Embed Size (px)
Citation preview

Deriving Insights from Search Data
Qing Wu/ Senior Economist, Google

CH
RIS
TM
AS
SUPERBOWL
OSCARS
CYBER MONDAY
Michael Jackson died
CASH-FOR-CLUNKER
CYBER MONDAY
OLYMPICS
TSUMAMI
HURRICANE SANDY
Short-Term Drivers OSCARS
ELE
CTIO
N

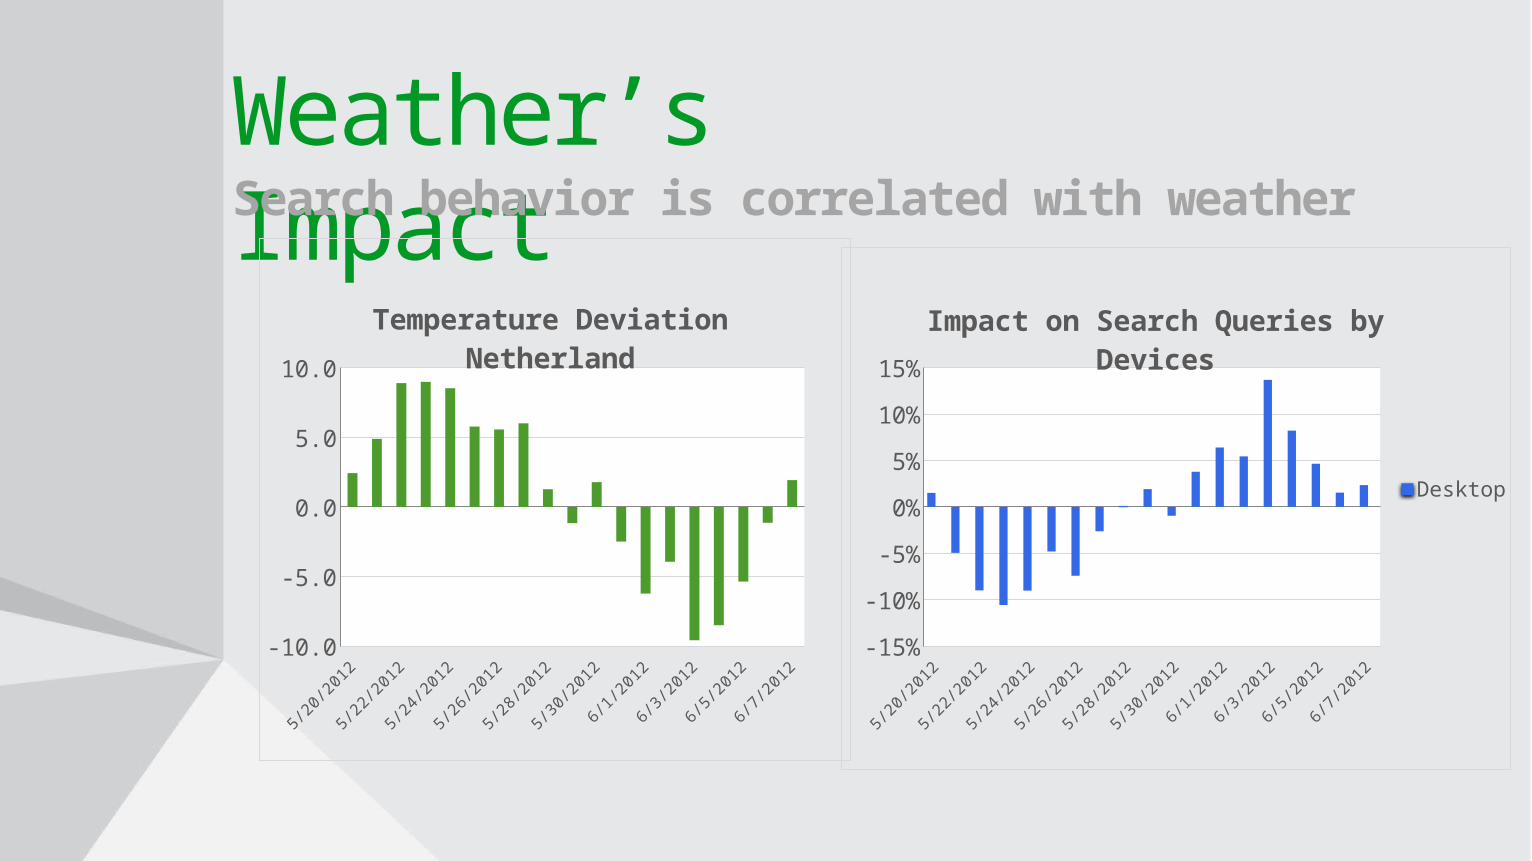
Weather’s Impact
5/20/2
012
5/21/2
012
5/22/2
012
5/23/2
012
5/24/2
012
5/25/2
012
5/26/2
012
5/27/2
012
5/28/2
012
5/29/2
012
5/30/2
012
5/31/2
012
6/1/2
012
6/2/2
012
6/3/2
012
6/4/2
012
6/5/2
012
6/6/2
012
6/7/2
012-10.0
-8.0-6.0-4.0-2.00.02.04.06.08.0
10.0
Temperature Deviation Netherland
Search behavior is correlated with weather
Weather’s ImpactSearch behavior is correlated with weather
5/20/2
012
5/21/2
012
5/22/2
012
5/23/2
012
5/24/2
012
5/25/2
012
5/26/2
012
5/27/2
012
5/28/2
012
5/29/2
012
5/30/2
012
5/31/2
012
6/1/2
012
6/2/2
012
6/3/2
012
6/4/2
012
6/5/2
012
6/6/2
012
6/7/2
012-10.0
-8.0-6.0-4.0-2.00.02.04.06.08.0
10.0
Temperature Deviation Netherland
5/20/2
012
5/21/2
012
5/22/2
012
5/23/2
012
5/24/2
012
5/25/2
012
5/26/2
012
5/27/2
012
5/28/2
012
5/29/2
012
5/30/2
012
5/31/2
012
6/1/2
012
6/2/2
012
6/3/2
012
6/4/2
012
6/5/2
012
6/6/2
012
6/7/2
012-15%
-10%
-5%
0%
5%
10%
15%
Impact on Search Queries by Devices
Desktop

Weather’s Impact
5/20/2
012
5/21/2
012
5/22/2
012
5/23/2
012
5/24/2
012
5/25/2
012
5/26/2
012
5/27/2
012
5/28/2
012
5/29/2
012
5/30/2
012
5/31/2
012
6/1/2
012
6/2/2
012
6/3/2
012
6/4/2
012
6/5/2
012
6/6/2
012
6/7/2
012-10.0
-8.0-6.0-4.0-2.00.02.04.06.08.0
10.0
Temperature Deviation Netherland
5/20/2
012
5/21/2
012
5/22/2
012
5/23/2
012
5/24/2
012
5/25/2
012
5/26/2
012
5/27/2
012
5/28/2
012
5/29/2
012
5/30/2
012
5/31/2
012
6/1/2
012
6/2/2
012
6/3/2
012
6/4/2
012
6/5/2
012
6/6/2
012
6/7/2
012-15%
-10%
-5%
0%
5%
10%
15%
Impact on Search Queries by Devices
Desktop
Mobile
Search behavior is correlated with weather

Holiday ImpactConsumers are trained to search online deals on key shopping days
0.850000000000001
0.950000000000001
1.05
1.15
1.25
1.35
1.45
1.55
1.65
1.75
1.85
20102011

0.850000000000001
0.950000000000001
1.05
1.15
1.25
1.35
1.45
1.55
1.65
1.75
1.85
20102011
Shifting Holiday ImpactConsumers are trained to search online deals on key shopping days
Black Friday
Cyber Monday

0.850000000000001
0.950000000000001
1.05
1.15
1.25
1.35
1.45
1.55
1.65
1.75
1.85
20102011
Shifting Holiday ImpactConsumers are trained to search online deals on key shopping days
Black Friday
Cyber Monday
Green Monday

0.850000000000001
0.950000000000001
1.05
1.15
1.25
1.35
1.45
1.55
1.65
1.75
1.85
201020112012
Shifting Holiday ImpactConsumers are trained to search online deals on key shopping days
Black Friday
Cyber Monday
Green Monday

2012-06-24
2012-07-01
2012-07-08
2012-07-15
2012-07-22
2012-07-29
2012-08-05
2012-08-12
2012-08-19
2012-08-26
2012-09-02
2012-09-09-5%
-4%
-3%
-2%
-1%
0%
1%
2%
3%
Shopping
2...
OlympicsUK vertical trends during Olympics

Long-Term Drivers
SOCIAL NETWORKS
E-COMMERCE
APPS
GREAT RECESSION
GROUP BUYING
TABLE
T
CO
MPETIT
OR
S
CONSUMER CONFIDENCE
SMART PHONES
DEMOGRAPHICS

Economy: Auto Sales
Jan-0
8
Apr-08
Jul-0
8
Oct-08
Jan-0
9
Apr-09
Jul-0
9
Oct-09
Jan-1
0
Apr-10
Jul-1
0
Oct-10
Jan-1
1
Apr-11
Jul-1
1
Oct-11
Jan-1
2
Apr-12
Jul-1
2
Oct-12
Jan-1
350000
55000
60000
65000
70000
75000
80000
Auto Sales

Economy: Auto Sales
Jan-0
8
Apr-08
Jul-0
8
Oct-08
Jan-0
9
Apr-09
Jul-0
9
Oct-09
Jan-1
0
Apr-10
Jul-1
0
Oct-10
Jan-1
1
Apr-11
Jul-1
1
Oct-11
Jan-1
2
Apr-12
Jul-1
2
Oct-12
Jan-1
350000
55000
60000
65000
70000
75000
80000
0.9
0.95
1
1.05
1.1
0.78
0.8
0.82
0.84
0.86
0.88
Auto Sales
Vehicle Brand
Trucks & SUV
Cash-for-Clunkers

E-Commerce TrendsGoods/services move online with varying paces
Jan-04
Jul-04Jan
-05Jul-0
5Jan
-06Jul-0
6Jan
-07Jul-0
7Jan
-08Jul-0
8Jan
-09Jul-0
9Jan
-10Jul-1
0Jan
-11Jul-1
1Jan
-12Jul-1
2Jan
-130.5
0.6
0.7
0.8
0.9
1
1.1
1.2
1.3
1.4
1.5
Normalized Google Trend Indices in US
Apparel
Consumer Electron-ics
Air Travel

Device Changes When
0 1 2 3 4 5 6 7 8 9 10111213141516171819202122230
1
2
3
4
5
6
Hourly Trends for New QueriesFeb 4 2013 Monday
desktop
Local hour

Device Changes When
0 1 2 3 4 5 6 7 8 9 10111213141516171819202122230
1
2
3
4
5
6
Hourly Trends for New QueriesFeb 4 2013 Monday
desktop
smartphone
Local hour

Device Changes When
0 1 2 3 4 5 6 7 8 9 10111213141516171819202122230
1
2
3
4
5
6
Hourly Trends for New QueriesFeb 4 2013 Monday
desktop
smartphone
tablet
Local hour

Device Changes What
Starbucks Atm Mcdonalds Gas station Store hours0%
20%40%60%80%
100%120%140%160%180%200%
Normalized Growth between 2009 and 2012

Device Changes What
Starbucks Atm Mcdonalds Gas station Store hours How old0%
20%40%60%80%
100%120%140%160%180%200%
Normalized Growth between 2009 and 2012

Demographic Shift Changes WhoNarrowing of the digital divide
2000030000
4000050000
6000070000
8000090000
100000
All Devices Queries per CapitaCity Level Median vs. Income
Household income (thousands)
Que
ries
/use
r

Demographic Shift Changes WhoNarrowing of the digital divide
2000030000
4000050000
6000070000
8000090000
100000
All Devices Queries per CapitaCity Level Median vs. Income
Household income (thousands)
Que
ries
/use
r
2000030000
4000050000
6000070000
8000090000
100000
YoY GrowthCity Level Median vs. Income
Household income (thousands)
YoY
Gro
wth

Big Data, Insights and Action• Google trends data offers great opportunity to study
consumer behavior and industry trend• But the real challenge is how we use them
• Product sales and marketing strategy• Financial planning• Advertisers: making campaign decisions based on
data

Thank you