Embed Size (px)
Citation preview
DV ANALYTICS COURSE CONTENTS
A Comprehensive Analytics Training Institute
DV Analytics
[email protected] 9591793303
Contents Excel : Course Contents ................................................................................................................................................... - 2 -
Access Course Contents .................................................................................................................................................. - 4 -
SQL Course Contents:...................................................................................................................................................... - 5 -
Base SAS Course Contents .............................................................................................................................................. - 7 -
Advanced SAS Course Contents ...................................................................................................................................... - 8 -
Qlikview Course Contents: .............................................................................................................................................. - 9 -
Analytics Course Contents ............................................................................................................................................ - 12 -
R Course Contents ......................................................................................................................................................... - 17 -
Tableau Course Contents .............................................................................................................................................. - 18 -
Introduction to BIG Data Analytics Course Contents .................................................................................................... - 21 -
Contact us
9591793303
DV Analytics
Krishnappa Garden,
Bhagmane techpark
CV Raman Nagar,
Bangalore-560093
[email protected] 9591793303
Excel : Course Contents Section1:
Introduction to MS Excel
Navigation technique using excel ribbons (a journey to excel Home, Insert, Page Layout, Data, View and Developer)
Cell Reference, Range, Rows and Columns (Excel shortcut keys)
Excel manipulations objects
Format Paint, Border Style and Designing, Cell Merging, Conditional Formatting, Autosum, Sorting and filtering, Data Validation, Data consolidation
Exercise
Section2:
Data Importing and Exporting and Data normalization standardization process
o Data Import and Export from csv,.txt,.xlsx and ODBC connections
o Text to column data
o Remove duplicates
o Data sorting and customized sorting
o Data validation
o Data Consolidation
o Data connection properties
o What-if analysis
Exercise
Excel Charts
o Vbar chart
o Hbar chart
o Pie Chart
o Scatter chart
o Area Chart
o Line chart
o Snake chart
o Excel hit map
o Bubble chart
o Radar chart
Exercise
Excel Pivot
o Basic pivot (Understanding of pivot table and field objects for row label, column label, Value and report filter)
o Pivot slicers and slicer connection
[email protected] 9591793303
o Pivot relational data model preparation
o Pivot data visualization designing techniques
o Pivot slicer dashboard
o Pivot options
o Pivot connection to other database
o Pivot calculations and values manipulation techniques
o Power pivot
o Live projects
Exercise
Section3:
Excel formula and functions
o Character Functions (Upper, Lower, Proper, Left, Right, Mid, Concatenate, Trim Istext , find , substitute and replace etc.)
o Numeric Functions (Ceiling, Flooring, Round, Round UP/DOWN, Int, Isnumber, Count if, Sum if etc.)
o Date Functions (Today,Now,Hour,Minute,Second,Datediff,Day,Month,QTR,Year,Networkingdays etc.)
o Excel Formulas and Functions like IF and Nested IF, Vlook-up, HLook-up, Sum,Sum IF,Match, Offset and Index etc.
Section4: Excel Advanced
Excel Dashboard using Form control and ActiveX control, Excel formula and functions
Excel VBA Programming
Excel automated dashboard using Excel VBA, formula and functions
Live Dashboard making practical’s
Exercise
[email protected] 9591793303
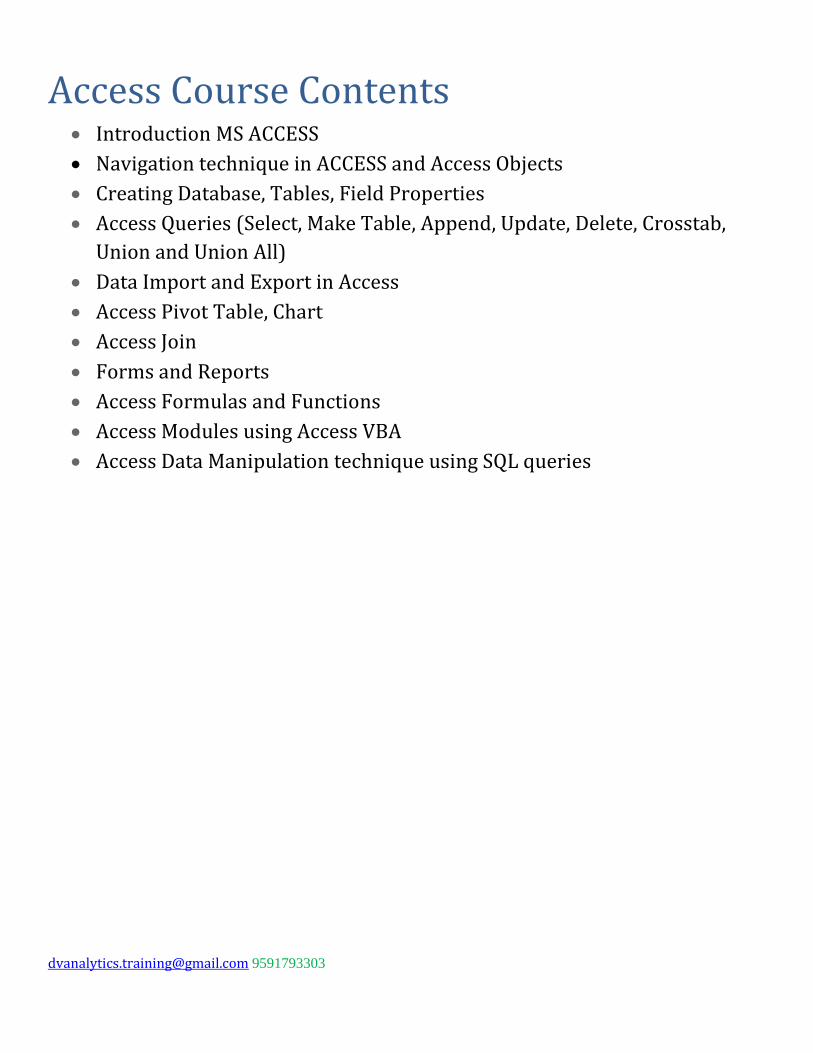
Access Course Contents Introduction MS ACCESS
Navigation technique in ACCESS and Access Objects
Creating Database, Tables, Field Properties
Access Queries (Select, Make Table, Append, Update, Delete, Crosstab,
Union and Union All)
Data Import and Export in Access
Access Pivot Table, Chart
Access Join
Forms and Reports
Access Formulas and Functions
Access Modules using Access VBA
Access Data Manipulation technique using SQL queries
[email protected] 9591793303
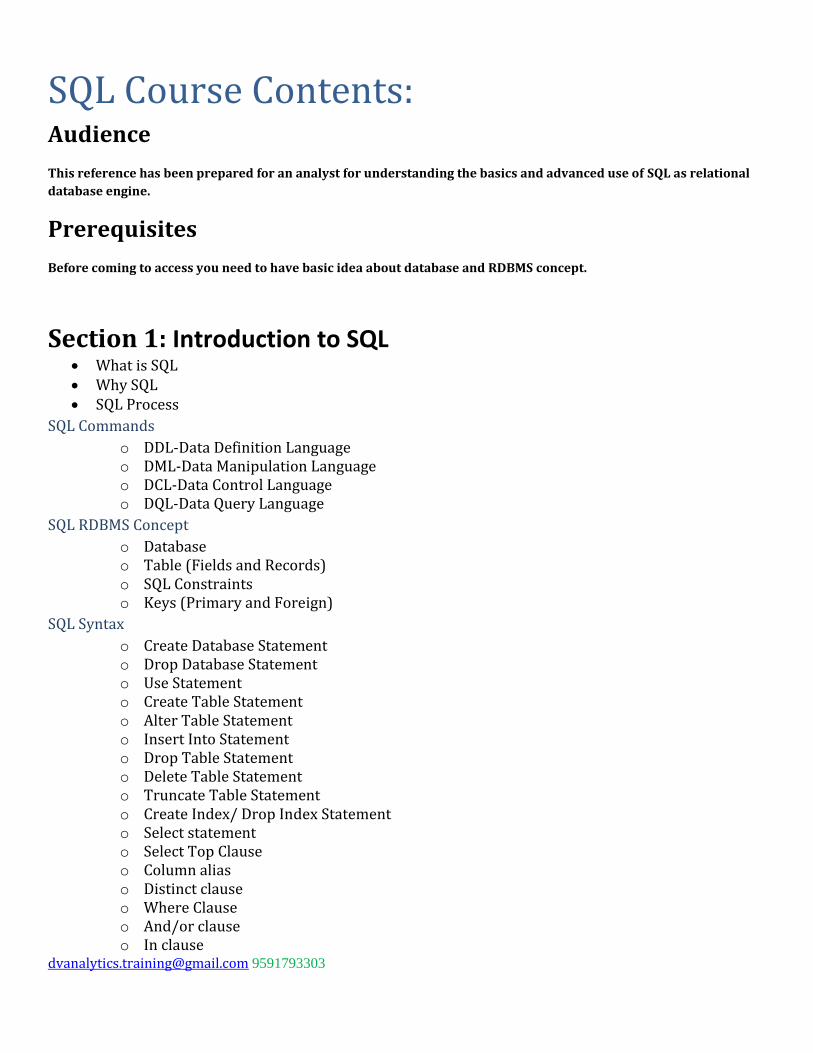
SQL Course Contents: Audience
This reference has been prepared for an analyst for understanding the basics and advanced use of SQL as relational
database engine.
Prerequisites
Before coming to access you need to have basic idea about database and RDBMS concept.
Section 1: Introduction to SQL What is SQL Why SQL SQL Process
SQL Commands
o DDL-Data Definition Language o DML-Data Manipulation Language o DCL-Data Control Language o DQL-Data Query Language
SQL RDBMS Concept
o Database o Table (Fields and Records) o SQL Constraints o Keys (Primary and Foreign)
SQL Syntax
o Create Database Statement o Drop Database Statement o Use Statement o Create Table Statement o Alter Table Statement o Insert Into Statement o Drop Table Statement o Delete Table Statement o Truncate Table Statement o Create Index/ Drop Index Statement o Select statement o Select Top Clause o Column alias o Distinct clause o Where Clause o And/or clause o In clause
[email protected] 9591793303
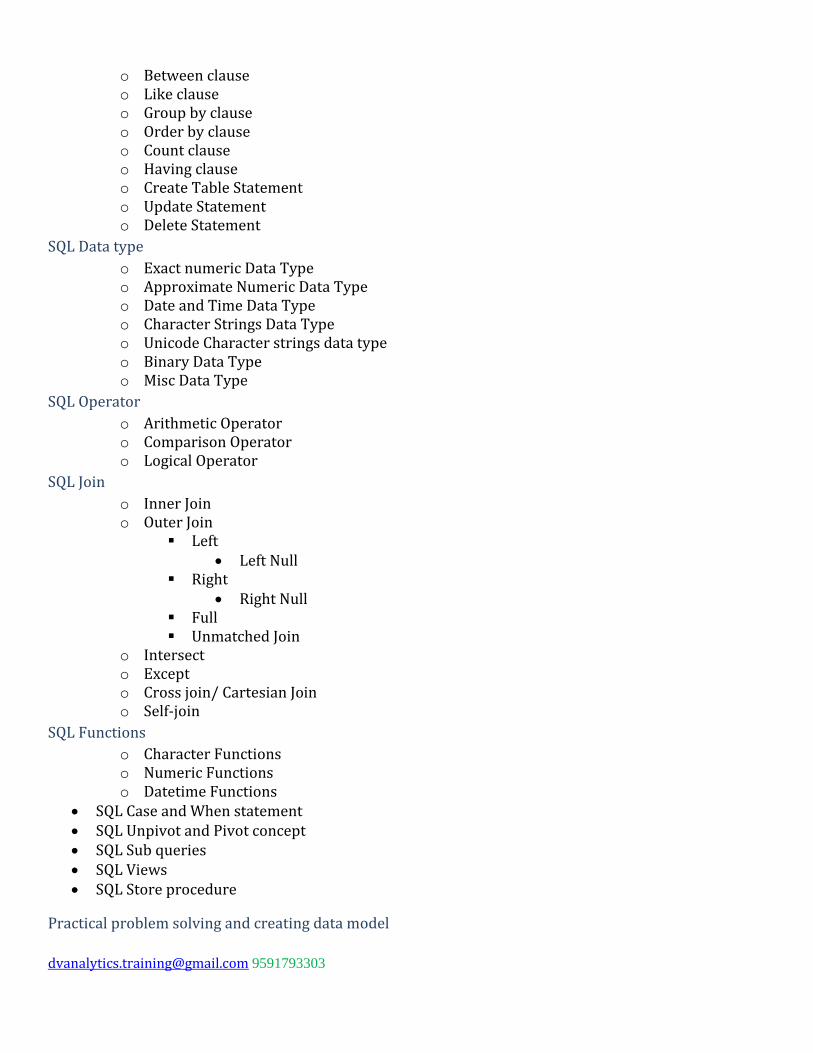
o Between clause o Like clause o Group by clause o Order by clause o Count clause o Having clause o Create Table Statement o Update Statement o Delete Statement
SQL Data type
o Exact numeric Data Type o Approximate Numeric Data Type o Date and Time Data Type o Character Strings Data Type o Unicode Character strings data type o Binary Data Type o Misc Data Type
SQL Operator
o Arithmetic Operator o Comparison Operator o Logical Operator
SQL Join
o Inner Join o Outer Join
Left Left Null
Right Right Null
Full Unmatched Join
o Intersect o Except o Cross join/ Cartesian Join o Self-join
SQL Functions
o Character Functions o Numeric Functions o Datetime Functions
SQL Case and When statement SQL Unpivot and Pivot concept SQL Sub queries SQL Views SQL Store procedure
Practical problem solving and creating data model
[email protected] 9591793303
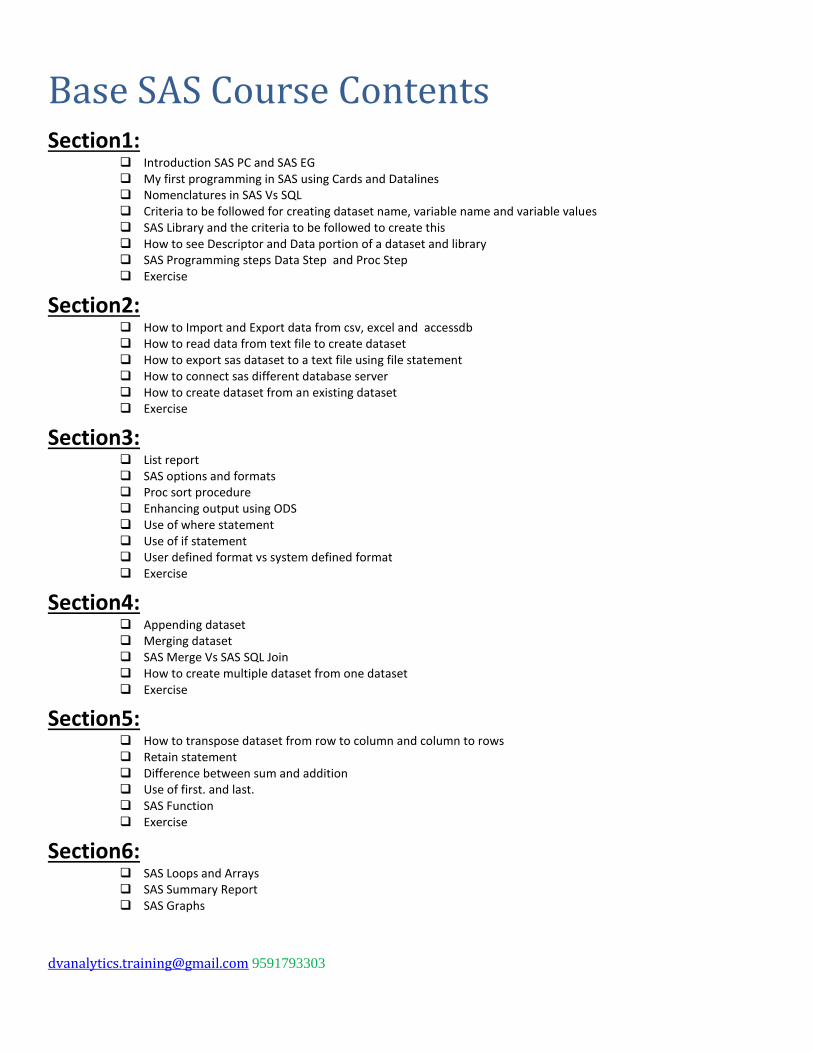
Base SAS Course Contents Section1:
Introduction SAS PC and SAS EG My first programming in SAS using Cards and Datalines Nomenclatures in SAS Vs SQL Criteria to be followed for creating dataset name, variable name and variable values SAS Library and the criteria to be followed to create this How to see Descriptor and Data portion of a dataset and library SAS Programming steps Data Step and Proc Step Exercise
Section2:
How to Import and Export data from csv, excel and accessdb How to read data from text file to create dataset How to export sas dataset to a text file using file statement How to connect sas different database server How to create dataset from an existing dataset Exercise
Section3:
List report SAS options and formats Proc sort procedure Enhancing output using ODS Use of where statement Use of if statement User defined format vs system defined format Exercise
Section4:
Appending dataset Merging dataset SAS Merge Vs SAS SQL Join How to create multiple dataset from one dataset Exercise
Section5:
How to transpose dataset from row to column and column to rows Retain statement Difference between sum and addition Use of first. and last. SAS Function Exercise
Section6:
SAS Loops and Arrays SAS Summary Report SAS Graphs
[email protected] 9591793303
Advanced SAS Course Contents Section1: SAS SQL
Introduction to SAS SQL Retrieving data using
• Select statement • Where statement • Group by statement • Order by statement • Having clause
SAS SQL Options How to create a new table from an existing table Altering table, creating index and views Use of case and when statement Update query, Updating a Table with Values from Another Table Delete query Appending Table SAS SQL Join, Except and Intersect Creating macro variable using sas sql Exercise
Section2: SAS Macro Introduction to Macro Facility Creating the first macro Understand the concept of macro statement, options and functions Creating Macro Variable Macro debugging options Conditional macro statement
• %if %then • %do %end
Macro Expressions Macro Quoting Macro Functions Storing and using of Macro Exercise
[email protected] 9591793303
Qlikview Course Contents: Section 1: Introduction to Data Visualization
About Data Visualization Software lined up for Data Visualization support Why Qlikview A sample dashboard in Qlikview for an introduction to visualization techniques and benefits
Section 2: Introduction to Data Driven approach for dashboard preparation
Data Access
o Data Importing from Excel, CSV and Flat file
o Data Importing from ODBC and OLE DB
o Data Importing from QVD file
o Data Preparation using Inline
o Data storing into QVD
o How to save script into .QVS file
o Reload and Partial Reload (For Appending and Replacing data)
o Reduce data
Data Management
o Treating Null Value
o Mapping Table
o Concatenate and No concatenate
o Resident
o Adding field and Functions for data manipulation
o Creating Variables (Use of Set and Let)
o Qlikview Functions
Data Analysis
Data Presentation and Reporting
Section 3: An Introduction to Business Intelligence Architecture
Understanding Data Structure Creating Data Model Concept about OLAP, Fact Table and Dimension Table
[email protected] 9591793303
Section 4: A journey through Qlikview User Interface
Navigation through Qlikview Menu commands and Toolbars and status bar o Starting with Qlikview o Getting Started wizard o Qlikview file o Menu commands o Toolbars and status bar o User preferences o Exporting and printing o Logic and selections o Bookmark o Reports o Alerts o Variable overview o Expression overview o Internal file
Section 5: Sheet and Sheet Objects
Sheet Properties New Sheet objects
o List Box and properties o Statistics Box and properties o Multi Box and properties o Table Box and properties o Current Selection Box and properties o Input Box and properties o Button and properties o Text Object and properties o Line and Arrow Object and properties o Slider and Calendar Object and properties o Bookmark Object and properties o Search Object and properties
Container Custom Object Server Object pane Layout theme
Section 6: Charts
Introduction to chart Bar Chart (Vbar and Hbar) Lines Chart
[email protected] 9591793303
Pie Chart Combo Chart Radar Chart Scatter Chart Grid Chart Funnel Chart Block Chart Gauge Chart Mekko Chart Pivot Table Straight Table Chart Expressions
Section 7: Scripting and Security
Variables and fields Script dialogs Script syntax Script Expressions Data Structure/Data Model Evaluating the loaded data QVD files
Practical with live dashboard making
[email protected] 9591793303
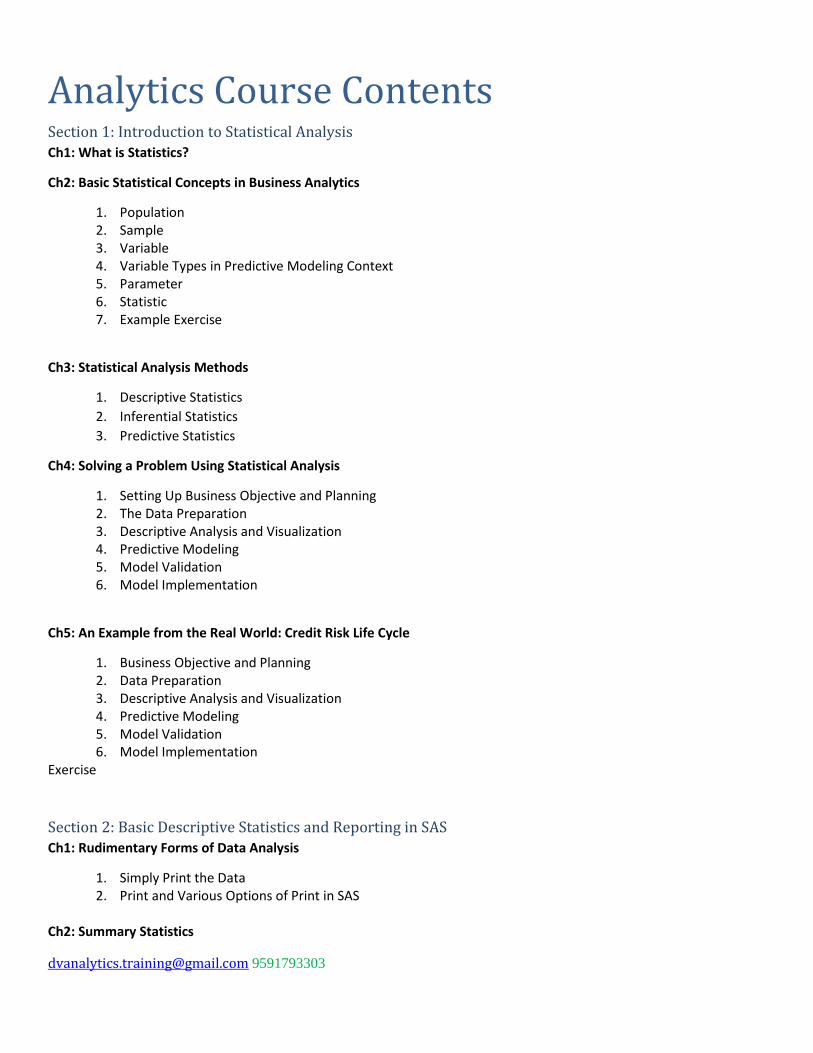
Analytics Course Contents Section 1: Introduction to Statistical Analysis
Ch1: What is Statistics?
Ch2: Basic Statistical Concepts in Business Analytics
1. Population 2. Sample 3. Variable 4. Variable Types in Predictive Modeling Context 5. Parameter 6. Statistic 7. Example Exercise
Ch3: Statistical Analysis Methods
1. Descriptive Statistics
2. Inferential Statistics
3. Predictive Statistics
Ch4: Solving a Problem Using Statistical Analysis
1. Setting Up Business Objective and Planning 2. The Data Preparation 3. Descriptive Analysis and Visualization 4. Predictive Modeling 5. Model Validation 6. Model Implementation
Ch5: An Example from the Real World: Credit Risk Life Cycle
1. Business Objective and Planning 2. Data Preparation 3. Descriptive Analysis and Visualization 4. Predictive Modeling 5. Model Validation 6. Model Implementation
Exercise
Section 2: Basic Descriptive Statistics and Reporting in SAS
Ch1: Rudimentary Forms of Data Analysis
1. Simply Print the Data 2. Print and Various Options of Print in SAS
Ch2: Summary Statistics
[email protected] 9591793303
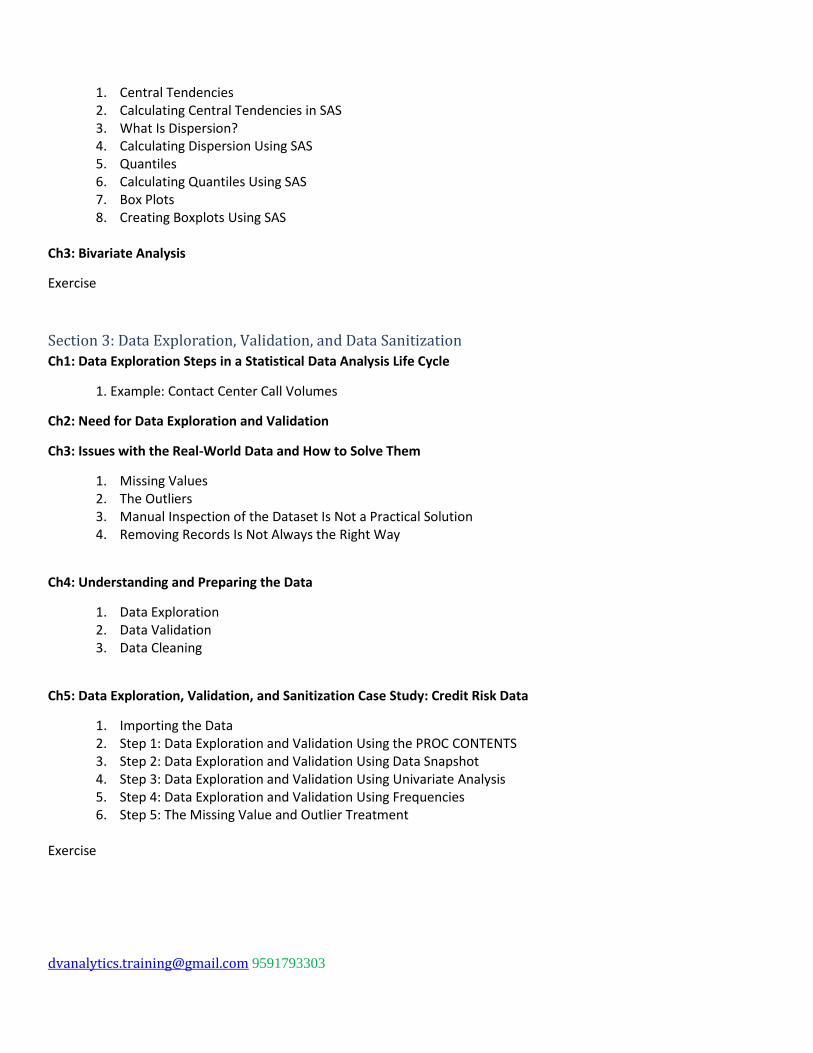
1. Central Tendencies 2. Calculating Central Tendencies in SAS 3. What Is Dispersion? 4. Calculating Dispersion Using SAS 5. Quantiles 6. Calculating Quantiles Using SAS 7. Box Plots 8. Creating Boxplots Using SAS
Ch3: Bivariate Analysis
Exercise
Section 3: Data Exploration, Validation, and Data Sanitization
Ch1: Data Exploration Steps in a Statistical Data Analysis Life Cycle
1. Example: Contact Center Call Volumes
Ch2: Need for Data Exploration and Validation
Ch3: Issues with the Real-World Data and How to Solve Them
1. Missing Values 2. The Outliers 3. Manual Inspection of the Dataset Is Not a Practical Solution 4. Removing Records Is Not Always the Right Way
Ch4: Understanding and Preparing the Data
1. Data Exploration 2. Data Validation 3. Data Cleaning
Ch5: Data Exploration, Validation, and Sanitization Case Study: Credit Risk Data
1. Importing the Data 2. Step 1: Data Exploration and Validation Using the PROC CONTENTS 3. Step 2: Data Exploration and Validation Using Data Snapshot 4. Step 3: Data Exploration and Validation Using Univariate Analysis 5. Step 4: Data Exploration and Validation Using Frequencies 6. Step 5: The Missing Value and Outlier Treatment
Exercise
[email protected] 9591793303
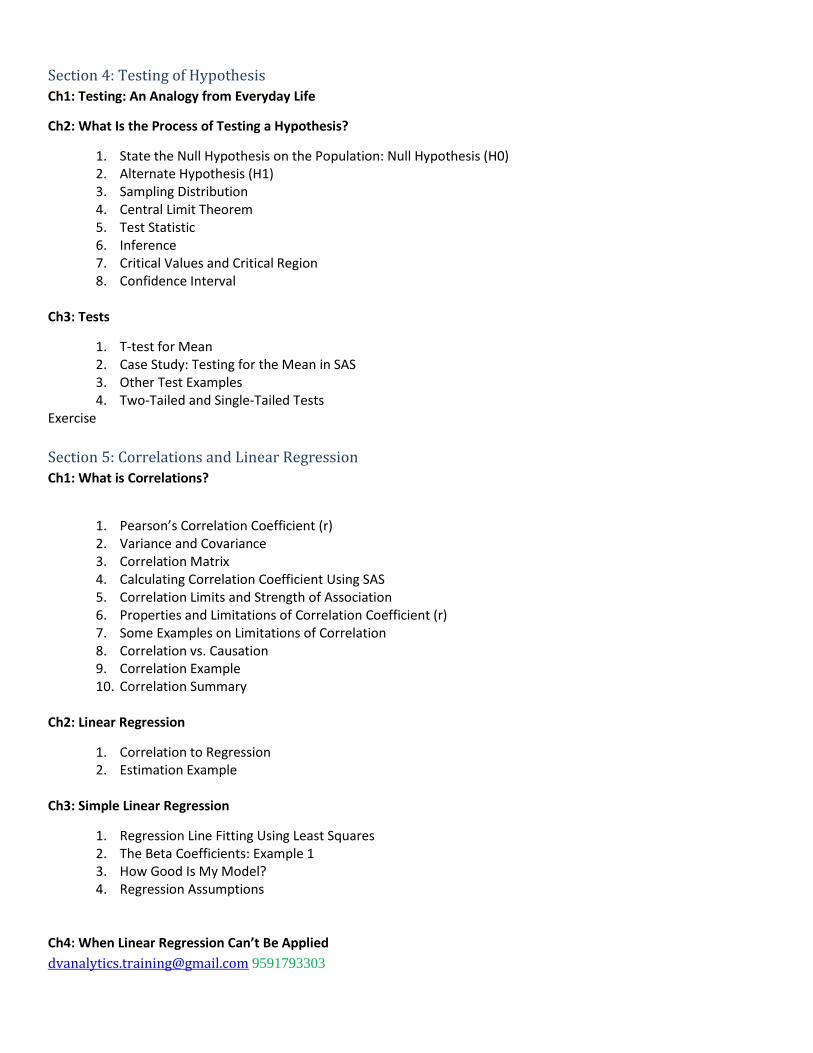
Section 4: Testing of Hypothesis
Ch1: Testing: An Analogy from Everyday Life
Ch2: What Is the Process of Testing a Hypothesis?
1. State the Null Hypothesis on the Population: Null Hypothesis (H0) 2. Alternate Hypothesis (H1) 3. Sampling Distribution 4. Central Limit Theorem 5. Test Statistic 6. Inference 7. Critical Values and Critical Region 8. Confidence Interval
Ch3: Tests
1. T-test for Mean 2. Case Study: Testing for the Mean in SAS 3. Other Test Examples 4. Two-Tailed and Single-Tailed Tests
Exercise
Section 5: Correlations and Linear Regression
Ch1: What is Correlations?
1. Pearson’s Correlation Coefficient (r) 2. Variance and Covariance 3. Correlation Matrix 4. Calculating Correlation Coefficient Using SAS 5. Correlation Limits and Strength of Association 6. Properties and Limitations of Correlation Coefficient (r) 7. Some Examples on Limitations of Correlation 8. Correlation vs. Causation 9. Correlation Example 10. Correlation Summary
Ch2: Linear Regression
1. Correlation to Regression 2. Estimation Example
Ch3: Simple Linear Regression
1. Regression Line Fitting Using Least Squares 2. The Beta Coefficients: Example 1 3. How Good Is My Model? 4. Regression Assumptions
Ch4: When Linear Regression Can’t Be Applied
[email protected] 9591793303
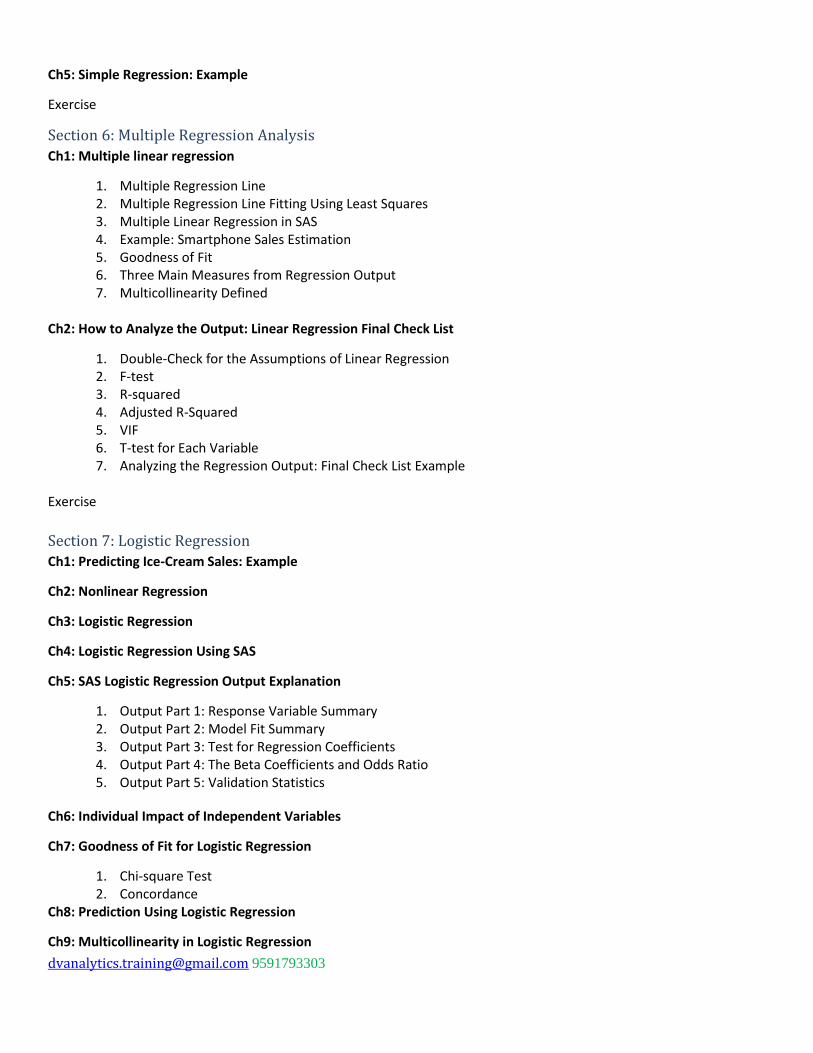
Ch5: Simple Regression: Example
Exercise
Section 6: Multiple Regression Analysis
Ch1: Multiple linear regression
1. Multiple Regression Line 2. Multiple Regression Line Fitting Using Least Squares 3. Multiple Linear Regression in SAS 4. Example: Smartphone Sales Estimation 5. Goodness of Fit 6. Three Main Measures from Regression Output 7. Multicollinearity Defined
Ch2: How to Analyze the Output: Linear Regression Final Check List
1. Double-Check for the Assumptions of Linear Regression 2. F-test 3. R-squared 4. Adjusted R-Squared 5. VIF 6. T-test for Each Variable 7. Analyzing the Regression Output: Final Check List Example
Exercise
Section 7: Logistic Regression
Ch1: Predicting Ice-Cream Sales: Example
Ch2: Nonlinear Regression
Ch3: Logistic Regression
Ch4: Logistic Regression Using SAS
Ch5: SAS Logistic Regression Output Explanation
1. Output Part 1: Response Variable Summary 2. Output Part 2: Model Fit Summary 3. Output Part 3: Test for Regression Coefficients 4. Output Part 4: The Beta Coefficients and Odds Ratio 5. Output Part 5: Validation Statistics
Ch6: Individual Impact of Independent Variables
Ch7: Goodness of Fit for Logistic Regression
1. Chi-square Test 2. Concordance
Ch8: Prediction Using Logistic Regression
Ch9: Multicollinearity in Logistic Regression
[email protected] 9591793303
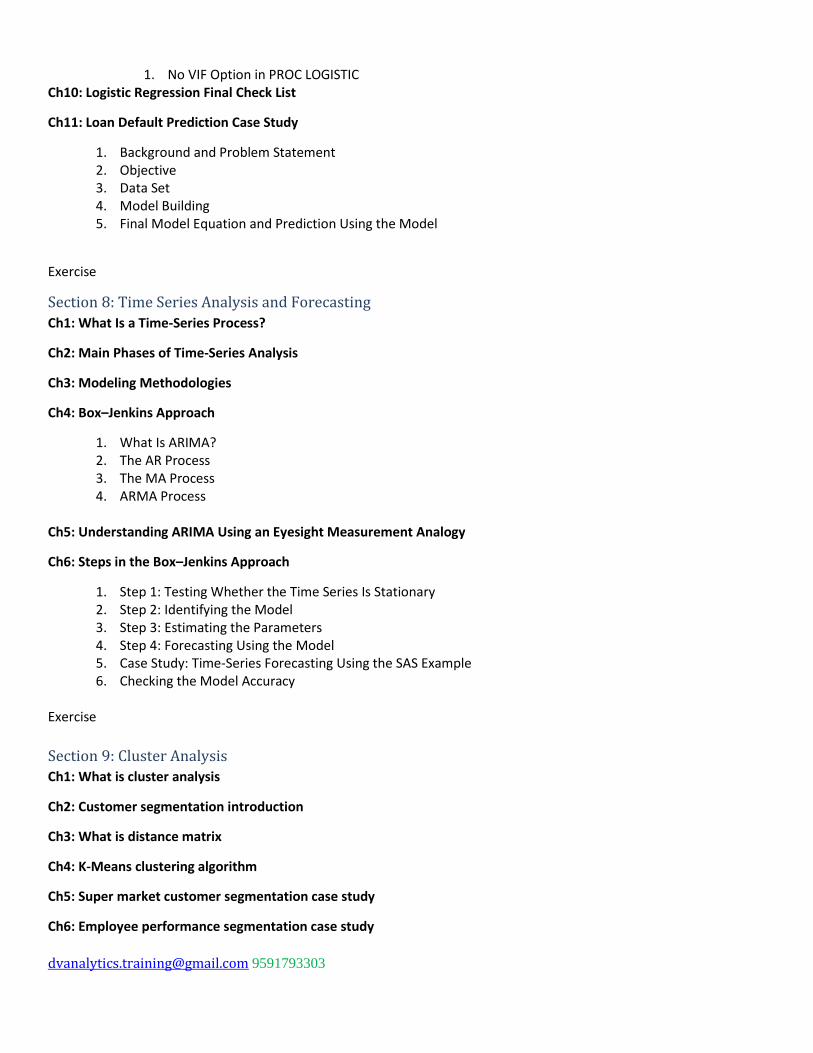
1. No VIF Option in PROC LOGISTIC Ch10: Logistic Regression Final Check List
Ch11: Loan Default Prediction Case Study
1. Background and Problem Statement 2. Objective 3. Data Set 4. Model Building 5. Final Model Equation and Prediction Using the Model
Exercise
Section 8: Time Series Analysis and Forecasting
Ch1: What Is a Time-Series Process?
Ch2: Main Phases of Time-Series Analysis
Ch3: Modeling Methodologies
Ch4: Box–Jenkins Approach
1. What Is ARIMA? 2. The AR Process 3. The MA Process 4. ARMA Process
Ch5: Understanding ARIMA Using an Eyesight Measurement Analogy
Ch6: Steps in the Box–Jenkins Approach
1. Step 1: Testing Whether the Time Series Is Stationary 2. Step 2: Identifying the Model 3. Step 3: Estimating the Parameters 4. Step 4: Forecasting Using the Model 5. Case Study: Time-Series Forecasting Using the SAS Example 6. Checking the Model Accuracy
Exercise
Section 9: Cluster Analysis
Ch1: What is cluster analysis
Ch2: Customer segmentation introduction
Ch3: What is distance matrix
Ch4: K-Means clustering algorithm
Ch5: Super market customer segmentation case study
Ch6: Employee performance segmentation case study
[email protected] 9591793303
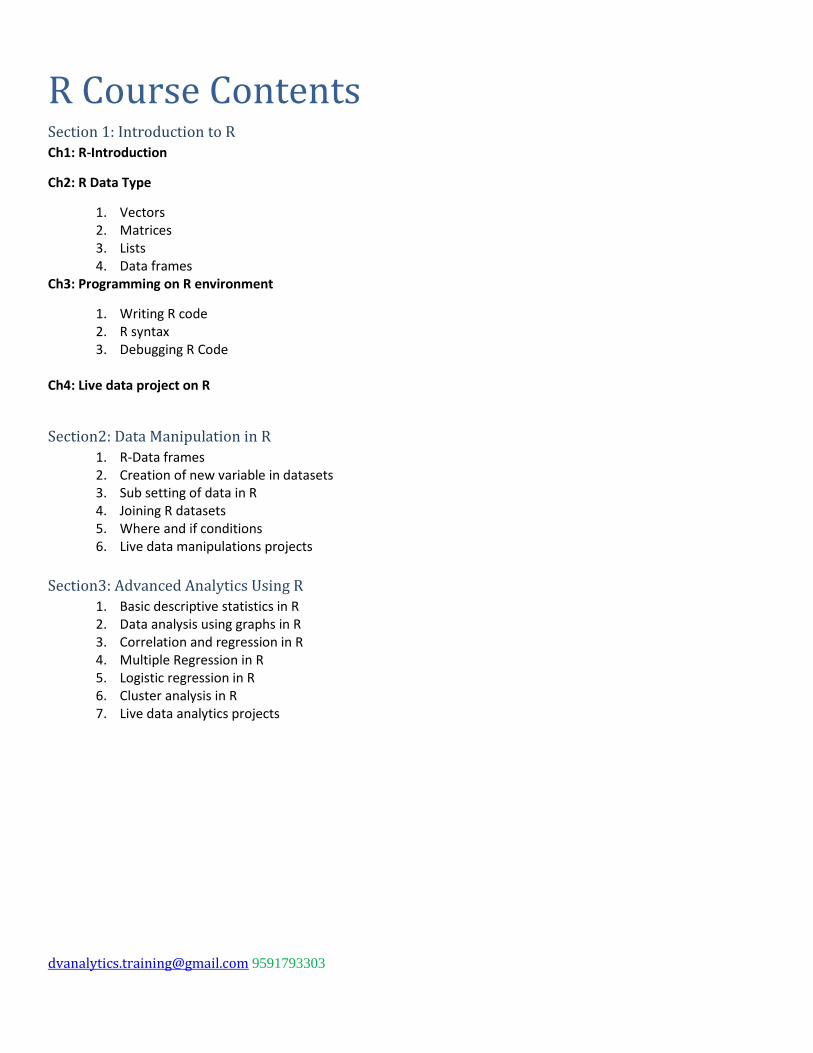
R Course Contents Section 1: Introduction to R
Ch1: R-Introduction
Ch2: R Data Type
1. Vectors 2. Matrices 3. Lists 4. Data frames
Ch3: Programming on R environment
1. Writing R code 2. R syntax 3. Debugging R Code
Ch4: Live data project on R
Section2: Data Manipulation in R
1. R-Data frames 2. Creation of new variable in datasets 3. Sub setting of data in R 4. Joining R datasets 5. Where and if conditions 6. Live data manipulations projects
Section3: Advanced Analytics Using R
1. Basic descriptive statistics in R 2. Data analysis using graphs in R 3. Correlation and regression in R 4. Multiple Regression in R 5. Logistic regression in R 6. Cluster analysis in R 7. Live data analytics projects
[email protected] 9591793303
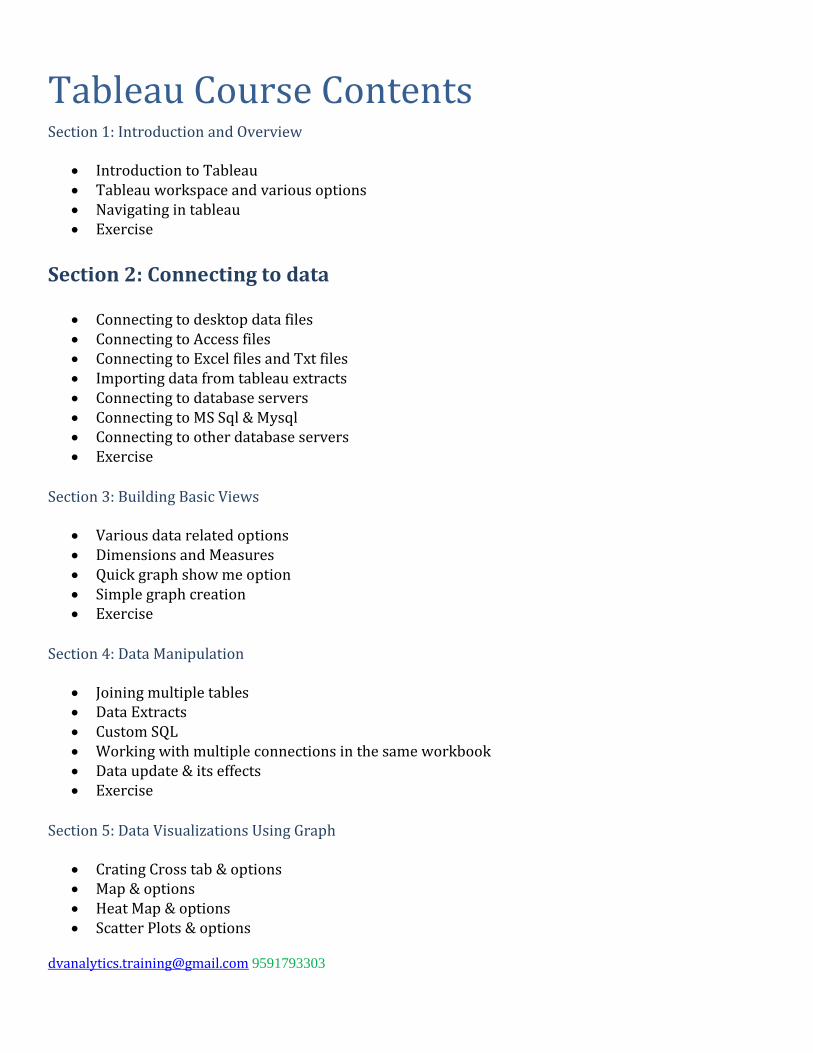
Tableau Course Contents Section 1: Introduction and Overview
Introduction to Tableau Tableau workspace and various options Navigating in tableau Exercise
Section 2: Connecting to data
Connecting to desktop data files Connecting to Access files Connecting to Excel files and Txt files Importing data from tableau extracts Connecting to database servers Connecting to MS Sql & Mysql Connecting to other database servers Exercise
Section 3: Building Basic Views
Various data related options Dimensions and Measures Quick graph show me option Simple graph creation Exercise
Section 4: Data Manipulation
Joining multiple tables Data Extracts Custom SQL Working with multiple connections in the same workbook Data update & its effects Exercise
Section 5: Data Visualizations Using Graph
Crating Cross tab & options Map & options Heat Map & options Scatter Plots & options
[email protected] 9591793303
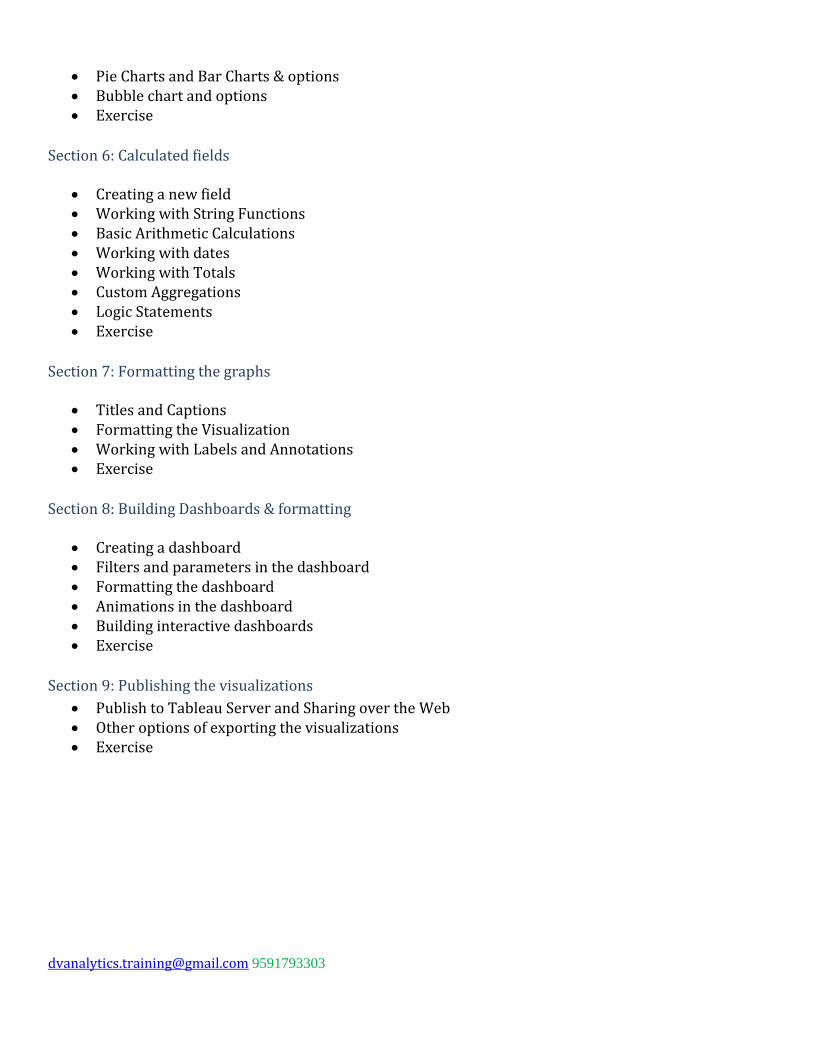
Pie Charts and Bar Charts & options Bubble chart and options Exercise
Section 6: Calculated fields
Creating a new field Working with String Functions Basic Arithmetic Calculations Working with dates Working with Totals Custom Aggregations Logic Statements Exercise
Section 7: Formatting the graphs
Titles and Captions Formatting the Visualization Working with Labels and Annotations Exercise
Section 8: Building Dashboards & formatting
Creating a dashboard Filters and parameters in the dashboard Formatting the dashboard Animations in the dashboard Building interactive dashboards Exercise
Section 9: Publishing the visualizations
Publish to Tableau Server and Sharing over the Web Other options of exporting the visualizations Exercise
[email protected] 9591793303
Section 10: Advanced Data Options
Clipboard data Connecting two data sources Joining data sources Creating hierarchies Measure values and Measure names Exercise
Section 11: Advanced Graph Options
Sorting Groups Sets Actions Parameters Exercise
Section 12: Basic Statistics using Tableau
Mean, Median Quartiles Box plots Outlier Identification Exercise
Section 13: Visualization Mock Projects
Data Importing Data validation and sanitization Creating basic visualizations Exercise
Section 14: Data Visualization Final Projects
Data Importing Data validation and sanitization Creating basic visualizations Analysis and creating interactive dashboard
[email protected] 9591793303
Introduction to BIG Data Analytics Course Contents
Introducing Big Data Analytics
Ch1: Traditional Data-Handling Tools
1. Walmart Customer Data 2. Facebook Data 3. Examples of the Growing Size of Data
Ch2: What Is Big Data?
1. The Three Main Components of Big Data 2. Applications of Big Data Analytics
Ch3: The Solution for Big Data Problems
Ch4: Distributed Computing
Ch5: What Is MapReduce?
1. Map Function 2. Reduce Function
Ch6: What Is Apache Hadoop?
1. Hadoop Distributed File System 2. MapReduce 3. Apache Hive 4. Apache Pig 5. Other Tools in the Hadoop Ecosystem 6. CompaniesThat Use Hadoop
Ch7: Big Data Analytics Example
1. Examining the Business Problem 2. Getting the Data Set 3. Starting Hadoop 4. Looking at the Hadoop Components 5. Moving Data from the Local System to Hadoop 6. Viewing the Data on HDFS 7. Starting Hive 8. Creating a Table Using Hive

[email protected] 9591793303
9. Executing a Program Using Hive 10. Viewing the MapReduce Status 11. The Final Result
[email protected] 9591793303
Contact us
9591793303
DV Analytics
Krishnappa Garden,
Bhagmane techpark
CV Raman Nagar,
Bangalore-560093
http://dvanalyticstraininginstitute.blogspot.in/