Embed Size (px)
Citation preview

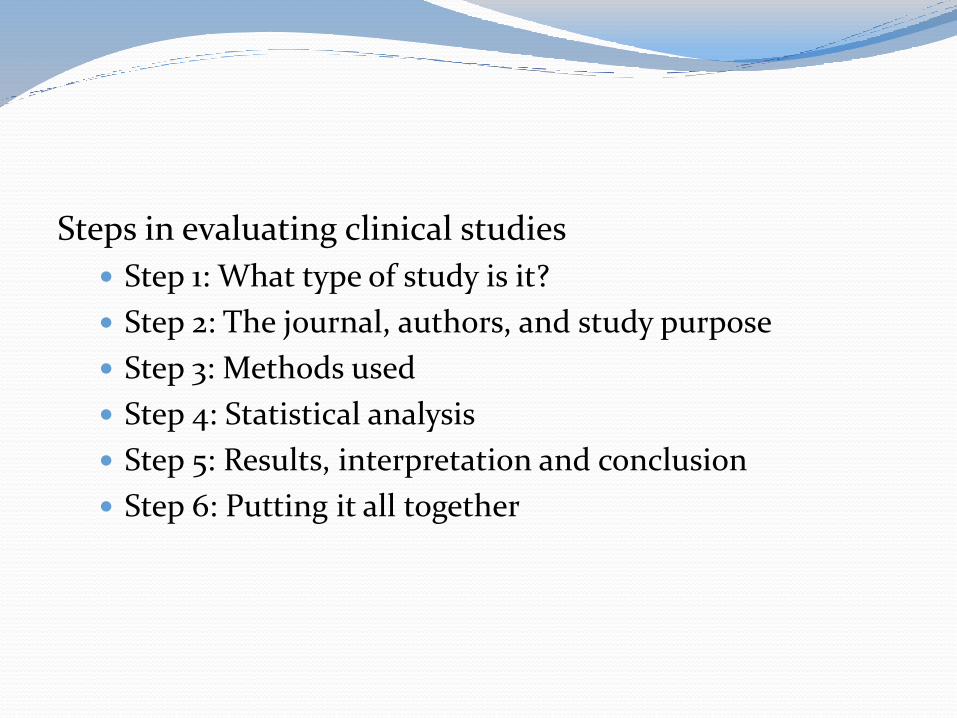
Steps in evaluating clinical studies
Step 1: What type of study is it?
Step 2: The journal, authors, and study purpose
Step 3: Methods used
Step 4: Statistical analysis
Step 5: Results, interpretation and conclusion
Step 6: Putting it all together

There are 2 types of studies
Descriptive
Simply recording information from observing patients
Explanatory
Using group comparisons as the basis for determining whether an exposure/treatment might cause or affect a condition or outcome

Clinical Studies
Descriptive
Studies
Case Reports
Case Series
Explanatory
Studies
Experimental
Studies
Controlled Experimental
Studies
Randomized controlled studies
Non randomized controlled studies
NoncontrolledExperimental
Studiesn-of-1 studies
Observational studies
Case-control Studies
Cohort Studies
Prospective Cohort Studies
Retrospective Cohort Studies
Cross-sectional studies
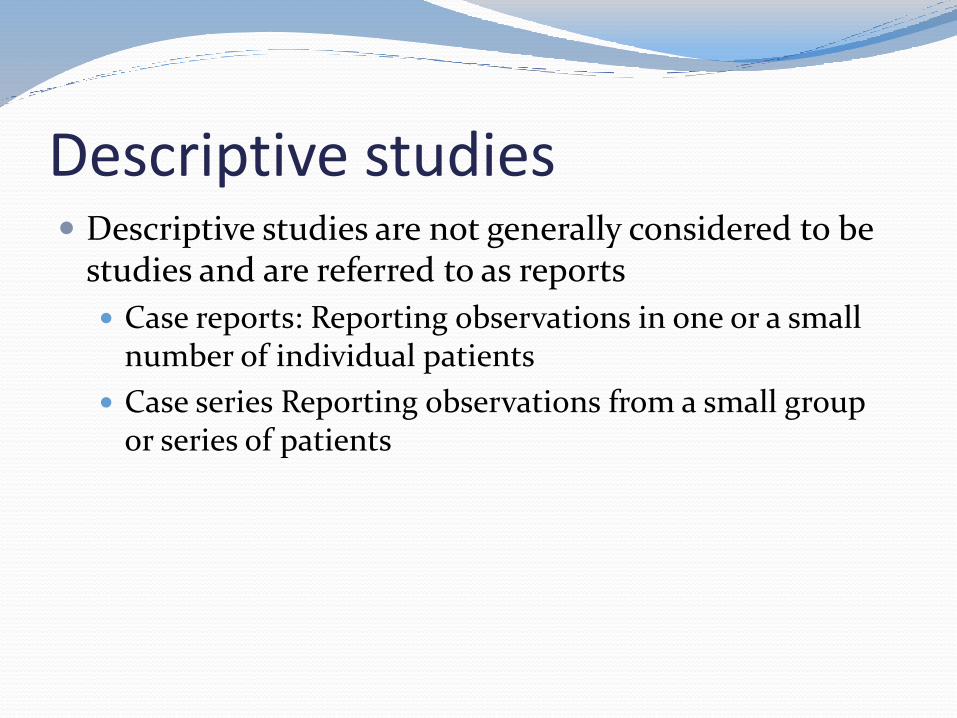
Descriptive studies Descriptive studies are not generally considered to be
studies and are referred to as reports
Case reports: Reporting observations in one or a small number of individual patients
Case series Reporting observations from a small group or series of patients

Explanatory studies
Explanatory studies
Experimental studies
Controlled
Noncontrolled
Observational studies

Experimental studies Involve actual intervention by investigators
Subjects are assigned and given treatments by investigators
Controlled experimental studies are the best “gold standard”
They use a treatment group and a control group

Control group Helps account for factors other than treatment that might affect
the study results
Investigators compare effects seen in the control patients with those in the treatment patients to determine if there is a difference between them
Types of control groups Placebo Active (another treatment with established efficacy) No treatment Historical (Comparison with a treatment previously studied)
Not commonly used, only when it is the only type of control available

n-of-1 studies Type of experimental studies
Single-subject research design
Often used by primary care practitioners
Studies a specific patient
The researcher conducts a baseline assessment of the patient’s condition followed by therapy initiation
During/after therapy the researcher measures changes in the condition

n-of-1 studies Disadvantages of n-of-1 studies
Inability to generalize results to others
Difficult/impossible to perform statistical analyses
Difficult to validate studies

Observational studies In observational studies the treatment(s) taken or other
exposures studied were not given by the study investigators
Observational designs are used when controlled experimental study design is not possible, feasible or ethical
e.g., for rare conditions or those that require a long time to develop

Example Coffee consumption and pancreatic cancer
Is coffee intake associated with an increased risk of pancreatic cancer development?
Investigators suspect that coffee might be a risk factor for pancreatic cancer.
Would it be appropriate for the investigators to use an experimental design to test their hypothesis?

Case-control studies Used to determine the possible factors (e.g., exposures, drugs)
influencing or causing an event or outcome.
Always retrospective
This design begins with patients who already have the event or outcome (cases) and another group of similar patients who lack the event or outcome (controls)
The investigators need to look back in time in order to compare drug use or the extent of exposure in both groups prior to when they developed the outcome
If the cases are found to have significantly greater drug use or extent of exposure than the controls, a possible association exists between the drug/exposure and outcome development


Cohort studies A cohort study can be prospective (concurrent) or retrospective
(nonconcurrent, historical) The basic design of each is the same:
(1) Identify groups (cohorts) with and without the drug use/exposures of interest – no one has the outcome at the start(2) Follow the groups forward over time and measure differences in outcome development
The nonconcurrent or retrospective design differs from the prospective cohort study in that all information (drug use/exposures and outcomes) is obtained from already existing medical records or databases
The start of a nonconcurrent cohort study occurs at a designated point in the past

Cohort studies The investigators initially select the cohorts for inclusion in either the
study or control groups with no knowledge of whether or not the outcome later develops
Once all subjects are included the investigators examine the existing data, going forward in time from the starting point, to determine whether or not the subjects in each group developed the outcome
Which cohort design, prospective or retrospective, is strongest?
The prospective concurrent design is best because it is less subject to bias and inaccuracies
The nonconcurrent or retrospective design is dependent upon existing records or databases that might be incomplete or incorrect

Cohort design Follows a study ‘‘cohort’’ (a group of individuals/ subjects who share a
common characteristic) over time to determine if a drug or other exposure will lead to the development of an outcome of interest
Unlike the case-control design, the subjects in a cohort study do not have the outcome at the start of the study.
Investigators identify subjects who are taking the drug or have the exposure of interest (study subjects), as well as similar subjects who are not taking the drug or who lack the exposure (control/comparison subjects). The investigators then follow the subjects
In both groups (through scheduled visits, by examining medical records) over a certain period of time to compare the extent to which they develop the outcome
If significantly more subjects in the study group develop the outcome compared to the control subjects, it is concluded that the drug or exposure might contribute to outcome development.

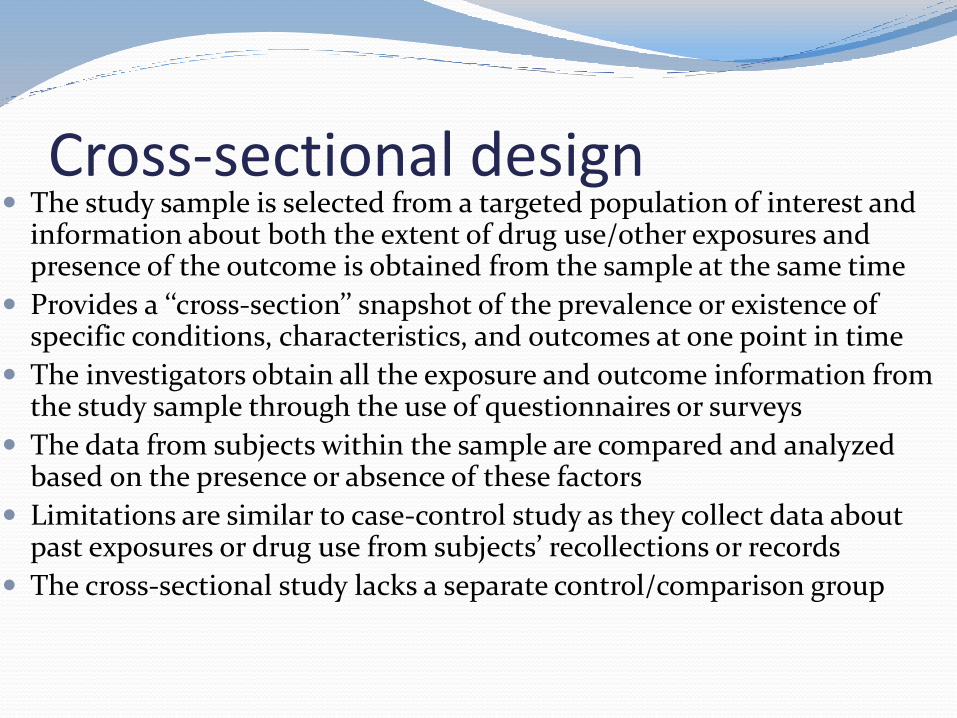
Cross-sectional design The study sample is selected from a targeted population of interest and
information about both the extent of drug use/other exposures and presence of the outcome is obtained from the sample at the same time
Provides a ‘‘cross-section’’ snapshot of the prevalence or existence of specific conditions, characteristics, and outcomes at one point in time
The investigators obtain all the exposure and outcome information from the study sample through the use of questionnaires or surveys
The data from subjects within the sample are compared and analyzed based on the presence or absence of these factors
Limitations are similar to case-control study as they collect data about past exposures or drug use from subjects’ recollections or records
The cross-sectional study lacks a separate control/comparison group


The order of the study designs from strongest (best) to weakest (most limitations/disadvantages) is:
1. Controlled experimental
2. Prospective cohort
3. Case-control/cross-sectional/retrospective cohort
Observational studies cannot prove that a drug or exposure caused a certain outcome; only well-designed controlled experimental studies can do this
Observational studies can provide very useful information when it is not possible, feasible, or ethical to conduct an experimental study

Bias in clinical trials “Bias refers to unconscious distortion in the selection
of patients, collection of data, determination of end points, and final analyses” (Shapiro & Louis, 1983)
Bias is also referred to as systematic error, and can be defined as: “Any process or effect at any stage of a study from its design to its execution to the application of information from the study, that produces results or conclusions that differ systematically from the truth” (Gay, 1999)

Types of Bias Selection bias: it is related to the recruitment of subjects into
different groups with unusual and unequal relation
Drop-out bias (loss to follow-up): occur when a subject leaves a trial before it's over.
Information and Misclassification bias: result from error in measuring outcome or exposure that results in differential accuracy of information between compared groups
Confounding: occurs when a risk factor affecting health status or outcome is not considered
Example: confounding by reason for prescription; and confounding by co-medication

Types of Bias Bias due to lack of compliance
Publication bias: it is caused by the tendency of publishing studies with positive results rather than negative
Bias due to tendency toward obtaining positive results, frequently patients like getting and reporting positive results, similarly, investigators and statisticians wish to see the drug approved, especially if they have financial interest with the company developing the drug under investigation

Evaluating clinical studies Journal
Authors
Study purpose

There are thousands of journals that vary in quality
Editorial boards and peer review are 2 methods for ensuring the overall quality of a journal and its studies

Journals Editorial board
Consists of individuals with expertise in the journal’s area of focus
Helps assure the quality of the published studies
The editors read the manuscript first and make the decision to send it for peer review or not
Peer review
The manuscript is sent by the editor to a small number of outside individuals (peers) with expertise in the subject area
The peers provide their comments/ revisions/ recommendations about accepting or rejecting the manuscript
How to determine if a published study was peer reviewed or not?
Check the journal instructions for authors
Check the received date and date of acceptance
Investigators should conduct their study in a manner free from bias or other factors that can affect their objective judgment
Competing or conflicting interests can influence the manner by which investigators conduct the study or view the results
Conflict of interest for investigators can compromise the objectivity and quality of their work
Conflict of interests can be personal or financial (ties to companies, funding, etc., easier to identify)
Any conflict of interest should be clearly stated in the publication
Conflicts of interest do not necessarily invalidate the study, they indicate that readers should use extra care when analyzing the study

Potential conflicts of interest Receiving study funding from the manufacturer of the drug
investigated
Serving as a consultant or on the board of directors of the pharmaceutical manufacturer of the drug investigated
Being employed by the manufacturer of the drug studied
Having a personal relationship or representing the manufacturer of the drug under investigation
If a pharmaceutical manufacturer only provided the drug or placebo used in the study without any other involvement, it is not a conflict of interest

Questions to determine if conflicts of interests exist
Did the introduction appear overly positive or only focus on the benefits of therapy?
Inclusion or exclusion criteria that include patients who are more likely to benefit from treatment?
Was the active control chosen so that clinicians would choose the investigated drug?
Were there any conclusions that are not supported by the results in the study?

Things to consider when critically reading an article
Journal quality (Impact factor…)
Potential conflict of interests
The objectives of the study and the related hypotheses to determine if the design and methods were sufficient to fulfill the purpose


Introduction The rationale for conducting the study should be clear from its
introduction
The introduction should provide a thorough review of the literature and identify gaps that the study will address
Favorable and unfavorable findings about the drugs should be included
The benefits and the risks associated with the treatment should be assessed
The objective of the study should be clearly stated at the end of the introduction (in most studies)
The hypotheses tested and the results expected can also be stated

Type of hypothesesStudy hypotheses are tested statistically
Null hypothesis: there is no difference between treatments or comparisons
Alternative hypothesis: a difference is expected between therapies
One-tailed
An expected direction of the effect is stated
Two-tailed (Mostly used)
A change is expected but it can be in either direction

Evaluating methods used Importance of a study’s eligibility criteria, methods used
for enrolling patients in a study (sampling) and informed consent
Advantages and disadvantages of different controlled experimental design and types of control
Importance of random assignment in a study Effect of adherance on study findings Importance of outcome measure selection Concepts of validity, reliability, sensetivity and specificity
and their importance to the outcome measures used Dependent vs independent variables The levels of measurements

Considerations in examining methods used in a study Study sample
Sample size
Controlled experimental designs
Assignment to treatment groups
Blinding
Drug treatments
Adherance
Outcomes
Variables
Measurements

It is almost impossible to design the perfect study
One should differentiate between weaknesses and limitations that could invalidate the findings or just limit the applications of the results

Eligibility (inclusion and exclusion) criteria Used to define the characteristics of the subjects
enrolled in the study
Inclusion criteria: characteristics that should be present in the subjects
Exclusion criteria: characteristics that prevent subjects from participating in the study
Eligibility criteria defines the population for which the study results can be applied
Selection bias occur when the study sample is chosen in a way that does not represent the target population

Examples on exclusion criteria:
Nonstudy concurrent medications that might interact with the study drugs or have actions that affect the studied condition
Patients who have contraindications to the study drugs such as allergy or renal impairment
Patients who have other medical conditions that can interfere with the study findings

Example: A study examined the efficacy of a new antihypertensive drug.
The inclusion criteria were: 40-75 years of age, normal renal function, diastolic BP 90-105 mmHg.
Patients were excluded if they had liver disease or were receiving other therapy for their hypertension.
The new drug was found to be very efficacious in lowering diastolic BP in these patients
Can one assume that the new drug will be efficacious in hypertensive patients with impaired renal function or liver disease?

Sampling (enrollment) considerations For best study sample, everyone in the population should
have the same chance of being selected for the study
Random methods are the best methods for sampling
Random sampling is not always possible, since investigators can not have access to everyone in the population

Types of sampling Simple random
Stratified random
Cluster
Systematic
Convenience

Simple random sampling: Everyone in the population is identified and a random
procedure is used to identify persons for study inclusion
Example: computer generated sampling
Stratified random sampling: Enrolling similar numbers of patients who have or do not have
certain characteristics (smokers or nonsmokers, diabetic or non-diabetic patients, etc.)
The population is divided into groups based on the presence or absence of a characteristic, and a random sample is chosen from each group for enrollment

Cluster sampling:
All individuals present in identified clusters in the population are selected for enrollment
Example: everyone living in a city, or attending a hospital
Systematic sampling:
Type of random sampling
Everyone in the population is known and the starting point is randomly selected
Selecting every nth person for the study

Convenience sampling
Most commonly used in experimental studies
Nonrandom sampling that enrolls patients based upon advertisements or whether they are treated in a certain clinic that the investigators work at
Used when it is not possible to contact all persons in the target population
This is acceptable as long as it is defined at the time of the study enrollment which group the patient will be assigned to

Example:
Investigators wish to study the efficacy of a new drug to increase smoking cessation, a condition in which subjects motivation to quit is very important.
Patients are enrolled who respond to a newspaper ad asking for volunteers who would like to participate in a study to quit smoking
Could selection bias be a problem?

Informed consent Investigators need to ensure that the subjects in their
studies are protected from harm to the extent possible
Institutional review board (IRB) and the informed consent are used to ensure subjects are protected
IRB is responsible for assuring that the subjects rights and welfare are protected, before and throughout the study
The informed consent should be obtained by the investigators prior to enrollment in the study

Informed consent Parts of informed consent include:
Providing a subject with adequate information about the study, and its benefits and risks
Giving the subject appropriate opportunity to consider all options
Responding to the subject’s questions
Ensuring that the subject understands the information
Obtaining the subject’s written voluntary consent to participate in the study
Providing additional information as needed

With informed consent, the subjects also have the right to quit the study whenever they wish.
The patients should also be aware of all the potential adverse effects and risks from each type of therapy they may receive

Sampling size A study should have enough sampling size to identify a
statistically significant difference among treatments when an effect exists
Should be able to reject the null hypothesis

With informed consent, the subjects also have the right to quit the study whenever they wish.
The patients should also be aware of all the potential adverse effects and risks from each type of therapy they may receive

Sample size The study should have enough sample size to identify a
statistically significant difference among treatments
When the null hypothesis is rejected
The extent to which a statistical test is able to identify a significant difference when there is an actual treatment effect is referred to as power
Sample size is a key factor affecting a study’s power
All other factors being equal, if the sample size increases the statistical power increases
If a study’s power is too low, the analysis could find the difference between treatments not to be statistically significant

Sample size The study’s sample size or the number of patient to
enroll should ideally be calculated before the study begins
The desired power is selected (≥80)
The sample size can be calculated based on the power value

Example A study reports total of 100 patients needed to be
enrolled in each of two treatment groups to achieve a power of 80%. Although they were able to enroll a sample of 200 patients (100 in each group). Several patients did not complete the study and only 80 patients were analyzed per group. The results showed there w as a fairly large difference in the outcome between treatment groups but it was not statistically significant. The investigators concluded that there was no difference between treatments.
Were enough patients enrolled?

Controlled experimental design Controlled experiment is a strong design for providing
cause and effect and establishing therapy efficacy
Controls should be used when possible
To reduce the likelihood that outside factors (environment, nonstudy medications) might affect the results
Types of controlled study designs
1. Concurrent control (parallel)
2. Cross over
3. Time series (before and after)

Concurrent control (parallel design) Patients are assigned to receive either a control or a study
treatment Results are compared between groups The patients in each group should be as similar as possible Advantages
Most straight forward to analyze statistically Effect can not carry over Requires less time than cross over and time series
Disadvantages Are the different groups comparable
Random assigning and clear eligibility criteria are important
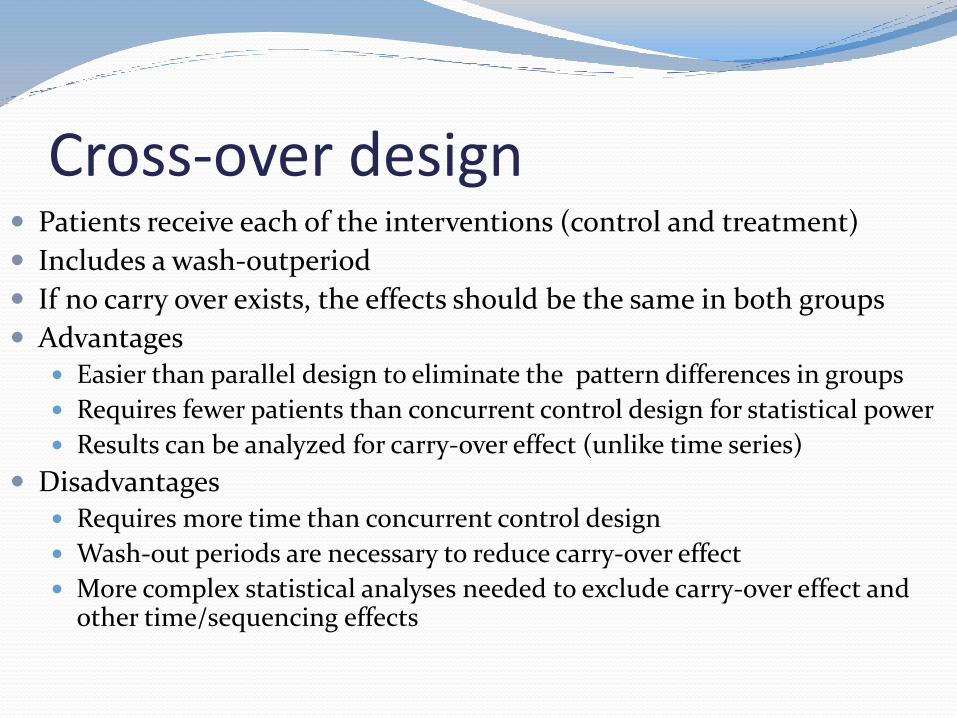
Cross-over design Patients receive each of the interventions (control and treatment)
Includes a wash-outperiod
If no carry over exists, the effects should be the same in both groups
Advantages Easier than parallel design to eliminate the pattern differences in groups
Requires fewer patients than concurrent control design for statistical power
Results can be analyzed for carry-over effect (unlike time series)
Disadvantages Requires more time than concurrent control design
Wash-out periods are necessary to reduce carry-over effect
More complex statistical analyses needed to exclude carry-over effect and other time/sequencing effects

Time series study design Each patient also receives each study intervention All the patients receive the same type of intervention at the same
time Advantages
Easier than parallel design to eliminate patient differences Requires fewer patients than concurrent control design for a desired
power
Disadvantages Requires more time to complete than concurrent control design Wash-out period is important to eliminate carry-over effect Cannot analyze results to determine if carry-over or other sequencing
effect occurred

Example Investigators conducted a randomized single-blind,
placebo-controlled study of galantamine (G) and rivastigmine(R) given for 12 weeks in 60 patients aged 65-85 years with mild Alzheimer’s disease (AD). The investigators state that this study is conducted “to determine the efficacy of G and R on quality of life in AD patients.
How would this study be conducted using a parallel study design?
How would it be conducted using a cross-over design?


The concurrent study design is the preferred
The time series design is the least desirable
The effects time and drug sequence cannot be determined

Assignments to interventions Randomization is the best way to assign patients to
intervention groups
Each patient has an equal chance to be in each study group
Differences in patient characteristics should be balanced between groups
Investigators should conduct postrandomization baseline assessment of the characteristics of patients enrolled in each group
To ensure potentially important factors are evenly distributed among groups

Blinding Blinding (masking) is when patients or investigators do not
know the intervention group that the patient was assigned to
Reduces risk of bias
Many outcome measures can be affected by personal believe that a therapy will work
Pain relief
Changes in mood
Development of side effects
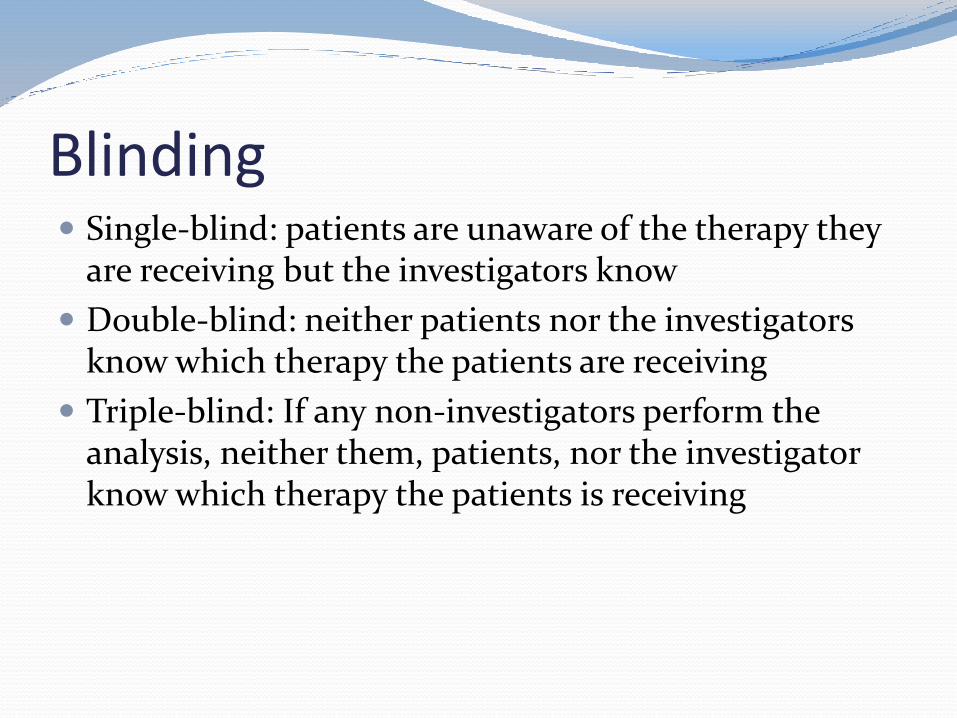
Blinding Single-blind: patients are unaware of the therapy they
are receiving but the investigators know
Double-blind: neither patients nor the investigators know which therapy the patients are receiving
Triple-blind: If any non-investigators perform the analysis, neither them, patients, nor the investigator know which therapy the patients is receiving

Double blinded studies are preferred to single blinded The gold standard for RCT study designs Less bias than single blind studies
Sometimes blinding is harder (characteristic odor, taste, side effect)
Unbinding occurs if a patient or investigator can identify what the patient is receiving during a blinded study
How to tell if unblinding occurred?

Example A double-blind study compared a new NSAID to placebo
for management of arithritis pain. Patients who provided informed consent were randomly assigned to receive either the NSAID (80 patients) or placebo (65 patients) for 10 weeks. Identically appearing NSAID or placebo tablets were used. The NSAID was found to be more efficacious than placebo in relieving pain. Adverse effects (Nause, stomach pain and headaches) were reported by 75 % of patients receiving the NSAID compared to 15% of placebo patients.
Would unblinding be of concern in this study?

Open label (nonblinded) study both the patients and investigators know which therapy the patient is receiving.
Treatment considerations Dosage and dosage form
Dosing frequency
Route of administration
Duration of therapy
Drug concentrations obtained
Use of any concomitant non-study medications
Adverse effects
Therapy adherence

Methods for determining adherence
Pill count
Review pharmacy refill records
Electronic caps or devices that record the times the container was opened
Asking patients or keeping a diary
Measuring drug concentrations
Measuring a drug’s physiologic action

Example Two pain medications, A and Y were compared for treatment of
severe back pain.
After 3 months of therapy 89% of patients receiving drug A reported complete pain relief compared to only 60% of drug Y patients
Bitter taste was reported by 80% of patients receiving drug Y
Mild nausea and headache were reported in 5% of patients receiving either drug
Through the use of pill count and patient diaries, 96% of patients receiving drug A took 90% of their doses compared to 65% of drug Y patients
Was adherence appropriately measured? Was compliance bias a potential problem?
Outcomes A study’s objective should specify the broad overall
outcome of interest
Example: hypertension control, smoking cessation, diabetic control.
The methods should clearly state the primary outcomes of interest as well as any secondary outcomes.
The end point where the outcome will be successfully met should be specified when possible

Variables Variables refer to study characteristics that can assume
different values
Dependent or independent variables, confounding variables
Independent (explanatory) variables affect the value of the dependent (response) variables
Type of treatment
Dependent variables: change in value as a result of the independent variable
The outcome measures are the dependent variables that can be altered by exposure to treatment
Confounding variable A factor that can affect the value of the outcome
measures in addition to the therapy being studied
Affect the study results and their interpretation
The confounding variables should be taken into account

Example A randomized single-blind study compares a new triptan T to
sumatriptan for migraine headaches.
54 patients are assigned to receive either treatment
When migraine is experiences the patient takes the assigned drug and records the severity of pain over 24 hours
The outcome measures include the time to headache relief and the severity of pain over the 24 hour period
Patients are allowed to take prn NSAIDs if they do not experience headache relief within 2 hours after treatment
Would taking NSAIDs affect the results of the study?

Measurements The tests or procedures used to measure changes in
the desired outcomes (dependent variables) should be appropriate to the intended objectives
Studies should select the best test or a combination of tests to measure outcomes

Measurements For a study’s measurements to reflect the outcomes
the tests should be
Valid; can truly determine the desired measurement
Reliable; reproducible, consistent
Sensitive; can identify the presence of a condition
Specific; can identify as negative those who do not have the condition
Surveys or questionnaires should be validated prior to use in a study

Example Suppose Arthritis Quality of Life Scale is able to
measure accurately only the changes in quality of life that result from arthritis but not from any other medical conditions, it is not able to detect small changes in quality of life, it only detects fairly large changes
Which of the following characteristics validity, reliability, sensitivity or specificity, does the survey process?

Example A study of methotrexate for treating RA measured the
degree of joint erosion and joint space narrowing on X-rays as two of the primary outcomes
Assuming X-rays can measure even very small changes in the degree of joint erosion and space narrowing
Which measurement attribute describe the ability to detect very small changes in the outcome measure?

Internal & external validity Internal validity: the extent to which a study’s findings were
appropriate and correct
The relationship between the intervention and outcomes was accurate
External validity: The extent to which the findings of a study can be applied to the patients and settings outside the study

The stronger the study’s design, methods and analyses, the greater the internal validity RCT have greater internal validity than other study types
External validity is important for applying the results from a study in clinical practice
The study should provide clear protocols and definitions to ensure that an outcome measure is appropriately used throughout the study

Hawthorne effect Hawthorne effect is when patients alter their performance,
behavior or attitudes as a result of being observed or given attention in a study and not from the intervention
Hawthorne effect can be reduced by handling patients in each treatment group as similarly as possible

Scales of measurements Nominal
Ordinal
Continuous
Interval
Ratio
Determine the statistical tests used

Scales of measurements Nominal (categorical): data that lack numerical qualities
e.g. race, gender, presence or absence of adverse effect/ cure
Ordinal: data that can be ranked on a scale with one value more or less than another, assigned numbers do not have exact differences
e.g. opinions ranked using a scale of 5-1 (strongly agree-disagree)
Ranking of severity of illness

Scales of measurements Continuous: data that can assume an unlimited number of
numerical values within a range with equal distances between numbers
Interval: Lack a true zero point
pH values, Fahrenheit or Celius temperatures
Ratio: have a true zero point
The most common type of continuous data used in clinical research
e.g. height, weight, drug concentration

Examples Label as nominal, ordinal or continuous
Thyroxine serum concentration following thyroid replacement
The severity of neuropathic pain (3=severe, 2=moderate, 1= mild, 0= absent) following therapy with gabapentin or placebo
Number of osteoporosis patients who experienced a fracture during treatment with either alendronate (3 of 29, 10.3%) or risidronate (5 of 35, 14.3%)
Hemoglobin A1c concentration at baseline and following metformin therapy

Example A double-blind randomized study examined the use of
a new antipsoriatic medication
The outcome measures included the rating of psoriatic severity by investigators as 4= severe, 3=moderately severe, 2= moderate, 1= mild, 0= absent.
The study found that there was a slight but significant reduction in the rating of psoriatic severity
Are there any potential problems with the rating scale from this study?

Statistical analyses Interpretation of a clinical trial’s findings usually depends upon
statistical analyses of the data
Statistics help the investigators and readers find out: If differences found in outcome measures resulted from treatments or
not The association among variables measured in the study group Predictions that can be made for the populations based on the results
from the study sample
Many statistical tests are available The appropriate test is chosen depending on the types of data and
conditions involved

One-tailed vs two-tailed tests The use of one-tailed or two-tailed tests depends on the
study’s stated objectives or hypothesis
One-tailed test is used only when a study clearly states a one-tailed hypothesis (unidirectional change)
Most clinical studies use two-tailed tests

Factors considered when selecting a statistical test:
Level/scale of measurement of the data being analyzed
(nominal, ordinal, continuous)
Number of treatment groups being compared
Data collected from paired (the same patient) or unpaired (different) patients

Categories of statistical tests
Parametric
Nonparametic
Choice of parametric or nonparametric tests to analyze data depends on the population from which the study sample was selected

Parametric tests Used when the data being analyzed is continuous and
normally (or near normally) distributed
Normal (Gaussian)distribution resembles a bell-shaped curve when graphed by frequency
Preferred
(more statistical power)
Example:
t-test
ANOVA
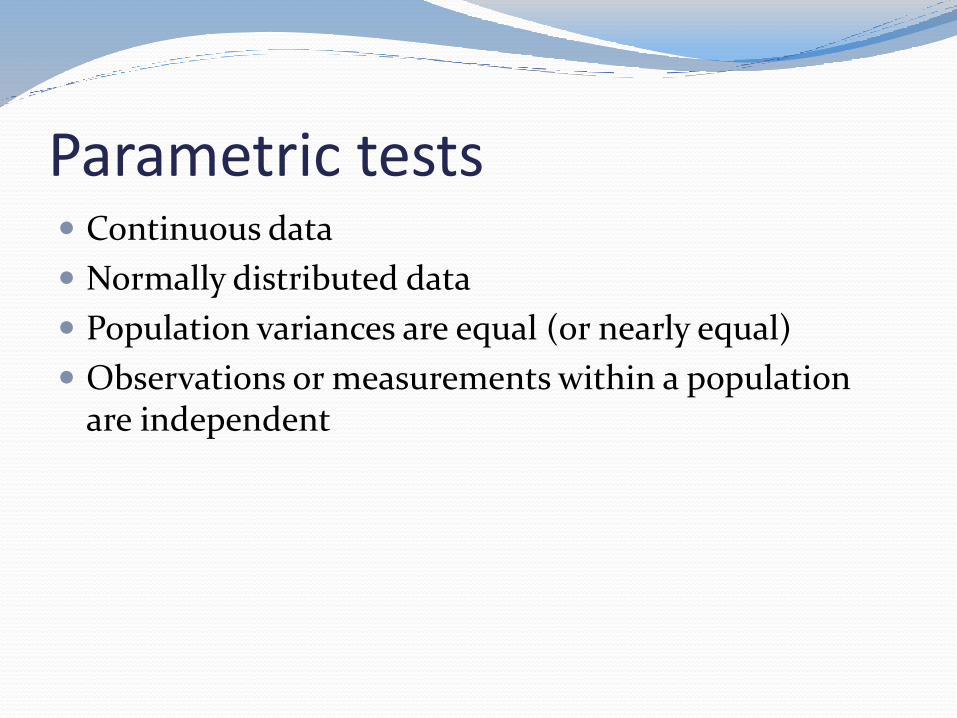
Parametric tests Continuous data
Normally distributed data
Population variances are equal (or nearly equal)
Observations or measurements within a population are independent

Parametric tests t-test
Used when comparing the means of only 2 groups
Paired or unpaired t-test
ANOVA Used when comparing the means of 3 or more groups
If ANOVA is significant, a multiple comparison (post-hoc) test is used to identify which 2 group mean comparison is statistically significant Scheffe’s test
Tukey honestly significant (HSD) test
Dunnett test
Fisher least significant test (LSD)

ANOVA
One-way ANOVA
≥3 groups, one independent variable, parallel study design (unpaired)
Two way ANOVA
≥3 groups, two independent variable, parallel study design (unpaired)
Repeated measures ANOVA
≥3 groups, one independent variable, cross-over design, (paired data)
≥2 groups, one independent variable, parallel study design, multiple measurements taken over time in each study group

Example A parallel double-blind study is performed to compare the
diastolic blood pressure after 12 weeks of therapy in patients randomized to receive enalapril (n = 68), lisinopril (n = 72), fosinopril (n = 65)
Assume the blood pressure readings are normally distributed
Which statistical test should be used to analyze the results?A. Paired t-test
B. Unpaired t-test
C. One-way ANOVA
D. Two-way ANOVA
E. Repeated measures ANOVA

Nonparametric test Used when data is not normally distributed
The choice of nonparametric test depends on:
Whether the data being analyzed are nominal or ordinal (Chi-square, Fisher’s exact are examples on tests used for nominal data)
(Mann-Whitney, Friedman are examples on tests used for ordinal data)
The number of groups involved
Samples are paired or unpaired


Correlation The association between two variables
Correlation coefficient (r) is used to quantify the degree and direction of a linear association between 2 variables
r ranges from -1 to 1
Negative r indicates an inverse association
Positive r indicates a positive association
r = 0; no association

Correlation

Regression analyses Involves predicting the value of an outcome measure based
upon the value of an independent variable
If two variables are correlated, an equation can be created to predict one of the variables if the other is known
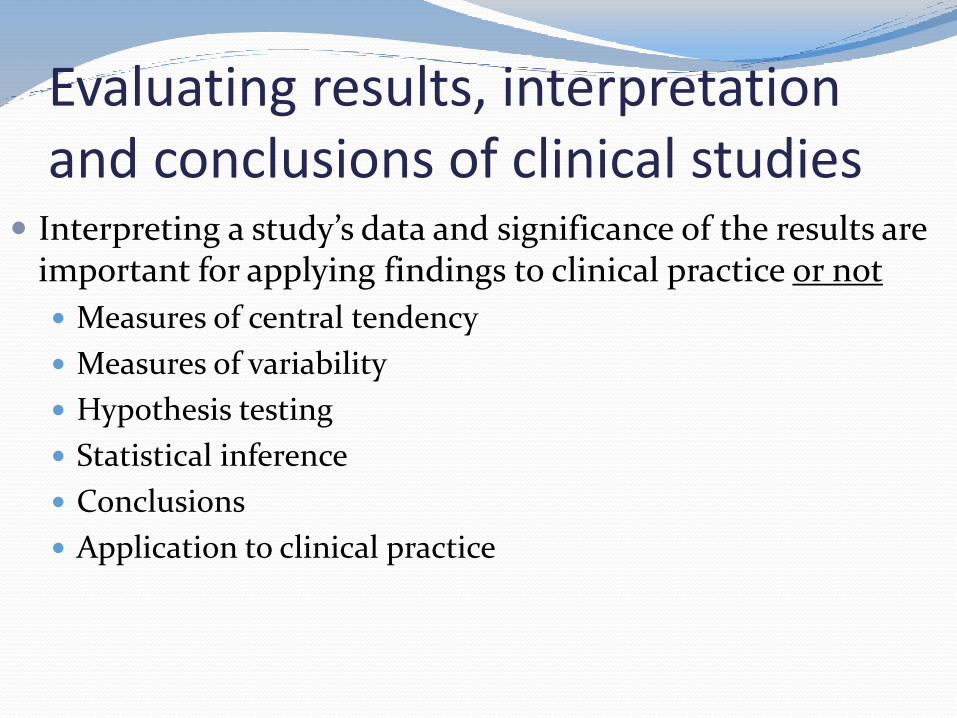
Evaluating results, interpretation and conclusions of clinical studies
Interpreting a study’s data and significance of the results are important for applying findings to clinical practice or not
Measures of central tendency
Measures of variability
Hypothesis testing
Statistical inference
Conclusions
Application to clinical practice

Measures of central tendency Central tendency of the data reflects the usual or typical
response to therapy in the study
3 Central tendency measures:
The mean
The median
The mode

The mean Provides a good estimate for central tendency (clustering) of
continuous data
Can be used for ordinal-level data
Keep in mind that distances between numbers are not equal
Caution should be taken when interpreting ordinal data represented by the mean
In the presence of outliers, the mean can misrepresent the data

Examples Serum potassium values in mEq/L for 10 patients are: 4.1, 3.1,
5.2, 3.7, 5.1, 3.2, 4.8, 4.3, 3.9, 5.1
The mean = Sum/n= 4.25
Estrogen concentrations in 10 women in pg/mL
28, 29, 30, 30, 29, 28, 28, 30, 30, 259
The mean = 52.1
Without the outlier, the data is clustered around 29

The median The midpoint of a rank ordered data
The 5oth percentile
Can be used for ordinal or continuous data
It better represents the central tendency of data with one or more outliers

Examples Estrogen concentrations in 10 women in pg/mL
28, 29, 30, 30, 29, 28, 28, 30, 30, 259
The mean = 52.1
The median = 29

The mode The most frequently occurring value in a data set
Can be used for nominal, ordinal, or continuous data
Only one used for nominal data
Not very helpful for continuous data

Examples Systolic blood pressure in patients in mmHg
<120 (23 patients)
120-149 (27 patients)
≥150 mmHg (18 patients)
Patients satisfaction with therapy on a scale of 0-4
If most patients indicated 3, the mode =3

Example A study evaluating the efficacy of herbal Chinese tea
extract for treating hyperlipidemia in 12 diabetic patients reported that serum cholesterol levels following 8 weeks of therapy were:
mean = 220 mg/dL; median =175 mg/dL
Which value appears to provide a better estimate of the central tendency of the data?

Measures of variability Measures of spread or dispersion of the data
The range
Interquartile range (IQR)
Variance (not used frequently)
Standard deviation (SD)
Most commonly used
Reported as mean ± SD or mean (SD)
Standard error of the mean (SE or SEM)
Frequently used in clinical trials but should not be used

Example Two studies examined whether counseling diabetes patients
about their medications increased blood glucose control.
The patients’ mean (SD) fasting blood glucose concentration following counseling were
Study 1 160 (31) mg%
Study 2 158 (45) mg%
Which study reported greater variability in individual patient responses following therapy?

Example A study examined the efficacy of a new drug for hypertension
treatment in 200 patients. At the end of the study (week 16), the change from baseline in mean (SEM) systolic/diastolic blood pressure was -18.07(0.8)/-10.9(0.5)
Is it appropriate for SEM to be reported

Statistical inference
The process used to draw conclusions about the underlying population from the data obtained in the study sample
Statistical inference incorporates
Confidence intervals
Hypothesis testing

Confidence interval
Confidence intervals CI can help us apply the study’s results to the population of interest
Confidence interval provides the values likely (at a specified level of confidence) to contain the actual population value for that measure
Can be used for nominal or continuous data
Can be determined for efficacy rates or other outcome measures within a group or differences between groups

Confidence interval Wide vs narrow
Factors that affect the width of confidence interval
Level of confidence selected
90% CI, 95% CI, 99% CI (which one is the widest?)
Sample size
SD of the study sample

Example A study reports that the clinical cure rate was 91.8% (89 out
of 97 patients) for levofloxacin compared with 82.4% (84 of 102 patients) for ciprofloxacin.
(95% CI =2.1-16.8)

Example A study compared the efficacy of pine bark extract (64
patients) with placebo (56 patients) for treatment of hypertension.
Patients receiving pine bark extract had a mean decrease in diastolic pressure from baseline to the end of therapy of 3.1 mm Hg (95% CI 1.0-5.2)
How would the CI interval change if
We used 90% CI
200 patients were enrolled in the pine bark extract

Hypothesis testing The process of determining whether or not the data gathered
support the study’s hypothesis
Used to reject or accept the null hypothesis
Important concepts in hypothesis testing
Probability (P) values
Type I error; alpha (α)
Type II error; beta (β)
Statistical power and factors influencing power

P values P values provides the likelihood that chance was responsible
for the effect observed or that the null hypothesis was true
P values range from zero to 1
The value of 0.05 (level of significance) is used as a cut-0ff in clinical studies
P < 0.05 statistically significant findings
P ≥ 0.05 findings not statistically significant

Example A study compared the efficacy of oral mesalazine (n=28
patients) with topical mesalazine (n=30 patients) for the treatment of distal ulcerative colitis.
Following 2 weeks of therapy with either agent the clinical response ate was 43% with oral mesalazine vs 58% with topical mesalazine (P=0.003)
Is therapy difference statistically significant?

Type I error Finding concluded to be statistically significant (P < 0.05)
and resulting from treatment when the difference was due to chance
Rejecting the null hypothesis when it is really true
False positive effect
α is the probability of type I error, it is set at 0.05

Type II error The finding concluded not to be statistically significant when
the treatment actually caused the difference observed
False negative results
Type II error is possible when P ≥ 0.05
Failure to reject the null hypothesis when it is false and should be rejected
Β is the probability of type 2 error

Statistical power Statistical power is the likelihood of not making type II error
Power = 1 – beta
Power ≥ 80% is desired

Statistical power Statistical power is calculated based on available formulas
Factors affecting statistical power
Sample size (Easiest to adjust to increase power)
Effect size: the size of difference in the outcome measure that if present can be identified as statistically significant
Alpha: risk of type 1 error, the cutoff point for power calculation is usually 0.05
Variability of the outcome measure in the population (SD)

Example Investigators compared a new drug to placebo for the
prevention of headaches
30 patients experiencing headache were enrolled
15 received placebo and 15 received the drug
Following 10 weeks of therapy there were a 40% reduction in headache frequency with the drug compared to placebo (p=0.07)
What would be your conclusion?
What type of error is involved?

Statistical significance vs clinical significance
If a study is statistically significant (p<0.05), we should then look at the treatment effect or difference between group to determine clinical significance
Can a study be clinically significant if it is not statistically significant?
How to determine if CI is not statistically significant?

Measures of risk, risk reduction, and clinical utility
Clinical studies investigate the likelihood of an event to occur with therapy
Adverse event
Beneficial event
When comparing different therapies clinicians would like to know the extent to which the treatment can cause such effects

Measures of risk, risk reduction, and clinical utility
Odds ratio (OR)
Relative risk (RR)
Relative risk reduction (RRR)
Absolute risk reduction (ARR)
Number needed to treat (NNT)
Number needed to harm (NNH)

Odds ratio Odds ratio (OR)
The odds of an event occurring in one treatment group divided by the odds of the event occurring in the other group
OR< 1 (Odds of an event occurring in treatment group is less
than in placebo)
OR = 1 (Odds of an event occurring in treatment group equals
that in placebo)
OR > 1 (Odds of an event occurring in treatment group is
higher than in placebo)

Example A study examined the efficacy of a new drug for migraine
prophylaxis compared with propranolol (control)
A total of 350 patients were randomly assigned to receive either the new drug (150) or propranolol (200)
Patients were followed for 2 weeks
Outcome measure: migraine development
30 patients in the new drug group developed migraine and 50 patients in the propranolol group had migraine
What is the OR for migraine development with the new drug compared to propranolol?

Risk and relative risk Risk of an event occurring is the number of times the event
occurs divided by the total number of persons in the involved (exposed) groups
RR ratio of the risk of an event occurring in one group (treatment) divided by the risk of it occurring in another (control) group
RR<1 (Risk is higher in control group)
RR=1 (Risk is equal in both groups)
RR>1 (Risk is higher in treatment group)

Example A study examined the efficacy of a new drug for migraine
prophylaxis compared with propranolol (control)
A total of 350 patients were randomly assigned to receive either the new drug (150) or propranolol (200)
Patients were followed for 2 weeks
Outcome measure: migraine development
30 patients in the new drug group developed migraine and 50 patients in the propranolol group had migraine
What is the RR for migraine development with the new drug compared to propranolol?

RRR vs ARR RRR
The extent of reduction in relative risk
The proportion of reduction in risk that the patients might receive
ARR
The actual difference in the event rates between treatments

NNT vs NNH NNT = 1/ARR
Number of patients needed to be treated to observe a beneficial effects
NNH= 1/ARI
ARI absolute risk increase
Number of patients treated to observe an adverse outcome
When the treatment is worse than control

Example A study compared the incidence of severe hypoglycemia in
diabetic patients receiving either an oral drug for diabetes (238 patients) or a new inhaled insulin (295)
At the end of a year 65 patients who received the oral drug and 103 patients who received insulin developed at least one episode of severe hypoglycemia
What is the OR for development of severe hypoglycemia with the oral drug compared with the inhaled insulin?
What is the RR for development of severe hypoglycemia with the oral drug compared with the inhaled insulin?
What is the NNT for development of severe hypoglycemia with the oral drug compared with the inhaled insulin?

Drop-outs and data handling Ideally patients involved in a study would complete the study
and investigators would be able to collect needed data
Usually many patients will quit a study (drop out)
There are 2 common methods for handling drop-outs Intent-to-treat: data from all patients randomized in treatment
groups are analyzed whether they completed the study or not
Exclusion of subjects (per protocol): only those who complete the study protocol as specified are included in data analysis
Modified intent-to-treat (The patients have taken at least one dose of therapy or completed one data collection)

Example 100 patients are enrolled in a study to receive drug A.
35 patients dropped out during the study for a variety of reasons.
45 patients had a favorable response to drug A.
What would be the efficacy if the intent-to-treat data handling method were used?
What would be the efficacy if exclusion of subjects were used?

Example 1-year study compared Fosamax (200 patients) with Actonel (200
patients) for preventing bone fractures in patients with osteoporosis
To detect a 5% difference in the incidence of bone fractures with 400 total patients and an α=0.05, the power was 80%
60 patients dropped out of the Fosamax group and 10 patients dropped out of the Actonel group.
What was the effect size used for power analysis?
Which data-handling method (intent-to-treat or exclusion of subjects, would reduce the statistical power for comparing the bone fracture rates between treatments?

Discussion section Summarizes all important findings of the study
Analyzes the results in relation to previous studies or other relevant literature
Explanation of the results can be provided
Limitations of the study should be mentioned
Types of future research needed in the area
A final summary that states the study’s conclusions and clinical applicability of the findings

Evaluating clinical studies Type of study (strength and limitations)
Introduction and study rationale
Enrollment of subjects
Treatment regiments
Outcome measures
Data handling and statistical analyses
Presentation and interpretation of the results
Author’s discussion and conclusions

Key questions when critiquing published experimental studies Journals and authors
Does the journal have an editorial board? Does the journal use peer review?
Any potential conflict of interest for authors or investigators? Would they affect the objective, methods or conclusions?
Introduction Was appropriate scientific background or rationale provided?
Is the stated objective or hypothesis consistent with the research question needed to be addressed?
Is the study adequately designed to fulfill its stated objective?

Key questions when critiquing published experimental studies Patients/subjects
Were the inclusion and exclusion criteria appropriate and representative of the population of interest?
Were factors that might interfere with the study excluded?
Was the number of patients enrolled and analyzed sufficient to maintain at least 80% power for outcome measures?
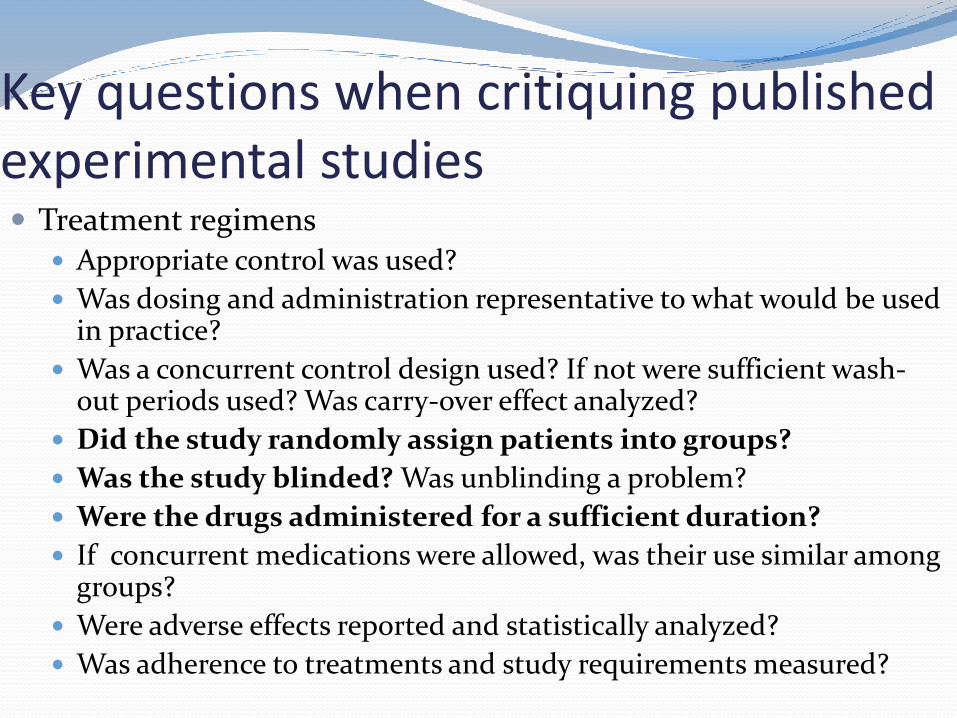
Key questions when critiquing published experimental studies Treatment regimens
Appropriate control was used?
Was dosing and administration representative to what would be used in practice?
Was a concurrent control design used? If not were sufficient wash-out periods used? Was carry-over effect analyzed?
Did the study randomly assign patients into groups?
Was the study blinded? Was unblinding a problem?
Were the drugs administered for a sufficient duration?
If concurrent medications were allowed, was their use similar among groups?
Were adverse effects reported and statistically analyzed?
Was adherence to treatments and study requirements measured?

Key questions when critiquing published experimental studies Outcome measures
Were the primary and secondary outcome measures clearly defined and appropriate for the objective?
Were standardized methods used?
Was the timing of outcome measures appropriate and of adequate frequency?
Were different patient groups handled similarly?
Statistical methods
Were appropriate statistical tests used for all outcome measures?
Did any reported correlation (r) values represent strong or clinically important associations?

Key questions when critiquing published experimental studies Results
Were any significant differences apparent among groups?
Was the number of patients accounted for at each step? And was it clear how many patients were in each analysis?
Drop-outs and data handling method used?
Was power appropriate for outcome analysis?
Was the measure of central tendency appropriate?
Were the measures of variability appropriate and sufficient?
Were findings statistically significant? And if yes, were they large enough to be clinically significant?

Key questions when critiquing published experimental studies Discussion
Were the results (positive and negative) interpreted?
Did the authors adequately explain key study limitations and any discrepancies from other similar studies?
Were conclusions consistent with the results and study limitations?
Overall assessment What were the important weaknesses of the study? What key
findings should be taken away from the study?
Could any study limitations or design weaknesses reduce internal validity thereby affecting its external validity?
What is the role of the study in clinical practice?
Is any further research needed?

Equivalence and noninferiority studies Clinical trials “superiority studies” are most frequently
conducted to either reject or accept the null hypothesis
Equivalence studies
Noninferiority studies
Both equivalence studies and noninferiority study designs use active control not placebo

Equivalence studies Equivalence studies:
A new therapy is no better or worse than an active control therapy
Investigators want to show that treatments are not significantly different (Equivalent)
Used to prove that generic drugs are equivalent to brand drug

Equivalence study example Equivalence study examines bioavailability of new drug A
compared to established drug B
Equivalence margin identified as 95% CI of 80-125%
The study finds the bioavailability of the drug =92% with 95%CI= 88%-96%

Noninferiority studies Noninferiority studies
Used to determine that a treatment is at least as efficacious as but no worse than an active control therapy
The study treatment can be better or has the same efficacy as an active control
Performed to establish the efficacy of a new drug when there is no highly beneficial therapy available or it is not possible to use placebo
OR
Performed to determine that a new drug has fewer side effects or other secondary benefits

Noninferiority studies Noninferiority studies establish a certain efficacy difference
called the noninferiority margin or threshold
Noninferiority studies do not report P values but report CI instead