Embed Size (px)
Citation preview
CHARLESTON, SC DMA
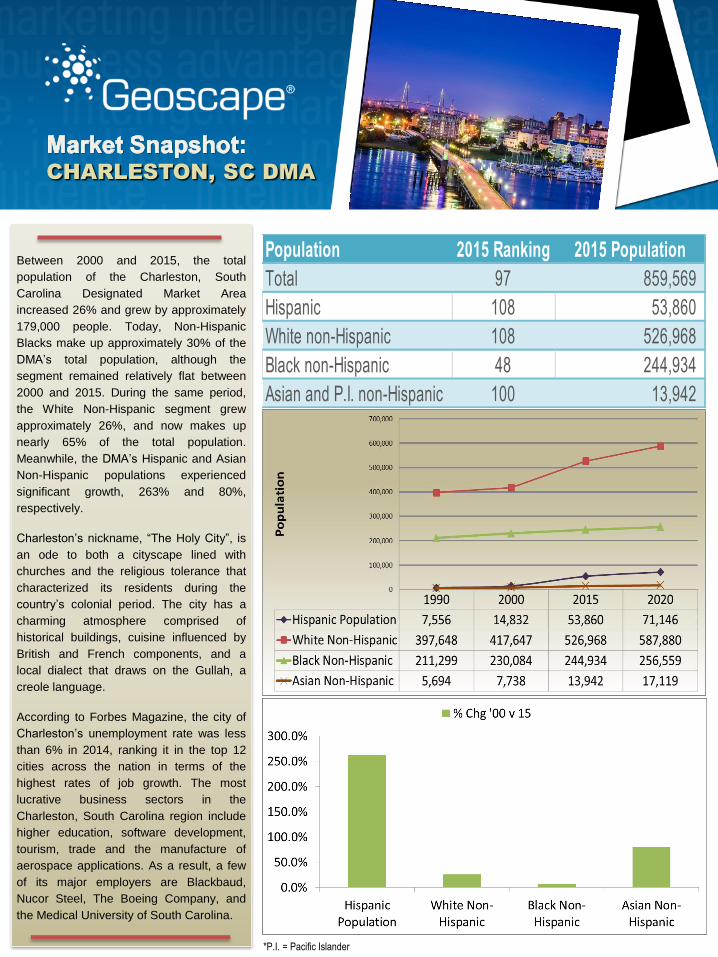
Between 2000 and 2015, the total
population of the Charleston, South
Carolina Designated Market Area
increased 26% and grew by approximately
179,000 people. Today, Non-Hispanic
Blacks make up approximately 30% of the
DMA’s total population, although the
segment remained relatively flat between
2000 and 2015. During the same period,
the White Non-Hispanic segment grew
approximately 26%, and now makes up
nearly 65% of the total population.
Meanwhile, the DMA’s Hispanic and Asian
Non-Hispanic populations experienced
significant growth, 263% and 80%,
respectively.
Charleston’s nickname, “The Holy City”, is
an ode to both a cityscape lined with
churches and the religious tolerance that
characterized its residents during the
country’s colonial period. The city has a
charming atmosphere comprised of
historical buildings, cuisine influenced by
British and French components, and a
local dialect that draws on the Gullah, a
creole language.
According to Forbes Magazine, the city of
Charleston’s unemployment rate was less
than 6% in 2014, ranking it in the top 12
cities across the nation in terms of the
highest rates of job growth. The most
lucrative business sectors in the
Charleston, South Carolina region include
higher education, software development,
tourism, trade and the manufacture of
aerospace applications. As a result, a few
of its major employers are Blackbaud,
Nucor Steel, The Boeing Company, and
the Medical University of South Carolina.
*P.I. = Pacific Islander
Population 2015 Ranking 2015 Population
Total 97 859,569
Hispanic 108 53,860
White non-Hispanic 108 526,968
Black non-Hispanic 48 244,934
Asian and P.I. non-Hispanic 100 13,942
CHARLESTON, SC DMA
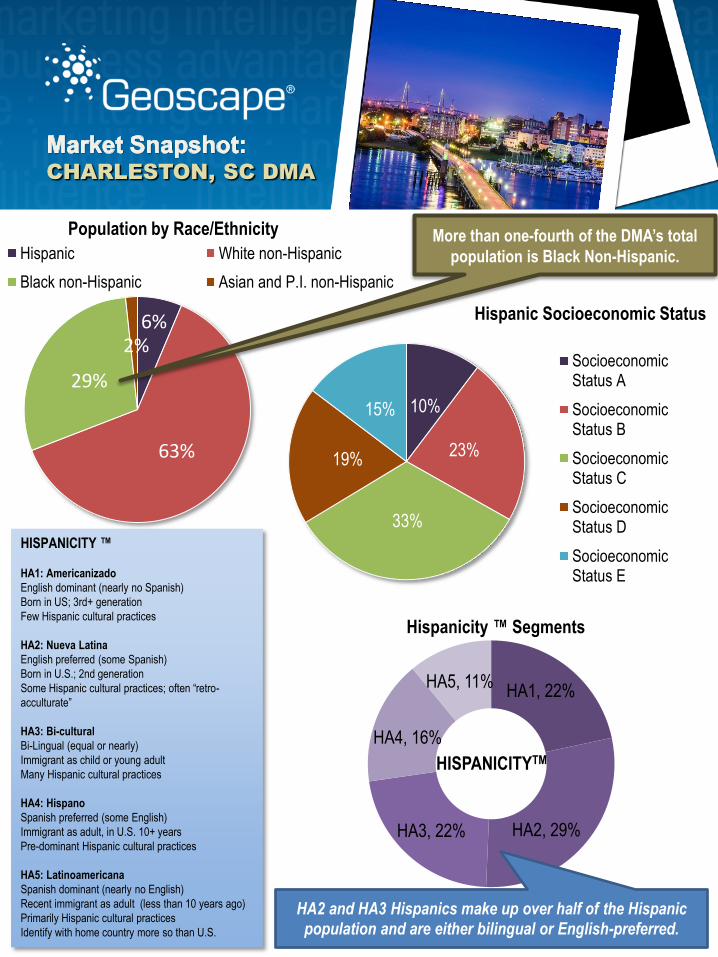
HISPANICITY ™
HA1: Americanizado
English dominant (nearly no Spanish)
Born in US; 3rd+ generation
Few Hispanic cultural practices
HA2: Nueva Latina
English preferred (some Spanish)
Born in U.S.; 2nd generation
Some Hispanic cultural practices; often “retro-
acculturate”
HA3: Bi-cultural
Bi-Lingual (equal or nearly)
Immigrant as child or young adult
Many Hispanic cultural practices
HA4: Hispano
Spanish preferred (some English)
Immigrant as adult, in U.S. 10+ years
Pre-dominant Hispanic cultural practices
HA5: Latinoamericana
Spanish dominant (nearly no English)
Recent immigrant as adult (less than 10 years ago)
Primarily Hispanic cultural practices
Identify with home country more so than U.S.
HA1, 22%
HA2, 29% HA3, 22%
HA4, 16%
HA5, 11%
HISPANICITYTM
HA2 and HA3 Hispanics make up over half of the Hispanic population and are either bilingual or English-preferred.
10%
23%
33%
19%
15%
SocioeconomicStatus A
SocioeconomicStatus B
SocioeconomicStatus C
SocioeconomicStatus D
SocioeconomicStatus E
Hispanic Socioeconomic Status
Hispanicity ™ Segments
Population by Race/Ethnicity
6%
63%
29%
2%
Hispanic White non-Hispanic
Black non-Hispanic Asian and P.I. non-Hispanic
More than one-fourth of the DMA’s total
population is Black Non-Hispanic.
CHARLESTON, SC DMA
P. 888.211.9353 | E. [email protected] | URL. www.geoscape.com
Source: Geoscape American Marketscape DataStream™ and/or Consumer Spending Dynamix™ Series 2015
The Designated Market Area (DMA) boundaries are defined by Nielsen.
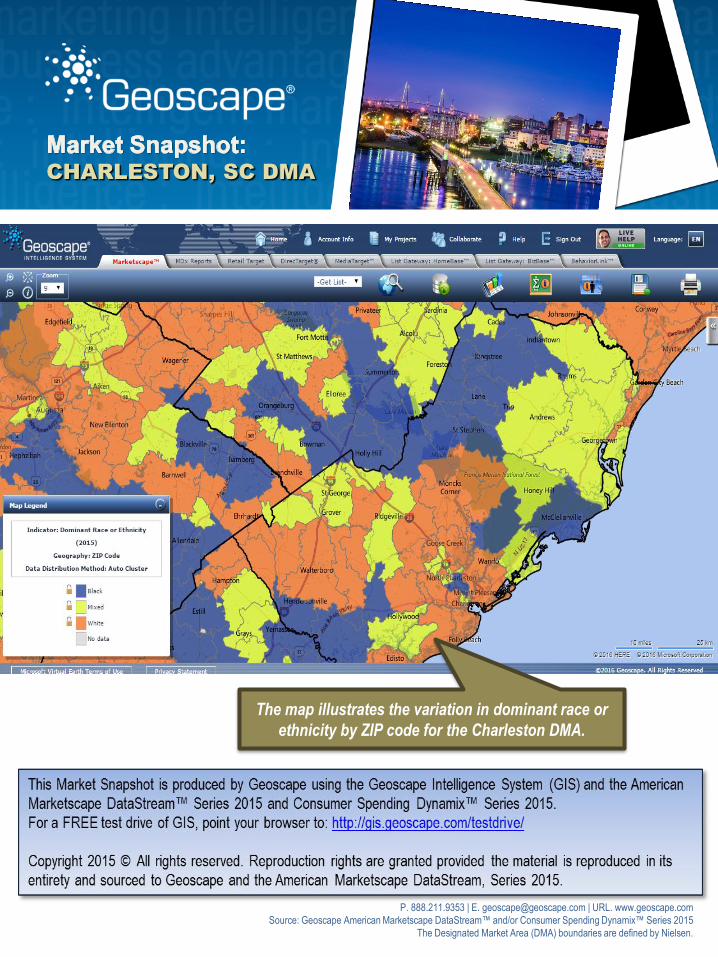
The map illustrates the variation in dominant race or
ethnicity by ZIP code for the Charleston DMA.
CHARLESTON, SC DMA
P. 888.211.9353 | E. [email protected] | URL. www.geoscape.com
Source: Geoscape American Marketscape DataStream™ and/or Consumer Spending Dynamix™ Series 2015
The Designated Market Area (DMA) boundaries are defined by Nielsen.
Orlando
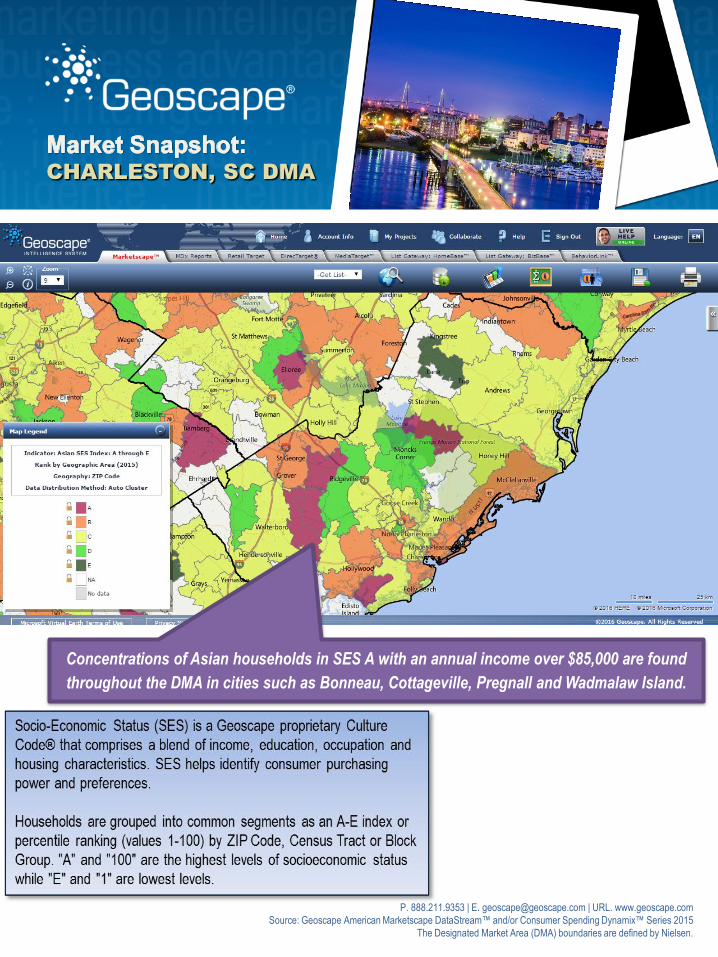
Concentrations of Asian households in SES A with an annual income over $85,000 are found
throughout the DMA in cities such as Bonneau, Cottageville, Pregnall and Wadmalaw Island.
CHARLESTON, SC DMA
P. 888.211.9353 | E. [email protected] | URL. www.geoscape.com
Source: Geoscape American Marketscape DataStream™ and/or Consumer Spending Dynamix™ Series 2015
The Designated Market Area (DMA) boundaries are defined by Nielsen.
Orlando
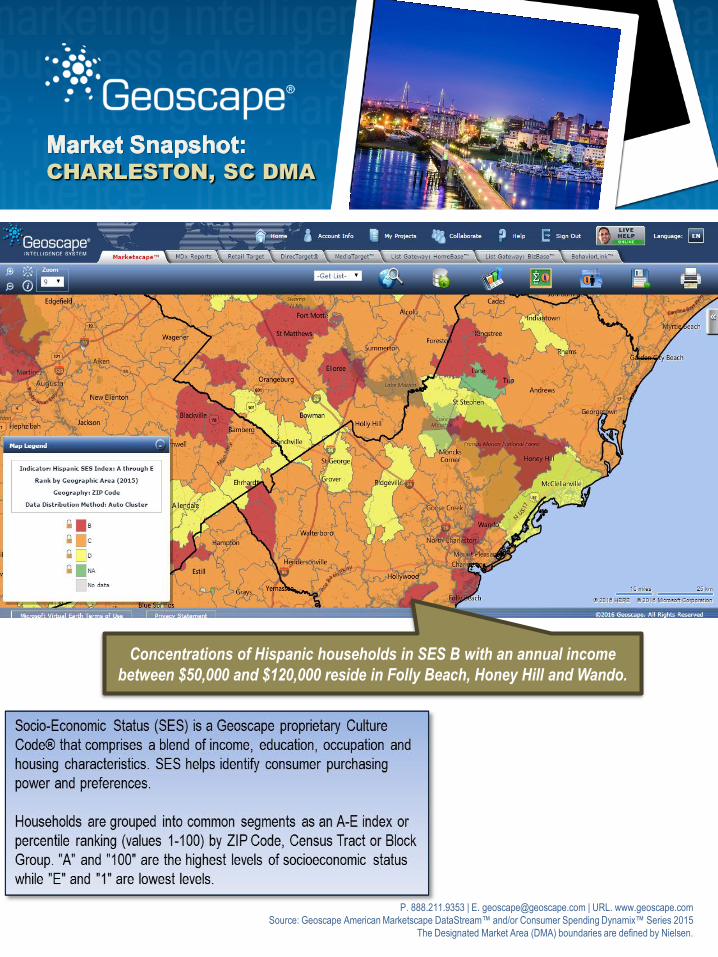
Concentrations of Hispanic households in SES B with an annual income
between $50,000 and $120,000 reside in Folly Beach, Honey Hill and Wando.