Embed Size (px)
Citation preview
Making Sense of Statistics in HCI: From P to Bayes and Beyond – Alan Dix
Making Sense of Statistics in HCI
Part 4 – So What?making sense of results
Alan Dixhttp://alandix.com/statistics/
Making Sense of Statistics in HCI: From P to Bayes and Beyond – Alan Dix
why are you doing it?
exploration vs. validationprocess vs. product
Making Sense of Statistics in HCI: From P to Bayes and Beyond – Alan Dix
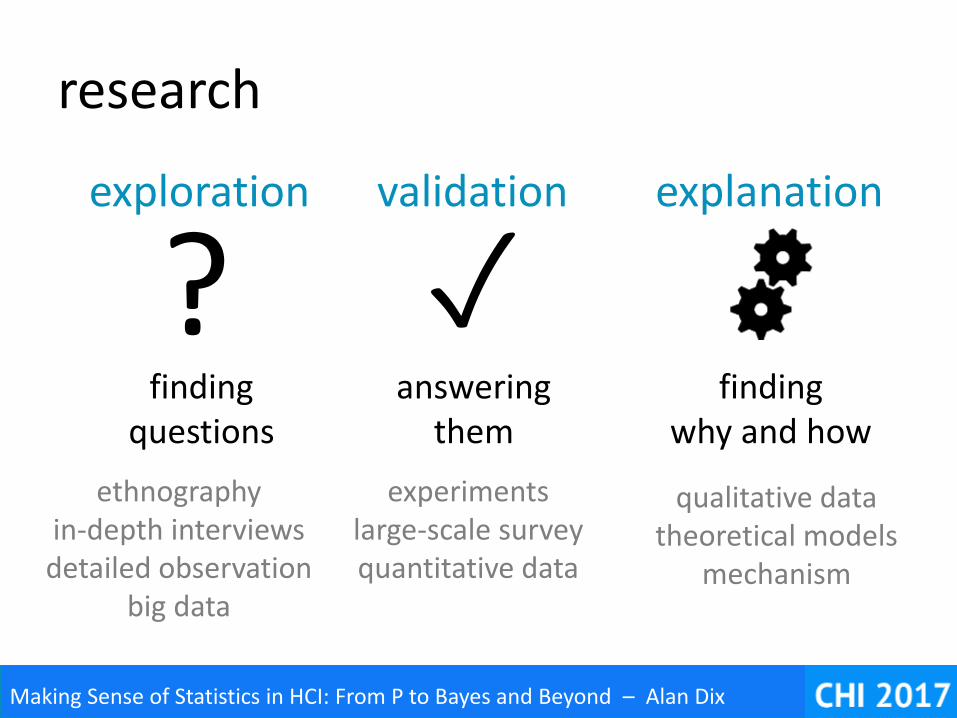
research
exploration
?finding
questions
✓validation
answeringthem
explanation
findingwhy and how
ethnographyin-depth interviewsdetailed observation
big data
experimentslarge-scale surveyquantitative data
qualitative datatheoretical models
mechanism
Making Sense of Statistics in HCI: From P to Bayes and Beyond – Alan Dix
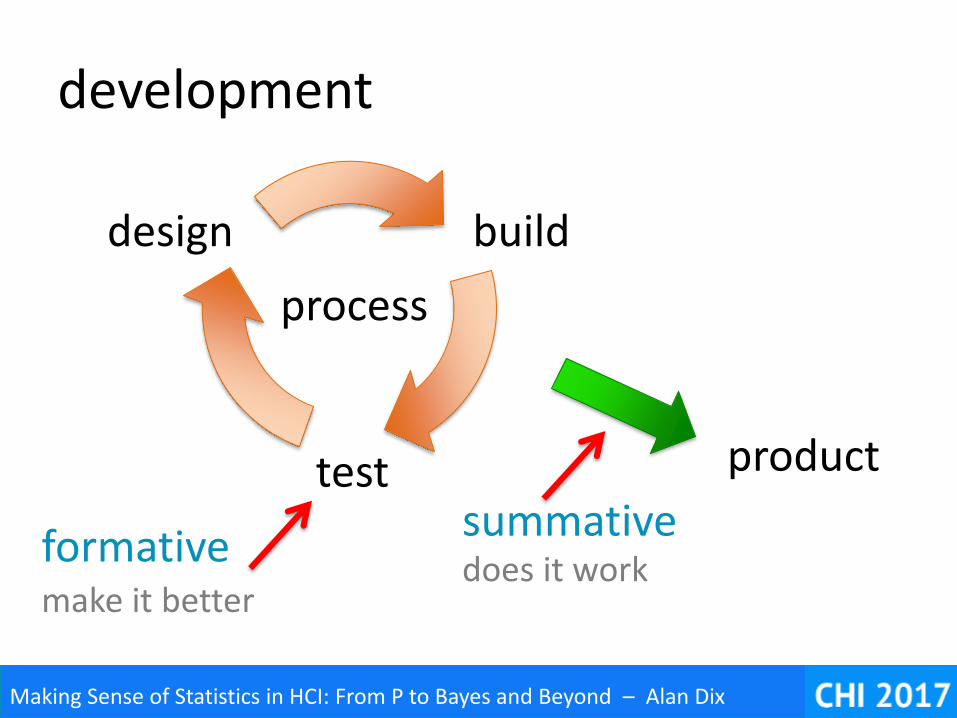
development
design build
test
process
product
summativeformativemake it better
does it work
Making Sense of Statistics in HCI: From P to Bayes and Beyond – Alan Dix
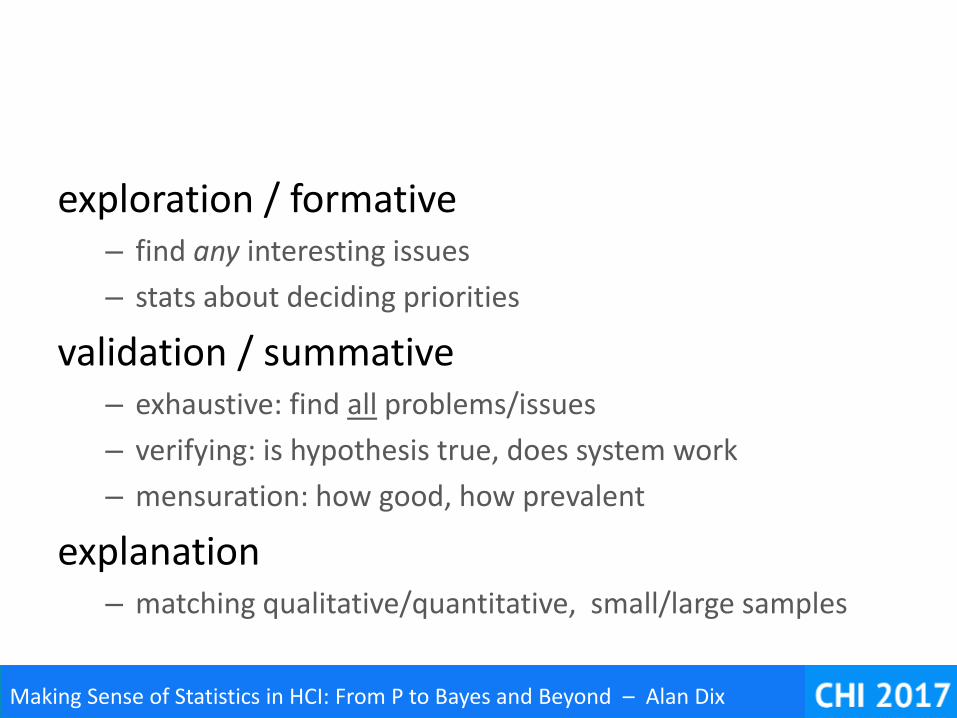
exploration / formative– find any interesting issues
– stats about deciding priorities
validation / summative– exhaustive: find all problems/issues
– verifying: is hypothesis true, does system work
– mensuration: how good, how prevalent
explanation– matching qualitative/quantitative, small/large samples
Making Sense of Statistics in HCI: From P to Bayes and Beyond – Alan Dix
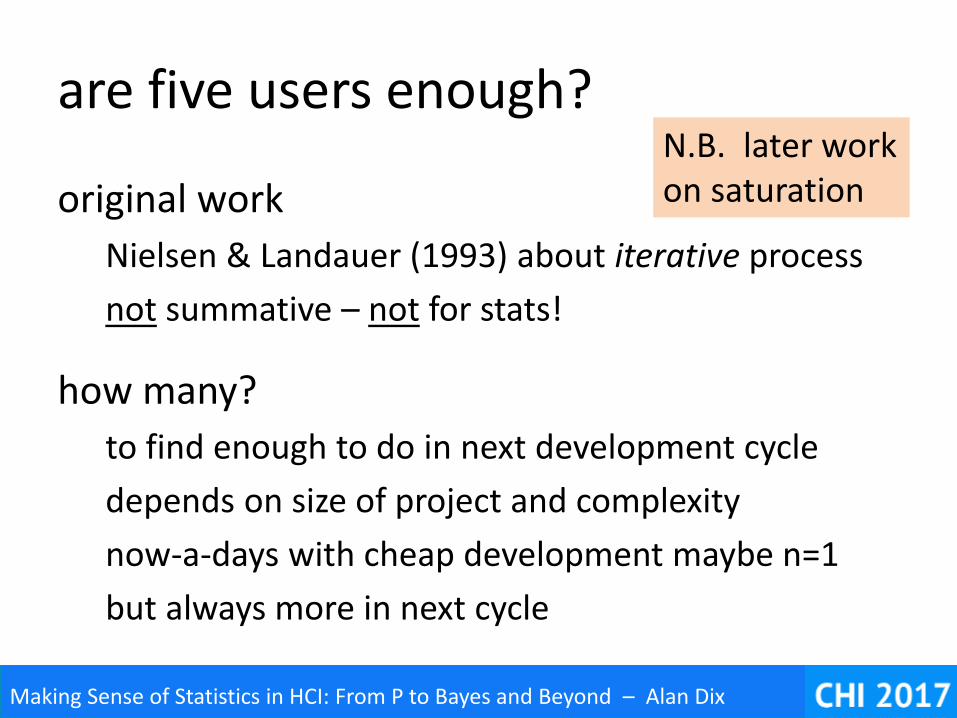
are five users enough?
original work
Nielsen & Landauer (1993) about iterative process
not summative – not for stats!
how many?
to find enough to do in next development cycle
depends on size of project and complexity
now-a-days with cheap development maybe n=1
but always more in next cycle
N.B. later work on saturation

Making Sense of Statistics in HCI: From P to Bayes and Beyond – Alan Dix
Making Sense of Statistics in HCI: From P to Bayes and Beyond – Alan Dix
look at the data
don’t just add up the numbers!
Making Sense of Statistics in HCI: From P to Bayes and Beyond – Alan Dix
look at the data
eyeball the raw data
are there anomalies, extreme values?
does it match your model?
but remember
randomness can be misleading
data is not truth!
Making Sense of Statistics in HCI: From P to Bayes and Beyond – Alan Dix
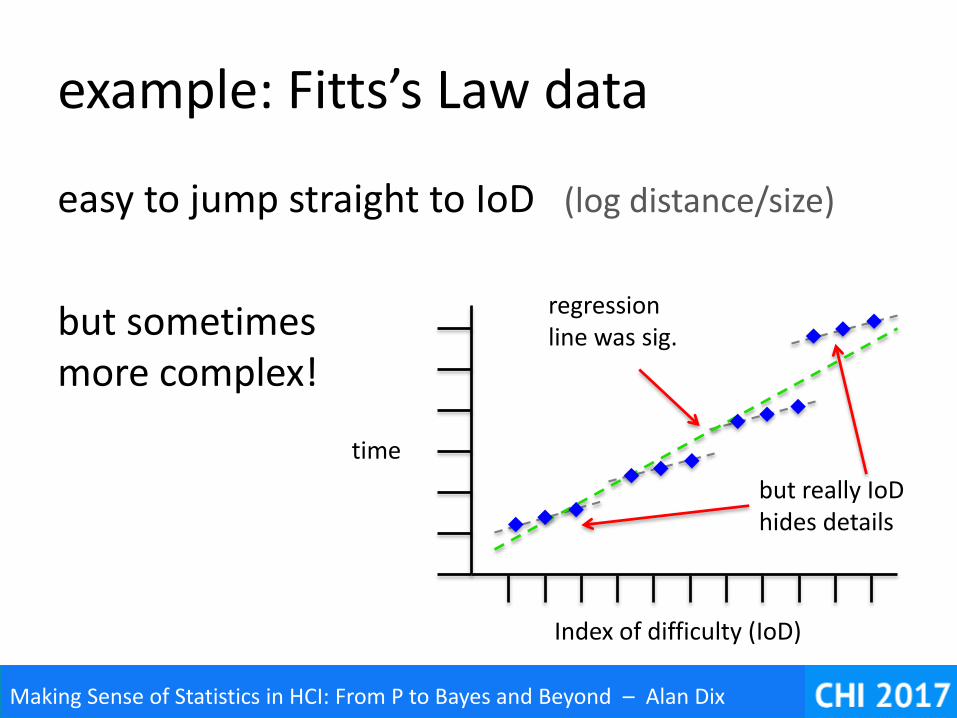
example: Fitts’s Law data
easy to jump straight to IoD (log distance/size)
but sometimesmore complex!
time
Index of difficulty (IoD)
regressionline was sig.
but really IoDhides details
Making Sense of Statistics in HCI: From P to Bayes and Beyond – Alan Dix
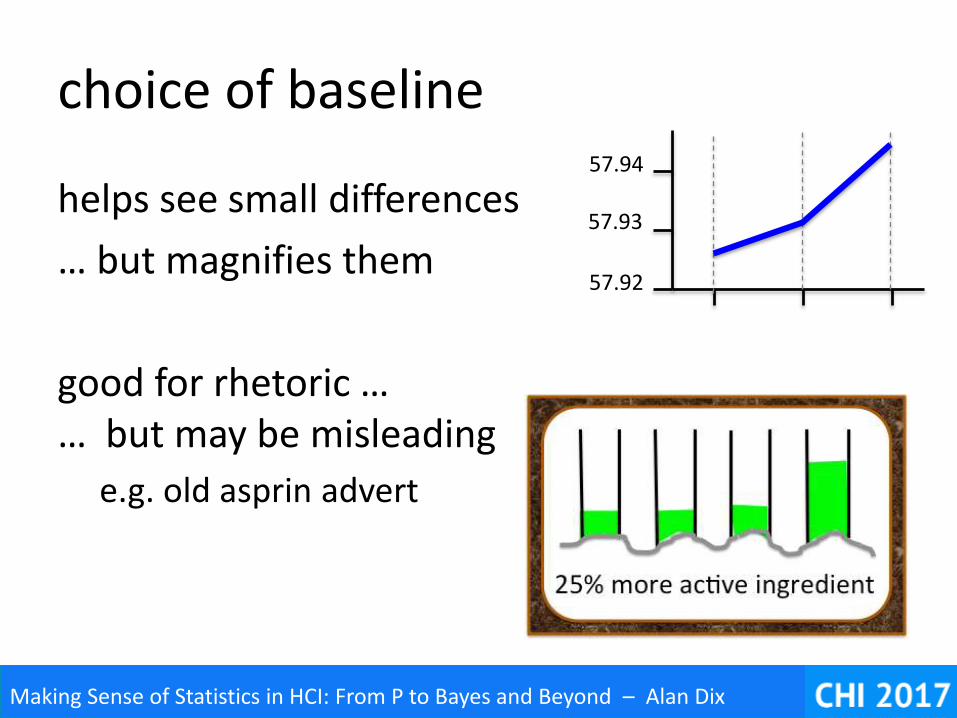
choice of baseline
helps see small differences
… but magnifies them
good for rhetoric …… but may be misleading
e.g. old asprin advert
57.92
57.93
57.94
Making Sense of Statistics in HCI: From P to Bayes and Beyond – Alan Dix
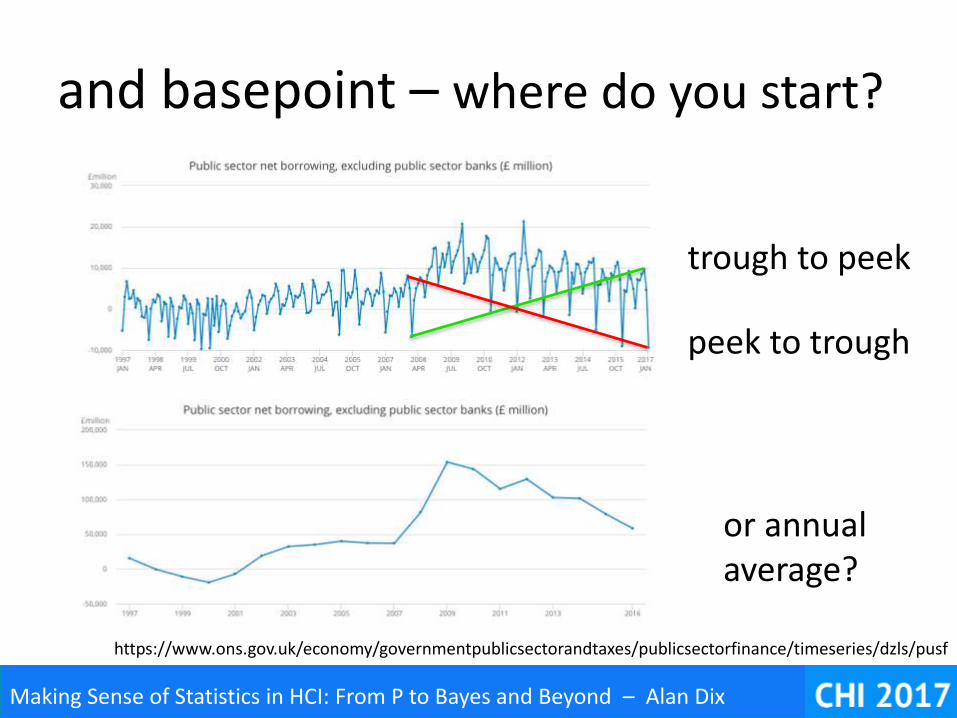
https://www.ons.gov.uk/economy/governmentpublicsectorandtaxes/publicsectorfinance/timeseries/dzls/pusf
trough to peek
and basepoint – where do you start?
peek to trough
or annualaverage?

Making Sense of Statistics in HCI: From P to Bayes and Beyond – Alan Dix
Making Sense of Statistics in HCI: From P to Bayes and Beyond – Alan Dix
what have you really shown?
stats are about the measure,but what does it measure
Making Sense of Statistics in HCI: From P to Bayes and Beyond – Alan Dix
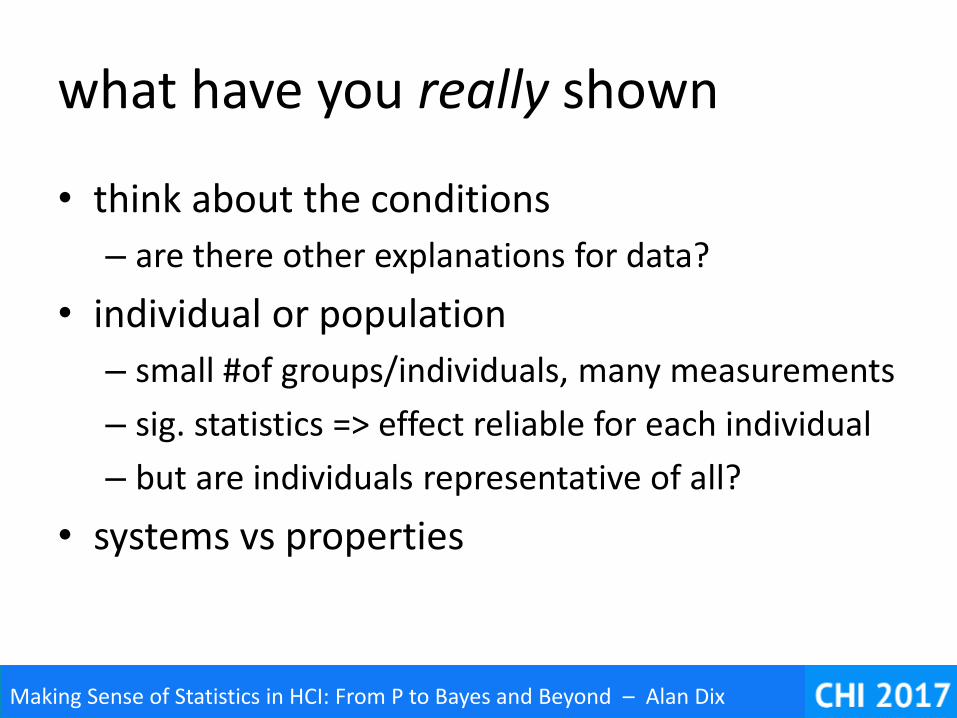
what have you really shown
• think about the conditions
– are there other explanations for data?
• individual or population
– small #of groups/individuals, many measurements
– sig. statistics => effect reliable for each individual
– but are individuals representative of all?
• systems vs properties
Making Sense of Statistics in HCI: From P to Bayes and Beyond – Alan Dix
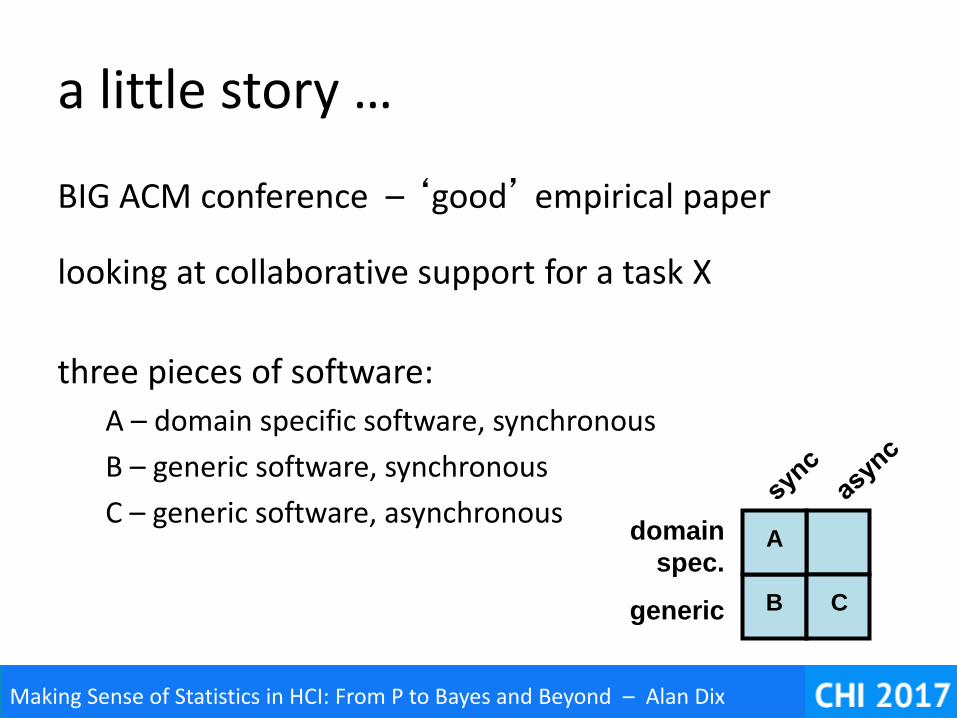
a little story …
BIG ACM conference – ‘good’ empirical paper
looking at collaborative support for a task X
three pieces of software:
A – domain specific software, synchronous
B – generic software, synchronous
C – generic software, asynchronousA
B C
domain
spec.
generic
Making Sense of Statistics in HCI: From P to Bayes and Beyond – Alan Dix
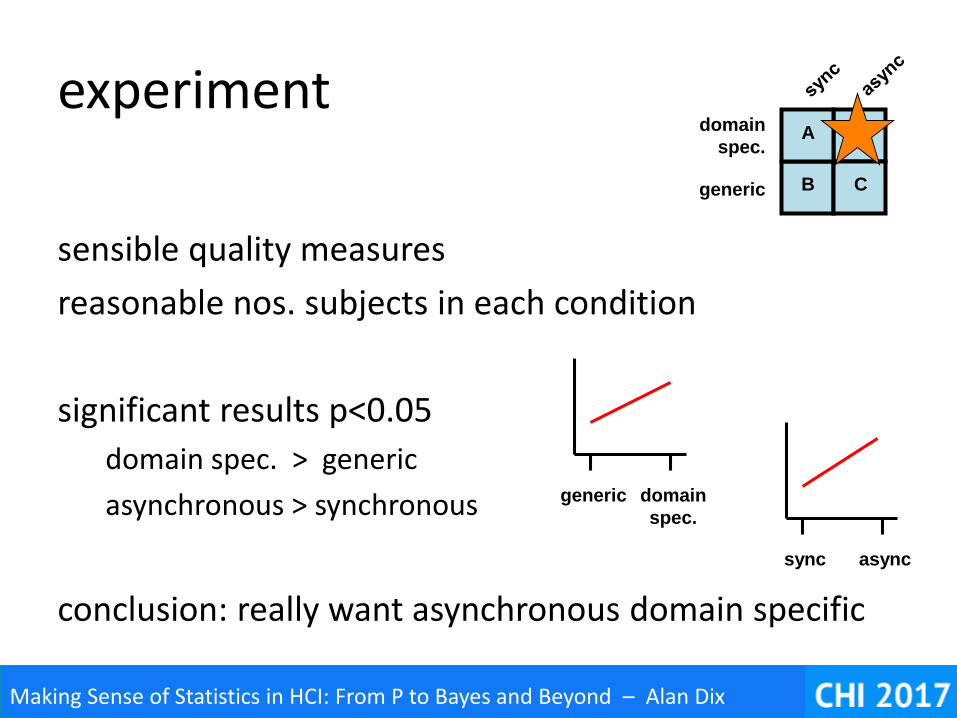
experiment
sensible quality measures
reasonable nos. subjects in each condition
significant results p<0.05
domain spec. > generic
asynchronous > synchronous
conclusion: really want asynchronous domain specific
A
B C
domain
spec.
generic
domain
spec.
generic
asyncsync
Making Sense of Statistics in HCI: From P to Bayes and Beyond – Alan Dix
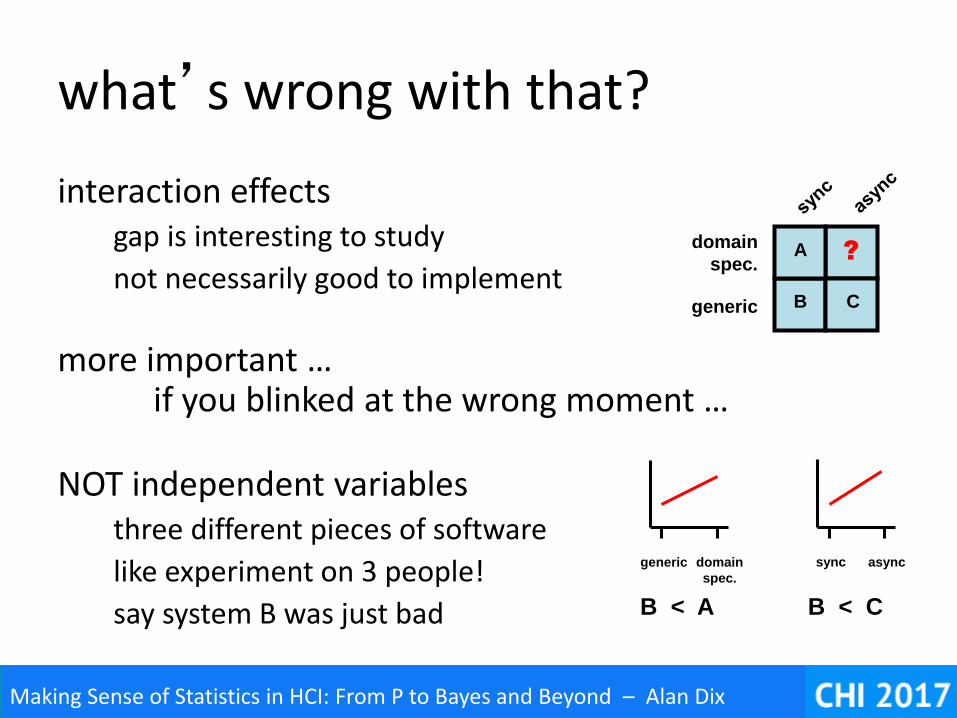
what’s wrong with that?
interaction effectsgap is interesting to study
not necessarily good to implement
more important … if you blinked at the wrong moment …
NOT independent variablesthree different pieces of software
like experiment on 3 people!
say system B was just bad
domain
spec.
generic asyncsync
A
B C
domain
spec.
generic
?
B < A B < C
Making Sense of Statistics in HCI: From P to Bayes and Beyond – Alan Dix
what went wrong?
borrowed psych method… but method embodies assumptions
single simple cause, controlled environment
interaction needs ecologically valid experimentmultiple causes, open situations
what to do? understand assumptions and modify

Making Sense of Statistics in HCI: From P to Bayes and Beyond – Alan Dix
Making Sense of Statistics in HCI: From P to Bayes and Beyond – Alan Dix
diversity – individual/task
good for not just good
Making Sense of Statistics in HCI: From P to Bayes and Beyond – Alan Dix
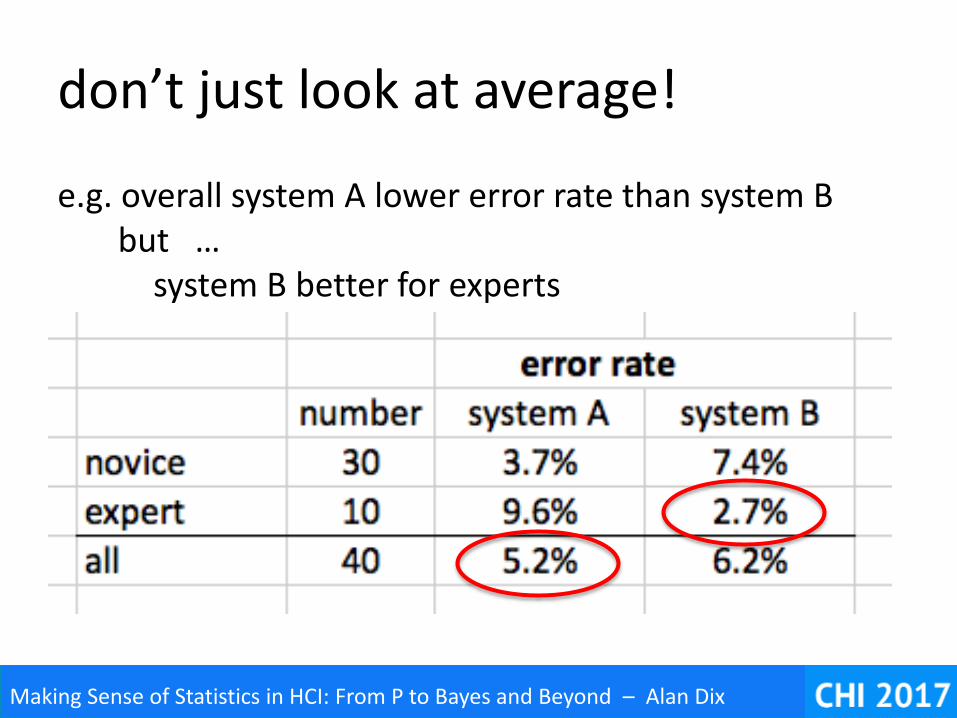
don’t just look at average!
e.g. overall system A lower error rate than system Bbut …
system B better for experts
Making Sense of Statistics in HCI: From P to Bayes and Beyond – Alan Dix
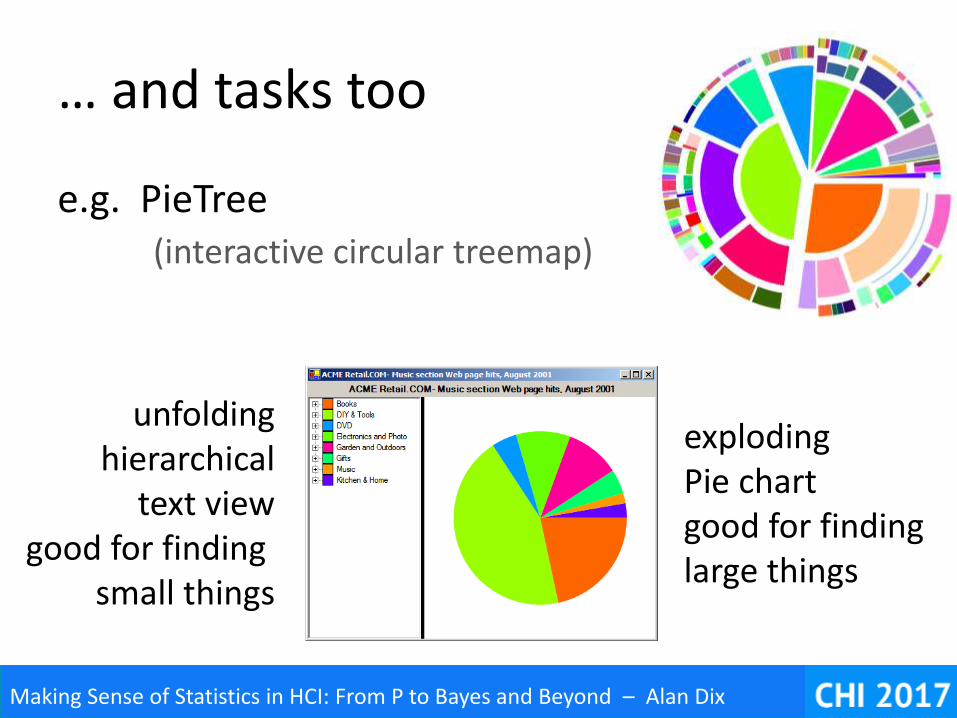
… and tasks too
e.g. PieTree(interactive circular treemap)
exploding Pie chart good for finding large things
unfoldinghierarchical
text viewgood for finding
small things
Making Sense of Statistics in HCI: From P to Bayes and Beyond – Alan Dix
more important to know
who or what something is good for

Making Sense of Statistics in HCI: From P to Bayes and Beyond – Alan Dix
Making Sense of Statistics in HCI: From P to Bayes and Beyond – Alan Dix
mechanism
from what happens to how and why
Making Sense of Statistics in HCI: From P to Bayes and Beyond – Alan Dix
mechanism
quantitative and statistical
what is true end to end
phenomena
qualitative and theoretical
why and how
mechanism
Making Sense of Statistics in HCI: From P to Bayes and Beyond – Alan Dix
generalisation
empirical data
at best interpolate
understanding mechanism allows:
extrapolation
application in new contexts
Making Sense of Statistics in HCI: From P to Bayes and Beyond – Alan Dix
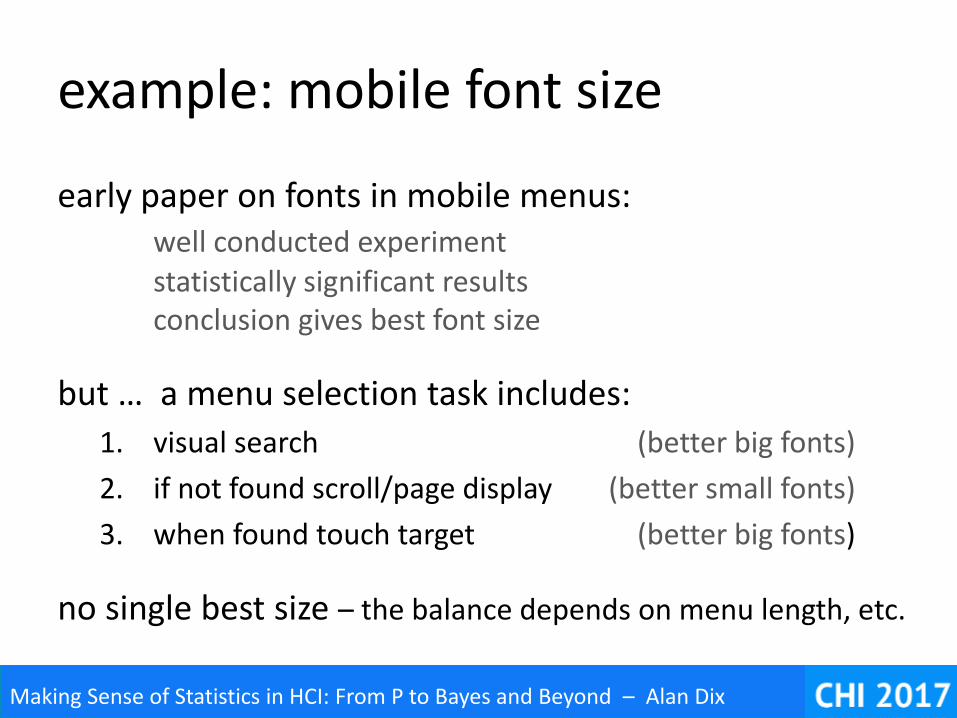
example: mobile font size
early paper on fonts in mobile menus:well conducted experimentstatistically significant resultsconclusion gives best font size
but … a menu selection task includes:
1. visual search (better big fonts)
2. if not found scroll/page display (better small fonts)
3. when found touch target (better big fonts)
no single best size – the balance depends on menu length, etc.

Making Sense of Statistics in HCI: From P to Bayes and Beyond – Alan Dix
Making Sense of Statistics in HCI: From P to Bayes and Beyond – Alan Dix
complex issues
probability can be hard!
Making Sense of Statistics in HCI: From P to Bayes and Beyond – Alan Dix
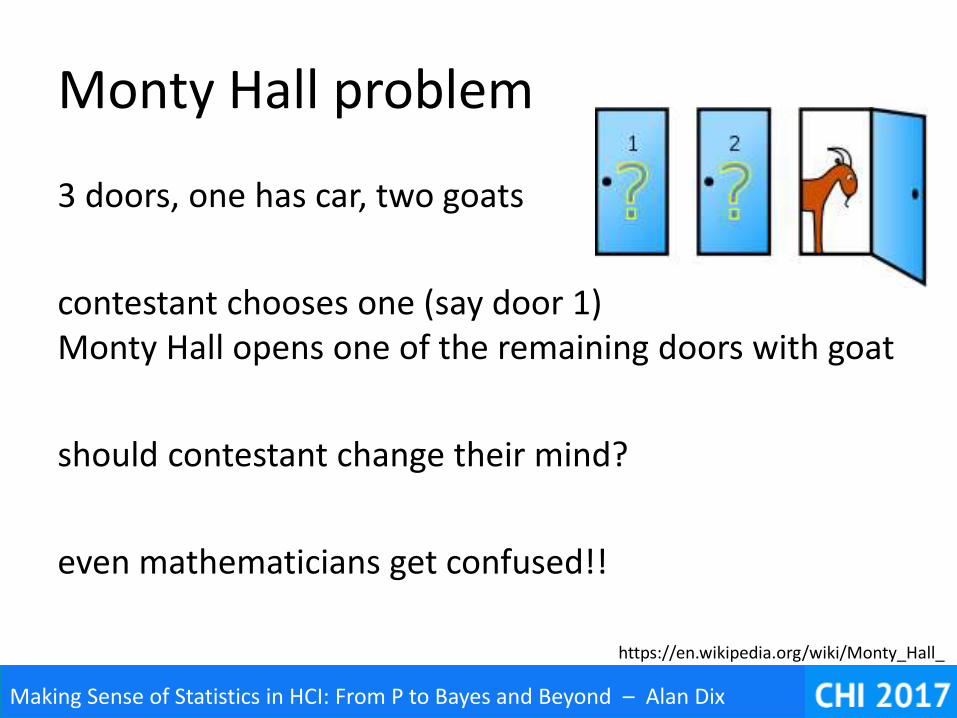
Monty Hall problem
3 doors, one has car, two goats
contestant chooses one (say door 1)Monty Hall opens one of the remaining doors with goat
should contestant change their mind?
even mathematicians get confused!!
https://en.wikipedia.org/wiki/Monty_Hall_
Making Sense of Statistics in HCI: From P to Bayes and Beyond – Alan Dix
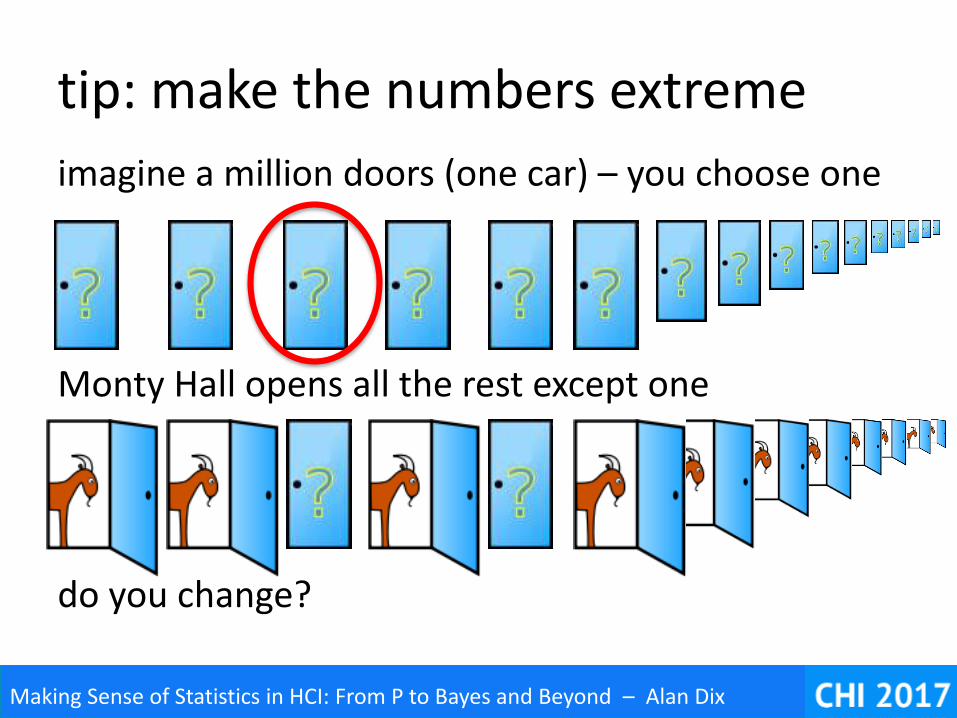
tip: make the numbers extreme
imagine a million doors (one car) – you choose one
Monty Hall opens all the rest except one
do you change?
Making Sense of Statistics in HCI: From P to Bayes and Beyond – Alan Dix
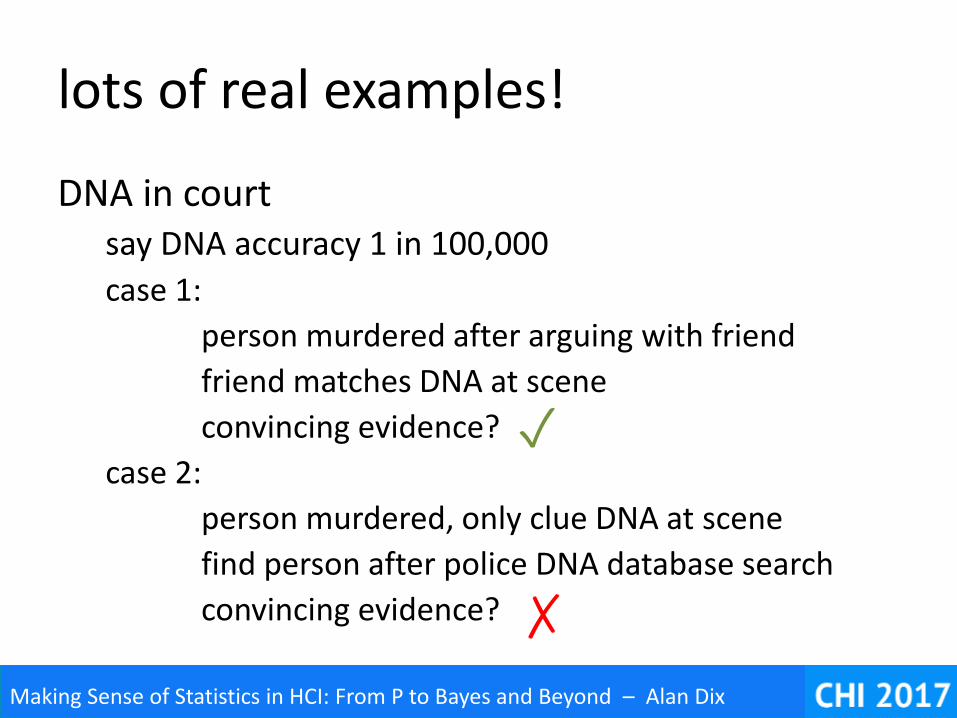
lots of real examples!
DNA in courtsay DNA accuracy 1 in 100,000
case 1:
person murdered after arguing with friend
friend matches DNA at scene
convincing evidence?
case 2:
person murdered, only clue DNA at scene
find person after police DNA database search
convincing evidence? ✗
✓
Making Sense of Statistics in HCI: From P to Bayes and Beyond – Alan Dix
Making Sense of Statistics in HCI: From P to Bayes and Beyond – Alan Dix
building for the future
adding to the discipline
Making Sense of Statistics in HCI: From P to Bayes and Beyond – Alan Dix
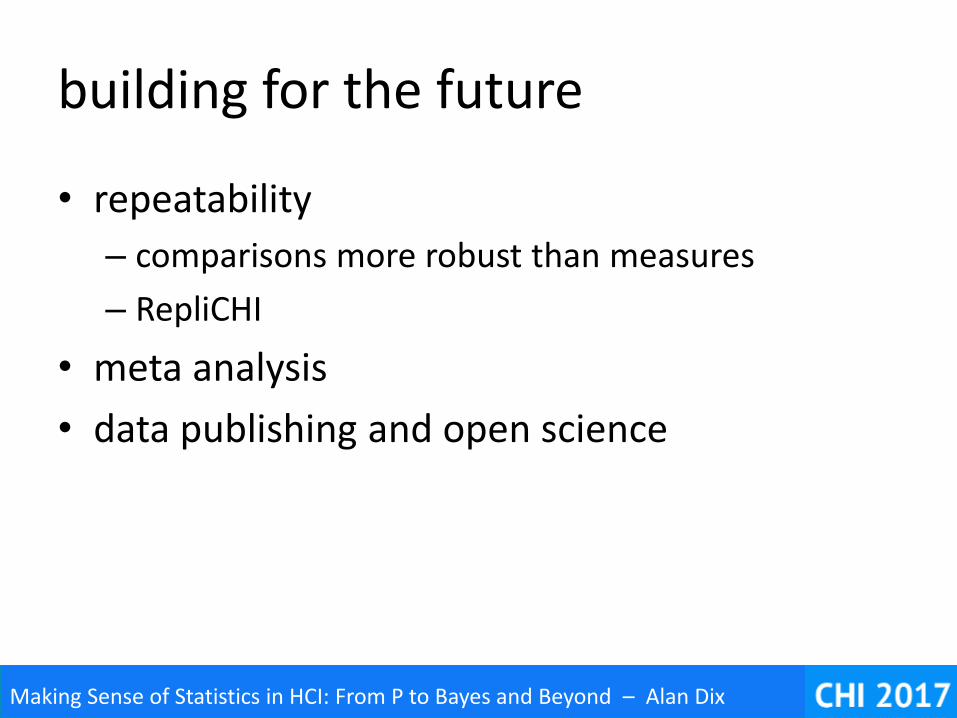
building for the future
• repeatability
– comparisons more robust than measures
– RepliCHI
• meta analysis
• data publishing and open science
Making Sense of Statistics in HCI: From P to Bayes and Beyond – Alan Dix