Embed Size (px)
Citation preview

Matlab Notes Part 1Austin Baird
UNC Department of MathematicsUNC Department of Biology
January 15, 2014
Introduction
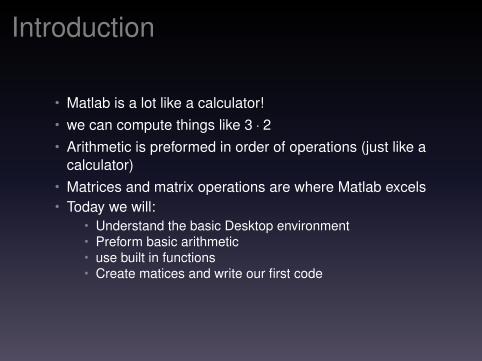
• Matlab is a lot like a calculator!• we can compute things like 3 · 2• Arithmetic is preformed in order of operations (just like a
calculator)• Matrices and matrix operations are where Matlab excels• Today we will:
• Understand the basic Desktop environment• Preform basic arithmetic• use built in functions• Create matices and write our first code
Desktop Basics
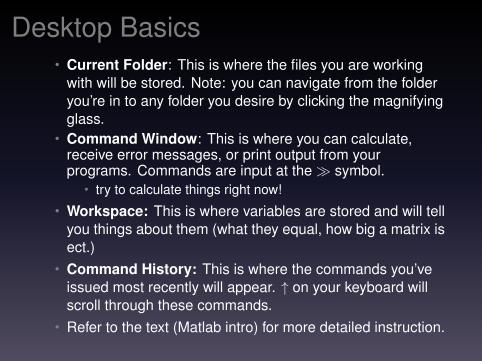
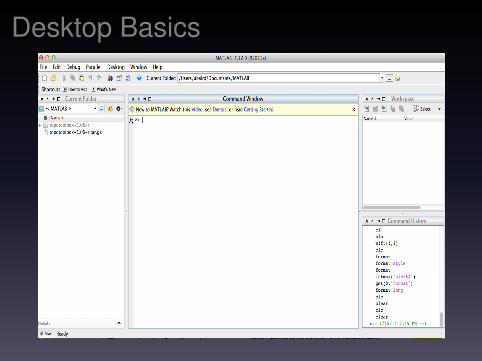
Desktop Basics• Current Folder: This is where the files you are working
with will be stored. Note: you can navigate from the folderyou’re in to any folder you desire by clicking the magnifyingglass.
• Command Window: This is where you can calculate,receive error messages, or print output from yourprograms. Commands are input at the� symbol.
• try to calculate things right now!
• Workspace: This is where variables are stored and will tellyou things about them (what they equal, how big a matrix isect.)
• Command History: This is where the commands you’veissued most recently will appear. ↑ on your keyboard willscroll through these commands.
• Refer to the text (Matlab intro) for more detailed instruction.
Troubleshooting
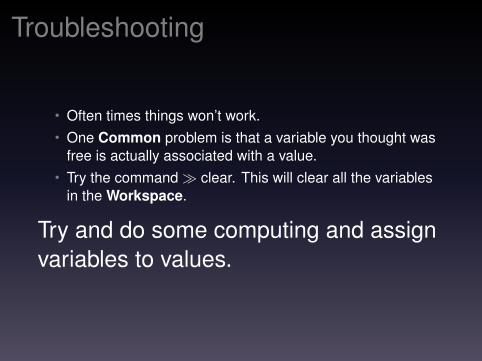
• Often times things won’t work.• One Common problem is that a variable you thought was
free is actually associated with a value.• Try the command� clear. This will clear all the variables
in the Workspace.
Try and do some computing and assignvariables to values.
Arrays
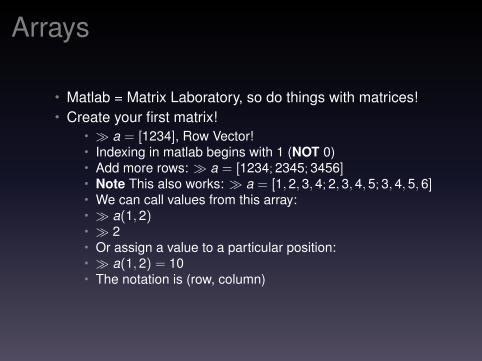
• Matlab = Matrix Laboratory, so do things with matrices!• Create your first matrix!
• � a = [1234], Row Vector!• Indexing in matlab begins with 1 (NOT 0)• Add more rows: � a = [1234;2345;3456]• Note This also works: � a = [1,2,3,4;2,3,4,5;3,4,5,6]• We can call values from this array:• � a(1,2)• � 2• Or assign a value to a particular position:• � a(1,2) = 10• The notation is (row, column)
Array Creating Functions
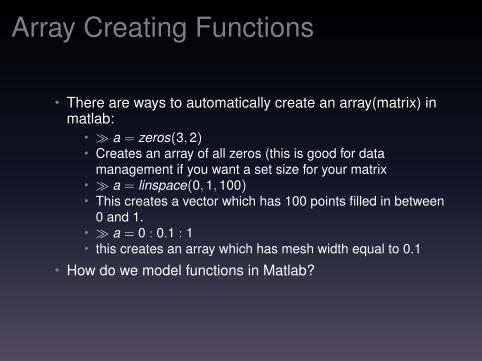
• There are ways to automatically create an array(matrix) inmatlab:
• � a = zeros(3,2)• Creates an array of all zeros (this is good for data
management if you want a set size for your matrix• � a = linspace(0,1,100)• This creates a vector which has 100 points filled in between
0 and 1.• � a = 0 : 0.1 : 1• this creates an array which has mesh width equal to 0.1
• How do we model functions in Matlab?
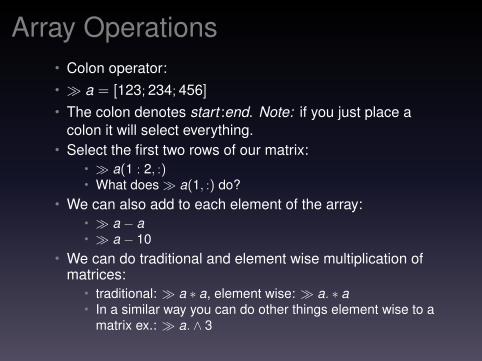
Array Operations• Colon operator:• � a = [123;234;456]• The colon denotes start :end. Note: if you just place a
colon it will select everything.• Select the first two rows of our matrix:
• � a(1 : 2, :)• What does� a(1, :) do?
• We can also add to each element of the array:• � a − a• � a − 10
• We can do traditional and element wise multiplication ofmatrices:
• traditional: � a ∗ a, element wise: � a. ∗ a• In a similar way you can do other things element wise to a
matrix ex.: � a. ∧ 3
Discrete Functions
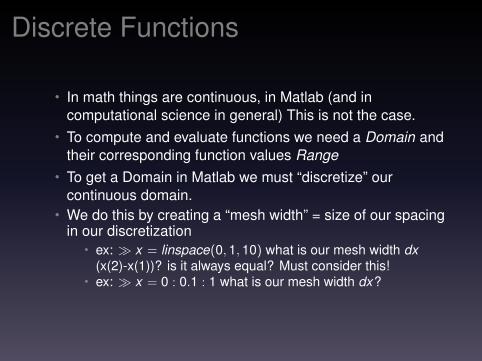
• In math things are continuous, in Matlab (and incomputational science in general) This is not the case.
• To compute and evaluate functions we need a Domain andtheir corresponding function values Range
• To get a Domain in Matlab we must “discretize” ourcontinuous domain.
• We do this by creating a “mesh width” = size of our spacingin our discretization
• ex: � x = linspace(0,1,10) what is our mesh width dx(x(2)-x(1))? is it always equal? Must consider this!
• ex: � x = 0 : 0.1 : 1 what is our mesh width dx?
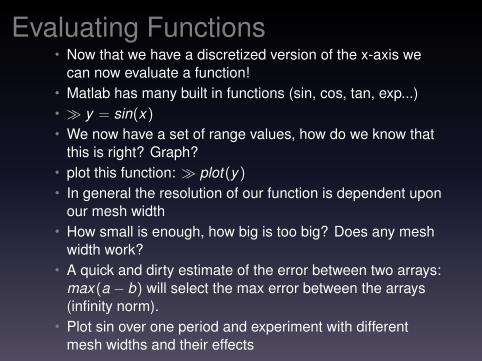
Evaluating Functions• Now that we have a discretized version of the x-axis we
can now evaluate a function!• Matlab has many built in functions (sin, cos, tan, exp...)• � y = sin(x )• We now have a set of range values, how do we know that
this is right? Graph?• plot this function: � plot (y )• In general the resolution of our function is dependent upon
our mesh width• How small is enough, how big is too big? Does any mesh
width work?• A quick and dirty estimate of the error between two arrays:
max (a − b) will select the max error between the arrays(infinity norm).
• Plot sin over one period and experiment with differentmesh widths and their effects
Our First Program
• Matlab files are denoted by a .m at the end of the name.• Documentation is very very important! % is how you
comment lines (these will not be read by the computer)• Notice that to run the code Matlab asks you whether to add
folder to path or to change to directory, both work.• Just type the name of the code in the command line to get
the program to run.
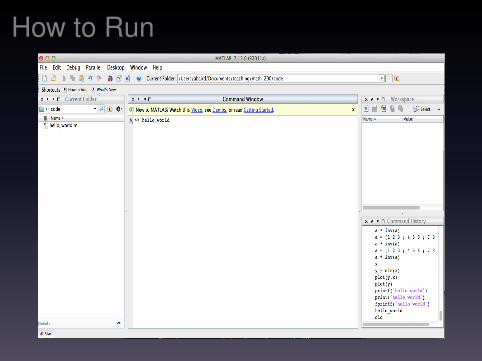
How to Run
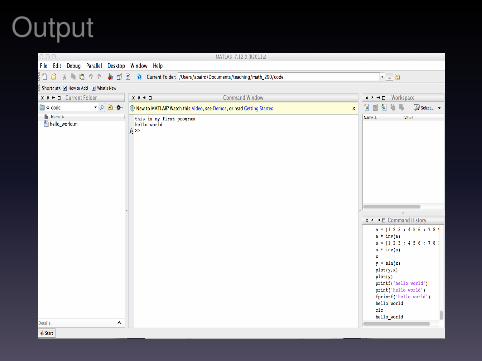
Output
Homework
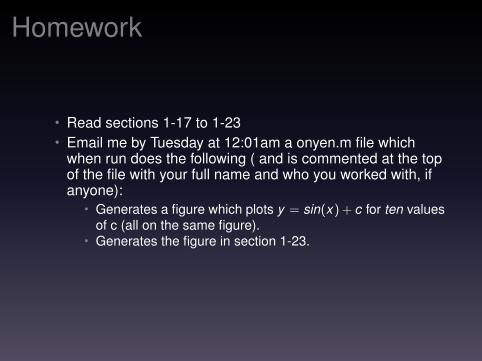
• Read sections 1-17 to 1-23• Email me by Tuesday at 12:01am a onyen.m file which
when run does the following ( and is commented at the topof the file with your full name and who you worked with, ifanyone):
• Generates a figure which plots y = sin(x ) + c for ten valuesof c (all on the same figure).
• Generates the figure in section 1-23.