Embed Size (px)
Citation preview

5th June, New York
Business Briefing

Global Capacity
0
500
1,000
1,500
2,000
2,500
3,000
Summer2010
Summer2011
Summer2012
Summer2013
Summer2014
Summer2015
Mil
lio
ns
Approximately there are 2.8 billion seats in Summer 2015 compared
to 2.3 billion at the start of the decade; an increase of 500 million or
1.3 million seats a day.
The average capacity per scheduled flight is now at around 139
compared to 125 at the beginning of the decade.
OAG Schedules Analyser

Global Capacity
0
500
1,000
1,500
2,000
2,500
3,000
Summer 2010 Summer 2015
Mill
ion
s
Scheduled Capacity Comparison
Australasia
Middle East
Latin America
Asia
Africa
North America
Europe
In all regions capacity has increased and this is reflective of the use
of both larger aircraft types and reduced regional jet flying in some
markets, including a 13% decline in North America.
OAG Schedules Analyser
27.5% 26.8%
26.8% 23.0%
27.2% 32.0%

Global Frequency
1718181818181919191919202020
Summer2010
Summer2011
Summer2012
Summer2013
Summer2014
Summer2015
Mil
lio
ns
Scheduled Flights
19.7 million scheduled services planned for Summer 2015, representing
growth of 3% for the peak period year on year. The global picture does
however disguise some significant regional variations.
Over 1.5 million extra flights scheduled for 2015 versus 2010,
approximately 4,100 a day more.

Global Frequency
0
5
10
15
20
25
Summer 2010 Summer 2015
Mill
ion
s Scheduled Flights Comparison
Australasia
Middle East
Latin America
Asia
Africa
North America
Europe
The number of scheduled flights operated in North America has declined
by 7% over the last six years as airline consolidation has impacted
networks and regional operations have been scaled back. The
United/Continental consolidation in particular resulted in an 18%
reduction in frequency over the last five years.
34.6% 29.7%
20.8% 26.6%
25.8% 24.8%

Legacy Versus Low-cost Capacity, Intra
Region
0%10%20%30%40%50%60%70%80%90%
100%
Scheduled Frequency Comparison
Low Cost
Legacy
Low-cost carriers will account for around 27% of global capacity this
summer with Europe at 36% (39% intra Europe) leading the way and
China still at a regional level the least well served by such carriers.
With 6% and 9%, respectively, of capacity provided by LCC’s, China and
Africa appear to be the two last opportunities or challenges.
OAG Schedules Analyser

Alliances Share…
0%10%20%30%40%50%60%70%80%90%
100%
Scheduled Capacity Comparison
Star
Skyteam
OneWorld
Non Aligned
Non-aligned carriers still provide the majority of frequency in the global
market, circa 54%.
Star are the largest alliance and are particularly strong in Africa whilst
Skyteam are the strongest in Asia although that is driven by their
Chinese partnerships (China Eastern and Southern).
OAG Schedules Analyser

And in terms of key carriers…
Source:- OAG Schedules Analyser
The ‘Big Three’ North American carriers dominate the GLOBAL
landscape producing 13% of all available capacity.
EY
QR
EK CA
MU CZ
UA
DL
AA
0
50
100
150
200
250
300
Seats
(m
)
Ranked Order
Seats by Airline in 2014

Load factors at least globally suggest
spare capacity….
30
40
50
60
70
80
90
2000 2001 2002 2003 2004 2005 2006 2007 2008 2009 2010 2011 2012 2013 2014
Avera
ge
Glo
ba
l %
Average Load Factor By Segment
Passenger Cargo
Whilst we may think load factors are now very high (and they are in some
markets!) on average one in five seats remains empty. In the cargo
market less than half of capacity is used highlighting the real directional
challenges of cargo demand (east to west, perishables etc)
*Source: IATA 2014 Annual Report
IATA

But US airlines have been enjoying record levels…..
70
75
80
85
90
Av
era
ge P
ax L
oad
Facto
r %
Average Passenger Load Factors US Major Carriers Systemwide
American Delta Air Lines United Airlines Southwest JetBlue Alaska Spirit
US airlines have been reporting strong load factors over the last year,
with above industry averages reported by most carriers. The low-cost
carriers appear to have improved load factors in the last few months
whilst the three legacy carriers have seen slippages in their numbers.
*Source: OAG DOT Analyser
65
70
75
80
85
90
95
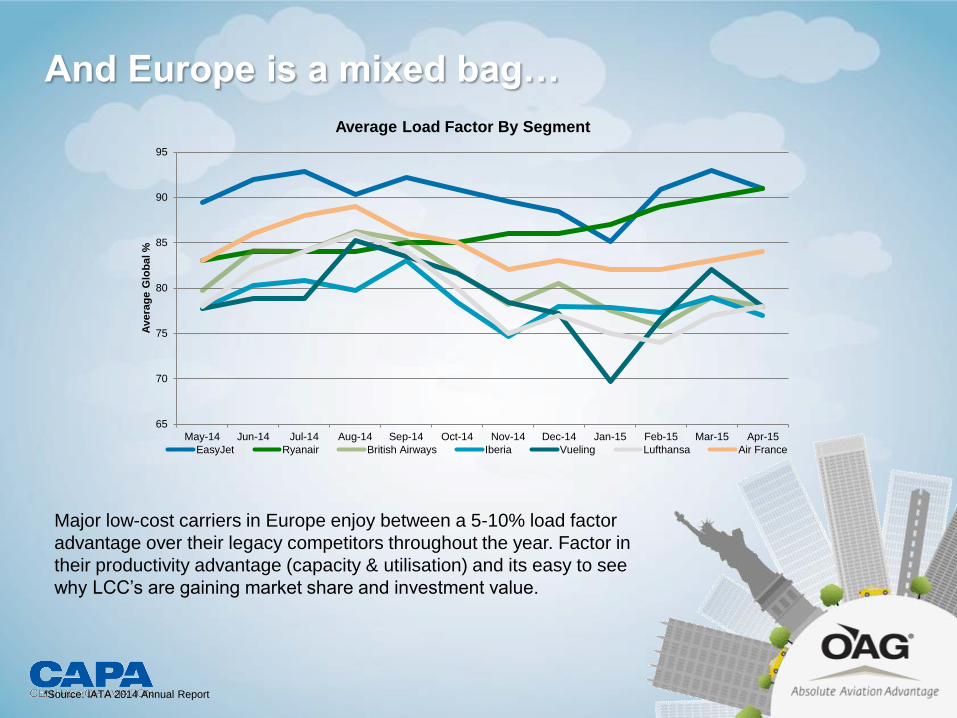
May-14 Jun-14 Jul-14 Aug-14 Sep-14 Oct-14 Nov-14 Dec-14 Jan-15 Feb-15 Mar-15 Apr-15
Avera
ge
Glo
ba
l %
Average Load Factor By Segment
EasyJet Ryanair British Airways Iberia Vueling Lufthansa Air France
Major low-cost carriers in Europe enjoy between a 5-10% load factor
advantage over their legacy competitors throughout the year. Factor in
their productivity advantage (capacity & utilisation) and its easy to see
why LCC’s are gaining market share and investment value.
*Source: IATA 2014 Annual Report
And Europe is a mixed bag…

30
40
50
60
70
80
90
2010 2011 2012 2013 2014 2015 (YTD)
Avera
ge
Glo
ba
l %
Average Load Factor By Segment
AEA Average Load Factor
AEA’s load factors over the last five years have hovered around the 80%
mark on a per annum basis. It may just be that securing load factors
above that point on a yearly basis is just too challenging for some airlines.
Association European Airlines
With Europe reflecting that average level

Capacity in Summary

The North
American
Market

North American Domiciled Carrier Capacity
Share….
0%
20%
40%
60%
80%
100%
2011 2012 2013 2014 2015
Scheduled Capacity Summer Season World
Global Capacity NAM Domiciled Carrier Capacity
21.7%
75.3% 78.3%
Over one in five seats operated by scheduled airlines this summer will be
provided by North American domiciled carriers.
Source:- OAG Schedules Analyser
24.7%

North American Domiciled Carrier Frequency
Share….
0%
20%
40%
60%
80%
100%
2011 2012 2013 2014 2015
Scheduled Frequency Summer Season World
Global Capacity NAM Domiciled Carrier Capacity
29.0%
69.1% 71.0%
Scheduled capacity has continued to grow steadily and faster than
flights, reflecting the use of larger aircraft and continued growth in
emergent markets.
AAGR over the last 5 years has been just above 5% with the strongest
growth occurring in the last two year.
Source:- OAG Schedules Analyser
30.9%

But The Rest of The World is Growing Faster!
The United States is the largest market in the World and despite the
emergence of China, will probably remain so for at least another 7-10 years.
Canada is the 15th largest market (No change) and Mexico are 19th (Down
Two) but in absolute terms, has grown by 26% in that time!
OAG Schedules Analyser
Country Summer
2011
Summer
2015
Movement in
Position
USA 568,713,826 577,342,813 No Change
China 238,817,979 332,634,172 No Change
Japan 94,006,876 109,815,423 No Change
United Kingdom 92,367,240 96,916,630 No Change
Germany 85,875,118 88,065,676 Up One
Brazil 83,372,305 83,762,237 Down One
Spain 82,102,835 80,033,795 No Change
India 67,740,006 79,192,686 No Change
Indonesia 63,465,882 75,802,592 Up Three
France 57,387,294 64,039,068 No Change

Forecast Capacity Growth
0
200
400
600
800
1,000
1,200
Mil
lio
ns
Forecast Capacity Growth
United States & China, Summer Seasons
US Capacity China Capacity
Based on current growth rates we can expect China to become the
largest market in the world based on capacity by 2022, although on
which day remains unclear!

And yet frequency growth remains controlled….
0
2
4
6
8
10
12
14
16
American Delta AirLines
United Southwest AlaskaAirlines
JetBlue Spirit Allegiant
Su
mm
er
Fre
qu
en
cy
(‘
000,0
00’s
)
Frequency Growth From US Majors
Summer '13 Summer '15
12.7% 43.7% 43.0%
In absolute terms there has been no frequency growth in the US market
over the last two Summer seasons. Amongst the ‘Big Four’, no carrier has
added frequency in the last three years.
There is relatively large frequency growth from Spirit, Alaska and Allegiant
but it hardly moves the market needle.
*Source: OAG Schedules Analyser
0.0%
(3.2)% (12.1%)
(3.1%)
12.5%

And capacity hasn’t grown much either….
0
20
40
60
80
100
120
140
160
American Delta AirLines
United Southwest AlaskaAirlines
JetBlue Spirit Allegiant
Su
mm
er
Cap
acit
y S
eats
M
illio
ns
Capacity Growth From US Majors
Summer '13 Summer '15
14.5% 48.8% 42.2%
US domestic capacity has grown by some 4% since Summer’13.
3.4%
4.7%
(2.1%) 1.0%
15.8%
OAG Schedules Analyser

But yields have recently softened…..
6
8
10
12
14
16
18
20
AmericanAirlines Inc.
Delta AirLines Inc.
JetBlueAirways
SouthwestAirlines Co.
Spirit AirLines
United AirLines Inc.
US AirwaysInc.
US Majors Domestic Yields Per Available Seat Kilometre
20134 20144
In the third quarter of 2014, average US domestic yields were between 9-
15% higher than 2013. Latest data for 4th Quarter suggest that yields are
now only slightly above those reported in 2013 and in one case actually
lower.
*Source: OAG DOT Analyser

Load Factor Summary

The Big Three
Discussion
(or is it Four?)

The Big Three/Four Discussion
Direct services between the Middle East and North America have increased considerably
over the last 5 years….
In June 2011 there were 21 non-stop city pair connections with 6 operated by US
domiciled airlines, 11 by Middle East Carriers and 4 by Turkish Airlines.

The Big Three/Four Discussion
Today, some 49 city pairs are being operated….
US domiciled airlines operate 6 of those city pairs, 32 are operated by Middle East
Carriers and 11 by Turkish Airlines.

But other markets have seen similar change
During June 2011, there were 14 non-stop city pair connections from North America to China – today
there are 43 non-stop city pairs. US domiciled carriers operate 18 of those city pairs, Chinese
carriers operate 25; five years ago they operated 7.

Supply has increased, has demand?
OAG Traffic Analyser
- 100 200 300 400 500 600 700 800 900
1,000P
ax
Pe
r A
nn
um
(‘0
00
’s)
Middle East – North America Traffic
2011 2014
In four years the market has grown by 34% with some noticeable
increases in major markets such as Saudi Arabia (+131%) and Iran
(+46%).
Israel is still the largest market in the region with a 32% share of
traffic compared to 40% in 2011.

Supply has increased, has demand?
OAG Traffic Analyser
0
50
100
150
200
250
300
350
Pa
x P
er
An
nu
m (
‘00
0’s
) Middle East – North America Traffic
By Airline
2011 2014
United Airlines have the third largest market share and in the last four
years have seen their traffic increase by 91%; in comparison Emirates
traffic has only increased by some 46%. Only two carriers have seen a
reduction in traffic carried; Delta Air Lines (-29%) and Air France (-4%)
but both have also cut capacity over that time series.
Indian sub-continent demand has doubled..
OAG Traffic Analyser
-
100
200
300
400
500
600
700
800
900
India Pakistan Bangladesh Nepal Others
Pa
x P
er
An
nu
m (
‘00
0’s
)
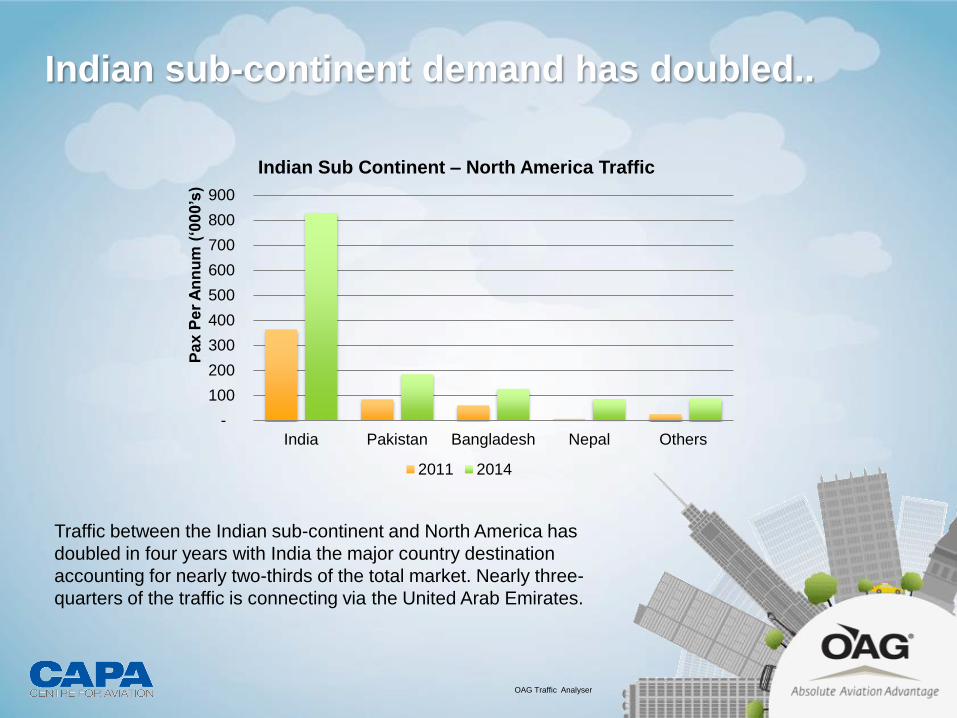
Indian Sub Continent – North America Traffic
2011 2014
Traffic between the Indian sub-continent and North America has
doubled in four years with India the major country destination
accounting for nearly two-thirds of the total market. Nearly three-
quarters of the traffic is connecting via the United Arab Emirates.

Supply has increased, has demand?
OAG Traffic Analyser
-
100
200
300
400
500
600
Pa
x P
er
An
nu
m (
‘00
0’s
) Indian Sub-Continent – North America Traffic
By Airline
2011 2014
Not surprisingly the Big Three Middle East carriers secure around 90%
of the traffic flow.

And those new services provide feed to US
carriers….
Over 730,000 passengers were ‘fed’ to US domiciled carriers from Emirates,
Etihad and Qatar Airways in 2014. Assume an average ‘feeder’ value of $150
per passenger and that equates to nearly $110 million of feed for little effort.
Passenger Feed …. EK EY QR Grand
Total
US/American 43,853 105,258 304,743 453,854
United Airlines 22,503 7,684 13,954 44,141
Delta Air Lines 27,629 4,410 1,799 33,838
JetBlue 80,616 31,864 23,222 135,702
Others 58,527 2,259 2,422 63,208
233,128 151,475 346,140 730,743
32% 21% 47%
US/American 62%
United Airlines 6%
Delta Air Lines 5%
JetBlue 18%
Others 9%
Carriers benefitting from connecting traffic from Gulf carriers (2014)
OAG Traffic Analyser

Whilst US Airlines ‘fed’ via major European
gateways to the Middle East Carriers….
Some 9,500 passengers were ‘fed’ to the Gulf domiciled carriers from the Big
Three US carriers in 2014 via LON, PAR or FRA. Assume an average ‘feeder’
value of $350 per passenger and that equates to under $3.3 million of ‘
reciprocal’ feed.
Passenger Feed …. AA/US DL UA Grand Total
Emirates 871 194 266 1,291
Etihad 3,598 674 799 5,071
Qatar 2,983 45 63 3,091
Total 7,452 913 1,088 9,453
OAG Traffic Analyser

Big Three Summary

Aircraft &
Market
Evolution

B787 Scheduled Network
Summer 2012 Summer 2012
Number of Scheduled
Flights
8,521
Scheduled Capacity 2,099,720

B787 Scheduled Network
Summer 2015 Summer 2015
Number of Scheduled
Flights
115,081
Scheduled Capacity 30,225,563

A380 Scheduled Network
Summer 2012
Summer 2012
Number of Scheduled
Flights
9,877
Scheduled Capacity 4,773,876

A380 Scheduled Network
Summer 2015
Summer 2015
Number of Scheduled
Flights
52,447
Scheduled Capacity 25,487,701

Thank you!