Embed Size (px)
Citation preview

Airline Industry Economics Advisory Workshop 2016 1
Outlook for growth,
traffic and airline profits
Brian Pearce,
Chief Economist,
IATA
www.iata.org/economics
Widespread revival of business confidence
Source: IATA Economics using data from Markit
35
40
45
50
55
60
2008 2009 2010 2011 2012 2013 2014 2015 2016 2017
50
= n
o c
han
ge in
ou
tpu
t ex
pec
ted
Business confidence in developed and emerging economies
Developedeconomies
Emerging economies

Consumers have become more confident too
Source: IATA Economics using data from Datastream
96
97
98
99
100
101
102
2008 2009 2010 2011 2012 2013 2014 2015 2016 2017
Worldwide average consumer confidence

Donald Trump Vows to Rip Up
Trade Deals and Confront ChinaThe New York Times
28 June 2016
Perhaps surprisingly given political shocks
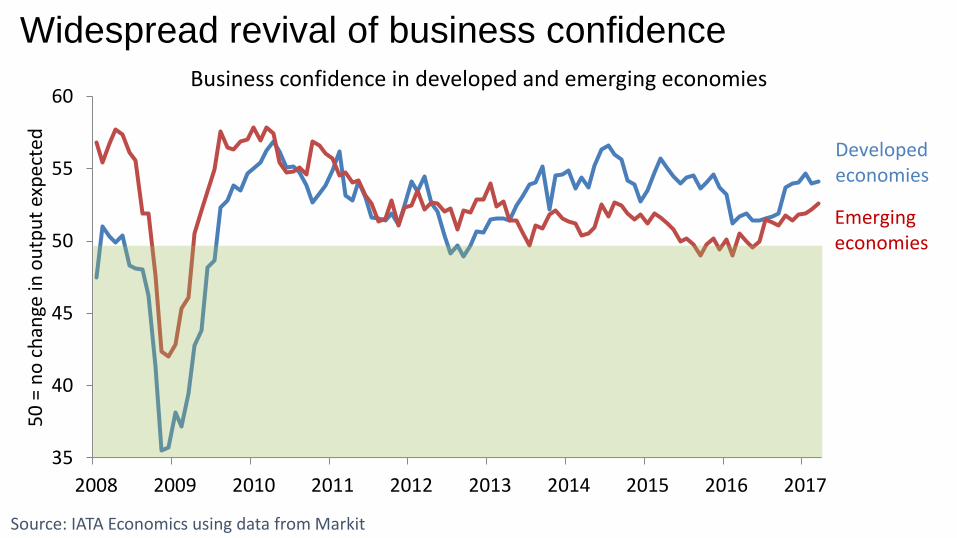
Will the IMF economic growth forecast be right at last?
Source: IMF World Economic Outlook databases
-3
-2
-1
0
1
2
3
4
5
2004 2005 2006 2007 2008 2009 2010 2011 2012 2013 2014 2015 2016 2017 2018
IMF forecasts of global economic growth (using market exchange rates), % y-o-y
April 2013April 2014
April 2015April 2016
January 2017
Latest data point
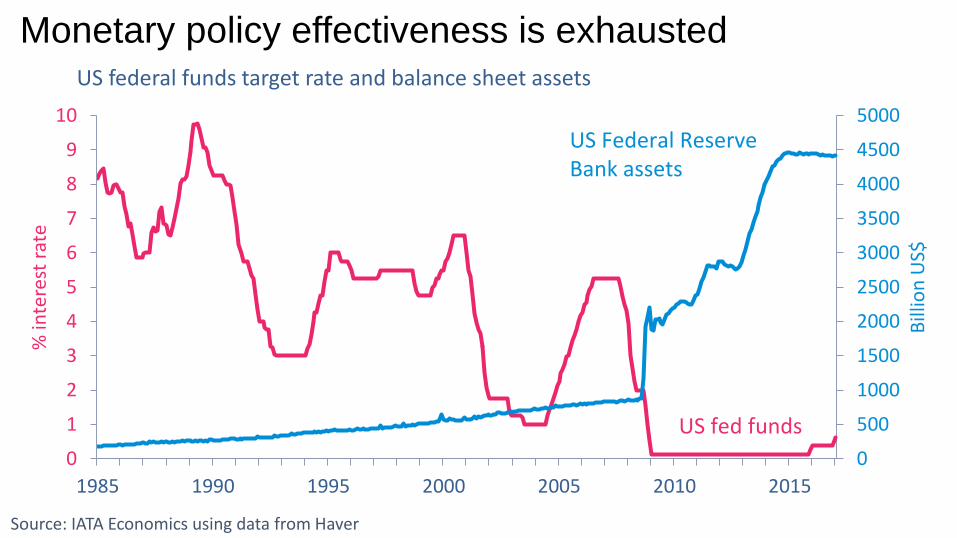
Monetary policy effectiveness is exhausted
Source: IATA Economics using data from Haver
0
500
1000
1500
2000
2500
3000
3500
4000
4500
5000
0
1
2
3
4
5
6
7
8
9
10
1985 1990 1995 2000 2005 2010 2015
Bill
ion
US$
% in
tere
st r
ate
US federal funds target rate and balance sheet assets
US fed funds
US Federal Reserve Bank assets
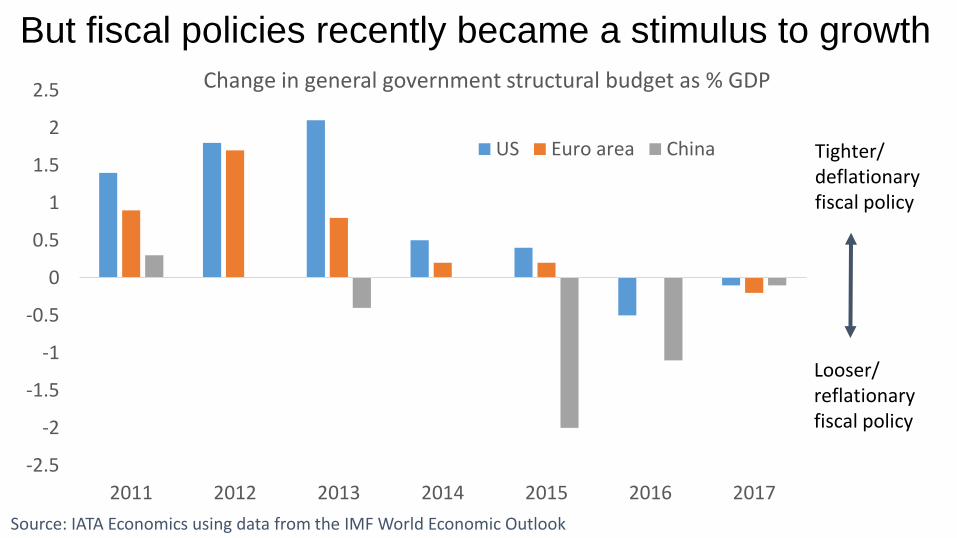
But fiscal policies recently became a stimulus to growth
Source: IATA Economics using data from the IMF World Economic Outlook
-2.5
-2
-1.5
-1
-0.5
0
0.5
1
1.5
2
2.5
2011 2012 2013 2014 2015 2016 2017
Change in general government structural budget as % GDP
US Euro area China Tighter/ deflationary fiscal policy
Looser/ reflationary fiscal policy
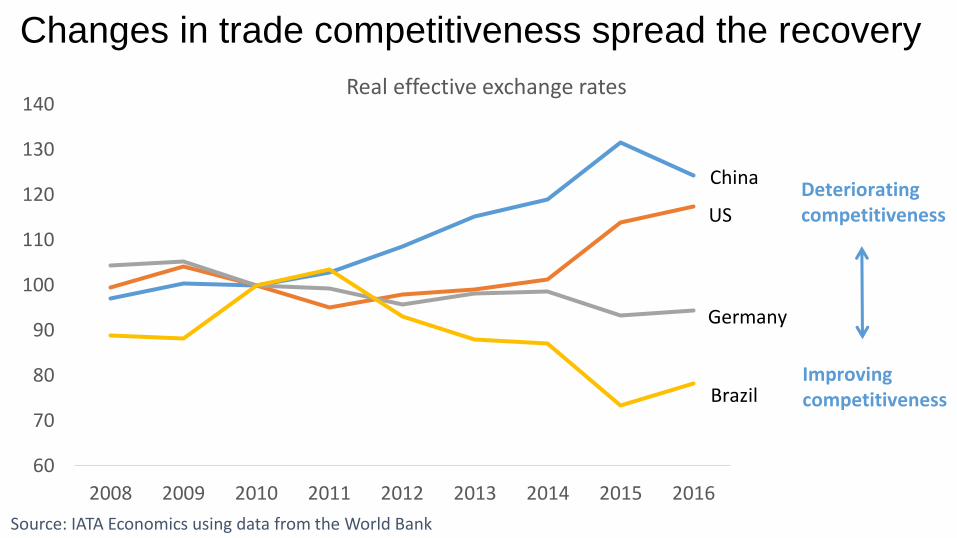
Changes in trade competitiveness spread the recovery
Source: IATA Economics using data from the World Bank
60
70
80
90
100
110
120
130
140
2008 2009 2010 2011 2012 2013 2014 2015 2016
Real effective exchange rates
China
US
Germany
Brazil
Deteriorating competitiveness
Improving competitiveness
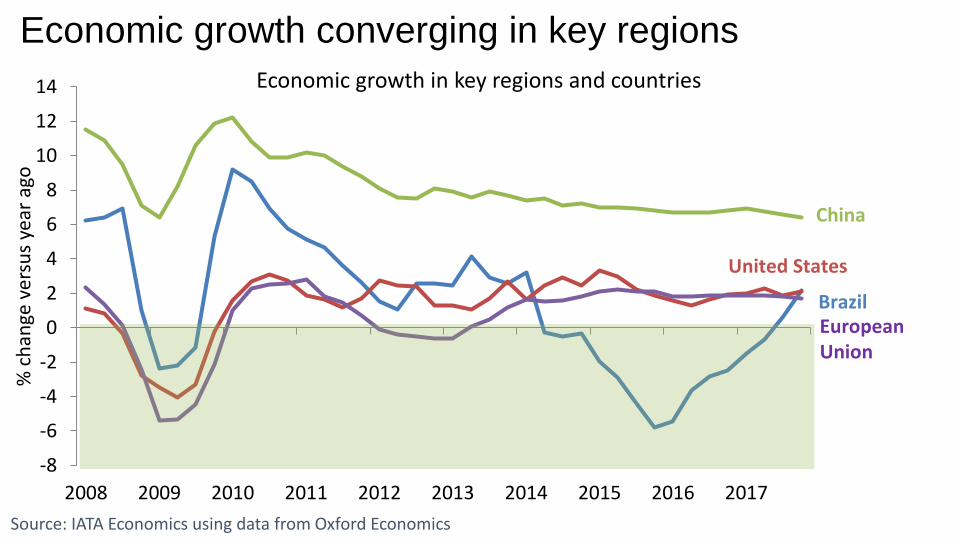
Economic growth converging in key regions
Source: IATA Economics using data from Oxford Economics
-8
-6
-4
-2
0
2
4
6
8
10
12
14
2008 2009 2010 2011 2012 2013 2014 2015 2016 2017
% c
han
ge v
ersu
s ye
ar a
go
Economic growth in key regions and countries
China
Brazil
United States
European Union
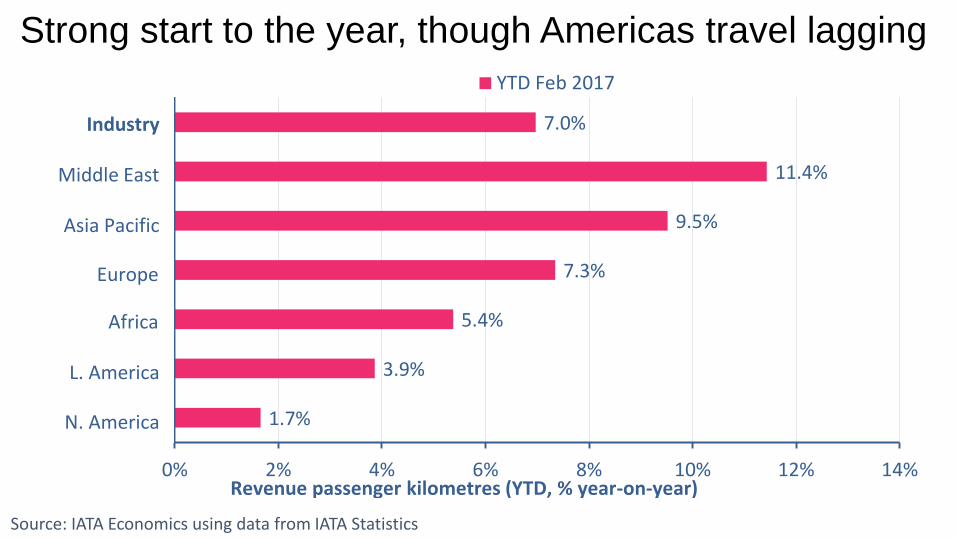
Strong start to the year, though Americas travel lagging
Source: IATA Economics using data from IATA Statistics
1.7%
3.9%
5.4%
7.3%
9.5%
11.4%
7.0%
0% 2% 4% 6% 8% 10% 12% 14%
YTD Feb 2017
Revenue passenger kilometres (YTD, % year-on-year)
Industry
Middle East
Asia Pacific
Europe
Africa
L. America
N. America
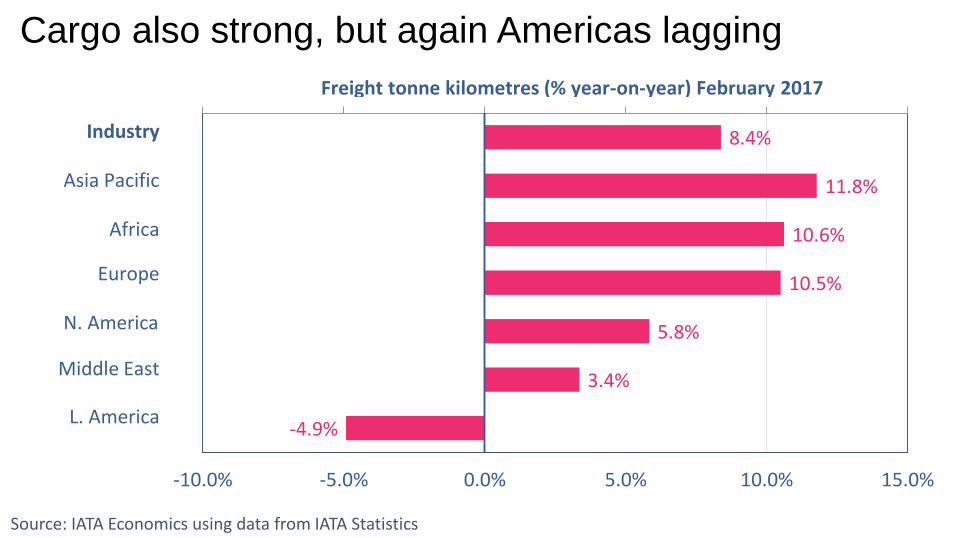
Cargo also strong, but again Americas lagging
Source: IATA Economics using data from IATA Statistics
-4.9%
3.4%
5.8%
10.5%
10.6%
11.8%
8.4%
-10.0% -5.0% 0.0% 5.0% 10.0% 15.0%
Freight tonne kilometres (% year-on-year) February 2017
Industry
Asia Pacific
Africa
Europe
N. America
Middle East
L. America
Airline Industry Economics Advisory Workshop 2016 12
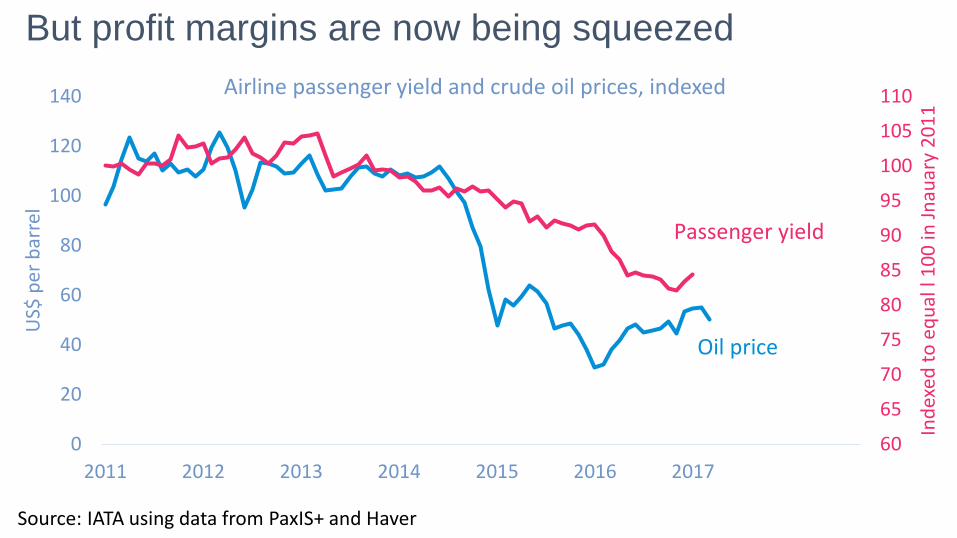
But profit margins are now being squeezed
Source: IATA using data from PaxIS+ and Haver
60
65
70
75
80
85
90
95
100
105
110
0
20
40
60
80
100
120
140
2011 2012 2013 2014 2015 2016 2017
Ind
exed
to
eq
ual
l 1
00
in J
nau
ary
20
11
US$
per
bar
rel
Airline passenger yield and crude oil prices, indexed
Oil price
Passenger yield

Airline Industry Economics Advisory Workshop 2016 13
Industry profitability peaked a year ago
Source: IATA Economic Performance of the Airline Industry – end year 2016 report
-2%
0%
2%
4%
6%
8%
10%
12%
14%
16%
2011 2012 2013 2014 2015 2016 2017
EBIT
as
% r
even
ues
Quarterly profile for airline industry operating profits (EBIT)
Seasonally adjusted margins
Unadjusted margins
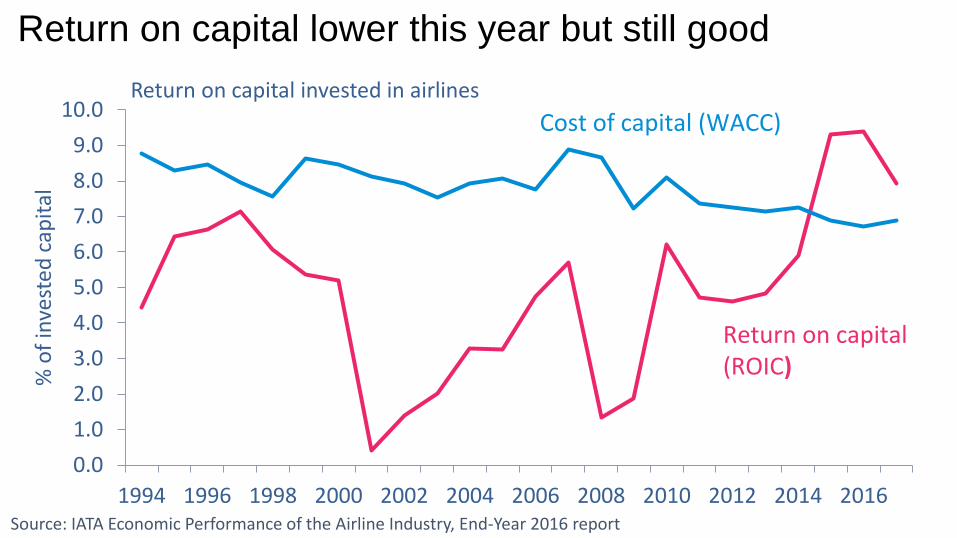
Return on capital lower this year but still good
Source: IATA Economic Performance of the Airline Industry, End-Year 2016 report
0.0
1.0
2.0
3.0
4.0
5.0
6.0
7.0
8.0
9.0
10.0
1994 1996 1998 2000 2002 2004 2006 2008 2010 2012 2014 2016
% o
f in
vest
ed c
apit
al
Return on capital invested in airlines
Cost of capital (WACC)
Return on capital (ROIC)
Airline Industry Economics Advisory Workshop 2016 15
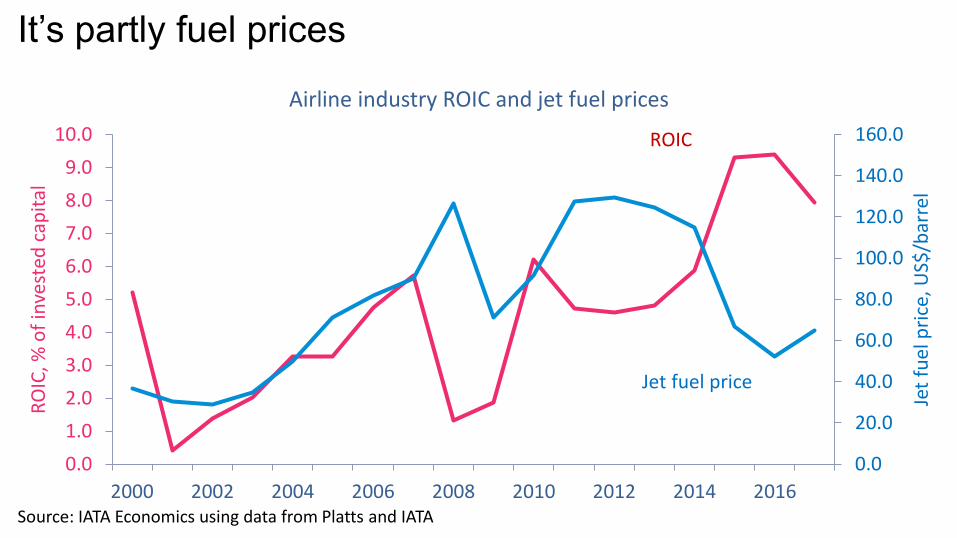
It’s partly fuel prices
Source: IATA Economics using data from Platts and IATA
0.0
20.0
40.0
60.0
80.0
100.0
120.0
140.0
160.0
0.0
1.0
2.0
3.0
4.0
5.0
6.0
7.0
8.0
9.0
10.0
2000 2002 2004 2006 2008 2010 2012 2014 2016
Jet
fuel
pri
ce, U
S$/b
arre
l
RO
IC, %
of
inve
sted
cap
ital
Airline industry ROIC and jet fuel prices
ROIC
Jet fuel price
Airline Industry Economics Advisory Workshop 2016 16
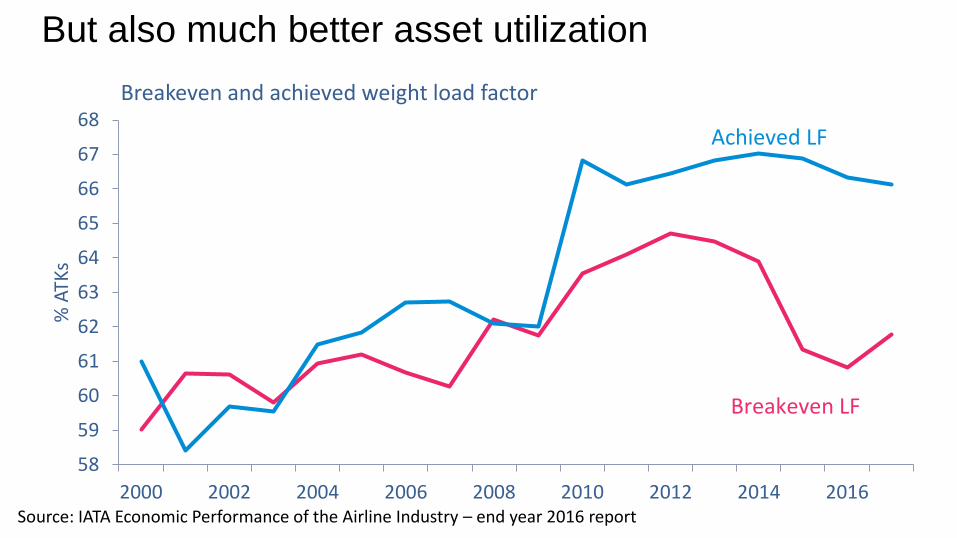
But also much better asset utilization
58
59
60
61
62
63
64
65
66
67
68
2000 2002 2004 2006 2008 2010 2012 2014 2016
% A
TKs
Breakeven and achieved weight load factor
Achieved LF
Breakeven LF
Source: IATA Economic Performance of the Airline Industry – end year 2016 report
Airline Industry Economics Advisory Workshop 2016 17
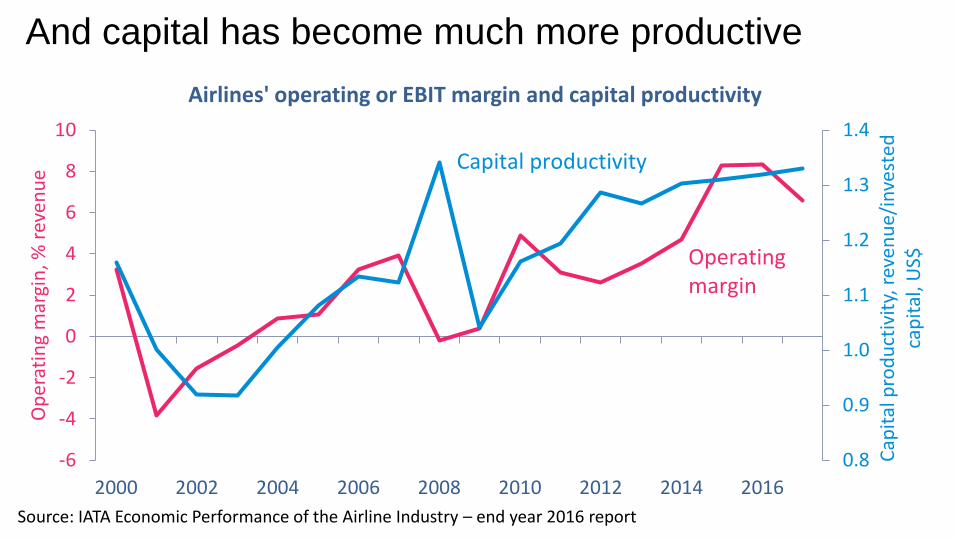
And capital has become much more productive
0.8
0.9
1.0
1.1
1.2
1.3
1.4
-6
-4
-2
0
2
4
6
8
10
2000 2002 2004 2006 2008 2010 2012 2014 2016
Cap
ital
pro
du
ctiv
ity,
rev
enu
e/in
vest
ed
cap
ital
, US$
Op
erat
ing
mar
gin
, % r
even
ue
Airlines' operating or EBIT margin and capital productivity
Capital productivity
Operating margin
Source: IATA Economic Performance of the Airline Industry – end year 2016 report

But performance is very different between regions
Source: IATA Economics using data from The Airline Analyst
0%
2%
4%
6%
8%
10%
12%
14%
16%
18%
20%
2010 2011 2012 2013 2014 2015 2016
EBIT
ad
just
ed f
or
op
erat
ing
leas
es a
s %
in
vest
ed c
apit
alReturn on invested capital
Industry average
North America
Europe
Asia Pacific
Latin AmericaMiddle East
Weighted Average Cost of Capital
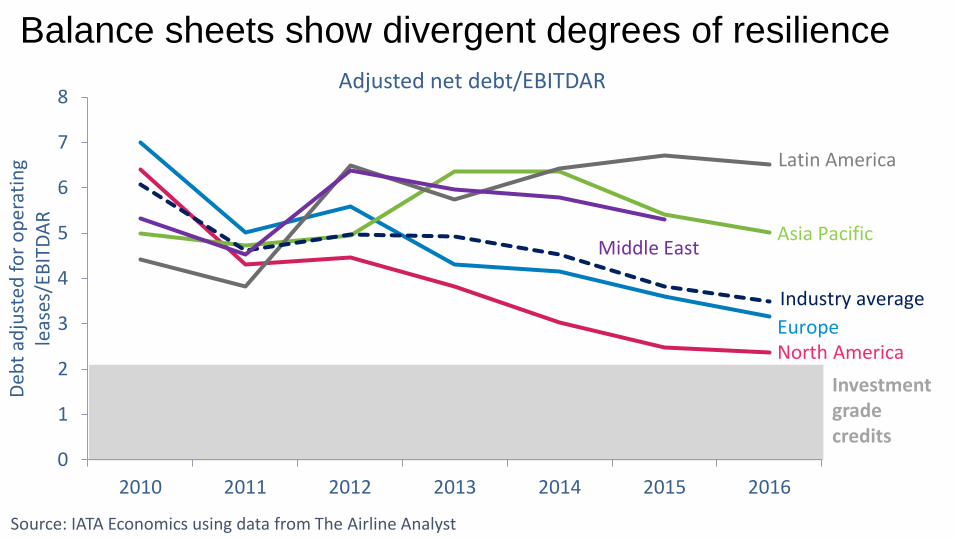
Balance sheets show divergent degrees of resilience
Source: IATA Economics using data from The Airline Analyst
0
1
2
3
4
5
6
7
8
2010 2011 2012 2013 2014 2015 2016
Deb
t ad
just
ed f
or
op
erat
ing
leas
es/E
BIT
DA
R
Adjusted net debt/EBITDAR
Latin America
Asia Pacific
Industry average
EuropeNorth America
Middle East
Investment grade credits
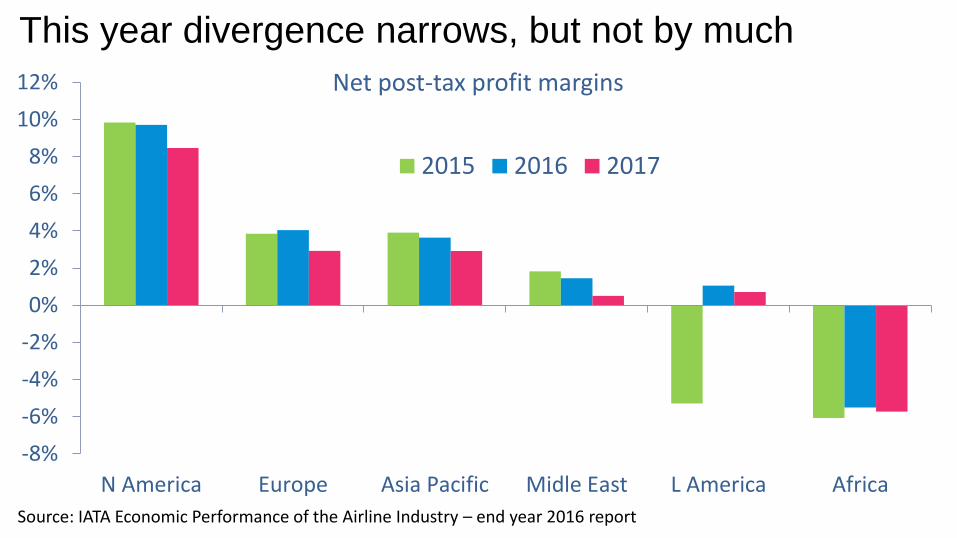
This year divergence narrows, but not by much
Source: IATA Economic Performance of the Airline Industry – end year 2016 report
-8%
-6%
-4%
-2%
0%
2%
4%
6%
8%
10%
12%
N America Europe Asia Pacific Midle East L America Africa
Net post-tax profit margins
2015 2016 2017

Airline Industry Economics Advisory Workshop 2016 21