Embed Size (px)
Citation preview
CALCULATED BETS: COMPUTERS,
GAMBLING, AND MATHEMATICAL
MODELING TO WIN
Steven Skiena
CAMBRIDGE UNIVERSITY PRESS
CALCULATED BETS
Computers, Gambling, and Mathematical Modeling to Win
This is a book about a gambling system that works. It tells how the author usedcomputer simulations and mathematical-modeling techniques to predict theoutcome of jai alai matches and bet on them successfully, thus increasing hisinitial stake by over 500 percent in one year! His methods can work for anyone;at the end of the book he tells the best way to watch jai alai and how to beton it.
With humor and enthusiasm, Skiena details a life-long fascination with thecomputer prediction of sporting events. Along the way, he discusses othergambling systems, both successful and unsuccessful, for such games as lotto,roulette, blackjack, and the stock market. Indeed, he shows how his jai alaisystem functions like a miniature stock-trading system.
Do you want to learn about program trading systems, the future of Internetgambling, and the real reason brokerage houses do not offer mutual fundsthat invest at racetracks and frontons? How mathematical models are used inpolitical polling? The difference between correlation and causation? If you areinterested in gambling and mathematics, odds are this is the book for you!
Steven Skiena is Professor of Computer Science at the State University of NewYork, Stony Brook. He is the author of two popular books, The Algorithm DesignManual and the award-winning Computational Discrete Mathematics, a newedition of which is being published by Cambridge University Press. He is therecipient of the Office of Naval Research (ONR) Young Investigator’s Award andthe Chancellor’s Award for Excellence in Teaching at Stony Brook.
i
OUTLOOKSPUBLISHED BY CAMBRIDGE UNIVERSITY PRESS ANDTHE MATHEMATICAL ASSOCIATION OF AMERICA
Mathematical content is not confined to mathematics. Eugene Wigner notedthe unreasonable effectiveness of mathematics in the physical sciences. Deepmathematical structures also exist in areas as diverse as genetics and art, fi-nance and music. The discovery of these mathematical structures has in turninspired new questions within pure mathematics.
In the Outlooks series, the interplay between mathematics and other disci-plines is explored. Authors reveal mathematical content, limitations, and newquestions arising from this interplay, providing a provocative and novel viewfor mathematicians, and for others an advertisement for the mathematicaloutlook.
Managing EditorRonald L. Graham, University of California, San Diego
Editorial BoardJohn Barrow, University of Cambridge
Fan Chung, University of California, San DiegoIngrid Daubechies, Princeton University
Persi Diaconis, Stanford UniversityDon Zagier, Max Planck Institute, Bonn
iii

CALCULATED BETSCOMPUTERS, GAMBLING, AND
MATHEMATICAL MODELING TO WIN
STEVEN SKIENAState University of New York at Stony Brook
Mathematical Association of America
v

PUBLISHED BY CAMBRIDGE UNIVERSITY PRESS (VIRTUAL PUBLISHING) FOR AND ON BEHALF OF THE PRESS SYNDICATE OF THE UNIVERSITY OF CAMBRIDGE The Pitt Building, Trumpington Street, Cambridge CB2 IRP 40 West 20th Street, New York, NY 10011-4211, USA 477 Williamstown Road, Port Melbourne, VIC 3207, Australia http://www.cambridge.org © Steven S. Skiena 2001 This edition © Steven S. Skiena 2003 First published in printed format 2001 A catalogue record for the original printed book is available from the British Library and from the Library of Congress Original ISBN 0 521 80426 4 hardback Original ISBN 0 521 00962 6 paperback ISBN 0 511 01837 1 virtual (netLibrary Edition)

To my parents, Morris and Ria Skiena, for introducing me to jai alai.
Children look to their parents to teach them values, and you taught
us the value of a good quiniela at an early age.
And to our new daughter Bonnie;
We look forward to teaching you the best of what our parents taught us.
vii
CONTENTS
PrefacePage xi
AcknowledgmentsPage xv
1The Making of a Gambler
Page 1
2What Is Jai Alai?
Page 6
3Monte Carlo on the Tundra
Page 40
4The Impact of the Internet
Page 68
ix
P1: FYX/FYX P2: FYX/UKS QC: FYX/UKS T1: FYX
CB386-Skiena-FM CB386-Skiena June 8, 2001 17:38 Char Count= 34988
CONTENTS
5Is This Bum Any Good?
Page 85
6Modeling the Payoffs
Page 109
7Engineering the System
Page 150
8Putting My Money Where My Mouth Is
Page 174
9How Should You Bet?
Page 187
10Projects to Ponder
Page 209
GlossaryPage 215
For Further ReadingPage 219
IndexPage 223
x
P1: FYX/FYX P2: FYX/UKS QC: FYX/UKS T1: FYX
CB386-Skiena-FM CB386-Skiena June 8, 2001 17:38 Char Count= 34988
PREFACE
This is a book about predicting the future. It describes my attempt to mas-ter a small enough corner of the universe to glimpse the events of tomor-row, today. The degree to which one can do this in my tiny toy domain tellsus something about our potential to foresee larger and more interestingfutures.
Considered less prosaically, this is the story of my 25-year obsessionwith predicting the results of jai alai matches in order to bet on themsuccessfully. As obsessions go, it probably does not rank with yearningfor the love of one you will never have or questing for the freedom of anoppressed and downtrodden people. But it is my obsession – one that hasled me down paths that were unimaginable at the beginning of the journey.
This book marks the successful completion of my long quest and givesme a chance to share what I have learned and experienced. I think theattentive reader will come to understand the worlds of mathematics, com-puters, gambling, and sports quite differently after reading this book.
I tell this tale to introduce several things that have long interested meto a larger audience:
■ The joys of jai alai – Jai alai is a spectator sport and gambling forumthat is underappreciated and misunderstood by the public. I’d like to
xi
P1: FYX/FYX P2: FYX/UKS QC: FYX/UKS T1: FYX
CB386-Skiena-FM CB386-Skiena June 8, 2001 17:38 Char Count= 34988
PREFACE
acquaint a new audience with this fun and exciting game and whet theinterest of current fans by making them more aware of what determinesthe outcome of each match. If you stick with me, you will learn the bestway to watch jai alai and bet on it.
■ The power of mathematical modeling – Mathematical models governour economy and help forecast our weather. They predict who will winthe election and decide whether your mortgage should be granted.However, the man on the street knows little about what mathematicalmodels are and how they work. In this book, I use our jai alai system toexplain how mathematical models are designed, built, and validated.
■ The mathematics of money – Gambling and mathematics have a longand interesting history together. I’ll discuss other gambling systems,both successful and unsuccessful, for such games as lotto, roulette,blackjack, and the stock market. Indeed, my jai alai system functionsvery much as a stock-trading system in miniature. You will learn howprogram-trading systems work, the future of Internet gambling, andthe real reason brokerage houses don’t offer mutual funds that investat racetracks and frontons.
■ The craft of computer programming – For most nonprogrammers, theideas behind modern computing systems lie shrouded beneath a thickmist of buzzwords and technology. These buzzwords give no hint ofthe process by which computer programs are made to work or of theelegance and beauty that underlie the best software. In this book, youwill discover how my students and I built a particularly interestingcomputer program. I use our jai alai system to explain to the laypersonsuch computer science concepts as parsing and random number gen-eration, why real programmers hate Microsoft, and the true glories ofthe Internet.
■ The aesthetics of data – Many people don’t like the looks of charts,graphs, and tables, no matter how many colors they are printed in.But done right, such data representations can be a thing ofbeauty – vehicles driving us to understand the story that the num-bers are trying to tell. In this book, you will get to see a variety of datasets presented in several different ways. You will get a first-hand lookat how to interrogate numbers and make them talk.
Finally, this is the story of a mild-mannered professor who placesmoney on the line to test whether his system really works. Do I hit it rich
xii
P1: FYX/FYX P2: FYX/UKS QC: FYX/UKS T1: FYX
CB386-Skiena-FM CB386-Skiena June 8, 2001 17:38 Char Count= 34988
PREFACE
or end up a tragic, bankrupt figure? You will have to read to the end to seehow I make out.
My goal has been to produce a book that will be interesting and under-standable even to those with little background in each of our three maintopics: jai alai, mathematics, and computing. I explain all the jai alai lingothat I use, and thus you will be able to appreciate what we are doing evenif you have never been to a fronton. If you can understand how mortgageinterest is calculated, you have all of the mathematical background youneed to follow what we are doing. Even if you have never programmed acomputer, you will be able to understand the ideas underlying our system.Either way, after reading this book you will have a better understanding ofhow and why computers are programmed.
Maybe you will even be inspired to try some mathematical modelingof your own! At the end of this book I suggest some possible projects to getyou started.
I have tried to make this book as fun to read as it was to write. Inparticular, I have striven to be in the spirit of Bill James, the popular writerwhose books on baseball go deeply into the essence of the game. He usesadvanced statistical analysis and historical research to unearth hiddentrends and overturn conventional wisdom. One perceptive review notesthat part of the fun in reading his work comes from the spectacle of afirst-rate mind wasting itself on baseball. Part of the fun of this book, Ihope, is the spectacle of a second-rate mind wasting itself on jai alai.
xiii
P1: FYX/FYX P2: FYX/UKS QC: FYX/UKS T1: FYX
CB386-Skiena-FM CB386-Skiena June 8, 2001 17:38 Char Count= 34988
ACKNOWLEDGMENTS
First and foremost, I thank Dario Vlah, Meena Nagarajan, and RogerMailler, the three students who labored to build the system described inthis book. Without the efforts of these three musketeers the project couldnever have been completed. I hope they enjoyed working with me half asmuch as I did with them. I would also like to thank our system admin-istrators Brian Tria and Anne Kilarjian, who patiently kept our computersystems up and running, and Gene Stark, who kept the phones ringing.
I would like to thank the management of the following frontons: DaniaJai-Alai, Milford Jai-Alai, Berenson’s Hartford Jai-Alai, and World Jai-Alai forproviding me with records of games played at their frontons over the years.I particularly thank Bob Heussler for permission to use his jai alai actionphotographs as well as for his time during our field trip to Milford. Thanksare also due to Dr. Simona Rusnak Schmid, Carl Banks, The New BrunswickHome News, the Institute for Operations Research, and the ManagementSciences (INFORMS) for permission to use copyrighted materials.
I am grateful to the people at Cambridge University Press, particularlyLauren Cowles, Caitlin Doggart, and Cathy Siddiqi, for taking a flier onthis gambler’s tale. Eleanor Umali of TechBooks did a great job with pro-duction. Finally, Persi Diaconis worked his magic in helping me find apublisher, and I thank him for his interest and enthusiasm.
xv
P1: FCH/FYX P2: FCH
CB386-01 CB386-Skiena June 8, 2001 16:42 Char Count= 0
CHAPTER ONE
THE MAKING OF A GAMBLER
My interest in jai alai began during my parents’ annual escape from thecold of a New Jersey winter to the promised land of Florida. They stuffedthe kids into a Ford station wagon and drove a thousand miles in 2 dayseach way. Florida held many attractions for a kid: the sun and the beach,Disney World, Grampa, Aunt Fanny, and Uncle Sam. But the biggest drawcame to be the one night each trip when we went to a fronton, or jai alaistadium, and watched them play.
Mom was the biggest jai alai fan in the family and the real motiva-tion behind our excursions. We loaded up the station wagon and droveto the Dania Jai-Alai fronton located midway between Miami and FortLauderdale. In the interests of preserving capital for later investment, myfather carefully avoided the valet parking in favor of the do-it-yourselflot. We followed a trail of palm trees past the cashiers’ windows into thefronton.
Walking into the fronton was an exciting experience. The playing courtsat in a vast open space, three stories tall, surrounded by several tiers ofstadium seating. To my eyes, at least, this was big-league, big-time sport.Particularly “cool” was the sign saying that no minors would be admit-ted without a parent. This was a very big deal when I was only 12 yearsold.
1
P1: FCH/FYX P2: FCH
CB386-01 CB386-Skiena June 8, 2001 16:42 Char Count= 0
CALCULATED BETS
We followed the usher who led us to our seats. The first game hadalready started. We watched as the server spun like a top and hurled thegoathide sphere to the green granite wall, where it rocketed off with asatisfying thunk. His opponent climbed up the sidewall to catch the ball inhis basket, or cesta, and then – with one smooth motion – slung it back towhence it came. The crowd alternated between ooh and ah as the playerscaught and released the ball. The players barked orders to their partners ina foreign tongue, positioning each other across the almost football–field-sized court. Thunk, thunk, thunk went the volley until a well-placed ballfinally eluded its defender.
After each point, the losing side would creep off the court in shame re-placed by another team from the queue. The action would then resume . . .
thunk, thunk, thunk . . . .You have to visit a jai alai fronton to really appreciate the sights and
sounds of the crowd. Most of the spectators, at least the most vocal ones,don’t seem terribly knowledgeable about the players or game. Indeed,many are tourists or retired people who wouldn’t recognize a pelotari,or jai alai player, if they woke up in bed with one. There is only one playerthey are interested in: themselves. The spectators have money riding oneach and every point and are primarily concerned about the performanceof their investment:
“You stink, red.”“Drop it, number 5.”“Just one more point, Laxi – uh, whatever your name is.”
Occasionally a more knowledgeable voice, usually with a Spanish ac-cent, would salute a subtle play: “Chula! Chula!”.
The really neat thing about jai alai is that events happen in discrete stepsinstead of as a continuous flow, and thus the game is more like tennis thanbasketball or horse racing. After watching a few games, I began to get thehang of the scoring system. The pause between each point gives you timeto think about how the game is shaping up and what the prospects for yourbet currently are. Sometimes you can look ahead and figure out an exactsequence of events that will take you to victory. “Look, if 1 beats 5 on thispoint, then loses to 7, and then 4 wins its next two points, the game ends4–2–1 and I win!”
With each point, the loyalties of the crowd change rapidly. A wonderfulaspect of the jai alai scoring system is that the dynamics of the game can
2
P1: FCH/FYX P2: FCH
CB386-01 CB386-Skiena June 8, 2001 16:42 Char Count= 0
THE MAKING OF A GAMBLER
change almost instantaneously. In baseball, you can be 12 runs ahead, andthus giving up one run costs you absolutely nothing. This is not so in jaialai. No matter how far ahead you are, the loss of a single point can kill byforcing you to sit down to watch your opponent win the match. Suddenlya team given up for dead trots back on the court, and then it becomes awhole new game.
Fan loyalty is particularly fleeting because it is often the case that abettor now needs to defeat the same player he or she was rooting for onthe previous point.
“You stink, blue.”“Drop it, number 6.”“You’re my main man, Sourball. I mean Sor-ze-ball.”
After we got settled into our seats, my father gave me, the oldest of thethree kids, a pair of rumpled one-dollar bills. It was enough for one betover the course of the evening. “Use it wisely,” he said.
But what did wisely mean? On his way into the fronton, my father hadinvested 50 cents on a Pepe’s Green Card. Pepe’s Green Card was a one-pagetout sheet printed on green cardboard. I was much too young to catch anyallusion to Pepe’s immigration status in the title. For each of the gamesplayed that evening, Pepe predicted who would finish first, second, andthird alongside a cryptic comment about each player such as “wants towin,” “tough under pressure,” or “in the money.”
On the top of the card, in a box on the right-hand side, Pepe listed hissingle “best bet” for the evening. That night, Pepe liked a 4–2–1 trifecta inthe sixth match.
My brothers and I studied this strange document carefully. We likedthe idea of a tout sheet. It would help us spend our money wisely. As kids,we were used to being told what to do. Why should it be any different whenwe were gambling?
“Boy, this is great. Pepe must really know his stuff,” I said.My brother Len agreed. “You bet! We’ve got nothing but winners here.”“Dad, why do other people pick their own numbers when Pepe has all
the winners here?” asked Rob, the youngest.“Pepe, my pupik!” came my parental voice of authority. “Pepe wouldn’t
know a winner if he stepped on one.”“Look, Pepe gives a best bet. A 4–2–1 trifecta in the sixth match. It can’t
possibly lose.”
3
P1: FCH/FYX P2: FCH
CB386-01 CB386-Skiena June 8, 2001 16:42 Char Count= 0
CALCULATED BETS
My father shook his head sadly. “Trifectas are the longest shots of all,the toughest bet one can make in jai alai. You have almost no chance ofwinning. Why don’t you bet on something that gives you a better chanceto win?”
In retrospect, it is clear that my father was right. To win a trifecta, youmust identify the players who will come in first, second, and third – allin the correct order. There are 8 × 7 × 6 = 336 possible trifectas to bet on,only one of which can occur in any given game.
But we trusted Pepe. And besides, it was now our money. Eventually,we convinced our father to trade in our 2 dollars for a 4–2–1 trifecta ticketon Game 6.
We waited patiently for our chosen moment.At last the public address announcer informed us it was one minute
to post time for Game 6. Last-minute bettors scrambled to the cashiers tothe accompaniment of the betting clock: tick, tick, tick, tick.
The chosen game proved to be a doubles match. Eight pairs of men,each pair wearing a numbered jersey of a prescribed color, marched out toceremonial bull-fighting music: the “March of the Toreadors.” They gavethe crowd a synchronized, if half-hearted, wave of the cesta, and all butthe first two teams straggled back to the bench.
The betting clock completed its countdown, which was terminated by aloud buzzer announcing that betting was now closed. The referee whistled,and the first player bounced the ball and served. The game was on.
We cheered for team 2, at least until they played team 4. We switchedour allegiance to team 4 up until the moment it looked like they would gettoo many points and win without 2 and 1 in their designated positions.We booed any other team with a high score because their success wouldinterfere with the chances of our favorites.
We watched in fascination as player 2 held onto first place, while player1 slid into a distant but perfectly satisfactory second-place position. Whenplayer 4 marched on the court for the second time, my mother noticedwhat was happening. “My G-d, only two more points and the kids win!”
This revelation only made us cheer louder. “Green! Green! Green!,” Iyelled.
“Four! Four! Four!,” my brothers chimed in.Player 4 got the point, leaving us only one point shy of the big payoff.The designated representative from team 4 served the ball.
4
P1: FCH/FYX P2: FCH
CB386-01 CB386-Skiena June 8, 2001 16:42 Char Count= 0
THE MAKING OF A GAMBLER
We followed up with the play-by-play: “Miss it, ooh. No, catch it! Ah!Miss it, ooh. No, catch it! Ah! Miss it . . . .”
He missed it!Family pandemonium broke out as we waited the few moments it took
for the game to become official. Our trifecta paid us $124.60 for a 2-dollarbet – an incomprehensibly large amount of money to a bunch of kids. Thepublic address announcer, in shock, informed all in the house that Pepe’sGreen Card had picked the winning trifecta in the previous game. Momtold all in earshot that her kids had won the big one. Dad sauntered upto the cashier to collect our winnings for us, kids being forbidden fromentering the betting area by state law.
We kids took the family out to dinner the next night. We experiencedthe thrill of being the breadwinner, hunters returning from the kill. It wasindeed fun being a winner – so much fun that I starting wondering howPepe did it. It was clear that most people in the crowd didn’t understandwhat was going on at the fronton, but Pepe did. Maybe I could figure it out,too.
An old gambling axiom states that luck is good, but brains are better.Indeed, it took me almost 25 years, but finally I have figured it out. Let metell you how I did it . . . .
5
P1: GGL
CB386-02 CB386-Skiena June 8, 2001 17:7 Char Count= 0
CHAPTER TWO
WHAT IS JAI ALAI?
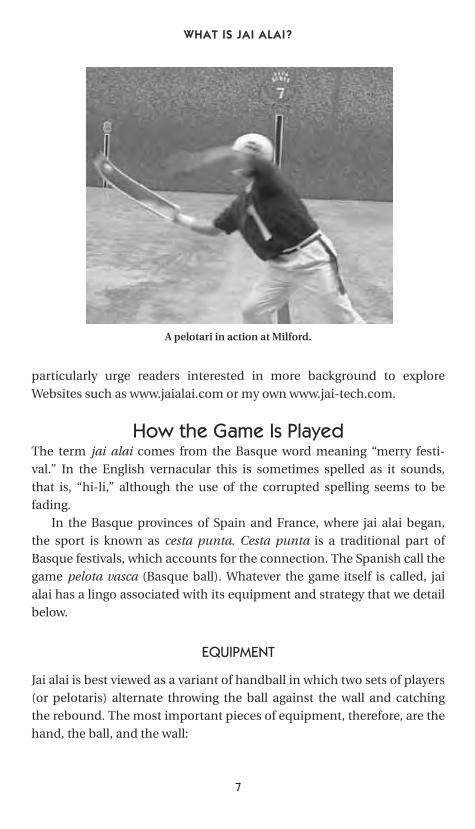
Jai alai is a sport of Basque origin in which opposing players or teamsalternate hurling a ball against the wall and catching it until one of themfinally misses and loses the point. The throwing and catching are done withan enlarged basket or cesta. The ball or pelota is made of goatskin and hardrubber, and the wall is of granite or concrete – which is a combination thatleads to fast and exciting action. Jai alai is a popular spectator sport inEurope and the Americas. In the United States, it is most associated withthe states of Florida, Connecticut, and Rhode Island, which permit pari-mutuel wagering on the sport.
In this chapter, we will delve deeper into the history and culture of jaialai. From the standpoint purely crass of winning money through gam-bling, much of this material is not strictly necessary, but a little historyand culture never hurt anybody. Be my guest if you want to skip aheadto the more mercenary or technical parts of the book, but don’t neglectto review the basic types of bets in jai alai and the Spectacular Sevenscoring system. Understanding the implications of the scoring systemis perhaps the single most important factor in successful jai alaiwagering.
Much of this background material has been lifted from the frontonWebsites described later in this chapter and earlier books on jai alai. I
6
P1: GGL
CB386-02 CB386-Skiena June 8, 2001 17:7 Char Count= 0
WHAT IS JAI ALAI?
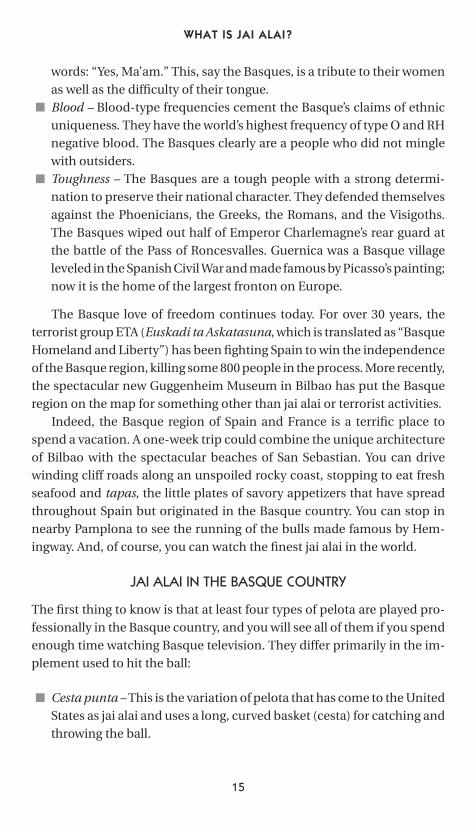
A pelotari in action at Milford.
particularly urge readers interested in more background to exploreWebsites such as www.jaialai.com or my own www.jai-tech.com.
How the Game Is PlayedThe term jai alai comes from the Basque word meaning “merry festi-val.” In the English vernacular this is sometimes spelled as it sounds,that is, “hi-li,” although the use of the corrupted spelling seems to befading.
In the Basque provinces of Spain and France, where jai alai began,the sport is known as cesta punta. Cesta punta is a traditional part ofBasque festivals, which accounts for the connection. The Spanish call thegame pelota vasca (Basque ball). Whatever the game itself is called, jaialai has a lingo associated with its equipment and strategy that we detailbelow.
EQUIPMENT
Jai alai is best viewed as a variant of handball in which two sets of players(or pelotaris) alternate throwing the ball against the wall and catchingthe rebound. The most important pieces of equipment, therefore, are thehand, the ball, and the wall:
7
P1: GGL
CB386-02 CB386-Skiena June 8, 2001 17:7 Char Count= 0
CALCULATED BETS
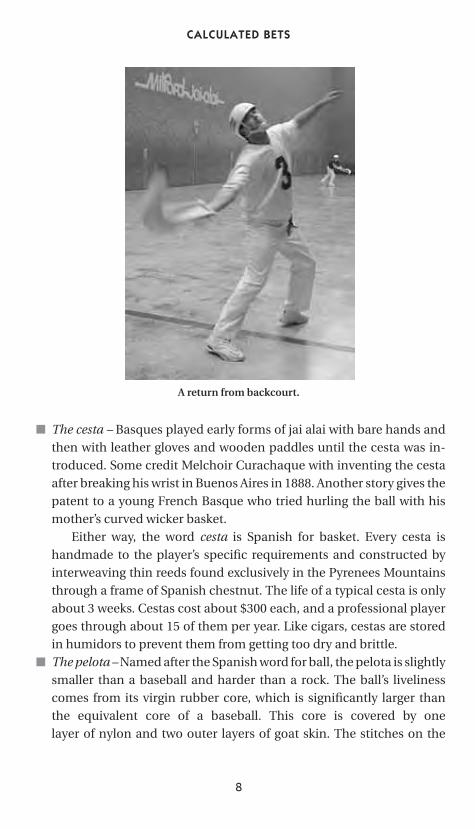
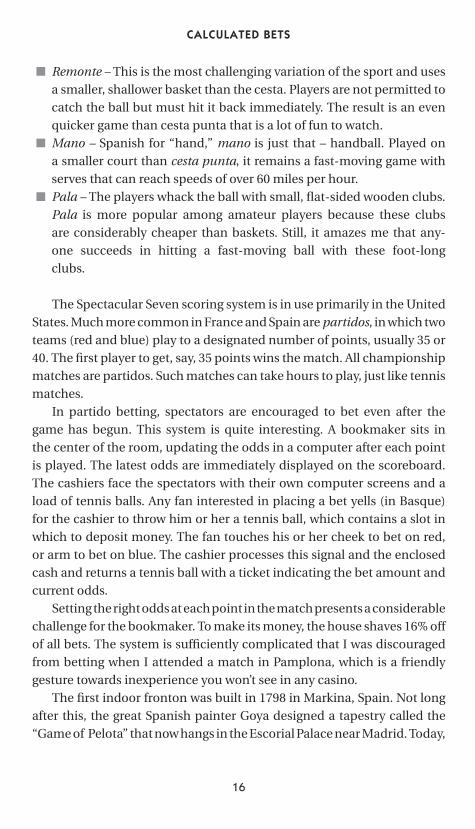
A return from backcourt.
■ The cesta – Basques played early forms of jai alai with bare hands andthen with leather gloves and wooden paddles until the cesta was in-troduced. Some credit Melchoir Curachaque with inventing the cestaafter breaking his wrist in Buenos Aires in 1888. Another story gives thepatent to a young French Basque who tried hurling the ball with hismother’s curved wicker basket.
Either way, the word cesta is Spanish for basket. Every cesta ishandmade to the player’s specific requirements and constructed byinterweaving thin reeds found exclusively in the Pyrenees Mountainsthrough a frame of Spanish chestnut. The life of a typical cesta is onlyabout 3 weeks. Cestas cost about $300 each, and a professional playergoes through about 15 of them per year. Like cigars, cestas are storedin humidors to prevent them from getting too dry and brittle.
■ The pelota – Named after the Spanish word for ball, the pelota is slightlysmaller than a baseball and harder than a rock. The ball’s livelinesscomes from its virgin rubber core, which is significantly larger thanthe equivalent core of a baseball. This core is covered by onelayer of nylon and two outer layers of goat skin. The stitches on the
8
P1: GGL
CB386-02 CB386-Skiena June 8, 2001 17:7 Char Count= 0
WHAT IS JAI ALAI?
pelota are embedded so as to minimize damage when it slams into thecesta.
Each pelota has a court life of only 20 minutes or so before thecover splits owing to the punishment it takes hitting the wall duringplay. These pelotas, which are made by hand at a cost of about $150,are then recycled by sewing on new covers and subsequently aged or“rested” for at least one month in order to regain full liveliness.
Pelotas in play have been clocked at over 180 miles per hour, whichis twice the speed of a major league fast ball. The combination of hardmass and high velocity makes it a very bad idea to get in the way of amoving pelota.
Pelota is also used as the name for a sport with religious overtonesplayed by the ancient Aztecs. Those guys took their games very seri-ously, for the losing team was often put up as a human sacrifice. Suchpolicies presumably induced greater effort from the players than isseen today even at the best frontons, although modern jai alai playersare able to accumulate more experience than their Aztec forebears.
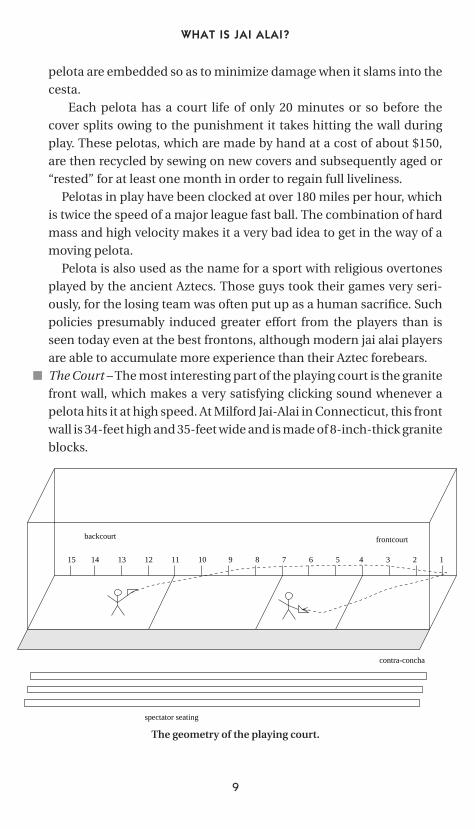
■ The Court – The most interesting part of the playing court is the granitefront wall, which makes a very satisfying clicking sound whenever apelota hits it at high speed. At Milford Jai-Alai in Connecticut, this frontwall is 34-feet high and 35-feet wide and is made of 8-inch-thick graniteblocks.
15 14 13 12 11 10 9 8 7 6 5 4 3 2 1
contra-concha
backcourt frontcourt
spectator seating
The geometry of the playing court.
9
P1: GGL
CB386-02 CB386-Skiena June 8, 2001 17:7 Char Count= 0
CALCULATED BETS
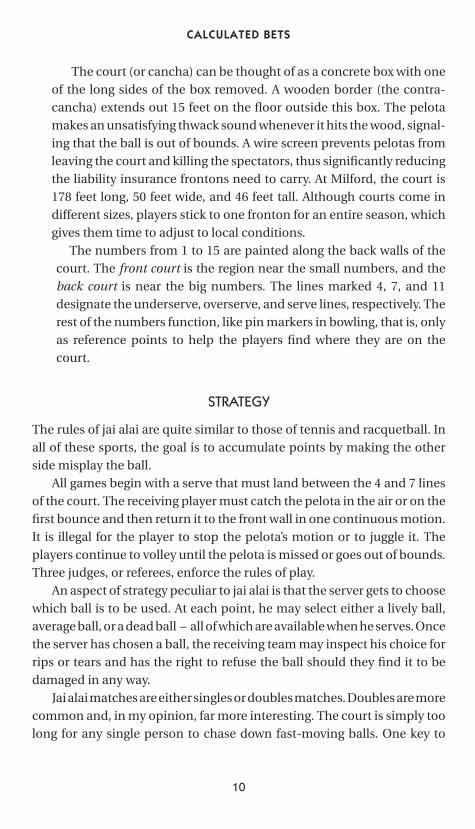
The court (or cancha) can be thought of as a concrete box with oneof the long sides of the box removed. A wooden border (the contra-cancha) extends out 15 feet on the floor outside this box. The pelotamakes an unsatisfying thwack sound whenever it hits the wood, signal-ing that the ball is out of bounds. A wire screen prevents pelotas fromleaving the court and killing the spectators, thus significantly reducingthe liability insurance frontons need to carry. At Milford, the court is178 feet long, 50 feet wide, and 46 feet tall. Although courts come indifferent sizes, players stick to one fronton for an entire season, whichgives them time to adjust to local conditions.
The numbers from 1 to 15 are painted along the back walls of thecourt. The front court is the region near the small numbers, and theback court is near the big numbers. The lines marked 4, 7, and 11designate the underserve, overserve, and serve lines, respectively. Therest of the numbers function, like pin markers in bowling, that is, onlyas reference points to help the players find where they are on thecourt.
STRATEGY
The rules of jai alai are quite similar to those of tennis and racquetball. Inall of these sports, the goal is to accumulate points by making the otherside misplay the ball.
All games begin with a serve that must land between the 4 and 7 linesof the court. The receiving player must catch the pelota in the air or on thefirst bounce and then return it to the front wall in one continuous motion.It is illegal for the player to stop the pelota’s motion or to juggle it. Theplayers continue to volley until the pelota is missed or goes out of bounds.Three judges, or referees, enforce the rules of play.
An aspect of strategy peculiar to jai alai is that the server gets to choosewhich ball is to be used. At each point, he may select either a lively ball,average ball, or a dead ball – all of which are available when he serves. Oncethe server has chosen a ball, the receiving team may inspect his choice forrips or tears and has the right to refuse the ball should they find it to bedamaged in any way.
Jai alai matches are either singles or doubles matches. Doubles are morecommon and, in my opinion, far more interesting. The court is simply toolong for any single person to chase down fast-moving balls. One key to
10
P1: GGL
CB386-02 CB386-Skiena June 8, 2001 17:7 Char Count= 0
WHAT IS JAI ALAI?
being an effective player is correctly judging whether it will be easier tocatch the ball as it flies directly off the frontwall or to wait for the reboundoff the back wall. Doubles players specialize as either frontcourters orbackcourters, depending upon where they are stationed. Frontcourtersmust be faster than the backcourters because they have more ground tocover and less time to react, whereas backcourtsmen require stronger armsto heave the pelota the full length of the court.
Understanding the court geometry is essential to appreciate the im-portance of shot placement. Although the ball does spin and curve, jai alaiplayers rely more on raw power and placement than English1 to beat theiropponents. The following are the most interesting shots :
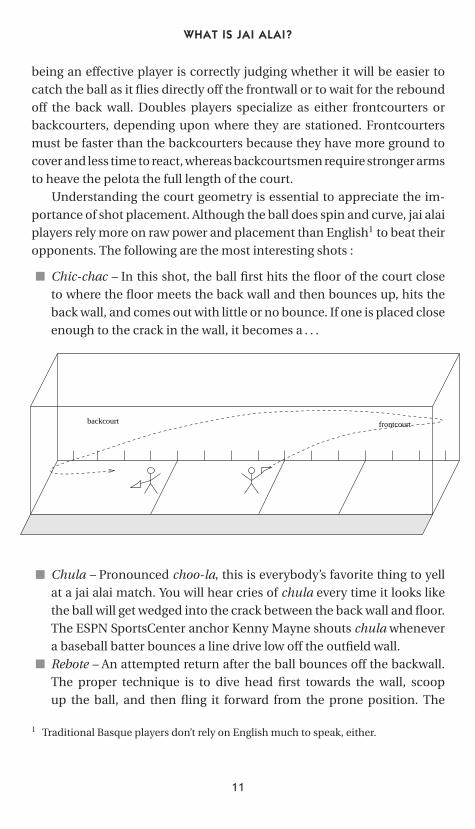
■ Chic-chac – In this shot, the ball first hits the floor of the court closeto where the floor meets the back wall and then bounces up, hits theback wall, and comes out with little or no bounce. If one is placed closeenough to the crack in the wall, it becomes a . . .
backcourt frontcourt
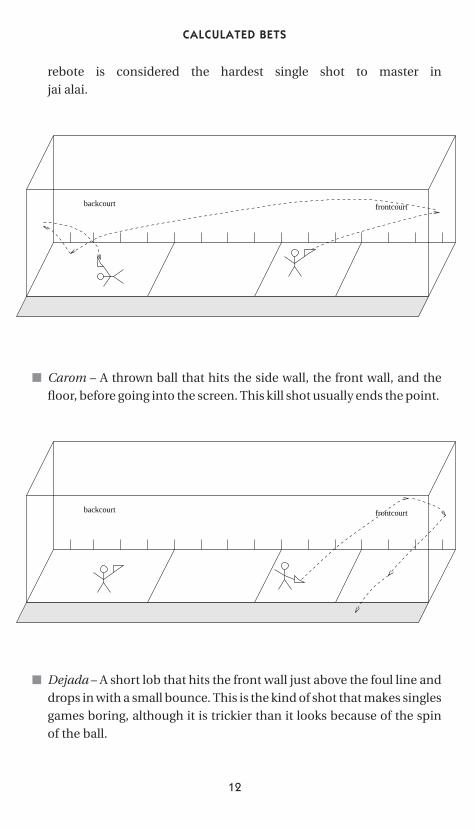
■ Chula – Pronounced choo-la, this is everybody’s favorite thing to yellat a jai alai match. You will hear cries of chula every time it looks likethe ball will get wedged into the crack between the back wall and floor.The ESPN SportsCenter anchor Kenny Mayne shouts chula whenevera baseball batter bounces a line drive low off the outfield wall.
■ Rebote – An attempted return after the ball bounces off the backwall.The proper technique is to dive head first towards the wall, scoopup the ball, and then fling it forward from the prone position. The
1 Traditional Basque players don’t rely on English much to speak, either.
11
P1: GGL
CB386-02 CB386-Skiena June 8, 2001 17:7 Char Count= 0
CALCULATED BETS
rebote is considered the hardest single shot to master injai alai.
backcourt frontcourt
■ Carom – A thrown ball that hits the side wall, the front wall, and thefloor, before going into the screen. This kill shot usually ends the point.
backcourt frontcourt
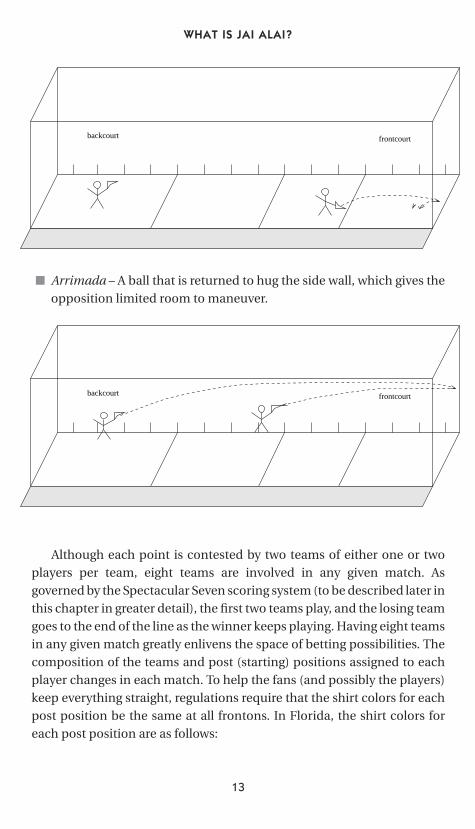
■ Dejada – A short lob that hits the front wall just above the foul line anddrops in with a small bounce. This is the kind of shot that makes singlesgames boring, although it is trickier than it looks because of the spinof the ball.
12
P1: GGL
CB386-02 CB386-Skiena June 8, 2001 17:7 Char Count= 0
WHAT IS JAI ALAI?
backcourt frontcourt
■ Arrimada – A ball that is returned to hug the side wall, which gives theopposition limited room to maneuver.
backcourt frontcourt
Although each point is contested by two teams of either one or twoplayers per team, eight teams are involved in any given match. Asgoverned by the Spectacular Seven scoring system (to be described later inthis chapter in greater detail), the first two teams play, and the losing teamgoes to the end of the line as the winner keeps playing. Having eight teamsin any given match greatly enlivens the space of betting possibilities. Thecomposition of the teams and post (starting) positions assigned to eachplayer changes in each match. To help the fans (and possibly the players)keep everything straight, regulations require that the shirt colors for eachpost position be the same at all frontons. In Florida, the shirt colors foreach post position are as follows:
13
P1: GGL
CB386-02 CB386-Skiena June 8, 2001 17:7 Char Count= 0
CALCULATED BETS
Post Position 1 2 3 4 5 6 7 8Shirt Color Red Blue White Green Black Yellow Brown Purple
Because each player needs jerseys with his uniform number in eachof these eight colors, laundry (and, as we will see, fairness) considerationsdictate that no player appear in a particular position too often each night.
History of the GameTracking down definitive information on the history of jai alai posed moredifficulties than I might have imagined. The best book on jai alai’s earlyhistory appears to be Blazy’s La Pelote Basque from 1929, whose neat oldphotos and line drawings lose none of their charm even though the bookwas written in French. Similarly, the definitive Historia de la Pelota Vascaen Las Americas is written in Spanish.
Unfortunately, if I were a pelotari, my nickname would be Monolingual.Therefore, most of the history reported below comes from less authorita-tive sources. Some cite legends that jai alai was invented by Saint Ignatiusof Loyola, a Basque. Others sources trace the origins of the game even ear-lier to Adam and Eve. These same legends assure us that they spoke to eachother in Basque.
THE BASQUES
About three million Basques live in their green and beautiful homeland inthe Pyrenees Mountains. The land of the Basques (called Eskual Herria inthe Basque language) straddles the border of France and Spain, comprisingthree French and four Spanish provinces. The Basques are a distinctivepeople with several unique characteristics:
■ Language – Basque is apparently the only Western European languagethat does not belong to the Indo–European family of languages. Writ-ten Basque is as strange-looking as the language is strange-sounding,featuring an extraordinary number of x’s and an apparent disregard forvowels. The Basques refer to themselves as Euskaldunak or “speakers ofthe Euzkara.” Contemporary theories suggest that Basques may havedescended from early Iberian tribes, and this language presumablycame with them.
Legend states the Devil tried to learn Basque by listening behindthe door of a Basque farmhouse. After 7 years, he mastered only two
14
P1: GGL
CB386-02 CB386-Skiena June 8, 2001 17:7 Char Count= 0
WHAT IS JAI ALAI?
words: “Yes, Ma’am.” This, say the Basques, is a tribute to their womenas well as the difficulty of their tongue.
■ Blood – Blood-type frequencies cement the Basque’s claims of ethnicuniqueness. They have the world’s highest frequency of type O and RHnegative blood. The Basques clearly are a people who did not minglewith outsiders.
■ Toughness – The Basques are a tough people with a strong determi-nation to preserve their national character. They defended themselvesagainst the Phoenicians, the Greeks, the Romans, and the Visigoths.The Basques wiped out half of Emperor Charlemagne’s rear guard atthe battle of the Pass of Roncesvalles. Guernica was a Basque villageleveled in the Spanish Civil War and made famous by Picasso’s painting;now it is the home of the largest fronton on Europe.
The Basque love of freedom continues today. For over 30 years, theterrorist group ETA (Euskadi ta Askatasuna, which is translated as “BasqueHomeland and Liberty”) has been fighting Spain to win the independenceof the Basque region, killing some 800 people in the process. More recently,the spectacular new Guggenheim Museum in Bilbao has put the Basqueregion on the map for something other than jai alai or terrorist activities.
Indeed, the Basque region of Spain and France is a terrific place tospend a vacation. A one-week trip could combine the unique architectureof Bilbao with the spectacular beaches of San Sebastian. You can drivewinding cliff roads along an unspoiled rocky coast, stopping to eat freshseafood and tapas, the little plates of savory appetizers that have spreadthroughout Spain but originated in the Basque country. You can stop innearby Pamplona to see the running of the bulls made famous by Hem-ingway. And, of course, you can watch the finest jai alai in the world.
JAI ALAI IN THE BASQUE COUNTRY
The first thing to know is that at least four types of pelota are played pro-fessionally in the Basque country, and you will see all of them if you spendenough time watching Basque television. They differ primarily in the im-plement used to hit the ball:
■ Cesta punta – This is the variation of pelota that has come to the UnitedStates as jai alai and uses a long, curved basket (cesta) for catching andthrowing the ball.
15
P1: GGL
CB386-02 CB386-Skiena June 8, 2001 17:7 Char Count= 0
CALCULATED BETS
■ Remonte – This is the most challenging variation of the sport and usesa smaller, shallower basket than the cesta. Players are not permitted tocatch the ball but must hit it back immediately. The result is an evenquicker game than cesta punta that is a lot of fun to watch.
■ Mano – Spanish for “hand,” mano is just that – handball. Played ona smaller court than cesta punta, it remains a fast-moving game withserves that can reach speeds of over 60 miles per hour.
■ Pala – The players whack the ball with small, flat-sided wooden clubs.Pala is more popular among amateur players because these clubsare considerably cheaper than baskets. Still, it amazes me that any-one succeeds in hitting a fast-moving ball with these foot-longclubs.
The Spectacular Seven scoring system is in use primarily in the UnitedStates. Much more common in France and Spain are partidos, in which twoteams (red and blue) play to a designated number of points, usually 35 or40. The first player to get, say, 35 points wins the match. All championshipmatches are partidos. Such matches can take hours to play, just like tennismatches.
In partido betting, spectators are encouraged to bet even after thegame has begun. This system is quite interesting. A bookmaker sits inthe center of the room, updating the odds in a computer after each pointis played. The latest odds are immediately displayed on the scoreboard.The cashiers face the spectators with their own computer screens and aload of tennis balls. Any fan interested in placing a bet yells (in Basque)for the cashier to throw him or her a tennis ball, which contains a slot inwhich to deposit money. The fan touches his or her cheek to bet on red,or arm to bet on blue. The cashier processes this signal and the enclosedcash and returns a tennis ball with a ticket indicating the bet amount andcurrent odds.
Setting the right odds at each point in the match presents a considerablechallenge for the bookmaker. To make its money, the house shaves 16% offof all bets. The system is sufficiently complicated that I was discouragedfrom betting when I attended a match in Pamplona, which is a friendlygesture towards inexperience you won’t see in any casino.
The first indoor fronton was built in 1798 in Markina, Spain. Not longafter this, the great Spanish painter Goya designed a tapestry called the“Game of Pelota” that now hangs in the Escorial Palace near Madrid. Today,
16
P1: GGL
CB386-02 CB386-Skiena June 8, 2001 17:7 Char Count= 0
WHAT IS JAI ALAI?
professional jai alai can be watched in Spain at frontons in Pamplona(Huarte), San Sebastian, and Guernica. In France, the premier fronton isin Saint-Jean-de-Luz, a lovely village near the sea.
Basque players dominate world jai alai. Of the 48 players on the 1998Milford Jai-Alai roster, 30 list their nationality as Spanish Basque and 4more as French Basque. The close-knit Basque player’s association hasbeen credited with helping to preserve the integrity of the sport by rig-orously policing itself. This association eventually evolved into the Inter-national Jai-Alai Players Association (www.ijapa.com), which is a unionaffiliated with the United Auto Workers.
Jai alai has been played whereever Basques have lived. Before WorldWar II, jai alai was played in Havana and such exotic places as Shanghaiand Tientsin, China. The Havana fronton was one of the best in the worldbefore Castro outlawed the sport in the late 1950s. At least until recently,jai alai was played professionally in Italy, the Philippines, Macao, andIndonesia.
Jai alai achieved international recognition when it was played in the1992 Barcelona Olympic Games as a demonstration sport.
JAI ALAI IN THE UNITED STATES
Jai alai was introduced in the United States in 1904 at the Saint LouisWorld’s Fair, which, if I recall correctly, was also where the ice-cream conewas first unveiled to a hungry populace. The sport caught on to such anextent that America’s first permanent jai alai fronton was built in 1924 onwhat is now the parking lot of Hialeah racetrack in Miami, Florida. It wasalmost immediately destroyed in a hurricane but then quickly rebuilt. Tenyears later, in 1934, wagering on jai alai was legalized in Florida. Today,jai alai contributes an estimated $200 million per year in total economicrevenues to the Florida economy.
After the Basques, Americans constitute the largest population of pro-fessional jai alai players. Many of these players learned the sport at along-standing amateur facility in North Miami or the more recent am-ateur fronton at Milford, Connecticut. Jai alai underwent a big boom inthe mid-1970s. At its peak in 1978, there were 10 frontons in Florida, 3 inConnecticut, 2 in Nevada, and 1 in Rhode Island. Referenda to expand thesport to New Jersey and California failed by narrow margins, but furthergrowth seemed inevitable.
17
P1: GGL
CB386-02 CB386-Skiena June 8, 2001 17:7 Char Count= 0
CALCULATED BETS
However, the jai alai industry today is not what it used to be. The firstproblem was the long and nasty players strike, which lasted 3 years start-ing in 1988 and left serious wounds behind. Proclaimed “one of the biggestmesses in U.S. labor history” (Balfour 1990), it directly involved
the International Jai Alai Players Association, eight different employ-ers in three different states, the National Labor Relations Board, twoother federal agencies, three state agencies, federal courts, state courts,immigration restrictions and threatened deportations, state licensingprocedures, yellow dog contracts, a secondary boycott by employersin Spain, Basque machismo, the governor of Florida, and the UnitedAutomobile Workers.
The strike poisoned relationships between the players and the frontons,significantly lowered the quality of play through the use of underskilledscab players, and greatly disenchanted the fans. It was a lose–lose situa-tion for all concerned.
But even more damaging has been the competition from other forms ofgambling that has been cutting heavily into the fronton’s business. Since1988, when the Florida Lottery started, the number of operating fron-tons there has dwindled to five (Miami, Dania, Orlando, Fort Pierce, andOcala), the last two of which are open only part of the year. Connecticut’sHartford and Bridgeport frontons closed in the face of competition with theMashantucket Pequot’s Foxwoods Resort Casino, leaving Milford Jai-Alaias the sport’s only outpost in the state.
Several prominent frontons skate on thin financial ice and are in dangerof suffering the fate of Tampa Jai-Alai, which closed down on July 4, 1998.The primary hopes of the industry now rest on embracing casino gam-bling, and owners have been lobbying the governments of Connecticutand Florida to permit frontons to operate slot machines on the side. Be-sides competition, fronton owners complain about the amount of taxationthey must pay. In the year before it closed, Tampa Jai-Alai paid $1.76 millionto the state in taxes while reporting operating losses of over $1 million.
NORTH AMERICAN FRONTONS
In North America, professional jai alai is now played only in Florida, Con-necticut, Rhode Island, and Mexico. Each fronton is owned and operatedby private businessmen but licensed by the state. Frontons are good-sized
18
P1: GGL
CB386-02 CB386-Skiena June 8, 2001 17:7 Char Count= 0
WHAT IS JAI ALAI?
businesses, like baseball teams, which, counting players, coaches, bettingclerks, vendors, and support staff, can each employ several hundred peo-ple. The following are the major frontons in the United States:
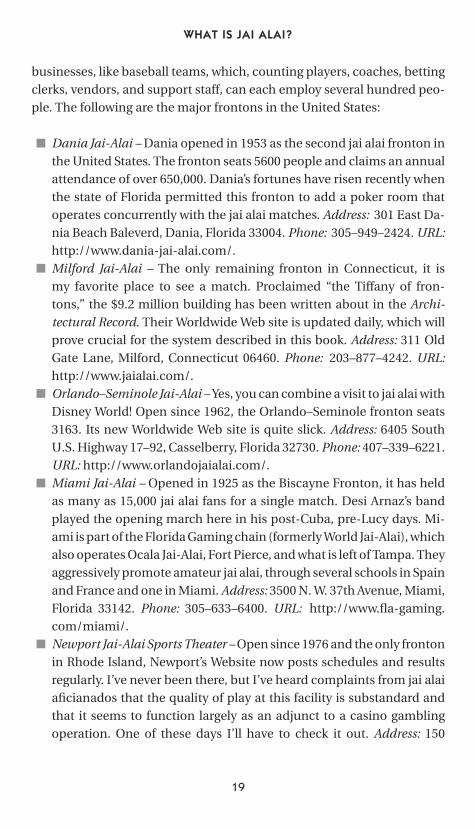
■ Dania Jai-Alai – Dania opened in 1953 as the second jai alai fronton inthe United States. The fronton seats 5600 people and claims an annualattendance of over 650,000. Dania’s fortunes have risen recently whenthe state of Florida permitted this fronton to add a poker room thatoperates concurrently with the jai alai matches. Address: 301 East Da-nia Beach Baleverd, Dania, Florida 33004. Phone: 305–949–2424. URL:http://www.dania-jai-alai.com/.
■ Milford Jai-Alai – The only remaining fronton in Connecticut, it ismy favorite place to see a match. Proclaimed “the Tiffany of fron-tons,” the $9.2 million building has been written about in the Archi-tectural Record. Their Worldwide Web site is updated daily, which willprove crucial for the system described in this book. Address: 311 OldGate Lane, Milford, Connecticut 06460. Phone: 203–877–4242. URL:http://www.jaialai.com/.
■ Orlando–Seminole Jai-Alai – Yes, you can combine a visit to jai alai withDisney World! Open since 1962, the Orlando–Seminole fronton seats3163. Its new Worldwide Web site is quite slick. Address: 6405 SouthU.S. Highway 17–92, Casselberry, Florida 32730. Phone: 407–339–6221.URL: http://www.orlandojaialai.com/.
■ Miami Jai-Alai – Opened in 1925 as the Biscayne Fronton, it has heldas many as 15,000 jai alai fans for a single match. Desi Arnaz’s bandplayed the opening march here in his post-Cuba, pre-Lucy days. Mi-ami is part of the Florida Gaming chain (formerly World Jai-Alai), whichalso operates Ocala Jai-Alai, Fort Pierce, and what is left of Tampa. Theyaggressively promote amateur jai alai, through several schools in Spainand France and one in Miami. Address: 3500 N. W. 37th Avenue, Miami,Florida 33142. Phone: 305–633–6400. URL: http://www.fla-gaming.com/miami/.
■ Newport Jai-Alai Sports Theater – Open since 1976 and the only frontonin Rhode Island, Newport’s Website now posts schedules and resultsregularly. I’ve never been there, but I’ve heard complaints from jai alaiaficianados that the quality of play at this facility is substandard andthat it seems to function largely as an adjunct to a casino gamblingoperation. One of these days I’ll have to check it out. Address: 150
19
P1: GGL
CB386-02 CB386-Skiena June 8, 2001 17:7 Char Count= 0
CALCULATED BETS
Admiral Kalibfus Road, Newport, RI 20840. Phone: 401–849–5000. URL:http://bermuda.newtonline.com/nja/.
■ Ocala Jai-Alai – Located near Gainesville, Florida, it offers live jai alaiMay through October. Ocala serves as somewhat of a farm team forAmerican players, and thus it is a good place to see up-and-comingdomestic talent. Address: 4601 N.W. Highway 318, Orange Lake, Florida32686. Phone: 352–591–2345. URL: http://www.ocalajaialai.com.
■ Fort Pierce Jai-Alai – Part of the World Jai-Alai empire, it has been lo-cated in Port Saint Lucie County since 1974. Fort Pierce currently op-erates from January through April, presumably to coincide with base-ball’s spring training season. Address: 1750 South Kings Highway (atPico’s Road), Fort Pierce, Florida 34945–3099. Phone: 407–464–7500.URL: http://www.jaialai.net/.
Mexico’s most prominent fronton is the Tijuana Jai-Alai Palace, whichopened in 1947. More recently, frontons have opened and closed inAcapulco and Cancun.
The jai alai palace is the classiest structure on Revolucion Avenue inthe tourist part of Tijuana. In front of the fronton, a statue of a pelotariwith his cesta aloft strides the world. Alas, no gambling is allowed atthe matches played Friday and Saturday nights in the Jai-Alai Palace, al-though there is a betting parlor next door that simulcasts games fromMiami. There are much easier ways to lose your money in Tijuana – eas-ier but ultimately less satisfying than jai alai. Address: 1100 RevolucionAve., Tijuana, B.C. Mexico. URL: http://www.geocities.com/Colosseum/Sideline/7480/.
Amateur play in the United States focuses at Milford and the NorthMiami Jai-Alai School. All told, there are about 500 active players in theUnited States.
THE PLAYERS
Like all athletes, no matter how strong, no matter how talented, jai alaiplayers are people with feelings and passions motivated by the same forcesthat affect us all. The rest of this book will consistently ignore the factthat players are people. Our system for predicting the outcome of jai alaimatches treats players as machines that generate points according to a
20
P1: GGL
CB386-02 CB386-Skiena June 8, 2001 17:7 Char Count= 0
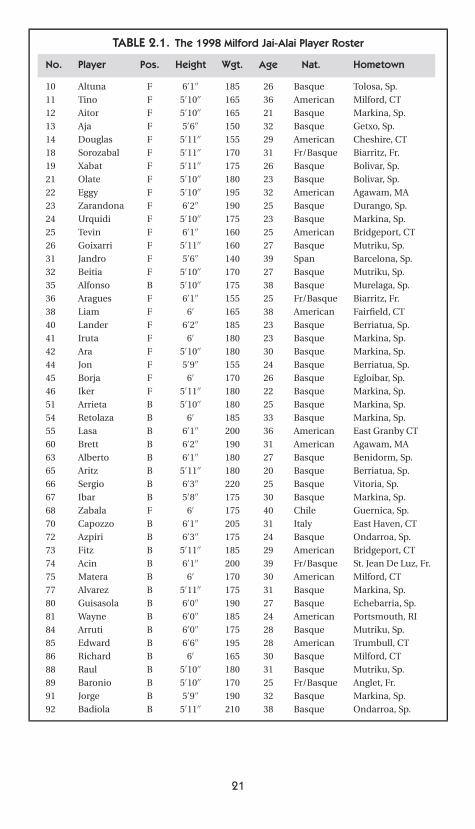
TABLE 2.1. The 1998 Milford Jai-Alai Player Roster
No. Player Pos. Height Wgt. Age Nat. Hometown
10 Altuna F 6′1′′ 185 26 Basque Tolosa, Sp.
11 Tino F 5′10′′ 165 36 American Milford, CT
12 Aitor F 5′10′′ 165 21 Basque Markina, Sp.
13 Aja F 5′6′′ 150 32 Basque Getxo, Sp.
14 Douglas F 5′11′′ 155 29 American Cheshire, CT
18 Sorozabal F 5′11′′ 170 31 Fr/Basque Biarritz, Fr.
19 Xabat F 5′11′′ 175 26 Basque Bolivar, Sp.
21 Olate F 5′10′′ 180 23 Basque Bolivar, Sp.
22 Eggy F 5′10′′ 195 32 American Agawam, MA
23 Zarandona F 6′2′′ 190 25 Basque Durango, Sp.
24 Urquidi F 5′10′′ 175 23 Basque Markina, Sp.
25 Tevin F 6′1′′ 160 25 American Bridgeport, CT
26 Goixarri F 5′11′′ 160 27 Basque Mutriku, Sp.
31 Jandro F 5′6′′ 140 39 Span Barcelona, Sp.
32 Beitia F 5′10′′ 170 27 Basque Mutriku, Sp.
35 Alfonso B 5′10′′ 175 38 Basque Murelaga, Sp.
36 Aragues F 6′1′′ 155 25 Fr/Basque Biarritz, Fr.
38 Liam F 6′ 165 38 American Fairfield, CT
40 Lander F 6′2′′ 185 23 Basque Berriatua, Sp.
41 Iruta F 6′ 180 23 Basque Markina, Sp.
42 Ara F 5′10′′ 180 30 Basque Markina, Sp.
44 Jon F 5′9′′ 155 24 Basque Berriatua, Sp.
45 Borja F 6′ 170 26 Basque Egloibar, Sp.
46 Iker F 5′11′′ 180 22 Basque Markina, Sp.
51 Arrieta B 5′10′′ 180 25 Basque Markina, Sp.
54 Retolaza B 6′ 185 33 Basque Markina, Sp.
55 Lasa B 6′1′′ 200 36 American East Granby CT
60 Brett B 6′2′′ 190 31 American Agawam, MA
63 Alberto B 6′1′′ 180 27 Basque Benidorm, Sp.
65 Aritz B 5′11′′ 180 20 Basque Berriatua, Sp.
66 Sergio B 6′3′′ 220 25 Basque Vitoria, Sp.
67 Ibar B 5′8′′ 175 30 Basque Markina, Sp.
68 Zabala F 6′ 175 40 Chile Guernica, Sp.
70 Capozzo B 6′1′′ 205 31 Italy East Haven, CT
72 Azpiri B 6′3′′ 175 24 Basque Ondarroa, Sp.
73 Fitz B 5′11′′ 185 29 American Bridgeport, CT
74 Acin B 6′1′′ 200 39 Fr/Basque St. Jean De Luz, Fr.
75 Matera B 6′ 170 30 American Milford, CT
77 Alvarez B 5′11′′ 175 31 Basque Markina, Sp.
80 Guisasola B 6′0′′ 190 27 Basque Echebarria, Sp.
81 Wayne B 6′0′′ 185 24 American Portsmouth, RI
84 Arruti B 6′0′′ 175 28 Basque Mutriku, Sp.
85 Edward B 6′6′′ 195 28 American Trumbull, CT
86 Richard B 6′ 165 30 Basque Milford, CT
88 Raul B 5′10′′ 180 31 Basque Mutriku, Sp.
89 Baronio B 5′10′′ 170 25 Fr/Basque Anglet, Fr.
91 Jorge B 5′9′′ 190 32 Basque Markina, Sp.
92 Badiola B 5′11′′ 210 38 Basque Ondarroa, Sp.
21
P1: GGL
CB386-02 CB386-Skiena June 8, 2001 17:7 Char Count= 0
CALCULATED BETS
Alfonso with the rebote at Milford.
given probability distribution. This section is the only portion of this bookin which we will ignore the numbers and look at the people who havestories to tell.
Just as with soccer players, it is traditional for jai alai players (or pelotaris)to adopt a one-word player name such as Pele. Many players use theiractual first or last name. The Basques often use shortened versions oftheir last names, which can approach 20 letters in their full glory. Otherplayers choose their mother’s maiden name, while some take the name oftheir home town. Brothers or children of established players often ap-pend a number to their mentor’s name becoming, say, Javier II. Naturally,players prefer the fans to call them by name rather than uniform color ornumber.
There are stars in jai alai as there are in every sport. Many old timersconsider Erdorza Menor to be the best player of all time. Perhaps the bestAmerican player was Joey Cornblit, known as Joey, who was a star for manyyears beginning in the early 1970s. Capturing the international essence of
22
P1: GGL
CB386-02 CB386-Skiena June 8, 2001 17:7 Char Count= 0
WHAT IS JAI ALAI?
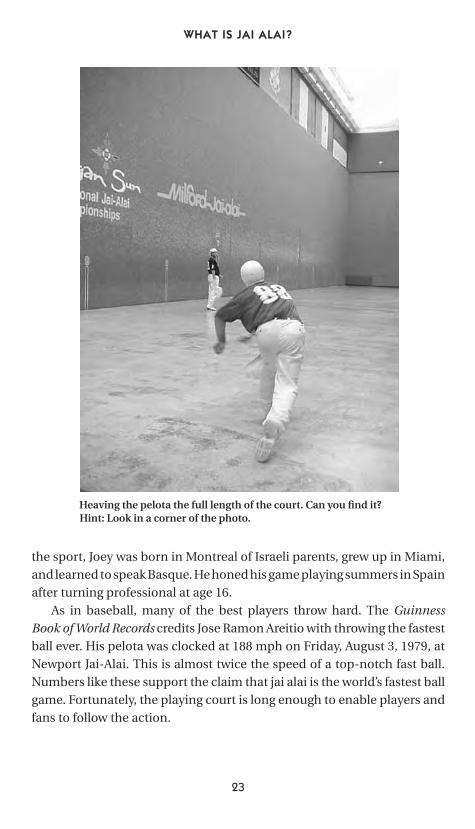
Heaving the pelota the full length of the court. Can you find it?Hint: Look in a corner of the photo.
the sport, Joey was born in Montreal of Israeli parents, grew up in Miami,and learned to speak Basque. He honed his game playing summers in Spainafter turning professional at age 16.
As in baseball, many of the best players throw hard. The GuinnessBook of World Records credits Jose Ramon Areitio with throwing the fastestball ever. His pelota was clocked at 188 mph on Friday, August 3, 1979, atNewport Jai-Alai. This is almost twice the speed of a top-notch fast ball.Numbers like these support the claim that jai alai is the world’s fastest ballgame. Fortunately, the playing court is long enough to enable players andfans to follow the action.
23

P1: GGL
CB386-02 CB386-Skiena June 8, 2001 17:7 Char Count= 0
CALCULATED BETS
Still the game is fast and dangerous. Since the 1920s at least four playershave been killed by a jai alai ball. The only U.S. fatality occurred duringthe early 1930s at the old Biscayne fronton when the frontcourter Ramoswas struck in the back of the head by his partner. He died a few days later.In 1967, a champion player named Orbea was hit in the head, and he layin a coma for weeks. Ultimately he recovered, eventually becoming theplayer-manager at Dania and Milford jai alai. Still, this incident forced theintroduction of helmets because the traditional Basque head gear (red orblue berets) didn’t do much to stop a pelota. Fortunately, there have beenfew instances of serious head injuries ever since.
Legend recounts at least one instance of the pelota being used for self-defense. Perkain was a champion player who fled to Spain to escape theguillotine during the French Revolution. Still, he could not resist returningto France to defend his title against a French challenger. When threat-ened with arrest, he succeeded in making his escape by beaning the lawenforcement official with the ball. Chula!
Jai alai players come in all shapes and sizes. The players on the 1998Milford roster ranged in height from 5 feet 6 inches to 6 feet 3 inches andin weight from 140 to 220 pounds. Frontcourt players are typically shorterand quicker, for they must react to balls coming at them directly off thefrontwall. Backcourt players must be stronger and more acrobatic to en-able them to dive for odd bounces yet recover to toss the ball the lengthof a football field in one smooth motion. It is not that unusual to see play-ers sporting substantial bellies, but appearances can be deceiving. Theseare highly skilled, conditioned athletes. According to pedometer studies,each player runs about one mile per game, and each player typically ap-pears in four to six games per night, five nights per week. As in tennis, theplayers must be versatile enough to play both offense and defense. Thesport is not as easy as it looks. Babe Ruth once tried a few shots, failingeven to hit the frontwall before he concluded that the cesta was “not myracket.”
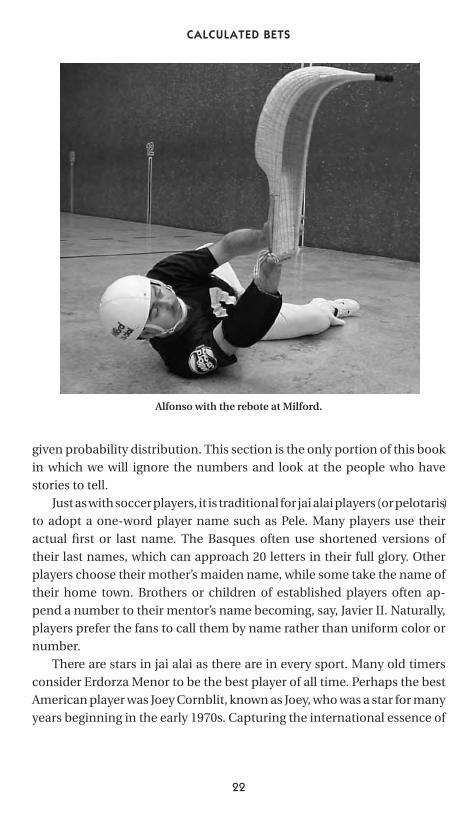
Pelotaris can have long careers. Three of the members of the 1998Milford roster (including Alfonso, shown in the figure on the page 22) haveplayed at Milford since at least 1982. As in baseball, professional playersrange in age from less than 20 to over 40. Both youth and experience havetheir advantages on the court.
Not all players have such long careers, of course. I recently read an arti-cle in The Jewish Week about the Barry sisters, famous stars of the Yiddish
24
P1: GGL
CB386-02 CB386-Skiena June 8, 2001 17:7 Char Count= 0
WHAT IS JAI ALAI?
stage. The granddaughter of Claire Barry, one of the sisters, recently mar-ried a professional jai alai player named Bryan Robbins. This newspaperaccount identifies Bryan as a “nice Jewish boy” and notes approvingly thathe has ended his jai alai career to become a medical student.
The open wall of the court results in an asymmetry that makes itvery undesirable to have the cesta on the left hand. Therefore, all pro-fessionals today are right-handed, or at least use that hand for playingjai alai. There have been exceptions, however. Marco de Villabona man-aged to be a competitive player after losing his right arm. A nineteenth-century player named Chiquito de Eibar was such a dominant player thathe was sometimes required to play with the basket on his left hand as ahandicap.
Jai alai is a male sport, although a few women have played the game onan amateur level. Perhaps the best-known amateur player was KatherineHerrington back in the 1940s, who went on to write a book on the sportafter playing her last exhibition at Saint-Jean-de-Luz, France, in 1971. Thelegendary Tita of Cambo, a French Basque, was reputedly so strong thather serves damaged stone walls.
BETTING ON JAI ALAI
Much of the excitement of attending a jai alai match comes from be-ing able to bet on your favorite player or outcome. Indeed, jai alai hasbeen called “a lottery with seats.” Each fronton supports a variety of dif-ferent types of bets, some of which are fairly exotic, but the most pop-ular bets are listed below. These terms should be familiar to anyone ac-quainted with horse racing, and we will use them throughout the rest of thebook.
■ Win – You bet that your team (or player) will win the game. There areeight possible win bets at a standard fronton.
■ Place – You bet that your team (or player) will finish either first or secondin the game. You will receive the same payoff regardless of whether yourteam is first or second. This is a less risky bet than picking a team towin, but the payoff is usually less as well. There are eight possible placebets at a standard fronton.
■ Show – You bet that your team (or player) will finish either first,second, or third. This is the least risky and hence lowest-paying wager
25
P1: GGL
CB386-02 CB386-Skiena June 8, 2001 17:7 Char Count= 0
CALCULATED BETS
available at most frontons. There are eight possible show bets at astandard fronton.
■ Quiniela – You pick two teams to finish first and second. The order inwhich your two teams finish is irrelevant – so long as they finish 1 and2 you receive the quiniela price. Quiniela comes from the Basque wordfor ‘twin,’ but this type of bet has spread beyond jai alai to other pari-mutuel sports as well. Personally, I find the quiniela bet to be the singlemost exciting choice for the spectator because it seems one always hasa chance to win at some point in the match. There are (8 × 7)/2 = 28possible quiniela bets at a standard fronton.
■ Exacta or Perfecta – You pick two teams to finish first and second in thatgiven order. If you pick a 2–6 exacta, it means that 2 must win and 6must come in second. In olden times, this used to be called a “correcta”bet. There are (8 × 7) = 56 possible exacta bets at a standard fronton,which is twice that of the quiniela.
■ Trifecta – You pick the three teams (or players) that finish first, second,and third in that exact order. If you play a 2–5–3 trifecta, then 2 mustwin, 5 must finish second (place), and 3 must come in third (show).There are 8 × 7 × 6 = 336 possible trifecta bets at a standard fronton.Trifectas are the riskiest conventional bet, but the one that typicallypays the highest returns.
Different frontons operate under slightly different betting rules. Oneaspect that varies is the size of the minimum bet allowed. Dania Jai-Alaicurrently has a $2.00 minimum bet, whereas Milford has a $3.00 minimumbet. Frontons tend not to have maximum bet limits because those areimposed by common sense. As will be discussed in Chapter 6, jai alai isa pari-mutuel sport, and thus you are trying to win money from otherpeople, not from the house. No matter how much you invest, you can’t winmore money than other people have bet. We will discuss this issue moredeeply later on, but as a rule of thumb there is probably from $5,000 to$15,000 bet on any given jai alai match.
Any bettor is free to make any combination of these types of bets onany given match. Indeed, frontons provide certain types of aggregate betsas a convenience to their customers.
■ Boxing – Betting all possible combinations of a given subset of numbers.For example, a 1–2–3 trifecta box bets on all six possible trifectas, which
26
P1: GGL
CB386-02 CB386-Skiena June 8, 2001 17:7 Char Count= 0
WHAT IS JAI ALAI?
can be built using those three numbers: 1–2–3, 1–3–2, 2–1–3, 2–3–1, 3–1–2, and 3–2–1. Ordering a box can simply be a convenience, but certainfrontons allow one to bet a trifecta box at a cost that works out to lessthan the minimum bet per combination. Indeed, we will exploit thisfreedom with our own betting strategy.
■ Wheeling – Betting a fixed set of numbers with all other numbersused for the remaining slots. For example, a 1–2 trifecta wheel de-fines bets on the following six trifectas: 1–2–3, 1–2–4, 1–2–5, 1–2–6,1–2–7, and 1–2–8. Certain venues presumably allow one to bet a tri-fecta wheel at a cost that works out to less than the minimum bet percombination.
Even more exotic bets, such as the Daily Double or Pick-6 (select thewinners of two or six given matches), are becoming more popular be-cause of their potentially enormous payoffs, but we won’t discuss themany further.
The Spectacular Seven Scoring SystemThis book reports our attempt to model the outcome of jai alai matches,not horse racing or football or any other sport. The critical aspect of jai alaithat makes it suitable for our kind of attack is its unique scoring system,which is unlike that of any other sport I am aware of. This scoring systemhas interesting mathematical properties that just beg the techno-geek totry to exploit it. For this reason, it is important to explain exactly howscoring in jai alai works.
As a pari-mutuel sport, jai alai has evolved to permit more than twoplayers in a match. Typically, eight players participate in any given match.Let’s name them 1, 2, 3, . . . , 8 to reflect their position in the original orderof play. Every point is a battle between only two players, with the activeby pair determine by their positions in a first-in, first-out (FIFO) queue.Initially, player 1 goes up against player 2. The loser of the point goes tothe end of the queue, and the winner stays on to play the fellow at thefront of the line. The first player to total (typically) seven points is declaredthe winner of the match. Because seven is exactly one point less than thenumber of players, this ensures that everyone gets at least one chancein every match. Various tiebreaking strategies are used to determine theplace and show positions.
27
P1: GGL
CB386-02 CB386-Skiena June 8, 2001 17:7 Char Count= 0
CALCULATED BETS
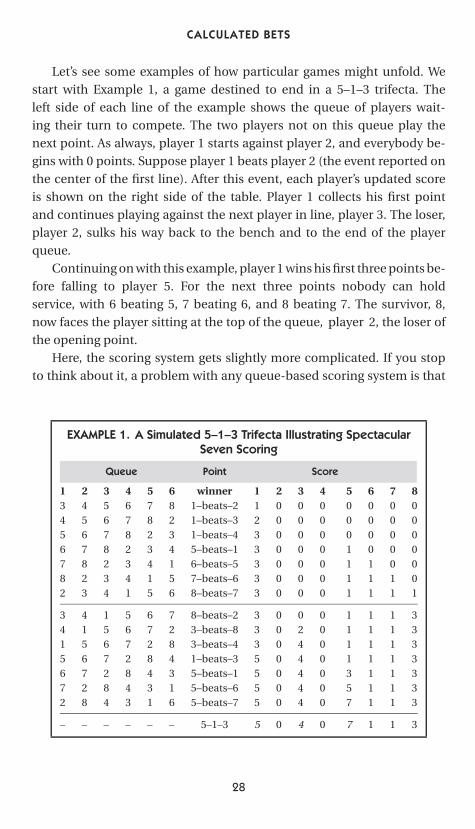
Let’s see some examples of how particular games might unfold. Westart with Example 1, a game destined to end in a 5–1–3 trifecta. Theleft side of each line of the example shows the queue of players wait-ing their turn to compete. The two players not on this queue play thenext point. As always, player 1 starts against player 2, and everybody be-gins with 0 points. Suppose player 1 beats player 2 (the event reported onthe center of the first line). After this event, each player’s updated scoreis shown on the right side of the table. Player 1 collects his first pointand continues playing against the next player in line, player 3. The loser,player 2, sulks his way back to the bench and to the end of the playerqueue.
Continuing on with this example, player 1 wins his first three points be-fore falling to player 5. For the next three points nobody can holdservice, with 6 beating 5, 7 beating 6, and 8 beating 7. The survivor, 8,now faces the player sitting at the top of the queue, player 2, the loser ofthe opening point.
Here, the scoring system gets slightly more complicated. If you stopto think about it, a problem with any queue-based scoring system is that
EXAMPLE 1. A Simulated 5–1–3 Trifecta Illustrating SpectacularSeven Scoring
Queue Point Score
1 2 3 4 5 6 winner 1 2 3 4 5 6 7 83 4 5 6 7 8 1–beats–2 1 0 0 0 0 0 0 04 5 6 7 8 2 1–beats–3 2 0 0 0 0 0 0 05 6 7 8 2 3 1–beats–4 3 0 0 0 0 0 0 06 7 8 2 3 4 5–beats–1 3 0 0 0 1 0 0 07 8 2 3 4 1 6–beats–5 3 0 0 0 1 1 0 08 2 3 4 1 5 7–beats–6 3 0 0 0 1 1 1 02 3 4 1 5 6 8–beats–7 3 0 0 0 1 1 1 1
3 4 1 5 6 7 8–beats–2 3 0 0 0 1 1 1 34 1 5 6 7 2 3–beats–8 3 0 2 0 1 1 1 31 5 6 7 2 8 3–beats–4 3 0 4 0 1 1 1 35 6 7 2 8 4 1–beats–3 5 0 4 0 1 1 1 36 7 2 8 4 3 5–beats–1 5 0 4 0 3 1 1 37 2 8 4 3 1 5–beats–6 5 0 4 0 5 1 1 32 8 4 3 1 6 5–beats–7 5 0 4 0 7 1 1 3
– – – – – – 5–1–3 5 0 4 0 7 1 1 3
28
P1: GGL
CB386-02 CB386-Skiena June 8, 2001 17:7 Char Count= 0
WHAT IS JAI ALAI?
the players whose initial post positions are at the bottom of the queuestart out at a serious disadvantage because the earlier players have moreopportunities to collect points. In order to reduce the disadvantage of latepost positions, the Spectacular Seven scoring system increases the rewardfor each winning volley after the seventh physical point from one to twopoints.
Our illustrative game is now at the midgame division line. Player 8 goesagainst player 2 and scores on a well-placed chic-chac. After winning theprevious point, player 8 had a score of 1. Because the contest against 2was the eighth physical point, it counts twice as much as before, and thusthe total score for player 8 goes from 1 to 3. Player 3 comes off the queue towin the next two points, giving him a score of 2 × 2 = 4. Player 1, the winnerof the first three points, now steps forward and dethrones the currentleader, giving him a total score of five points. Because the first player to getto seven points is the winner, player 1 needs only the next point for victory(remember it counts for 2). But number 5 is alive and knocks player 1 tothe end of the line. Now with a total of three points, player 5 continueson to beat his next two opponents, giving him a total of seven points andthe match. Player 1 (with five points) and player 3 (with four points) standalone for place and show, resulting in a 5–1–3 trifecta.
We have now seen two aspects of the Spectacular Seven scoringsystem. First, it is ruthless. By losing a single volley, the leading playercan be sent to the end of the line and may never get another chance toplay. Second, point doubling improves the chances for players at the bot-tom of the queue, particularly player 8. Players 1 or 2 would have to beattheir first seven opponents to win without ever going back to the queue,whereas player 8 only has to win his first four volleys (the first of whichcounts for 1 and the last three of which count for two points each). Becauseit is rare for any player to win seven in a row, the early players are penalized,and the system is supposed to even out.
The Spectacular Seven scoring system was introduced in the UnitedStates in the 1970s to speed up the game and add more excitement forbettors. Most games last from 8 to 14 minutes, allowing for 15 matches anight with enough time to wager in between matches. The ratio of action-to-waiting is much better in jai alai than horse racing because each racelasts only 2 or 3 minutes. The Spectacular Seven scoring system apparentlyemerged from a research project at the University of Miami, meaning thatI have not been the first academic to be seduced by the game.
29
P1: GGL
CB386-02 CB386-Skiena June 8, 2001 17:7 Char Count= 0
CALCULATED BETS
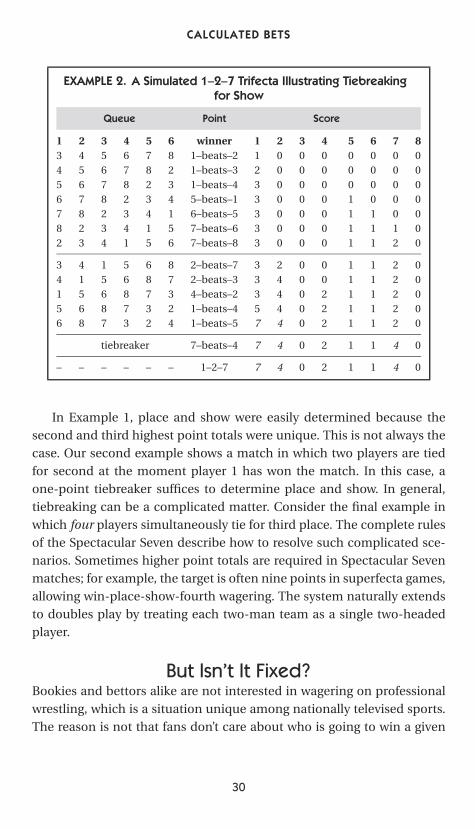
EXAMPLE 2. A Simulated 1–2–7 Trifecta Illustrating Tiebreakingfor Show
Queue Point Score
1 2 3 4 5 6 winner 1 2 3 4 5 6 7 83 4 5 6 7 8 1–beats–2 1 0 0 0 0 0 0 04 5 6 7 8 2 1–beats–3 2 0 0 0 0 0 0 05 6 7 8 2 3 1–beats–4 3 0 0 0 0 0 0 06 7 8 2 3 4 5–beats–1 3 0 0 0 1 0 0 07 8 2 3 4 1 6–beats–5 3 0 0 0 1 1 0 08 2 3 4 1 5 7–beats–6 3 0 0 0 1 1 1 02 3 4 1 5 6 7–beats–8 3 0 0 0 1 1 2 0
3 4 1 5 6 8 2–beats–7 3 2 0 0 1 1 2 04 1 5 6 8 7 2–beats–3 3 4 0 0 1 1 2 01 5 6 8 7 3 4–beats–2 3 4 0 2 1 1 2 05 6 8 7 3 2 1–beats–4 5 4 0 2 1 1 2 06 8 7 3 2 4 1–beats–5 7 4 0 2 1 1 2 0
tiebreaker 7–beats–4 7 4 0 2 1 1 4 0
– – – – – – 1–2–7 7 4 0 2 1 1 4 0
In Example 1, place and show were easily determined because thesecond and third highest point totals were unique. This is not always thecase. Our second example shows a match in which two players are tiedfor second at the moment player 1 has won the match. In this case, aone-point tiebreaker suffices to determine place and show. In general,tiebreaking can be a complicated matter. Consider the final example inwhich four players simultaneously tie for third place. The complete rulesof the Spectacular Seven describe how to resolve such complicated sce-narios. Sometimes higher point totals are required in Spectacular Sevenmatches; for example, the target is often nine points in superfecta games,allowing win-place-show-fourth wagering. The system naturally extendsto doubles play by treating each two-man team as a single two-headedplayer.
But Isn’t It Fixed?Bookies and bettors alike are not interested in wagering on professionalwrestling, which is a situation unique among nationally televised sports.The reason is not that fans don’t care about who is going to win a given
30
P1: GGL
CB386-02 CB386-Skiena June 8, 2001 17:7 Char Count= 0
WHAT IS JAI ALAI?
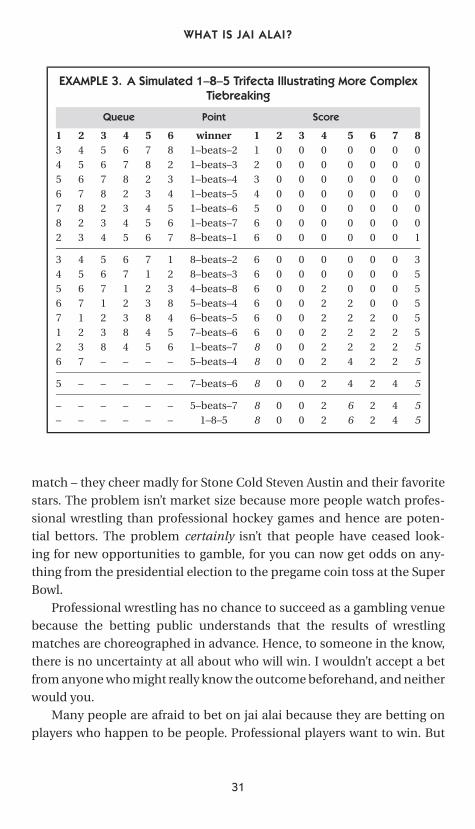
EXAMPLE 3. A Simulated 1–8–5 Trifecta Illustrating More ComplexTiebreaking
Queue Point Score
1 2 3 4 5 6 winner 1 2 3 4 5 6 7 83 4 5 6 7 8 1–beats–2 1 0 0 0 0 0 0 04 5 6 7 8 2 1–beats–3 2 0 0 0 0 0 0 05 6 7 8 2 3 1–beats–4 3 0 0 0 0 0 0 06 7 8 2 3 4 1–beats–5 4 0 0 0 0 0 0 07 8 2 3 4 5 1–beats–6 5 0 0 0 0 0 0 08 2 3 4 5 6 1–beats–7 6 0 0 0 0 0 0 02 3 4 5 6 7 8–beats–1 6 0 0 0 0 0 0 1
3 4 5 6 7 1 8–beats–2 6 0 0 0 0 0 0 34 5 6 7 1 2 8–beats–3 6 0 0 0 0 0 0 55 6 7 1 2 3 4–beats–8 6 0 0 2 0 0 0 56 7 1 2 3 8 5–beats–4 6 0 0 2 2 0 0 57 1 2 3 8 4 6–beats–5 6 0 0 2 2 2 0 51 2 3 8 4 5 7–beats–6 6 0 0 2 2 2 2 52 3 8 4 5 6 1–beats–7 8 0 0 2 2 2 2 56 7 – – – – 5–beats–4 8 0 0 2 4 2 2 5
5 – – – – – 7–beats–6 8 0 0 2 4 2 4 5
– – – – – – 5–beats–7 8 0 0 2 6 2 4 5– – – – – – 1–8–5 8 0 0 2 6 2 4 5
match – they cheer madly for Stone Cold Steven Austin and their favoritestars. The problem isn’t market size because more people watch profes-sional wrestling than professional hockey games and hence are poten-tial bettors. The problem certainly isn’t that people have ceased look-ing for new opportunities to gamble, for you can now get odds on any-thing from the presidential election to the pregame coin toss at the SuperBowl.
Professional wrestling has no chance to succeed as a gambling venuebecause the betting public understands that the results of wrestlingmatches are choreographed in advance. Hence, to someone in the know,there is no uncertainty at all about who will win. I wouldn’t accept a betfrom anyone who might really know the outcome beforehand, and neitherwould you.
Many people are afraid to bet on jai alai because they are betting onplayers who happen to be people. Professional players want to win. But
31
P1: GGL
CB386-02 CB386-Skiena June 8, 2001 17:7 Char Count= 0
CALCULATED BETS
give them sufficient financial incentive to lose, and they will lose. In horseracing, you can be pretty sure that the horse did not bet on the race, butsuch confidence seems misplaced in jai alai.2
Obviously, the frontons themselves have a strong incentive to avoidbetting scandals. Anything that scares away potential bettors is a funda-mental threat to their business. Every fronton pays players both a fixedsalary and a bonus for each game they win, and thus they have incentiveto play hard and win. The frontons have strong rules against match fixing,and any player not on the up-and-up will become persona non grata atevery fronton in the world. Players at a top fronton like Milford earn inthe ballpark of $50,000 over the course of an 8-month season (for starsthe earnings go into six figures), and thus they do have incentive to playfairly.
In the course of my research for this book, I have uncovered only lim-ited discussions of crooked jai alai betting. Nasty things apparently oc-curred in the United States in the late 1970s, which no one likes to talkabout today, but several Florida and California state documents from the1950s and 1960s I studied stress that the sport had no whiff of scandalup to that point. They credited this to a strong players union and theclose-knit structure of the Basque community, which polices its own.It is hard for an outsider to fix a game with a player who speaks onlyBasque.
The one game-fixing scandal I have seen documented occurred inFlorida, apparently during the strike years, when underskilled and unded-icated scab players roamed the court. Groups of three or four players permatch were bribed by the fixer to play dead, who then bought multiplequiniela boxes covering all pairs of honest players. The betting volumerequired to turn a profit on the deal was also high enough to catch theattention of the fronton. Eventually, it was used to help convict the headfixer in criminal court.
The nature of jai alai particularly lends itself to suspicions of fixing.Players have to catch a rock-hard ball hurled at 150 miles per hour usingan outsized basket strapped to their arm. Often, a seemingly catchable ballwill dribble out of a player’s cesta, and immediately cries of “fix” will comefrom bettors who have invested on this player’s behalf. But let’s be fair. Thewidth of the cesta in the area where the ball enters is only 3 to 3.5 inches,
2 Of course, one may be concerned about the jockey’s possible investment strategy.
32
P1: GGL
CB386-02 CB386-Skiena June 8, 2001 17:7 Char Count= 0
WHAT IS JAI ALAI?
whereas the diameter of the ball is almost 2 inches. This leaves only aninch or so as the margin of error, which is not much – especially when theball is curving or wobbling.
The fan’s fear of cheating has some interesting consequences. The pub-lished program listing the schedule for each match always includes eachplayer’s birthdate, even though some of the players are quite long in thetooth. Why? I’ve heard that suspicious fans think that Joey’s fellow playerswill, as a present, let him win matches on his birthday, and these bettorswant to share in the celebration.
All this said, we don’t worry about fixes in our betting system and won’tconcern ourselves with them any more in this book. Why? That our sys-tem predicts the outcome of jai alai matches much better than chancetells us that most games are not fixed. Even the most cynical bettor willadmit that performing a successful fix requires a certain amount of en-ergy, investment, and risk. These considerations dictate that only a smallfraction of games will be fixed. For a system like ours, which relies onmaking lots of small bets instead of a few big ones, fixes can be written offas a cost of doing business. Spend too much time worrying about fixes andyou turn into a conspiracy theorist and then a nut case. I have the serenityto accept the things I cannot change.
Other Betting SystemsBetting systems have existed for as long as gambling has. A betting system iseither bogus or clever, depending upon whether it is based on a sufficientlydeep understanding of the given game so that there is some method to themadness.
Gambling systems, even bogus ones, are always interesting to hearabout because they say something about how people perceive (or misper-ceive) probability. My favorite bogus systems include the following:
■ Doubling up in casino gambling – Consider the following strategy forgambling in roulette. Walk into the casino and bet a dollar on black. Ifit wins, boldly pocket your earnings. If not, bet $1 again on black. If itwins, you are back to where you started. If it loses, bet $2 on black torecoup your losses. After each loss, keep doubling up. Inevitably, youare going to win sometime, and at that point you are all caught up. Nowyou can start again from the beginning. You can’t ever lose money withthis scheme, can you?
33
P1: GGL
CB386-02 CB386-Skiena June 8, 2001 17:7 Char Count= 0
CALCULATED BETS
What’s the problem? Nothing really, so long as you have an infinitelydeep pocket and are playing on a table without a betting limit. If yourtable has a betting limit or you are not able to print money, you willeventually reach a point at which the house will not let you bet as muchas you need in order to play by this system. At this point you will havebeen completely wiped out.
This doubling or Martingale system offers you a high probabil-ity of small returns in exchange for a small possibility of becominghomeless. Casinos are more than happy to let you take this chance.After all, Donald Trump has a much deeper pocket than either you orI have.
■ The O’Hare straddle – An alternate doubling scheme is as follows: Bor-row a large amount of cash on a short-term basis. Set aside enoughmoney for a ticket on the next plane to South America. Bet the reston one spin of the roulette wheel at even money. If you win,return the principal and retire on the rest. Otherwise, use the planeticket.
Mathematically, the key to making this work is being bold enoughto wager all the money on a single bet rather than making multiplesmaller bets. The casino extracts a tax on each “even-money” wagervia the 0 and 00 slots on the wheel. You pay more tax each time you re-bet the winnings, thus lowering your chances of a big killing. However,the most likely result of playing the O’Hare straddle will be a suddenneed to increase your fluency in Spanish.
■ Collecting statistics on lottery numbers – Some people carefully chartthe frequency with which lottery numbers have come in recently andthen play the numbers that are either “due” or “hot.” Unfortunately,the notion of a number “being due” or “being hot” violates all laws ofprobability (technically the assumption that the numbers arise fromindependent Bernoulli trials). Lottery numbers are selected by draw-ing numbered balls from a jar, or some equivalent method. Providedthat the balls have been thoroughly mixed up, there is no way a ballcan “know” that it has not been selected for a while and hence is due.Similarly, the notion of a number’s “being hot” makes sense only whenthe numbers have been drawn according to a nonuniform randomnumber generator.
As we will see, poor random number generators certainly exist;I will talk more about this in Chapter 3. There is also historical
34
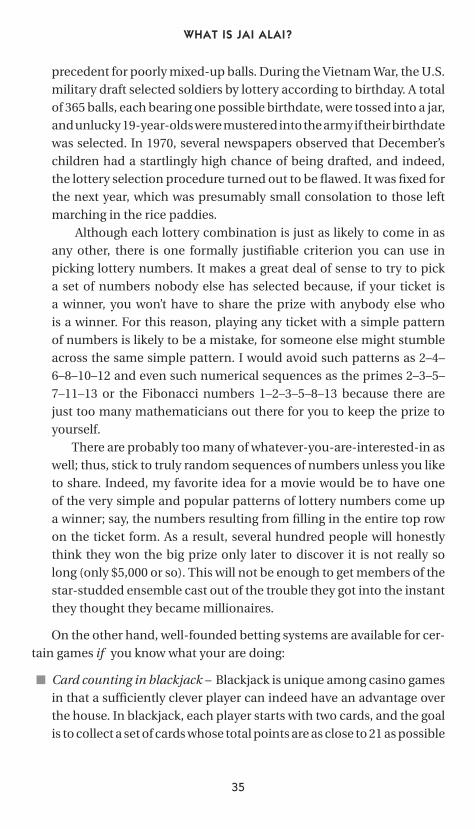
P1: GGL
CB386-02 CB386-Skiena June 8, 2001 17:7 Char Count= 0
WHAT IS JAI ALAI?
precedent for poorly mixed-up balls. During the Vietnam War, the U.S.military draft selected soldiers by lottery according to birthday. A totalof 365 balls, each bearing one possible birthdate, were tossed into a jar,and unlucky 19-year-olds were mustered into the army if their birthdatewas selected. In 1970, several newspapers observed that December’schildren had a startlingly high chance of being drafted, and indeed,the lottery selection procedure turned out to be flawed. It was fixed forthe next year, which was presumably small consolation to those leftmarching in the rice paddies.
Although each lottery combination is just as likely to come in asany other, there is one formally justifiable criterion you can use inpicking lottery numbers. It makes a great deal of sense to try to picka set of numbers nobody else has selected because, if your ticket isa winner, you won’t have to share the prize with anybody else whois a winner. For this reason, playing any ticket with a simple patternof numbers is likely to be a mistake, for someone else might stumbleacross the same simple pattern. I would avoid such patterns as 2–4–6–8–10–12 and even such numerical sequences as the primes 2–3–5–7–11–13 or the Fibonacci numbers 1–2–3–5–8–13 because there arejust too many mathematicians out there for you to keep the prize toyourself.
There are probably too many of whatever-you-are-interested-in aswell; thus, stick to truly random sequences of numbers unless you liketo share. Indeed, my favorite idea for a movie would be to have oneof the very simple and popular patterns of lottery numbers come upa winner; say, the numbers resulting from filling in the entire top rowon the ticket form. As a result, several hundred people will honestlythink they won the big prize only later to discover it is not really solong (only $5,000 or so). This will not be enough to get members of thestar-studded ensemble cast out of the trouble they got into the instantthey thought they became millionaires.
On the other hand, well-founded betting systems are available for cer-tain games if you know what your are doing:
■ Card counting in blackjack – Blackjack is unique among casino gamesin that a sufficiently clever player can indeed have an advantage overthe house. In blackjack, each player starts with two cards, and the goalis to collect a set of cards whose total points are as close to 21 as possible
35
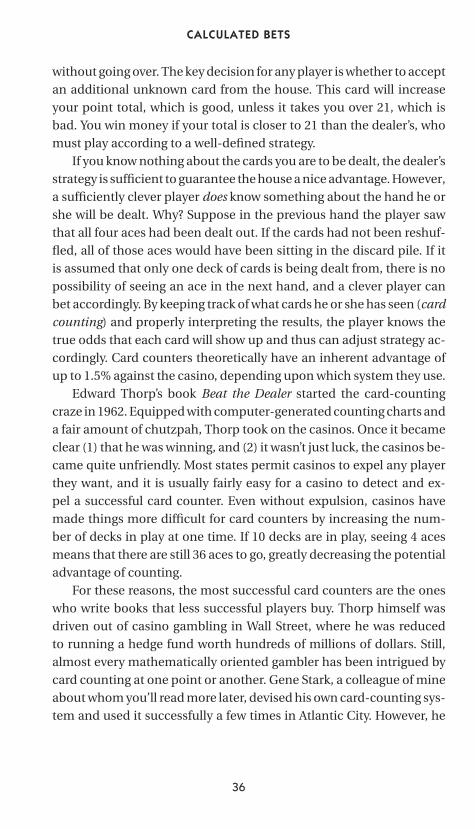
P1: GGL
CB386-02 CB386-Skiena June 8, 2001 17:7 Char Count= 0
CALCULATED BETS
without going over. The key decision for any player is whether to acceptan additional unknown card from the house. This card will increaseyour point total, which is good, unless it takes you over 21, which isbad. You win money if your total is closer to 21 than the dealer’s, whomust play according to a well-defined strategy.
If you know nothing about the cards you are to be dealt, the dealer’sstrategy is sufficient to guarantee the house a nice advantage. However,a sufficiently clever player does know something about the hand he orshe will be dealt. Why? Suppose in the previous hand the player sawthat all four aces had been dealt out. If the cards had not been reshuf-fled, all of those aces would have been sitting in the discard pile. If itis assumed that only one deck of cards is being dealt from, there is nopossibility of seeing an ace in the next hand, and a clever player canbet accordingly. By keeping track of what cards he or she has seen (cardcounting) and properly interpreting the results, the player knows thetrue odds that each card will show up and thus can adjust strategy ac-cordingly. Card counters theoretically have an inherent advantage ofup to 1.5% against the casino, depending upon which system they use.
Edward Thorp’s book Beat the Dealer started the card-countingcraze in 1962. Equipped with computer-generated counting charts anda fair amount of chutzpah, Thorp took on the casinos. Once it becameclear (1) that he was winning, and (2) it wasn’t just luck, the casinos be-came quite unfriendly. Most states permit casinos to expel any playerthey want, and it is usually fairly easy for a casino to detect and ex-pel a successful card counter. Even without expulsion, casinos havemade things more difficult for card counters by increasing the num-ber of decks in play at one time. If 10 decks are in play, seeing 4 acesmeans that there are still 36 aces to go, greatly decreasing the potentialadvantage of counting.
For these reasons, the most successful card counters are the oneswho write books that less successful players buy. Thorp himself wasdriven out of casino gambling in Wall Street, where he was reducedto running a hedge fund worth hundreds of millions of dollars. Still,almost every mathematically oriented gambler has been intrigued bycard counting at one point or another. Gene Stark, a colleague of mineabout whom you’ll read more later, devised his own card-counting sys-tem and used it successfully a few times in Atlantic City. However, he
36
P1: GGL
CB386-02 CB386-Skiena June 8, 2001 17:7 Char Count= 0
WHAT IS JAI ALAI?
discovered that making significant money off a 1.5% advantage overthe house requires a large investment of either time or money. It isn’tany more fun making $5.50 an hour counting cards than it is tendinga cash register.
■ The eudaemonic pie – Physicists tend to be good at mathematics. A fewyears ago, the American Physical Society had its annual convention inLas Vegas, during which the combination conference hotel and casinotook a serious financial hit. The hotel rented out rooms to the confer-ence at below cost, planning to make the difference back and morefrom the gambling losses of conference goers. However, the physicistsjust would not gamble. They knew that the only way to win was not toplay the game.
But another group of physicists did once develop a sound way tobeat the game of roulette. A roulette wheel consists of two parts, a mov-ing inner wheel and a stationary outer wheel. To determine the next“random” number, the inner wheel is set spinning, and then the ballis sent rolling along the rim of the outer wheel. Things rattle aroundfor several seconds before the ball drops down into its slot, and peo-ple are allowed to bet over this interval. However, in theory, the win-ning number is preordained from the speed of the ball, the speedof the wheel, and the starting position of each. All you have to do ismeasure these quantities to sufficient accuracy and work through thephysics.
As reported in Thomas Bass’s entertaining book The EudaemonicPie, this team built a computer small enough to fit in the heel of a shoeand programmed in the necessary equations. Finger or toe presses atreference points on the wheel were used to enter the observed speed ofthe ball. It was necessary to conceal this computer carefully; otherwise,casinos would have been certain to ban the players the moment theystarted winning.
Did it work? Yes, although they never quite made the big score inroulette. Like Thorp, the principals behind this scheme were even-tually driven to Wall Street, building systems to bet on stocks andcommodities instead of following the bouncing ball. Their later ad-ventures are reported in the sequel, The Predictors.
■ Flooding large lottery pools – Lotteries in the United States keep get-ting bigger. The bigger a jackpot, the more that people want to play.
37
P1: GGL
CB386-02 CB386-Skiena June 8, 2001 17:7 Char Count= 0
CALCULATED BETS
Many states have switched to systems of accumulated pools in which,if no grand prize winner emerges in a given week, the money rolls overto supplement next week’s prize. The pool grows very large whenevera few weeks go by without a winner. Whenever the pool gets largeenough (say $100 million), it starts a betting frenzy that draws nationalattention.
The interesting aspect of large pools is that any wager, no matterhow small the probability of success, can yield positive expected re-turns given a sufficiently high payoff. Most state lotteries are obligatedto pay some fraction (say 50%) of all betting receipts back to the bet-tors. If nobody guesses right for a sufficiently long time, the potentialpayoff for a winning ticket can overcome the vanishingly small oddsof winning. For any lottery, there exists a pool size sufficient to en-sure a positive expected return if only a given number of tickets aresold.
But once it pays to buy one lottery ticket, then it pays to buy allof them. This has not escaped the attention of large syndicates thatplace bets totaling millions of dollars on all possible combinations,thus ensuring themselves a winning ticket.
State lottery agents frown on such betting syndicates, not becausethey lose money (the cost of the large pool has been paid by the lack ofwinners over the previous few weeks) but because printing millions oftickets ties up agents throughout the state and discourages the rest ofthe betting public. Still, these syndicates like a discouraged public. Theonly danger they face is other bettors who also pick the winning num-bers, for the pool must be shared with these other parties. Given anestimate of how many tickets will be bought by the public, this risk canbe accurately measured by the syndicate to determine whether to gofor it.
Syndicate betting has also occurred in jai alai in a big way. PalmBeach Jai-Alai ran an accumulated Pick-6 pool that paid off only if abettor correctly picked the winners of six designated matches. Thiswas quite a challenge because each two-dollar bet was an 86 = 262,144-to-1 shot for the jackpot.
On March 1, 1983, the pool stood at $551,332 after accumulatingover 147 nights. This amount was more than it would have cost tobuy one of every possible ticket. That day, an anonymous syndicate
38

P1: GGL
CB386-02 CB386-Skiena June 8, 2001 17:7 Char Count= 0
WHAT IS JAI ALAI?
invested an additional $524,288 to guarantee itself a large profit, butonly if it didn’t have to share. Only $21,956 was wagered on Pick 6 thatnight by other bettors, giving the syndicate an almost 96% chance ofkeeping the entire pot to itself, which were terrific odds in its favor.Indeed, only the syndicate held the winning combo of 4–7–7–6–2–1, aticket worth $790,662.20.
39
P1: FCH/FYX P2: FCH
CB386-03 CB386-Skiena June 8, 2001 17:10 Char Count= 0
CHAPTER THREE
MONTE CARLO ON THE TUNDRA
Several years passed from that carefree winter day when Pepe’s Green Cardled me to my first trifecta. I found myself in high school taking a course incomputer programming and got myself hooked. It was very empoweringto be able tell a machine what to do and have it do exactly what I asked.All I had to do was figure out what to ask it.
I Was a High School BookieDuring my sophomore year of high school, I got the idea of writing aprogram that would predict the outcome of professional football games.Frankly, I wasn’t too interested in football as a sport (I remain a baseballfan at heart), but I observed several of my classmates betting their lunchmoney on the outcome of the weekend football games. It seemed clear tome that writing a program that accurately predicted the outcome of foot-ball games could have significant value and would be a very cool thing todo besides.
In retrospect, the program I came up with now seems hopelessly crude.It first read in the statistics for teams x and y; stats such as the total numberof points scored this year, the total number of points allowed, and thenumber of games played so far. My program averaged the points scored byteam x and the points allowed by team y to predict the number of points
40
P1: FCH/FYX P2: FCH
CB386-03 CB386-Skiena June 8, 2001 17:10 Char Count= 0
MONTE CARLO ON THE TUNDRA
x would score against y.
Px = (points scored by team x) + (points allowed by team y )2 × (games played)
Py = [(points scored by team y) + (points allowed by team x)]2 × (games played)
For example, suppose the Cowboys were playing the Saints. The cham-pion Cowboys had scored 300 points and given up 200, whereas the peren-nial doormat Saints had scored 200 and given up 400 points, each teamhaving played 10 games. The formulas above would predict the Cowboys tobeat the Saints by a score of (300 + 400)/(2 × 10) = 35 to (200 + 200)/(2 ×10) = 20. I would then adjust these numbers up or down in response to15 other factors, such as yards for and against and home field advantage,round the numbers appropriately, and call what was left my predictedscore for the game.
This computer program, Clyde, was my first attempt to build a mathe-matical model of some aspect of the real world. This model had a certainamount of logic going for it. Good teams score more points than they allow,whereas bad teams allow more points than they score. If team x plays ateam y that has given up a lot of points, then x should score more pointsagainst y than it does against teams with better defenses. Similarly, themore points team x has scored against the rest of the league, the morepoints it is likely to score against y.
Of course, this very crude model couldn’t capture all aspects of footballreality. Suppose team x has been playing all stiffs thus far in the season,whereas team y has been playing the best teams in the league. Team ymight be a much better team than x even though its record so far is poor.This model also ignores any injuries a team is suffering from, whether theweather is hot or cold, and whether the team is hot or cold. It disregardsall the factors that make sports inherently unpredictable.
And yet, even such a simple model can do a reasonable job of pre-dicting the outcome of football games. If you compute the point aver-ages as above and give the home team an additional 3 points as a bonus,you will pick the winner of about 2/3 of all football games, whereas theeven cruder model of flipping a coin predicts only half the gamescorrectly.
41
P1: FCH/FYX P2: FCH
CB386-03 CB386-Skiena June 8, 2001 17:10 Char Count= 0
CALCULATED BETS
That was the first major lesson Clyde taught me:
☞ Even crude mathematical models can have real predictive power.
As an audacious 16-year-old, I wrote to our local newspaper, The NewBrunswick Home News, explaining that I had a computer program to pre-dict football games and offering them the exclusive opportunity to publishmy predictions each week. Remember that this was back in 1977, well be-fore personal computers had registered on the public consciousness. Inthose days, the idea of a high school kid actually using a computer hadconsiderable gee-whiz novelty value. To appreciate how much times havechanged, check out the article the paper published about Clyde and me.
I got the job. Clyde predicted the outcome of each game in the 1977 Na-tional Football League. It was very cool seeing my name in print each weekand monitoring the football scores each Sunday to see how we were doing.As I recall, Clyde and I finished the season with the seemingly impressiverecord of 135–70. Each week, my predictions would be compared againstthose of the newspaper’s sportswriters. As I recall, we all finished within afew games of each other, although most of the sportswriters finished withbetter records than the computer.
The Home News was so impressed by my work that they didn’t renewme the following season. However, for the 1978 season Clyde’s picks werepublished in the Philadelphia Inquirer, a much bigger newspaper. I didn’thave the column to myself, though. Instead, the Inquirer included meamong 10 amateur and professional prognosticators. Each week we hadto predict the outcomes of four games against the point spread.
The point spread in football is a way of handicapping stronger teamsfor betting purposes. Think back to the Cowboys and Saints football gamedescribed earlier. It would be impossible to find a bookie who would letyou bet on the Cowboys to win at even-money odds because any Saintsvictory required a miracle substantial enough to get canonized in the firstplace. Instead, the bookies would publish a point spread like Cowboys by14 points. If you bet on the Cowboys, they had to win by at least 14 pointsfor you to win the bet. The Saints could lose the game by 10 points andstill leave their betting fans cheering. The point spread is designed to makeeach game a 50–50 proposition and hence makes predicting the outcomeof games much harder.
Clyde and I didn’t do very well against the spread during the 1978National Football League season, and neither did most of the other
42
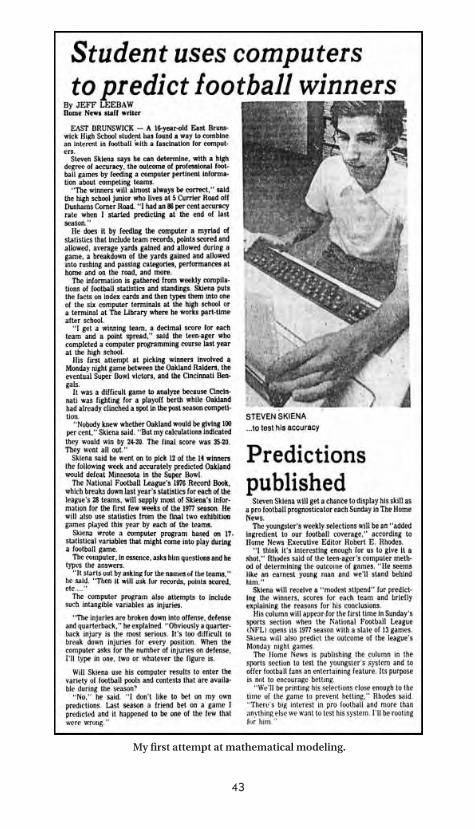
P1: FCH/FYX P2: FCH
CB386-03 CB386-Skiena June 8, 2001 17:10 Char Count= 0
My first attempt at mathematical modeling.
43
P1: FCH/FYX P2: FCH
CB386-03 CB386-Skiena June 8, 2001 17:10 Char Count= 0
CALCULATED BETS
Philadelphia Inquirer touts. We predicted only 46% of our games correctlyagainst the spread, which was a performance good (or bad) enough tofinish 7th out of the 10 published prognosticators. We did somewhat betteron the game we selected as our best bet of the week, finishing 12–8 and insecond place among the touts. Still, picking against the spread taught mea second major life lesson:
☞ Crude mathematical models do not have real predictive power whenthere is real money on the line.
Clyde finished his career with 4 years of picking the results of Universityof Virginia football games for our student newspaper, The Cavalier Daily.Our results were about the same as with the pros. We went 35–19–1, correcton the easy games and wrong on the hard ones.
Clyde’s most memorable moment at the University of Virginia camewhen I was hired to help tutor a member of the football team. Randy wasa linebacker, 6 feet 6 inches and 270 pounds. One day I asked him whathe thought of Clyde in the newspaper, not letting on that I was the manbehind the program. He assured me that the entire team felt Clyde didn’tknow bleep.
This taught me a third major life lesson:
☞ Never argue with a 6-foot 6-inch 270-pound linebacker.
Back to Jai AlaiEvery other winter or so our family migrated down to Florida for fun in thesun and a night at the fronton. Sometimes Pepe’s Green Card enabled usto break even for the night; other times it let us down. This mixed recordimpressed upon me the benefits of finding winners for ourselves.
The more jai alai I watched, the more it became apparent to me thatthe Spectacular Seven scoring system exerted a profound effect on theoutcome of jai alai matches. Even a cursory look at the statistics revealedthat certain positions were far easier to win from than others. It was simplynot the case that good teams would usually beat bad ones, because thearbitrarily chosen position from which you started in the queue made abig difference in how many chances you had to score the required points.If a good team got a bad starting position, its chances of winning might beless than that of a bad team in a good starting position. A good team in agood starting position had a real advantage; them that has, gets.
44
P1: FCH/FYX P2: FCH
CB386-03 CB386-Skiena June 8, 2001 17:10 Char Count= 0
MONTE CARLO ON THE TUNDRA
The Spectacular Seven scoring system means that life isn’t fair. Modernbusiness ethics teach us that, whenever you see an unfair situation, youshould exploit it for as much personal gain as possible.
How could I exploit the biases of the Spectacular Seven scoring system?I’d have to start by building a mathematical model of the situation, a sim-ulation of the series of events that unfold during each jai alai match. Thesimple ideas underlying my football program were simply not sufficientfor such a complex reality. However, I could get a handle on the situationusing the powerful technique of Monte Carlo simulation.
Monte Carlo SimulationsSimulations provide insight into complex problems. Simulation is used ineconomics, engineering, and the physical sciences because it is often im-possible to experiment on the real thing. Economists cannot play with theU.S. budget deficit and see how long it takes for the economy to collapse.Rather, they will make a computer model and study the effects of suchspending on it. The significance of the simulation results depends on theaccuracy of the model as well as how correctly the model has been turnedinto a computer program.
There are a wide variety of computer simulation techniques, but wewill employ a curious method known as Monte Carlo simulation. “MonteCarlo” should conjure up an image of a swank casino on the French Riviera,and hence seem particularly appropriate as a technique to model a formof gambling. However, this connection is even deeper because the wholeidea of Monte Carlo simulation is to mimic random games of chance.
Suppose we want to compute the odds of winning a particularly exoticbet in roulette, such as having the ball land in a prime-numbered slot(either 2, 3, 5, 7, 11, 13, 17, 19, 23, 29, or 31) three out of the next four timeswe spin the wheel. The most naive approach would be to watch a roulettewheel in action for a spell, keeping track of how often we win. If we watchedfor 1000 trials and won 91 times in this interval, the odds should be about1 in 10. To get a more accurate estimate, we could simply watch the gamefor a longer period.
Now suppose instead of watching a real roulette wheel in action we sim-ulate the random behavior of the wheel with a computer. We can conductthe same experiments in a computer program instead of a casino, and thefraction of simulated wins to simulated chances gives us the approximateodds – provided our roulette wheel simulation is accurate.
45
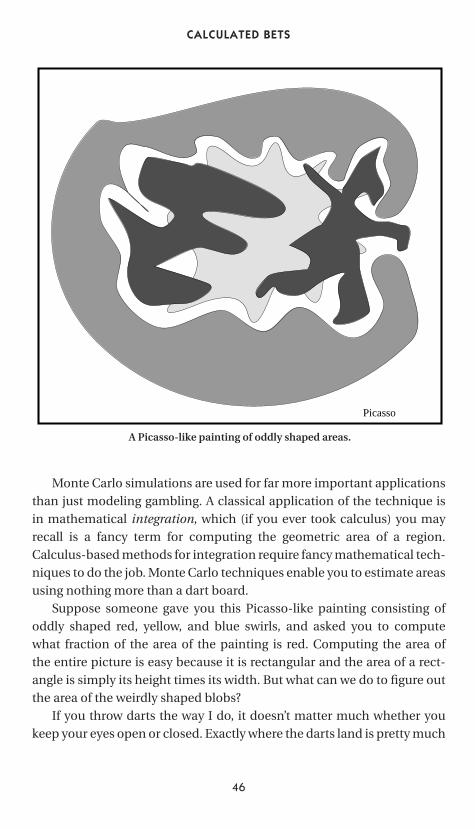
P1: FCH/FYX P2: FCH
CB386-03 CB386-Skiena June 8, 2001 17:10 Char Count= 0
CALCULATED BETS
Picasso
A Picasso-like painting of oddly shaped areas.
Monte Carlo simulations are used for far more important applicationsthan just modeling gambling. A classical application of the technique isin mathematical integration, which (if you ever took calculus) you mayrecall is a fancy term for computing the geometric area of a region.Calculus-based methods for integration require fancy mathematical tech-niques to do the job. Monte Carlo techniques enable you to estimate areasusing nothing more than a dart board.
Suppose someone gave you this Picasso-like painting consisting ofoddly shaped red, yellow, and blue swirls, and asked you to computewhat fraction of the area of the painting is red. Computing the area ofthe entire picture is easy because it is rectangular and the area of a rect-angle is simply its height times its width. But what can we do to figure outthe area of the weirdly shaped blobs?
If you throw darts the way I do, it doesn’t matter much whether youkeep your eyes open or closed. Exactly where the darts land is pretty much
46
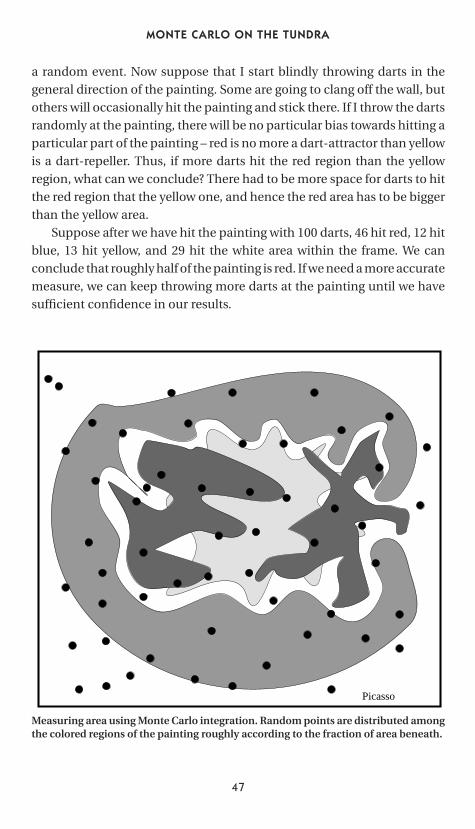
P1: FCH/FYX P2: FCH
CB386-03 CB386-Skiena June 8, 2001 17:10 Char Count= 0
MONTE CARLO ON THE TUNDRA
a random event. Now suppose that I start blindly throwing darts in thegeneral direction of the painting. Some are going to clang off the wall, butothers will occasionally hit the painting and stick there. If I throw the dartsrandomly at the painting, there will be no particular bias towards hitting aparticular part of the painting – red is no more a dart-attractor than yellowis a dart-repeller. Thus, if more darts hit the red region than the yellowregion, what can we conclude? There had to be more space for darts to hitthe red region that the yellow one, and hence the red area has to be biggerthan the yellow area.
Suppose after we have hit the painting with 100 darts, 46 hit red, 12 hitblue, 13 hit yellow, and 29 hit the white area within the frame. We canconclude that roughly half of the painting is red. If we need a more accuratemeasure, we can keep throwing more darts at the painting until we havesufficient confidence in our results.
Picasso
Measuring area using Monte Carlo integration. Random points are distributed amongthe colored regions of the painting roughly according to the fraction of area beneath.
47
P1: FCH/FYX P2: FCH
CB386-03 CB386-Skiena June 8, 2001 17:10 Char Count= 0
CALCULATED BETS
Of course, throwing real darts at a real Picasso painting would be an ex-pensive exercise. It would be much better to perform the entire experimentwith a computer. Suppose we scan in an image of the painting and ran-domly select points from this image. Each random point represents the tipof a virtual dart. By counting the number of selected points of each color,we can estimate the area of each region to as high a degree of accuracy aswe are willing to wait for.
I hope these examples have made the idea of Monte Carlo simulationclear. Basically, we must perform enough random trials on a computer toget a good estimate of what is likely to happen in real life. I will explainwhere the random numbers come from later. But first, I’ll show how tobuild a simulated jai alai match from random numbers.
Building the SimulationA simulation is a special type of mathematical model – one that aims toreplicate some form of real-world phenomenon instead of just predictingit. A simulation of a football game would attempt to “play” the game inquestion step-by-step to see what might happen. The simulated footballgame would start with a simulated kickoff and advance through a simu-lated set of downs, during which the simulated team would either score orgive up the simulated ball. After predicting what might happen on everysingle play in the simulated game, the program could produce a predictedfinal score as the outcome of the simulated game.
By contrast, my football-picking program Clyde was a statistical model,not a simulation. Clyde really knew almost nothing that was specific tofootball. Indeed, the basic technique of averaging the points for-and-against to get a score should work just as well to predict baseball andbasketball scores. The key to building an accurate statistical model is pick-ing the right statistical factors and weighing them appropriately.
Building an accurate football-game simulator would be an immenselychallenging task. The outcome of each play in football depends on manycomplicated factors, including the skill matchups between each of the11 sets of players, how tired or injured each of them are, the offensiveand defensive alignments of each team, the coach’s strategy, the gamesituation, and the current field conditions. Jai alai is, by contrast, a muchsimpler game to simulate.
What events in a jai alai match must we simulate? Each match startswith players 1 and 2 playing and the rest of the players waiting patiently in
48
P1: FCH/FYX P2: FCH
CB386-03 CB386-Skiena June 8, 2001 17:10 Char Count= 0
MONTE CARLO ON THE TUNDRA
line. All players start the game with scores of zero points each. Each pointin the match involves two players: one who will win and one who will lose.The loser will go to the end of the line, whereas the winner will add to hispoint total and await the next point unless he has accumulated enoughpoints to claim the match.
This sequence of events can be described by the following programflow structure, or algorithm:
Initialize the current players to 1 and 2.Initialize the queue of players to {3, 4, 5, 6, 7, 8}.Initialize the point total for each player to zero.
So long as the current winner has less than 7 points:Play a simulated point between the two current players.Add one (or if beyond the seventh point, two) to the
total of the simulated point winner.Put the simulated point loser at the end of the queue.Get the next player off the front of the queue.
End So long as.Identify the current point winner as the winner of the match.
The only step in this algorithm that needs more elaboration is that ofsimulating a point between two players. If the purpose of our simulation isto see how biases in the scoring system affect the outcome of the match, itmakes the most sense to consider the case in which all players are equallyskillful. To give every player a 50–50 chance of winning each point he isinvolved in, we can flip a simulated coin to determine who wins and wholoses.
Any reasonable computer programmer would be able to take a flowdescription such as this and turn it into a program in the language of hisor her choice. This algorithm describes how to simulate one particulargame, but by running it 1,000,000 times and keeping track of how ofteneach possible outcome occurs, we would get a pretty good idea of whathappens during a typical jai alai match.
Breaking TiesThe Spectacular Seven scoring system, as thus far described, uniquelydetermines a winner for every game. However, because of place and showbetting, a second- and third-place finisher must also be established.
49
P1: FCH/FYX P2: FCH
CB386-03 CB386-Skiena June 8, 2001 17:10 Char Count= 0
CALCULATED BETS
According to my simulation, ties occur in roughly one-third of all gamesplayed, and thus proper handling of these cases is essential.
It is very important to break ties under the same scoring system usedby the frontons themselves. To show how complicated these rules are, wepresent for your amusement the official state of Florida rules governingthe elimination games in jai alai:
1. After a winner has been declared, play-off rules to decide place,show and fourth positions vary according to the number of pointsscored by the participating players or teams, and shall be playedaccording to the players or teams rotation position (not post posi-tion), i.e., the order in which they were defeated.
2. In the case of a tie after a win position has been officially declared, itshall not be necessary, in order to determine place, show or fourthpositions, or all three for the players or teams to score the full game’snumber of points.
3. When there still remain five or seven players or teams, all of whichare tied without a point to their credit, the play-off shall be for a goalof one point less than the number of post positions represented inthe play-off.
4. When there still remain five or seven players or teams, all of whichare tied without a point to their credit, the play-off shall be contin-ued until the player or team reaches the number of points desig-nated for the game.
5. In case of two ties, after a Winner has been declared official, andthere are still two players or teams tied with the same number ofpoints, the place position shall be awarded to the player or teammaking the next point, and show position goes to the loser of saidpoint.In games where a fourth position is required, if:(a) Two ties remain after win and place have been determined, the
show position shall be awarded to the player or team making thenext point, and fourth position shall go to the loser of said point.
(b) Two ties remain after Win, Place and Show have been deter-mined, the Fourth position shall be awarded to the player orteam making the next point.
6. In case of three ties, after a Winner has been declared official, place,show and fourth positions shall be decided among the three playersor teams, with the same number of points, through elimination,according to rotating position. However, if after playing the firstplay-off point, any player’s or team’s score reaches the number ofpoints that the game calls for, said player or team shall immediately
50
P1: FCH/FYX P2: FCH
CB386-03 CB386-Skiena June 8, 2001 17:10 Char Count= 0
MONTE CARLO ON THE TUNDRA
be awarded the place, show or fourth position, as the case may be,and any remaining players or teams shall forfeit the right to playfor said position.
7. In case of four or six ties, after a Winner has been declared officialand there remain four or six players or teams, tied for place, show orfourth, or all three, play-off shall be through elimination accordingto their rotating position. The first two players or teams will playthe first point. The next two players or teams will play for one point,and the remaining (in case of 6) players or teams will also play forone point. Winners of the above points will play additional pointsto decide place, show and fourth position, as the case may require.
8. In games where a fourth position is required and no place, showor fourth position has been determined and there remain four ties,the losing players or teams of the elimination play-off return andplay a final point to determine fourth.
9. If at any time during a play-off a player or team reaches the des-ignated number of points the game calls for, said player, or team,shall immediately be awarded the place, show or fourth position,as the case may be and the remaining players or teams shall forfeitthe right to play for said position.
As you can see, the complete tiebreaking rules are insanely compli-cated. You need a lawyer, not a computer scientist to understand them.The least interesting but most time-consuming part of writing this sim-ulation was making sure that I implemented all of the tiebreaking rulescorrectly. I wanted the simulation to accurately reflect reality, even thoserare realities of seven players ending in a tie (which happens roughly onceevery 1300 games).
When you are simulating a million games, you must assume that any-thing that can happen will happen. By including the complete set oftiebreaking rules in the program, I knew my simulation would be readyfor anything.
Simulation ResultsI implemented the jai alai simulation in my favorite programming lan-guage at that time (Pascal) and ran it on 1,000,000 jai alai games. Today, itwould take no more than a few minutes of computer time to complete therun; back in the mid-1980s it probably took a few hours.
The simulation produced a table of statistics telling me how often eachof the possible win, place, show, and trifecta bets would have paid off
51
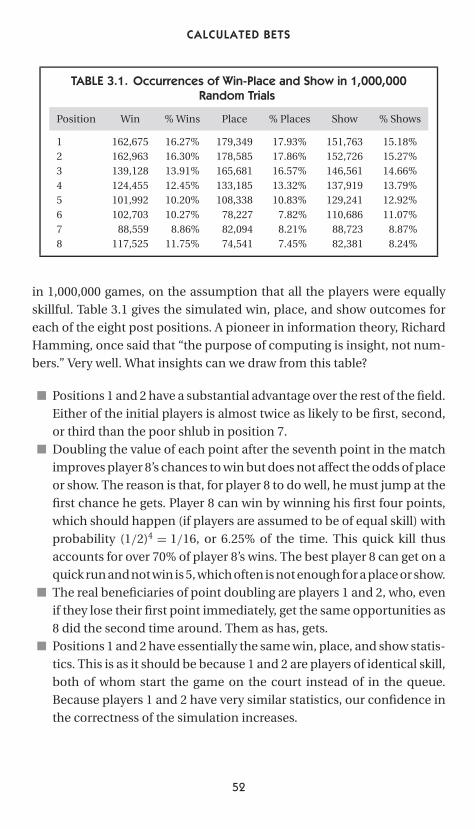
P1: FCH/FYX P2: FCH
CB386-03 CB386-Skiena June 8, 2001 17:10 Char Count= 0
CALCULATED BETS
TABLE 3.1. Occurrences of Win-Place and Show in 1,000,000Random Trials
Position Win % Wins Place % Places Show % Shows
1 162,675 16.27% 179,349 17.93% 151,763 15.18%2 162,963 16.30% 178,585 17.86% 152,726 15.27%3 139,128 13.91% 165,681 16.57% 146,561 14.66%4 124,455 12.45% 133,185 13.32% 137,919 13.79%5 101,992 10.20% 108,338 10.83% 129,241 12.92%6 102,703 10.27% 78,227 7.82% 110,686 11.07%7 88,559 8.86% 82,094 8.21% 88,723 8.87%8 117,525 11.75% 74,541 7.45% 82,381 8.24%
in 1,000,000 games, on the assumption that all the players were equallyskillful. Table 3.1 gives the simulated win, place, and show outcomes foreach of the eight post positions. A pioneer in information theory, RichardHamming, once said that “the purpose of computing is insight, not num-bers.” Very well. What insights can we draw from this table?
■ Positions 1 and 2 have a substantial advantage over the rest of the field.Either of the initial players is almost twice as likely to be first, second,or third than the poor shlub in position 7.
■ Doubling the value of each point after the seventh point in the matchimproves player 8’s chances to win but does not affect the odds of placeor show. The reason is that, for player 8 to do well, he must jump at thefirst chance he gets. Player 8 can win by winning his first four points,which should happen (if players are assumed to be of equal skill) withprobability (1/2)4 = 1/16, or 6.25% of the time. This quick kill thusaccounts for over 70% of player 8’s wins. The best player 8 can get on aquick run and not win is 5, which often is not enough for a place or show.
■ The real beneficiaries of point doubling are players 1 and 2, who, evenif they lose their first point immediately, get the same opportunities as8 did the second time around. Them as has, gets.
■ Positions 1 and 2 have essentially the same win, place, and show statis-tics. This is as it should be because 1 and 2 are players of identical skill,both of whom start the game on the court instead of in the queue.Because players 1 and 2 have very similar statistics, our confidence inthe correctness of the simulation increases.
52
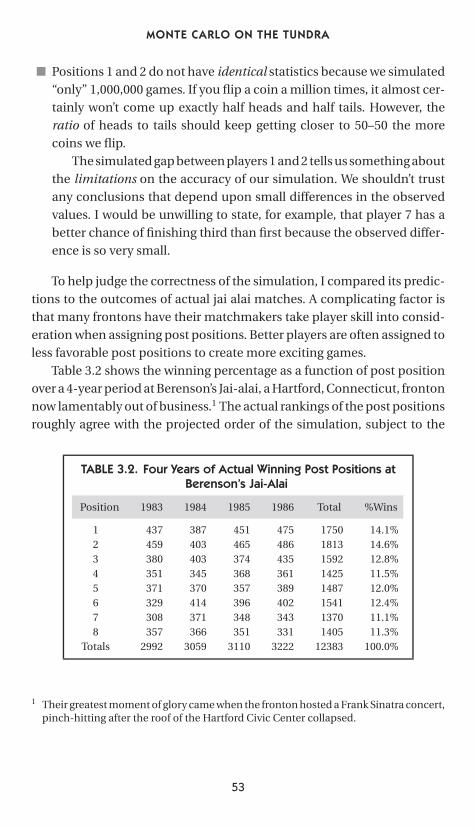
P1: FCH/FYX P2: FCH
CB386-03 CB386-Skiena June 8, 2001 17:10 Char Count= 0
MONTE CARLO ON THE TUNDRA
■ Positions 1 and 2 do not have identical statistics because we simulated“only” 1,000,000 games. If you flip a coin a million times, it almost cer-tainly won’t come up exactly half heads and half tails. However, theratio of heads to tails should keep getting closer to 50–50 the morecoins we flip.
The simulated gap between players 1 and 2 tells us something aboutthe limitations on the accuracy of our simulation. We shouldn’t trustany conclusions that depend upon small differences in the observedvalues. I would be unwilling to state, for example, that player 7 has abetter chance of finishing third than first because the observed differ-ence is so very small.
To help judge the correctness of the simulation, I compared its predic-tions to the outcomes of actual jai alai matches. A complicating factor isthat many frontons have their matchmakers take player skill into consid-eration when assigning post positions. Better players are often assigned toless favorable post positions to create more exciting games.
Table 3.2 shows the winning percentage as a function of post positionover a 4-year period at Berenson’s Jai-alai, a Hartford, Connecticut, frontonnow lamentably out of business.1 The actual rankings of the post positionsroughly agree with the projected order of the simulation, subject to the
TABLE 3.2. Four Years of Actual Winning Post Positions atBerenson’s Jai-Alai
Position 1983 1984 1985 1986 Total %Wins
1 437 387 451 475 1750 14.1%2 459 403 465 486 1813 14.6%3 380 403 374 435 1592 12.8%4 351 345 368 361 1425 11.5%5 371 370 357 389 1487 12.0%6 329 414 396 402 1541 12.4%7 308 371 348 343 1370 11.1%8 357 366 351 331 1405 11.3%
Totals 2992 3059 3110 3222 12383 100.0%
1 Their greatest moment of glory came when the fronton hosted a Frank Sinatra concert,pinch-hitting after the roof of the Hartford Civic Center collapsed.
53
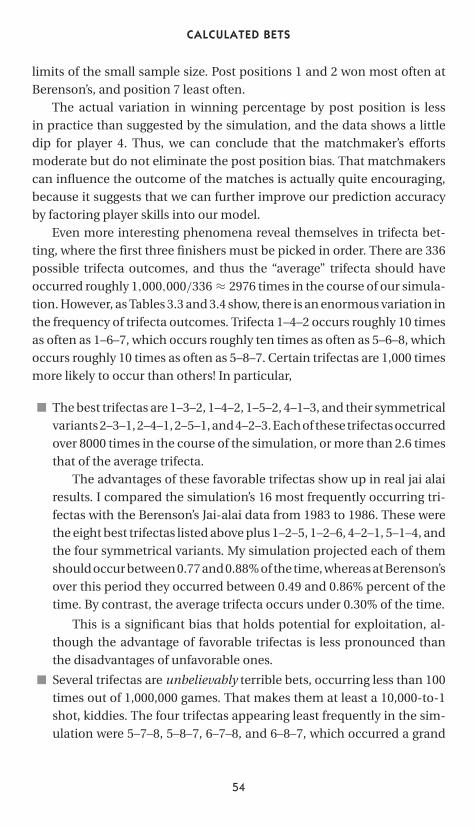
P1: FCH/FYX P2: FCH
CB386-03 CB386-Skiena June 8, 2001 17:10 Char Count= 0
CALCULATED BETS
limits of the small sample size. Post positions 1 and 2 won most often atBerenson’s, and position 7 least often.
The actual variation in winning percentage by post position is lessin practice than suggested by the simulation, and the data shows a littledip for player 4. Thus, we can conclude that the matchmaker’s effortsmoderate but do not eliminate the post position bias. That matchmakerscan influence the outcome of the matches is actually quite encouraging,because it suggests that we can further improve our prediction accuracyby factoring player skills into our model.
Even more interesting phenomena reveal themselves in trifecta bet-ting, where the first three finishers must be picked in order. There are 336possible trifecta outcomes, and thus the “average” trifecta should haveoccurred roughly 1,000,000/336 ≈ 2976 times in the course of our simula-tion. However, as Tables 3.3 and 3.4 show, there is an enormous variation inthe frequency of trifecta outcomes. Trifecta 1–4–2 occurs roughly 10 timesas often as 1–6–7, which occurs roughly ten times as often as 5–6–8, whichoccurs roughly 10 times as often as 5–8–7. Certain trifectas are 1,000 timesmore likely to occur than others! In particular,
■ The best trifectas are 1–3–2, 1–4–2, 1–5–2, 4–1–3, and their symmetricalvariants 2–3–1, 2–4–1, 2–5–1, and 4–2–3. Each of these trifectas occurredover 8000 times in the course of the simulation, or more than 2.6 timesthat of the average trifecta.
The advantages of these favorable trifectas show up in real jai alairesults. I compared the simulation’s 16 most frequently occurring tri-fectas with the Berenson’s Jai-alai data from 1983 to 1986. These werethe eight best trifectas listed above plus 1–2–5, 1–2–6, 4–2–1, 5–1–4, andthe four symmetrical variants. My simulation projected each of themshould occur between 0.77 and 0.88% of the time, whereas at Berenson’sover this period they occurred between 0.49 and 0.86% percent of thetime. By contrast, the average trifecta occurs under 0.30% of the time.
This is a significant bias that holds potential for exploitation, al-though the advantage of favorable trifectas is less pronounced thanthe disadvantages of unfavorable ones.
■ Several trifectas are unbelievably terrible bets, occurring less than 100times out of 1,000,000 games. That makes them at least a 10,000-to-1shot, kiddies. The four trifectas appearing least frequently in the sim-ulation were 5–7–8, 5–8–7, 6–7–8, and 6–8–7, which occurred a grand
54
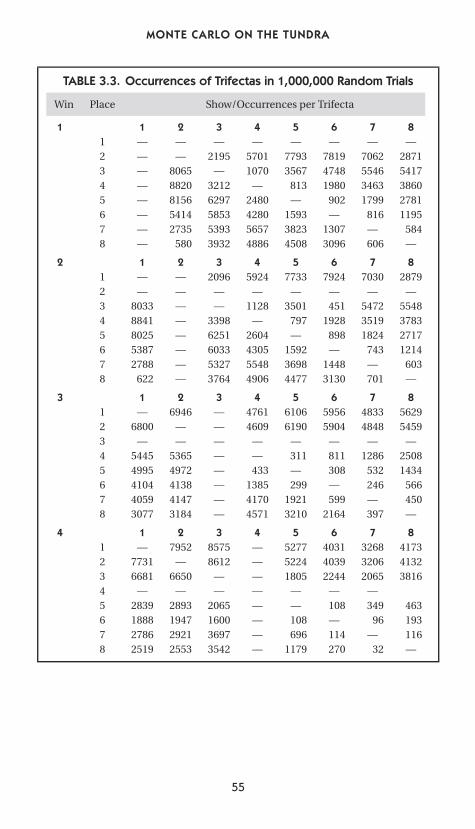
P1: FCH/FYX P2: FCH
CB386-03 CB386-Skiena June 8, 2001 17:10 Char Count= 0
MONTE CARLO ON THE TUNDRA
TABLE 3.3. Occurrences of Trifectas in 1,000,000 Random Trials
Win Place Show/Occurrences per Trifecta
1 1 2 3 4 5 6 7 81 — — — — — — — —2 — — 2195 5701 7793 7819 7062 28713 — 8065 — 1070 3567 4748 5546 54174 — 8820 3212 — 813 1980 3463 38605 — 8156 6297 2480 — 902 1799 27816 — 5414 5853 4280 1593 — 816 11957 — 2735 5393 5657 3823 1307 — 5848 — 580 3932 4886 4508 3096 606 —
2 1 2 3 4 5 6 7 81 — — 2096 5924 7733 7924 7030 28792 — — — — — — — —3 8033 — — 1128 3501 451 5472 55484 8841 — 3398 — 797 1928 3519 37835 8025 — 6251 2604 — 898 1824 27176 5387 — 6033 4305 1592 — 743 12147 2788 — 5327 5548 3698 1448 — 6038 622 — 3764 4906 4477 3130 701 —
3 1 2 3 4 5 6 7 81 — 6946 — 4761 6106 5956 4833 56292 6800 — — 4609 6190 5904 4848 54593 — — — — — — — —4 5445 5365 — — 311 811 1286 25085 4995 4972 — 433 — 308 532 14346 4104 4138 — 1385 299 — 246 5667 4059 4147 — 4170 1921 599 — 4508 3077 3184 — 4571 3210 2164 397 —
4 1 2 3 4 5 6 7 81 — 7952 8575 — 5277 4031 3268 41732 7731 — 8612 — 5224 4039 3206 41323 6681 6650 — — 1805 2244 2065 38164 — — — — — — —5 2839 2893 2065 — — 108 349 4636 1888 1947 1600 — 108 — 96 1937 2786 2921 3697 — 696 114 — 1168 2519 2553 3542 — 1179 270 32 —
55
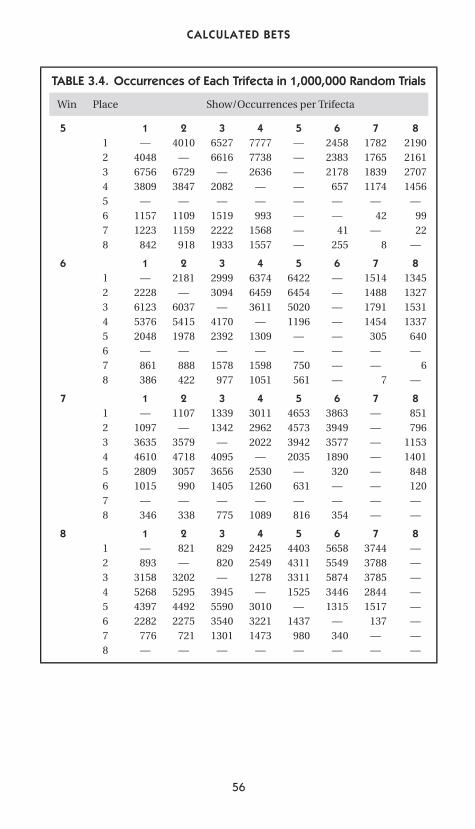
P1: FCH/FYX P2: FCH
CB386-03 CB386-Skiena June 8, 2001 17:10 Char Count= 0
CALCULATED BETS
TABLE 3.4. Occurrences of Each Trifecta in 1,000,000 Random Trials
Win Place Show/Occurrences per Trifecta
5 1 2 3 4 5 6 7 81 — 4010 6527 7777 — 2458 1782 21902 4048 — 6616 7738 — 2383 1765 21613 6756 6729 — 2636 — 2178 1839 27074 3809 3847 2082 — — 657 1174 14565 — — — — — — — —6 1157 1109 1519 993 — — 42 997 1223 1159 2222 1568 — 41 — 228 842 918 1933 1557 — 255 8 —
6 1 2 3 4 5 6 7 81 — 2181 2999 6374 6422 — 1514 13452 2228 — 3094 6459 6454 — 1488 13273 6123 6037 — 3611 5020 — 1791 15314 5376 5415 4170 — 1196 — 1454 13375 2048 1978 2392 1309 — — 305 6406 — — — — — — — —7 861 888 1578 1598 750 — — 68 386 422 977 1051 561 — 7 —
7 1 2 3 4 5 6 7 81 — 1107 1339 3011 4653 3863 — 8512 1097 — 1342 2962 4573 3949 — 7963 3635 3579 — 2022 3942 3577 — 11534 4610 4718 4095 — 2035 1890 — 14015 2809 3057 3656 2530 — 320 — 8486 1015 990 1405 1260 631 — — 1207 — — — — — — — —8 346 338 775 1089 816 354 — —
8 1 2 3 4 5 6 7 81 — 821 829 2425 4403 5658 3744 —2 893 — 820 2549 4311 5549 3788 —3 3158 3202 — 1278 3311 5874 3785 —4 5268 5295 3945 — 1525 3446 2844 —5 4397 4492 5590 3010 — 1315 1517 —6 2282 2275 3540 3221 1437 — 137 —7 776 721 1301 1473 980 340 — —8 — — — — — — — —
56
P1: FCH/FYX P2: FCH
CB386-03 CB386-Skiena June 8, 2001 17:10 Char Count= 0
MONTE CARLO ON THE TUNDRA
total of 43 times between them. I would like to play poker against any-body who bets such numbers regularly.
The paucity of these trifecta events is not an artifact of our simula-tion but is a phenomenon that really exists. I went back and looked atstatistics from 17 seasons at Dania Jai-alai encompassing 29,096 games(Dania’s has a significantly longer history than Berenson’s). Only 4 ofthe 336 possible trifectas never occurred over this period: 5–7–8, 5–8–7,6–7–8, and 6–8–7. These are exactly the four trifectas identified as leastlikely to occur by the simulation. The model expects them to happenonly once every 25,000 games or so, meaning that our results are righton target.
■ A careful study of the tables shows that there is a strong bias againstplayers from neighboring post positions both doing well in a match.For example, the 5–2–4 trifecta occurs almost three times as often as5–3–4, and 6–3–5 occurs almost five times as often as 6–4–5. This isbecause neighboring players must play each other early in the game,and the loser is destined to return to the bottom of the queue with atmost one point to his name. For both to do well, the point-winner hasto go on to earn enough points to lock up second place and then loseto permit his neighbor to accumulate enough points to win.
This bias helps explains the Gang of Four rotten trifectas, becausethey all have the double whammy of neighboring high-post positions.
Now we know the probability that each possible betting opportunity injai alai will pay off. Are we now ready to start making money? Unfortunatelynot. Even though we have established that post position is a major factorin determining the outcome of jai alai matches, perhaps the dominantone, we still have the following hurdles to overcome before we can betresponsibly:
■ The impact of player skills – Obviously, the skills of the individual playersaffect the outcome of the game. A study of season statistics for playersover several years reveals that their winning percentage stays relativelyconstant, like the batting averages of baseball player. Thus, a good playeris more likely to win than a bad one, regardless of post position. It is clearthat a better model for predicting the outcome of jai alai matches willcome from factoring relative skills into the queuing model.
■ The sophistication of the betting public – Economic analysis of horse rac-ing has shown that racetracks tend to be fairly efficient markets, meaning
57
P1: FCH/FYX P2: FCH
CB386-03 CB386-Skiena June 8, 2001 17:10 Char Count= 0
CALCULATED BETS
that the odds set by the public largely reflect the risk of the situation.Countless other people certainly noticed the impact of post positionwell before I did, including those who reported on similar simulationssuch as Goodfriend and Friedman, Grofman and Noviello, and Moser.Indeed, as we will see, the jai alai betting public has largely factored theeffect of post position in the odds.
Fortunately for us, however, largely does not mean completely.■ The house cut – Frontons keep about 20% of the betting pool as the house
percentage, and thus one has to do much better then the average bettorjust to break even.
My simulation provides information on which outcomes are mostlikely. It does not by itself identify which are the best bets. A good betdepends both upon the likelihood of the event’s occurring and the payoffwhen it occurs. Payoffs are decided by the rest of the betting public. To findthe best bets to make, we will have to work a lot harder.
Generating Random NumbersFinding a reliable source of random numbers is essential to making anyMonte Carlo simulation work. A good random-number generator pro-duces sequences of bits that are indistinguishable from random coin flips.This is much easier said than done. Generating random numbers is oneof the most subtle and interesting problems in computer science becauseseemingly reasonable solutions can have disastrous consequences.
Bad random number generators can easily cause Monte Carlo simula-tions to give meaningless results. For example, suppose we tried a random-number generator that simply alternated heads and tails each time it wasasked for another coin flip. This generator would produce a sequence ofcoin flips having some of the properties of a truly random sequence. Forexample, the expected number of heads after n random coin flips is n/2,and that is exactly how many will be produced by our simple generator.
But compare the following sequence of 50 real random flips (I used realpennies) with this “phony random” sequence:
real random HTHHH TTHHH TTTHT THHHT HTTHHHTHHT THHTH THHTT HTHHT TTTHT
phony random HTHTH THTHT HTHTH THTHT HTHTHTHTHT HTHTH THTHT HTHTH THTHT
58
P1: FCH/FYX P2: FCH
CB386-03 CB386-Skiena June 8, 2001 17:10 Char Count= 0
MONTE CARLO ON THE TUNDRA
There are significant differences between the two sequences. First,the real random sequence has an unbalanced number of heads and tails(27 heads versus 23 tails). This is not surprising. In fact, 50 coin flips shouldend up as exactly 25 heads and 25 tails only 11.2% of the time. Likewise,in the real random sequence there is a run of four consecutive tails. Asufficiently long sequence of flips should have substantial runs of consec-utive heads or tails if it is truly random. Such counterintuitive behaviorhelps explain why people are lousy at designing truly random-looking se-quences. Many embezzlers, ballot stuffers, and quack scientists have beencaught because their data or audit trails were too “random” to hold up tocareful scrutiny.
Let’s think through the consequences of using the phony-random gen-erator with our simulation instead of a truly random generator. No mat-ter how many games we simulated, only two different trifecta outcomeswould ever be produced! Suppose that whenever the first coin was heads,we assigned player 1 to be the winner of the first point (against player 2).Whenever player 1 wins the first point, this means that the next “random”coin flip will always yield a tail, and thus the winner of the second pointwill always be predestined. In either case, the outcome of the first coinflip always decides the winner of the match, and thus the results of oursimulation are completely meaningless!
How, then, do we generate truly random numbers on a computer? Theshort answer is that we can’t. Computers are deterministic machines thatalways do exactly what that they are programmed to do. In general, thisis a good thing, for it explains why we trust computers to balance ourcheckbook correctly. But this characteristic eliminates the possibility oflooking to computers as a source of true randomness.
The best we can hope for are pseudorandom numbers, a stream ofnumbers that appear as if they had been generated randomly. This is adicey situation. John von Neumann, the brilliant mathematician who iscredited with designing the first modern computer, said it best: “Anyonewho considers arithmetical methods of producing random digits is, ofcourse, in a state of sin.”
The pseudorandom-number generation algorithm of choice generatesrandom numbers based on the same principle that roulette wheels use. Ina roulette wheel, we start by rolling a ball around and around and aroundthe outer edge of the wheel. After several seconds of motion, the ball losesenough energy that it drops into the bottom part of the wheel and then
59
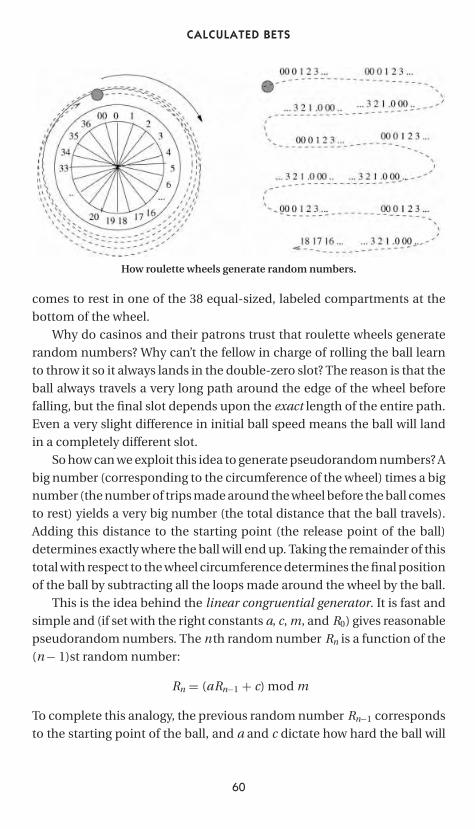
P1: FCH/FYX P2: FCH
CB386-03 CB386-Skiena June 8, 2001 17:10 Char Count= 0
CALCULATED BETS
How roulette wheels generate random numbers.
comes to rest in one of the 38 equal-sized, labeled compartments at thebottom of the wheel.
Why do casinos and their patrons trust that roulette wheels generaterandom numbers? Why can’t the fellow in charge of rolling the ball learnto throw it so it always lands in the double-zero slot? The reason is that theball always travels a very long path around the edge of the wheel beforefalling, but the final slot depends upon the exact length of the entire path.Even a very slight difference in initial ball speed means the ball will landin a completely different slot.
So how can we exploit this idea to generate pseudorandom numbers? Abig number (corresponding to the circumference of the wheel) times a bignumber (the number of trips made around the wheel before the ball comesto rest) yields a very big number (the total distance that the ball travels).Adding this distance to the starting point (the release point of the ball)determines exactly where the ball will end up. Taking the remainder of thistotal with respect to the wheel circumference determines the final positionof the ball by subtracting all the loops made around the wheel by the ball.
This is the idea behind the linear congruential generator. It is fast andsimple and (if set with the right constants a, c, m, and R0) gives reasonablepseudorandom numbers. The nth random number Rn is a function of the(n − 1)st random number:
Rn = (aRn−1 + c) mod m
To complete this analogy, the previous random number Rn−1 correspondsto the starting point of the ball, and a and c dictate how hard the ball will
60
P1: FCH/FYX P2: FCH
CB386-03 CB386-Skiena June 8, 2001 17:10 Char Count= 0
MONTE CARLO ON THE TUNDRA
be thrown. Finally, m stands for the circumference of the wheel. The modfunction is just a fancy term for the remainder.
Lurking within my simulation is a linear congruential generator withcarefully chosen constants that have been shown to produce reasonable-looking pseudorandom numbers.2 The high correlation between the dis-tribution of observed trifectas and our simulation results gives us faith inboth our model and our random-number generator.
Passing PaperI was a graduate student at the University of Illinois at the time I wrote thissimulation. I was living in Daniels Hall, a graduate student dorm whoselayout consisted of pairs of extremely small single rooms that shared aone-seat bathroom between them. To say these rooms were small wasno understatement; there was no place in my room where I could standwithout being able to touch at least three walls. I had a little couch thatrolled out to be a bed, after which I could not stand regardless of how manywalls I was willing to touch. The one saving grace in the tiny room was thatmy morning newspaper was delivered under my door, and I could pick itup and read it without ever leaving my bed.
But it is the shared bathroom that is the relevant part of this story. Withtwo doors leading to a one-seat john, sooner or later you get to meet theother party. That year, my bathroom-mate was a guy named Jay French, agraduate student in the business school.
Jay went on to work for McDonnell Douglas Aerospace Corporation inSt. Louis, and I’ve lost track of him over the years (give me a call, Jay, ifyou’re out there), but he is the one who gave me the nerve to publish myjai alai results. As a future M.B.A., he had a professional interest in get-rich-quick schemes, and thus he was intrigued when I told him about mysimulation.
“You know, I have just the place for you to publish a paper on that stuff.The Institute of Management Sciences publishes a semipopular journal,Interfaces. I’m a member, so they send it to me every other month. Theyhave lots of articles analyzing optimal strategies related to sports.”
2 An effective way to ruin any linear congruential generator is to instantiate it with thewrong constants. Setting a = 0, c = 0 and R0 = 0 simulates flipping a one-sided coinbecause every “random” number produced will be 0. See Knuth’s book for a thor-ough discussion of the subtle problem of selecting the right constants to make thingswork.
61
P1: FCH/FYX P2: FCH
CB386-03 CB386-Skiena June 8, 2001 17:10 Char Count= 0
CALCULATED BETS
He showed me a few back issues he had in his room. Daniels Hallrooms were so small you could only store a few back issues of anything.But indeed, there were articles whose depth and topics were comparableto what I had done.
“Is this a respected journal?,” I asked suspiciously.“Respected? No. But it is much less boring than the other journals they
publish.”I took the bait and wrote up a paper with the results of my simulation.
To give it a veneer of academic respectability, I claimed the paper was astudy of the “fairness” of the Spectacular Seven scoring system. The Spec-tacular Seven scoring system is unfair because equally skilled players havean unequal chance of winning. I tried varying the position where dou-ble points first start (after the seventh point played in Spectacular Seven)so as to discover the point that leads to the greatest equality. After sim-ulating 50,000 games for each possible doubling point, it became clearthat doubling near the beginning of a cycle is the worst time if you wantto ensure fairness because the already favored first or second players arelikely to be the first to emerge or reemerge from the queue. Yet this is ex-actly what happens with the Spectacular Seven. It would be much betterto double when the middle player is expected to leave the queue to play apoint.
You might be curious about how academic journals work. Publicationdecisions are made on the basis of “peer review.” When the editor of Inter-faces received my submitted article in the mail, he or she skimmed throughit and then came up with a list of two or three experts in the area to reviewit carefully. Identifying an appropriate set of referees for my article wasprobably somewhat difficult because there are few other academics witha clearly identifiable interest in jai alai. Instead, the editor probably sent itto experts in simulation or mathematical issues in sport.
Refereeing is one of the chores of being an active researcher. Wheneveryou submit a paper to a journal, you get your name stuck in that editor’sdatabase of possible future referees. It takes time to read a technical papercarefully and write a report stating its merits and identifying its flaws.Thus, many people try to dodge the work. But peer review is the best wayto ensure that journals publish only research articles that are correct andof high quality.
These referee reports go back to the editor, who uses them to decide thequestion of acceptance or rejection. Copies of the reports are sent to the
62
P1: FCH/FYX P2: FCH
CB386-03 CB386-Skiena June 8, 2001 17:10 Char Count= 0
MONTE CARLO ON THE TUNDRA
author of the paper, but with the names of the referee removed. Anonymityensures that referees are free to speak their mind without worrying thatvengeance will be taken at a later date. Referee reports contain ideas forimproving the article, and thus even those papers recommended for ac-ceptance are usually revised before publication.
My article, “A Fairer Scoring System for Jai-alai,” appeared in Interfacesin November 1988. For my efforts, I received a modest amount of glorybut no money. The authors of research papers receive no payment fortheir articles. To the contrary, researchers are often asked to contribute“page charges” to help keep the journal going. A specialized academicjournal might have a circulation of only 1000 or so, which is not enoughto realize any significant revenue from advertising. To cover the cost ofproduction, libraries get charged a fortune for subscriptions to academicjournals, which can run from hundreds to thousands of dollars a year.Nevertheless, most academic journals claim to lose money. I’m not sureI completely understand the economics of journals, but the point is thatmoney is tight.
This tight money issue lead to an amusing incident with this particularpaper. My Interfaces article contained several graphs of statistical datarelated to fairness, which I had drawn and printed using typical late 1980scomputer equipment. The editor decided that the production quality ofmy graphs was too low for publication and that I had to hire a draftsman, atmy expense, to redraw these graphs before the article would be accepted.My original graphs looked plenty good enough to me, and besides I wasn’thappy about paying the draftsman. So I played the starving student routine.In my final letter responding to the journal I wrote as follows:
Acting upon your suggestion, I found out that the university does in-deed employ a graphics artist. Since I had no grant to charge it to, theybilled me at a special student rate. The total cost, $26.25, meant that Ionly had to skip lunch for a week to pay for them. Thank you for yourhelp and I look forward to seeing my paper in Interfaces.
A few weeks later I received an envelope in the mail from the manag-ing editor of Interfaces. A stack of neatly cut out coupons to McDonald’s,Dunkin Donuts, and seemingly every other fast food chain in existencewas included. The note said
Maybe the enclosed will help you with your lunch problem. We don’twant you to go hungry.
63
P1: FCH/FYX P2: FCH
CB386-03 CB386-Skiena June 8, 2001 17:10 Char Count= 0
My first publication on jai-alai.
64
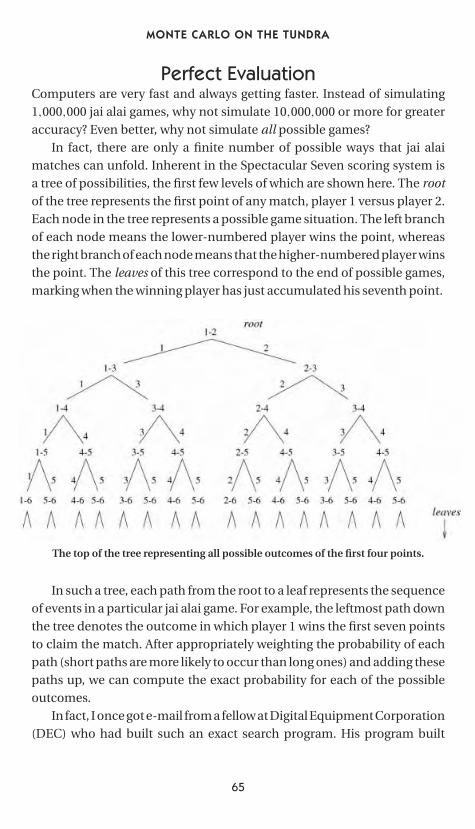
P1: FCH/FYX P2: FCH
CB386-03 CB386-Skiena June 8, 2001 17:10 Char Count= 0
MONTE CARLO ON THE TUNDRA
Perfect EvaluationComputers are very fast and always getting faster. Instead of simulating1,000,000 jai alai games, why not simulate 10,000,000 or more for greateraccuracy? Even better, why not simulate all possible games?
In fact, there are only a finite number of possible ways that jai alaimatches can unfold. Inherent in the Spectacular Seven scoring system isa tree of possibilities, the first few levels of which are shown here. The rootof the tree represents the first point of any match, player 1 versus player 2.Each node in the tree represents a possible game situation. The left branchof each node means the lower-numbered player wins the point, whereasthe right branch of each node means that the higher-numbered player winsthe point. The leaves of this tree correspond to the end of possible games,marking when the winning player has just accumulated his seventh point.
The top of the tree representing all possible outcomes of the first four points.
In such a tree, each path from the root to a leaf represents the sequenceof events in a particular jai alai game. For example, the leftmost path downthe tree denotes the outcome in which player 1 wins the first seven pointsto claim the match. After appropriately weighting the probability of eachpath (short paths are more likely to occur than long ones) and adding thesepaths up, we can compute the exact probability for each of the possibleoutcomes.
In fact, I once got e-mail from a fellow at Digital Equipment Corporation(DEC) who had built such an exact search program. His program built
65
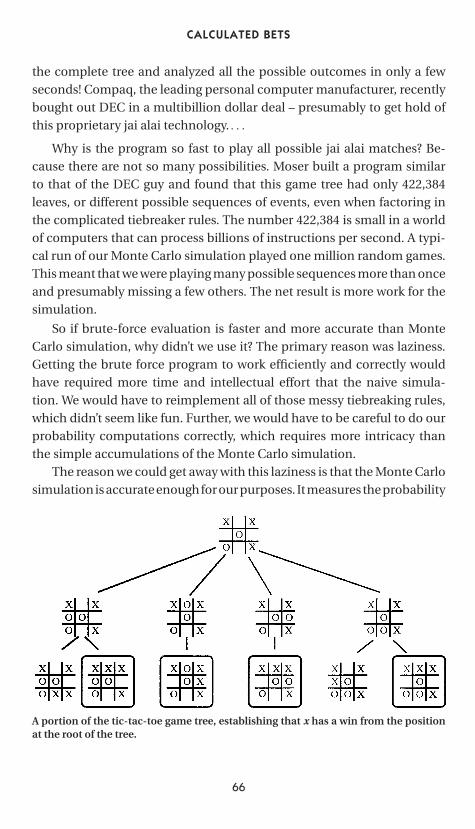
P1: FCH/FYX P2: FCH
CB386-03 CB386-Skiena June 8, 2001 17:10 Char Count= 0
CALCULATED BETS
the complete tree and analyzed all the possible outcomes in only a fewseconds! Compaq, the leading personal computer manufacturer, recentlybought out DEC in a multibillion dollar deal – presumably to get hold ofthis proprietary jai alai technology. . . .
Why is the program so fast to play all possible jai alai matches? Be-cause there are not so many possibilities. Moser built a program similarto that of the DEC guy and found that this game tree had only 422,384leaves, or different possible sequences of events, even when factoring inthe complicated tiebreaker rules. The number 422,384 is small in a worldof computers that can process billions of instructions per second. A typi-cal run of our Monte Carlo simulation played one million random games.This meant that we were playing many possible sequences more than onceand presumably missing a few others. The net result is more work for thesimulation.
So if brute-force evaluation is faster and more accurate than MonteCarlo simulation, why didn’t we use it? The primary reason was laziness.Getting the brute force program to work efficiently and correctly wouldhave required more time and intellectual effort that the naive simula-tion. We would have to reimplement all of those messy tiebreaking rules,which didn’t seem like fun. Further, we would have to be careful to do ourprobability computations correctly, which requires more intricacy thanthe simple accumulations of the Monte Carlo simulation.
The reason we could get away with this laziness is that the Monte Carlosimulation is accurate enough for our purposes. It measures the probability
A portion of the tic-tac-toe game tree, establishing that x has a win from the positionat the root of the tree.
66
P1: FCH/FYX P2: FCH
CB386-03 CB386-Skiena June 8, 2001 17:10 Char Count= 0
MONTE CARLO ON THE TUNDRA
of each betting outcome to within a fraction of a percent of its actual value.For example, our original simulation results agreed with Moser’s completeevaluation to within 0.05% on each win-place-show entry. Any bettingsystem that required finer tolerance than this would not be in a position tomake much money in the real world, and there is no reason to lull ourselvesinto a false sense of security by overoptimizing one aspect of our system.I’ve always intended to build a brute-force evaluator, but our time alwaysseemed better spent putting in more effort into the statistical analysis andmodeling.
The idea of constructing a tree of all possible sequences of moves isthe foundation of programs that play games of strategy such as chess. Toevaluate which of the current moves is the best choice, the program builds atree consisting of all possible sequences of play to a depth of several moves.It then makes a guess of the value of each leaf position and percolates thisinformation back up to the top of the tree to identify the best move.
If such a program could build the complete tree of possibilities for agiven game, as Moser did with jai alai, that program would always play asperfectly as possible. The game tree for tic-tac-toe is small enough to beeasily constructed; indeed, a portion of this tree proving x has a win froma given position fits on a page of this book. On the other hand, the gametree for chess is clearly too large ever to fit in any imaginable computer.Even though the computer Deep Blue recently beat the human championGary Kasparov in a match, it is by no means unbeatable. The game of Gohas a game tree that is vastly bigger than that of chess – enough so that thebest computer programs are no match for a competent human.
When playing games, it is always important to pick on somebody yourown size.
67

P1: FCH/FYX P2: FCH
cb386-04 CB386-Skiena June 8, 2001 17:13 Char Count= 0
CHAPTER FOUR
THE IMPACT OF THE INTERNET
Many years passed. I received my doctorate in Computer Science from theUniversity of Illinois with a thesis in computational geometry and foundmyself a faculty position in Computer Science at the State University ofNew York, Stony Brook.
Jai alai would have to wait awhile. As an Assistant Professor, your effortsrevolve around getting tenure. Publish or perish isn’t too far from the truth,but what you publish makes a big difference. I wouldn’t have gotten tenureeven if I had published 100 articles on jai alai because this work wouldn’t(and shouldn’t) carry much respect with the powers that be in academiccomputer science.
But 6 years later I found myself a tenured Associate Professor of Com-puter Science. Tenure gives you the freedom to work on whatever you want.You have to teach your classes, and you have to do your committee work,but otherwise what you do with your time is pretty much up to you. If Iwanted to devote a little effort to an interesting mathematical modelingproblem, well, nobody was going to stop me.
By now my parents had retired to Florida, and each winter my brotherLen and I would pay them a visit. Each visit included an obligatory tripto watch jai alai, and so on January 17, 1995, we spent the evening atthe Dania fronton. On arrival, our first action was, as always, to buy a
68
P1: FCH/FYX P2: FCH
cb386-04 CB386-Skiena June 8, 2001 17:13 Char Count= 0
THE IMPACT OF THE INTERNET
Pepe’s Green Card. Our second step was to convince ourselves of itsinfallibility.
“Pepe’s going to make us some money tonight.”“You bet. We’ve got nothing but winners here.”“Sure, Pepe’s making money tonight. From bagel-heads like you who
paid him good money for nothing.” Dad remained a skeptic.“Pepe’s best bet is a 5–8–3 trifecta in Game 6. Remember when he gave
us that winning trifecta when we were kids.”“Forget it. Pepe wins only once in a lifetime . . . .”Game 6 started. After watching the early points play out, I looked at
our ticket and thought ahead.“Hey, if 8 beats 7, then 1, and then 2 he will be in first place. Player 4
can then beat 8 to stop the run. Player 3 wins the next point to move intosecond. If 5 then wins his next three points, we are in business.”
Player 8 beat 7. Then 8 beat 1. Then 8 beat 2 to give him a total of fivepoints.
“Player 8 needs to lose this point, or else they have won the match.”Player 4 beat 8.“Player 3 has to win to stay ahead of 4.”Player 3 beat 4.“Now all we need is for 5 to run it.”“Yeah, three more points and Pepe’s got it.”Player 5 beat 3. My brother and I started giggling.Player 5 beat 6. We were laughing hysterically. We didn’t even have to
watch the next point to know how it would turn out.Player 5 beat 7.This time the trifecta paid $148 and change. Again we took the folks
out to dinner.Each year, during our family fronton visit, I told my parents I could win
at jai alai if only I spent the time to develop the method. They always said,“Big shot, so go do it.” Finally I couldn’t come up with a good reason notto. I came back from Florida with a suntan and a determination to moveforward with predicting jai alai matches by computer.
The Coming of the WebTo proceed with the project, I needed to provide my computer with anextensive database of jai alai statistics and results. I needed three kinds ofinformation:
69
P1: FCH/FYX P2: FCH
cb386-04 CB386-Skiena June 8, 2001 17:13 Char Count= 0
CALCULATED BETS
■ Game schedules – To perform an appropriate Monte Carlo simulation, Ineeded to know which players were playing, in which post positions, inwhich games, on which date. This meant obtaining the game schedulesfor a given fronton.
■ Player records – To customize a Monte Carlo simulation for the partic-ulars of a given match, I had to know the relative merits of the playersin each post position. This meant obtaining enough game results andplayer statistics to rank the pelotaris with some level of confidence.
■ Payoff information – To judge if a given bet was desirable meant Ineeded to know how much money each betting outcome would payoff if it won. This meant accumulating the prices paid to bettors overenough matches to predict the payoff without making the bet.
There seemed to be only two sources from which to get these statistics:
■ Directly from the frontons – Running a pari-mutuel betting operationis very much an information-intensive business. Clearly, frontons usecomputers to compute payoffs and results; thus, I knew that all the in-formation I wanted must have been on some computer at some time.However, except for general season statistics, frontons had no interestin keeping detailed records on each and every game. The public rela-tions directors of every fronton I spoke to tried to be helpful, but theynever had more than photocopies of records for the past few nights orold programs with last season’s general statistics.
■ Directly from newspapers – Several local newspapers in Florida andConnecticut print the results of jai alai matches each day. This meanssomebody at the newspaper must type them in in the first place. Ifigured that if I could get ahold of whoever did the actual typing, Icould convince him or her to save the files for us to process.
But I was wrong. Nobody I spoke to ever kept more than a week’sworth of data around. Local newspapers are in the business of produc-ing newspapers and understandably could not be bothered with yes-terday’s news. Of course, I could have gone through old printed copiesof the paper and retyped everything into the computer, but doing so for1 or 2 year’s worth of statistics would have been too great a task to bear.
Neither of these options was tenable. The jai alai project was dead inthe water until the Internet and Worldwide Web (WWW) suddenly becamepopular.
70
P1: FCH/FYX P2: FCH
cb386-04 CB386-Skiena June 8, 2001 17:13 Char Count= 0
THE IMPACT OF THE INTERNET
As the WWW caught on, more and more companies asked themselveswhat information they could provide to their potential customers. Theirfirst Web page probably only had the firm’s address and phone numberand maybe a copy of the public relations brochure. Eventually, however,someone had the imagination to say, “Hey, I can do more,” and got to workbuilding something interesting.
For jai-alai frontons, it was a no-brainer that they should provide sched-ules and results of play. Newspapers found the jai alai scores interestingenough to publish each day. The more information frontons could provideto the betting public, the more money the betting public would provide tothe frontons. Milford’s WWW site immediately started getting thousandsof hits per month and kept growing.
Frontons on the net changed everything for this project. When severalfrontons started providing daily schedules and results in early 1997, westarted downloading it. Retrieving a Web page by clicking a button ona browser such as Netscape or Internet Explorer is a simple task. It is notmuch more complicated to write a program to retrieve a given page withoutthe mouse click. Using such a program, we convinced our computer towake up early each morning and fetch the schedule of future matches froma given fronton’s WWW site, as well as retrieve the winners of yesterday’smatches.
For more than 3 years now we have collected schedules and results eachnight from the Websites of several frontons, including Milford, Dania, andMiami. Dania and Milford proved the most diligent about posting thisinformation; therefore, all of our subsequent work was performed usingdata from these frontons. Our huge database of jai alai results promisedto unlock the secrets of player skills – if only we could interpret themcorrectly.
ParsingA Holy Grail of computer science is building computer systems thatunderstand natural languages such as English. Wouldn’t it be great if youcould type something in like “schedule dinner with the Stark’s for nextSaturday night,” and the machine could figure out what you meant andact accordingly?
Natural language understanding is an extremely hard problem for com-puters – so hard that for most applications it is easier to design an artificiallanguage and teach people to use it instead of teaching the computer
71
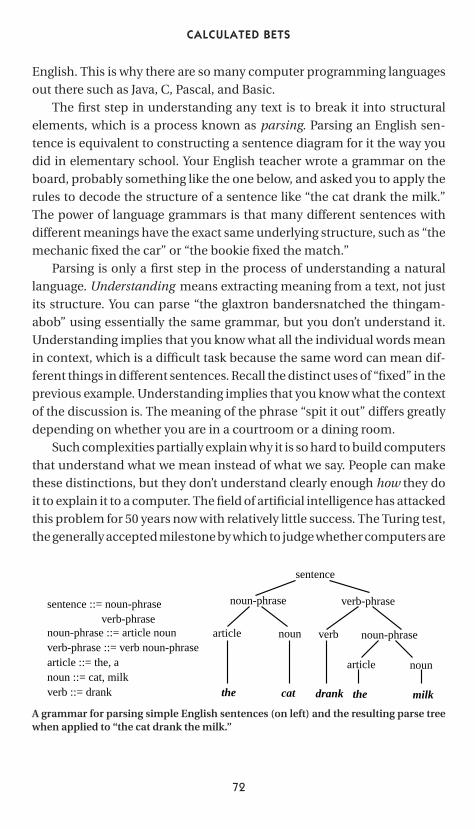
P1: FCH/FYX P2: FCH
cb386-04 CB386-Skiena June 8, 2001 17:13 Char Count= 0
CALCULATED BETS
English. This is why there are so many computer programming languagesout there such as Java, C, Pascal, and Basic.
The first step in understanding any text is to break it into structuralelements, which is a process known as parsing. Parsing an English sen-tence is equivalent to constructing a sentence diagram for it the way youdid in elementary school. Your English teacher wrote a grammar on theboard, probably something like the one below, and asked you to apply therules to decode the structure of a sentence like “the cat drank the milk.”The power of language grammars is that many different sentences withdifferent meanings have the exact same underlying structure, such as “themechanic fixed the car” or “the bookie fixed the match.”
Parsing is only a first step in the process of understanding a naturallanguage. Understanding means extracting meaning from a text, not justits structure. You can parse “the glaxtron bandersnatched the thingam-abob” using essentially the same grammar, but you don’t understand it.Understanding implies that you know what all the individual words meanin context, which is a difficult task because the same word can mean dif-ferent things in different sentences. Recall the distinct uses of “fixed” in theprevious example. Understanding implies that you know what the contextof the discussion is. The meaning of the phrase “spit it out” differs greatlydepending on whether you are in a courtroom or a dining room.
Such complexities partially explain why it is so hard to build computersthat understand what we mean instead of what we say. People can makethese distinctions, but they don’t understand clearly enough how they doit to explain it to a computer. The field of artificial intelligence has attackedthis problem for 50 years now with relatively little success. The Turing test,the generally accepted milestone by which to judge whether computers are
sentence ::= noun-phrase verb-phrasenoun-phrase ::= article nounverb-phrase ::= verb noun-phrasearticle ::= the, anoun ::= cat, milkverb ::= drank
sentence
verb-phrasenoun-phrase
article noun verb noun-phrase
article noun
drankthe cat the milk
A grammar for parsing simple English sentences (on left) and the resulting parse treewhen applied to “the cat drank the milk.”
72
P1: FCH/FYX P2: FCH
cb386-04 CB386-Skiena June 8, 2001 17:13 Char Count= 0
THE IMPACT OF THE INTERNET
intelligent, asks whether a person in conversation with a machine is fooledinto thinking that he or she is talking to another human. No computer haseven come close to passing the Turing test. I do not anticipate a seriouschallenge to be made in my lifetime, even though the $100,000 LoebnerPrize awaits the first program to pass.1
Although understanding natural language is a hopeless task, parsingsome well-defined artificial language is part of almost every sophisticatedcomputer program. This difference between parsing and understandinglanguage is part of the vernacular of computer science. When a program-mer comes out of a meeting saying “I don’t understand what he is saying,”the statement means that the programmer is confused. When a program-mer comes out of meeting saying “I can’t parse what he is saying,” it meansthat the programmer is very confused.
One of my primary missions as a professor is to teach computer sciencestudents how to program. Programming is best learned by doing, and thebest students are always looking for interesting projects to hone their skillsand learn new things. Properly harnessed, this youthful eagerness to buildthings is a terrific way for professors to get students to work for themwithout pay. The trick is presenting students with a project so interestingthey are happy to work for free.
Building a parser for WWW files to support a gambling system was asexy enough project to catch any undergraduate worth his or her salt. Iimmediately thought of the best student in my previous semester’s algo-rithms course, Dario Vlah. He was a soft-spoken 6-foot 8-inch Croatianwith a small goatee and a tremendous eagerness to hack.
The language Dario had to parse was that which the frontons used toreport the schedules and results on the WWW. Fortunately, these files wereprepared by the fronton’s own computers and thus had a fairly regularstructure to them. For example, the start of a typical raw Milford schedulefile looked like this:
Milford Jai-alai
Afternoon Performance - Sunday July 19, 1998
1 Perhaps the most famous conversational program was Eliza, a 1960s attempt to simu-late a Rogerian psychologist. Eliza briefly fooled surprisingly many people using verysimple tricks that had nothing to do with intelligence. She met her match, however,when paired with another program designed to mimic a psychotic paranoid. Elizafailed to cure him but did succeed in sending a bill.
73
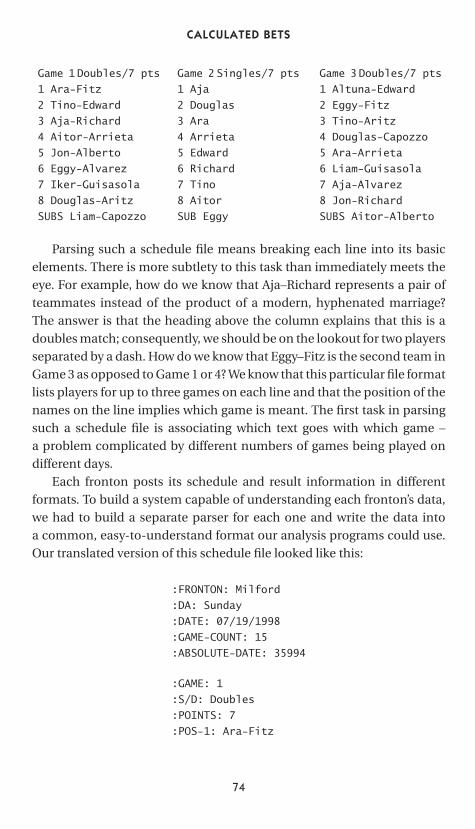
P1: FCH/FYX P2: FCH
cb386-04 CB386-Skiena June 8, 2001 17:13 Char Count= 0
CALCULATED BETS
Game 1 Doubles/7 pts Game 2 Singles/7 pts Game 3 Doubles/7 pts
1 Ara-Fitz 1 Aja 1 Altuna-Edward
2 Tino-Edward 2 Douglas 2 Eggy-Fitz
3 Aja-Richard 3 Ara 3 Tino-Aritz
4 Aitor-Arrieta 4 Arrieta 4 Douglas-Capozzo
5 Jon-Alberto 5 Edward 5 Ara-Arrieta
6 Eggy-Alvarez 6 Richard 6 Liam-Guisasola
7 Iker-Guisasola 7 Tino 7 Aja-Alvarez
8 Douglas-Aritz 8 Aitor 8 Jon-Richard
SUBS Liam-Capozzo SUB Eggy SUBS Aitor-Alberto
Parsing such a schedule file means breaking each line into its basicelements. There is more subtlety to this task than immediately meets theeye. For example, how do we know that Aja–Richard represents a pair ofteammates instead of the product of a modern, hyphenated marriage?The answer is that the heading above the column explains that this is adoubles match; consequently, we should be on the lookout for two playersseparated by a dash. How do we know that Eggy–Fitz is the second team inGame 3 as opposed to Game 1 or 4? We know that this particular file formatlists players for up to three games on each line and that the position of thenames on the line implies which game is meant. The first task in parsingsuch a schedule file is associating which text goes with which game –a problem complicated by different numbers of games being played ondifferent days.
Each fronton posts its schedule and result information in differentformats. To build a system capable of understanding each fronton’s data,we had to build a separate parser for each one and write the data intoa common, easy-to-understand format our analysis programs could use.Our translated version of this schedule file looked like this:
:FRONTON: Milford
:DAY: Sunday
:DATE: 07/19/1998
:GAME-COUNT: 15
:ABSOLUTE-DATE: 35994
:GAME: 1
:S/D: Doubles
:POINTS: 7
:POS-1: Ara-Fitz
74
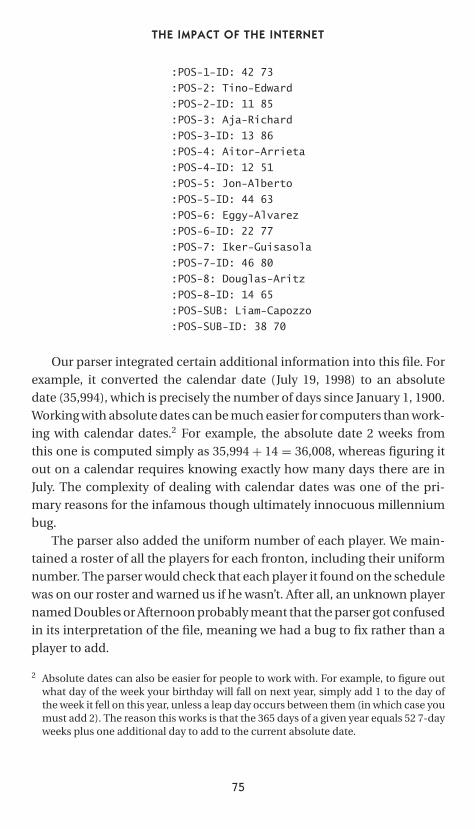
P1: FCH/FYX P2: FCH
cb386-04 CB386-Skiena June 8, 2001 17:13 Char Count= 0
THE IMPACT OF THE INTERNET
:POS-1-ID: 42 73
:POS-2: Tino-Edward
:POS-2-ID: 11 85
:POS-3: Aja-Richard
:POS-3-ID: 13 86
:POS-4: Aitor-Arrieta
:POS-4-ID: 12 51
:POS-5: Jon-Alberto
:POS-5-ID: 44 63
:POS-6: Eggy-Alvarez
:POS-6-ID: 22 77
:POS-7: Iker-Guisasola
:POS-7-ID: 46 80
:POS-8: Douglas-Aritz
:POS-8-ID: 14 65
:POS-SUB: Liam-Capozzo
:POS-SUB-ID: 38 70
Our parser integrated certain additional information into this file. Forexample, it converted the calendar date (July 19, 1998) to an absolutedate (35,994), which is precisely the number of days since January 1, 1900.Working with absolute dates can be much easier for computers than work-ing with calendar dates.2 For example, the absolute date 2 weeks fromthis one is computed simply as 35,994 + 14 = 36,008, whereas figuring itout on a calendar requires knowing exactly how many days there are inJuly. The complexity of dealing with calendar dates was one of the pri-mary reasons for the infamous though ultimately innocuous millenniumbug.
The parser also added the uniform number of each player. We main-tained a roster of all the players for each fronton, including their uniformnumber. The parser would check that each player it found on the schedulewas on our roster and warned us if he wasn’t. After all, an unknown playernamed Doubles or Afternoon probably meant that the parser got confusedin its interpretation of the file, meaning we had a bug to fix rather than aplayer to add.
2 Absolute dates can also be easier for people to work with. For example, to figure outwhat day of the week your birthday will fall on next year, simply add 1 to the day ofthe week it fell on this year, unless a leap day occurs between them (in which case youmust add 2). The reason this works is that the 365 days of a given year equals 52 7-dayweeks plus one additional day to add to the current absolute date.
75
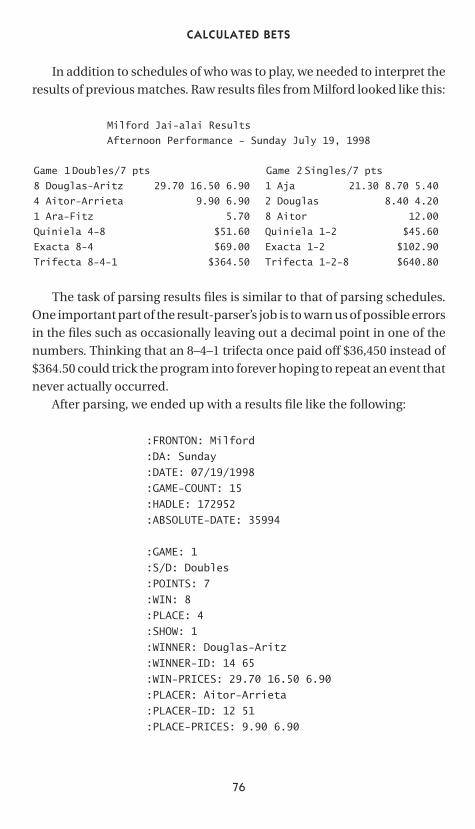
P1: FCH/FYX P2: FCH
cb386-04 CB386-Skiena June 8, 2001 17:13 Char Count= 0
CALCULATED BETS
In addition to schedules of who was to play, we needed to interpret theresults of previous matches. Raw results files from Milford looked like this:
Milford Jai-alai Results
Afternoon Performance - Sunday July 19, 1998
Game 1 Doubles/7 pts Game 2 Singles/7 pts
8 Douglas-Aritz 29.70 16.50 6.90 1 Aja 21.30 8.70 5.40
4 Aitor-Arrieta 9.90 6.90 2 Douglas 8.40 4.20
1 Ara-Fitz 5.70 8 Aitor 12.00
Quiniela 4-8 $51.60 Quiniela 1-2 $45.60
Exacta 8-4 $69.00 Exacta 1-2 $102.90
Trifecta 8-4-1 $364.50 Trifecta 1-2-8 $640.80
The task of parsing results files is similar to that of parsing schedules.One important part of the result-parser’s job is to warn us of possible errorsin the files such as occasionally leaving out a decimal point in one of thenumbers. Thinking that an 8–4–1 trifecta once paid off $36,450 instead of$364.50 could trick the program into forever hoping to repeat an event thatnever actually occurred.
After parsing, we ended up with a results file like the following:
:FRONTON: Milford
:DAY: Sunday
:DATE: 07/19/1998
:GAME-COUNT: 15
:HANDLE: 172952
:ABSOLUTE-DATE: 35994
:GAME: 1
:S/D: Doubles
:POINTS: 7
:WIN: 8
:PLACE: 4
:SHOW: 1
:WINNER: Douglas-Aritz
:WINNER-ID: 14 65
:WIN-PRICES: 29.70 16.50 6.90
:PLACER: Aitor-Arrieta
:PLACER-ID: 12 51
:PLACE-PRICES: 9.90 6.90
76
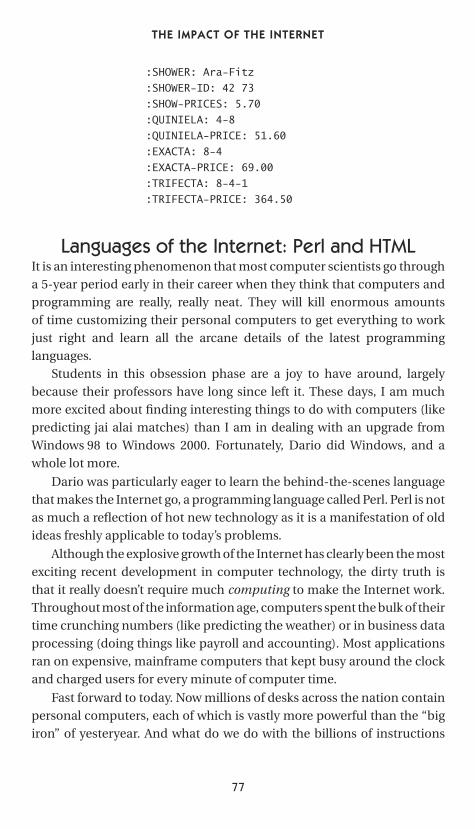
P1: FCH/FYX P2: FCH
cb386-04 CB386-Skiena June 8, 2001 17:13 Char Count= 0
THE IMPACT OF THE INTERNET
:SHOWER: Ara-Fitz
:SHOWER-ID: 42 73
:SHOW-PRICES: 5.70
:QUINIELA: 4-8
:QUINIELA-PRICE: 51.60
:EXACTA: 8-4
:EXACTA-PRICE: 69.00
:TRIFECTA: 8-4-1
:TRIFECTA-PRICE: 364.50
Languages of the Internet: Perl and HTMLIt is an interesting phenomenon that most computer scientists go througha 5-year period early in their career when they think that computers andprogramming are really, really neat. They will kill enormous amountsof time customizing their personal computers to get everything to workjust right and learn all the arcane details of the latest programminglanguages.
Students in this obsession phase are a joy to have around, largelybecause their professors have long since left it. These days, I am muchmore excited about finding interesting things to do with computers (likepredicting jai alai matches) than I am in dealing with an upgrade fromWindows 98 to Windows 2000. Fortunately, Dario did Windows, and awhole lot more.
Dario was particularly eager to learn the behind-the-scenes languagethat makes the Internet go, a programming language called Perl. Perl is notas much a reflection of hot new technology as it is a manifestation of oldideas freshly applicable to today’s problems.
Although the explosive growth of the Internet has clearly been the mostexciting recent development in computer technology, the dirty truth isthat it really doesn’t require much computing to make the Internet work.Throughout most of the information age, computers spent the bulk of theirtime crunching numbers (like predicting the weather) or in business dataprocessing (doing things like payroll and accounting). Most applicationsran on expensive, mainframe computers that kept busy around the clockand charged users for every minute of computer time.
Fast forward to today. Now millions of desks across the nation containpersonal computers, each of which is vastly more powerful than the “bigiron” of yesteryear. And what do we do with the billions of instructions
77
P1: FCH/FYX P2: FCH
cb386-04 CB386-Skiena June 8, 2001 17:13 Char Count= 0
CALCULATED BETS
per second that we have at our disposal? We run increasingly elaboratescreen-saving programs whose shimmering images decorate our desks asthey protect the phosphors on our monitors.
The truth is that the Internet is really about communication, not com-putation. Although the Worldwide Web has been dubbed the “World-wide Wait” because of sluggish response times, the primary source ofthese delays is not insufficient processing power but the problem of toomany people trying to use too few dedicated telephone lines – all at thesame time.
An embarrassingly high percentage of the computing tasks associatedwith the Worldwide Web are basic bookkeeping and simple text refor-matting. Perl is a language designed to make writing these conversiontasks as simple and painless as possible. Depending upon whom you be-lieve, Perl is an acronym for either “practical extracting and reporting lan-guage” or “pathologically eclectic rubbish lister.” The goal of its creator,Larry Wall, was to “make the easy jobs easy, without making the hard jobsimpossible.”
Perl programs are not particularly efficient, but they are particularlyshort. They are designed to be written quickly, plugged in place, and forgot-ten. No one would think of building a Monte Carlo simulation to simulatea million jai alai games in Perl because such high-performance number-crunching jobs must be carefully written to utilize the machine efficiently.Perl is for those quick-and-dirty, hit-and-run reformatting tasks that helpprogrammers untangle the Web.
One of the common text-processing tasks in which Perl scripts areused is preparing WWW pages on demand from databases. Look up yourfavorite book (ideally, look up my book) on Amazon.com or some otheron-line book dealer and you will see a customized page with the title andpublisher, a picture of the cover, reader-supplied reviews, and even thecurrent rank on the company’s bestsellers’ list. This WWW page was notwritten by a person but a computer program that extracts the relevantinformation from the database and adds formatting commands to makeit look right on the reader’s screen.
A second language of the Internet is HTML, an abbreviation for the“hypertext markup language.” HTML is the language in which all WWWpages are written, that is, the text spit out by Amazon.com’s Perl programs.It really isn’t a computer programming language at all, for you can’t writea program in HTML to do anything. This language provides a medium for
78
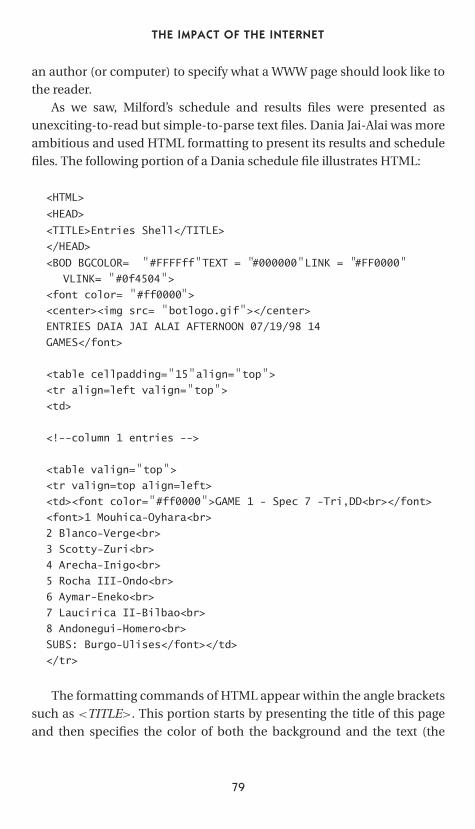
P1: FCH/FYX P2: FCH
cb386-04 CB386-Skiena June 8, 2001 17:13 Char Count= 0
THE IMPACT OF THE INTERNET
an author (or computer) to specify what a WWW page should look like tothe reader.
As we saw, Milford’s schedule and results files were presented asunexciting-to-read but simple-to-parse text files. Dania Jai-Alai was moreambitious and used HTML formatting to present its results and schedulefiles. The following portion of a Dania schedule file illustrates HTML:
<HTML>
<HEAD>
<TITLE>Entries Shell</TITLE>
</HEAD>
<BODY BGCOLOR= " #FFFFff" TEXT = "#000000" LINK = "#FF0000"
VLINK= " #0f4504" ><font color= " #ff0000" ><center><img src= " botlogo.gif" ></center>ENTRIES DANIA JAI ALAI AFTERNOON 07/19/98 14
GAMES</font>
<table cellpadding=" 15" align=" top" ><tr align=left valign=" top" ><td>
<!--column 1 entries -->
<table valign=" top" ><tr valign=top align=left>
<td><font color=" #ff0000" >GAME 1 - Spec 7 -Tri,DD<br></font>
<font>1 Mouhica-Oyhara<br>
2 Blanco-Verge<br>
3 Scotty-Zuri<br>
4 Arecha-Inigo<br>
5 Rocha III-Ondo<br>
6 Aymar-Eneko<br>
7 Laucirica II-Bilbao<br>
8 Andonegui-Homero<br>
SUBS: Burgo-Ulises</font></td>
</tr>
The formatting commands of HTML appear within the angle bracketssuch as <TITLE>. This portion starts by presenting the title of this pageand then specifies the color of both the background and the text (the
79
P1: FCH/FYX P2: FCH
cb386-04 CB386-Skiena June 8, 2001 17:13 Char Count= 0
CALCULATED BETS
actual colors are described by “names” like #ff0000). It then specifies that apicture named “botlogo” should be inserted, neatly centered in the middleof the line. The schedule of each game is formatted as a table in whicheach row presents the post number and the two members of each doublesteam.
This HTML formatting may seem ungainly, but you weren’t intendedto read it – your WWW browser was. It would be tedious for a person towrite all those formatting commands each day, but that was done by aPerl program, not a person. As is the case with Amazon.com, these WWWpages are produced by formatting the information in a database using astraightforward computer program. Because a computer program writesthe actual HTML files, we can rely on the format to be the same day to daywithout any typing or formatting errors.
My student Dario did not have access to the fronton’s private databasecontaining the unformatted schedule and result information. However, hedid have access to these HTML pages. By writing his own Perl program,he could carefully strip away all that formatting the fronton’s program haddiligently inserted. He could take the remaining data and format it just aswe did with the Milford data, enabling us to add it each day to our libraryof jai alai scores. Once we had amassed enough data to work with, our funcould really begin.
Any discussion of the languages of the Internet would be incompletewithout mentioning Java. At the risk of slightly oversimplifying things, Javais a programming language for writing programs that will run on somebodyelse’s machine, typically using an Internet browser.
For example, suppose I want to put a facility on the WWW enablingyou to calculate the amount of money you will pay each month if you takeout a mortgage. I could create a WWW page that would prompt you to typein the interest rate, loan amount, and term of the loan, then calculate thenumber on my machine, and send this number to you on your machine.Alternatively, I could write a little program in Java my machine could giveyour machine, which, when run on your machine, would prompt you forthe relevant numbers and do the calculation there. This second arrange-ment is better for me, in that it reduces the amount of interaction on mymachine, and also better for you because I don’t get to know how muchmoney you are thinking of embezzling from the bank.
We don’t use Java anywhere in our system because there is no programwe want to run on somebody else’s machine, and because no fronton’s
80
P1: FCH/FYX P2: FCH
cb386-04 CB386-Skiena June 8, 2001 17:13 Char Count= 0
THE IMPACT OF THE INTERNET
WWW site provides a program that we want to run (as opposed to data,which we want to read). Still, Java is a good thing. In fact, it is such a goodthing that Microsoft devoted considerable energy and resources trying tokill it.
Why Real Programmers Hate MicrosoftAs the 900-pound gorilla of the software industry, Microsoft finds itselfthe subject of a great deal of attention. Always welcome is the interest ofinvestors, whose enthusiasm has caused its stock to split each year likeclockwork. Completely unwelcome has been the interest of the JusticeDepartment, whose antitrust unit seeks to split the company instead ofthe stock.
It is fair to say that most real computer programmers hate Microsoft,but I’ve had a hard time explaining why to my nontechie friends. Mostcomputer programmers have a warm spot in their heart for high-techcompanies like Sun Microsystems, Netscape, Cisco, Apple Computer, andeven Intel, but not for Microsoft. The usual motives for hatred (jealousy,fear, resentment) don’t really suffice to explain this phenomenon:
■ Jealousy – Why should I be jealous of their success? Hell, I’m proud tosay I own some stock in Microsoft – enough to make me some moneybut not so much that I still can’t root against them in the marketplace.
■ Fear – What do I have to fear? I’m a tenured professor of computer sci-ence, and thus I have no reason to fear Microsoft will eat mylunch. This is one business Microsoft has shown no evidence of get-ting into. Indeed, Bill Gates has even donated money to Harvard andthe University of Washington for new buildings to better house theirexcellent computer science departments. By the way, we could use anew building at Stony Brook, too, Bill.
■ Resentment – Sure, Microsoft can be a pushy, arrogant company to dobusiness with. It is well-known that no other company ever got richdealing with Microsoft. But I don’t have to deal with them. Some of myfavorite former students have gone on to work for them. I wish themnothing but the best and indeed hope that they remember their almamater when it comes time to be looking for tax shelters.
No, the usual reasons don’t explain why real programmers hateMicrosoft. The real problem is the unhealthy degree of control Microsoftexerts in shaping the way the rest of the computer world does business.
81
P1: FCH/FYX P2: FCH
cb386-04 CB386-Skiena June 8, 2001 17:13 Char Count= 0
CALCULATED BETS
Its marketshare of the personal computer world is so high that it preventsthe rest of the industry from doing new and interesting things.
These are strong words, but let me make things clear. Our entire jai alaiproject could never have happened if Microsoft controlled the Internet theway it does the personal computer world.
Why? The technical foundations of the Internet are a series of softwarestandards enabling different hardware and software systems to talk to eachother. As long as each component adheres to the standards, everyone canunderstand each other.
Back in the days when the public thought the Internet was an envi-ronmentally unsound practice of the fishing industry, the Internet was de-signed and run by a small group of techies who had no proprietary interestin the standards it employed. To establish a standard, you had to convincethe other techies that your standard was better than theirs through opendiscussions. Eventually the community would reach a consensus, and thestandard was adopted.
The language in which WWW pages are written, HTML, is perhaps themost familiar of these Internet technical standards. The goals of HTMLwere to make it easy to read and write WWW pages. Formatting commandsare embedded within the raw text to be displayed, describing where to startparagraphs and how bold to make the titles.
Because HTML was designed as an open standard, it has no secretsto hide. Because every WWW page is written in an easy-to-understandlanguage, any mortal can look at someone else’s WWW page to see how heor she got it to look that way. This is nice. Want to know how to make a titleblink on and off? Go to the WWW page of someone whose title is blinkingand then view the source code to see how this was done. This open sourcepolicy makes it easy to learn from others, which is clearly a good thing forthe entire community.
Our jai alai project got off the ground precisely because HTML is anopen source language. Sure, the frontons that posted schedules and re-sults each day only intended for these files to be viewed on the screen bypotential bettors. However, because we were able to get the original HTMLsource files and parse them easily, we could understand the structure ofthe data they encoded. Because everything was open, clear, and consis-tent, we could write a parser to extract the information we wanted fromeach file and thus gather the statistics we needed. Although the potentialof such open source documents was certainly not forseen by the frontons,
82
P1: FCH/FYX P2: FCH
cb386-04 CB386-Skiena June 8, 2001 17:13 Char Count= 0
THE IMPACT OF THE INTERNET
it proved to be in their interest because we have placed a substantial num-ber of bets with them via our program. The open standard enriches all byencouraging new ideas and applications.
Now let us return to Microsoft. It is the purveyor of the most dominantoperating system in the world, running on 97% of all personal computers.Because Microsoft controls the software on the bulk of the machines outthere, it is in a position to enforce whatever standards it wishes. SupposeMicrosoft were to come out with a new standard “Microsoft-HTML,” whichits software used instead of real HTML. If you wanted your WWW pagevisible on 97% of the computers in the world, you would have to make itwork with the Microsoft product. If you wanted to view all these WWWpages, you had better buy the Microsoft product because it is the onlycompany supporting this new standard.
This creates two serious problems:
■ Quality and consensus are no longer part of the standards process –There is no inherent reason the Microsoft standard has to be technicallybetter to triumph in the marketplace. English is not an inherently betterlanguage than Serbo–Croatian, but because it is the standard morepeople write books in English than Serbo–Croatian. Because Microsofthas a monopoly, it can do whatever it pleases, and produce the de factostandard. With the appropriate changes to Microsoft Word, we couldall be forced to write in hieroglyphics.
Whenever another company comes up with a new or better ideafor a standard, Microsoft always chooses to “embrace and extend” thestandard, as it has done with Sun Microsystem’s programming lan-guage Java. But this is the embrace of death, because these extensionsserve primarily to make Microsoft’s version incompatible with the restof the world.
■ Microsoft has incentive to make its standards as obscure as possible –A Microsoft standard analagous to HTML is the file format for MicrosoftWord. Both provide ways to format text to make it look the way you wantit to. But is the Microsoft standard open?
Microsoft assumes that its users don’t care what technical stan-dards are used behind the hood – they just want to get their job done.Indeed, Microsoft products are great if you want to do exactly whatMicrosoft wants you to do. But can you take someone else’s Word fileand use it to figure out how to make your Word document look like that?
83
P1: FCH/FYX P2: FCH
cb386-04 CB386-Skiena June 8, 2001 17:13 Char Count= 0
CALCULATED BETS
No, because the Word file format does not produce human-readablesource. If you try to view a raw Word file on your screen, it will producecountless beeps and strings of gobledygook because of the machine-only control characters. You would learn nothing by reading it even ifyou could.
This problem is compounded because, instead of seeking clarity,Microsoft has an actual incentive to use as obscure and proprietarystandards as possible. The Word file standard is defined by exactlywhat Microsoft’s program reads. Why should Microsoft want to makeit easier for other companies to use this format? Better you should bestuck using Microsoft-only software! Sure, technological and businessopportunities will be lost because our standards are so restrictive, butthey are lost primarily to the other guy.
So, what can be done about Microsoft? Either it is going to have to learnsome manners, or else the real programmers of the world will eventuallyhave to surrender. The former doesn’t seem likely to happen unless theJustice Department succeeds in breaking up the company. The latter ishighly undesirable because, frankly, it is the real programmers of the worldwho contribute the innovations for Microsoft to “embrace and extend.”And it seems so unnecessary. Other corporations, like Sun Microsystems,have carved out very nice businesses while technically doing the rightthing.
That, and not jealousy, is the reason real programmers hate Microsoft.
84
P1: FCH/FYX P2: FCH
cb386-05 CB386-Skiena June 9, 2001 14:10 Char Count= 0
CHAPTER FIVE
IS THIS BUM ANY GOOD?
Every morning at 2 A.M., as professors sleep and graduate students arrive topull all-nighters, my computer diligently makes the rounds of the Websitesof all major frontons, downloading the latest schedules and results andthen running these files through Dario’s parsing programs. After a fewmonths of retrieval we had built a large-enough collection of jai alai data tojustify some serious analysis. Our goal was to use all this data to measure therelative abilities of jai alai players and incorporate this information into ourMonte Carlo simulation to make customized predictions for each match.
To get this job done, I had to bring another student on to the project,Meena Nagarajan. Meena was a different type of student than Dario. As amarried woman with a young child, she realized that there are other thingsto life besides computers. She was returning to school to get her master’sdegree with the express goal of getting a lucrative job with a financialservices company associated with Wall Street, as indeed she ultimatelydid. She realized that building a program-trading system for jai alai was agreat way to learn how to build one for trading stocks, and she thereforesigned on to work on the project.
Her undergraduate degree back in India was in applied mathem-atics; thus, she brought to the table an understanding of the meaningand limitations of statistics.
85
P1: FCH/FYX P2: FCH
cb386-05 CB386-Skiena June 9, 2001 14:10 Char Count= 0
CALCULATED BETS
Probability versus StatisticsProbability and statistics are related areas of mathematics that concernthemselves with analyzing the relative frequency of events. Still, there arefundamental differences in the way they see the world:
■ Probability deals with predicting the likelihood of future events,whereas statistics involves the analysis of the frequency of pastevents.
■ Probability is primarily a theoretical branch of mathematics that stud-ies the consequences of mathematical definitions. Statistics is pri-marily an applied branch of mathematics that tries to make sense ofobservations in the real world.
Both subjects are important, relevant, and useful. But they are differ-ent, and understanding the distinction is crucial in properly interpretingthe relevance of mathematical evidence. Many a gambler has gone to acold and lonely grave for failing to make the proper distinction betweenprobability and statistics.
This distinction will perhaps become clearer if we trace the thoughtprocess of a mathematician encountering a craps game for the firsttime:
■ If this mathematician were a probabilist, he or she would see the diceand think, “Six-sided dice? Presumably each face of the dice is equallylikely to land face up. Now assuming that each face comes up withprobability 1/6, I can figure out what my chances are of crappingout.”
■ If, instead, a statistician wandered by, he or she would see the dice andthink, “Those dice may look OK, but how do I know that they are notloaded? I’ll watch a while, and keep track of how often each numbercomes up. Then I can decide if my observations are consistent withthe assumption of equal-probability faces. Once I’m confident enoughthat the dice are fair, I’ll call a probabilist to tell me how to play.”
In summary, probability theory enables us to find the consequencesof a given ideal world, whereas statistical theory permits us to to measurethe extent to which our world is ideal.
Modern probability theory emerged from the dice tables of Francein 1654. Chevalier de Mere, a French nobleman, wondered whether the
86
P1: FCH/FYX P2: FCH
cb386-05 CB386-Skiena June 9, 2001 14:10 Char Count= 0
IS THIS BUM ANY GOOD?
player or the house had the advantage in a variation of the following bettinggame.1 In the basic version, the player rolls four dice and wins providednone of them are a six. The house collects on the even money bet if at leastone six appears.
De Mere brought this problem to attention of the French mathemati-cians Blaise Pascal and Pierre de Fermat, most famous as the source ofFermat’s last theorem. Together, these men worked out the basics of prob-ability theory and established along the way that the house wins the basicversion with probability p = 1 − (5/6)4 ≈ 0.517, where the prob-ability p = 0.5 denotes a fair game in which the house wins exactly half thetime.
The jai alai world of our Monte Carlo simulation assumes that we decidethe outcome of a point between two teams by flipping a suitably biasedcoin. If this world were reality, our simulation would compute the correctprobability of each possible betting outcome. But all players are not cre-ated equal, of course. By doing a statistical study of the outcome of all thematches involving a particular player, we can determine an appropriateamount to bias the coin.
But such computations only make sense if our simulated jai alai worldis a model consistent with the real world. John von Neumann once saidthat “the valuation of a poker hand can be sheer mathematics.” We haveto reduce our evaluation of a pelotari to sheer mathematics.
Jai Alai Players and Baseball PlayersHow much of an influence does player skill have on the outcome of a jai alaimatch? Obviously this depends upon how great the skill difference betweenthe players is. I am quite confident that the worst professional player, withhis leg in a cast, would crush me 1001 times if we played a series of 1000games against each other. The real question is whether the relatively minordifferences in player skills on the professional level translate in a significantdifference in the likelihood that the better player wins.
It is a simple matter to program our computer to tabulate the numberof wins that each player had over the past year, but is the most successfulplayer really most skillful? What is the right time span over which to an-alyze such statistics to measure the best current player? It needs to be along enough time for the totals to be statistically significant i.e., for such
1 He really shouldn’t have wondered. The house always has the advantage.
87
P1: FCH/FYX P2: FCH
cb386-05 CB386-Skiena June 9, 2001 14:10 Char Count= 0
CALCULATED BETS
random events as off-days and lucky bounces to cancel themselves out.And yet it cannot be too long a time interval, for certain player’s skills willimprove with training and experience whereas those of others erode withinjury and aging.
There is clearly anecdotal evidence that certain jai alai players arebetter than other players. Joey, perhaps the greatest American jai alai playerever, led the Dania fronton in wins an amazing eight consecutive seasonsfrom 1985 to 1989. (There are two seasons per year.) A look at the top10 players at any fronton will reveal many names in common with the listfrom the previous year.
Table 5.1 shows significant variation in the success rate of players atMilford in 1998. Lander (a big star) won 16.3% of his games that year, whichis a rate close to double that of Alberto (9.8%). Aragues was in the money(win, place, or show) 42.1% of the time, whereas the supporters of Tinowere rewarded on only 32.9% of show bets.
Most Americans have a finely developed statistical sense about base-ball. Let’s use that sense to gain better intuition about the impact of playerskills in jai alai. Baseball batting averages are well known to be mean-ingful statistics; indeed, a .300 hitter is the classical definition of a starplayer. Achieving a .300 average means that you managed to get 3 hitsevery 10 times at bat. Players’ batting averages fluctuate over the seasonbecause they have good and bad games. So how successful is a player’scurrent batting average at predicting how he will do in the future?
I will use batting averages from 1996 and 1997 to get a handle onthis situation by building a scatterplot of the data (see Figure 5.1). Eachdata point represents the statistics of one particular player. Each of themajor league baseball players who played regularly in both 1996 and 1997(defined as at least 400 at bats each season) is represented by an (x, y)point, where x is the 1996 average and y is the 1997 average.
Let’s think about what this means. If baseball players were completelyconsistent year to year, the two values would be identical, meaning thateach point would lie perfectly on the diagonal line y = x. If batting av-erages were completely random and one year’s performance completelyindependent of the next year’s performance, these points would jumparound like the darts we threw at Picasso’s painting.
What my scatterplots show is that batting averages are fairly consistentfrom year to year. Eyeballing both the left (American League) and right
88
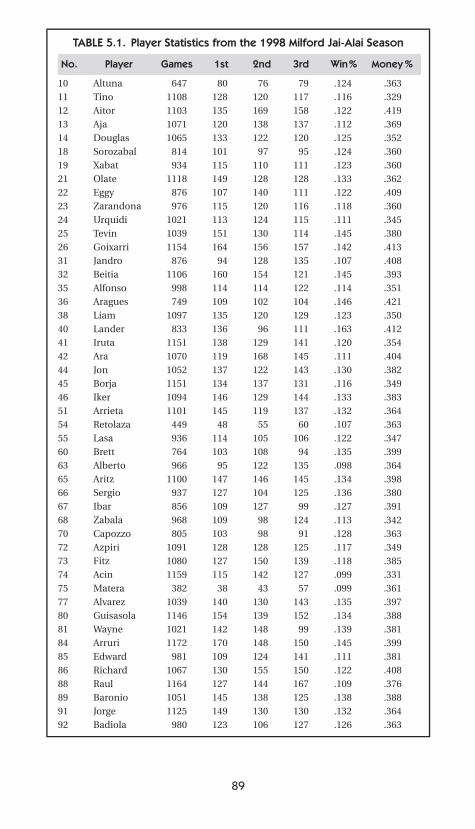
P1: FCH/FYX P2: FCH
cb386-05 CB386-Skiena June 9, 2001 14:10 Char Count= 0
TABLE 5.1. Player Statistics from the 1998 Milford Jai-Alai Season
No. Player Games 1st 2nd 3rd Win% Money%
10 Altuna 647 80 76 79 .124 .36311 Tino 1108 128 120 117 .116 .32912 Aitor 1103 135 169 158 .122 .41913 Aja 1071 120 138 137 .112 .36914 Douglas 1065 133 122 120 .125 .35218 Sorozabal 814 101 97 95 .124 .36019 Xabat 934 115 110 111 .123 .36021 Olate 1118 149 128 128 .133 .36222 Eggy 876 107 140 111 .122 .40923 Zarandona 976 115 120 116 .118 .36024 Urquidi 1021 113 124 115 .111 .34525 Tevin 1039 151 130 114 .145 .38026 Goixarri 1154 164 156 157 .142 .41331 Jandro 876 94 128 135 .107 .40832 Beitia 1106 160 154 121 .145 .39335 Alfonso 998 114 114 122 .114 .35136 Aragues 749 109 102 104 .146 .42138 Liam 1097 135 120 129 .123 .35040 Lander 833 136 96 111 .163 .41241 Iruta 1151 138 129 141 .120 .35442 Ara 1070 119 168 145 .111 .40444 Jon 1052 137 122 143 .130 .38245 Borja 1151 134 137 131 .116 .34946 Iker 1094 146 129 144 .133 .38351 Arrieta 1101 145 119 137 .132 .36454 Retolaza 449 48 55 60 .107 .36355 Lasa 936 114 105 106 .122 .34760 Brett 764 103 108 94 .135 .39963 Alberto 966 95 122 135 .098 .36465 Aritz 1100 147 146 145 .134 .39866 Sergio 937 127 104 125 .136 .38067 Ibar 856 109 127 99 .127 .39168 Zabala 968 109 98 124 .113 .34270 Capozzo 805 103 98 91 .128 .36372 Azpiri 1091 128 128 125 .117 .34973 Fitz 1080 127 150 139 .118 .38574 Acin 1159 115 142 127 .099 .33175 Matera 382 38 43 57 .099 .36177 Alvarez 1039 140 130 143 .135 .39780 Guisasola 1146 154 139 152 .134 .38881 Wayne 1021 142 148 99 .139 .38184 Arruri 1172 170 148 150 .145 .39985 Edward 981 109 124 141 .111 .38186 Richard 1067 130 155 150 .122 .40888 Raul 1164 127 144 167 .109 .37689 Baronio 1051 145 138 125 .138 .38891 Jorge 1125 149 130 130 .132 .36492 Badiola 980 123 106 127 .126 .363
89
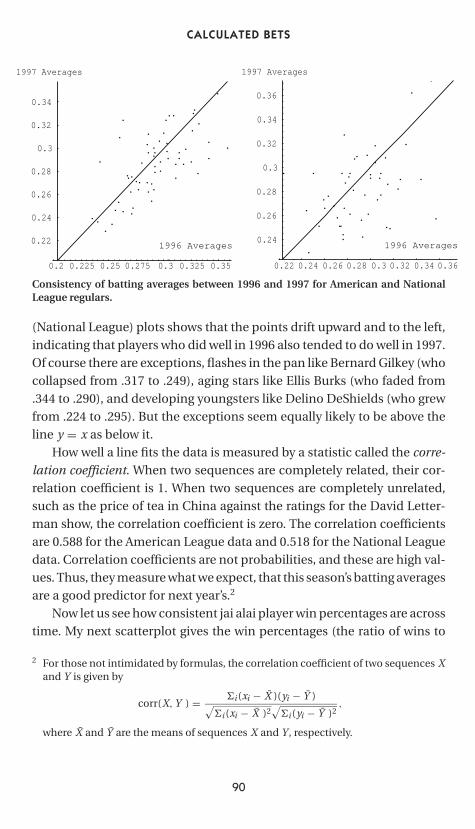
P1: FCH/FYX P2: FCH
cb386-05 CB386-Skiena June 9, 2001 14:10 Char Count= 0
CALCULATED BETS
0.2 0.225 0.25 0.275 0.3 0.325 0.35
1996 Averages0.22
0.24
0.26
0.28
0.3
0.32
0.34
1997 Averages
0.22 0.24 0.26 0.28 0.3 0.32 0.34 0.36
1996 Averages0.24
0.26
0.28
0.3
0.32
0.34
0.36
1997 Averages
Consistency of batting averages between 1996 and 1997 for American and NationalLeague regulars.
(National League) plots shows that the points drift upward and to the left,indicating that players who did well in 1996 also tended to do well in 1997.Of course there are exceptions, flashes in the pan like Bernard Gilkey (whocollapsed from .317 to .249), aging stars like Ellis Burks (who faded from.344 to .290), and developing youngsters like Delino DeShields (who grewfrom .224 to .295). But the exceptions seem equally likely to be above theline y = x as below it.
How well a line fits the data is measured by a statistic called the corre-lation coefficient. When two sequences are completely related, their cor-relation coefficient is 1. When two sequences are completely unrelated,such as the price of tea in China against the ratings for the David Letter-man show, the correlation coefficient is zero. The correlation coefficientsare 0.588 for the American League data and 0.518 for the National Leaguedata. Correlation coefficients are not probabilities, and these are high val-ues. Thus, they measure what we expect, that this season’s batting averagesare a good predictor for next year’s.2
Now let us see how consistent jai alai player win percentages are acrosstime. My next scatterplot gives the win percentages (the ratio of wins to
2 For those not intimidated by formulas, the correlation coefficient of two sequences Xand Y is given by
corr(X, Y ) = �i (xi − X )(yi − Y )√
�i (xi − X )2√
�i (yi − Y )2,
where X and Y are the means of sequences X and Y , respectively.
90
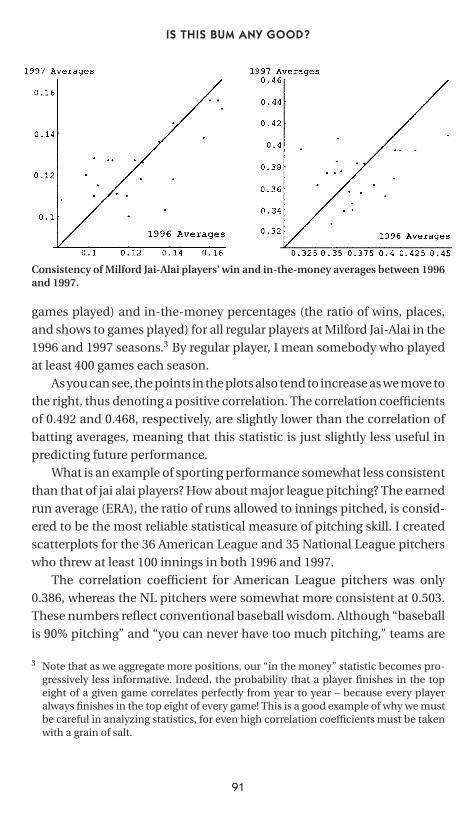
P1: FCH/FYX P2: FCH
cb386-05 CB386-Skiena June 9, 2001 14:10 Char Count= 0
IS THIS BUM ANY GOOD?
Consistency of Milford Jai-Alai players’ win and in-the-money averages between 1996and 1997.
games played) and in-the-money percentages (the ratio of wins, places,and shows to games played) for all regular players at Milford Jai-Alai in the1996 and 1997 seasons.3 By regular player, I mean somebody who playedat least 400 games each season.
As you can see, the points in the plots also tend to increase as we move tothe right, thus denoting a positive correlation. The correlation coefficientsof 0.492 and 0.468, respectively, are slightly lower than the correlation ofbatting averages, meaning that this statistic is just slightly less useful inpredicting future performance.
What is an example of sporting performance somewhat less consistentthan that of jai alai players? How about major league pitching? The earnedrun average (ERA), the ratio of runs allowed to innings pitched, is consid-ered to be the most reliable statistical measure of pitching skill. I createdscatterplots for the 36 American League and 35 National League pitcherswho threw at least 100 innings in both 1996 and 1997.
The correlation coefficient for American League pitchers was only0.386, whereas the NL pitchers were somewhat more consistent at 0.503.These numbers reflect conventional baseball wisdom. Although “baseballis 90% pitching” and “you can never have too much pitching,” teams are
3 Note that as we aggregate more positions, our “in the money” statistic becomes pro-gressively less informative. Indeed, the probability that a player finishes in the topeight of a given game correlates perfectly from year to year – because every playeralways finishes in the top eight of every game! This is a good example of why we mustbe careful in analyzing statistics, for even high correlation coefficients must be takenwith a grain of salt.
91
P1: FCH/FYX P2: FCH
cb386-05 CB386-Skiena June 9, 2001 14:10 Char Count= 0
CALCULATED BETS
2 3 4 5 6
1996 Averages
3
4
5
6
1997 Averages
2 3 4 5 6
1996 Averages2
3
4
5
6
1997 Averages
Consistency of earned run averages between 1996 and 1997 for American and NationalLeague pitchers.
historically much more reluctant to offer long-term contracts to pitchersthan hitters. Their level of consistency just isn’t the same. The differencebetween leagues may reflect the impact of the designated hitter rule.National League pitchers are often removed for pinch hitters, more sharplylimiting how long they work in a typical ballgame. There is less incentiveto remove an American League pitcher, and the accumulated work maywear him down over several seasons.
These numbers tell us something important about jai alai players. Starjai-alai players dominate their sport to about the same degree as star base-ball players. Any reasonable system for predicting baseball games accountsfor the difference in quality between the two team’s players. Therefore, oursystem has to factor in the abilities of the players, not just post positions.
Estimating Player Skill from StatisticsHow can we construct a useful measure of player skill from publishedstatistics? We can’t just use a player’s win or in-the-money percentage, oreven some combination of the two, as this measure. We need some numberwe can stick in our Monte Carlo simulation to tell us what the probabilityis that a given player (or team) P1 beats another player (or team) P2. Thenumber of game wins is, by itself, fairly meaningless in terms of pointwins. This is like using total wealth to estimate yearly salary. Sure, thereis some correlation, but retired people and professional heirs have largewealth with no earned income, whereas compulsive gamblers can havelarge salaries but no wealth. We needed a way to estimate the point-winpercentages accurately to enable our system to accumulate wealth.
92
P1: FCH/FYX P2: FCH
cb386-05 CB386-Skiena June 9, 2001 14:10 Char Count= 0
IS THIS BUM ANY GOOD?
Ideally, frontons would publish statistics on each player’s point-winpercentage, and thus we could use them directly. In fact, such statistics arekept but not published. The assignments of players to post positions aremade by the fronton’s player-manager, who traditionally handicaps thebest players by putting them in the less desirable post positions. Player-managers keep track of point-win statistics to help in scheduling compet-itive matches, but unfortunately they keep these statistics to themselves.
So what information do we have at our disposal? Via the Internet, wehave the schedules and results for all the games each player has played forthe past year. For each player in every game, we know that player’s initialpost position and whether he finished first, second, or third. Unfortunately,the published results don’t give the rest of the order, that is, the scores ofplayers who don’t win money.
It would be impractical for us to watch and tabulate the points scoredby real jai alai players. But we can watch simulated players and see whathappens to them. We played 1,000,000 simulated jai alai games and kepttrack of what every player scored from each starting position. We brokethese down into a table of the points scored by simulated players (eachof whom has equal likelihood of scoring) according to what post positionthey started in and where they finished. What can we observe?
■ Winners score more points on average than second- or third-placefinishers, as one would expect. But the percentage of points scored bywinners varies significantly, depending on their initial post position.
Percentage of Points Won by Post Position and Outcome over 1,000,000Random Games
Winner Placer Shower Other
Position % won total % won total % won total % won total
1 78.77% 966,964 63.52% 935,382 51.76% 774,133 27.26% 1,751,1422 78.58% 950,603 63.29% 918,901 51.65% 766,861 26.73% 1,759,2893 79.58% 797,630 66.16% 844,317 54.63% 729,834 27.91% 1,858,4554 81.59% 700,431 67.75% 668,502 57.64% 665,485 29.45% 1,923,1855 82.94% 574,348 70.32% 559,439 60.72% 610,894 30.83% 1,935,4716 85.84% 545,218 70.18% 391,145 63.09% 509,161 31.80% 1,852,3447 87.21% 471,896 72.05% 411,541 63.89% 414,517 31.76% 1,764,0618 89.44% 528,948 70.41% 309,496 62.75% 346,252 29.96% 1,513,216
all 82.08% 5,536,038 66.88% 5,038,723 57.16% 4,817,137 29.48% 14,357,163
93
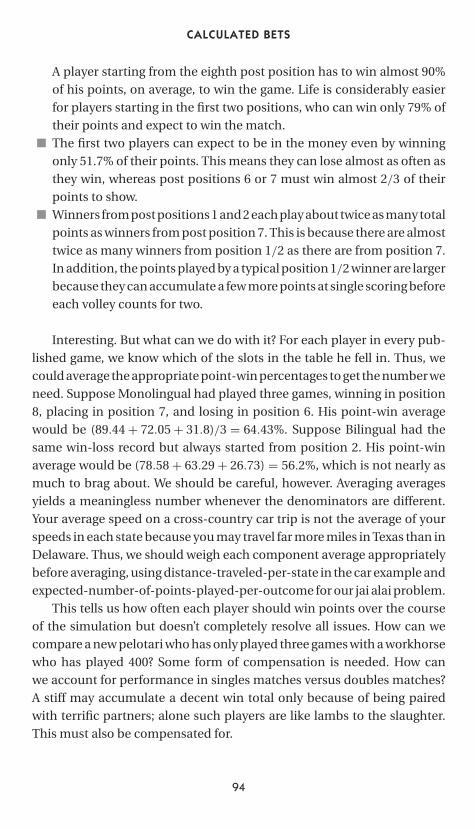
P1: FCH/FYX P2: FCH
cb386-05 CB386-Skiena June 9, 2001 14:10 Char Count= 0
CALCULATED BETS
A player starting from the eighth post position has to win almost 90%of his points, on average, to win the game. Life is considerably easierfor players starting in the first two positions, who can win only 79% oftheir points and expect to win the match.
■ The first two players can expect to be in the money even by winningonly 51.7% of their points. This means they can lose almost as often asthey win, whereas post positions 6 or 7 must win almost 2/3 of theirpoints to show.
■ Winners from post positions 1 and 2 each play about twice as many totalpoints as winners from post position 7. This is because there are almosttwice as many winners from position 1/2 as there are from position 7.In addition, the points played by a typical position 1/2 winner are largerbecause they can accumulate a few more points at single scoring beforeeach volley counts for two.
Interesting. But what can we do with it? For each player in every pub-lished game, we know which of the slots in the table he fell in. Thus, wecould average the appropriate point-win percentages to get the number weneed. Suppose Monolingual had played three games, winning in position8, placing in position 7, and losing in position 6. His point-win averagewould be (89.44 + 72.05 + 31.8)/3 = 64.43%. Suppose Bilingual had thesame win-loss record but always started from position 2. His point-winaverage would be (78.58 + 63.29 + 26.73) = 56.2%, which is not nearly asmuch to brag about. We should be careful, however. Averaging averagesyields a meaningless number whenever the denominators are different.Your average speed on a cross-country car trip is not the average of yourspeeds in each state because you may travel far more miles in Texas than inDelaware. Thus, we should weigh each component average appropriatelybefore averaging, using distance-traveled-per-state in the car example andexpected-number-of-points-played-per-outcome for our jai alai problem.
This tells us how often each player should win points over the courseof the simulation but doesn’t completely resolve all issues. How can wecompare a new pelotari who has only played three games with a workhorsewho has played 400? Some form of compensation is needed. How canwe account for performance in singles matches versus doubles matches?A stiff may accumulate a decent win total only because of being pairedwith terrific partners; alone such players are like lambs to the slaughter.This must also be compensated for.
94
P1: FCH/FYX P2: FCH
cb386-05 CB386-Skiena June 9, 2001 14:10 Char Count= 0
IS THIS BUM ANY GOOD?
Yet another consideration is the trade-off between serving versus re-ceiving. In many racket sports, the server has a considerable advantageover the receiver. Certain tennis players, such as Goran Ivanisevic, haverocket serves but are relatively clueless if someone manages to hit the ballback to them. This effect in jai alai is not so pronounced. In fact, it ap-pears that the receiving player has a small advantage over the server. Thisis suggested by the minor differences between the actual results of postpositions 1 and 2 in the table on page 53. Unless you prefer a blue uniformto a red one, the only real difference between starting in 1 or 2 is that player1 initially serves to player 2. Because post position 2 is slightly more suc-cessful in real life than player 1, presumably this server bias plays a smallrole in the outcome.
The Beauty of CurvesAlthough the French philosopher Descartes is best known for his state-ment “I think; therefore, I am,” his enduring accomplishment is Cartesiangeometry, the geometry of graphs drawn on an x–y plane. If you believethat souls live when instantiated in the memory of a living person, you cansay of Descartes that “I graph, so he is.”
Much of mathematics since Descartes can be described as the quest forsimple descriptions of interesting curves. The simplest types of curves arestraight lines, which can be described on a graph using linear functions,that is, formulas of the form y = a · x + b for given constants a and b.Linear functions are simple to work with and very useful in describingmany aspects of the world. The linear function y = (9/5)x + 32 describeshow to convert a temperature x in degrees Celsius to the temperature yin degrees Fahrenheit. For example, the boiling point of water is (9/5) ×100 + 32 = 212 degrees Fahrenheit, whereas the freezing point is ((9/5) ×0 + 32 = 32 Fahrenheit. Similar linear functions are used to convert frominches to meters, pounds to kilograms, and euros to yen.
Although linear functions are good things, not all functions areaccurately described by straight lines.4 In particular, straight lines do alousy job of approximating undulating curves such as the value of theDow–Jones industrial average as a function of time. One way to try to pre-dict the stock market would be to find a curve whose shape is as close
4 A cynical mathematician’s joke states that the best way to prove that a function is linearis to sample it at only two points.
95
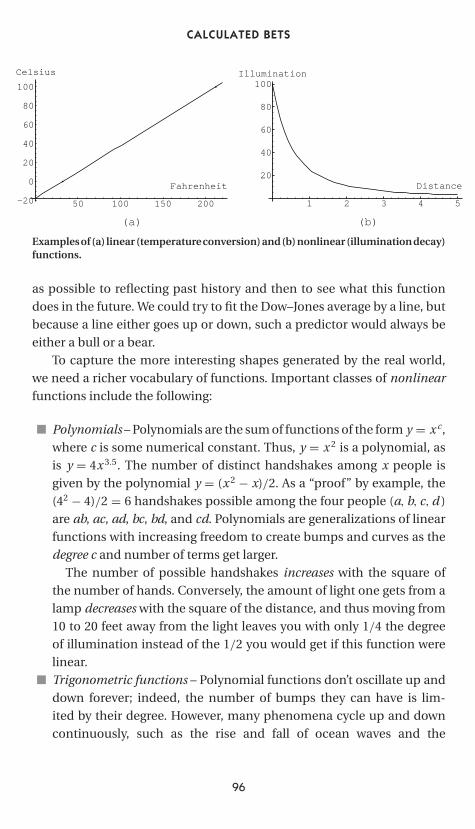
P1: FCH/FYX P2: FCH
cb386-05 CB386-Skiena June 9, 2001 14:10 Char Count= 0
CALCULATED BETS
50 100 150 200
Fahrenheit
-20
0
20
40
60
80
100
Celsius
1 2 3 4 5
Distance20
40
60
80
100Illumination
(a) (b)
Examples of (a) linear (temperature conversion) and (b) nonlinear (illumination decay)functions.
as possible to reflecting past history and then to see what this functiondoes in the future. We could try to fit the Dow–Jones average by a line, butbecause a line either goes up or down, such a predictor would always beeither a bull or a bear.
To capture the more interesting shapes generated by the real world,we need a richer vocabulary of functions. Important classes of nonlinearfunctions include the following:
■ Polynomials – Polynomials are the sum of functions of the form y = x c,where c is some numerical constant. Thus, y = x 2 is a polynomial, asis y = 4x 3.5. The number of distinct handshakes among x people isgiven by the polynomial y = (x 2 − x)/2. As a “proof” by example, the(42 − 4)/2 = 6 handshakes possible among the four people (a, b, c, d )are ab, ac, ad, bc, bd, and cd. Polynomials are generalizations of linearfunctions with increasing freedom to create bumps and curves as thedegree c and number of terms get larger.
The number of possible handshakes increases with the square ofthe number of hands. Conversely, the amount of light one gets from alamp decreases with the square of the distance, and thus moving from10 to 20 feet away from the light leaves you with only 1/4 the degreeof illumination instead of the 1/2 you would get if this function werelinear.
■ Trigonometric functions – Polynomial functions don’t oscillate up anddown forever; indeed, the number of bumps they can have is lim-ited by their degree. However, many phenomena cycle up and downcontinuously, such as the rise and fall of ocean waves and the
96
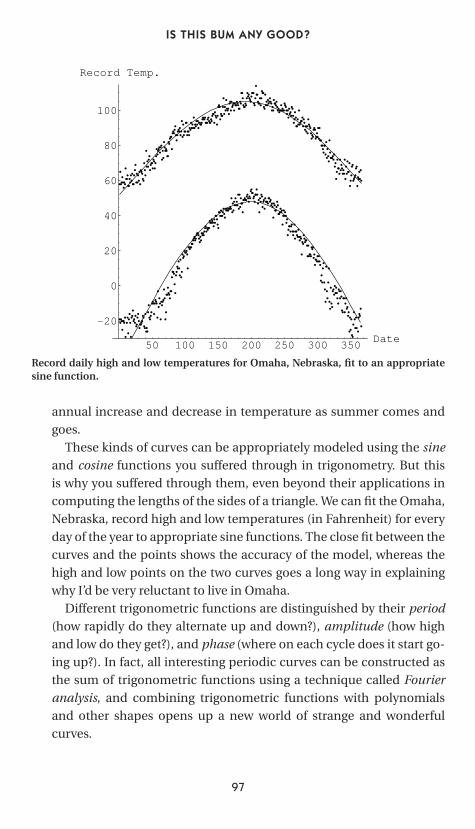
P1: FCH/FYX P2: FCH
cb386-05 CB386-Skiena June 9, 2001 14:10 Char Count= 0
IS THIS BUM ANY GOOD?
50 100 150 200 250 300 350Date
-20
0
20
40
60
80
100
Record Temp.
Record daily high and low temperatures for Omaha, Nebraska, fit to an appropriatesine function.
annual increase and decrease in temperature as summer comes andgoes.
These kinds of curves can be appropriately modeled using the sineand cosine functions you suffered through in trigonometry. But thisis why you suffered through them, even beyond their applications incomputing the lengths of the sides of a triangle. We can fit the Omaha,Nebraska, record high and low temperatures (in Fahrenheit) for everyday of the year to appropriate sine functions. The close fit between thecurves and the points shows the accuracy of the model, whereas thehigh and low points on the two curves goes a long way in explainingwhy I’d be very reluctant to live in Omaha.
Different trigonometric functions are distinguished by their period(how rapidly do they alternate up and down?), amplitude (how highand low do they get?), and phase (where on each cycle does it start go-ing up?). In fact, all interesting periodic curves can be constructed asthe sum of trigonometric functions using a technique called Fourieranalysis, and combining trigonometric functions with polynomialsand other shapes opens up a new world of strange and wonderfulcurves.
97
P1: FCH/FYX P2: FCH
cb386-05 CB386-Skiena June 9, 2001 14:10 Char Count= 0
CALCULATED BETS
■ Exponentials – Some things go up faster than any straight line or evenpolynomial. Think of the growth of the Internet, at least in the earlydays. For a while, the number of Websites was doubling every fewmonths according to a function like y = 2x, where x is the numberof seasons since the invention of the Web.
Such multiplicative growth (or decline) defines an exponentialfunction. Compound interest is the classic example of a function thatgrows exponentially. The value D ′ of D dollars accruing interest at arate of r for y years is given by the formula
D ′ = D (1 + r)y
Compound interest really adds up. Perhaps you recall the story of Peter
Minuet, who bought the island of Manhattan from the Indians for $24in 1626. Sharp New Yorker that he was, he even convinced the sellersto invest the money at an annual interest rate of only 6% (r = 0.06).Charting the progress of this investment over the course of the next300 years shows that, as of this writing, the tribe has to make do withonly $70 billion or so. This chart illustrates the most important charac-teristic of exponential functions, namely consistent explosive growth.Note that the shape of growth in each century is identical even as thetotals always rapidly increase.
The explosive growth of exponentials brings up an important point.They can’t be sustained. Within a few thousand years, the Indian in-vestors above will have a dollar for every atom in the universe. Just trypaying them off in small or even large bills! One wag used the sharpincrease (10, 100, 1000, . . .) in the number of Elvis impersonators in thelate 1970s to predict that by the late 1980s all U.S. males would soundand dress like the King. As with Elvis sightings, exponential functionsare to be had wherever you look. But catch them quickly, before theyleave the building.
■ Fractals – Mathematicians continue their search for simple descrip-tions of new and interesting shapes. The computer has revealed a newaesthetic of what mathematical simplicity is. If a function is easy to pro-gram, then it is easy to describe. The new areas of fractals and cellularautomata represent the latest ways to describe simple surfaces withsimple mathematics. The modern answer to the question, How did theleopard get its spots?, is not with a just-so story but a simple cellular
98
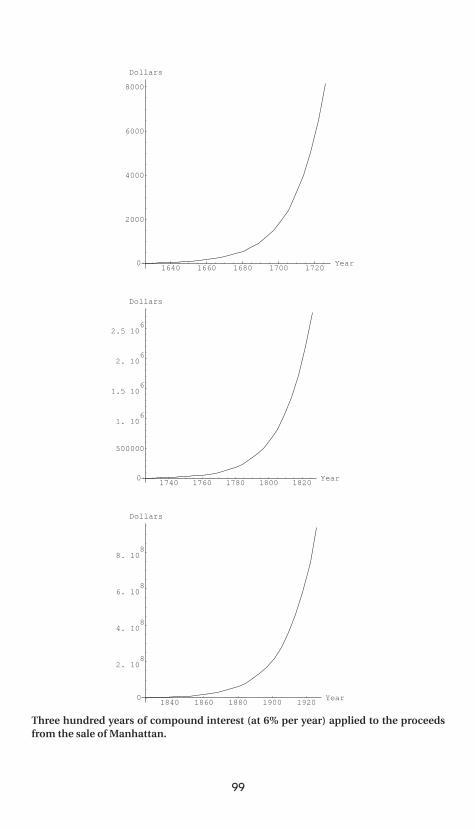
P1: FCH/FYX P2: FCH
cb386-05 CB386-Skiena June 9, 2001 14:10 Char Count= 0
1640 1660 1680 1700 1720Year0
2000
4000
6000
8000
Dollars
1740 1760 1780 1800 1820Year0
500000
61. 10
61.5 10
62. 10
62.5 10
Dollars
1840 1860 1880 1900 1920Year0
82. 10
84. 10
86. 10
88. 10
Dollars
Three hundred years of compound interest (at 6% per year) applied to the proceedsfrom the sale of Manhattan.
99
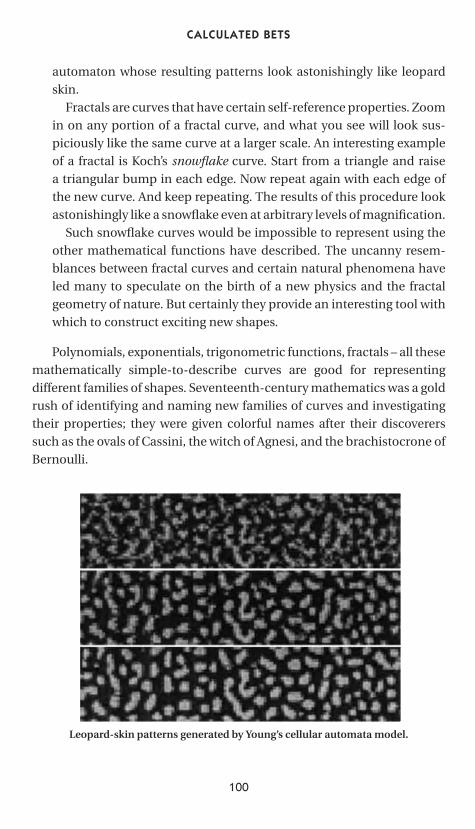
P1: FCH/FYX P2: FCH
cb386-05 CB386-Skiena June 9, 2001 14:10 Char Count= 0
CALCULATED BETS
automaton whose resulting patterns look astonishingly like leopardskin.
Fractals are curves that have certain self-reference properties. Zoomin on any portion of a fractal curve, and what you see will look sus-piciously like the same curve at a larger scale. An interesting exampleof a fractal is Koch’s snowflake curve. Start from a triangle and raisea triangular bump in each edge. Now repeat again with each edge ofthe new curve. And keep repeating. The results of this procedure lookastonishingly like a snowflake even at arbitrary levels of magnification.
Such snowflake curves would be impossible to represent using theother mathematical functions have described. The uncanny resem-blances between fractal curves and certain natural phenomena haveled many to speculate on the birth of a new physics and the fractalgeometry of nature. But certainly they provide an interesting tool withwhich to construct exciting new shapes.
Polynomials, exponentials, trigonometric functions, fractals – all thesemathematically simple-to-describe curves are good for representingdifferent families of shapes. Seventeenth-century mathematics was a goldrush of identifying and naming new families of curves and investigatingtheir properties; they were given colorful names after their discovererssuch as the ovals of Cassini, the witch of Agnesi, and the brachistocrone ofBernoulli.
Leopard-skin patterns generated by Young’s cellular automata model.
100
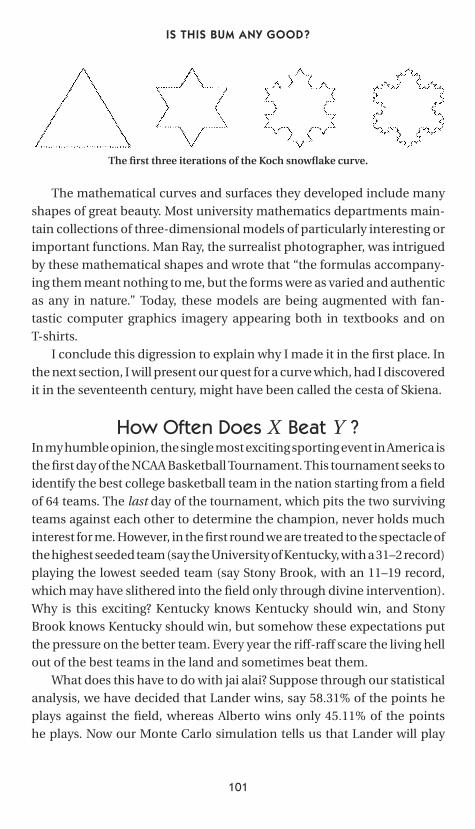
P1: FCH/FYX P2: FCH
cb386-05 CB386-Skiena June 9, 2001 14:10 Char Count= 0
IS THIS BUM ANY GOOD?
The first three iterations of the Koch snowflake curve.
The mathematical curves and surfaces they developed include manyshapes of great beauty. Most university mathematics departments main-tain collections of three-dimensional models of particularly interesting orimportant functions. Man Ray, the surrealist photographer, was intriguedby these mathematical shapes and wrote that “the formulas accompany-ing them meant nothing to me, but the forms were as varied and authenticas any in nature.” Today, these models are being augmented with fan-tastic computer graphics imagery appearing both in textbooks and onT-shirts.
I conclude this digression to explain why I made it in the first place. Inthe next section, I will present our quest for a curve which, had I discoveredit in the seventeenth century, might have been called the cesta of Skiena.
How Often Does X Beat Y ?In my humble opinion, the single most exciting sporting event in America isthe first day of the NCAA Basketball Tournament. This tournament seeks toidentify the best college basketball team in the nation starting from a fieldof 64 teams. The last day of the tournament, which pits the two survivingteams against each other to determine the champion, never holds muchinterest for me. However, in the first round we are treated to the spectacle ofthe highest seeded team (say the University of Kentucky, with a 31–2 record)playing the lowest seeded team (say Stony Brook, with an 11–19 record,which may have slithered into the field only through divine intervention).Why is this exciting? Kentucky knows Kentucky should win, and StonyBrook knows Kentucky should win, but somehow these expectations putthe pressure on the better team. Every year the riff-raff scare the living hellout of the best teams in the land and sometimes beat them.
What does this have to do with jai alai? Suppose through our statisticalanalysis, we have decided that Lander wins, say 58.31% of the points heplays against the field, whereas Alberto wins only 45.11% of the pointshe plays. Now our Monte Carlo simulation tells us that Lander will play
101
P1: FCH/FYX P2: FCH
cb386-05 CB386-Skiena June 9, 2001 14:10 Char Count= 0
CALCULATED BETS
the next point against Alberto. What is the probability that Lander winsthe point?
This is a curious problem worth thinking about. Given that player Awins Pr(A) of his points played against everybody, and player B wins Pr(B)of his points played against everybody, what is the probability Prob(A, B)that A beats B?
The answer must depend upon the nature of the contest. Suppose wewant to predict the outcome of a battle of brute strength in which thestronger fellow always crushes the weaker one. Then the answer is simple.The probability that A beats B, Prob(A, B), equals 1 if Pr(A) is bigger thanPr(B), and 0 if Pr(A) is less than Pr(B). But what about a more subtle sportin which upsets can occur, such as college basketball? This straightforwardsolution would clearly be inadequate.
In mathematical modeling, there are typically several different waysto approach a given problem. Good taste dictates that we consider theproperties we want our solution to have and then find a function that doesthe job. Relevant properties for our points modeling problem include thefollowing:
■ Integrity – It is important that Prob(A, B) be a real probability value,which means it must always lie between 0 and 1. The value of 0 meansthat A never defeats B, whereas a value of 1 makes A unbeatable. Youwould be surprised how often simple, reasonable-looking functions failto yield real probabilities. For example, consider Prob(A, B) = Pr(A) −Pr(B). This yields negative values whenever P(A) is less than P(B), whichwould be impossible for a probability value. Things can’t happen lessoften than never!
■ Symmetry – It makes sense that the probability that A wins shouldequal the probability that B loses. In other words, Prob(A, B) =1 − Prob(B, A).
■ Monotonicity – A function f is monotonically increasing if x ≥ yimplies that f (x) ≥ f (y) for all x and y. Our function should havecertain monotonicity properties, namely that Prob(A′, B) ≥ Prob(A, B)if Pr(A′) ≥ Pr(A). Out of monotonicity and symmetry, we get forfree . . .
■ Equality – If Pr(A) = 0.45 and Pr(B) = 0.45, then it makes sense thatA and B should have an equal chance of winning whenever they playeach other. Thus, whenever Pr(A) = Pr(B), Prob(A, B) = 1/2.
102
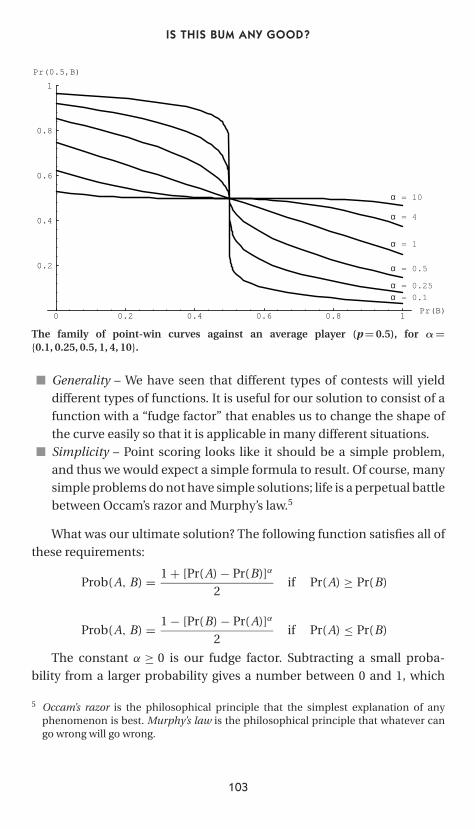
P1: FCH/FYX P2: FCH
cb386-05 CB386-Skiena June 9, 2001 14:10 Char Count= 0
IS THIS BUM ANY GOOD?
0 0.2 0.4 0.6 0.8 1Pr(B)
0.2
0.4
0.6
0.8
1
Pr(0.5,B)
α = 10
α = 0.1
α = 0.25
α = 0.5
α = 1
α = 4
The family of point-win curves against an average player (p = 0.5), for α={0.1, 0.25, 0.5, 1, 4, 10}.
■ Generality – We have seen that different types of contests will yielddifferent types of functions. It is useful for our solution to consist of afunction with a “fudge factor” that enables us to change the shape ofthe curve easily so that it is applicable in many different situations.
■ Simplicity – Point scoring looks like it should be a simple problem,and thus we would expect a simple formula to result. Of course, manysimple problems do not have simple solutions; life is a perpetual battlebetween Occam’s razor and Murphy’s law.5
What was our ultimate solution? The following function satisfies all ofthese requirements:
Prob(A, B) = 1 + [Pr(A) − Pr(B)]α
2if Pr(A) ≥ Pr(B)
Prob(A, B) = 1 − [Pr(B) − Pr(A)]α
2if Pr(A) ≤ Pr(B)
The constant α ≥ 0 is our fudge factor. Subtracting a small proba-bility from a larger probability gives a number between 0 and 1, which
5 Occam’s razor is the philosophical principle that the simplest explanation of anyphenomenon is best. Murphy’s law is the philosophical principle that whatever cango wrong will go wrong.
103
P1: FCH/FYX P2: FCH
cb386-05 CB386-Skiena June 9, 2001 14:10 Char Count= 0
CALCULATED BETS
is still a probability. Raising a probability to any power α ≥ 0 also leaves aprobability. A large α means a small contribution from this term, whereasa small α implies the skill difference has a large impact on the outcome.
I illustrate this effect with a set of curves representing the probabilitythat A will beat an average player B (i.e., Pr(B) = 1/2) as a function of sixdifferent values of α. Each of these curves satisfies all of the propertieslisted above. Observe how the value of α provides us with a knob to tweakto generate a variety of different shapes from flat as a pancake to steepas a cliff. Though trial-and-error experiments, we determined that α ≈ 0.4seemed to do the best job of predicting the winners of jai alai games, andthat is what we generally will use from here on out.
The Hot-Hand PhenomenonIs it reasonable to model human jai alai players merely as automata thatoutput points according to a given probability distribution? We assumethat each player always scores points uniformly at random according tohis standard skill level with no correction for whether the simulated playerscored the last point. Thus, our model ignores the possibility that playersenter a mental zone in which they are unbeatable for the night or thatthey can be doomed to have a rotten day because of hangovers or pulledgroins.
Certainly serious injuries will impair the performance of any athlete,but I think it is reasonable to assume that any pelotari is physically up toany match he plays in. If a player is not, why play and risk further injurywhen there are designated backups for each jai alai game? Missing oneof 1200 games per season is not a serious problem. But our assumptionthat the results are completely independent of each other may seem morequestionable. Isn’t a player more likely to play badly after being the goatin the previous game? Conversely, any pelotari who just won three gamesin a row seems like a better than average bet to go for his fourth.
However, our model is supported by some fascinating studies of the“hot-hand” phenomenon of basketball. A time-tested strategy in basket-ball is to go with the hot hand, the fellow on the team who just can’t seemto miss that night. Whenever a basketball player starts shooting the lightsout, the basket looks like the opening of a dumpster to him – so big he can’tmiss. He’s got confidence; he’s shaking and baking and on a roll. The restof the team just keeps feeding the ball to the hot hand – at least until thehot hand cools.
104
P1: FCH/FYX P2: FCH
cb386-05 CB386-Skiena June 9, 2001 14:10 Char Count= 0
IS THIS BUM ANY GOOD?
So if the hot hand works for basketball, why do we ignore it in our jai alaisimulation? The reason is, surprisingly, that it doesn’t really work in basket-ball! In a famous article, Gilovich, Vallone, and Tversky provided statisticalevidence that cast doubt on the existence of hot streaks in sports. Theyexamined the likelihood that a given NBA basketball player would makethe (k + 1)st shot in a row given that this player had made the last k. Carefulstatistical analysis of the sequences of shots showed that they did not differin length from sequences that would be expected by chance alone.
But how can a phenomenon every basketball player has personallyexperienced just not exist? As we previously discussed, most people have alousy understanding of how random sequences behave. If you make 50%of your shots on average, then by chance you are going to have long runs ofbaskets in exactly the same way a sequence of random coin flips will havelong runs of tails. It is only human to feel on a roll when this happens, butit is a natural consequence of general shooting accuracy.
These counterintuitive results have sparked considerable debate, andfollow-up studies provide some support for the concept of streaks in golfputting and professional pool. But in the absence of compelling evidencethe other way, I am much happier using the simpler mathematical modelof independence between games instead of trying to account for a phe-nomenon that may not even exist.
Correlation versus CausationIn a previous section, we used correlation coefficients to justify our as-sumption that we can use past results to predict future player performance.One of the tricky aspects of analyzing statistical data is distinguishingbetween correlation and causation. Two factors are correlated whenever achange in one of the sequences suggests that there will be a change in theother. Weight and height are well-correlated sequences in people. Tall peo-ple are likely to be heavier than shorter people. Education and income arealso typically correlated. For the most part, people with greater educationearn more money than those with less.
Properly interpreting correlations can be difficult. My favorite exampleis that the amount one exercises correlates positively with the probability ofdying from cancer. Does this mean that exercise causes cancer? Of coursenot! It means that everybody dies of something. The physically fit are atincreased risk of dying from a disease of old age (such as cancer) becausethey are at a decreased risk of an early death.
105
P1: FCH/FYX P2: FCH
cb386-05 CB386-Skiena June 9, 2001 14:10 Char Count= 0
CALCULATED BETS
A sequence x has a causal relation to y if a change in the value of x islikely to impact the value of y. An example of a well-known causal rela-tionship is that between interest rates and the price of stocks. Wheneverinterest rates rise, investors pull their money out of stocks to take ad-vantage of this development, and stock prices drop. When interest ratesdecrease, investors take their money out of the bank and buy somethingthat yields more of a return – typically stocks. Thus, not only are the se-quences inversely correlated, but there is a reason for it – an honest causalrelationship.
Two sequences can have high correlation without having a causal re-lationship between them. Consider the well-known connection betweenthe winner of the Super Bowl and the fate of the stock market. The SuperBowl, held each January, pits the winner of the American Football Confer-ence (AFC) against that of the National Football Conference (NFC). Thestock market seems to be positively correlated with the fate of the NFC.When the NFC wins, the market goes up for the year, and when it loses themarket goes down for the year. Since the Super Bowl began in 1967, thisrelationship has held an impressive 28 of 32 year, or 87.5% of the time.
If there was a causal relationship between the Super Bowl and the stockmarket, then we would be well justified in investing our money based onthe outcome of the game. However, I for one am confident that this phe-nomenon is just a vagary of chance, a consequence of the fact that spuriouscorrelations are certain to emerge whenever enough pairs of sequences areanalyzed.
However, deciding whether a causal relationship between two factorsreally exists can be a very tricky business – indeed it can literally be areligious war. Consider the question of whether the Almighty acts on theprayers of the faithful. Countless people swear that the Lord heard theirprayers and saved them. However, no statistical study worthy of the namehas ever been able to convince nonbelievers. Is there a causal relationbetween faith and cure? What is the efficacy of prayer?
A notorious recent case is that of the “Bible code,” mysterious messagesapparently embedded in the Hebrew scriptures. A best-selling book byM. Droshin reported on patterns in the Torah (the first five books of theBible) that predicted the assassination of Yitzhak Rabin and also encodeother historical facts that would have been impossible for the authors ofthe books to know at the time. Unless of course, the authors of the Biblewere divinely inspired . . .
106
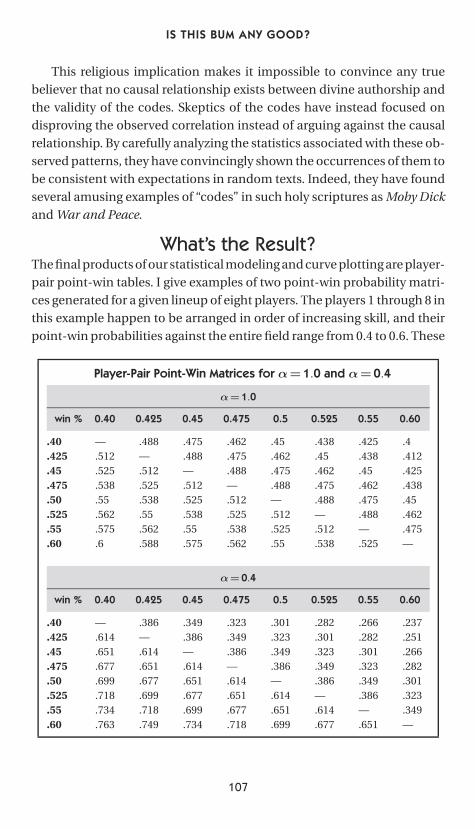
P1: FCH/FYX P2: FCH
cb386-05 CB386-Skiena June 9, 2001 14:10 Char Count= 0
IS THIS BUM ANY GOOD?
This religious implication makes it impossible to convince any truebeliever that no causal relationship exists between divine authorship andthe validity of the codes. Skeptics of the codes have instead focused ondisproving the observed correlation instead of arguing against the causalrelationship. By carefully analyzing the statistics associated with these ob-served patterns, they have convincingly shown the occurrences of them tobe consistent with expectations in random texts. Indeed, they have foundseveral amusing examples of “codes” in such holy scriptures as Moby Dickand War and Peace.
What’s the Result?The final products of our statistical modeling and curve plotting are player-pair point-win tables. I give examples of two point-win probability matri-ces generated for a given lineup of eight players. The players 1 through 8 inthis example happen to be arranged in order of increasing skill, and theirpoint-win probabilities against the entire field range from 0.4 to 0.6. These
Player-Pair Point-Win Matrices for α= 1.0 and α= 0.4
α= 1.0
win % 0.40 0.425 0.45 0.475 0.5 0.525 0.55 0.60
.40 — .488 .475 .462 .45 .438 .425 .4
.425 .512 — .488 .475 .462 .45 .438 .412
.45 .525 .512 — .488 .475 .462 .45 .425
.475 .538 .525 .512 — .488 .475 .462 .438
.50 .55 .538 .525 .512 — .488 .475 .45
.525 .562 .55 .538 .525 .512 — .488 .462
.55 .575 .562 .55 .538 .525 .512 — .475
.60 .6 .588 .575 .562 .55 .538 .525 —
α= 0.4
win % 0.40 0.425 0.45 0.475 0.5 0.525 0.55 0.60
.40 — .386 .349 .323 .301 .282 .266 .237
.425 .614 — .386 .349 .323 .301 .282 .251
.45 .651 .614 — .386 .349 .323 .301 .266
.475 .677 .651 .614 — .386 .349 .323 .282
.50 .699 .677 .651 .614 — .386 .349 .301
.525 .718 .699 .677 .651 .614 — .386 .323
.55 .734 .718 .699 .677 .651 .614 — .349
.60 .763 .749 .734 .718 .699 .677 .651 —
107
P1: FCH/FYX P2: FCH
cb386-05 CB386-Skiena June 9, 2001 14:10 Char Count= 0
CALCULATED BETS
are fairly typical numbers. Each matrix presents the probabilities for eachpossible matchup between pairs of players.
The two matrices differ because they were generated with differentvalues of the fudge factor α. The matrix on top used α = 1.0, a very gentleskewing that actually reduces the degree of difference between these par-ticular players. The bottom matrix used α = 0.4, which our experimentssuggest makes the simulation most accurately reflect reality.
Using the appropriate such matrix within a Monte Carlo simulationshould yield reasonably accurate predictions of the outcome of jai alaimatches. But that alone is still not enough information to venture an in-telligent wager on the match. We must be able to estimate accurately whatour payoff will be if we win. This requires that we delve much deeper intothe economics of jai alai.
108
P1: FCH/FYX P2: FCH
CB386-06 CB386-Skiena June 11, 2001 18:43 Char Count= 0
CHAPTER SIX
MODELING THE PAYOFFS
Economists are very concerned with the concept of market efficiency.Markets are efficient whenever prices reflect underlying values. Marketefficiency implies that everyone has the same information about what isavailable and processes it correctly.
The question of whether the jai alai bettors’ market is efficient goesstraight to the heart of whether there is any hope to make money bettingon it. All of the information that we use to predict the outcome of jai alaimatches is available to the general public. Because we are betting againstthe public, we can only win if we can interpret this data more successfullythan the rest of the market. We can win money if and only if the market isinefficient.
Analyzing market efficiency requires us to build a model of how thegeneral public bets. Once we have an accurate betting model, we cancompare it with the results of our Monte Carlo simulation to look for inef-ficiencies. Any bet that the public rates higher than our simulation is oneto stay away from, whereas any bet that the simulation rates higher thanthe public represents a market inefficiency potentially worth exploiting.
The issue of market efficiency rears its head most dramatically in thestock market. Billions of dollars are traded daily in the major marketsby tens of thousands of people watching minute-by-minute stock ticker
109
P1: FCH/FYX P2: FCH
CB386-06 CB386-Skiena June 11, 2001 18:43 Char Count= 0
CALCULATED BETS
reports. Quantitative market analysts (the so-called quants) believe thatthere are indeed inefficiencies in the stock market that show up as statisti-cal patterns. Companies like D. E. Shaw and Renaissance Technology hirelarge teams of people with training like mine to perform analyses to findsuch patterns to invest in and exploit.
But are these patterns really present, and are they large enough toexploit? Many knowledgeable people believe that the behavior of the stockmarket is essentially random walk that is totally unpredictable. If so, itmeans these market inefficiencies don’t really exist. And if they do exist,they will not exist for long. The quants have taken their beatings alongthe way.
Why should the situation be any different in jai alai than the stockmarket? My sense is that the average dollar in jai alai is spent in a lessinformed way than one invested in the stock market. I have never seenanyone hanging off the railing at the New York Stock Exchange yelling“You stink, ATT!” or “Miss it, TXN!” If the average bettor trusts oracles likePepe’s Green Card or knows as little about jai alai as I did before beginningthis study – well, there are bound to be plenty of market inefficiencies. Allwe had to do was find them.
Pari-Mutuel WageringAccurately modeling payoffs requires us to face the question of exactlyhow the fronton makes its money. Running a professional jai alai frontonis an expensive proposition and involves several hundred people. Eachfronton has a stable of at least 30 professional players who insist on beingpaid, as do the cashiers, cleaning people, management, and stockhold-ers. Admission to a fronton costs only a few bucks; consequently, even1500 paying spectators per match do not provide much of a revenuestream.
Much more than by selling tickets, refreshments, and copies of Pepe’sGreen Card, frontons make their money by taking a cut of the bettingaction. Jai alai frontons in the United States operate under the pari-mutuelsystem. Developed by a Frenchman, Pierre Ollier, in the middle of thenineteenth century, the pari-mutuel (“wagers among ourselves”) systemdispenses with odds makers who use their judgment to decide how mucha given wager should pay. Ollier owned a perfume shop in Paris and de-veloped his system in reaction to losing too much of his own money tobookies. Instead, all of the money wagered on the given type of bet is put
110
P1: FCH/FYX P2: FCH
CB386-06 CB386-Skiena June 11, 2001 18:43 Char Count= 0
MODELING THE PAYOFFS
into a single pool to be divided equally among the winning bets. However,before it is divided up, a house cut of roughly 20% is extracted from thispool and taken by the fronton (and its partner, the state government.)
Let’s see an example of the system in action. Suppose the followingamounts of money were bet on each of the eight possible winning out-comes:
Position 1 2 3 4 5 6 7 8Amount Bet $10 $20 $25 $40 $25 $20 $0 $10
The total amount of money in the pool is $150. After the house deductsits 20% cut, the pool is left with $120 in it. Suppose that number 1 winsthe match. The payoff will be $120/$10 = $12 per dollar invested on thewinner, and thus a bet of $3 would pay off $36.00. If number 4 had won thematch, the payoff per dollar would be only $3, and thus a $3 bet would payoff $9.00. The odds reported in the newspaper or on the tote board refer tothe amount paid off on the house’s minimum allowable bet – typically $2or $3.
Now suppose number 7 had won the match. Because no one bet anymoney on this possibility, typically the price of all win tickets would berefunded, although the exact policy depends upon local rules. This is arare but not unheard of event; it occasionally happens in very early or latematches that have fewer customers.
Dividing up the place and show pools is a somewhat more complicatedprocess. After the house extracts its cut, it sets aside an amount equalto the amount bet on all winning entries from the pool, and thus eachwinning bettor is assured of getting back at least his or her initial stake.The remaining money is split into equal-sized pools, one for each of thetwo (for place) or three (for show) different paying numbers. Each of thesepools is divided among the dollars bet on the given number and returnedalong with the initial stake. Thus, the two different place payoffs in anymatch are usually different. In the example on page 76, 8 to place paid offat $16.50 whereas 4 to place paid only $9.90. Significantly more money wasbet on 4 to place; consequently, its half of the pool had to be shared amongmore bettors.
In addition to the 15–20% deducted from the pool as house advantage,the fronton also profits from the breakage, the odd cents left over whendividing the pool. For reasons of either convenience, tradition, or greed,
111
P1: FCH/FYX P2: FCH
CB386-06 CB386-Skiena June 11, 2001 18:43 Char Count= 0
CALCULATED BETS
all payoffs at the track or fronton are given as multiples of 10 cents. You seepayoffs of $14.40, but not $14.47. So what happens to that extra $0.07 perwinning ticket whenever the pool works out that way? The answer is thatit is deducted as breakage and is split between the state and the frontonaccording to prevailing local laws. These pennies certainly add up. Thebreakage works out to, on average, a nickel per winning ticket, thus addinganother percentage point or two to the house advantage. This nickel worksout as a lower percentage of exotic bets such as trifecta, because it is anegligible fraction of the payoff, but represents a more serious cut of thewin, place, and show payoffs.
The computers used today crunch out these payoff computations ina fraction of a second. Thus, payoff results are typically posted within aminute of the completion of each match, which is somewhat faster than inyears past. But in those precomputer days, the money counting and poolcomputations had to be done by hand. That they were performed quicklyand accurately enough to satisfy impatient and suspicious gamblers wasa feat worthy of our respect.
There are several interesting implications of the pari-mutuel system.First, the exact payoffs for any bet are not known to anybody in advance.To estimate the payoff you will receive, you really have to know how otherpeople are betting. For this reason, every fronton or racetrack has an elec-tronic scoreboard or monitor that flashes the current odds for each possiblewager. Many “professional” gamblers make a careful study of the oddsboard and place their bet at the last possible minute, investing in playerswho seem undervalued by the rest of the betting population. Observe thedifference from casino games, for you always know that a correct bet onblack in roulette pays off at two-to-one regardless of how many other peo-ple have also invested on black.
Because of the pari-mutuel system, every bettor can theoretically pickthe winner in jai alai, and the fronton still makes money.1 This is nottrue of casinos and to my way of thinking makes frontons much friendlierplaces than casinos. Frontons want you to bet, whereas casinos want youto lose.
1 This isn’t completely true because many states guarantee bettors a minimum return(say 10%) on every winning bet, which would have to come from the house if every-body picked the same winner. This would be an unheard of situation in jai alai. Suchminus pools do arise occasionally in horse racing – typically when a wonder horsegoes up against thoroughly inadequate competition.
112
P1: FCH/FYX P2: FCH
CB386-06 CB386-Skiena June 11, 2001 18:43 Char Count= 0
MODELING THE PAYOFFS
This may seem a meaningless distinction because casino odds are suffi-ciently stacked against you that the more you bet, the more you are almostcertain to lose. However, it shows up clearly in how the house deals with sys-tems bettors. Every casino employs a large security staff with sophisticatedsurveillance equipment who watch any successful bettor’s every move. Ifthe security force finds you using any forbidden equipment (like a com-puter in your shoe) or any successful mathematical technique (like cardcounting in blackjack), you will be tossed out on your rear hard enough toknow never to come back.
Now conversely, suppose I showed up at the fronton with my laptopcomputer and a system guaranteed to make money betting on jai alai.Management would welcome me with open arms. The house keeps 20%of everything I wager, and I must spend money to make money. If I weresuccessful, I would just be taking money from other bettors, but this isnone of the fronton’s concern.
Ollier’s pari-mutuel system caught on quickly in France but was ini-tially unpopular in the United States because bettors then (as now) wantedto be able to bet on long shots that paid off (if successful) at high odds.Under the pari-mutuel system, whenever many people bet on a long shot,it ceases to be one. Other bettors feared that the house would manipulatethe calculations to skim off more than their allotted share.
Once the tide started shifting against them, bookmakers tried to com-pete by paying off at the same odds as those of the racetrack, with the addedadvantage that your bets would not depress the payoffs as they did whenyou bet at the track. Sharpies took advantage of the situation by investingrelatively small amounts of money at the track on everything except thehorse they wanted and then large amounts at the bookie on their favorite.Their preliminary wagers skewed the small pool so that their real horsepaid off at greatly inflated odds, which the bookie then had to match. Oneby one, these bookies were put out of business, and now the pari-mutuelsystem reigns throughout horse racing and jai alai.
Estimating the PayoffsBeing able to pick winners in jai alai is not enough to make money. Weneed to be able to pick them better than other people.
Remember that glorious 4–2–1 trifecta triumph my brothers and I hadvia Pepe’s Green Card. Sure, Pepe picked a winner, and we had a profitableevening. But the trifecta payoff of $124.60 for a $2 bet represents a terrible
113
P1: FCH/FYX P2: FCH
CB386-06 CB386-Skiena June 11, 2001 18:43 Char Count= 0
CALCULATED BETS
return on investment when we factor in risk. Essentially we got back $60for every $1 we bet for successfully picking a 336-to-1 shot.
Why was the payoff so low? Every yutz who bought a Pepe’s Green Cardthat night probably bet on the same 4–2–1 trifecta, which tremendouslydampened the odds. The final payoff probably would have been three orfour times higher without the influence of Pepe’s disciples. Although it isimpossible to predict who Pepe will pick, we can study past payoffs to geta handle on how the public bets.
We can model the behavior by properly interpreting the statistical evi-dence of previous payoffs. My belief is that there are three major factorsthat the betting public uses to decide where to place its bets:
■ Estimates of player skills – Every jai alai bettor is given the nightly pro-gram of matches as he or she walks into the fronton. In addition to theplaying schedule, the program typically includes statistical measures ofthe performance of each entrant. Usually this consists of the win, place,and show record for each player this season sometimes supplementedby the entrant’s record in the particular game number. For example,a reader of the program might learn that the team of Zarandona andGuisasola have a record of 7–4–9 as a doubles team in 47 games andthat Guisasola has a personal record of 19–12–20 in the 139 Game 3’she played this season.
Personally, I cannot imagine why any bettor would find a pelotari’sGame 3 record useful for predictive purposes any more than a baseballplayer’s Tuesday average. But I don’t have to. If I know that people areusing this information to bet, it potentially provides some kind of edgefor me if I am making more rational forecasts.
■ Records of post positions – The nightly program also includes tablesshowing how often each win, place, show, quiniela, exacta, andtrifecta have occurred thus far this season. These tables alert thebettor to much of what we learned from our initial Monte Carlo simu-lation, namely that certain combinations occur much more often thanothers.
■ Whims and fancy – Here I might credit factors like Pepe’s Green Cardand all bets based on birthdays and lucky hotel room numbers. Theredoesn’t seem to be very much one can do to model this sort of thing.Presumably these essentially random factors serve to cancel each otherout. For every grandmother who bets on 4–8 quinielas because she likes
114
P1: FCH/FYX P2: FCH
CB386-06 CB386-Skiena June 11, 2001 18:43 Char Count= 0
MODELING THE PAYOFFS
green and purple uniforms, there will be a granddaughter who thinksOlate has a cute butt.
The most straightforward approach to model how the public accountsfor post position is simply to average the payoffs from all the times that thecombination has occurred. By this point in the project, we had a loggedthe results of 7730 jai alai matches. This was a large enough database toprovide some meaningful results. The average payoff of the 455 successful1–2 quinielas was only $17.46 per dollar, whereas the average payoff ofthe 279 4–8 quinielas was $26.41 per dollar. These are enough results toconvince me that a 4–8 quiniela bet should pay off substantially betterthan a 1–2 quiniela if, in fact, the combination wins.
Our payoff models are given in Tables 6.1–6.4. These payoffs are nor-malized to represent the amount returned per dollar invested so that wecan properly combine the results from Dania and Milford. Because the twofrontons have different minimum bet amounts, directly averaging payoffsfrom them would produce meaningless results.
What do these tables show?
■ Table 6.1 presents the average payoffs for win, place, and show betting.As a citizen, I am gratified to see that the average payoff per dollar variesinversely with the number of times each result occurred. This meansthat the public is smart enough to understand that certain positionscome in more often than others and bet accordingly. As a gambler, I findthis somewhat less heartwarming because I become a better bettor themore wrongheaded the public is.
The most interesting anomaly in these data is that the public prefersbetting on 1 rather than 2. Two-to-win pays off 30 cents more per dollarthan 1-to-win, even though 2 came in more often for win, place, andshow.
■ Table 6.2 presents the average payoff for quiniela bets. The payoffs perdollar range from $16.53 to $47.62, a much narrower band than thenumber of occurrences (86 to 455), which suggests that the public un-dervalues the most commonly occurring trifectas. This phenomenonalso exists in horse racing and other types of sports betting in which ithas long been recognized that the public tends to underbet the favorite.
■ Table 6.3 presents the average payoff for exacta bets. There are twiceas many betting opportunities with exactas as with quinielas, and evi-dence that the public does not evaluate exactas as well as the simpler
115
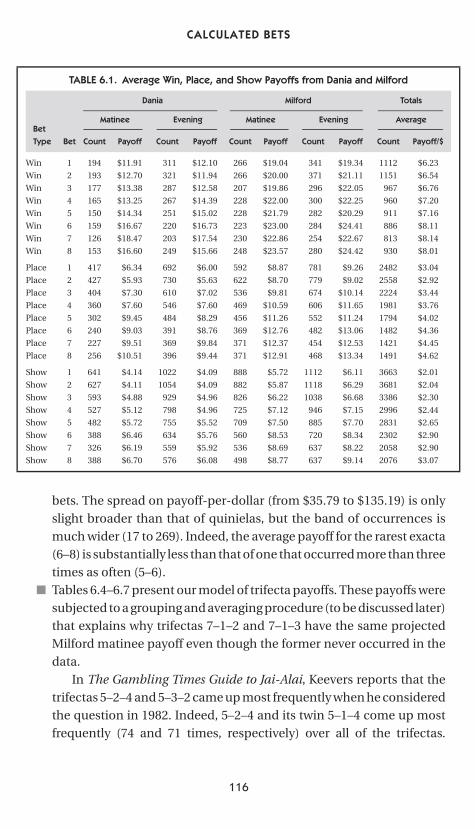
P1: FCH/FYX P2: FCH
CB386-06 CB386-Skiena June 11, 2001 18:43 Char Count= 0
CALCULATED BETS
TABLE 6.1. Average Win, Place, and Show Payoffs from Dania and Milford
Dania Milford Totals
Matinee Evening Matinee Evening AverageBet
Type Bet Count Payoff Count Payoff Count Payoff Count Payoff Count Payoff/$
Win 1 194 $11.91 311 $12.10 266 $19.04 341 $19.34 1112 $6.23
Win 2 193 $12.70 321 $11.94 266 $20.00 371 $21.11 1151 $6.54
Win 3 177 $13.38 287 $12.58 207 $19.86 296 $22.05 967 $6.76
Win 4 165 $13.25 267 $14.39 228 $22.00 300 $22.25 960 $7.20
Win 5 150 $14.34 251 $15.02 228 $21.79 282 $20.29 911 $7.16
Win 6 159 $16.67 220 $16.73 223 $23.00 284 $24.41 886 $8.11
Win 7 126 $18.47 203 $17.54 230 $22.86 254 $22.67 813 $8.14
Win 8 153 $16.60 249 $15.66 248 $23.57 280 $24.42 930 $8.01
Place 1 417 $6.34 692 $6.00 592 $8.87 781 $9.26 2482 $3.04
Place 2 427 $5.93 730 $5.63 622 $8.70 779 $9.02 2558 $2.92
Place 3 404 $7.30 610 $7.02 536 $9.81 674 $10.14 2224 $3.44
Place 4 360 $7.60 546 $7.60 469 $10.59 606 $11.65 1981 $3.76
Place 5 302 $9.45 484 $8.29 456 $11.26 552 $11.24 1794 $4.02
Place 6 240 $9.03 391 $8.76 369 $12.76 482 $13.06 1482 $4.36
Place 7 227 $9.51 369 $9.84 371 $12.37 454 $12.53 1421 $4.45
Place 8 256 $10.51 396 $9.44 371 $12.91 468 $13.34 1491 $4.62
Show 1 641 $4.14 1022 $4.09 888 $5.72 1112 $6.11 3663 $2.01
Show 2 627 $4.11 1054 $4.09 882 $5.87 1118 $6.29 3681 $2.04
Show 3 593 $4.88 929 $4.96 826 $6.22 1038 $6.68 3386 $2.30
Show 4 527 $5.12 798 $4.96 725 $7.12 946 $7.15 2996 $2.44
Show 5 482 $5.72 755 $5.52 709 $7.50 885 $7.70 2831 $2.65
Show 6 388 $6.46 634 $5.76 560 $8.53 720 $8.34 2302 $2.90
Show 7 326 $6.19 559 $5.92 536 $8.69 637 $8.22 2058 $2.90
Show 8 388 $6.70 576 $6.08 498 $8.77 637 $9.14 2076 $3.07
bets. The spread on payoff-per-dollar (from $35.79 to $135.19) is onlyslight broader than that of quinielas, but the band of occurrences ismuch wider (17 to 269). Indeed, the average payoff for the rarest exacta(6–8) is substantially less than that of one that occurred more than threetimes as often (5–6).
■ Tables 6.4–6.7 present our model of trifecta payoffs. These payoffs weresubjected to a grouping and averaging procedure (to be discussed later)that explains why trifectas 7–1–2 and 7–1–3 have the same projectedMilford matinee payoff even though the former never occurred in thedata.
In The Gambling Times Guide to Jai-Alai, Keevers reports that thetrifectas 5–2–4 and 5–3–2 came up most frequently when he consideredthe question in 1982. Indeed, 5–2–4 and its twin 5–1–4 come up mostfrequently (74 and 71 times, respectively) over all of the trifectas.
116
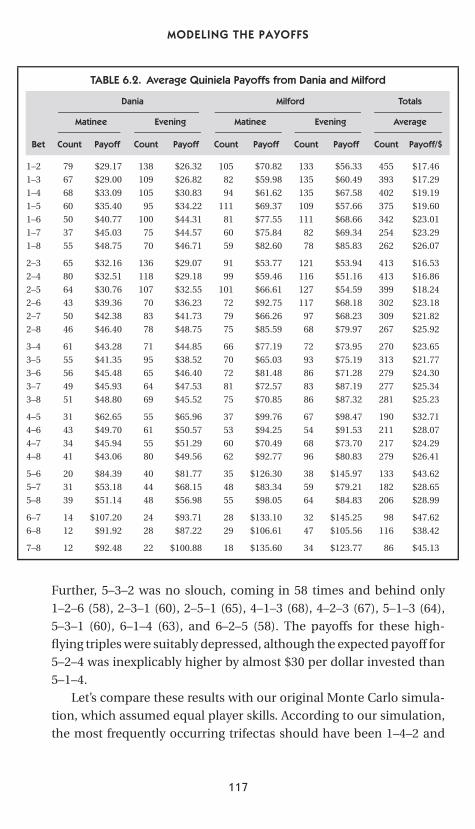
P1: FCH/FYX P2: FCH
CB386-06 CB386-Skiena June 11, 2001 18:43 Char Count= 0
MODELING THE PAYOFFS
TABLE 6.2. Average Quiniela Payoffs from Dania and Milford
Dania Milford Totals
Matinee Evening Matinee Evening Average
Bet Count Payoff Count Payoff Count Payoff Count Payoff Count Payoff/$
1–2 79 $29.17 138 $26.32 105 $70.82 133 $56.33 455 $17.46
1–3 67 $29.00 109 $26.82 82 $59.98 135 $60.49 393 $17.29
1–4 68 $33.09 105 $30.83 94 $61.62 135 $67.58 402 $19.19
1–5 60 $35.40 95 $34.22 111 $69.37 109 $57.66 375 $19.60
1–6 50 $40.77 100 $44.31 81 $77.55 111 $68.66 342 $23.01
1–7 37 $45.03 75 $44.57 60 $75.84 82 $69.34 254 $23.29
1–8 55 $48.75 70 $46.71 59 $82.60 78 $85.83 262 $26.07
2–3 65 $32.16 136 $29.07 91 $53.77 121 $53.94 413 $16.53
2–4 80 $32.51 118 $29.18 99 $59.46 116 $51.16 413 $16.86
2–5 64 $30.76 107 $32.55 101 $66.61 127 $54.59 399 $18.24
2–6 43 $39.36 70 $36.23 72 $92.75 117 $68.18 302 $23.18
2–7 50 $42.38 83 $41.73 79 $66.26 97 $68.23 309 $21.82
2–8 46 $46.40 78 $48.75 75 $85.59 68 $79.97 267 $25.92
3–4 61 $43.28 71 $44.85 66 $77.19 72 $73.95 270 $23.65
3–5 55 $41.35 95 $38.52 70 $65.03 93 $75.19 313 $21.77
3–6 56 $45.48 65 $46.40 72 $81.48 86 $71.28 279 $24.30
3–7 49 $45.93 64 $47.53 81 $72.57 83 $87.19 277 $25.34
3–8 51 $48.80 69 $45.52 75 $70.85 86 $87.32 281 $25.23
4–5 31 $62.65 55 $65.96 37 $99.76 67 $98.47 190 $32.71
4–6 43 $49.70 61 $50.57 53 $94.25 54 $91.53 211 $28.07
4–7 34 $45.94 55 $51.29 60 $70.49 68 $73.70 217 $24.29
4–8 41 $43.06 80 $49.56 62 $92.77 96 $80.83 279 $26.41
5–6 20 $84.39 40 $81.77 35 $126.30 38 $145.97 133 $43.62
5–7 31 $53.18 44 $68.15 48 $83.34 59 $79.21 182 $28.65
5–8 39 $51.14 48 $56.98 55 $98.05 64 $84.83 206 $28.99
6–7 14 $107.20 24 $93.71 28 $133.10 32 $145.25 98 $47.62
6–8 12 $91.92 28 $87.22 29 $106.61 47 $105.56 116 $38.42
7–8 12 $92.48 22 $100.88 18 $135.60 34 $123.77 86 $45.13
Further, 5–3–2 was no slouch, coming in 58 times and behind only1–2–6 (58), 2–3–1 (60), 2–5–1 (65), 4–1–3 (68), 4–2–3 (67), 5–1–3 (64),5–3–1 (60), 6–1–4 (63), and 6–2–5 (58). The payoffs for these high-flying triples were suitably depressed, although the expected payoff for5–2–4 was inexplicably higher by almost $30 per dollar invested than5–1–4.
Let’s compare these results with our original Monte Carlo simula-tion, which assumed equal player skills. According to our simulation,the most frequently occurring trifectas should have been 1–4–2 and
117
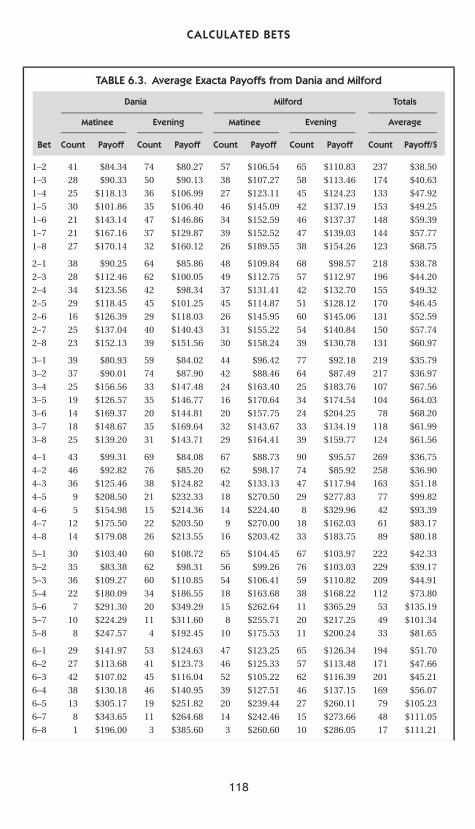
P1: FCH/FYX P2: FCH
CB386-06 CB386-Skiena June 11, 2001 18:43 Char Count= 0
CALCULATED BETS
TABLE 6.3. Average Exacta Payoffs from Dania and Milford
Dania Milford Totals
Matinee Evening Matinee Evening Average
Bet Count Payoff Count Payoff Count Payoff Count Payoff Count Payoff/$
1–2 41 $84.34 74 $80.27 57 $106.54 65 $110.83 237 $38.50
1–3 28 $90.33 50 $90.13 38 $107.27 58 $113.46 174 $40.63
1–4 25 $118.13 36 $106.99 27 $123.11 45 $124.23 133 $47.92
1–5 30 $101.86 35 $106.40 46 $145.09 42 $137.19 153 $49.25
1–6 21 $143.14 47 $146.86 34 $152.59 46 $137.37 148 $59.39
1–7 21 $167.16 37 $129.87 39 $152.52 47 $139.03 144 $57.77
1–8 27 $170.14 32 $160.12 26 $189.55 38 $154.26 123 $68.75
2–1 38 $90.25 64 $85.86 48 $109.84 68 $98.57 218 $38.78
2–3 28 $112.46 62 $100.05 49 $112.75 57 $112.97 196 $44.20
2–4 34 $123.56 42 $98.34 37 $131.41 42 $132.70 155 $49.32
2–5 29 $118.45 45 $101.25 45 $114.87 51 $128.12 170 $46.45
2–6 16 $126.39 29 $118.03 26 $145.95 60 $145.06 131 $52.59
2–7 25 $137.04 40 $140.43 31 $155.22 54 $140.84 150 $57.74
2–8 23 $152.13 39 $151.56 30 $158.24 39 $130.78 131 $60.97
3–1 39 $80.93 59 $84.02 44 $96.42 77 $92.18 219 $35.79
3–2 37 $90.01 74 $87.90 42 $88.46 64 $87.49 217 $36.97
3–4 25 $156.56 33 $147.48 24 $163.40 25 $183.76 107 $67.56
3–5 19 $126.57 35 $146.77 16 $170.64 34 $174.54 104 $64.03
3–6 14 $169.37 20 $144.81 20 $157.75 24 $204.25 78 $68.20
3–7 18 $148.67 35 $169.64 32 $143.67 33 $134.19 118 $61.99
3–8 25 $139.20 31 $143.71 29 $164.41 39 $159.77 124 $61.56
4–1 43 $99.31 69 $84.08 67 $88.73 90 $95.57 269 $36.75
4–2 46 $92.82 76 $85.20 62 $98.17 74 $85.92 258 $36.90
4–3 36 $125.46 38 $124.82 42 $133.13 47 $117.94 163 $51.18
4–5 9 $208.50 21 $232.33 18 $270.50 29 $277.83 77 $99.82
4–6 5 $154.98 15 $214.36 14 $224.40 8 $329.96 42 $93.39
4–7 12 $175.50 22 $203.50 9 $270.00 18 $162.03 61 $83.17
4–8 14 $179.08 26 $213.55 16 $203.42 33 $183.75 89 $80.18
5–1 30 $103.40 60 $108.72 65 $104.45 67 $103.97 222 $42.33
5–2 35 $83.38 62 $98.31 56 $99.26 76 $103.03 229 $39.17
5–3 36 $109.27 60 $110.85 54 $106.41 59 $110.82 209 $44.91
5–4 22 $180.09 34 $186.55 18 $163.68 38 $168.22 112 $73.80
5–6 7 $291.30 20 $349.29 15 $262.64 11 $365.29 53 $135.19
5–7 10 $224.29 11 $311.60 8 $255.71 20 $217.25 49 $101.34
5–8 8 $247.57 4 $192.45 10 $175.53 11 $200.24 33 $81.65
6–1 29 $141.97 53 $124.63 47 $123.25 65 $126.34 194 $51.70
6–2 27 $113.68 41 $123.73 46 $125.33 57 $113.48 171 $47.66
6–3 42 $107.02 45 $116.04 52 $105.22 62 $116.39 201 $45.21
6–4 38 $130.18 46 $140.95 39 $127.51 46 $137.15 169 $56.07
6–5 13 $305.17 19 $251.82 20 $239.44 27 $260.11 79 $105.23
6–7 8 $343.65 11 $264.68 14 $242.46 15 $273.66 48 $111.05
6–8 1 $196.00 3 $385.60 3 $260.60 10 $286.05 17 $111.21
118
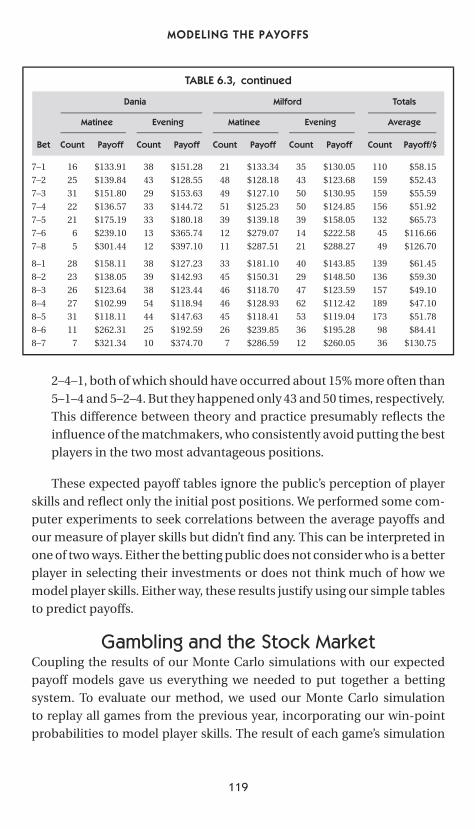
P1: FCH/FYX P2: FCH
CB386-06 CB386-Skiena June 11, 2001 18:43 Char Count= 0
MODELING THE PAYOFFS
TABLE 6.3, continued
Dania Milford Totals
Matinee Evening Matinee Evening Average
Bet Count Payoff Count Payoff Count Payoff Count Payoff Count Payoff/$
7–1 16 $133.91 38 $151.28 21 $133.34 35 $130.05 110 $58.15
7–2 25 $139.84 43 $128.55 48 $128.18 43 $123.68 159 $52.43
7–3 31 $151.80 29 $153.63 49 $127.10 50 $130.95 159 $55.59
7–4 22 $136.57 33 $144.72 51 $125.23 50 $124.85 156 $51.92
7–5 21 $175.19 33 $180.18 39 $139.18 39 $158.05 132 $65.73
7–6 6 $239.10 13 $365.74 12 $279.07 14 $222.58 45 $116.66
7–8 5 $301.44 12 $397.10 11 $287.51 21 $288.27 49 $126.70
8–1 28 $158.11 38 $127.23 33 $181.10 40 $143.85 139 $61.45
8–2 23 $138.05 39 $142.93 45 $150.31 29 $148.50 136 $59.30
8–3 26 $123.64 38 $123.44 46 $118.70 47 $123.59 157 $49.10
8–4 27 $102.99 54 $118.94 46 $128.93 62 $112.42 189 $47.10
8–5 31 $118.11 44 $147.63 45 $118.41 53 $119.04 173 $51.78
8–6 11 $262.31 25 $192.59 26 $239.85 36 $195.28 98 $84.41
8–7 7 $321.34 10 $374.70 7 $286.59 12 $260.05 36 $130.75
2–4–1, both of which should have occurred about 15% more often than5–1–4 and 5–2–4. But they happened only 43 and 50 times, respectively.This difference between theory and practice presumably reflects theinfluence of the matchmakers, who consistently avoid putting the bestplayers in the two most advantageous positions.
These expected payoff tables ignore the public’s perception of playerskills and reflect only the initial post positions. We performed some com-puter experiments to seek correlations between the average payoffs andour measure of player skills but didn’t find any. This can be interpreted inone of two ways. Either the betting public does not consider who is a betterplayer in selecting their investments or does not think much of how wemodel player skills. Either way, these results justify using our simple tablesto predict payoffs.
Gambling and the Stock MarketCoupling the results of our Monte Carlo simulations with our expectedpayoff models gave us everything we needed to put together a bettingsystem. To evaluate our method, we used our Monte Carlo simulationto replay all games from the previous year, incorporating our win-pointprobabilities to model player skills. The result of each game’s simulation
119
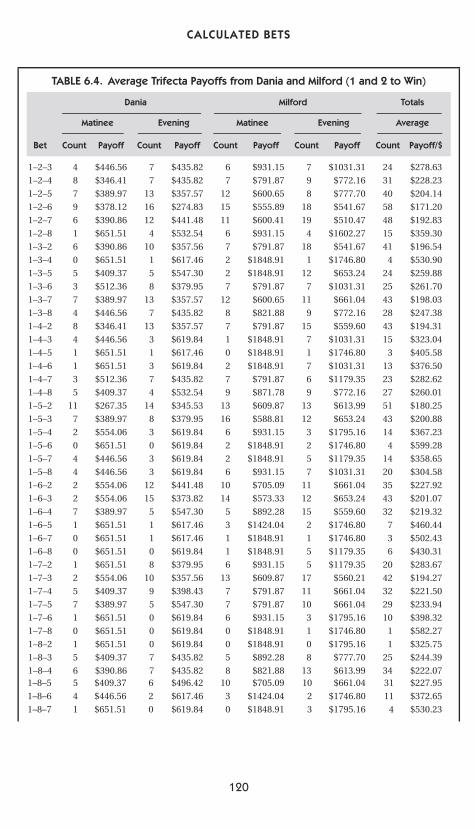
P1: FCH/FYX P2: FCH
CB386-06 CB386-Skiena June 11, 2001 18:43 Char Count= 0
CALCULATED BETS
TABLE 6.4. Average Trifecta Payoffs from Dania and Milford (1 and 2 to Win)
Dania Milford Totals
Matinee Evening Matinee Evening Average
Bet Count Payoff Count Payoff Count Payoff Count Payoff Count Payoff/$
1–2–3 4 $446.56 7 $435.82 6 $931.15 7 $1031.31 24 $278.63
1–2–4 8 $346.41 7 $435.82 7 $791.87 9 $772.16 31 $228.23
1–2–5 7 $389.97 13 $357.57 12 $600.65 8 $777.70 40 $204.14
1–2–6 9 $378.12 16 $274.83 15 $555.89 18 $541.67 58 $171.20
1–2–7 6 $390.86 12 $441.48 11 $600.41 19 $510.47 48 $192.83
1–2–8 1 $651.51 4 $532.54 6 $931.15 4 $1602.27 15 $359.30
1–3–2 6 $390.86 10 $357.56 7 $791.87 18 $541.67 41 $196.54
1–3–4 0 $651.51 1 $617.46 2 $1848.91 1 $1746.80 4 $530.90
1–3–5 5 $409.37 5 $547.30 2 $1848.91 12 $653.24 24 $259.88
1–3–6 3 $512.36 8 $379.95 7 $791.87 7 $1031.31 25 $261.70
1–3–7 7 $389.97 13 $357.57 12 $600.65 11 $661.04 43 $198.03
1–3–8 4 $446.56 7 $435.82 8 $821.88 9 $772.16 28 $247.38
1–4–2 8 $346.41 13 $357.57 7 $791.87 15 $559.60 43 $194.31
1–4–3 4 $446.56 3 $619.84 1 $1848.91 7 $1031.31 15 $323.04
1–4–5 1 $651.51 1 $617.46 0 $1848.91 1 $1746.80 3 $405.58
1–4–6 1 $651.51 3 $619.84 2 $1848.91 7 $1031.31 13 $376.50
1–4–7 3 $512.36 7 $435.82 7 $791.87 6 $1179.35 23 $282.62
1–4–8 5 $409.37 4 $532.54 9 $871.78 9 $772.16 27 $260.01
1–5–2 11 $267.35 14 $345.53 13 $609.87 13 $613.99 51 $180.25
1–5–3 7 $389.97 8 $379.95 16 $588.81 12 $653.24 43 $200.88
1–5–4 2 $554.06 3 $619.84 6 $931.15 3 $1795.16 14 $367.23
1–5–6 0 $651.51 0 $619.84 2 $1848.91 2 $1746.80 4 $599.28
1–5–7 4 $446.56 3 $619.84 2 $1848.91 5 $1179.35 14 $358.65
1–5–8 4 $446.56 3 $619.84 6 $931.15 7 $1031.31 20 $304.58
1–6–2 2 $554.06 12 $441.48 10 $705.09 11 $661.04 35 $227.92
1–6–3 2 $554.06 15 $373.82 14 $573.33 12 $653.24 43 $201.07
1–6–4 7 $389.97 5 $547.30 5 $892.28 15 $559.60 32 $219.32
1–6–5 1 $651.51 1 $617.46 3 $1424.04 2 $1746.80 7 $460.44
1–6–7 0 $651.51 1 $617.46 1 $1848.91 1 $1746.80 3 $502.43
1–6–8 0 $651.51 0 $619.84 1 $1848.91 5 $1179.35 6 $430.31
1–7–2 1 $651.51 8 $379.95 6 $931.15 5 $1179.35 20 $283.67
1–7–3 2 $554.06 10 $357.56 13 $609.87 17 $560.21 42 $194.27
1–7–4 5 $409.37 9 $398.43 7 $791.87 11 $661.04 32 $221.50
1–7–5 7 $389.97 5 $547.30 7 $791.87 10 $661.04 29 $233.94
1–7–6 1 $651.51 0 $619.84 6 $931.15 3 $1795.16 10 $398.32
1–7–8 0 $651.51 0 $619.84 0 $1848.91 1 $1746.80 1 $582.27
1–8–2 1 $651.51 0 $619.84 0 $1848.91 0 $1795.16 1 $325.75
1–8–3 5 $409.37 7 $435.82 5 $892.28 8 $777.70 25 $244.39
1–8–4 6 $390.86 7 $435.82 8 $821.88 13 $613.99 34 $222.071–8–5 5 $409.37 6 $496.42 10 $705.09 10 $661.04 31 $227.95
1–8–6 4 $446.56 2 $617.46 3 $1424.04 2 $1746.80 11 $372.65
1–8–7 1 $651.51 0 $619.84 0 $1848.91 3 $1795.16 4 $530.23
120
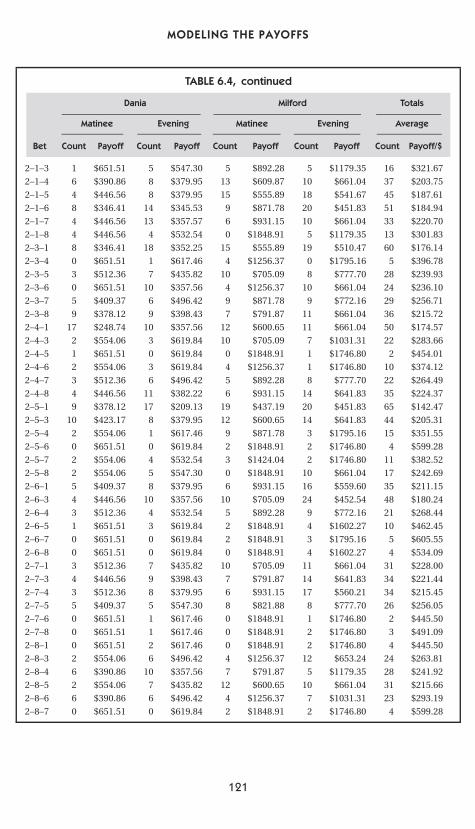
P1: FCH/FYX P2: FCH
CB386-06 CB386-Skiena June 11, 2001 18:43 Char Count= 0
MODELING THE PAYOFFS
2–1–3 1 $651.51 5 $547.30 5 $892.28 5 $1179.35 16 $321.67
2–1–4 6 $390.86 8 $379.95 13 $609.87 10 $661.04 37 $203.75
2–1–5 4 $446.56 8 $379.95 15 $555.89 18 $541.67 45 $187.61
2–1–6 8 $346.41 14 $345.53 9 $871.78 20 $451.83 51 $184.94
2–1–7 4 $446.56 13 $357.57 6 $931.15 10 $661.04 33 $220.70
2–1–8 4 $446.56 4 $532.54 0 $1848.91 5 $1179.35 13 $301.83
2–3–1 8 $346.41 18 $352.25 15 $555.89 19 $510.47 60 $176.14
2–3–4 0 $651.51 1 $617.46 4 $1256.37 0 $1795.16 5 $396.78
2–3–5 3 $512.36 7 $435.82 10 $705.09 8 $777.70 28 $239.93
2–3–6 0 $651.51 10 $357.56 4 $1256.37 10 $661.04 24 $236.10
2–3–7 5 $409.37 6 $496.42 9 $871.78 9 $772.16 29 $256.71
2–3–8 9 $378.12 9 $398.43 7 $791.87 11 $661.04 36 $215.72
2–4–1 17 $248.74 10 $357.56 12 $600.65 11 $661.04 50 $174.57
2–4–3 2 $554.06 3 $619.84 10 $705.09 7 $1031.31 22 $283.66
2–4–5 1 $651.51 0 $619.84 0 $1848.91 1 $1746.80 2 $454.01
2–4–6 2 $554.06 3 $619.84 4 $1256.37 1 $1746.80 10 $374.12
2–4–7 3 $512.36 6 $496.42 5 $892.28 8 $777.70 22 $264.49
2–4–8 4 $446.56 11 $382.22 6 $931.15 14 $641.83 35 $224.37
2–5–1 9 $378.12 17 $209.13 19 $437.19 20 $451.83 65 $142.47
2–5–3 10 $423.17 8 $379.95 12 $600.65 14 $641.83 44 $205.31
2–5–4 2 $554.06 1 $617.46 9 $871.78 3 $1795.16 15 $351.55
2–5–6 0 $651.51 0 $619.84 2 $1848.91 2 $1746.80 4 $599.28
2–5–7 2 $554.06 4 $532.54 3 $1424.04 2 $1746.80 11 $382.52
2–5–8 2 $554.06 5 $547.30 0 $1848.91 10 $661.04 17 $242.69
2–6–1 5 $409.37 8 $379.95 6 $931.15 16 $559.60 35 $211.15
2–6–3 4 $446.56 10 $357.56 10 $705.09 24 $452.54 48 $180.24
2–6–4 3 $512.36 4 $532.54 5 $892.28 9 $772.16 21 $268.44
2–6–5 1 $651.51 3 $619.84 2 $1848.91 4 $1602.27 10 $462.45
2–6–7 0 $651.51 0 $619.84 2 $1848.91 3 $1795.16 5 $605.55
2–6–8 0 $651.51 0 $619.84 0 $1848.91 4 $1602.27 4 $534.09
2–7–1 3 $512.36 7 $435.82 10 $705.09 11 $661.04 31 $228.00
2–7–3 4 $446.56 9 $398.43 7 $791.87 14 $641.83 34 $221.44
2–7–4 3 $512.36 8 $379.95 6 $931.15 17 $560.21 34 $215.45
2–7–5 5 $409.37 5 $547.30 8 $821.88 8 $777.70 26 $256.05
2–7–6 0 $651.51 1 $617.46 0 $1848.91 1 $1746.80 2 $445.50
2–7–8 0 $651.51 1 $617.46 0 $1848.91 2 $1746.80 3 $491.09
2–8–1 0 $651.51 2 $617.46 0 $1848.91 2 $1746.80 4 $445.50
2–8–3 2 $554.06 6 $496.42 4 $1256.37 12 $653.24 24 $263.81
2–8–4 6 $390.86 10 $357.56 7 $791.87 5 $1179.35 28 $241.92
2–8–5 2 $554.06 7 $435.82 12 $600.65 10 $661.04 31 $215.66
2–8–6 6 $390.86 6 $496.42 4 $1256.37 7 $1031.31 23 $293.19
2–8–7 0 $651.51 0 $619.84 2 $1848.91 2 $1746.80 4 $599.28
Dania Milford Totals
Matinee Evening Matinee Evening Average
Bet Count Payoff Count Payoff Count Payoff Count Payoff Count Payoff/$
TABLE 6.4, continued
121
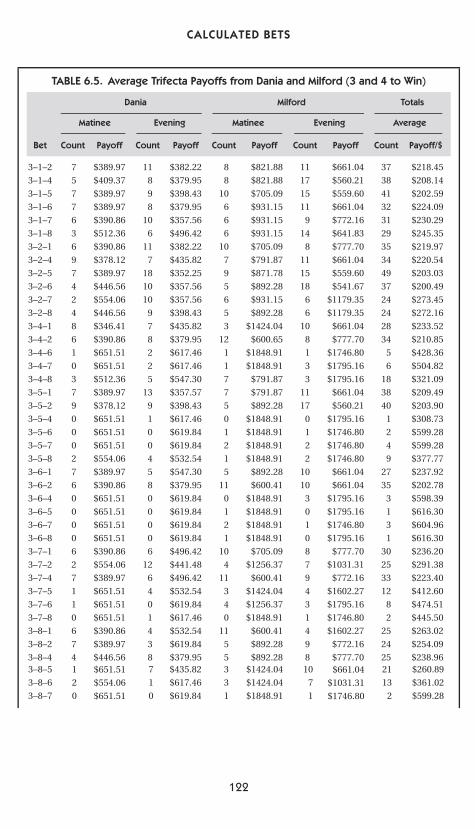
P1: FCH/FYX P2: FCH
CB386-06 CB386-Skiena June 11, 2001 18:43 Char Count= 0
CALCULATED BETS
TABLE 6.5. Average Trifecta Payoffs from Dania and Milford (3 and 4 to Win)
Dania Milford Totals
Matinee Evening Matinee Evening Average
Bet Count Payoff Count Payoff Count Payoff Count Payoff Count Payoff/$
3–1–2 7 $389.97 11 $382.22 8 $821.88 11 $661.04 37 $218.45
3–1–4 5 $409.37 8 $379.95 8 $821.88 17 $560.21 38 $208.14
3–1–5 7 $389.97 9 $398.43 10 $705.09 15 $559.60 41 $202.59
3–1–6 7 $389.97 8 $379.95 6 $931.15 11 $661.04 32 $224.09
3–1–7 6 $390.86 10 $357.56 6 $931.15 9 $772.16 31 $230.29
3–1–8 3 $512.36 6 $496.42 6 $931.15 14 $641.83 29 $245.35
3–2–1 6 $390.86 11 $382.22 10 $705.09 8 $777.70 35 $219.97
3–2–4 9 $378.12 7 $435.82 7 $791.87 11 $661.04 34 $220.54
3–2–5 7 $389.97 18 $352.25 9 $871.78 15 $559.60 49 $203.03
3–2–6 4 $446.56 10 $357.56 5 $892.28 18 $541.67 37 $200.49
3–2–7 2 $554.06 10 $357.56 6 $931.15 6 $1179.35 24 $273.45
3–2–8 4 $446.56 9 $398.43 5 $892.28 6 $1179.35 24 $272.16
3–4–1 8 $346.41 7 $435.82 3 $1424.04 10 $661.04 28 $233.52
3–4–2 6 $390.86 8 $379.95 12 $600.65 8 $777.70 34 $210.85
3–4–6 1 $651.51 2 $617.46 1 $1848.91 1 $1746.80 5 $428.36
3–4–7 0 $651.51 2 $617.46 1 $1848.91 3 $1795.16 6 $504.82
3–4–8 3 $512.36 5 $547.30 7 $791.87 3 $1795.16 18 $321.09
3–5–1 7 $389.97 13 $357.57 7 $791.87 11 $661.04 38 $209.49
3–5–2 9 $378.12 9 $398.43 5 $892.28 17 $560.21 40 $203.90
3–5–4 0 $651.51 1 $617.46 0 $1848.91 0 $1795.16 1 $308.73
3–5–6 0 $651.51 0 $619.84 1 $1848.91 1 $1746.80 2 $599.28
3–5–7 0 $651.51 0 $619.84 2 $1848.91 2 $1746.80 4 $599.28
3–5–8 2 $554.06 4 $532.54 1 $1848.91 2 $1746.80 9 $377.77
3–6–1 7 $389.97 5 $547.30 5 $892.28 10 $661.04 27 $237.92
3–6–2 6 $390.86 8 $379.95 11 $600.41 10 $661.04 35 $202.78
3–6–4 0 $651.51 0 $619.84 0 $1848.91 3 $1795.16 3 $598.39
3–6–5 0 $651.51 0 $619.84 1 $1848.91 0 $1795.16 1 $616.30
3–6–7 0 $651.51 0 $619.84 2 $1848.91 1 $1746.80 3 $604.96
3–6–8 0 $651.51 0 $619.84 1 $1848.91 0 $1795.16 1 $616.30
3–7–1 6 $390.86 6 $496.42 10 $705.09 8 $777.70 30 $236.20
3–7–2 2 $554.06 12 $441.48 4 $1256.37 7 $1031.31 25 $291.38
3–7–4 7 $389.97 6 $496.42 11 $600.41 9 $772.16 33 $223.40
3–7–5 1 $651.51 4 $532.54 3 $1424.04 4 $1602.27 12 $412.60
3–7–6 1 $651.51 0 $619.84 4 $1256.37 3 $1795.16 8 $474.51
3–7–8 0 $651.51 1 $617.46 0 $1848.91 1 $1746.80 2 $445.50
3–8–1 6 $390.86 4 $532.54 11 $600.41 4 $1602.27 25 $263.02
3–8–2 7 $389.97 3 $619.84 5 $892.28 9 $772.16 24 $254.09
3–8–4 4 $446.56 8 $379.95 5 $892.28 8 $777.70 25 $238.963–8–5 1 $651.51 7 $435.82 3 $1424.04 10 $661.04 21 $260.89
3–8–6 2 $554.06 1 $617.46 3 $1424.04 7 $1031.31 13 $361.02
3–8–7 0 $651.51 0 $619.84 1 $1848.91 1 $1746.80 2 $599.28
122
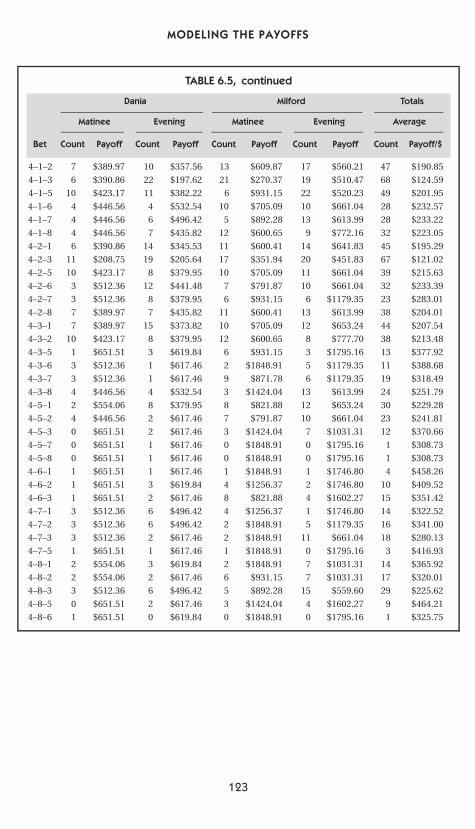
P1: FCH/FYX P2: FCH
CB386-06 CB386-Skiena June 11, 2001 18:43 Char Count= 0
MODELING THE PAYOFFS
Dania Milford Totals
Matinee Evening Matinee Evening Average
Bet Count Payoff Count Payoff Count Payoff Count Payoff Count Payoff/$
4–1–6 4 $446.56 4 $532.54 10 $705.09 10 $661.04 28 $232.57
4–1–7 4 $446.56 6 $496.42 5 $892.28 13 $613.99 28 $233.22
4–1–8 4 $446.56 7 $435.82 12 $600.65 9 $772.16 32 $223.05
4–2–1 6 $390.86 14 $345.53 11 $600.41 14 $641.83 45 $195.29
4–2–3 11 $208.75 19 $205.64 17 $351.94 20 $451.83 67 $121.02
4–2–5 10 $423.17 8 $379.95 10 $705.09 11 $661.04 39 $215.63
4–2–6 3 $512.36 12 $441.48 7 $791.87 10 $661.04 32 $233.39
4–2–7 3 $512.36 8 $379.95 6 $931.15 6 $1179.35 23 $283.01
4–2–8 7 $389.97 7 $435.82 11 $600.41 13 $613.99 38 $204.01
4–3–1 7 $389.97 15 $373.82 10 $705.09 12 $653.24 44 $207.54
4–3–2 10 $423.17 8 $379.95 12 $600.65 8 $777.70 38 $213.48
4–3–5 1 $651.51 3 $619.84 6 $931.15 3 $1795.16 13 $377.92
4–3–6 3 $512.36 1 $617.46 2 $1848.91 5 $1179.35 11 $388.68
4–3–7 3 $512.36 1 $617.46 9 $871.78 6 $1179.35 19 $318.49
4–3–8 4 $446.56 4 $532.54 3 $1424.04 13 $613.99 24 $251.79
4–5–1 2 $554.06 8 $379.95 8 $821.88 12 $653.24 30 $229.28
4–5–2 4 $446.56 2 $617.46 7 $791.87 10 $661.04 23 $241.81
4–5–3 0 $651.51 2 $617.46 3 $1424.04 7 $1031.31 12 $370.66
4–5–7 0 $651.51 1 $617.46 0 $1848.91 0 $1795.16 1 $308.73
4–5–8 0 $651.51 1 $617.46 0 $1848.91 0 $1795.16 1 $308.73
4–6–1 1 $651.51 1 $617.46 1 $1848.91 1 $1746.80 4 $458.26
4–6–2 1 $651.51 3 $619.84 4 $1256.37 2 $1746.80 10 $409.52
4–6–3 1 $651.51 2 $617.46 8 $821.88 4 $1602.27 15 $351.42
4–7–1 3 $512.36 6 $496.42 4 $1256.37 1 $1746.80 14 $322.52
4–7–2 3 $512.36 6 $496.42 2 $1848.91 5 $1179.35 16 $341.00
4–7–3 3 $512.36 2 $617.46 2 $1848.91 11 $661.04 18 $280.13
4–7–5 1 $651.51 1 $617.46 1 $1848.91 0 $1795.16 3 $416.93
4–8–1 2 $554.06 3 $619.84 2 $1848.91 7 $1031.31 14 $365.92
4–8–2 2 $554.06 2 $617.46 6 $931.15 7 $1031.31 17 $320.01
4–8–3 3 $512.36 6 $496.42 5 $892.28 15 $559.60 29 $225.62
4–8–5 0 $651.51 2 $617.46 3 $1424.04 4 $1602.27 9 $464.21
4–8–6 1 $651.51 0 $619.84 0 $1848.91 0 $1795.16 1 $325.75
TABLE 6.5, continued
4–1–2 7 $389.97 10 $357.56 13 $609.87 17 $560.21 47 $190.85
4–1–3 6 $390.86 22 $197.62 21 $270.37 19 $510.47 68 $124.59
4–1–5 10 $423.17 11 $382.22 6 $931.15 22 $520.23 49 $201.95
123
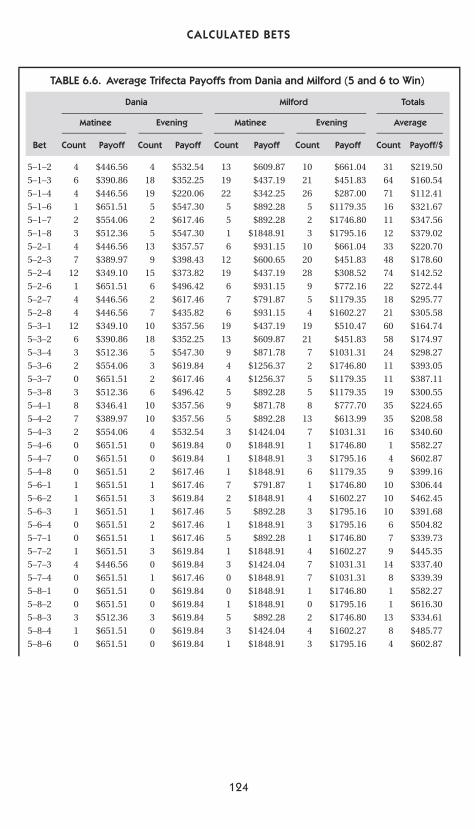
P1: FCH/FYX P2: FCH
CB386-06 CB386-Skiena June 11, 2001 18:43 Char Count= 0
CALCULATED BETS
Dania Milford Totals
Matinee Evening Matinee Evening Average
Bet Count Payoff Count Payoff Count Payoff Count Payoff Count Payoff/$
5–1–2 4 $446.56 4 $532.54 13 $609.87 10 $661.04 31 $219.50
5–1–3 6 $390.86 18 $352.25 19 $437.19 21 $451.83 64 $160.54
5–1–4 4 $446.56 19 $220.06 22 $342.25 26 $287.00 71 $112.41
5–1–6 1 $651.51 5 $547.30 5 $892.28 5 $1179.35 16 $321.67
5–1–7 2 $554.06 2 $617.46 5 $892.28 2 $1746.80 11 $347.56
5–1–8 3 $512.36 5 $547.30 1 $1848.91 3 $1795.16 12 $379.02
5–2–1 4 $446.56 13 $357.57 6 $931.15 10 $661.04 33 $220.70
5–2–3 7 $389.97 9 $398.43 12 $600.65 20 $451.83 48 $178.60
5–2–4 12 $349.10 15 $373.82 19 $437.19 28 $308.52 74 $142.52
5–2–6 1 $651.51 6 $496.42 6 $931.15 9 $772.16 22 $272.44
5–2–7 4 $446.56 2 $617.46 7 $791.87 5 $1179.35 18 $295.77
5–2–8 4 $446.56 7 $435.82 6 $931.15 4 $1602.27 21 $305.58
5–3–1 12 $349.10 10 $357.56 19 $437.19 19 $510.47 60 $164.74
5–3–2 6 $390.86 18 $352.25 13 $609.87 21 $451.83 58 $174.97
5–3–4 3 $512.36 5 $547.30 9 $871.78 7 $1031.31 24 $298.27
5–3–6 2 $554.06 3 $619.84 4 $1256.37 2 $1746.80 11 $393.05
5–3–7 0 $651.51 2 $617.46 4 $1256.37 5 $1179.35 11 $387.11
5–3–8 3 $512.36 6 $496.42 5 $892.28 5 $1179.35 19 $300.55
5–4–1 8 $346.41 10 $357.56 9 $871.78 8 $777.70 35 $224.65
5–4–2 7 $389.97 10 $357.56 5 $892.28 13 $613.99 35 $208.58
5–4–3 2 $554.06 4 $532.54 3 $1424.04 7 $1031.31 16 $340.60
5–4–6 0 $651.51 0 $619.84 0 $1848.91 1 $1746.80 1 $582.27
5–4–7 0 $651.51 0 $619.84 1 $1848.91 3 $1795.16 4 $602.87
5–4–8 0 $651.51 2 $617.46 1 $1848.91 6 $1179.35 9 $399.16
5–6–1 1 $651.51 1 $617.46 7 $791.87 1 $1746.80 10 $306.44
5–6–2 1 $651.51 3 $619.84 2 $1848.91 4 $1602.27 10 $462.45
5–6–3 1 $651.51 1 $617.46 5 $892.28 3 $1795.16 10 $391.68
5–6–4 0 $651.51 2 $617.46 1 $1848.91 3 $1795.16 6 $504.82
5–7–1 0 $651.51 1 $617.46 5 $892.28 1 $1746.80 7 $339.73
5–7–2 1 $651.51 3 $619.84 1 $1848.91 4 $1602.27 9 $445.35
5–7–3 4 $446.56 0 $619.84 3 $1424.04 7 $1031.31 14 $337.40
5–7–4 0 $651.51 1 $617.46 0 $1848.91 7 $1031.31 8 $339.39
5–8–1 0 $651.51 0 $619.84 0 $1848.91 1 $1746.80 1 $582.27
5–8–2 0 $651.51 0 $619.84 1 $1848.91 0 $1795.16 1 $616.30
5–8–3 3 $512.36 3 $619.84 5 $892.28 2 $1746.80 13 $334.61
5–8–4 1 $651.51 0 $619.84 3 $1424.04 4 $1602.27 8 $485.77
5–8–6 0 $651.51 0 $619.84 1 $1848.91 3 $1795.16 4 $602.87
TABLE 6.6. Average Trifecta Payoffs from Dania and Milford (5 and 6 to Win)
124
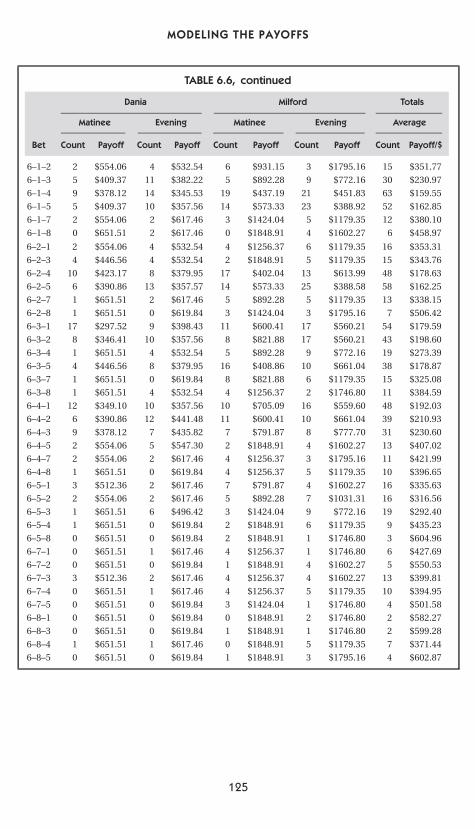
P1: FCH/FYX P2: FCH
CB386-06 CB386-Skiena June 11, 2001 18:43 Char Count= 0
MODELING THE PAYOFFS
Dania Milford Totals
Matinee Evening Matinee Evening Average
Bet Count Payoff Count Payoff Count Payoff Count Payoff Count Payoff/$
6–2–1 2 $554.06 4 $532.54 4 $1256.37 6 $1179.35 16 $353.31
6–2–3 4 $446.56 4 $532.54 2 $1848.91 5 $1179.35 15 $343.76
6–2–4 10 $423.17 8 $379.95 17 $402.04 13 $613.99 48 $178.63
6–2–5 6 $390.86 13 $357.57 14 $573.33 25 $388.58 58 $162.25
6–2–7 1 $651.51 2 $617.46 5 $892.28 5 $1179.35 13 $338.15
6–2–8 1 $651.51 0 $619.84 3 $1424.04 3 $1795.16 7 $506.42
6–3–1 17 $297.52 9 $398.43 11 $600.41 17 $560.21 54 $179.59
6–3–2 8 $346.41 10 $357.56 8 $821.88 17 $560.21 43 $198.60
6–3–4 1 $651.51 4 $532.54 5 $892.28 9 $772.16 19 $273.39
6–3–5 4 $446.56 8 $379.95 16 $408.86 10 $661.04 38 $178.87
6–3–7 1 $651.51 0 $619.84 8 $821.88 6 $1179.35 15 $325.08
6–3–8 1 $651.51 4 $532.54 4 $1256.37 2 $1746.80 11 $384.59
6–4–1 12 $349.10 10 $357.56 10 $705.09 16 $559.60 48 $192.03
6–4–2 6 $390.86 12 $441.48 11 $600.41 10 $661.04 39 $210.93
6–4–3 9 $378.12 7 $435.82 7 $791.87 8 $777.70 31 $230.60
6–4–5 2 $554.06 5 $547.30 2 $1848.91 4 $1602.27 13 $407.02
6–4–7 2 $554.06 2 $617.46 4 $1256.37 3 $1795.16 11 $421.99
6–4–8 1 $651.51 0 $619.84 4 $1256.37 5 $1179.35 10 $396.65
6–5–1 3 $512.36 2 $617.46 7 $791.87 4 $1602.27 16 $335.63
6–5–2 2 $554.06 2 $617.46 5 $892.28 7 $1031.31 16 $316.56
6–5–3 1 $651.51 6 $496.42 3 $1424.04 9 $772.16 19 $292.40
6–5–4 1 $651.51 0 $619.84 2 $1848.91 6 $1179.35 9 $435.23
6–5–8 0 $651.51 0 $619.84 2 $1848.91 1 $1746.80 3 $604.96
6–7–1 0 $651.51 1 $617.46 4 $1256.37 1 $1746.80 6 $427.69
6–7–2 0 $651.51 0 $619.84 1 $1848.91 4 $1602.27 5 $550.53
6–7–3 3 $512.36 2 $617.46 4 $1256.37 4 $1602.27 13 $399.81
6–7–4 0 $651.51 1 $617.46 4 $1256.37 5 $1179.35 10 $394.95
6–7–5 0 $651.51 0 $619.84 3 $1424.04 1 $1746.80 4 $501.58
6–8–1 0 $651.51 0 $619.84 0 $1848.91 2 $1746.80 2 $582.27
6–8–3 0 $651.51 0 $619.84 1 $1848.91 1 $1746.80 2 $599.28
6–8–4 1 $651.51 1 $617.46 0 $1848.91 5 $1179.35 7 $371.44
6–8–5 0 $651.51 0 $619.84 1 $1848.91 3 $1795.16 4 $602.87
TABLE 6.6, continued
6–1–2 2 $554.06 4 $532.54 6 $931.15 3 $1795.16 15 $351.77
6–1–3 5 $409.37 11 $382.22 5 $892.28 9 $772.16 30 $230.97
6–1–4 9 $378.12 14 $345.53 19 $437.19 21 $451.83 63 $159.55
6–1–5 5 $409.37 10 $357.56 14 $573.33 23 $388.92 52 $162.85
6–1–7 2 $554.06 2 $617.46 3 $1424.04 5 $1179.35 12 $380.10
6–1–8 0 $651.51 2 $617.46 0 $1848.91 4 $1602.27 6 $458.97
125
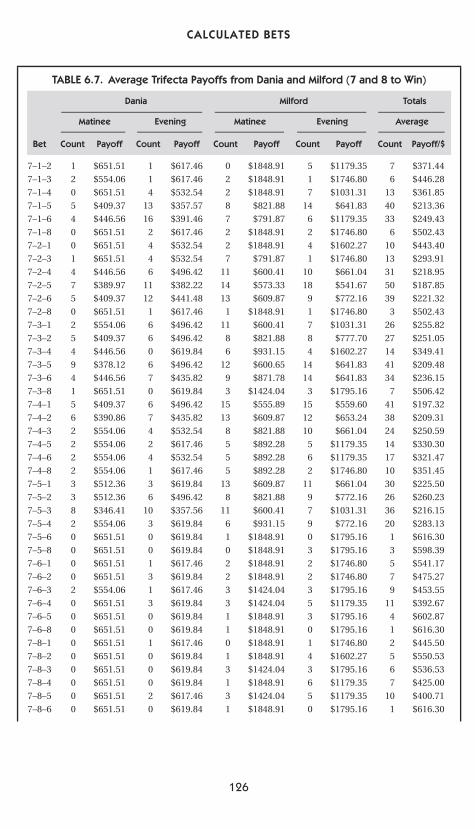
P1: FCH/FYX P2: FCH
CB386-06 CB386-Skiena June 11, 2001 18:43 Char Count= 0
CALCULATED BETS
TABLE 6.7. Average Trifecta Payoffs from Dania and Milford (7 and 8 to Win)
Dania Milford Totals
Matinee Evening Matinee Evening Average
Bet Count Payoff Count Payoff Count Payoff Count Payoff Count Payoff/$
7–1–2 1 $651.51 1 $617.46 0 $1848.91 5 $1179.35 7 $371.44
7–1–3 2 $554.06 1 $617.46 2 $1848.91 1 $1746.80 6 $446.28
7–1–4 0 $651.51 4 $532.54 2 $1848.91 7 $1031.31 13 $361.85
7–1–5 5 $409.37 13 $357.57 8 $821.88 14 $641.83 40 $213.36
7–1–6 4 $446.56 16 $391.46 7 $791.87 6 $1179.35 33 $249.43
7–1–8 0 $651.51 2 $617.46 2 $1848.91 2 $1746.80 6 $502.43
7–2–1 0 $651.51 4 $532.54 2 $1848.91 4 $1602.27 10 $443.40
7–2–3 1 $651.51 4 $532.54 7 $791.87 1 $1746.80 13 $293.91
7–2–4 4 $446.56 6 $496.42 11 $600.41 10 $661.04 31 $218.95
7–2–5 7 $389.97 11 $382.22 14 $573.33 18 $541.67 50 $187.85
7–2–6 5 $409.37 12 $441.48 13 $609.87 9 $772.16 39 $221.32
7–2–8 0 $651.51 1 $617.46 1 $1848.91 1 $1746.80 3 $502.43
7–3–1 2 $554.06 6 $496.42 11 $600.41 7 $1031.31 26 $255.82
7–3–2 5 $409.37 6 $496.42 8 $821.88 8 $777.70 27 $251.05
7–3–4 4 $446.56 0 $619.84 6 $931.15 4 $1602.27 14 $349.41
7–3–5 9 $378.12 6 $496.42 12 $600.65 14 $641.83 41 $209.48
7–3–6 4 $446.56 7 $435.82 9 $871.78 14 $641.83 34 $236.15
7–3–8 1 $651.51 0 $619.84 3 $1424.04 3 $1795.16 7 $506.42
7–4–1 5 $409.37 6 $496.42 15 $555.89 15 $559.60 41 $197.32
7–4–2 6 $390.86 7 $435.82 13 $609.87 12 $653.24 38 $209.31
7–4–3 2 $554.06 4 $532.54 8 $821.88 10 $661.04 24 $250.59
7–4–5 2 $554.06 2 $617.46 5 $892.28 5 $1179.35 14 $330.30
7–4–6 2 $554.06 4 $532.54 5 $892.28 6 $1179.35 17 $321.47
7–4–8 2 $554.06 1 $617.46 5 $892.28 2 $1746.80 10 $351.45
7–5–1 3 $512.36 3 $619.84 13 $609.87 11 $661.04 30 $225.50
7–5–2 3 $512.36 6 $496.42 8 $821.88 9 $772.16 26 $260.23
7–5–3 8 $346.41 10 $357.56 11 $600.41 7 $1031.31 36 $216.15
7–5–4 2 $554.06 3 $619.84 6 $931.15 9 $772.16 20 $283.13
7–5–6 0 $651.51 0 $619.84 1 $1848.91 0 $1795.16 1 $616.30
7–5–8 0 $651.51 0 $619.84 0 $1848.91 3 $1795.16 3 $598.39
7–6–1 0 $651.51 1 $617.46 2 $1848.91 2 $1746.80 5 $541.17
7–6–2 0 $651.51 3 $619.84 2 $1848.91 2 $1746.80 7 $475.27
7–6–3 2 $554.06 1 $617.46 3 $1424.04 3 $1795.16 9 $453.55
7–6–4 0 $651.51 3 $619.84 3 $1424.04 5 $1179.35 11 $392.67
7–6–5 0 $651.51 0 $619.84 1 $1848.91 3 $1795.16 4 $602.87
7–6–8 0 $651.51 0 $619.84 1 $1848.91 0 $1795.16 1 $616.30
7–8–1 0 $651.51 1 $617.46 0 $1848.91 1 $1746.80 2 $445.50
7–8–2 0 $651.51 0 $619.84 1 $1848.91 4 $1602.27 5 $550.53
7–8–3 0 $651.51 0 $619.84 3 $1424.04 3 $1795.16 6 $536.53
7–8–4 0 $651.51 0 $619.84 1 $1848.91 6 $1179.35 7 $425.00
7–8–5 0 $651.51 2 $617.46 3 $1424.04 5 $1179.35 10 $400.71
7–8–6 0 $651.51 0 $619.84 1 $1848.91 0 $1795.16 1 $616.30
126
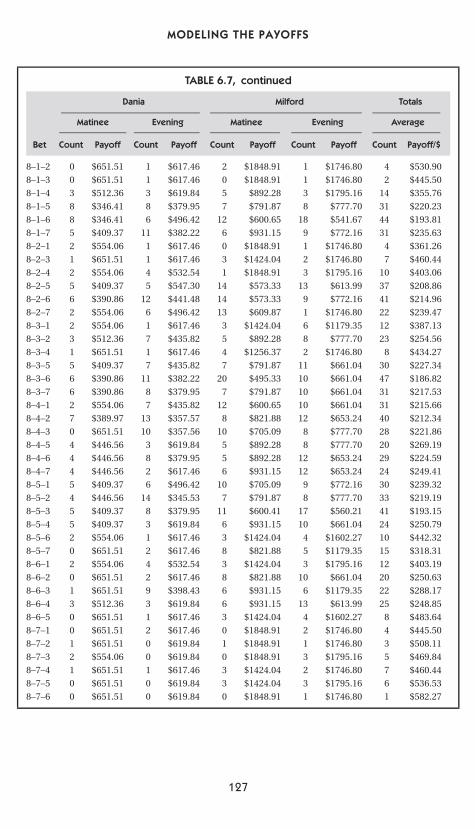
P1: FCH/FYX P2: FCH
CB386-06 CB386-Skiena June 11, 2001 18:43 Char Count= 0
MODELING THE PAYOFFS
TABLE 6.7, continued
Dania Milford Totals
Matinee Evening Matinee Evening Average
Bet Count Payoff Count Payoff Count Payoff Count Payoff Count Payoff/$
8–1–2 0 $651.51 1 $617.46 2 $1848.91 1 $1746.80 4 $530.90
8–1–3 0 $651.51 1 $617.46 0 $1848.91 1 $1746.80 2 $445.50
8–1–4 3 $512.36 3 $619.84 5 $892.28 3 $1795.16 14 $355.76
8–1–5 8 $346.41 8 $379.95 7 $791.87 8 $777.70 31 $220.23
8–1–6 8 $346.41 6 $496.42 12 $600.65 18 $541.67 44 $193.81
8–1–7 5 $409.37 11 $382.22 6 $931.15 9 $772.16 31 $235.63
8–2–1 2 $554.06 1 $617.46 0 $1848.91 1 $1746.80 4 $361.26
8–2–3 1 $651.51 1 $617.46 3 $1424.04 2 $1746.80 7 $460.44
8–2–4 2 $554.06 4 $532.54 1 $1848.91 3 $1795.16 10 $403.06
8–2–5 5 $409.37 5 $547.30 14 $573.33 13 $613.99 37 $208.86
8–2–6 6 $390.86 12 $441.48 14 $573.33 9 $772.16 41 $214.96
8–2–7 2 $554.06 6 $496.42 13 $609.87 1 $1746.80 22 $239.47
8–3–1 2 $554.06 1 $617.46 3 $1424.04 6 $1179.35 12 $387.13
8–3–2 3 $512.36 7 $435.82 5 $892.28 8 $777.70 23 $254.56
8–3–4 1 $651.51 1 $617.46 4 $1256.37 2 $1746.80 8 $434.27
8–3–5 5 $409.37 7 $435.82 7 $791.87 11 $661.04 30 $227.34
8–3–6 6 $390.86 11 $382.22 20 $495.33 10 $661.04 47 $186.82
8–3–7 6 $390.86 8 $379.95 7 $791.87 10 $661.04 31 $217.53
8–4–1 2 $554.06 7 $435.82 12 $600.65 10 $661.04 31 $215.66
8–4–2 7 $389.97 13 $357.57 8 $821.88 12 $653.24 40 $212.34
8–4–3 0 $651.51 10 $357.56 10 $705.09 8 $777.70 28 $221.86
8–4–5 4 $446.56 3 $619.84 5 $892.28 8 $777.70 20 $269.19
8–4–6 4 $446.56 8 $379.95 5 $892.28 12 $653.24 29 $224.59
8–4–7 4 $446.56 2 $617.46 6 $931.15 12 $653.24 24 $249.41
8–5–1 5 $409.37 6 $496.42 10 $705.09 9 $772.16 30 $239.32
8–5–2 4 $446.56 14 $345.53 7 $791.87 8 $777.70 33 $219.19
8–5–3 5 $409.37 8 $379.95 11 $600.41 17 $560.21 41 $193.15
8–5–4 5 $409.37 3 $619.84 6 $931.15 10 $661.04 24 $250.79
8–5–6 2 $554.06 1 $617.46 3 $1424.04 4 $1602.27 10 $442.32
8–5–7 0 $651.51 2 $617.46 8 $821.88 5 $1179.35 15 $318.31
8–6–1 2 $554.06 4 $532.54 3 $1424.04 3 $1795.16 12 $403.19
8–6–2 0 $651.51 2 $617.46 8 $821.88 10 $661.04 20 $250.63
8–6–3 1 $651.51 9 $398.43 6 $931.15 6 $1179.35 22 $288.17
8–6–4 3 $512.36 3 $619.84 6 $931.15 13 $613.99 25 $248.85
8–6–5 0 $651.51 1 $617.46 3 $1424.04 4 $1602.27 8 $483.64
8–7–1 0 $651.51 2 $617.46 0 $1848.91 2 $1746.80 4 $445.50
8–7–2 1 $651.51 0 $619.84 1 $1848.91 1 $1746.80 3 $508.11
8–7–3 2 $554.06 0 $619.84 0 $1848.91 3 $1795.16 5 $469.84
8–7–4 1 $651.51 1 $617.46 3 $1424.04 2 $1746.80 7 $460.44
8–7–5 0 $651.51 0 $619.84 3 $1424.04 3 $1795.16 6 $536.53
8–7–6 0 $651.51 0 $619.84 0 $1848.91 1 $1746.80 1 $582.27
127
P1: FCH/FYX P2: FCH
CB386-06 CB386-Skiena June 11, 2001 18:43 Char Count= 0
CALCULATED BETS
was a probability distribution predicting the likelihood of each possiblebetting outcome. Using the payoff model, we could predict what the payoffshould be for each outcome and make a simulated bet if its expected valuewas sufficient to justify the investment.
The expected value of a given dollar bet on x with probability px andmodel payoff mx is given by the formula
E(x) = px × mx − $1
This captures the notion that we get paid only if x happens, but we mustbuy the $1 ticket regardless. If E (x) is greater than zero, then x is a betoffering positive returns. If E (x) is negative, we should avoid that bet likethe plague.
Our initial betting strategy was to place simulated wagers on all betsoffering sufficient positive return. And our first attempt at simulatedbetting using these average payoffs was amazingly successful. We madea simulated $15,000 profit on a simulated investment of only $20,000.Meena was, understandably, quite happy with these results. But the keyword is simulated. Our simulated success was due to an overly simplisticbetting model.
To be a first-rate programmer, it is important to be very suspicious.You learn to trust no one and question everything. Any program can failbecause of bugs, and a mathematical model is particularly problematicbecause, even if the program is “correct,” the model can fail to capturesome important aspect of reality. It is essential for any programmer toanticipate problems and not to trust numbers that happen to be spit out. AsIntel’s longtime chairman Andrew Grove says, “Only the paranoid survive.”As my mother could have told me, if we were making too much money tooeasily, there had to be a catch.
What was the catch? Under the pari-mutuel system, the payoff for anymatch is a function of both how much money was wagered in total andhow much of this pool was invested on the successful outcome. Wheneverwe add winning money to the pool, it will necessarily reduce the amountthat will be paid off per dollar to the other winners. If we simply averagethe payoffs we have seen from the WWW site, we miss the fact that ourbets themselves will change the payoffs. As we will see in the discussionthat follows, this factor can be very significant.
Investing in the stock market bears considerable similarity to gam-bling and in particular works more like a pari-mutuel system than one
128
P1: FCH/FYX P2: FCH
CB386-06 CB386-Skiena June 11, 2001 18:43 Char Count= 0
MODELING THE PAYOFFS
governed by odds makers. Yet all serious investment money is put intostocks, not horses. Why hasn’t anyone started a jai alai or racetrack mu-tual fund to bet on these sports? There are two fundamental reasonswhy pari-mutuel wagering cannot be considered to be a solid investmentvehicle:
■ The cost per transaction – We have seen that the house keeps about 20%of each bet as a cost for each transaction. This means that we must do20% better than the average bettor just to break even. By comparison,the cost per transaction is just pennies per share in major stock markets,particularly for large transactions. Thus I can prosper with even a slightincrease in the value of my stock.
Low transaction fees are one of the important reasons for the suc-cess of computer trading systems for stocks, which react instanta-neously to price changes in the market and look to benefit from minorfluctuations. A typical stock price might vary 5% per day or less, andthus large commissions would kill any short-term trading strategy.
■ The size of the pool – Large investors like the stock market because it canabsorb great amounts of capital with relatively little reaction. SupposeI wanted to buy 1000 shares of Microsoft. According to my newspaperalmost 600,000 shares were traded yesterday. My 1000-share trade willonly be a blip in this market, yet it would represent an investment onthe order of one million dollars. By comparison, one lousy $3 jai alaibet to win will significantly reduce the payoff for everyone else whobet on the same number to win. Thus, even when I find an excellentbetting opportunity in jai alai, I can’t put enough money on it to takesignificant advantage of my insight.
The so called “penny stocks” that trade on small stock exchangesare subject to this same phenomenon or even worse malfeasance andchicanery. Small companies are, by definition, small. Hence, the totalvalue of all the stock is relatively low. The current price of any stockis exactly what the last person paid for it. Suppose I own a significantamount of a cheap stock that has relatively little trading in it each day. Ican sell a small part of my holdings back and forth to my co-conspirator,raising the price each day. Eventually, honest bettors will see that thestock is moving and want to get some of the action. I will be happy tosell them all of my holdings at this artificially high price, hoping to getrid of it before the market crashes.
129
P1: FCH/FYX P2: FCH
CB386-06 CB386-Skiena June 11, 2001 18:43 Char Count= 0
CALCULATED BETS
With these two facts in mind, why did I devote so much time and effortto develop a betting system for jai alai? Frankly, it can’t be justified on anycold, analytical basis. I did it because it was a very cool thing to do. I onceread a description of an infamous boxing promoter as a man who wouldprefer to steal one dollar than earn two dollars honestly. That motivation,in a much more benign sense, probably also applied to me. All of us, Ithink, get a perverse thrill that comes only from beating the system. Makingmoney gambling is a form of beating the system because we know that theodds are stacked against us. This project represents my effort to beat backthe forces of nature through understanding and intellectual effort.
If you remain unconvinced, think of it this way. Building this systemwas my attempt to steal one dollar. Writing this book was my attemptto earn two dollars honestly. Which of the two do you think was a moreexciting venture to contemplate?
Measuring Our Impact on the PoolHow we can compensate for the fact that our own bets impact the payoffswe receive? The first order of business is to estimate the size of the bettingpools that we are impacting.
The single best measure of the financial health of any track or frontonis not its attendance but its handle. The handle is the total dollar amountthat has been wagered over the course of the day. Because the frontontakes 20% of the handle as its cut, this is the number that matters to them.
Milford Jai-Alai posts the handle with the other results of each day’smatches. These numbers provide interesting insights into the financialstate of the jai alai industry. I plotted the the amount of money bet atMilford each night over a 2-year period in six graphs partitioned accordingto the day of the week.
I always find it exciting to see a large amount of data presented in asmall amount of paper in such a way that it can be understood. I referall fellow mathematical graphics fans to Tufte’s Visualization of Quanti-tative Data, a coffee-table quality book illustrating the beauty of properlyrepresented data.
The handles presented in this figure are for all the evening sessions atMilford in 1997 and 1998. Matinee (afternoon) sessions, which are typicallyplayed on Sunday, Monday, and Wednesday, are not included. From thisdata, it is clear that Friday and Saturday are the big nights at Milford. Thehandles are almost twice as large on weekends as on Monday night. Early
130
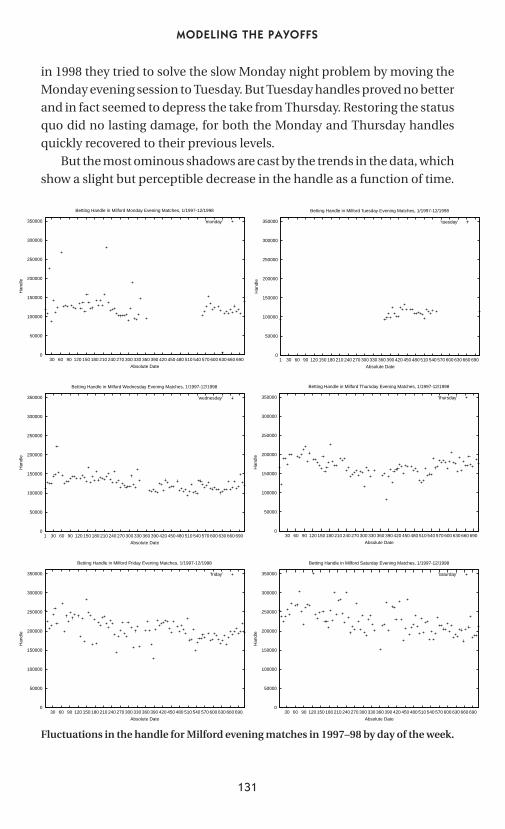
P1: FCH/FYX P2: FCH
CB386-06 CB386-Skiena June 11, 2001 18:43 Char Count= 0
MODELING THE PAYOFFS
in 1998 they tried to solve the slow Monday night problem by moving theMonday evening session to Tuesday. But Tuesday handles proved no betterand in fact seemed to depress the take from Thursday. Restoring the statusquo did no lasting damage, for both the Monday and Thursday handlesquickly recovered to their previous levels.
But the most ominous shadows are cast by the trends in the data, whichshow a slight but perceptible decrease in the handle as a function of time.
0
50000
100000
150000
200000
250000
300000
350000
30 60 90 120 150 180 210 240 270 300 330 360 390 420 450 480 510 540 570 600 630 660 690
Han
dle
Absolute Date
Betting Handle in Milford Monday Evening Matches, 1/1997-12/1998
’monday’
0
50000
100000
150000
200000
250000
300000
350000
1 30 60 90 120 150 180 210 240 270 300 330 360 390 420 450 480 510 540 570 600 630 660 690
Han
dle
Absolute Date
Betting Handle in Milford Tuesday Evening Matches, 1/1997-12/1998
’tuesday’
0
50000
100000
150000
200000
250000
300000
350000
1 30 60 90 120 150 180 210 240 270 300 330 360 390 420 450 480 510 540 570 600 630 660 690
Han
dle
Absolute Date
Betting Handle in Milford Wednesday Evening Matches, 1/1997-12/1998
’wednesday’
0
50000
100000
150000
200000
250000
300000
350000
30 60 90 120 150 180 210 240 270 300 330 360 390 420 450 480 510 540 570 600 630 660 690
Han
dle
Absolute Date
Betting Handle in Milford Thursday Evening Matches, 1/1997-12/1998
’thursday’
0
50000
100000
150000
200000
250000
300000
350000
30 60 90 120 150 180 210 240 270 300 330 360 390 420 450 480 510 540 570 600 630 660 690
Han
dle
Absolute Date
Betting Handle in Milford Friday Evening Matches, 1/1997-12/1998
’friday’
0
50000
100000
150000
200000
250000
300000
350000
30 60 90 120 150 180 210 240 270 300 330 360 390 420 450 480 510 540 570 600 630 660 690
Han
dle
Absolute Date
Betting Handle in Milford Saturday Evening Matches, 1/1997-12/1998
’saturday’
Fluctuations in the handle for Milford evening matches in 1997–98 by day of the week.
131
P1: FCH/FYX P2: FCH
CB386-06 CB386-Skiena June 11, 2001 18:43 Char Count= 0
CALCULATED BETS
These numbers are best put in perspective by comparing them with theboom days of jai alai 20 years ago. In 1978, the average handle at Milfordwas $349,360, a figure reached exactly once over the past 2 years, on anaverage attendance of over 3000 people. Today’s handle and attendanceare about half of what they were 20 years ago.
This data can be used to model how much money would be bet at thefronton on a given night. But that isn’t all we need. Each night’s handle is atotal of all the pools over all the matches. We had to break this total into itscomponents to predict the size of each betting pool. We could estimate theamount of money bet on each match by dividing the handle by the totalnumber of matches in the session. We could further divide the money permatch into its component pools if we knew what fractions of the handlewent into win, place, show, quiniela, exacta, and trifecta pools.
Once we knew how much money was invested in a given pool, it waseasy to figure out our impact on it. From the pool size and our payoff-per-dollar estimation, we could work backwards to figure out how much ofthe pool money would have to have been invested on the winner for it topay off at the estimated rate. By adding our (minimum allowable) bet tothis winning pool amount, we can now divide the total pool among thewinners, including, it is hoped, ourselves.
These formulas gave us the ability to estimate the impact of our betson the entire pool, but we needed the right fractions to predict how muchmoney was invested in each betting pool. This information wasn’t avail-able on the Internet. We had to go back to the source.
Field Trip to ConnecticutMy then-fiance, now-wife Renee had heard me babble about jai alai almostfrom the moment we had met, but she had never been to see a game. Itseemed like a good idea to let her see what she was missing and show Darioand Meena what the sport was really about.
Therefore, on May 28, 1997, we went on a field trip to Connecticut.Bridgeport, which used to be the fronton closest to where I live, had recentlygone out of business after a disastrous attempt to turn it into a dog racingtrack. Milford, the only remaining fronton in Connecticut, is a 2-hour drivefrom Stony Brook. Renee and I swung by to pick the two students up, andthen we rounded New York City and drove into the Nutmeg State.
From our discussions in the car, it became clear that neither Dario norMeena had any real understanding of the physical nature of jai alai. All
132
P1: FCH/FYX P2: FCH
CB386-06 CB386-Skiena June 11, 2001 18:43 Char Count= 0
MODELING THE PAYOFFS
they knew of the sport was what I had told them, and what I told themwas a mathematical abstraction. To Dario and Meena, jai alai players wereBasque-speaking automata who randomly scored points according to agiven probability distribution. They found it somewhat disorienting todiscover that the players were people. It was a reversal of the standardmovie zombie story – the body snatchers came and suddenly there wasflesh and blood on what yesterday had been much-loved machines.
We arrived at an attractively landscaped building designed by award-winning architect Herbert S. Newman. Although Milford has been calledthe “Tiffany of frontons,” its concrete bulkiness betrayed the 1970s con-struction. Milford dates back to the time when betting on jai alai firstbecame legal in Connecticut.
We cruised down the Galleria, beneath a series of colorful Basque-style banners. The thin early crowd seemed to consist mostly of retiredpeople. Not too many working people can take the afternoon off to watchjai alai. The spectators projected the same aura of modest seediness thatyou find in any race track or casino. There was just enough light, glitter,and spectacle about the room to ward off the undercurrent of gloom thatlurks wherever people are losing money. Renee wandered off to explorewhile the rest of us took care of business.
I had arranged for us to meet with Milford Jai-Alai’s public relationsdirector, Bob Heussler. He turned out to be a tall, friendly fellow whotreated us as honored guests. Bob escorted us to the clubhouse, a smallbar and restaurant with the best seats in the house, and offered us drinkson his tab. He even seemed a little disappointed when none of us orderedanything stronger than orange juice. I guess his usual clientele does notinclude students and their professor.
We spent an hour watching and talking jai alai. Times had gotten a lotharder for Milford the instant that the Pequots had opened up their nearbyFoxwoods casino. First the Hartford and then the Bridgeport frontons gotscalped by the Indians, leaving Milford as the only remaining outpost inthe state. Milford inherited the dates and some of the customers of theprevious frontons, which helped. Their finances were stable, but still, itwasn’t like the old days.
“I don’t understand these people,” Bob said, shaking his head sadly.“We offer an exciting game with lots of action. But people just seem towant to throw their money into slot machines. We can’t take their moneyfrom them as fast as the casino can, so they stay away.”
133
P1: FCH/FYX P2: FCH
CB386-06 CB386-Skiena June 11, 2001 18:43 Char Count= 0
CALCULATED BETS
I looked around the hall. It was an early game of a Wednesday matinee,perhaps the slowest period of the week. Only a couple hundred spectatorslined the stands, although more would file in later. The thought that severaltimes as many people were sullenly feeding quarters to the Pequots justan hour’s drive away filled me with despair.
“We’ve been lobbying the state to let us offer slot machines and pokeron the side. That would help bring back the public.”
My students and I had come primarily to learn what we could aboutbetting patterns at Milford. Les Trotto, the director of mutual operations,dropped by to give us copies of the handle summary sheets for the pastfew days.
This data was extremely interesting. The total handle (i.e., the totalamount bet) for Sunday afternoon, May 25, was $222,670. With a goodMemorial Day weekend crowd of 1542 on hand, this worked out to $144.40bet per head. This figure is somewhat inflated because roughly a quarterof the handle comes from off-track betting (OTB). Indeed, enough peoplehad looked up from their slot machines at Foxwoods to contribute $5,475to the pool.
Still, these average handles sounded awfully high to me. The typicalbettor was doing much more than placing one minimum $3 wager oneach game.
The early games of the session had by far the smallest pools, presumablybecause most of the spectators had not yet shown up at the fronton. Thehandle picked up as the day progressed, eventually reaching almost twicethat of the opening session. It peaked three or four games from the end asthe crowd started going home. There was a blip in the last game, however.It featured a high payoff “superfecta” bet for which the object is to pick thefirst four players in the correct order.
“We like to have an exotic bet at the end of the session to keep the crowdin the house,” Bob explained.
Indeed, the higher the payoff, the more popular the bet seemed tobe. Roughly 60% of the total handle was wagered on trifectas. Quinielasaccounted for 25% of the pool, and 10% was invested in exactas. Theremaining 5% of the handle was split between win, place, and show aswell as the exotic bets. Bob and Les confirmed that these patterns weretypical.
“Trifectas are the most popular type of bet. People are attracted bythe big payoffs and then lose all their bets. They get frustrated and don’t
134
P1: FCH/FYX P2: FCH
CB386-06 CB386-Skiena June 11, 2001 18:43 Char Count= 0
MODELING THE PAYOFFS
come back. We wish more people would bet win–place–show so they havesomething to show for the day. Keep them coming back.”
“Any ideas on what kind of systems people use to bet?,” I asked, lookingfor an edge.
“Our customers do all kinds of things. Some people play their favoritenumber or color. Others watch the players. We have a few people whowatch the odds boards and bet on numbers which have very little moneyin them.”
“How do they do?”“The odds guys? Pretty good, I guess. Some of them have been here for
years.”I had heard that there were people at tracks who made a living pick-
ing up winning tickets that had been erroneously discarded by the peo-ple who bought them. “What happens to unclaimed winning tickets?” Iasked him.
“Good question. Each year there are about $100,000 worth of winningswhich are not claimed. You get exactly one year to cash in any winningticket. Unclaimed winnings money is retained by the house, but it is notmoney we are looking for. We urge patrons to cash winning tickets imme-diately. The state used to keep that money until several years ago.”
“Tell me,” I asked. “Who is Pepe, of Pepe’s Green Card, and how does hemake his picks?”
Bob laughed. “I hate to tell you this, but there is no Pepe. The GreenCard picks are usually made by the public address announcer. I’ve filled infor him on occasion when he went on vacation.”
The truth sometimes hurts. It was a good thing we were working on asystem to eliminate our dependence on Pepe.
After Bob and Les left, Renee joined us at our table. It was time to teachmy fledglings how to bet. They had been watching the numbers closely foralmost a year now. Now was the time to test what they had learned.
“How about 2 to show?,” Dario suggested. My adventurers had pickedthe safest bet in the house. It was the second game, a singles match.
I bellied up to the cashier and invested $3 on Baronio to Show.Baronio came in second, and so we won. We watched with interest as
the result was posted. Number 2 to show paid off at $3.60. We had cleared20% on this wise investment in less than 15 minutes, which was probablybetter than either Bill Gates or Warren Buffet have ever done with theirmoney.
135
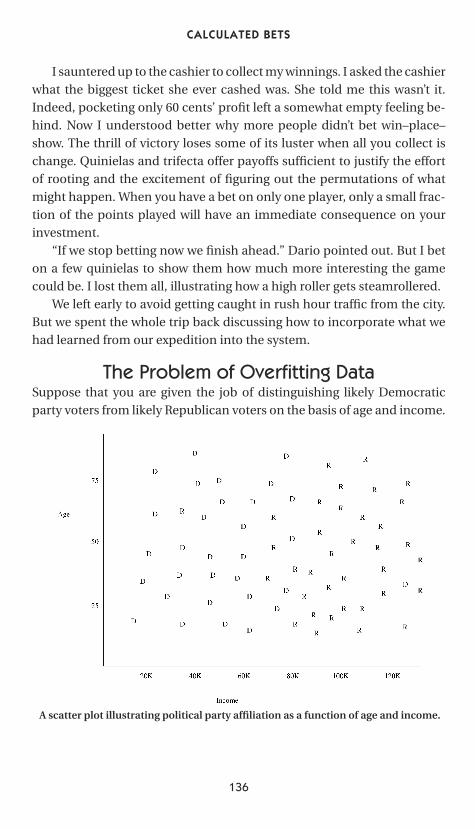
P1: FCH/FYX P2: FCH
CB386-06 CB386-Skiena June 11, 2001 18:43 Char Count= 0
CALCULATED BETS
I sauntered up to the cashier to collect my winnings. I asked the cashierwhat the biggest ticket she ever cashed was. She told me this wasn’t it.Indeed, pocketing only 60 cents’ profit left a somewhat empty feeling be-hind. Now I understood better why more people didn’t bet win–place–show. The thrill of victory loses some of its luster when all you collect ischange. Quinielas and trifecta offer payoffs sufficient to justify the effortof rooting and the excitement of figuring out the permutations of whatmight happen. When you have a bet on only one player, only a small frac-tion of the points played will have an immediate consequence on yourinvestment.
“If we stop betting now we finish ahead.” Dario pointed out. But I beton a few quinielas to show them how much more interesting the gamecould be. I lost them all, illustrating how a high roller gets steamrollered.
We left early to avoid getting caught in rush hour traffic from the city.But we spent the whole trip back discussing how to incorporate what wehad learned from our expedition into the system.
The Problem of Overfitting DataSuppose that you are given the job of distinguishing likely Democraticparty voters from likely Republican voters on the basis of age and income.
A scatter plot illustrating political party affiliation as a function of age and income.
136
P1: FCH/FYX P2: FCH
CB386-06 CB386-Skiena June 11, 2001 18:43 Char Count= 0
MODELING THE PAYOFFS
To give you the basis to make such a decision, you have polled 100 peopleand obtained their age, income, and party affiliation and put the results ina scatterplot.
How can you generalize from this data to predict political affiliationbased only on people’s age and income? The simplest approach would beto carve up the age–space plane into two regions and assign each of theseregions to one of the political parties. We present two possible divisionson page 138. On the top is the best possible Democrat–Republican dis-criminator that can be built from a single straight line. It cuts the spacecompletely according to income; anyone who makes less than $80,000 ayear is a classified a Democrat, whereas anyone who makes more than thatis called a Republican.
Such a simple-minded division makes mistakes, of course. Indeed,three of the Democrats and four of the Republicans ended up on the wrongside of the line. On the bottom we provide a different divider that correctlyclassifies for all the compassionate rich and misguided poor in our test set,but it has to jump around a lot in order to do so.
Which of these two classifiers do you think does a better job distin-guishing Democrats from Republicans? Even though it makes a few mis-takes, I prefer the simpler model on the left. Its simplicity helps guardagainst overfitting the data, that is, building a model that so completelyreflects the weirdnesses of the training data that it misses the larger pic-ture. The classifier on the right distorts its shape to classify the outliers,correctly whereas the classifier on the left mislabels these oddballson the assumption that they are, in fact, oddballs without predictivevalue.
Properly modeling the expected trifecta payoffs required care to guardagainst overfitting our data. Recall that we averaged the results of all pre-vious payoffs to predict future returns. This method worked well for mostbet types such as win, place, show, and quiniela. However, the results ofsimple averaging are not so easy to believe in the case of trifectas. There are336 different trifecta combinations, and thus the average trifecta shouldhave occurred roughly 23 times during our sampling interval. But thisaverage is misleading because there is a high variance in the number ofoccurrences.
The mean or average is a statistical measure of the most likely value ofa sequence, whereas variance, and its close cousin standard deviation,
137
P1: FCH/FYX P2: FCH
CB386-06 CB386-Skiena June 11, 2001 18:43 Char Count= 0
CALCULATED BETS
Two dividers that discriminate between Democrats and Republicans.
measure the consistency of values in a sequence. Let us consider theannual salaries (in thousands of dollars) of 10 people in each of 2 dif-ferent professions. The first sample comes from unionized postal workersin Omaha, Nebraska:
33, 27, 39, 25, 26, 24, 36, 28, 32, 30
and the second sample comes from people in the telemarketing industry
138
P1: FCH/FYX P2: FCH
CB386-06 CB386-Skiena June 11, 2001 18:43 Char Count= 0
MODELING THE PAYOFFS
(a large fraction of whom happen to operate out of Omaha):
19, 30, 20, 24, 108, 17, 23, 19, 22, 18
Both of these sequences have the same average (30K). But the varianceof the telemarketers is considerably higher because it is thrown off bythe inclusion of one high-paid member of management. The standarddeviation in salaries at a union shop is likely to be much lower than one inwhich management feels free to oppress the masses and appropriately oilthe squeaky wheel.
The high variance of payoffs associated with rare trifectas becomes aproblem in trying to estimate their expected return accurately. Supposewe were to pick a single random element of each of the two sets of salariesabove. Which random salary would more accurately reflect the average ofthe group? There is less chance that a random element of the low-variancesequence will do a bad job representing his cronies than one from the morediverse sequence. Picking the manager as a typical representative of thetelemarketing industry would be seriously misleading, but is just as likelyas picking the single fellow who is right on the average.
Simply averaging the payoffs for rare, high-variance trifectas doesn’tmake much sense. Over the last 2 years the trifecta 8–7–6 came in only fivetimes at Milford, paying at $3708.60, $4568.40, $4574.70, $1975.50, and$1293.00 for a $3 bet. What about even rarer trifectas that may have comein only once or never? What should they pay off at?
To do a better job of estimating the payoff of rare trifectas, wepartitioned them into groups with similar occurrence frequencies andthen averaged all the payoffs within each group. This meant all of thelow-probability trifectas in a given group were assigned the same expectedpayoff. Damping the projected payoff from the highest-return singletonpayoff was essential to keep our betting system from being burned like amoth attracted to a flame. If one trifecta had a projected payoff of $2000 perdollar invested based on only one or two actual occurrences, the systemwould be liable to keep chasing what was probably a fluke payoff insteadof a real quirk in the public’s betting strategy.
Mathematical Modeling TechniquesI digress here to explain more about the broad range of mathematical mod-eling techniques used in science and industry. None of these techniques isdirectly employed within our jai alai system, so follow the bouncing pelota
139
P1: FCH/FYX P2: FCH
CB386-06 CB386-Skiena June 11, 2001 18:43 Char Count= 0
CALCULATED BETS
The cycle of mathematical modeling development and validation.
to the next chapter if you really want to get on with the story. But I urgeyou to stick with me for a better understanding of how models are built inthe real world.
The process of creating and validating any mathematical model is char-acterized by three primary steps:
■ Translation – Express observations of the real world in some form ofmathematical language or implementation.
■ Execution – Use this model on training or real-world data to make newpredictions or conclusions about the world.
■ Validation – Interpret and test the resulting predictions to assess theextent to which the model reflects reality.
As shown by our experiences, the validation process typically leads usto new observations that must be translated back into the model, thusgenerating a cycle of activity that may require several rounds to get right.
Our system employs two different types of mathematical modeltechniques, namely Monte Carlo simulation and statistical analysis. Inthis section, we will introduce several other important approaches tomathematical modeling. The resulting models can be classified accord-ing to a variety of basic properties and characteristics. My taxonomy ofmodels is based on the following traits:
■ Discrete versus continuous models – Certain models manipulate discreteentities, which are those that cannot be further divided into fractionalparts. Our jai alai model was discrete, for each point scored was a dis-tinct minimal event with exactly one winner. Traffic flow simulationsdeal with quanta of individual vehicles. But other models deal with in-herently continuous quantities such as temperature, speed, time, force,and salary where there are no possible gaps between allowable values.Whatever speeds x and y are traveling at say, 65.231 and 65.232 mph,
140
P1: FCH/FYX P2: FCH
CB386-06 CB386-Skiena June 11, 2001 18:43 Char Count= 0
MODELING THE PAYOFFS
respectively, there is room for someone to get between them (say, at65.2315 mph).
Calculus, algebra, geometry, and trigonometry all revolve aroundcontinuous functions, and so the full weight of classical mathematicscan be brought to bear in modeling continuous functions.
■ General versus ad hoc models – Certain types of models use ad hoctechniques carefully customized for the given application. In the courseof developing our jai alai simulation, not for one moment did we everforget that we were simulating jai alai. It would be very difficult toadapt our model to another application – even another pari-mutuelsport such as horse racing.
Other mathematical modeling techniques are not so fussy. They aretypically designed to work with general statistical data, hunting for pat-terns and correlations. They couldn’t care less whether you feed themstock market data, baseball scores, electrocardiograms, or astrologicalcharts. Of course the quality of the resulting model depends heavilyupon the quality of the input data – garbage in, garbage out.
The surprise is that the performance of such general techniques isoften very competitive with carefully crafted, problem-specific models.Which approach is better depends upon the quality of the statisticaldata you have to work with and how much the proper interpretationof this data depends upon idiosyncrasies of the application.
■ Black box versus descriptive models – Descriptive modeling techniquesgive us more than just an answer. They provide additional informationto let us know how the model reached its decision and how much tobelieve it. Many statistical models come with measures of the strengthof correlations and the significance of the results.
Black box methods apply some form of magic to data, yielding an-swers but not necessarily a reason to trust them. Applying any modelingmethod you don’t fully understand yields a black box model. The nameshould conjure up the image of a device that takes data in and spitsanswers out but whose internal mechanisms are hidden from view bythe container in which it is housed.
Black box methods can be very useful despite this inherentmystery – particularly if there is independent data on which to val-idate the resulting models. Indeed, we will see that the opaquenessof such popular modeling techniques as neural networks can be animportant part of their charm.
141
P1: FCH/FYX P2: FCH
CB386-06 CB386-Skiena June 11, 2001 18:43 Char Count= 0
CALCULATED BETS
■ Simulation versus data-driven models – Simulations attempt to recre-ate nature from first principles. Conversely, data-driven models at-tempt to interpret nature by analyzing statistical data.
The actuarial tables used by insurance companies are constructedby classical data-driven models. A simulation approach to predictingyour life expectancy might be to model the set of all events that couldhappen to you each and every day, play them out, and see which onehappens to kill you. By repeating the experiment millions of timesin a Monte Carlo fashion, the model could estimate the probabilitydistribution of when and how you will die.
But the range of activities you may engage in over the course ofyour life is clearly much too varied to be simulated accurately, partic-ularly because the fate of the entire insurance industry depends uponthe results. Instead, actuaries use a statistical approach to predictingyour life expectancy, not by predicting what will happen to you butby observing what has happened to people like you. Do you smoke?Do you drive more than 15 miles to work each day? Well, the actuar-ies have extensive records on millions of people, and they know justwhat happened to people just like you. They predict your future not bypreplaying it but by putting you in the right pigeonhole and reportingwhat happened to the rest of the flock.
■ Randomized versus deterministic models – Certain mathematical mod-els are deterministic, meaning that the answers they give are completelydefined by the input data. If we give exactly the same input twice, weexpect to see the same results twice. My high-school football predictionprogram Clyde is a good example of a deterministic model.
Randomized models, such as our Monte Carlo simulation, incor-porate some level of randomness into their execution. Thus, runningthe model twice on the same players and post positions will yield twoslightly different distributions of who wins with what probability.
That there is usually only one right answer to any given problemyields an aesthetic appeal to deterministic models. But rememberRalph Waldo Emerson’s credo that “a foolish consistency is the hob-goblin of little minds.” Randomization give us the power to run a modelmany different times, enabling us to vote for solutions that come upmost frequently or explore the space of possibilities. Such a distribu-tion can be more useful than a bald assertion that X is the best solutionpossible.
142
P1: FCH/FYX P2: FCH
CB386-06 CB386-Skiena June 11, 2001 18:43 Char Count= 0
MODELING THE PAYOFFS
I will now introduce a variety of modeling techniques whose advan-tages and disadvantages can best be understood in the light of theseattributes.
CURVE-FITTING MODELS
We have seen that the mathematical modeler has a menagerie of curveshapes available to work with. A simple but powerful modeling paradigmis to find the curve that most closely agrees with the shape of your data athand and use it to predict future trends or the values of points you haven’tbeen able to measure.
Modeling the high and low temperatures in Omaha by sine curves(see page 97) is an excellent example of curve fitting in action. We can usethis technique to predict which temperature records are most likely to bebroken by noting which highs lie below and which lows lie above the fittedcurves. This works because the curve tells us what the real values “shouldbe.” A reasonable way to predict how much warmer it will be a month fromnow would be to measure how much higher the fitted curves cross thatdate relative to the present.
The basic curve type to use for fitting a given data set can identifiedby either eyeballing its gross shape or using a general theory. In the firstapproach, the modeler studies the data set and selects a curve whose shapethe data remind him of. In the second, the modeler posits a curve thatshould underlie the data according to the laws of physics or man.
Once the given curve type has been identified, the appropriate para-meters must be set to best match the data. The number of parametersfor any curve type is counted by its number of degrees of freedom. Astraight line, y = ax + b, has two degrees of freedom, namely the slopea and intercept b. The best parameter values to fit a given curve to a givendata set can be found using a black box mathematical technique calledlinear regression, which is programmed in many pocket calculators thesedays.
The more degrees of freedom a curve has, the more flexibility it has tobe wrapped around a given data set. With this power comes the dangerof overfitting, that is, constructing a curve that so completely accountsfor the noise in your data it ignores the larger trends. Robust fits use smallnumbers of degrees of freedom to account for large numbers of data points.The sine curves so carefully fitting our Omaha temperature data use only
143
P1: FCH/FYX P2: FCH
CB386-06 CB386-Skiena June 11, 2001 18:43 Char Count= 0
CALCULATED BETS
four parameters (height, amplitude, frequency, and phase) to fit 365 pointsaccurately.
NEAREST NEIGHBOR PREDICTORS
Nearest neighbor models use a simple but compelling idea. To predictsomething about you, find someone similar to you and observe that prop-erty in them.
Let’s say a telemarketing company wants to know your salary but is toopolite to ask.2 The company no doubt has a large database of customerswho have previously been hassled as well as some information about you.Thus, they can hunt through their database to find the person who seemsmost similar in the aspects they know about. If person x is similar to youin several aspects, say your age, amount of education, and geographiclocation, why shouldn’t he or she be similar in other ways as well? Thus, ifthe telemarketers knew person x’s salary, they probably have a reasonableidea of what you are making.
Nearest neighbor classifiers work by carving up the space of possibleinputs into cells such that each cell consists of the portion of space closestto that of a single training point. The entire cell takes on the identity of thetraining point, thus enabling us to classify the entire space of possibilities.I give such a cell decomposition (also called a Voronoi diagram) for atraining set of Democrat–Republican data. This type of system is usedby Amazon.com and other Websites to predict what products I might likeby matching me with people who have made similar purchases.
Despite their elegance and simplicity, nearest neighbor models havetwo serious drawbacks. First, finding the right measure of similarity isoften an ill-posed problem. Is a 39-year-old New Yorker with a Ph.D. moresimilar to a 45-year-old high-school dropout from Chicago or a 79-year-old retired professor on Barbados? Somehow your distance function willhave to score that appropriately. The simplest class of distance functionsassigns each feature a numerical value and mimics the geometric distancefunction in the plane
d(a, b) =√
(Xa − Xb)2 + (Ya − Yb)2
2 Sure . . . if only they were too polite to interrupt my dinner.
144
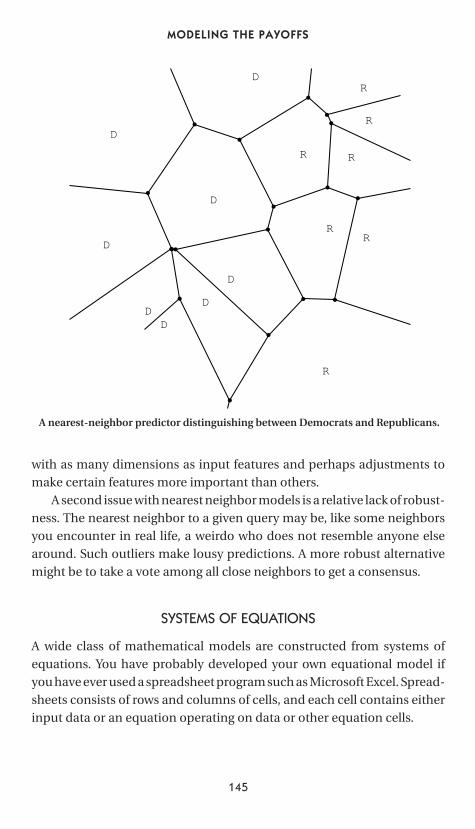
P1: FCH/FYX P2: FCH
CB386-06 CB386-Skiena June 11, 2001 18:43 Char Count= 0
MODELING THE PAYOFFS
R
R
D
D
R
R
D
D
D
D
R
R
RD
D
A nearest-neighbor predictor distinguishing between Democrats and Republicans.
with as many dimensions as input features and perhaps adjustments tomake certain features more important than others.
A second issue with nearest neighbor models is a relative lack of robust-ness. The nearest neighbor to a given query may be, like some neighborsyou encounter in real life, a weirdo who does not resemble anyone elsearound. Such outliers make lousy predictions. A more robust alternativemight be to take a vote among all close neighbors to get a consensus.
SYSTEMS OF EQUATIONS
A wide class of mathematical models are constructed from systems ofequations. You have probably developed your own equational model ifyou have ever used a spreadsheet program such as Microsoft Excel. Spread-sheets consists of rows and columns of cells, and each cell contains eitherinput data or an equation operating on data or other equation cells.
145
P1: FCH/FYX P2: FCH
CB386-06 CB386-Skiena June 11, 2001 18:43 Char Count= 0
CALCULATED BETS
Budgets are perhaps the model most frequently implemented onspreadsheets. Such models can be used to establish how high you canjack up your own salary while maintaining corporate profitability or todetermine the impact of a tax cut on the fate of a project.
Indeed, spreadsheet programs make wonderful environments inwhich to experiment with your own mathematical models. Modernspreadsheets have the graphical capability to make plots, statistical rou-tines for data analysis, and even fairly general data entry formats. I hopeinspired readers will go on to tackle their own modeling projects, perhapsstarting from my suggestions at the end of this book.
Econometrics is the science of building models of the economy. Say thedirector of the Federal Reserve Bank wants to know what will happen if heraises interest rates one point. Instead of trying it on the real economy tosee if the stock market crashes, he can experiment with an econometricmodel. Such models are essentially giant spreadsheets with thousands ofequations incorporating vast amounts of economic data and experience.
Similar models are maintained by large companies such as airlines topredict the sales impact of raising or lowering prices. By incorporatingoptimization techniques such as linear programming these models canyield pricing schemes that maximize profits. Indeed, the rapidly changingand seemingly irrational ticket prices that airlines set for different seats ona given plane are a tribute to the power and flexibility of such models.
DIFFERENTIAL EQUATION MODELS
Perhaps the most important mathematical model ever developed wasNewton’s laws of motion. The success of these laws in predicting themotion of planets had a radical effect on humanity’s conception of howthe universe works. Like any good mathematical model, Newton’s lawsoversimplified reality (they were superseded by Einstein’s general theoryof relativity) but yielded very accurate predictions on a wide variety ofproblems.
The proper models for many physical phenomena are based on dif-ferential equations. They are used in modeling fluid flows and heat dissi-pation, analyzing electronic and magnetic fields, and predicting changesin human or animal populations. These differential equations provide theunderpinnings of weather forecasting, nuclear weapons design, and epi-demiology – to name just a few killer applications.
146
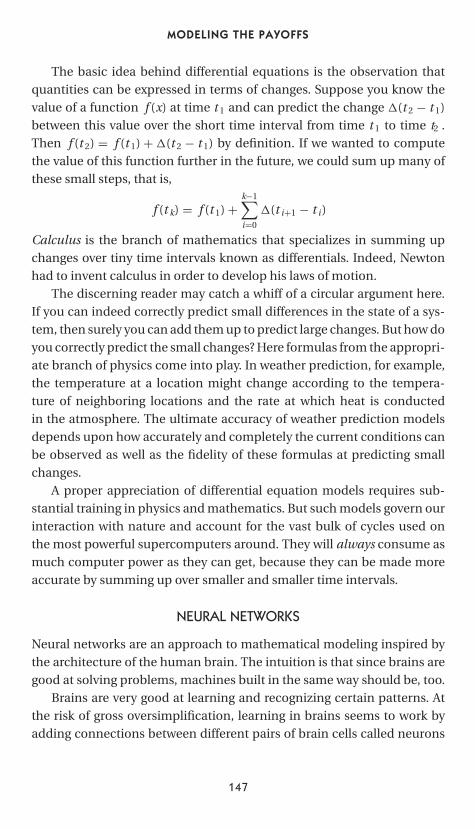
P1: FCH/FYX P2: FCH
CB386-06 CB386-Skiena June 11, 2001 18:43 Char Count= 0
MODELING THE PAYOFFS
The basic idea behind differential equations is the observation thatquantities can be expressed in terms of changes. Suppose you know thevalue of a function f (x) at time t 1 and can predict the change �(t 2 − t 1)between this value over the short time interval from time t 1 to time t2 .Then f (t 2) = f (t 1) + �(t 2 − t 1) by definition. If we wanted to computethe value of this function further in the future, we could sum up many ofthese small steps, that is,
f (t k) = f (t 1) +k−1∑
i=0
�(t i+1 − t i)
Calculus is the branch of mathematics that specializes in summing upchanges over tiny time intervals known as differentials. Indeed, Newtonhad to invent calculus in order to develop his laws of motion.
The discerning reader may catch a whiff of a circular argument here.If you can indeed correctly predict small differences in the state of a sys-tem, then surely you can add them up to predict large changes. But how doyou correctly predict the small changes? Here formulas from the appropri-ate branch of physics come into play. In weather prediction, for example,the temperature at a location might change according to the tempera-ture of neighboring locations and the rate at which heat is conductedin the atmosphere. The ultimate accuracy of weather prediction modelsdepends upon how accurately and completely the current conditions canbe observed as well as the fidelity of these formulas at predicting smallchanges.
A proper appreciation of differential equation models requires sub-stantial training in physics and mathematics. But such models govern ourinteraction with nature and account for the vast bulk of cycles used onthe most powerful supercomputers around. They will always consume asmuch computer power as they can get, because they can be made moreaccurate by summing up over smaller and smaller time intervals.
NEURAL NETWORKS
Neural networks are an approach to mathematical modeling inspired bythe architecture of the human brain. The intuition is that since brains aregood at solving problems, machines built in the same way should be, too.
Brains are very good at learning and recognizing certain patterns. Atthe risk of gross oversimplification, learning in brains seems to work byadding connections between different pairs of brain cells called neurons
147
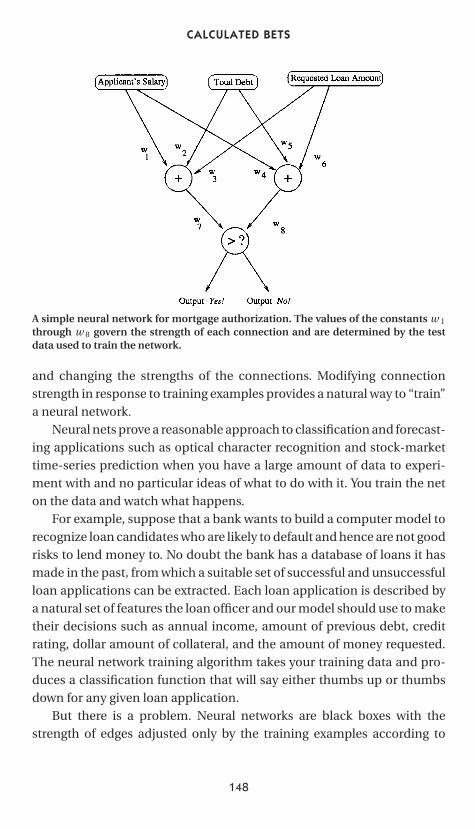
P1: FCH/FYX P2: FCH
CB386-06 CB386-Skiena June 11, 2001 18:43 Char Count= 0
CALCULATED BETS
A simple neural network for mortgage authorization. The values of the constants w 1
through w 8 govern the strength of each connection and are determined by the testdata used to train the network.
and changing the strengths of the connections. Modifying connectionstrength in response to training examples provides a natural way to “train”a neural network.
Neural nets prove a reasonable approach to classification and forecast-ing applications such as optical character recognition and stock-markettime-series prediction when you have a large amount of data to experi-ment with and no particular ideas of what to do with it. You train the neton the data and watch what happens.
For example, suppose that a bank wants to build a computer model torecognize loan candidates who are likely to default and hence are not goodrisks to lend money to. No doubt the bank has a database of loans it hasmade in the past, from which a suitable set of successful and unsuccessfulloan applications can be extracted. Each loan application is described bya natural set of features the loan officer and our model should use to maketheir decisions such as annual income, amount of previous debt, creditrating, dollar amount of collateral, and the amount of money requested.The neural network training algorithm takes your training data and pro-duces a classification function that will say either thumbs up or thumbsdown for any given loan application.
But there is a problem. Neural networks are black boxes with thestrength of edges adjusted only by the training examples according to
148
P1: FCH/FYX P2: FCH
CB386-06 CB386-Skiena June 11, 2001 18:43 Char Count= 0
MODELING THE PAYOFFS
some magic learning algorithm. Because your classifier was developed bya black box, you never really know why it is making its decisions, and thusyou can’t know when it will fail. An interesting case was a system built forthe military to distinguish between images of cars and tanks. It performedvery well on test images but disastrously in the field. Eventually, someonerealized that the car images had been filmed on a sunnier day than thetanks had been filmed on, and the program was classifying solely on thebasis of clouds in the background of the image!
That it is difficult to figure out why neural networks make the decisionsthey do can actually be perceived as an advantage in certain applications.Redlining is the illegal practice of making loan decisions on the basis ofaddresses. Redlining is illegal because it has often been used as a cover todiscriminate against members of the given minority group that happensto dominate the particular neighborhood. If a loan officer were to rejecta loan on the basis of zip code, the bank could have a serious lawsuit onits hand. But if the loan officer rejects the loan because the mathematicalmodel tells him to, all is covered. An unscrupulous banker can train aneural network to hate Hispanics by feeding it a selection of many badloans from bad neighborhoods and know that his or her tracks are coveredby the opaqueness of the black box.
149
P1: GGL
CB386-07 CB386-Skiena June 9, 2001 14:36 Char Count= 0
CHAPTER SEVEN
ENGINEERING THE SYSTEM
There is a big difference between building a prototype system and a pieceof production software. In his classic book The Mythical Man-Month,Fredrick Brooks estimates that it takes nine times the effort to create acomplete, reliable system as opposed to an initial program that starts todo the job.
With Meena’s graduation, I needed a fresh student to turn our pro-totype into a production system. I got to know Roger Mailler when hetook CSE 214, undergraduate Data Structures, with me in the fall of 1997.Roger was the bored-looking student in the front row – too bright andknowledgeable to get very much from the course, but too disciplinedto cut class or hide in the back. Roger finished first out of the 126 stu-dents in the course (by a substantial margin) and was untainted by aprogramming assignment cheating scandal that claimed many of hisclassmates.
Roger is an interesting fellow whose career path to Stony Brook fol-lowed a very non-standard course. His first attempt at college (at theRochester Institute of Technology) was, to be charitable, unsuccessful.In one year at RIT he amassed a grade point average (GPA) of 0.96, where4.0 is an A and 1.0 is a D. Any mammal with a pulse ought to beable to do better. Indeed, this is the lowest GPA I’ve ever seen sustained
150
P1: GGL
CB386-07 CB386-Skiena June 9, 2001 14:36 Char Count= 0
ENGINEERING THE SYSTEM
over a full academic year because students capable of such perfor-mance usually manage to get themselves expelled before the year is out.
Roger clearly had some growing up to do. He did this in the U.S. AirForce while stationed in Korea. There he started computer programmingand found his calling. He worked on a system that automatically monitorede-mail to prevent the release of classified information. Working Air Forcesecurity is perhaps the best place to develop that productively suspiciousnature needed to produce high-reliability software.
After his enlistment ran out, he returned to college, this time at StonyBrook. He went on to earn a 3.96 GPA here, which is about as high as youcan get and a hell of a lot better than I ever did. Such academic turnaroundsoccur surprisingly often with older returning students who have finally fig-ured out what they want from life. They are Exhibit A for the importance ofallowing people second chances, which is one of the many noble missionsfor state universities like Stony Brook.
After incorporating the pool adjustments of the previous chapter, ourprogram was losing simulated money. This is better than losing real moneybut still not a satisfactory state of affairs. It was now up to Roger to turnour system around, as successfully, it was hoped, as he had his GPA.
Elegance in Software SystemsI often get the sense that people trained in the humanities have an im-age of computer scientists as Neanderthals with knuckles dragging on theground. They see our mismatched clothes and our taste for Jolt Cola insteadof wine as the stigmata of the geek and manifestations of a downtroddenpeople.
However, the quest for beauty and elegance occupies a substantialplace in the hearts and minds of software engineers. There can easily betwo programs that solve exactly the same problem, one of which is beau-tiful and the other of which is ugly. And although beauty is only skin deep,ugliness goes clean to the bone as far as software is concerned.
What goes into making a beautiful program?
■ Readability – An understandable program is a pretty program. Explain-ing what makes programs readable is as easy (and hard) as it is to ex-plain what makes English text readable. You have to break the programproperly into files and subroutines, which are analogous to chaptersand paragraphs in English. You have to add meaningful documentation
151
P1: GGL
CB386-07 CB386-Skiena June 9, 2001 14:36 Char Count= 0
CALCULATED BETS
and variable names much as you have to define any unusual vocabu-lary for the reader. You have to structure the program properly on thepage just as you must use the proper fonts and formatting for yourEnglish document.
The importance of readable programs is emphasized by an Inter-net tradition, the annual International Obfuscated C Code Contest.The enormously powerful programming language C incorporates thepotential to write indecipherable programs. The goal of the ObfuscatedC contest is to write short programs that do useful or interesting thingsbut in such a way that no skilled programmer would be able to identifythese things are by reading the program. The Best of Show winningprogram by Carl Banks is a particularly outstanding combination ofbeauty and illegibility. To see other inspiring winners, visit the con-test’s official WWW page at http://www.ioccc.org/.
Comparing this code with that of our Monte Carlo simulationshould convince you that clarity and legibility have their own beauty –especially if you are trying to make something work.
Creating readable programs is particularly essential in a world inwhich software gets passed from its author to those charged with main-taining it. Dario’s programs got passed to Meena, who passed them toRoger. Much of the trouble associated with the millennium bug wasdue to the unreadable programs Generation IX left to Generation X.
■ Generality – A beautiful program is one that can easily be made to domore than it was intended to do. This is a testament to the soundness ofits underlying design more than it is about the programmer’s ambitionor the ability to anticipate what needs will be made of the system inthe future.
The distinction between programs and data is a fundamental one;programs are descriptions of how to do something, whereas data isa passive entity being acted on. In a well-written program, we caneasily change the data without changing the program acting on it.A good word processor can be used to edit English as well as Chi-nese text, computer program source code as well as tables of num-bers. The key is thinking generally enough about the task at handto encompass a broader set of goals than may originally have beenconceived.
An example of the quest for generality was Roger’s rewrite of Meena’sprograms to tabulate statistics for each different type of bet – win,
152
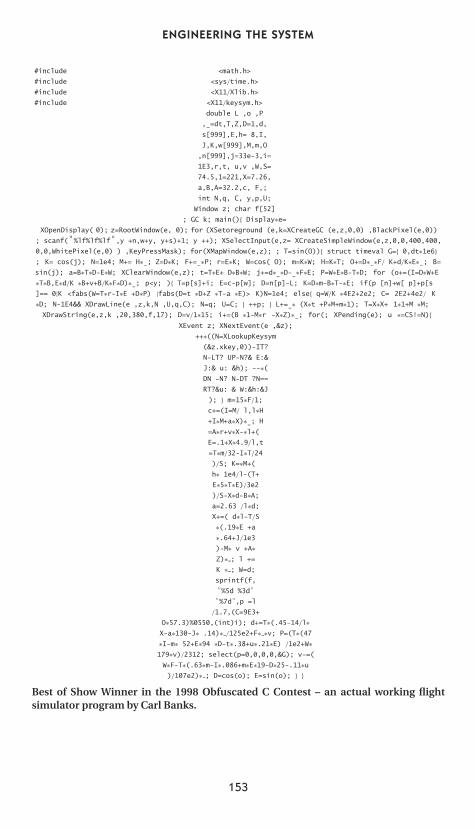
P1: GGL
CB386-07 CB386-Skiena June 9, 2001 14:36 Char Count= 0
ENGINEERING THE SYSTEM
#include <math.h>
#include <sys/time.h>
#include <X11/Xlib.h>
#include <X11/keysym.h>
double L ,o ,P
,-=dt,T,Z,D=1,d,
s[999],E,h= 8,I,
J,K,w[999],M,m,O
,n[999],j=33e-3,i=
1E3,r,t, u,v ,W,S=
74.5,1=221,X=7.26,
a,B,A=32.2,c, F,H;
int N,q, C, y,p,U;
Window z; char f[52]
; GC k; main(){ Display∗e=XOpenDisplay( 0); z=RootWindow(e, 0); for (XSetForeground (e,k=XCreateGC (e,z,0,0) ,BlackPixel(e,0))
; scanf(" %lf%lf%lf" ,y +n,w+y, y+s)+1; y ++); XSelectInput(e,z= XCreateSimpleWindow(e,z,0,0,400,400,
0,0,WhitePixel(e,0) ) ,KeyPressMask); for(XMapWindow(e,z); ; T=sin(O)){ struct timeval G={ 0,dt∗1e6}; K= cos(j); N=1e4; M+= H∗-; Z=D∗K; F+=-∗P; r=E∗K; W=cos( O); m=K∗W; H=K∗T; O+=D∗-∗F/ K+d/K∗E∗-; B=
sin(j); a=B∗T∗D-E∗W; XClearWindow(e,z); t=T∗E+ D∗B∗W; j+=d∗-∗D--∗F∗E; P=W∗E∗B-T∗D; for (o+=(I=D∗W+E∗T∗B,E∗d/K ∗B+v+B/K∗F∗D)∗-; p<y; ){ T=p[s]+i; E=c-p[w]; D=n[p]-L; K=D∗m-B∗T-H∗E; if(p [n]+w[ p]+p[s
]== 0|K <fabs(W=T∗r-I∗E +D∗P) |fabs(D=t ∗D+Z ∗T-a ∗E)> K)N=1e4; else{ q=W/K ∗4E2+2e2; C= 2E2+4e2/ K
∗D; N-1E4&& XDrawLine(e ,z,k,N ,U,q,C); N=q; U=C; } ++p; } L+=-∗ (X∗t +P∗M+m∗1); T=X∗X+ 1∗1+M ∗M;XDrawString(e,z,k ,20,380,f,17); D=v/1∗15; i+=(B ∗1-M∗r -X∗Z)∗-; for(; XPending(e); u ∗=CS!=N){
XEvent z; XNextEvent(e ,&z);
++∗((N=XLookupKeysym(&z.xkey,0))-IT?
N-LT? UP-N?& E:&
J:& u: &h); --∗(DN -N? N-DT ?N==
RT?&u: & W:&h:&J
); } m=15∗F/1;
c+=(I=M/ l,l∗H+I∗M+a∗X)∗-; H
=A∗r+v∗X-F∗l+(E=.1+X∗4.9/l,t
=T∗m/32-I∗T/24
)/S; K=F∗M+(h∗ 1e4/l-(T+
E∗5∗T∗E)/3e2
)/S-X∗d-B∗A;a=2.63 /l∗d;X+=( d∗l-T/S
∗(.19∗E +a
∗.64+J/1e3
)-M∗ v +A∗Z)∗ ; l +=
K ∗ ; W=d;
sprintf(f," %5d %3d"
" %7d" ,p =l
/1.7,(C=9E3+
O∗57.3)%0550,(int)i); d+=T∗(.45-14/l∗X-a∗130-J∗ .14)∗ /125e2+F∗ ∗v; P=(T∗(47∗I-m∗ 52+E∗94 ∗D-t∗.38+u∗.21∗E) /1e2+W∗179∗v)/2312; select(p=0,0,0,0,&G); v-=(
W∗F-T∗(.63∗m-I∗.086+m∗E∗19-D∗25-.11∗u)/107e2)∗ ; D=cos(o); E=sin(o); } }
Best of Show Winner in the 1998 Obfuscated C Contest – an actual working flightsimulator program by Carl Banks.
153
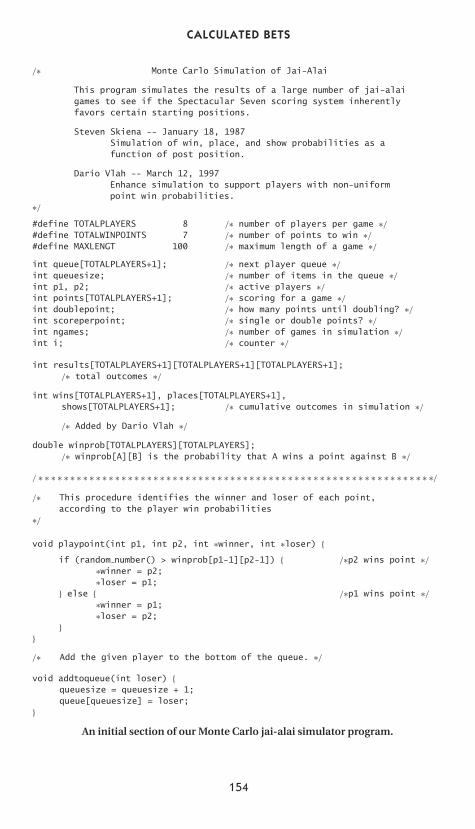
P1: GGL
CB386-07 CB386-Skiena June 9, 2001 14:36 Char Count= 0
CALCULATED BETS
/∗ Monte Carlo Simulation of Jai-Alai
This program simulates the results of a large number of jai-alaigames to see if the Spectacular Seven scoring system inherentlyfavors certain starting positions.
Steven Skiena -- January 18, 1987Simulation of win, place, and show probabilities as afunction of post position.
Dario Vlah -- March 12, 1997Enhance simulation to support players with non-uniformpoint win probabilities.
∗/
#define TOTALPLAYERS 8 /∗ number of players per game ∗/
#define TOTALWINPOINTS 7 /∗ number of points to win ∗/
#define MAXLENGTH 100 /∗ maximum length of a game ∗/
int queue[TOTALPLAYERS+1]; /∗ next player queue ∗/
int queuesize; /∗ number of items in the queue ∗/
int p1, p2; /∗ active players ∗/
int points[TOTALPLAYERS+1]; /∗ scoring for a game ∗/
int doublepoint; /∗ how many points until doubling? ∗/
int scoreperpoint; /∗ single or double points? ∗/
int ngames; /∗ number of games in simulation ∗/
int i; /∗ counter ∗/
int results[TOTALPLAYERS+1][TOTALPLAYERS+1][TOTALPLAYERS+1];/∗ total outcomes ∗/
int wins[TOTALPLAYERS+1], places[TOTALPLAYERS+1],shows[TOTALPLAYERS+1]; /∗ cumulative outcomes in simulation ∗/
/∗ Added by Dario Vlah ∗/
double winprob[TOTALPLAYERS][TOTALPLAYERS];/∗ winprob[A][B] is the probability that A wins a point against B ∗/
/ ∗ ∗ ∗ ∗ ∗ ∗ ∗ ∗ ∗ ∗ ∗ ∗ ∗ ∗ ∗ ∗ ∗ ∗ ∗ ∗ ∗ ∗ ∗ ∗ ∗ ∗ ∗ ∗ ∗ ∗ ∗ ∗ ∗ ∗ ∗ ∗ ∗ ∗ ∗ ∗ ∗ ∗ ∗ ∗ ∗ ∗ ∗ ∗ ∗ ∗ ∗ ∗ ∗ ∗ ∗ ∗ ∗ ∗ ∗ ∗ ∗ ∗/
/∗ This procedure identifies the winner and loser of each point,according to the player win probabilities
∗/
void playpoint(int p1, int p2, int ∗winner, int ∗loser) {if (random number() > winprob[p1-1][p2-1]) { /∗p2 wins point ∗/
∗winner = p2;∗loser = p1;
} else { /∗p1 wins point ∗/
∗winner = p1;∗loser = p2;
}}/∗ Add the given player to the bottom of the queue. ∗/
void addtoqueue(int loser) {queuesize = queuesize + 1;queue[queuesize] = loser;
}
An initial section of our Monte Carlo jai-alai simulator program.
154
P1: GGL
CB386-07 CB386-Skiena June 9, 2001 14:36 Char Count= 0
ENGINEERING THE SYSTEM
place, show, exacta, quiniela, and trifecta. Once Meena got the firstprogram working (say to calculate win statistics), she basically copiedthis program and changed the word “win” everywhere it appeared to“show”. She then repeated this process five times to build six sepa-rate programs, each computing results for one type of statistic. Thiswas a reasonable response at the time to an unreasonable professorwho wanted results yesterday, but this approach was not conduciveto building small, reliable programs.
Roger looked at all six of the slightly varying programs and replacedthem by a single program that did the right thing for each by onlychanging one word in a data file, say from “win” to “show”. This madethe program much more general, because we could add functionalityto all bet types by changing one program file instead of requiring usto make the change to all six of them. Roger’s change shortened theprogram by several hundred lines, and you can’t have bugs in lines youdon’t have.
■ Robustness – A pretty program is robust and reliable. It detects prob-lems like faulty or unexpected data without crashing and burning.Instead, it smoothly compensates for the defective data and alerts theuser as to the nature of the problem.
Anticipating the unexpected and developing a plan to respond toit are hallmarks of a top-notch programmer. I have said before thata good programmer must be paranoid, but that is not enough. Youcannot get trapped in conspiracy theories, frozen by the impossibilityof looking everywhere and seeing everything. You must be creativeenough to eliminate the causes of your paranoia, or at least bottlethem up so these demons are constrained to a small part of the system.
Smoking Out BugsHow can we find bugs in programs when we don’t know what the answershould be? This was the case in our system. We certainly did not knowhow successful we should have been at predicting the outcome of jai alaimatches when we wrote the program. For every problem we encountered,there would be two distinct sources of possible error:
■ Our underlying mathematical model did not accurately describe thereal world. This meant a fundamental problem in the design of oursystem.
155
P1: GGL
CB386-07 CB386-Skiena June 9, 2001 14:36 Char Count= 0
CALCULATED BETS
■ The computer program did not implement the mathematical modelas we had intended. This presumably meant a problem that could besolved by rewriting the appropriate portion of the program. But we hadto find it first.
The most frustrating aspect of debugging our system was figuring outwhich of these possibilities were the real source of our problem. At thispoint, our simulated betting strategies reported that we were losing moneyat a rate of about 20% per bet. This suggested that we were doing no betterthan any grandmother betting on her favorite color would. It was not clearwhether we had bugs that could be fixed or if in fact Grandma had a goodthing going relative to us.
This form of uncertainty occurs in interpreting the results of any sim-ulation or mathematical model. Every so often you read that physicistshave performed supercomputer simulations of what happens when galax-ies collide, the results of which inexorably imply that the Big Bang did(or did not) happen. It is prudent to be highly suspicious of such simula-tions unless the physicists can also bang two actual galaxies together tosee what really happens.
Finding and fixing bugs in computer programs are very tricky thingsto do, even in applications in which you know exactly what the programis supposed to do and how it works. A company like Microsoft employsroughly one full-time tester for every computer programmer in order toboost the reliability of its products. Still, this programmer can create bugsat a faster rate than the tester can discover them.
A good programmer can anticipate bugs in a system by identifying whathe or she did not know how to do in a clean, correct manner. I was onceprivileged to witness the spectacle of Stephen Wolfram demonstrating hisMathematica computer algebra system to William Kahan, who is perhapsthe world’s leading authority on performing accurate numerical computa-tions. Now Wolfram is a very bright guy – winner of the MacArthur Founda-tion genius award and recipient of his Ph.D. at age 20 – and Mathematica isan excellent product. But Kahan is no slouch, either. Within a few minutesof stepping up to the console, Kahan had Mathematica merrily provingthat 0.9999 = 1 and that −1 = 1. From there, he proved that day was night,as Wolfram shrank in horror.
I’ve heard the following tale told of IBM’s OS 360, the biggest softwaredevelopment project of its time. A large staff of programmers set to work
156
P1: GGL
CB386-07 CB386-Skiena June 9, 2001 14:36 Char Count= 0
ENGINEERING THE SYSTEM
repairing bugs as they were found by users, gradually improving the reli-ability of the product. Eventually, their progress slowed and ceased withroughly a thousand known bugs still infesting the system. No matter howhard they worked at it, fixing these bugs created other bugs, just as paintingthe walls leaves drips on the floor.
The Millennium BugAs we were developing our system, the specter of the millennium bug (orthe Year 2000 problem) slowly but surely eased its way into the conscious-ness of the general public. People became aware that computer systemsaround the world were at serious risk of failing on the morning of January1, 2000, owing to what sounded like the most ridiculous and trivial of pro-grammer errors. My personal favorite doomsday scenarios included thefollowing:
■ December 31, 1999: Grand Ballroom, Waldorf–Astoria Hotel – Thecream of New York society, powerful gray-haired men in tuxedos withdiamond-studded trophy wives, gather to drink and dance in the newcentury. 10–9–8–7–6–5–4–3–2–1! We have reached the twentyfirstcentury!
Suddenly several men around the room start clutching their chests,unable to breath. Inside their bodies, pacemakers programmed withthe millennium bug have begun to party like it’s 1999. . .
■ December 31, 1999: United States Strategic Air Command Head-quarters – Renegade General Duke Hazard lights up a victory cigardeep within a top-secret bunker under the Colorado Rockies. The clockstrikes 9 P.M. It is the moment he had spent 5 years planning for,waiting for. The rotation of the earth has already changed the cen-tury throughout Europe and Asia, and the United States now awaits itsturn to ring in the century with a bang.
But not anywhere near the bang General Hazard had in mind! Heknows that the militaries of every other power on earth lie paralyzed bythe millennium bug. With one all-out nuclear strike we could eliminatethe threat of China, Russia, Iraq, Libya – once and for all. He caresses thebutton that will irrevocably send off the missiles and bombers whenhe pushes it. The true Manifest Destiny of the United States is being onthe right side of the International Dateline at the right time, he muses.
157
P1: GGL
CB386-07 CB386-Skiena June 9, 2001 14:36 Char Count= 0
CALCULATED BETS
But outside his bunker, a crack team led by Bruce Willis attacks thehardened concrete, racing against time to save the world from utterdestruction . . .
Fortunately, neither of these scenarios was destined to happen; indeedin retrospect Y2K seems much ado about nothing. However, billions ofdollars had to be spent fixing programs to ensure that business and societycontinued to function properly at the start of the century.
The millennium bug was usually described as the result of a program-mer’s ill-advised attempts to save the memory space it took to store the“19” at the front of every year. Thirty years ago, this may have been true.But in fact, the most insidious occurrences of the bug were not a resultof space parsimony so much as a human inability to anticipate trouble insomething that seemed like it was working correctly.
Lurking within our jai alai system was a good example of a millenniumbug. Each night our program fetched the next day’s schedules and yester-day’s results, and this data had to be stored in files. We gave each file aname that encoded as much information as possible about what it was.For example, we named the Milford Afternoon results and schedule filesfor a particular date ma-08-22-98.res and ma-08-22-98.sch, respectively.In various contexts, our program assumed two-digit dates because theyread better than the full four-digit dates. Sure, the extra two digits werewasted space, but who cares about the cost of such a tiny amount of mem-ory. But the extra digits were a pain for the people who had to read thedates.
Two-digit dates don’t necessarily present a problem, provided theyare computed correctly from four-digit dates. The obvious algorithm isto take the given year and subtract 1900 from it. Obvious but wrong! Sure1996 − 1900 = 96, but 2000 − 1900 = 100, which is no longer a two-digitnumber! Extra logic has to be added to chop it down to two digits.
After making such changes, Roger assured me that the system will con-tinue to predict jai alai matches into next century, and indeed it camethrough New Year’s Day 2000 like a champ. We should now be in the clearuntil 2096, when the earliest of the data we collected will start to have filenames that will collide with our latest retrievals. At this point, I do nottrust our system to work after 2096, but we can take care of this in duetime. Of course, this is the kind of thinking that got us in trouble with themillennium bug in the first place, but I will be very happy if I get to dealwith the problem at that time.
158
P1: GGL
CB386-07 CB386-Skiena June 9, 2001 14:36 Char Count= 0
ENGINEERING THE SYSTEM
Program Trading in Jai AlaiRoger diligently beat on the jai alai system, fixing bugs, tightening the code,making sure he understood how every line of the program works.
With the system clean and stable, he now systematically conductedexperiments on its performance. He took 3 months’ worth of schedulesand results and evaluated a raft of different betting strategies on them.Each betting strategy was described by three parameters: (1) the subset ofgames we were studying (evenings, matinees, or both for a given fronton),(2) the α value described earlier regulating how aggressively we favored thestronger player, and (3) the expected-return threshold that regulated howadvantageous a bet had to be before we were willing to risk it. In principle,the higher we set our expected-return threshold, the greater the percentageof our profits should have been. However, a lower threshold might returngreater total profits by enabling us to place more money-making bets evenif the yield-per-bet was less. We needed to find the right point to skim offthe most cream.
Roger kept our computers busy for a week trying every possible bettingstrategy. The results were clear and consistent. There was no cream to skimwith any of them. All lost money at about the same rate as random chance.
How could this be? We racked our heads trying to figure out what waswrong with the model. I repeatedly sent Roger away in search of bugs, buthe kept coming back giving the program a clean bill of health.
If our programs didn’t have bugs, the problem had to be in our model.But where could it be? Our Monte Carlo simulation was straightforwardenough to trust, but what about our assessment of player skills? It dawnedon us that almost 90% of all jai alai matches are doubles matches, yetwe were maintaining statistics about individual players, not teams. Topredict how good a team was, we averaged the skills of the two athletesinvolved. But did this make sense? It was easy to imagine pairs of highlytalented players who couldn’t stand each other, and other pairs whoseskills complemented each other so they were better as a team than asindividuals. Certainly teams with more experience were likely to do betterthan a pair thrown together for the first time.
We decided to give the system one last chance and use team recordsto measure player skill. This presented some minor problems because thenumber of teams is potentially enormous. Note that a stable of 50 playerscould generate up to 50 × 49/2 = 1225 teams to keep track of, but in factmost possible pairings never occurred.
159
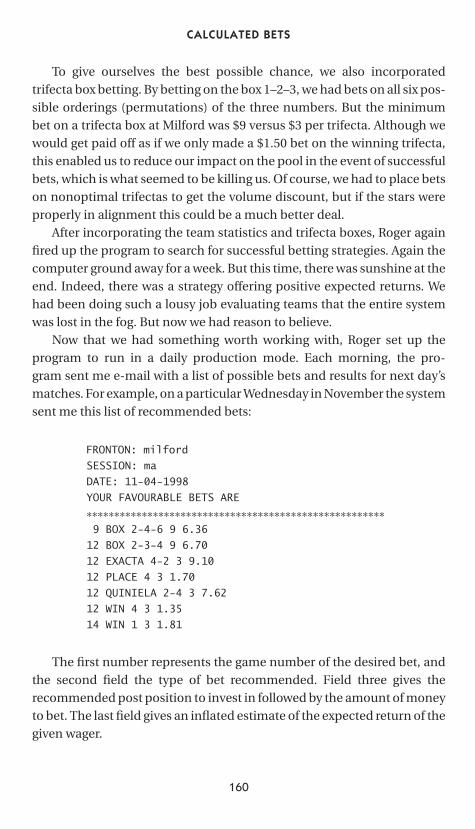
P1: GGL
CB386-07 CB386-Skiena June 9, 2001 14:36 Char Count= 0
CALCULATED BETS
To give ourselves the best possible chance, we also incorporatedtrifecta box betting. By betting on the box 1–2–3, we had bets on all six pos-sible orderings (permutations) of the three numbers. But the minimumbet on a trifecta box at Milford was $9 versus $3 per trifecta. Although wewould get paid off as if we only made a $1.50 bet on the winning trifecta,this enabled us to reduce our impact on the pool in the event of successfulbets, which is what seemed to be killing us. Of course, we had to place betson nonoptimal trifectas to get the volume discount, but if the stars wereproperly in alignment this could be a much better deal.
After incorporating the team statistics and trifecta boxes, Roger againfired up the program to search for successful betting strategies. Again thecomputer ground away for a week. But this time, there was sunshine at theend. Indeed, there was a strategy offering positive expected returns. Wehad been doing such a lousy job evaluating teams that the entire systemwas lost in the fog. But now we had reason to believe.
Now that we had something worth working with, Roger set up theprogram to run in a daily production mode. Each morning, the pro-gram sent me e-mail with a list of possible bets and results for next day’smatches. For example, on a particular Wednesday in November the systemsent me this list of recommended bets:
FRONTON: milford
SESSION: ma
DATE: 11-04-1998
YOUR FAVOURABLE BETS ARE
∗∗∗∗∗∗∗∗∗∗∗∗∗∗∗∗∗∗∗∗∗∗∗∗∗∗∗∗∗∗∗∗∗∗∗∗∗∗∗∗∗∗∗∗∗∗∗∗∗∗∗∗∗∗9 BOX 2-4-6 9 6.36
12 BOX 2-3-4 9 6.70
12 EXACTA 4-2 3 9.10
12 PLACE 4 3 1.70
12 QUINIELA 2-4 3 7.62
12 WIN 4 3 1.35
14 WIN 1 3 1.81
The first number represents the game number of the desired bet, andthe second field the type of bet recommended. Field three gives therecommended post position to invest in followed by the amount of moneyto bet. The last field gives an inflated estimate of the expected return of thegiven wager.
160
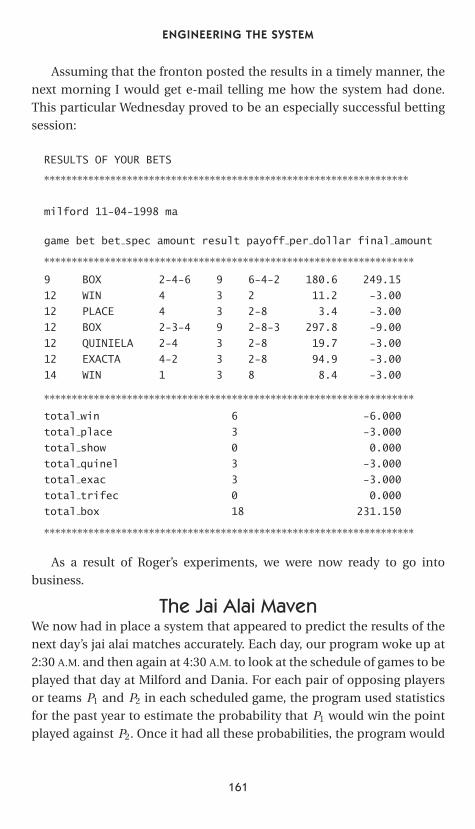
P1: GGL
CB386-07 CB386-Skiena June 9, 2001 14:36 Char Count= 0
ENGINEERING THE SYSTEM
Assuming that the fronton posted the results in a timely manner, thenext morning I would get e-mail telling me how the system had done.This particular Wednesday proved to be an especially successful bettingsession:
RESULTS OF YOUR BETS
∗∗∗∗∗∗∗∗∗∗∗∗∗∗∗∗∗∗∗∗∗∗∗∗∗∗∗∗∗∗∗∗∗∗∗∗∗∗∗∗∗∗∗∗∗∗∗∗∗∗∗∗∗∗∗∗∗∗∗∗∗∗∗∗∗∗
milford 11-04-1998 ma
game bet bet spec amount result payoff per dollar final amount
∗∗∗∗∗∗∗∗∗∗∗∗∗∗∗∗∗∗∗∗∗∗∗∗∗∗∗∗∗∗∗∗∗∗∗∗∗∗∗∗∗∗∗∗∗∗∗∗∗∗∗∗∗∗∗∗∗∗∗∗∗∗∗∗∗∗∗9 BOX 2-4-6 9 6-4-2 180.6 249.15
12 WIN 4 3 2 11.2 -3.00
12 PLACE 4 3 2-8 3.4 -3.00
12 BOX 2-3-4 9 2-8-3 297.8 -9.00
12 QUINIELA 2-4 3 2-8 19.7 -3.00
12 EXACTA 4-2 3 2-8 94.9 -3.00
14 WIN 1 3 8 8.4 -3.00
∗∗∗∗∗∗∗∗∗∗∗∗∗∗∗∗∗∗∗∗∗∗∗∗∗∗∗∗∗∗∗∗∗∗∗∗∗∗∗∗∗∗∗∗∗∗∗∗∗∗∗∗∗∗∗∗∗∗∗∗∗∗∗∗∗∗∗total win 6 -6.000
total place 3 -3.000
total show 0 0.000
total quinel 3 -3.000
total exac 3 -3.000
total trifec 0 0.000
total box 18 231.150
∗∗∗∗∗∗∗∗∗∗∗∗∗∗∗∗∗∗∗∗∗∗∗∗∗∗∗∗∗∗∗∗∗∗∗∗∗∗∗∗∗∗∗∗∗∗∗∗∗∗∗∗∗∗∗∗∗∗∗∗∗∗∗∗∗∗∗
As a result of Roger’s experiments, we were now ready to go intobusiness.
The Jai Alai MavenWe now had in place a system that appeared to predict the results of thenext day’s jai alai matches accurately. Each day, our program woke up at2:30 A.M. and then again at 4:30 A.M. to look at the schedule of games to beplayed that day at Milford and Dania. For each pair of opposing playersor teams P1 and P2 in each scheduled game, the program used statisticsfor the past year to estimate the probability that P1 would win the pointplayed against P2. Once it had all these probabilities, the program would
161
P1: GGL
CB386-07 CB386-Skiena June 9, 2001 14:36 Char Count= 0
CALCULATED BETS
simulate each game 250, 000 times and then produce a list of all the betsthat it felt offered a sufficiently high return to warrant betting on.
The 2:30 A.M. version of the program differed from the 4:30 A.M. versiononly in the value of the fudge factor α. The early program used a conserva-tive α = 1, whereas the late program used the more aggressive α = 0.4. Bycomparing the two results, we could see whether the early program caughtthe worm.
Each invocation of the program provided a fairly long list of bets itassessed as offering reasonable returns. Betting on all of them would havecost me over $1000 a day in bets, which was much too rich for my blood andtoo much data for me to be able to keep track of how well the system wasdoing. For this reason, I wrote a short program to merge the conservativeand aggressive selections and identify a more exclusive subset of good betsunder the following criteria:
■ Make any win, place, or show bet the conservative program thoughtoffered positive returns or the aggressive program thought offered atleast $0.50 profit per dollar bet.
■ Because the system offered up considerably more quiniela and exactabetting possibilities, make any quiniela or exacta bet the conservativeprogram thought offered positive returns and the aggressive programthought offered at least $5.00 profit per dollar bet.
■ Because trifecta box bets were more expensive than the other bets(they cost us $9 at Milford instead of $3), we needed an even stricterinvestment criteria. The system would make any trifecta box bet theconservative program thought offered positive returns and the aggres-sive program thought offered at least $6.00 profit per dollar bet.
I named this selection program Maven, which is a Yiddish word for“self-proclaimed expert.” After final tuning, my jai alai Maven and I wereready for the test.
On the WireI live in New York, and the nearest jai alai action resides a 2-hour drivefrom me in Connecticut or a 2-hour flight from me in Florida. I’m notsuch a self-destructive gambler to incur such transit times just to make abet – particularly for a system that seeks to bet only a modest amount eachday. But to test the system, we had to find someone to take our money. Ithought about striking a deal with local people in Connecticut and Florida
162
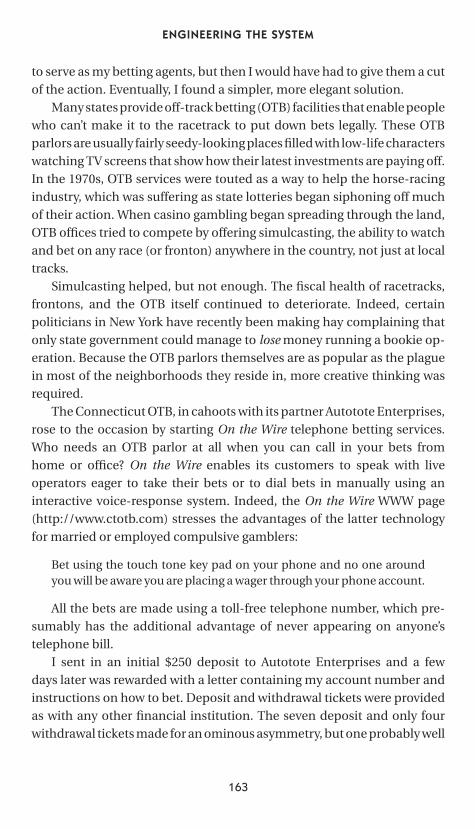
P1: GGL
CB386-07 CB386-Skiena June 9, 2001 14:36 Char Count= 0
ENGINEERING THE SYSTEM
to serve as my betting agents, but then I would have had to give them a cutof the action. Eventually, I found a simpler, more elegant solution.
Many states provide off-track betting (OTB) facilities that enable peoplewho can’t make it to the racetrack to put down bets legally. These OTBparlors are usually fairly seedy-looking places filled with low-life characterswatching TV screens that show how their latest investments are paying off.In the 1970s, OTB services were touted as a way to help the horse-racingindustry, which was suffering as state lotteries began siphoning off muchof their action. When casino gambling began spreading through the land,OTB offices tried to compete by offering simulcasting, the ability to watchand bet on any race (or fronton) anywhere in the country, not just at localtracks.
Simulcasting helped, but not enough. The fiscal health of racetracks,frontons, and the OTB itself continued to deteriorate. Indeed, certainpoliticians in New York have recently been making hay complaining thatonly state government could manage to lose money running a bookie op-eration. Because the OTB parlors themselves are as popular as the plaguein most of the neighborhoods they reside in, more creative thinking wasrequired.
The Connecticut OTB, in cahoots with its partner Autotote Enterprises,rose to the occasion by starting On the Wire telephone betting services.Who needs an OTB parlor at all when you can call in your bets fromhome or office? On the Wire enables its customers to speak with liveoperators eager to take their bets or to dial bets in manually using aninteractive voice-response system. Indeed, the On the Wire WWW page(http://www.ctotb.com) stresses the advantages of the latter technologyfor married or employed compulsive gamblers:
Bet using the touch tone key pad on your phone and no one aroundyou will be aware you are placing a wager through your phone account.
All the bets are made using a toll-free telephone number, which pre-sumably has the additional advantage of never appearing on anyone’stelephone bill.
I sent in an initial $250 deposit to Autotote Enterprises and a fewdays later was rewarded with a letter containing my account number andinstructions on how to bet. Deposit and withdrawal tickets were providedas with any other financial institution. The seven deposit and only fourwithdrawal tickets made for an ominous asymmetry, but one probably well
163
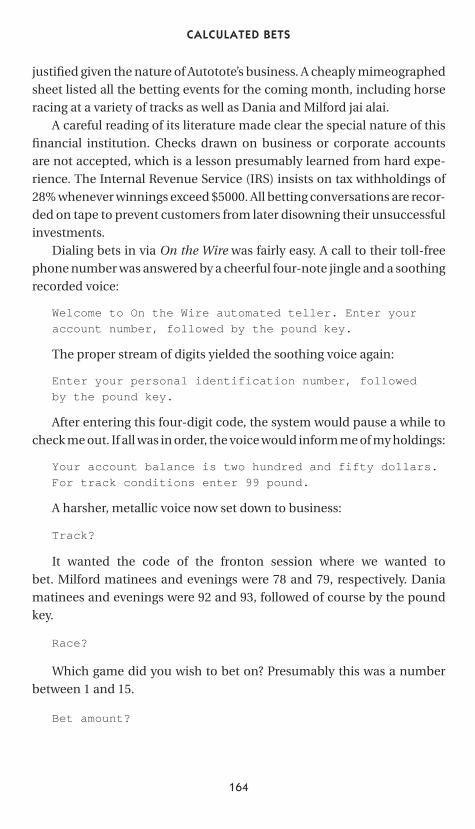
P1: GGL
CB386-07 CB386-Skiena June 9, 2001 14:36 Char Count= 0
CALCULATED BETS
justified given the nature of Autotote’s business. A cheaply mimeographedsheet listed all the betting events for the coming month, including horseracing at a variety of tracks as well as Dania and Milford jai alai.
A careful reading of its literature made clear the special nature of thisfinancial institution. Checks drawn on business or corporate accountsare not accepted, which is a lesson presumably learned from hard expe-rience. The Internal Revenue Service (IRS) insists on tax withholdings of28% whenever winnings exceed $5000. All betting conversations are recor-ded on tape to prevent customers from later disowning their unsuccessfulinvestments.
Dialing bets in via On the Wire was fairly easy. A call to their toll-freephone number was answered by a cheerful four-note jingle and a soothingrecorded voice:
Welcome to On the Wire automated teller. Enter your
account number, followed by the pound key.
The proper stream of digits yielded the soothing voice again:
Enter your personal identification number, followed
by the pound key.
After entering this four-digit code, the system would pause a while tocheck me out. If all was in order, the voice would inform me of my holdings:
Your account balance is two hundred and fifty dollars.
For track conditions enter 99 pound.
A harsher, metallic voice now set down to business:
Track?
It wanted the code of the fronton session where we wanted tobet. Milford matinees and evenings were 78 and 79, respectively. Daniamatinees and evenings were 92 and 93, followed of course by the poundkey.
Race?
Which game did you wish to bet on? Presumably this was a numberbetween 1 and 15.
Bet amount?
164
P1: GGL
CB386-07 CB386-Skiena June 9, 2001 14:36 Char Count= 0
ENGINEERING THE SYSTEM
Here we could type in any amount we wanted, in dollars, subject to theminimum allowable bet. The “*” key was available to serve as a decimalpoint if needed, as on trifecta box bets.
Bet type?
Each possible type of bet had a numerical code associated with it. Thecode for a win was “11,” while “32” would get you a trifecta box.
Runners?
Here the system would prompt you for the post position numbers (be-tween 1 and 8) of the players you wished to bet on. For quiniela, exacta,and trifecta bets that involved more than one post position, the entrieswere separated with the “*” key.
You have requested Milford Jai-Alai, evening, game 5,
for one dollar fifty cents on trifecta box 3-5-6. Press
1 to confirm.
On confirming the bet, the system would inform you of the size ofyour now diminished balance and return to “Track? ” Entering a “*” orjust hanging up the phone would end this session. Personally, I pre-ferred entering a “*” so I could listen as their machine thanked me for mybusiness.
Otto the AutodialerDialing in bets may have been easy, but it was also mind-numbingly boring.This was the kind of boredom that ruined far more blackjack card countersthan casino security ever did. Imagine you were an intelligent, restless sortof person who knew enough mathematics to develop or master some kindof intricate card-counting system. This system turns the odds in your favorinstead of the house’s, offering, say, a 1.5% per hand positive return. Nowseat this intelligent, restless sort of person at a blackjack table, where hisor her disciplined, intense play pays off at up to $50 per hour. For the firstfew hours, the card counter will think, “Cool! I am sitting here taking thecasino’s money.”
But over the course of the next 100 hands or so, reality will graduallybut inevitably set in. Your eyes will start to get glassy from the glare of thelights off the cards, your fingers will start to cramp from handling the cards,
165
P1: GGL
CB386-07 CB386-Skiena June 9, 2001 14:36 Char Count= 0
CALCULATED BETS
and your head will start pounding from the strain of keeping track of allthose numbers. “What the hell am I doing here? I never wanted to be abank clerk, even at $50 an hour!” You will storm out of the casino and buya book on the stock market, or preferably this one, on jai alai.
The same thing happened to me in the course of phoning in my bets,and it didn’t take a hundred hands. Five or six was more like it. Phoning ineach bet took close to a minute of punching in a list of digits printed out bya machine and then waiting until another machine read back my bets andasked for my confirmation. It didn’t take long before the glamor wore off.There was no way I would spend the 15–20 minutes per day of mindlessdialing it would require to really test our system out.
It was time to put technology to work for the betterment of man. Whencomputers want to talk on the telephone, they use a device called a modem.A modem, short for modulator–demodulator, is a device that translatesarbitrary text and data into tones suitable to be sent down a phone lineand converts another modem’s tones back into its original text and data.Anyone who has ever tried talking to a fax machine or interrupted junior’sAOL session by picking up the phone has some idea what these tonessound like. But other computers don’t mind listening to them, and suchcommunication is the real foundation of the Internet revolution.
My first modem was a 300-baud acoustic coupler model for which youhand dialed the phone number of the computer you wanted to reach,listened for the squeal, and then tried to jam the handset of the telephoneinto the two black rubber cuffs fast enough to establish a connection beforethe other machine cut you off. If you got lucky, you were rewarded withtext streaming across your computer screen at the speed of a slow typist.
From these humble beginnings, modem technology has matured ina big way. Acoustic cuffs disappeared years ago in favor of jacks plug-ging directly into phone lines, thus increasing reliability and speed. To-day’s modems operate at 56 kilobaud on standard telephone lines, roughly200 times faster than what I started with.
Eliminating the acoustic couplers meant that the modem had to besmart enough to dial the phone for itself. This required the modem tounderstand a command language with instructions to dial numbers, detectwhether a phone answers or is busy, wait prescribed amounts of timebefore issuing new commands, and hang up.
Turning modems into programmable devices opened up new worldsof possibilities for those bold enough to grasp them. By programming
166
P1: GGL
CB386-07 CB386-Skiena June 9, 2001 14:36 Char Count= 0
ENGINEERING THE SYSTEM
your modem to speed-dial a radio station repeatedly, you could increaseyour chances of getting through to win some kind of prize. You coulduse your modem for political expression. I recall a bloke who programmedhis modem to call up the Reverend Jerry Falwell’s toll-free fund-raisingnumber once every minute for several months. This saddled poor Jerrywith quite a phone bill because toll-free calls are paid by the recipient,not the sender. “Reach out and touch someone,” was the bloke’s motto, atleast until the courts shut him down. While he was still in high school, myold roommate Luke programmed his home computer to conduct an early-morning search for telephones answered by computers. Over the next fewmonths, he systematically woke up every single person in his home townof Baton Rouge, Louisiana, exactly once.
Fortunately for Luke, those were the days before the caller ID optionwas offered by the telephone company. Today, such activities, called“scanning” or “war-dialing,” are illegal in many places. In particular, thelaw in Luke’s current hometown of Colorado Springs, Colorado, makes itillegal to place a call “without the intent to communicate.”
What I had in mind wasn’t so unsavory. I wanted to program the modemto dial our bets into On the Wire so I didn’t have to phone them in myself.I needed free access to a modem attached to our departmental computersystems. This was a problem. In justifiable fear of creative students likeLuke, our system’s staff would not let anybody but themselves play withthe modems. They did inform me that one of our faculty members has hisown modem hooked to his own personal computer in his office.
Because this professor is Gene Stark, I knew that he would help me withthis project. Why? Well, first Gene is a terrific hacker in the best sense ofthe word, and thus I knew that he would get a kick out of it. Second, Genehas had high-tech gambling experience of his own; he was the colleague Itold you about who devised his own card-counting system in blackjack.
Gene was intrigued enough with the project that he wrote the autodi-aler program himself. Its job was to take a file of bets and phone them intoAutotote. It was a pleasure watching Gene program, a master at work. Hisbig hands would dance over the small keyboard, bang–bang–bang, and heissued commentary as he pecked away.
“Parse the input file, initialize the modem, emit the dialing commands.”Bang–bang–bang . . .
“Need some structure. Modularize this sucker. One routine to makeeach kind of bet.” Bang–bang–bang . . .
167
P1: GGL
CB386-07 CB386-Skiena June 9, 2001 14:36 Char Count= 0
CALCULATED BETS
Gene was disciplined enough to do things right, not just get somethingworking. “Always aim for more structure. Nah, that is too crufty. Try it thisway.” Bang–bang–bang . . .
“Good. Let’s see if it talks to the modem.” We could hear garbled soundscoming through the cheap speaker on his modem. Hiss, bleep,
whine. “Doesn’t work. Why not? The modem is hung trying to talk tothe other machine. It doesn’t get the carrier. Why not? Of course. It’s nottrying connect, just pumping out dial commands.” Bang–bang–bang . . .
“Try it again.”
Hiss, bleep! Welcome to On the Wire automated teller.
Enter beep-beep-beep-beep your account number. I did
not understand your account number. Please try again.
“Our pause timing is off here. Sleep another 5 seconds and try it again.”Bang–bang–bang . . .
One of the most critical aspects of the autodialer was figuring out howlong to wait before issuing various commands. We were trying to programthe modem to use an interface designed to be used by people. Peoplephoning in bets would listen to the system prompts and enter the datawhen the machine told them it was ready for it. If they goofed, the machinewould tell them why and what to do from that point. But our modem wasdeaf and didn’t understand English. It could not hear any prompts from thesystem, let alone understand them. All it could do was pump out touch-tones at prescribed intervals in time. By timing the On the Wire systemwith a stop watch, we could estimate how long it would take the system toreact and pause accordingly between data items.
Hiss, bleep! Welcome to On the Wire automated teller.
beep-beep-beep-beep, . . . , beep-beep-beep-beep, Your
account balance is now two hundred and forty seven
dollars...
“Ha-ha-ha,” Gene laughed. “It just spent your money. I sure hope youknow what you’re doing with this jai alai thing.”
We sat there for a while listening to the two machines talking to eachother. The modem would issue commands, wait patiently until its partnerstopped talking and then dial in its next request. I’ve had conversationslike that, when someone is babbling so much that I just remove the phonefrom my ear and wait until he or she is finished talking. But here, it was amachine doing the talking as well. It was the dumb talking to the deaf.
168
P1: GGL
CB386-07 CB386-Skiena June 9, 2001 14:36 Char Count= 0
ENGINEERING THE SYSTEM
Gene’s only stipulation was that our computer had to be off his phoneby the time he came into the office each morning. This meant that we hadto start dialing in our bets by about 7:30 A.M. or so to be sure we finished ontime. This was before On the Wire officially opened for business, and thusabout half the time our bets didn’t take. Still, it was well worth this amountof shrinkage to avoid the drudgery of phoning the bets in by hand.
Phoning the bets in that early may also have had an advantage, becauseit might scare off any bettor watching the odds board. Our bets could serveto depress the preliminary odds enough that these bottom-feeders wouldbe induced to pick other options instead, thus reducing our competition.Considerations like this made it impossible to simulate exactly how thesystem would perform in real life. We had to place actual bets to see if weknew what we were doing.
I’d occasionally get to work early enough to catch the modem phoningin the bets. Whenever I did, I’d press my ear against Gene’s office doorto hear what was going on. I’d hear foggy touch-tones going beep-beep-
beep-beep followed by a muffled, synthesized voice thanking an emptyroom for its business.
Cryptography and SecurityGene never let any program that he didn’t understand run on his computer.“I don’t trust it,” he’d say.
We had to insulate Gene’s machine from the entire jai alai system whilegetting him the bets. The solution was to e-mail the bets to a special ad-dress on his office machine and have his e-mail handling software respondappropriately to it.
How does your email ultimately get to you, and you alone? Suppose yousend mail to [email protected]. The stuff to the right of the @ specifiesa machine that knows about the fellow whose account name is to theleft of the @. Internet routing computers keep tables of the addresses ofimportant machines on the network and eventually ship the mail to thespecified machine. This machine runs software that looks at each incomingmessage, identifies which account it is for, and then looks to see how mailfor this account should be processed.
For most people, this processing means adding the mail to their unreadmail file and perhaps raising a “you’ve got mail” flag. For our special jaialai account, this meant taking the given mail message, stripping off any
169
P1: GGL
CB386-07 CB386-Skiena June 9, 2001 14:36 Char Count= 0
CALCULATED BETS
header information, and then invoking Otto the Autodialer on the givenset of bets.
Gene’s system was now safely protected from my jai alai program, al-though this nifty e-mail interface exposed my money to a certain amountof extra risk. Suppose someone else sent an appropriately formatted e-mailmessage to this account. Otto would be just as happy to phone in thesebets as it would be to phone in mine. Indeed, an evil person could drain allmy money away making 6–8–7 trifecta bets if he or she were appropriatelyinformed and devious.
This introduces us to an important and surprisingly intricate problemof contemporary computer science, namely, “convince me that you arewho you say you are.” I needed to find a way to prevent Otto from listeningto anyone except me. How could I convince it I was who I said I was?
The most common approach to solving such identification problemsinvolves the use of a password. If you and I are the only ones who knowthe secret password, than you can e-mail the password to me in orderto convince me that you are you. But what’s the catch? Anybody on anycomputer this e-mail passes through might be snooping in on our message.Thus, he or she could easily discover the password. From this moment on,he or she could masquerade as either of us. This is exactly why many people(including me) are reluctant to use their credit card to order anything overthe Internet. The bad guys may be watching.
More important even than safeguarding my credit card number, userauthentication problems can be a matter of life and death. Consider thefriend-or-foe identification systems in fighter aircraft used in the military.Combat among fighter aircraft is a high-speed, high-stakes business. Imag-ine I’m a pilot. Radar reports an unknown craft rapidly closing in on mytail. Friend or foe? If I’m wrong, I’ll shoot down my buddy, or even worse,someone will shoot me down.
Friend or foe? Passwords won’t work well for this application. Theopposing side certainly has radio receivers and can listen in on everythingwe transmit to each other. As soon as I broadcast the password, the otherside could discover it and teach its aircraft the magic word to sneak up onus. We could change the password often, but that is a dangerous game. Ifmy buddy’s password ever gets slightly out of date, he’s toast – I’m liable toshoot him down for his carelessness.
Real military friend-or-foe systems work by conducting a question-and-answer session between the two parties. Both parties have stored up
170
P1: GGL
CB386-07 CB386-Skiena June 9, 2001 14:36 Char Count= 0
ENGINEERING THE SYSTEM
a large series of questions and answers. I’ll send you a random stream ofnumbers corresponding to the questions I want to ask you. You send meback the given answers. Someone listening can’t immediately use this in-formation, because the next time I want to check somebody out I’ll ask himor her a different set of questions. Properly employed, such randomizationenables us to protect our secrets while facilitating authentication.
So, how does Gene’s e-mail-handling software safeguard my money byprocessing messages only from me? I’m not telling. Any information I givehere will only help young hackers (the future Lukes of America) figure outhow to break into my system. And I’m not interested in making any 6–8–7trifecta bets, thank you.
Internet GamblingVarious sectors of the so-called gaming industry are excited about theprospects for widespread Internet gambling, and chafing at the regulatoryconstraints that are delaying its widespread introduction.
I’ve seen the volume of legal gambling in the United States estimated ashigh as $500 billion per year. This works out to almost $2000 per person peryear. Even a small fraction of this total is a healthy chunk of change. I hateto think what the amount of illegal gambling is! The Interactive GamingCouncil reports that more than $1.2 billion were bet in its member’s 700cyber casino sites in 1999. This is an amazing number comparable to the$1.6 billion dollars in sales that Amazon.com had in the same year. Thisgives new perspective on who really runs the Internet. The United StatesJustice Department and Senator Jon Kyle estimate that this annual totalcould grow to $10 billion within a few years.
Internet gambling differs in many important ways from conventionalgambling. Whether these changes are positive or negative depends uponyour perspective:
■ Loss of community control – Today, for better or worse, state, local, ortribal government regulates the opportunities for legal gambling. Ifthe people of a given region believe that casino gambling is harmful,it will be forbidden. If the people of a given region believe that casinogambling is good for economic development, they can pass a law andmust live with the consequences.
But Internet gambling has no such geographic limitations. Any-one with a computer is a potential player, even in the most righteous
171
P1: GGL
CB386-07 CB386-Skiena June 9, 2001 14:36 Char Count= 0
CALCULATED BETS
community on earth. The problems of compulsive gambling won’t goaway, and indeed their effects will stay local. All the benefits, such aspotential profits, taxes, and jobs won’t stay local but instead get suckedoff into cyberspace.
■ Lack of regulation – You are playing virtual roulette in a virtual casino.After 10 straight blacks you just know the next ball will be red. Youswallow hard as you put down a $10,000 wager on red. It is more thanyou ever dreamed of betting, and frankly more than you can afford. Itcomes up black, again. You lose.
But how do you know that the game was fair? Perhaps the pro-grammer decided to make the ball fall in the slot which minimizes theamount returned to bettors, instead of fairly picking a random number.The WWW site you have been sending your money to is on an unin-habited island in the Bahamas. If the game wasn’t fair, who could youcomplain to, anyway?
■ Lack of infrastructure – Expanding casino gambling from an enclavein Las Vegas into a nationwide “gaming” industry required a consid-erable investment in infrastructure and personnel. Massive hotels andpowerful politicians had to be bought, the latter to help steer reluctantlegislatures towards legalizing their business.
Interestingly, it is the established gaming industry that has the mostto lose if Internet gambling gains a foothold in the hearts and mindsof gamblers. Operating an Internet gambling site does not requirea 3000-room hotel in Vegas. Indeed, well-known establishments likeCaesar’s Palace have no particular edge in building a virtual casino.Instead, they face the prospect of their customers’ sitting home gluedto their computer screens. Why lose money in Atlantic City when youcan do so from the comfort of your living room?
The Internet Gambling Prohibition Act of 1997 was passed by the Senateon July 23, 1998, by a vote of 90–10. This act amends the Federal criminalcode to prohibit and set penalties for: (1) placing, receiving, or otherwisemaking a bet or wager via the Internet or any other interactive computerservice in any State, and (2) engaging in the business of betting or wageringthrough the Internet or any such service. There are exceptions for statelotteries, horse racing, and (yes) jai alai.
As of this writing, the House of Representatives has failed to vote thisbill into law. Special interests line up for or against it in interesting ways.
172
P1: GGL
CB386-07 CB386-Skiena June 9, 2001 14:36 Char Count= 0
ENGINEERING THE SYSTEM
Liquor store owners and religious groups are for the legislation, but per-haps from different motives. The liquor dealers fear a reduction in theirlottery ticket sales owing to competition with on-line lotteries. A surprisingcollection of state governors stand quietly against it, with their eyes opento losing revenue from these same lotteries.
Internet gambling is currently legal in 50 countries, including Liecht-enstein, Gibraltar, Australia, and certain Caribbean countries – more thanenough to cause trouble. A California woman who lost $70,000 to an over-seas virtual casino sued her credit card company, asserting that she shouldget their cut of this action.
The Internet Gambling Prohibition Act is broad enough potentially tothreaten full deployment of our jai alai system to frontons beyond thosesupported by On the Wire. In particular, we could imagine e-mailing ourpicks to a local agent, who would place our bets for us in Newport or Miami.As I read the act, this might be a Federal crime, even though it would beperfectly legal to have our same program spewing out the predictions onthe agent’s own personal computer.
This act works by extending the current prohibitions against usingtelephones for interstate gambling. There are serious consequences forthose who violate it:
Whoever, being engaged in the business of betting or wagering know-ingly uses a communication facility for the transmission or receipt ininterstate or foreign commerce of bets or wagers, information assistingin the placing of bets or wagers, or a communication that entitles thetransmitter or receiver to the opportunity to receive money or creditas a result of bets or wagers, shall be fined not more than $10,000,imprisoned not more than 2 years, or both.
The prohibition against using telephones for interstate gambling hasproven to be a powerful legal tool against organized crime. It presumablydoes not apply to my use of On the Wire because the statute providesexemptions as regulated by state law. As a prerequisite to opening myaccount, I had to assert that I live in one of the states that permits off-track wagering; fortunately, New York is one of these states. Still, it wasdisconcerting to learn how close my system came to violating Federal law.If caught, I feel pretty sure it would have been me doing the time, notMaven.
173
P1: FCH/FYX P2: FXS
CB386-08 CB386-Skiena June 8, 2001 17:33 Char Count= 0
CHAPTER EIGHT
PUTTING MY MONEY WHEREMY MOUTH IS
It was time to put my money where my mouth was. The system was runningwell, more or less. Roger was busy with his summer job and then his fallclasses, and thus the program wasn’t destined to improve in the foreseeablefuture. The longer we waited, the more likely it was that some externalevent – maybe a hardware problem, maybe Milford changing its WWWsite – would put us out of business for good. My On the Wire account wasstocked with $250. It was time to put the system to the test.
A Gambler’s DiaryOn July 29, 1998, Maven made its first six bets for $3 each. I bided my timeuntil late that night when I could call in to see how I did.
Your account balance is $263.50.
I was a winner! I could stop now and forever be ahead. But I was awinner! And I wanted to keep on winning.
The first few days I kept the bet amounts small as we ironed out timingproblems with the autodialer. Still, risking even $20 gave me some pause.
Your account balance is $242.50.
This gave me a sinking feeling. I’d lost my winnings, and more. Wasthere a bug with my program? Would I ever go ahead again?
174
P1: FCH/FYX P2: FXS
CB386-08 CB386-Skiena June 8, 2001 17:33 Char Count= 0
PUTTING MY MONEY WHERE MY MOUTH IS
Your account balance is $264.40.
Your account balance is $261.40.
Your account balance is $258.40.
Your account balance is $272.80.
The autodialer was clearly working. The program seemed to be makingmoney. At least it wasn’t giving it away. I lowered the profitability thresholdto convince Maven to make more bets, and on August 26 it put $99 at risk.I was more nervous than usual when I listened that night:
Your account balance is $408.70.
Big win! In the news, the Russian government had defaulted on itsdebt, setting off a sharp stock market decline. Because my pension fundsare invested in stocks, it meant I was probably several thousand dollarspoorer for the day. But what did that matter! I was winning at jai alai.Flushed with success, the phone call to get the day’s results became afavorite evening ritual . . .
Your account balance is $350.20.
Your account balance is $384.10.
Your account balance is $302.80.
A little loss didn’t bother me. After all, I was playing now with the house’smoney. I was ahead of the game . . .
Your account balance is $284.80.
I came to see that wins always came in spurts. The program liked longshots, and they only came in every few days.
Your account balance is $300.10.
Your account balance is $223.30.
It was September 9, and suddenly I was behind. And on this day of alldays, Maven decided to bet nearly twice as much as it ever had before,$169.00. If I got wiped out for the day, my account would nearly be dry.Certainly I would have to throttle back my bets if I was going to make thismoney last. It was with more than the usual trepidation that I called myelectronic bookie that night:
Your account balance is $499.75.
175
P1: FCH/FYX P2: FXS
CB386-08 CB386-Skiena June 8, 2001 17:33 Char Count= 0
CALCULATED BETS
Dynamite! I had now almost doubled my money! The system worked!When I was winning, this nightly phone call was a source of immensepleasure to me. It was less thrilling to my wife Renee, who started ques-tioning what kind of man she had married.
Your account balance is $409.75.
Your account balance is $367.15.
I felt like I was participating in a modern type of pushbutton war-fare. You hit a switch to send off thousands of missiles, reach for a beer,and then check the videos to see how much you scored. I felt a similarbloodless disconnect between the simulations we were doing and the ac-tual sporting events that were generating my new balance each night.Back at the fronton, two dozen Basques played their guts out in everymatch, laboring in blissful ignorance of the fact that this game had beenplayed 500,000 times the night before. The likelihood of each possible out-come had already been foretold. All the Basques were doing (in physicsjargon) was collapsing this probabilistic wave function down to its groundstate.
Similarly, each night I checked my phone to find out how much moneyI had won without knowing or caring who had won it for me and howwell they had played. The e-mail report I received each morning toldme which bets had paid off the previous night, but this report didn’t in-clude player names or identification numbers – just their post position inthe match. The only hint of humanity in this entire process, and it wasjust a hint, came on the right-hand side of the list of proposed bets. Foreach bet, we reported the expected probability of its winning that givenmatch. The discerning eye could tell that player 3 in game three wasdeemed more skillful than player 3 in game four and was hence a bet-ter investment.
For this reason, I’m aware that this recital of my bet outcomes suffersfrom a fundamental flaw. The stories of winning a jai alai match wouldbe infinitely more interesting if the matches were about people. My taleswould be about the chic-chac shot Enrique made to win game seven or theway the crowd cried “Fix!” when Laxhi muffed an easy catch in game nine.War movies were infinitely more interesting when people shot people,instead of people shooting missiles.
Your account balance is $349.15.
176
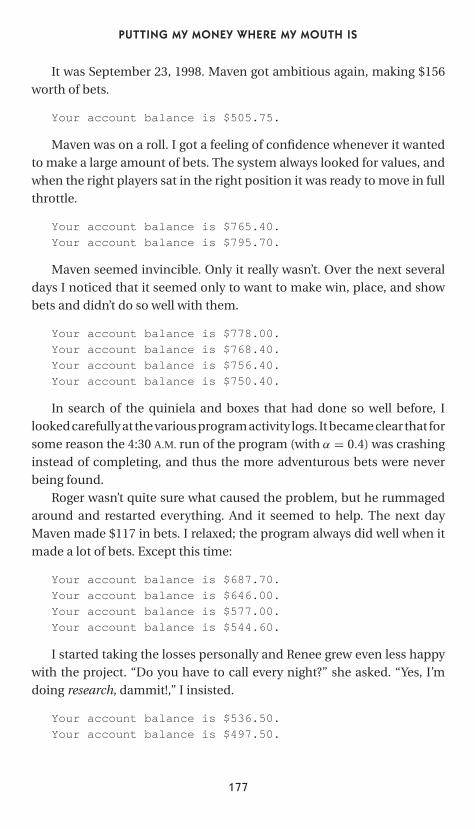
P1: FCH/FYX P2: FXS
CB386-08 CB386-Skiena June 8, 2001 17:33 Char Count= 0
PUTTING MY MONEY WHERE MY MOUTH IS
It was September 23, 1998. Maven got ambitious again, making $156worth of bets.
Your account balance is $505.75.
Maven was on a roll. I got a feeling of confidence whenever it wantedto make a large amount of bets. The system always looked for values, andwhen the right players sat in the right position it was ready to move in fullthrottle.
Your account balance is $765.40.
Your account balance is $795.70.
Maven seemed invincible. Only it really wasn’t. Over the next severaldays I noticed that it seemed only to want to make win, place, and showbets and didn’t do so well with them.
Your account balance is $778.00.
Your account balance is $768.40.
Your account balance is $756.40.
Your account balance is $750.40.
In search of the quiniela and boxes that had done so well before, Ilooked carefully at the various program activity logs. It became clear that forsome reason the 4:30 A.M. run of the program (with α = 0.4) was crashinginstead of completing, and thus the more adventurous bets were neverbeing found.
Roger wasn’t quite sure what caused the problem, but he rummagedaround and restarted everything. And it seemed to help. The next dayMaven made $117 in bets. I relaxed; the program always did well when itmade a lot of bets. Except this time:
Your account balance is $687.70.
Your account balance is $646.00.
Your account balance is $577.00.
Your account balance is $544.60.
I started taking the losses personally and Renee grew even less happywith the project. “Do you have to call every night?” she asked. “Yes, I’mdoing research, dammit!,” I insisted.
Your account balance is $536.50.
Your account balance is $497.50.
177
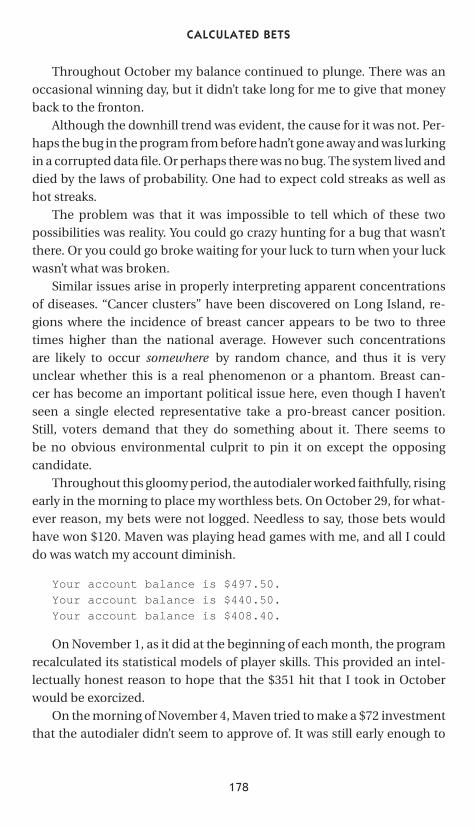
P1: FCH/FYX P2: FXS
CB386-08 CB386-Skiena June 8, 2001 17:33 Char Count= 0
CALCULATED BETS
Throughout October my balance continued to plunge. There was anoccasional winning day, but it didn’t take long for me to give that moneyback to the fronton.
Although the downhill trend was evident, the cause for it was not. Per-haps the bug in the program from before hadn’t gone away and was lurkingin a corrupted data file. Or perhaps there was no bug. The system lived anddied by the laws of probability. One had to expect cold streaks as well ashot streaks.
The problem was that it was impossible to tell which of these twopossibilities was reality. You could go crazy hunting for a bug that wasn’tthere. Or you could go broke waiting for your luck to turn when your luckwasn’t what was broken.
Similar issues arise in properly interpreting apparent concentrationsof diseases. “Cancer clusters” have been discovered on Long Island, re-gions where the incidence of breast cancer appears to be two to threetimes higher than the national average. However such concentrationsare likely to occur somewhere by random chance, and thus it is veryunclear whether this is a real phenomenon or a phantom. Breast can-cer has become an important political issue here, even though I haven’tseen a single elected representative take a pro-breast cancer position.Still, voters demand that they do something about it. There seems tobe no obvious environmental culprit to pin it on except the opposingcandidate.
Throughout this gloomy period, the autodialer worked faithfully, risingearly in the morning to place my worthless bets. On October 29, for what-ever reason, my bets were not logged. Needless to say, those bets wouldhave won $120. Maven was playing head games with me, and all I coulddo was watch my account diminish.
Your account balance is $497.50.
Your account balance is $440.50.
Your account balance is $408.40.
On November 1, as it did at the beginning of each month, the programrecalculated its statistical models of player skills. This provided an intel-lectually honest reason to hope that the $351 hit that I took in Octoberwould be exorcized.
On the morning of November 4, Maven tried to make a $72 investmentthat the autodialer didn’t seem to approve of. It was still early enough to
178
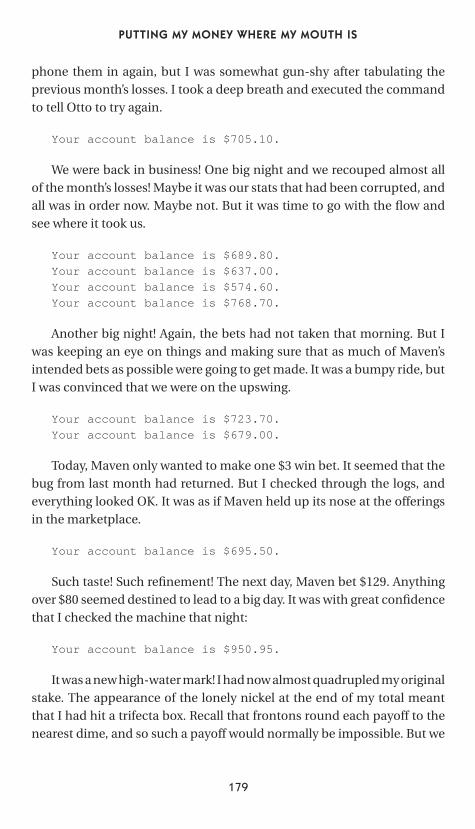
P1: FCH/FYX P2: FXS
CB386-08 CB386-Skiena June 8, 2001 17:33 Char Count= 0
PUTTING MY MONEY WHERE MY MOUTH IS
phone them in again, but I was somewhat gun-shy after tabulating theprevious month’s losses. I took a deep breath and executed the commandto tell Otto to try again.
Your account balance is $705.10.
We were back in business! One big night and we recouped almost allof the month’s losses! Maybe it was our stats that had been corrupted, andall was in order now. Maybe not. But it was time to go with the flow andsee where it took us.
Your account balance is $689.80.
Your account balance is $637.00.
Your account balance is $574.60.
Your account balance is $768.70.
Another big night! Again, the bets had not taken that morning. But Iwas keeping an eye on things and making sure that as much of Maven’sintended bets as possible were going to get made. It was a bumpy ride, butI was convinced that we were on the upswing.
Your account balance is $723.70.
Your account balance is $679.00.
Today, Maven only wanted to make one $3 win bet. It seemed that thebug from last month had returned. But I checked through the logs, andeverything looked OK. It was as if Maven held up its nose at the offeringsin the marketplace.
Your account balance is $695.50.
Such taste! Such refinement! The next day, Maven bet $129. Anythingover $80 seemed destined to lead to a big day. It was with great confidencethat I checked the machine that night:
Your account balance is $950.95.
It was a new high-water mark! I had now almost quadrupled my originalstake. The appearance of the lonely nickel at the end of my total meantthat I had hit a trifecta box. Recall that frontons round each payoff to thenearest dime, and so such a payoff would normally be impossible. But we
179
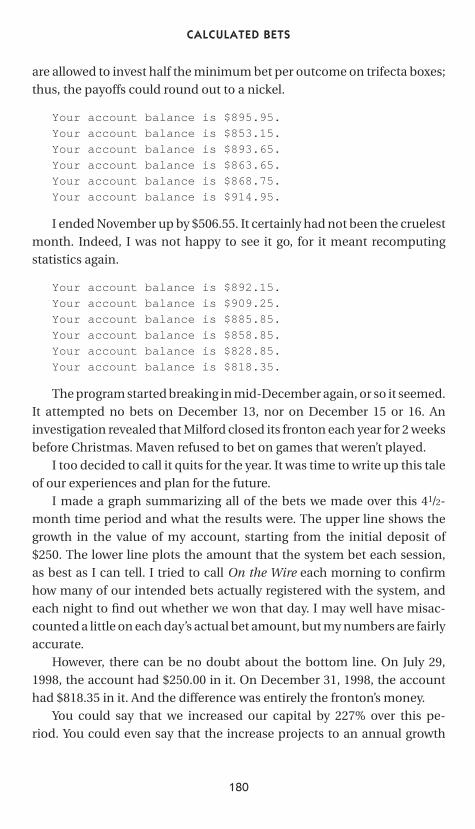
P1: FCH/FYX P2: FXS
CB386-08 CB386-Skiena June 8, 2001 17:33 Char Count= 0
CALCULATED BETS
are allowed to invest half the minimum bet per outcome on trifecta boxes;thus, the payoffs could round out to a nickel.
Your account balance is $895.95.
Your account balance is $853.15.
Your account balance is $893.65.
Your account balance is $863.65.
Your account balance is $868.75.
Your account balance is $914.95.
I ended November up by $506.55. It certainly had not been the cruelestmonth. Indeed, I was not happy to see it go, for it meant recomputingstatistics again.
Your account balance is $892.15.
Your account balance is $909.25.
Your account balance is $885.85.
Your account balance is $858.85.
Your account balance is $828.85.
Your account balance is $818.35.
The program started breaking in mid-December again, or so it seemed.It attempted no bets on December 13, nor on December 15 or 16. Aninvestigation revealed that Milford closed its fronton each year for 2 weeksbefore Christmas. Maven refused to bet on games that weren’t played.
I too decided to call it quits for the year. It was time to write up this taleof our experiences and plan for the future.
I made a graph summarizing all of the bets we made over this 41/2-month time period and what the results were. The upper line shows thegrowth in the value of my account, starting from the initial deposit of$250. The lower line plots the amount that the system bet each session,as best as I can tell. I tried to call On the Wire each morning to confirmhow many of our intended bets actually registered with the system, andeach night to find out whether we won that day. I may well have misac-counted a little on each day’s actual bet amount, but my numbers are fairlyaccurate.
However, there can be no doubt about the bottom line. On July 29,1998, the account had $250.00 in it. On December 31, 1998, the accounthad $818.35 in it. And the difference was entirely the fronton’s money.
You could say that we increased our capital by 227% over this pe-riod. You could even say that the increase projects to an annual growth
180
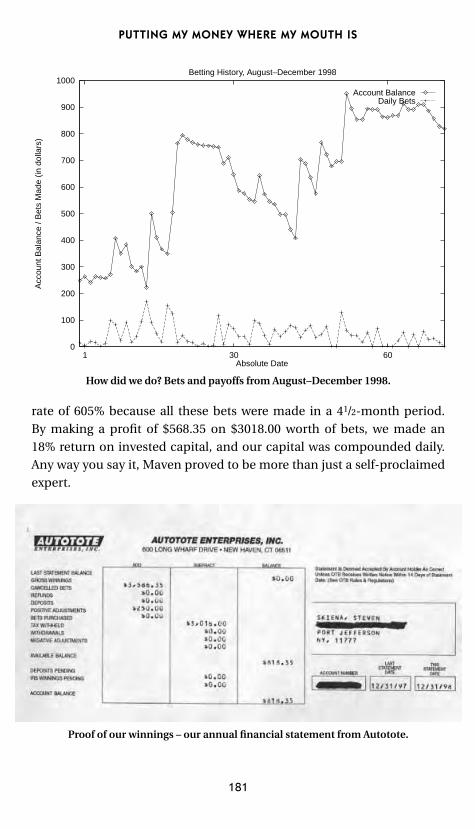
P1: FCH/FYX P2: FXS
CB386-08 CB386-Skiena June 8, 2001 17:33 Char Count= 0
PUTTING MY MONEY WHERE MY MOUTH IS
0
100
200
300
400
500
600
700
800
900
1000
1 30 60
Acc
ount
Bal
ance
/ B
ets
Mad
e (in
dol
lars
)
Absolute Date
Betting History, August–December 1998
Account BalanceDaily Bets
How did we do? Bets and payoffs from August–December 1998.
rate of 605% because all these bets were made in a 41/2-month period.By making a profit of $568.35 on $3018.00 worth of bets, we made an18% return on invested capital, and our capital was compounded daily.Any way you say it, Maven proved to be more than just a self-proclaimedexpert.
Proof of our winnings – our annual financial statement from Autotote.
181
P1: FCH/FYX P2: FXS
CB386-08 CB386-Skiena June 8, 2001 17:33 Char Count= 0
CALCULATED BETS
EpilogueOur initial experiments demonstrated that, with jai alai at least, we knowwhat we are doing. We clearly predict the outcome of jai alai matches betterthan the general public and well enough to make small but nontrivialamounts of money.
So, what would be next for Maven? In order to make much more moneyoff the deal, we had to greatly increase the volume of profitable bets.But we didn’t dare bet on Dania for fear of certain insidious parser bugs.And we didn’t dare bet on Miami or Newport for fear of the InternetGambling Act. We didn’t even dare bet too much on Milford games,because relatively few games had bets that showed a clear positive re-turn. Finally, even when we were brave enough to go for it, Otto the Auto-dialer often disagreed and did not phone in all the bets. We had muchwork to do if were were to increase our number of transactions signifi-cantly.
Roger came back to work on Maven in the spring of 1999, his lastsemester at Stony Brook before starting Ph.D. studies in computer scienceat the University of Massachusetts. We beat on the system, improving it,making it stronger.
I continued letting the original Maven run while we worked on itssuccessor. I throttled back the number of bets it made so that I didn’t haveto pay much attention to it on a daily basis. Also, in case of disaster I wantedto preserve capital for an improved version to play with.
Your account balance is $818.35.
Your account balance is $940.30.
Your account balance is $1037.80.
Your account balance is $793.60.
Your account balance is $865.45.
But we had to finish our changes in a rush, with the semester endingbefore we could complete a real validation phase or as much robustnesstesting as we would have liked to.
Now Roger was finished with the project. At this point, the accountcontained $865.45. It was now or never for Maven because the robustnessof the program would only deteriorate with time. I gave the new programphone privileges and hoped for the best. The first day, it liked 11 trifectaboxes, but they didn’t like us back:
182
P1: FCH/FYX P2: FXS
CB386-08 CB386-Skiena June 8, 2001 17:33 Char Count= 0
PUTTING MY MONEY WHERE MY MOUTH IS
Your account balance is $766.45.
Your account balance is $712.45.
Your account balance is $1072.60.
Now that was more like it! A new record high!
Your account balance is $1051.60.
Your account balance is $952.60.
To complicate matters, Renee and I were set to spend the entire monthof June 1999 visiting the Polytechnic University (UPC) in Barcelona, Spain.It is hard to imagine a more wonderful place to be than Barcelona, which isperhaps the most graceful and civilized city on earth. But the distance andtime difference made it difficult to keep up with what Maven was doing.My last phone call before we boarded the plane was to On the Wire.
Your account balance is $1105.30.
Ole! Maven had hit a new high total again.Shortly after my arrival, I gave the first public lecture on our jai alai
prediction system at the university. The Spaniards were somewhat baffledby my interest in this regional game of theirs (imagine a European scholarwriting a treatise on the Pro Bowlers Tour) but were scholars and sportsmenenough to get the drift.
Reading my mail from Barcelona proved difficult. Through the magicof a program called telnet, I could sit at a computer in Spain and havecomplete access to my desktop computer in Stony Brook. Thus, I couldread e-mail. But there were network delays on the order of seconds sendingbits around the world even when network traffic was light. And as soon asthe rest of Spain got to work in the morning, forget about it. It would havebeen more efficient to hop on a plane and read it from my office.
But the news that arrived was very good. It was clear that Maven waswinning. It seemed that every other day for the second week of June, it hitanother box. The reported winnings were clearly several hundred dollars.I broke down and checked my balance with On the Wire :
Your account balance is $1009.30.
Huh? Where was my money? I could tell that the calls had been placedby the autodialer, but it seems On the Wire decided this wasn’t the week tolisten – at least to my winning bets.
183
P1: FCH/FYX P2: FXS
CB386-08 CB386-Skiena June 8, 2001 17:33 Char Count= 0
CALCULATED BETS
Renee and I took advantage of our location and visited the Basqueregion in Spain, watching remonte action and gazing at the spectacularscenery. Maven stayed on a roll that third week of June. Again, my e-mailshowed me winning. And again, On the Wire said.
Your account balance is $1009.30.
It was impossible to debug the phone calls by long distance. The fourthweek of June Maven kept picking winners. But I knew what kind of balanceI had waiting for me when I got back.
Your account balance is $1009.30.
After I returned, it became clear why none of our bets were taking.Autotote had changed its hours, refusing to accept bets until 10 A.M. somy 7:30 A.M. phone calls hadn’t taken. With Gene keeping summer hours,however, there was no real barrier to letting Otto call the bets in later. Ireset the timing of the program and crossed my fingers that the results I’dbeen seeing hadn’t been fiction.
Your account balance is $1401.40.
Maven hits two boxes!
Your account balance is $1430.35.
Maven hits another little box. The program was winning just as it hadbeen that month in Spain.
Your account balance is $1385.35.
Your account balance is $1367.35.
Maven makes $117 in bets – a record for the new version.
Your account balance is $1630.60.
Maven hits a 1–4–8 box!
Your account balance is $1567.60.
Your account balance is $1513.60.
Maven bets $126 – another new version record.
Your account balance is $1796.80.
184
P1: FCH/FYX P2: FXS
CB386-08 CB386-Skiena June 8, 2001 17:33 Char Count= 0
PUTTING MY MONEY WHERE MY MOUTH IS
Hits 1–2–4 and 2–4–6 boxes! Another new high!
Your account balance is $1851.70.
Hits a cheap 1–3–6 box! Yet another new high!Maven had just cleared almost $1000 in only 2 weeks. The program was
making money fast enough that it was threatening to become a revenuesource instead of just a research project. And that presented me with afresh set of problems.
University professors are not supposed to use research computing fa-cilities to run book-making operations. This project was a harmless ec-centricity when it was playing for peanuts. But at this scale money wouldvery quickly become an issue. I made plans to contact the university’s le-gal counsel, which was a step I feared because it is always easier to begforgiveness than get permission. Further, if Maven really started makingmoney, the students who built it certainly deserved a cut of the action. Buthow much?
Maven decided to spare me these problems. Its taste in bets suddenlyregressed to 1–2–4 and 1–2–5 trifectas, losing interest in anything else.Something had broken deep inside the program. Professors often com-plain that student-built software works until the day after graduation.What this really means is that the professors don’t have the skills or thegumption to maintain it. At least this professor didn’t.
Software rot is a sad but real phenomenon. In principle, software lastsforever because it is just a stream of bits, and these bits are easily main-tained on disk with perfect fidelity. Software may be immutable, but therest of the world changes around it. Suddenly a new data format arrivesfrom Milford, or the operating system of our host computer is upgraded.Software rot is why people must eventually junk Windows 95 – not that ithas changed but because the rest of the world has decayed around it.
Maven’s betting run was over. With a heavy heart and slightly lighterbank roll, I unplugged Maven from On the Wire. Each night, the pro-gram continues to scan the net for details of the next day’s jai alai action.It continues to play each game half a million times before dawn. It con-tinues to identify the best bets and mail me the results. But the bets havebecome as virtual as the simulated games themselves.
I write this book almost one year after our last wager. I wrote a checkfor the amount of my winnings and sent it to a charity associated withthe university, to purge my soul and cover my butt. Indeed, a plaque on
185

P1: FCH/FYX P2: FXS
CB386-08 CB386-Skiena June 8, 2001 17:33 Char Count= 0
CALCULATED BETS
display at the Stony Brook Hillel acknowledges the generous support ofthe “Jai-Alai Maven.”
Maven still sends me e-mail every morning, and of late it seems oursimulated bets have been winning somewhat more steadily than before.Maybe the difficulties we had encountered were due simply to a corrupteddata file. If so, after a year it will slip from the Maven’s consciousness andprofitability will be restored.
Retelling this tale has whet my appetite for another round of jai alaiaction. If the university lets me, maybe the time has come to bring anotherstudent on board to wrestle with the program anew and bring Maven backon line. Check http://www.jai-tech.com for the latest on how we are doing.
Hail the Maven evermore!
186
P1: GKA
CB386-09 CB386-Skiena June 9, 2001 14:17 Char Count= 0
CHAPTER NINE
HOW SHOULD YOU BET?
The system described in this book retrieves and analyzes data each nightand employs a substantial amount of computational sophistication to de-termine the most profitable bets to make. It isn’t something you are goingto try at home, kiddies.
However, in this section I’ll provide some hints on how you can makeyour trip to the fronton as profitable as possible. By combing the results ofour Monte Carlo simulations and expected payoff model, I’ve constructedtables giving the expected payoff for each bet, under the assumption thatall players are equally skillful. This is very useful information to have if youare not equipped to make your own judgments as to who is the best player,although we also provide tips as to how to assess player skills. By followingmy advice, you will avoid criminally stupid bets like the 6–8–7 trifecta.
But first a word of caution is in order. There are three primary types ofgamblers:
■ (A) Those who gamble to make money – If you are in this category, youare likely a sick individual and need help. My recommendation insteadwould be that you take your money and invest in a good mutual fund.In particular, the Vanguard Primecap fund has done right well for meover the past few years.
187
P1: GKA
CB386-09 CB386-Skiena June 9, 2001 14:17 Char Count= 0
CALCULATED BETS
One theme running through this book is how hard we had to workin order to make even a small profit. As the saying goes, “gambling is ahard way to make easy money.” You can’t expect to make a lot of moneywithout considerably more insight and effort than we expended, andthere are far more profitable places to devote this effort to than a track,casino, or fronton.
■ (B) Those who gamble to lose money – If you are in this category,you are likely a very sick individual and really need help. I recom-mend that you contact Gambler’s Anonymous (1-213-386-8789, orwww.gamblersanonymous.org) immediately and get to work on yourproblem.
My Grandfather was a problem gambler and almost destroyed him-self and his family. Don’t let this happen to you or the ones you love.
■ (C) Those who gamble to have fun – If you are in this category, I pro-nounce you perfectly healthy. Modest amounts of wagering can makeany sporting event (including jai alai) more exciting by turning you intoone of the players.
Having Fun Betting on Jai AlaiDamon Runyon once quoted a bettor as saying “I hope to break even today.I really need the money.” It is more fun to win than to lose, or even to breakeven. The rest of this chapter is intended to show you how to maximize theamount-of-fun-per-dollar-invested ratio when you go to watch jai alai.
To maximize your chances of having fun, I start with the followingrecommendations:
■ Go to the fronton – Jai alai is a fantastic sport to watch. You get to seegreat professional athletes making amazing plays, and there is nothinglike the sound of a pelota clicking off the granite frontcourt. Figuring outthe machinations of the Spectacular Seven scoring system is excellentexercise for the mind. These charms are completely lost when youinvest via off-track betting (OTB) or a phone betting scheme. The kidswill love a day or an evening at the fronton. I greatly recommend theexperience.
■ Buy a Pepe’s Green Card – We always do. To be honest, there is noreason to believe in any of the picks you see there. In fact, a trulysavvy bettor will avoid all of Pepe’s recommendations, not necessar-ily because they are bad but because too many other people will put
188
P1: GKA
CB386-09 CB386-Skiena June 9, 2001 14:17 Char Count= 0
HOW SHOULD YOU BET?
their trust in Pepe. Enough copies of the card are sold that the odds onany suggested bet will likely be seriously depressed and unable to payoff big even if Pepe is right.
■ Always make the minimum bet – The betting pools in jai alai are smallenough that they get saturated by making the minimum bet. Bettingmore than the minimum likely means that you are betting against your-self. Certainly anyone making more than the minimum bet on anytrifecta ought to have his or her head examined.
If you find it much more exciting to have $6 riding on a matchthan $3, then you might fall into problem gambler categories (A) or (B)above. But if you are determined to invest more than the minimum, youshould bet on two separate outcomes. First, you increase the chancethat you will have a winner or at least be close. Second, such a tacticis justified by the laws of probability. The expected value E(A + B) oftwo random variables A and B satisfies the formula
E(A + B) = E (A) + E (B)
regardless of whether the random variables are independent. Thismeans that whenever you can find two bets, both of which (you per-ceive) have an expectation of a positive return, the sum of the twobets will also have an expectation of positive return. Thus, don’t botherworrying whether your 4–1–2 trifecta contradicts your 5–7 quiniela.If both of these bets are individually good, then they are good incombination.
■ Bet quinielas to maximize your action – In my humble opinion (IMHO),quiniela bets offer the most entertainment value for your dollar. Underthe Spectacular Seven scoring system, the quiniela offers you enoughpossible ways to win that you are likely to be able to identify at least onerelatively promising victory scenario in almost every match. Further,the payoff is such that if you win once you pay for the evening andmaybe even dinner afterwards.
■ Bet show to maximize your chances of cashing a ticket – If you wantto maximize your chances of sauntering up to the cashier and gettingmoney back, bet on 2 to show. You have a 49% chance of making aninsignificant amount of money, but at least it means that you won’t bea total loser for the night.
■ Check your tickets carefully before discarding them – Make sure yourtickets are official losers before throwing any of them away. Because
189
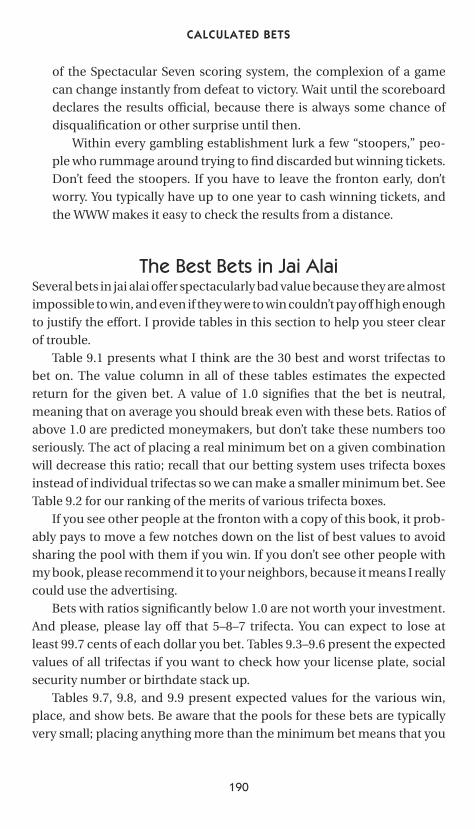
P1: GKA
CB386-09 CB386-Skiena June 9, 2001 14:17 Char Count= 0
CALCULATED BETS
of the Spectacular Seven scoring system, the complexion of a gamecan change instantly from defeat to victory. Wait until the scoreboarddeclares the results official, because there is always some chance ofdisqualification or other surprise until then.
Within every gambling establishment lurk a few “stoopers,” peo-ple who rummage around trying to find discarded but winning tickets.Don’t feed the stoopers. If you have to leave the fronton early, don’tworry. You typically have up to one year to cash winning tickets, andthe WWW makes it easy to check the results from a distance.
The Best Bets in Jai AlaiSeveral bets in jai alai offer spectacularly bad value because they are almostimpossible to win, and even if they were to win couldn’t pay off high enoughto justify the effort. I provide tables in this section to help you steer clearof trouble.
Table 9.1 presents what I think are the 30 best and worst trifectas tobet on. The value column in all of these tables estimates the expectedreturn for the given bet. A value of 1.0 signifies that the bet is neutral,meaning that on average you should break even with these bets. Ratios ofabove 1.0 are predicted moneymakers, but don’t take these numbers tooseriously. The act of placing a real minimum bet on a given combinationwill decrease this ratio; recall that our betting system uses trifecta boxesinstead of individual trifectas so we can make a smaller minimum bet. SeeTable 9.2 for our ranking of the merits of various trifecta boxes.
If you see other people at the fronton with a copy of this book, it prob-ably pays to move a few notches down on the list of best values to avoidsharing the pool with them if you win. If you don’t see other people withmy book, please recommend it to your neighbors, because it means I reallycould use the advertising.
Bets with ratios significantly below 1.0 are not worth your investment.And please, please lay off that 5–8–7 trifecta. You can expect to lose atleast 99.7 cents of each dollar you bet. Tables 9.3–9.6 present the expectedvalues of all trifectas if you want to check how your license plate, socialsecurity number or birthdate stack up.
Tables 9.7, 9.8, and 9.9 present expected values for the various win,place, and show bets. Be aware that the pools for these bets are typicallyvery small; placing anything more than the minimum bet means that you
190
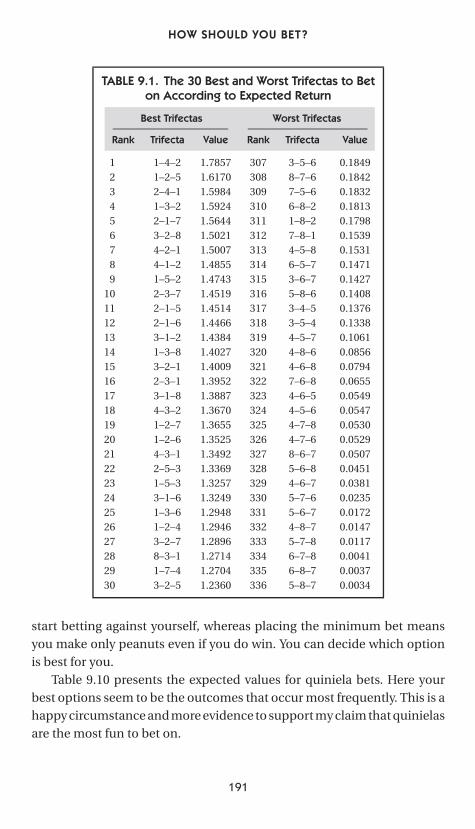
P1: GKA
CB386-09 CB386-Skiena June 9, 2001 14:17 Char Count= 0
HOW SHOULD YOU BET?
TABLE 9.1. The 30 Best and Worst Trifectas to Beton According to Expected Return
Best Trifectas Worst Trifectas
Rank Trifecta Value Rank Trifecta Value
1 1–4–2 1.7857 307 3–5–6 0.18492 1–2–5 1.6170 308 8–7–6 0.18423 2–4–1 1.5984 309 7–5–6 0.18324 1–3–2 1.5924 310 6–8–2 0.18135 2–1–7 1.5644 311 1–8–2 0.17986 3–2–8 1.5021 312 7–8–1 0.15397 4–2–1 1.5007 313 4–5–8 0.15318 4–1–2 1.4855 314 6–5–7 0.14719 1–5–2 1.4743 315 3–6–7 0.1427
10 2–3–7 1.4519 316 5–8–6 0.140811 2–1–5 1.4514 317 3–4–5 0.137612 2–1–6 1.4466 318 3–5–4 0.133813 3–1–2 1.4384 319 4–5–7 0.106114 1–3–8 1.4027 320 4–8–6 0.085615 3–2–1 1.4009 321 4–6–8 0.079416 2–3–1 1.3952 322 7–6–8 0.065517 3–1–8 1.3887 323 4–6–5 0.054918 4–3–2 1.3670 324 4–5–6 0.054719 1–2–7 1.3655 325 4–7–8 0.053020 1–2–6 1.3525 326 4–7–6 0.052921 4–3–1 1.3492 327 8–6–7 0.050722 2–5–3 1.3369 328 5–6–8 0.045123 1–5–3 1.3257 329 4–6–7 0.038124 3–1–6 1.3249 330 5–7–6 0.023525 1–3–6 1.2948 331 5–6–7 0.017226 1–2–4 1.2946 332 4–8–7 0.014727 3–2–7 1.2896 333 5–7–8 0.011728 8–3–1 1.2714 334 6–7–8 0.004129 1–7–4 1.2704 335 6–8–7 0.003730 3–2–5 1.2360 336 5–8–7 0.0034
start betting against yourself, whereas placing the minimum bet meansyou make only peanuts even if you do win. You can decide which optionis best for you.
Table 9.10 presents the expected values for quiniela bets. Here yourbest options seem to be the outcomes that occur most frequently. This is ahappy circumstance and more evidence to support my claim that quinielasare the most fun to bet on.
191
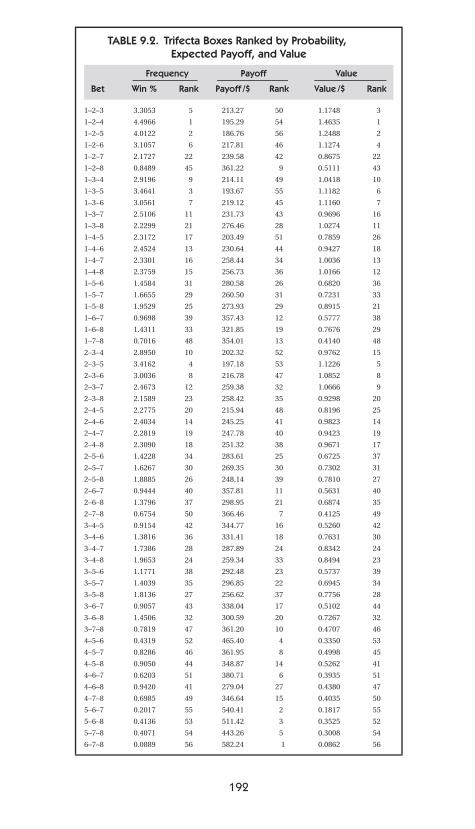
P1: GKA
CB386-09 CB386-Skiena June 9, 2001 14:17 Char Count= 0
TABLE 9.2. Trifecta Boxes Ranked by Probability,Expected Payoff, and Value
Frequency Payoff Value
Bet Win % Rank Payoff /$ Rank Value /$ Rank
1–2–3 3.3053 5 213.27 50 1.1748 3
1–2–4 4.4966 1 195.29 54 1.4635 1
1–2–5 4.0122 2 186.76 56 1.2488 2
1–2–6 3.1057 6 217.81 46 1.1274 4
1–2–7 2.1727 22 239.58 42 0.8675 22
1–2–8 0.8489 45 361.22 9 0.5111 43
1–3–4 2.9196 9 214.11 49 1.0418 10
1–3–5 3.4641 3 193.67 55 1.1182 6
1–3–6 3.0561 7 219.12 45 1.1160 7
1–3–7 2.5106 11 231.73 43 0.9696 16
1–3–8 2.2299 21 276.46 28 1.0274 11
1–4–5 2.3172 17 203.49 51 0.7859 26
1–4–6 2.4524 13 230.64 44 0.9427 18
1–4–7 2.3301 16 258.44 34 1.0036 13
1–4–8 2.3759 15 256.73 36 1.0166 12
1–5–6 1.4584 31 280.58 26 0.6820 36
1–5–7 1.6655 29 260.50 31 0.7231 33
1–5–8 1.9529 25 273.93 29 0.8915 21
1–6–7 0.9698 39 357.43 12 0.5777 38
1–6–8 1.4311 33 321.85 19 0.7676 29
1–7–8 0.7016 48 354.01 13 0.4140 48
2–3–4 2.8950 10 202.32 52 0.9762 15
2–3–5 3.4162 4 197.18 53 1.1226 5
2–3–6 3.0036 8 216.78 47 1.0852 8
2–3–7 2.4673 12 259.38 32 1.0666 9
2–3–8 2.1589 23 258.42 35 0.9298 20
2–4–5 2.2775 20 215.94 48 0.8196 25
2–4–6 2.4034 14 245.25 41 0.9823 14
2–4–7 2.2819 19 247.78 40 0.9423 19
2–4–8 2.3090 18 251.32 38 0.9671 17
2–5–6 1.4228 34 283.61 25 0.6725 37
2–5–7 1.6267 30 269.35 30 0.7302 31
2–5–8 1.8885 26 248.14 39 0.7810 27
2–6–7 0.9444 40 357.81 11 0.5631 40
2–6–8 1.3796 37 298.95 21 0.6874 35
2–7–8 0.6754 50 366.46 7 0.4125 49
3–4–5 0.9154 42 344.77 16 0.5260 42
3–4–6 1.3816 36 331.41 18 0.7631 30
3–4–7 1.7386 28 287.89 24 0.8342 24
3–4–8 1.9653 24 259.34 33 0.8494 23
3–5–6 1.1771 38 292.48 23 0.5737 39
3–5–7 1.4039 35 296.85 22 0.6945 34
3–5–8 1.8136 27 256.62 37 0.7756 28
3–6–7 0.9057 43 338.04 17 0.5102 44
3–6–8 1.4506 32 300.59 20 0.7267 32
3–7–8 0.7819 47 361.20 10 0.4707 46
4–5–6 0.4319 52 465.40 4 0.3350 53
4–5–7 0.8286 46 361.95 8 0.4998 45
4–5–8 0.9050 44 348.87 14 0.5262 41
4–6–7 0.6203 51 380.71 6 0.3935 51
4–6–8 0.9420 41 279.04 27 0.4380 47
4–7–8 0.6985 49 346.64 15 0.4035 50
5–6–7 0.2017 55 540.41 2 0.1817 55
5–6–8 0.4136 53 511.42 3 0.3525 52
5–7–8 0.4071 54 443.26 5 0.3008 54
6–7–8 0.0889 56 582.24 1 0.0862 56
192
P1: GKA
CB386-09 CB386-Skiena June 9, 2001 14:17 Char Count= 0
TABLE 9.3. Trifecta Bets (1/2 to win) Ranked by Probability,Expected Payoff, and Value
Frequency Payoff Value
Bet Win % Rank Payoff /$ Rank Value /$ Rank
1–2–3 0.206% 188 278.63 188 0.575 2291–2–4 0.567% 45 228.23 240 1.295 261–2–5 0.792% 8 204.14 290 1.617 21–2–6 0.790% 10 171.20 326 1.353 201–2–7 0.708% 18 192.83 310 1.365 191–2–8 0.282% 159 359.30 134 1.014 881–3–2 0.810% 7 196.54 304 1.592 41–3–4 0.112% 255 530.90 35 0.594 2211–3–5 0.355% 126 259.88 202 0.922 1201–3–6 0.495% 70 261.70 198 1.295 251–3–7 0.566% 48 198.03 302 1.121 571–3–8 0.567% 46 247.38 216 1.403 141–4–2 0.919% 1 194.31 306 1.786 11–4–3 0.334% 133 323.04 157 1.079 701–4–5 0.078% 280 405.58 101 0.317 2941–4–6 0.200% 193 376.50 123 0.752 1751–4–7 0.344% 131 282.62 186 0.973 981–4–8 0.387% 110 260.01 201 1.006 901–5–2 0.818% 5 180.25 317 1.474 91–5–3 0.660% 24 200.88 299 1.326 231–5–4 0.252% 170 367.23 129 0.924 1191–5–6 0.087% 269 599.28 20 0.520 2491–5–7 0.183% 206 358.65 135 0.657 2041–5–8 0.274% 160 304.58 172 0.835 1521–6–2 0.541% 58 227.92 243 1.233 311–6–3 0.606% 37 201.07 298 1.218 351–6–4 0.434% 88 219.32 264 0.953 1071–6–5 0.149% 220 460.44 75 0.687 1941–6–7 0.074% 283 502.43 44 0.372 2771–6–8 0.113% 254 430.31 92 0.485 2571–7–2 0.264% 164 283.67 182 0.749 1761–7–3 0.538% 59 194.27 307 1.046 791–7–4 0.574% 43 221.50 255 1.270 291–7–5 0.384% 111 233.94 231 0.898 1281–7–6 0.130% 235 398.32 107 0.518 2501–7–8 0.056% 296 582.27 27 0.328 2911–8–2 0.055% 298 325.75 155 0.180 3111–8–3 0.375% 117 244.39 218 0.915 1241–8–4 0.504% 67 222.07 253 1.118 581–8–5 0.455% 83 227.95 242 1.037 821–8–6 0.312% 142 372.65 125 1.163 471–8–7 0.061% 290 530.23 36 0.323 292
(continued)
193
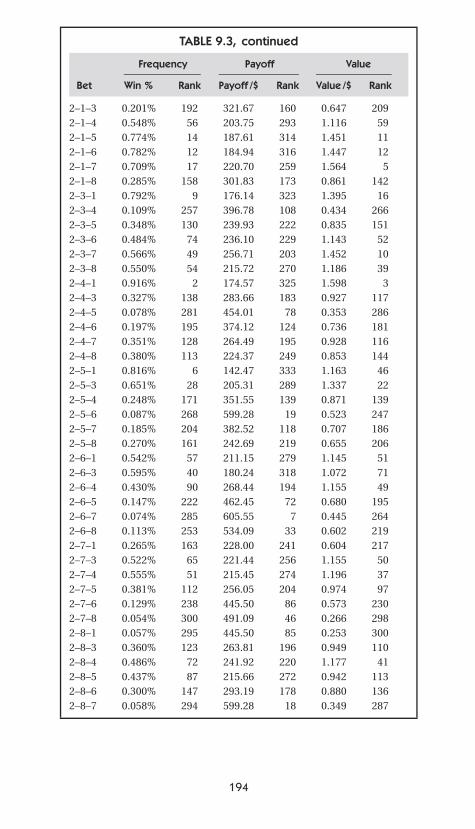
P1: GKA
CB386-09 CB386-Skiena June 9, 2001 14:17 Char Count= 0
TABLE 9.3, continued
Frequency Payoff Value
Bet Win % Rank Payoff /$ Rank Value /$ Rank
2–1–3 0.201% 192 321.67 160 0.647 2092–1–4 0.548% 56 203.75 293 1.116 592–1–5 0.774% 14 187.61 314 1.451 112–1–6 0.782% 12 184.94 316 1.447 122–1–7 0.709% 17 220.70 259 1.564 52–1–8 0.285% 158 301.83 173 0.861 1422–3–1 0.792% 9 176.14 323 1.395 162–3–4 0.109% 257 396.78 108 0.434 2662–3–5 0.348% 130 239.93 222 0.835 1512–3–6 0.484% 74 236.10 229 1.143 522–3–7 0.566% 49 256.71 203 1.452 102–3–8 0.550% 54 215.72 270 1.186 392–4–1 0.916% 2 174.57 325 1.598 32–4–3 0.327% 138 283.66 183 0.927 1172–4–5 0.078% 281 454.01 78 0.353 2862–4–6 0.197% 195 374.12 124 0.736 1812–4–7 0.351% 128 264.49 195 0.928 1162–4–8 0.380% 113 224.37 249 0.853 1442–5–1 0.816% 6 142.47 333 1.163 462–5–3 0.651% 28 205.31 289 1.337 222–5–4 0.248% 171 351.55 139 0.871 1392–5–6 0.087% 268 599.28 19 0.523 2472–5–7 0.185% 204 382.52 118 0.707 1862–5–8 0.270% 161 242.69 219 0.655 2062–6–1 0.542% 57 211.15 279 1.145 512–6–3 0.595% 40 180.24 318 1.072 712–6–4 0.430% 90 268.44 194 1.155 492–6–5 0.147% 222 462.45 72 0.680 1952–6–7 0.074% 285 605.55 7 0.445 2642–6–8 0.113% 253 534.09 33 0.602 2192–7–1 0.265% 163 228.00 241 0.604 2172–7–3 0.522% 65 221.44 256 1.155 502–7–4 0.555% 51 215.45 274 1.196 372–7–5 0.381% 112 256.05 204 0.974 972–7–6 0.129% 238 445.50 86 0.573 2302–7–8 0.054% 300 491.09 46 0.266 2982–8–1 0.057% 295 445.50 85 0.253 3002–8–3 0.360% 123 263.81 196 0.949 1102–8–4 0.486% 72 241.92 220 1.177 412–8–5 0.437% 87 215.66 272 0.942 1132–8–6 0.300% 147 293.19 178 0.880 1362–8–7 0.058% 294 599.28 18 0.349 287
194
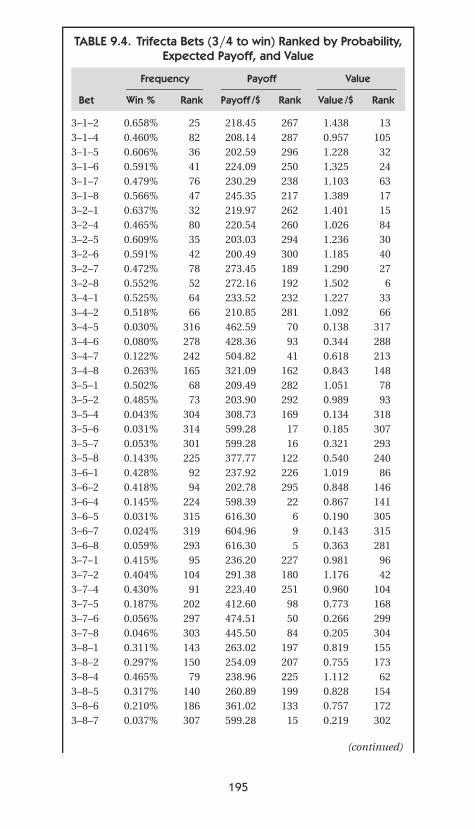
P1: GKA
CB386-09 CB386-Skiena June 9, 2001 14:17 Char Count= 0
TABLE 9.4. Trifecta Bets (3/4 to win) Ranked by Probability,Expected Payoff, and Value
Frequency Payoff Value
Bet Win % Rank Payoff /$ Rank Value /$ Rank
3–1–2 0.658% 25 218.45 267 1.438 133–1–4 0.460% 82 208.14 287 0.957 1053–1–5 0.606% 36 202.59 296 1.228 323–1–6 0.591% 41 224.09 250 1.325 243–1–7 0.479% 76 230.29 238 1.103 633–1–8 0.566% 47 245.35 217 1.389 173–2–1 0.637% 32 219.97 262 1.401 153–2–4 0.465% 80 220.54 260 1.026 843–2–5 0.609% 35 203.03 294 1.236 303–2–6 0.591% 42 200.49 300 1.185 403–2–7 0.472% 78 273.45 189 1.290 273–2–8 0.552% 52 272.16 192 1.502 63–4–1 0.525% 64 233.52 232 1.227 333–4–2 0.518% 66 210.85 281 1.092 663–4–5 0.030% 316 462.59 70 0.138 3173–4–6 0.080% 278 428.36 93 0.344 2883–4–7 0.122% 242 504.82 41 0.618 2133–4–8 0.263% 165 321.09 162 0.843 1483–5–1 0.502% 68 209.49 282 1.051 783–5–2 0.485% 73 203.90 292 0.989 933–5–4 0.043% 304 308.73 169 0.134 3183–5–6 0.031% 314 599.28 17 0.185 3073–5–7 0.053% 301 599.28 16 0.321 2933–5–8 0.143% 225 377.77 122 0.540 2403–6–1 0.428% 92 237.92 226 1.019 863–6–2 0.418% 94 202.78 295 0.848 1463–6–4 0.145% 224 598.39 22 0.867 1413–6–5 0.031% 315 616.30 6 0.190 3053–6–7 0.024% 319 604.96 9 0.143 3153–6–8 0.059% 293 616.30 5 0.363 2813–7–1 0.415% 95 236.20 227 0.981 963–7–2 0.404% 104 291.38 180 1.176 423–7–4 0.430% 91 223.40 251 0.960 1043–7–5 0.187% 202 412.60 98 0.773 1683–7–6 0.056% 297 474.51 50 0.266 2993–7–8 0.046% 303 445.50 84 0.205 3043–8–1 0.311% 143 263.02 197 0.819 1553–8–2 0.297% 150 254.09 207 0.755 1733–8–4 0.465% 79 238.96 225 1.112 623–8–5 0.317% 140 260.89 199 0.828 1543–8–6 0.210% 186 361.02 133 0.757 1723–8–7 0.037% 307 599.28 15 0.219 302
(continued)
195
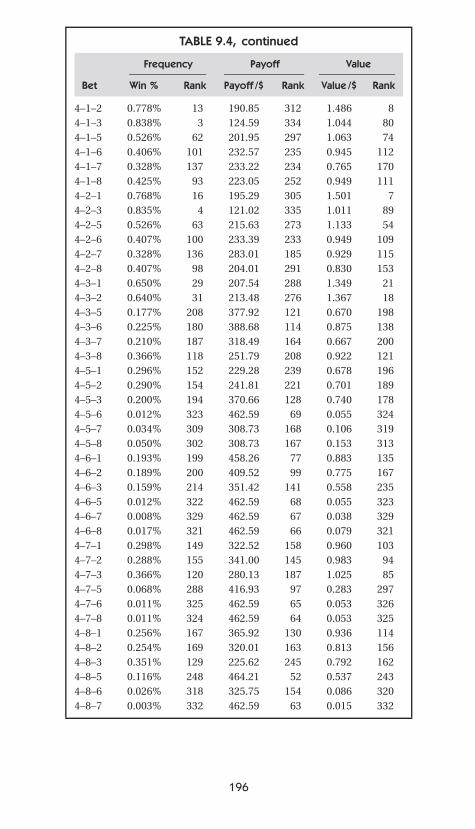
P1: GKA
CB386-09 CB386-Skiena June 9, 2001 14:17 Char Count= 0
TABLE 9.4, continued
Frequency Payoff Value
Bet Win % Rank Payoff /$ Rank Value /$ Rank
4–1–2 0.778% 13 190.85 312 1.486 84–1–3 0.838% 3 124.59 334 1.044 804–1–5 0.526% 62 201.95 297 1.063 744–1–6 0.406% 101 232.57 235 0.945 1124–1–7 0.328% 137 233.22 234 0.765 1704–1–8 0.425% 93 223.05 252 0.949 1114–2–1 0.768% 16 195.29 305 1.501 74–2–3 0.835% 4 121.02 335 1.011 894–2–5 0.526% 63 215.63 273 1.133 544–2–6 0.407% 100 233.39 233 0.949 1094–2–7 0.328% 136 283.01 185 0.929 1154–2–8 0.407% 98 204.01 291 0.830 1534–3–1 0.650% 29 207.54 288 1.349 214–3–2 0.640% 31 213.48 276 1.367 184–3–5 0.177% 208 377.92 121 0.670 1984–3–6 0.225% 180 388.68 114 0.875 1384–3–7 0.210% 187 318.49 164 0.667 2004–3–8 0.366% 118 251.79 208 0.922 1214–5–1 0.296% 152 229.28 239 0.678 1964–5–2 0.290% 154 241.81 221 0.701 1894–5–3 0.200% 194 370.66 128 0.740 1784–5–6 0.012% 323 462.59 69 0.055 3244–5–7 0.034% 309 308.73 168 0.106 3194–5–8 0.050% 302 308.73 167 0.153 3134–6–1 0.193% 199 458.26 77 0.883 1354–6–2 0.189% 200 409.52 99 0.775 1674–6–3 0.159% 214 351.42 141 0.558 2354–6–5 0.012% 322 462.59 68 0.055 3234–6–7 0.008% 329 462.59 67 0.038 3294–6–8 0.017% 321 462.59 66 0.079 3214–7–1 0.298% 149 322.52 158 0.960 1034–7–2 0.288% 155 341.00 145 0.983 944–7–3 0.366% 120 280.13 187 1.025 854–7–5 0.068% 288 416.93 97 0.283 2974–7–6 0.011% 325 462.59 65 0.053 3264–7–8 0.011% 324 462.59 64 0.053 3254–8–1 0.256% 167 365.92 130 0.936 1144–8–2 0.254% 169 320.01 163 0.813 1564–8–3 0.351% 129 225.62 245 0.792 1624–8–5 0.116% 248 464.21 52 0.537 2434–8–6 0.026% 318 325.75 154 0.086 3204–8–7 0.003% 332 462.59 63 0.015 332
196
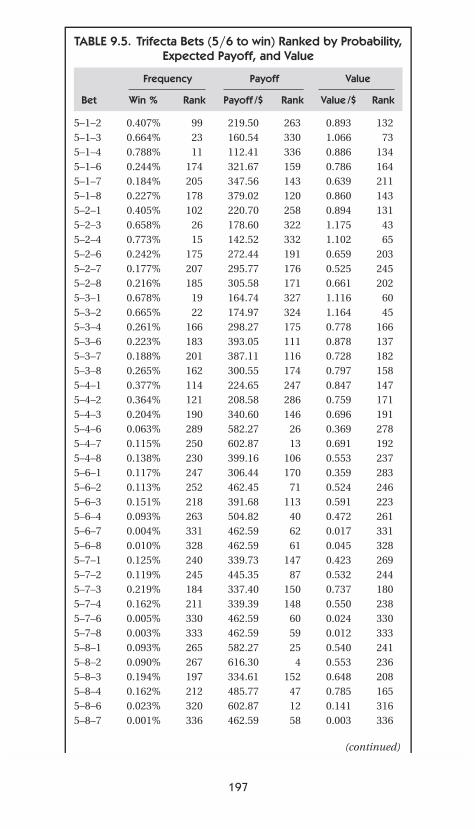
P1: GKA
CB386-09 CB386-Skiena June 9, 2001 14:17 Char Count= 0
TABLE 9.5. Trifecta Bets (5/6 to win) Ranked by Probability,Expected Payoff, and Value
Frequency Payoff Value
Bet Win % Rank Payoff /$ Rank Value /$ Rank
5–1–2 0.407% 99 219.50 263 0.893 1325–1–3 0.664% 23 160.54 330 1.066 735–1–4 0.788% 11 112.41 336 0.886 1345–1–6 0.244% 174 321.67 159 0.786 1645–1–7 0.184% 205 347.56 143 0.639 2115–1–8 0.227% 178 379.02 120 0.860 1435–2–1 0.405% 102 220.70 258 0.894 1315–2–3 0.658% 26 178.60 322 1.175 435–2–4 0.773% 15 142.52 332 1.102 655–2–6 0.242% 175 272.44 191 0.659 2035–2–7 0.177% 207 295.77 176 0.525 2455–2–8 0.216% 185 305.58 171 0.661 2025–3–1 0.678% 19 164.74 327 1.116 605–3–2 0.665% 22 174.97 324 1.164 455–3–4 0.261% 166 298.27 175 0.778 1665–3–6 0.223% 183 393.05 111 0.878 1375–3–7 0.188% 201 387.11 116 0.728 1825–3–8 0.265% 162 300.55 174 0.797 1585–4–1 0.377% 114 224.65 247 0.847 1475–4–2 0.364% 121 208.58 286 0.759 1715–4–3 0.204% 190 340.60 146 0.696 1915–4–6 0.063% 289 582.27 26 0.369 2785–4–7 0.115% 250 602.87 13 0.691 1925–4–8 0.138% 230 399.16 106 0.553 2375–6–1 0.117% 247 306.44 170 0.359 2835–6–2 0.113% 252 462.45 71 0.524 2465–6–3 0.151% 218 391.68 113 0.591 2235–6–4 0.093% 263 504.82 40 0.472 2615–6–7 0.004% 331 462.59 62 0.017 3315–6–8 0.010% 328 462.59 61 0.045 3285–7–1 0.125% 240 339.73 147 0.423 2695–7–2 0.119% 245 445.35 87 0.532 2445–7–3 0.219% 184 337.40 150 0.737 1805–7–4 0.162% 211 339.39 148 0.550 2385–7–6 0.005% 330 462.59 60 0.024 3305–7–8 0.003% 333 462.59 59 0.012 3335–8–1 0.093% 265 582.27 25 0.540 2415–8–2 0.090% 267 616.30 4 0.553 2365–8–3 0.194% 197 334.61 152 0.648 2085–8–4 0.162% 212 485.77 47 0.785 1655–8–6 0.023% 320 602.87 12 0.141 3165–8–7 0.001% 336 462.59 58 0.003 336
(continued)
197
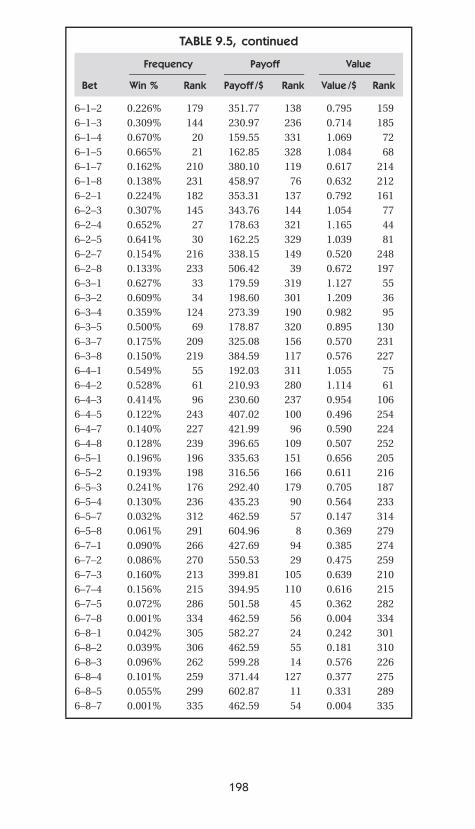
P1: GKA
CB386-09 CB386-Skiena June 9, 2001 14:17 Char Count= 0
TABLE 9.5, continued
Frequency Payoff Value
Bet Win % Rank Payoff /$ Rank Value /$ Rank
6–1–2 0.226% 179 351.77 138 0.795 1596–1–3 0.309% 144 230.97 236 0.714 1856–1–4 0.670% 20 159.55 331 1.069 726–1–5 0.665% 21 162.85 328 1.084 686–1–7 0.162% 210 380.10 119 0.617 2146–1–8 0.138% 231 458.97 76 0.632 2126–2–1 0.224% 182 353.31 137 0.792 1616–2–3 0.307% 145 343.76 144 1.054 776–2–4 0.652% 27 178.63 321 1.165 446–2–5 0.641% 30 162.25 329 1.039 816–2–7 0.154% 216 338.15 149 0.520 2486–2–8 0.133% 233 506.42 39 0.672 1976–3–1 0.627% 33 179.59 319 1.127 556–3–2 0.609% 34 198.60 301 1.209 366–3–4 0.359% 124 273.39 190 0.982 956–3–5 0.500% 69 178.87 320 0.895 1306–3–7 0.175% 209 325.08 156 0.570 2316–3–8 0.150% 219 384.59 117 0.576 2276–4–1 0.549% 55 192.03 311 1.055 756–4–2 0.528% 61 210.93 280 1.114 616–4–3 0.414% 96 230.60 237 0.954 1066–4–5 0.122% 243 407.02 100 0.496 2546–4–7 0.140% 227 421.99 96 0.590 2246–4–8 0.128% 239 396.65 109 0.507 2526–5–1 0.196% 196 335.63 151 0.656 2056–5–2 0.193% 198 316.56 166 0.611 2166–5–3 0.241% 176 292.40 179 0.705 1876–5–4 0.130% 236 435.23 90 0.564 2336–5–7 0.032% 312 462.59 57 0.147 3146–5–8 0.061% 291 604.96 8 0.369 2796–7–1 0.090% 266 427.69 94 0.385 2746–7–2 0.086% 270 550.53 29 0.475 2596–7–3 0.160% 213 399.81 105 0.639 2106–7–4 0.156% 215 394.95 110 0.616 2156–7–5 0.072% 286 501.58 45 0.362 2826–7–8 0.001% 334 462.59 56 0.004 3346–8–1 0.042% 305 582.27 24 0.242 3016–8–2 0.039% 306 462.59 55 0.181 3106–8–3 0.096% 262 599.28 14 0.576 2266–8–4 0.101% 259 371.44 127 0.377 2756–8–5 0.055% 299 602.87 11 0.331 2896–8–7 0.001% 335 462.59 54 0.004 335
198
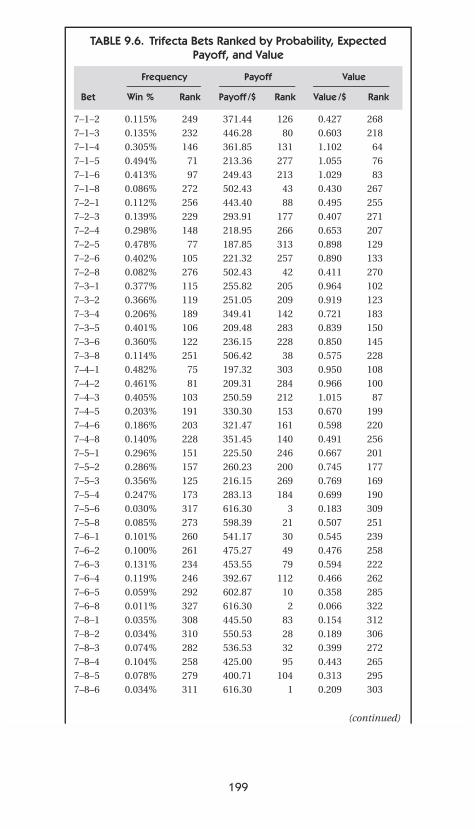
P1: GKA
CB386-09 CB386-Skiena June 9, 2001 14:17 Char Count= 0
TABLE 9.6. Trifecta Bets Ranked by Probability, ExpectedPayoff, and Value
Frequency Payoff Value
Bet Win % Rank Payoff /$ Rank Value /$ Rank
7–1–2 0.115% 249 371.44 126 0.427 2687–1–3 0.135% 232 446.28 80 0.603 2187–1–4 0.305% 146 361.85 131 1.102 647–1–5 0.494% 71 213.36 277 1.055 767–1–6 0.413% 97 249.43 213 1.029 837–1–8 0.086% 272 502.43 43 0.430 2677–2–1 0.112% 256 443.40 88 0.495 2557–2–3 0.139% 229 293.91 177 0.407 2717–2–4 0.298% 148 218.95 266 0.653 2077–2–5 0.478% 77 187.85 313 0.898 1297–2–6 0.402% 105 221.32 257 0.890 1337–2–8 0.082% 276 502.43 42 0.411 2707–3–1 0.377% 115 255.82 205 0.964 1027–3–2 0.366% 119 251.05 209 0.919 1237–3–4 0.206% 189 349.41 142 0.721 1837–3–5 0.401% 106 209.48 283 0.839 1507–3–6 0.360% 122 236.15 228 0.850 1457–3–8 0.114% 251 506.42 38 0.575 2287–4–1 0.482% 75 197.32 303 0.950 1087–4–2 0.461% 81 209.31 284 0.966 1007–4–3 0.405% 103 250.59 212 1.015 877–4–5 0.203% 191 330.30 153 0.670 1997–4–6 0.186% 203 321.47 161 0.598 2207–4–8 0.140% 228 351.45 140 0.491 2567–5–1 0.296% 151 225.50 246 0.667 2017–5–2 0.286% 157 260.23 200 0.745 1777–5–3 0.356% 125 216.15 269 0.769 1697–5–4 0.247% 173 283.13 184 0.699 1907–5–6 0.030% 317 616.30 3 0.183 3097–5–8 0.085% 273 598.39 21 0.507 2517–6–1 0.101% 260 541.17 30 0.545 2397–6–2 0.100% 261 475.27 49 0.476 2587–6–3 0.131% 234 453.55 79 0.594 2227–6–4 0.119% 246 392.67 112 0.466 2627–6–5 0.059% 292 602.87 10 0.358 2857–6–8 0.011% 327 616.30 2 0.066 3227–8–1 0.035% 308 445.50 83 0.154 3127–8–2 0.034% 310 550.53 28 0.189 3067–8–3 0.074% 282 536.53 32 0.399 2727–8–4 0.104% 258 425.00 95 0.443 2657–8–5 0.078% 279 400.71 104 0.313 2957–8–6 0.034% 311 616.30 1 0.209 303
(continued)
199
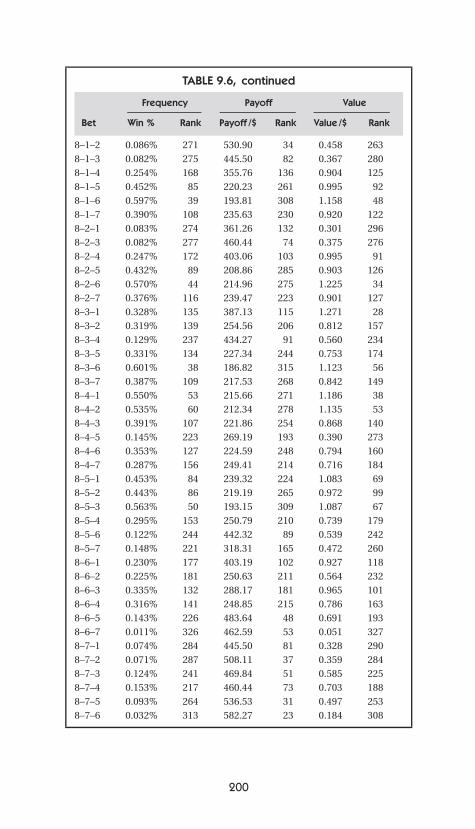
P1: GKA
CB386-09 CB386-Skiena June 9, 2001 14:17 Char Count= 0
TABLE 9.6, continued
Frequency Payoff Value
Bet Win % Rank Payoff /$ Rank Value /$ Rank
8–1–2 0.086% 271 530.90 34 0.458 2638–1–3 0.082% 275 445.50 82 0.367 2808–1–4 0.254% 168 355.76 136 0.904 1258–1–5 0.452% 85 220.23 261 0.995 928–1–6 0.597% 39 193.81 308 1.158 488–1–7 0.390% 108 235.63 230 0.920 1228–2–1 0.083% 274 361.26 132 0.301 2968–2–3 0.082% 277 460.44 74 0.375 2768–2–4 0.247% 172 403.06 103 0.995 918–2–5 0.432% 89 208.86 285 0.903 1268–2–6 0.570% 44 214.96 275 1.225 348–2–7 0.376% 116 239.47 223 0.901 1278–3–1 0.328% 135 387.13 115 1.271 288–3–2 0.319% 139 254.56 206 0.812 1578–3–4 0.129% 237 434.27 91 0.560 2348–3–5 0.331% 134 227.34 244 0.753 1748–3–6 0.601% 38 186.82 315 1.123 568–3–7 0.387% 109 217.53 268 0.842 1498–4–1 0.550% 53 215.66 271 1.186 388–4–2 0.535% 60 212.34 278 1.135 538–4–3 0.391% 107 221.86 254 0.868 1408–4–5 0.145% 223 269.19 193 0.390 2738–4–6 0.353% 127 224.59 248 0.794 1608–4–7 0.287% 156 249.41 214 0.716 1848–5–1 0.453% 84 239.32 224 1.083 698–5–2 0.443% 86 219.19 265 0.972 998–5–3 0.563% 50 193.15 309 1.087 678–5–4 0.295% 153 250.79 210 0.739 1798–5–6 0.122% 244 442.32 89 0.539 2428–5–7 0.148% 221 318.31 165 0.472 2608–6–1 0.230% 177 403.19 102 0.927 1188–6–2 0.225% 181 250.63 211 0.564 2328–6–3 0.335% 132 288.17 181 0.965 1018–6–4 0.316% 141 248.85 215 0.786 1638–6–5 0.143% 226 483.64 48 0.691 1938–6–7 0.011% 326 462.59 53 0.051 3278–7–1 0.074% 284 445.50 81 0.328 2908–7–2 0.071% 287 508.11 37 0.359 2848–7–3 0.124% 241 469.84 51 0.585 2258–7–4 0.153% 217 460.44 73 0.703 1888–7–5 0.093% 264 536.53 31 0.497 2538–7–6 0.032% 313 582.27 23 0.184 308
200
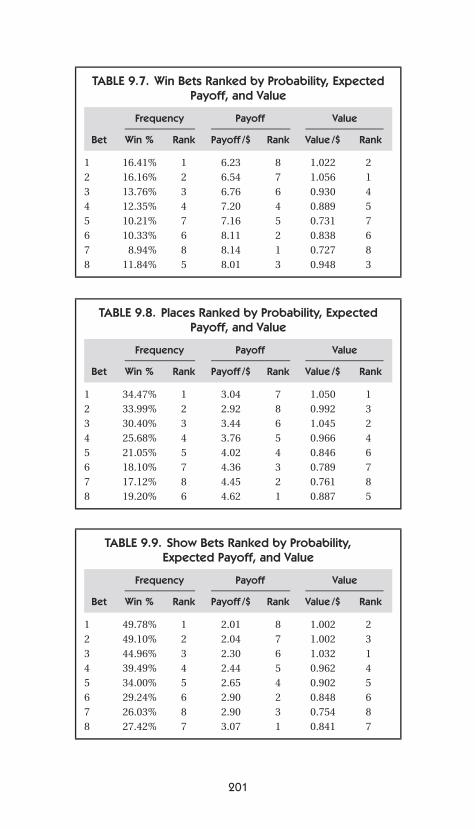
P1: GKA
CB386-09 CB386-Skiena June 9, 2001 14:17 Char Count= 0
TABLE 9.7. Win Bets Ranked by Probability, ExpectedPayoff, and Value
Frequency Payoff Value
Bet Win % Rank Payoff /$ Rank Value /$ Rank
1 16.41% 1 6.23 8 1.022 22 16.16% 2 6.54 7 1.056 13 13.76% 3 6.76 6 0.930 44 12.35% 4 7.20 4 0.889 55 10.21% 7 7.16 5 0.731 76 10.33% 6 8.11 2 0.838 67 8.94% 8 8.14 1 0.727 88 11.84% 5 8.01 3 0.948 3
TABLE 9.8. Places Ranked by Probability, ExpectedPayoff, and Value
Frequency Payoff Value
Bet Win % Rank Payoff /$ Rank Value /$ Rank
1 34.47% 1 3.04 7 1.050 12 33.99% 2 2.92 8 0.992 33 30.40% 3 3.44 6 1.045 24 25.68% 4 3.76 5 0.966 45 21.05% 5 4.02 4 0.846 66 18.10% 7 4.36 3 0.789 77 17.12% 8 4.45 2 0.761 88 19.20% 6 4.62 1 0.887 5
TABLE 9.9. Show Bets Ranked by Probability,Expected Payoff, and Value
Frequency Payoff Value
Bet Win % Rank Payoff /$ Rank Value /$ Rank
1 49.78% 1 2.01 8 1.002 22 49.10% 2 2.04 7 1.002 33 44.96% 3 2.30 6 1.032 14 39.49% 4 2.44 5 0.962 45 34.00% 5 2.65 4 0.902 56 29.24% 6 2.90 2 0.848 67 26.03% 8 2.90 3 0.754 88 27.42% 7 3.07 1 0.841 7
201
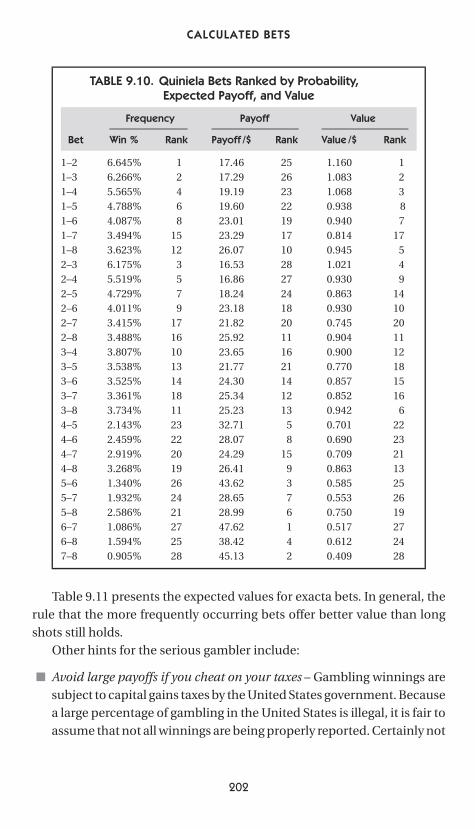
P1: GKA
CB386-09 CB386-Skiena June 9, 2001 14:17 Char Count= 0
CALCULATED BETS
TABLE 9.10. Quiniela Bets Ranked by Probability,Expected Payoff, and Value
Frequency Payoff Value
Bet Win % Rank Payoff /$ Rank Value /$ Rank
1–2 6.645% 1 17.46 25 1.160 11–3 6.266% 2 17.29 26 1.083 21–4 5.565% 4 19.19 23 1.068 31–5 4.788% 6 19.60 22 0.938 81–6 4.087% 8 23.01 19 0.940 71–7 3.494% 15 23.29 17 0.814 171–8 3.623% 12 26.07 10 0.945 52–3 6.175% 3 16.53 28 1.021 42–4 5.519% 5 16.86 27 0.930 92–5 4.729% 7 18.24 24 0.863 142–6 4.011% 9 23.18 18 0.930 102–7 3.415% 17 21.82 20 0.745 202–8 3.488% 16 25.92 11 0.904 113–4 3.807% 10 23.65 16 0.900 123–5 3.538% 13 21.77 21 0.770 183–6 3.525% 14 24.30 14 0.857 153–7 3.361% 18 25.34 12 0.852 163–8 3.734% 11 25.23 13 0.942 64–5 2.143% 23 32.71 5 0.701 224–6 2.459% 22 28.07 8 0.690 234–7 2.919% 20 24.29 15 0.709 214–8 3.268% 19 26.41 9 0.863 135–6 1.340% 26 43.62 3 0.585 255–7 1.932% 24 28.65 7 0.553 265–8 2.586% 21 28.99 6 0.750 196–7 1.086% 27 47.62 1 0.517 276–8 1.594% 25 38.42 4 0.612 247–8 0.905% 28 45.13 2 0.409 28
Table 9.11 presents the expected values for exacta bets. In general, therule that the more frequently occurring bets offer better value than longshots still holds.
Other hints for the serious gambler include:
■ Avoid large payoffs if you cheat on your taxes – Gambling winnings aresubject to capital gains taxes by the United States government. Becausea large percentage of gambling in the United States is illegal, it is fair toassume that not all winnings are being properly reported. Certainly not
202
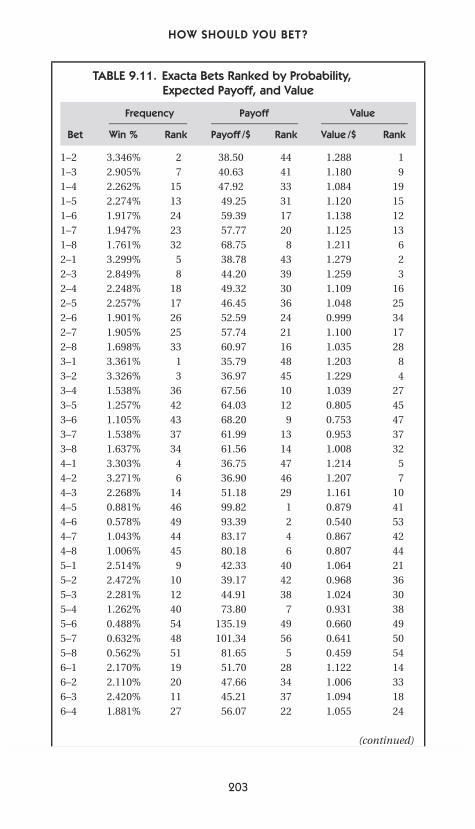
P1: GKA
CB386-09 CB386-Skiena June 9, 2001 14:17 Char Count= 0
HOW SHOULD YOU BET?
TABLE 9.11. Exacta Bets Ranked by Probability,Expected Payoff, and Value
Frequency Payoff Value
Bet Win % Rank Payoff /$ Rank Value /$ Rank
1–2 3.346% 2 38.50 44 1.288 11–3 2.905% 7 40.63 41 1.180 91–4 2.262% 15 47.92 33 1.084 191–5 2.274% 13 49.25 31 1.120 151–6 1.917% 24 59.39 17 1.138 121–7 1.947% 23 57.77 20 1.125 131–8 1.761% 32 68.75 8 1.211 62–1 3.299% 5 38.78 43 1.279 22–3 2.849% 8 44.20 39 1.259 32–4 2.248% 18 49.32 30 1.109 162–5 2.257% 17 46.45 36 1.048 252–6 1.901% 26 52.59 24 0.999 342–7 1.905% 25 57.74 21 1.100 172–8 1.698% 33 60.97 16 1.035 283–1 3.361% 1 35.79 48 1.203 83–2 3.326% 3 36.97 45 1.229 43–4 1.538% 36 67.56 10 1.039 273–5 1.257% 42 64.03 12 0.805 453–6 1.105% 43 68.20 9 0.753 473–7 1.538% 37 61.99 13 0.953 373–8 1.637% 34 61.56 14 1.008 324–1 3.303% 4 36.75 47 1.214 54–2 3.271% 6 36.90 46 1.207 74–3 2.268% 14 51.18 29 1.161 104–5 0.881% 46 99.82 1 0.879 414–6 0.578% 49 93.39 2 0.540 534–7 1.043% 44 83.17 4 0.867 424–8 1.006% 45 80.18 6 0.807 445–1 2.514% 9 42.33 40 1.064 215–2 2.472% 10 39.17 42 0.968 365–3 2.281% 12 44.91 38 1.024 305–4 1.262% 40 73.80 7 0.931 385–6 0.488% 54 135.19 49 0.660 495–7 0.632% 48 101.34 56 0.641 505–8 0.562% 51 81.65 5 0.459 546–1 2.170% 19 51.70 28 1.122 146–2 2.110% 20 47.66 34 1.006 336–3 2.420% 11 45.21 37 1.094 186–4 1.881% 27 56.07 22 1.055 24
(continued)
203
P1: GKA
CB386-09 CB386-Skiena June 9, 2001 14:17 Char Count= 0
CALCULATED BETS
TABLE 9.11, continued
Frequency Payoff Value
Bet Win % Rank Payoff /$ Rank Value /$ Rank
6–5 0.852% 47 105.23 55 0.896 406–7 0.565% 50 111.05 54 0.628 516–8 0.334% 56 111.21 53 0.372 567–1 1.547% 35 58.15 19 0.900 397–2 1.510% 38 52.43 25 0.792 467–3 1.823% 30 55.59 23 1.013 317–4 1.877% 28 51.92 26 0.974 357–5 1.299% 39 65.73 11 0.854 437–6 0.520% 53 116.66 52 0.607 527–8 0.360% 55 126.70 51 0.455 558–1 1.862% 29 61.45 15 1.144 118–2 1.790% 31 59.30 18 1.062 238–3 2.096% 21 49.10 32 1.029 298–4 2.262% 16 47.10 35 1.065 208–5 2.024% 22 51.78 27 1.048 268–6 1.259% 41 84.41 3 1.063 228–7 0.546% 52 130.75 50 0.714 48
all legal gambling winnings are properly reported. In response to thisproblem, the IRS withholds taxes from all sufficiently profitable bets,meaning those that pay off at greater than 300–to–1 odds or return atotal of at least $1000.
This withholding system represents a compromise between thelegal requirements of performing withholding and the difficulty inproviding a 1099 form for every single bet. A bettor who wins a signi-ficant amount of money on many little bets (like me) will not triggerwithholding, which might be deemed unfair, but I feel that the sys-tem is quite reasonable.1 Bottom line – if you are religiously opposedto paying taxes, avoid trifectas and other exotic bets that might riseabove this threshold. On the other hand, I am unaware of any reli-gion that prohibits taxes but encourages pari-mutuel wagering, so giveUncle Sam his due.
If you do win a sufficiently large payoff to be subject to withholding,be sure to save all of your betting tickets, especially the losers. You candeduct your gambling losses from your winnings. Of course, you must
1 I am proud to report that I have paid taxes on all of Maven’s winnings.
204
P1: GKA
CB386-09 CB386-Skiena June 9, 2001 14:17 Char Count= 0
HOW SHOULD YOU BET?
have winnings to defray it; you can’t use losses at the fronton to reduceyour taxable income.
■ Employ smart money management – Money management is consi-dered to be a key to successful gambling as it is in any financial venture.If you are putting nontrivial amounts of money at risk, do so for soundreasons, not hunches.
Rating the PlayersBetting the players, instead of just post positions, can make for a moreprofitable and entertaining evening. The single best measure of playerskill is probably the in-the-money percentage. Any player or team that hasa 0.400 win–place–show average is a good player and quite possibly worthan investment. Only 8 of the 48 players on Milford’s 1998 roster achievedthis level of performance.
I have prepared a pair of charts to make it easier for you to evaluatethe performance of a given player or team. First, I provide a scatter plot ofall the regular players (more than 400 games) at Milford in 1998 and 1999.Each player is represented by his game-win and in-the-money averages.These two ratios are typically provided in each night’s program. If not, theycan be easily computed by dividing their number of wins (or the numberof wins + places + shows) by the number of games played.
Using this plot, you can eyeball how your player or team stacks up toother players. Suppose that Mediocre won 12.5% of his games and was inthe money 38% of the time. That performance puts him in the middle ofthe cloud of players, suggesting that he is of average skill. Suppose thatMagnifico won 14% of his games and finished in the money 41% of thetime. This point is to the upper right of the cloud, showing that he is a verysuccessful pelotari.
I also provide contour lines to make it easier to compare the perfor-mance of two players or teams. Which is better, Julio, who won 12% of hisgames and finished in the money 40% of the time, or Iglacias, who won18% of the time but didn’t place or show as much and so paid off only34% of the time? Contour lines link performances our program thinks areequivalent.
Thus, to identify the more successful player, find which of the linesthe two players are closest to and pick the player with the higher line. Forexample, Julio’s performance puts him on the fourth line from the top,
205
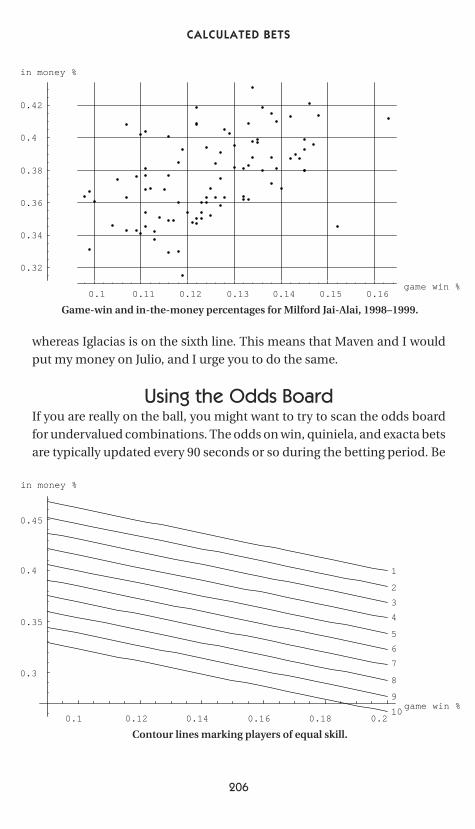
P1: GKA
CB386-09 CB386-Skiena June 9, 2001 14:17 Char Count= 0
CALCULATED BETS
0.1 0.11 0.12 0.13 0.14 0.15 0.16game win %
0.32
0.34
0.36
0.38
0.4
0.42
in money %
Game-win and in-the-money percentages for Milford Jai-Alai, 1998–1999.
whereas Iglacias is on the sixth line. This means that Maven and I wouldput my money on Julio, and I urge you to do the same.
Using the Odds BoardIf you are really on the ball, you might want to try to scan the odds boardfor undervalued combinations. The odds on win, quiniela, and exacta betsare typically updated every 90 seconds or so during the betting period. Be
0.1 0.12 0.14 0.16 0.18 0.2
game win %
0.3
0.35
0.4
0.45
in money %
1
2
3
4
5
6
7
8
9
10
Contour lines marking players of equal skill.
206
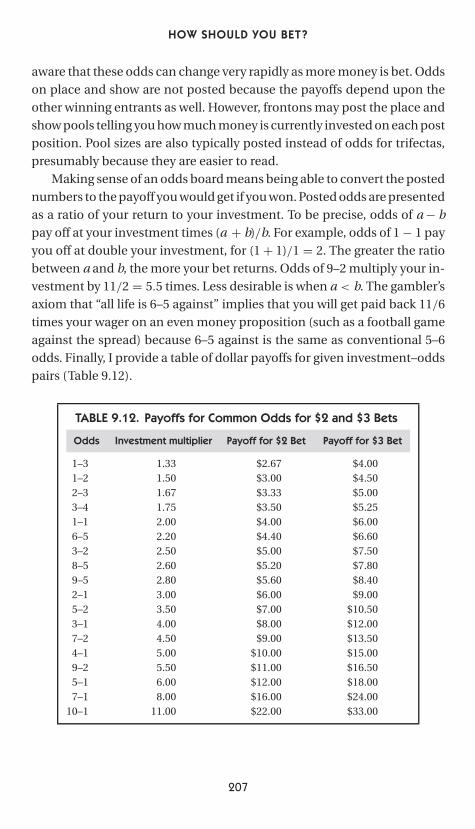
P1: GKA
CB386-09 CB386-Skiena June 9, 2001 14:17 Char Count= 0
HOW SHOULD YOU BET?
aware that these odds can change very rapidly as more money is bet. Oddson place and show are not posted because the payoffs depend upon theother winning entrants as well. However, frontons may post the place andshow pools telling you how much money is currently invested on each postposition. Pool sizes are also typically posted instead of odds for trifectas,presumably because they are easier to read.
Making sense of an odds board means being able to convert the postednumbers to the payoff you would get if you won. Posted odds are presentedas a ratio of your return to your investment. To be precise, odds of a − bpay off at your investment times (a + b)/b. For example, odds of 1 − 1 payyou off at double your investment, for (1 + 1)/1 = 2. The greater the ratiobetween a and b, the more your bet returns. Odds of 9–2 multiply your in-vestment by 11/2 = 5.5 times. Less desirable is when a < b. The gambler’saxiom that “all life is 6–5 against” implies that you will get paid back 11/6times your wager on an even money proposition (such as a football gameagainst the spread) because 6–5 against is the same as conventional 5–6odds. Finally, I provide a table of dollar payoffs for given investment–oddspairs (Table 9.12).
TABLE 9.12. Payoffs for Common Odds for $2 and $3 Bets
Odds Investment multiplier Payoff for $2 Bet Payoff for $3 Bet
1–3 1.33 $2.67 $4.001–2 1.50 $3.00 $4.502–3 1.67 $3.33 $5.003–4 1.75 $3.50 $5.251–1 2.00 $4.00 $6.006–5 2.20 $4.40 $6.603–2 2.50 $5.00 $7.508–5 2.60 $5.20 $7.809–5 2.80 $5.60 $8.402–1 3.00 $6.00 $9.005–2 3.50 $7.00 $10.503–1 4.00 $8.00 $12.007–2 4.50 $9.00 $13.504–1 5.00 $10.00 $15.009–2 5.50 $11.00 $16.505–1 6.00 $12.00 $18.007–1 8.00 $16.00 $24.00
10–1 11.00 $22.00 $33.00
207

P1: GKA
CB386-09 CB386-Skiena June 9, 2001 14:17 Char Count= 0
CALCULATED BETS
All this data can easily get overwhelming; consequently, I recommendthat you initially limit your attention to two or three combinations youhave prescreened using other criteria. Then bet on the one that shows thebest current odds. The trick is to bet as late as possible while still getting tothe betting window in time. The art lies in gauging the length of the linesand the speed of the clerks.
Let the buyer beware, and good luck!
208
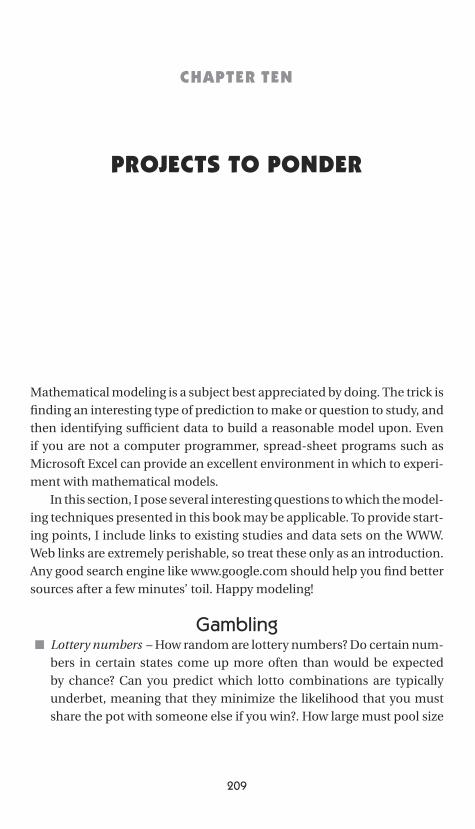
P1: FCH/FYX P2: FCH
CB386-10 CB386-Skiena June 8, 2001 17:37 Char Count= 0
CHAPTER TEN
PROJECTS TO PONDER
Mathematical modeling is a subject best appreciated by doing. The trick isfinding an interesting type of prediction to make or question to study, andthen identifying sufficient data to build a reasonable model upon. Evenif you are not a computer programmer, spread-sheet programs such asMicrosoft Excel can provide an excellent environment in which to experi-ment with mathematical models.
In this section, I pose several interesting questions to which the model-ing techniques presented in this book may be applicable. To provide start-ing points, I include links to existing studies and data sets on the WWW.Web links are extremely perishable, so treat these only as an introduction.Any good search engine like www.google.com should help you find bettersources after a few minutes’ toil. Happy modeling!
Gambling■ Lottery numbers – How random are lottery numbers? Do certain num-
bers in certain states come up more often than would be expectedby chance? Can you predict which lotto combinations are typicallyunderbet, meaning that they minimize the likelihood that you mustshare the pot with someone else if you win?. How large must pool size
209
P1: FCH/FYX P2: FCH
CB386-10 CB386-Skiena June 8, 2001 17:37 Char Count= 0
CALCULATED BETS
grow in a given progressive lottery to yield a positive expected valuefor each ticket bought?
Plenty of lottery records are available on the WWW if you lookhard enough. Log on to http://www.lottonet.com/ for several year’shistorical data from several state lotteries. Minnesota does a particu-larly good job, making its historical numbers available at http://www.lottery.state.mn.us.
■ Horse racing – Many of the ideas employed in our jai alai system aredirectly applicable to horse racing. How can you take a horse’s recordand compute a measure of how fast it will run on a particular trackin the given weather conditions? How will the other bettors price therespective horses in a race? Is there a betting strategy that will offer youpositive returns?
The Daily Racing Form, available at http://racingform.com, hasthe schedules and results for every track in the country. Schedules andresults from New York tracks, including Aqueduct and Belmont Park,are available from http://www.nyra.com/.
■ Blackjack – Write a Monte Carlo simulation of a card-counting strategyin Blackjack. Thorp’s book is the granddaddy of all such schemes, butdozens of other strategies are available in books or on the WWW. Whichone is best? For each strategy, what are the expected winnings per handas a function of the number of decks employed by the casino?
Develop and simulate card-counting strategies for other card gamessuch as gin rummy or poker variations in which cards are publicly dis-carded. What impact does memorizing the discards have on your abilityto predict the odds of getting the card that you want?
■ Bidding strategies on Ebay – Ebay (www.ebay.com) is an Internet phe-nomenon, a giant on-line auction house that lets just about anybodyauction just about anything (it draws the line at organs and other bodyparts). Successful bidding requires considerable strategy. When do youraise a bid, and by how much?
Ebay is an excellent resource to study auction strategies becausethe bidding history is available, giving the name, bid amount, and timefor each bid on every completed auction. How often does making abig presumptive bid knock everyone else out of the game? Does it payto be the first one to make a bid? Are the rules different for expensiveand inexpensive items? How much variance in bids is there, amongdifferent auctions, for exactly the same item?
210
P1: FCH/FYX P2: FCH
CB386-10 CB386-Skiena June 8, 2001 17:37 Char Count= 0
PROJECTS TO PONDER
Sports and Games■ Baseball – Can you define a single ranking function that accurately
assigns value to hitters, pitchers, or both on the basis of their statistics,ranking them from best to worst? Can you predict, on the basis ofstatistics, whether a player will be elected to the Hall of Fame? Can youfind the best batting order for a given team or the ordering of its hittersthat maximizes the expected number of runs the team scores? Howdoes this total compare with the worst possible order?
Batting averages give many children their first inkling of the powerof mathematics. Complete team-by-team baseball statistics canbe found at http://www.baseball-reference.com. Check http://www.usatoday.com/sports/baseball/sbstats.htm for player statistics since1992.
■ Football – Can you write an improved Clyde-like program for predict-ing the outcome of football games? What fraction of the games canyou pick correctly, and how do you do against the spread? Are collegefootball games easier or harder to predict than professional games?
Last season’s NFL statistics are available at http://www.sporting-news.com/nfl/statistics/. The official NFL site is www.nfl.com. Com-plete college football records are harder to find, but http://www.washingtonpost.com/ offers standings for all teams at all levels of play.
■ Basketball – Being a game of individual player matchups and dis-crete shot attempts, basketball lends itself to Monte Carlo simulationin addition to Clyde-type prediction programs. Can you write a goodbasketball simulation?
What about predicting the outcome of the NCAA college basketballtournament, by assigning a probability of who wins each game basedon statistics and rerunning the entire tourney many times?
Last season’s NBA statistics are available at http://www.sporting-news.com/nba/statistics/. The official NBA site is www.nba.com.Complete college basketball records are available from http://www.washingtonpost.com/.
■ Board games – Many interesting board games are controlled by dice,implying that an accurate knowledge of the probabilities of certainevents is essential for optimal play. Monte Carlo simulations can beused to gain insight into these events.
Take Monopoly as an example. Which properties are worth themost? This is a function of how often people land there as well as
211
P1: FCH/FYX P2: FCH
CB386-10 CB386-Skiena June 8, 2001 17:37 Char Count= 0
CALCULATED BETS
what the rents and costs are. Such probabilities can easily be studiedby simulation. The results of one such study appear at http://www.tkcs-collins.com/truman/monopoly/monopoly.shtml
What about the simpler board game of Chutes and Ladders or thecard game War? What is the expected number of rolls or turns you willbe committed to when your 5-year old nephew demands just one moregame?
People Prediction■ Election Prediction – Mathematical models abound in politics. And
the results matter – just ask Al Gore. Incorrect television projectionsbased on partial returns and exit polls may well have cost him the U.S.presidential election in 2000.
Properly interpreting the results of a scientific poll involves seriousstatistical analysis to remove polling biases. For example, telephonepolls will oversample retired and unemployed people because they aremore likely to be there to pick up the phone.
A famous model to predict the outcome of U.S. presidential elec-tions was “As Maine goes, so goes the nation.” This became “As Mainegoes, so goes Vermont” after the 1936 election, when those two NewEngland states accounted for all of Alf Landon’s 8 electoral votes againstFranklin Roosevelt. Developing a more accurate predictor is an inter-esting project. Check out Fair’s economic model http://fairmodel.econ.yale.edu/, which has missed only two presidential elections between1916 and 1992. This site also contains information on economic modelsto predict the stock market and other things.
■ Distribution of first names – First names fall in and out of fashion owingto the strange combination of forces affecting popular culture. Stevenwas the 10th most popular boy’s name in 1961, but we dropped to 47thby 1999. Jacob was the 35th most popular boy’s name in the 1980s, butwas on top by 1999. Can you predict the 10 most popular boy’s andgirl’s first names for next year using previous years statistics? Extensivedata on the popularity of yesteryear’s names are available from the So-cial Security Administration WWW site, at http://www.ssa.gov/OACT/NOTES/note139/note139.html.
■ Distribution of last names – Traditionally, children are given the lastname of the father. Last names can and do become extinct when
212

P1: FCH/FYX P2: FCH
CB386-10 CB386-Skiena June 8, 2001 17:37 Char Count= 0
PROJECTS TO PONDER
families do not produce sufficient numbers of male heirs. The Skienaline in the United States, which started with my grandfather Sol Skienain 1911, has expanded to 19 as of this writing. But our ultimate survivalcannot be guaranteed.
What is the expected number of generations until a last name withn people out of a population of m becomes extinct? How should thenumber of distinct last names in a population decrease as a functionof time? Similar issues arise in biodiversity studies with respect to ani-mal species. What explains the nonuniform popularity of certain lastnames? Is it a phenomenon due largely to chance, or is it due to otherfactors such as immigration?
The U.S. Census Bureau posts the frequencies of the 88,800 mostpopular last names, according to the1990 census, at http://www.census.gov/genealogy/names/. These account for only 90.483% of the popula-tion, and the Skienas are nowhere to be found. From this data, can youestimate how many distinct last names there are in the United States?
Financial Modeling■ Stock market investing – Predicting the stock market is without ques-
tion the most financially rewarding mathematical modeling oppor-tunity. There is no shortage of people who have studied the question,and plenty of people believe that stock prices are a random walkand inherently unpredictable. But that shouldn’t stop you fromhunting for market inefficiencies by evaluating different investmentstrategies.
Although there is a plethora of sites that will tell you today’s clos-ing prices, it is surprisingly difficult to find good historical stock dataon the WWW in a format suitable for downloading. Long-term dailyprice data on selected stocks are available from R & C Research atwww.grainmarketresearch.com. One year’s worth of historical stockmarket data is available from http://biz.swcp.com/stocks/.
■ Economic forecasting – There is much more to modeling the econ-omy than stock prices. How are interest rates tied to the dollar againstforeign currencies? The U.S. Federal Reserve (http://www.federal-reserve.gov/releases/) provides extensive historical economic data, in-cluding well over 10 years of international exchange and interestrates.
213
P1: FCH/FYX P2: FCH
CB386-10 CB386-Skiena June 8, 2001 17:37 Char Count= 0
CALCULATED BETS
Scientific Forecasting■ Weather prediction – Predicting tomorrow’s weather today is one of the
most important and challenging problems in mathematical modeling.Today’s weather prediction codes are extremely sophisticated, so don’texpect to be able to beat the TV weatherman. But it is interesting andhealthy to see how well or badly simple predictors can do, just fromknowing what the weather was like for the past few days.
The National Climatic Data Center (NCDC) of the National Oceanicand Atmospheric Administration (NOAA) http://www.ncdc.noaa.gov/has a variety of weather data sets and makes a good starting point.Historical weather data is available from climates as disparate asLos Angeles (http://www.losangelesalmanac.com/topics/Weather)and Omaha (http://www.crh.noaa.gov/oax).
The Old Farmer’s Almanac boldly makes weather predictions a fullyear in advance and puts them on-line at http://www.almanac.com/.Compare their predictions with current and historical weather data tosee how well they do!
■ Population demographics – What will the population of the world bein 2050? An accurate answer depends largely upon predicting two dif-ferent issues: human life expectancy and human fertility rates.
The U.S. Census Bureau maintains a world population clock projec-tion service at http://www.census.gov/cgi-bin/ipc/popclockw, whichreports that there are exactly 6,083,935,136 potential buyers for thisbook at the moment I am writing this. This site explains their model andpoints to on-line sources of demographic information. The details ofyour model can have huge impacts on the size of your predicted popu-lation. The Census Bureau and the United Nations differed by morethan 3 months as to the date when the human population first crossedthe 6 billion mark. The two counts differed by roughly 18 million peo-ple. Projecting such disparities forward for 50 years can lead to vastlydifferent conclusions.
214
P1: FCH/FYX P2: FCH
CB3886-GLO CB386-Skiena June 8, 2001 17:39 Char Count= 0
GLOSSARY
Basques The ethnic group from the Pyrenees Mountains that invented jaialai.
causal relationship Two events A and B such that event A actually triggersB as opposed to their merely occurring simultaneously.
cesta The reed basket jai alai players use to catch and throw the ball.
computer simulation Replicating the behavior of an aspect of the physicalworld through the execution of a computer program.
correlation Two events A and B that tend to occur in synchrony with eachother and that may or may not imply a causal relationship.
correlation coefficient A measure (from −1 to 1) of the extent to which twoevents tend to occur in synchrony with each other.
curve fitting The art of best matching a standard mathematical shape to agiven numerical data set.
efficiency of markets The extent to which information on prices is fairlydistributed to all potential customers.
expected value The mean or average of a given set of numbers; a measure ofthe most likely value of a sampled function.
fronton A stadium specially constructed to hold jai alai matches.
gambling systems Betting strategies designed (usually unsuccessfully) to en-sure positive returns in a specific game of chance.
215
P1: FCH/FYX P2: FCH
CB3886-GLO CB386-Skiena June 8, 2001 17:39 Char Count= 0
GLOSSARY
jai alai A Basque variation on the sport of handball in which players alternatethrowing and catching a goatskin ball (pelota) with a reed basket (cesta). Itis legal to bet on jai alai in Connecticut, Florida, and Rhode Island.
martingale system A gambling system in which losing wagers are repeatedlydoubled to ensure a positive return, given an infinite bankroll and unre-stricted betting limits. An excellent way to go broke in the absence of suchassumptions.
mathematical model A formula or algorithm to obtain additional insightsfrom observations of the physical world.
Monte Carlo analysis A computer simulation technique using repeated runsand random numbers to model a complex system.
overfitting The danger, inherent to all mathematical models, of simulatingthe training data so faithfully as to model the real world unreliably.
pari-mutuel wagering The method of setting payoffs employed in horse rac-ing and jai alai that dispenses with a central odds maker in favor of dividingthe betting pool among the holders of winning tickets.
parsing The computer science term for interpreting the gross structure of agiven input file; it is necessary for any further processing.
pelota The hard rubber, goatskin-covered ball used in jai alai matches.
Pepe’s Green Card A tout sheet purporting to predict the winners of a givencollection of jai alai matches.
Perl A computer programming language well suited to parsing and otheressential housekeeping tasks.
post positions The order of play for all jai alai players involved in a givenmatch; an order critical to predicting the outcome of a match under theSpectacular Seven scoring system.
probability The branch of mathematics devoted to calculating the likelihoodof events given a well-defined set of assumptions; a number from 0 to 1measuring the likelihood of a given event.
regressionanalysis A mathematical technique for determining the best curve(usually a straight line) matching a given collection of data.
Spectacular Seven The scoring system employed in professional jai alaimatches in the United States that imposes inherent biases on the proba-bility of the possible outcomes.
statistics The branch of mathematics devoted to analyzing the significanceof real-world data, often with an eye towards defining or improving a givenmathematical model.
trifecta The pari-mutuel wager that requires correctly identifying the topthree performers of a given match in the right order of finish.
216

P1: FCH/FYX P2: FCH
CB3886-GLO CB386-Skiena June 8, 2001 17:39 Char Count= 0
GLOSSARY
Worldwide Web A distributed collection of text and data files located on com-puters all over the world that is made accessible through a system of links,indices, and addresses; an amazing resource for most anything you canthink of, including jai alai.
217
P1: FCH/FYX P2: FCH
CB386-FR CB386-Skiena June 8, 2001 17:40 Char Count= 0
FOR FURTHER READING
BOOKS ON JAI ALAI
1. E. Blazy. La Pelote Basque. Librairie Pailloux, Bayonne, France, 1929.2. K. H. Herrington. Jai Alai: The First Inside Look at America ’s Newest Sports
Craze. WICC Books, 1977.3. Z. Hollander and D. Schultz. The Jai Alai Handbook. Pinnacle Books,
Los Angeles, 1978.4. W. R. Keevers. The Gambling Times Guide to Jai Alai. Gambling Times,
Hollywood, 1984.5. M. C. Leal. El Juego de Pelota: The Ball Game. Museo Nacional de Anthro-
pologica, Mexico, 1973.6. D. Lostritto. Jai Alai Wagering to Win: The Complete Book for Jai Alai Wa-
gering. Fair Haven Press, Fair Haven, CT, 1985.7. The President. How to Win at Jai-Alai. President Books, Los Angeles, 1964.8. R. Taylor. Jai Alai. Doubleday, New York, NY, 1987.9. Carmelo Urza, editor. Historia de la Pelota Vasca en Las Americas. University
of Nevada Press, Reno, 1994.
ARTICLES ON JAI ALAI
1. Milford jai-alai – festive building for the merry festival. Architectural Record,163–4:119–124, 1978.
219
P1: FCH/FYX P2: FCH
CB386-FR CB386-Skiena June 8, 2001 17:40 Char Count= 0
FOR FURTHER READING
2. P. Axthelm. The $500,000 sure thing: Pick 6 bet at jai-alai fronton. Newsweek,101, March 21, 1983.
3. A. Balfour. The longest strike in U.S. professional sports history: Jai alai –part I (?). Labor Law Journal, 41:394–409, July 1990.
4. J. Charnes and H. Gitlow. Using control charts to corroborate bribery injai alai. American Statistician, 49:386–389, November 1995.
5. M. J. Goodfriend and J. H. Friedman. Monte Carlo analysis of jai-alai. Pre-sented at the Fall Joint National Meeting of the Operations Research Societyof America and the Institute of Management Science, 1975.
6. B. Grofman and N. Noviello. Jai-alai outcomes as a function of playerposition and skill level. Simulation and Games, 16:211–223, June 1985.
7. L. Moser. A mathematical analysis of the game of jai alai. American Math-ematical Monthly, 89:292–300, 1982.
8. S. Skiena. A fairer scoring system for jai-alai. Interfaces, 18–6:35–41,November/December 1988.
MATHEMATICS, MODELING, AND DATA ANALYSIS
1. F. Brooks. The Mythical Man-Month: Essays on Software Engineering.Addison–Wesley, Reading, MA, 1975.
2. D. E. Knuth. The Art of Computer Programming, Volume 2: SeminumericalAlgorithms. Addison–Wesley, Reading, MA, second edition, 1981.
3. F. Roberts. Discrete Mathematical Models. Prentice–Hall, Englewood Cliffs,NJ, 1976.
4. L. Steen, editor. For All Practical Purposes. W. H. Freeman, New York, NY,1993.
5. E. Tufte. The Visual Display of Quantitative Information. Graphics Press,Cheshire, CT, 1983.
6. S. Wagon. Mathematica in Action. W. H. Freeman, New York, 1991.7. W. Weaver. Lady Luck. Dover Publications, Mineola, NY, 1982.
SPORTS, GAMBLING, AND PREDICTION
1. R. M. Adams. Momentum in the performance of professional pocketbilliards players. International Journal of Sport Psychology, 26:580–587,1996.
2. P. Asch and R. E. Quandt. Racetrack Betting: The Professors’ Guide to Strate-gies. Auburn House Publishing, Dover, MA, 1986.
3. T. Bass. The Eudaemonic Pie. Houghton Mifflin Company, Boston, 1985.4. T. Bass. The Predictors. Henry Holt and Company, New York, 1999.5. M. Drosnin. The Bible Codes. Simon and Schuster, New York, 1997.6. B. Freeman, B. Freeman, and J. McKinley. Wanta Bet? A Study of the
220

P1: FCH/FYX P2: FCH
CB386-FR CB386-Skiena June 8, 2001 17:40 Char Count= 0
FOR FURTHER READING
Pari-Mutuels System in the United States. Freeman Mutuels Management,USA, 1982.
7. D. L. Gilden and S. G. Wilson. Streaks in skilled performance. PsychonomicBulletin and Review, 21:260–265, 1995.
8. T. Gilovich, R. Vallone, and A. Tversky. The hot hand in basketball: On themisperception of random sequences. Cognitive Psychology, 17:295–314,1985.
9. B. James. The Bill James Historical Baseball Abstract. Willard Books,New York, 1988.
10. B. Malkiel. A Random Walk Down Wall Street. W. W. Norton, New York,1999.
11. B. D. McKay, D. Bar-Natan, M. Bar-Hillel, and G. Kalai, Solving theBible code puzzle, Statistical Science, 14:150–173, May 1999. Also:http://cs.anu.edu.au/∼bdm/dilugim/torah.html.
12. E. Thorp. Beat the Dealer: A Winning Strategy for the Game of Twenty-One.Random House, NY, 1966.
221
P1: FCH/FYX P2: FCH/FYX QC: FCH/FXU T1: FCH
CB386-index CB386-Skiena June 12, 2001 9:49 Char Count= 0
INDEX
Absolute dates, 75Academic journals, 62Acoustic coupler, 166–167Actuarial tables, 142Adam and Eve, 14Ad hoc models, 140Algorithms, 49. See also
Mathematical modelsAmateur jai-alai, 20Amazon.com, 78, 144, 171Amplitude, of functions, 97Area, calculation of, 47–48Arimada, 13Artificial intelligence, 73Asymmetry, of court, 25Athletic skills, in jai-alai, 24Auction strategies, 210Authentication protocols, 170–171Autodialing, 167–169Autotote Enterprises, 163–164Average, measure of, 137Aztecs, 9
Babe Ruth, 24Backcourt players, 11, 24Ball (pelota), 8, 216
Basque ball, 7choices of, 10curve shots, 11manufacture of, 9pelota vasca, 7speed of, 9, 24spin on, 11types of shots, 11–13See also specific shots
Bank loan models, 148–149Banks, C., 152Barcelona Olympics, 16Barry sisters, 25Baseball, 23, 88, 91–92, 211Basketball, 101, 211Basques, 7, 14–17, 215Beat the Dealer (Thorp), 36Berenson’s fronton, 53, 54, 57Bernoulli trials, 34
223
P1: FCH/FYX P2: FCH/FYX QC: FCH/FXU T1: FCH
CB386-index CB386-Skiena June 12, 2001 9:49 Char Count= 0
INDEX
Betting, 25–27aggregate bets, 27asymmetries in, 52blackjack, 35, 210boxing, 27, 160, 162, 165, 177card counting, 35casino, 33, 112–113, 163, 171, 172community control, 172Daily Double, 27doubling up, 33–34exactas. See Exactasexpected payoffs, 116–119, 205expected-return threshold, 159handles, 132–134house cut, 58, 110Internet and, 162–164major factors in, 114martingales, 34, 216minimum, 26, 115off-track, 163–165, 188O’Hare straddle, 34pari-mutuel. See Pari-mutuel
bettingpartido betting, 16perfectas, 26Pick-6, 27place bets, 26, 115–116, 134–135,
137, 162, 200post position and, 53quinielas. See Quienielasroulette, 33, 37, 60scandals, 32show bets, 26, 115–116, 137, 162Spectacular Seven and, 29state lotteries, 34, 172, 207syndicates, 38systems, 33–39tie-breaking, 50–51trifectas. See Trifectastypes of bets, 25–27unclaimed tickets, 135, 190wheeling, 27
win bets, 25, 115–116, 135, 137,161, 162, 201
wrestling and, 30–31volume of, 171
Bible code, 106Birthday games, 32Black box methods, 141Blackjack, 35, 210Board games, 211Box betting, 27, 160, 162, 177Brachistocrone of Bernoulli, 100Brain, modelling of, 146Breakage, 111Brute force methods, 65–66Budget models, 146Bugs, in programs, 155–156
Calculus, 147Calendar dates, 75Caller ID option, 167Cancer clusters, 178Cancha. See Jai-alai, courtCard-counting systems, 35–36,
165–166, 210Carom shot, 12Cartesian geometry, 95Casino gambling, 33, 112–113,
133–134, 163, 171–172Causal relationships, 105–107, 215Cell decomposition, 144Cellular automata, 100Cesta, 4
cost of, 8definition of, 215handmade, 8invention of, 8manufacture of , 8remonte, 16
Cesta of Skiena, 101Cesta punta, 7, 15Chess, 67Chic-chac, 11
224
P1: FCH/FYX P2: FCH/FYX QC: FCH/FXU T1: FCH
CB386-index CB386-Skiena June 12, 2001 9:49 Char Count= 0
INDEX
Chiquito de Eiber, 25Chula, 11Chutes and Ladders, 212Clyde program, 41, 142, 211Coin flips, 58–59Compound interest, 98Computer programs
absolute dates in, 75autodialing with, 165–167algorithms for, 49artificial languages, 51, 71, 72, 215bugs in, 155–158C-coding contest, 152cellular automata, 100Clyde program, 40–41cryptography and, 169–171definition of, 215exact search program, 65generality of, 152HTML language, 77–81, 82Internet, 77–82, 171–173Java language, 80, 83linear programming, 146mathematical models. See
Mathematical modelsMathematica program, 156Maven program, 162, 174–186millenium bug, 157–158modems, 166–168Monte Carlo. See Monte Carlo
methodsnatural languages and, 71neural networks, 147–149open source languages, 82optical character recognition, 148parsing in, 71–76, 85, 215Pascal language, 51Perl language, 77–81, 215randomness and. See Random
numbersrobustness of, 145, 155roulette and, 37
simulations with, 37, 45, 52, 215software systems, 151–155, 187stock trading and, 85, 148, 213tiebreaking, 51Turing test, 73von Neumann and, 59, 87Worldwide Web, 78, 80, 82, 217See also specific models, terms
Connecticut frontons, 53, 132–139Continuous models, 140–141Cornblit, J., 22, 90Correcta bet, 26Correlation coefficients
causation and, 105–107definition of, 215formula for, 90statistics and, 90
Cosine functions, 97Counterintuitive results, 105Court (cancha), 10–11, 25Cryptography, 169–171Cuban jai-alai, 17Curvefitting models
definition of, 215degrees of freedom, 143families of curves, 100graphs and, 95models, 143
Daily Double bets, 27Daily Racing Form, 210Dania fronton, 1, 19, 57, 68, 79Data-driven models, 142Debugging, of programs, 155–157Deep Blue, 67Degrees of freedom, 143Dejada shot, 12Democrats, 137, 138, 144–145Descartes, 95Descriptive models, 141Deterministic models, 142Differential equations, 146–147
225
P1: FCH/FYX P2: FCH/FYX QC: FCH/FXU T1: FCH
CB386-index CB386-Skiena June 12, 2001 9:49 Char Count= 0
INDEX
Discrete models, 140–141Diseases, clusters of, 178Distance function, 144Doubles matches, 10Doubling methods, 33–34Dow-Jones average, 96
Ebay bidding, 210Econometrics, 146Economic forecasting, 45, 109, 213Efficient markets, 57Einstein, A., 146Elegance, of design, 151–155Eliminations, in jai-alai, 50Eliza program, 73Elvis impersonators, 98Email, 168–170Emerson, R.W., 142Epidemiology, 146Equations, systems of, 145–146Erdorza Menor, 23Eskual Herria, 14ETA group, 15Eudaemonic Pie, The (Bass), 37Exact search program, 65Exactas, 132, 162
expected payoffs, 203–204payoffs for, 118–119possible bets, 26probabilities for, 203–204
Excel program, 209Expected return, 159Expected value, 128, 189, 216Exponential functions, 98
“Fairer Scoring System for Jai-Alai, A”(Skiena), 63, 64
Fair’s economic models, 212Falwell, J., 167Fatalities, in jai-alai, 24Fax machines, 166–167Federal Reserve Bank, 146
Fermat, P., 87FIFO. See First-in first-out queueFinancial modelling, 213First-in first-out (FIFO) queue, 27–28First name distributions, 212Florida rules, 50Football, 42, 48, 211Foreign currencies, 213Fort Pierce (Fla.) fronton, 20Fourier analysis, 100Foxwoods casino, 18, 133Fractals, 98French, J., 61Friend-foe identification, 170–171Frontcourters, 11Frontons, 6
betting. See Bettingcasinos and, 112, 133in Connecticut, 18, 53, 132–136cost per transaction, 129definition of, 215first indoor, 16in France, 17in Havana, 17handles, 130, 131, 132house cuts, 58, 110Internet and, 71martingales, 34, 216minimum bets, 26, 114North American, 18–20player-managers, 93schedule file, 74season statistics, 70See also specific frontons
Fudge factor, 103
Gamblers, types of, 187–188Gamblers Anonymous, 188Gambling
community control, 171Internet, 171–173stock market and, 119, 128–129
226
P1: FCH/FYX P2: FCH/FYX QC: FCH/FXU T1: FCH
CB386-index CB386-Skiena June 12, 2001 9:49 Char Count= 0
INDEX
systems for, 215volume of, 171See also Betting
Gambling Times Guide to Jai-Alai(Keevers), 116
Game-fixing, 32Game of Pelota (Goya), 16Gates, W., 81Geek, 151General public, 109Generality, 103, 152Geometric distance function,
144Gilovich-Vallone-Tversky study,
104–105Go, game of, 67Goodfriend-Friedman study, 58Gore, A., 212Goya tapestry, 16Grammars, language, 71Graphs, of curves, 95Grofman-Noviello studies, 58Grove, A., 128Guernica (Picasso), 15
Hamming, R., 52Handball, 16Handedness, in jai-alai, 25Handicapping, 42Handles, of frontons, 130–132Havana (Cuba) fronton, 17Helmets, 24Herrington, K., 25Heussler, R., 133Historia de la Pelota Vasca en Las
Americas, 14Horse racing, 112, 210Hot streaks study, 34, 104, 105House cut, 58, 110HTML. See Hypertext markup
languageHuman sacrifice, 9
Hypertext markup language(HTML), 77–81, 82
IBM 360 system, 156Ignatius, St., 14Independence assumption, 105Information theory, 52Integration methods, 46–48Integrity, of probability, 102Interactive Gaming Council, 171, 172Interest rates, 213Interfaces Journal, 61, 63Internal Revenue Service (IRS), 164,
202International Jai-Alai Players
Association, 17, 18International Obfuscated C Code
Contest, 151Internet
gambling on, 171–173languages of, 77–81technical standards, 82
Internet Gambling Prohibition Act of1997, 172
IRS. See Internal Revenue Service
Jai alaiamateur, 20athletic skills, 24ball. See Ballbaseball and, 88Basques and, 6, 7, 14–17, 215betting. See Bettingcesta, 4, 8, 16, 215modelling. See Computer
programscourt, 10–11, 25frontons. See Frontonsgame-fixing, 32handball and, 7handedness in, 25history of, 14–25
227
P1: FCH/FYX P2: FCH/FYX QC: FCH/FXU T1: FCH
CB386-index CB386-Skiena June 12, 2001 9:49 Char Count= 0
INDEX
Jai alai (cont.)players. See Playerspost position. See Post positionscoring. See Point scoringseasons, 88tie-breaking, 50–51, 66women in, 25See also specific terms
Java language, 80, 83Joey (Cornblit), 23, 90
Kahan, W., 156Kasparov, G., 67Kill shot, 12Koch curve, 100
La Pelote Basque (Blazy), 14Last name distribution, 212Linear congruential generator, 60, 61Linear functions, 97–98Linear programming, 145Linear regression, 143, 215Loebner Prize, 73Lotteries, state, 34, 37–38, 172,
209–210
Mailler, R., 150–151, 155, 158, 159,160, 161
Man Ray, on curves, 101Mano game, 16Market efficiency, 34, 109–113, 215Martingale system, 34, 215Mathematica system, 155Mathematical modelling, 209
ad hoc methods, 141black-box models, 141continuous models, 141curve-fitting and, 143definition of, 233deterministic, 142differential equation models,
146–147
discrete models, 140general models, 141integration, 46Monte Carlo methods. See Monte
Carlo methodsnearest neighbor predictors,
144–145neural networks, 147–149predictive power, 44process of, 140randomized models, 142systems of equations, 145–146techniques, 139–149See also specific models, programs
Maven program, 162, 174–186Mean, measure of, 137Melchoir Curachaque, 8Menor, Erdoza, 23Mexico, jai-alai in, 20Miami (Fla.) fronton, 17–19Microsoft, 81–84, 129, 156Microsoft Excel, 145, 209Milford (Conn.) fronton, 19, 130–136Military, 35, 170Millenium bug, 157–158Minimum bets, 26, 115Minimum return, 112Minuet, P., 98Minus pools, 112Moby Dick codes, 107Modelling. See Mathematical
modellingModems, 166–167Monopoly, 211Monotonic functions, 102Monte Carlo methods, 45–58, 64–67
betting strategy, 158brute-force calculation and, 66definition of, 215expected payoff models, 119integration and, 46–48market efficiency, 109
228
P1: FCH/FYX P2: FCH/FYX QC: FCH/FXU T1: FCH
CB386-index CB386-Skiena June 12, 2001 9:49 Char Count= 0
INDEX
Monopoly example, 211point-win percentages, 95, 108randomness in, 58, 142statistical analysis, 140statistics needed, 70
Moser studies, 58, 67Murphy’s law, 103Mythical Man-Month, The (Brooks),
150
Nagarajan, M., 85, 132, 150, 159Names, distribution of, 212National Climatic Data Center
(NCDC), 214National Oceanic and Atmospheric
Administration (NOAA), 214NCAA basketball tournament, 101NCDC. See National Climatic Data
CenterNearest neighbor models, 144–145Neighboring players, 57Neural networks, 147–149Newman, H. S., 133Newport (R. I.) fronton, 19Newton’s laws of motion, 146, 147NOAA. See National Oceanic and
Atmospheric AdministrationNonlinear functions, 96Nuclear weapons, 146
Obfuscated C contest, 152Ocala (Fla.) fronton, 20Occam’s razor, 103Odds board, 206–207Off-track betting (OTB), 134, 163, 188O’Hare straddle, 34Old Farmer’s Almanac, 214Ollier, P., 110On the Wire system, 162–164Open source language, 82Open standards, 82Optical character recognition, 148
Orlando-Seminole (Fla.) fronton, 19Ovals of Cassini, 100Overfitting
definition of, 216linear regression and, 143mathematical models of, 216statistics and, 136–139
Pala game, 16Palm Beach (Fla.) fronton, 38Pamplona games, 16Pari-mutuel betting
casinos and, 113program for, 174–186definition of, 216implications of, 112investments and, 129market efficiency and, 110–113payoffs in, 110–111, 128United States and, 6See also Betting; specific types of
betsParsing, 71–76, 85, 216Partido betting, 16Pascal language, 51Pascal, B., 87Passwords, 170Payoffs, 70, 137. See also BettingPeer review, academic, 62Pelotaris. See PlayersPelota. See BallPelota vasca (Basque ball), 7Penny stocks, 129Pepe’s Green Card, 3, 40, 44, 69, 110,
114, 135, 188, 216Perfecta bets, 26Periodic functions, 96Perkain, escape of, 24Perl language, 77–81, 216Physical sciences, models in, 45Pick-6 bets, 27Place bets, 26, 115, 116–117, 134, 162
229
P1: FCH/FYX P2: FCH/FYX QC: FCH/FXU T1: FCH
CB386-index CB386-Skiena June 12, 2001 9:49 Char Count= 0
INDEX
Players (pelatoris), 7, 20–25earnings, 32handicaps, 92–95height, 24names of, 22player-managers, 92player-pair tables, 110post position. See Post positionright-handed, 25skills of, 57, 70, 87, 92–95, 114,
205–206statistics on, 89–90strike, 19–20weight, 24
Point scoringdoubling, 52modelling problem, 102probabilities, 107, 108scoring function, 103service advantage, 95simulations, 107–108Spectacular Seven. See Spectacular
Seven scoring system,spread, 42
Polynomials, 96Population demographics, 216Post positions, 13
betting and, 53definition of, 216players, 53, 94shirt colors, 13simulation of, 54winning percentages, 54
Predictive models, 44, 140Presidential elections, 212Prices, and values, 112Probability
definition of, 216equality, 102experimental factors, 104integrity, 102modern theory of, 86
power law, 104statistics and, 86–87symmetry, 102See also Monte Carlo methods;
Random sequencesProgramming. See Computer
programsPseudo-random numbers, 59, 60
Quantitative market analysis, 110Queue-based scoring system, 29Quiniela bets, 134–136, 137, 161,
184–185defined, 26most exciting, 26payoffs, 115–117, 202possible types, 26probabilities for, 202
R & C Research, 213Racquetball, 10Random sequences, 34, 45
computers and, 59generators, 60models and, 142Monte Carlo. See Monte Carlo
methodspseudorandom numbers, 57, 60random walks, 110roulette and, 60
Readability, of software, 151–152Rebote shot, 11Redlining, 149Regression analysis, 143, 216Relativity, theory of, 146Remonte, 16Renaissance Technology, 110Republicans, 136, 137, 138, 144Robustness, of programs, 145, 155Roulette, 33, 37, 60Runyon, Damon, 188Ruth, Babe, 24
230
P1: FCH/FYX P2: FCH/FYX QC: FCH/FXU T1: FCH
CB386-index CB386-Skiena June 12, 2001 9:49 Char Count= 0
INDEX
Scanning, 167Scatterplots, 90Schedule files, 73–75Scientific forecasting, 214Security systems, 150, 169–171Service advantage, 95Shaw, D.E., 110Shirt colors, 13Shots, types of, 11–12Show bets, 26, 115–116, 135, 136, 162Similarity, measure of, 144Simplicity, 103Simulation methods, 142
actual rankings and, 53economics and, 45engineering and, 45Monte Carlo methods. See Monte
Carlo methodsphysical sciences and, 45post position and, 54
Simulcasting, 163Sine functions, 96Singles matches, 10Snowflake curve, 100Social Security Administration, 212Software systems, 151–155, 185Software rot, 185Spectacular Seven scoring system,
13, 16, 44, 49, 62bettors and, 29biases of, 45definition of, 216increase in reward, 29origin of, 29scoring in, 27–30tree of possibilities, 65
Spreadsheet programs, 145, 209Standard deviation, 137Stark, Gene, 36, 167–171Statistical analysis, 155
average, 137correlation coefficient, 90
definition of, 216mean, 138overfitting, 136–139probability and, 86–87standard deviation, 137See also Probability
Stock market, 96, 213cost per transaction, 139gambling and, 119, 129–130jai alai and, 110market efficiency, 109neural nets, 148random walk, 110program-trading systems, 85
Stoopers, 190Sun Microsystems, 83Superfecta, 30Symmetry, 102Syndicate betting, 38Systems of equations, 145–146
Tampa (Fla.) fronton, 19Taxes, 202, 205Telnet program, 183Temperature conversion, 95Tennis, 10, 95Thorp, Edward, 36, 208Tic-tac-toe game, 66–67Tiebreaking rules, 50–51, 66Tijuana (Mex.) fronton, 20Time-series prediction, 148Tita of Cambo, 25Torah, patterns in, 106Tout sheets, 3. See also Pepe’s Green
CardTranslation, in models, 139Tree searches, 65, 67Trifecta bets, 4, 116, 124–127,
134–139, 193–200best trifectas, 54nonoptimal, 160boxes, 160, 162, 192–193
231
P1: FCH/FYX P2: FCH/FYX QC: FCH/FXU T1: FCH
CB386-index CB386-Skiena June 12, 2001 9:49 Char Count= 0
INDEX
Trifecta bets (cont.)definition of, 216expected payoff, 191–200frequency of outcomes, 54Gang of Four, 57most unlikely, 54occurrences of, 55–56payoffs, 116–117, 118–127, 137possible types, 4, 26, 54probabilities for, 139, 191–197variance, 139, 154
Trigonometric functions, 99, 100Trotto, Les, 134Turing test, 73
Unclaimed tickets, 135, 190United States frontons, 19–20. See
also specific locationsU.S. Census Bureau, 212, 214U.S. Federal Reserve, 213
Validation, in models, 140Values, prices and, 109Vanguard Primecap fund, 187Variance, 137, 139Vietnam War, 35
Visualization of Quantitative Data,The (Tufte), 130
Vlah, Dario, 73, 80, 132–136von Neumann, John, 59, 87Voronoi diagram, 144
War and Peace codes, 107War-dialing, 167Weather forecasting, 146, 214Weighting, of probabilities, 65Wheeling, 27Win bets, 25, 135, 162
payoffs for, 115, 116–117,201
post position and, 54probabilities for, 201unclaimed, 135, 190
Witch of Agnesi, 100Withholding taxes, 202Wolfram, Stephen, 155Women, in jai-alai, 25Worldwide Web, 78, 80, 82, 217Wrestling, 30–31
Year 2000 problem, 157–158Young automata model, 100
232