Embed Size (px)
Citation preview

Lecture 23:Pairs Trading
Steven Skiena
Department of Computer ScienceState University of New YorkStony Brook, NY 11794–4400
http://www.cs.sunysb.edu/∼skiena

Pairs Trading
This strategy was pioneered by Nunzio Tartaglia’s quantgroup at Morgan Stanley in the 1980’s. It remains animportantstatistical arbitragetechnique used by hedge funds.They found that certain securities were correlated in theirday-to-day price movements.When a well established price correlation betweenA andB
broke down, i.e. stockA traded up whileB traded down,they would sellA and buyB, betting that thespread wouldeventually converge.This divergence between pairs may be caused by temporarysupply/demand changes, when a single large investor changesposition in a single security.

Potentially Correlated Pairs
• Coca-Cola (KO) and Pepsi (PEP)
• Wal-Mart (WMT) and Target Corporation (TGT)
• Dell (DELL) and Hewlett-Packard (HPQ)
• Ford (F) and General Motors (GM)
Highly-correlated pairs often (but not always) come from thesame sector because they face similar systematic risks.

Advantages of Pair Trading: Market Neutrality
The pairs trade helps to hedge sector- and market-risk.If the market or sector crashes, you should experience a gainon the short position and a negating loss on the long position,leaving your profit close to zero in spite of the large move.In a pairs trade, you bet on the direction of the stocks relativeto each other.Trading strategies which are independent of market move-ments are said to bemarket neutral.Pairs trading is a mean-revertingstrategy, assuming thatprices will revert to historical trends.Pairs trading is largely self-funding, since the short salereturns can be used to buy the long position.

Dangers of Pair Trading: News Reaction
The increased divergence between two stocks can be arational response to news about one of the companies.Transaction costs (e.g. commissions, bid-ask spreads) caneatup the theoretical returns in such an active strategy.Pairs trading became less advantagous as more groups starteddoing it.Hedge funds use algorithmic trading strategies that monitorfor deviations in price, automatically buying and selling tocapitalize on market inefficiencies.Such program trading requires fast reaction/execution time totake advantage of tighter spreads before other groups can.

Identifying Pairs
Correlation analysis can be used to identify interestingpotential pairs, but beware of spurious correlation.Competing companies in the same sector make naturalpotential pairs.Certain companies have several classes of shares tradingsimultaneously (e.g. common and preferred) which shouldmove largely in unison.Certain companies may be simultaneously traded on multipleexchanges or have international subsidiaries (e.g. Dutch andRoyal Shell)A general or sector index portfolio (ETF) might be used asone component of a pair.
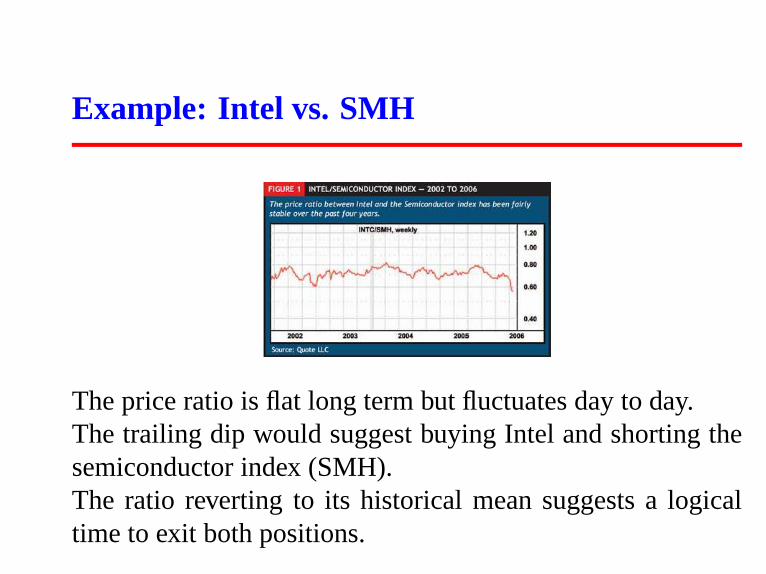
Example: Intel vs. SMH
The price ratio is flat long term but fluctuates day to day.The trailing dip would suggest buying Intel and shorting thesemiconductor index (SMH).The ratio reverting to its historical mean suggests a logicaltime to exit both positions.

Achieving Market Neutrality
Stock A: $20 per share, Stock B: $10 per sharePairs trade: Long 100 shares of Stock A: $2,000 Short 200shares of Stock B: $2,000 Net long/short: $0This is a true market-neutral position:Scenario 1: Both stocks rise 50 percent:Stock A: $30 StockB: $15Scenario 2: Both stocks fall 50 percent:Stock A: $10 StockB: $5
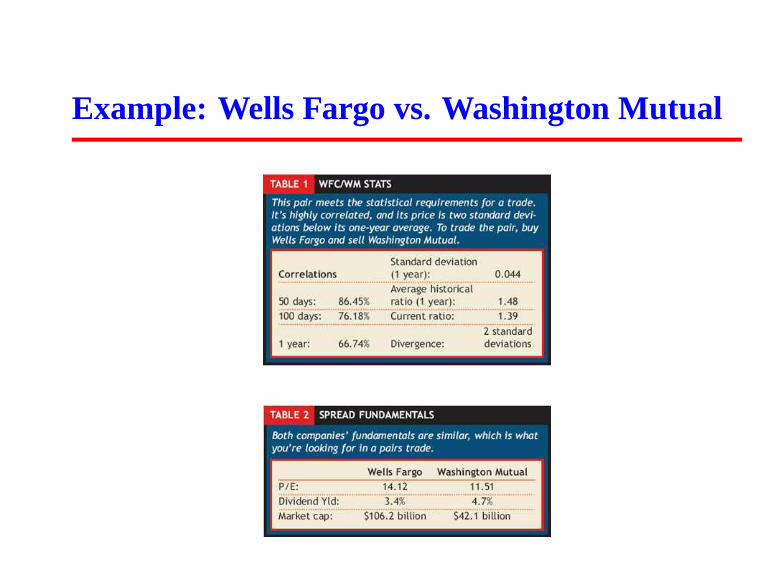
Example: Wells Fargo vs. Washington Mutual

A Successful Pairs Trade
That said, Washington Mutual has since collapsed, soobserved correlations do break down. . .

Why Might Pairs Trading Work?
Reversion to the mean requires a driving mechanism; pairstrading would not work were prices truly random walks.The Law of One Price(LOP) is the proposition that twoinvestments with the same payoff in every state of nature musthave the same current value.A strong historical correlation suggests they behave the samein a large number of states, and soshould be priced the same.Another possible explanation is that changing risks of (rarelyoccuring) bankrupcies would cause reversion after the non-realization of the event plays out.

Academic Studies: Gatev, Goetzmann,Rouwenhorst
“Pairs Trading: Performance of a Relative-Value ArbitrageRule”, The Review of Financial Studies, 19 (2006) 797-827They tested a simple pairs trading strategy on daily data from1962-2002.A simple trading rule yields average annualized excessreturns of up to 11% for self-financing portfolios of pairs.We will look at their results as a model for a carefulbacktesting analysis of a trading strategy.

Strategy Specification
Pairs were formed based on price correlations over a 12-month period, starting every month.Each pair was then traded (possibly multiple times) over thenext six months.The pair was “bought” when its ratio spread was outsidetwo standard deviations of its 12-month spread. If normallydistributed, this should happen about 5% of the time.

The position is closed when the ratio returned to its historicalparity, or when the given six-month period ended.Pair trades were made for $1 in each direction.

Pair Formation
Stocks which did not trade on at least one day in the formationperiod were eliminated to ensure liquidity.A matching partner for each security was found by minimiz-ing the squared deviations between the two normalized dailyprice series, where dividends were reinvested.Separate experiments were done to restrict pairs to the sameindustrial sector.The pairs were ranked by distance, and those within givenrank traded.

Return Computation
That pairs open and close at various points during the six-month trading period complicates evaluation of return.Pairs that open and converge will have positive cash flows;Pairs that open but do not converge will have positive ornegative cash flows on the last day of the trading intervalwhen all positions are closed out.All positions are marked-to-market daily to analyze dailyreturns.

What is the Denominator?
To compute returns you must measure how much capital youneed.They assume it costs $1 to go long and nothing up front to goshort.Thus committed capital is equal to the number of pairsmonitored.Employed capital is equal to the number of open positions ateach time, and thus less than committed capital.Employed capital makes sense if the uninvested money canused elsewhere in the hedge fund.

Results
Pairs portfolio Top 5 Top 20 101 to 120 AllAvg. monthly return 0.01308 0.01436 0.01081 0.01104Return on committed capital 0.00784 0.00805 0.00679 0.00614Avg. monthly return (1 day delay) 0.00745 0.00895 0.00795 0.00715Return on committed capital 0.00463 0.00520 0.00503 0.00396
Performance is sensitive to execution time or bid/ask spreadand denominator.Performance is relatively insensitive to which pairs are used.Much of the return disappears when trading one day afteroptimal, which was studied to capture some aspect oftransaction costs.

Trading Statistics
Pairs portfolio Top 5 Top 20 101120 AllAverage price deviation trigger 0.04758 0.05284 0.07560 0.16888Average pairs traded per period 4.81 19.30 19.41 1944.22Average round-trip trades per pair 2.02 1.96 1.78 1.62Average time pairs are open 3.75 3.76 3.98 3.97Average weight of stocks in top five size deciles 0.91 0.91 0.79 0.62Average weight of pairs from different deciles 0.66 0.69 0.75 0.82Utilities 0.72 0.71 0.32 0.08Transportation 0.02 0.02 0.02 0.03Financials 0.11 0.13 0.26 0.16Industrials 0.15 0.14 0.40 0.73Mixed sector pairs 0.20 0.22 0.44 0.33
The most highly correlated pairs provided little potentialreturn (4.76%), because twoσ represents a small absolutespread.Returns from randomly selected pairs were negative, so theinitial correlation was important.

Most of the returns came from the short position, theeffect is not simple mean reversion or reward for unrealizedbankrupcy risk.Most pairs occurred within a sector because the systematicrisk is so highly correlated.Certain sectors (particularly utilities) generated higher-correlated pairs.

Monthly Returns
Returns are positive and quite regular, but become smallerand more volitile after the pairs trading became a popularstrategy.Of the $137 billion in hedge fund assets in 2000, $119 billionwere employed in market neutral strategies.

Pairs Trading: Conclusions
Pairs trading is an important type of statistical arbitragetechnique.There is good theoretical, experimental and practical experi-ence that it can be a profitable strategy.Such strategies become much harder to employ once theybecome popular; hedge funds deploy them on a massive scaleas part of algorithmic trading systems.The original Morgan Stanley group was initially extremelyprofitable but disbanded with losses only a few years later.

Types of Buy/Sell Orders
Brokers can typically perform the following buy/sell ordersfor exchange traded assets:
• Market orders request the trade happen immediately at thebest current price.
• Limit orders demand a given or better price at which tobuy or sell the asset. Nothing happens unless a matchingbuyer or seller is found.
• Stop or stop-loss order becomes a market order when agiven price is reached by the market on the downside.This enables an investor to minimize their losses in a

market reversal, but does not guarantee them the givenprice.
• Market-if-Touched order (MIT) becomes a market orderwhen a given price is reached by the market on the upside.This enables an investor to take profits when they areavailable, but does not guarantee them the given price.
The volume and distribution of stop and limit orders inprinciple contains information about future price movements.Theory argues against making such orders as giving awayan option for no payoff, however, such orders are usefulparticularly for modest-sized investments.


![SCC-211 - Capítulo 12 Gridswiki.icmc.usp.br/images/3/34/SCC211Cap12.pdf · Material do Steven Skiena Os próximos 14 slides contêm material de Steven Skiena disponíveis em [2]](https://img.pdfslide.net/doc/110x75/605b2d910f118c29276f78be/scc-211-captulo-12-material-do-steven-skiena-os-prximos-14-slides-contm.jpg)