Embed Size (px)
Citation preview
Telling Tales & Solving Crimes
uncovering the practical, business side of New Relic
“Just like automated deployments and unit tests, New Relic is going
to change how we work.”
Reacting fastApplication Performance Monitoring
enables us to deal with issues quickly and definitively
Case Study 1Javascript Errors on the Live site
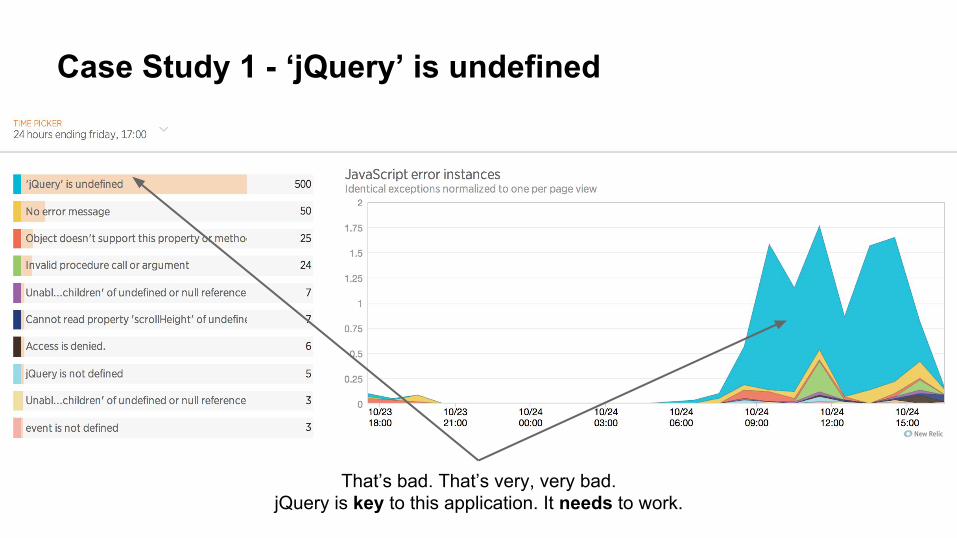
Case Study 1 - ‘jQuery’ is undefined
That’s bad. That’s very, very bad.jQuery is key to this application. It needs to work.

We tested this - how did that happen?
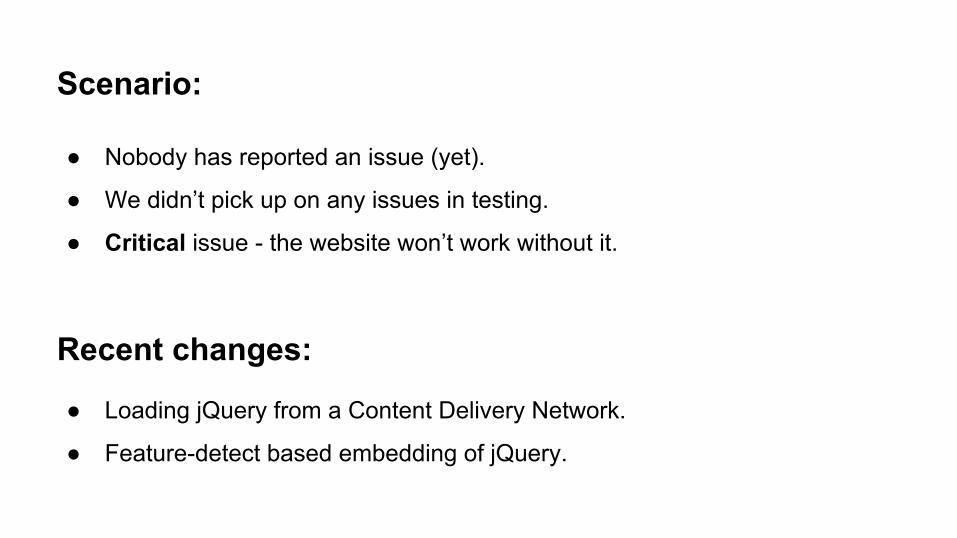
Scenario:
● Nobody has reported an issue (yet).
● We didn’t pick up on any issues in testing.
● Critical issue - the website won’t work without it.
Recent changes:
● Loading jQuery from a Content Delivery Network.
● Feature-detect based embedding of jQuery.
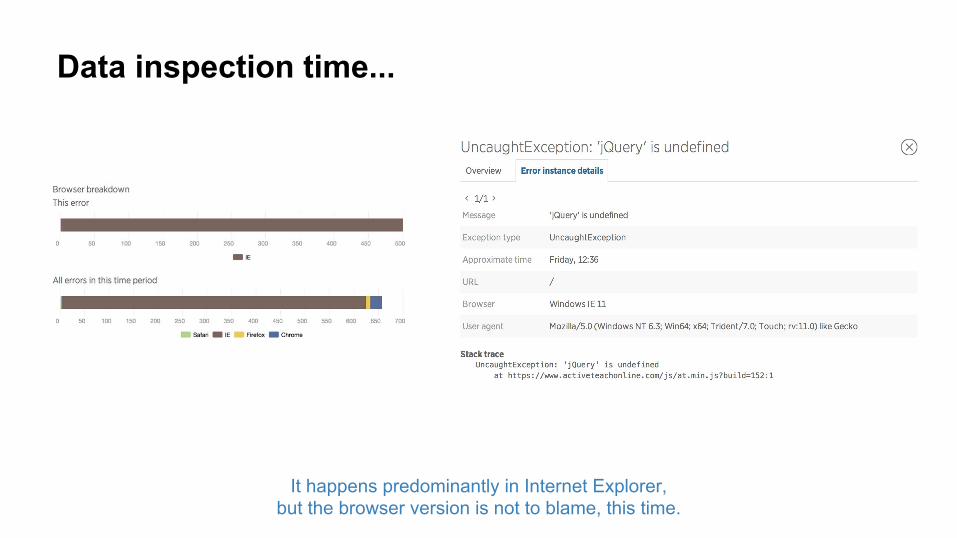
Data inspection time...
It happens predominantly in Internet Explorer, but the browser version is not to blame, this time.
[manual testing]
Repeating our test process to ensure that everything we’ve tested for is still working as expected.

When all else fails, Google it.
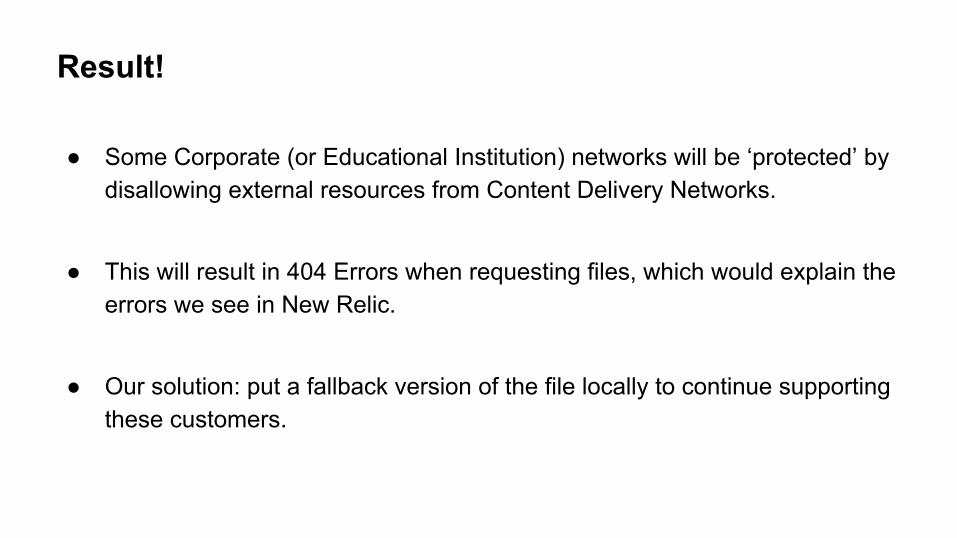
● Some Corporate (or Educational Institution) networks will be ‘protected’ by disallowing external resources from Content Delivery Networks.
● This will result in 404 Errors when requesting files, which would explain the errors we see in New Relic.
● Our solution: put a fallback version of the file locally to continue supporting these customers.
Result!
Most importantly, we’ve identified issues that real users are experiencing, debugged and resolved them without the customer or
the client having to report any issues or provide any details.
Which also means we fixed the issue in a fraction of the time!
Case Study 2Server Crash
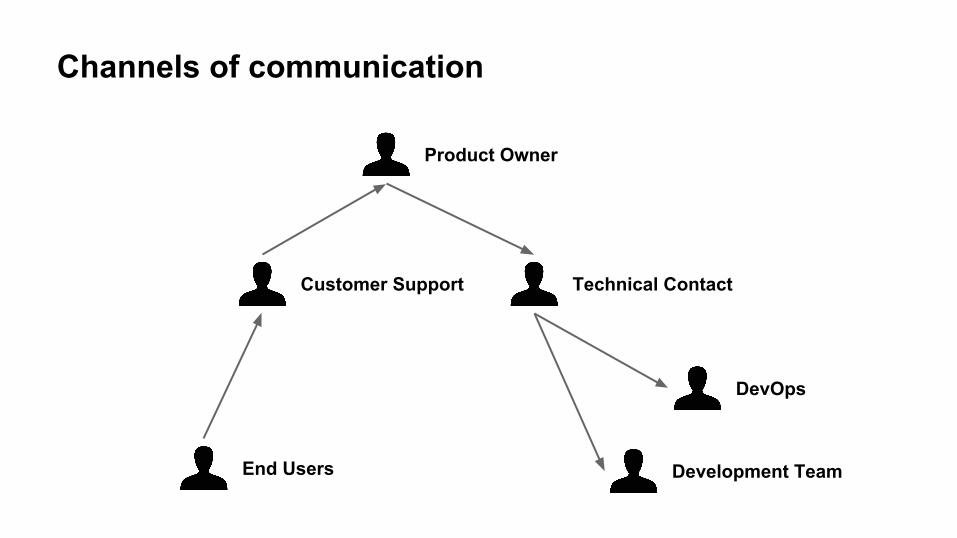
End Users
Technical Contact
Product Owner
DevOps
Development Team
Customer Support
Channels of communication
End Users
Technical Contact
Product Owner
DevOps
Development Team
Customer Support
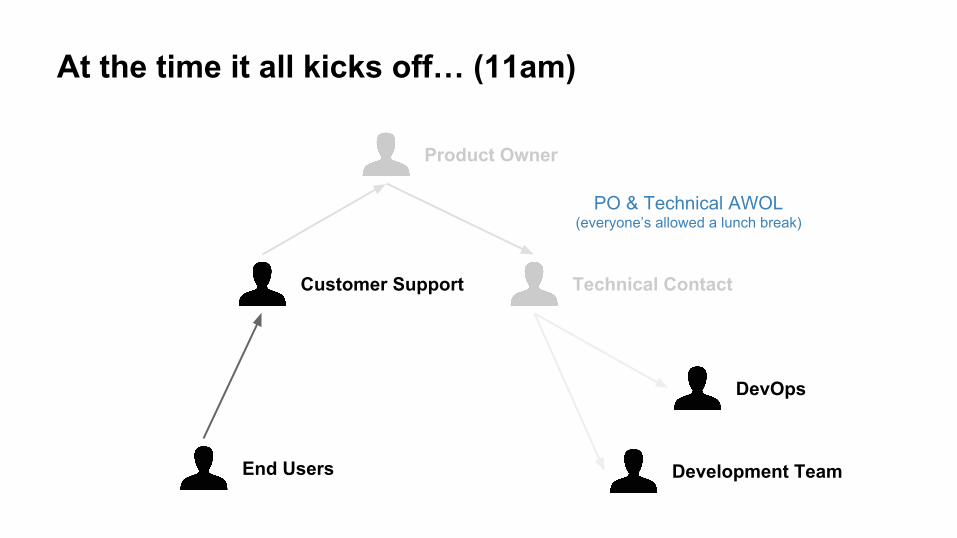
At the time it all kicks off… (11am)
PO & Technical AWOL(everyone’s allowed a lunch break)
End Users
Technical Contact
Product Owner
DevOps
Development Team
Customer Support
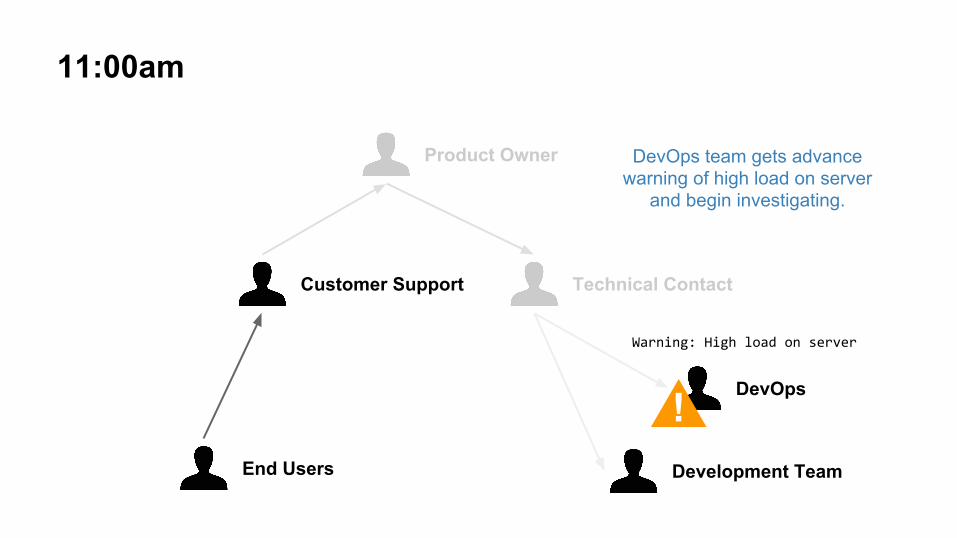
11:00am
!
Warning: High load on server
DevOps team gets advance warning of high load on server
and begin investigating.
End Users
Technical Contact
Product Owner
DevOps
Development Team
Customer Support
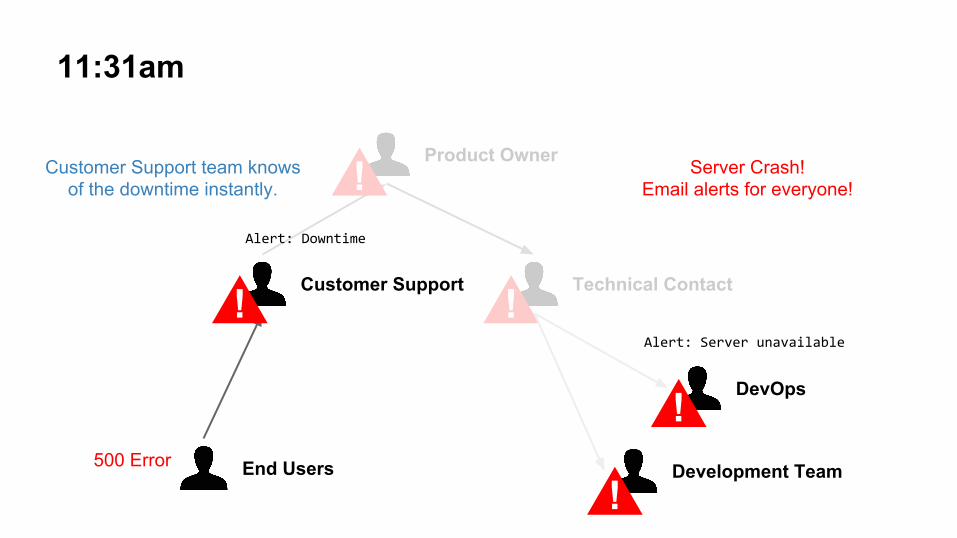
11:31am
!
!
!
Alert: Server unavailable
!
!
Alert: Downtime
Server Crash! Email alerts for everyone!
Customer Support team knows of the downtime instantly.
500 Error
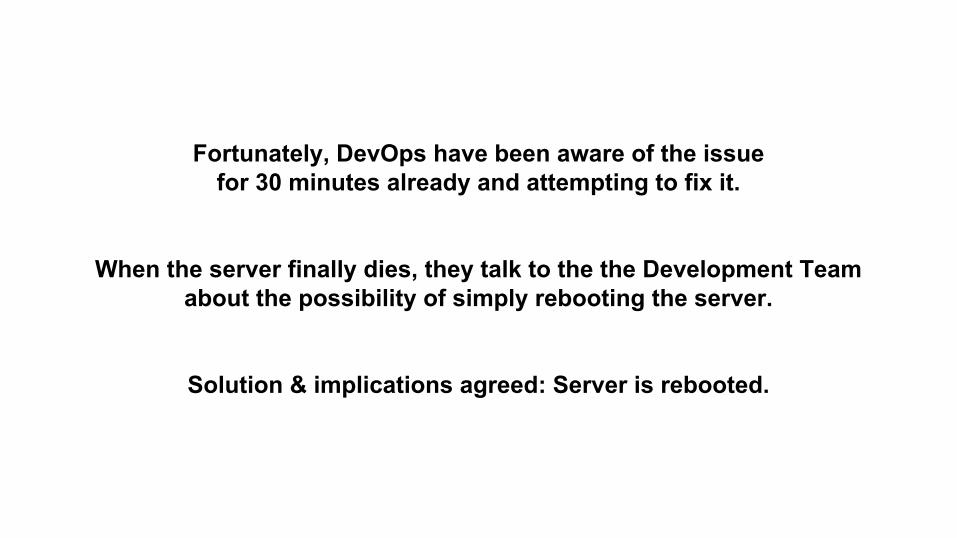
Fortunately, DevOps have been aware of the issue for 30 minutes already and attempting to fix it.
When the server finally dies, they talk to the the Development Team about the possibility of simply rebooting the server.
Solution & implications agreed: Server is rebooted.
End Users
Technical Contact
Product Owner
DevOps
Development Team
Customer Support
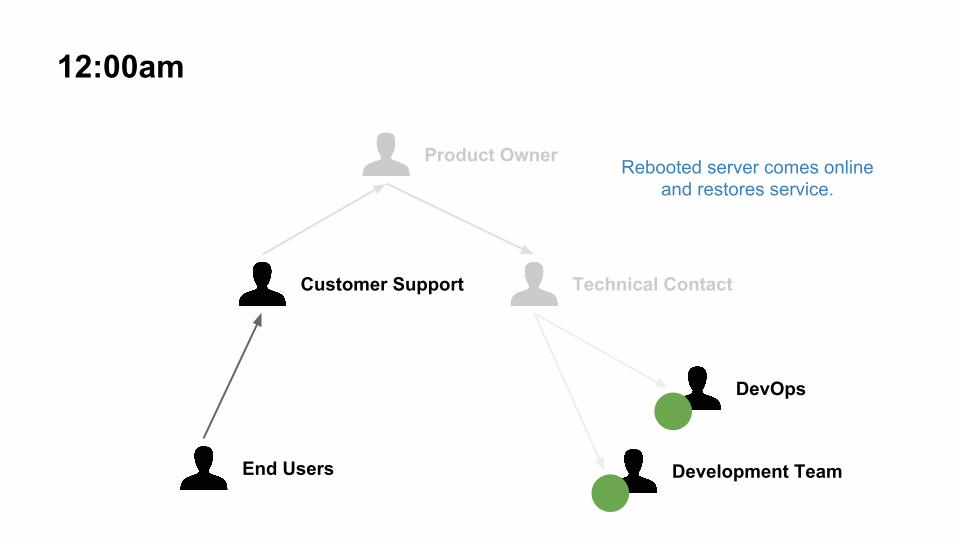
12:00am
Rebooted server comes online and restores service.
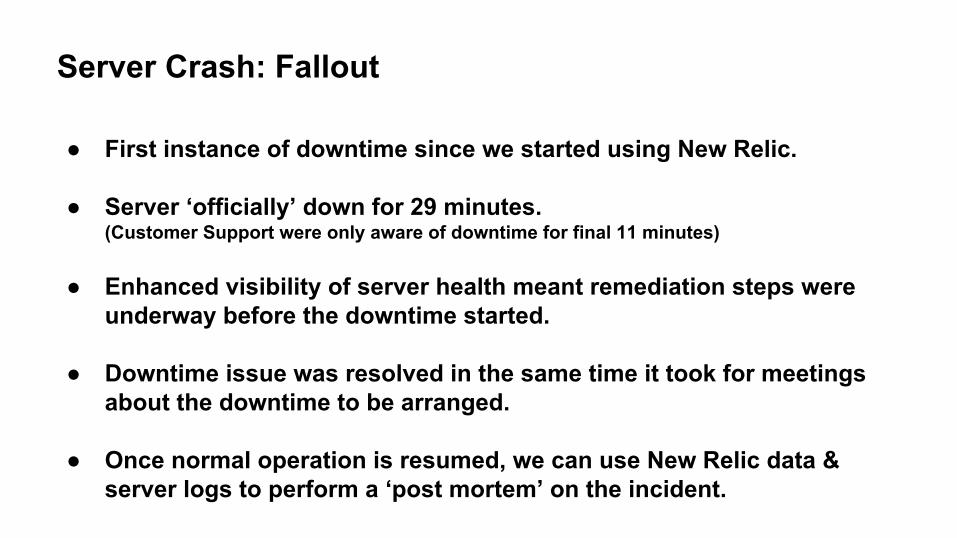
Server Crash: Fallout
● First instance of downtime since we started using New Relic.
● Server ‘officially’ down for 29 minutes. (Customer Support were only aware of downtime for final 11 minutes)
● Enhanced visibility of server health meant remediation steps were underway before the downtime started.
● Downtime issue was resolved in the same time it took for meetings about the downtime to be arranged.
● Once normal operation is resumed, we can use New Relic data & server logs to perform a ‘post mortem’ on the incident.
“Real user data is much, much better than artificially-created
lab results”


![Relic [Pendergast 01] - Preston.pdf](https://img.pdfslide.net/doc/110x75/577cd69e1a28ab9e789ccc6d/relic-pendergast-01-prestonpdf.jpg)