Embed Size (px)
Citation preview
Mixed Methods Research in the Age of Big Data
A Primer for UX Professionals
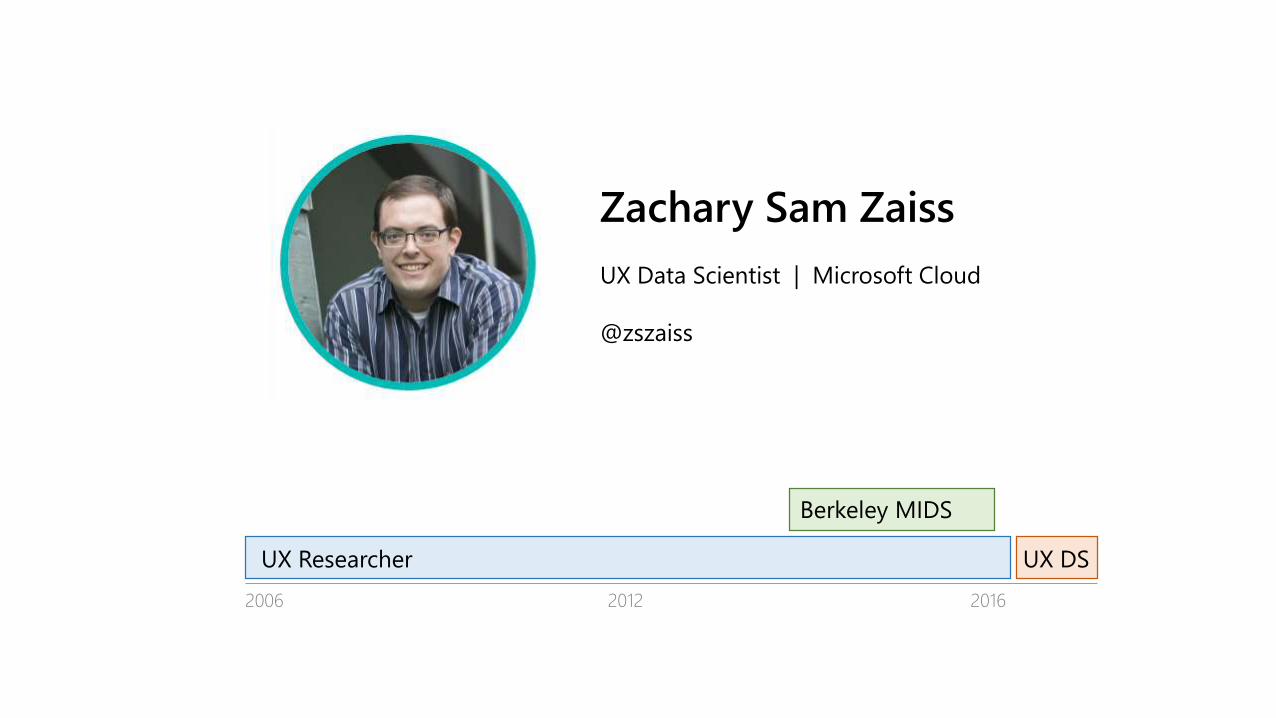
Zachary Sam Zaiss
UX Data Scientist | Microsoft Cloud
@zszaiss
2006 2012 2016
UX Researcher UX DS
Berkeley MIDS
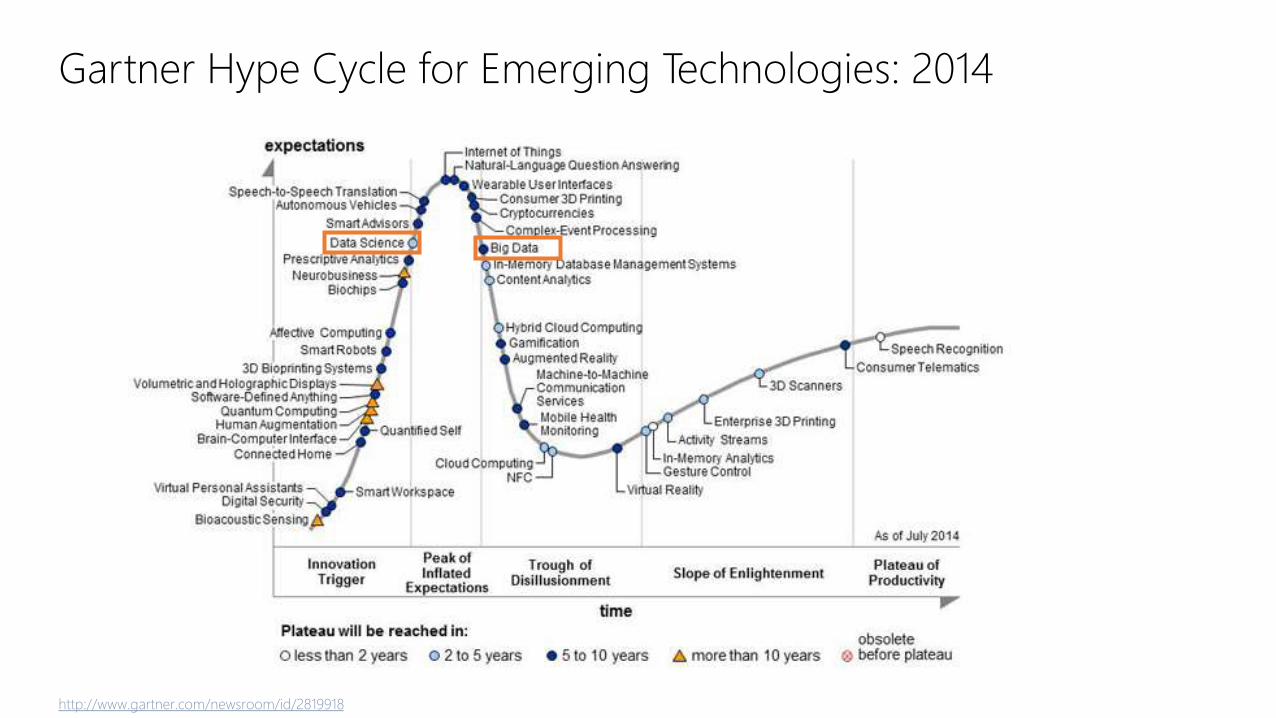
Gartner Hype Cycle for Emerging Technologies: 2014
http://www.gartner.com/newsroom/id/2819918
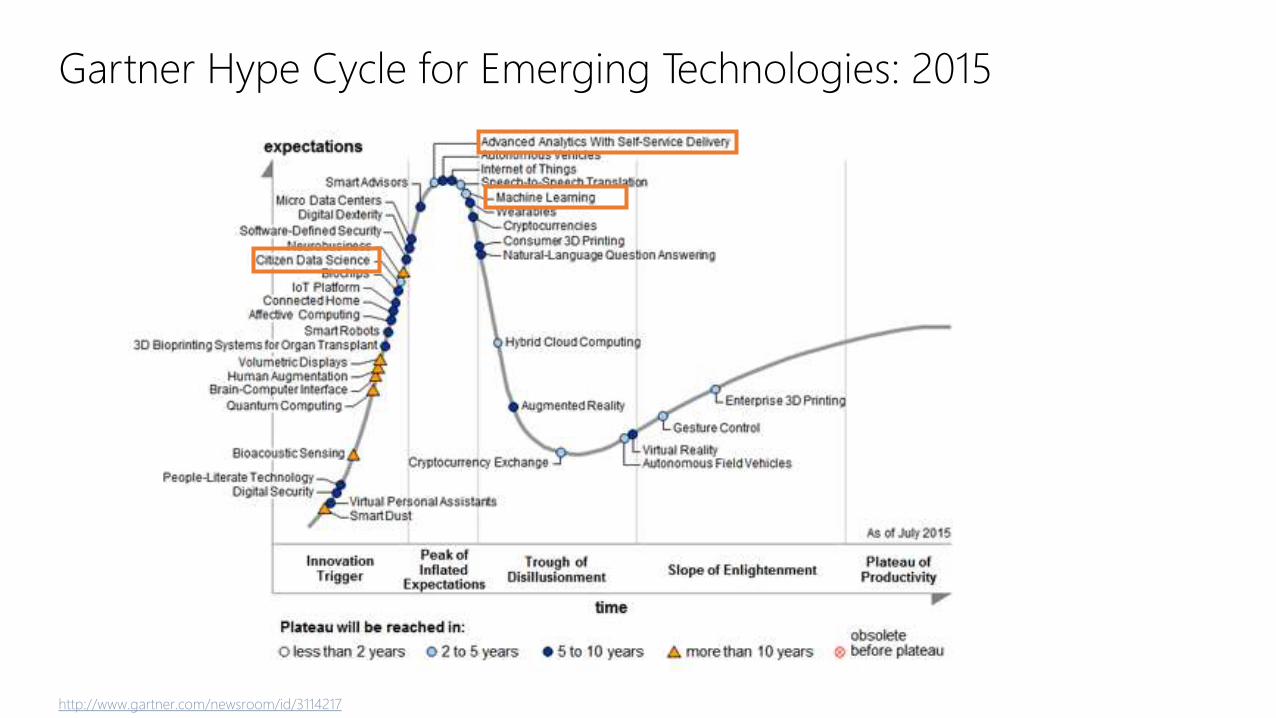
Gartner Hype Cycle for Emerging Technologies: 2015
http://www.gartner.com/newsroom/id/3114217

The Education Perspective
https://whatsthebigdata.com/2012/08/09/graduate-programs-in-big-data-and-data-science/
http://uxmastery.com/resources/ux-degrees/
84 78Graduate Degree
Programs in
Data Science
Graduate Degree
Programs in UX
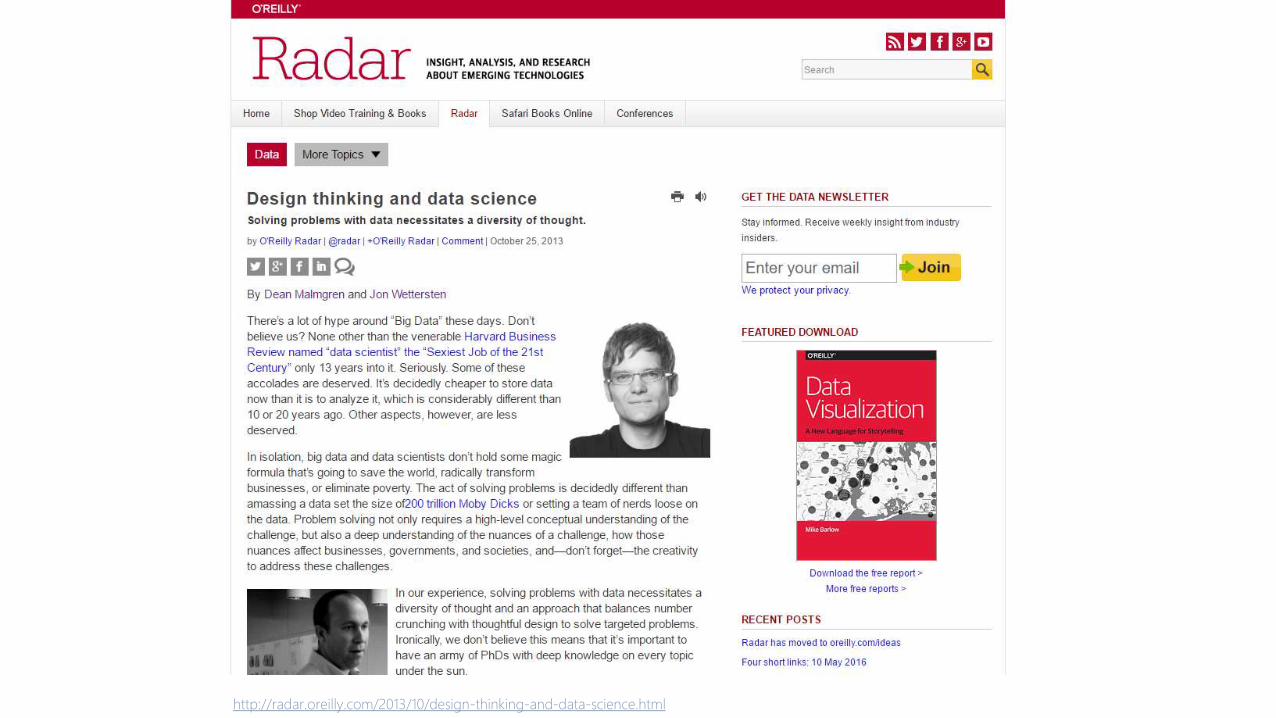
http://radar.oreilly.com/2013/10/design-thinking-and-data-science.html
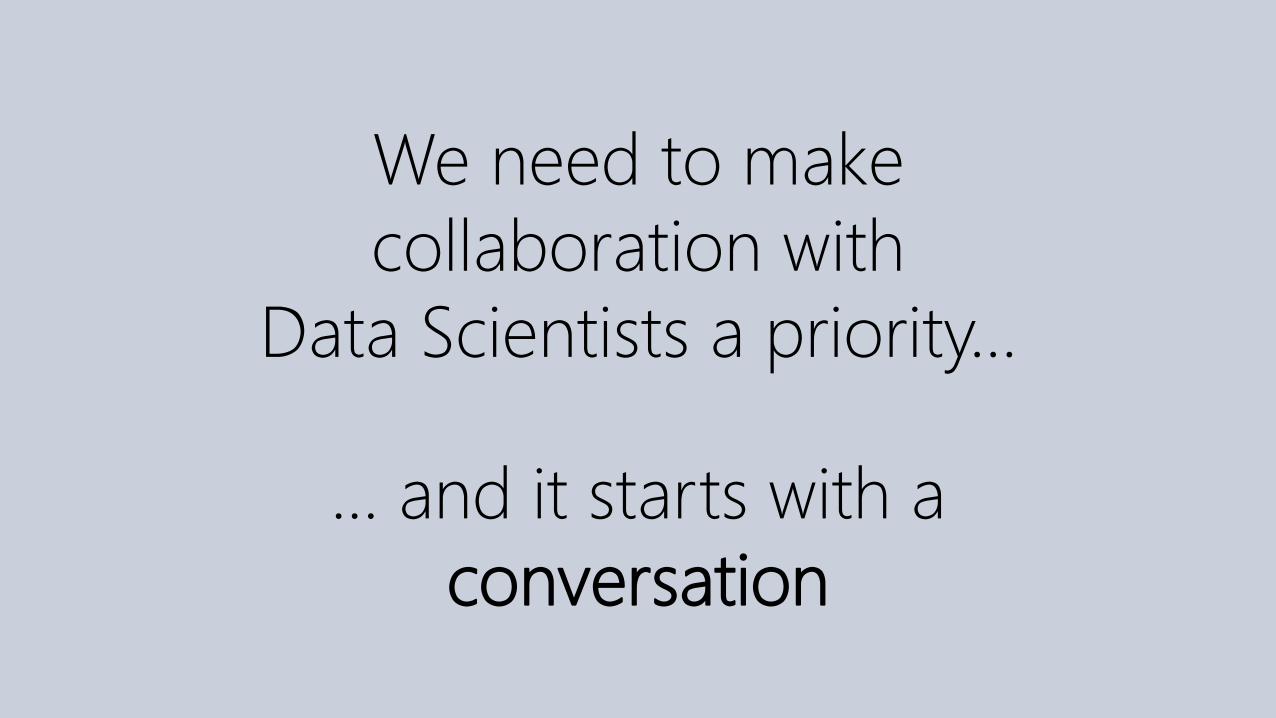
We need to make
collaboration with
Data Scientists a priority…
… and it starts with a
conversation

Tip #1
Stake Your Claim
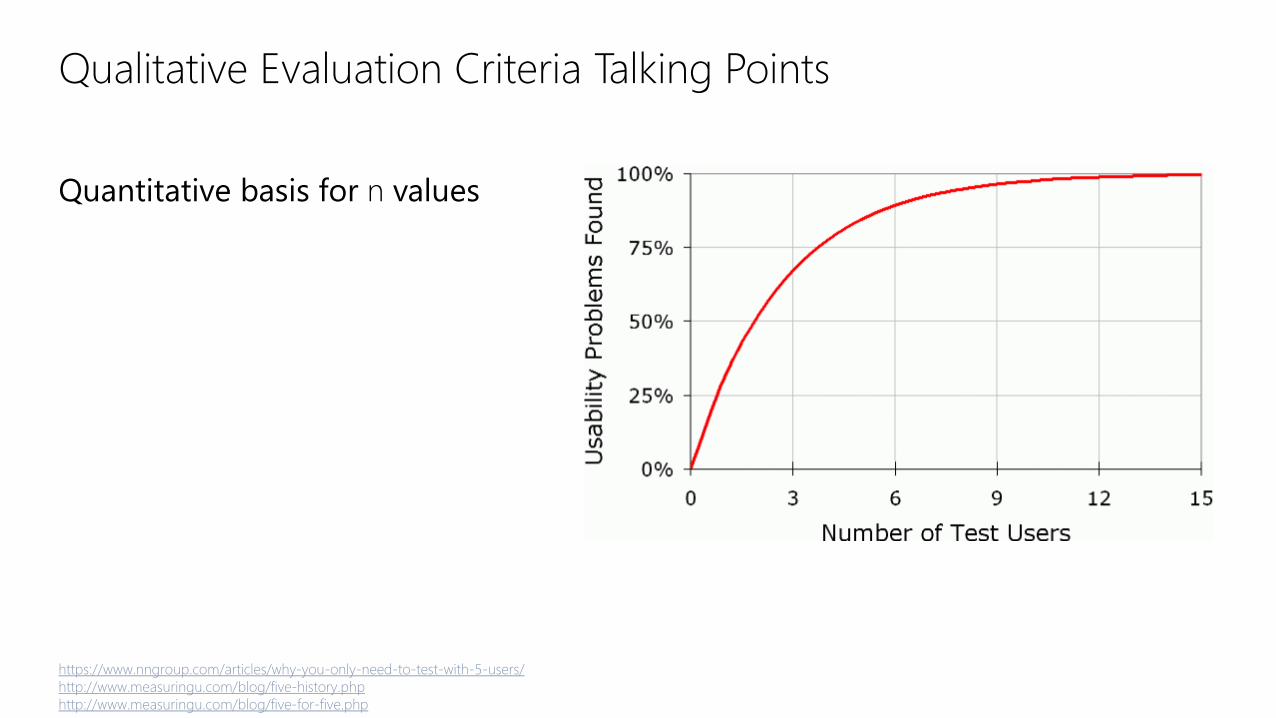
Qualitative Evaluation Criteria Talking Points
Quantitative basis for n values
https://www.nngroup.com/articles/why-you-only-need-to-test-with-5-users/
http://www.measuringu.com/blog/five-history.php
http://www.measuringu.com/blog/five-for-five.php
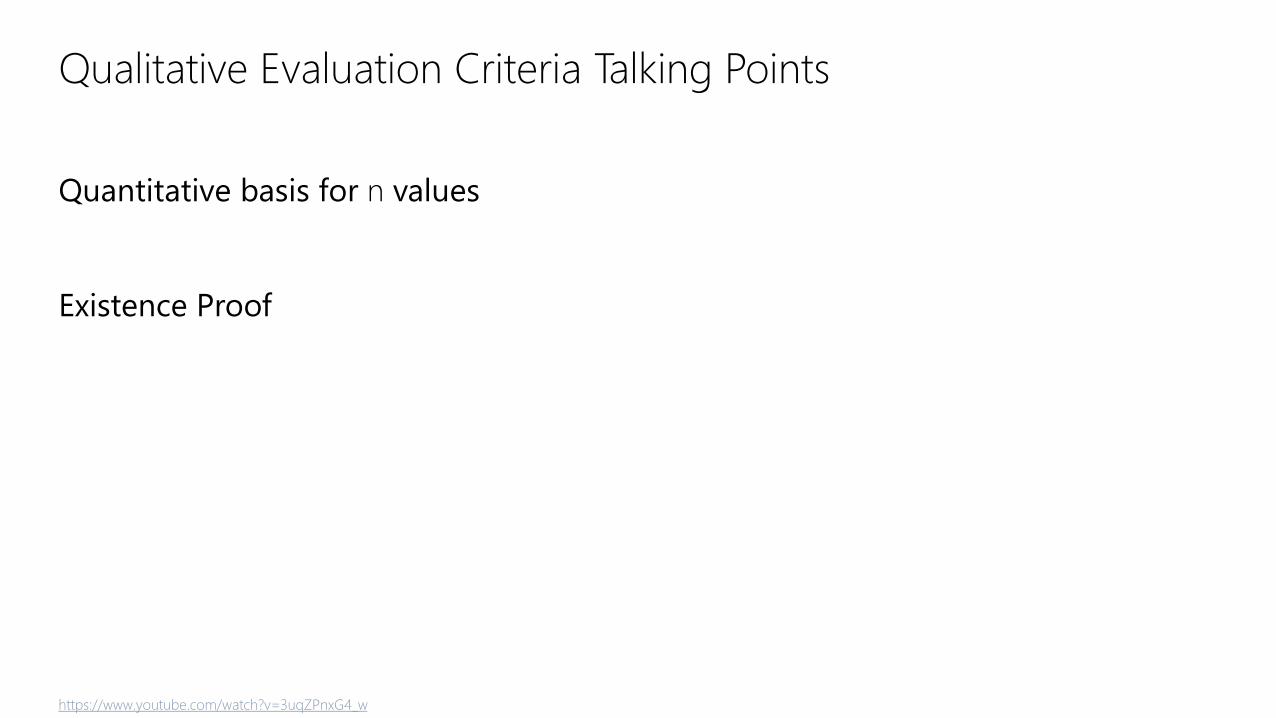
Qualitative Evaluation Criteria Talking Points
Quantitative basis for n values
Existence Proof
https://www.youtube.com/watch?v=3uqZPnxG4_w
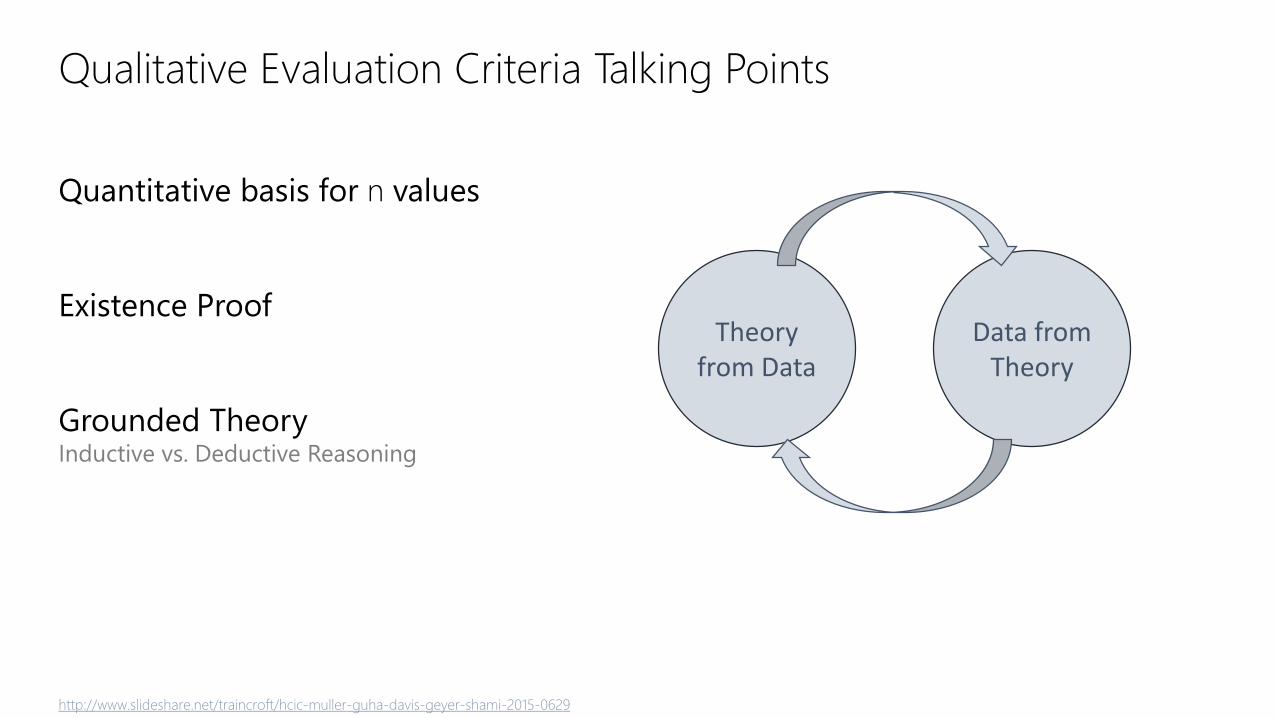
Qualitative Evaluation Criteria Talking Points
Quantitative basis for n values
Existence Proof
Grounded TheoryInductive vs. Deductive Reasoning
http://www.slideshare.net/traincroft/hcic-muller-guha-davis-geyer-shami-2015-0629
Theory from Data
Data from Theory
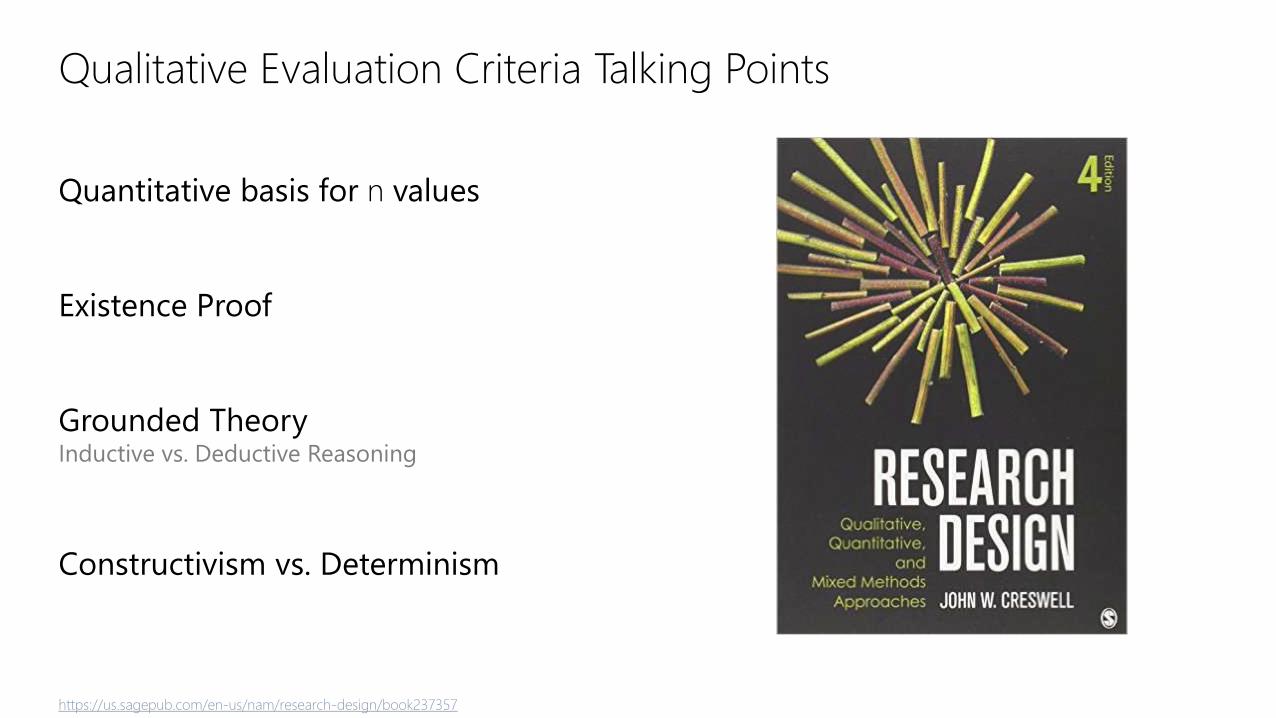
Qualitative Evaluation Criteria Talking Points
Quantitative basis for n values
Existence Proof
Grounded TheoryInductive vs. Deductive Reasoning
Constructivism vs. Determinism
https://us.sagepub.com/en-us/nam/research-design/book237357

Discussing evaluation criteria
for qualitative research
needs to be second nature.

What is your
mic drop moment?

Tip #1
Stake Your Claim

Tip #2
Speak the Language

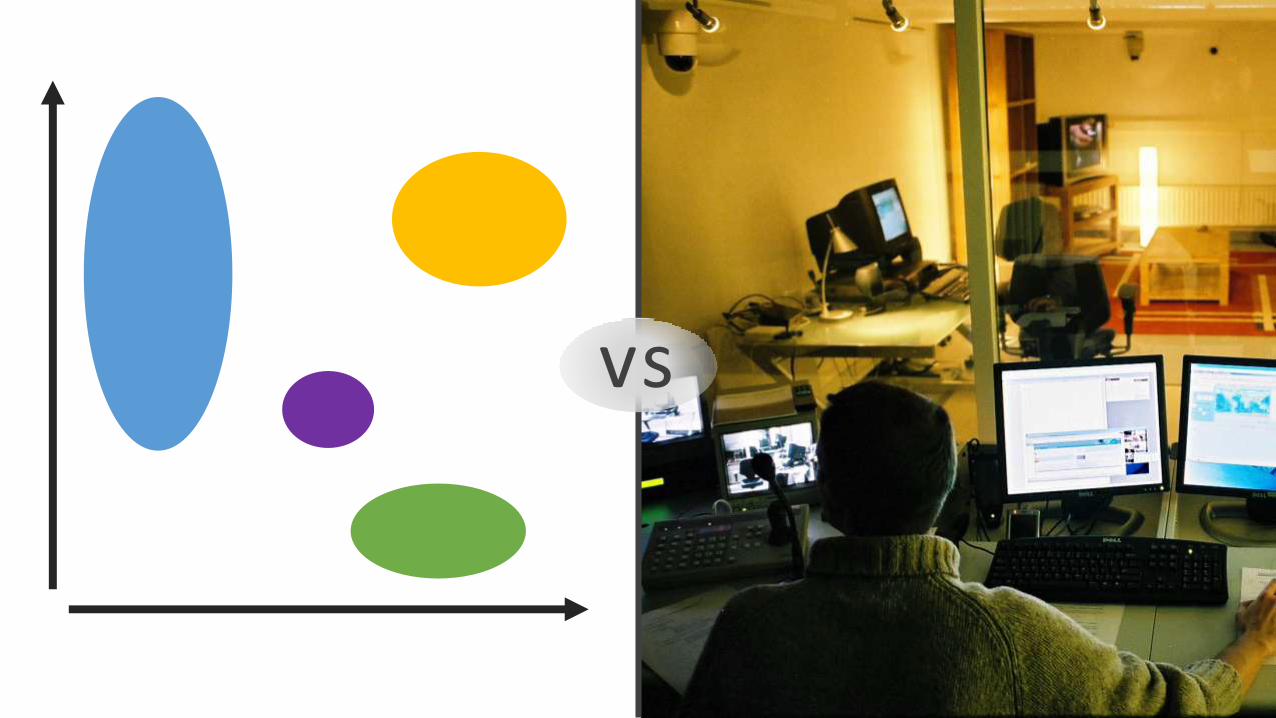
vs
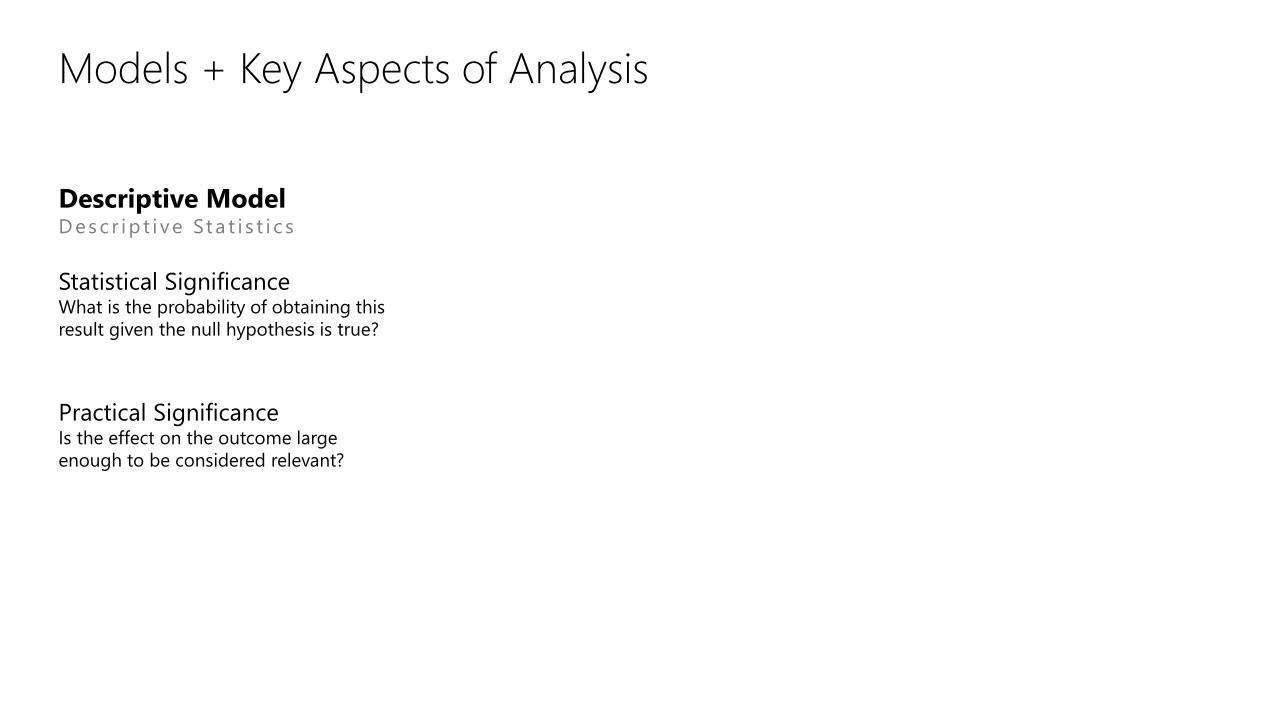
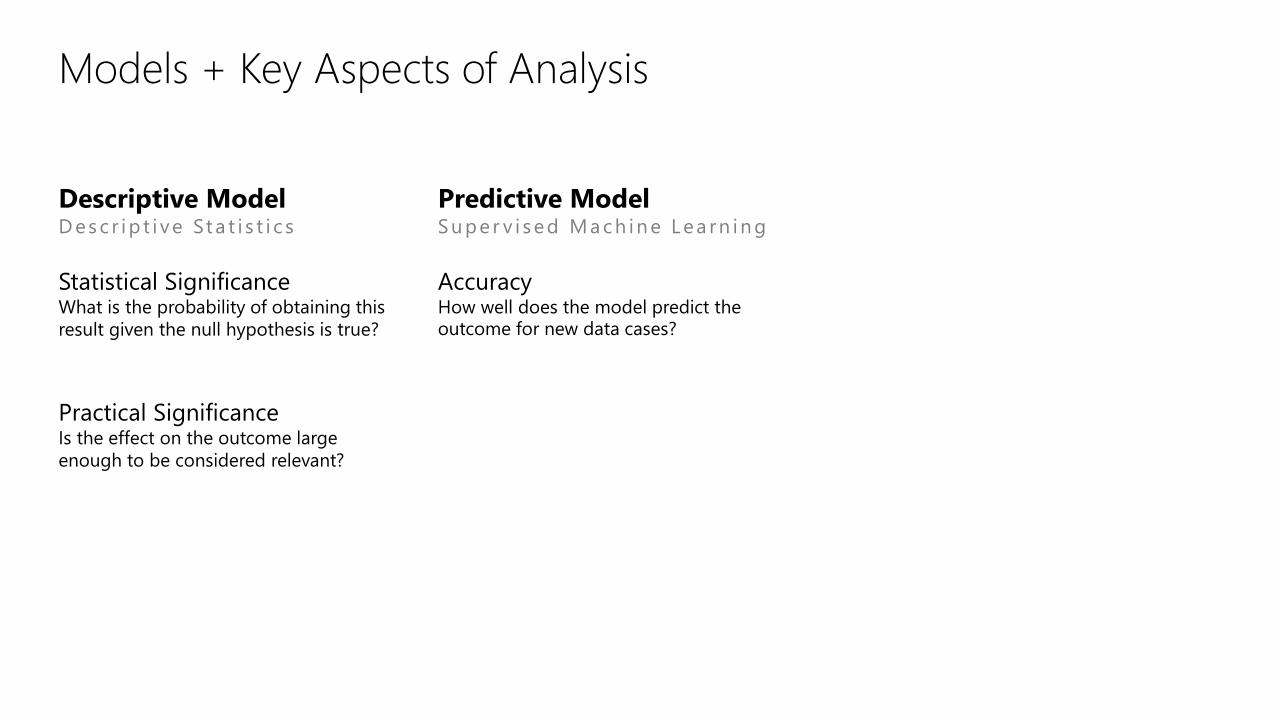
Models + Key Aspects of Analysis
Descriptive ModelD esc r ip t i ve Sta t i s t i c s
Statistical SignificanceWhat is the probability of obtaining this
result given the null hypothesis is true?
Practical SignificanceIs the effect on the outcome large
enough to be considered relevant?
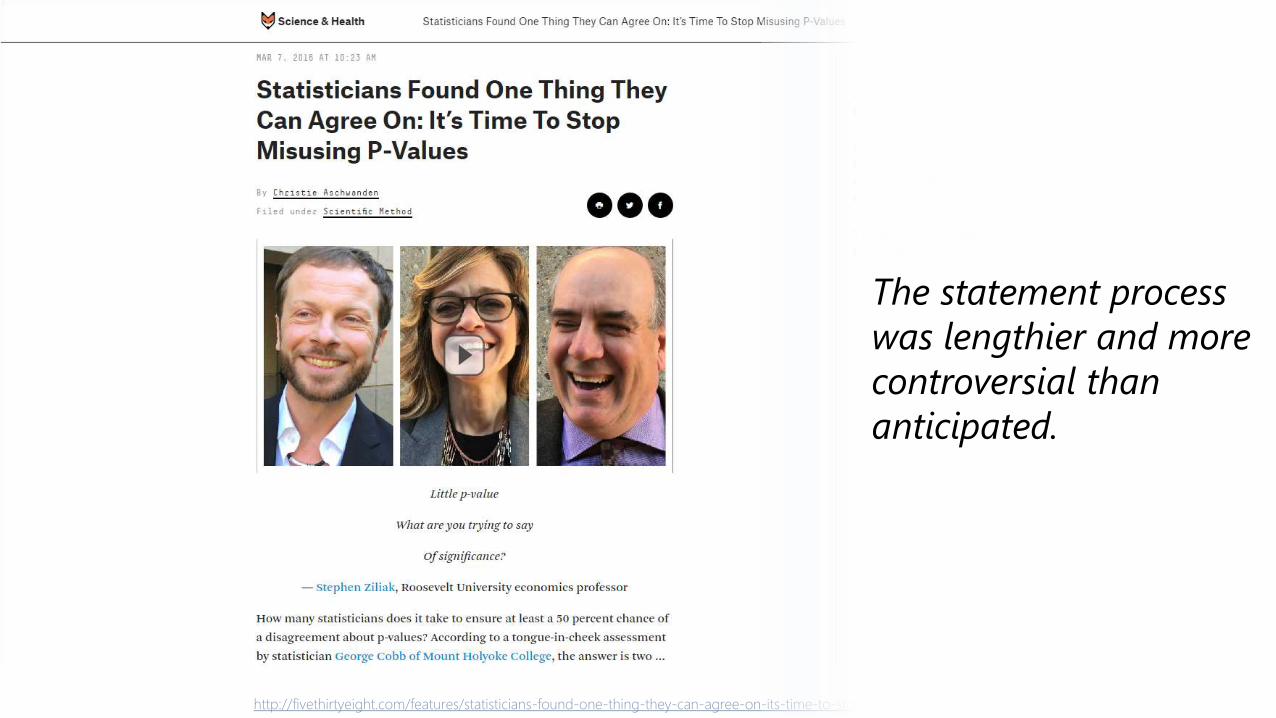
http://fivethirtyeight.com/features/statisticians-found-one-thing-they-can-agree-on-its-time-to-stop-misusing-p-values/
The statement process
was lengthier and more
controversial than
anticipated.
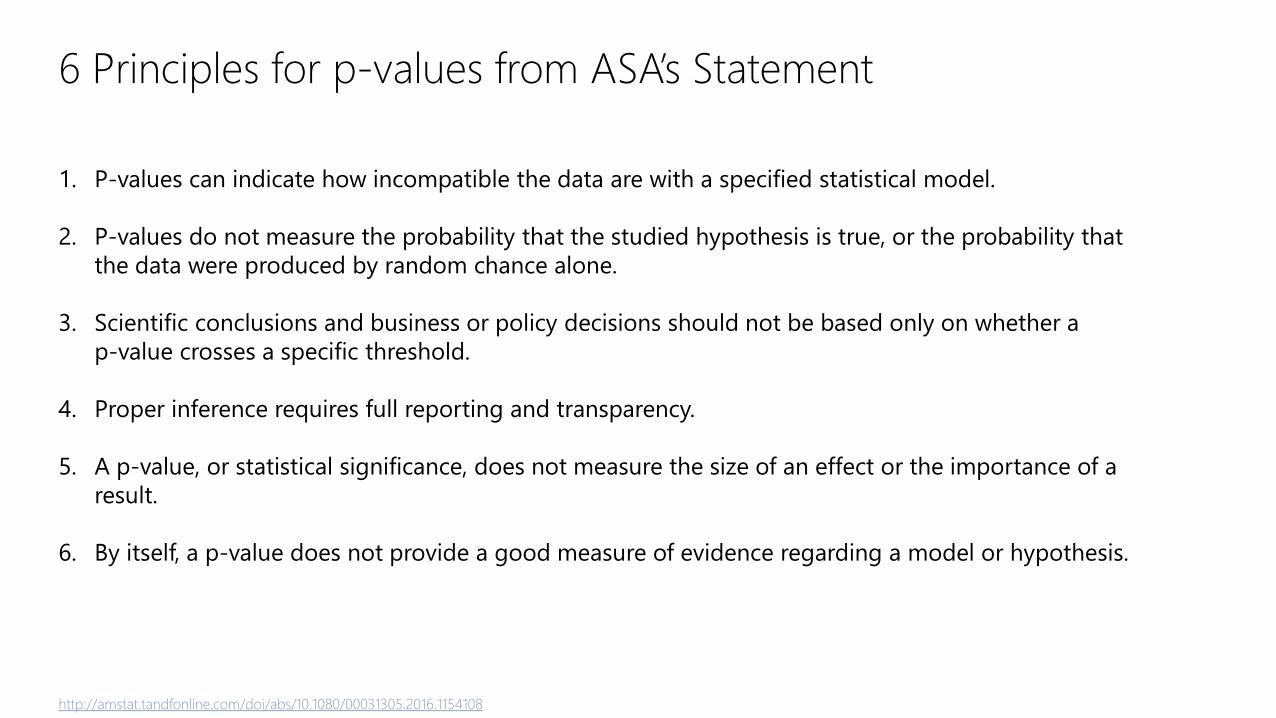
6 Principles for p-values from ASA’s Statement
1. P-values can indicate how incompatible the data are with a specified statistical model.
2. P-values do not measure the probability that the studied hypothesis is true, or the probability that
the data were produced by random chance alone.
3. Scientific conclusions and business or policy decisions should not be based only on whether a
p-value crosses a specific threshold.
4. Proper inference requires full reporting and transparency.
5. A p-value, or statistical significance, does not measure the size of an effect or the importance of a
result.
6. By itself, a p-value does not provide a good measure of evidence regarding a model or hypothesis.
http://amstat.tandfonline.com/doi/abs/10.1080/00031305.2016.1154108
Models + Key Aspects of Analysis
Descriptive ModelD esc r ip t i ve Sta t i s t i c s
Statistical SignificanceWhat is the probability of obtaining this
result given the null hypothesis is true?
Practical SignificanceIs the effect on the outcome large
enough to be considered relevant?
Predictive ModelSuper v i sed Ma ch ine Lea rn ing
AccuracyHow well does the model predict the outcome for new data cases?
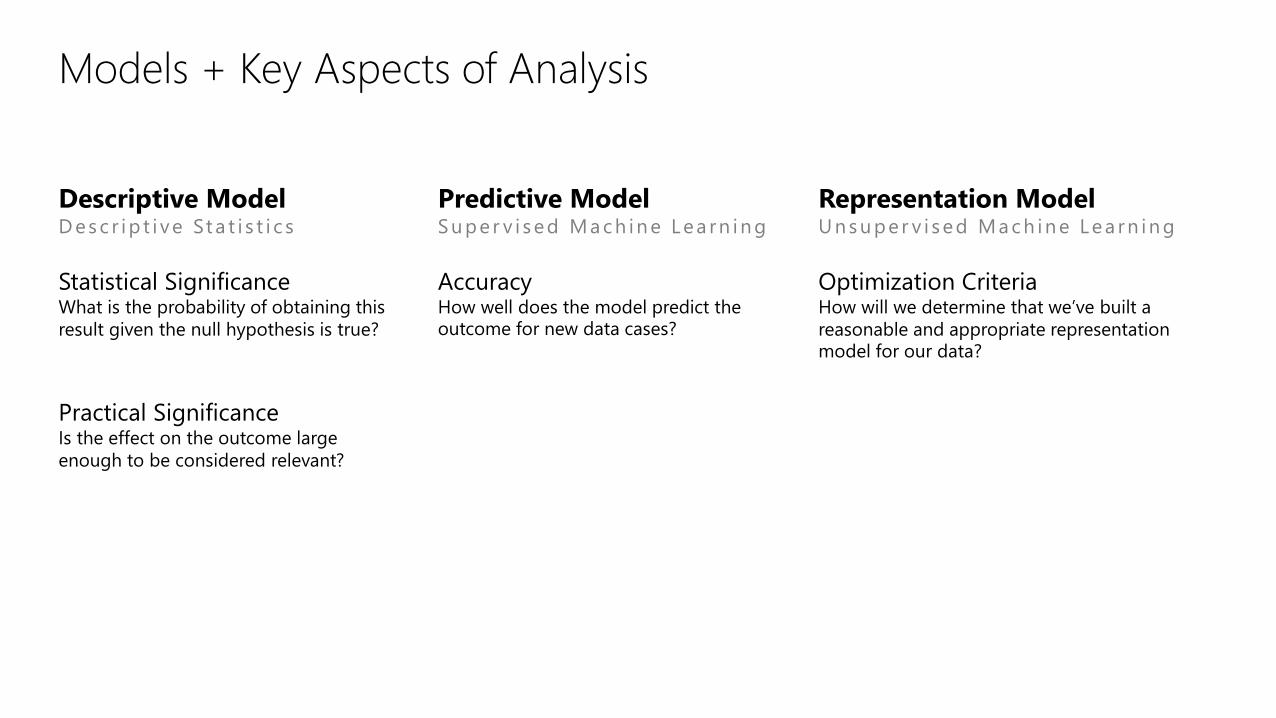
Representation ModelUnsuper v i sed Ma ch ine Lea rn ing
Optimization CriteriaHow will we determine that we’ve built a
reasonable and appropriate representation model for our data?
vs
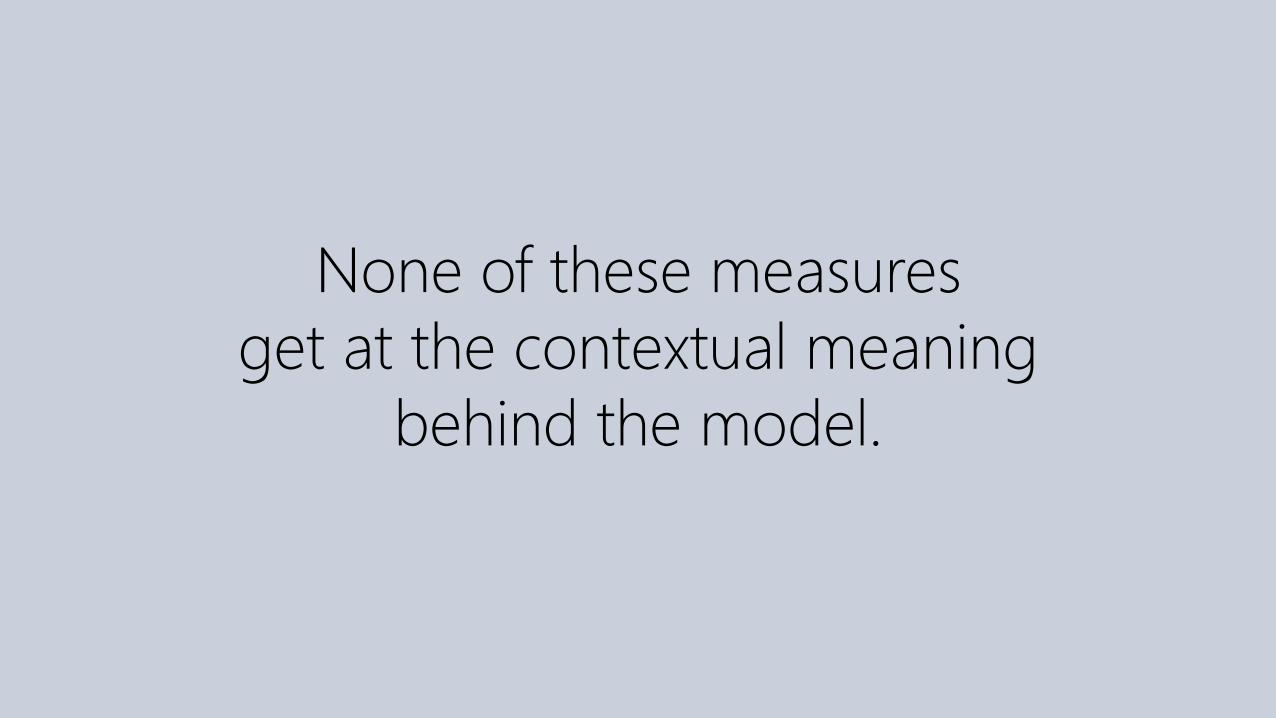
None of these measures
get at the contextual meaning
behind the model.
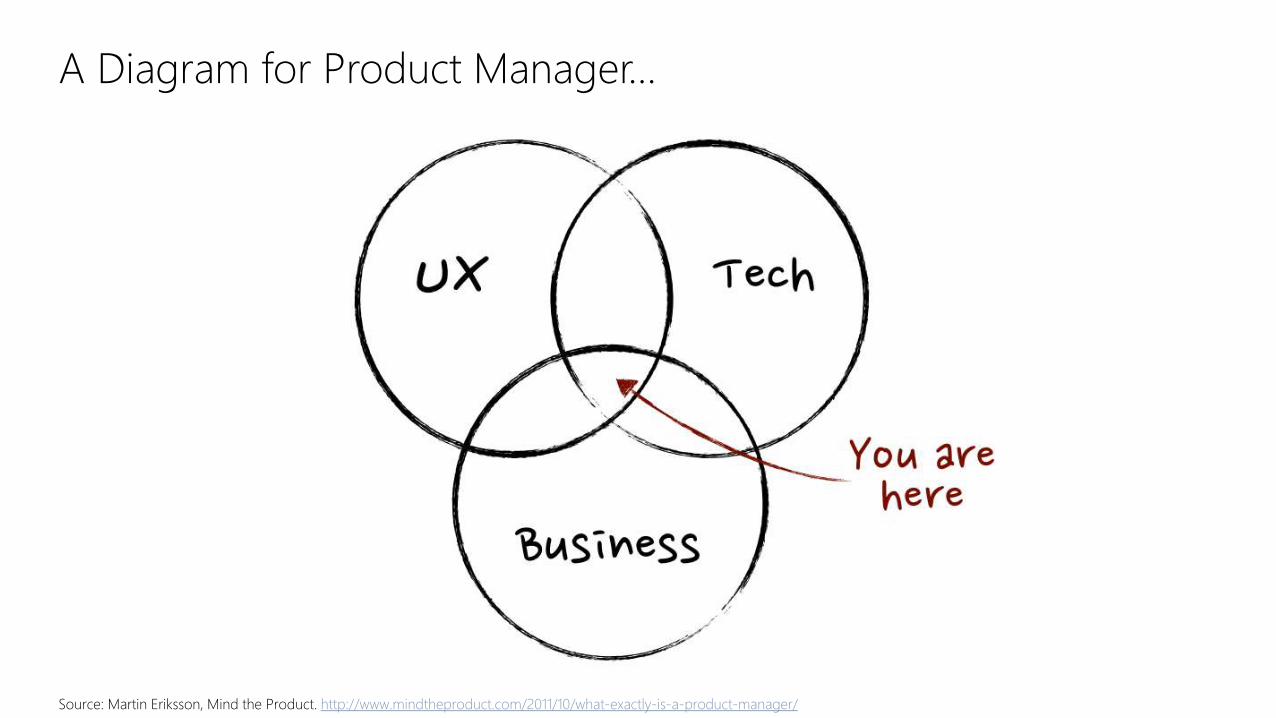
A Diagram for Product Manager…
Source: Martin Eriksson, Mind the Product. http://www.mindtheproduct.com/2011/10/what-exactly-is-a-product-manager/
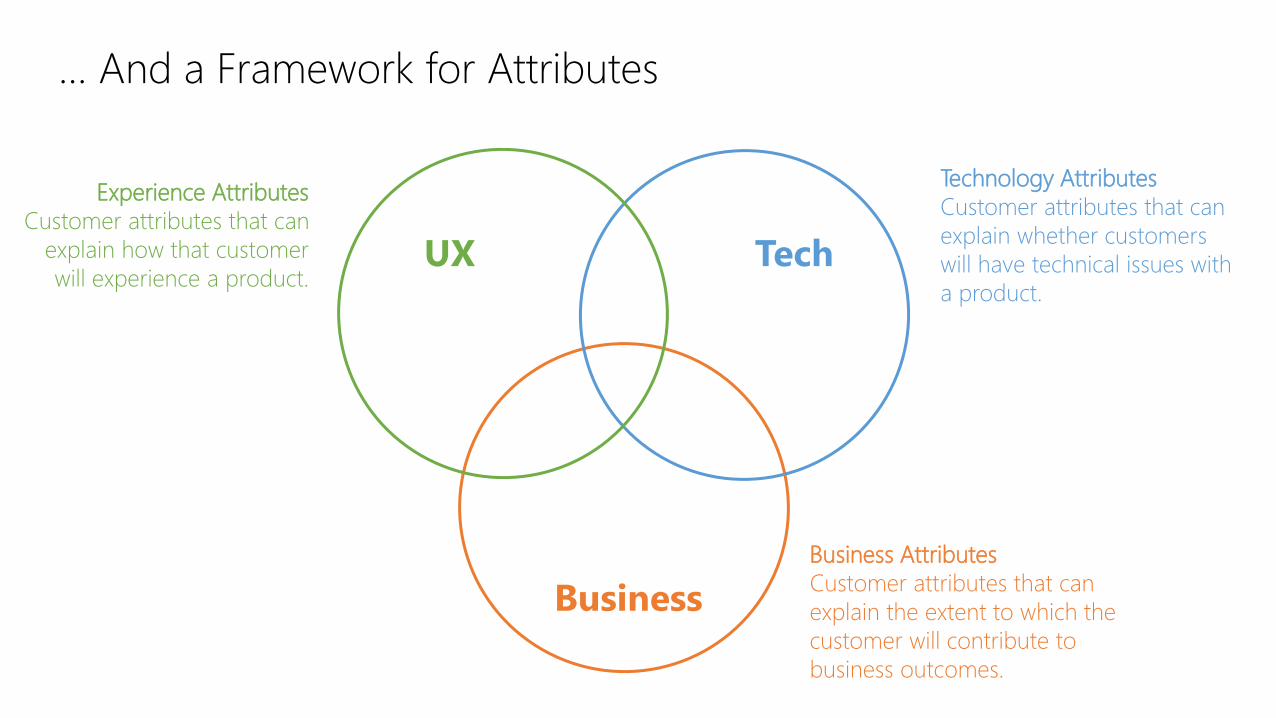
… And a Framework for Attributes
UX
Business
Tech
Experience Attributes
Customer attributes that can
explain how that customer
will experience a product.
Technology Attributes
Customer attributes that can
explain whether customers
will have technical issues with
a product.
Business Attributes
Customer attributes that can
explain the extent to which the
customer will contribute to
business outcomes.
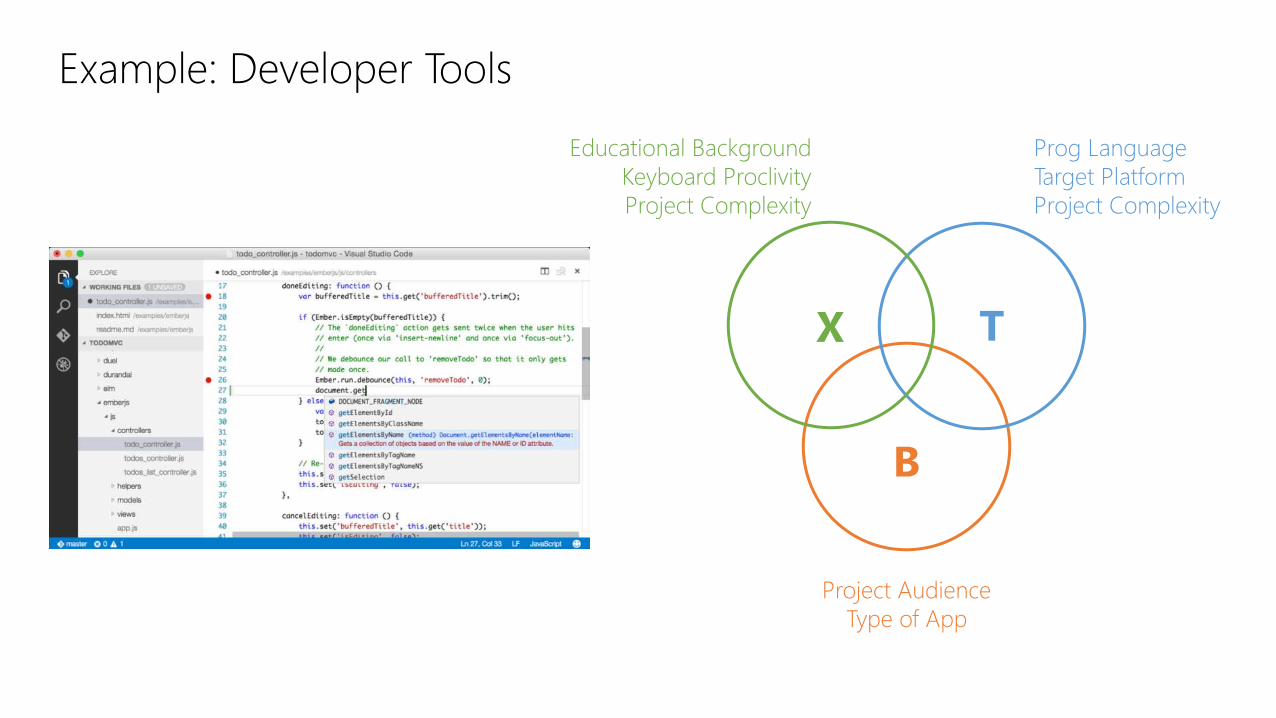
Example: Developer Tools
X
B
T
Prog Language
Target Platform
Project Complexity
Project Audience
Type of App
Educational Background
Keyboard Proclivity
Project Complexity
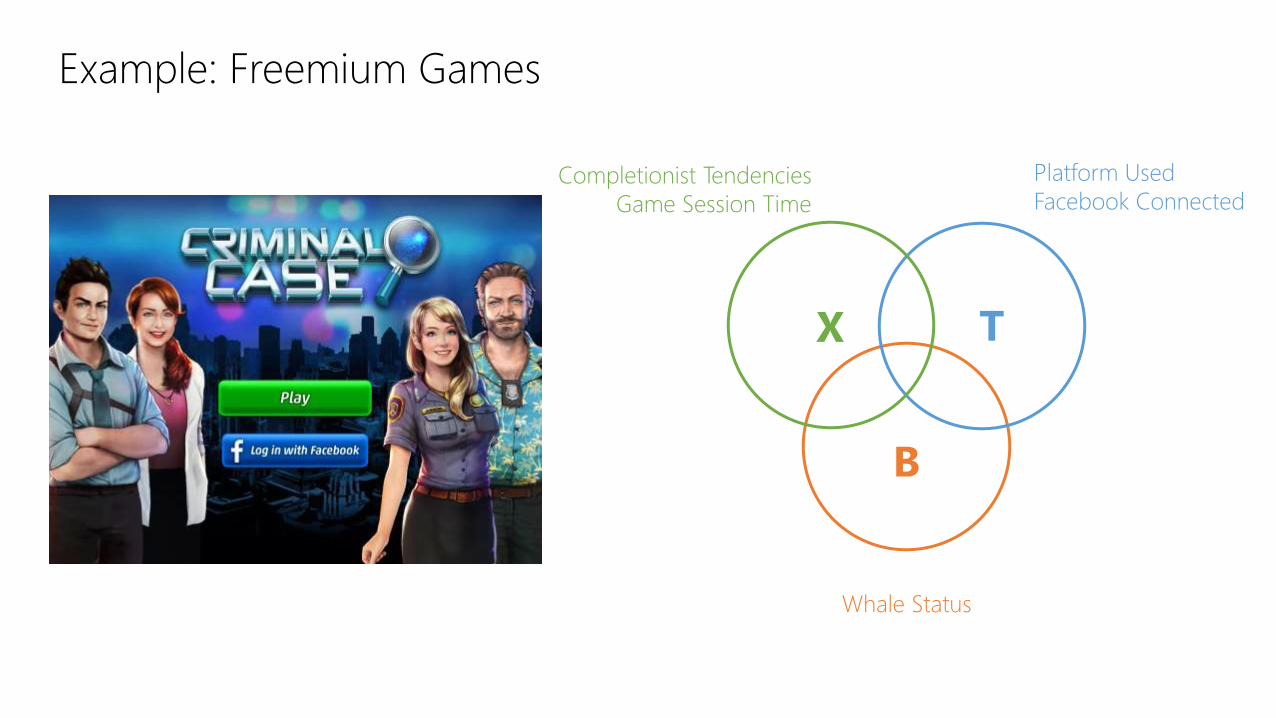
Example: Freemium Games
X
B
T
Platform Used
Facebook Connected
Whale Status
Completionist Tendencies
Game Session Time
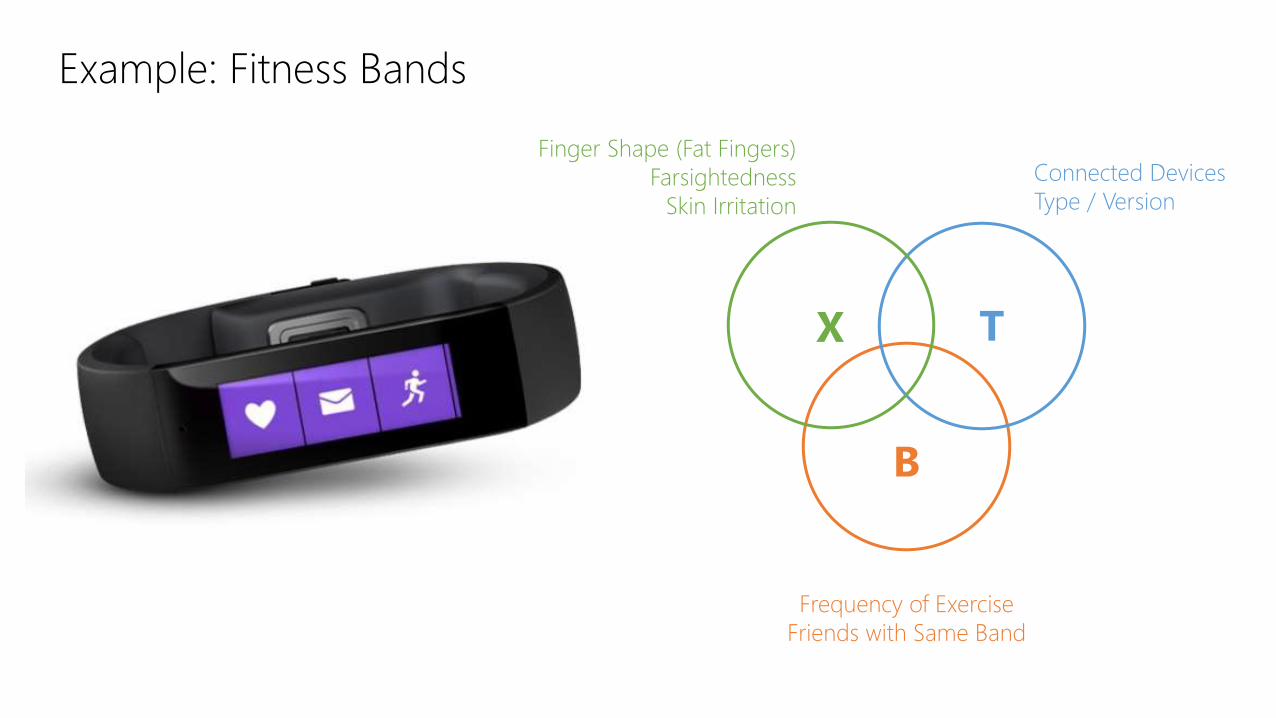
Example: Fitness Bands
X
B
T
Connected Devices
Type / Version
Frequency of Exercise
Friends with Same Band
Finger Shape (Fat Fingers)
Farsightedness
Skin Irritation

We are uniquely qualified
to articulate the experience
attributes of our products.

Tip #2
Speak the Language

Tip #3
Get Involved
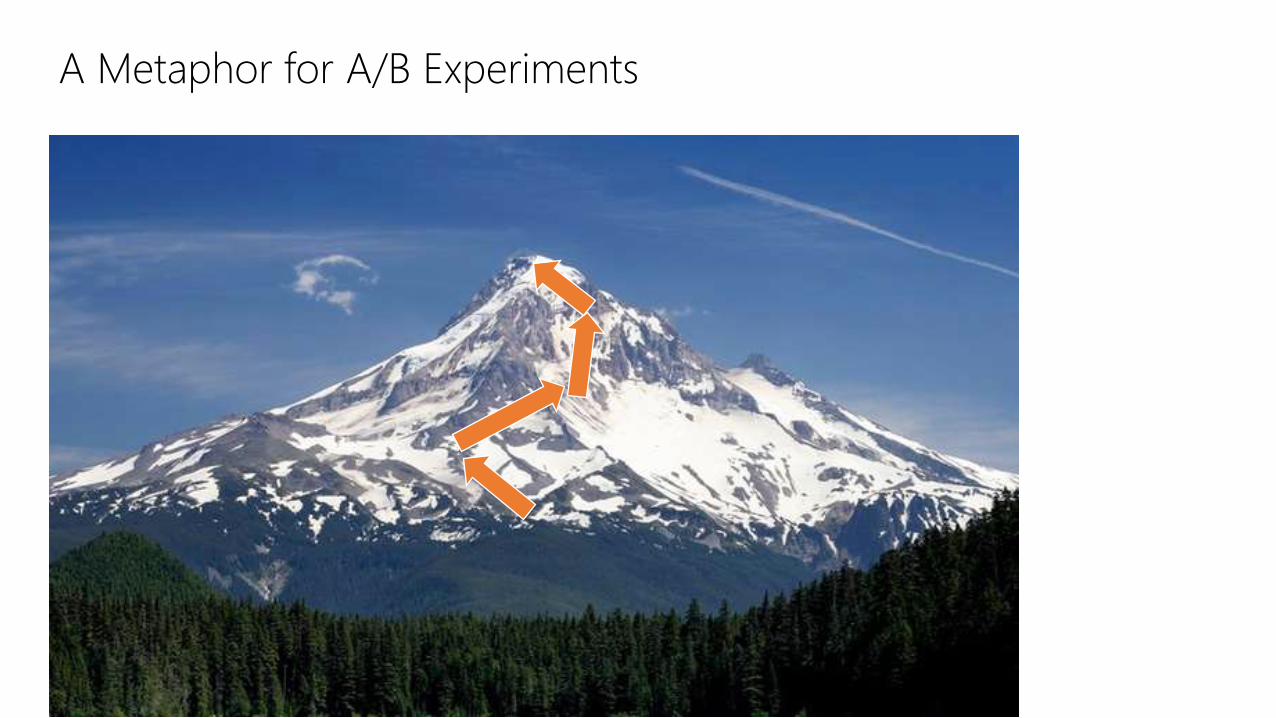
A Metaphor for A/B Experiments
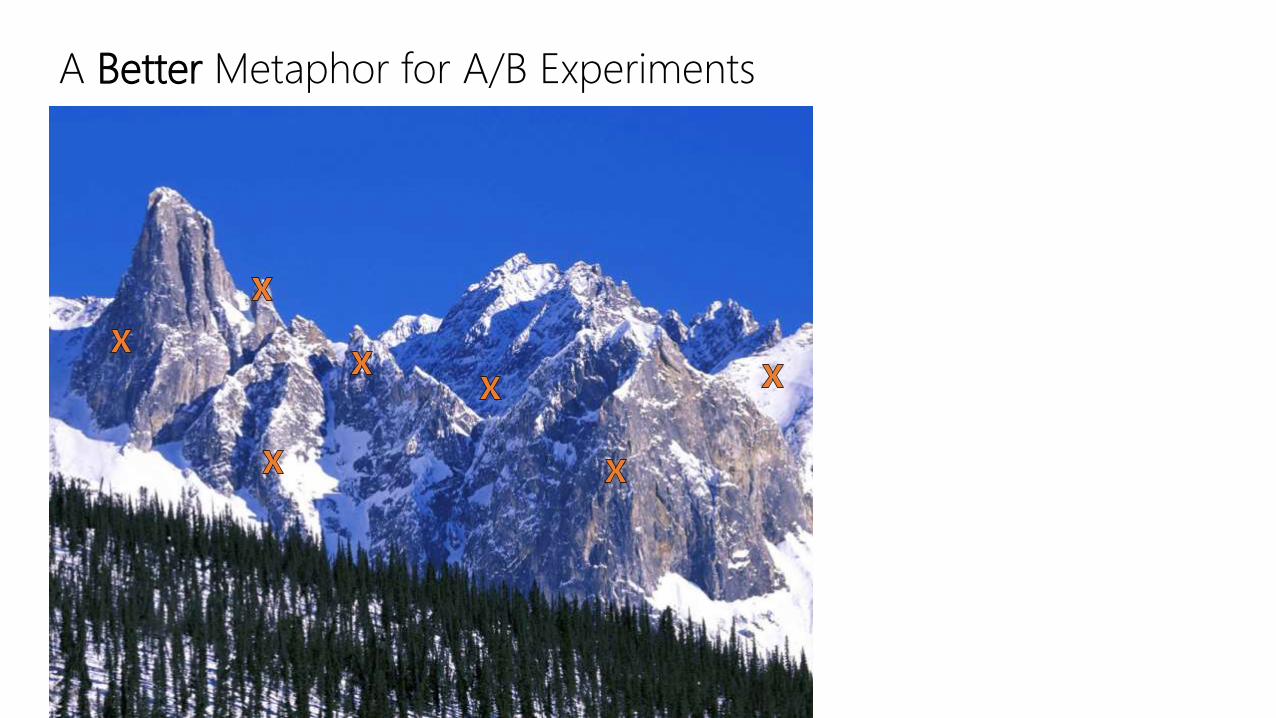
A Better Metaphor for A/B Experiments
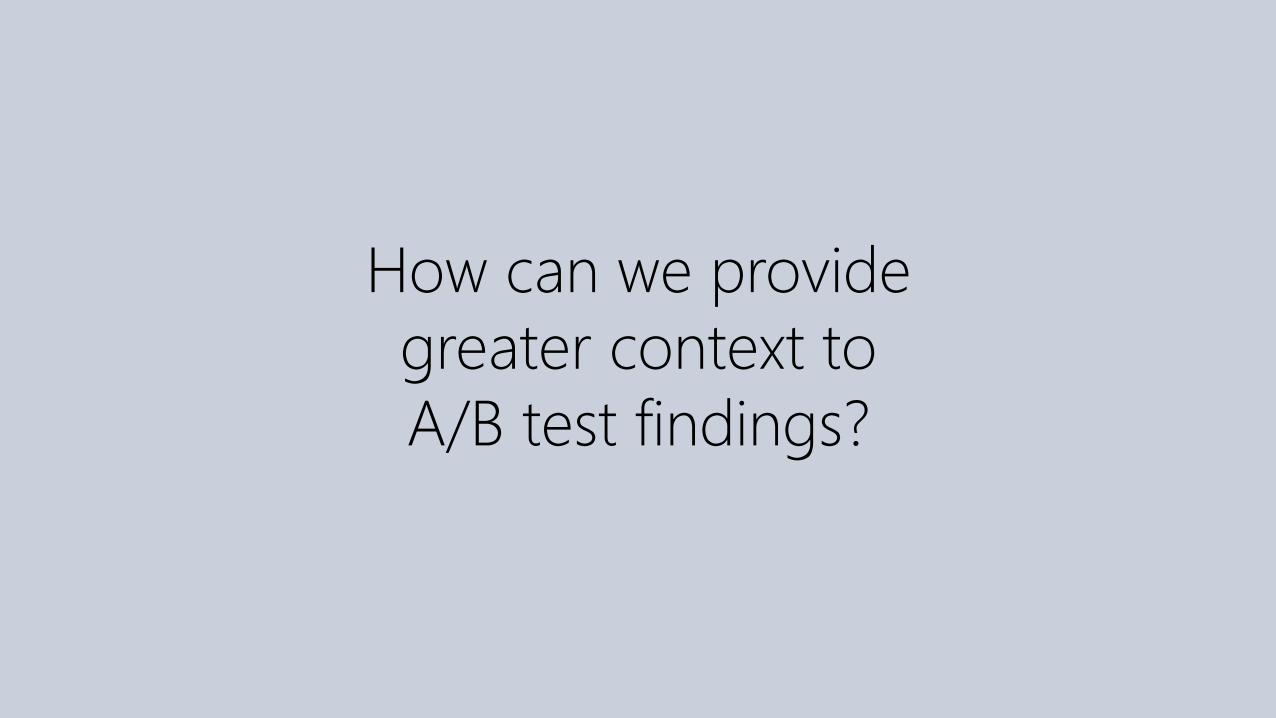
How can we provide
greater context to
A/B test findings?
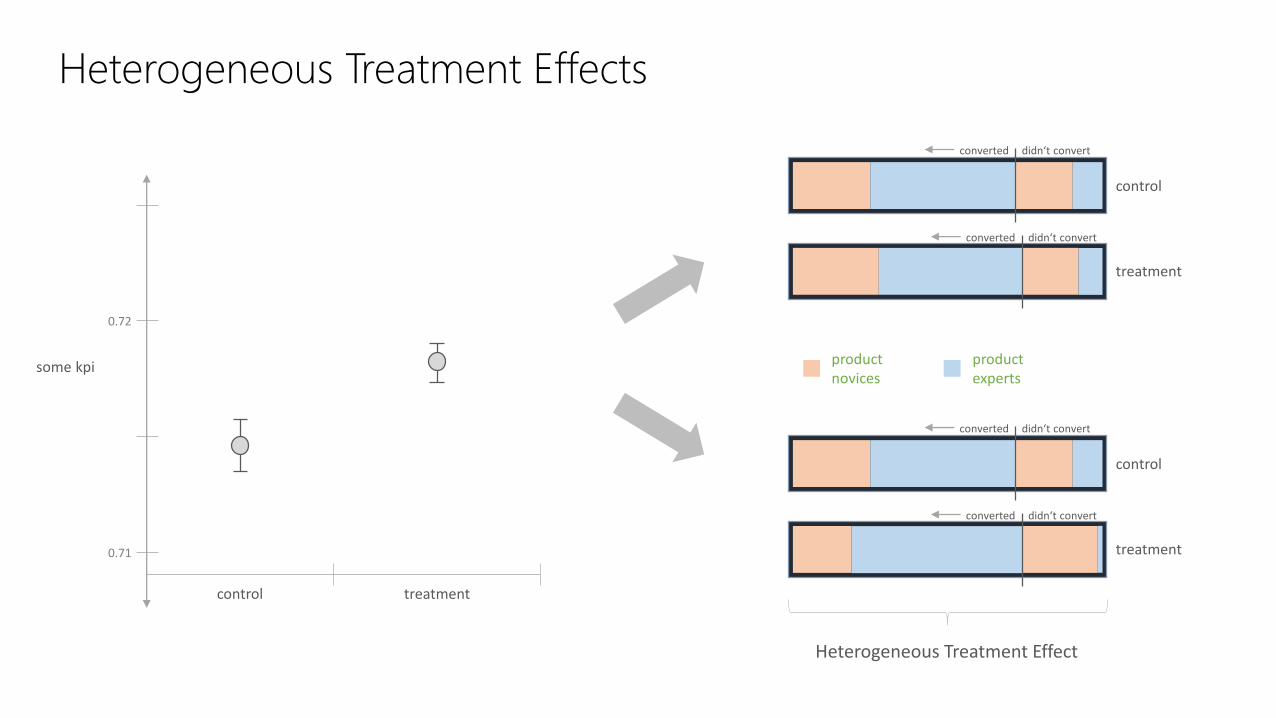
Heterogeneous Treatment Effects
control treatment
some kpi
0.71
0.72
productexperts
productnovices
control
treatment
converted didn‘t convert
converted didn‘t convert
control
treatment
converted didn‘t convert
converted didn‘t convert
Heterogeneous Treatment Effect
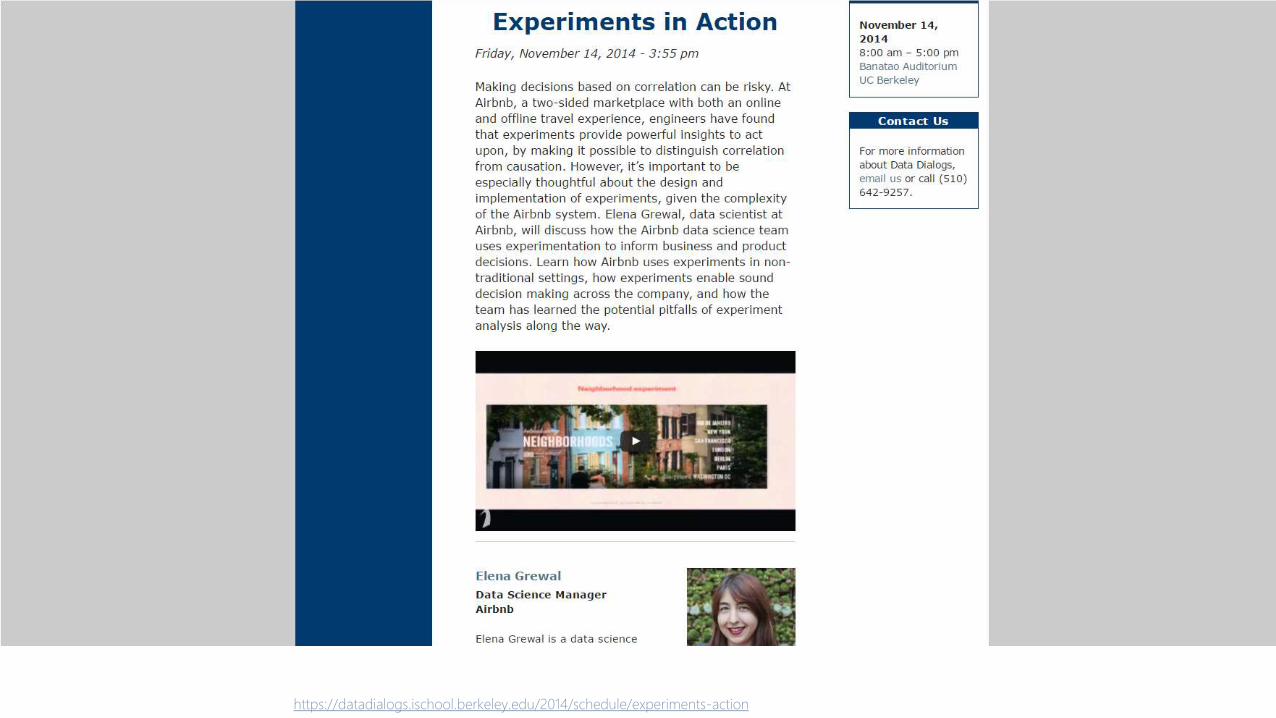
https://datadialogs.ischool.berkeley.edu/2014/schedule/experiments-action

Tip #1: Stake Your Claim
Tip #2: Speak the Language
Tip #3: Get Involved
Mixed Methods Research in the Age of Big Data
A Primer for UX Professionals
http://www.uxpa.org/sessionsurvey?sessionid=113