Embed Size (px)
Citation preview
WHERE IS THE MONEY?
cc: Cristiano Betta - https://www.flickr.com/photos/45488928@N00
PRACTICAL STEPS TOWARD INSIGHTFUL PHILANTHROPY FUNDRAISING
Format Why growing giving matters Overview of UK wealth dynamics Some methods Q&A
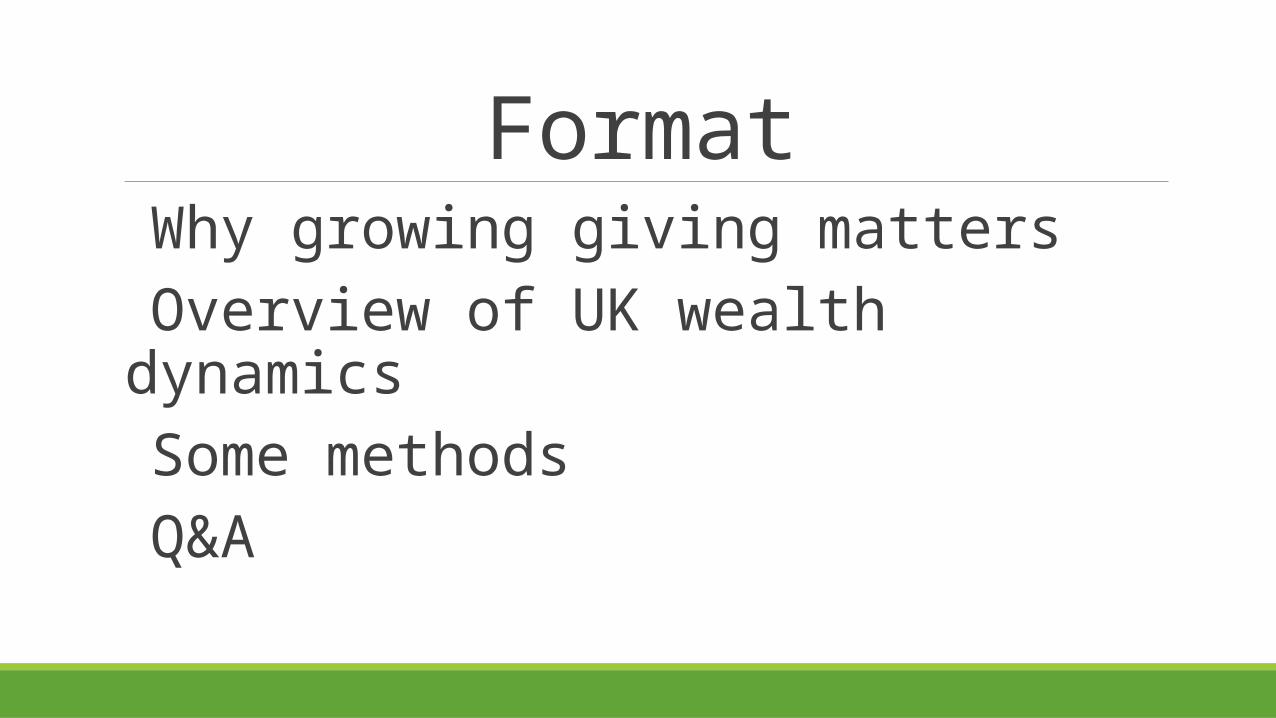
Why Growth Matters FPS & stricter controls on marketing; forecasted shortfalls (NCVO, RNLI); government austerity
Younger generations agnostic on achieving social impact; CSR, ethical goods Mixed/’layered’ funding; social finance evolving, growing
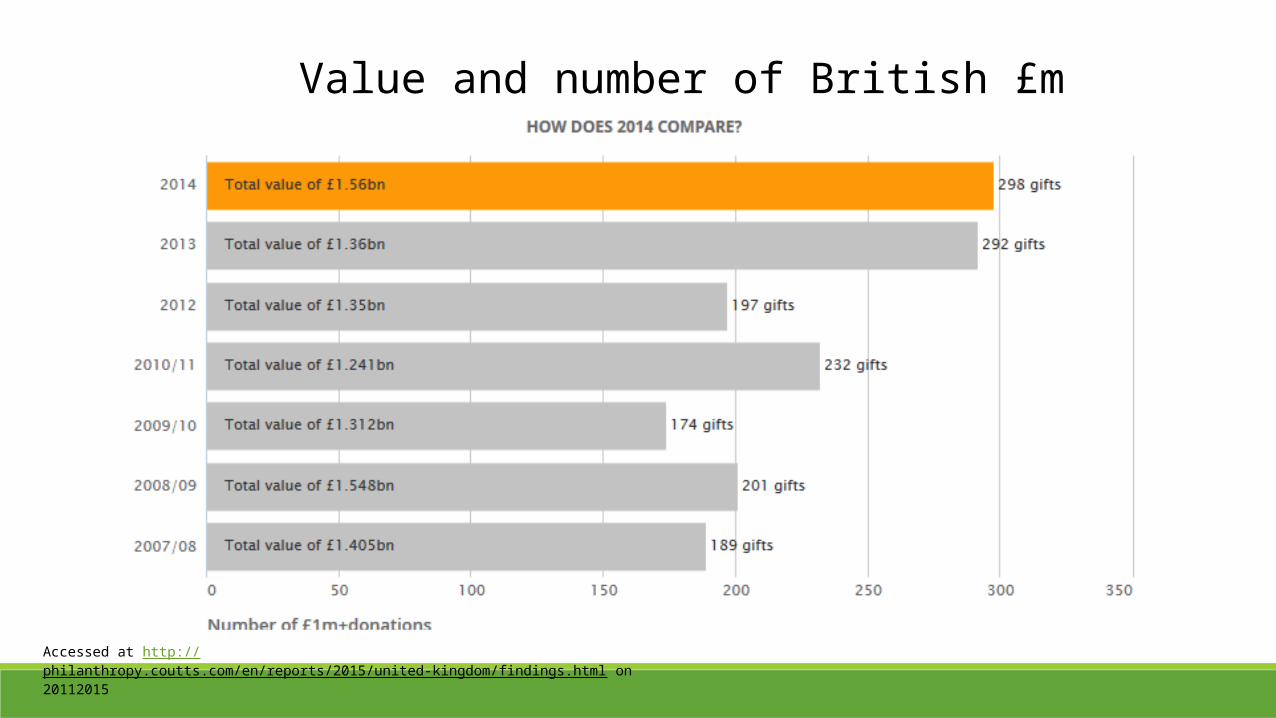
Value and number of British £m donations
Accessed at http://philanthropy.coutts.com/en/reports/2015/united-kingdom/findings.html on 20112015
Top Wealth in the UK UK HNWI population of roughly 500,000, estimated net worth of ~$2trn
Those highest on the income scale have seen the highest growth in wealth
According to the ST Rich List 2015, the wealthiest 1,000 people worth £547bn…
2% of this would double UK fundraised income
Next: four dimensions of wealth:• Change over time • Wages • Geography• Wealth vs
Affluence
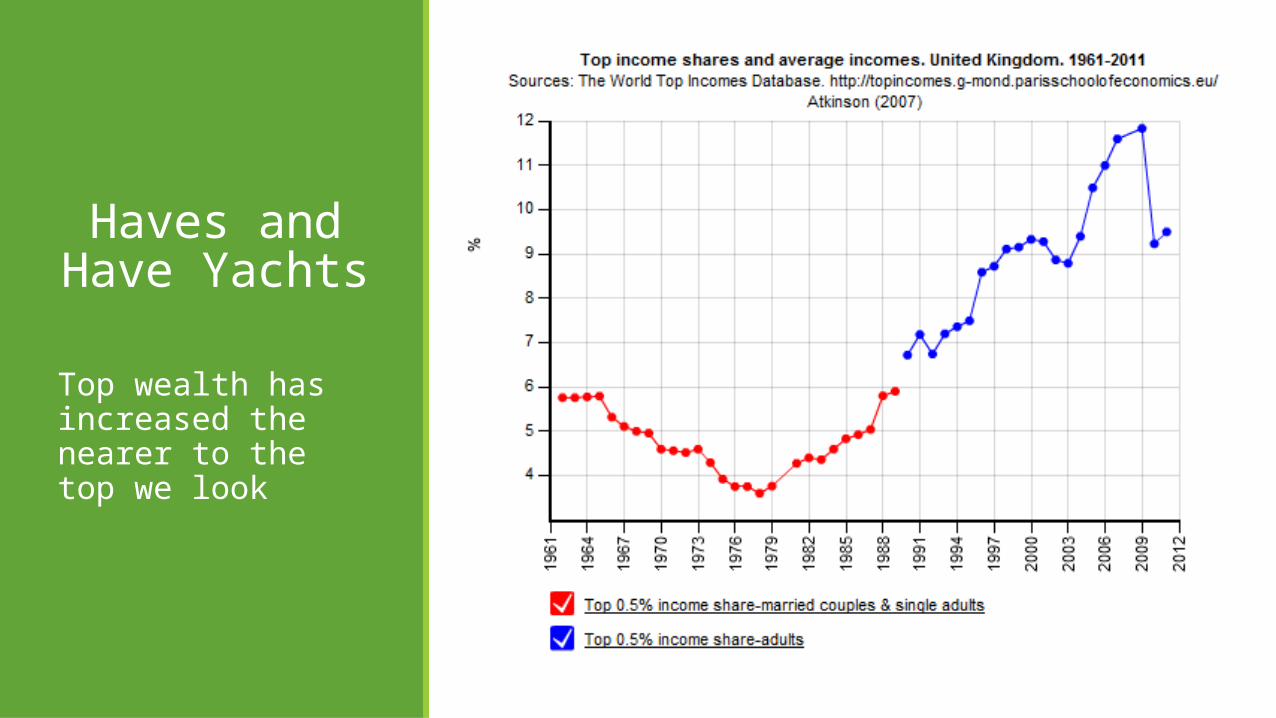
Haves and Have Yachts
Top wealth has increased the nearer to the top we look
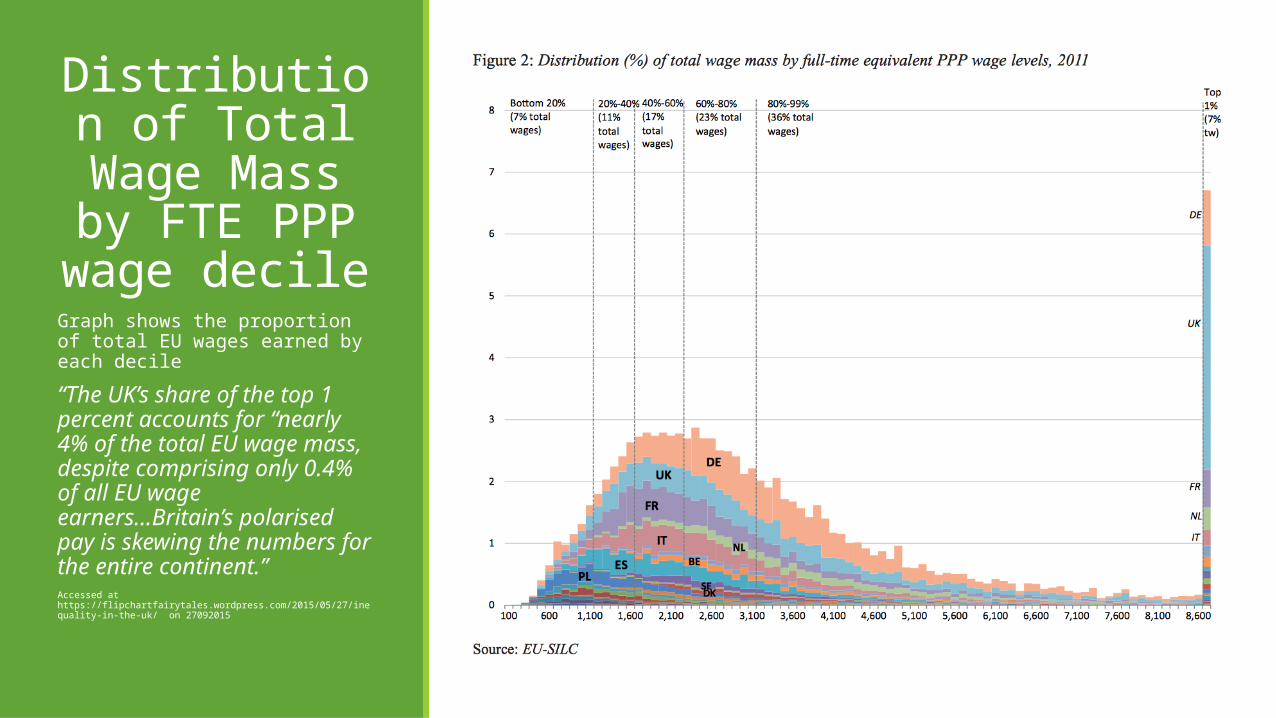
Distribution of Total Wage Mass by FTE
PPP wage decile
Graph shows the proportion of total EU wages earned by each decile
“The UK’s share of the top 1 percent accounts for “nearly 4% of the total EU wage mass, despite comprising only 0.4% of all EU wage earners...Britain’s polarised pay is skewing the numbers for the entire continent.”Accessed at https://flipchartfairytales.wordpress.com/2015/05/27/inequality-in-the-uk/ on 27092015
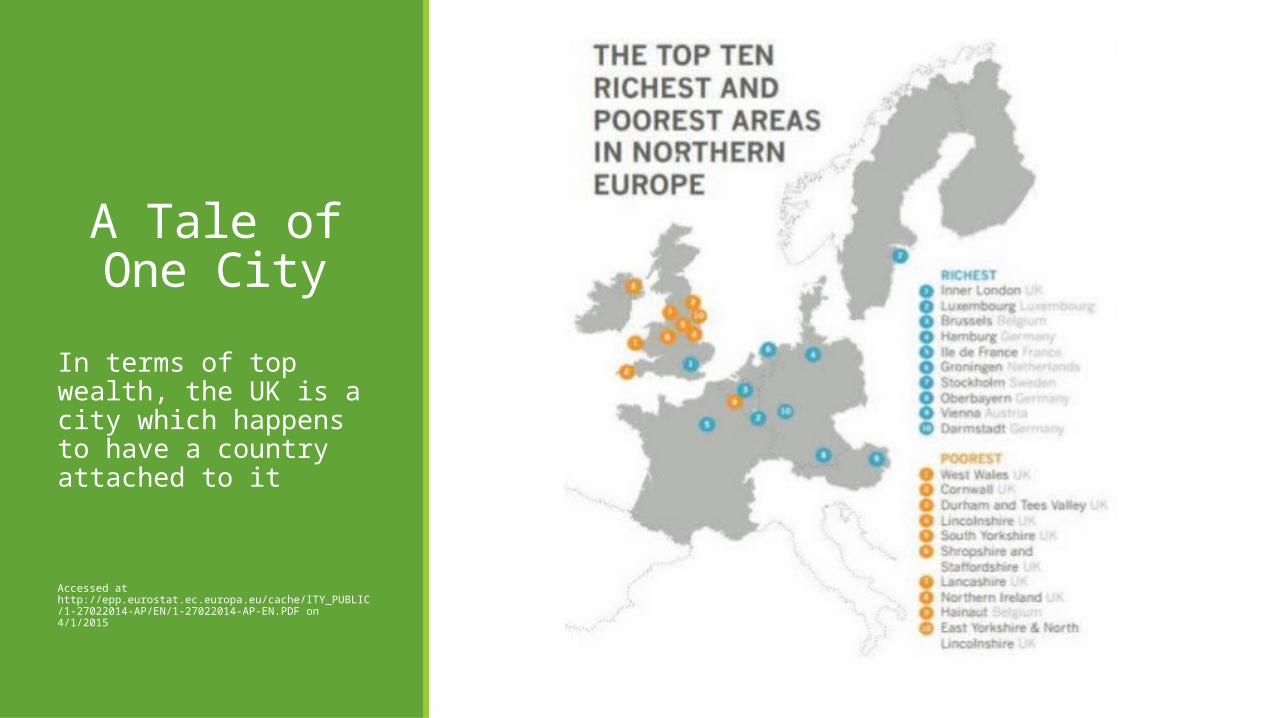
A Tale of One City
In terms of top wealth, the UK is a city which happens to have a country attached to it
Accessed at http://epp.eurostat.ec.europa.eu/cache/ITY_PUBLIC/1-27022014-AP/EN/1-27022014-AP-EN.PDF on 4/1/2015
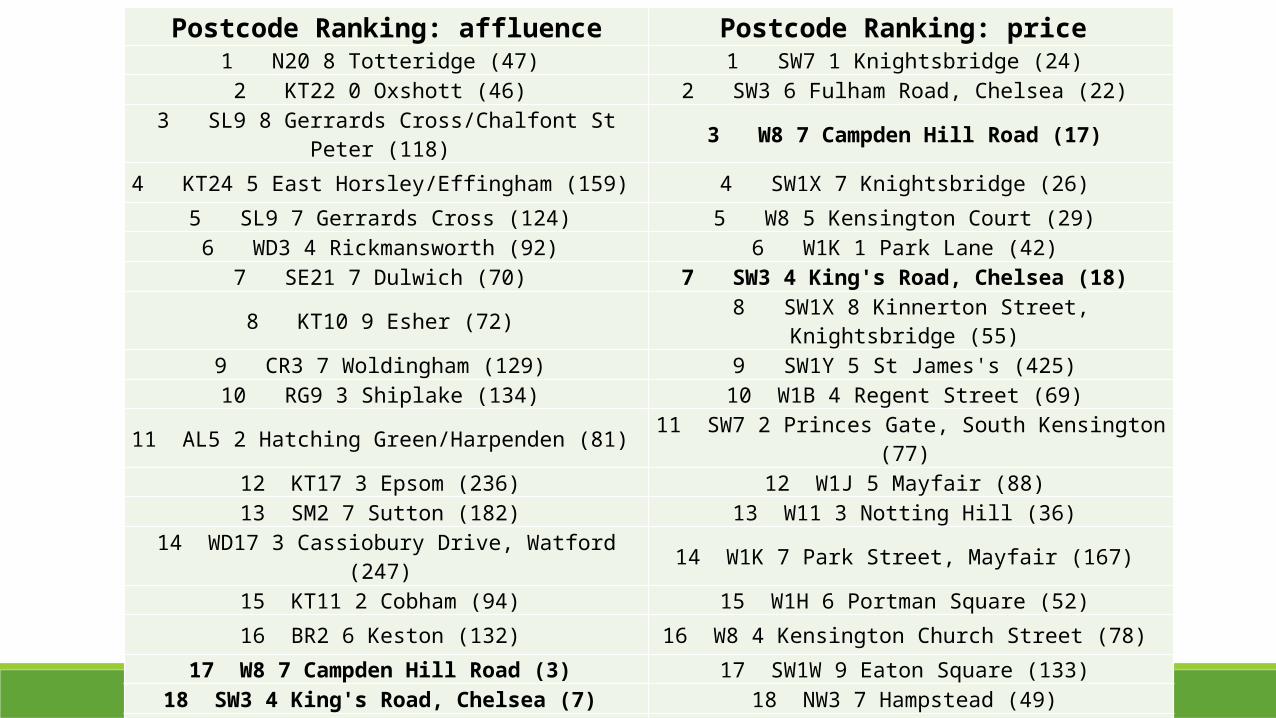
Postcode Ranking: affluence Postcode Ranking: price 1 N20 8 Totteridge (47) 1 SW7 1 Knightsbridge (24) 2 KT22 0 Oxshott (46) 2 SW3 6 Fulham Road, Chelsea (22)
3 SL9 8 Gerrards Cross/Chalfont St Peter (118) 3 W8 7 Campden Hill Road (17)
4 KT24 5 East Horsley/Effingham (159) 4 SW1X 7 Knightsbridge (26) 5 SL9 7 Gerrards Cross (124) 5 W8 5 Kensington Court (29) 6 WD3 4 Rickmansworth (92) 6 W1K 1 Park Lane (42)
7 SE21 7 Dulwich (70) 7 SW3 4 King's Road, Chelsea (18) 8 KT10 9 Esher (72) 8 SW1X 8 Kinnerton Street, Knightsbridge (55)
9 CR3 7 Woldingham (129) 9 SW1Y 5 St James's (425) 10 RG9 3 Shiplake (134) 10 W1B 4 Regent Street (69)
11 AL5 2 Hatching Green/Harpenden (81) 11 SW7 2 Princes Gate, South Kensington (77) 12 KT17 3 Epsom (236) 12 W1J 5 Mayfair (88) 13 SM2 7 Sutton (182) 13 W11 3 Notting Hill (36)
14 WD17 3 Cassiobury Drive, Watford (247) 14 W1K 7 Park Street, Mayfair (167) 15 KT11 2 Cobham (94) 15 W1H 6 Portman Square (52) 16 BR2 6 Keston (132) 16 W8 4 Kensington Church Street (78)
17 W8 7 Campden Hill Road (3) 17 SW1W 9 Eaton Square (133) 18 SW3 4 King's Road, Chelsea (7) 18 NW3 7 Hampstead (49)
19 RG9 6 Hambleden (150) 19 SW3 2 Walton Street, Chelsea (51) 20 GU10 2 Churt/Tilford (184) 20 W1G 0 Cavendish Square (135)
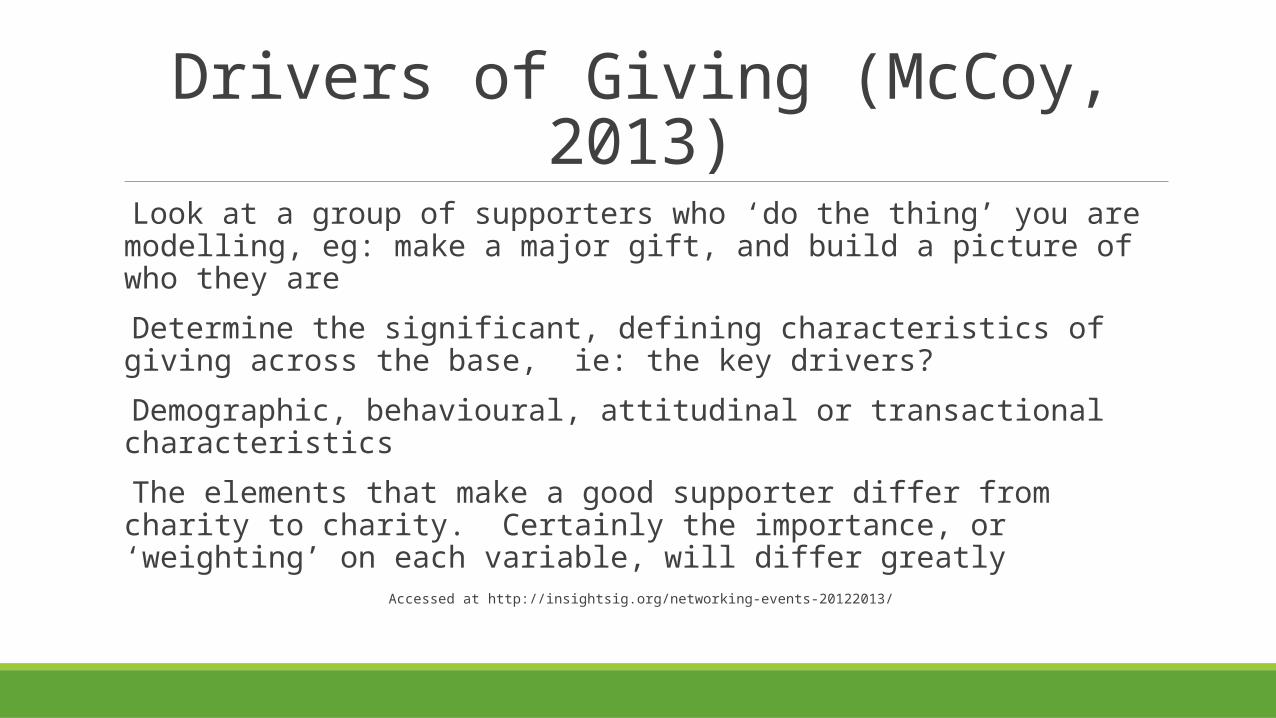
Drivers of Giving (McCoy, 2013) Look at a group of supporters who ‘do the thing’ you are modelling, eg: make a major gift, and build a picture of who they are
Determine the significant, defining characteristics of giving across the base, ie: the key drivers?
Demographic, behavioural, attitudinal or transactional characteristics The elements that make a good supporter differ from charity to charity. Certainly the importance, or ‘weighting’ on each variable, will differ greatly
Accessed at http://insightsig.org/networking-events-20122013/
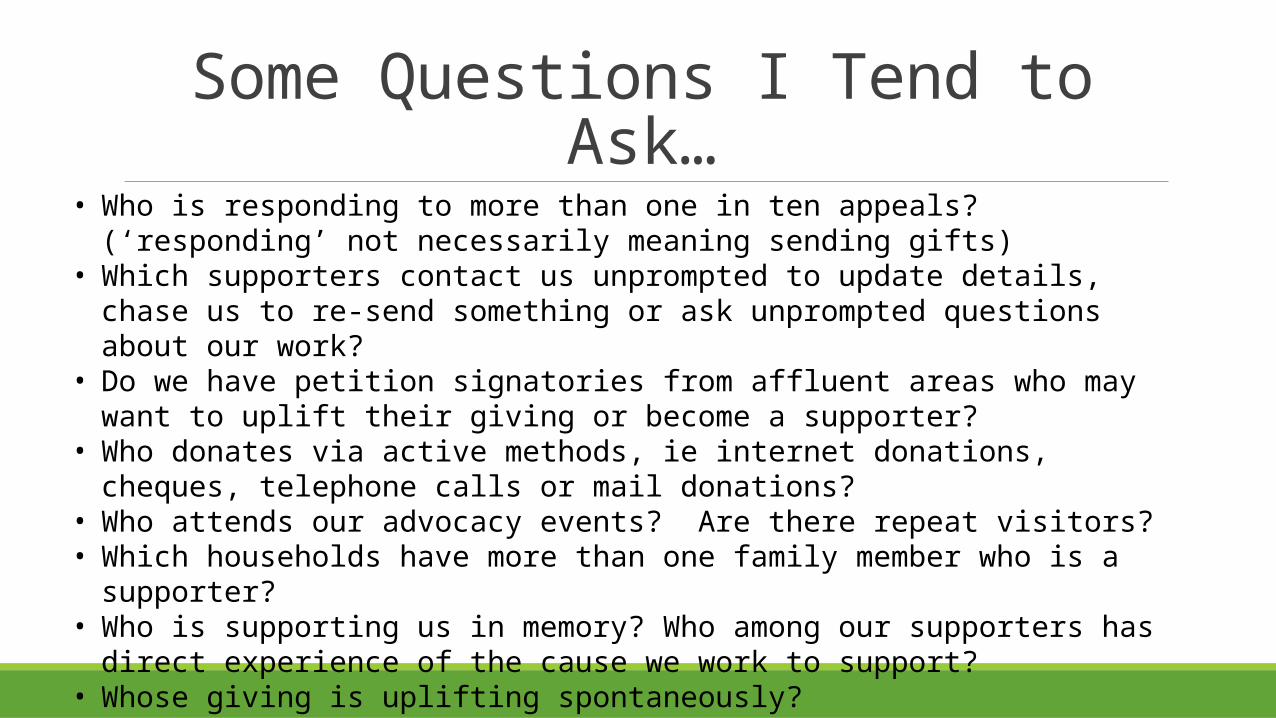
Some Questions I Tend to Ask…• Who is responding to more than one in ten appeals? (‘responding’ not necessarily meaning
sending gifts)• Which supporters contact us unprompted to update details, chase us to re-send something
or ask unprompted questions about our work?• Do we have petition signatories from affluent areas who may want to uplift their giving or
become a supporter?• Who donates via active methods, ie internet donations, cheques, telephone calls or mail
donations?• Who attends our advocacy events? Are there repeat visitors?• Which households have more than one family member who is a supporter?• Who is supporting us in memory? Who among our supporters has direct experience of the
cause we work to support?• Whose giving is uplifting spontaneously?
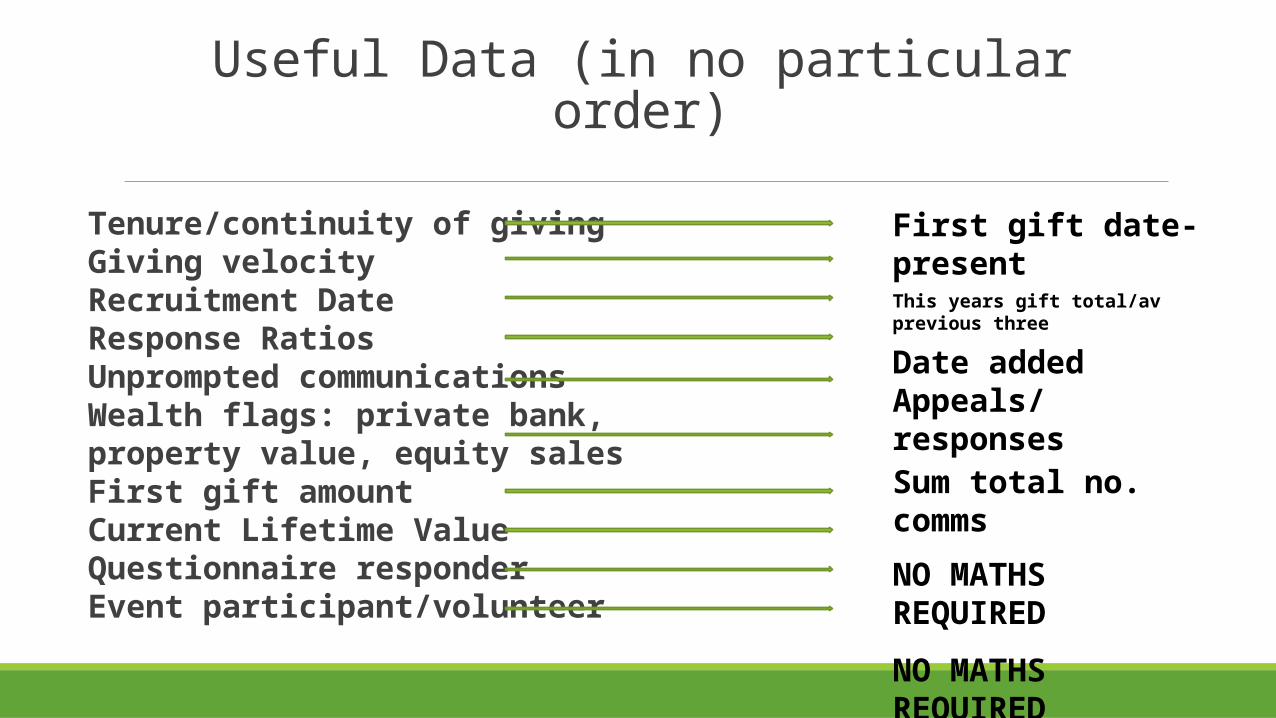
Useful Data (in no particular order)Tenure/continuity of givingGiving velocityRecruitment DateResponse RatiosUnprompted communicationsWealth flags: private bank, property value, equity salesFirst gift amountCurrent Lifetime ValueQuestionnaire responderEvent participant/volunteer
First gift date-presentThis years gift total/av previous three
Date addedAppeals/responsesSum total no. comms
NO MATHS REQUIRED
NO MATHS REQUIREDSum total givingNO MATHS REQUIREDNO MATHS REQUIRED
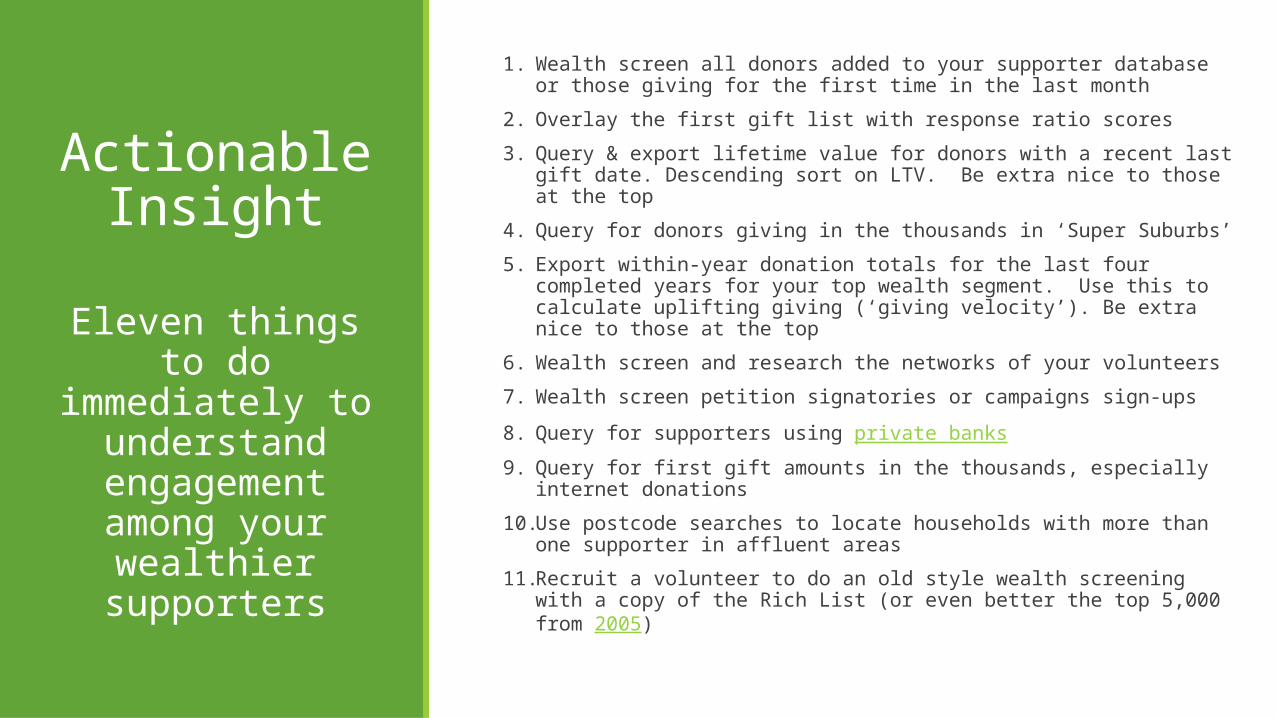
Actionable Insight
1. Wealth screen all donors added to your supporter database or those giving for the first time in the last month
2. Overlay the first gift list with response ratio scores
3. Query & export lifetime value for donors with a recent last gift date. Descending sort on LTV. Be extra nice to those at the top
4. Query for donors giving in the thousands in ‘Super Suburbs’
5. Export within-year donation totals for the last four completed years for your top wealth segment. Use this to calculate uplifting giving (‘giving velocity’). Be extra nice to those at the top
6. Wealth screen and research the networks of your volunteers
7. Wealth screen petition signatories or campaigns sign-ups
8. Query for supporters using private banks
9. Query for first gift amounts in the thousands, especially internet donations
10. Use postcode searches to locate households with more than one supporter in affluent areas
11. Recruit a volunteer to do an old style wealth screening with a copy of the Rich List (or even better the top 5,000 from 2005)
Eleven things to do immediately to
understand engagement among
your wealthier supporters
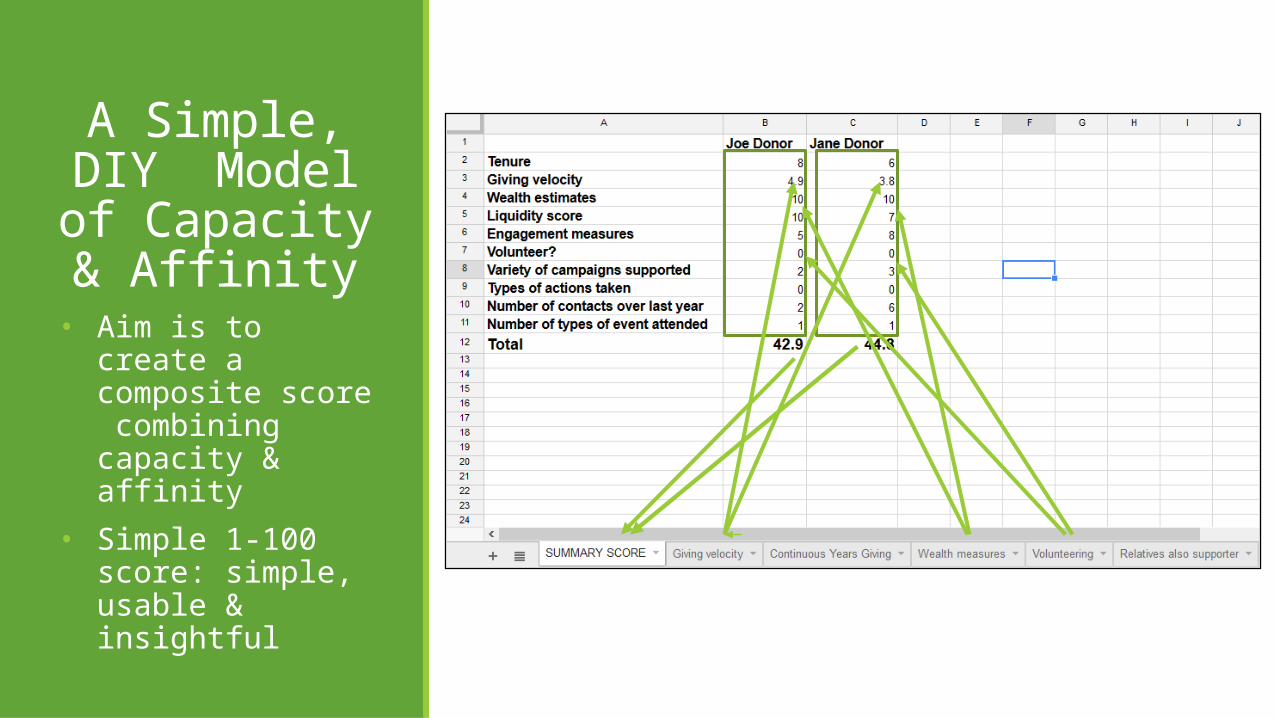
A Simple, DIY Model of Capacity & Affinity
• Aim is to create a composite score combining capacity & affinity
• Simple 1-100 score: simple, usable & insightful
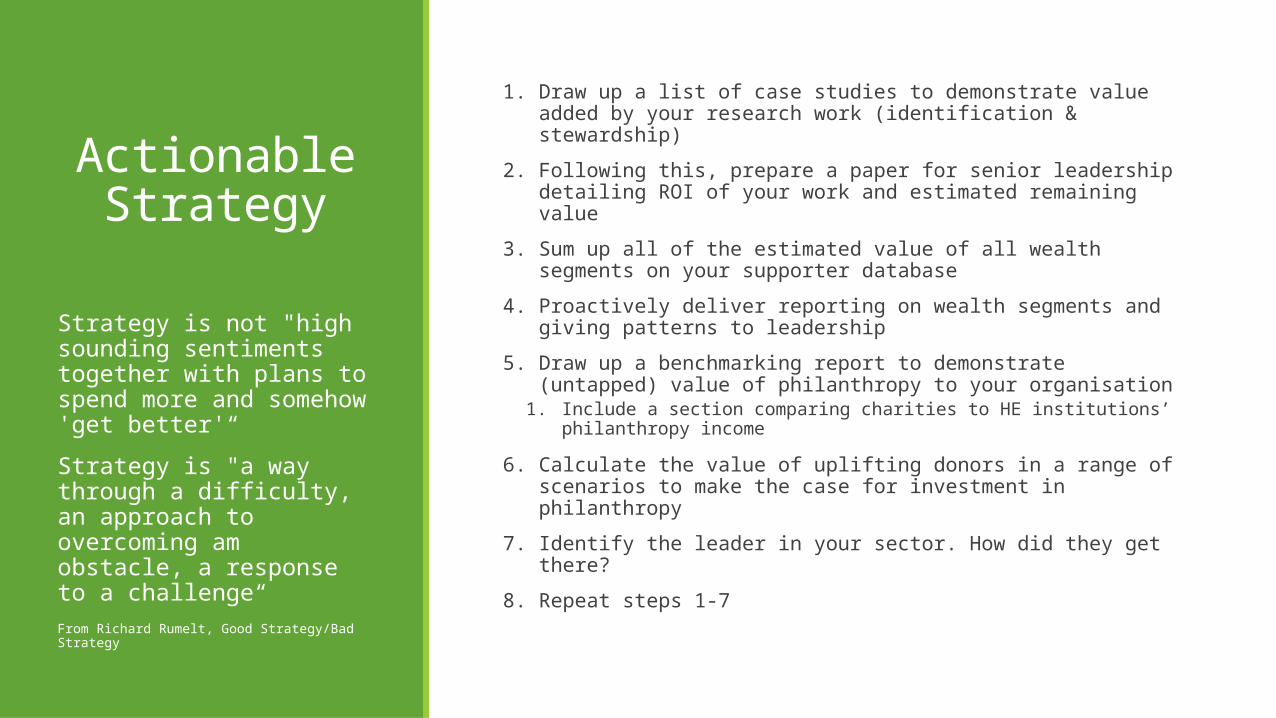
Actionable Strategy
1. Draw up a list of case studies to demonstrate value added by your research work (identification & stewardship)
2. Following this, prepare a paper for senior leadership detailing ROI of your work and estimated remaining value
3. Sum up all of the estimated value of all wealth segments on your supporter database
4. Proactively deliver reporting on wealth segments and giving patterns to leadership
5. Draw up a benchmarking report to demonstrate (untapped) value of philanthropy to your organisation
1. Include a section comparing charities to HE institutions’ philanthropy income
6. Calculate the value of uplifting donors in a range of scenarios to make the case for investment in philanthropy
7. Identify the leader in your sector. How did they get there?
8. Repeat steps 1-7
Strategy is not "high sounding sentiments together with plans to spend more and somehow 'get better'“
Strategy is "a way through a difficulty, an approach to overcoming am obstacle, a response to a challenge“From Richard Rumelt, Good Strategy/Bad Strategy
Rare Events•Many other professions - epidemiologists, insurers and bankers, the military, geographers, scholars of international relations and meteorologists - face similar forecasting challenges
• Academic work is ongoing into correcting biases & forecasting using rare events data:• Gary King• Raffaella Calabrese • Blattman, Blair & Hartman
• Popular work is also ongoing online by some of these authors and others to improve our ability to forecast rare events
•Researchers can do more! Work across silos
Charity sector forecast to be heading for a £4.6bn shortfall within the next four years, an achievable, sustainable way to
grow overall giving through enduring donor relationships is a
positive message!
Barack Obama did not say ‘No, They Can’t’, and Dr. Martin
Luther King did not say ‘I have a nightmare’
• Understanding market dynamics of wealth/income critical to success in growing giving, for top philanthropy and ‘leadership giving’
• Huge potential to identify wealth and understand affinity, much of which is already in our supporter base
• These methods can be used to incorporate measures of connection and affinity into our work
Summary
Further Reading & ResourcesKevin MacDonnell’s blog: Cooldata
His and Peter Wylie’s 2014 book ‘Score!’ (ISBN 0899644457)Josh Birkholz: Fundraising Analytics
Philip Tetlock: Superforecasting: the Art & Science of PredictionSee list at: https://www.worldcat.org/profiles/BenRymer/lists/3257763
https://mailman.mit.edu/mailman/listinfo/prospect-dmmTwitter: @joshbirkholz @iofinsight @n_ashutosh
Thanks & Q&Ahttps://fundraisingvoices.wordpress.com/
This presentation is copyright Ben Rymer, Fundraising Research Manager, Age UK© 2015 All rights reserved. Used with permission.