Embed Size (px)
Citation preview
Regional Activity Centre for Cleaner Production (RAC/CP)Mediterranean Action Plan
Regional Activity Centrefor Cleaner Production
Government of CataloniaMinistry of the Environment
Ministry of the EnvironmentSpain
Dairy industry
Prevention ofpollution in the

Note: This publication may be reproduced in whole or in part in any formfor educational or non-profit purposes without special permission from theRegional Activity Centre for Cleaner Production (RAC/CP) provided ack-nowledgement of the source is made. RAC/CP would appreciate receivinga copy of any publication that uses this document as source. No use ofthis publication may be made for resale or for any other commercial pur-poses whatsoever without prior permission in writing from RAC/CP.
The designations employed and the presentation of the material in this do-cument do not imply the expression of any opinion whatsoever on the partof RAC/CP concerning the legal status of any country, territory or area,or of its authorities, or concerning the delimitation of its frontiers or boun-daries.
If you consider that some part of this study could be improved or there isany lack of precision, we would appreciate very much receiving notifica-tion of it.
Study finished on November 2001Study published on May 2002
Additional copies or information can be requested to:
Regional Activity Centre for Cleaner Production (RAC/CP)
C/ París, 184 – 3a planta08036 Barcelona (Spain)
Tf. +34 93 415 11 12 - Fax. +34 93 237 02 86 e-mail: [email protected]
Web page: http://www.cema-sa.org


1. INTRODUCTION. OBJECTIVES AND METHODOLOGY .................................................. 7
2. STATUS OF THE DAIRY INDUSTRY IN THE MAP COUNTRIES ..................................... 92.1. OVERALL status of the dairy sector in the Mediterranean countries .......................... 9
2.1.1. General information on the food and dairy sector ............................................ 92.1.2. National milk production .................................................................................. 102.1.3. Production of milk and dairy products ............................................................. 12
2.2. SPECIFIC status of national dairy sectors in the Mediterranean countries ................ 18
3. THE MAIN PRODUCTION PROCESSES USED IN THE DAIRY INDUSTRYAND RELATED ENVIRONMENTAL EFFECTS .................................................................. 333.1. Processing of fresh milk .............................................................................................. 33
3.1.1. The processing of heat-treated milk .................................................................. 343.1.2. Processing operations and environmental considerations ............................... 353.1.3. Environmental effects of the processing of heat-treated milk .......................... 43
3.2. Dairy products obtained from milk fat: butter and cream ........................................... 453.2.1. The processing of butter and cream ................................................................ 453.2.2. Production operations and environmental considerations ............................... 473.2.3. Environmental effects of the production of butter and cream .......................... 51
3.3. Production of fermented milks .................................................................................... 523.3.1. Production of yogurt ........................................................................................ 533.3.2. Production operations and environmental considerations ............................... 543.3.3. Environmental effects of yogurt production ..................................................... 58
3.4. Cheese production ...................................................................................................... 593.4.1. Cheese production ........................................................................................... 603.4.2. Productions operations and environmental considerations ............................. 603.4.3. Environmental effects of cheese production .................................................... 67
3.5. Secondary operations in the dairy industry ................................................................. 683.5.1. Cleaning and disinfection operations ............................................................... 683.5.2. Steam generation ............................................................................................. 713.5.3. Refrigeration ..................................................................................................... 723.5.4. Water supply ..................................................................................................... 723.5.5. Environmental effects of secondary operations ............................................... 73
4. ENVIRONMENTAL EFFECTS OF THE DAIRY INDUSTRY ............................................... 754.1. Water consumption ..................................................................................................... 754.2. Energy consumption .................................................................................................... 764.3. Wastewater .................................................................................................................. 774.4. Waste ........................................................................................................................... 804.5. Atmospheric emissions ............................................................................................... 814.6. Noise ............................................................................................................................ 82
5
CONTENTS

5. OPPORTUNITIES TO PREVENT AND REDUCE POLLUTION AT THE SOURCE ............. 83
6. CASE STUDIES .................................................................................................................. 129
7. CONCLUSIONS .................................................................................................................. 141
8. BIBLIOGRAPHY ................................................................................................................. 157
TABLES .................................................................................................................................... 161
FIGURES .................................................................................................................................. 163
Prevention of Pollution in the Dairy Industry
The study on the prevention and reduction of pollution at the source in the dairy industry inthe countries of the Mediterranean Action Plan (MAP) (the DAIRY/CP PROJECT) by theRegional Activity Centre for Cleaner Production (RAC/CP) was one of the recommendations ofthe RAC/CP National Focal Points.
RAC/CP has carried out the study with the support of experts on the environment and industrialfood and agriculture processes of the Spanish Instituto Tecnológico Agroalimentario (AINIA), loca-ted in Paterna (Valencia).
This centre was chosen in 1997 by the Spanish government for carrying out the project for disse-mination and promotion of Council Directive IPCC 96/61/EC and exchange of information aboutBest Available Techniques (BATs) in the dairy sector.
The main objectives of the DAIRY/CP study are to describe the status of the dairy industry in theMAP countries, the main production processes, secondary operations, products of the dairy in-dustry and related environmental effects and to describe the main opportunities to prevent orreduce pollution at the source through the presentation of concrete cases, conclusions and re-commendations. The following countries are members of MAP: Albania, Algeria, Bosnia andHerzegovina, Croatia, Cyprus, Egypt, France, Greece, Israel, Italy, Lebanon, Libya, Malta, Monaco,Morocco, Slovenia, Spain, Syria, Tunisia and Turkey.
Monaco and Slovenia have not been included in the study because no background material wasavailable or information was lacking on the dairy industry.
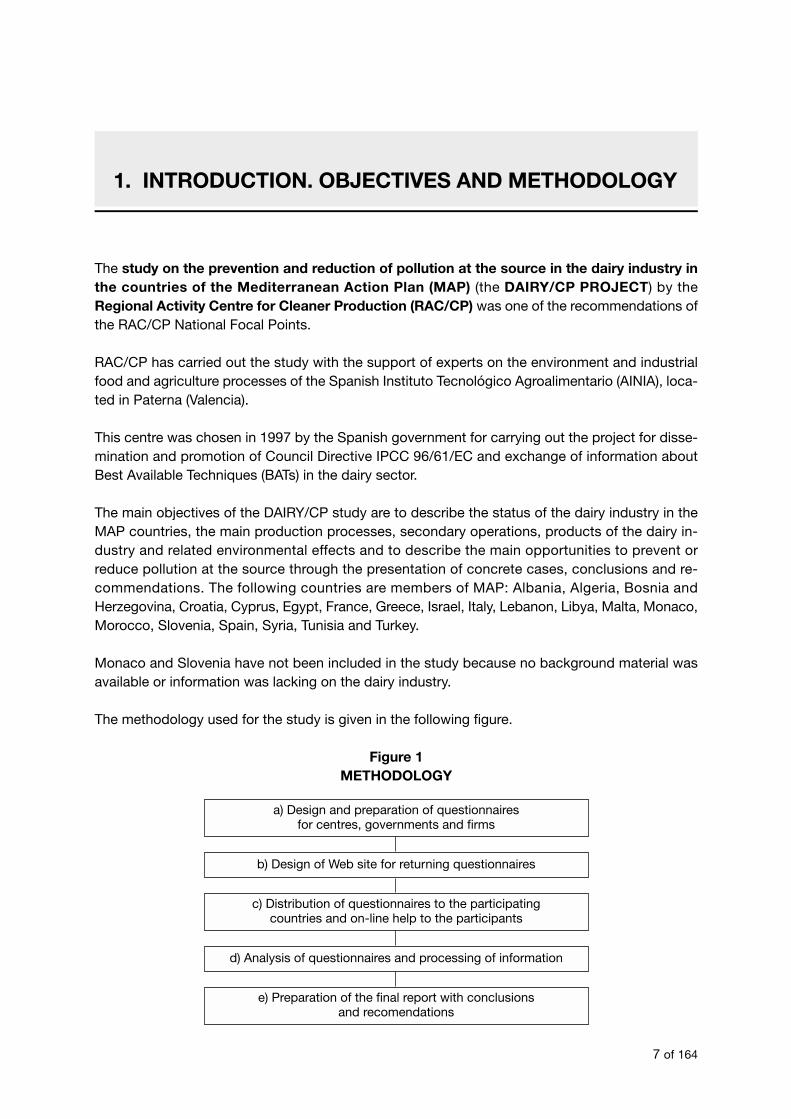
The methodology used for the study is given in the following figure.
Figure 1METHODOLOGY
7 of 164
1. INTRODUCTION. OBJECTIVES AND METHODOLOGY
a) Design and preparation of questionnairesfor centres, governments and firms
b) Design of Web site for returning questionnaires
c) Distribution of questionnaires to the participatingcountries and on-line help to the participants
d) Analysis of questionnaires and processing of information
e) Preparation of the final report with conclusionsand recomendations
a) Three types of questionnaires were drawn up to be completed by three types of respondents:
• A questionnaire for the GOVERNMENT: ministries of industry, the environment, food, agricultu-re, etc. (annex I), including questions on structure, production, consumption, exports and importsof the dairy sector, as well as policies for the prevention of pollution;
• A questionnaire for CENTRES: technological, research or teaching (annex II), including questionson products, cleaner production activities (good practices, clean technologies, recycling at thesource);
• A questionnaire for FIRMS in the dairy sector (annex III), including questions primarily on pro-cesses and equipment.
A minimum experience of five years as technician in the dairy or environmental sectors was re-quired for the person completing the questionnaire.
b) Once the questionnaires were drawn up, a Web site in three languages was created so that theparticipants could download the questionnaires in Word format and obtain information about anydoubts that might occur during the filling-out of the questionnaire. The questionnaire was also sentby e-mail and fax to several countries.
Figure 2WEB SITE DAIRY/CP PROJECT
c) During the DAIRY/CP PROJECT, more than 250 contacts were made with governments, centresand enterprises in the countries participating in the study. Completed questionnaires were recei-ved from the countries, providing sufficient information in order to give content to the study. Thedifficulty of standardizing data and information from countries with quite different cultures and re-sources should be pointed out. Participation of the Focal Points was a key to the success of thestudy’s objectives.
d) Once the completed questionnaires were received, the data were processed and the final reportwas written. The main source of information used for description of the situation in each countryhas been the data provided by the Focal Points, contrasted and/or completed with data fromUSDA. This last source of information is mentioned as reference through the study with the aimof giving it an homogeneous dimension. This has not implied substitution of the data source, whichhas remained the information provided by the Focal Points. The philosophy behind the study isto provide a tool to improve the prevention of pollution through practical proposals whose appli-cation is possible for dairy firms in the MAP countries.
Prevention of Pollution in the Dairy Industry
8 of 164
2.1. OVERALL status of the dairy sector in the Mediterranean countries
2.1.1. General information on the food and dairy sector
In the Mediterranean countries, the food and agricultural sector represents between 10 and 20 percent of total industrial activity. Only Algeria with 2 per cent and Egypt with about 31 per cent areoutside this range. There are approximately 100,000 food and agricultural firms whose distributionthroughout the Mediterranean countries varies enormously, owing to differences in population andlevel of industrial development.
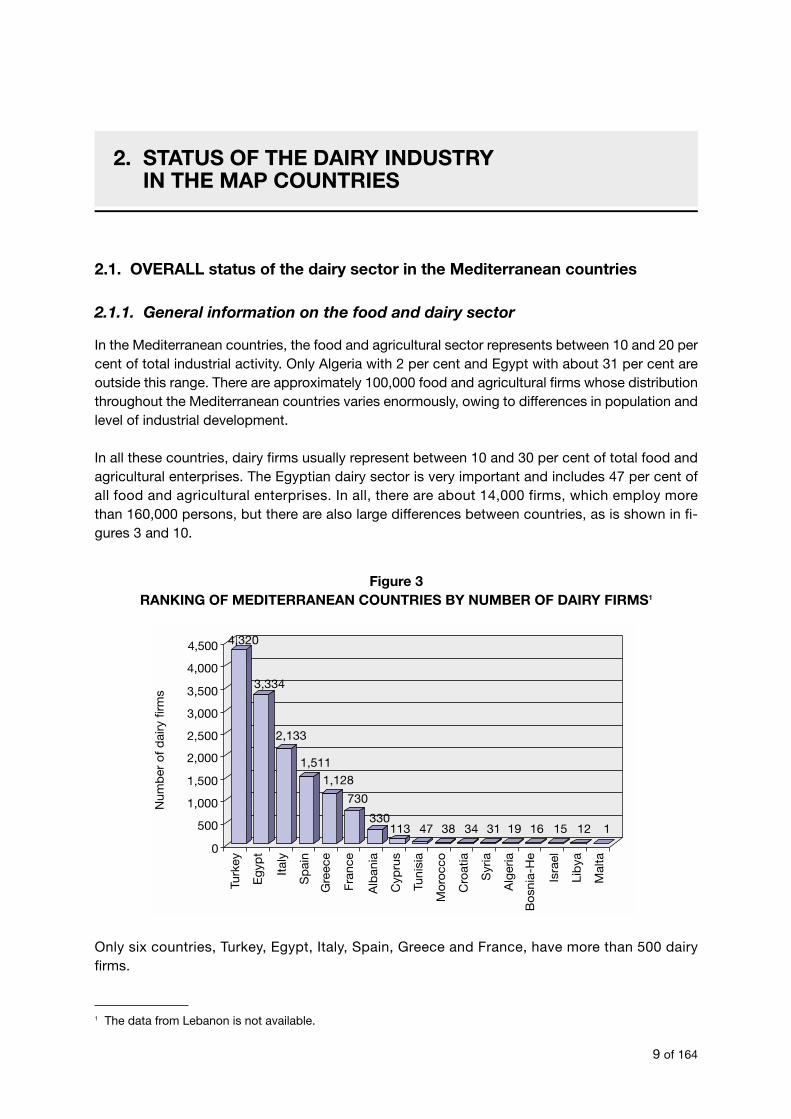
In all these countries, dairy firms usually represent between 10 and 30 per cent of total food andagricultural enterprises. The Egyptian dairy sector is very important and includes 47 per cent ofall food and agricultural enterprises. In all, there are about 14,000 firms, which employ morethan 160,000 persons, but there are also large differences between countries, as is shown in fi-gures 3 and 10.
Figure 3RANKING OF MEDITERRANEAN COUNTRIES BY NUMBER OF DAIRY FIRMS1
Only six countries, Turkey, Egypt, Italy, Spain, Greece and France, have more than 500 dairyfirms.
Metodología de Grupos de Trabajo
9 of 164
2. STATUS OF THE DAIRY INDUSTRYIN THE MAP COUNTRIES
1 The data from Lebanon is not available.
4,320
3,334
2,133
1,511
1,128
730
330113 47 38 34 31 19 16 15 12 1
0
500
1,000
1,500
2,000
2,500
3,000
3,500
4,000
4,500
Num
ber
of
dai
ry f
irms
Turk
ey
Eg
ypt
Ital
y
Sp
ain
Gre
ece
Fra
nce
Alb
ania
Cyp
rus
Tuni
sia
Mo
rocc
o
Cro
atia
Syr
ia
Alg
eria
Bo
snia
-He
Isra
el
Lib
ya
Mal
ta

In most of the countries, dairy firms are small with fewer than 10 workers. The average number ofsmall firms reaches 77.9 per cent. These firms are usually traditional and produce a volume of milkand dairy products that is always less than 50 tons/day.
In many Mediterranean countries, especially in those where the dairy sector is poorly developed,there are a few enterprises that absorb most of the production in addition to the small enterpri-ses. They are operations with more than 100 workers and with a high level of production ofmore than 100 tons/day. Occasionally, these enterprises are state controlled.
2.1.2. National milk production
Total national milk production in the Mediterranean countries is 68.8 million tons (see figures 4and 11). The 25.6 million tons/year produced by France is the largest amount and represents 37per cent of total production in the Mediterranean. The five major producers, France, Italy, Turkey,Spain and Egypt, share 83 per cent of total production.
Figure 4MAIN MEDITERRANEAN MILK-PRODUCING COUNTRIES
Cow’s milk is the most important milk throughout the Mediterranean region and represents 88.5per cent of total production. The rest of the production is made up of about 5.2 per cent sheep’smilk, 3.3 per cent buffalo’s milk and another 3.0 per cent of goat’s milk.
Prevention of Pollution in the Dairy Industry
10 of 164
0
5,000,000
10,000,000
15,000,000
20,000,000
25,000,000
30,000,000
Tons
/yea
r
Fran
ce
Italy
Turk
ey
Sp
ain
Egy
pt
Gre
ece
Syr
ia
Mor
occo
Alg
eria
Isra
el
Alb
ania
Tuni
sia
Slo
veni
a
Cro
atia
Bos
nia-
He
Leb
anon
Cyp
rus
Lib
ya
Mal
ta
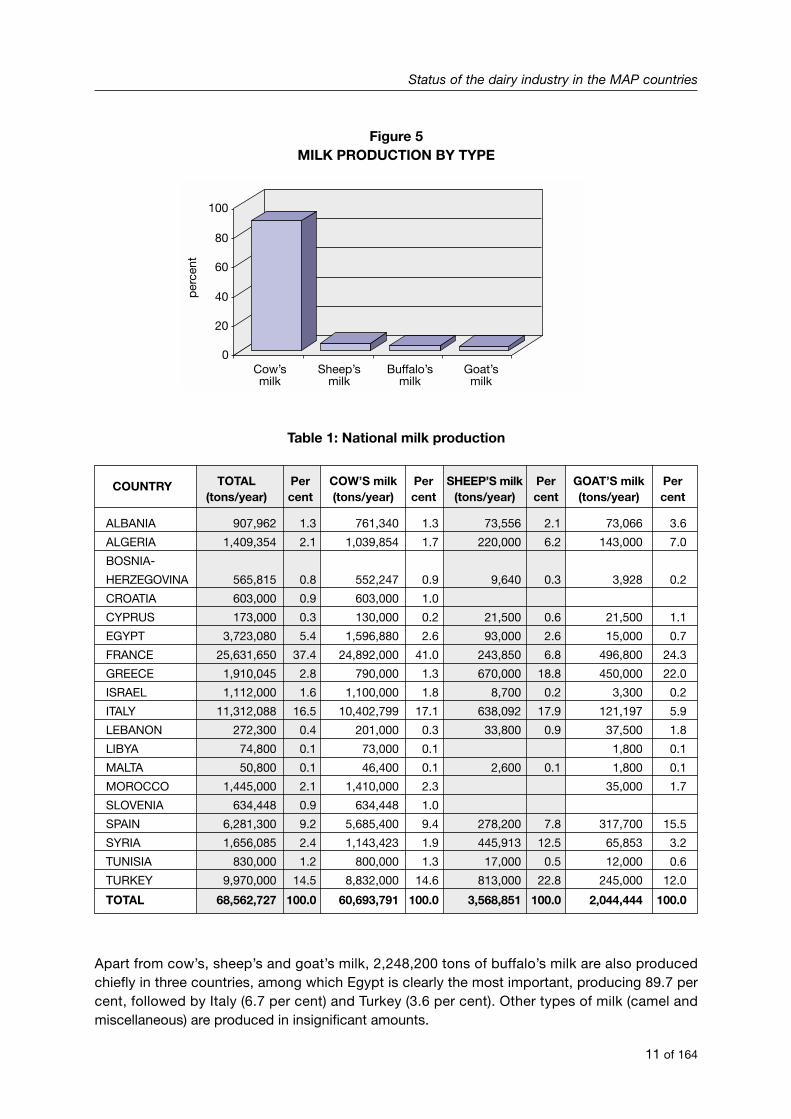
Figure 5MILK PRODUCTION BY TYPE
Table 1: National milk production
COUNTRY TOTAL Per COW’S milk Per SHEEP’S milk Per GOAT’S milk Per(tons/year) cent (tons/year) cent (tons/year) cent (tons/year) cent
ALBANIA 907,962 1.3 761,340 1.3 73,556 2.1 73,066 3.6
ALGERIA 1,409,354 2.1 1,039,854 1.7 220,000 6.2 143,000 7.0
BOSNIA-
HERZEGOVINA 565,815 0.8 552,247 0.9 9,640 0.3 3,928 0.2
CROATIA 603,000 0.9 603,000 1.0
CYPRUS 173,000 0.3 130,000 0.2 21,500 0.6 21,500 1.1
EGYPT 3,723,080 5.4 1,596,880 2.6 93,000 2.6 15,000 0.7
FRANCE 25,631,650 37.4 24,892,000 41.0 243,850 6.8 496,800 24.3
GREECE 1,910,045 2.8 790,000 1.3 670,000 18.8 450,000 22.0
ISRAEL 1,112,000 1.6 1,100,000 1.8 8,700 0.2 3,300 0.2
ITALY 11,312,088 16.5 10,402,799 17.1 638,092 17.9 121,197 5.9
LEBANON 272,300 0.4 201,000 0.3 33,800 0.9 37,500 1.8
LIBYA 74,800 0.1 73,000 0.1 1,800 0.1
MALTA 50,800 0.1 46,400 0.1 2,600 0.1 1,800 0.1
MOROCCO 1,445,000 2.1 1,410,000 2.3 35,000 1.7
SLOVENIA 634,448 0.9 634,448 1.0
SPAIN 6,281,300 9.2 5,685,400 9.4 278,200 7.8 317,700 15.5
SYRIA 1,656,085 2.4 1,143,423 1.9 445,913 12.5 65,853 3.2
TUNISIA 830,000 1.2 800,000 1.3 17,000 0.5 12,000 0.6
TURKEY 9,970,000 14.5 8,832,000 14.6 813,000 22.8 245,000 12.0
TOTAL 68,562,727 100.0 60,693,791 100.0 3,568,851 100.0 2,044,444 100.0
Apart from cow’s, sheep’s and goat’s milk, 2,248,200 tons of buffalo’s milk are also producedchiefly in three countries, among which Egypt is clearly the most important, producing 89.7 percent, followed by Italy (6.7 per cent) and Turkey (3.6 per cent). Other types of milk (camel andmiscellaneous) are produced in insignificant amounts.
Status of the dairy industry in the MAP countries
11 of 164
0
20
40
60
80
100p
erce
nt
Cow’smilk
Sheep’smilk
Buffalo’smilk
Goat’smilk

2.1.3. Production of milk and dairy products
The main dairy product is fresh milk (32.3 million tons/year), followed by cheese (4.1 million tons/year), yo-gurt and other fermented milks (2.8 million tons/year), small quantities of butter (0.8 million tons/year) andcream (0.5 million tons/year).
Figure 6DISTRIBUTION OF DAIRY PRODUCTS
The main producers of fresh milk are France (22 million tons/year), Spain (3.6 million tons/year),Italy (3.1 million tons/year) and Israel (0.9 million tons/year), which together produce 92 per cent ofoverall production (see figures 7 and 12).
Several countries that have an important local production, such as Turkey and Egypt, have arather low national production of fresh milk. Milk consumption is lower than that of other dairy pro-ducts, especially cheese, although the main reason for this in both cases is found in the very im-portant role of local consumption on dairy farms and direct sales to consumers.
Figure 7RANKING OF FRESH MILK PRODUCERS
Prevention of Pollution in the Dairy Industry
12 of 164
0
5,000,000
10,000,000
15,000,000
20,000,000
25,000,000
30,000,000
35,000,000
tons
/yea
r
Freshmilk Cheese
Yogurt ButterCream
tons/year
Fran
ce
France 22,000,000
0
500,000
1,000,000
1,500,000
2,000,000
2,500,000
3,000,000
3,500,000
4,000,000
4,500,000
5,000,000
Spa
in
Italy
Isra
el
Mor
occo
Gre
ece
Cro
atia
Tuni
sia
Turk
ey
Alg
eria
Cyp
rus
Liby
a
Mal
ta
Egy
pt
Bos
nia-
He
Syr
ia
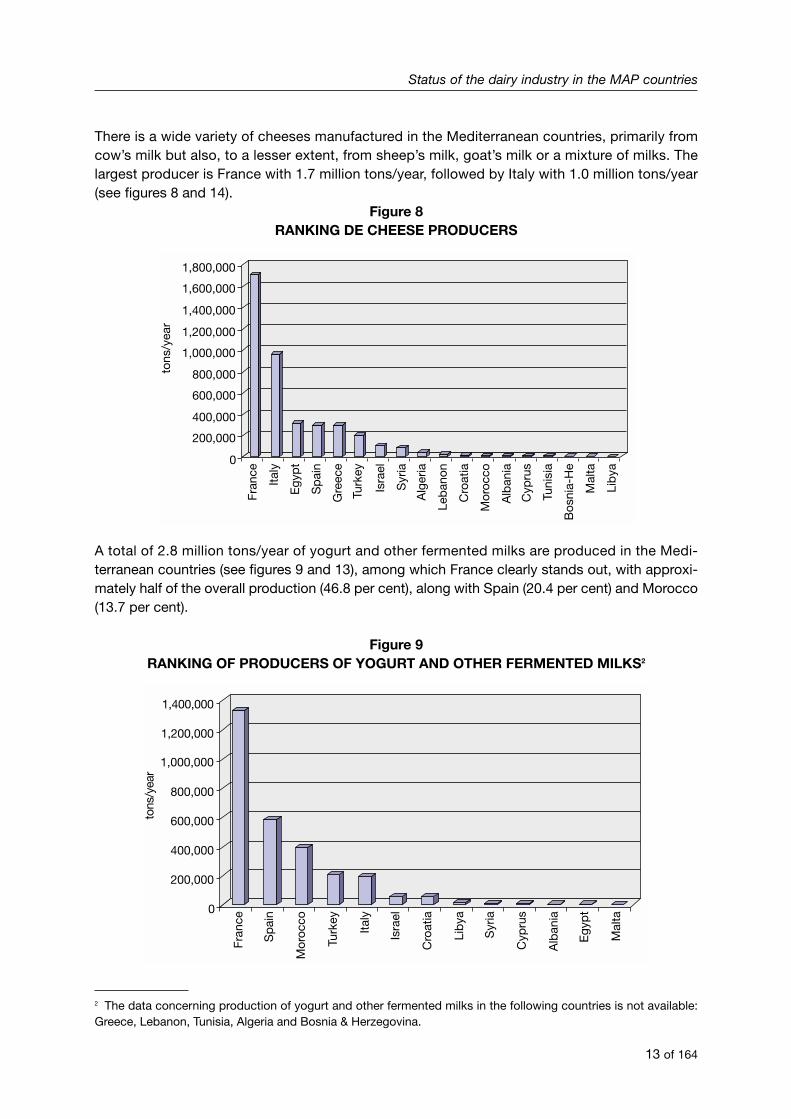
There is a wide variety of cheeses manufactured in the Mediterranean countries, primarily fromcow’s milk but also, to a lesser extent, from sheep’s milk, goat’s milk or a mixture of milks. Thelargest producer is France with 1.7 million tons/year, followed by Italy with 1.0 million tons/year(see figures 8 and 14).
Figure 8RANKING DE CHEESE PRODUCERS
A total of 2.8 million tons/year of yogurt and other fermented milks are produced in the Medi-terranean countries (see figures 9 and 13), among which France clearly stands out, with approxi-mately half of the overall production (46.8 per cent), along with Spain (20.4 per cent) and Morocco(13.7 per cent).
Figure 9RANKING OF PRODUCERS OF YOGURT AND OTHER FERMENTED MILKS2
Status of the dairy industry in the MAP countries
13 of 164
tons
/yea
r
Fran
ce
0
200,000
400,000
600,000
800,000
1,000,000
1,200,000
1,400,000
1,600,000
1,800,000Ita
ly
Egy
pt
Sp
ain
Gre
ece
Turk
ey
Isra
el
Syr
ia
Alg
eria
Leb
anon
Cro
atia
Mor
occo
Alb
ania
Cyp
rus
Tuni
sia
Bos
nia-
He
Mal
ta
Lib
ya
tons
/yea
r
0
200,000
400,000
600,000
800,000
1,000,000
1,200,000
1,400,000
Fran
ce
Sp
ain
Mor
occo
Turk
ey
Italy
Isra
el
Cro
atia
Lib
ya
Syr
ia
Cyp
rus
Alb
ania
Egy
pt
Mal
ta
2 The data concerning production of yogurt and other fermented milks in the following countries is not available:Greece, Lebanon, Tunisia, Algeria and Bosnia & Herzegovina.
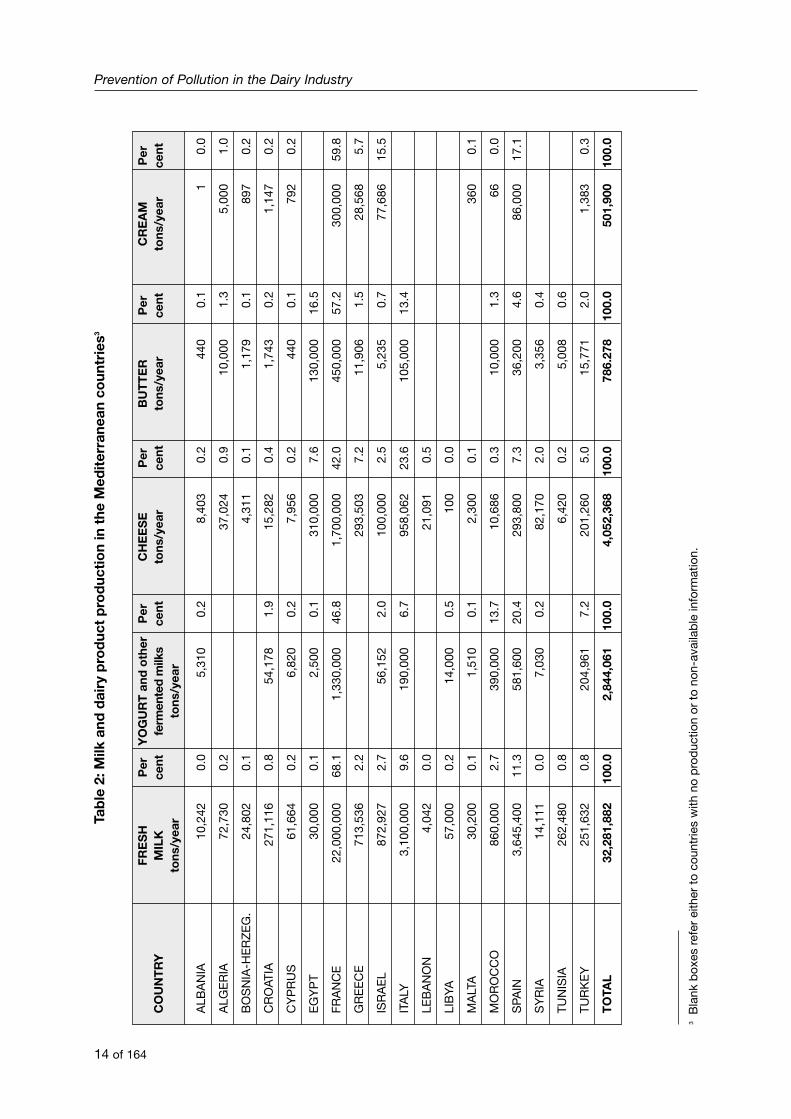
Tab
le 2
: Milk
and
dai
ry p
rod
uct
pro
duc
tio
n in
the
Med
iter
rane
an c
oun
trie
s3
FRE
SH
Per
YO
GU
RT
and
oth
erP
erC
HE
ES
EP
erB
UT
TE
RP
erC
RE
AM
Per
CO
UN
TR
YM
ILK
cent
ferm
ente
d m
ilks
cent
tons
/yea
rce
ntto
ns/y
ear
cent
tons
/yea
rce
ntto
ns/y
ear
tons
/yea
r
ALB
AN
IA10
,242
0.0
5,31
00.
28,
403
0.2
440
0.1
10.
0
ALG
ER
IA72
,730
0.2
37,0
240.
910
,000
1.3
5,00
01.
0
BO
SN
IA-H
ER
ZE
G.
24,8
020.
14,
311
0.1
1,17
90.
189
70.
2
CR
OAT
IA27
1,11
60.
854
,178
1.9
15,2
820.
41,
743
0.2
1,14
70.
2
CY
PR
US
61,6
640.
26,
820
0.2
7,95
60.
244
00.
179
20.
2
EG
YP
T30
,000
0.1
2,50
00.
131
0,00
07.
613
0,00
016
.5
FRA
NC
E22
,000
,000
68.1
1,33
0,00
0 46
.81,
700,
000
42.0
450,
000
57.2
300,
000
59.8
GR
EE
CE
713,
536
2.2
293,
503
7.2
11,9
061.
528
,568
5.7
ISR
AE
L87
2,92
72.
756
,152
2.0
100,
000
2.5
5,23
50.
777
,686
15.5
ITA
LY3,
100,
000
9.6
190,
000
6.7
958,
062
23.6
105,
000
13.4
LEB
AN
ON
4,04
20.
021
,091
0.5
LIB
YA57
,000
0.2
14,0
000.
510
00.
0
MA
LTA
30,2
000.
11,
510
0.1
2,30
00.
136
00.
1
MO
RO
CC
O86
0,00
02.
739
0,00
013
.710
,686
0.3
10,0
001.
366
0.0
SPA
IN3,
645,
400
11.3
581,
600
20.4
293,
800
7.3
36,2
004.
686
,000
17.1
SY
RIA
14,1
110.
07,
030
0.2
82,1
702.
03,
356
0.4
TUN
ISIA
262,
480
0.8
6,42
00.
25,
008
0.6
TUR
KE
Y25
1,63
20.
820
4,96
17.
220
1,26
05.
015
,771
2.0
1,38
30.
3
TO
TAL
32,2
81,8
8210
0.0
2,84
4,06
110
0.0
4,05
2,36
810
0.0
786.
278
100.
050
1,90
010
0.0
Prevention of Pollution in the Dairy Industry
14 of 164
3B
lank
box
es r
efer
eith
er t
o co
untr
ies
with
no
pro
duc
tion
or t
o no
n-av
aila
ble
info
rmat
ion.
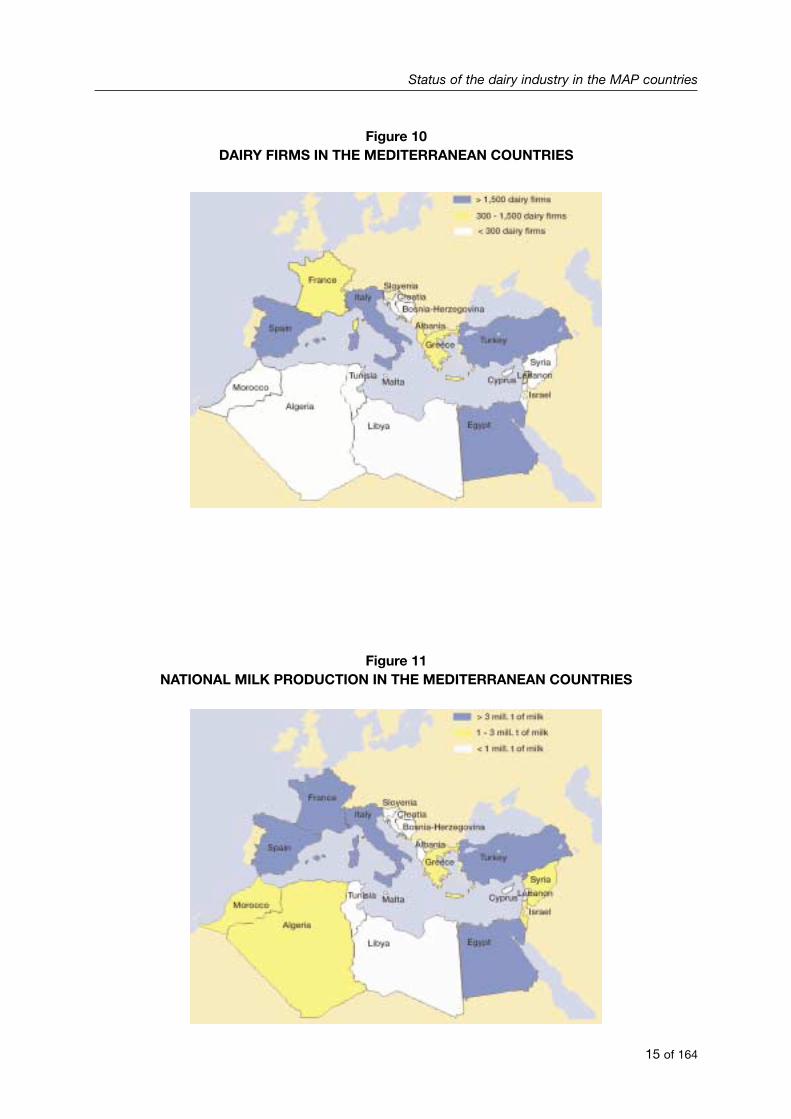
Figure 10DAIRY FIRMS IN THE MEDITERRANEAN COUNTRIES
Figure 11NATIONAL MILK PRODUCTION IN THE MEDITERRANEAN COUNTRIES
Status of the dairy industry in the MAP countries
15 of 164
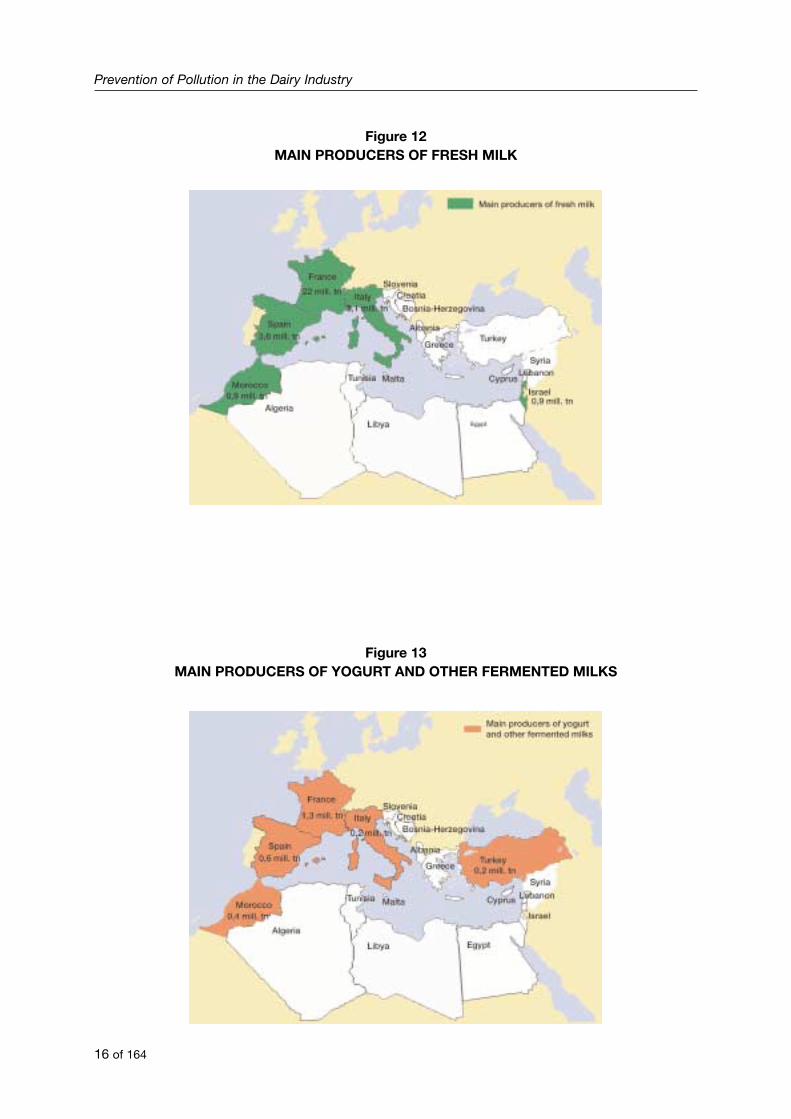
Figure 12MAIN PRODUCERS OF FRESH MILK
Figure 13MAIN PRODUCERS OF YOGURT AND OTHER FERMENTED MILKS
Prevention of Pollution in the Dairy Industry
16 of 164
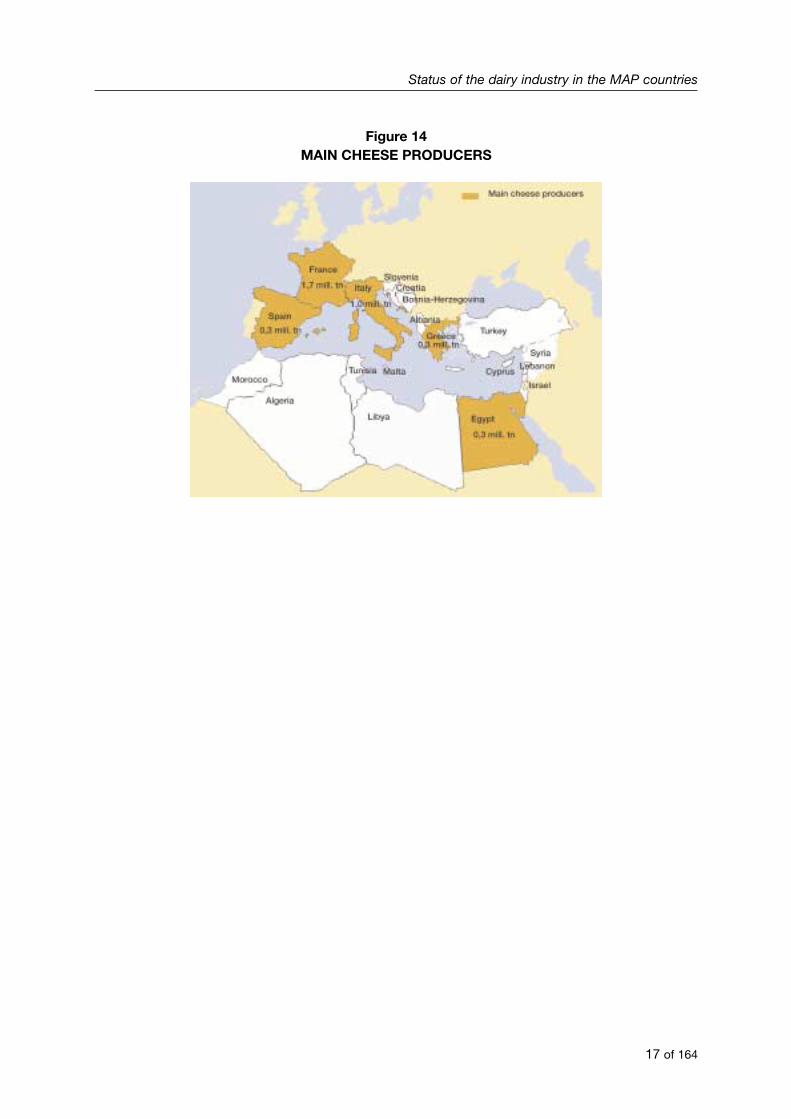
Figure 14MAIN CHEESE PRODUCERS
Status of the dairy industry in the MAP countries
17 of 164
2.2. SPECIFIC status of national dairy sectors in theMediterranean countries
The reforms begun in Albania in 1992 completely changed the structure of the agrarian sector, andthe whole productive structure was changed through reform of agriculture and livestock farms.Land was distributed in small farms of 1-2 hectares, and cattle in cooperatives and on statefarms were distributed to the new farms in groups of 1-3 cows. These changes led to the loss ofcentralized milk production in Albania.
There are currently 330 dairy firms in Albania, which employ 970 workers. Most of these firms(80 per cent) are traditional and employ fewer than 10 workers (INSTAT, 1999; Food ResearchInstitute, 2000).
Total annual milk production was 907,962 tons: primarily cow’s milk (761,340 tons) and to a lesserextent sheep’s milk (73,556 tons) and goat’s milk (73,066 tons). As for the production of dairyproducts, the following products were produced: 10,242 tons of fresh milk, 5,310 tons of yogurt,8,403 tons of cheese, 440 tons of butter and 1 ton of cream. Practically all the production is usedfor domestic consumption (Food Research Institute, 1999).
Only 25 per cent of the milk consumed directly is pasteurized in dairy industries. The rest is usuallysold on farms directly to consumers who boil it before use.
Yogurt is usually made from cow’s milk and is a traditional product in Albania. Cheese ismade from cow’s milk, sheep’s milk or a mixture of both. There are soft cheeses (Feta, Teleme,Tip83) and hard cheeses (Vize and Kasher). Southern Albania produces the best quality ofcheeses.
Policies for preventing pollution are poorly developed in Albania. Currently, there is no sour-ce of national subsidy for development of projects to prevent pollution. The Albanian Ministryof the Environment is preparing a list of dumping limits for the main pollutants in industrialwaste.
Prevention of Pollution in the Dairy Industry
18 of 164
POPULATION: 3,413,904
AREA: 28,750 km2
NUMBER OF DAIRY FIRMS: 330
MILK PRODUCTION: 907,962 metric tons/yearALBANIA
The food and agricultural sector, some 96 firms, represents about only 2 per cent of total Algerianindustrial activity. Of that, the dairy subsector represents 20 per cent, spread among 19 firms, whichemploy a total of 19,000 workers.
These firms belong to the state industrial group Giplait (Groupe Industriel pour la Productionde Lait), which controls most of the production of pasteurized milk for direct consumption.The number of workers is greater than 250 in 70 per cent of these plants, while the numberof employees in other firms ranges between 100 and 250 (Holdings, Ministry of Industry,2001).
Algeria is a net importer because it produces only 40 per cent of the dairy products that it con-sumes. One of the main causes of the weakness of the dairy sector is poor development of thedistribution network of fresh milk from farms. Despite the subsidized sale of milk to industrialproduction plants, only 7 per cent of the milk produced on farms is used for this. The rest is con-sumed locally on the farms or is sold directly to consumers at higher prices than those fixed by thegovernment.
Fresh milk in Algeria is reconstituted milk obtained primarily from imported powered skim milk.Production is 859,206 tons/year, while the dairy-product sector (cheese, butter and cream) pro-duces 52,024 tons/year (Holdings, Ministry of Industry, 2001). All of the production is consumeddomestically.
Giplait prefers to use fresh milk collected in Algeria for the production of dairy products such ascheese, yogurt and butter. The private sector (small traditional enterprises) is not reflected statis-tically in this document but has specialized in the manufacture of these products.
Local production of cheese is soft cheese, Brie and Camembert. These types of cheese are ma-nufactured from fresh milk and sometimes from powered milk. Nonetheless, the most popular andleast expensive cheese in Algeria is a spread cheese prepared from imported cheddar.
As already mentioned, fresh milk is rarely available on the market and consumers normally buy re-constituted milk or whole powered milk ready for consumption (26 per cent milk fat content).
A programme of financing has been set up in Algeria that will help enterprises reduce pollution.The most important projects are related to the installation of wastewater treatment plants. Projectshave also been planned for the use of whey in the form of carbonated beverages, although the pro-jects are currently stopped.
Status of the dairy industry in the MAP countries
19 of 164
POPULATION: 28,539,321
AREA: 2,381,740 km2
NUMBER OF DAIRY FIRMS: 19
MILK PRODUCTION: 1,409,354 metric tons/yearALGERIA
Bosnia and Herzegovina is currently composed of two entities with broad autonomy: the Federationof Bosnia and Herzegovina and the Republic of Srpska. The Federation of Bosnia and Herzegovinais a decentralized entity divided into ten cantons with governments that have a high degree ofautonomy. The Republic of Srpska is a centralized entity divided into seven regions, where localadministration exists only at the municipality level. The Republic of Srpska is responsible for pro-viding environment protection, and the municipalities ensure law enforcement.
In 1991, before the war, total national production of cow’s milk was 874,000 tons, which con-trasts with 413,837 tons in 1997 as a result of the loss of half the dairy herd during the conflict(USDA, 2000). After the war, steps were taken to rebuild livestock, but that process has not yetbeen completed. Rebuilding of the dairy herd is being financed with the help of several pro-grammes of the World Bank, the European Union and other governmental and non-governmen-tal organizations.
In 1999, total national production of cow’s milk was 552,247 tons, with 286,522 tons producedin the Federation of Bosnia and Herzegovina and 265,725 tons in the Republic of Srpska. As forsheep’s milk, the total was 9,640 tons: the Federation of Bosnia and Herzegovina (7,355 tons) andthe Republic of Srpska (2,285 tons). The production of goat’s milk in Bosnia and Herzegovinawas 3,928 tons.
Nonetheless, the amount of milk sold to industry is insufficient to meet demand. Thus, Bosnia andHerzegovina cannot produce sufficient fresh milk and dairy products and, therefore, must im-port large amounts. The most important sources of imported milk for Bosnia and Herzegovina areSlovenia, Croatia, Germany and Hungary, while the Republic of Serbia (Yugoslavia) is the most im-portant source for the Republic of Srpska. It should be pointed out that illegal milk imports are a pro-blem for the governments of the Federation of Bosnia and Herzegovina and the Republic of Srpska.Even before the war, state farms produced only 25 per cent of the milk needed by industry. On theother hand, private farms were small (80 per cent, with one or two cows per farm) and only 6-7 percent of the milk was sold to the dairy industry with the rest being consumed on the farms. Afterthe conflict, this situation became further distorted because of a lack of supply, but supply to in-dustry has been progressively improving since 1997.
From 1997 until 1999, there was an increase in the purchase of milk from private farms because ofprice incentives created by local administrations and subsidies for construction of new productionplants.
In 1999, there were 16 dairy industries in Bosnia and Herzegovina with a productive capacity of200,000 tons/year (135,000 tons/year in the Federation of Bosnia and Herzegovina and 65,000tons/year in the Republic of Srpska) (USDA, 2000). These industries employ between 25 and 100
Prevention of Pollution in the Dairy Industry
20 of 164
POPULATION: 3,835,777
AREA: 51,129 km2
NUMBER OF DAIRY FIRMS: 16
MILK PRODUCTION: 565,815 metric tons/yearBOSNIA-
HERZEGOVINA
workers and have good industrial equipment. All of them produce fewer than 50 tons/day, becauseonly 25 per cent of capacity is used (22.6 per cent in the Federation of Bosnia and Herzegovinaand 32 per cent in the Republic of Srpska).
The production of milk and dairy products in Bosnia and Herzegovina will improve in the comingyears with the recovery of herds, the introduction of more productive breeds, price incentivesat the source in order to increase the volume of domestic fresh milk sold to industries, and theconstruction of new production plants, thus reducing demand for imported dairy products.
Currently, there is neither financing nor significant projects for the prevention of pollution. Limits onthe dumping of industrial wastewater date from before the war.
In Croatia, there are 34 dairy firms, which employ a total of 3,900 workers-18 firms that employfewer than 10 workers, 13 with between 10 and 250 workers and 3 with more than 250 workers(Central Bureau of Statistics, 1999). The larger firms produce more than 200 tons of milk anddairy products daily.
Annual production of cow’s milk reached 603,000 tons (Central Bureau of Statistics, 1999). The fo-llowing amounts of dairy products were produced: 271,116 tons of fresh milk, 54,178 tons of yo-gurt, 15,282 tons of cheese, 1,743 tons of butter and 1,147 tons of cream. In addition, 6,650 tonsof condensed milk and 971 tons of powered milk were produced (Central Bureau of Statisticsand Faculty of Agriculture, University of Zagreb, 1999).
It should be pointed out that 14,500 tons of fresh milk, 6,070 tons of yogurt, 2,240 tons of cheese and460 tons of butter were exported to other countries. The rest of the production was consumed in Croatia.The annual consumption of milk and dairy products in Croatia is 125 litres per capita, of which freshmilk corresponds to 92 litres per capita (Household Consumption Survey).
Currently, there are plans costing about euro 2 million for projects related to the protection of sur-face and ground water, air, noise, soil and nature, and for the management of waste in the amountof euro 100,000.
There are limitations on dumping of industrial wastewater. The maximum amount of COD is 125mg O2/litre for dumping into rivers and 700 mg O2/litre for dumping into the sewage system.
Several firms have taken steps to reduce the consumption of water through reuse of treated waste-water in several production operations or through changes in the refrigeration system, including re-placing compressors with closed circuits.
Status of the dairy industry in the MAP countries
21 of 164
POPULATION: 4,282,216
AREA: 56,538 km2
NUMBER OF DAIRY FIRMS: 34
MILK PRODUCTION: 603,000 metric tons/yearCROATIA
In 2000, there were 997 food and agricultural enterprises in Cyprus (16 per cent of all industry), ofwhich 11 per cent, about 113, were dairy firms. The number of employees in the dairy sector was1,285, which means employment of 12.5 per cent of the workers in the food and agricultural sec-tor (Industrial Statistics, 2000).
About 87 per cent of the dairy firms employ fewer than 10 workers, about 9 per cent between 10and 50 workers, and about 4 per cent more than 50 workers. Ninety-eight per cent of Cypriot dairyfirms produce less than 50 tons/day and only about 2 per cent produce between 50 and 200tons/day.
National production of cow’s milk in 2000 was 130,000 tons, with half being used as fresh milk andthe other half for the preparation of dairy products. As for sheep’s and goat’s milk, all the produc-tion, namely 43,000 tons, is completely used for the manufacture of dairy products (CyprusOrganisation of Dairy Products, 2000).
Annual industrial production of milk may be broken down as follows: 61,664 tons of pasteurizedmilk, 6,820 tons of yogurt, 7,956 tons of cheese, 440 tons of butter and 792 tons of cream. All ofthe production is consumed domestically except for 2,519 tons of cheese that is exported(Industrial Statistics, 1999).
The most important local cheeses are halloumi, of which 5,200 tons were manufactured in 1999,and feta (776 tons).
There are programmes in Cyprus for financing environmental projects related to cleaner tech-nologies, minimization, recycling, treatment of wastewater and control. Subventions areusually 30 per cent of the cost of these projects (Ministry of Commerce, Industry and Tourism,2001).
The government has constructed a central wastewater treatment plant to which small indus-tries (including dairy firms) can take their waste. The plant has facilities for secondary andtertiary treatments that use the latest technologies. This makes it possible to solve the problemof waste from small enterprises that are unable to have their own wastewater treatment plants.Dumping of COD is limited to 18,000 mg O2/litre, and dumping without prior treatment is per-mitted.
Among the most important dairy firms in Cyprus, one has its own wastewater treatment plant,while another expects that pre-treatment installations will be completed during 2001 and that thispartially treated wastewater will then be emptied into the public sewer to be treated together withdomestic sewage at the local wastewater treatment plant.
Prevention of Pollution in the Dairy Industry
22 of 164
POPULATION: 758,363
AREA: 9,250 km2
NUMBER OF DAIRY FIRMS: 113
MILK PRODUCTION: 173,000 metric tons/yearCYPRUS
In addition, the government is subsidizing pig farms to convert their current dry feeding systemsinto wet systems that will make it possible to use whey from the dairy industry. By the end of 2001,it is hoped that 85 per cent of the liquid whey will be used to feed pigs.
The food and agricultural sector is made up of 7,531 food and agricultural enterprises, whichmeans 31 per cent of all Egyptian industry. Almost half (3,334), 47 per cent, are dairy firms, which em-ploy 12,136 workers (Statistics Year Book, 2000). As a result, the dairy industry is the most im-portant subsector of the food and agricultural sector.
It is important to point out that 97 per cent of these enterprises employ fewer than 10 workers. Theremaining 3 per cent, some 86 enterprises, are divided among the 51 that have between 10 and 25workers, 33 that employ between 25 and 100, 2 enterprises with between 100 and 250 workersand 1 with more than 250 workers.
It is estimated that 85 per cent are traditional enterprises, 11 per cent are industries and 4 percent operate with a high level of technology. Approximately, 93 per cent of the firms have a le-vel of daily production of less than 50 tons and only about 2 per cent produce more than 200tons/day.
There is a high degree of foreign capital, as 6 of the 12 largest enterprises are controlled by multi-nationals (AECI, 1999).
Total national milk production in 1999 was 3.7 million tons, an increase of 6.7 per cent in relationto the previous year. This growth is due primarily to the expansion of modern farms with importedhigh-yield cattle (USDA, 2000).
Out of the total milk production in Egypt in 1998, about 20 per cent was consumed directly onthe farms, about 70 per cent was processed by small firms to produce milk (25 per cent), cheese(60 per cent) and other products (15 per cent), while modern industries processed only the remai-ning 10 per cent into fresh milk (23 per cent), soft cheeses (70 per cent) and other products (7 percent) (AECI, 1999).
As can be seen from the above, cheese is the most important dairy product in Egypt. Almost50 per cent of milk production and imports of skimmed powered milk are used for produ-cing cheese. Annual cheese production totals 310,000 tons. Almost all the cheese produced(75 per cent) is feta. Cheese is an important part of the Egyptian diet and is consumed dailyeither directly or with bread. The consumption of cheese is estimated to be 6 kilos/year/in-habitant.
Status of the dairy industry in the MAP countries
23 of 164
POPULATION: 69,536,644
AREA: 1,001,450 km2
NUMBER OF DAIRY FIRMS: 3,334
MILK PRODUCTION: 3,723,080 metric tons/yearEGYPT
The rest of the annual production of dairy products is divided among 30,000 tons of milk (pasteu-rized), 2,500 tons of yogurt and 130,000 tons of butter.
There are plans or environmental projects in Egypt for reducing pollution by dairy firms, whose prin-ciples are biological treatment of wastewater, reuse of water, minimization of water use through CIPsystems and monitoring and control of operations.
For environmental projects, financing is usually available for between 20 and 30 per cent of the va-lue of projects for cleaner technologies, minimization, reuse, energy and control. About 50 per centof available financing is used for wastewater treatment projects (EPAP, EEAA, 2001).
Limitations on the content of wastewater are 600 mg O2/litres of COD for dumping into the sewa-ge system, 30 mg O2/litre into rivers and 60 mg O2/litre into the sea (Law 93/62 48/82 4194).
France has 3,500 food and agricultural enterprises, representing 7 per cent of total French indus-trial activity, which employ 400,000 workers (10 per cent of the total labour force). The dairy sub-sector is formed by 730 enterprises, namely 20 per cent of all the food and agricultural enterprisesand 15 per cent of food and agricultural employment (60,000 workers) (MA, 2000).
France is the most important country for production of milk and dairy products in the Mediterraneanregion. Nonetheless, by number of enterprises it ranks sixth, which indicates that the enterprisesare larger than in other Mediterranean countries.
About 66 per cent of dairy firms produce less than 50 tons/year, 18 per cent between 50 and 100tons/year and 16 per cent more than 200 tons/year.Annual national milk production reached 25,631,650 tons, of which 24,892,000 tons were cow’smilk, 243,850 tons sheep’s milk and 496,800 tons goat’s milk (USDA, 1999).
Production of dairy products is distributed as follows: fresh milk (22,000,000 tons), yogurt (1,330,000tons), cheese (1,700,100 tons), butter (450,000 tons) and cream (300,000 tons). Apart from theseproducts, 737,132 tons of powered milk and 620,000 tons of powered whey are produced.
France exported 750,000 tons of liquid milk, 300,000 tons of powered milk, 480,000 tons of cheeseand 75,000 tons of butter (USDA, 2000).
Prevention of Pollution in the Dairy Industry
24 of 164
POPULATION: 59,551,227
AREA: 547,030 km2
NUMBER OF DAIRY FIRMS: 730
MILK PRODUCTION: 25,631,650 metric tons/yearFRANCE
In Greece, there are a total of 1,128 dairy firms, including 28 pasteurization plants, 800 cheese pro-ducers and 300 small firms in which yogurt is produced. Four producers process 80 per cent of thepasteurized milk.
The sector has structural deficiencies compared to the other countries of the European Union, es-pecially as regards the production of cow’s milk. The average Greek farm has 5.6 cows, comparedto the European average of 19.6. In Greece, there are only 220,000 dairy cows compared with6.5 million head of sheep and 3.9 million head of goats with a low yield of milk per animal. Thevalue of imported dairy products is euro 340 million (Greek Ministry of Agriculture, 1997).
Annual national milk production reached 1,910,045 tons in 1999, of which 790,000 tons were cow’smilk, 670,000 tons of sheep’s milk and 450,000 tons of goat’s milk (USDA, 1999).
Annual production of fresh milk was 713,536 tons of cow’s milk, 293,503 tons of cheese, 11,906tons of butter and 28,568 tons of cream (USDA, 1999).
In Israel, there are about 300 food and agricultural enterprises, of which 5 per cent, some 15 en-terprises, form the dairy sector that provides employment to 5,300 workers (ManufacturersAssociation of Israel, 2000).
Eighty per cent of the production of dairy products takes place in large and modern enterpriseswith a high level of technology and with more than 250 employees. Sixty per cent of the enterpri-ses produce large volumes of more than 50 tons/day.
Annual fresh milk production is 872,927 tons, primarily cow’s milk (99 per cent). The rest of the pro-duction is broken down as follows: 56,152 tons of yogurt, 100,000 tons of cheese, 5,235 tons ofbutter and 77,686 tons of cream (MAI, 2000).
It is important to point out that almost 80 per cent of the fresh milk produced in Israel is exportedto other countries.
Status of the dairy industry in the MAP countries
25 of 164
POPULATION: 5,938,903
AREA: 20,770 km2
NUMBER OF DAIRY FIRMS: 15
MILK PRODUCTION: 1,112,000 metric tons/yearISRAEL
POPULATION: 10,623,835
AREA: 131,940 km2
NUMBER OF DAIRY FIRMS: 1,128
MILK PRODUCTION: 1,910,045 metric tons/yearGREECE
Among the important environmental projects, one for the separation, storage and transportationof brine to authorized dumping points stands out. It should be mentioned that salt and salt brineare large sources of high pollution in Israel, and their dumping into the sewage system is prohi-bited.
Other projects underway deal with pre-treatment of wastewater to meet government standards, li-mits on atmospheric emissions, and the recycling of packaging and packing waste. The govern-ment does not subsidize any of these projects.
Maximum COD for dumping into the sewage system is 2,000 mg O2/litre, while that into the riveris 70 mg O2/litre (MAI, 2000).
In Italy, there are 20,125 food and agricultural enterprises, namely 12.4 per cent of total Italian in-dustries. The dairy industry is formed by 2,133 enterprises and makes up 11 per cent of the foodand agricultural sector. The dairy subsector employs 39,851 workers, representing 16 per cent ofthe employment in the food and agricultural industry (ISTAT, 1996).
Sixty-five per cent of the dairy firms have fewer than 10 workers, 20 per cent between 10 and 25workers, 13 per cent between 25 and 100 workers and the remaining 2 per cent have more than100 workers.
Annual milk production was 11,312,088 tons: cow’s milk (10,402,799 tons), sheep’s milk (638,092tons), goat’s milk (121,197 tons) and buffalo’s milk (150,000 tons) (Rapporto Assolatte IndustriaLattiero-Casearia Italiana, 2000).
Annual production of dairy products was fresh milk (3,100,000 tons), yogurt (190,000 tons),cheese (958,062 tons) and butter (105,000 tons) (Rapporto Assolatte Industria Lattiero-CaseariaItaliana, 2000).
Italy exported its dairy products to many countries, primarily to Germany and the United Statesof America, including 1,758,357 tons of raw milk,168,925 tons of cheese and, of less importance,12,297 tons of butter, 5,672 tons of fresh milk and 5,852 tons of yogurt.
In addition, Italy imported 347,179 tons of cheese and 347,362 tons of fresh milk.
The best-known cheeses in Italy are Grana Padano and Parmigiano Reggiano, which represent 25per cent of total production. Soft cheeses (primarily Mozzarella) represent a volume of 39 per cent.
Prevention of Pollution in the Dairy Industry
26 of 164
POPULATION: 57,679,825
AREA: 301,230 km2
NUMBER OF DAIRY FIRMS: 2,133
MILK PRODUCTION: 11,312,088 metric tons/yearITALY
Other important cheeses are Pecorino (7 per cent) and Gorgonzola (4.5 per cent) (RapportoAssolatte Industria Lattiero-Casearia, 2000).
Maximum permitted levels for COD are 500 mg O2/litre for dumping into the sewage system and160 mg O2/litre for dumping into rivers and the sea.
The main problem that the Lebanese dairy industry is facing is the low quality of fresh milk pro-duced. Several factors are the causes of this problem, including inadequate design and the con-ditions of installations for dairy herds, poor hygiene and lack of refrigeration during storage andtransportation.
Improvement of dairy production on the farms is difficult because of the low prices paid for milk,which are below production costs at several times of the year.
Current production of dairy industries in Lebanon is below capacity. The large producers want toincrease milk supply in the country if quality is improved. And, for this, programmes to provide refrigera-tion vats to farms interested in receiving higher prices for better-quality fresh milk should be carried out.
The quantity of milk produced in Lebanon in 1999 was 272,300 tons: 201,000 tons of cow’s milk,33,800 tons of sheep’s milk and 37,500 tons of goat’s milk.
In Libya, there are 87 food and agricultural enterprises that employ 11,000 workers. The dairy sec-tor is formed by 12 enterprises (14 per cent), employing 2,400 workers (22 per cent). Most ofthese firms are owned by the government (General Dairy Product, 2000). These statistics donot take into account the more than 200 small private traditional enterprises.
Twenty per cent of these enterprises employ between 25 and 100 workers and the rest of the firmsemploy between 100 and 200 workers.
Status of the dairy industry in the MAP countries
27 of 164
POPULATION: 3,578,036
AREA: 10,400 km2
NUMBER OF DAIRY FIRMS: -
MILK PRODUCTION: 272,300 metric tons/yearLEBANON
POPULATION: 5,240,599
AREA: 1,759,540 km2
NUMBER OF DAIRY FIRMS: 12
MILK PRODUCTION: 74,800 metric tons/yearLIBYA
Annual milk production in Libya was 74,800 tons: 73,000 tons of cow’s milk and 1,800 tons ofgoat’s milk. The production of dairy products is distributed between fresh milk (57,000 tons/year),yogurt (14,000 tons/year) and cheese (100 tons/year) (GDP, 2000). All the production is for thedomestic market.
Only a few enterprises have wastewater treatment plants.
In Malta, there is only one large dairy firm, which employs 166 workers, including 10 managers, 15technicians and 141 workers. This firm produces more than 50 tons of dairy products per dayand has an annual sales volume of euro 26.3 million.
In 2000, total milk production in Malta was 50,800 tons, primarily cow’s milk (46,400 tons) and toa lesser extent, sheep’s milk (2,600 tons) and goat’s milk (1,800 tons). About 30,200 tons of freshmilk, 1,510 tons of yogurt, 2,300 tons of cheese and 360 tons of cream were produced (Malta DairyProducts Ltd., 2000). All the production is for the domestic market.
In Morocco, there are 1,642 food and agricultural enterprises, representing 25 per cent of totalMoroccan industrial activity. The dairy firms make up 2.3 per cent of the food and agricultural sec-tor (some 38 enterprises) and employ 8,984 workers (Centre Marocain de Production Propre).
70 per cent of the firms forming the Moroccan dairy sector can be considered large firms due toboth their number of workers and production. Some of them are multinationals and others ownedby large industrial national groups. Enterprises with more than 250 workers represent 41 percent, those with a number of workers between 100 and 250, 15 per cent, and finally, those em-ploying between 25 and 100 workers, represent 13 per cent.
The rest, namely 30 per cent, is primarily made up of cooperatives as well as small and medium-sized production units. There have been considered as such firms with a number of workers
Prevention of Pollution in the Dairy Industry
28 of 164
POPULATION: 30,645,605
AREA: 446,550 km2
NUMBER OF DAIRY FIRMS: 38
MILK PRODUCTION: 1,445,000 metric tons/yearMOROCCO
POPULATION: 394,583
AREA: 316 km2
NUMBER OF DAIRY FIRMS: 1
MILK PRODUCTION: 50,800 metric tons/yearMALTA
between 10 and 25 (18 per cent of the total) and those employing less than 10 workers, which re-present 13 per cent of all the dairy firms.
The most important region with regard to milk production is El Jadida, followed by Khémisset,Settat, Meknes and Oujda.
As for the average annual production of milk and/or dairy products in tons/day, 30 per cent ofthe firms produce less than 50 tons/day, 50 per cent produce between 50 and 200 tons/day and therest, 20 per cent, produce over 200 tons/day.
National milk production reached 1,445,000 tons, distributed between 1,410,000 tons of cow’s milkand 35,000 tons of goat’s milk.
Despite the high level of national milk production, the volume of fresh milk is rather low becauseof local consumption and direct sales on farms. Total production of fresh milk was 860,000 tons,while that of cheese and butter was 10,686 tons and 10,000 tons respectively. Production of yo-gurt and other fermented milks reached 390,000 tons.
As it can be observed, production of fresh milk predominates over the rest of dairy products, dueto seasonal nature of national milk production. There are two seasons: one of high production (fromFebruary until August) and another of low production. During the season of high production, pro-cessing firms work at full capacity and milk surplus is used for production of dairy products. Duringlow production season, industries only produce fresh milk; small-sized firms work below capa-city, while large enterprises reconstitute powered milk produced during the season of high pro-duction.
Financing of environmental projects usually reaches 40 per cent of the total cost in projects con-cerning cleaner technologies, 20 per cent in minimization projects and 40 per cent in wastewatertreatment projects.
In Morocco, there is a fund for reducing industrial pollution (Fonds de Dépollution Industrielle,FODEP), which finances projects reducing both water consumption and environmental pollution.Under the framework of FODEP, 15 projects (out of 30 presented) have been carried out through-out the year 2001, 8 focusing on treatment of liquid effluents, 5 on treatment of gas effluents and2 on solid waste. The 15 projects represented an overall investment of Dirham 104.55 million (eu-ro 10,170,960), of which financing was Dirham 78.20 million (euro 7,607,547). Projects related toliquid effluents represented more than 50 per cent of the total cost. 60 per cent of these projectsare from the dairy industry.
As for limitations concerning dumping of wastewater, there is no law specifying them. Nonetheless,there are attempts of controlling dumping at the regional level by using as a reference numberthe average amounts of dumping for each industrial zone.
Status of the dairy industry in the MAP countries
29 of 164
Spain has 33,105 food and agricultural enterprises, representing 14 per cent of total Spanish indus-trial activity, which employ 368,750 workers (19 per cent). The dairy subsector has 1,511 enterpri-ses, about 5 per cent of all the food and agricultural enterprises and 7 per cent of food and agricul-tural employment (27,745 workers) (Ministerio de Agricultura, Pesca y Alimentación, FIAB, 1999).
Eighty-five per cent of the enterprises have fewer than 10 employees, 11 per cent between 10 and25, 2 per cent between 25 and 100 and the remaining 2 per cent more than 100 workers (FIAB,1999).
Annual national milk production was 6,281,300 tons, of which 5,685,400 tons were cow’s milk,278,200 tons of sheep’s milk and 317,700 tons of goat’s milk (FENIL, 1999).
The production of dairy products is broken down as follows: fresh milk (3,645,400 tons), yogurt(581,600 tons), cheese (293,800 tons), butter (36,200 tons) and cream (86,000 tons) (FENIL, 1999).In 1999, Spain imported 400,729 tons of liquid, condensed or powered milk, 119,985 tons of yo-gurt and other fermented milks, 110,862 tons of cheese, 9,237 tons of butter and 10,789 tons ofcream (Departamento de Aduanas, 1999).
On the other hand, in 1999 Spain exported 200,494 tons of liquid, condensed, concentrated or po-wered milk, 33,422 tons of yogurt and other fermented milks, 36,099 tons of cheese, 8,477 tons ofbutter and 18,411 tons of cream (Departamento de Aduanas, 1999).
Per capita consumption was 108 kilos/inhabitant/year of fresh milk, 9.2 kilos/inhabitant/year ofcheese, 16.2 kilos/inhabitant/year of yogurt, 0.47 kilos/inhabitant/year of butter and 2.3 kilos/in-habitant/year of cream (MAPA, 1999).
In Syria, there are 1,250 food and agricultural enterprises, of which 2.5 per cent, some 31 enter-prises, make up the dairy sector (Statistics of the Food Association, 2001) (Arab Federation forFood Industries, 2001).
Prevention of Pollution in the Dairy Industry
30 of 164
POPULATION: 16,728,808
AREA: 185,180 km2
NUMBER OF DAIRY FIRMS: 31
MILK PRODUCTION: 1,656,085 metric tons/yearSYRIA
POPULATION: 40,037,995
AREA: 504,782 km2
NUMBER OF DAIRY FIRMS: 1,511
MILK PRODUCTION: 6,281,300 metric tons/yearSPAIN
Forty per cent of the enterprises employ between 10 and 25 workers, while the rest, 60 per cent,employ between 25 and 100 workers. Seventy per cent of the enterprises are traditional. Ninety-nine per cent of the enterprises produce fewer than 50 tons/year.
There is an important number of small domestic firms, chiefly in rural areas, which produce con-siderable amounts of both yogurt and cheese for domestic consumption. Data on the subject isnot included since there is no reliable statistics concerning these productions.
Total national milk production in Syria was 1,656,085 tons: 1,143,423 tons of cow’s milk, 445,913tons of sheep’s milk, 65,853 tons of goat’s milk and 896 tons of buffalo’s milk.
This high volume of production contrasts with the low level of production of dairy products by asmall number of enterprises. Annual production of fresh milk was 14,111 tons of cow’s milk. Therest of the production is broken down as follows: 7,030 tons of yogurt, 82,170 tons of cheeseand 3,356 tons of butter (Ministry of Industry, 2000).
The main environmental project in the dairy sector is a short-term project for reuse of whey.
The maximum amount of COD authorized for dumping into the sewage system is 3,000 mgO2/litre (Syrian Standard, 1995).
There are 47 dairy firms, including eight fresh milk production plants, 14 plants producing yogurtand 25 producing cheese.
Milk production in Tunisia is increasing thanks to improvement of the feeding and breeding of dairycows. The amount of imported powered milk has been dramatically reduced recently, and thecountry currently almost covers its dairy needs and is almost self-sufficient.
Total national milk production reached 830,000 tons, including 800,000 tons of cow’s milk, 17,000tons of sheep’s milk and 12,000 tons of goat’s milk.
Production of fresh milk in 1996 reached 262,480 tons, while 550 million jars of yogurt, 6,420tons of various types of cheese and 5,008 tons of butter were produced (USDA, 2000).
Industrial production of yogurt and cheese is increasing along with development of the dairysector.
Status of the dairy industry in the MAP countries
31 of 164
POPULATION: 9,593,402
AREA: 163,310 km2
NUMBER OF DAIRY FIRMS: 47
MILK PRODUCTION: 830,000 metric tons/yearTUNISIA
The Turkish food and agricultural sector has 24,000 enterprises, of which 18 per cent, some4,320 enterprises, are in the dairy sector (Republic of Turkey, Ministry of Agriculture and RuralAffairs, 1999).
Seventy per cent of these enterprises are traditional with fewer than 10 workers. About 29.5 percent employ between 10 and 250 workers, and about 0.5 per cent use modern technology andemploy more than 250 persons.
Annual milk production in Turkey is 9,970,000 tons distributed among cow’s milk (8,832,000tons), sheep’s milk (813,000 tons), goat’s milk (245,000 tons) and buffalo’s milk (80,000 tons)(Republic of Turkey, Ministry of Agriculture and Rural Affairs, 1998).
Annual production of diary products can be broken down into fresh milk (251,632 tons), yogurt(204,961 tons), cheese (201,260 tons), butter (15,771 tons) and cream (1,383 tons). Almost allproduction is for the domestic market, except for 5,006 tons of cheese that are exported(Republic of Turkey, Ministry of Agriculture and Rural Affairs, 1999).
The main environmental projects carried out in Turkey to reduce pollution in the dairy industryare collection and spray drying of cheese whey, the recycling of solid waste, the reduction of wa-ter consumption and use of low-energy-consuming machinery.
Maximum BOD for dumping wastewater in Turkey is 40 mg O2/litre into the sewage system, ri-vers or the sea (Turkish National Water Pollution Control Act, 1988).
Prevention of Pollution in the Dairy Industry
32 of 164
POPULATION: 66,493,470
AREA: 780,580 km2
NUMBER OF DAIRY FIRMS: 4,320
MILK PRODUCTION: 9,970,000 metric tons/yearTURKEY
This chapter describes the most representative production processes for the main groups ofdairy products and subsidiary operations:
• Fresh milk;• Products obtained from milk fat (cream and butter);• Fermented milks (yogurt);• Cheeses (ripened and soft);• Secondary operations.
For each of these production processes and subsidiary operations, the main related environmen-tal effects are described and ranked semi-qualitatively in function of their relative importance inoverall production. The ranking used has three levels: primary, secondary and insignificant (see fo-llowing table).
Table 3: Criteria for ranking environmental effects
PRIMARY An important effect with regard to the overall impact of the activity
SECONDARY A secondary effect with regard to the overall impact of the activity
INSIGNIFICANT An insignificant effect with regard to the overall impact of the activity
3.1. Processing of fresh milk
Milk used for human consumption can be divided into two categories:
• Raw milk. Raw milk without any processing has been consumed as a natural product sinceantiquity, and in many countries it continues to be a very frequent form for consumingmilk.
• Heat-treated milk (pasteurized or sterilized). The ease with which milk can rapidly deteriorate andbe altered by all types of pollution make it necessary to submit milk to a specific treatment to in-crease its conservation and eliminate possible pollution before consumption. In many countries,this treatment is required by law.
Metodología de Grupos de Trabajo
33 of 164
3. THE MAIN PRODUCTION PROCESSES USEDIN THE DAIRY INDUSTRY AND RELATEDENVIRONMENTAL EFFECTS
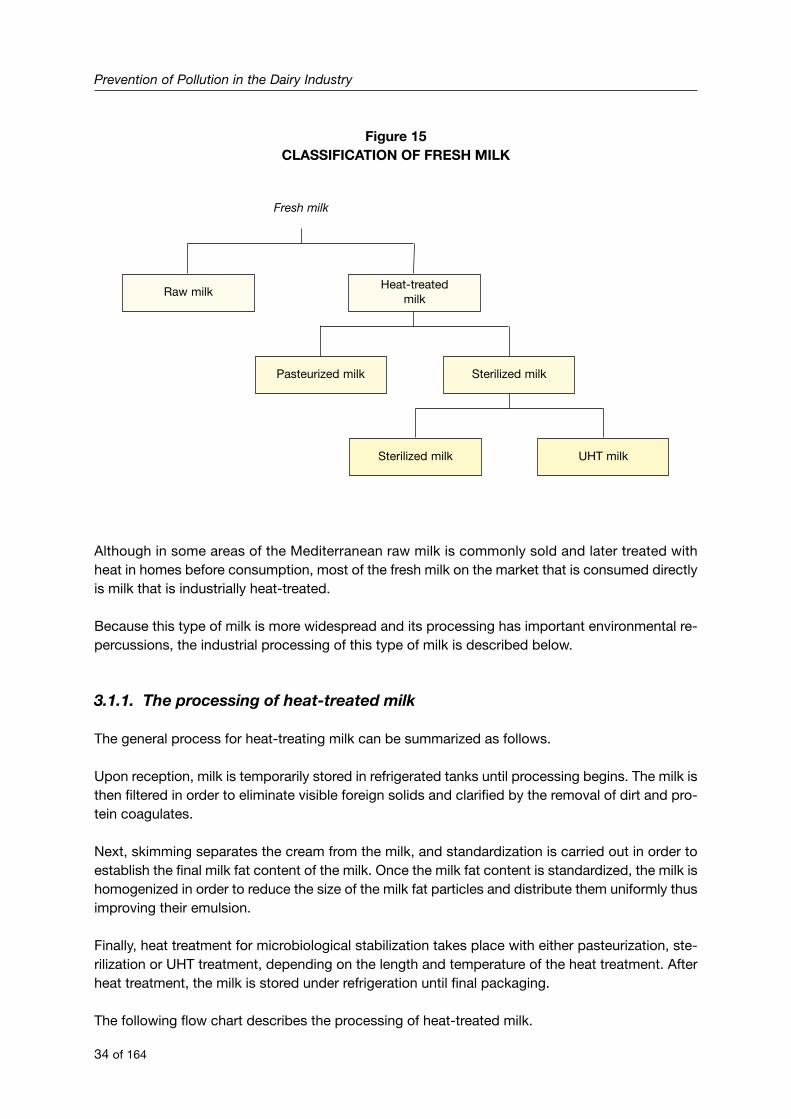
Figure 15CLASSIFICATION OF FRESH MILK
Although in some areas of the Mediterranean raw milk is commonly sold and later treated withheat in homes before consumption, most of the fresh milk on the market that is consumed directlyis milk that is industrially heat-treated.
Because this type of milk is more widespread and its processing has important environmental re-percussions, the industrial processing of this type of milk is described below.
3.1.1. The processing of heat-treated milk
The general process for heat-treating milk can be summarized as follows.
Upon reception, milk is temporarily stored in refrigerated tanks until processing begins. The milk isthen filtered in order to eliminate visible foreign solids and clarified by the removal of dirt and pro-tein coagulates.
Next, skimming separates the cream from the milk, and standardization is carried out in order toestablish the final milk fat content of the milk. Once the milk fat content is standardized, the milk ishomogenized in order to reduce the size of the milk fat particles and distribute them uniformly thusimproving their emulsion.
Finally, heat treatment for microbiological stabilization takes place with either pasteurization, ste-rilization or UHT treatment, depending on the length and temperature of the heat treatment. Afterheat treatment, the milk is stored under refrigeration until final packaging.
The following flow chart describes the processing of heat-treated milk.
Prevention of Pollution in the Dairy Industry
34 of 164
Fresh milk
Raw milkHeat-treated
milk
Pasteurized milk Sterilized milk
Sterilized milk UHT milk
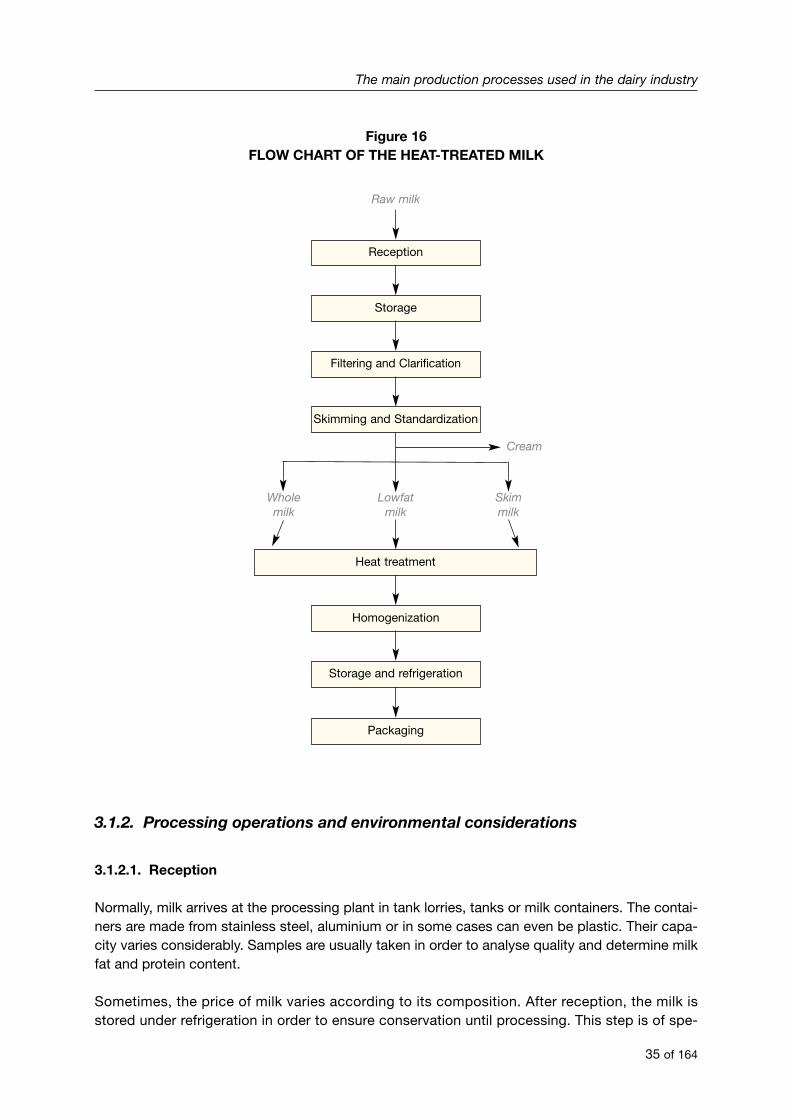
Figure 16FLOW CHART OF THE HEAT-TREATED MILK
3.1.2. Processing operations and environmental considerations
3.1.2.1. Reception
Normally, milk arrives at the processing plant in tank lorries, tanks or milk containers. The contai-ners are made from stainless steel, aluminium or in some cases can even be plastic. Their capa-city varies considerably. Samples are usually taken in order to analyse quality and determine milkfat and protein content.
Sometimes, the price of milk varies according to its composition. After reception, the milk isstored under refrigeration in order to ensure conservation until processing. This step is of spe-
The main production processes used in the dairy industry
35 of 164
Raw milk
Reception
Storage
Filtering and Clarification
Skimming and Standardization
Homogenization
Heat treatment
Storage and refrigeration
Packaging
Cream
Lowfatmilk
Wholemilk
Skimmilk
cial importance when the milk must remain in storage before being treated because of irregularsupply flow.
At this time, the milk lorries and collection tanks are cleaned before transporting more milk. Thecleaning of the lorries and tanks is described in greater detail in the section on cleaning operationswhere there is also a description of the environmental effects of this operation.
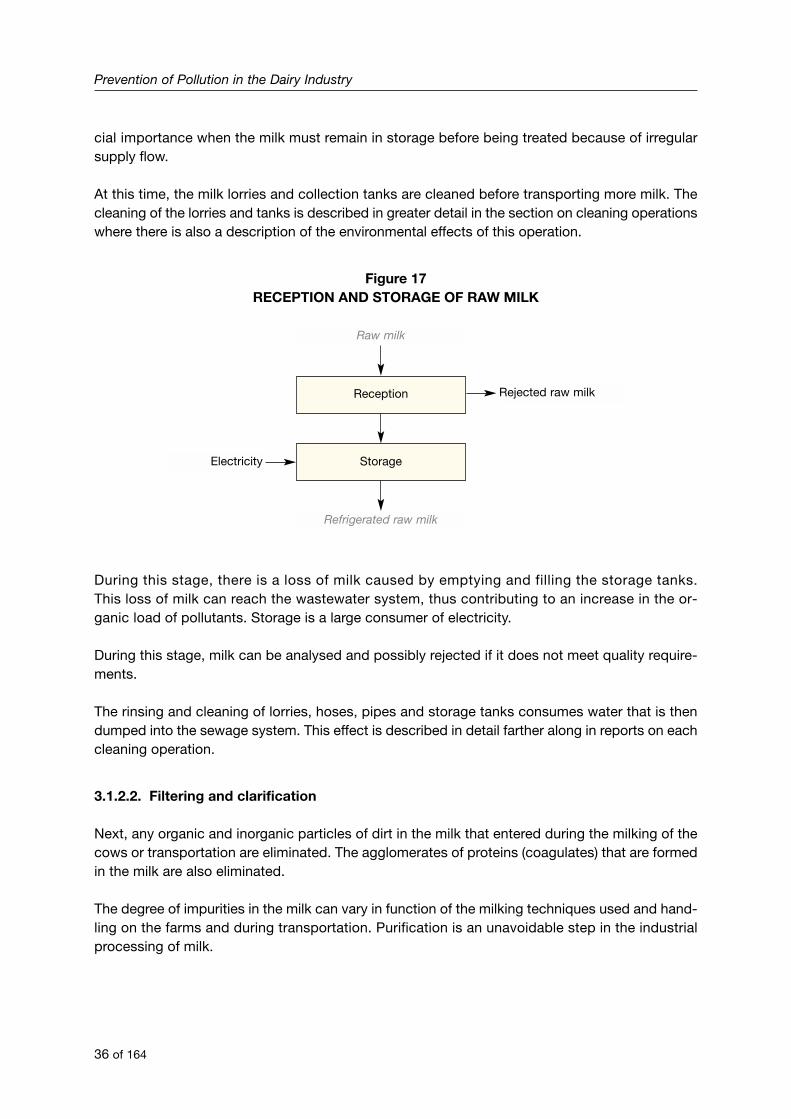
Figure 17RECEPTION AND STORAGE OF RAW MILK
During this stage, there is a loss of milk caused by emptying and filling the storage tanks.This loss of milk can reach the wastewater system, thus contributing to an increase in the or-ganic load of pollutants. Storage is a large consumer of electricity.
During this stage, milk can be analysed and possibly rejected if it does not meet quality require-ments.
The rinsing and cleaning of lorries, hoses, pipes and storage tanks consumes water that is thendumped into the sewage system. This effect is described in detail farther along in reports on eachcleaning operation.
3.1.2.2. Filtering and clarification
Next, any organic and inorganic particles of dirt in the milk that entered during the milking of thecows or transportation are eliminated. The agglomerates of proteins (coagulates) that are formedin the milk are also eliminated.
The degree of impurities in the milk can vary in function of the milking techniques used and hand-ling on the farms and during transportation. Purification is an unavoidable step in the industrialprocessing of milk.
Prevention of Pollution in the Dairy Industry
36 of 164
Raw milk
Reception Rejected raw milk
Storage
Refrigerated raw milk
Electricity
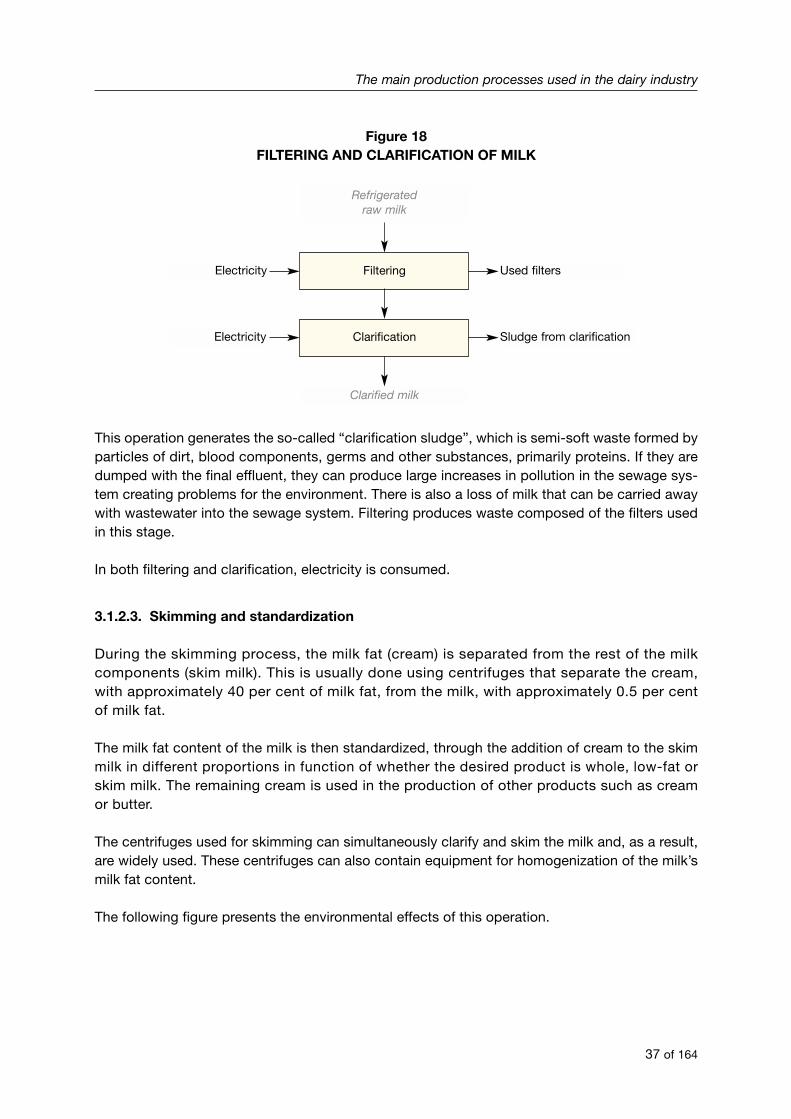
Figure 18FILTERING AND CLARIFICATION OF MILK
This operation generates the so-called “clarification sludge”, which is semi-soft waste formed byparticles of dirt, blood components, germs and other substances, primarily proteins. If they aredumped with the final effluent, they can produce large increases in pollution in the sewage sys-tem creating problems for the environment. There is also a loss of milk that can be carried awaywith wastewater into the sewage system. Filtering produces waste composed of the filters usedin this stage.
In both filtering and clarification, electricity is consumed.
3.1.2.3. Skimming and standardization
During the skimming process, the milk fat (cream) is separated from the rest of the milkcomponents (skim milk). This is usually done using centrifuges that separate the cream,with approximately 40 per cent of milk fat, from the milk, with approximately 0.5 per centof milk fat.
The milk fat content of the milk is then standardized, through the addition of cream to the skimmilk in different proportions in function of whether the desired product is whole, low-fat orskim milk. The remaining cream is used in the production of other products such as creamor butter.
The centrifuges used for skimming can simultaneously clarify and skim the milk and, as a result,are widely used. These centrifuges can also contain equipment for homogenization of the milk’smilk fat content.
The following figure presents the environmental effects of this operation.
The main production processes used in the dairy industry
37 of 164
Refrigeratedraw milk
Filtering Used filtersElectricity
Clarification
Clarified milk
Sludge from clarificationElectricity
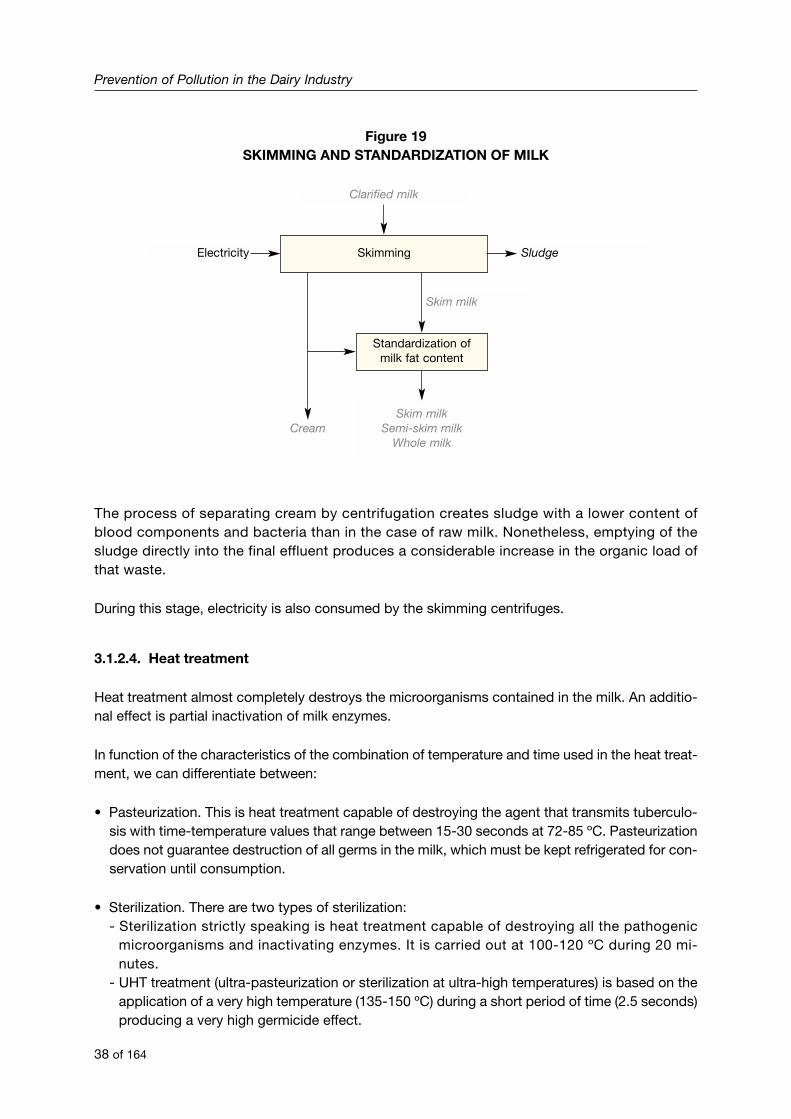
Figure 19SKIMMING AND STANDARDIZATION OF MILK
The process of separating cream by centrifugation creates sludge with a lower content ofblood components and bacteria than in the case of raw milk. Nonetheless, emptying of thesludge directly into the final effluent produces a considerable increase in the organic load ofthat waste.
During this stage, electricity is also consumed by the skimming centrifuges.
3.1.2.4. Heat treatment
Heat treatment almost completely destroys the microorganisms contained in the milk. An additio-nal effect is partial inactivation of milk enzymes.
In function of the characteristics of the combination of temperature and time used in the heat treat-ment, we can differentiate between:
• Pasteurization. This is heat treatment capable of destroying the agent that transmits tuberculo-sis with time-temperature values that range between 15-30 seconds at 72-85 ºC. Pasteurizationdoes not guarantee destruction of all germs in the milk, which must be kept refrigerated for con-servation until consumption.
• Sterilization. There are two types of sterilization:- Sterilization strictly speaking is heat treatment capable of destroying all the pathogenic
microorganisms and inactivating enzymes. It is carried out at 100-120 ºC during 20 mi-nutes.
- UHT treatment (ultra-pasteurization or sterilization at ultra-high temperatures) is based on theapplication of a very high temperature (135-150 ºC) during a short period of time (2.5 seconds)producing a very high germicide effect.
Prevention of Pollution in the Dairy Industry
38 of 164
Clarified milk
Skimming SludgeElectricity
Standardization ofmilk fat content
Skim milk
Skim milkSemi-skim milk
Whole milkCream
After one of the sterilization treatments, milk can be conserved at room temperature for a longperiod of time, as long as the packaging process is aseptic. These treatments are used prima-rily to process fresh milk for long conservation and to aromatize milk.
The system of heat-treatment can be separated into systems of direct or indirect heating.
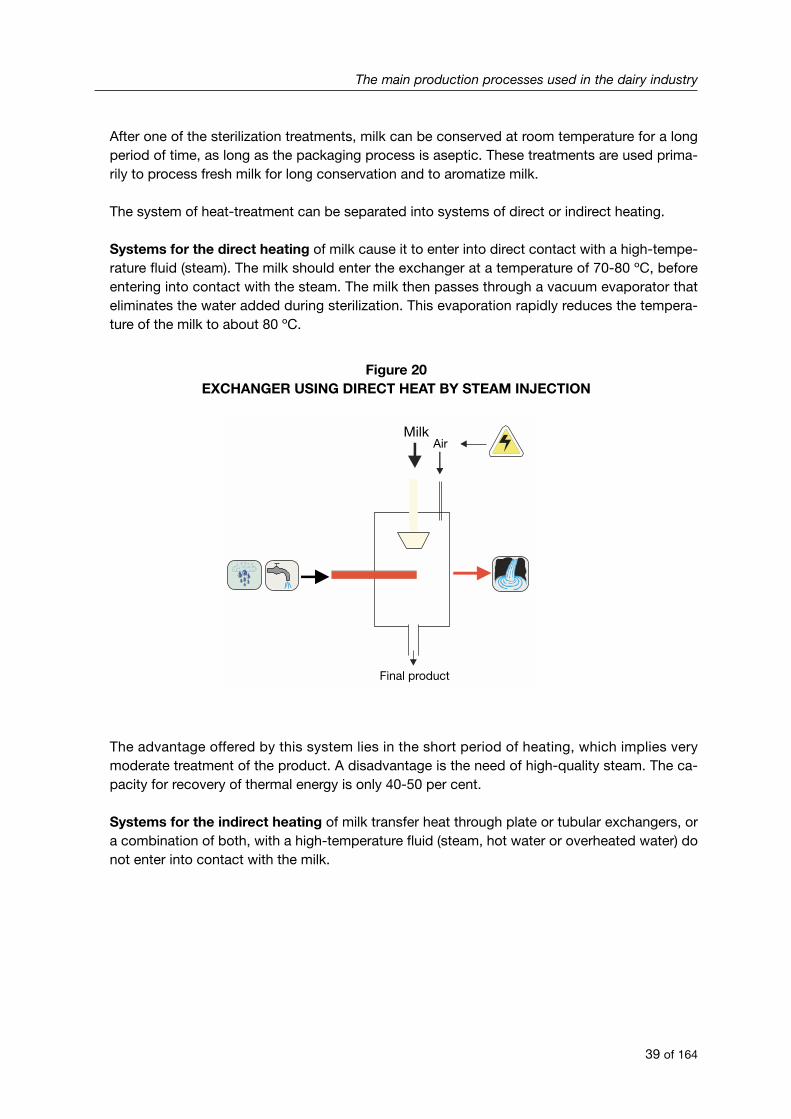
Systems for the direct heating of milk cause it to enter into direct contact with a high-tempe-rature fluid (steam). The milk should enter the exchanger at a temperature of 70-80 ºC, beforeentering into contact with the steam. The milk then passes through a vacuum evaporator thateliminates the water added during sterilization. This evaporation rapidly reduces the tempera-ture of the milk to about 80 ºC.
Figure 20EXCHANGER USING DIRECT HEAT BY STEAM INJECTION
The advantage offered by this system lies in the short period of heating, which implies verymoderate treatment of the product. A disadvantage is the need of high-quality steam. The ca-pacity for recovery of thermal energy is only 40-50 per cent.
Systems for the indirect heating of milk transfer heat through plate or tubular exchangers, ora combination of both, with a high-temperature fluid (steam, hot water or overheated water) donot enter into contact with the milk.
The main production processes used in the dairy industry
39 of 164
Final product
MilkAir
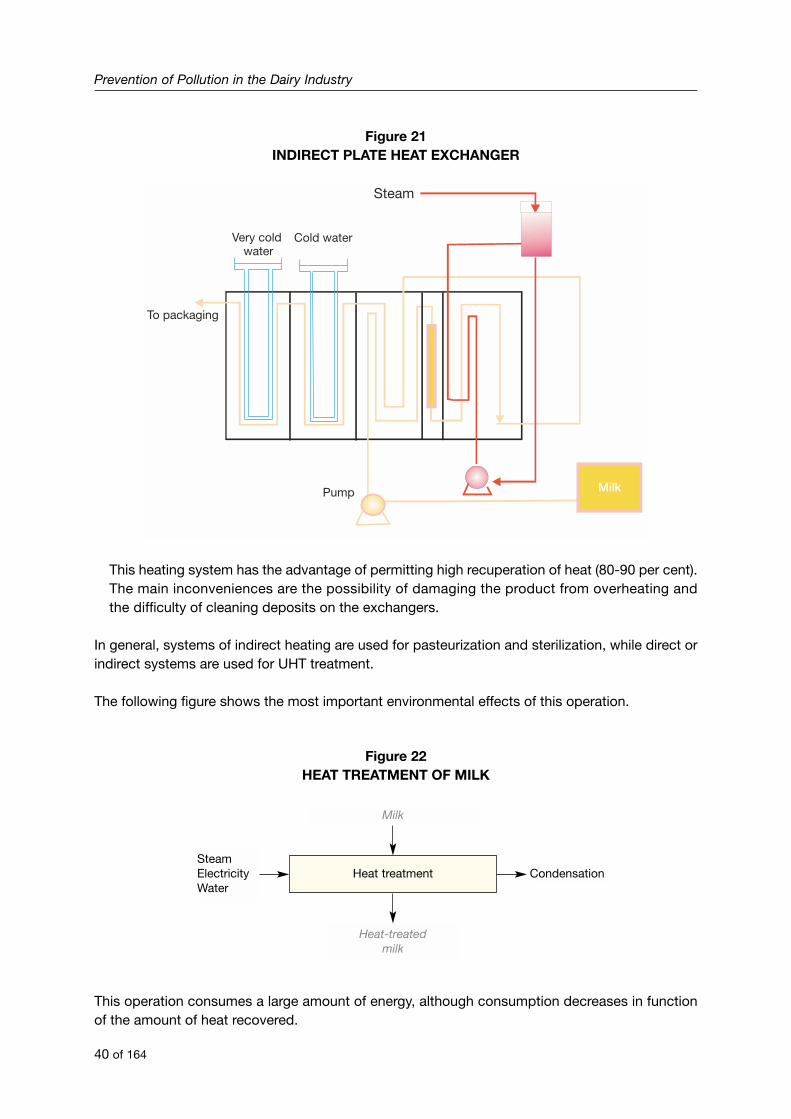
Figure 21INDIRECT PLATE HEAT EXCHANGER
This heating system has the advantage of permitting high recuperation of heat (80-90 per cent).The main inconveniences are the possibility of damaging the product from overheating andthe difficulty of cleaning deposits on the exchangers.
In general, systems of indirect heating are used for pasteurization and sterilization, while direct orindirect systems are used for UHT treatment.
The following figure shows the most important environmental effects of this operation.
Figure 22HEAT TREATMENT OF MILK
This operation consumes a large amount of energy, although consumption decreases in functionof the amount of heat recovered.
Prevention of Pollution in the Dairy Industry
40 of 164
Very coldwater
Cold water
Milk
To packaging
Pump
Steam
Milk
Heat treatment CondensationSteamElectricityWater
Heat-treatedmilk
In systems of direct heating, the milk is passed through a vacuum evaporator to eliminate wateradded during the direct heat treatment with steam. The released vapour is condensed and if eva-cuated it is considered to be a waste.
3.1.2.5. Homogenization
Homogenization takes place either before or after heat treatment. This process reduces the size offat globules thus favouring uniform distribution of the milk fat. At the same time, separation of thecream is avoided.
Homogenization also reduces the stability of the proteins when subjected to heat so that when milkis exposed to high temperatures, homogenization is carried out after heat treatment.
During homogenization milk is passed at high pressure through slots narrower than the fat globu-les in order to reduce the diameter of the fat globules, thus keeping them in suspension.
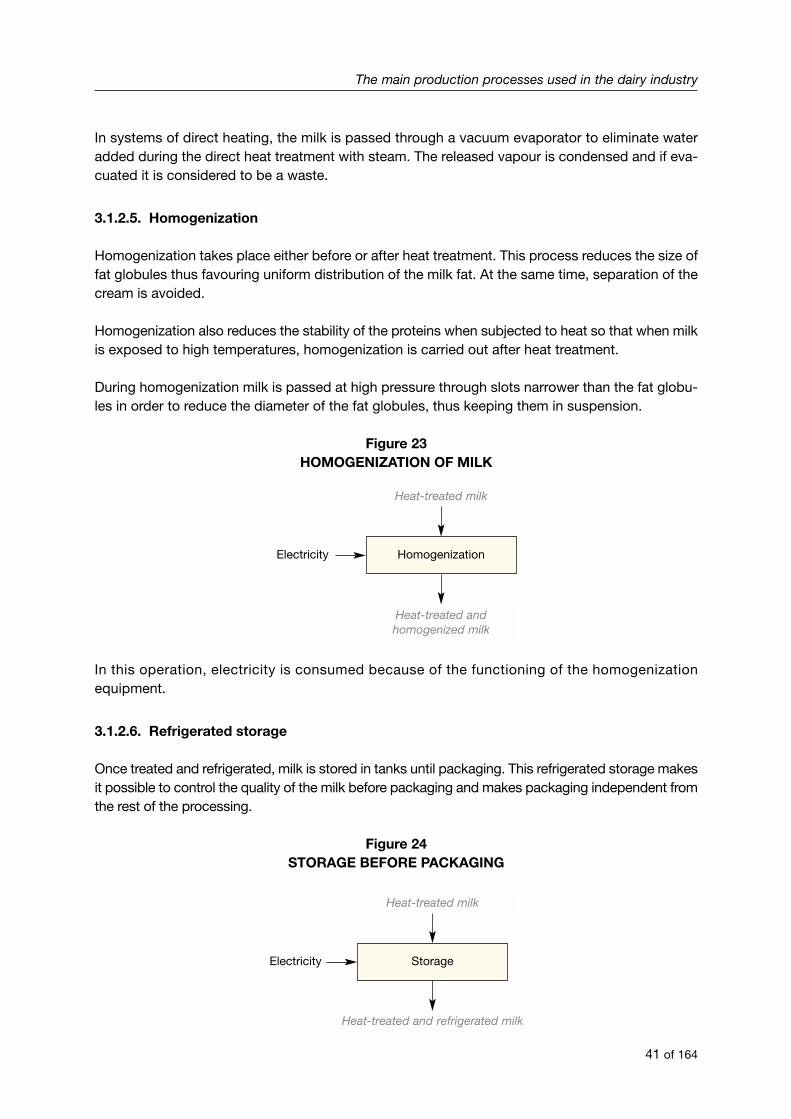
Figure 23HOMOGENIZATION OF MILK
In this operation, electricity is consumed because of the functioning of the homogenizationequipment.
3.1.2.6. Refrigerated storage
Once treated and refrigerated, milk is stored in tanks until packaging. This refrigerated storage makesit possible to control the quality of the milk before packaging and makes packaging independent fromthe rest of the processing.
Figure 24STORAGE BEFORE PACKAGING
The main production processes used in the dairy industry
41 of 164
Heat-treated milk
HomogenizationElectricity
Heat-treated andhomogenized milk
Heat-treated milk
StorageElectricity
Heat-treated and refrigerated milk
The main environmental effects produced during this stage are the consumption of energy ne-cessary to maintain the milk refrigerated and possible losses of milk that can happen duringstorage in tanks.
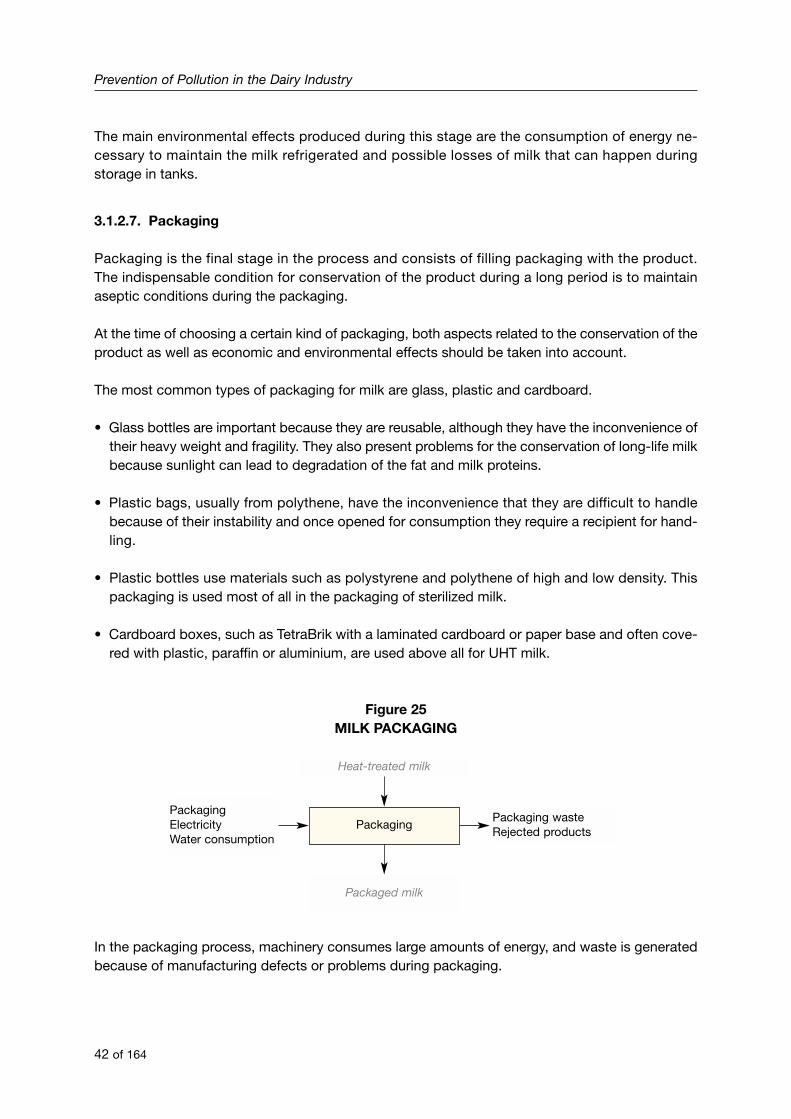
3.1.2.7. Packaging
Packaging is the final stage in the process and consists of filling packaging with the product.The indispensable condition for conservation of the product during a long period is to maintainaseptic conditions during the packaging.
At the time of choosing a certain kind of packaging, both aspects related to the conservation of theproduct as well as economic and environmental effects should be taken into account.
The most common types of packaging for milk are glass, plastic and cardboard.
• Glass bottles are important because they are reusable, although they have the inconvenience oftheir heavy weight and fragility. They also present problems for the conservation of long-life milkbecause sunlight can lead to degradation of the fat and milk proteins.
• Plastic bags, usually from polythene, have the inconvenience that they are difficult to handlebecause of their instability and once opened for consumption they require a recipient for hand-ling.
• Plastic bottles use materials such as polystyrene and polythene of high and low density. Thispackaging is used most of all in the packaging of sterilized milk.
• Cardboard boxes, such as TetraBrik with a laminated cardboard or paper base and often cove-red with plastic, paraffin or aluminium, are used above all for UHT milk.
Figure 25MILK PACKAGING
In the packaging process, machinery consumes large amounts of energy, and waste is generatedbecause of manufacturing defects or problems during packaging.
Prevention of Pollution in the Dairy Industry
42 of 164
Heat-treated milk
PackagingPackagingElectricityWater consumption
Packaged milk
Packaging wasteRejected products
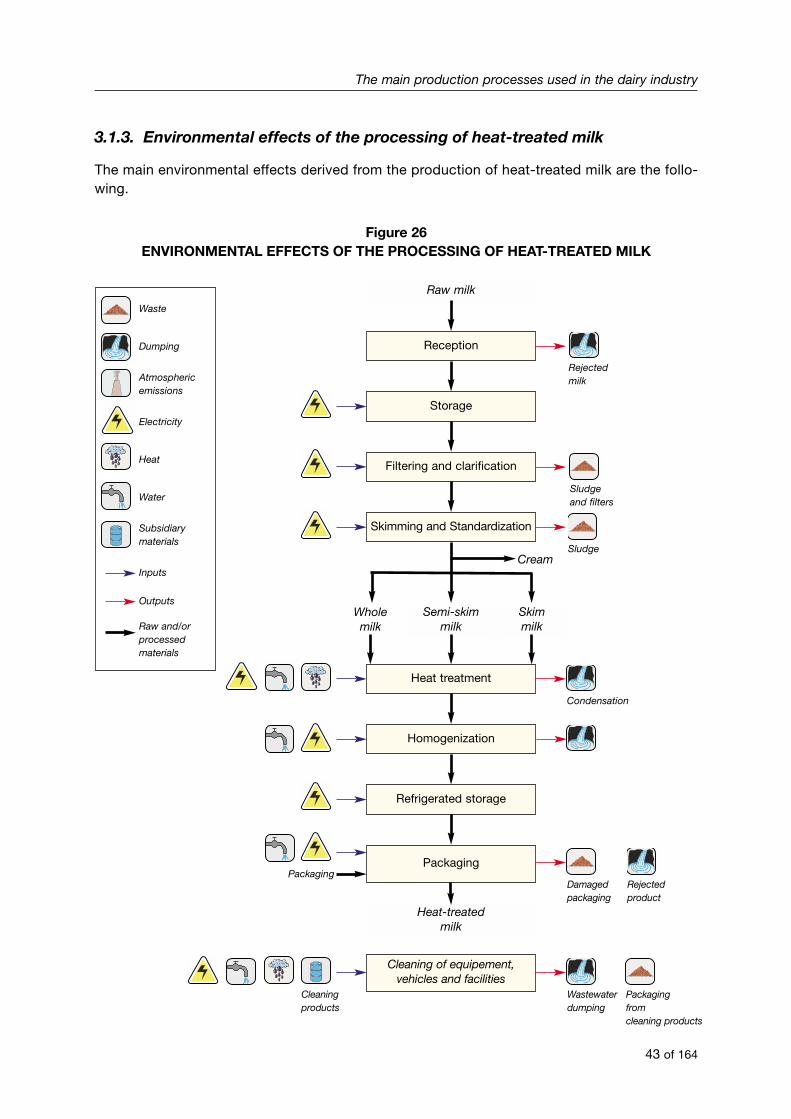
3.1.3. Environmental effects of the processing of heat-treated milk
The main environmental effects derived from the production of heat-treated milk are the follo-wing.
Figure 26ENVIRONMENTAL EFFECTS OF THE PROCESSING OF HEAT-TREATED MILK
The main production processes used in the dairy industry
43 of 164
Raw milk
Reception
Rejectedmilk
Waste
Dumping
Atmosphericemissions
Electricity
Heat
Water
Subsidiarymaterials
Inputs
Outputs
Raw and/orprocessedmaterials
Storage
Filtering and clarification
Skimming and Standardization
Heat treatment
Semi-skimmilk
Skimmilk
Homogenization
Refrigerated storage
Packaging
Heat-treatedmilk
Cleaning of equipement,vehicles and facilities
Sludgeand filters
Condensation
Damagedpackaging
Rejectedproduct
Wastewaterdumping
Cleaningproducts
Packagingfromcleaning products
Packaging
SludgeCream
Wholemilk
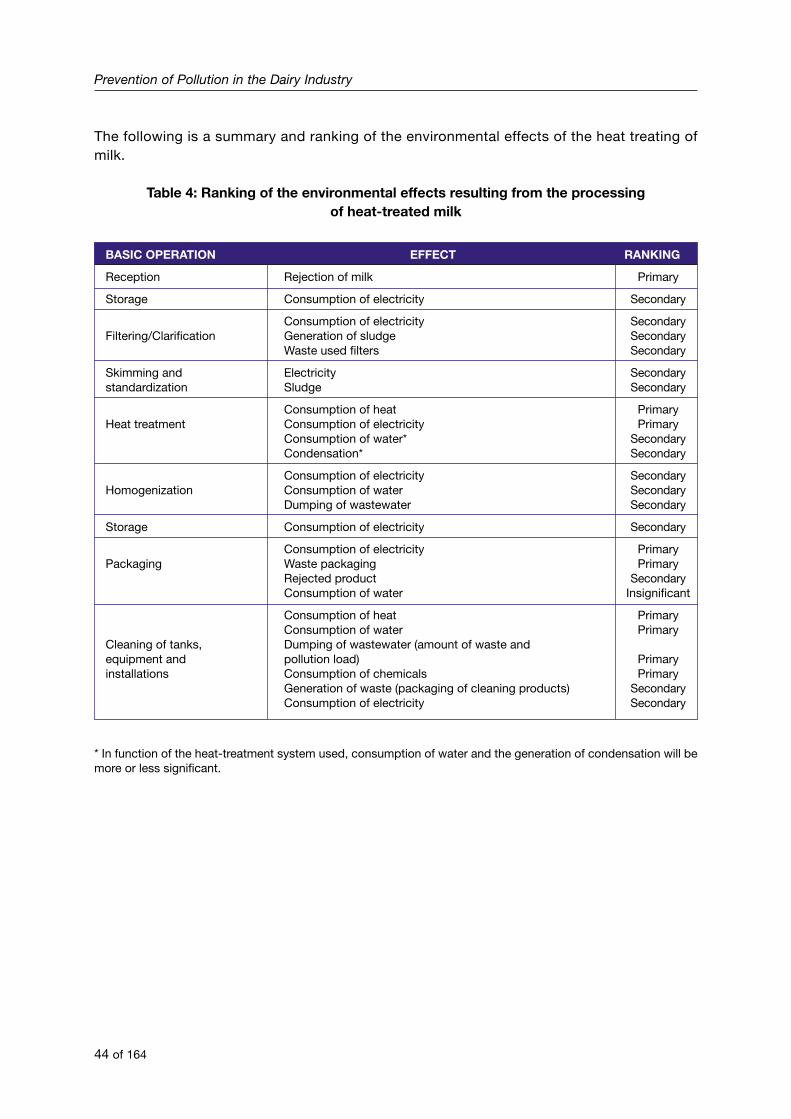
The following is a summary and ranking of the environmental effects of the heat treating ofmilk.
Table 4: Ranking of the environmental effects resulting from the processingof heat-treated milk
BASIC OPERATION EFFECT RANKING
Reception Rejection of milk Primary
Storage Consumption of electricity Secondary
Consumption of electricity SecondaryFiltering/Clarification Generation of sludge Secondary
Waste used filters Secondary
Skimming and Electricity Secondarystandardization Sludge Secondary
Consumption of heat PrimaryHeat treatment Consumption of electricity Primary
Consumption of water* SecondaryCondensation* Secondary
Consumption of electricity SecondaryHomogenization Consumption of water Secondary
Dumping of wastewater Secondary
Storage Consumption of electricity Secondary
Consumption of electricity PrimaryPackaging Waste packaging Primary
Rejected product SecondaryConsumption of water Insignificant
Consumption of heat PrimaryConsumption of water Primary
Cleaning of tanks, Dumping of wastewater (amount of waste and equipment and pollution load) Primaryinstallations Consumption of chemicals Primary
Generation of waste (packaging of cleaning products) SecondaryConsumption of electricity Secondary
* In function of the heat-treatment system used, consumption of water and the generation of condensation will bemore or less significant.
Prevention of Pollution in the Dairy Industry
44 of 164

3.2. Dairy products obtained from milk fat: butter and cream
The main dairy products obtained from milk fat are butter and cream.Cream is an emulsion of milk fat in water, while butter is a product obtained from cream afterits curing and elimination of a large part of the water, which makes it in reality an emulsion of wa-ter in oil.
3.2.1. The processing of butter and cream
The raw material used in the industrial production of butter and cream for consumption is cre-am remaining from the operations of skimming and standardization during the processing offresh milk.
Cream
Cream for consumption is obtained after deodorization and heat treatment of the cream base.It can be sold as fresh cream (pasteurized) or long life (UHT treatment) after being submit-ted to a process of microbiological stabilization through pasteurization or sterilization andfinal packaging.
Butter
Butter is a product with a characteristic smell and taste obtained through the curing of cream, inwhich the cream undergoes a series of biochemical transformations. During churning, it looses alarge part of its aqueous state and is transformed into an emulsion of water in oil.
There are several systems for making butter. The two most common systems are based on theagglomeration of fat globules and on refrigeration of a concentration of oil (used to obtainbutter with a butter fat content of less than 50 per cent). The following description is for conti-nuous preparation of butter based on the agglomeration of fat globules. It is the most widelyused system.
The following figure presents the flow chart of the manufacture of cream and butter, which coin-cides in their first stages.
The main production processes used in the dairy industry
45 of 164
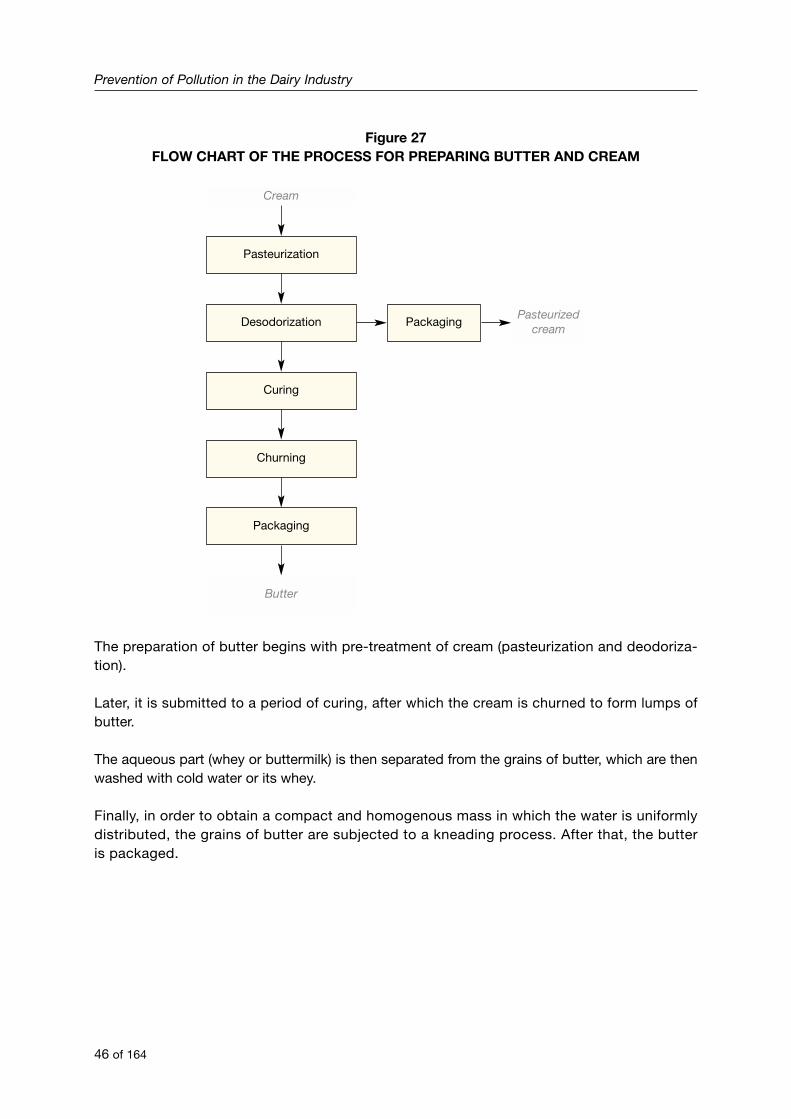
Figure 27FLOW CHART OF THE PROCESS FOR PREPARING BUTTER AND CREAM
The preparation of butter begins with pre-treatment of cream (pasteurization and deodoriza-tion).
Later, it is submitted to a period of curing, after which the cream is churned to form lumps ofbutter.
The aqueous part (whey or buttermilk) is then separated from the grains of butter, which are thenwashed with cold water or its whey.
Finally, in order to obtain a compact and homogenous mass in which the water is uniformlydistributed, the grains of butter are subjected to a kneading process. After that, the butteris packaged.
Prevention of Pollution in the Dairy Industry
46 of 164
Cream
Pasteurization
PackagingDesodorization
Curing
Churning
Packaging
Butter
Pasteurized cream
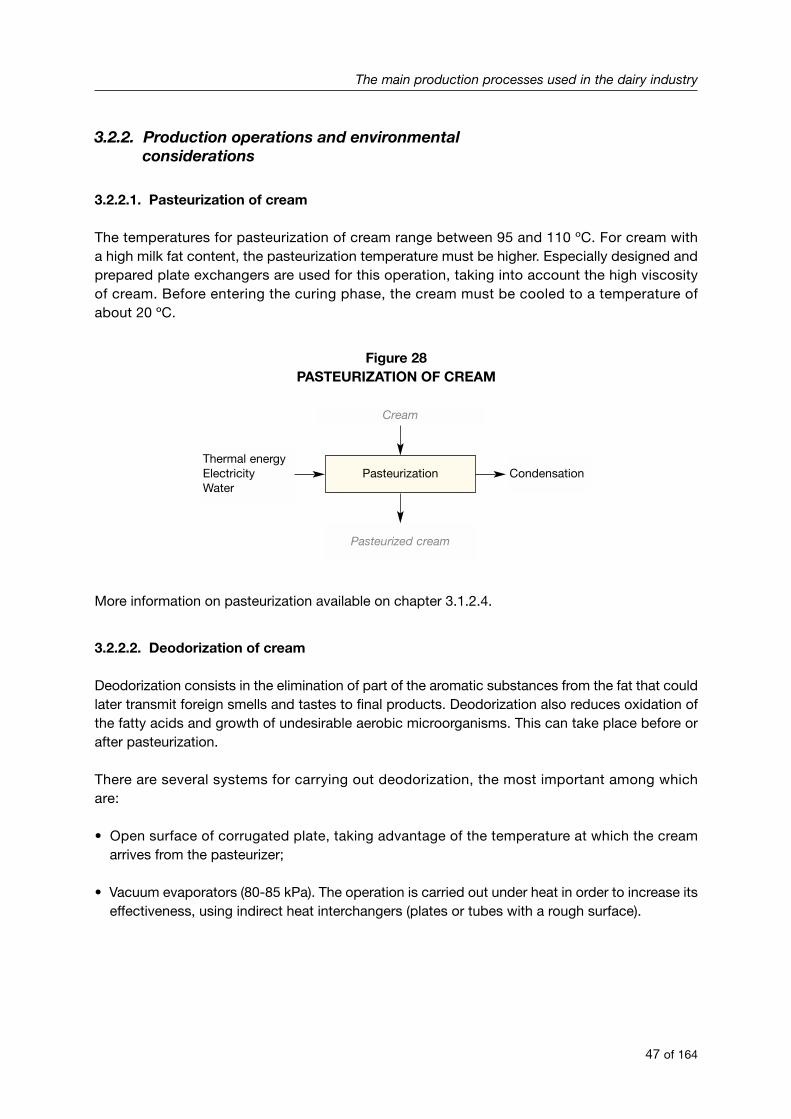
3.2.2. Production operations and environmentalconsiderations
3.2.2.1. Pasteurization of cream
The temperatures for pasteurization of cream range between 95 and 110 ºC. For cream witha high milk fat content, the pasteurization temperature must be higher. Especially designed andprepared plate exchangers are used for this operation, taking into account the high viscosityof cream. Before entering the curing phase, the cream must be cooled to a temperature ofabout 20 ºC.
Figure 28PASTEURIZATION OF CREAM
More information on pasteurization available on chapter 3.1.2.4.
3.2.2.2. Deodorization of cream
Deodorization consists in the elimination of part of the aromatic substances from the fat that couldlater transmit foreign smells and tastes to final products. Deodorization also reduces oxidation ofthe fatty acids and growth of undesirable aerobic microorganisms. This can take place before orafter pasteurization.
There are several systems for carrying out deodorization, the most important among whichare:
• Open surface of corrugated plate, taking advantage of the temperature at which the creamarrives from the pasteurizer;
• Vacuum evaporators (80-85 kPa). The operation is carried out under heat in order to increase itseffectiveness, using indirect heat interchangers (plates or tubes with a rough surface).
The main production processes used in the dairy industry
47 of 164
Cream
PasteurizationThermal energyElectricityWater
Pasteurized cream
Condensation
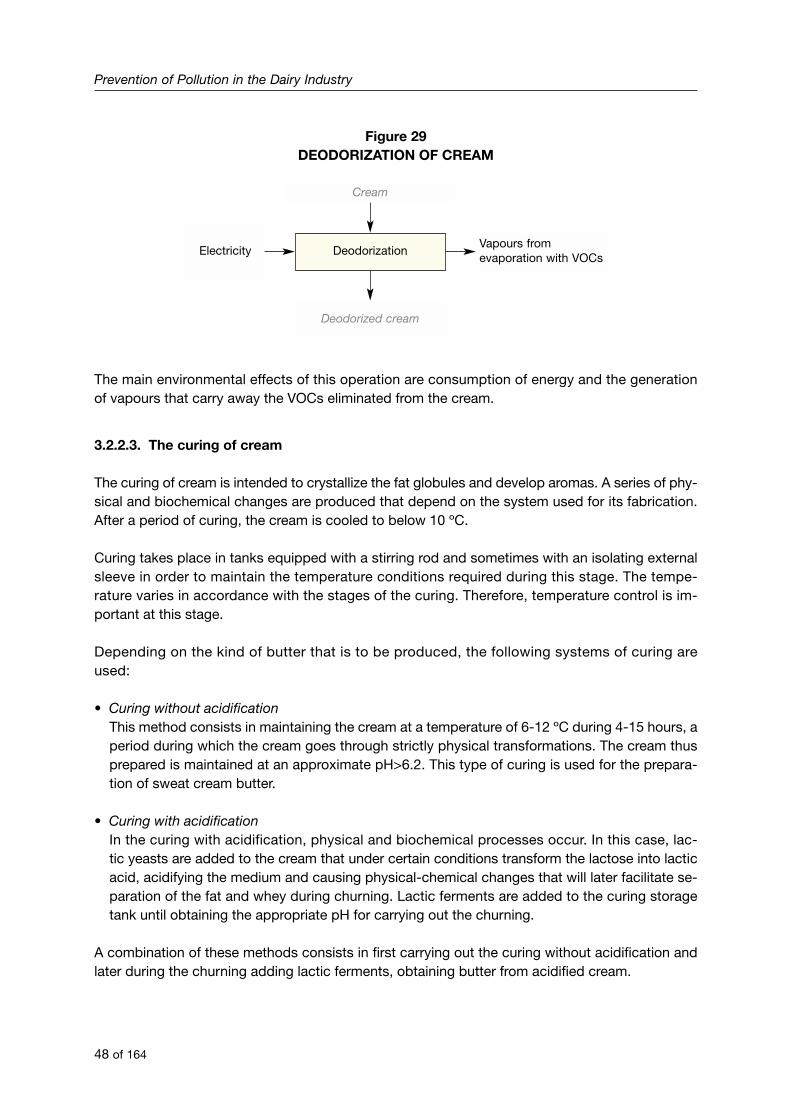
Figure 29DEODORIZATION OF CREAM
The main environmental effects of this operation are consumption of energy and the generationof vapours that carry away the VOCs eliminated from the cream.
3.2.2.3. The curing of cream
The curing of cream is intended to crystallize the fat globules and develop aromas. A series of phy-sical and biochemical changes are produced that depend on the system used for its fabrication.After a period of curing, the cream is cooled to below 10 ºC.
Curing takes place in tanks equipped with a stirring rod and sometimes with an isolating externalsleeve in order to maintain the temperature conditions required during this stage. The tempe-rature varies in accordance with the stages of the curing. Therefore, temperature control is im-portant at this stage.
Depending on the kind of butter that is to be produced, the following systems of curing areused:
• Curing without acidificationThis method consists in maintaining the cream at a temperature of 6-12 ºC during 4-15 hours, aperiod during which the cream goes through strictly physical transformations. The cream thusprepared is maintained at an approximate pH>6.2. This type of curing is used for the prepara-tion of sweat cream butter.
• Curing with acidificationIn the curing with acidification, physical and biochemical processes occur. In this case, lac-tic yeasts are added to the cream that under certain conditions transform the lactose into lacticacid, acidifying the medium and causing physical-chemical changes that will later facilitate se-paration of the fat and whey during churning. Lactic ferments are added to the curing storagetank until obtaining the appropriate pH for carrying out the churning.
A combination of these methods consists in first carrying out the curing without acidification andlater during the churning adding lactic ferments, obtaining butter from acidified cream.
Prevention of Pollution in the Dairy Industry
48 of 164
Cream
DeodorizationElectricity
Deodorized cream
Vapours fromevaporation with VOCs
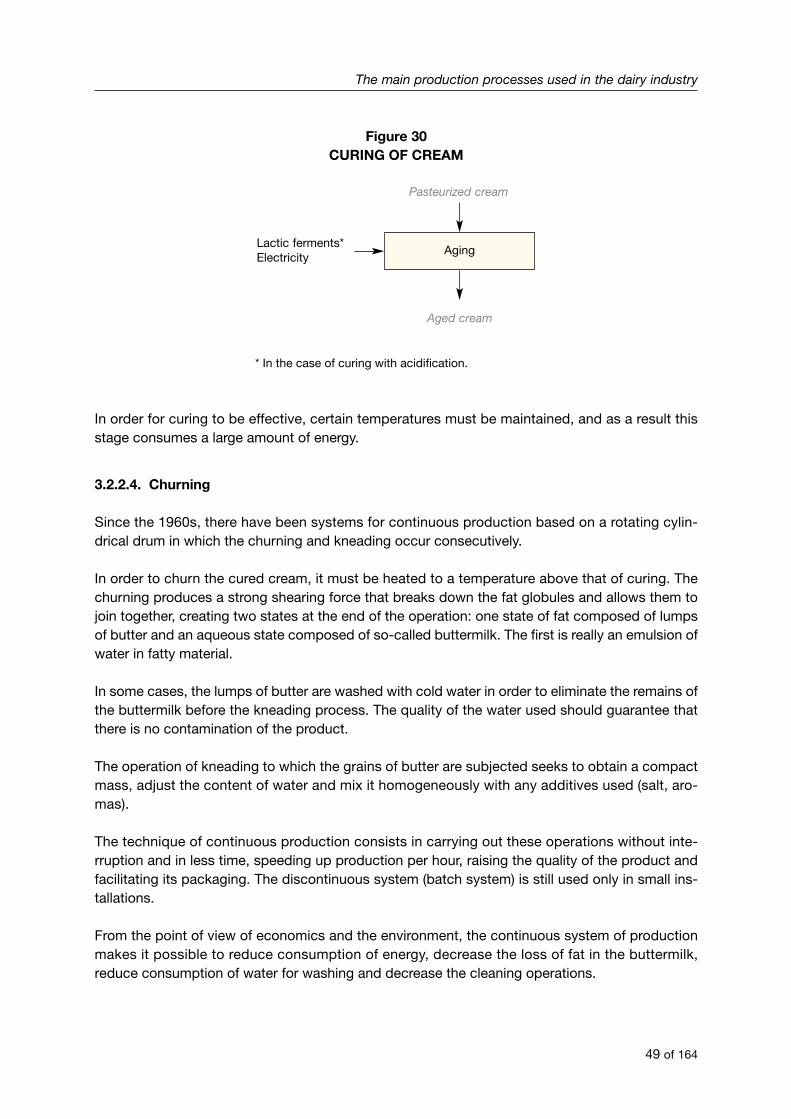
Figure 30CURING OF CREAM
* In the case of curing with acidification.
In order for curing to be effective, certain temperatures must be maintained, and as a result thisstage consumes a large amount of energy.
3.2.2.4. Churning
Since the 1960s, there have been systems for continuous production based on a rotating cylin-drical drum in which the churning and kneading occur consecutively.
In order to churn the cured cream, it must be heated to a temperature above that of curing. Thechurning produces a strong shearing force that breaks down the fat globules and allows them tojoin together, creating two states at the end of the operation: one state of fat composed of lumpsof butter and an aqueous state composed of so-called buttermilk. The first is really an emulsion ofwater in fatty material.
In some cases, the lumps of butter are washed with cold water in order to eliminate the remains ofthe buttermilk before the kneading process. The quality of the water used should guarantee thatthere is no contamination of the product.
The operation of kneading to which the grains of butter are subjected seeks to obtain a compactmass, adjust the content of water and mix it homogeneously with any additives used (salt, aro-mas).
The technique of continuous production consists in carrying out these operations without inte-rruption and in less time, speeding up production per hour, raising the quality of the product andfacilitating its packaging. The discontinuous system (batch system) is still used only in small ins-tallations.
From the point of view of economics and the environment, the continuous system of productionmakes it possible to reduce consumption of energy, decrease the loss of fat in the buttermilk,reduce consumption of water for washing and decrease the cleaning operations.
The main production processes used in the dairy industry
49 of 164
Pasteurized cream
AgingLactic ferments*Electricity
Aged cream
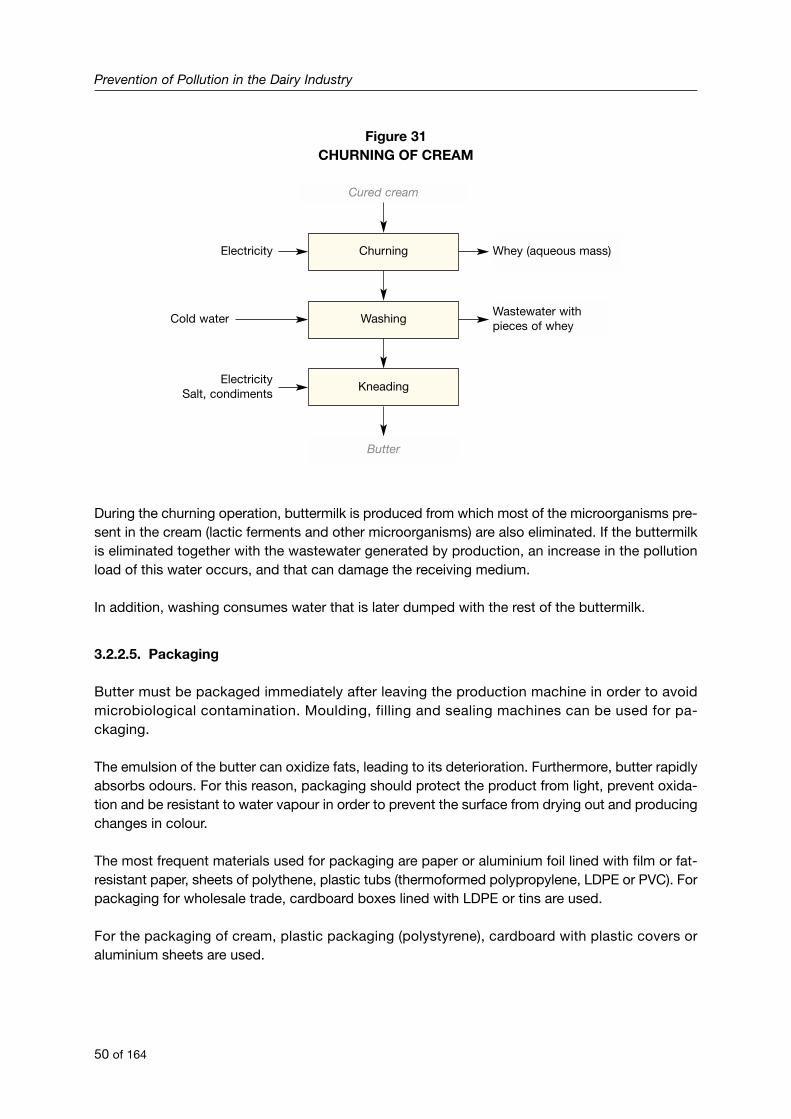
Figure 31CHURNING OF CREAM
During the churning operation, buttermilk is produced from which most of the microorganisms pre-sent in the cream (lactic ferments and other microorganisms) are also eliminated. If the buttermilkis eliminated together with the wastewater generated by production, an increase in the pollutionload of this water occurs, and that can damage the receiving medium.
In addition, washing consumes water that is later dumped with the rest of the buttermilk.
3.2.2.5. Packaging
Butter must be packaged immediately after leaving the production machine in order to avoidmicrobiological contamination. Moulding, filling and sealing machines can be used for pa-ckaging.
The emulsion of the butter can oxidize fats, leading to its deterioration. Furthermore, butter rapidlyabsorbs odours. For this reason, packaging should protect the product from light, prevent oxida-tion and be resistant to water vapour in order to prevent the surface from drying out and producingchanges in colour.
The most frequent materials used for packaging are paper or aluminium foil lined with film or fat-resistant paper, sheets of polythene, plastic tubs (thermoformed polypropylene, LDPE or PVC). Forpackaging for wholesale trade, cardboard boxes lined with LDPE or tins are used.
For the packaging of cream, plastic packaging (polystyrene), cardboard with plastic covers oraluminium sheets are used.
Prevention of Pollution in the Dairy Industry
50 of 164
Cured cream
ChurningElectricity
Cold water
ElectricitySalt, condiments
Washing
Kneading
Butter
Whey (aqueous mass)
Wastewater withpieces of whey
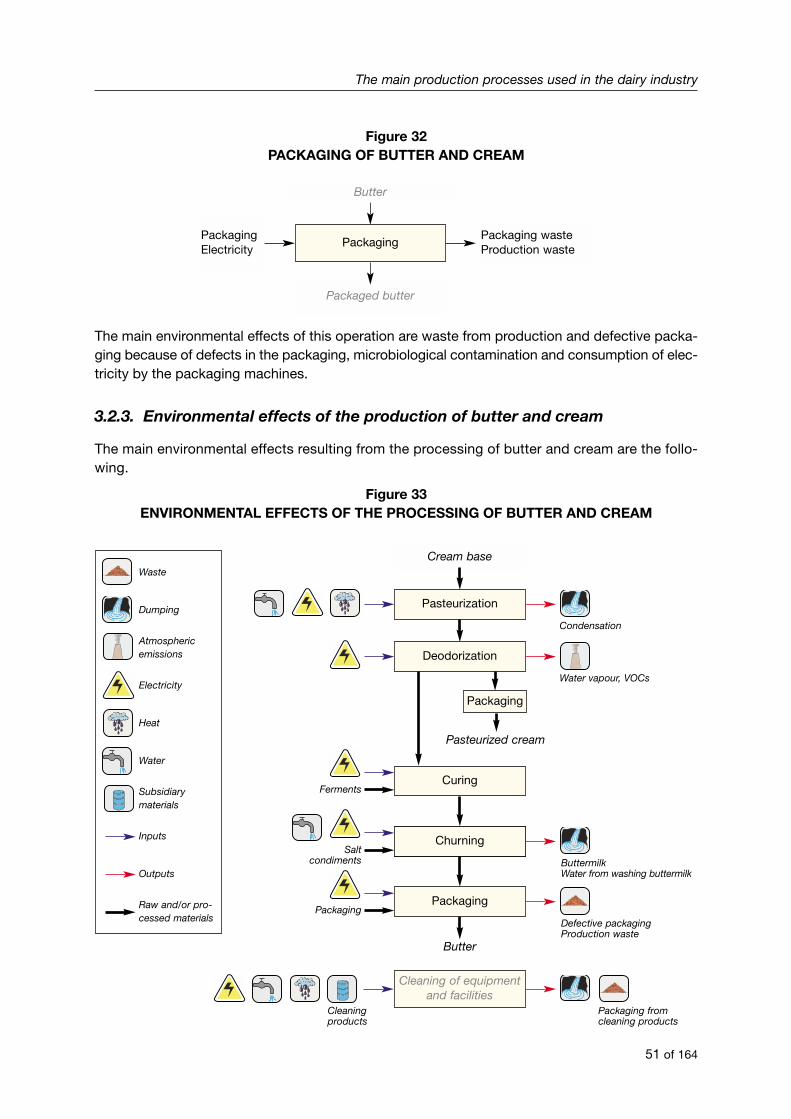
Figure 32PACKAGING OF BUTTER AND CREAM
The main environmental effects of this operation are waste from production and defective packa-ging because of defects in the packaging, microbiological contamination and consumption of elec-tricity by the packaging machines.
3.2.3. Environmental effects of the production of butter and cream
The main environmental effects resulting from the processing of butter and cream are the follo-wing.
Figure 33ENVIRONMENTAL EFFECTS OF THE PROCESSING OF BUTTER AND CREAM
The main production processes used in the dairy industry
51 of 164
Butter
PackagingPackagingElectricity
Packaged butter
Packaging wasteProduction waste
Cream base
Pasteurization
Water vapour, VOCs
Condensation
Waste
Dumping
Atmosphericemissions
Electricity
Heat
Water
Subsidiarymaterials
Inputs
Outputs
Raw and/or pro-cessed materials
Deodorization
Curing
Packaging
Butter
Cleaning of equipmentand facilities
Packaging
Pasteurized cream
Churning
ButtermilkWater from washing buttermilk
Defective packagingProduction waste
Packaging fromcleaning products
Cleaningproducts
Ferments
Saltcondiments
Packaging
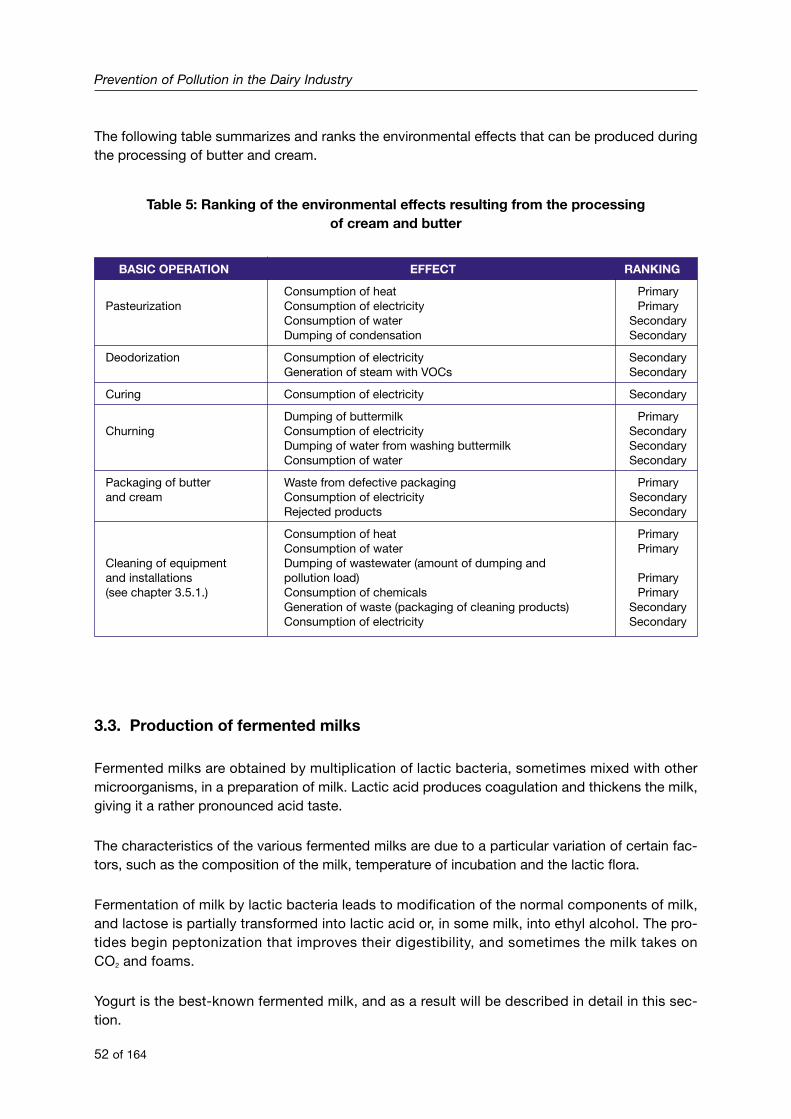
The following table summarizes and ranks the environmental effects that can be produced duringthe processing of butter and cream.
Table 5: Ranking of the environmental effects resulting from the processingof cream and butter
BASIC OPERATION EFFECT RANKING
Consumption of heat PrimaryPasteurization Consumption of electricity Primary
Consumption of water SecondaryDumping of condensation Secondary
Deodorization Consumption of electricity SecondaryGeneration of steam with VOCs Secondary
Curing Consumption of electricity Secondary
Dumping of buttermilk PrimaryChurning Consumption of electricity Secondary
Dumping of water from washing buttermilk SecondaryConsumption of water Secondary
Packaging of butter Waste from defective packaging Primaryand cream Consumption of electricity Secondary
Rejected products Secondary
Consumption of heat PrimaryConsumption of water Primary
Cleaning of equipment Dumping of wastewater (amount of dumping and and installations pollution load) Primary(see chapter 3.5.1.) Consumption of chemicals Primary
Generation of waste (packaging of cleaning products) SecondaryConsumption of electricity Secondary
3.3. Production of fermented milks
Fermented milks are obtained by multiplication of lactic bacteria, sometimes mixed with othermicroorganisms, in a preparation of milk. Lactic acid produces coagulation and thickens the milk,giving it a rather pronounced acid taste.
The characteristics of the various fermented milks are due to a particular variation of certain fac-tors, such as the composition of the milk, temperature of incubation and the lactic flora.
Fermentation of milk by lactic bacteria leads to modification of the normal components of milk,and lactose is partially transformed into lactic acid or, in some milk, into ethyl alcohol. The pro-tides begin peptonization that improves their digestibility, and sometimes the milk takes onCO2 and foams.
Yogurt is the best-known fermented milk, and as a result will be described in detail in this sec-tion.
Prevention of Pollution in the Dairy Industry
52 of 164
There are a large variety of types of yogurt in function of their consistency (coagulates, liquids,mousse), composition (skim, low fat, normal, enriched) or flavour (natural, with sugar, flavours, orpieces of fruit, etc).
3.3.1. Production of yogurt
Yogurt is produced from coagulated milk obtained by lactic fermentation, produced by the actionof Lactobacillus bulgaricus and Streptococcus thermophilus in pasteurized or concentrated milk,totally or partially skimmed with or without additions (pasteurized cream, powered milk, sugar…).Other species of lactic bacteria and even other genera, such as Bifidobacterium, are also usedfor the preparation of fermented milk. The acceptance of these products as yogurts depends onthe legislation of each country.
Yogurt can be prepared from goat’s milk, sheep’s milk and donkey’s milk, although the most widelyused is that made from cow’s milk.
For the preparation of yogurt, standardized milk is used the fat content of which has been stabili-zed and pasteurized in order to avoid undesirable microbial contaminations.
First, the milk is fermented through inoculation with the bacterial culture and then incubated atan appropriate temperature. In function of the type of yogurt being prepared, incubation canbe carried out in the final packaging in which it will be sold or in tanks for later packaging.Fermentation is halted through refrigeration.
The consistency of the yogurt depends on the proportion of lean dry extract (casein) of the milk.At times during preparation, thick yogurts must be adjusted by adding skim-powered milk or byconcentration. The addition of sugar and other supplements (fruit syrups, jams, fruit pulp, etc.) canbe carried out directly during the processing of the product before packaging using dosage equip-ment or during fermentation or storage in tanks.
The following flow chart describes the preparation of yogurt.
The main production processes used in the dairy industry
53 of 164
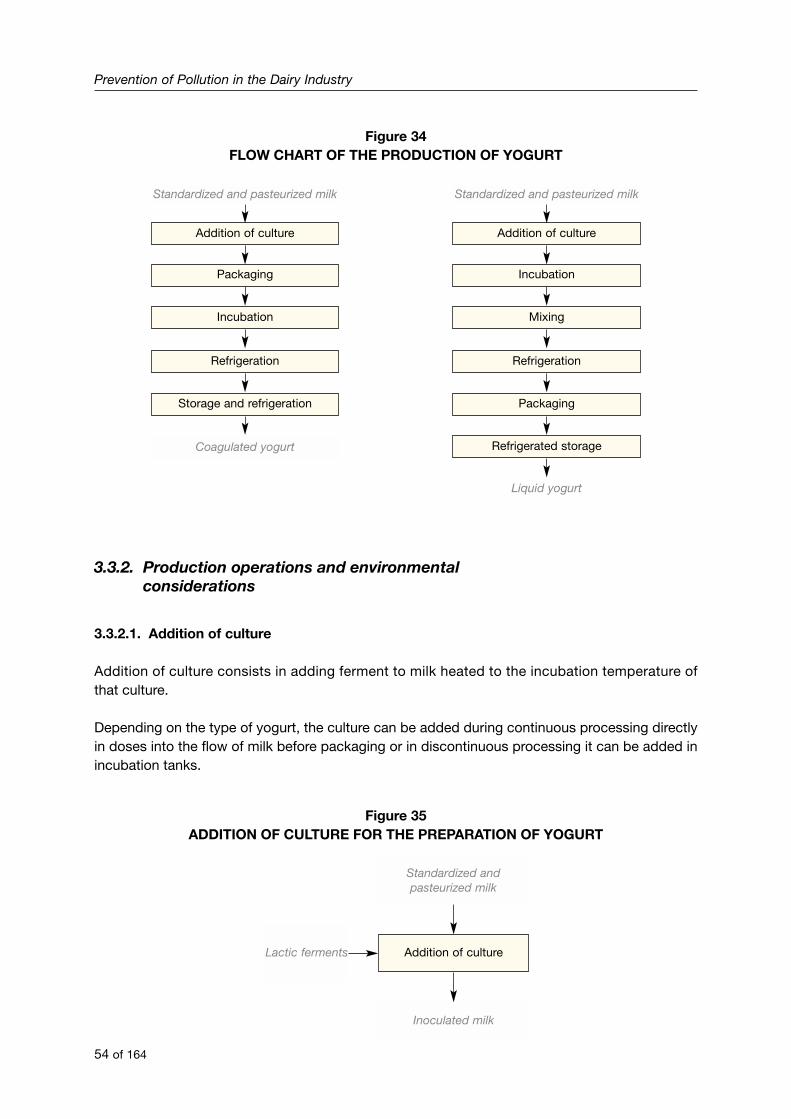
Figure 34FLOW CHART OF THE PRODUCTION OF YOGURT
3.3.2. Production operations and environmentalconsiderations
3.3.2.1. Addition of culture
Addition of culture consists in adding ferment to milk heated to the incubation temperature ofthat culture.
Depending on the type of yogurt, the culture can be added during continuous processing directlyin doses into the flow of milk before packaging or in discontinuous processing it can be added inincubation tanks.
Figure 35ADDITION OF CULTURE FOR THE PREPARATION OF YOGURT
Prevention of Pollution in the Dairy Industry
54 of 164
Standardized and pasteurized milk
Addition of culture
Packaging
Incubation
Refrigeration
Storage and refrigeration
Coagulated yogurt
Standardized and pasteurized milk
Addition of culture
Incubation
Mixing
Refrigeration
Packaging
Refrigerated storage
Liquid yogurt
Standardized andpasteurized milk
Addition of cultureLactic ferments
Inoculated milk
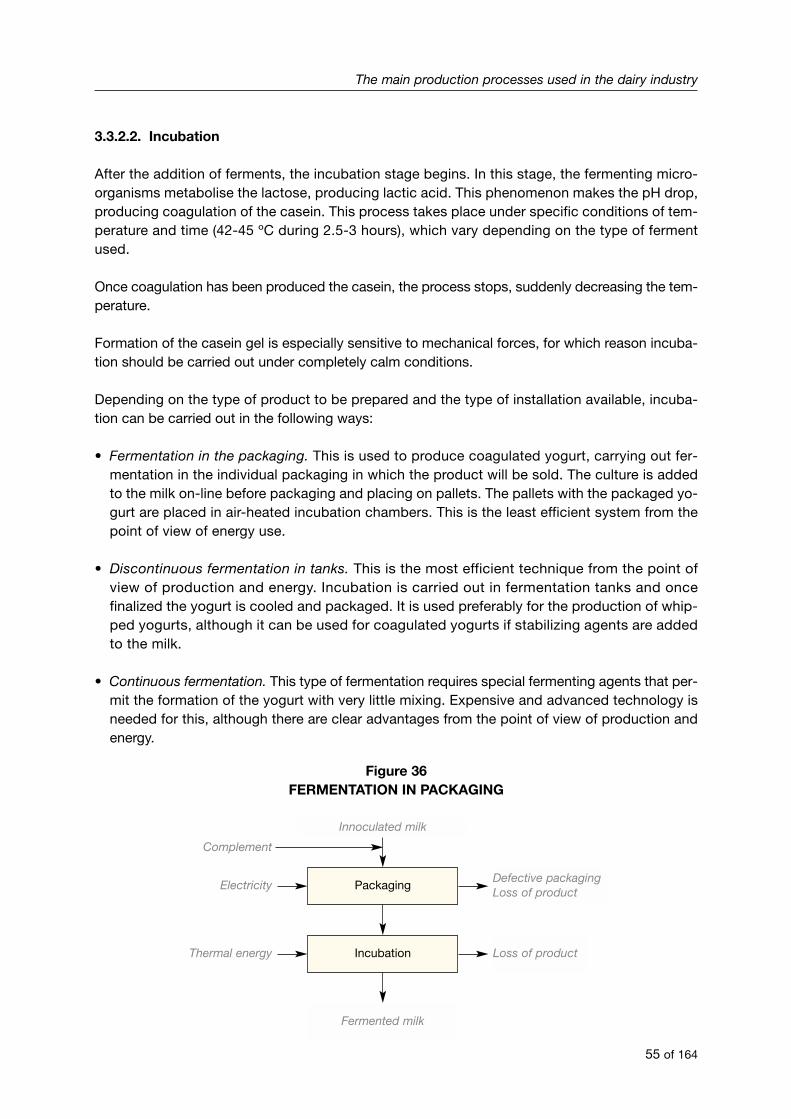
3.3.2.2. Incubation
After the addition of ferments, the incubation stage begins. In this stage, the fermenting micro-organisms metabolise the lactose, producing lactic acid. This phenomenon makes the pH drop,producing coagulation of the casein. This process takes place under specific conditions of tem-perature and time (42-45 ºC during 2.5-3 hours), which vary depending on the type of fermentused.
Once coagulation has been produced the casein, the process stops, suddenly decreasing the tem-perature.
Formation of the casein gel is especially sensitive to mechanical forces, for which reason incuba-tion should be carried out under completely calm conditions.
Depending on the type of product to be prepared and the type of installation available, incuba-tion can be carried out in the following ways:
• Fermentation in the packaging. This is used to produce coagulated yogurt, carrying out fer-mentation in the individual packaging in which the product will be sold. The culture is addedto the milk on-line before packaging and placing on pallets. The pallets with the packaged yo-gurt are placed in air-heated incubation chambers. This is the least efficient system from thepoint of view of energy use.
• Discontinuous fermentation in tanks. This is the most efficient technique from the point ofview of production and energy. Incubation is carried out in fermentation tanks and oncefinalized the yogurt is cooled and packaged. It is used preferably for the production of whip-ped yogurts, although it can be used for coagulated yogurts if stabilizing agents are addedto the milk.
• Continuous fermentation. This type of fermentation requires special fermenting agents that per-mit the formation of the yogurt with very little mixing. Expensive and advanced technology isneeded for this, although there are clear advantages from the point of view of production andenergy.
Figure 36FERMENTATION IN PACKAGING
The main production processes used in the dairy industry
55 of 164
Innoculated milk
PackagingElectricity
Complement
Incubation
Fermented milk
Thermal energy
Defective packagingLoss of product
Loss of product

Figure 37DISCONTINUOUS FERMENTATION IN TANKS
Incubation requires special conditions of temperature (42-45 ºC) during periods that can varybetween 2.5 and 3 hours. As a result, there is high consumption of energy during this stage in or-der to maintain the conditions for incubation.
3.3.2.3. Refrigeration
Cooling of the yogurt paralyses the fermentation reactions, preventing the yogurt from continuingto acidify. Depending on the type of incubation system used (see previous section), there are twomain refrigeration systems:
• Dry-air cold tunnels. When fermentation is carried out in the final packaging, pallets with the pa-ckaging are introduced in cooling tunnels with cold, dry air where the temperature of the productis dropped to 15 ºC.
• Plate exchangers. When cooling is used between fermentation and packaging, the yogurt canbe cooled quickly once it is incubated, using plate exchangers.
Figure 38REFRIGERATION STAGE
* In the case of refrigeration by heat exchangers.
Prevention of Pollution in the Dairy Industry
56 of 164
Innoculated milk
IncubationHeat
Mixing
Fermented milk
ElectricityComplements
Loss of product
Fermented milk
RefrigerationElectricityWater*
Yogurt

This stage consumes a great deal of energy. The use of plate exchangers for refrigeration is mo-re profitable in terms of energy than cold tunnels.
3.3.2.4. Packaging
As mentioned earlier, packaging can be carried out before or after incubation.
Polystyrene packaging with aluminium foil tops covered with polyethylene that can be sealedwith heat are almost always used for packaging yogurt. Other types of packaging, such as glassjars, are also used.
Figure 39PACKAGING STAGE
The generation of packaging waste is usually the main environmental effect generated during thisstage. Occasionally, there can also be losses of the product that are washed away with the waste-water during cleaning operations.
The main production processes used in the dairy industry
57 of 164
Liquid yogurt
PackagingElectricity
Packagedliquid yogurt
Defective packagingLoss of product
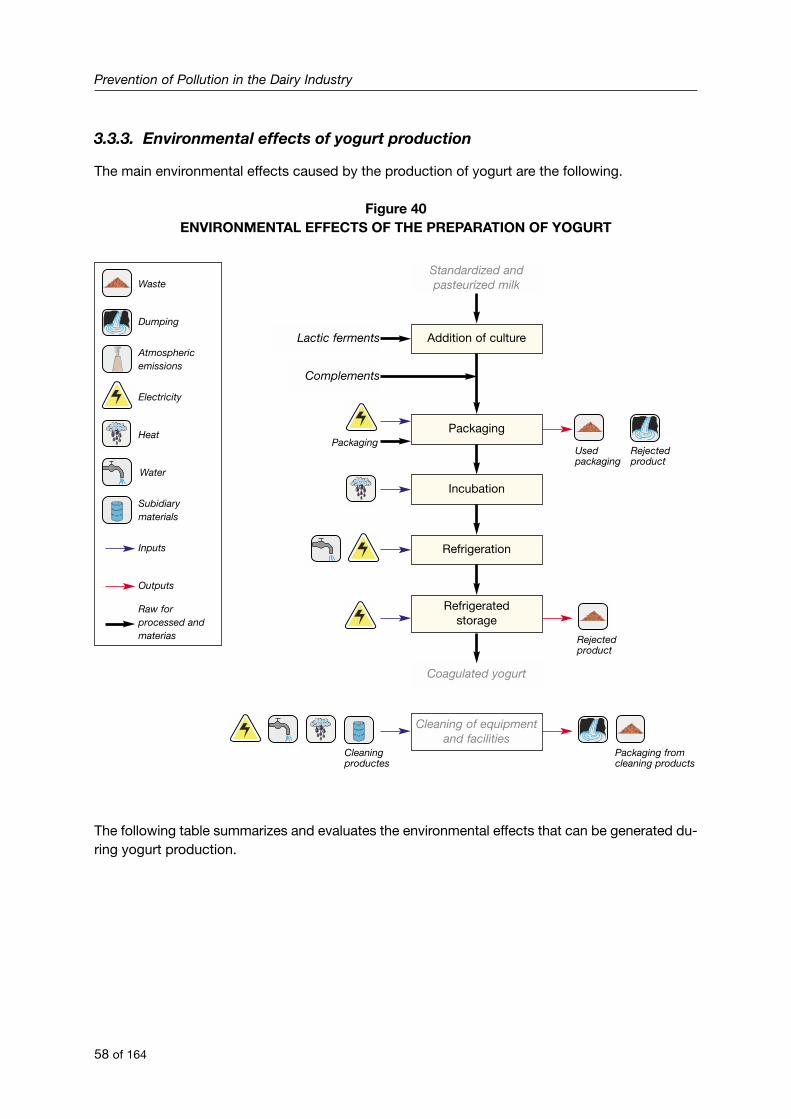
3.3.3. Environmental effects of yogurt production
The main environmental effects caused by the production of yogurt are the following.
Figure 40ENVIRONMENTAL EFFECTS OF THE PREPARATION OF YOGURT
The following table summarizes and evaluates the environmental effects that can be generated du-ring yogurt production.
Prevention of Pollution in the Dairy Industry
58 of 164
Standardized andpasteurized milk
Addition of cultureLactic ferments
Complements
Usedpackaging
Rejectedproduct
Rejectedproduct
PackagingPackaging
Incubation
Refrigeration
Cleaning of equipmentand facilities
Packaging fromcleaning products
Cleaningproductes
Refrigeratedstorage
Coagulated yogurt
Waste
Dumping
Atmosphericemissions
Electricity
Heat
Water
Subidiarymaterials
Inputs
Outputs
Raw forprocessed andmaterias
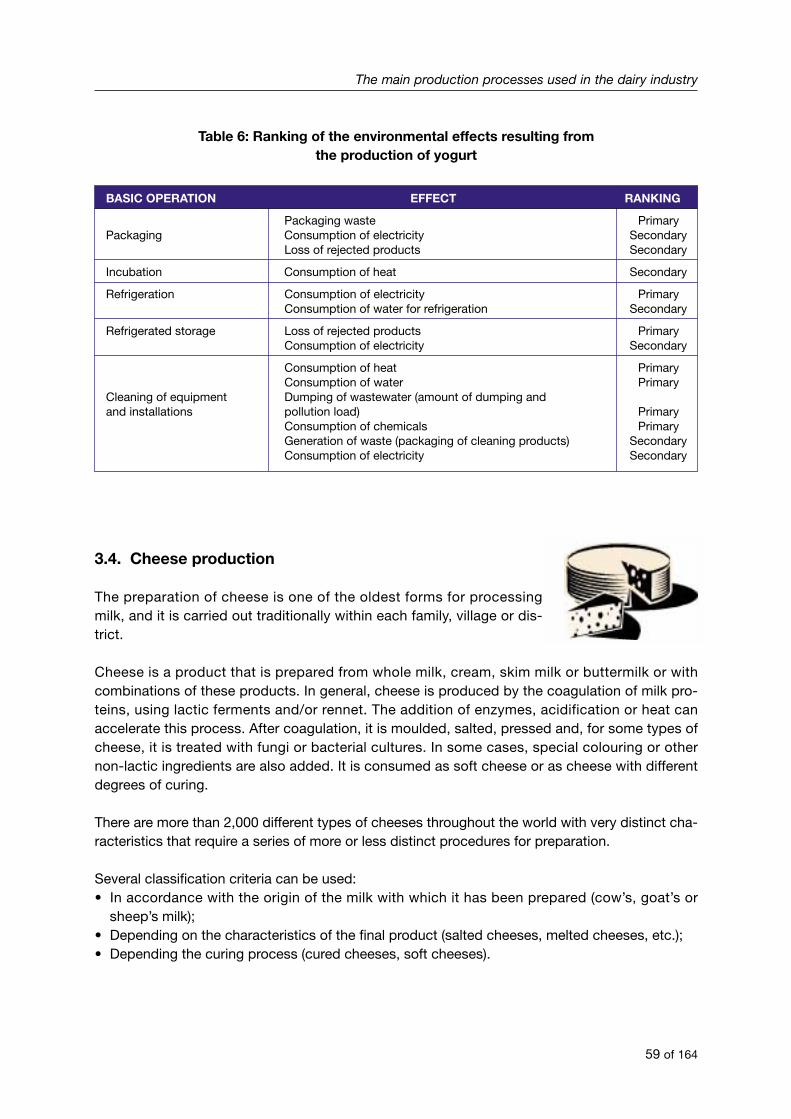
Table 6: Ranking of the environmental effects resulting from the production of yogurt
BASIC OPERATION EFFECT RANKING
Packaging waste PrimaryPackaging Consumption of electricity Secondary
Loss of rejected products Secondary
Incubation Consumption of heat Secondary
Refrigeration Consumption of electricity PrimaryConsumption of water for refrigeration Secondary
Refrigerated storage Loss of rejected products PrimaryConsumption of electricity Secondary
Consumption of heat PrimaryConsumption of water Primary
Cleaning of equipment Dumping of wastewater (amount of dumping and and installations pollution load) Primary
Consumption of chemicals PrimaryGeneration of waste (packaging of cleaning products) SecondaryConsumption of electricity Secondary
3.4. Cheese production
The preparation of cheese is one of the oldest forms for processingmilk, and it is carried out traditionally within each family, village or dis-trict.
Cheese is a product that is prepared from whole milk, cream, skim milk or buttermilk or withcombinations of these products. In general, cheese is produced by the coagulation of milk pro-teins, using lactic ferments and/or rennet. The addition of enzymes, acidification or heat canaccelerate this process. After coagulation, it is moulded, salted, pressed and, for some types ofcheese, it is treated with fungi or bacterial cultures. In some cases, special colouring or othernon-lactic ingredients are also added. It is consumed as soft cheese or as cheese with differentdegrees of curing.
There are more than 2,000 different types of cheeses throughout the world with very distinct cha-racteristics that require a series of more or less distinct procedures for preparation.
Several classification criteria can be used:• In accordance with the origin of the milk with which it has been prepared (cow’s, goat’s or
sheep’s milk);• Depending on the characteristics of the final product (salted cheeses, melted cheeses, etc.);• Depending the curing process (cured cheeses, soft cheeses).
The main production processes used in the dairy industry
59 of 164
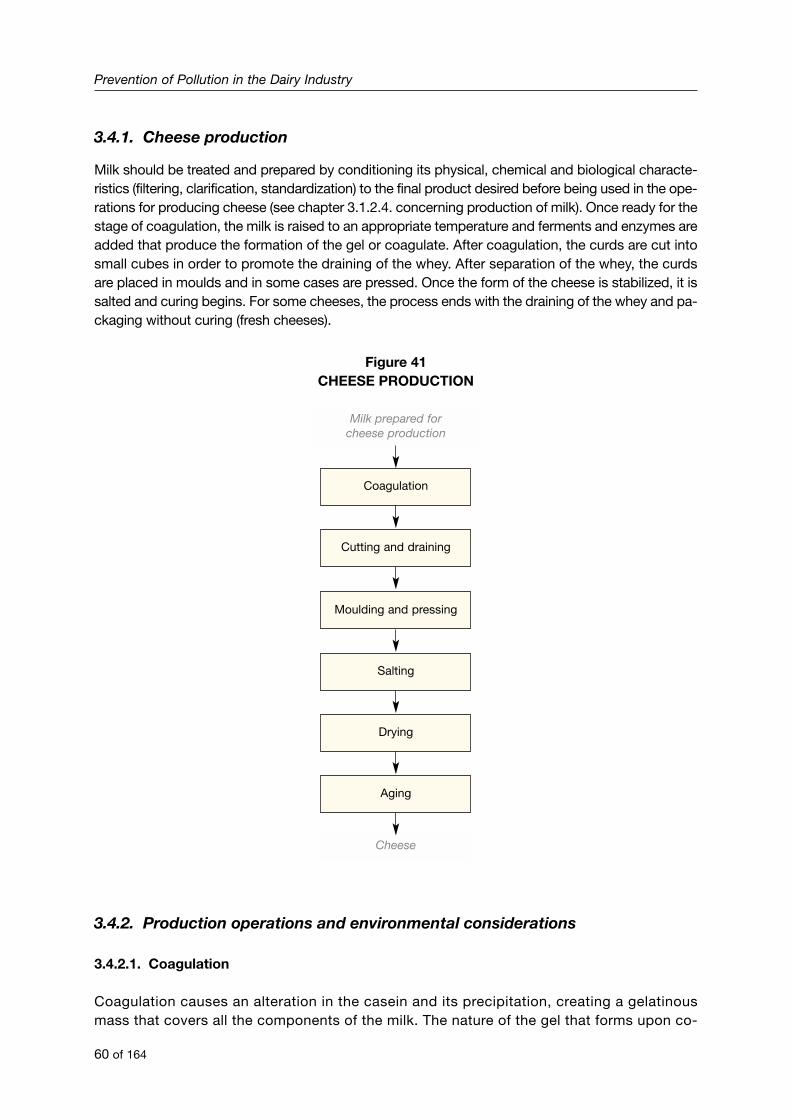
3.4.1. Cheese production
Milk should be treated and prepared by conditioning its physical, chemical and biological characte-ristics (filtering, clarification, standardization) to the final product desired before being used in the ope-rations for producing cheese (see chapter 3.1.2.4. concerning production of milk). Once ready for thestage of coagulation, the milk is raised to an appropriate temperature and ferments and enzymes areadded that produce the formation of the gel or coagulate. After coagulation, the curds are cut intosmall cubes in order to promote the draining of the whey. After separation of the whey, the curdsare placed in moulds and in some cases are pressed. Once the form of the cheese is stabilized, it issalted and curing begins. For some cheeses, the process ends with the draining of the whey and pa-ckaging without curing (fresh cheeses).
Figure 41CHEESE PRODUCTION
3.4.2. Production operations and environmental considerations
3.4.2.1. Coagulation
Coagulation causes an alteration in the casein and its precipitation, creating a gelatinousmass that covers all the components of the milk. The nature of the gel that forms upon co-
Prevention of Pollution in the Dairy Industry
60 of 164
Milk prepared forcheese production
Coagulation
Cutting and draining
Moulding and pressing
Salting
Drying
Aging
Cheese
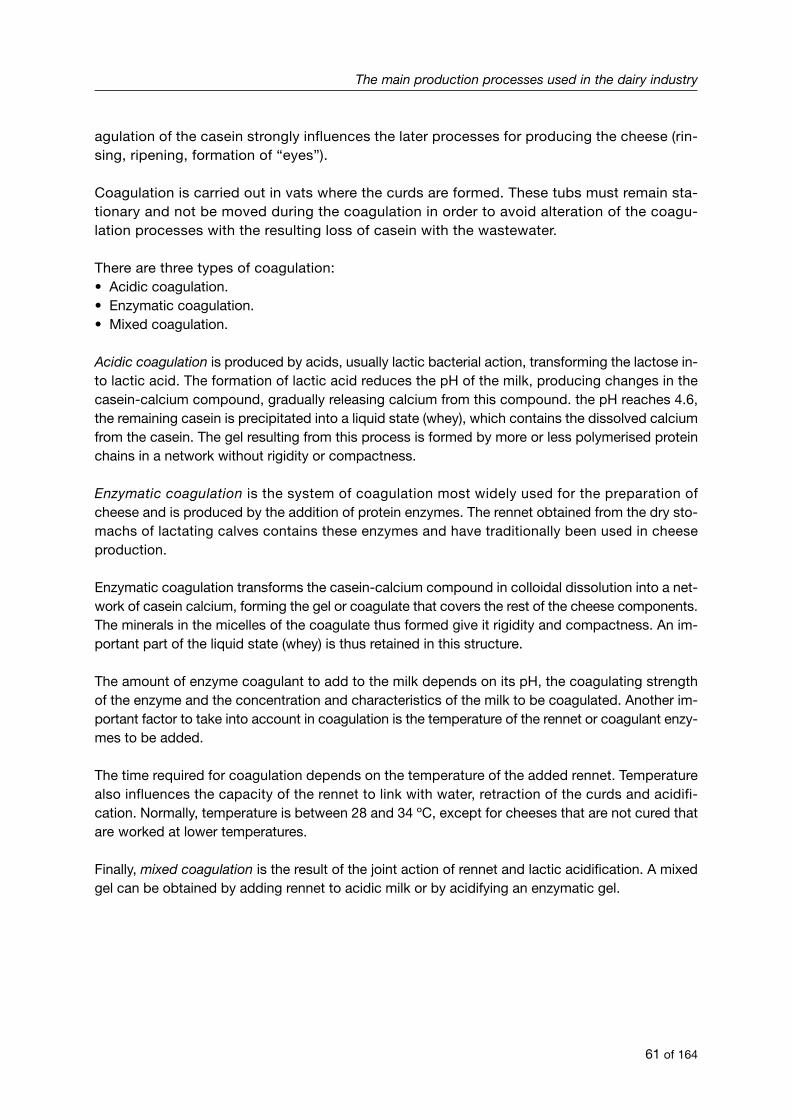
agulation of the casein strongly influences the later processes for producing the cheese (rin-sing, ripening, formation of “eyes”).
Coagulation is carried out in vats where the curds are formed. These tubs must remain sta-tionary and not be moved during the coagulation in order to avoid alteration of the coagu-lation processes with the resulting loss of casein with the wastewater.
There are three types of coagulation: • Acidic coagulation.• Enzymatic coagulation.• Mixed coagulation.
Acidic coagulation is produced by acids, usually lactic bacterial action, transforming the lactose in-to lactic acid. The formation of lactic acid reduces the pH of the milk, producing changes in thecasein-calcium compound, gradually releasing calcium from this compound. the pH reaches 4.6,the remaining casein is precipitated into a liquid state (whey), which contains the dissolved calciumfrom the casein. The gel resulting from this process is formed by more or less polymerised proteinchains in a network without rigidity or compactness.
Enzymatic coagulation is the system of coagulation most widely used for the preparation ofcheese and is produced by the addition of protein enzymes. The rennet obtained from the dry sto-machs of lactating calves contains these enzymes and have traditionally been used in cheeseproduction.
Enzymatic coagulation transforms the casein-calcium compound in colloidal dissolution into a net-work of casein calcium, forming the gel or coagulate that covers the rest of the cheese components.The minerals in the micelles of the coagulate thus formed give it rigidity and compactness. An im-portant part of the liquid state (whey) is thus retained in this structure.
The amount of enzyme coagulant to add to the milk depends on its pH, the coagulating strengthof the enzyme and the concentration and characteristics of the milk to be coagulated. Another im-portant factor to take into account in coagulation is the temperature of the rennet or coagulant enzy-mes to be added.
The time required for coagulation depends on the temperature of the added rennet. Temperaturealso influences the capacity of the rennet to link with water, retraction of the curds and acidifi-cation. Normally, temperature is between 28 and 34 ºC, except for cheeses that are not cured thatare worked at lower temperatures.
Finally, mixed coagulation is the result of the joint action of rennet and lactic acidification. A mixedgel can be obtained by adding rennet to acidic milk or by acidifying an enzymatic gel.
The main production processes used in the dairy industry
61 of 164
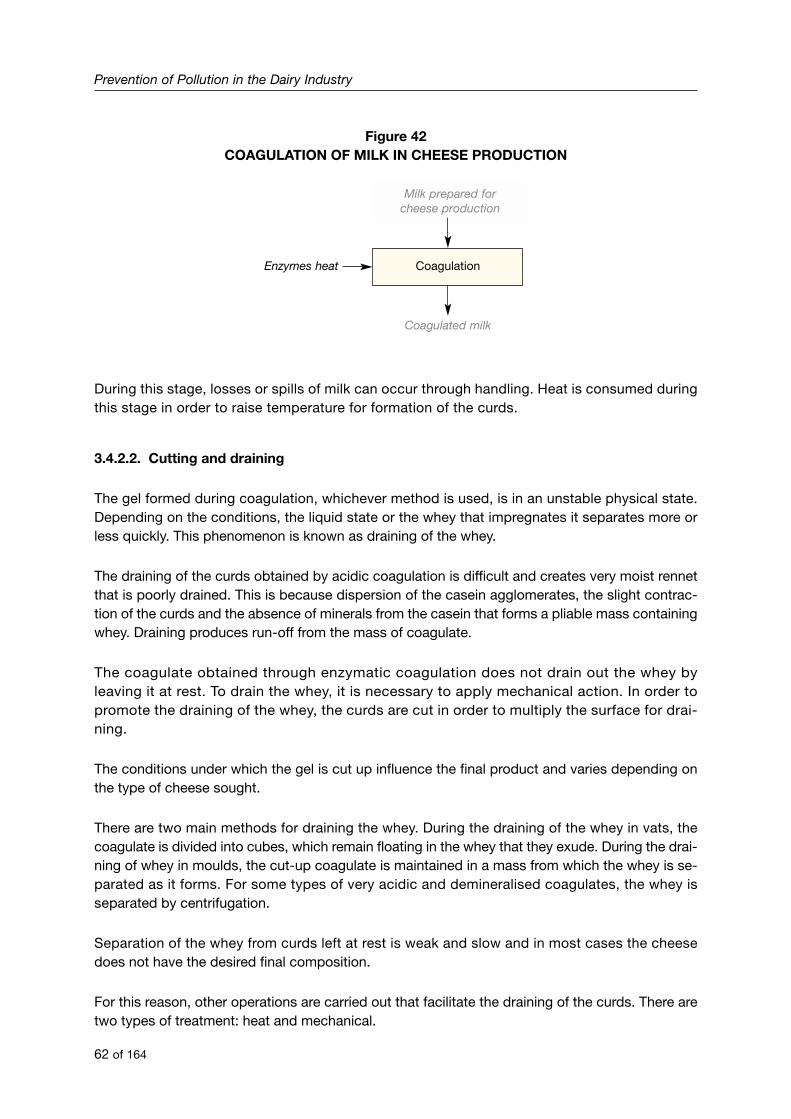
Figure 42COAGULATION OF MILK IN CHEESE PRODUCTION
During this stage, losses or spills of milk can occur through handling. Heat is consumed duringthis stage in order to raise temperature for formation of the curds.
3.4.2.2. Cutting and draining
The gel formed during coagulation, whichever method is used, is in an unstable physical state.Depending on the conditions, the liquid state or the whey that impregnates it separates more orless quickly. This phenomenon is known as draining of the whey.
The draining of the curds obtained by acidic coagulation is difficult and creates very moist rennetthat is poorly drained. This is because dispersion of the casein agglomerates, the slight contrac-tion of the curds and the absence of minerals from the casein that forms a pliable mass containingwhey. Draining produces run-off from the mass of coagulate.
The coagulate obtained through enzymatic coagulation does not drain out the whey byleaving it at rest. To drain the whey, it is necessary to apply mechanical action. In order topromote the draining of the whey, the curds are cut in order to multiply the surface for drai-ning.
The conditions under which the gel is cut up influence the final product and varies depending onthe type of cheese sought.
There are two main methods for draining the whey. During the draining of the whey in vats, thecoagulate is divided into cubes, which remain floating in the whey that they exude. During the drai-ning of whey in moulds, the cut-up coagulate is maintained in a mass from which the whey is se-parated as it forms. For some types of very acidic and demineralised coagulates, the whey isseparated by centrifugation.
Separation of the whey from curds left at rest is weak and slow and in most cases the cheesedoes not have the desired final composition.
For this reason, other operations are carried out that facilitate the draining of the curds. There aretwo types of treatment: heat and mechanical.
Prevention of Pollution in the Dairy Industry
62 of 164
Milk prepared forcheese production
CoagulationEnzymes heat
Coagulated milk
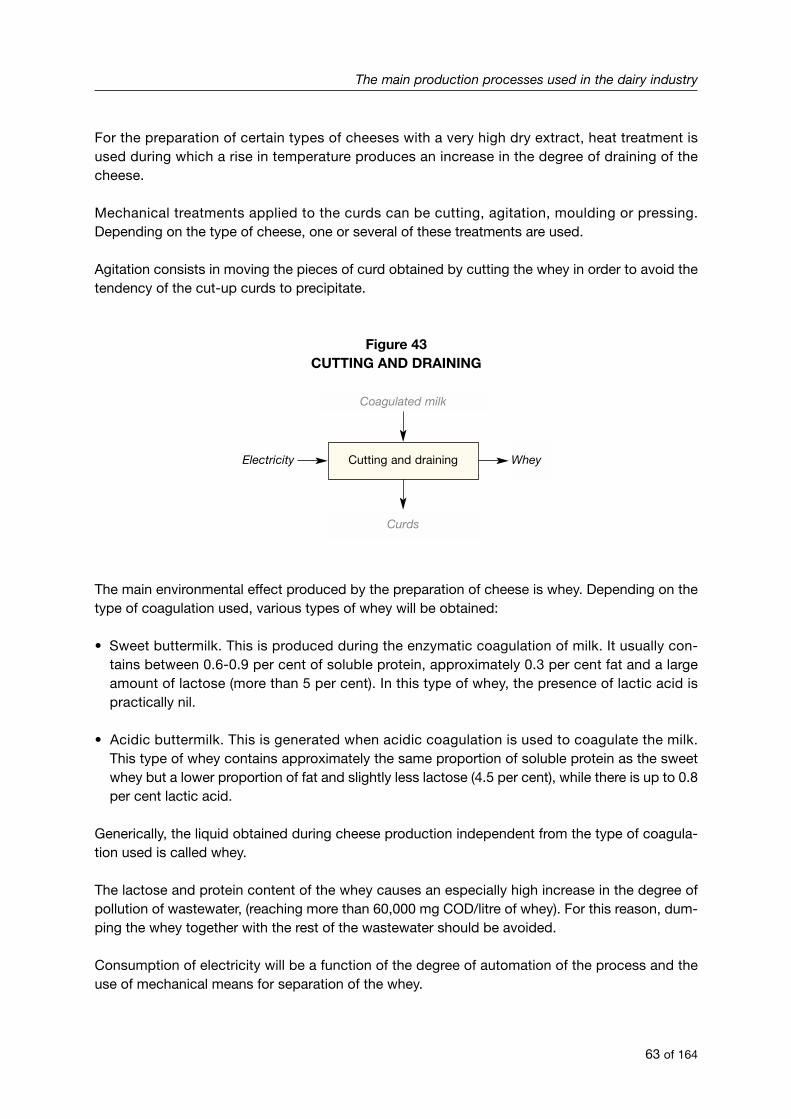
For the preparation of certain types of cheeses with a very high dry extract, heat treatment isused during which a rise in temperature produces an increase in the degree of draining of thecheese.
Mechanical treatments applied to the curds can be cutting, agitation, moulding or pressing.Depending on the type of cheese, one or several of these treatments are used.
Agitation consists in moving the pieces of curd obtained by cutting the whey in order to avoid thetendency of the cut-up curds to precipitate.
Figure 43CUTTING AND DRAINING
The main environmental effect produced by the preparation of cheese is whey. Depending on thetype of coagulation used, various types of whey will be obtained:
• Sweet buttermilk. This is produced during the enzymatic coagulation of milk. It usually con-tains between 0.6-0.9 per cent of soluble protein, approximately 0.3 per cent fat and a largeamount of lactose (more than 5 per cent). In this type of whey, the presence of lactic acid ispractically nil.
• Acidic buttermilk. This is generated when acidic coagulation is used to coagulate the milk.This type of whey contains approximately the same proportion of soluble protein as the sweetwhey but a lower proportion of fat and slightly less lactose (4.5 per cent), while there is up to 0.8per cent lactic acid.
Generically, the liquid obtained during cheese production independent from the type of coagula-tion used is called whey.
The lactose and protein content of the whey causes an especially high increase in the degree ofpollution of wastewater, (reaching more than 60,000 mg COD/litre of whey). For this reason, dum-ping the whey together with the rest of the wastewater should be avoided.
Consumption of electricity will be a function of the degree of automation of the process and theuse of mechanical means for separation of the whey.
The main production processes used in the dairy industry
63 of 164
Coagulated milk
Cutting and drainingElectricity
Curds
Whey
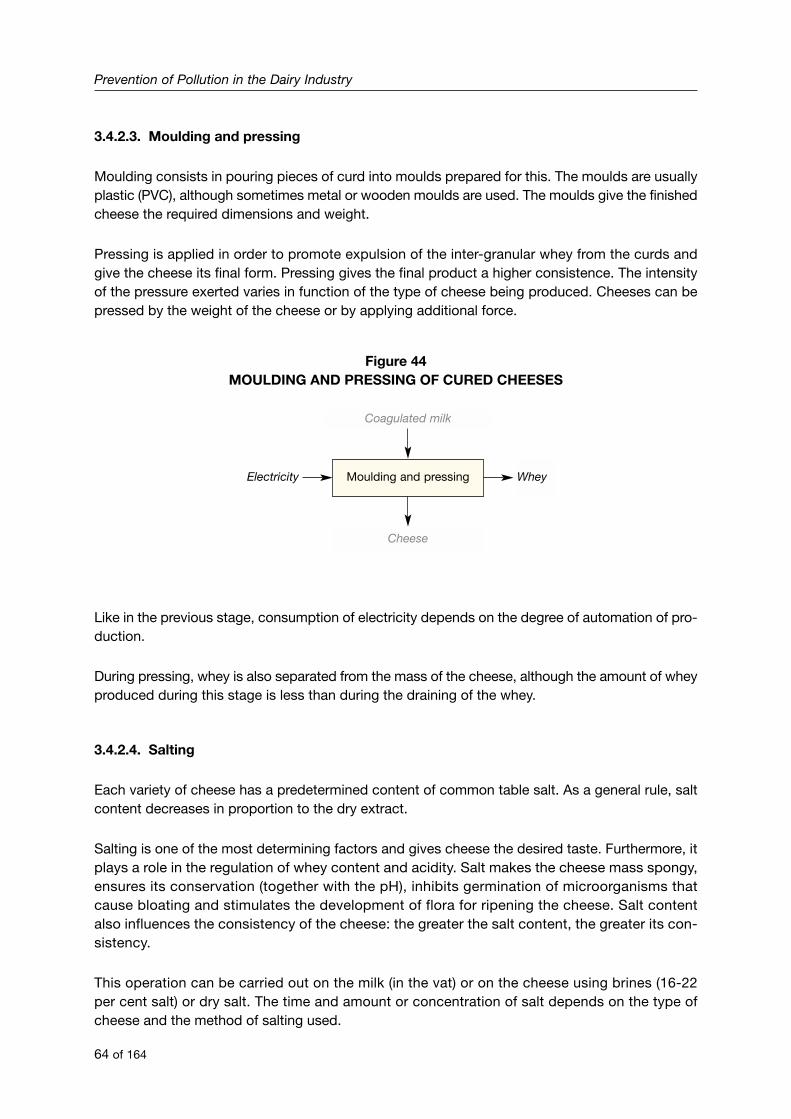
3.4.2.3. Moulding and pressing
Moulding consists in pouring pieces of curd into moulds prepared for this. The moulds are usuallyplastic (PVC), although sometimes metal or wooden moulds are used. The moulds give the finishedcheese the required dimensions and weight.
Pressing is applied in order to promote expulsion of the inter-granular whey from the curds andgive the cheese its final form. Pressing gives the final product a higher consistence. The intensityof the pressure exerted varies in function of the type of cheese being produced. Cheeses can bepressed by the weight of the cheese or by applying additional force.
Figure 44MOULDING AND PRESSING OF CURED CHEESES
Like in the previous stage, consumption of electricity depends on the degree of automation of pro-duction.
During pressing, whey is also separated from the mass of the cheese, although the amount of wheyproduced during this stage is less than during the draining of the whey.
3.4.2.4. Salting
Each variety of cheese has a predetermined content of common table salt. As a general rule, saltcontent decreases in proportion to the dry extract.
Salting is one of the most determining factors and gives cheese the desired taste. Furthermore, itplays a role in the regulation of whey content and acidity. Salt makes the cheese mass spongy,ensures its conservation (together with the pH), inhibits germination of microorganisms thatcause bloating and stimulates the development of flora for ripening the cheese. Salt contentalso influences the consistency of the cheese: the greater the salt content, the greater its con-sistency.
This operation can be carried out on the milk (in the vat) or on the cheese using brines (16-22per cent salt) or dry salt. The time and amount or concentration of salt depends on the type ofcheese and the method of salting used.
Prevention of Pollution in the Dairy Industry
64 of 164
Coagulated milk
Moulding and pressingElectricity
Cheese
Whey
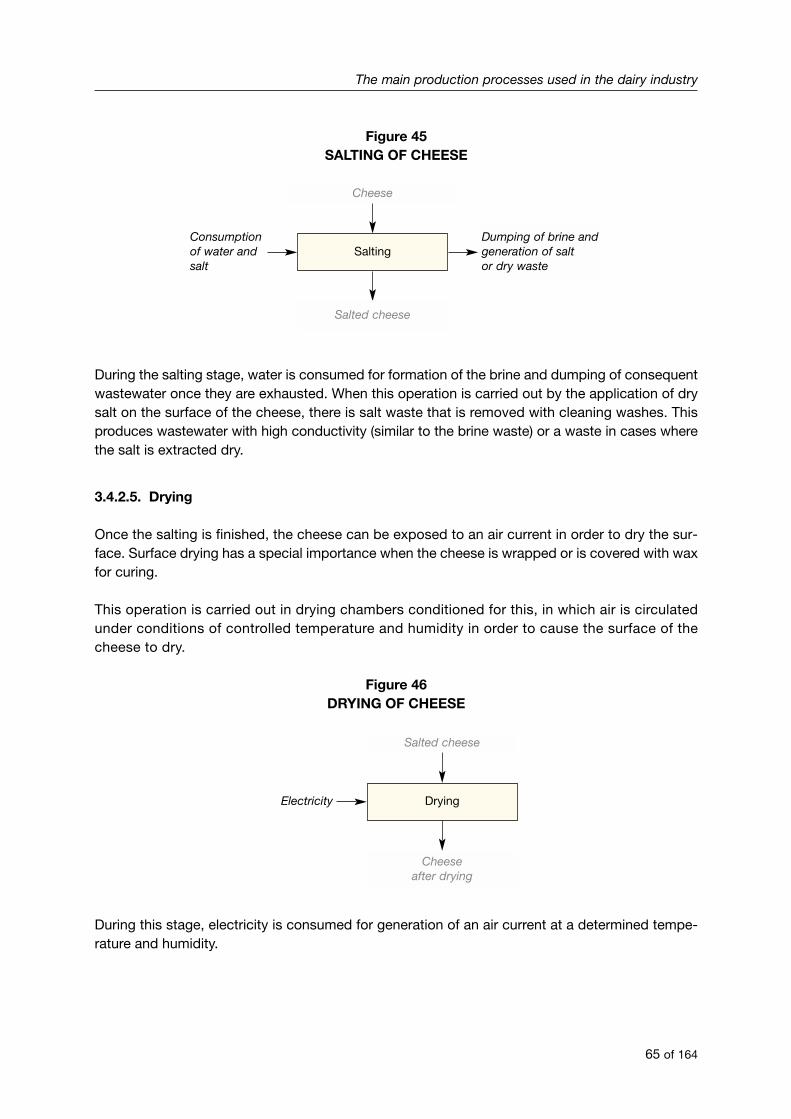
Figure 45SALTING OF CHEESE
During the salting stage, water is consumed for formation of the brine and dumping of consequentwastewater once they are exhausted. When this operation is carried out by the application of drysalt on the surface of the cheese, there is salt waste that is removed with cleaning washes. Thisproduces wastewater with high conductivity (similar to the brine waste) or a waste in cases wherethe salt is extracted dry.
3.4.2.5. Drying
Once the salting is finished, the cheese can be exposed to an air current in order to dry the sur-face. Surface drying has a special importance when the cheese is wrapped or is covered with waxfor curing.
This operation is carried out in drying chambers conditioned for this, in which air is circulatedunder conditions of controlled temperature and humidity in order to cause the surface of thecheese to dry.
Figure 46DRYING OF CHEESE
During this stage, electricity is consumed for generation of an air current at a determined tempe-rature and humidity.
The main production processes used in the dairy industry
65 of 164
Cheese
SaltingConsumptionof water andsalt
Salted cheese
Dumping of brine andgeneration of saltor dry waste
Salted cheese
DryingElectricity
Cheeseafter drying
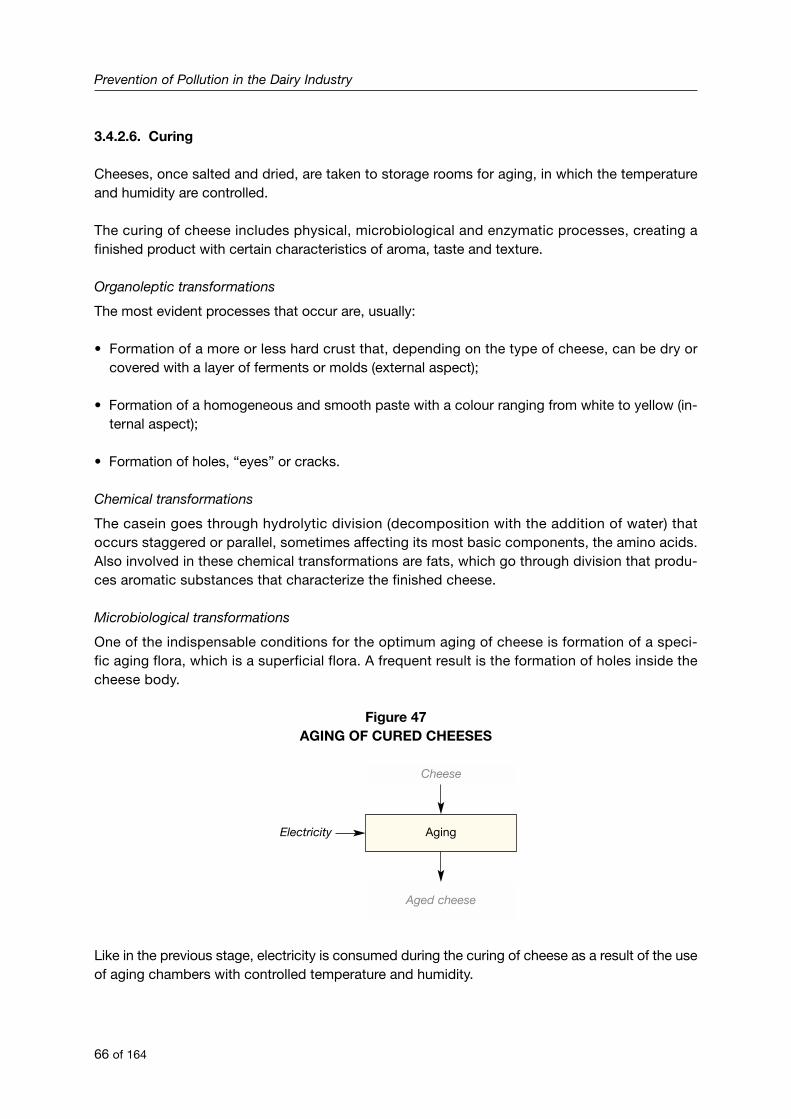
3.4.2.6. Curing
Cheeses, once salted and dried, are taken to storage rooms for aging, in which the temperatureand humidity are controlled.
The curing of cheese includes physical, microbiological and enzymatic processes, creating afinished product with certain characteristics of aroma, taste and texture.
Organoleptic transformations
The most evident processes that occur are, usually:
• Formation of a more or less hard crust that, depending on the type of cheese, can be dry orcovered with a layer of ferments or molds (external aspect);
• Formation of a homogeneous and smooth paste with a colour ranging from white to yellow (in-ternal aspect);
• Formation of holes, “eyes” or cracks.
Chemical transformations
The casein goes through hydrolytic division (decomposition with the addition of water) thatoccurs staggered or parallel, sometimes affecting its most basic components, the amino acids.Also involved in these chemical transformations are fats, which go through division that produ-ces aromatic substances that characterize the finished cheese.
Microbiological transformations
One of the indispensable conditions for the optimum aging of cheese is formation of a speci-fic aging flora, which is a superficial flora. A frequent result is the formation of holes inside thecheese body.
Figure 47AGING OF CURED CHEESES
Like in the previous stage, electricity is consumed during the curing of cheese as a result of the useof aging chambers with controlled temperature and humidity.
Prevention of Pollution in the Dairy Industry
66 of 164
Cheese
AgingElectricity
Aged cheese
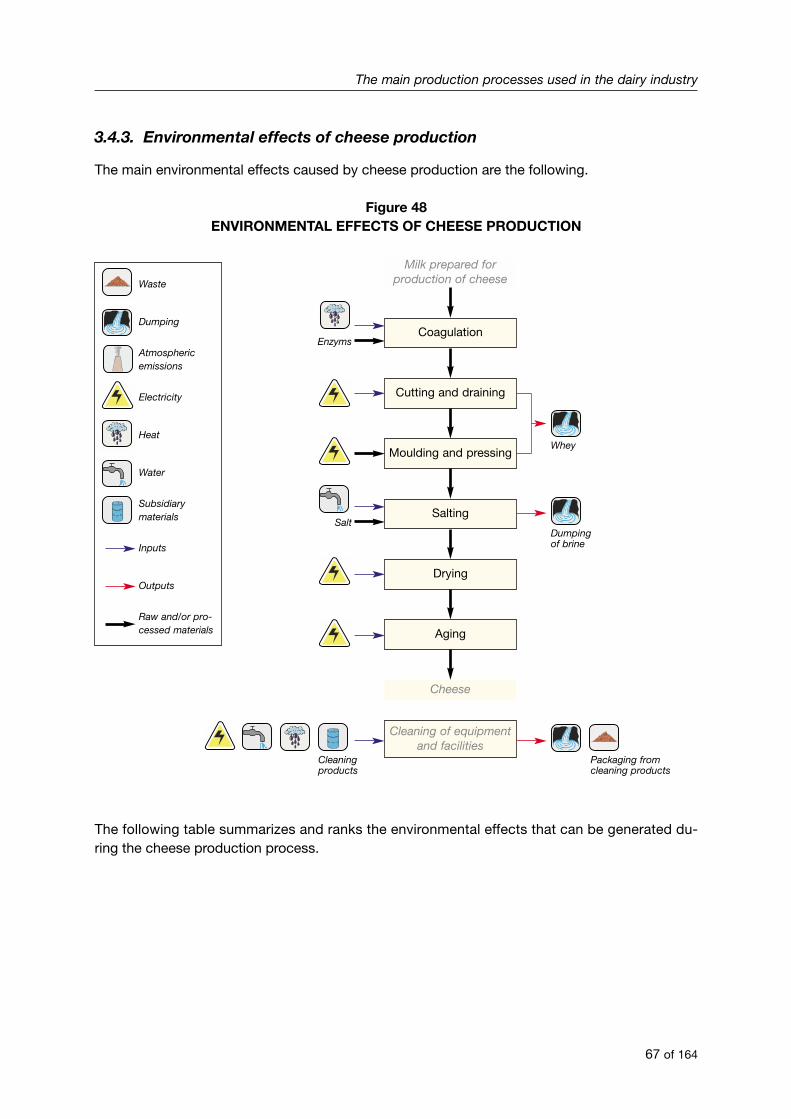
3.4.3. Environmental effects of cheese production
The main environmental effects caused by cheese production are the following.
Figure 48ENVIRONMENTAL EFFECTS OF CHEESE PRODUCTION
The following table summarizes and ranks the environmental effects that can be generated du-ring the cheese production process.
The main production processes used in the dairy industry
67 of 164
Milk prepared forproduction of cheese
Coagulation
Cutting and draining
Moulding and pressing
Salting
Cleaning of equipmentand facilities
Dumpingof brine
Packaging fromcleaning products
Cleaningproducts
Enzyms
Whey
Salt
Drying
Aging
Cheese
Waste
Dumping
Atmosphericemissions
Electricity
Heat
Water
Subsidiarymaterials
Inputs
Outputs
Raw and/or pro-cessed materials

Table 7: Ranking of the environmental effects resulting from the production of cheese
BASIC OPERATION EFFECT RANKING
Coagulation Consumption of heat Secondary
Cutting and draining Dumping of whey PrimaryConsumption of electricity Secondary
Moulding and pressing Dumping of whey PrimaryConsumption of electricity Secondary
Salting Consumption of water PrimaryDumping of brine Primary
Drying Consumption of electricity Secondary
Curing Consumption of electricity Secondary
Consumption of heat PrimaryConsumption of water PrimaryDumping of wastewater (amount of waste and
Cleaning pollutant load) PrimaryConsumption of chemicals PrimaryGeneration of waste (packaging of cleaning products) PrimaryConsumption of electricity Secondary
3.5. Secondary operations in the dairy industry
In this section are described the secondary operations common to all processes in the dairy in-dustry. Environmental effects associated with these operations are evaluated at the end of thissection.
3.5.1. Cleaning and disinfection operations
Because of the characteristics of the raw material used and the products produced, the hygienicconditions of the equipment and installations of the dairy firms should guarantee the quality ofthe products produced.
Maintenance of the hygienic conditions in a dairy firm require continuously carrying out cleaningoperations and disinfection, up to one fourth of the total time worked. These operations use mostof the water, energy and chemicals consumed by the plant and produce a considerable amount ofwastewater.
Cleaning means total elimination of all traces of milk or its components and other visible impuri-ties. Disinfection means eliminating all pathogenic microorganisms and most of those that are non-pathogenic that can affect the quality of the final product.
Cleaning and disinfection are two operations that are usually carried out one after the otherover time; first, cleaning and then disinfection, using detergents and disinfectants separa-tely.
Prevention of Pollution in the Dairy Industry
68 of 164
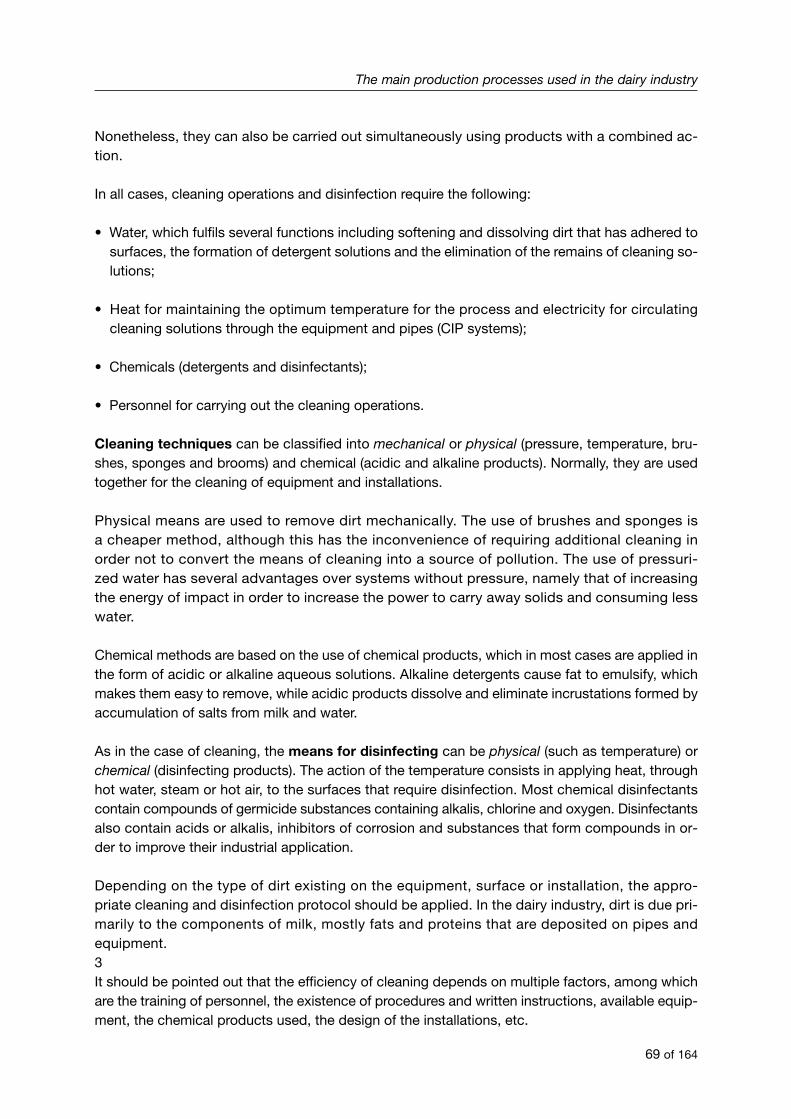
Nonetheless, they can also be carried out simultaneously using products with a combined ac-tion.
In all cases, cleaning operations and disinfection require the following:
• Water, which fulfils several functions including softening and dissolving dirt that has adhered tosurfaces, the formation of detergent solutions and the elimination of the remains of cleaning so-lutions;
• Heat for maintaining the optimum temperature for the process and electricity for circulatingcleaning solutions through the equipment and pipes (CIP systems);
• Chemicals (detergents and disinfectants);
• Personnel for carrying out the cleaning operations.
Cleaning techniques can be classified into mechanical or physical (pressure, temperature, bru-shes, sponges and brooms) and chemical (acidic and alkaline products). Normally, they are usedtogether for the cleaning of equipment and installations.
Physical means are used to remove dirt mechanically. The use of brushes and sponges isa cheaper method, although this has the inconvenience of requiring additional cleaning inorder not to convert the means of cleaning into a source of pollution. The use of pressuri-zed water has several advantages over systems without pressure, namely that of increasingthe energy of impact in order to increase the power to carry away solids and consuming lesswater.
Chemical methods are based on the use of chemical products, which in most cases are applied inthe form of acidic or alkaline aqueous solutions. Alkaline detergents cause fat to emulsify, whichmakes them easy to remove, while acidic products dissolve and eliminate incrustations formed byaccumulation of salts from milk and water.
As in the case of cleaning, the means for disinfecting can be physical (such as temperature) orchemical (disinfecting products). The action of the temperature consists in applying heat, throughhot water, steam or hot air, to the surfaces that require disinfection. Most chemical disinfectantscontain compounds of germicide substances containing alkalis, chlorine and oxygen. Disinfectantsalso contain acids or alkalis, inhibitors of corrosion and substances that form compounds in or-der to improve their industrial application.
Depending on the type of dirt existing on the equipment, surface or installation, the appro-priate cleaning and disinfection protocol should be applied. In the dairy industry, dirt is due pri-marily to the components of milk, mostly fats and proteins that are deposited on pipes andequipment.3It should be pointed out that the efficiency of cleaning depends on multiple factors, among whichare the training of personnel, the existence of procedures and written instructions, available equip-ment, the chemical products used, the design of the installations, etc.
The main production processes used in the dairy industry
69 of 164
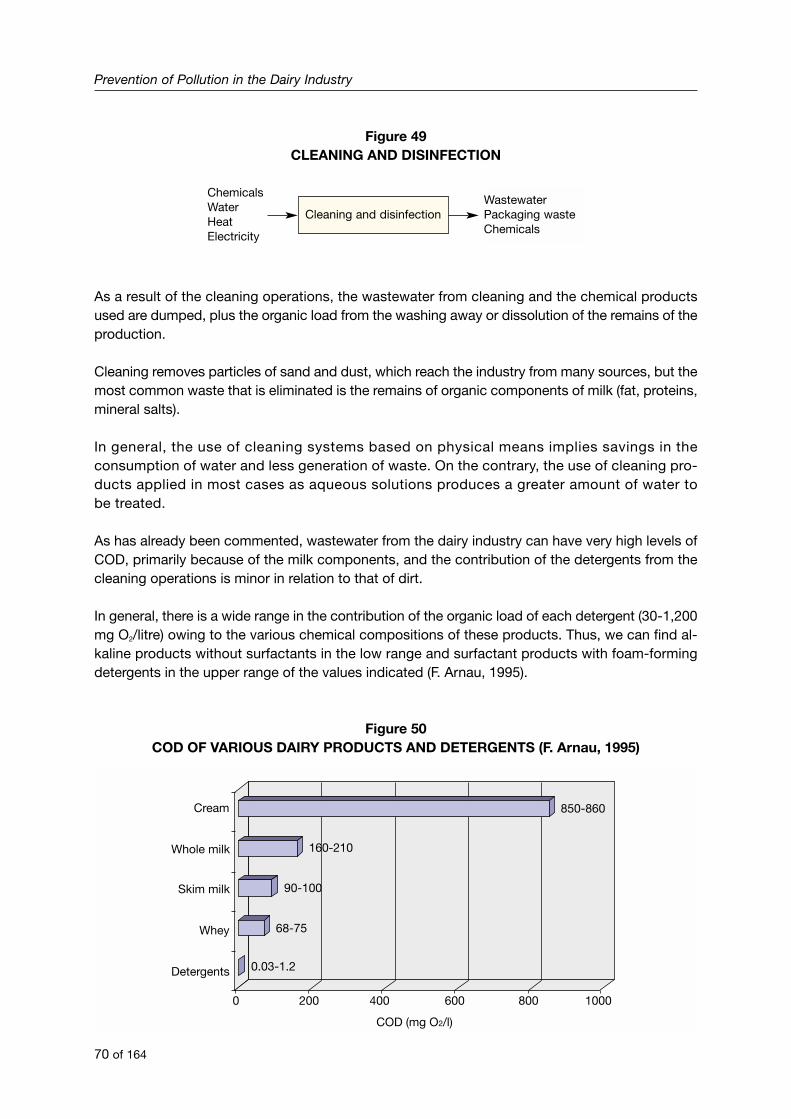
Figure 49CLEANING AND DISINFECTION
As a result of the cleaning operations, the wastewater from cleaning and the chemical productsused are dumped, plus the organic load from the washing away or dissolution of the remains of theproduction.
Cleaning removes particles of sand and dust, which reach the industry from many sources, but themost common waste that is eliminated is the remains of organic components of milk (fat, proteins,mineral salts).
In general, the use of cleaning systems based on physical means implies savings in theconsumption of water and less generation of waste. On the contrary, the use of cleaning pro-ducts applied in most cases as aqueous solutions produces a greater amount of water tobe treated.
As has already been commented, wastewater from the dairy industry can have very high levels ofCOD, primarily because of the milk components, and the contribution of the detergents from thecleaning operations is minor in relation to that of dirt.
In general, there is a wide range in the contribution of the organic load of each detergent (30-1,200mg O2/litre) owing to the various chemical compositions of these products. Thus, we can find al-kaline products without surfactants in the low range and surfactant products with foam-formingdetergents in the upper range of the values indicated (F. Arnau, 1995).
Figure 50COD OF VARIOUS DAIRY PRODUCTS AND DETERGENTS (F. Arnau, 1995)
Prevention of Pollution in the Dairy Industry
70 of 164
Cleaning and disinfection
ChemicalsWaterHeatElectricity
WastewaterPackaging wasteChemicals
0 200 400 600 800 1000
Cream
Whole milk
Skim milk
Whey
Detergents
COD (mg O2/l)
0.03-1.2
68-75
90-100
160-210
850-860
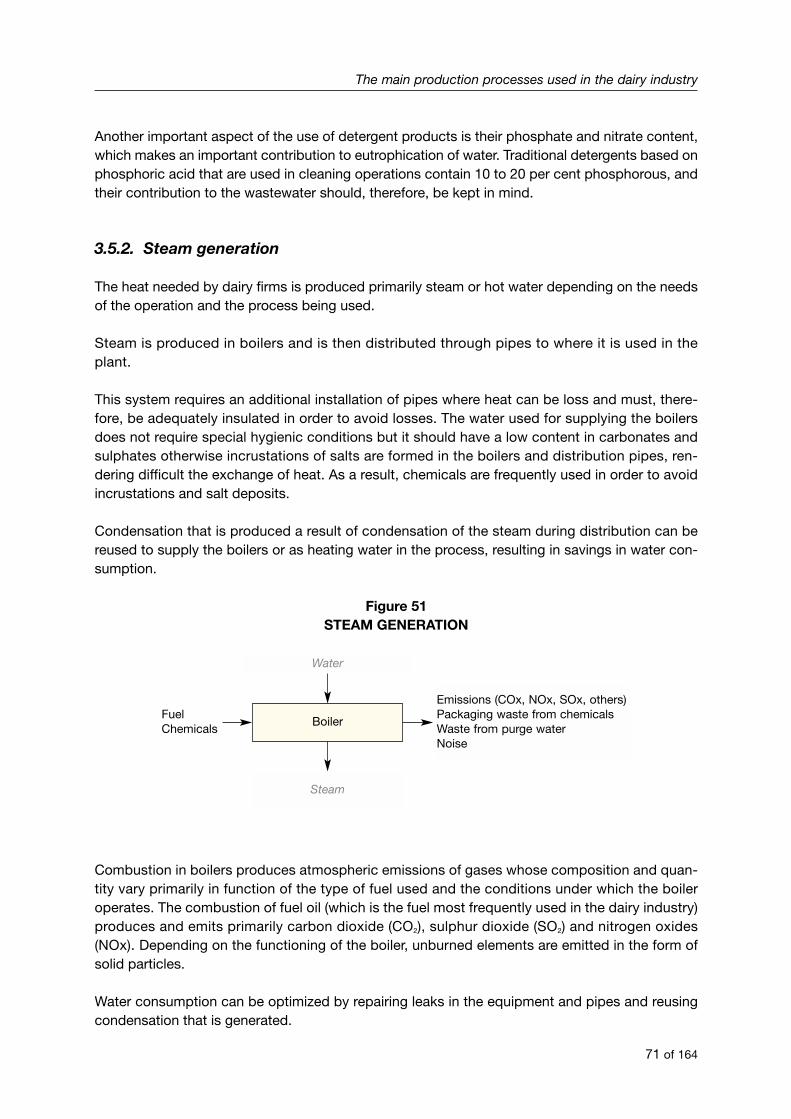
Another important aspect of the use of detergent products is their phosphate and nitrate content,which makes an important contribution to eutrophication of water. Traditional detergents based onphosphoric acid that are used in cleaning operations contain 10 to 20 per cent phosphorous, andtheir contribution to the wastewater should, therefore, be kept in mind.
3.5.2. Steam generation
The heat needed by dairy firms is produced primarily steam or hot water depending on the needsof the operation and the process being used.
Steam is produced in boilers and is then distributed through pipes to where it is used in theplant.
This system requires an additional installation of pipes where heat can be loss and must, there-fore, be adequately insulated in order to avoid losses. The water used for supplying the boilersdoes not require special hygienic conditions but it should have a low content in carbonates andsulphates otherwise incrustations of salts are formed in the boilers and distribution pipes, ren-dering difficult the exchange of heat. As a result, chemicals are frequently used in order to avoidincrustations and salt deposits.
Condensation that is produced a result of condensation of the steam during distribution can bereused to supply the boilers or as heating water in the process, resulting in savings in water con-sumption.
Figure 51STEAM GENERATION
Combustion in boilers produces atmospheric emissions of gases whose composition and quan-tity vary primarily in function of the type of fuel used and the conditions under which the boileroperates. The combustion of fuel oil (which is the fuel most frequently used in the dairy industry)produces and emits primarily carbon dioxide (CO2), sulphur dioxide (SO2) and nitrogen oxides(NOx). Depending on the functioning of the boiler, unburned elements are emitted in the form ofsolid particles.
Water consumption can be optimized by repairing leaks in the equipment and pipes and reusingcondensation that is generated.
The main production processes used in the dairy industry
71 of 164
Water
BoilerFuelChemicals
Steam
Emissions (COx, NOx, SOx, others)Packaging waste from chemicalsWaste from purge waterNoise
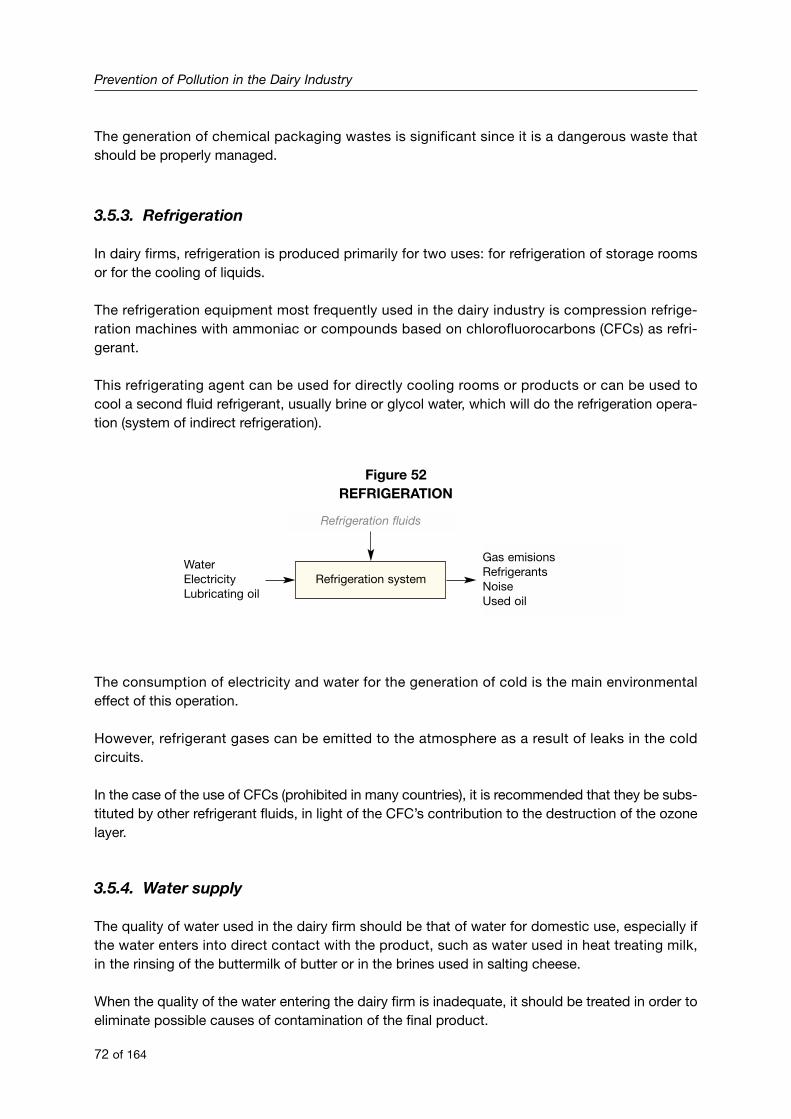
The generation of chemical packaging wastes is significant since it is a dangerous waste thatshould be properly managed.
3.5.3. Refrigeration
In dairy firms, refrigeration is produced primarily for two uses: for refrigeration of storage roomsor for the cooling of liquids.
The refrigeration equipment most frequently used in the dairy industry is compression refrige-ration machines with ammoniac or compounds based on chlorofluorocarbons (CFCs) as refri-gerant.
This refrigerating agent can be used for directly cooling rooms or products or can be used tocool a second fluid refrigerant, usually brine or glycol water, which will do the refrigeration opera-tion (system of indirect refrigeration).
Figure 52REFRIGERATION
The consumption of electricity and water for the generation of cold is the main environmentaleffect of this operation.
However, refrigerant gases can be emitted to the atmosphere as a result of leaks in the coldcircuits.
In the case of the use of CFCs (prohibited in many countries), it is recommended that they be subs-tituted by other refrigerant fluids, in light of the CFC’s contribution to the destruction of the ozonelayer.
3.5.4. Water supply
The quality of water used in the dairy firm should be that of water for domestic use, especially ifthe water enters into direct contact with the product, such as water used in heat treating milk,in the rinsing of the buttermilk of butter or in the brines used in salting cheese.
When the quality of the water entering the dairy firm is inadequate, it should be treated in order toeliminate possible causes of contamination of the final product.
Prevention of Pollution in the Dairy Industry
72 of 164
Refrigeration fluids
Refrigeration systemWater ElectricityLubricating oil
Gas emisionsRefrigerantsNoiseUsed oil
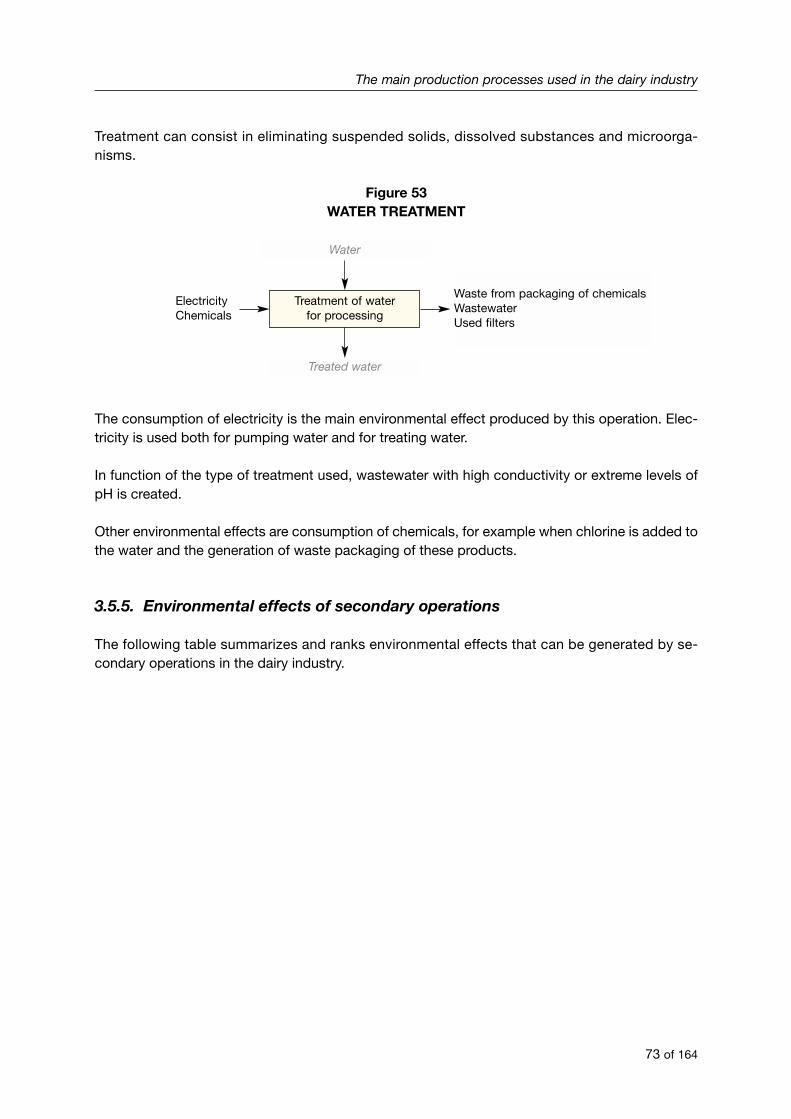
Treatment can consist in eliminating suspended solids, dissolved substances and microorga-nisms.
Figure 53WATER TREATMENT
The consumption of electricity is the main environmental effect produced by this operation. Elec-tricity is used both for pumping water and for treating water.
In function of the type of treatment used, wastewater with high conductivity or extreme levels ofpH is created.
Other environmental effects are consumption of chemicals, for example when chlorine is added tothe water and the generation of waste packaging of these products.
3.5.5. Environmental effects of secondary operations
The following table summarizes and ranks environmental effects that can be generated by se-condary operations in the dairy industry.
The main production processes used in the dairy industry
73 of 164
Water
Treatment of waterfor processing
ElectricityChemicals
Treated water
Waste from packaging of chemicalsWastewaterUsed filters
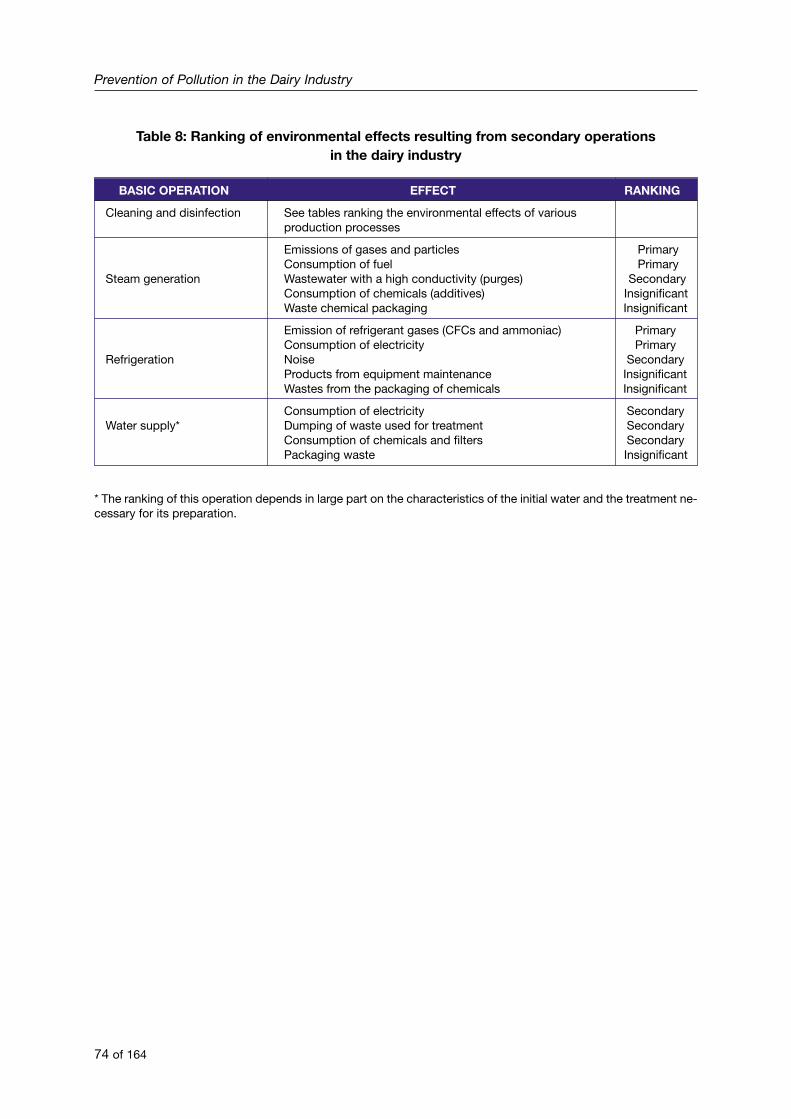
Table 8: Ranking of environmental effects resulting from secondary operationsin the dairy industry
BASIC OPERATION EFFECT RANKING
Cleaning and disinfection See tables ranking the environmental effects of various production processes
Emissions of gases and particles PrimaryConsumption of fuel Primary
Steam generation Wastewater with a high conductivity (purges) SecondaryConsumption of chemicals (additives) InsignificantWaste chemical packaging Insignificant
Emission of refrigerant gases (CFCs and ammoniac) PrimaryConsumption of electricity Primary
Refrigeration Noise SecondaryProducts from equipment maintenance InsignificantWastes from the packaging of chemicals Insignificant
Consumption of electricity SecondaryWater supply* Dumping of waste used for treatment Secondary
Consumption of chemicals and filters SecondaryPackaging waste Insignificant
* The ranking of this operation depends in large part on the characteristics of the initial water and the treatment ne-cessary for its preparation.
Prevention of Pollution in the Dairy Industry
74 of 164

The main environmental effects of the dairy industry are related to the high consumption of waterand energy, generation of wastewater with a high organic content, and the production and manage-ment of waste. Of minor importance are emissions of gases and particles into the atmosphere andnoise.
It is important to point out that quantification of these aspects can vary from one installation toanother in function of factors such as the size and age of the installation, equipment, use, cleaningprogrammes, awareness of the employees, etc.
4.1. Water consumption
Like most of the other firms in the food and agriculture sector, dairy industries consume daily largequantities of water in their processes, especially in order to maintain the required hygienic andsanitary conditions.
Table 9: Water consumption in the dairy industry
PRODUCTIVE LEVEL OF OPERATIONS WITH HIGHEST OBSERVATIONS PPO*PROCESSES CONSUMPT. WATER CONSUMPTION
Milk Low Heat treatment 1-29Packaging
Cream and Low Pasteurization of cream Rinsing of buttermilk 1-29butter Churning before churning
Yogurt Low — Mainly in secondary 1-29operations
Cheese Medium Salting Salting using 1-10-brine 11-29
Secondary Cleaning and disinfection Consumption of water 12-13-14-operations High Generation of steam is the greatest during 15-16-17-
Refrigeration these operations 18-19-21
* Pollution prevention opportunity (see chapter 5).
Depending on the type of installation and the cleaning system and its management, the total quan-tity of water consumed in the process can reach several times the volume of milk processed.Consumption is usually 1.3-3.2 litres of water/kilo of milk received, but can reach as much as 10 li-tres of water/kilo of milk received. Nonetheless, it is possible to optimize this consumption at 0.8-1.0litre of water/kilo milk received using advanced equipment and proper management (UNEP, 2000).
As indicated in table 9, the greatest consumption of water occurs during secondary operations,particularly in the cleaning and disinfection where 25-40 per cent of the total is consumed.
Metodología de Grupos de Trabajo
75 of 164
4. ENVIRONMENTAL EFFECTS OF THE DAIRYINDUSTRY
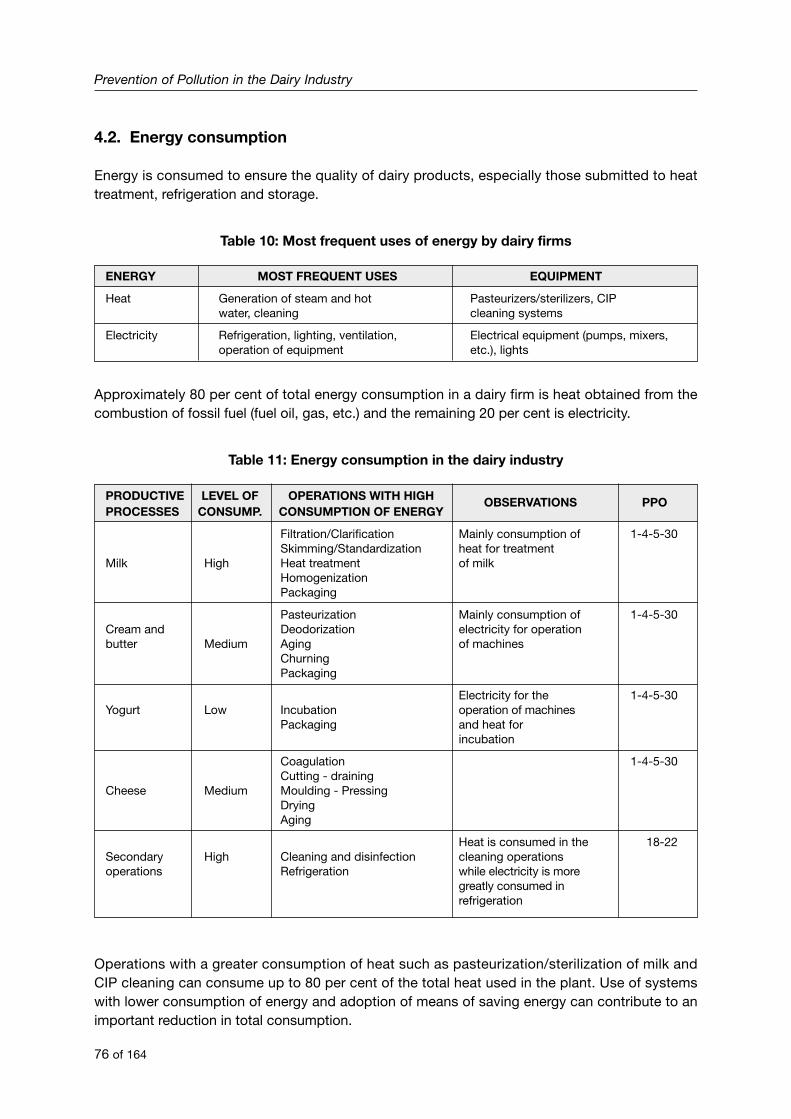
4.2. Energy consumption
Energy is consumed to ensure the quality of dairy products, especially those submitted to heattreatment, refrigeration and storage.
Table 10: Most frequent uses of energy by dairy firms
ENERGY MOST FREQUENT USES EQUIPMENT
Heat Generation of steam and hot Pasteurizers/sterilizers, CIP water, cleaning cleaning systems
Electricity Refrigeration, lighting, ventilation, Electrical equipment (pumps, mixers, operation of equipment etc.), lights
Approximately 80 per cent of total energy consumption in a dairy firm is heat obtained from thecombustion of fossil fuel (fuel oil, gas, etc.) and the remaining 20 per cent is electricity.
Table 11: Energy consumption in the dairy industry
PRODUCTIVE LEVEL OF OPERATIONS WITH HIGH OBSERVATIONS PPOPROCESSES CONSUMP. CONSUMPTION OF ENERGY
Filtration/Clarification Mainly consumption of 1-4-5-30Skimming/Standardization heat for treatment
Milk High Heat treatment of milkHomogenizationPackaging
Pasteurization Mainly consumption of 1-4-5-30Cream and Deodorization electricity for operation butter Medium Aging of machines
ChurningPackaging
Electricity for the 1-4-5-30Yogurt Low Incubation operation of machines
Packaging and heat forincubation
Coagulation 1-4-5-30Cutting - draining
Cheese Medium Moulding - PressingDryingAging
Heat is consumed in the 18-22Secondary High Cleaning and disinfection cleaning operations operations Refrigeration while electricity is more
greatly consumed inrefrigeration
Operations with a greater consumption of heat such as pasteurization/sterilization of milk andCIP cleaning can consume up to 80 per cent of the total heat used in the plant. Use of systemswith lower consumption of energy and adoption of means of saving energy can contribute to animportant reduction in total consumption.
Prevention of Pollution in the Dairy Industry
76 of 164
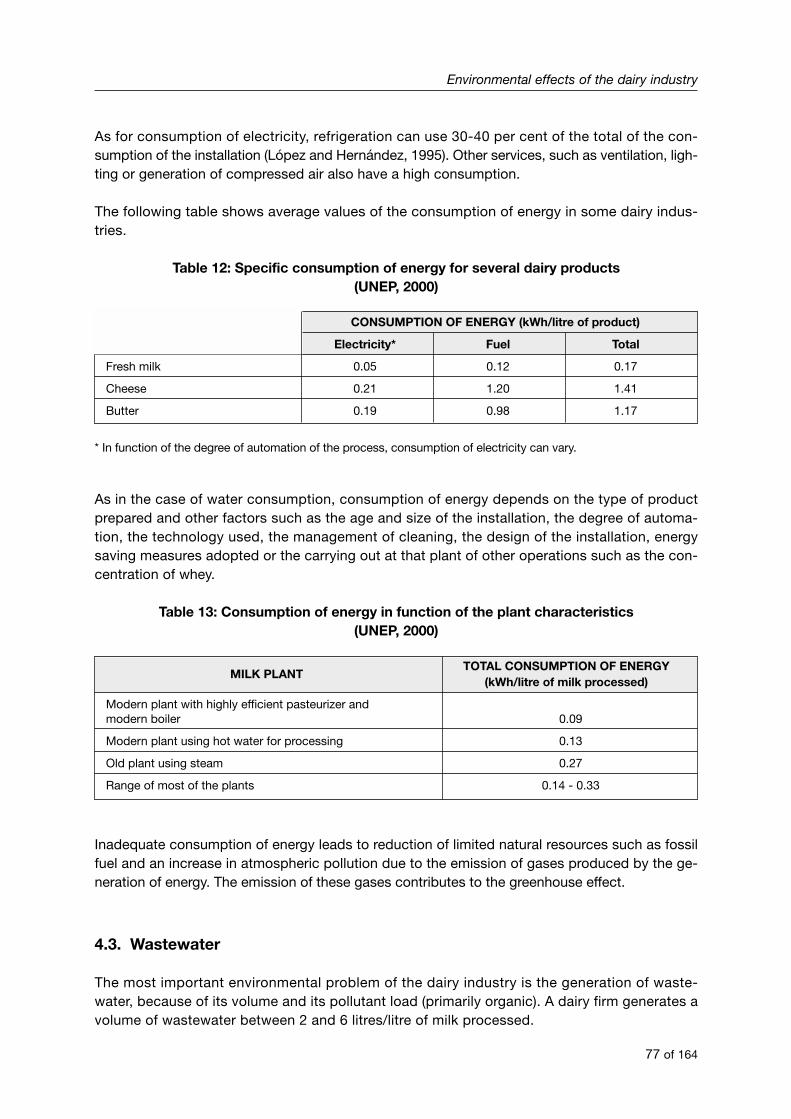
As for consumption of electricity, refrigeration can use 30-40 per cent of the total of the con-sumption of the installation (López and Hernández, 1995). Other services, such as ventilation, ligh-ting or generation of compressed air also have a high consumption.
The following table shows average values of the consumption of energy in some dairy indus-tries.
Table 12: Specific consumption of energy for several dairy products (UNEP, 2000)
CONSUMPTION OF ENERGY (kWh/litre of product)
Electricity* Fuel Total
Fresh milk 0.05 0.12 0.17
Cheese 0.21 1.20 1.41
Butter 0.19 0.98 1.17
* In function of the degree of automation of the process, consumption of electricity can vary.
As in the case of water consumption, consumption of energy depends on the type of productprepared and other factors such as the age and size of the installation, the degree of automa-tion, the technology used, the management of cleaning, the design of the installation, energysaving measures adopted or the carrying out at that plant of other operations such as the con-centration of whey.
Table 13: Consumption of energy in function of the plant characteristics (UNEP, 2000)
MILK PLANTTOTAL CONSUMPTION OF ENERGY
(kWh/litre of milk processed)
Modern plant with highly efficient pasteurizer andmodern boiler 0.09
Modern plant using hot water for processing 0.13
Old plant using steam 0.27
Range of most of the plants 0.14 - 0.33
Inadequate consumption of energy leads to reduction of limited natural resources such as fossilfuel and an increase in atmospheric pollution due to the emission of gases produced by the ge-neration of energy. The emission of these gases contributes to the greenhouse effect.
4.3. Wastewater
The most important environmental problem of the dairy industry is the generation of waste-water, because of its volume and its pollutant load (primarily organic). A dairy firm generates avolume of wastewater between 2 and 6 litres/litre of milk processed.
Environmental effects of the dairy industry
77 of 164

Table 14: Volume of wastewater created by different processes
MAIN ACTIVITYVOLUME OF
WASTEWATER*
Production of butter 1 - 3
Production of cheese 2 - 4
Processing of fresh milk (pasteurization and sterilization) 2.5 - 9
* Litres of wastewater/litre of milk.
The wastewater generated by a dairy firm can be classified in terms of their source: processes andcleaning or refrigeration.
Table 15: Wastewater created by a dairy firm
ORIGIN DESCRIPTION CHARACTERISTICS VOLUME*
Cleaning and Cleaning of surfaces, Extreme pH, high organic 0.8 - 1.5processing pipes, tanks and equipment. content (BOD and COD),
Loss of product, whey, brine, oils and fats, ferments, etc. suspended solids
Refrigeration Water from cooling towers, Variations in temperature, 2 - 4condensation, etc. conductivity
* Volume expressed in litres of wastewater/litres of processed milk (Source: E. Spreer, 1991).
Table 16: Wastewater in the dairy industry
PRODUCTIVE LEVEL OF OPERATIONS PRODUCINGPROCESSES WASTE HIGH AMOUNTS OF OBSERVATIONS PPO
WASTEWATER
Heat treatment Waste decreases if water 2-3Milk Medium Packaging used for heat treatment is
re-circulated
Cream and Pasteurization Water used for cleaning 2-3-6butter Medium Churning the buttermilk has a high
Packaging fat content
Yogurt Low — Mainly secondary operations 2-3
Dumping of whey leads to a high 2-3-7-Cutting - Draining high amount of pollution. 8-10-11
Cheese High Moulding - Pressing Regeneration of brine produces Salting periodic dumping of highly
conductive waste
The amounts and pollutant 12-13-14-load of cleaning water 15-16-17-
Secondary High Cleaning and depend on their management 18operations disinfection by the firm.
Refrigeration Wastewater from refrigeration depends on the degree oftheir re-use
Prevention of Pollution in the Dairy Industry
78 of 164
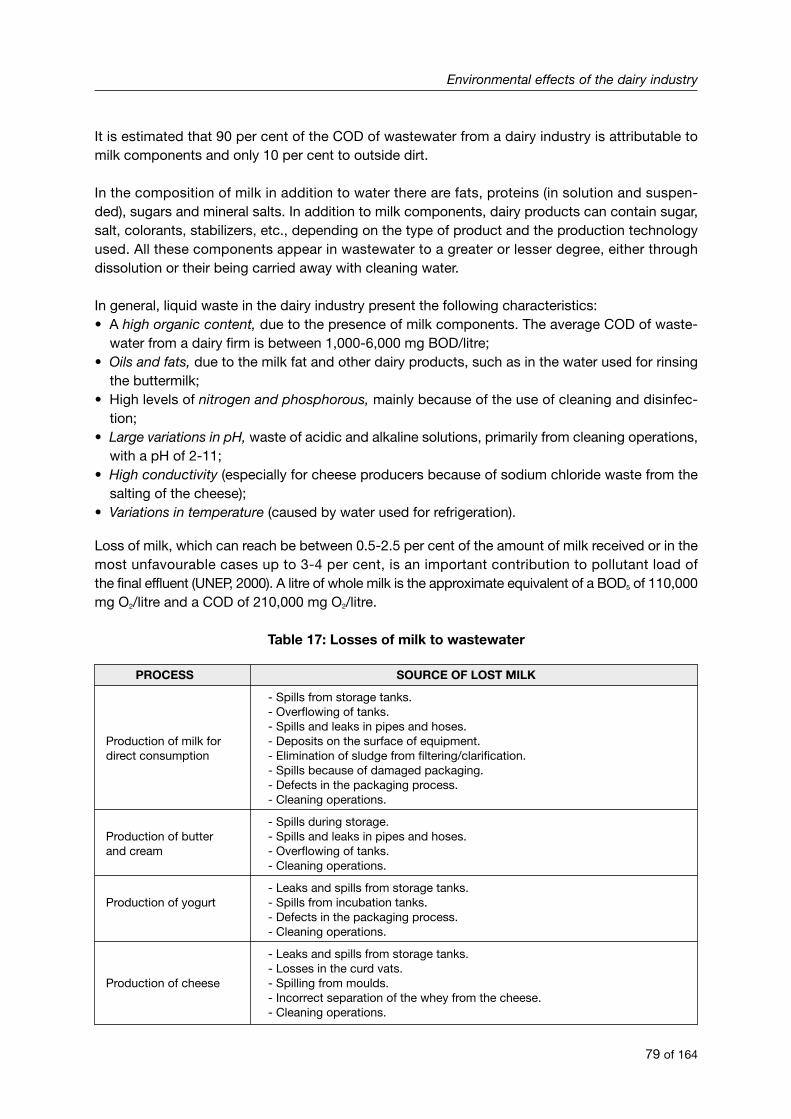
It is estimated that 90 per cent of the COD of wastewater from a dairy industry is attributable tomilk components and only 10 per cent to outside dirt.
In the composition of milk in addition to water there are fats, proteins (in solution and suspen-ded), sugars and mineral salts. In addition to milk components, dairy products can contain sugar,salt, colorants, stabilizers, etc., depending on the type of product and the production technologyused. All these components appear in wastewater to a greater or lesser degree, either throughdissolution or their being carried away with cleaning water.
In general, liquid waste in the dairy industry present the following characteristics: • A high organic content, due to the presence of milk components. The average COD of waste-
water from a dairy firm is between 1,000-6,000 mg BOD/litre;• Oils and fats, due to the milk fat and other dairy products, such as in the water used for rinsing
the buttermilk;• High levels of nitrogen and phosphorous, mainly because of the use of cleaning and disinfec-
tion;• Large variations in pH, waste of acidic and alkaline solutions, primarily from cleaning operations,
with a pH of 2-11;• High conductivity (especially for cheese producers because of sodium chloride waste from the
salting of the cheese);• Variations in temperature (caused by water used for refrigeration).
Loss of milk, which can reach be between 0.5-2.5 per cent of the amount of milk received or in themost unfavourable cases up to 3-4 per cent, is an important contribution to pollutant load ofthe final effluent (UNEP, 2000). A litre of whole milk is the approximate equivalent of a BOD5 of 110,000mg O2/litre and a COD of 210,000 mg O2/litre.
Table 17: Losses of milk to wastewater
PROCESS SOURCE OF LOST MILK
- Spills from storage tanks.- Overflowing of tanks.- Spills and leaks in pipes and hoses.
Production of milk for - Deposits on the surface of equipment.direct consumption - Elimination of sludge from filtering/clarification.
- Spills because of damaged packaging.- Defects in the packaging process.- Cleaning operations.
- Spills during storage.Production of butter - Spills and leaks in pipes and hoses.and cream - Overflowing of tanks.
- Cleaning operations.
- Leaks and spills from storage tanks.Production of yogurt - Spills from incubation tanks.
- Defects in the packaging process.- Cleaning operations.
- Leaks and spills from storage tanks.- Losses in the curd vats.
Production of cheese - Spilling from moulds.- Incorrect separation of the whey from the cheese.- Cleaning operations.
Environmental effects of the dairy industry
79 of 164
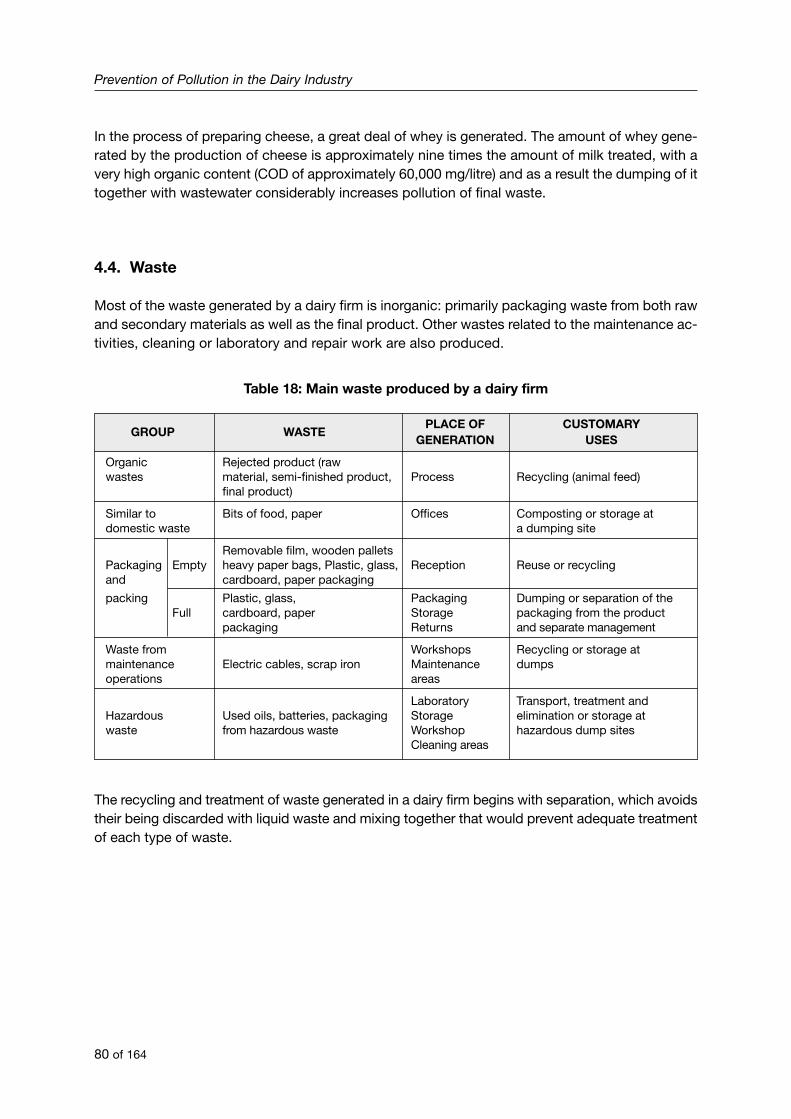
In the process of preparing cheese, a great deal of whey is generated. The amount of whey gene-rated by the production of cheese is approximately nine times the amount of milk treated, with avery high organic content (COD of approximately 60,000 mg/litre) and as a result the dumping of ittogether with wastewater considerably increases pollution of final waste.
4.4. Waste
Most of the waste generated by a dairy firm is inorganic: primarily packaging waste from both rawand secondary materials as well as the final product. Other wastes related to the maintenance ac-tivities, cleaning or laboratory and repair work are also produced.
Table 18: Main waste produced by a dairy firm
GROUP WASTEPLACE OF CUSTOMARY
GENERATION USES
Organic Rejected product (raw wastes material, semi-finished product, Process Recycling (animal feed)
final product)
Similar to Bits of food, paper Offices Composting or storage at domestic waste a dumping site
Removable film, wooden palletsPackaging Empty heavy paper bags, Plastic, glass, Reception Reuse or recycling and cardboard, paper packaging
packing Plastic, glass, Packaging Dumping or separation of the Full cardboard, paper Storage packaging from the product
packaging Returns and separate management
Waste from Workshops Recycling or storage at maintenance Electric cables, scrap iron Maintenance dumpsoperations areas
Laboratory Transport, treatment and Hazardous Used oils, batteries, packaging Storage elimination or storage at waste from hazardous waste Workshop hazardous dump sites
Cleaning areas
The recycling and treatment of waste generated in a dairy firm begins with separation, which avoidstheir being discarded with liquid waste and mixing together that would prevent adequate treatmentof each type of waste.
Prevention of Pollution in the Dairy Industry
80 of 164

Table 19: Waste in the dairy industry
PRODUCTIVE LEVEL OF MOST SIGNIFICANTOBSERVATIONS PPO
PROCESS GENERATION OPERATIONS
Filtering/Clarification Used filters and sludge from 25Milk High Skimming/Homogenization filtering organic material
Packaging Waste from packages andpackaging
Cream and High Packaging Waste from packages and 25butter packaging
Yogurt High Packaging Waste from packages and 25packaging
Cheese Low — Mainly from secondary operations 25
Cleaning and disinfection Waste from packaging from 24-26-32Secondary Maintenance of cleaning and disinfection.operations Medium installations Waste from maintenance
Laboratories operations.Laboratory wastes
4.5. Atmospheric emissions
The main emissions of gases from the dairy industry are produced in boilers for producing steamor hot water required for production and cleaning operations.
The pollutants in the combustion gases are CO, SO2, NOx and particles. The level of emission ofthese pollutants varies in function of the type and quality of the fuel used, the state of the installa-tions and the efficiency and control of the combustion process.
The fuels most frequently used in the boilers are solid fuel (coal or wood), liquid (fuel or gas oil) orgas (natural gas).
Table 20: Average properties of several fuels (Source: Brennan, J.G., 1998)
TYPE OF FUELCALORIES
(MJ/kg)SULPHUR (per cent) ASH (per cent)
Coal 29 2 8
Firewood 14 - 4 - 5
Gas oil 34 sec.* 45.5 0.75 max. 0.01 max.
Fuel 220 sec.* 43.5 3.2 max. 0.05 max.
Natural gas 37.2 MJ/m3 Neg. Neg.
* Viscosity in Redwood seconds at 38 ºC.
Solid fuels are characterized by a high content of sulphur and ash. In addition, they usually havetraces of volatile and toxic products, such as lead and arsenic. Their content varies in function ofthe quality and source of the fuel.
Environmental effects of the dairy industry
81 of 164
Like solid fuels, liquid fuels have a high sulphur content and the possibility of producing soot andparticles through incomplete combustion. Furthermore, they should have fuel storage facilities withproper security arrangements in order to avoid the risk of possible leaks and explosions.
Natural gas, in spite of representing only 10 per cent of the world’s energy reserves, represents afuel that is more and more widely used given its advantages. Natural gas is free from sulphur andother impurities and does not emit these pollutants. It is also unnecessary to store it in the plants,although its use also presents risks of fire and explosion.
Preventive measures against emission of polluting gases are based on adequate maintenance andcleaning of burners, self-control of emissions and, wherever necessary, implementation of co-rrective measures.
Another source of pollution to be considered in atmospheric emissions is emission of refrigerantgases used in refrigeration systems. Losses or leaks of these gases have an important environ-mental impact given their repercussion on the destruction of the ozone layer.
4.6. Noise
In function of the closeness of urban centres, problems can occur because of noise from the ma-chinery used in the industrial activities, primarily in packaging and refrigeration equipment. Anothereffect is the noise caused by the traffic of lorries, both in reception of milk as well as at the timeof delivery of the finished product. The constant traffic of lorries can produce high levels of acous-tic contamination.
Noise is a significant effect in dairy plants located in inhabited areas. Preventive measures in-clude isolating noisy machines acoustically and as a source of vibrations. Another preventivemeasure is the monitoring of noise levels, thus allowing reduction of the impact before it isproduced.
Prevention of Pollution in the Dairy Industry
82 of 164
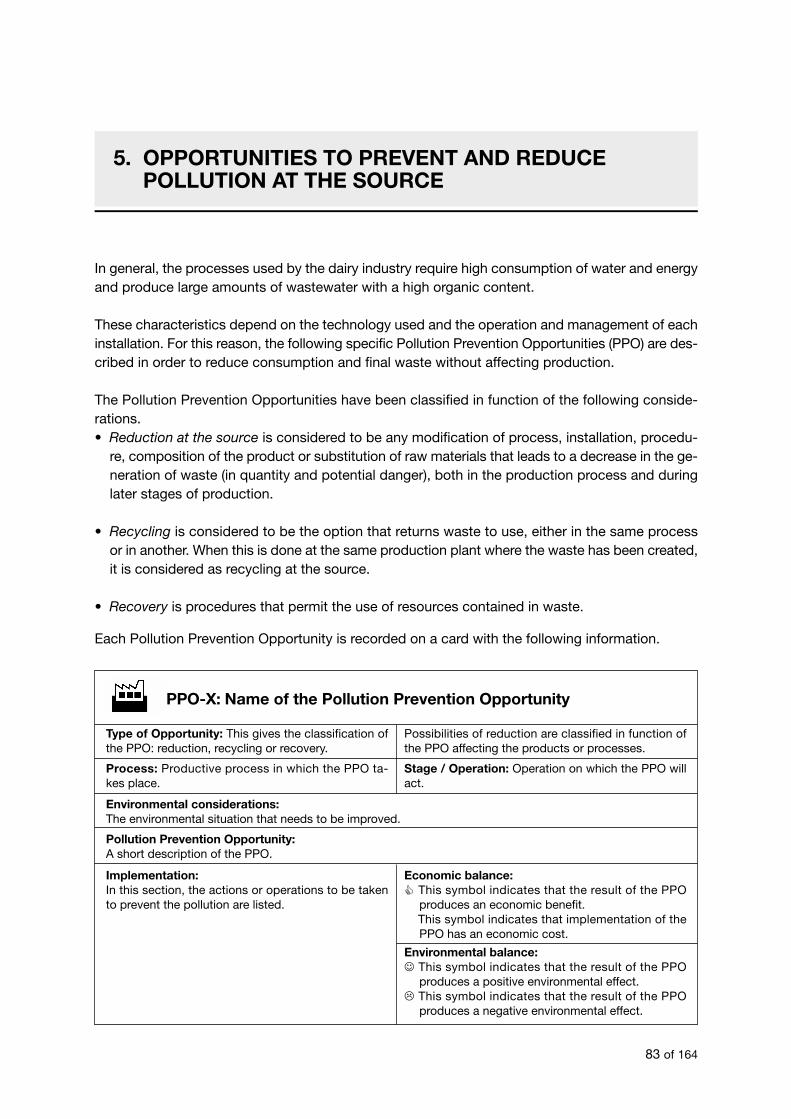
PPO-X: Name of the Pollution Prevention Opportunity
Environmental considerations: The environmental situation that needs to be improved.
Pollution Prevention Opportunity:A short description of the PPO.
In general, the processes used by the dairy industry require high consumption of water and energyand produce large amounts of wastewater with a high organic content.
These characteristics depend on the technology used and the operation and management of eachinstallation. For this reason, the following specific Pollution Prevention Opportunities (PPO) are des-cribed in order to reduce consumption and final waste without affecting production.
The Pollution Prevention Opportunities have been classified in function of the following conside-rations.• Reduction at the source is considered to be any modification of process, installation, procedu-
re, composition of the product or substitution of raw materials that leads to a decrease in the ge-neration of waste (in quantity and potential danger), both in the production process and duringlater stages of production.
• Recycling is considered to be the option that returns waste to use, either in the same processor in another. When this is done at the same production plant where the waste has been created,it is considered as recycling at the source.
• Recovery is procedures that permit the use of resources contained in waste.
Each Pollution Prevention Opportunity is recorded on a card with the following information.
Metodología de Grupos de Trabajo
83 of 164
5. OPPORTUNITIES TO PREVENT AND REDUCEPOLLUTION AT THE SOURCE
Type of Opportunity: This gives the classification ofthe PPO: reduction, recycling or recovery.
Process: Productive process in which the PPO ta-kes place.
Possibilities of reduction are classified in function ofthe PPO affecting the products or processes.
Stage / Operation: Operation on which the PPO willact.
Implementation:In this section, the actions or operations to be takento prevent the pollution are listed.
Economic balance:� This symbol indicates that the result of the PPO
produces an economic benefit.� This symbol indicates that implementation of the
PPO has an economic cost.
Environmental balance:☺ This symbol indicates that the result of the PPO
produces a positive environmental effect.� This symbol indicates that the result of the PPO
produces a negative environmental effect.
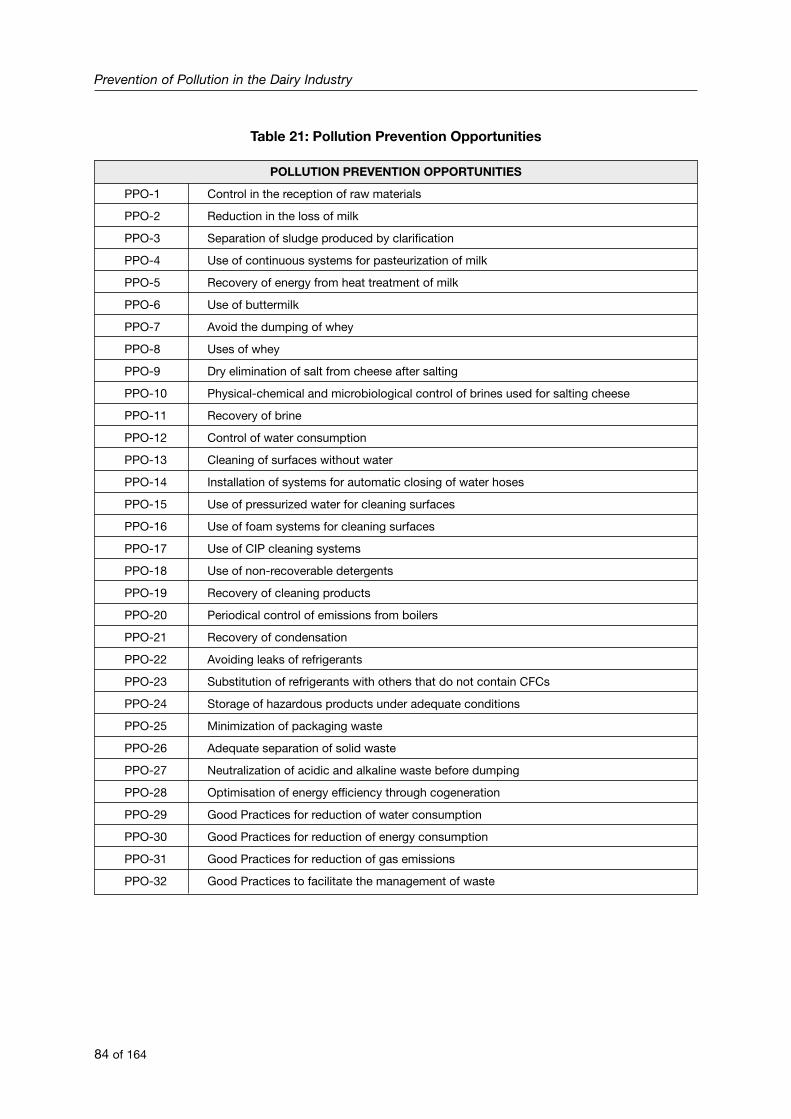
Table 21: Pollution Prevention Opportunities
POLLUTION PREVENTION OPPORTUNITIES
PPO-1 Control in the reception of raw materials
PPO-2 Reduction in the loss of milk
PPO-3 Separation of sludge produced by clarification
PPO-4 Use of continuous systems for pasteurization of milk
PPO-5 Recovery of energy from heat treatment of milk
PPO-6 Use of buttermilk
PPO-7 Avoid the dumping of whey
PPO-8 Uses of whey
PPO-9 Dry elimination of salt from cheese after salting
PPO-10 Physical-chemical and microbiological control of brines used for salting cheese
PPO-11 Recovery of brine
PPO-12 Control of water consumption
PPO-13 Cleaning of surfaces without water
PPO-14 Installation of systems for automatic closing of water hoses
PPO-15 Use of pressurized water for cleaning surfaces
PPO-16 Use of foam systems for cleaning surfaces
PPO-17 Use of CIP cleaning systems
PPO-18 Use of non-recoverable detergents
PPO-19 Recovery of cleaning products
PPO-20 Periodical control of emissions from boilers
PPO-21 Recovery of condensation
PPO-22 Avoiding leaks of refrigerants
PPO-23 Substitution of refrigerants with others that do not contain CFCs
PPO-24 Storage of hazardous products under adequate conditions
PPO-25 Minimization of packaging waste
PPO-26 Adequate separation of solid waste
PPO-27 Neutralization of acidic and alkaline waste before dumping
PPO-28 Optimisation of energy efficiency through cogeneration
PPO-29 Good Practices for reduction of water consumption
PPO-30 Good Practices for reduction of energy consumption
PPO-31 Good Practices for reduction of gas emissions
PPO-32 Good Practices to facilitate the management of waste
Prevention of Pollution in the Dairy Industry
84 of 164

Opportunities to prevent and reduce pollution at the source
85 of 164
PPO-1: Control of raw materials
Environmental considerations: Accepted raw materials that result from the low quality or are microbiologically altered can be converted intotheir own waste or later the waste generated by rejected products.
Pollution Prevention Opportunity:Establishment of quality specifications for raw materials and carrying out tests upon reception using micro-biological and physical-chemical tests.
Implementation:- Creation of specifications for acceptance of raw ma-
terials.- Laboratory and/or kits for quick testing. - Control of the storage conditions for raw mate-
rials.- Trained personnel.- Operational procedures.- Implementation of an HACCP system (Hazard Ana-
lysis and Critical Control Points). This system inclu-des approved suppliers.
- Work in an integrated system from farms to in-dustry.
Economic balance:� Reduction in the cost of raw materials.� Savings in the cost of eliminating waste and/or
treatment costs.� Adjustment in the price of the quality of milk.� Savings in the cost of processing rejected pro-
ducts.� Personnel costs.� Costs of testing equipment.
Environmental balance:☺ Reduction in the amount of waste produced.☺ Lower consumption of resources (energy, water,
etc.).
Comments
Implantation of a quality control system for raw materials and secondary materials (such as fer-ments, sugar, fruits, etc.) implies knowledge of the specifications of the product that are accepta-ble to the dairy firm.
Once the specifications of the product that are required are known, opportune controls and analy-sis are carried out to verify that those specifications are being met. This control requires trainedpersonnel for carrying out analytical tests and operational procedures that guarantee systematicand correct application.
Under the notion of quality of raw milk are grouped several aspects, although in general the follo-wing are taken into account:
• Content in nutrients;• Fat content;• Total content of microorganisms;• Presence or absence of pathogenic germs;• Presence or absence of certain substances (for example solids, pus, antibiotics);• Organoleptic characteristics (aroma and flavour).
Type of Opportunity: Reduction at the source.
Process: Preparation of dairy products.
Redesign of processes: Good Practices.
Stage / Operation: Reception of materials.
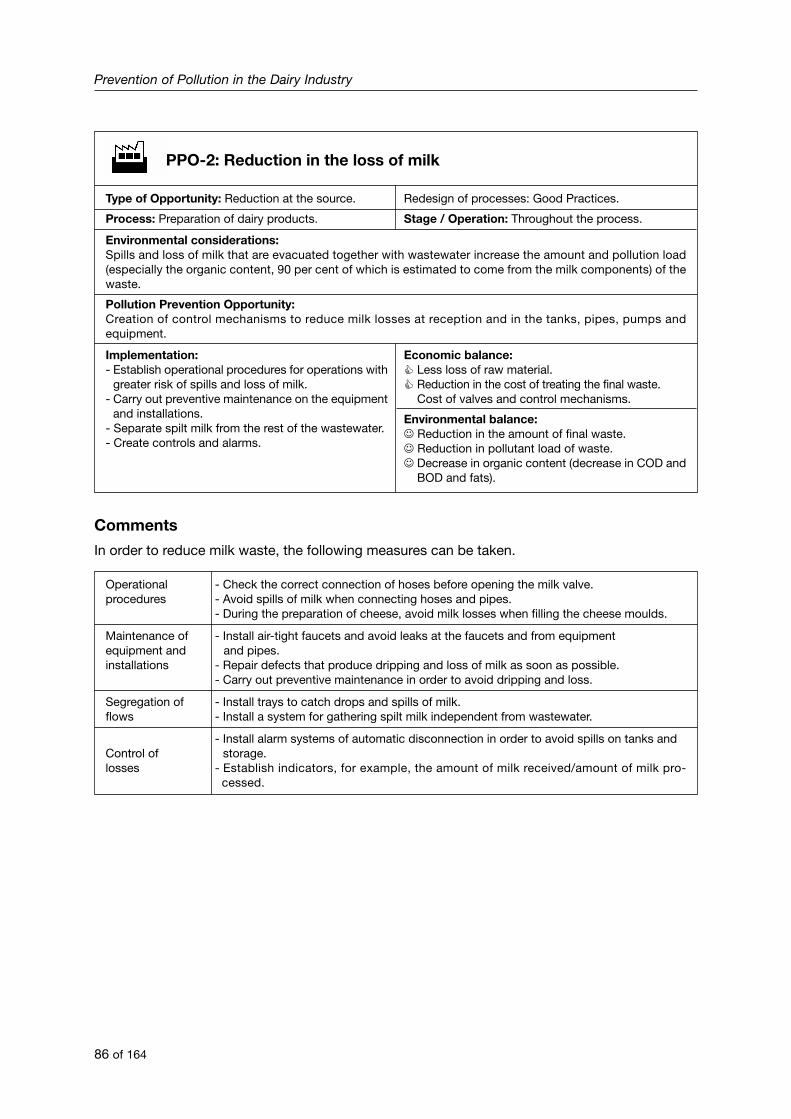
Comments
In order to reduce milk waste, the following measures can be taken.
Operational - Check the correct connection of hoses before opening the milk valve. procedures - Avoid spills of milk when connecting hoses and pipes.
- During the preparation of cheese, avoid milk losses when filling the cheese moulds.
Maintenance of - Install air-tight faucets and avoid leaks at the faucets and from equipment equipment and and pipes.installations - Repair defects that produce dripping and loss of milk as soon as possible.
- Carry out preventive maintenance in order to avoid dripping and loss.
Segregation of - Install trays to catch drops and spills of milk.flows - Install a system for gathering spilt milk independent from wastewater.
- Install alarm systems of automatic disconnection in order to avoid spills on tanks and Control of storage.losses - Establish indicators, for example, the amount of milk received/amount of milk pro-
cessed.
Prevention of Pollution in the Dairy Industry
86 of 164
PPO-2: Reduction in the loss of milk
Environmental considerations: Spills and loss of milk that are evacuated together with wastewater increase the amount and pollution load(especially the organic content, 90 per cent of which is estimated to come from the milk components) of thewaste.
Pollution Prevention Opportunity:Creation of control mechanisms to reduce milk losses at reception and in the tanks, pipes, pumps andequipment.
Implementation:- Establish operational procedures for operations with
greater risk of spills and loss of milk.- Carry out preventive maintenance on the equipment
and installations.- Separate spilt milk from the rest of the wastewater.- Create controls and alarms.
Economic balance:� Less loss of raw material.� Reduction in the cost of treating the final waste.� Cost of valves and control mechanisms.
Environmental balance:☺ Reduction in the amount of final waste. ☺ Reduction in pollutant load of waste. ☺ Decrease in organic content (decrease in COD and
BOD and fats).
Type of Opportunity: Reduction at the source.
Process: Preparation of dairy products.
Redesign of processes: Good Practices.
Stage / Operation: Throughout the process.

Example of application
For a firm with the following daily production.
Production 50 tons
Amount of waste 175 m3
Loss of milk (4 per cent) 2 tons
COD of the waste (from milk loss) 2,400 mg/litre
Cost of the milk lost (*) 590.19 e
* Assuming an average price of milk of 0.30 ¤/kg.
In function of the measures implemented, the following percentages of reduction in the loss of milkcan be obtained. The following estimate gives the variation of COD of waste in function of the per-centage of milk that is lost with wastewater and the cost of the lost milk.
Loss of milk 4 3.5 3 2.5 2 1.5 1per cent per cent per cent per cent per cent per cent per cent
COD (mg/litre)* 2,400 2,100 1,800 1,500 1,200 900 600
Cost of theloss of milk** 590.19 516.42 442.65 368.87 295.10 221.32 147.55(¤/day)
(*) COD from only the milk, approximately 90 per cent of the organic load of the wastewater.(**) Based on an average milk price of 49.1 ¤/kg.
Opportunities to prevent and reduce pollution at the source
87 of 164
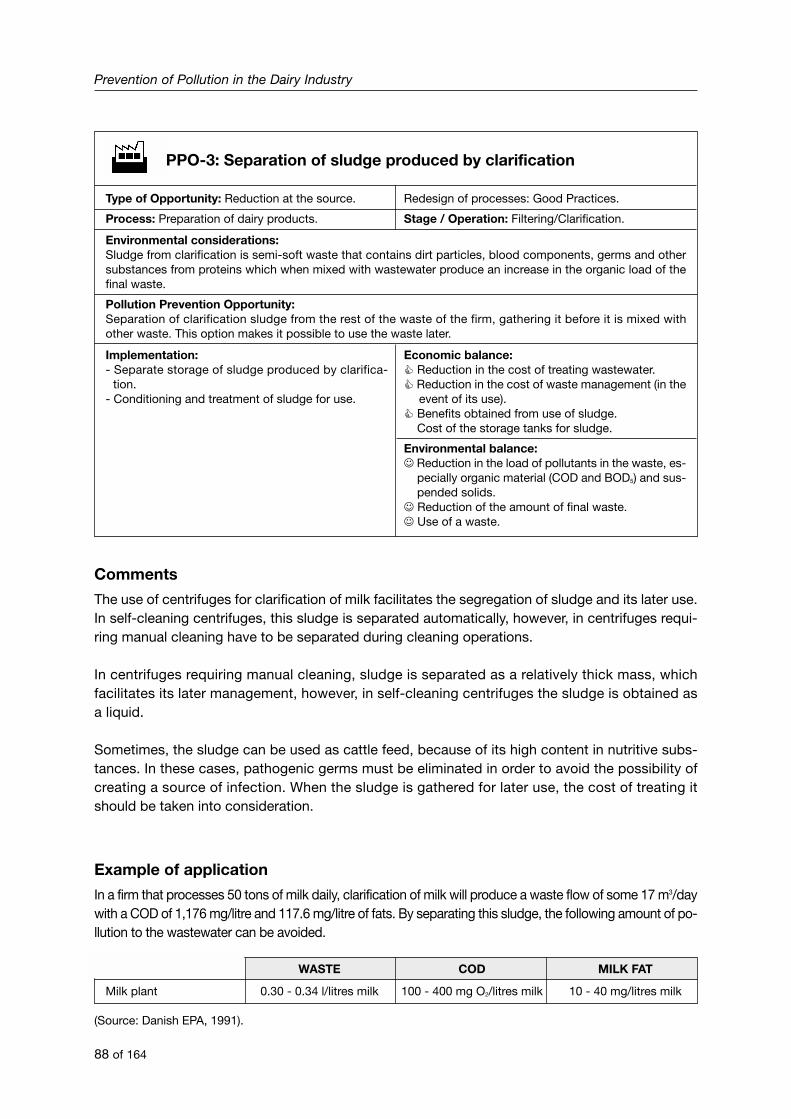
Comments
The use of centrifuges for clarification of milk facilitates the segregation of sludge and its later use.In self-cleaning centrifuges, this sludge is separated automatically, however, in centrifuges requi-ring manual cleaning have to be separated during cleaning operations.
In centrifuges requiring manual cleaning, sludge is separated as a relatively thick mass, whichfacilitates its later management, however, in self-cleaning centrifuges the sludge is obtained asa liquid.
Sometimes, the sludge can be used as cattle feed, because of its high content in nutritive subs-tances. In these cases, pathogenic germs must be eliminated in order to avoid the possibility ofcreating a source of infection. When the sludge is gathered for later use, the cost of treating itshould be taken into consideration.
Example of application
In a firm that processes 50 tons of milk daily, clarification of milk will produce a waste flow of some 17 m3/daywith a COD of 1,176 mg/litre and 117.6 mg/litre of fats. By separating this sludge, the following amount of po-llution to the wastewater can be avoided.
WASTE COD MILK FAT
Milk plant 0.30 - 0.34 l/litres milk 100 - 400 mg O2/litres milk 10 - 40 mg/litres milk
(Source: Danish EPA, 1991).
Prevention of Pollution in the Dairy Industry
88 of 164
PPO-3: Separation of sludge produced by clarification
Environmental considerations: Sludge from clarification is semi-soft waste that contains dirt particles, blood components, germs and othersubstances from proteins which when mixed with wastewater produce an increase in the organic load of thefinal waste.
Pollution Prevention Opportunity:Separation of clarification sludge from the rest of the waste of the firm, gathering it before it is mixed withother waste. This option makes it possible to use the waste later.
Implementation:- Separate storage of sludge produced by clarifica-
tion.- Conditioning and treatment of sludge for use.
Economic balance:� Reduction in the cost of treating wastewater. � Reduction in the cost of waste management (in the
event of its use).� Benefits obtained from use of sludge.� Cost of the storage tanks for sludge.
Environmental balance:☺ Reduction in the load of pollutants in the waste, es-
pecially organic material (COD and BOD5) and sus-pended solids.
☺ Reduction of the amount of final waste. ☺ Use of a waste.
Type of Opportunity: Reduction at the source.
Process: Preparation of dairy products.
Redesign of processes: Good Practices.
Stage / Operation: Filtering/Clarification.
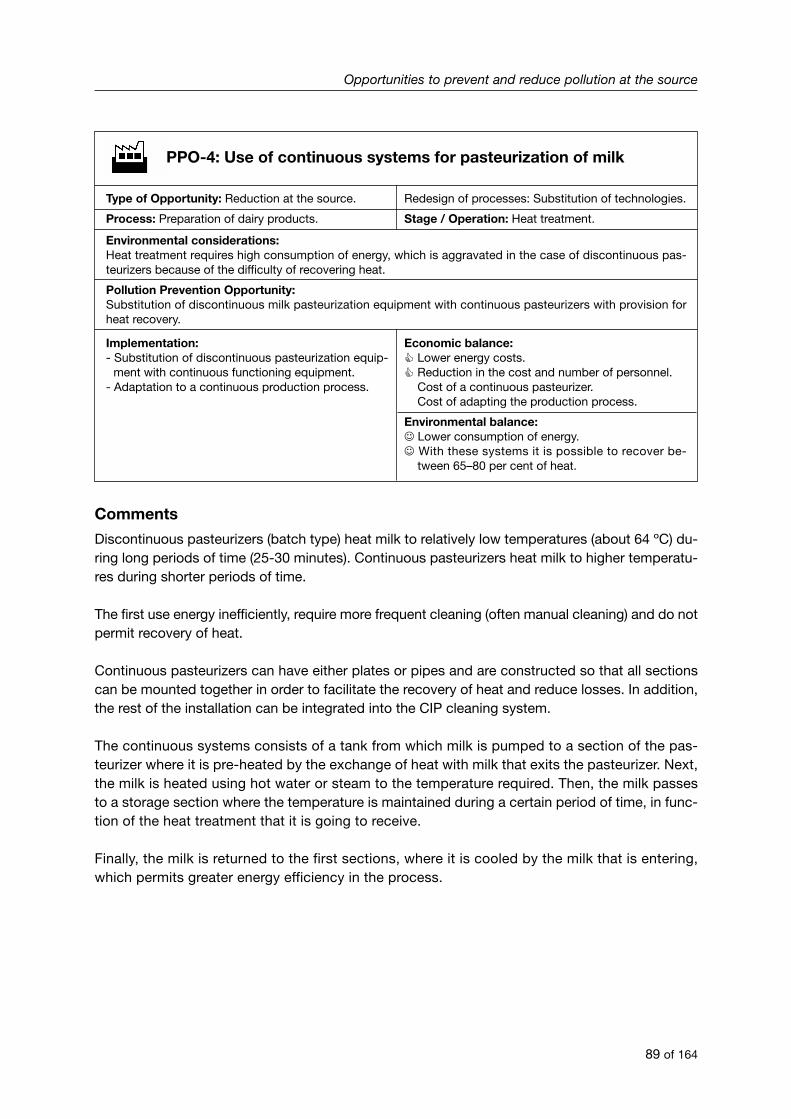
Comments
Discontinuous pasteurizers (batch type) heat milk to relatively low temperatures (about 64 ºC) du-ring long periods of time (25-30 minutes). Continuous pasteurizers heat milk to higher temperatu-res during shorter periods of time.
The first use energy inefficiently, require more frequent cleaning (often manual cleaning) and do notpermit recovery of heat.
Continuous pasteurizers can have either plates or pipes and are constructed so that all sectionscan be mounted together in order to facilitate the recovery of heat and reduce losses. In addition,the rest of the installation can be integrated into the CIP cleaning system.
The continuous systems consists of a tank from which milk is pumped to a section of the pas-teurizer where it is pre-heated by the exchange of heat with milk that exits the pasteurizer. Next,the milk is heated using hot water or steam to the temperature required. Then, the milk passesto a storage section where the temperature is maintained during a certain period of time, in func-tion of the heat treatment that it is going to receive.
Finally, the milk is returned to the first sections, where it is cooled by the milk that is entering,which permits greater energy efficiency in the process.
Opportunities to prevent and reduce pollution at the source
89 of 164
PPO-4: Use of continuous systems for pasteurization of milk
Environmental considerations: Heat treatment requires high consumption of energy, which is aggravated in the case of discontinuous pas-teurizers because of the difficulty of recovering heat.
Pollution Prevention Opportunity:Substitution of discontinuous milk pasteurization equipment with continuous pasteurizers with provision forheat recovery.
Implementation:- Substitution of discontinuous pasteurization equip-
ment with continuous functioning equipment.- Adaptation to a continuous production process.
Economic balance:� Lower energy costs.� Reduction in the cost and number of personnel.� Cost of a continuous pasteurizer.� Cost of adapting the production process.
Environmental balance:☺ Lower consumption of energy.☺ With these systems it is possible to recover be-
tween 65–80 per cent of heat.
Type of Opportunity: Reduction at the source.
Process: Preparation of dairy products.
Redesign of processes: Substitution of technologies.
Stage / Operation: Heat treatment.
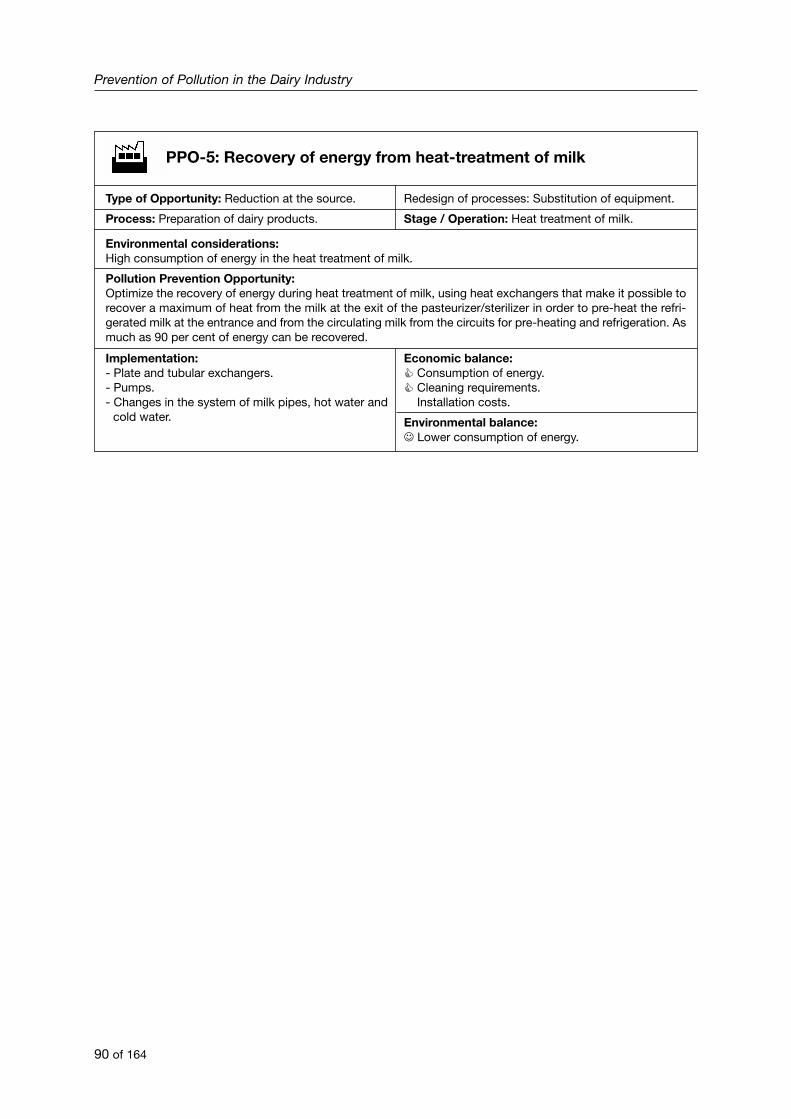
Prevention of Pollution in the Dairy Industry
90 of 164
PPO-5: Recovery of energy from heat-treatment of milk
Environmental considerations: High consumption of energy in the heat treatment of milk.
Pollution Prevention Opportunity:Optimize the recovery of energy during heat treatment of milk, using heat exchangers that make it possible torecover a maximum of heat from the milk at the exit of the pasteurizer/sterilizer in order to pre-heat the refri-gerated milk at the entrance and from the circulating milk from the circuits for pre-heating and refrigeration. Asmuch as 90 per cent of energy can be recovered.
Implementation:- Plate and tubular exchangers.- Pumps.- Changes in the system of milk pipes, hot water and
cold water.
Economic balance:� Consumption of energy.� Cleaning requirements.� Installation costs.
Environmental balance:☺ Lower consumption of energy.
Type of Opportunity: Reduction at the source.
Process: Preparation of dairy products.
Redesign of processes: Substitution of equipment.
Stage / Operation: Heat treatment of milk.
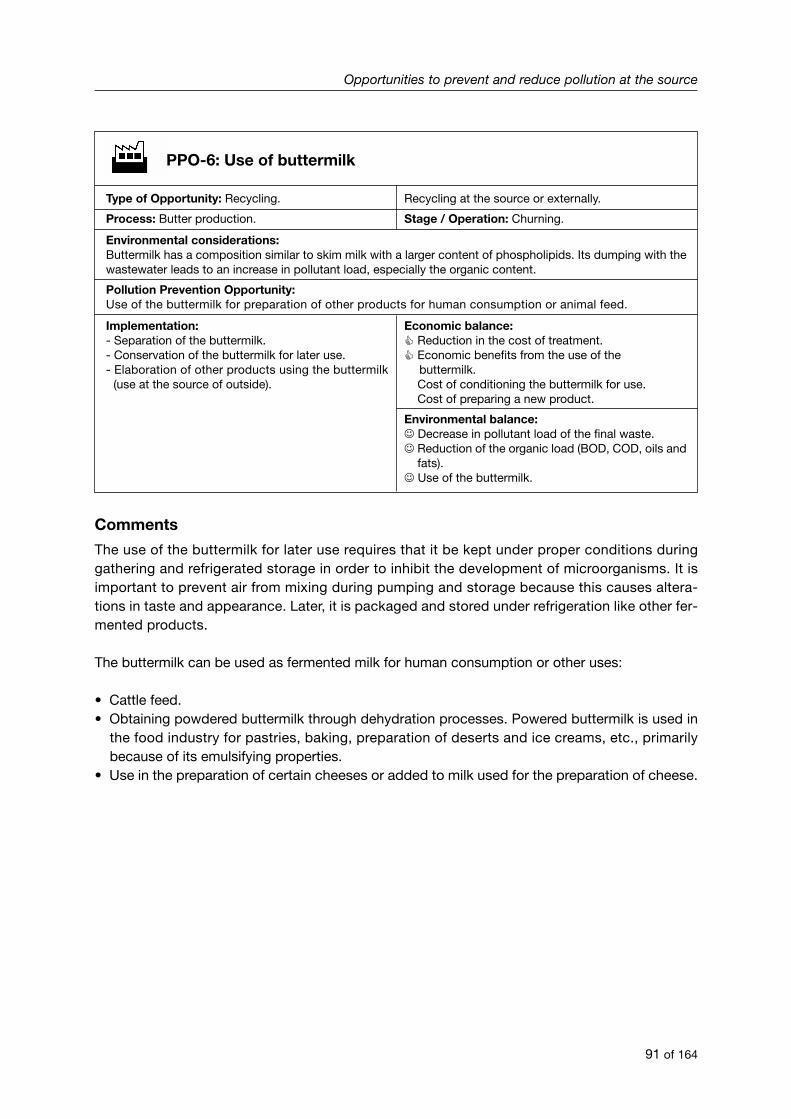
Comments
The use of the buttermilk for later use requires that it be kept under proper conditions duringgathering and refrigerated storage in order to inhibit the development of microorganisms. It isimportant to prevent air from mixing during pumping and storage because this causes altera-tions in taste and appearance. Later, it is packaged and stored under refrigeration like other fer-mented products.
The buttermilk can be used as fermented milk for human consumption or other uses:
• Cattle feed.• Obtaining powdered buttermilk through dehydration processes. Powered buttermilk is used in
the food industry for pastries, baking, preparation of deserts and ice creams, etc., primarilybecause of its emulsifying properties.
• Use in the preparation of certain cheeses or added to milk used for the preparation of cheese.
Opportunities to prevent and reduce pollution at the source
91 of 164
PPO-6: Use of buttermilk
Environmental considerations: Buttermilk has a composition similar to skim milk with a larger content of phospholipids. Its dumping with thewastewater leads to an increase in pollutant load, especially the organic content.
Pollution Prevention Opportunity:Use of the buttermilk for preparation of other products for human consumption or animal feed.
Implementation:- Separation of the buttermilk.- Conservation of the buttermilk for later use.- Elaboration of other products using the buttermilk
(use at the source of outside).
Economic balance:� Reduction in the cost of treatment.� Economic benefits from the use of the
buttermilk.� Cost of conditioning the buttermilk for use.� Cost of preparing a new product.
Environmental balance:☺ Decrease in pollutant load of the final waste.☺ Reduction of the organic load (BOD, COD, oils and
fats).☺ Use of the buttermilk.
Type of Opportunity: Recycling.
Process: Butter production.
Recycling at the source or externally.
Stage / Operation: Churning.
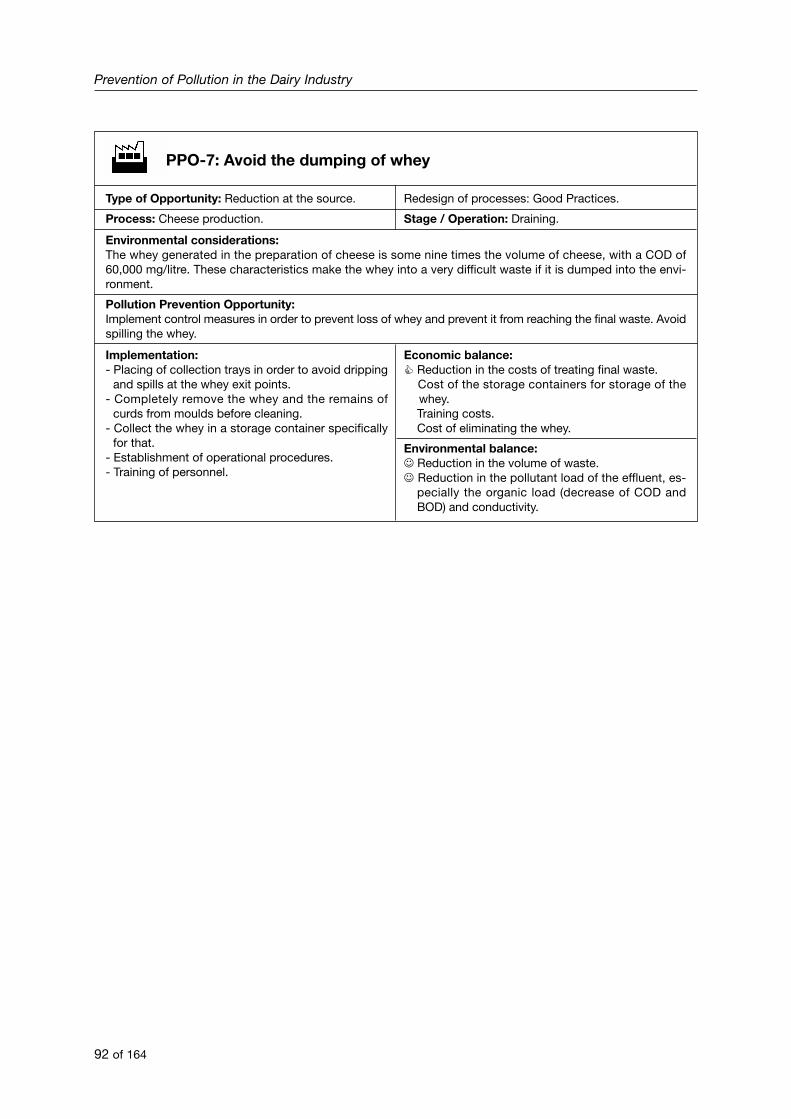
Prevention of Pollution in the Dairy Industry
92 of 164
PPO-7: Avoid the dumping of whey
Environmental considerations: The whey generated in the preparation of cheese is some nine times the volume of cheese, with a COD of60,000 mg/litre. These characteristics make the whey into a very difficult waste if it is dumped into the envi-ronment.
Pollution Prevention Opportunity:Implement control measures in order to prevent loss of whey and prevent it from reaching the final waste. Avoidspilling the whey.
Implementation:- Placing of collection trays in order to avoid dripping
and spills at the whey exit points.- Completely remove the whey and the remains of
curds from moulds before cleaning.- Collect the whey in a storage container specifically
for that.- Establishment of operational procedures.- Training of personnel.
Economic balance:� Reduction in the costs of treating final waste.� Cost of the storage containers for storage of the
whey.� Training costs.� Cost of eliminating the whey.
Environmental balance:☺ Reduction in the volume of waste.☺ Reduction in the pollutant load of the effluent, es-
pecially the organic load (decrease of COD andBOD) and conductivity.
Type of Opportunity: Reduction at the source.
Process: Cheese production.
Redesign of processes: Good Practices.
Stage / Operation: Draining.

Comments
Given that the production of whey can reach some nine times the amount of cheese produced, itscontribution to total wastewater is of great importance, both in terms of its volume and high con-centration of organic material, reaches more than 60,000 mg COD/litre (F. Omil and F. Morales, 1996).
In the following figure alternatives to the dumping of whey are shown:
Figure 54ALTERNATIVE USES OF WHEY
Opportunities to prevent and reduce pollution at the source
93 of 164
PPO-8: Use of whey
Environmental considerations: The whey recovered during processing should be used in order to cause as little impact on the environment aspossible. Other activities associated with its use, such as transportation to place of use or its concentrationin situ in order to decrease its volume and reduce transportation costs should also be taken into account in theoverall approach to dealing with whey.
Pollution Prevention Opportunity:Use of whey for preparing other products, animal feed or obtaining increments of value added, such as lacto-se or proteins.
Implementation:- Identification of alternative uses.- Evaluation of alternatives (technical and economic
evaluation).- Selection of alternatives.- Implementation of the option chosen.
Economic balance:� Reduction in the cost of treating final waste.� Economic benefits derived from use of the whey.� Cost of the study of alternatives and their imple-
mentation.� Cost of equipment.� Personnel costs.
Environmental balance:☺ Reduction of volume of final waste. ☺ Reduction of pollutant load in the effluent, especially
the organic content (decrease of COD and BOD)and conductivity.
☺ Use of waste.
Type of Opportunity: Use and external recycling.
Process: Cheese production. Stage / Operation: Draining.
WHEY
Recycling
Animalfeed
Preparationof drinks
Fermentation Concentration
Use as energy
Animal feed Use of ingredients
The following aspects should be kept in mind before choosing any option:
• Separation of the whey;• Analysis;• Study of possible alternatives to dumping;• Technical and economic ranking of the alternatives;• Selection of alternatives;• Implementation of the chosen alternative.
Animal feed
Traditionally, whey has been used for directly feeding animals, primarily pigs; with 12 kilos of wheybeing the equivalent of approximately one kilo of barley (A. Fernández and M. Díaz, 1995).Nonetheless, the high content in lactose of the whey can cause digestive problems in certain ani-mals because of a lack of lactase (the enzyme that hydrolyses lactose). This is the case of youngcalves, in which this problem occurs if they have an excess of lactose in their diet. Furthermore,the whey has a low content of nitrogenous substances; as a result its use in excessive amountsin animal feed can cause nutritional imbalances.
For this reason, it is recommended that a study be carried out on the diet with a supplement in ce-real ration of correctors and concentrated feed in order to counteract these deficiencies.
If this possibility is adopted, the following considerations should be taken into account:
• Separation of the whey;• Analysis of the whey;• Selection of potential users (cattle centres) for the whey;• Adaptation of the animals’ diet;• Cost of transporting the whey;• Requirements and cost of conditioning the whey for its transportation and use (whenever ne-
cessary).
Depending on the cost of transportation, concentration of the whey at the dairy firm can be profi-table.
Preparation of drinks from whey
Another possibility for use of whey is the preparation of drinks from buttermilk.
The main inconvenience in using whey to prepare drinks is its high lactose content, which is diffi-cult to digest, and gives it a characteristic taste that is unacceptable to consumers. In order toavoid these problems, drinks made from whey are prepared with a low lactose content and withthe addition of fruit aromas that improve taste. These products should be sterilized and packa-ged aseptically in order to guarantee proper conservation.
Prevention of Pollution in the Dairy Industry
94 of 164

Concentration of whey
Given the high percentage of water in whey, it may be convenient to remove it or reduce it throughconcentration in order to decrease transportation costs and facilitate obtaining elements of thewhey.
Concentration can be carried out in evaporators with various effects of low pressure or inverse os-mosis. This operation takes place in the plant of the dairy enterprise, in attempting to reduce thevolume of whey in order to minimize transportation expenses to places of final use.
Obtaining parts of the whey
Traditionally, industrial use of the whey has been based on the recovery of the parts of greatest use fromthe industrial point of view, principally proteins and lactose.
The installation of a plant to recover parts of the whey is a viable alternative in the case of large indus-tries with high volumes of whey, because for small industries there is a high economic cost.
Demineralisation of the whey is unattractive, but does make it possible to increase the possibilities foruse of certain elements of the whey.
a.1) Obtaining protein
Whey contains an average of 0.8 per cent proteins, representing between 15 and 22 percent of total proteins in milk. It also contains a waste variable of casein agglomerates that en-ter the whey during the process of separating the curds and whey from the milk.
The recovered proteins can be incorporated back into the cheese-making process or be usedin other industrial processes (bread baking, pastries, preparation of diet foods or in the pre-paration of pharmaceutical products).
A third option for use of the proteins is their separation and purification. Pure proteins of hig-her commercial value can thus be obtained.
a.2) Obtaining lactose
Lactose is the most abundant component of whey. Its characteristics permit its use in phar-maceutical products (as an excipient) and diet products (as a sweetener). In addition, thelactose can serve as a substratum for a large variety of microorganisms, so it is used forexample in the production of penicillin and other antibiotics.
Fermentation of whey
Lactose represents a source of energy for the fermentation processes of many microorganisms.Through fermentation of the whey, the lactose content is lowered and as a result the BOD5 is lo-wered.
Fermentation of the microorganisms produces CO2 and ethanol. In addition, it is possible to ob-tain lactic acid from the lactose, which can be used as a food additive, and in function of the de-
Opportunities to prevent and reduce pollution at the source
95 of 164
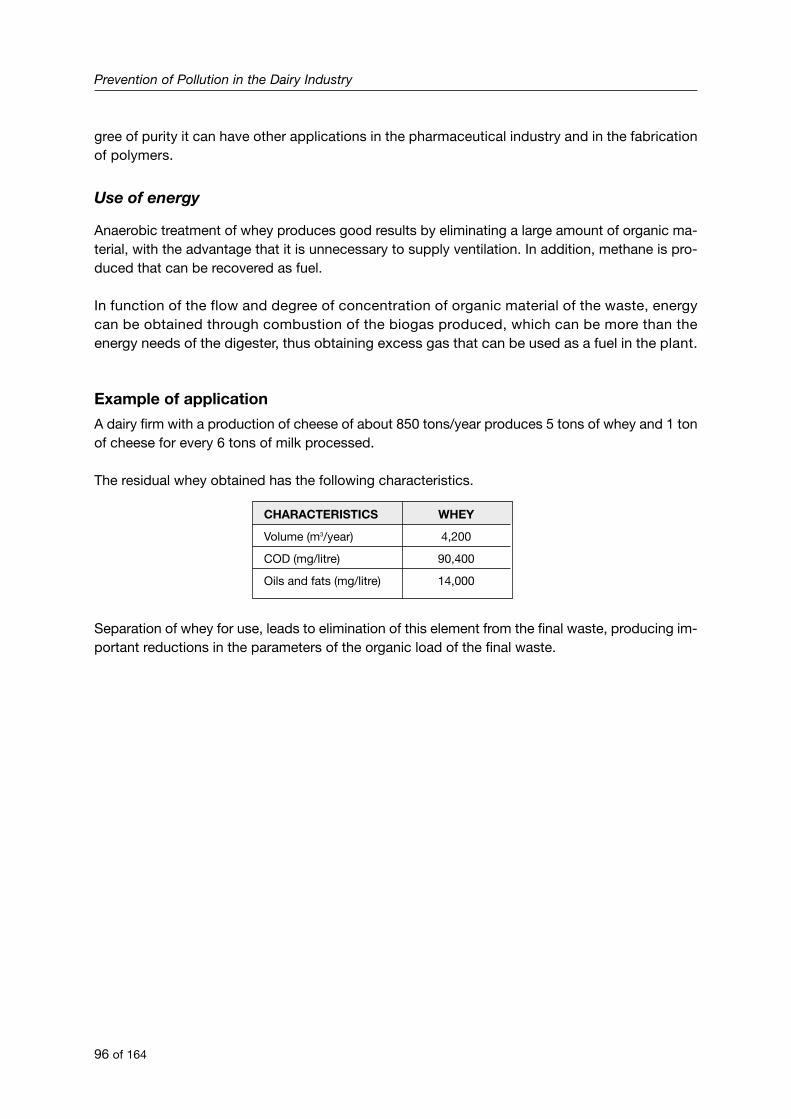
gree of purity it can have other applications in the pharmaceutical industry and in the fabricationof polymers.
Use of energy
Anaerobic treatment of whey produces good results by eliminating a large amount of organic ma-terial, with the advantage that it is unnecessary to supply ventilation. In addition, methane is pro-duced that can be recovered as fuel.
In function of the flow and degree of concentration of organic material of the waste, energycan be obtained through combustion of the biogas produced, which can be more than theenergy needs of the digester, thus obtaining excess gas that can be used as a fuel in the plant.
Example of application
A dairy firm with a production of cheese of about 850 tons/year produces 5 tons of whey and 1 tonof cheese for every 6 tons of milk processed.
The residual whey obtained has the following characteristics.
CHARACTERISTICS WHEY
Volume (m3/year) 4,200
COD (mg/litre) 90,400
Oils and fats (mg/litre) 14,000
Separation of whey for use, leads to elimination of this element from the final waste, producing im-portant reductions in the parameters of the organic load of the final waste.
Prevention of Pollution in the Dairy Industry
96 of 164
Comments
There are several ways to carry out the salting operation. This is one of the factors that most in-fluences the characteristics of the final product.
In the case of dry application of the salt, it is rubbed or spread evenly over the surface of thecheese to which it adheres. With this procedure for salting, there is heavy use of salt, in somecases as much as 7 kilos of salt for every 100 kilos of cheese and a longer period is requiredfor salting.
Dry removal of the salt has no effect on the final product but presents important advantages for theenvironment and for the dairy firm because the salt can be reused as long as proper hygienic con-ditions are maintained.
Manual removal of the salt does not efficiently remove the salt stuck to the surface of the cheese.In these cases, automatic systems for dry elimination of the salt from the surface of the cheese canconsiderably improve the efficiency of the removal.
Opportunities to prevent and reduce pollution at the source
97 of 164
PPO-9: Dry elimination of salt from cheese after salting
Environmental considerations:The salt used in salting cheese makes the wastewater highly conductive.
Pollution Prevention Opportunity:Initial elimination of dry salt from the surface of the cheese or in place of the use of water.
Implementation:- Use of machines (brushes or brushes and aspiration
of the salt) for dry elimination of the salt.- Establishment of operational procedures.- Training of personnel.
Economic balance:� Reduction of wastewater treatment costs.� Reduction in the cost of salting.� Lower cost of materials (salt).� Personnel costs. � Cost of eliminating solid waste.
Environmental balance:☺ Reduction of pollutant load in the wastewater, es-
pecially conductivity.☺ Reduction in the consumption of resources.
Type of Opportunity: Reduction at the source.
Process: Cheese production.
Redesign of processes: Good Practices.
Stage / Operation: Salting.
Comments
Immersion in brine is one of the methods most used in the salting of cheese because it permitseven salting, reduces labour and can be easily integrated into very mechanized systems de pro-duction. The use of salt is lower than when it is applied dry, between 3 and 4 kilos for each 100kilos of cheese.
The brine is composed of water and sodium chloride, but during the salting, there is an exchangebetween the brine and the cheese. As a result of this exchange, the brine takes on soluble subs-tances from the cheese (soluble proteins, mineral salts, lactose, lactic acid, etc.). Microbiologicalcontamination of the brine can also occur. The microorganisms can come from the natural floraof the cheese, in which case there are no problems, or from other sources (personnel, materials,water, etc.) causing changes in the cheese during aging that prevent the cheese from acquiring thedesired characteristics.
In order to ensure optimum conditions for salting, it is necessary that the brine be adequaterequiring the creation of controls that guarantee the physical, chemical and microbiological con-ditions of the brine. This control should take into account the following considerations:
• The water and salt used for the brine should be free from any pollution because it enters into di-rect contact with the cheese;
• Control of the pH, temperature and duration of salting in function of the type of cheese that isbeing prepared;
• Maintaining an adequate concentration of salt in order to obtain optimum salting;
Prevention of Pollution in the Dairy Industry
98 of 164
PPO-10: Physical-chemical and microbiological control of brinesused for salting cheese
Environmental considerations: The brines used to salt cheese have a high conductivity, a characteristic that they transmit to the wastewaterwhen they are dumped together. In addition, any deteriorated brine generates waste in the form of rejected pro-ducts.
Pollution Prevention Opportunity:Creation of a system for controlling the physical, chemical and microbiological parameters of brines, making itpossible to determine the degree of aging of the brines and obtain optimum salting of the cheese.
Implementation:- Establishment of specifications for use of brines for
salting cheese.- Operational procedures.- Equipment for control and analysis.- Trained personnel.
Economic balance:� Reduction in the cost of elimination of waste and
treatment costs.� Savings in the cost of elaborating rejected final pro-
ducts.� Reduction of the cost of raw materials (optimisation
of the consumption of brine).� Cost of the equipment for control and/or analy-
sis. � Personnel costs.
Environmental balance:☺ Reduction in the consumption of water.☺ Reduction of the final amount of waste. ☺ Decrease of waste from rejected products.
Type of Opportunity: Reduction at the source.
Process: Cheese production.
Redesign of processes: Good Practices.
Stage / Operation: Salting.
• Adequate calcium content of the brine in order to promote drying of the rind;• Elimination of cheese particles;• Maintaining the presence of microorganisms as low as possible;• Elimination or treatment of brine contaminated with undesirable microorganisms.
For carrying out these controls, both simple methods of sampling and laboratory analysis as wellas the installation of automatic equipment for measuring the parameters of the brine and auto-matic dosage can be used.
Opportunities to prevent and reduce pollution at the source
99 of 164
Comments
The elimination of large quantities of brine together with final effluent generates environmental pro-blems because these brines are rich in suspended particles, microorganisms, calcium salts,magnesium, lactose, lactic acid, etc. This leads to an increase in the amount of organic load andconductivity of the final waste.
Separation of the brines from the rest of the waste of the plant makes it possible to treat it for possi-ble reuse at the source or its recycling in other processes.
Filtering techniques using membranes make it possible to eliminate the microorganisms present inthe brine and separate other parts such as suspended particles and salts.
Once the brine is treated with these techniques, it is possible to reuse them in the same processcompensating for loss of salts that are produced during recovery.
Prevention of Pollution in the Dairy Industry
100 of 164
PPO-11: Recovery of brine
Environmental considerations: For the preparation of brine, large quantities of salt and water are used. Dumping it into the environment cau-ses heavy environmental impact.
Pollution Prevention Opportunity:Use of filtering techniques for the recovery of brine.
Implementation:- Selection of a filtering system.- Operational procedures.- Trained personnel.
Economic balance:� Reduction in the use of water. � Reduction in the use of salt.� Cost of the filtering equipment.� Cost of the energy for running the equipment.� Maintenance costs.� Personnel costs.
Environmental balance:☺ Reduction in the consumption of water.☺ Reduction of the final volume of waste.� Consumption of energy.
Type of Opportunity: Reduction at the source.
Process: Cheese production.
Redesign of processes: New technologies.
Stage / Operation: Salting.
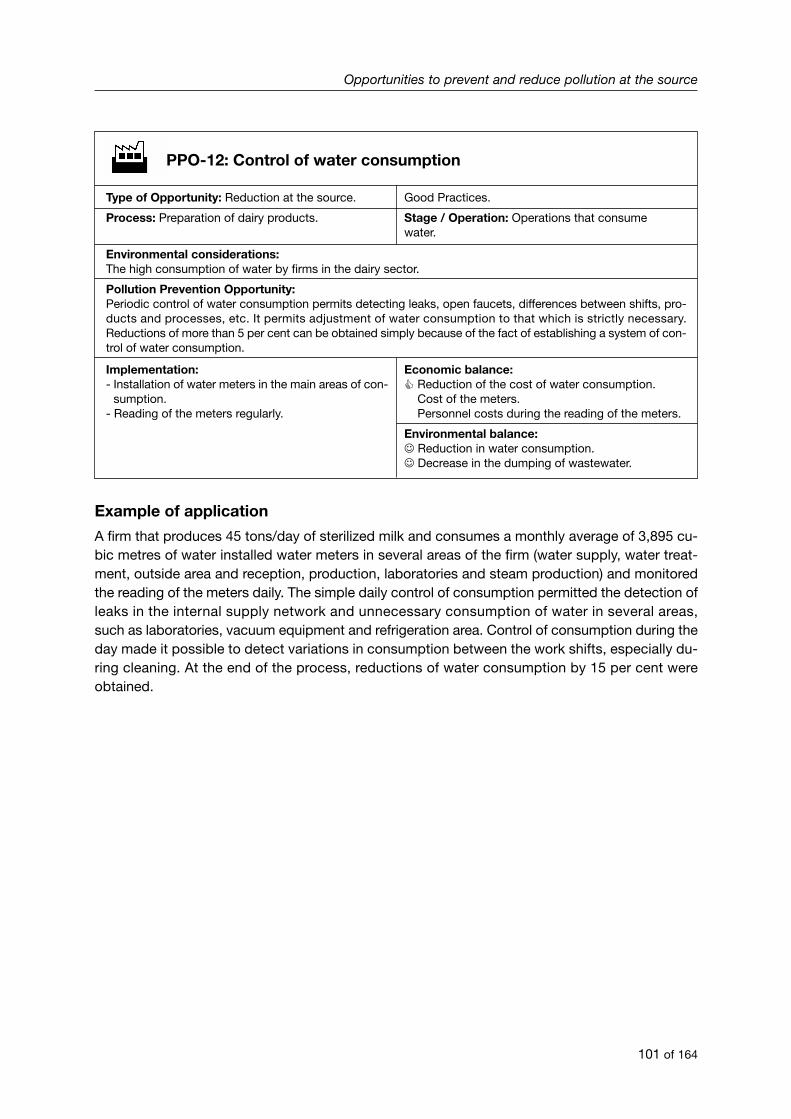
Example of application
A firm that produces 45 tons/day of sterilized milk and consumes a monthly average of 3,895 cu-bic metres of water installed water meters in several areas of the firm (water supply, water treat-ment, outside area and reception, production, laboratories and steam production) and monitoredthe reading of the meters daily. The simple daily control of consumption permitted the detection ofleaks in the internal supply network and unnecessary consumption of water in several areas,such as laboratories, vacuum equipment and refrigeration area. Control of consumption during theday made it possible to detect variations in consumption between the work shifts, especially du-ring cleaning. At the end of the process, reductions of water consumption by 15 per cent wereobtained.
Opportunities to prevent and reduce pollution at the source
101 of 164
PPO-12: Control of water consumption
Environmental considerations: The high consumption of water by firms in the dairy sector.
Pollution Prevention Opportunity:Periodic control of water consumption permits detecting leaks, open faucets, differences between shifts, pro-ducts and processes, etc. It permits adjustment of water consumption to that which is strictly necessary.Reductions of more than 5 per cent can be obtained simply because of the fact of establishing a system of con-trol of water consumption.
Implementation:- Installation of water meters in the main areas of con-
sumption.- Reading of the meters regularly.
Economic balance:� Reduction of the cost of water consumption.� Cost of the meters.� Personnel costs during the reading of the meters.
Environmental balance:☺ Reduction in water consumption.☺ Decrease in the dumping of wastewater.
Type of Opportunity: Reduction at the source.
Process: Preparation of dairy products.
Good Practices.
Stage / Operation: Operations that consumewater.
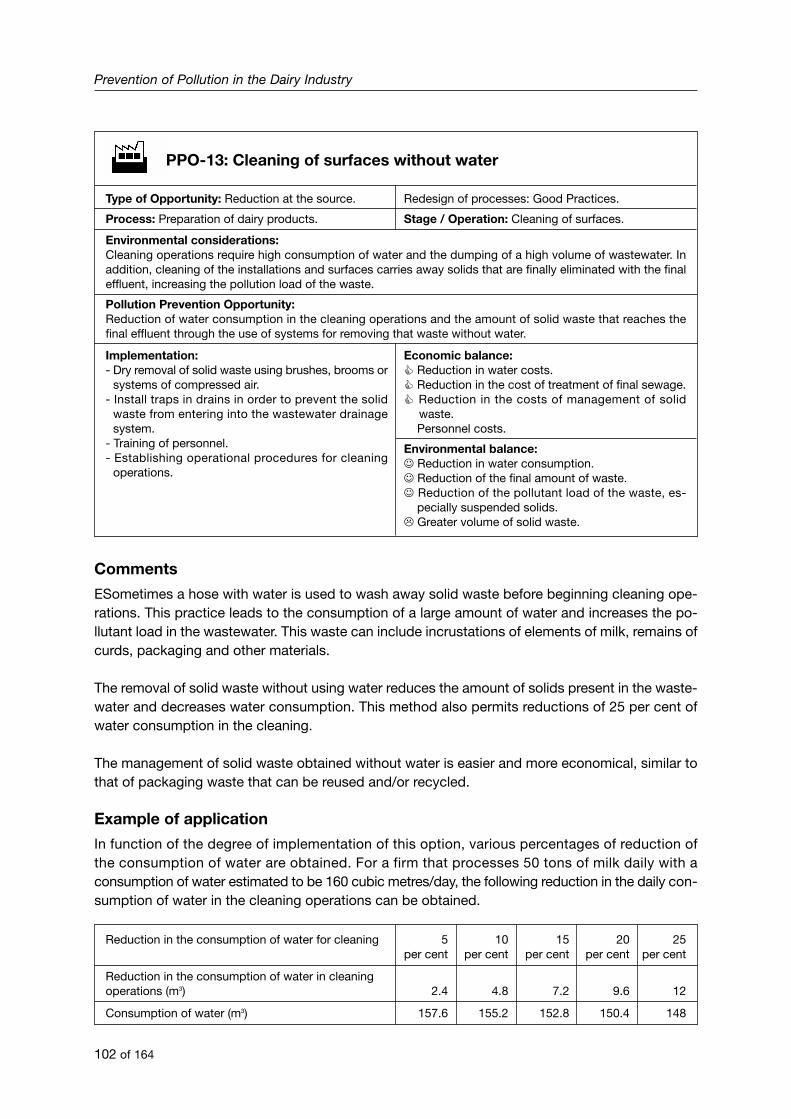
Comments
ESometimes a hose with water is used to wash away solid waste before beginning cleaning ope-rations. This practice leads to the consumption of a large amount of water and increases the po-llutant load in the wastewater. This waste can include incrustations of elements of milk, remains ofcurds, packaging and other materials.
The removal of solid waste without using water reduces the amount of solids present in the waste-water and decreases water consumption. This method also permits reductions of 25 per cent ofwater consumption in the cleaning.
The management of solid waste obtained without water is easier and more economical, similar tothat of packaging waste that can be reused and/or recycled.
Example of application
In function of the degree of implementation of this option, various percentages of reduction ofthe consumption of water are obtained. For a firm that processes 50 tons of milk daily with aconsumption of water estimated to be 160 cubic metres/day, the following reduction in the daily con-sumption of water in the cleaning operations can be obtained.
Reduction in the consumption of water for cleaning 5 10 15 20 25per cent per cent per cent per cent per cent
Reduction in the consumption of water in cleaningoperations (m3) 2.4 4.8 7.2 9.6 12
Consumption of water (m3) 157.6 155.2 152.8 150.4 148
Prevention of Pollution in the Dairy Industry
102 of 164
PPO-13: Cleaning of surfaces without water
Environmental considerations: Cleaning operations require high consumption of water and the dumping of a high volume of wastewater. Inaddition, cleaning of the installations and surfaces carries away solids that are finally eliminated with the finaleffluent, increasing the pollution load of the waste.
Pollution Prevention Opportunity:Reduction of water consumption in the cleaning operations and the amount of solid waste that reaches thefinal effluent through the use of systems for removing that waste without water.
Implementation:- Dry removal of solid waste using brushes, brooms or
systems of compressed air.- Install traps in drains in order to prevent the solid
waste from entering into the wastewater drainagesystem.
- Training of personnel.- Establishing operational procedures for cleaning
operations.
Economic balance:� Reduction in water costs.� Reduction in the cost of treatment of final sewage.� Reduction in the costs of management of solid
waste.� Personnel costs.
Environmental balance:☺ Reduction in water consumption.☺ Reduction of the final amount of waste. ☺ Reduction of the pollutant load of the waste, es-
pecially suspended solids. � Greater volume of solid waste.
Type of Opportunity: Reduction at the source.
Process: Preparation of dairy products.
Redesign of processes: Good Practices.
Stage / Operation: Cleaning of surfaces.
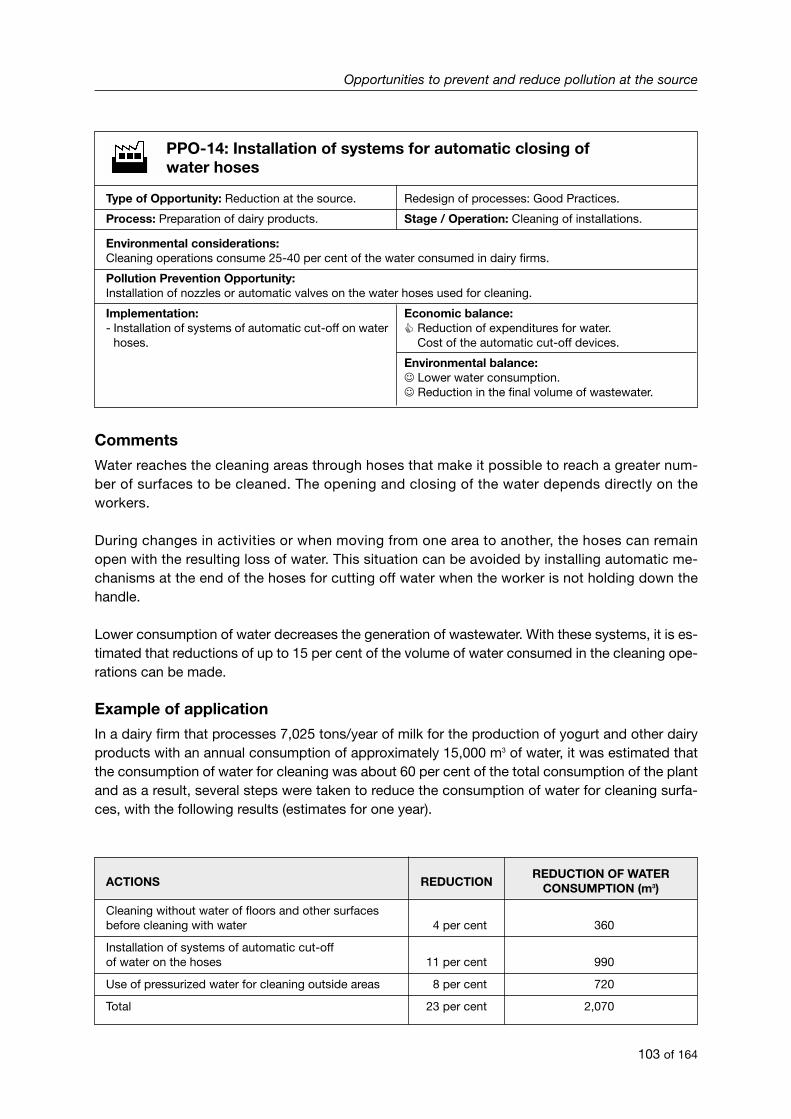
Comments
Water reaches the cleaning areas through hoses that make it possible to reach a greater num-ber of surfaces to be cleaned. The opening and closing of the water depends directly on theworkers.
During changes in activities or when moving from one area to another, the hoses can remainopen with the resulting loss of water. This situation can be avoided by installing automatic me-chanisms at the end of the hoses for cutting off water when the worker is not holding down thehandle.
Lower consumption of water decreases the generation of wastewater. With these systems, it is es-timated that reductions of up to 15 per cent of the volume of water consumed in the cleaning ope-rations can be made.
Example of application
In a dairy firm that processes 7,025 tons/year of milk for the production of yogurt and other dairyproducts with an annual consumption of approximately 15,000 m3 of water, it was estimated thatthe consumption of water for cleaning was about 60 per cent of the total consumption of the plantand as a result, several steps were taken to reduce the consumption of water for cleaning surfa-ces, with the following results (estimates for one year).
ACTIONS REDUCTIONREDUCTION OF WATER
CONSUMPTION (m3)
Cleaning without water of floors and other surfacesbefore cleaning with water 4 per cent 360
Installation of systems of automatic cut-offof water on the hoses 11 per cent 990
Use of pressurized water for cleaning outside areas 8 per cent 720
Total 23 per cent 2,070
Opportunities to prevent and reduce pollution at the source
103 of 164
PPO-14: Installation of systems for automatic closing ofwater hoses
Environmental considerations: Cleaning operations consume 25-40 per cent of the water consumed in dairy firms.
Pollution Prevention Opportunity:Installation of nozzles or automatic valves on the water hoses used for cleaning.
Implementation:- Installation of systems of automatic cut-off on water
hoses.
Economic balance:� Reduction of expenditures for water.� Cost of the automatic cut-off devices.
Environmental balance:☺ Lower water consumption.☺ Reduction in the final volume of wastewater.
Type of Opportunity: Reduction at the source.
Process: Preparation of dairy products.
Redesign of processes: Good Practices.
Stage / Operation: Cleaning of installations.
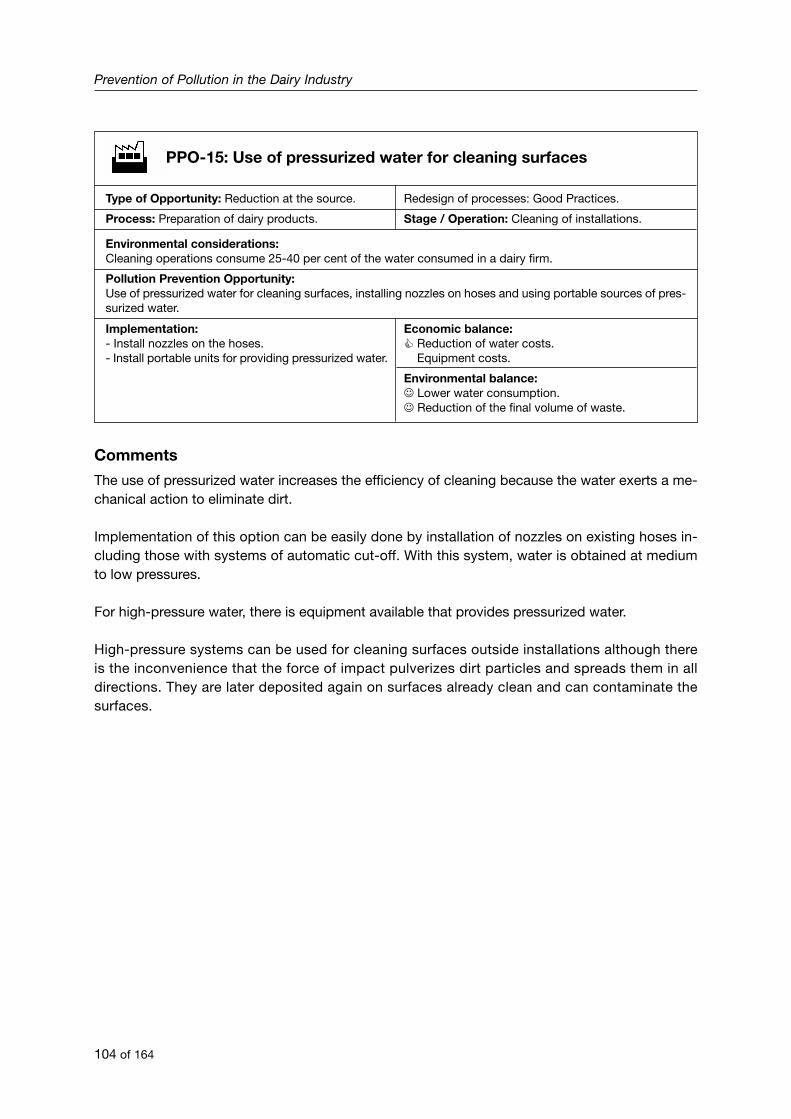
Comments
The use of pressurized water increases the efficiency of cleaning because the water exerts a me-chanical action to eliminate dirt.
Implementation of this option can be easily done by installation of nozzles on existing hoses in-cluding those with systems of automatic cut-off. With this system, water is obtained at mediumto low pressures.
For high-pressure water, there is equipment available that provides pressurized water.
High-pressure systems can be used for cleaning surfaces outside installations although thereis the inconvenience that the force of impact pulverizes dirt particles and spreads them in alldirections. They are later deposited again on surfaces already clean and can contaminate thesurfaces.
Prevention of Pollution in the Dairy Industry
104 of 164
PPO-15: Use of pressurized water for cleaning surfaces
Environmental considerations:Cleaning operations consume 25-40 per cent of the water consumed in a dairy firm.
Pollution Prevention Opportunity:Use of pressurized water for cleaning surfaces, installing nozzles on hoses and using portable sources of pres-surized water.
Implementation:- Install nozzles on the hoses.- Install portable units for providing pressurized water.
Economic balance:� Reduction of water costs.� Equipment costs.
Environmental balance:☺ Lower water consumption.☺ Reduction of the final volume of waste.
Type of Opportunity: Reduction at the source.
Process: Preparation of dairy products.
Redesign of processes: Good Practices.
Stage / Operation: Cleaning of installations.
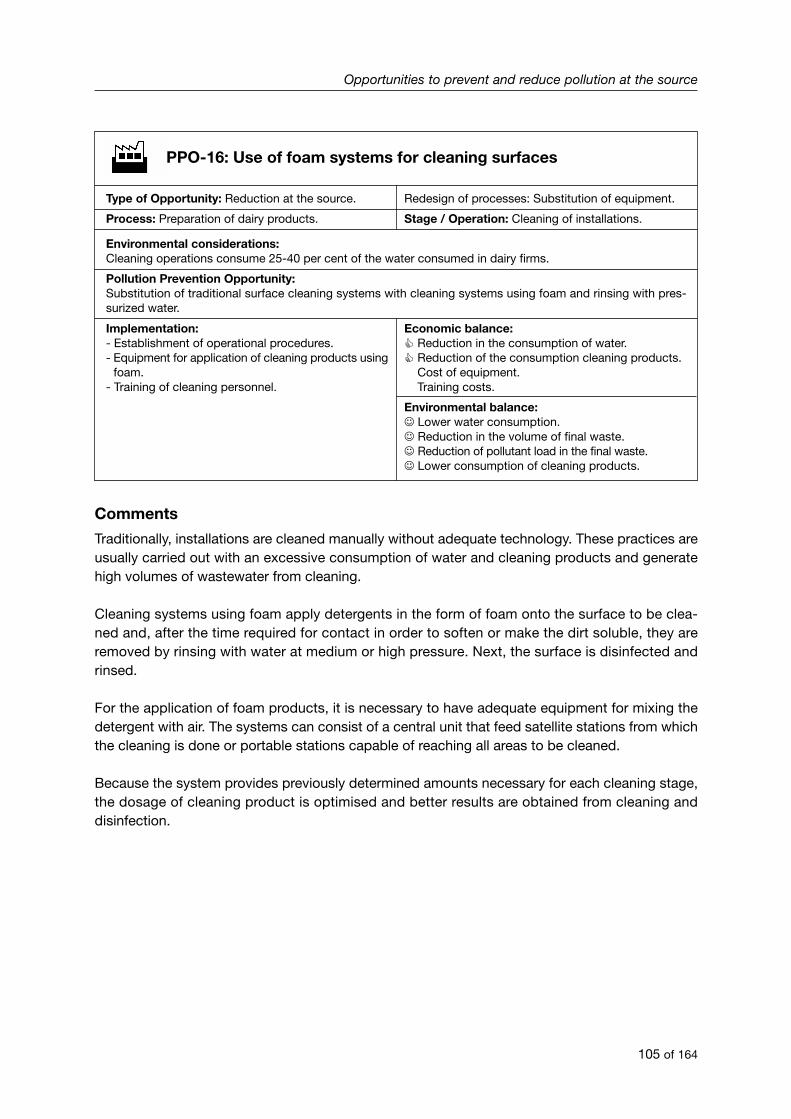
Comments
Traditionally, installations are cleaned manually without adequate technology. These practices areusually carried out with an excessive consumption of water and cleaning products and generatehigh volumes of wastewater from cleaning.
Cleaning systems using foam apply detergents in the form of foam onto the surface to be clea-ned and, after the time required for contact in order to soften or make the dirt soluble, they areremoved by rinsing with water at medium or high pressure. Next, the surface is disinfected andrinsed.
For the application of foam products, it is necessary to have adequate equipment for mixing thedetergent with air. The systems can consist of a central unit that feed satellite stations from whichthe cleaning is done or portable stations capable of reaching all areas to be cleaned.
Because the system provides previously determined amounts necessary for each cleaning stage,the dosage of cleaning product is optimised and better results are obtained from cleaning anddisinfection.
Opportunities to prevent and reduce pollution at the source
105 of 164
PPO-16: Use of foam systems for cleaning surfaces
Environmental considerations: Cleaning operations consume 25-40 per cent of the water consumed in dairy firms.
Pollution Prevention Opportunity:Substitution of traditional surface cleaning systems with cleaning systems using foam and rinsing with pres-surized water.
Implementation:- Establishment of operational procedures.- Equipment for application of cleaning products using
foam.- Training of cleaning personnel.
Economic balance:� Reduction in the consumption of water.� Reduction of the consumption cleaning products.� Cost of equipment.� Training costs.
Environmental balance:☺ Lower water consumption.☺ Reduction in the volume of final waste.☺ Reduction of pollutant load in the final waste.☺ Lower consumption of cleaning products.
Type of Opportunity: Reduction at the source.
Process: Preparation of dairy products.
Redesign of processes: Substitution of equipment.
Stage / Operation: Cleaning of installations.
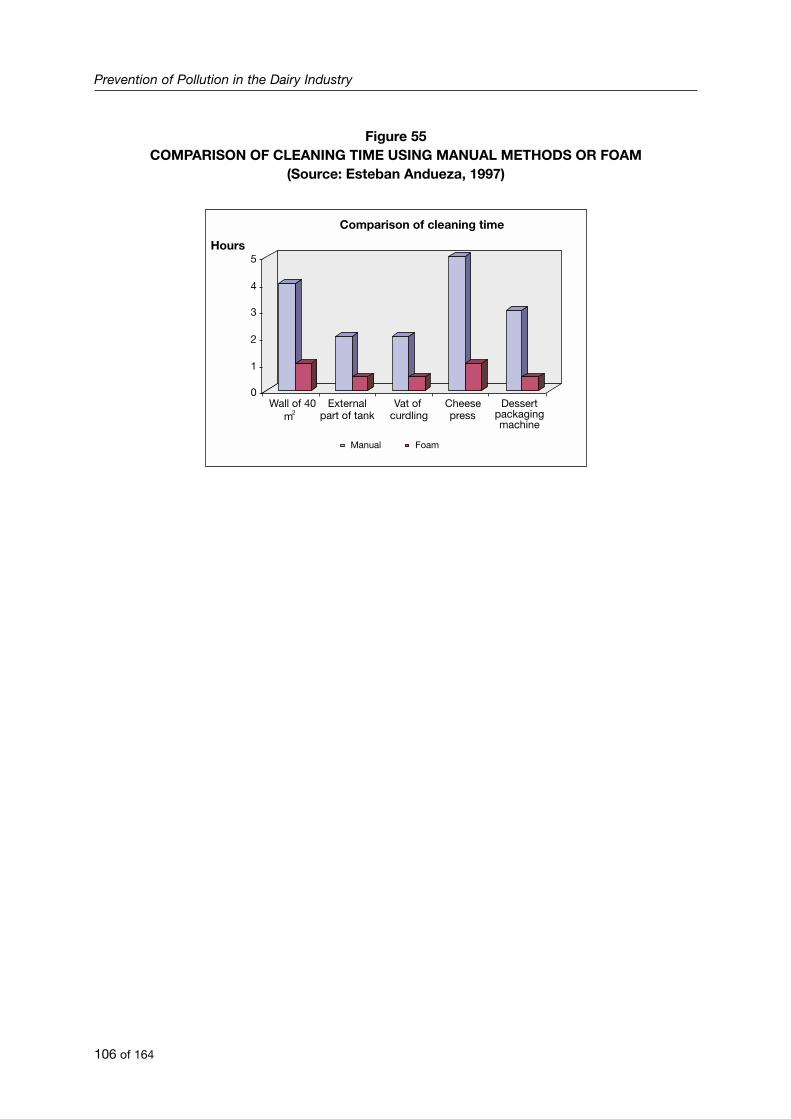
Figure 55COMPARISON OF CLEANING TIME USING MANUAL METHODS OR FOAM
(Source: Esteban Andueza, 1997)
Prevention of Pollution in the Dairy Industry
106 of 164
Hours
Comparison of cleaning time
Manual Foam
0
1
2
3
4
5
Wall of 40 Externalpart of tank
Vat ofcurdling
Cheesepress
Dessertpackagingmachine
m2

Opportunities to prevent and reduce pollution at the source
107 of 164
Comments
Traditional cleaning methods for equipment and pipes consist in dismounting and manual cleaningof parts. These systems are characterized by their low efficiency, high labour cost and the long pe-riods during which production is stopped.
CIP systems (cleaning in place) consist in sequentially passing cleaning products, disinfection andrinsing through pipes and inside the machines. These systems permit greater efficiency in cleaning,decrease the time used and minimize environmental impact.
Complete CIP cleaning in a dairy industry is usually composed of the following stages:
• Initial rinsing;• Detergent phase with a caustic agent to remove organic residues;• Intermediate rinsing;• Scrubbing phase with an acidic agent for elimination of calcareous deposits;• Intermediate rinsing;• Disinfection of installations;• Final rinsing.
The main unit of a CIP system consists of storage tanks for concentrated detergents, reservoirs ofclean water, re-circulation pumps, tanks for recovering the water used for washing (if it is recove-red) and other systems for the preparation of cleaning solutions.
PPO-17: Use of CIP cleaning systems
Environmental considerations: Cleaning operations consume between 25 and 40 per cent of the water consumed by a dairy firm.
Pollution Prevention Opportunity:Substitution of traditional cleaning methods by equipment with CIP cleaning systems with closed circuit cir-culation.
Implementation:- Installation of CIP cleaning equipment.- Training of personnel.- Operational procedures.- Possibility to re-use rinsing water and other solu-
tions.
Economic balance:� Reduction in the consumption of water.� Reduction in personnel costs. � Cost of energy.
Environmental balance:☺ Lower water consumption.☺ Reduction in the volume of wastewater.☺ Less packaging of cleaning products.� Greater consumption of energy.
Type of Opportunity: Reduction at the source.
Process: Preparation of dairy products.
Redesign of processes: Substitution of technology.
Stage / Operation: Cleaning of installations.
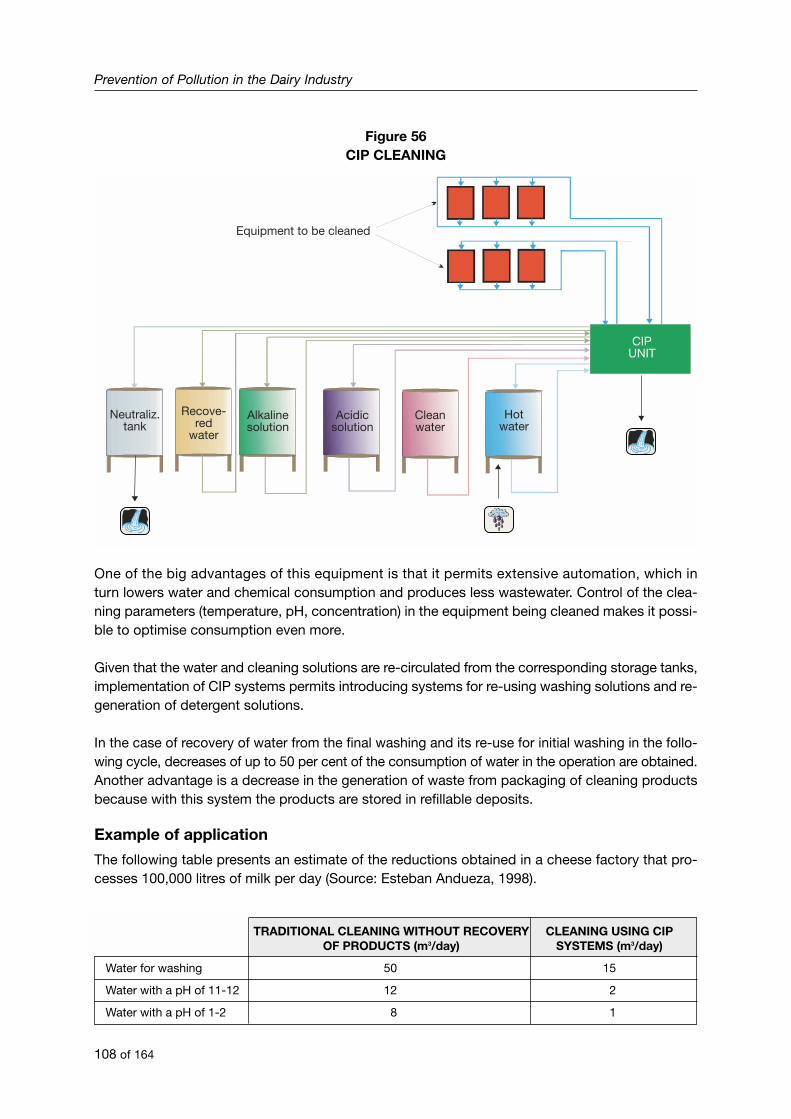
Figure 56CIP CLEANING
One of the big advantages of this equipment is that it permits extensive automation, which inturn lowers water and chemical consumption and produces less wastewater. Control of the clea-ning parameters (temperature, pH, concentration) in the equipment being cleaned makes it possi-ble to optimise consumption even more.
Given that the water and cleaning solutions are re-circulated from the corresponding storage tanks,implementation of CIP systems permits introducing systems for re-using washing solutions and re-generation of detergent solutions.
In the case of recovery of water from the final washing and its re-use for initial washing in the follo-wing cycle, decreases of up to 50 per cent of the consumption of water in the operation are obtained.Another advantage is a decrease in the generation of waste from packaging of cleaning productsbecause with this system the products are stored in refillable deposits.
Example of application
The following table presents an estimate of the reductions obtained in a cheese factory that pro-cesses 100,000 litres of milk per day (Source: Esteban Andueza, 1998).
TRADITIONAL CLEANING WITHOUT RECOVERY CLEANING USING CIP OF PRODUCTS (m3/day) SYSTEMS (m3/day)
Water for washing 50 15
Water with a pH of 11-12 12 2
Water with a pH of 1-2 8 1
Prevention of Pollution in the Dairy Industry
108 of 164
CIPUNIT
Equipment to be cleaned
Neutraliz.tank
Recove-red
water
Alkalinesolution
Acidicsolution
Cleanwater
Hotwater
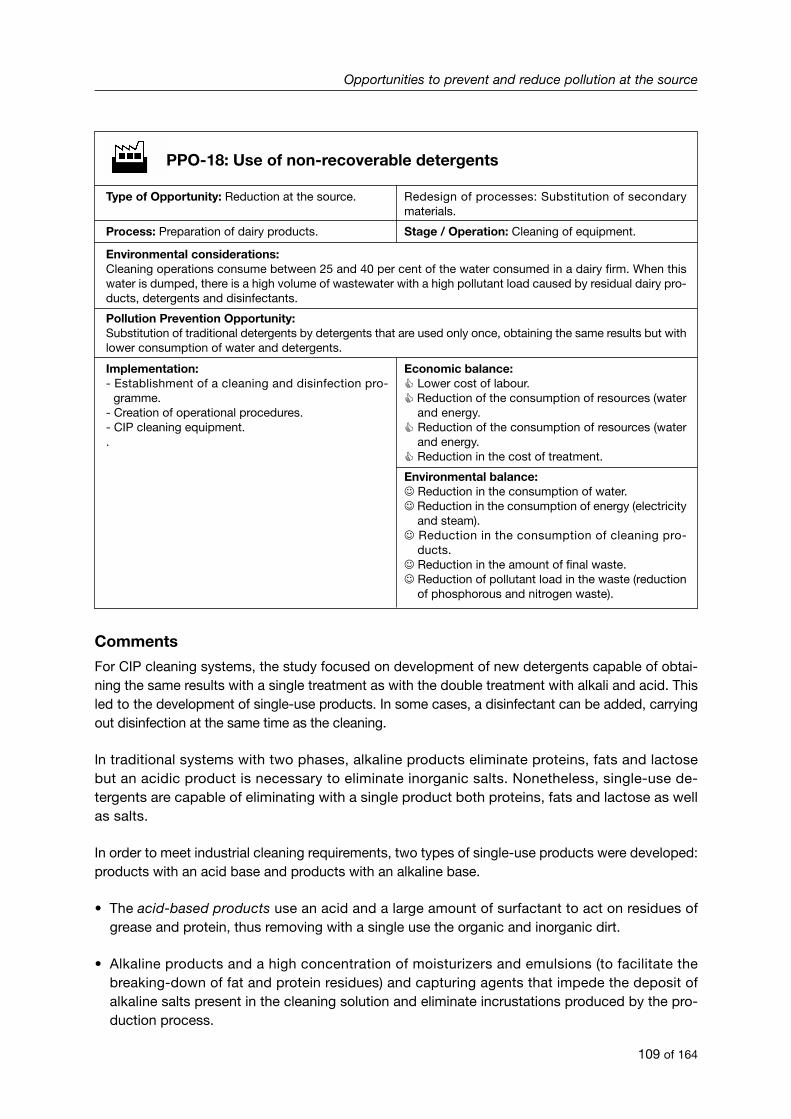
Opportunities to prevent and reduce pollution at the source
109 of 164
Comments
For CIP cleaning systems, the study focused on development of new detergents capable of obtai-ning the same results with a single treatment as with the double treatment with alkali and acid. Thisled to the development of single-use products. In some cases, a disinfectant can be added, carryingout disinfection at the same time as the cleaning.
In traditional systems with two phases, alkaline products eliminate proteins, fats and lactosebut an acidic product is necessary to eliminate inorganic salts. Nonetheless, single-use de-tergents are capable of eliminating with a single product both proteins, fats and lactose as wellas salts.
In order to meet industrial cleaning requirements, two types of single-use products were developed:products with an acid base and products with an alkaline base.
• The acid-based products use an acid and a large amount of surfactant to act on residues ofgrease and protein, thus removing with a single use the organic and inorganic dirt.
• Alkaline products and a high concentration of moisturizers and emulsions (to facilitate thebreaking-down of fat and protein residues) and capturing agents that impede the deposit ofalkaline salts present in the cleaning solution and eliminate incrustations produced by the pro-duction process.
PPO-18: Use of non-recoverable detergents
Environmental considerations: Cleaning operations consume between 25 and 40 per cent of the water consumed in a dairy firm. When thiswater is dumped, there is a high volume of wastewater with a high pollutant load caused by residual dairy pro-ducts, detergents and disinfectants.
Pollution Prevention Opportunity:Substitution of traditional detergents by detergents that are used only once, obtaining the same results but withlower consumption of water and detergents.
Implementation:- Establishment of a cleaning and disinfection pro-
gramme.- Creation of operational procedures.- CIP cleaning equipment..
Economic balance:� Lower cost of labour.� Reduction of the consumption of resources (water
and energy.� Reduction of the consumption of resources (water
and energy.� Reduction in the cost of treatment.
Environmental balance:☺ Reduction in the consumption of water.☺ Reduction in the consumption of energy (electricity
and steam).☺ Reduction in the consumption of cleaning pro-
ducts.☺ Reduction in the amount of final waste.☺ Reduction of pollutant load in the waste (reduction
of phosphorous and nitrogen waste).
Type of Opportunity: Reduction at the source.
Process: Preparation of dairy products.
Redesign of processes: Substitution of secondarymaterials.
Stage / Operation: Cleaning of equipment.
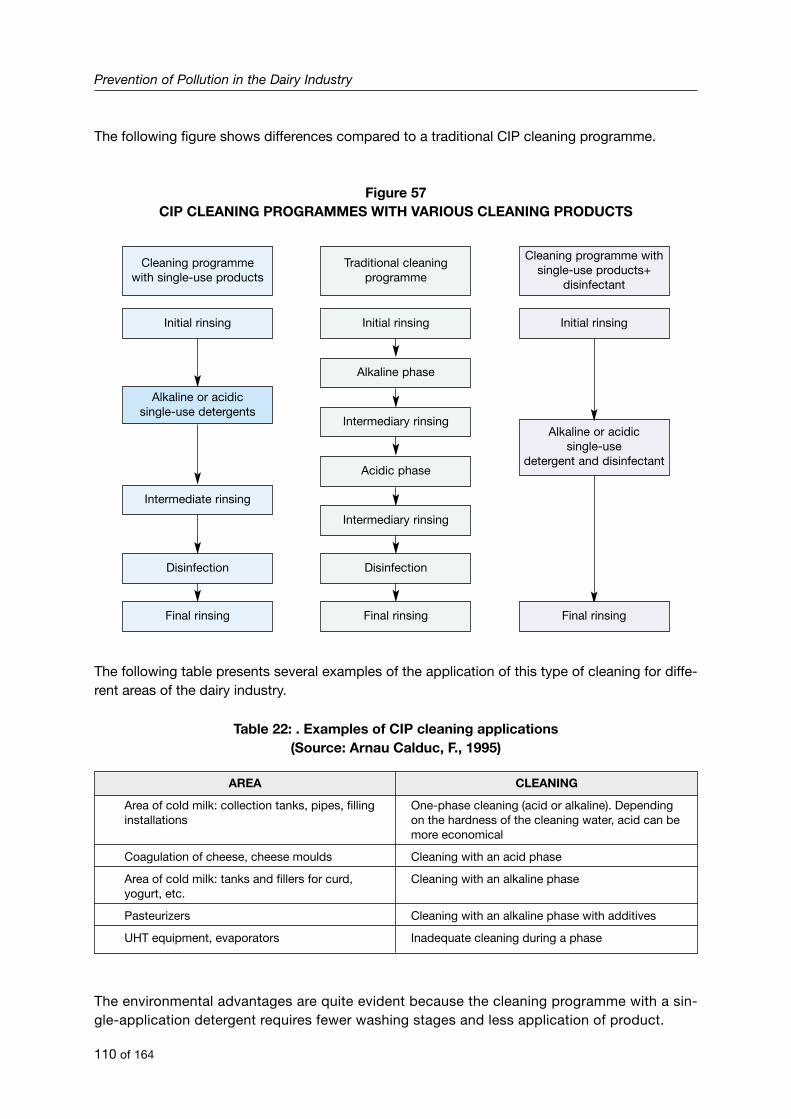
The following figure shows differences compared to a traditional CIP cleaning programme.
Figure 57CIP CLEANING PROGRAMMES WITH VARIOUS CLEANING PRODUCTS
The following table presents several examples of the application of this type of cleaning for diffe-rent areas of the dairy industry.
Table 22: . Examples of CIP cleaning applications(Source: Arnau Calduc, F., 1995)
AREA CLEANING
Area of cold milk: collection tanks, pipes, filling One-phase cleaning (acid or alkaline). Depending installations on the hardness of the cleaning water, acid can be
more economical
Coagulation of cheese, cheese moulds Cleaning with an acid phase
Area of cold milk: tanks and fillers for curd, Cleaning with an alkaline phaseyogurt, etc.
Pasteurizers Cleaning with an alkaline phase with additives
UHT equipment, evaporators Inadequate cleaning during a phase
The environmental advantages are quite evident because the cleaning programme with a sin-gle-application detergent requires fewer washing stages and less application of product.
Prevention of Pollution in the Dairy Industry
110 of 164
Traditional cleaningprogramme
Cleaning programmewith single-use products
Initial rinsing Initial rinsing Initial rinsing
Cleaning programme withsingle-use products+
disinfectant
Alkaline or acidicsingle-use
detergent and disinfectant
Alkaline phase
Alkaline or acidicsingle-use detergents
Intermediary rinsing
Acidic phase
Intermediate rinsing
Intermediary rinsing
DisinfectionDisinfection
Final rinsing Final rinsingFinal rinsing
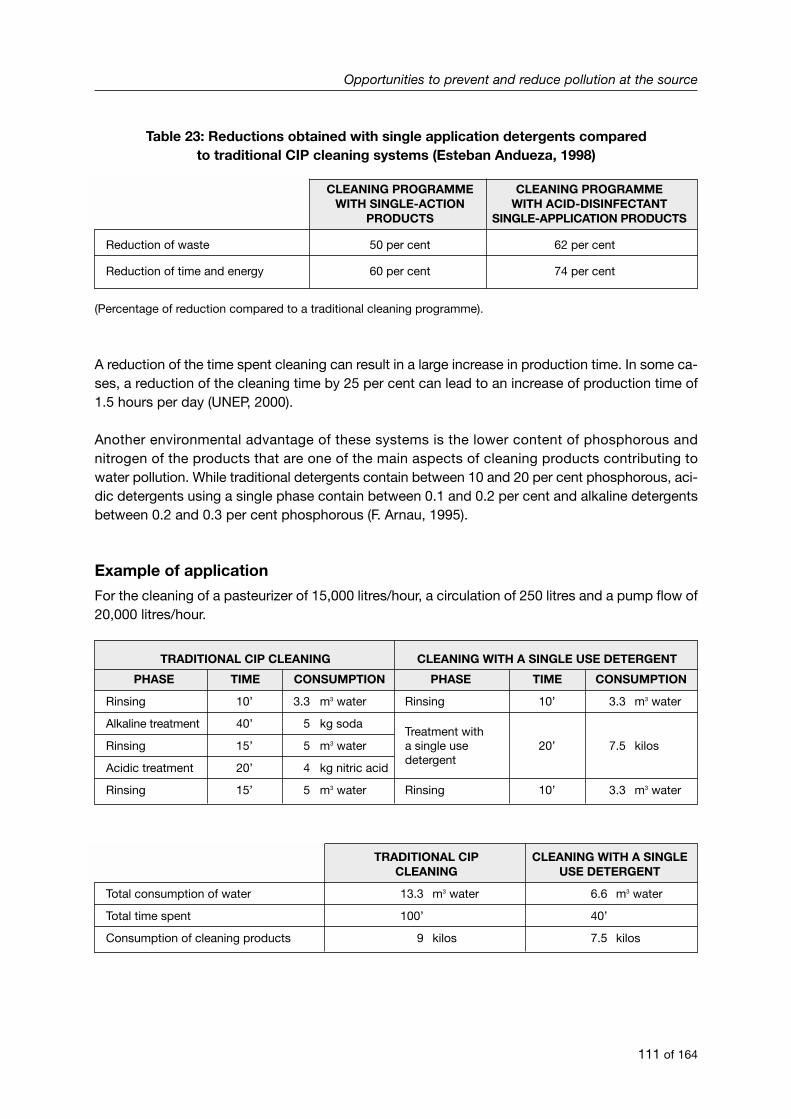
Table 23: Reductions obtained with single application detergents comparedto traditional CIP cleaning systems (Esteban Andueza, 1998)
CLEANING PROGRAMME CLEANING PROGRAMME WITH SINGLE-ACTION WITH ACID-DISINFECTANT
PRODUCTS SINGLE-APPLICATION PRODUCTS
Reduction of waste 50 per cent 62 per cent
Reduction of time and energy 60 per cent 74 per cent
(Percentage of reduction compared to a traditional cleaning programme).
A reduction of the time spent cleaning can result in a large increase in production time. In some ca-ses, a reduction of the cleaning time by 25 per cent can lead to an increase of production time of1.5 hours per day (UNEP, 2000).
Another environmental advantage of these systems is the lower content of phosphorous andnitrogen of the products that are one of the main aspects of cleaning products contributing towater pollution. While traditional detergents contain between 10 and 20 per cent phosphorous, aci-dic detergents using a single phase contain between 0.1 and 0.2 per cent and alkaline detergentsbetween 0.2 and 0.3 per cent phosphorous (F. Arnau, 1995).
Example of application
For the cleaning of a pasteurizer of 15,000 litres/hour, a circulation of 250 litres and a pump flow of20,000 litres/hour.
TRADITIONAL CIP CLEANING CLEANING WITH A SINGLE USE DETERGENT
PHASE TIME CONSUMPTION PHASE TIME CONSUMPTION
Rinsing 10’ 3.3 m3 water Rinsing 10’ 3.3 m3 water
Alkaline treatment 40’ 5 kg sodaTreatment with
Rinsing 15’ 5 m3 water a single use 20’ 7.5 kilos
Acidic treatment 20’ 4 kg nitric aciddetergent
Rinsing 15’ 5 m3 water Rinsing 10’ 3.3 m3 water
TRADITIONAL CIP CLEANING WITH A SINGLE CLEANING USE DETERGENT
Total consumption of water 13.3 m3 water 6.6 m3 water
Total time spent 100’ 40’
Consumption of cleaning products 9 kilos 7.5 kilos
Opportunities to prevent and reduce pollution at the source
111 of 164
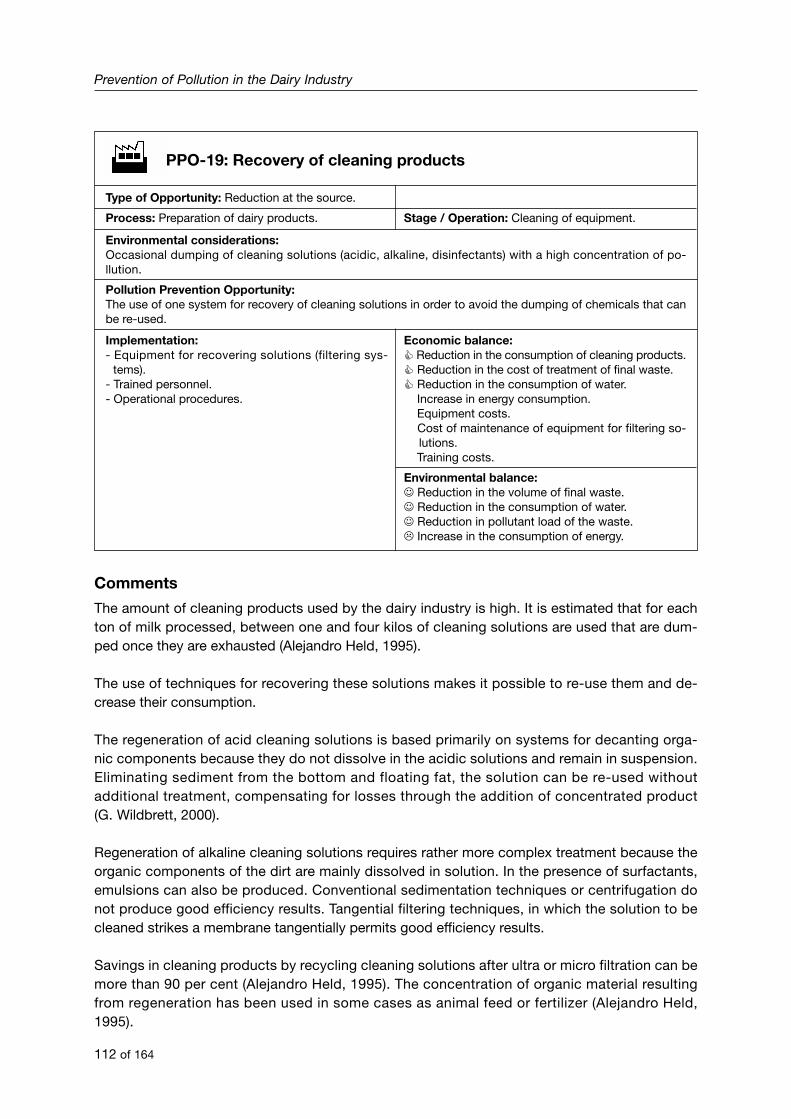
Comments
The amount of cleaning products used by the dairy industry is high. It is estimated that for eachton of milk processed, between one and four kilos of cleaning solutions are used that are dum-ped once they are exhausted (Alejandro Held, 1995).
The use of techniques for recovering these solutions makes it possible to re-use them and de-crease their consumption.
The regeneration of acid cleaning solutions is based primarily on systems for decanting orga-nic components because they do not dissolve in the acidic solutions and remain in suspension.Eliminating sediment from the bottom and floating fat, the solution can be re-used withoutadditional treatment, compensating for losses through the addition of concentrated product(G. Wildbrett, 2000).
Regeneration of alkaline cleaning solutions requires rather more complex treatment because theorganic components of the dirt are mainly dissolved in solution. In the presence of surfactants,emulsions can also be produced. Conventional sedimentation techniques or centrifugation donot produce good efficiency results. Tangential filtering techniques, in which the solution to becleaned strikes a membrane tangentially permits good efficiency results.
Savings in cleaning products by recycling cleaning solutions after ultra or micro filtration can bemore than 90 per cent (Alejandro Held, 1995). The concentration of organic material resultingfrom regeneration has been used in some cases as animal feed or fertilizer (Alejandro Held,1995).
Prevention of Pollution in the Dairy Industry
112 of 164
PPO-19: Recovery of cleaning products
Environmental considerations: Occasional dumping of cleaning solutions (acidic, alkaline, disinfectants) with a high concentration of po-llution.
Pollution Prevention Opportunity:The use of one system for recovery of cleaning solutions in order to avoid the dumping of chemicals that canbe re-used.
Implementation:- Equipment for recovering solutions (filtering sys-
tems).- Trained personnel.- Operational procedures.
Economic balance:� Reduction in the consumption of cleaning products. � Reduction in the cost of treatment of final waste.� Reduction in the consumption of water.� Increase in energy consumption.� Equipment costs.� Cost of maintenance of equipment for filtering so-
lutions.� Training costs.
Environmental balance:☺ Reduction in the volume of final waste.☺ Reduction in the consumption of water. ☺ Reduction in pollutant load of the waste. � Increase in the consumption of energy.
Type of Opportunity: Reduction at the source.
Process: Preparation of dairy products. Stage / Operation: Cleaning of equipment.
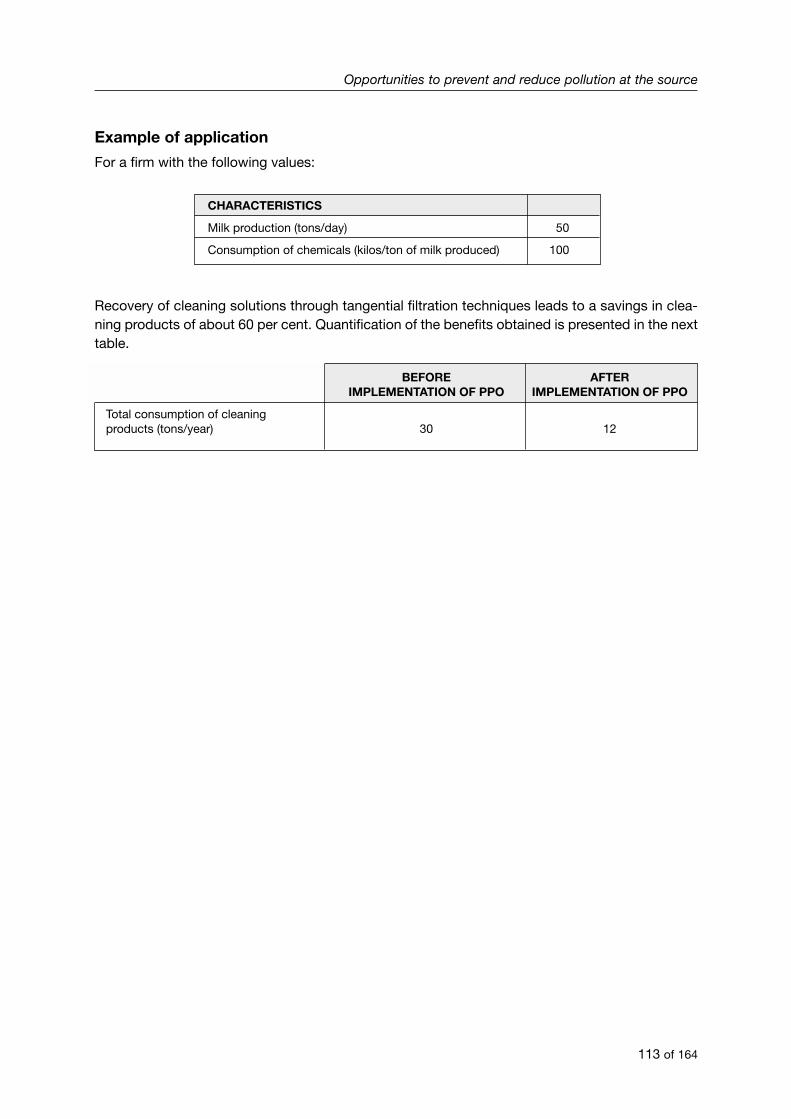
Opportunities to prevent and reduce pollution at the source
113 of 164
Example of application
For a firm with the following values:
CHARACTERISTICS
Milk production (tons/day) 50
Consumption of chemicals (kilos/ton of milk produced) 100
Recovery of cleaning solutions through tangential filtration techniques leads to a savings in clea-ning products of about 60 per cent. Quantification of the benefits obtained is presented in the nexttable.
BEFORE AFTER IMPLEMENTATION OF PPO IMPLEMENTATION OF PPO
Total consumption of cleaningproducts (tons/year) 30 12
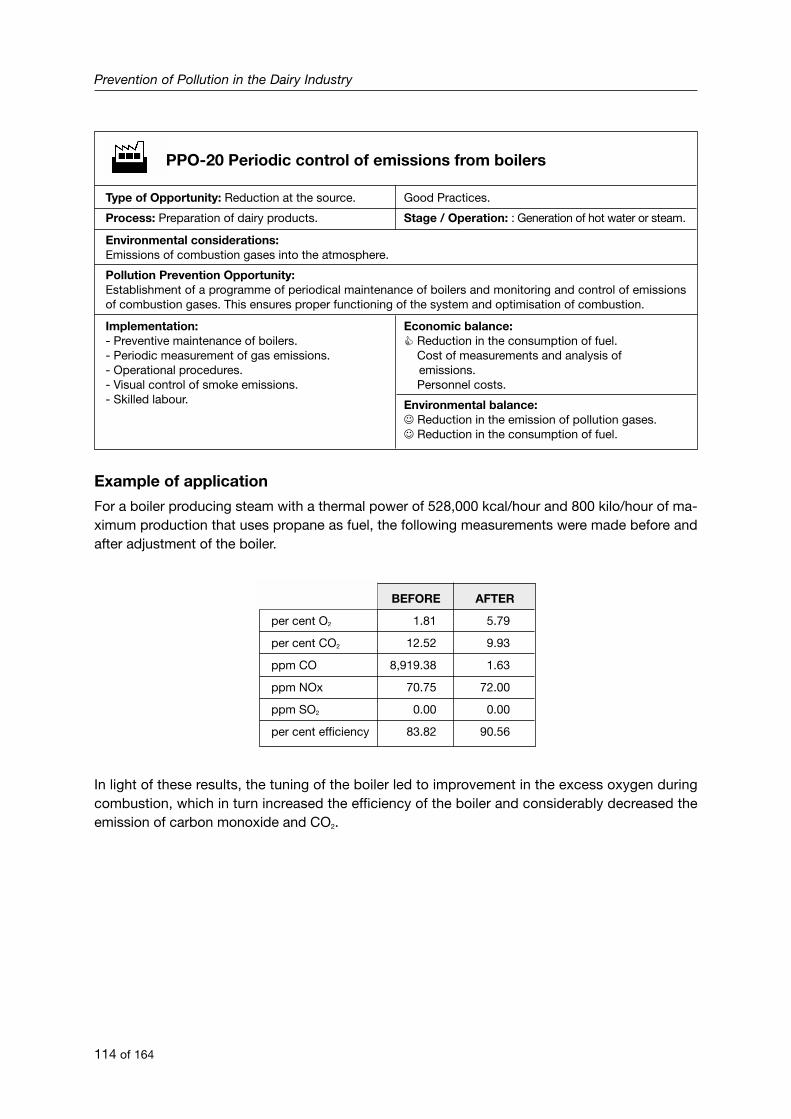
Prevention of Pollution in the Dairy Industry
114 of 164
Example of application
For a boiler producing steam with a thermal power of 528,000 kcal/hour and 800 kilo/hour of ma-ximum production that uses propane as fuel, the following measurements were made before andafter adjustment of the boiler.
In light of these results, the tuning of the boiler led to improvement in the excess oxygen duringcombustion, which in turn increased the efficiency of the boiler and considerably decreased theemission of carbon monoxide and CO2.
PPO-20 Periodic control of emissions from boilers
Environmental considerations: Emissions of combustion gases into the atmosphere.
Pollution Prevention Opportunity:Establishment of a programme of periodical maintenance of boilers and monitoring and control of emissionsof combustion gases. This ensures proper functioning of the system and optimisation of combustion.
Implementation:- Preventive maintenance of boilers.- Periodic measurement of gas emissions.- Operational procedures.- Visual control of smoke emissions.- Skilled labour.
Economic balance:� Reduction in the consumption of fuel.� Cost of measurements and analysis of
emissions.� Personnel costs.
Environmental balance:☺ Reduction in the emission of pollution gases.☺ Reduction in the consumption of fuel.
Type of Opportunity: Reduction at the source.
Process: Preparation of dairy products.
Good Practices.
Stage / Operation: : Generation of hot water or steam.
BEFORE AFTER
per cent O2 1.81 5.79
per cent CO2 12.52 9.93
ppm CO 8,919.38 1.63
ppm NOx 70.75 72.00
ppm SO2 0.00 0.00
per cent efficiency 83.82 90.56
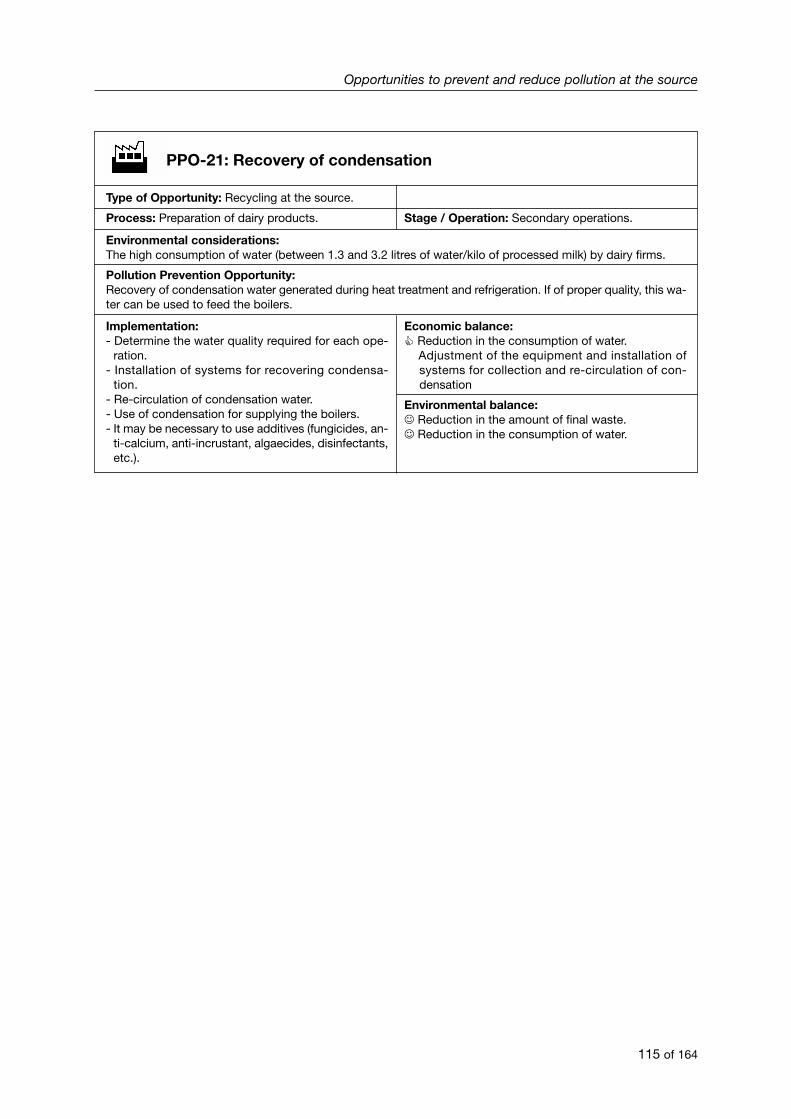
Opportunities to prevent and reduce pollution at the source
115 of 164
PPO-21: Recovery of condensation
Environmental considerations: The high consumption of water (between 1.3 and 3.2 litres of water/kilo of processed milk) by dairy firms.
Pollution Prevention Opportunity:Recovery of condensation water generated during heat treatment and refrigeration. If of proper quality, this wa-ter can be used to feed the boilers.
Implementation:- Determine the water quality required for each ope-
ration.- Installation of systems for recovering condensa-
tion.- Re-circulation of condensation water.- Use of condensation for supplying the boilers.- It may be necessary to use additives (fungicides, an-
ti-calcium, anti-incrustant, algaecides, disinfectants,etc.).
Economic balance:� Reduction in the consumption of water.� Adjustment of the equipment and installation of
systems for collection and re-circulation of con-densation
Environmental balance:☺ Reduction in the amount of final waste.☺ Reduction in the consumption of water.
Type of Opportunity: Recycling at the source.
Process: Preparation of dairy products. Stage / Operation: Secondary operations.
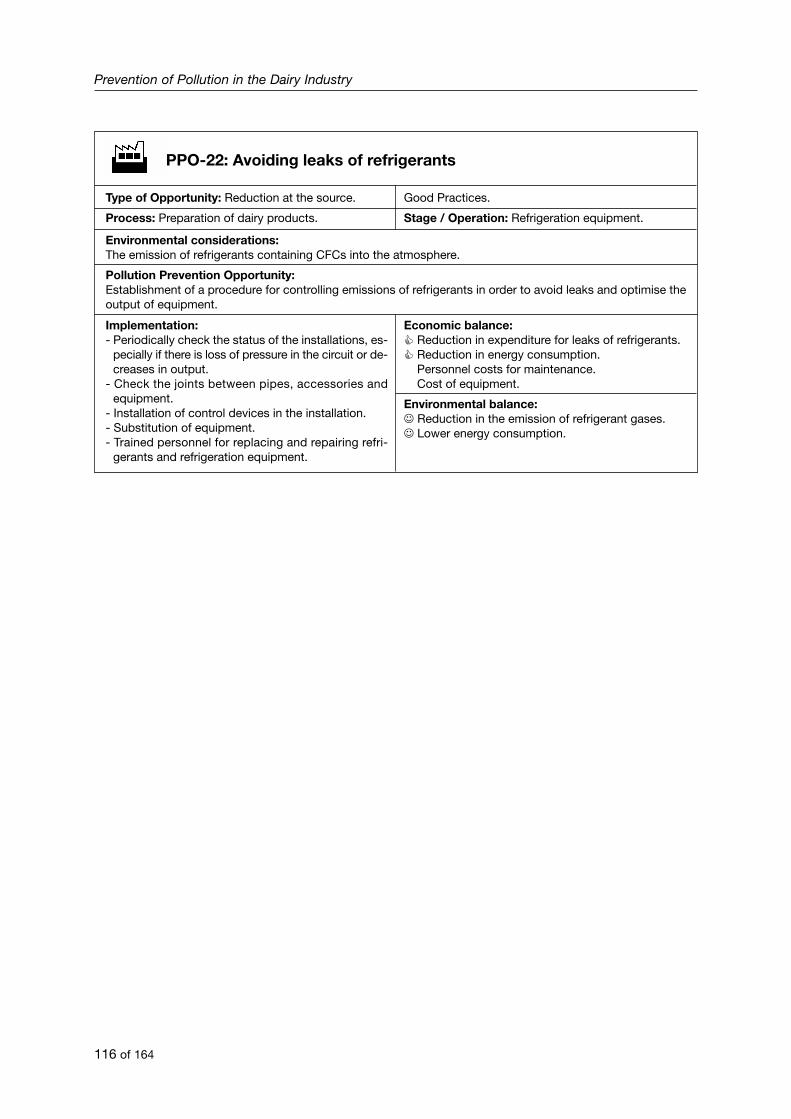
Prevention of Pollution in the Dairy Industry
116 of 164
PPO-22: Avoiding leaks of refrigerants
Environmental considerations: The emission of refrigerants containing CFCs into the atmosphere.
Pollution Prevention Opportunity:Establishment of a procedure for controlling emissions of refrigerants in order to avoid leaks and optimise theoutput of equipment.
Implementation:- Periodically check the status of the installations, es-
pecially if there is loss of pressure in the circuit or de-creases in output.
- Check the joints between pipes, accessories andequipment.
- Installation of control devices in the installation.- Substitution of equipment.- Trained personnel for replacing and repairing refri-
gerants and refrigeration equipment.
Economic balance:� Reduction in expenditure for leaks of refrigerants.� Reduction in energy consumption.� Personnel costs for maintenance.� Cost of equipment.
Environmental balance:☺ Reduction in the emission of refrigerant gases.☺ Lower energy consumption.
Type of Opportunity: Reduction at the source.
Process: Preparation of dairy products.
Good Practices.
Stage / Operation: Refrigeration equipment.
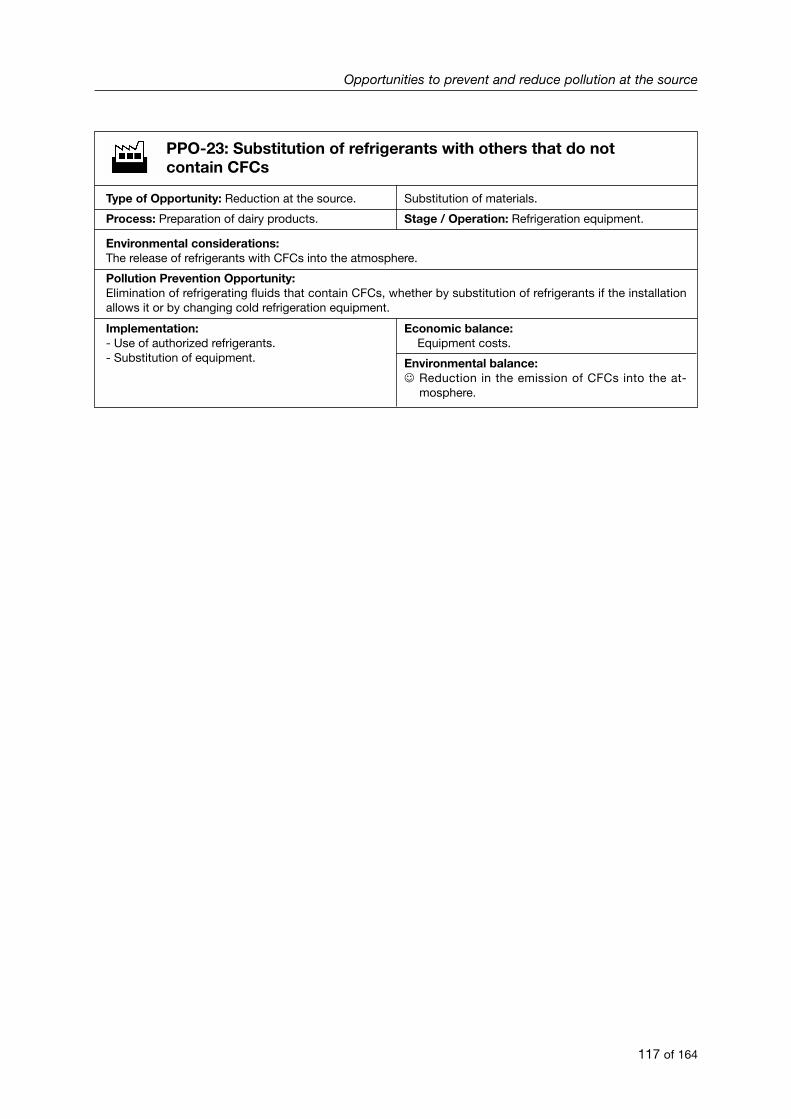
Opportunities to prevent and reduce pollution at the source
117 of 164
PPO-23: Substitution of refrigerants with others that do notcontain CFCs
Environmental considerations: The release of refrigerants with CFCs into the atmosphere.
Pollution Prevention Opportunity:Elimination of refrigerating fluids that contain CFCs, whether by substitution of refrigerants if the installationallows it or by changing cold refrigeration equipment.
Implementation:- Use of authorized refrigerants.- Substitution of equipment.
Economic balance:� Equipment costs.
Environmental balance:☺ Reduction in the emission of CFCs into the at-
mosphere.
Type of Opportunity: Reduction at the source.
Process: Preparation of dairy products.
Substitution of materials.
Stage / Operation: Refrigeration equipment.

Prevention of Pollution in the Dairy Industry
118 of 164
PPO-24: Storage of hazardous products under adequateconditions
Environmental considerations: Hazardous products can pollute large areas of ground and water in the event of dumping or accidentalspills.
Pollution Prevention Opportunity:Provide a storage area appropriate for hazardous goods. This area should be protected from passing vehicles,have access restricted to responsible personnel and have measures for collecting leachate that might beproduced.
Implementation:- Provide a specific storage area for these products
with security measures.- Make the soil impermeable on which these products
are stored.- Provide a system of collection independent from
wastewater for spills of hazardous products.- Training of personnel in the management of these
products.- Establishment of a contingency system in the event
of an accident (both with regard to the environmentand workers).
- Provide adequate symbols and labelling to hazar-dous products.
Economic balance:� Reduction in the cost of treatment.� Cost of preparation of storage areas.� Cost of training personnel.
Environmental balance:☺ Prevention of accidents with environmental effects.
Type of Opportunity: Reduction at the source.
Process: Preparation of dairy products.
Good Practices.
Stage / Operation: Secondary operations.
Opportunities to prevent and reduce pollution at the source
119 of 164
PPO-25: Minimization of packaging waste
Environmental considerations: The dairy industry puts on the market a large amount of packaging. Because of defects in the packaging lineor defects in the final product, much used packaging is often generated that becomes waste for the firm.
Pollution Prevention Opportunity:Implementation of a minimization plan for waste packaging after completion of a study permits considerablereduction in the amount of packaging material placed on the market without substantial reduction in its quali-ties (mechanical resistance, preservation of the product, ...).
Implementation:- Study of minimization possibilities and market study- Modifications in equipment for production of packa-
ging (if this is carried out at the plant).- Possible change in the supplier of packaging.- Re-design of packaging of dairy products.
Economic balance:� Lower consumption of packaging material.� Lower costs for the management of waste packa-
ging produced by the firm.� Cost of the minimization study.� Modifications in the packaging operation and sto-
rage.
Environmental balance:☺ Decrease in the amount of waste of packaging put
on the market.
Type of Opportunity: Reduction at the source.
Process: Preparation of dairy products.
Redesign of processes: Packaging.
Stage / Operation: Packaging.
Comments
The dairy industries are characterized by the production of very perishable products that must beprotected with packaging in order to market them. Optimisation of the ratio of weight of packagingto weight of product permits reducing unnecessary consumption of resources and/or energy fortheir production and reduces the amount of packaging waste that will remain on the market oncethe product is consumed.
In order to implement a minimization plan for packaging in a dairy firm, the following steps areusually taken:
• Carrying out of an inventory of all packaging used by the firm regarding formats, type of mate-rials, volumes, specifications, etc.
• Study of possibilities for minimization of packaging (changes in material, characteristics of thematerial, packaging design, volume of packaging, transportation, storage) taking into accountamong other things the product’s needs and the conditioning factors of the transportation sys-tem and storage used.
• Application of the measures;
• Quantification of the results.
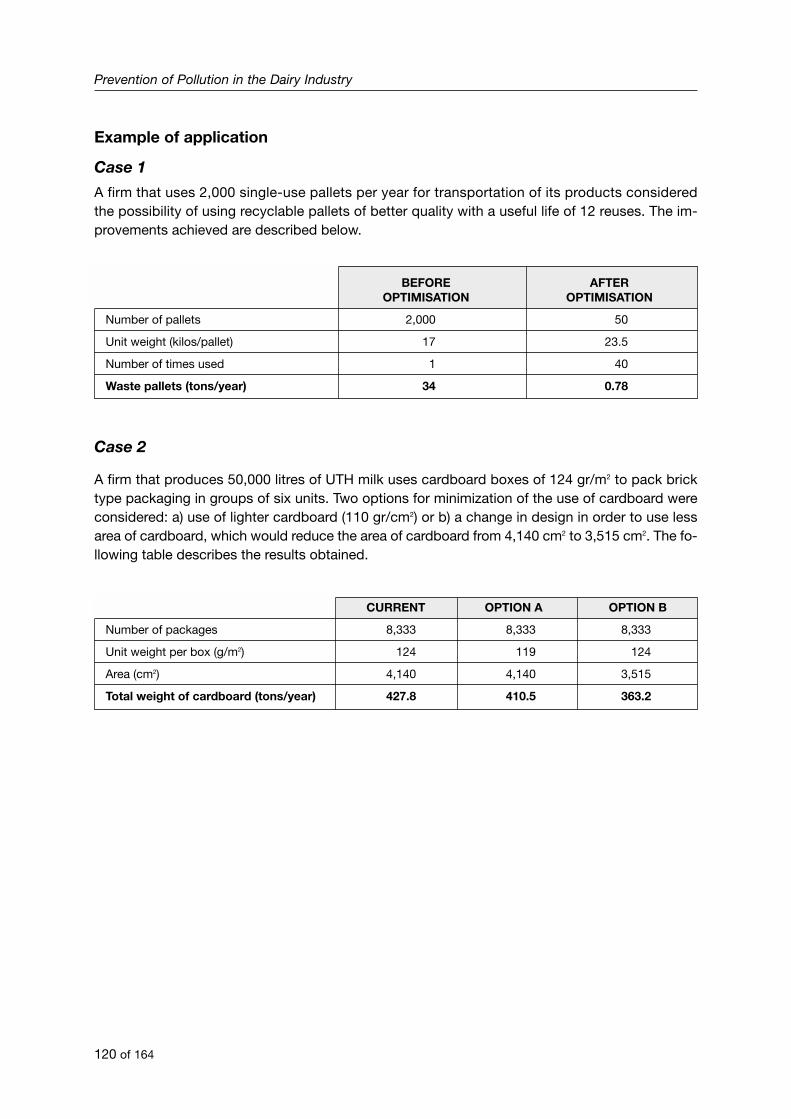
Prevention of Pollution in the Dairy Industry
120 of 164
Example of application
Case 1
A firm that uses 2,000 single-use pallets per year for transportation of its products consideredthe possibility of using recyclable pallets of better quality with a useful life of 12 reuses. The im-provements achieved are described below.
BEFORE AFTEROPTIMISATION OPTIMISATION
Number of pallets 2,000 50
Unit weight (kilos/pallet) 17 23.5
Number of times used 1 40
Waste pallets (tons/year) 34 0.78
Case 2
A firm that produces 50,000 litres of UTH milk uses cardboard boxes of 124 gr/m2 to pack bricktype packaging in groups of six units. Two options for minimization of the use of cardboard wereconsidered: a) use of lighter cardboard (110 gr/cm2) or b) a change in design in order to use lessarea of cardboard, which would reduce the area of cardboard from 4,140 cm2 to 3,515 cm2. The fo-llowing table describes the results obtained.
CURRENT OPTION A OPTION B
Number of packages 8,333 8,333 8,333
Unit weight per box (g/m2) 124 119 124
Area (cm2) 4,140 4,140 3,515
Total weight of cardboard (tons/year) 427.8 410.5 363.2
Opportunities to prevent and reduce pollution at the source
121 of 164
PPO-26: Adequate separation of solid waste
Environmental considerations: The volume of solid waste produced is high, especially from waste packaging and packing. This waste canbe recycled for preparing new products.
Pollution Prevention Opportunity:Creation of the infrastructure necessary to permit adequate separation of the main types of solid waste gene-rated by the firm (packaging, paper/cardboard, plastics, glass), in order that it can be adequately managedlater.
Implementation:- Provide containers for each type of waste.- Identify the different containers in function of the
waste to be deposited there.- Place containers near areas of greatest generation
of waste packaging and packing in order to facilita-te its separation.
- Provide a storage area.- Compact the packaging waste in order to save sto-
rage space and transportation costs.- Training of personnel.
Economic balance:� Reduction in the cost of waste management.� Cost of containers.� Cost of the conditioning equipment (compactors,
packaging machines, ...).� Cost of training personnel.
Environmental balance:☺ Recovery of waste.
Type of Opportunity: Recovery.
Process: Preparation of dairy products.
External recycling.
Stage / Operation: Packaging.

Prevention of Pollution in the Dairy Industry
122 of 164
PPO-27: Neutralization of acidic and alkaline wastebefore dumping
Environmental considerations: Occasional dumping of wastewater from cleaning with extreme pHs when emptying tanks used for acid oralkaline cleaning solutions. They cause a heavy environmental impact on the receiving medium and can be veryharmful for wastewater treatment systems (especially if they are biological).
Pollution Prevention Opportunity:Neutralize sources with extreme pH before dumping, mixing acid and basic sources or dosing reagent toreach a pH near neutral at the point of dumping.
Implementation:- Construction of a tank for homogenization/neutrali-
zation of acid and basic sources.- Dosing of reagents.
Economic balance:� Reduction in the cost of treatment.� Cost of the construction of the homogenization
tank.� Cost of the system for dosing reagents.
Environmental balance:☺ Reduction in the hazardous content of waste.
Type of Opportunity: Reduction at the source.
Process: Preparation of dairy products. Stage / Operation: Treatment of wastewater.
Opportunities to prevent and reduce pollution at the source
123 of 164
PPO-28: Optimisation of energy efficiency throughcogeneration
Environmental considerations: The high demand for energy (heat and electricity) of dairy firms.
Pollution Prevention Opportunity:In large industrial plants or in plants with a high consumption of heat (for example those that have opera-tions for concentrating whey), the production of electricity using residual heat for production of thermalenergy can be economically viable. The viability of this option depends at all times on the price of fossil fuels,electricity and governmental support in each country participating in the cogeneration.
Implementation:Development of a project for cogeneration:- Feasibility study.- Basic project.- Optimisation of design.- Construction and start-up.- Legalization and administrative procedures.- Relations with the electric company and the source
of fuel.- Maintenance and use.
Economic balance:� Decrease in the cost of energy.� Energy independence.� Cost of project development.� Investment in the system.� Cost of maintenance and use.
Environmental balance:☺ Savings in primary energy.☺ Reduction of emissions into the atmosphere (less
fuel is burned to generate the same energy).☺ Use of less polluting fuel (natural gas) or use of re-
sidual fuels (biogas, biomass, industrial waste,etc.).
Type of Opportunity: Reduction at the source.
Process: Preparation of dairy products. Stage / Operation: Generation of energy.
Prevention of Pollution in the Dairy Industry
124 of 164
PPO-29: Good Practices for reduction of water consumption
Environmental considerations: High consumption of water in dairy firms, with values between 1.3 and 3.2 litres/litre of milk processed.
Pollution Prevention Opportunity:Implementation of Good Practices for the reduction of water consumption in all parts of the firm.
Implementation:- Adjustment of the flow of water to the needs for each operation.- Creation of optimum operating conditions, posting them in writing and providing them to the workers.- Installation of valves that make it possible to regulate water flow.- Installation of systems for cutting off parts of the water network, making it possible to cut off water supply
to an area in the event of leakage.- Use of the amount of water suitable for each operation, permitting re-use of water in less critical stages and
savings in pre-treatment of water for each process.- Carry out periodical inspections of the installation and/or consumption in order to detect leaks, breaks or los-
ses as soon as possible.- Use of closed circuit refrigeration.- Automatic systems for closing off water outlets (hoses, taps, services, etc.).- Use of wastewater after being treated, as long as they reach an acceptable level of quality, for operations
such as watering of landscaped areas of the firm or cleaning of outside areas.
Type of Opportunity: Reduction at the source.
Process: Preparation of dairy products.
Redesign of processes: Good Practices.
Stage / Operation: All.
Opportunities to prevent and reduce pollution at the source
125 of 164
PPO-30: Good Practices for reduction of energy consumption
Environmental considerations: In most dairy firms, a high level of energy is consumed (electricity and heat), in many cases more than 0.14kWh/litre of milk processed.
Pollution Prevention Opportunity:Implementation of Good Practices for the reduction of the consumption of energy in the plant of the dairyfirm.
Implementation:- Installation of systems of automatic control for turning off lights and equipment when they are not being
used.- Creation of optimum operating conditions, posting them in writing and informing the workers.- Preventing doors of refrigerated areas from remaining open for a long time.- Installation of automatic mechanisms for turning off lights and equipment when not in use.- Prevention of steam leaks.- Avoid heat losses in the pipes and installations using insulation.- Carry out adequate maintenance of the insulation and heat sealing.- Installation of mechanisms for monitoring operations in order to avoid the functioning of empty equip-
ment.- Installation of a system of information technology for monitoring temperature in the refrigerating chambers
and alarm.
Type of Opportunity: Reduction at the source.
Process: Preparation of dairy products.
Redesign of processes: Good Practices.
Stage / Operation: All.
Prevention of Pollution in the Dairy Industry
126 of 164
PPO-31: Good Practices for reduction of gas emissions
Environmental considerations: The emission of combustion gases (CO, SO2 or NOx, and particles) by the boilers used to produce steam andhot water and refrigeration fluids of the refrigeration equipment.
Pollution Prevention Opportunity:Carrying out Good Practices as a simple form for the reduction of gas emissions.
Implementation:- Make a visual check of the emission of fumes.- Carry out periodic measurement of gas emissions.- Check the correct functioning of boilers.- Carry out periodic maintenance of boilers and burners.- Check periodically the refrigeration installations in order to detect possible leaks.- Use of cleaner fuels, such as natural gas.
Type of Opportunity: Reduction at the source.
Process: Preparation of dairy products.
Redesign of processes: Good Practices.
Stage / Operation: Generation of heat and refrigeration.
Opportunities to prevent and reduce pollution at the source
127 of 164
PPO-32: Good Practices to facilitate the management of waste
Environmental considerations: The generation of waste resulting from the activities of the dairy industry (processing, maintenance, cleaning,office work, laboratory).
Pollution Prevention Opportunity:Carry out measurements to decrease the amount of waste generated or facilitate its transport and manage-ment.
Implementation:- Prevent the dumping of used lubricating oils and other hazardous wastes into the drainage system.- Prevent fuel leaks from reaching the system for evacuating wastewater.- Install a system for collecting possible leaked fuel.- Completely empty containers with cleaning products, additives, chemicals, etc.- Carefully check the products available in warehouse.- Use refillable tanks for products used in large quantities.- Use of larger packaging for products of greatest consumption in order to decrease packaging waste.- Avoid dumping laboratory waste into the general system for evacuating wastewater.- Gather separately waste that can be recycled.- Avoid mixing hazardous waste with non-recyclable waste.- Identify the storage area for hazardous waste in order to avoid their mixing with non-hazardous waste.- Dry-separate solid waste in order to facilitate its transportation and later management.
Type of Opportunity: Reduction at the source.
Process: Preparation of dairy products.
Redesign of processes: Good Practices.
Stage / Operation: All.

Prevention of Pollution in the Dairy Industry
128 of 152
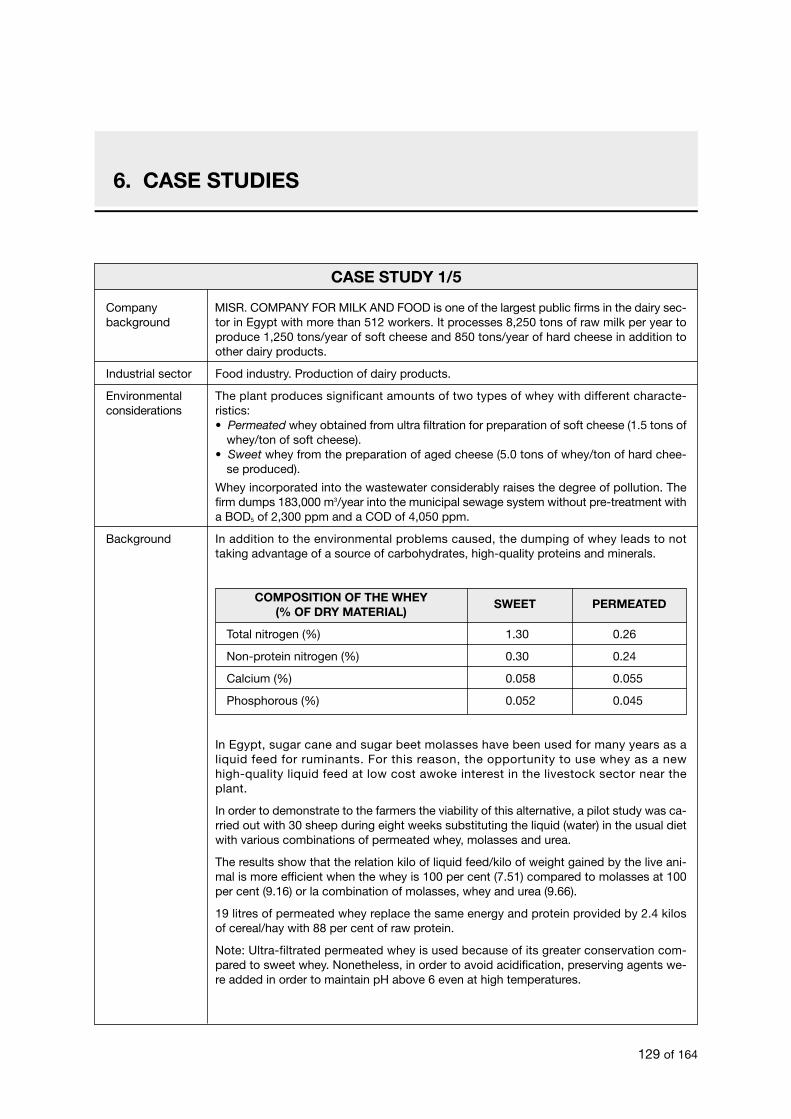
CASE STUDY 1/5
Company MISR. COMPANY FOR MILK AND FOOD is one of the largest public firms in the dairy sec-background tor in Egypt with more than 512 workers. It processes 8,250 tons of raw milk per year to
produce 1,250 tons/year of soft cheese and 850 tons/year of hard cheese in addition toother dairy products.
Industrial sector Food industry. Production of dairy products.
Environmental The plant produces significant amounts of two types of whey with different characte-considerations ristics:
• Permeated whey obtained from ultra filtration for preparation of soft cheese (1.5 tons ofwhey/ton of soft cheese).
• Sweet whey from the preparation of aged cheese (5.0 tons of whey/ton of hard chee-se produced).
Whey incorporated into the wastewater considerably raises the degree of pollution. Thefirm dumps 183,000 m3/year into the municipal sewage system without pre-treatment witha BOD5 of 2,300 ppm and a COD of 4,050 ppm.
Background In addition to the environmental problems caused, the dumping of whey leads to not taking advantage of a source of carbohydrates, high-quality proteins and minerals.
COMPOSITION OF THE WHEY(% OF DRY MATERIAL)
SWEET PERMEATED
Total nitrogen (%) 1.30 0.26
Non-protein nitrogen (%) 0.30 0.24
Calcium (%) 0.058 0.055
Phosphorous (%) 0.052 0.045
In Egypt, sugar cane and sugar beet molasses have been used for many years as aliquid feed for ruminants. For this reason, the opportunity to use whey as a newhigh-quality liquid feed at low cost awoke interest in the livestock sector near theplant.
In order to demonstrate to the farmers the viability of this alternative, a pilot study was ca-rried out with 30 sheep during eight weeks substituting the liquid (water) in the usual dietwith various combinations of permeated whey, molasses and urea.
The results show that the relation kilo of liquid feed/kilo of weight gained by the live ani-mal is more efficient when the whey is 100 per cent (7.51) compared to molasses at 100per cent (9.16) or la combination of molasses, whey and urea (9.66).
19 litres of permeated whey replace the same energy and protein provided by 2.4 kilosof cereal/hay with 88 per cent of raw protein.
Note: Ultra-filtrated permeated whey is used because of its greater conservation com-pared to sweet whey. Nonetheless, in order to avoid acidification, preserving agents we-re added in order to maintain pH above 6 even at high temperatures.
Metodología de Grupos de Trabajo
129 of 164
6. CASE STUDIES
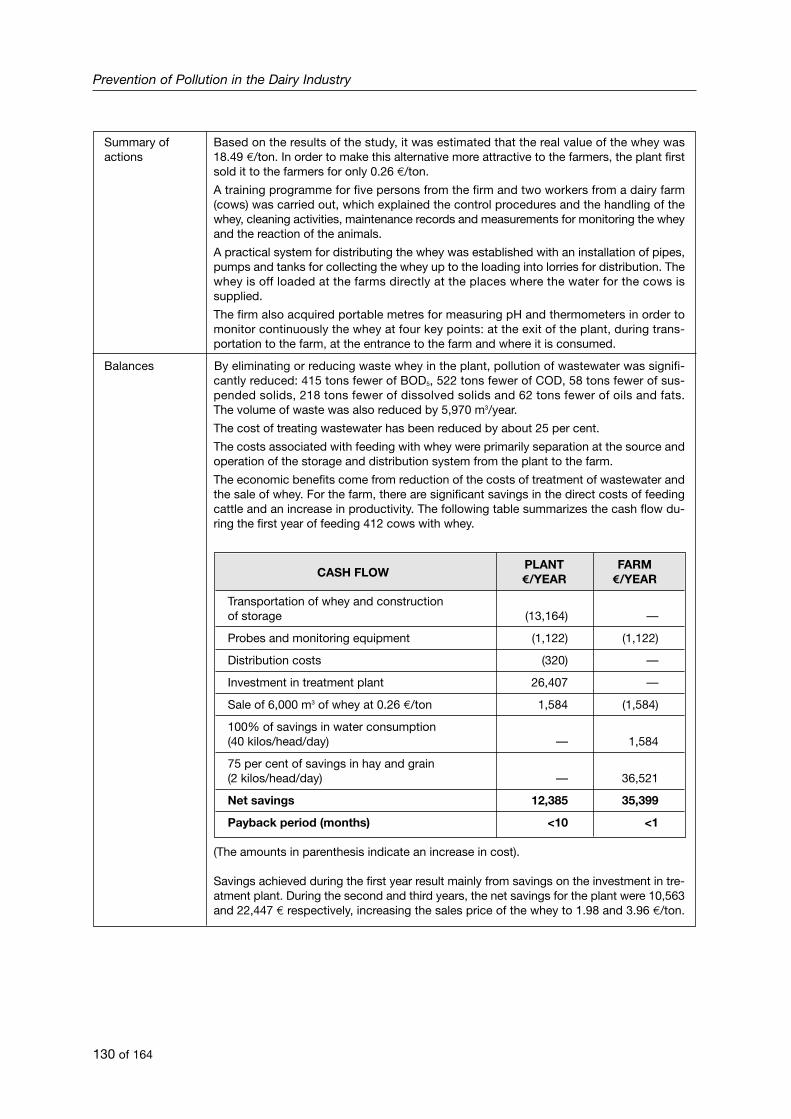
Summary of Based on the results of the study, it was estimated that the real value of the whey wasactions 18.49 ¤/ton. In order to make this alternative more attractive to the farmers, the plant first
sold it to the farmers for only 0.26 ¤/ton.
A training programme for five persons from the firm and two workers from a dairy farm(cows) was carried out, which explained the control procedures and the handling of thewhey, cleaning activities, maintenance records and measurements for monitoring the wheyand the reaction of the animals.
A practical system for distributing the whey was established with an installation of pipes,pumps and tanks for collecting the whey up to the loading into lorries for distribution. Thewhey is off loaded at the farms directly at the places where the water for the cows issupplied.
The firm also acquired portable metres for measuring pH and thermometers in order tomonitor continuously the whey at four key points: at the exit of the plant, during trans-portation to the farm, at the entrance to the farm and where it is consumed.
Balances By eliminating or reducing waste whey in the plant, pollution of wastewater was signifi-cantly reduced: 415 tons fewer of BOD5, 522 tons fewer of COD, 58 tons fewer of sus-pended solids, 218 tons fewer of dissolved solids and 62 tons fewer of oils and fats.The volume of waste was also reduced by 5,970 m3/year.
The cost of treating wastewater has been reduced by about 25 per cent.
The costs associated with feeding with whey were primarily separation at the source andoperation of the storage and distribution system from the plant to the farm.
The economic benefits come from reduction of the costs of treatment of wastewater andthe sale of whey. For the farm, there are significant savings in the direct costs of feedingcattle and an increase in productivity. The following table summarizes the cash flow du-ring the first year of feeding 412 cows with whey.
CASH FLOWPLANT FARME/YEAR E/YEAR
Transportation of whey and constructionof storage (13,164) —
Probes and monitoring equipment (1,122) (1,122)
Distribution costs (320) —
Investment in treatment plant 26,407 —
Sale of 6,000 m3 of whey at 0.26 ¤/ton 1,584 (1,584)
100% of savings in water consumption(40 kilos/head/day) — 1,584
75 per cent of savings in hay and grain(2 kilos/head/day) — 36,521
Net savings 12,385 35,399
Payback period (months) <10 <1
(The amounts in parenthesis indicate an increase in cost).
Savings achieved during the first year result mainly from savings on the investment in tre-atment plant. During the second and third years, the net savings for the plant were 10,563and 22,447 ¤ respectively, increasing the sales price of the whey to 1.98 and 3.96 ¤/ton.
Prevention of Pollution in the Dairy Industry
130 of 164
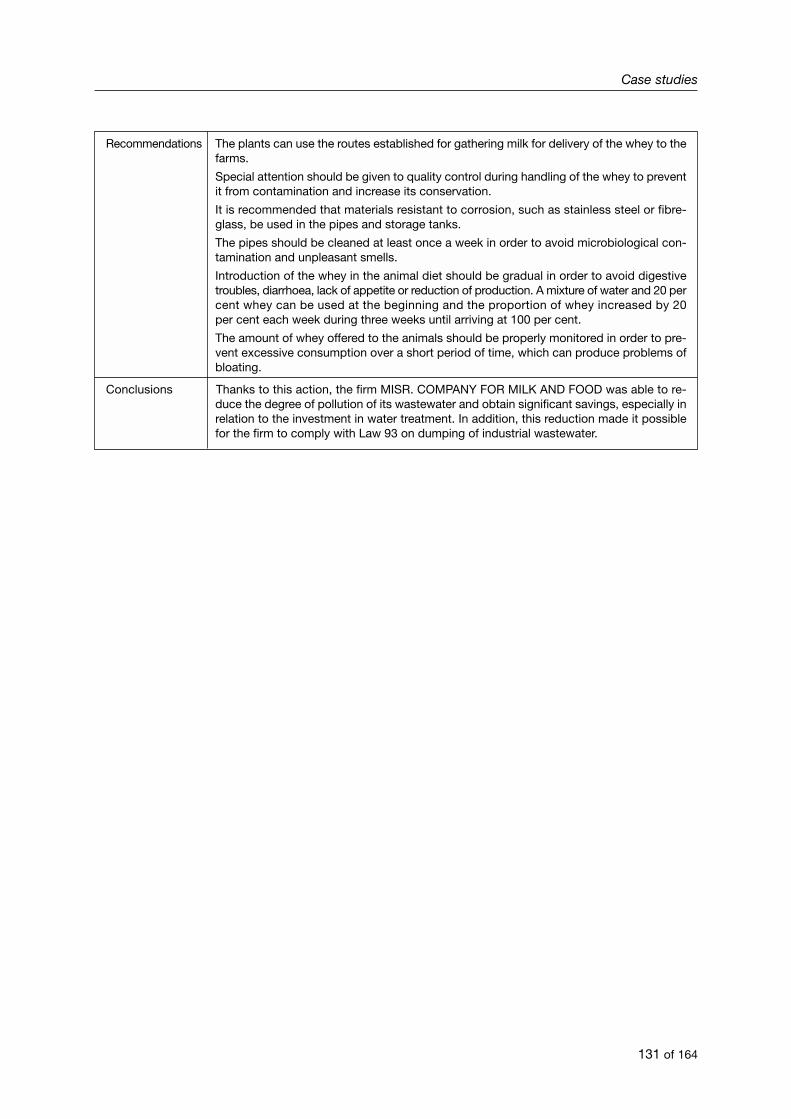
Recommendations The plants can use the routes established for gathering milk for delivery of the whey to the farms.
Special attention should be given to quality control during handling of the whey to preventit from contamination and increase its conservation.
It is recommended that materials resistant to corrosion, such as stainless steel or fibre-glass, be used in the pipes and storage tanks.
The pipes should be cleaned at least once a week in order to avoid microbiological con-tamination and unpleasant smells.
Introduction of the whey in the animal diet should be gradual in order to avoid digestivetroubles, diarrhoea, lack of appetite or reduction of production. A mixture of water and 20 percent whey can be used at the beginning and the proportion of whey increased by 20per cent each week during three weeks until arriving at 100 per cent.
The amount of whey offered to the animals should be properly monitored in order to pre-vent excessive consumption over a short period of time, which can produce problems ofbloating.
Conclusions Thanks to this action, the firm MISR. COMPANY FOR MILK AND FOOD was able to re-duce the degree of pollution of its wastewater and obtain significant savings, especially inrelation to the investment in water treatment. In addition, this reduction made it possiblefor the firm to comply with Law 93 on dumping of industrial wastewater.
Case studies
131 of 164
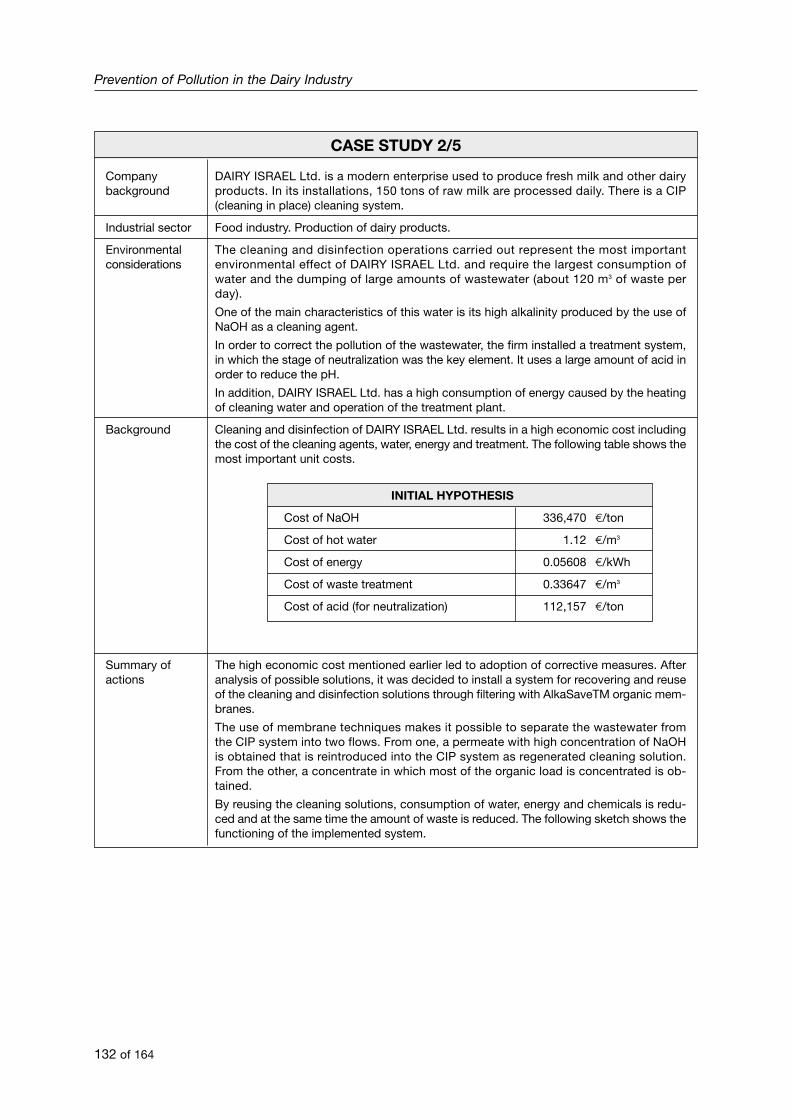
Prevention of Pollution in the Dairy Industry
132 of 164
CASE STUDY 2/5
Company DAIRY ISRAEL Ltd. is a modern enterprise used to produce fresh milk and other dairy background products. In its installations, 150 tons of raw milk are processed daily. There is a CIP
(cleaning in place) cleaning system.
Industrial sector Food industry. Production of dairy products.
Environmental The cleaning and disinfection operations carried out represent the most important considerations environmental effect of DAIRY ISRAEL Ltd. and require the largest consumption of
water and the dumping of large amounts of wastewater (about 120 m3 of waste perday).
One of the main characteristics of this water is its high alkalinity produced by the use ofNaOH as a cleaning agent.
In order to correct the pollution of the wastewater, the firm installed a treatment system,in which the stage of neutralization was the key element. It uses a large amount of acid inorder to reduce the pH.
In addition, DAIRY ISRAEL Ltd. has a high consumption of energy caused by the heatingof cleaning water and operation of the treatment plant.
Background Cleaning and disinfection of DAIRY ISRAEL Ltd. results in a high economic cost including the cost of the cleaning agents, water, energy and treatment. The following table shows themost important unit costs.
INITIAL HYPOTHESIS
Cost of NaOH 336,470 e/ton
Cost of hot water 1.12 e/m3
Cost of energy 0.05608 e/kWh
Cost of waste treatment 0.33647 e/m3
Cost of acid (for neutralization) 112,157 e/ton
Summary of The high economic cost mentioned earlier led to adoption of corrective measures. After actions analysis of possible solutions, it was decided to install a system for recovering and reuse
of the cleaning and disinfection solutions through filtering with AlkaSaveTM organic mem-branes.
The use of membrane techniques makes it possible to separate the wastewater fromthe CIP system into two flows. From one, a permeate with high concentration of NaOHis obtained that is reintroduced into the CIP system as regenerated cleaning solution.From the other, a concentrate in which most of the organic load is concentrated is ob-tained.
By reusing the cleaning solutions, consumption of water, energy and chemicals is redu-ced and at the same time the amount of waste is reduced. The following sketch shows thefunctioning of the implemented system.

Case studies
133 of 164
HYPOTHETICAL OPERATION
System capacity 120 m3/day
Concentration (NaOH) of the solutionto be treated 2 %
Recovery 90 %
Days in operation 300 days/year
Hours of operation 22 hours/day
Amount of soda recovered (100%) 2.16 tons/day
Amount of soda recovered 648 tons/year
Balances As a result of the installation of a membrane filter for separation and reuse of the causticpart of the wastewater of the CIP, the following results have been obtained.
Users
CleanCaustic
5 - 30m3
2 % NaOH65-70 ºC
Buffertank
SpentCaustic
5 - 30m3
2 % NaOH65-70 ºC
Concentrated Organic Materialto Discharge or to Feed Stock
(after diafiltration)
Membrane system
Purified Caustic (Permeated)
Diafiltrationwater
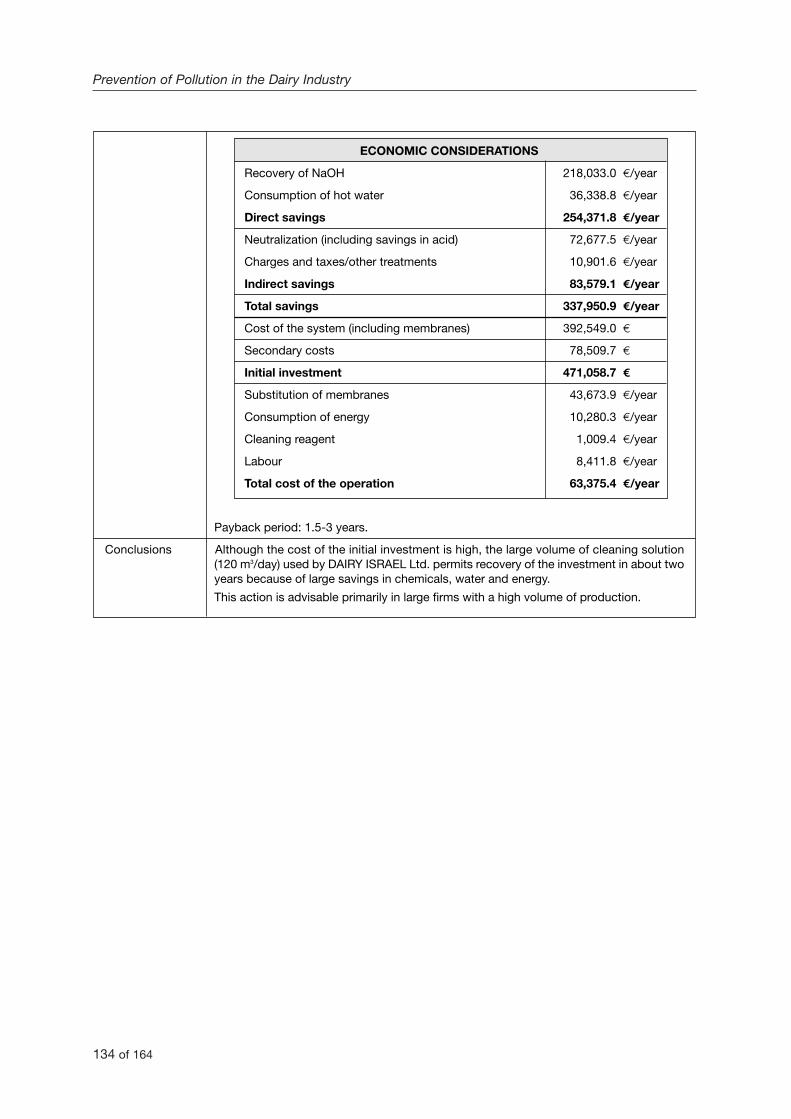
Prevention of Pollution in the Dairy Industry
134 of 164
ECONOMIC CONSIDERATIONS
Recovery of NaOH 218,033.0 e/year
Consumption of hot water 36,338.8 e/year
Direct savings 254,371.8 e/year
Neutralization (including savings in acid) 72,677.5 e/year
Charges and taxes/other treatments 10,901.6 e/year
Indirect savings 83,579.1 e/year
Total savings 337,950.9 e/year
Cost of the system (including membranes) 392,549.0 e
Secondary costs 78,509.7 e
Initial investment 471,058.7 e
Substitution of membranes 43,673.9 e/year
Consumption of energy 10,280.3 e/year
Cleaning reagent 1,009.4 e/year
Labour 8,411.8 e/year
Total cost of the operation 63,375.4 e/year
Payback period: 1.5-3 years.
Conclusions Although the cost of the initial investment is high, the large volume of cleaning solution(120 m3/day) used by DAIRY ISRAEL Ltd. permits recovery of the investment in about twoyears because of large savings in chemicals, water and energy.
This action is advisable primarily in large firms with a high volume of production.
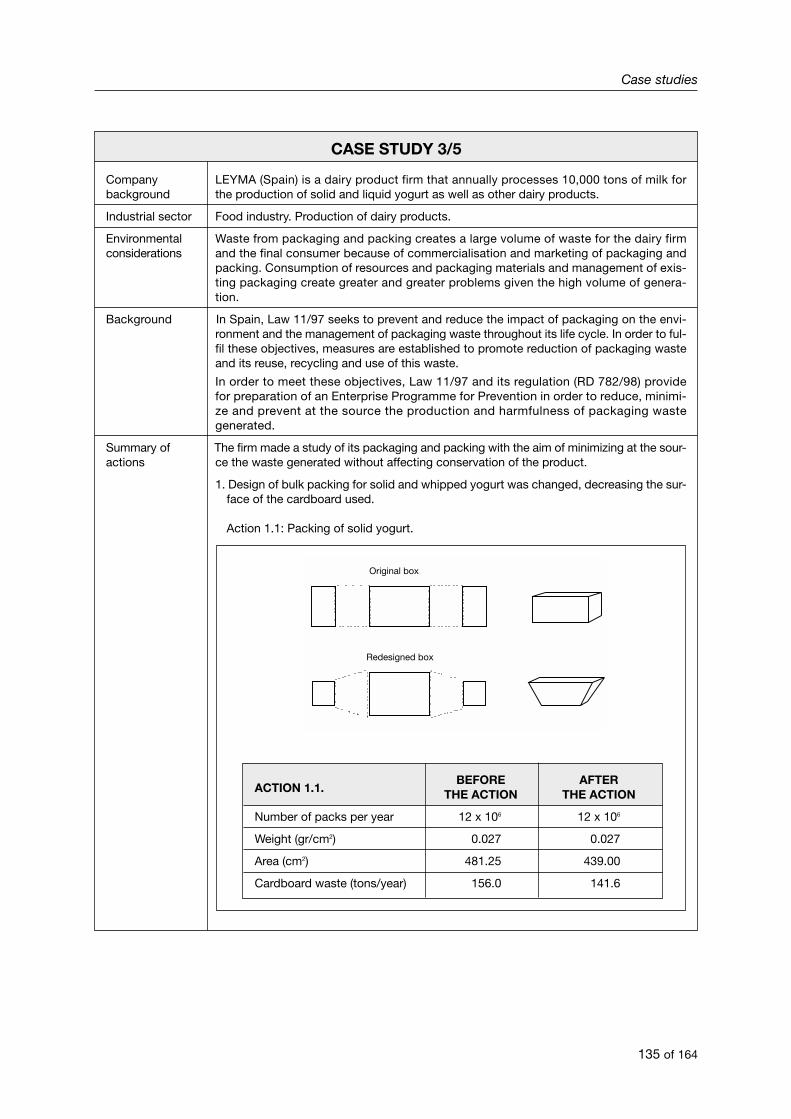
Case studies
135 of 164
Original box
Redesigned box
ACTION 1.1.BEFORE AFTER
THE ACTION THE ACTION
Number of packs per year 12 x 106 12 x 106
Weight (gr/cm2) 0.027 0.027
Area (cm2) 481.25 439.00
Cardboard waste (tons/year) 156.0 141.6
CASE STUDY 3/5
Company LEYMA (Spain) is a dairy product firm that annually processes 10,000 tons of milk for background the production of solid and liquid yogurt as well as other dairy products.
Industrial sector Food industry. Production of dairy products.
Environmental Waste from packaging and packing creates a large volume of waste for the dairy firmconsiderations and the final consumer because of commercialisation and marketing of packaging and
packing. Consumption of resources and packaging materials and management of exis-ting packaging create greater and greater problems given the high volume of genera-tion.
Background In Spain, Law 11/97 seeks to prevent and reduce the impact of packaging on the envi-ronment and the management of packaging waste throughout its life cycle. In order to ful-fil these objectives, measures are established to promote reduction of packaging wasteand its reuse, recycling and use of this waste.
In order to meet these objectives, Law 11/97 and its regulation (RD 782/98) providefor preparation of an Enterprise Programme for Prevention in order to reduce, minimi-ze and prevent at the source the production and harmfulness of packaging wastegenerated.
Summary of The firm made a study of its packaging and packing with the aim of minimizing at the sour-actions ce the waste generated without affecting conservation of the product.
1. Design of bulk packing for solid and whipped yogurt was changed, decreasing the sur-face of the cardboard used.
Action 1.1: Packing of solid yogurt.
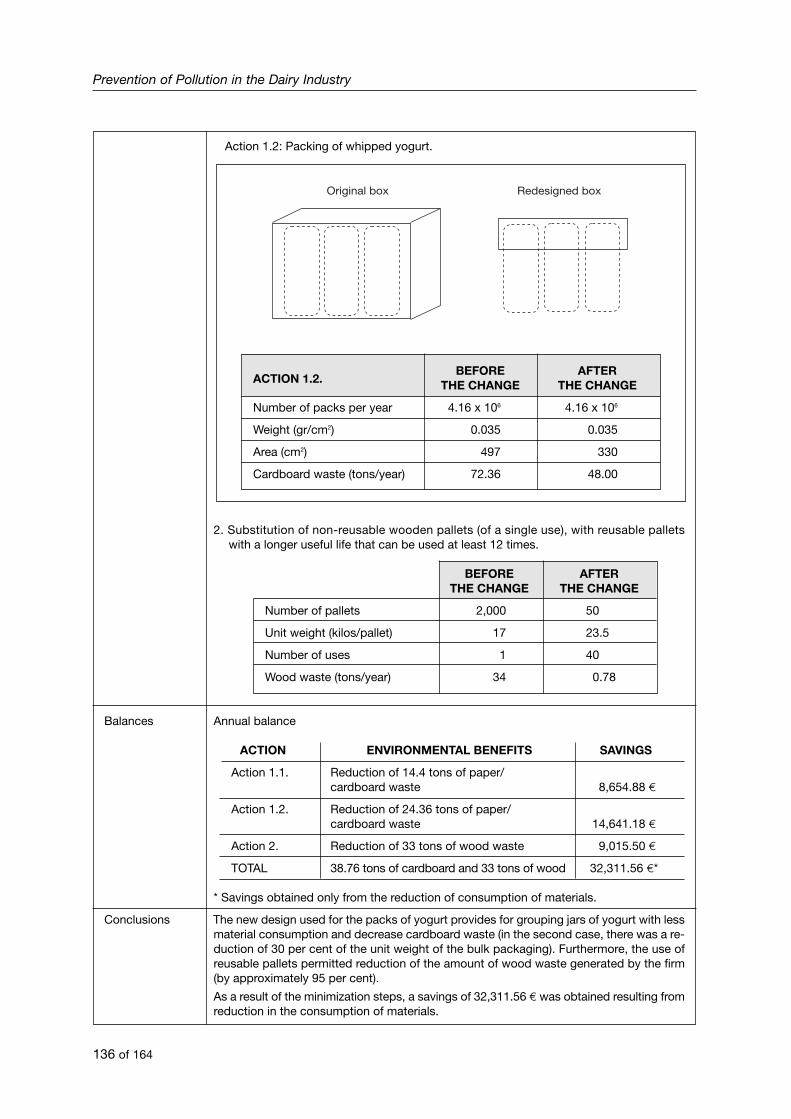
Action 1.2: Packing of whipped yogurt.
2. Substitution of non-reusable wooden pallets (of a single use), with reusable palletswith a longer useful life that can be used at least 12 times.
BEFORE AFTERTHE CHANGE THE CHANGE
Number of pallets 2,000 50
Unit weight (kilos/pallet) 17 23.5
Number of uses 1 40
Wood waste (tons/year) 34 0.78
Balances Annual balance
ACTION ENVIRONMENTAL BENEFITS SAVINGS
Action 1.1. Reduction of 14.4 tons of paper/cardboard waste 8,654.88 e
Action 1.2. Reduction of 24.36 tons of paper/cardboard waste 14,641.18 e
Action 2. Reduction of 33 tons of wood waste 9,015.50 e
TOTAL 38.76 tons of cardboard and 33 tons of wood 32,311.56 e*
* Savings obtained only from the reduction of consumption of materials.
Conclusions The new design used for the packs of yogurt provides for grouping jars of yogurt with less material consumption and decrease cardboard waste (in the second case, there was a re-duction of 30 per cent of the unit weight of the bulk packaging). Furthermore, the use ofreusable pallets permitted reduction of the amount of wood waste generated by the firm(by approximately 95 per cent).
As a result of the minimization steps, a savings of 32,311.56 ¤ was obtained resulting fromreduction in the consumption of materials.
Prevention of Pollution in the Dairy Industry
136 of 164
ACTION 1.2.BEFORE AFTER
THE CHANGE THE CHANGE
Number of packs per year 4.16 x 10⁶ 4.16 x 10⁶
Weight (gr/cm2) 0.035 0.035
Area (cm2) 497 330
Cardboard waste (tons/year) 72.36 48.00
Original box Redesigned box

Metodología de Grupos de Trabajo
137 of 164
CASE STUDY 4/5
Company MISR. COMPANY FOR DAIRY AND FOOD (Egypt) is one of the largest producers of dai-background ry products in Egypt. The factory processes annually an average of 7,200 tons of milk,
producing mainly pasteurised milk, white cheese, blue cheese and mish. Yoghurt, sourcream, ghee and processed cheese are also produced. An industrial audit was conduc-ted in this company in order to identify pollution prevention opportunities.
Industrial sector Food industry sector. Production of dairy products.
Environmental The audit identified a series of environmental considerations to take into account, main-considerations ly due to the following reasons:
– Different solid wastes were stored haphazardly in open areas and roads, constituting afire risk and impairing the general appearance of the premises.
– Considerable amounts of milk were wasted due to overflow during the filling of storageand service tanks.
– Milk leakages occurred in the milk packaging and refrigeration units.– Oil used in the car and truck maintenance facilities was drained to factory sewers, en-
couraging drain blockage and consequent development of foul odours.– Excessive consumption of mazot in the boiler house, due to poorly turned boilers. This
also resulted in excessive air emissions being discharged form the boiler stacks.
Background During the audit stage, particular attention was paid to those improvements which couldbe carried out at low or no cost to the factory, focusing on the following options:
1) Good housekeeping: improvement of factory units and buildings, maintenance and up-grading of factory drainage, sewers, and manholes to eliminate blockage and overflowproblems, collection of garage oil for resale, and segregation of solid wastes genera-ted to be afterwards disposed or sold.
2) Water and energy conservation: optimisation of the ratio of air to mazot to increase theefficiency of the boilers and restoration of the softening unit to prevent the scaling ofthe boiler by chemical treatment of the feedwater.
3) Reuse and recycling: upgrading of raw milk storage units and the refrigeration roomof the packaged milk products to prevent spoilage and loss, reuse of 50% of thepermeate with a high lactose concentration in the cheese packaging stage in placeof fresh water, and installation of level controls in storage tanks and control valvesthroughout the factory.
Summary of The following actions and achievements were put into practice:actions 1) With low cost, improvement of the cleanliness of the factory premises was achieved,
a monthly accumulation of 0.75 tons of used garage oil was sold at 81.4 e per ton, the-reby reducing the strength of wastwater, and preventing blockage of sewers and over-flow, and an efficient removal of solid wastes from the site was achieved with additio-nal economic benefits due to selling of the same.
2) By means of the boiler tune-up and upgrade, mazot consumption was reduced by 60tons/year and, in addtition, energy consumption reduction was also achieved. With therestoration of the softening unit, a 16% increase in boiler efficiency was achieved.
3) By means of the installation of a refrigeration system which permitted temperature tobe fully controlled and the relocation of the packaging unit from a restricted area to beadjacent to the refrigeration facility thus preventing handling losses, production capa-city, process efficiency and quality control were improved, and a reduction of 3.3tons/month of milk losses was achieved.By reusing permeate in the cheese packaging stage, a 50% drop in the organic loadgenerated from the white cheese unit was achieved, and 2,200 m3 of water were savedon an manual basis.By installing level controls and control valves, daily savings of 350 kg of milk were ob-tained and pollution loads were reduced, thus improving cleanliness and hygiene.
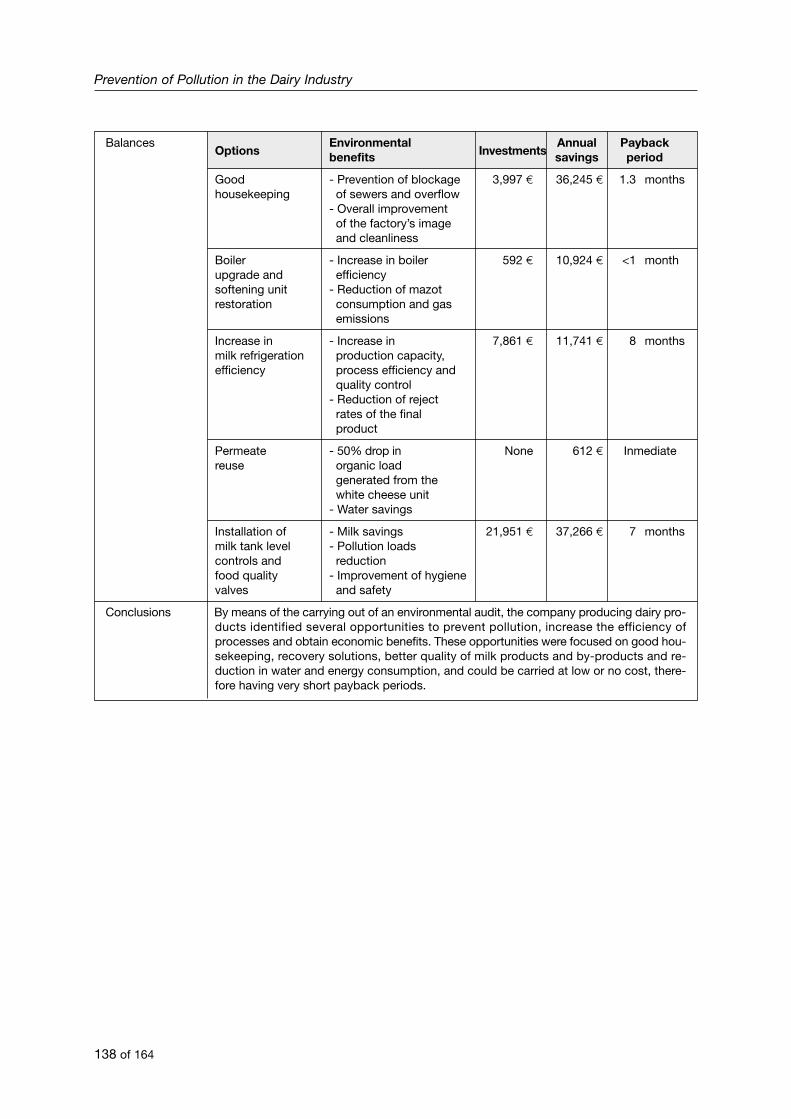
Prevention of Pollution in the Dairy Industry
138 of 164
BalancesOptions
EnvironmentalInvestments
Annual Paybackbenefits savings period
Good - Prevention of blockage 3,997 E 36,245 E 1.3 monthshousekeeping of sewers and overflow
- Overall improvementof the factory’s imageand cleanliness
Boiler - Increase in boiler 592 E 10,924 E <1 monthupgrade and efficiencysoftening unit - Reduction of mazot restoration consumption and gas
emissions
Increase in - Increase in 7,861 E 11,741 E 8 monthsmilk refrigeration production capacity,efficiency process efficiency and
quality control- Reduction of rejectrates of the finalproduct
Permeate - 50% drop in None 612 E Inmediatereuse organic load
generated from thewhite cheese unit
- Water savings
Installation of - Milk savings 21,951 E 37,266 E 7 monthsmilk tank level - Pollution loadscontrols and reductionfood quality - Improvement of hygienevalves and safety
Conclusions By means of the carrying out of an environmental audit, the company producing dairy pro-ducts identified several opportunities to prevent pollution, increase the efficiency ofprocesses and obtain economic benefits. These opportunities were focused on good hou-sekeeping, recovery solutions, better quality of milk products and by-products and re-duction in water and energy consumption, and could be carried at low or no cost, there-fore having very short payback periods.
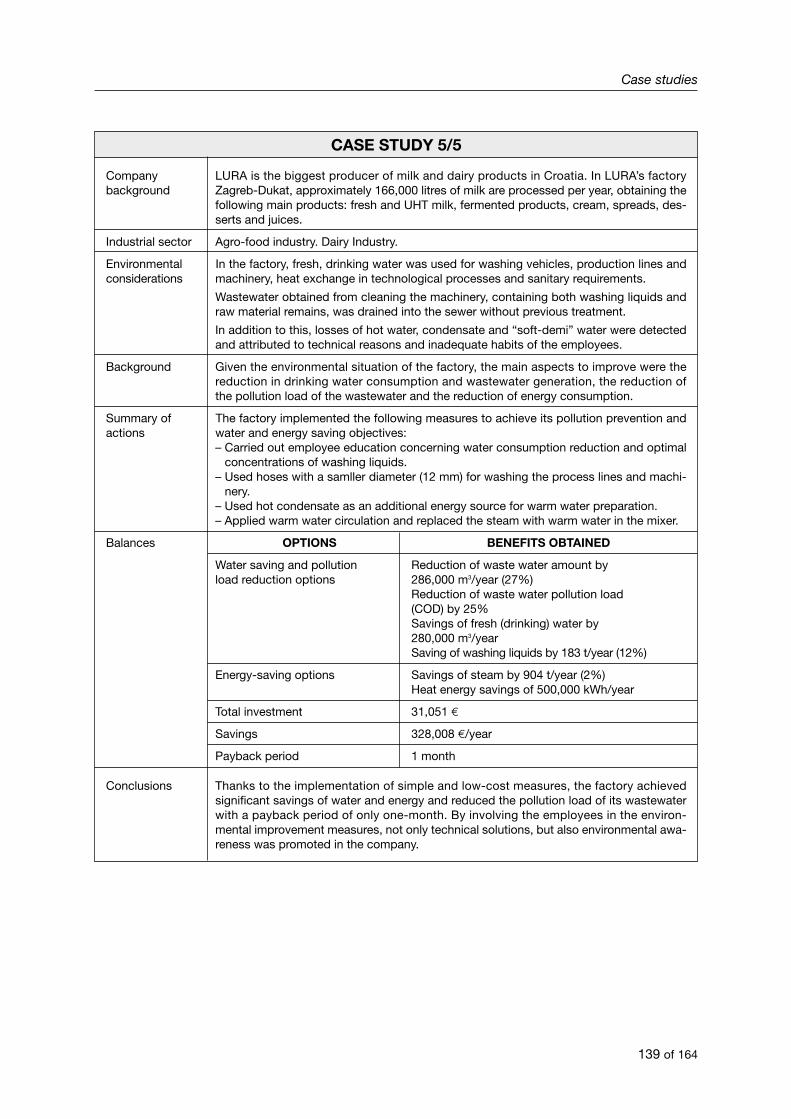
Case studies
139 of 164
CASE STUDY 5/5
Company LURA is the biggest producer of milk and dairy products in Croatia. In LURA’s factorybackground Zagreb-Dukat, approximately 166,000 litres of milk are processed per year, obtaining the
following main products: fresh and UHT milk, fermented products, cream, spreads, des-serts and juices.
Industrial sector Agro-food industry. Dairy Industry.
Environmental In the factory, fresh, drinking water was used for washing vehicles, production lines andconsiderations machinery, heat exchange in technological processes and sanitary requirements.
Wastewater obtained from cleaning the machinery, containing both washing liquids andraw material remains, was drained into the sewer without previous treatment.
In addition to this, losses of hot water, condensate and “soft-demi” water were detectedand attributed to technical reasons and inadequate habits of the employees.
Background Given the environmental situation of the factory, the main aspects to improve were thereduction in drinking water consumption and wastewater generation, the reduction ofthe pollution load of the wastewater and the reduction of energy consumption.
Summary of The factory implemented the following measures to achieve its pollution prevention and actions water and energy saving objectives:
– Carried out employee education concerning water consumption reduction and optimalconcentrations of washing liquids.
– Used hoses with a samller diameter (12 mm) for washing the process lines and machi-nery.
– Used hot condensate as an additional energy source for warm water preparation.– Applied warm water circulation and replaced the steam with warm water in the mixer.
Balances OPTIONS BENEFITS OBTAINED
Water saving and pollution Reduction of waste water amount by load reduction options 286,000 m3/year (27%)
Reduction of waste water pollution load(COD) by 25%Savings of fresh (drinking) water by280,000 m3/yearSaving of washing liquids by 183 t/year (12%)
Energy-saving options Savings of steam by 904 t/year (2%)Heat energy savings of 500,000 kWh/year
Total investment 31,051 E
Savings 328,008 E/year
Payback period 1 month
Conclusions Thanks to the implementation of simple and low-cost measures, the factory achievedsignificant savings of water and energy and reduced the pollution load of its wastewaterwith a payback period of only one-month. By involving the employees in the environ-mental improvement measures, not only technical solutions, but also environmental awa-reness was promoted in the company.

Prevention of Pollution in the Dairy Industry
140 of 152
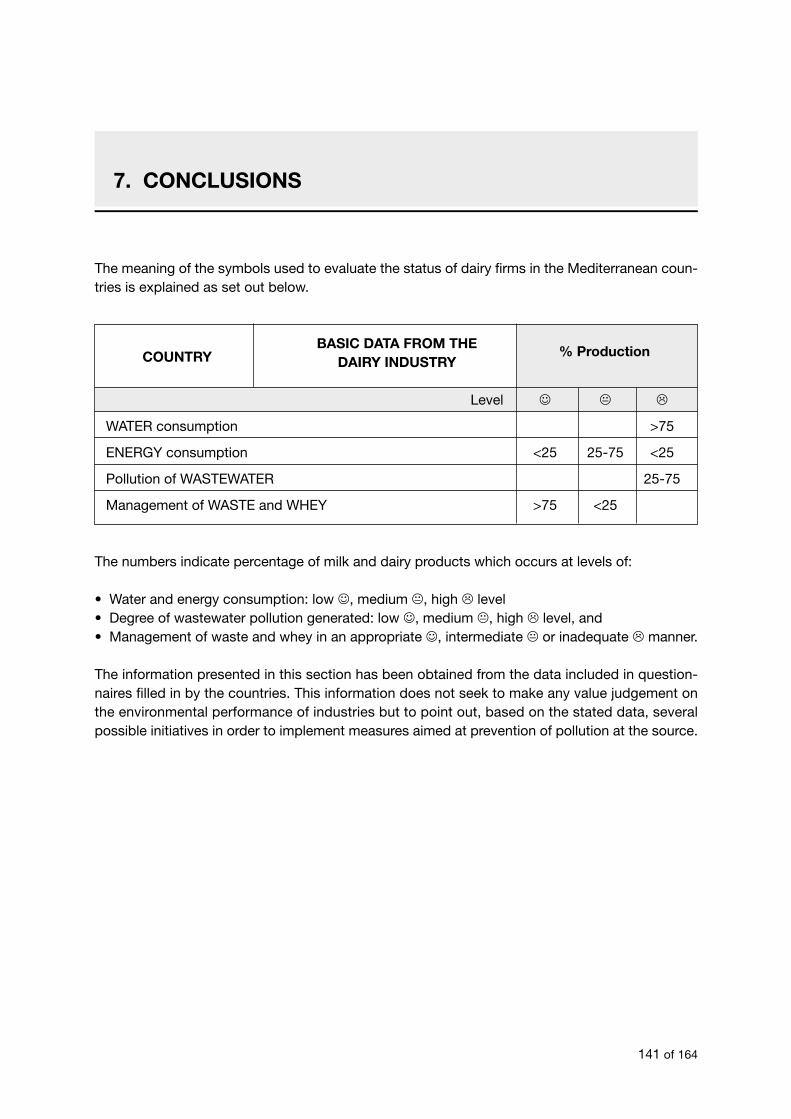
The meaning of the symbols used to evaluate the status of dairy firms in the Mediterranean coun-tries is explained as set out below.
BASIC DATA FROM THE % ProductionCOUNTRY DAIRY INDUSTRY
Level ☺ � �
WATER consumption >75
ENERGY consumption <25 25-75 <25
Pollution of WASTEWATER 25-75
Management of WASTE and WHEY >75 <25
The numbers indicate percentage of milk and dairy products which occurs at levels of:
• Water and energy consumption: low ☺, medium �, high � level • Degree of wastewater pollution generated: low ☺, medium �, high � level, and• Management of waste and whey in an appropriate ☺, intermediate � or inadequate � manner.
The information presented in this section has been obtained from the data included in question-naires filled in by the countries. This information does not seek to make any value judgement onthe environmental performance of industries but to point out, based on the stated data, severalpossible initiatives in order to implement measures aimed at prevention of pollution at the source.
Metodología de Grupos de Trabajo
141 of 164
7. CONCLUSIONS
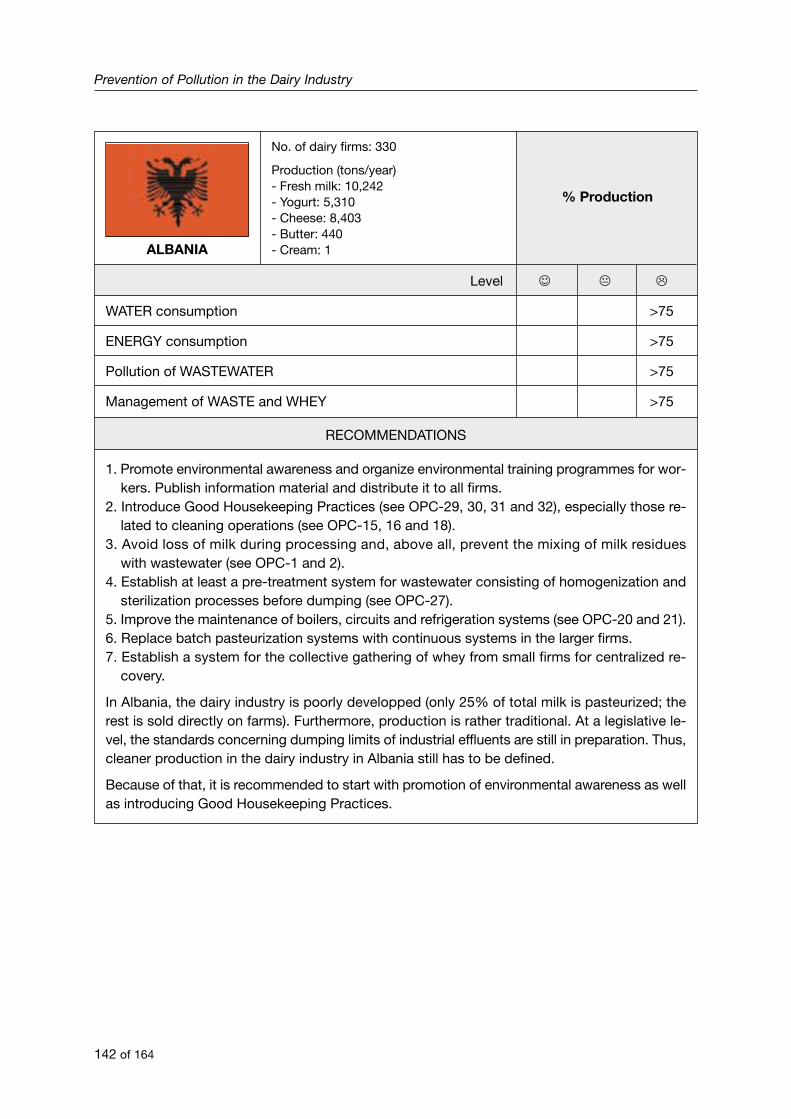
Prevention of Pollution in the Dairy Industry
142 of 164
ALBANIA
No. of dairy firms: 330
Production (tons/year)- Fresh milk: 10,242- Yogurt: 5,310- Cheese: 8,403- Butter: 440- Cream: 1
% Production
Level ☺ � �
WATER consumption >75
ENERGY consumption >75
Pollution of WASTEWATER >75
Management of WASTE and WHEY >75
RECOMMENDATIONS
1. Promote environmental awareness and organize environmental training programmes for wor-kers. Publish information material and distribute it to all firms.
2. Introduce Good Housekeeping Practices (see OPC-29, 30, 31 and 32), especially those re-lated to cleaning operations (see OPC-15, 16 and 18).
3. Avoid loss of milk during processing and, above all, prevent the mixing of milk residueswith wastewater (see OPC-1 and 2).
4. Establish at least a pre-treatment system for wastewater consisting of homogenization andsterilization processes before dumping (see OPC-27).
5. Improve the maintenance of boilers, circuits and refrigeration systems (see OPC-20 and 21).6. Replace batch pasteurization systems with continuous systems in the larger firms.7. Establish a system for the collective gathering of whey from small firms for centralized re-
covery.
In Albania, the dairy industry is poorly developped (only 25% of total milk is pasteurized; therest is sold directly on farms). Furthermore, production is rather traditional. At a legislative le-vel, the standards concerning dumping limits of industrial effluents are still in preparation. Thus,cleaner production in the dairy industry in Albania still has to be defined.
Because of that, it is recommended to start with promotion of environmental awareness as wellas introducing Good Housekeeping Practices.
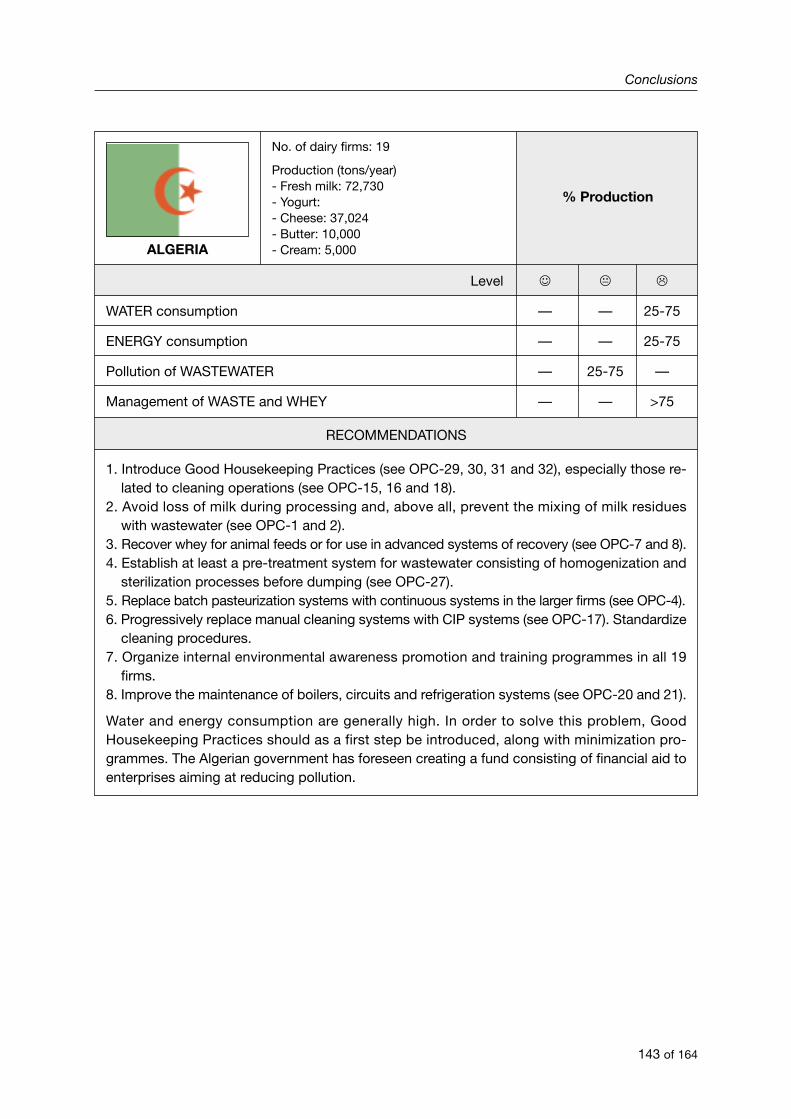
Conclusions
143 of 164
ALGERIA
No. of dairy firms: 19
Production (tons/year)- Fresh milk: 72,730- Yogurt: - Cheese: 37,024- Butter: 10,000- Cream: 5,000
% Production
Level ☺ � �
WATER consumption — — 25-75
ENERGY consumption — — 25-75
Pollution of WASTEWATER — 25-75 —
Management of WASTE and WHEY — — >75
RECOMMENDATIONS
1. Introduce Good Housekeeping Practices (see OPC-29, 30, 31 and 32), especially those re-lated to cleaning operations (see OPC-15, 16 and 18).
2. Avoid loss of milk during processing and, above all, prevent the mixing of milk residueswith wastewater (see OPC-1 and 2).
3. Recover whey for animal feeds or for use in advanced systems of recovery (see OPC-7 and 8).4. Establish at least a pre-treatment system for wastewater consisting of homogenization and
sterilization processes before dumping (see OPC-27).5. Replace batch pasteurization systems with continuous systems in the larger firms (see OPC-4).6. Progressively replace manual cleaning systems with CIP systems (see OPC-17). Standardize
cleaning procedures.7. Organize internal environmental awareness promotion and training programmes in all 19
firms.8. Improve the maintenance of boilers, circuits and refrigeration systems (see OPC-20 and 21).
Water and energy consumption are generally high. In order to solve this problem, GoodHousekeeping Practices should as a first step be introduced, along with minimization pro-grammes. The Algerian government has foreseen creating a fund consisting of financial aid toenterprises aiming at reducing pollution.
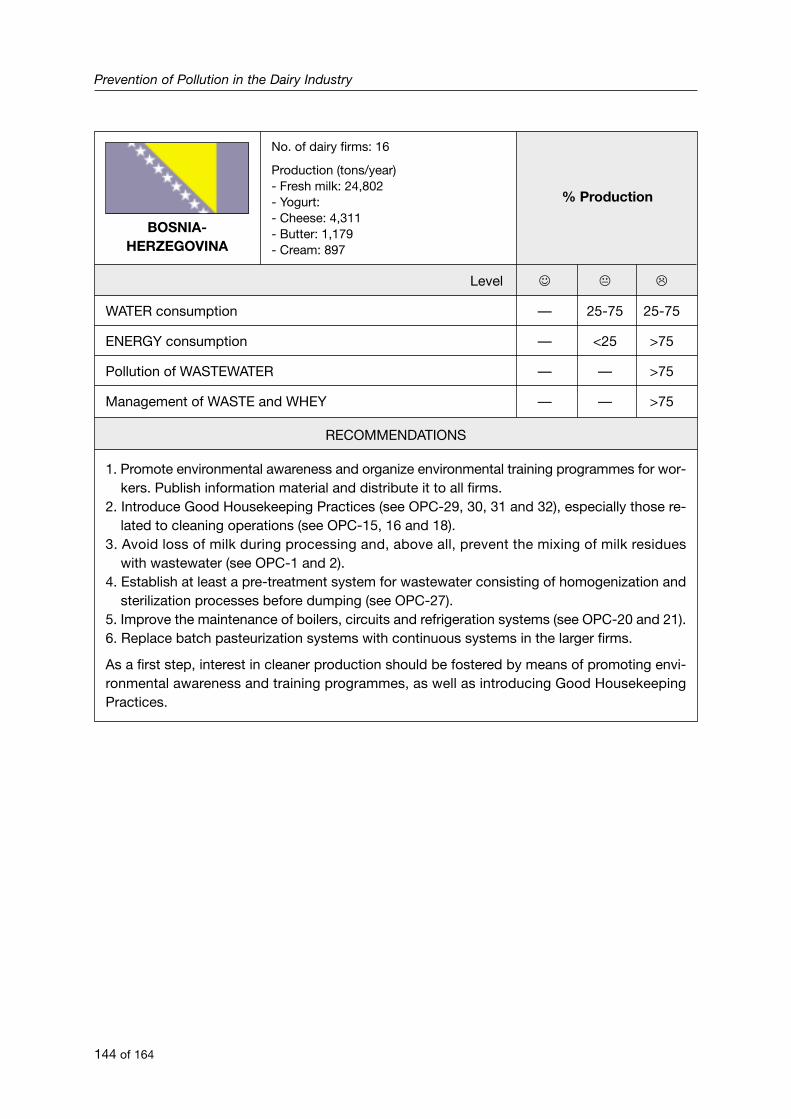
Prevention of Pollution in the Dairy Industry
144 of 164
BOSNIA-HERZEGOVINA
No. of dairy firms: 16
Production (tons/year)- Fresh milk: 24,802- Yogurt: - Cheese: 4,311- Butter: 1,179- Cream: 897
% Production
Level ☺ � �
WATER consumption — 25-75 25-75
ENERGY consumption — <25 >75
Pollution of WASTEWATER — — >75
Management of WASTE and WHEY — — >75
RECOMMENDATIONS
1. Promote environmental awareness and organize environmental training programmes for wor-kers. Publish information material and distribute it to all firms.
2. Introduce Good Housekeeping Practices (see OPC-29, 30, 31 and 32), especially those re-lated to cleaning operations (see OPC-15, 16 and 18).
3. Avoid loss of milk during processing and, above all, prevent the mixing of milk residueswith wastewater (see OPC-1 and 2).
4. Establish at least a pre-treatment system for wastewater consisting of homogenization andsterilization processes before dumping (see OPC-27).
5. Improve the maintenance of boilers, circuits and refrigeration systems (see OPC-20 and 21).6. Replace batch pasteurization systems with continuous systems in the larger firms.
As a first step, interest in cleaner production should be fostered by means of promoting envi-ronmental awareness and training programmes, as well as introducing Good HousekeepingPractices.
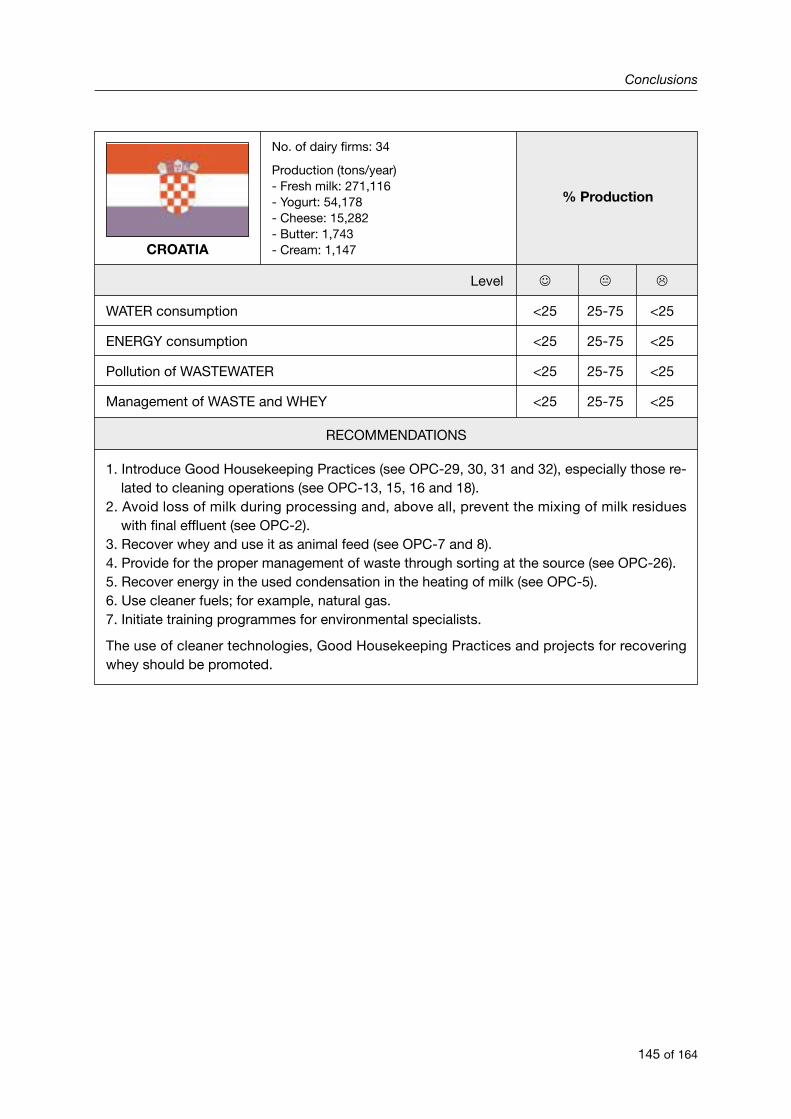
Conclusions
145 of 164
CROATIA
No. of dairy firms: 34
Production (tons/year)- Fresh milk: 271,116- Yogurt: 54,178- Cheese: 15,282- Butter: 1,743- Cream: 1,147
% Production
Level ☺ � �
WATER consumption <25 25-75 <25
ENERGY consumption <25 25-75 <25
Pollution of WASTEWATER <25 25-75 <25
Management of WASTE and WHEY <25 25-75 <25
RECOMMENDATIONS
1. Introduce Good Housekeeping Practices (see OPC-29, 30, 31 and 32), especially those re-lated to cleaning operations (see OPC-13, 15, 16 and 18).
2. Avoid loss of milk during processing and, above all, prevent the mixing of milk residueswith final effluent (see OPC-2).
3. Recover whey and use it as animal feed (see OPC-7 and 8).4. Provide for the proper management of waste through sorting at the source (see OPC-26).5. Recover energy in the used condensation in the heating of milk (see OPC-5).6. Use cleaner fuels; for example, natural gas.7. Initiate training programmes for environmental specialists.
The use of cleaner technologies, Good Housekeeping Practices and projects for recoveringwhey should be promoted.
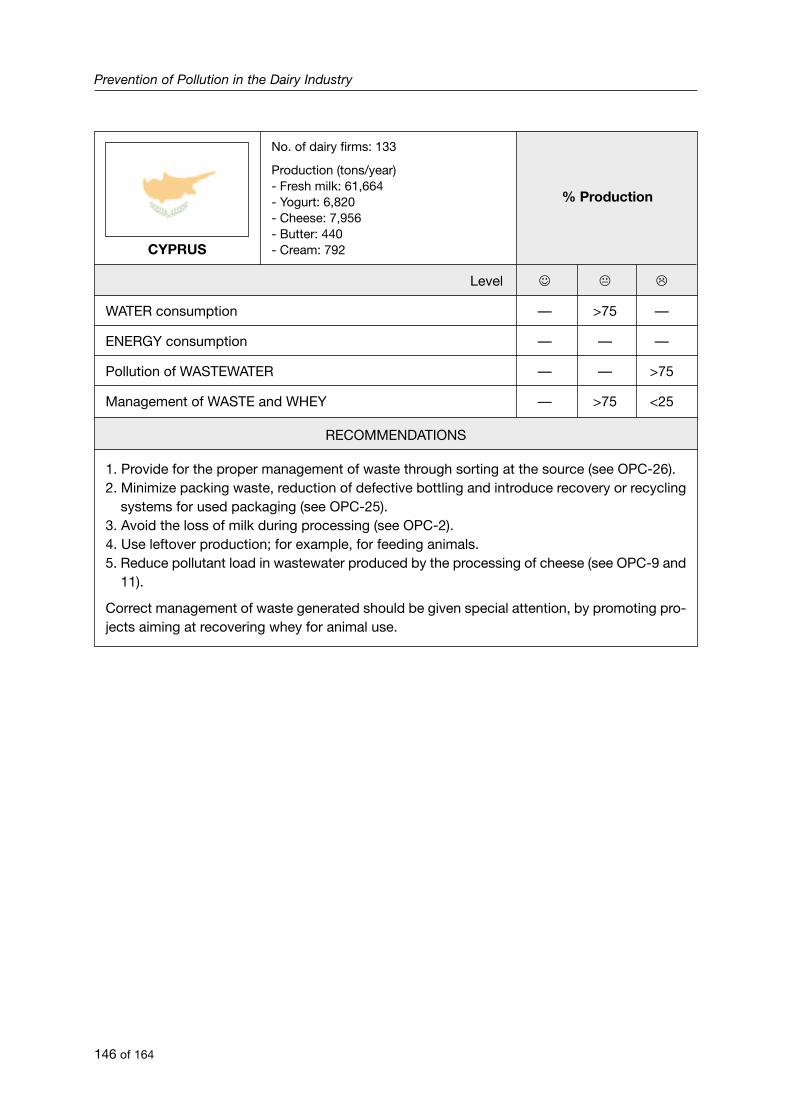
Prevention of Pollution in the Dairy Industry
146 of 164
CYPRUS
No. of dairy firms: 133
Production (tons/year)- Fresh milk: 61,664- Yogurt: 6,820- Cheese: 7,956- Butter: 440- Cream: 792
% Production
Level ☺ � �
WATER consumption — >75 —
ENERGY consumption — — —
Pollution of WASTEWATER — — >75
Management of WASTE and WHEY — >75 <25
RECOMMENDATIONS
1. Provide for the proper management of waste through sorting at the source (see OPC-26).2. Minimize packing waste, reduction of defective bottling and introduce recovery or recycling
systems for used packaging (see OPC-25).3. Avoid the loss of milk during processing (see OPC-2).4. Use leftover production; for example, for feeding animals.5. Reduce pollutant load in wastewater produced by the processing of cheese (see OPC-9 and
11).
Correct management of waste generated should be given special attention, by promoting pro-jects aiming at recovering whey for animal use.

Conclusions
147 of 164
EGYPT
No. of dairy firms: 3,334
Production (tons/year)- Fresh milk: 30,000- Yogurt: 2,500- Cheese: 310,000- Butter: 130,000- Cream:
% Production
Level ☺ � �
WATER consumption <25 <25 >75
ENERGY consumption — — —
Pollution of WASTEWATER <25 <25 >75
Management of WASTE and WHEY <25 25-75 25-75
RECOMMENDATIONS
1. Introduce Good Housekeeping Practices (see OPC-29, 30, 31 and 32).2. Establish at least a pre-treatment system for wastewater consisting of homogenization and
sterilization processes before dumping (see OPC-27).3. Provide for the sorting of waste at the source for later management (see OPC-26).4. Continue the trend of introducing CIP cleaning systems, reusing cleaning products where
new systems are introduced (see OPC-17 and 19).5. Where manual cleaning systems are used, introduce measures to reduce water consump-
tion (see OPC-14, 15, 16 and 18).6. Avoid the loss of milk in processing and reduce the quantity of milk incorporated into the
final effluent.7. Use continuous processes instead of batch processes (see OPC-4).8. Use milk residues in other products or using it in animal feed.9. Introduce measures for recovering energy (see OPC-5).
10. Improve the maintenance of boilers, circuits and refrigeration systems (see OPC-20 and 21).
In Egypt, there are initiatives related to cleaner production in the dairy industry. A project foruse of whey in animal feed has been successfully developed. Following this trend is recom-mended, by promoting these kind of projects not only in most advanced firms but also in thesmall ones.
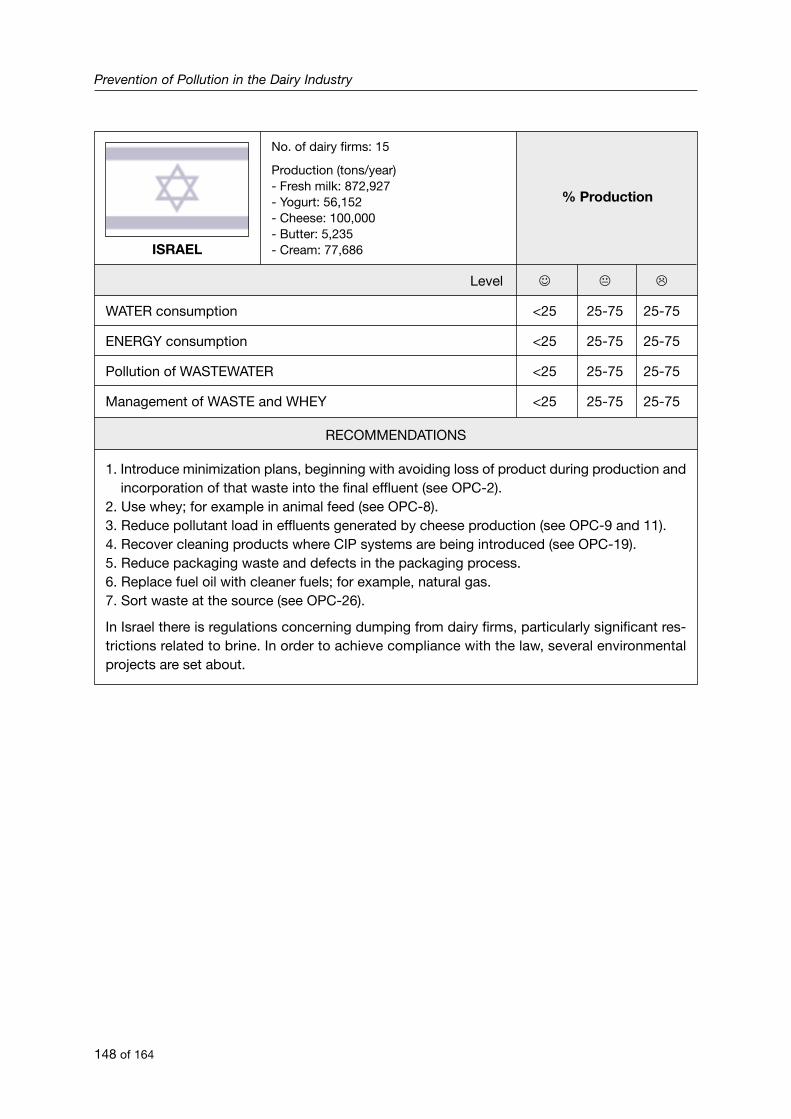
Prevention of Pollution in the Dairy Industry
148 of 164
ISRAEL
No. of dairy firms: 15
Production (tons/year)- Fresh milk: 872,927- Yogurt: 56,152- Cheese: 100,000- Butter: 5,235- Cream: 77,686
% Production
Level ☺ � �
WATER consumption <25 25-75 25-75
ENERGY consumption <25 25-75 25-75
Pollution of WASTEWATER <25 25-75 25-75
Management of WASTE and WHEY <25 25-75 25-75
RECOMMENDATIONS
1. Introduce minimization plans, beginning with avoiding loss of product during production andincorporation of that waste into the final effluent (see OPC-2).
2. Use whey; for example in animal feed (see OPC-8).3. Reduce pollutant load in effluents generated by cheese production (see OPC-9 and 11).4. Recover cleaning products where CIP systems are being introduced (see OPC-19).5. Reduce packaging waste and defects in the packaging process.6. Replace fuel oil with cleaner fuels; for example, natural gas.7. Sort waste at the source (see OPC-26).
In Israel there is regulations concerning dumping from dairy firms, particularly significant res-trictions related to brine. In order to achieve compliance with the law, several environmentalprojects are set about.
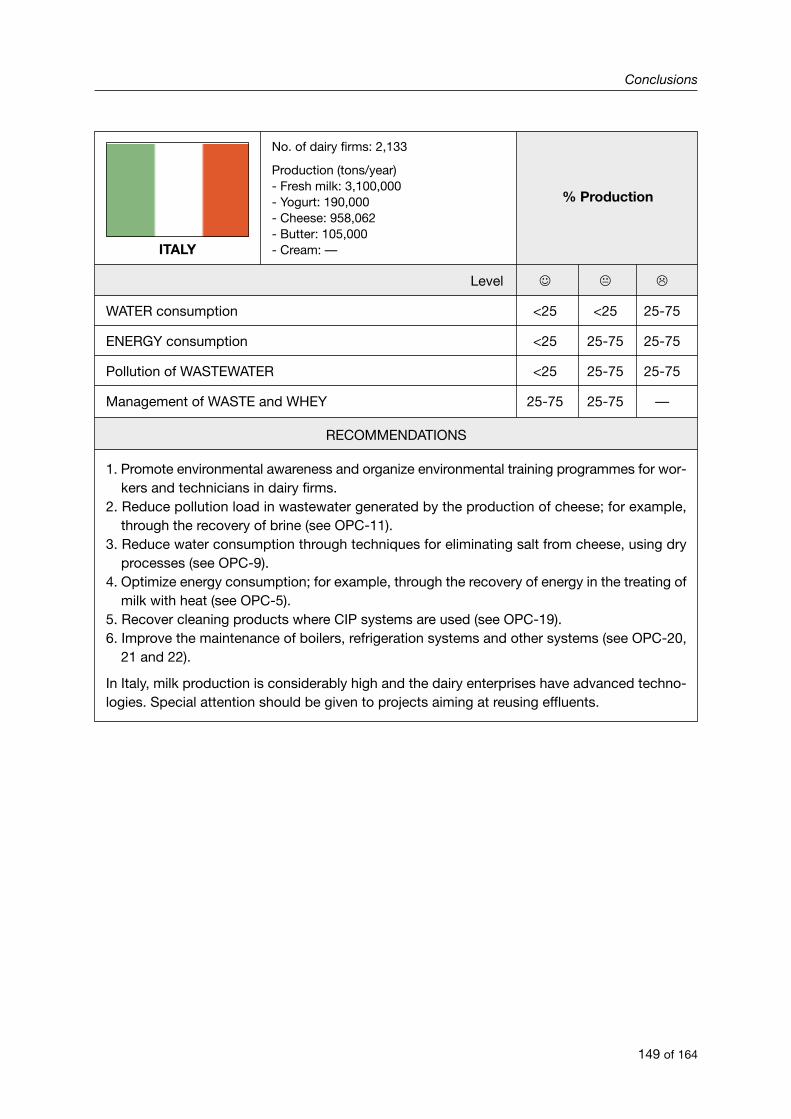
Conclusions
149 of 164
ITALY
No. of dairy firms: 2,133
Production (tons/year)- Fresh milk: 3,100,000- Yogurt: 190,000- Cheese: 958,062- Butter: 105,000- Cream: —
% Production
Level ☺ � �
WATER consumption <25 <25 25-75
ENERGY consumption <25 25-75 25-75
Pollution of WASTEWATER <25 25-75 25-75
Management of WASTE and WHEY 25-75 25-75 —
RECOMMENDATIONS
1. Promote environmental awareness and organize environmental training programmes for wor-kers and technicians in dairy firms.
2. Reduce pollution load in wastewater generated by the production of cheese; for example,through the recovery of brine (see OPC-11).
3. Reduce water consumption through techniques for eliminating salt from cheese, using dryprocesses (see OPC-9).
4. Optimize energy consumption; for example, through the recovery of energy in the treating ofmilk with heat (see OPC-5).
5. Recover cleaning products where CIP systems are used (see OPC-19).6. Improve the maintenance of boilers, refrigeration systems and other systems (see OPC-20,
21 and 22).
In Italy, milk production is considerably high and the dairy enterprises have advanced techno-logies. Special attention should be given to projects aiming at reusing effluents.
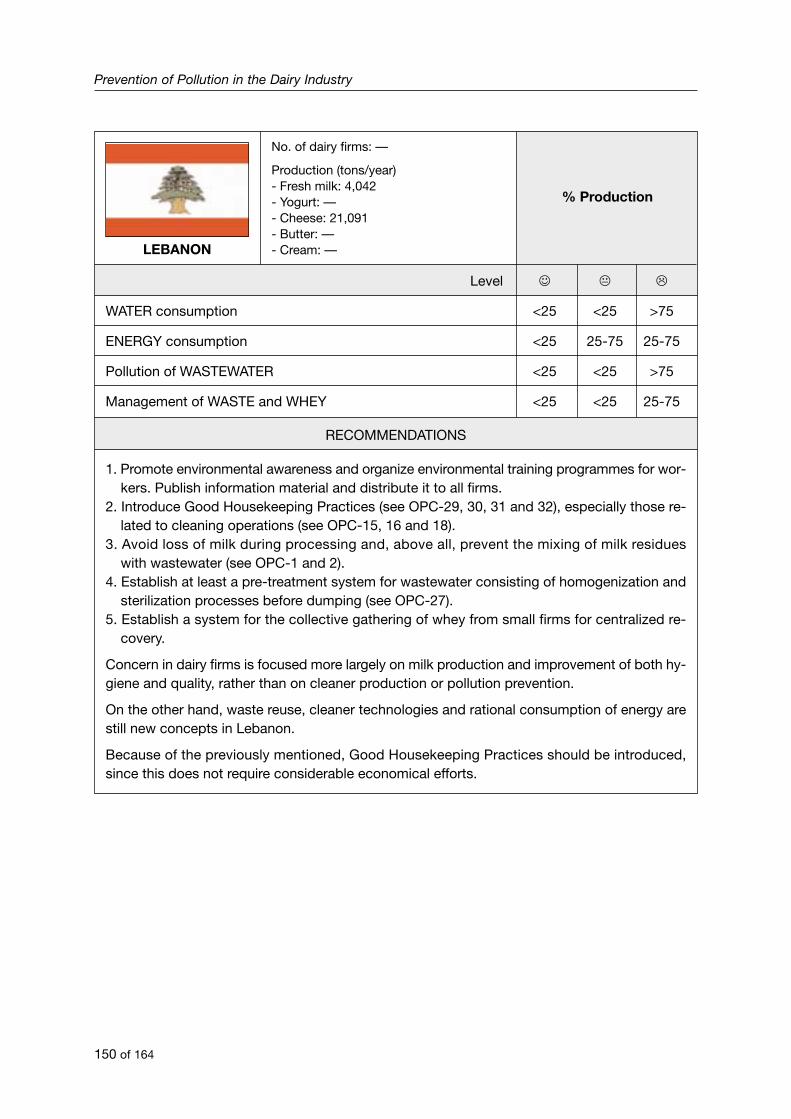
Prevention of Pollution in the Dairy Industry
150 of 164
LEBANON
No. of dairy firms: —
Production (tons/year)- Fresh milk: 4,042- Yogurt: —- Cheese: 21,091- Butter: —- Cream: —
% Production
Level ☺ � �
WATER consumption <25 <25 >75
ENERGY consumption <25 25-75 25-75
Pollution of WASTEWATER <25 <25 >75
Management of WASTE and WHEY <25 <25 25-75
RECOMMENDATIONS
1. Promote environmental awareness and organize environmental training programmes for wor-kers. Publish information material and distribute it to all firms.
2. Introduce Good Housekeeping Practices (see OPC-29, 30, 31 and 32), especially those re-lated to cleaning operations (see OPC-15, 16 and 18).
3. Avoid loss of milk during processing and, above all, prevent the mixing of milk residueswith wastewater (see OPC-1 and 2).
4. Establish at least a pre-treatment system for wastewater consisting of homogenization andsterilization processes before dumping (see OPC-27).
5. Establish a system for the collective gathering of whey from small firms for centralized re-covery.
Concern in dairy firms is focused more largely on milk production and improvement of both hy-giene and quality, rather than on cleaner production or pollution prevention.
On the other hand, waste reuse, cleaner technologies and rational consumption of energy arestill new concepts in Lebanon.
Because of the previously mentioned, Good Housekeeping Practices should be introduced,since this does not require considerable economical efforts.
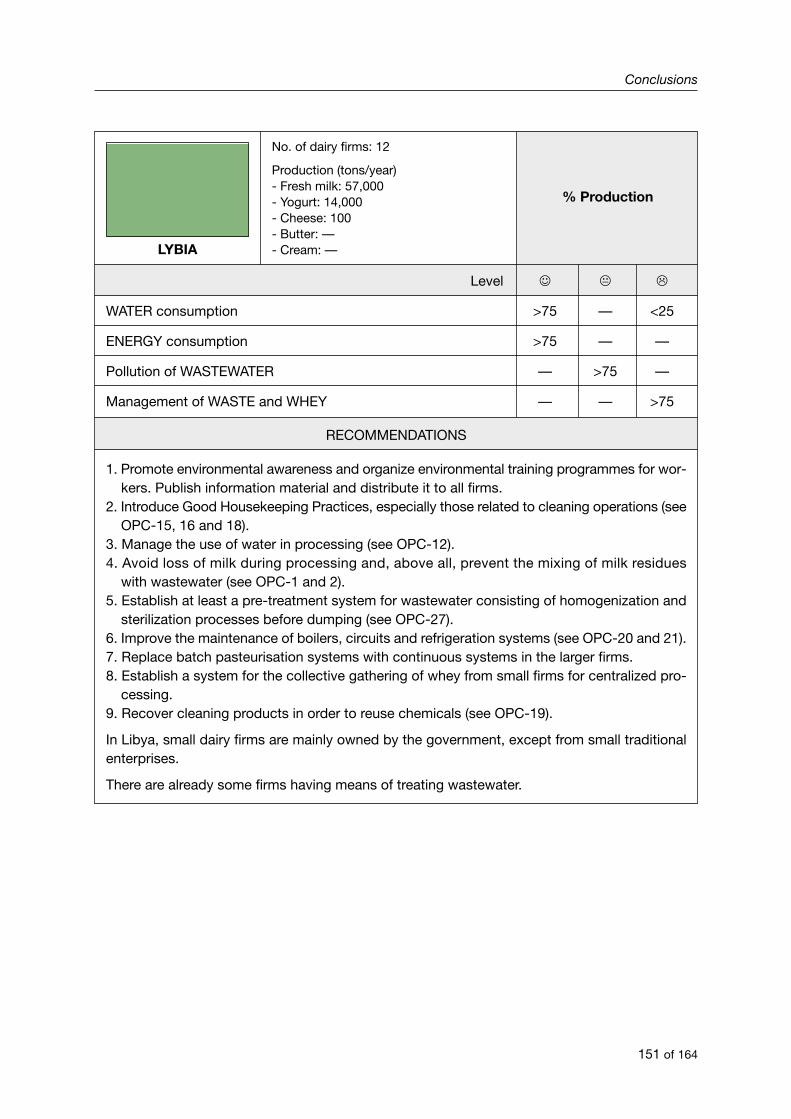
Conclusions
151 of 164
LYBIA
No. of dairy firms: 12
Production (tons/year)- Fresh milk: 57,000- Yogurt: 14,000- Cheese: 100- Butter: —- Cream: —
% Production
Level ☺ � �
WATER consumption >75 — <25
ENERGY consumption >75 — —
Pollution of WASTEWATER — >75 —
Management of WASTE and WHEY — — >75
RECOMMENDATIONS
1. Promote environmental awareness and organize environmental training programmes for wor-kers. Publish information material and distribute it to all firms.
2. Introduce Good Housekeeping Practices, especially those related to cleaning operations (seeOPC-15, 16 and 18).
3. Manage the use of water in processing (see OPC-12).4. Avoid loss of milk during processing and, above all, prevent the mixing of milk residues
with wastewater (see OPC-1 and 2).5. Establish at least a pre-treatment system for wastewater consisting of homogenization and
sterilization processes before dumping (see OPC-27).6. Improve the maintenance of boilers, circuits and refrigeration systems (see OPC-20 and 21).7. Replace batch pasteurisation systems with continuous systems in the larger firms.8. Establish a system for the collective gathering of whey from small firms for centralized pro-
cessing.9. Recover cleaning products in order to reuse chemicals (see OPC-19).
In Libya, small dairy firms are mainly owned by the government, except from small traditionalenterprises.
There are already some firms having means of treating wastewater.

Prevention of Pollution in the Dairy Industry
152 of 164
MALTA
No. of dairy firms: 1
Production (tons/year)- Fresh milk: 30,200- Yogurt: 1,510- Cheese: 2,300- Butter: —- Cream: 360
% Production
Level ☺ � �
WATER consumption <25 >75 25-75
ENERGY consumption 25-75 25-75 <25
Pollution of WASTEWATER <25 — >75
Management of WASTE and WHEY <25 — >75
RECOMMENDATIONS
1. Promote environmental awareness and organize environmental training programmes for wor-kers. Publish information material and distribute it to all firms.
2. Introduce Good Housekeeping Practices, especially those related to cleaning operations (seeOPC-15, 16 and 18).
3. Avoid loss of milk during processing and, above all, prevent the mixing of milk residueswith wastewater (see OPC-1 and 2).
4. Establish at least a pre-treatment system for wastewater consisting of homogenization andsterilization processes before dumping (see OPC-27).
5. Improve the maintenance of boilers, circuits and refrigeration systems (see OPC-20 and 21).6. Replace batch pasteurisation systems with continuous systems in the larger firms.7. Establish a system for the collective gathering of whey from small firms for centralized re-
covery.
There are many possibilities of environmental improve, especially concerning use of whey.

Conclusions
153 of 164
MOROCCO
No. of dairy firms: 38
Production (tons/year)- Fresh milk: 860,000- Yogurt: 390,000- Cheese: 10,686- Butter: 10,000- Cream: 66
% Production
Level ☺ � �
WATER consumption — <25 >75
ENERGY consumption <25 25-75 <25
Pollution of WASTEWATER — <25 >75
Management of WASTE and WHEY — <25 25-75
RECOMMENDATIONS
1. Promote environmental awareness and organize environmental training programmes for wor-kers. Publish information material and distribute it to all firms.
2. Introduce Good Housekeeping Practices (see OPC-29, 30, 31 and 32), especially those re-lated to cleaning operations (see OPC-15, 16 and 18).
3. Avoid loss of milk during processing and, above all, prevent the mixing of milk residueswith wastewater (see OPC-1 and 2).
4. Establish at least a pre-treatment system for wastewater consisting of homogenization andsterilization processes before dumping (see OPC-27).
5. Establish a system for the collective gathering of whey from small firms for centralized re-covery.
Due to current status of environmental management, introduction of Good HousekeepingPractices would be very useful, contributing to significantly improve it.
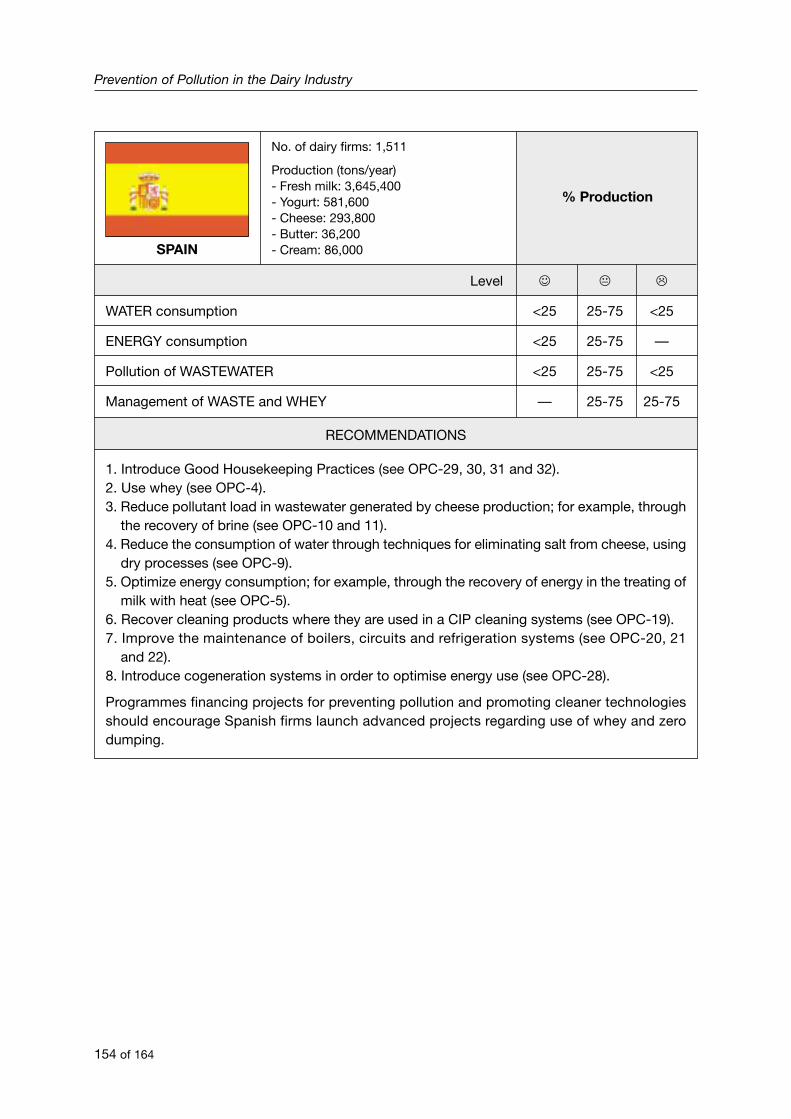
Prevention of Pollution in the Dairy Industry
154 of 164
SPAIN
No. of dairy firms: 1,511
Production (tons/year)- Fresh milk: 3,645,400- Yogurt: 581,600- Cheese: 293,800- Butter: 36,200- Cream: 86,000
% Production
Level ☺ � �
WATER consumption <25 25-75 <25
ENERGY consumption <25 25-75 —
Pollution of WASTEWATER <25 25-75 <25
Management of WASTE and WHEY — 25-75 25-75
RECOMMENDATIONS
1. Introduce Good Housekeeping Practices (see OPC-29, 30, 31 and 32).2. Use whey (see OPC-4).3. Reduce pollutant load in wastewater generated by cheese production; for example, through
the recovery of brine (see OPC-10 and 11).4. Reduce the consumption of water through techniques for eliminating salt from cheese, using
dry processes (see OPC-9).5. Optimize energy consumption; for example, through the recovery of energy in the treating of
milk with heat (see OPC-5).6. Recover cleaning products where they are used in a CIP cleaning systems (see OPC-19).7. Improve the maintenance of boilers, circuits and refrigeration systems (see OPC-20, 21
and 22).8. Introduce cogeneration systems in order to optimise energy use (see OPC-28).
Programmes financing projects for preventing pollution and promoting cleaner technologiesshould encourage Spanish firms launch advanced projects regarding use of whey and zerodumping.

Conclusions
155 of 164
SYRIA
No. of dairy firms: 31
Production (tons/year)- Fresh milk: 14,111- Yogurt: 7,030- Cheese: 82,170- Butter: 3,356- Cream: —
% Production
Level ☺ � �
WATER consumption — <25 >75
ENERGY consumption — >75 <25
Pollution of WASTEWATER — >75 <25
Management of WASTE and WHEY — <25 >75
RECOMMENDATIONS
1. Promote environmental awareness and organize environmental training programmes for wor-kers. Publish information material and distribute it to all firms.
2. Introduce Good Housekeeping Practices, especially those related to cleaning operations (seeOPC-15, 16 and 18).
3. Avoid loss of milk during processing and, above all, prevent the mixing of milk residueswith wastewater (see OPC-1 and 2).
4. Avoid the dumping of whey and establish a system for gathering and use of whey (see OPC-7 and 8).
6. Establish at least a pre-treatment system for wastewater consisting of homogenization andsterilization processes before dumping (see OPC-27).
5. Introduce measures to reduce water consumption (see OPC-12).
Most unattended environmental aspects are water consumption and management of waste andwhey. There is an initiative regarding reuse of whey that will be shortly developed. Water con-sumption could be significantly reduced by introducing Good Housekeeping Practices. This so-lution is perfectly feasible both for large enterprises and small-sized traditional firms (which re-present 70% of total number of firms), since they are generally simple operations with low cost.
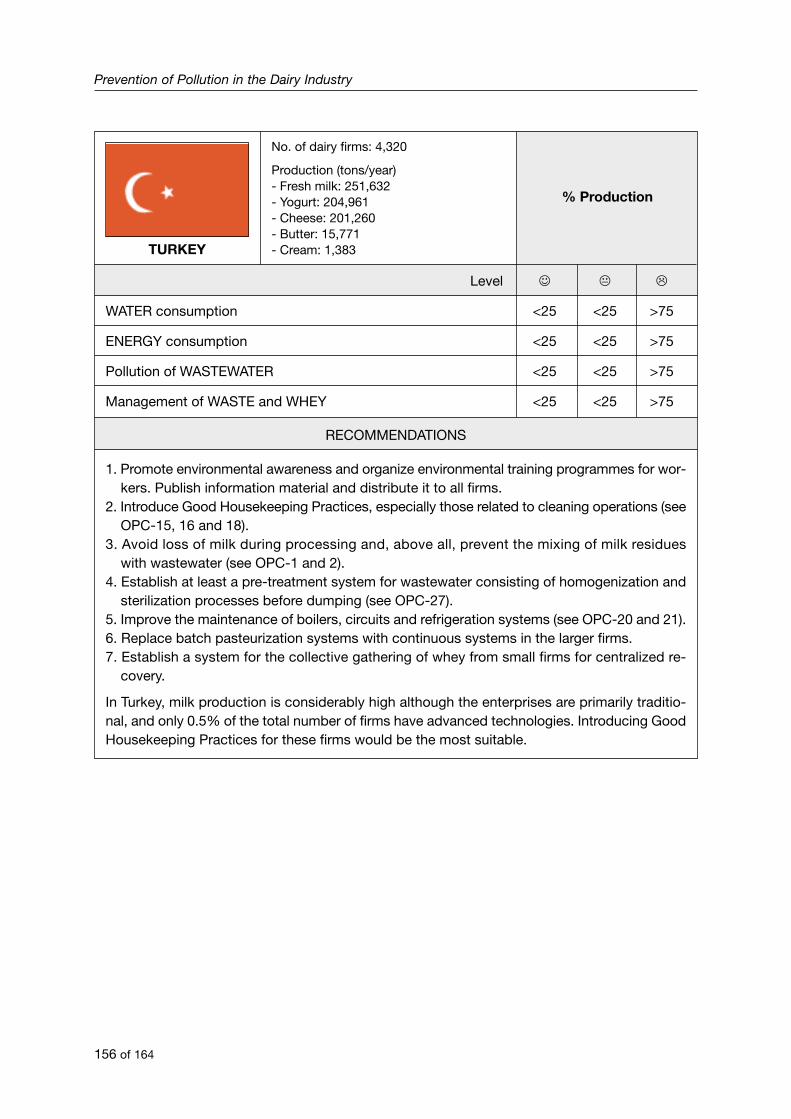
Prevention of Pollution in the Dairy Industry
156 of 164
TURKEY
No. of dairy firms: 4,320
Production (tons/year)- Fresh milk: 251,632- Yogurt: 204,961- Cheese: 201,260- Butter: 15,771- Cream: 1,383
% Production
Level ☺ � �
WATER consumption <25 <25 >75
ENERGY consumption <25 <25 >75
Pollution of WASTEWATER <25 <25 >75
Management of WASTE and WHEY <25 <25 >75
RECOMMENDATIONS
1. Promote environmental awareness and organize environmental training programmes for wor-kers. Publish information material and distribute it to all firms.
2. Introduce Good Housekeeping Practices, especially those related to cleaning operations (seeOPC-15, 16 and 18).
3. Avoid loss of milk during processing and, above all, prevent the mixing of milk residueswith wastewater (see OPC-1 and 2).
4. Establish at least a pre-treatment system for wastewater consisting of homogenization andsterilization processes before dumping (see OPC-27).
5. Improve the maintenance of boilers, circuits and refrigeration systems (see OPC-20 and 21).6. Replace batch pasteurization systems with continuous systems in the larger firms.7. Establish a system for the collective gathering of whey from small firms for centralized re-
covery.
In Turkey, milk production is considerably high although the enterprises are primarily traditio-nal, and only 0.5% of the total number of firms have advanced technologies. Introducing GoodHousekeeping Practices for these firms would be the most suitable.
8.1. Reference material
AINIA, 1998: Manual de buenas prácticas medioambientales.
AINIA: Guías Tecnológicas. Directiva 96/61 relativa a la prevención y control integrados de la con-taminación. Sector Agroalimentario.
AJKA Information Memorandum 2000.
BRENNAN J.G., BUTTERS J.R., COWELL N.D., LILLEY A. E.V., 1998. Las operaciones de la ingeniería delos alimentos. Editorial Acribia.
CEAS Consultants (Wye) Ltd, Centre for European Agricultural Studies, The European Forum onNature Conservation and Pastoralism, 2000: The environmental impact of dairy production inthe EU: practical options for the improvement of the environmental impact. Final report forEuropean Commision (DGXI).
Confederación Española de Organizaciones Empresariales. Agencia Española de CooperaciónInternacional, 1999: Proyecto CEOE TT PYMEs en Egipto. Sector Lácteo.
HAIDAR, J., 2001: Agriculture in Lebanon. Lebanese American University.
HYGINOV C., 2001. Guía para la elaboración de un plan de limpieza y desinfección. EditorialAranAcribia
Instituto Nacional de Estadística (INE): Encuesta Anual de Empresas.
KIERMEIER F., WILDBRETT G., 2000. Principios básicos de la limpieza. En Limpieza y desinfección enla industria agroalimentaria. Editorial Acribia. P. 67-84.
KLOPCIC, M., HABE, F.: Extension Service and Quality of Milk in Slovenia. University of Ljubljana.
LÓPEZ A. y HERNÁNDEZ A., 1995. Eficiencia energética de las industrias catalanas de procesado deleche líquida. Alimentación. Equipos y Tecnología. Julio/agosto: pág.: 35-42.
LUQUET F.M., 1991: Leche y Productos Lácteos. Editorial Acribia.
OMIL F. y MORALES F. J., 1996: Alternativas de tratamiento y recuperación de compuestos proteicosde los efluentes residuales del sector lácteo. Alimentación, Equipos, Tecnología.
PAINE F. y PAINE H., 1994. Manual de envasado de alimentos. Ediciones A. Madrid Vicente.
Metodología de Grupos de Trabajo
157 of 164
8. BIBLIOGRAPHY
PUIG-DURÁN FRESCO J., 1999. Ingeniería, Autocontrol y Auditoría de la Higiene en la IndustriaAlimentaria. Editorial Mundi-Prensa.
Rapporto Assolatte Industria Lattiero-Casearia Italiana, 2000.
Secretaría General Técnica. Ministerio de Agricultura, Pesca y Alimentación, 2000: Hechos y cifrasdel Sector Agroalimentario Español.
SPREER E., 1991. Lactología Industrial. Editorial Acribia.
Statistic of food association (Syria), 2001.
Statistics Year Book Egypt, 2000.
Syrian Standard, 1995.
Turkish National Water Pollution Control Act., 1988.
UNEP, 2000: Cleaner production assessment in dairy processing. United Nations Publications.95 pp.
USDA Foreign Agricultural Service: GAIN Reports (Global Agriculture Information Network).
VEISSEYRE R., 1988. Lactología Técnica. Composición, recogida, tratamiento y transformación de laleche. Editorial Acribia.
8.2. Other sources of information:
AECI (Spain).
Arab Federation for Food Industries.
Central Administration for Statistics of Lebanon.
Central Agency for Public Mobilization and Statistics of Egypt.
Central Bureau of Statistics of Israel.
Centre Marocain de Production Propre.
Croatian Central Bureau of Statiscs.
Cyprus Organisation of Dairy Products.
Danish Environmental Protection Agency.
Departamento Español de Aduanas.
Prevention of Pollution in the Dairy Industry
158 of 164
Israel Embassy.
EPAP, EEAA (Egypt).
Faculty of Agriculture by University of Zabreg.
FENIL (Federación Nacional de Industrias Lácteas).
Food Research Institute.
General Dairy Product (Lybia).
Greek Ministry of Agriculture.
Household Consumption Survey of Croatia.
IGEME. Turquía.
Industrial Statistics.
INSTAT.
Institut National de la Statistique. Republique Tunisienne.
Institute of Statistics of Albania.
Instituto Nacional de Estadística Español.
ISTAT (Italy).
MA (France).
MAI (Israel).
Manufacturers Association of Israel.
Ministère de l'Agriculture, du Développement Rural et des Eaux et Forêts.
Ministerio de Agricultura, Pesca y Alimentación. FIAB (Spain).
Ministry of Agriculture and Rural affairs of Turkey.
Ministry of Commerce, Industry and Tourism of Cyprus.
Ministry of Industry of Algeria.
Ministry of Industry of Syria.
Bibliography
159 of 164

Ministry of Public Economy and Privatisation of the Republic of Albania. National Agency ofPrivatisation.
National Institute of Statistics and Economic Studies France.
National Office of Statistics of Algeria.
National Statistical Institute of Italy.
National Statistical Service of Greece.
National Statistics Office of Malta.
SEAM/Entec (Support for Environmental Assessment and Management).
State Institute of Statistics Turkey.
Statistical Office Slovenia.
Statistical Service of Cyprus.
Statistics Directorate Morocco.
UNEP.
8.3. On-line resources:
Corporate Information: http://www.corporateinformation.com
Euromilk. European Dairy Industry Figures: http://www.eda.euromilk.org
FAOSTAT Database: http://www.fao.org
Tradeport Food Market Reports: http://www.tradeport.org
Prevention of Pollution in the Dairy Industry
160 of 164
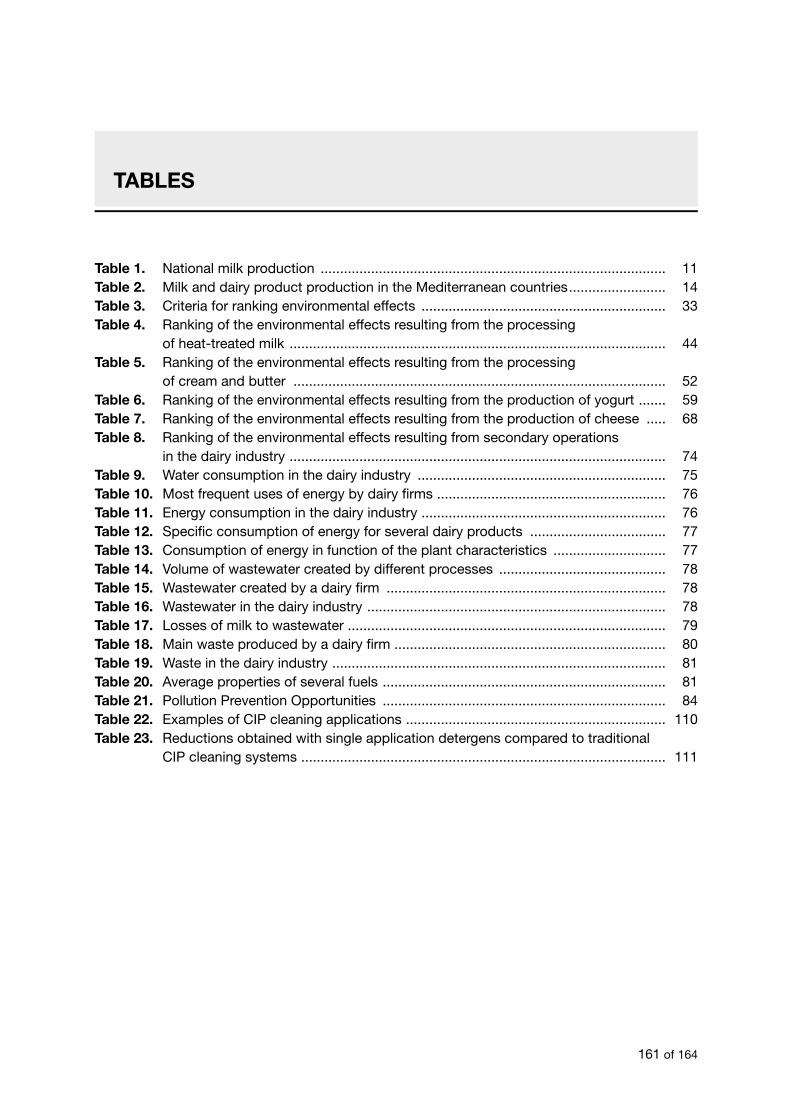
Table 1. National milk production ......................................................................................... 11Table 2. Milk and dairy product production in the Mediterranean countries......................... 14Table 3. Criteria for ranking environmental effects ............................................................... 33Table 4. Ranking of the environmental effects resulting from the processing
of heat-treated milk ................................................................................................. 44Table 5. Ranking of the environmental effects resulting from the processing
of cream and butter ................................................................................................ 52Table 6. Ranking of the environmental effects resulting from the production of yogurt ....... 59Table 7. Ranking of the environmental effects resulting from the production of cheese ..... 68Table 8. Ranking of the environmental effects resulting from secondary operations
in the dairy industry ................................................................................................. 74Table 9. Water consumption in the dairy industry ................................................................ 75Table 10. Most frequent uses of energy by dairy firms ........................................................... 76Table 11. Energy consumption in the dairy industry ............................................................... 76Table 12. Specific consumption of energy for several dairy products ................................... 77Table 13. Consumption of energy in function of the plant characteristics ............................. 77Table 14. Volume of wastewater created by different processes ........................................... 78Table 15. Wastewater created by a dairy firm ........................................................................ 78Table 16. Wastewater in the dairy industry ............................................................................. 78Table 17. Losses of milk to wastewater .................................................................................. 79Table 18. Main waste produced by a dairy firm ...................................................................... 80Table 19. Waste in the dairy industry ...................................................................................... 81Table 20. Average properties of several fuels ......................................................................... 81Table 21. Pollution Prevention Opportunities ......................................................................... 84Table 22. Examples of CIP cleaning applications ................................................................... 110Table 23. Reductions obtained with single application detergens compared to traditional
CIP cleaning systems .............................................................................................. 111
Metodología de Grupos de Trabajo
161 of 164
TABLES

Prevention of Pollution in the Dairy Industry
162 of 152
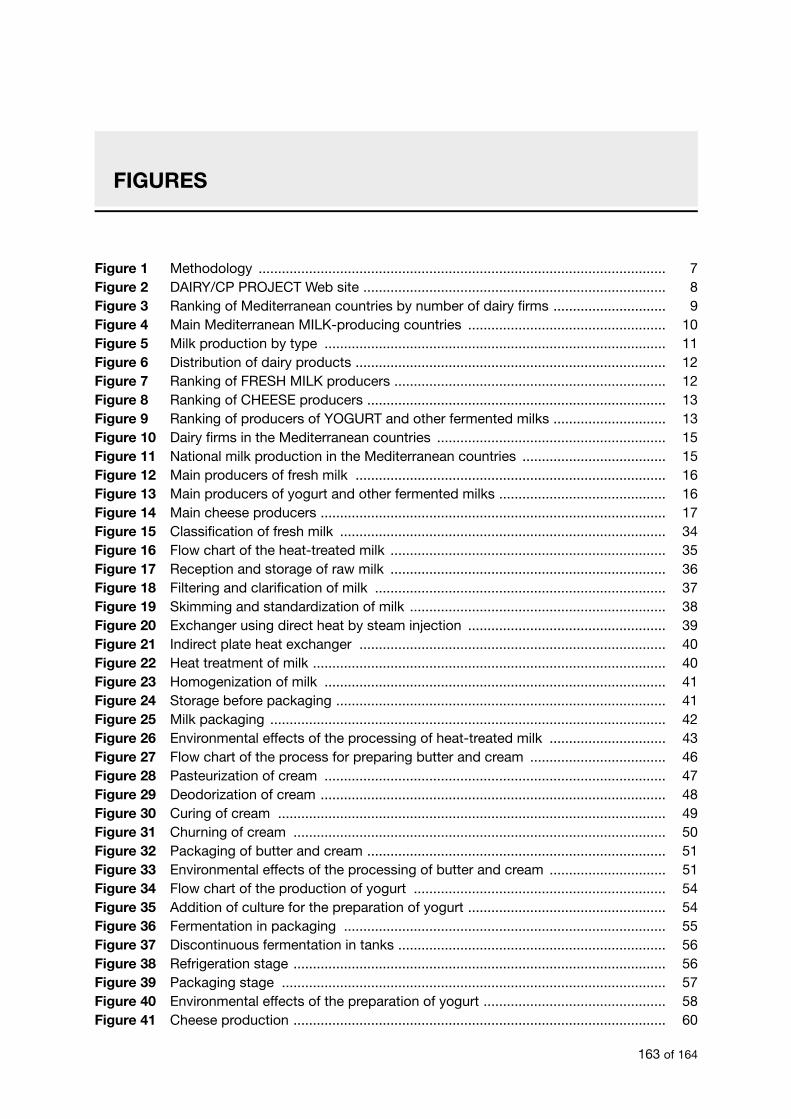
Figure 1 Methodology ......................................................................................................... 7Figure 2 DAIRY/CP PROJECT Web site .............................................................................. 8Figure 3 Ranking of Mediterranean countries by number of dairy firms ............................. 9Figure 4 Main Mediterranean MILK-producing countries ................................................... 10Figure 5 Milk production by type ........................................................................................ 11Figure 6 Distribution of dairy products ................................................................................ 12Figure 7 Ranking of FRESH MILK producers ...................................................................... 12Figure 8 Ranking of CHEESE producers ............................................................................. 13Figure 9 Ranking of producers of YOGURT and other fermented milks ............................. 13Figure 10 Dairy firms in the Mediterranean countries ........................................................... 15Figure 11 National milk production in the Mediterranean countries ..................................... 15Figure 12 Main producers of fresh milk ................................................................................ 16Figure 13 Main producers of yogurt and other fermented milks ........................................... 16Figure 14 Main cheese producers ......................................................................................... 17Figure 15 Classification of fresh milk .................................................................................... 34Figure 16 Flow chart of the heat-treated milk ....................................................................... 35Figure 17 Reception and storage of raw milk ....................................................................... 36Figure 18 Filtering and clarification of milk ........................................................................... 37Figure 19 Skimming and standardization of milk .................................................................. 38Figure 20 Exchanger using direct heat by steam injection ................................................... 39Figure 21 Indirect plate heat exchanger ............................................................................... 40Figure 22 Heat treatment of milk ........................................................................................... 40Figure 23 Homogenization of milk ........................................................................................ 41Figure 24 Storage before packaging ..................................................................................... 41Figure 25 Milk packaging ...................................................................................................... 42Figure 26 Environmental effects of the processing of heat-treated milk .............................. 43Figure 27 Flow chart of the process for preparing butter and cream ................................... 46Figure 28 Pasteurization of cream ........................................................................................ 47Figure 29 Deodorization of cream ......................................................................................... 48Figure 30 Curing of cream .................................................................................................... 49Figure 31 Churning of cream ................................................................................................ 50Figure 32 Packaging of butter and cream ............................................................................. 51Figure 33 Environmental effects of the processing of butter and cream .............................. 51Figure 34 Flow chart of the production of yogurt ................................................................. 54Figure 35 Addition of culture for the preparation of yogurt ................................................... 54Figure 36 Fermentation in packaging ................................................................................... 55Figure 37 Discontinuous fermentation in tanks ..................................................................... 56Figure 38 Refrigeration stage ................................................................................................ 56Figure 39 Packaging stage ................................................................................................... 57Figure 40 Environmental effects of the preparation of yogurt ............................................... 58Figure 41 Cheese production ................................................................................................ 60
Metodología de Grupos de Trabajo
163 of 164
FIGURES
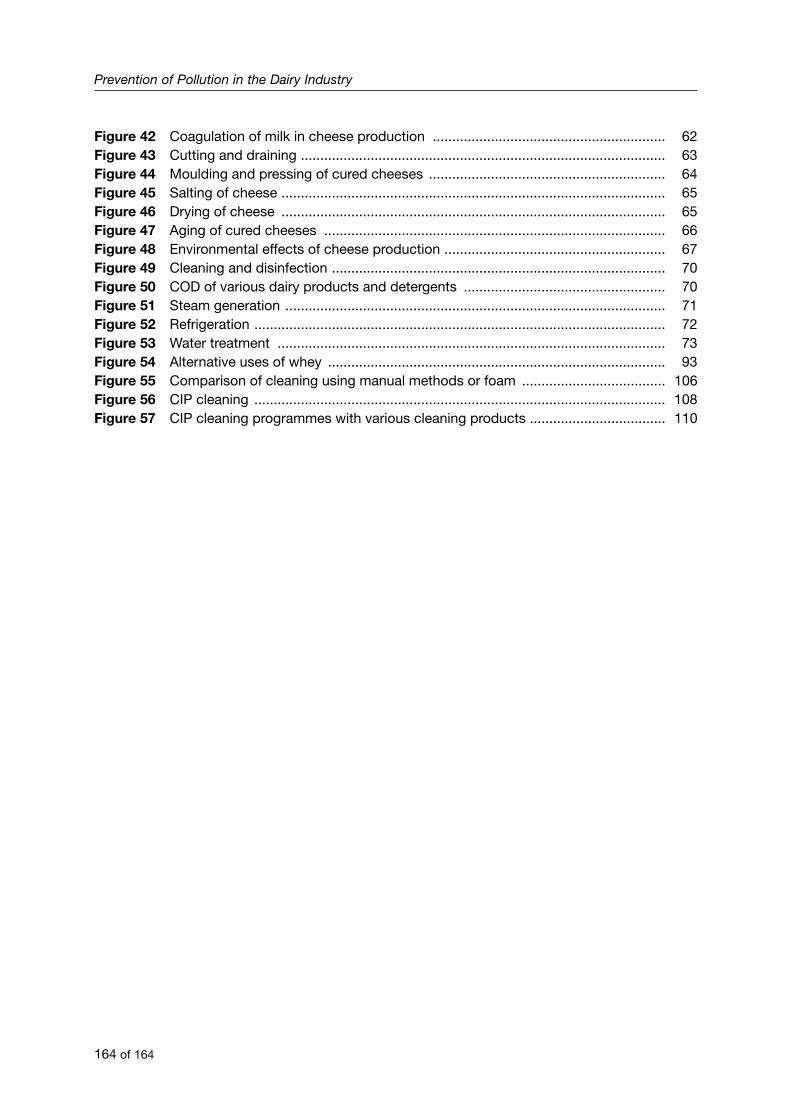
Figure 42 Coagulation of milk in cheese production ............................................................ 62Figure 43 Cutting and draining .............................................................................................. 63Figure 44 Moulding and pressing of cured cheeses ............................................................. 64Figure 45 Salting of cheese ................................................................................................... 65Figure 46 Drying of cheese ................................................................................................... 65Figure 47 Aging of cured cheeses ........................................................................................ 66Figure 48 Environmental effects of cheese production ......................................................... 67Figure 49 Cleaning and disinfection ...................................................................................... 70Figure 50 COD of various dairy products and detergents .................................................... 70Figure 51 Steam generation .................................................................................................. 71Figure 52 Refrigeration .......................................................................................................... 72Figure 53 Water treatment .................................................................................................... 73 Figure 54 Alternative uses of whey ....................................................................................... 93Figure 55 Comparison of cleaning using manual methods or foam ..................................... 106Figure 56 CIP cleaning .......................................................................................................... 108Figure 57 CIP cleaning programmes with various cleaning products ................................... 110
Prevention of Pollution in the Dairy Industry
164 of 164