Embed Size (px)
Citation preview
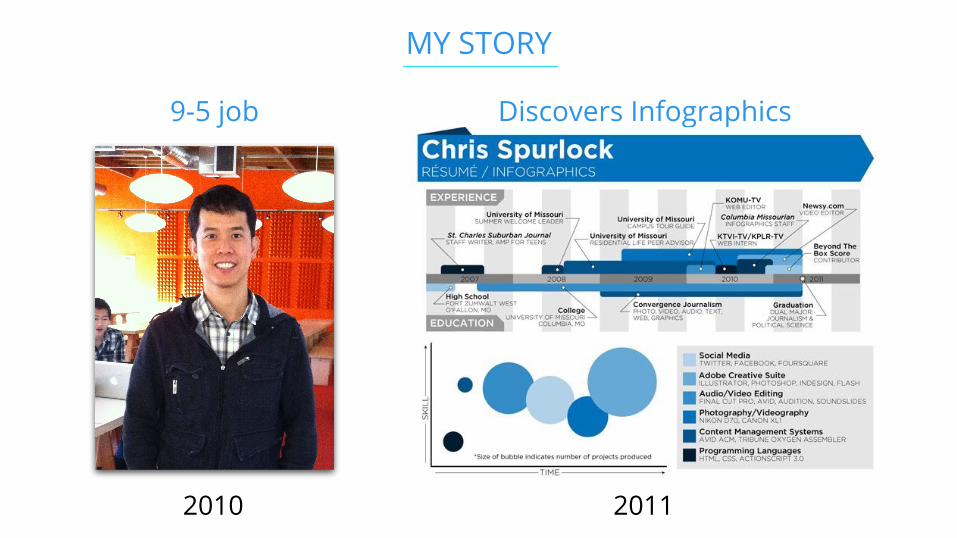
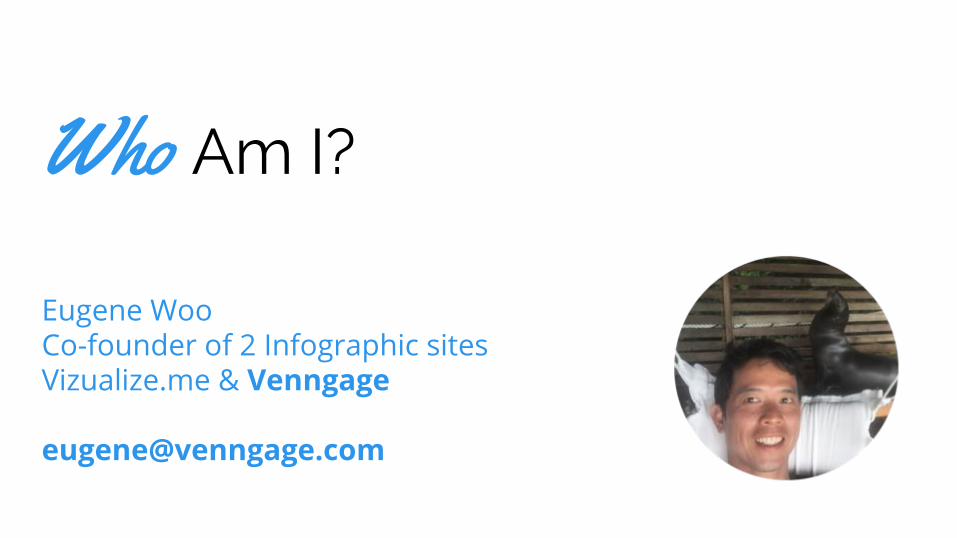
MY STORY
2010
9-5 job Discovers Infographics
2011
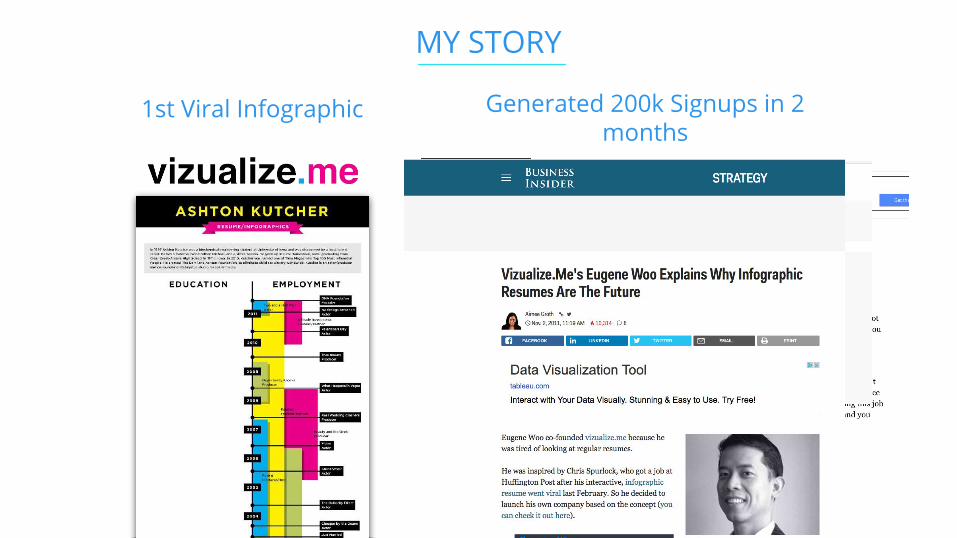
MY STORY
2010
1st Viral Infographic Generated 200k Signups in 2 months
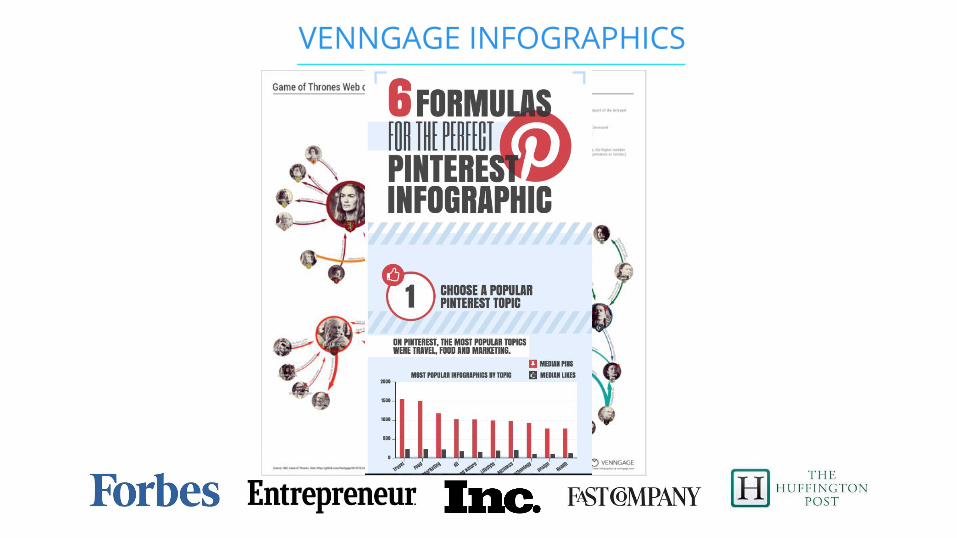
VENNGAGE INFOGRAPHICS
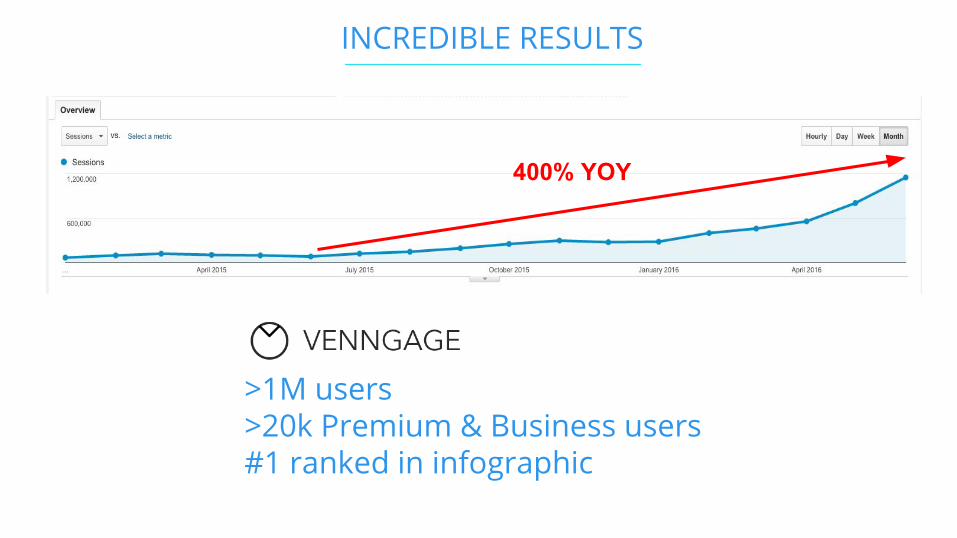
INCREDIBLE RESULTS
>1M users>20k Premium & Business users#1 ranked in infographic
400% YOY
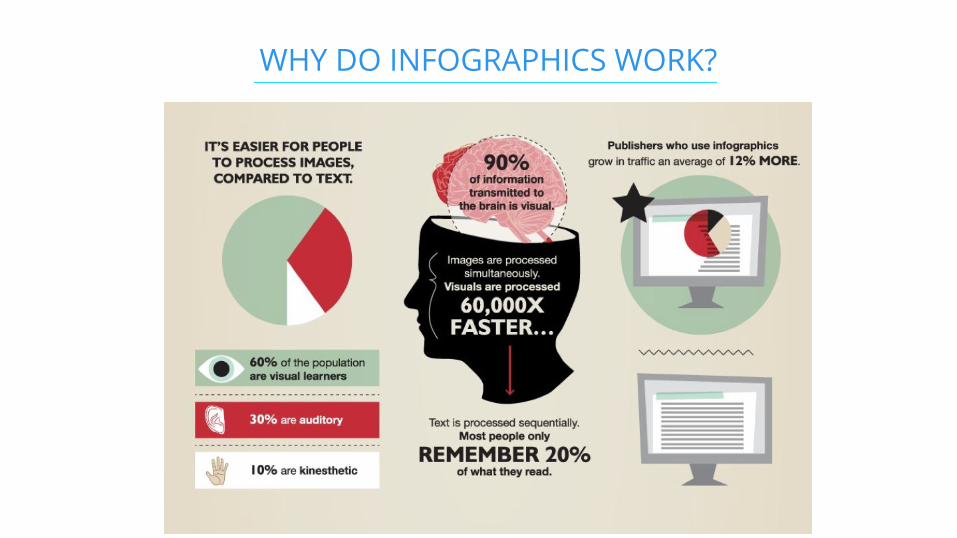
WHY DO INFOGRAPHICS WORK?
My Promise to You1. The 5 key steps in creating great infographics
2. Our own ICCORE method for transforming data to
visuals
3. Design hacks to make your infographics beautiful
4. Short cut to the next level
WHO IS THIS FOR?
1. Marketers who want to grow traffic
2. Educators, researchers, analysts and students
3. Professionals who want to create better reports or slides
4. Self employed, startups or consultants growing their brand
5. News editors, writers who want to tell visual stories
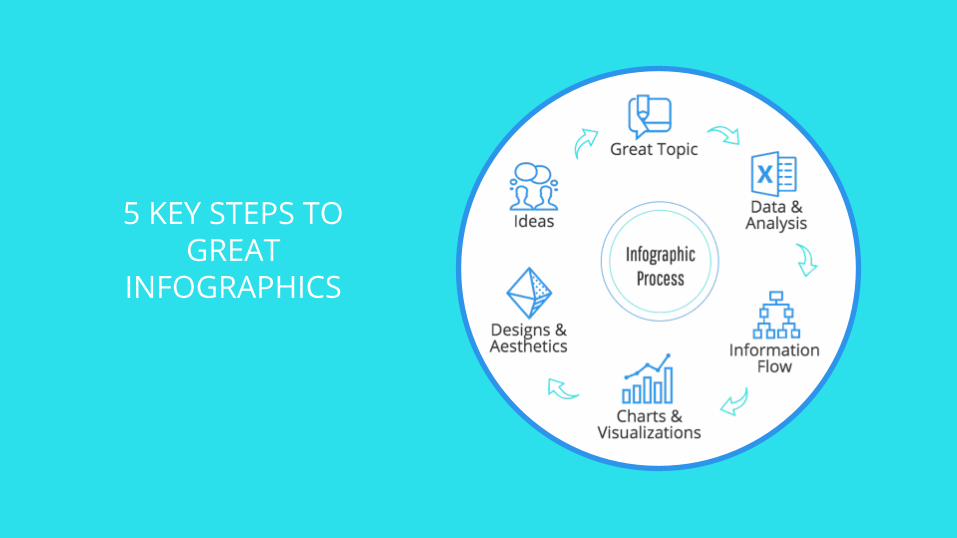
5 KEY STEPS TO GREAT
INFOGRAPHICS

Pick a Great Topic
Key Step 1
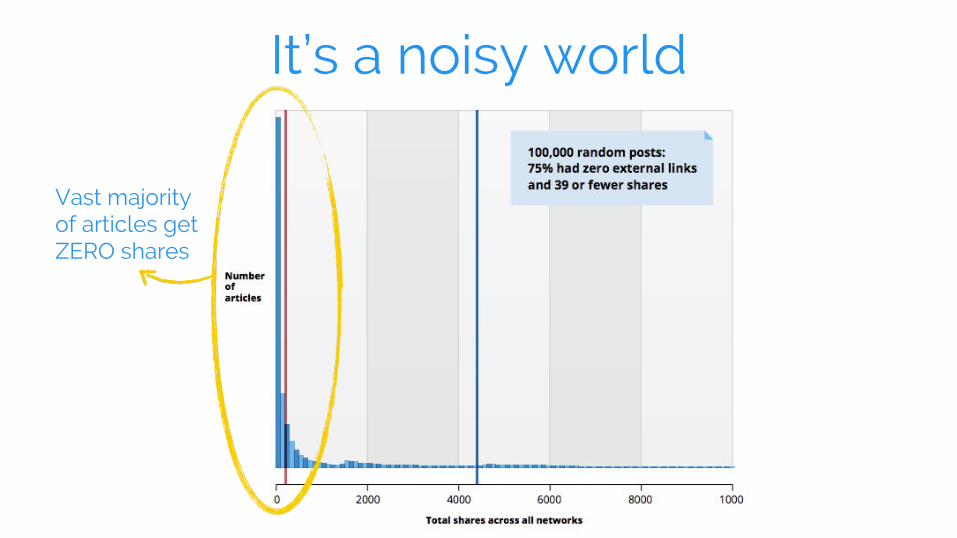
It’s a noisy world
Vast majority of articles get ZERO shares

Solve a burning problem
Tip 1
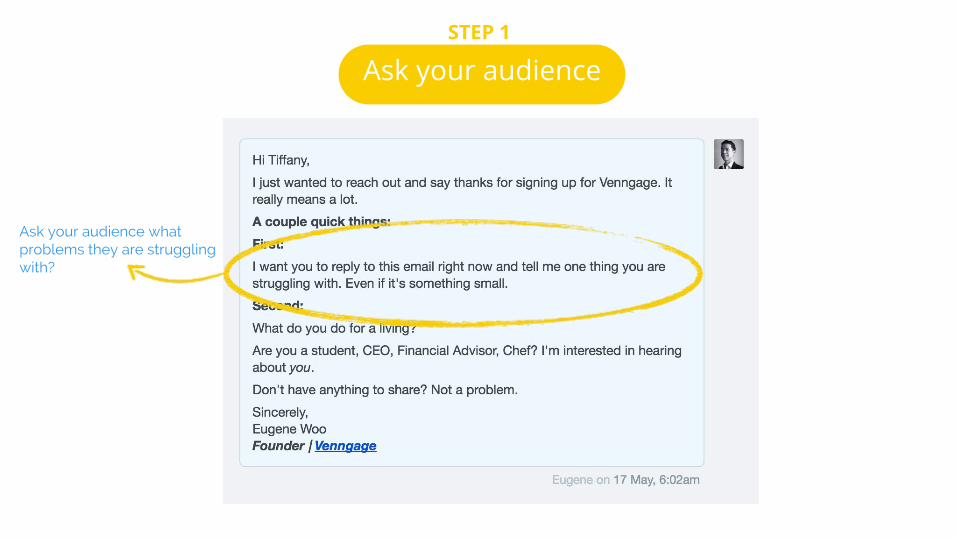
Ask your audienceSTEP 1
Ask your audience what problems they are struggling with?
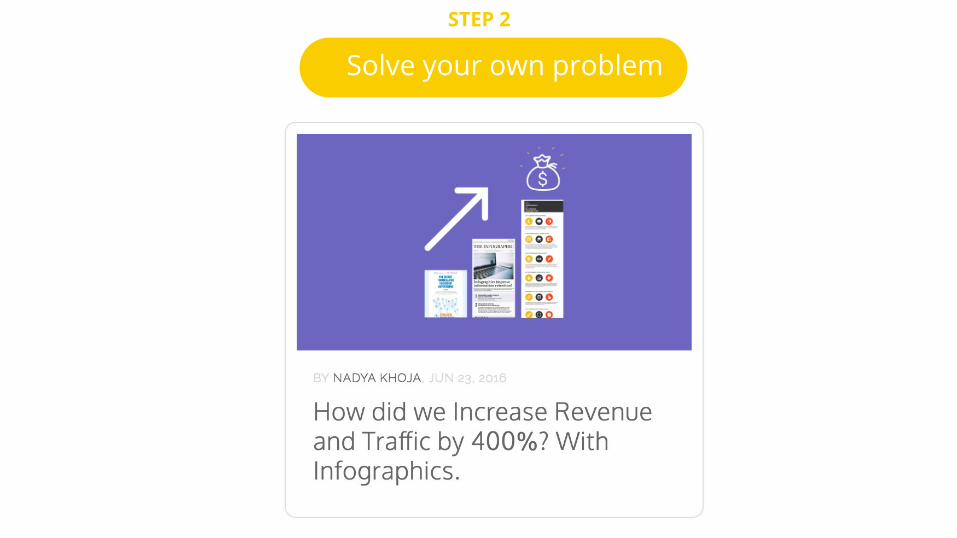
Solve your own problem
STEP 2
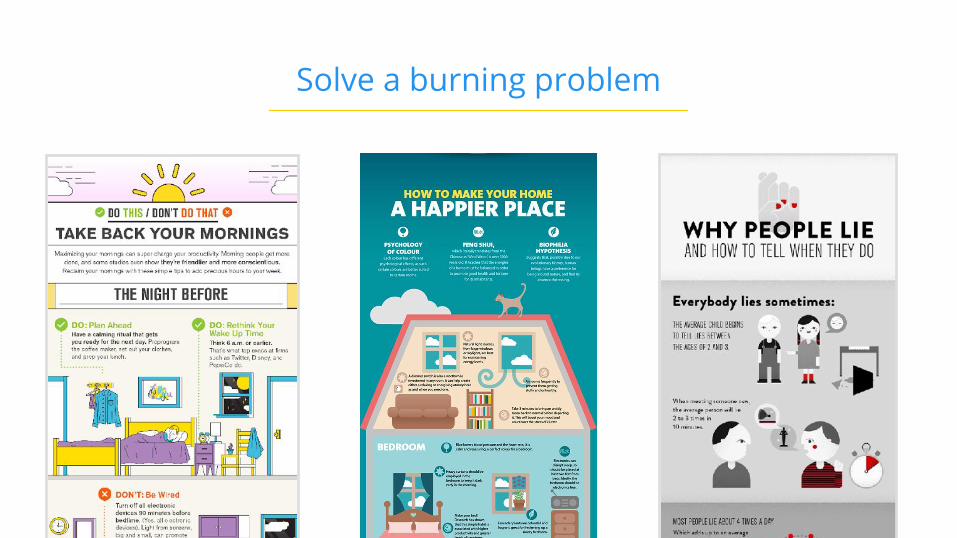
Solve a burning problem
Challenge the status quo
Tip 2
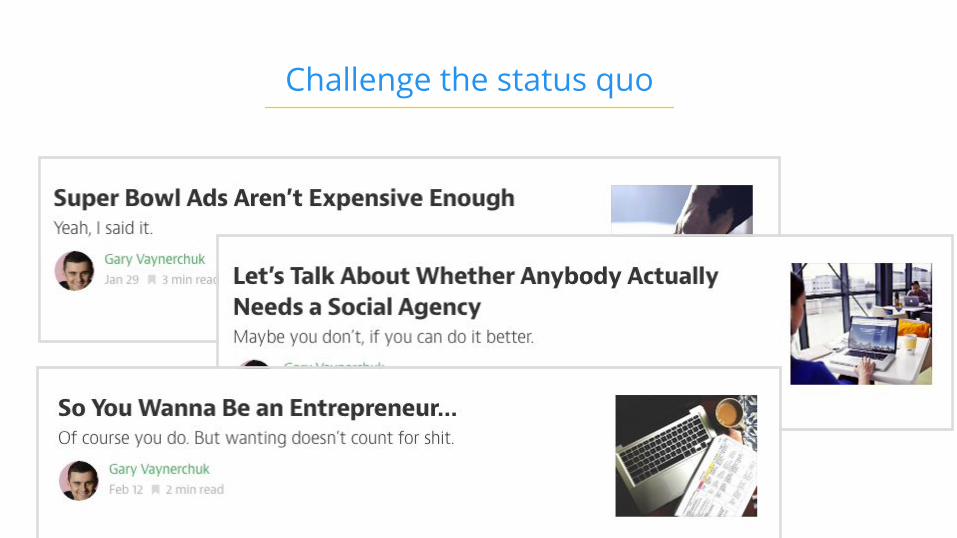
Challenge the status quo
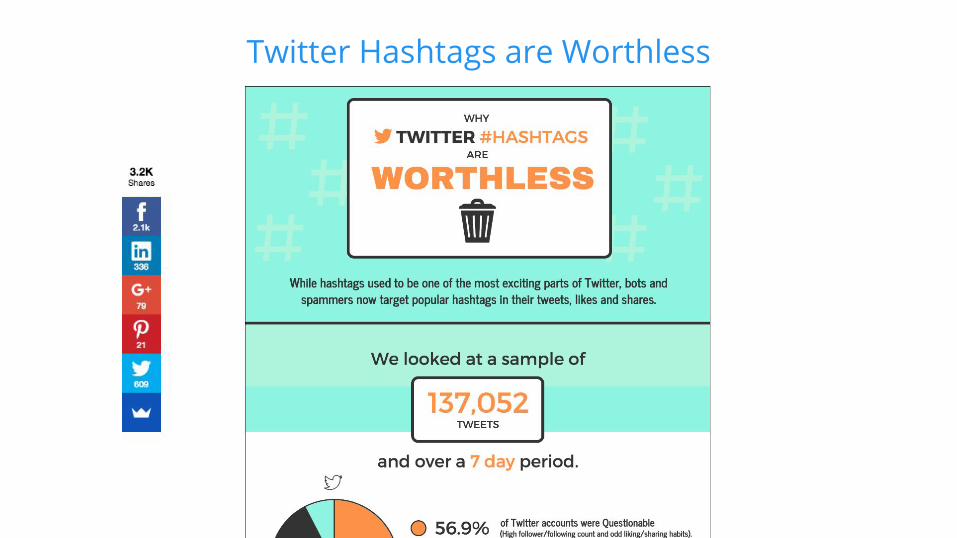
Twitter Hashtags are Worthless
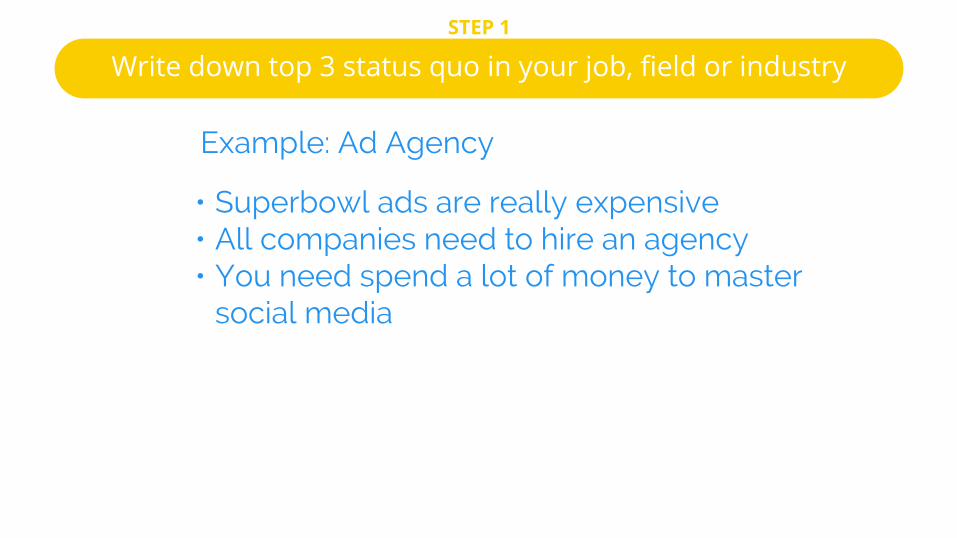
Write down top 3 status quo in your job, field or industrySTEP 1
• Superbowl ads are really expensive• All companies need to hire an agency• You need spend a lot of money to master
social media
Example: Ad Agency
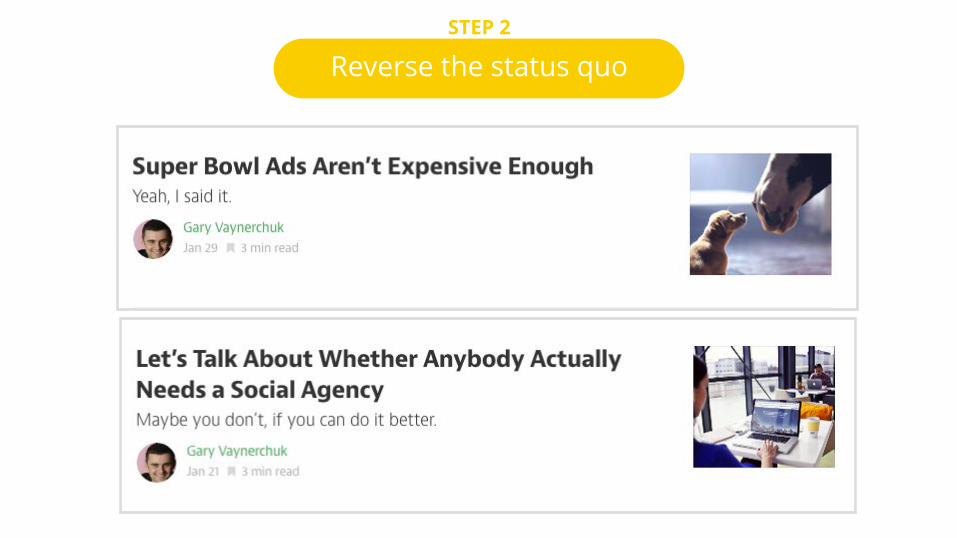
Reverse the status quoSTEP 2

Change the Perspective
Tip 3
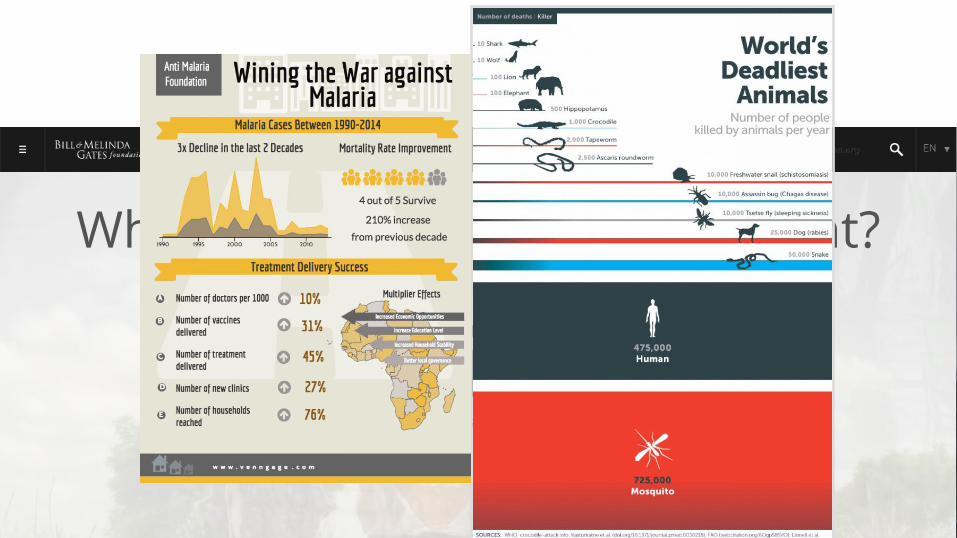
Reframe the question
Why fighting Malaria is important?

Key Step 2
Plan a Research Strategy

Form a Question Pyramid
Tip 1
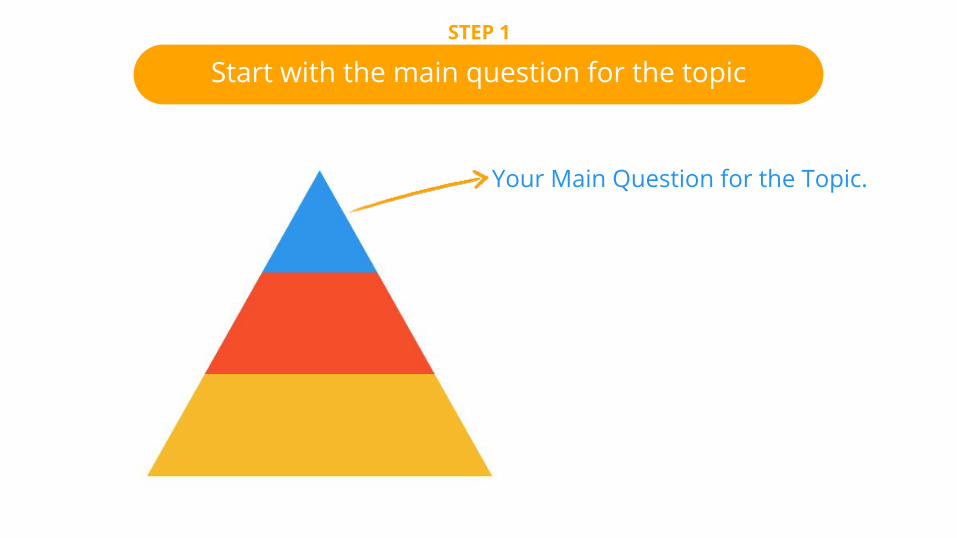
Start with the main question for the topicSTEP 1
Form a Question Pyramid
Your Main Question for the Topic.
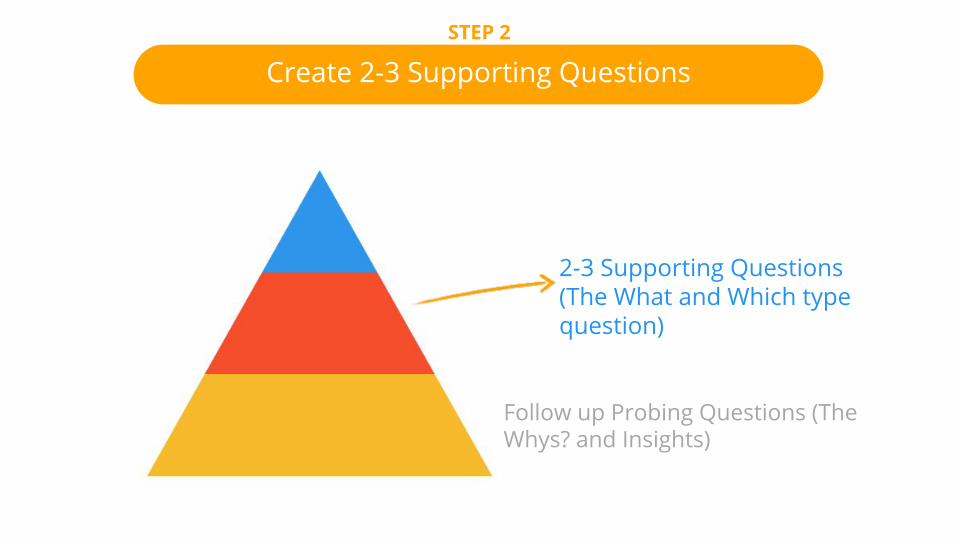
Create 2-3 Supporting QuestionsSTEP 2
Form a Question Pyramid2-3 Supporting Questions (The What and Which type question)
Follow up Probing Questions (The Whys? and Insights)
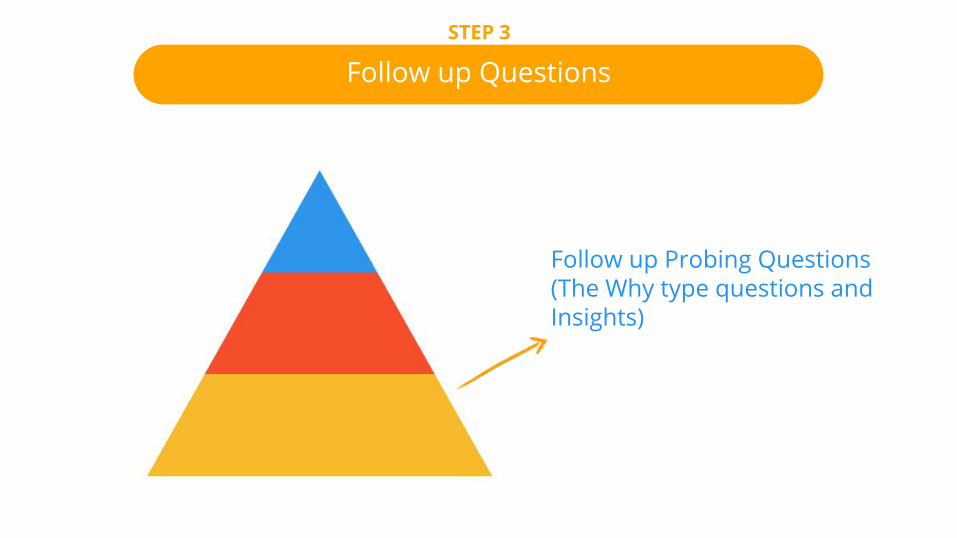
Follow up QuestionsSTEP 3
Form a Question PyramidFollow up Probing Questions (The Why type questions and Insights)
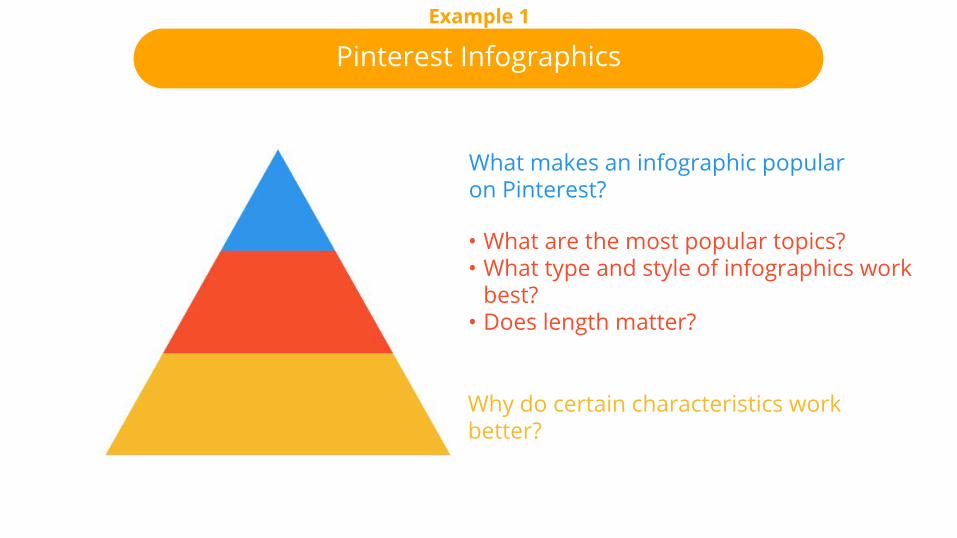
Pinterest Infographics Example 1
Form a Question Pyramid
What makes an infographic popular on Pinterest?
• What are the most popular topics?• What type and style of infographics work
best?• Does length matter?
Why do certain characteristics work better?

Key Step 3
Collect your Data
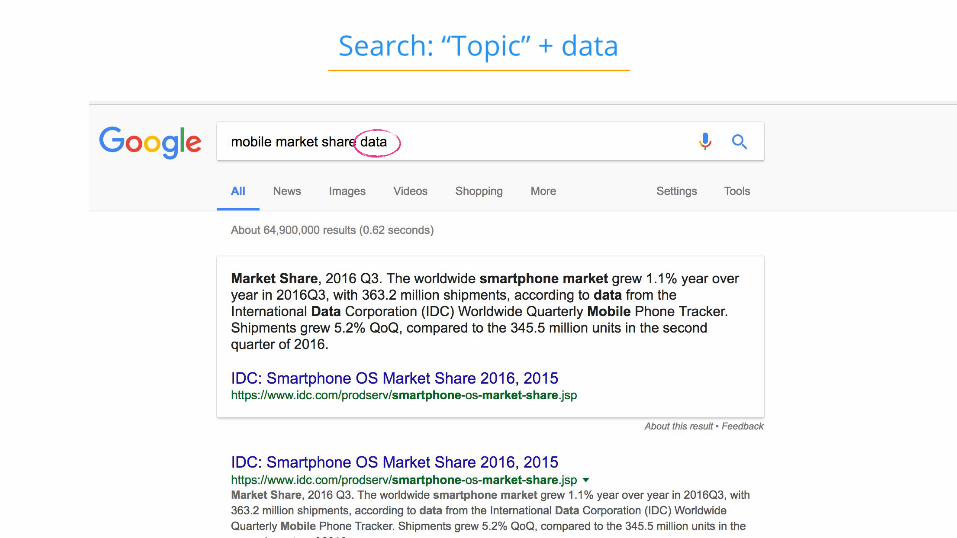
Search: “Topic” + data
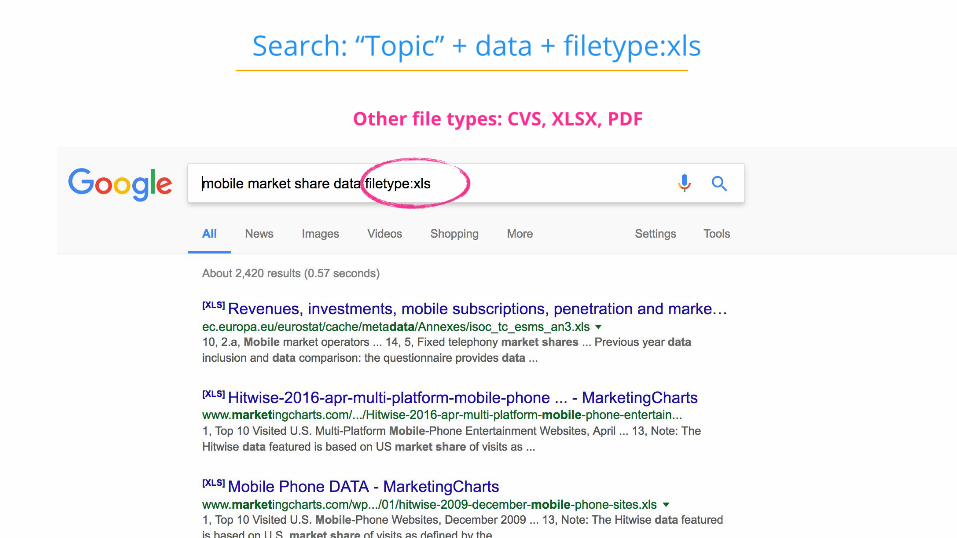
Search: “Topic” + data + filetype:xls
Other file types: CVS, XLSX, PDF
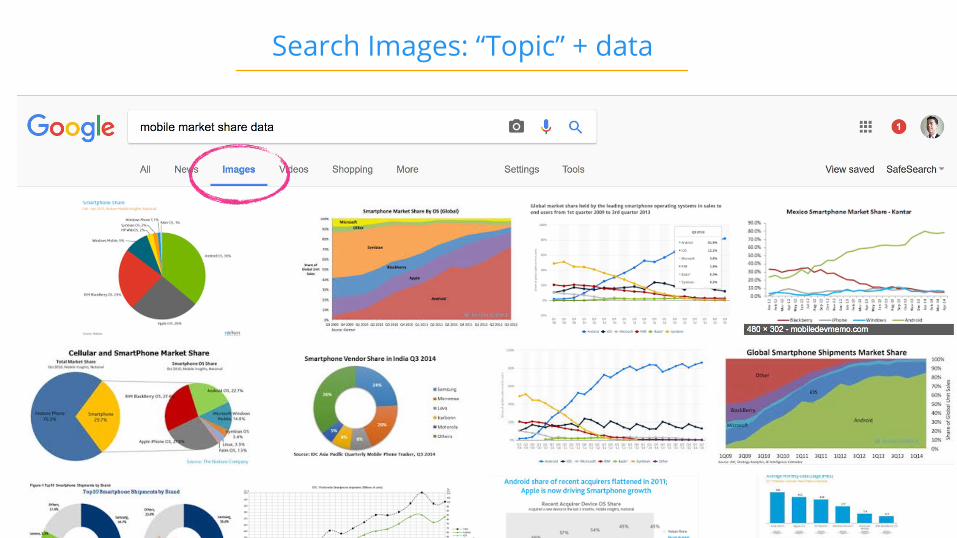
Search Images: “Topic” + data
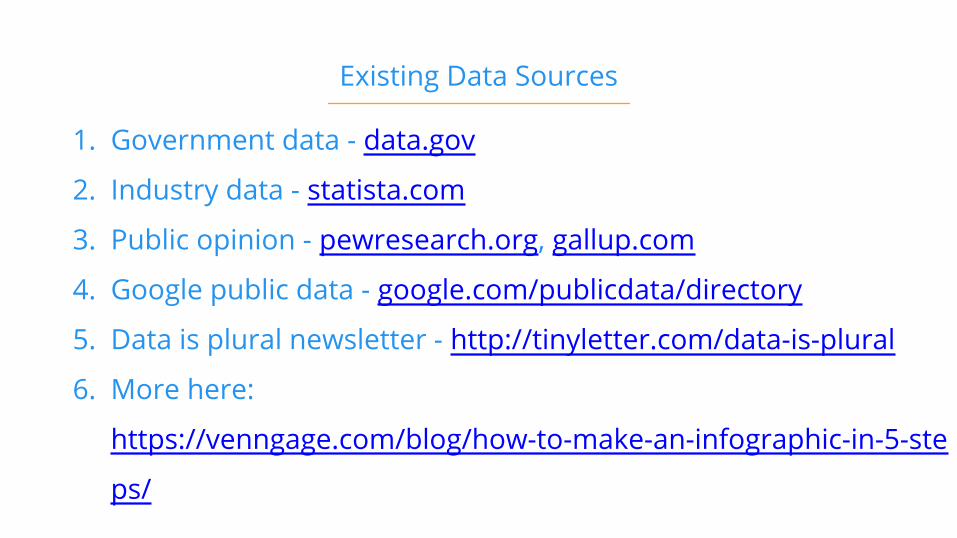
Existing Data Sources
1. Government data - data.gov
2. Industry data - statista.com
3. Public opinion - pewresearch.org, gallup.com
4. Google public data - google.com/publicdata/directory
5. Data is plural newsletter - http://tinyletter.com/data-is-plural
6. More here:
https://venngage.com/blog/how-to-make-an-infographic-in-5-ste
ps/
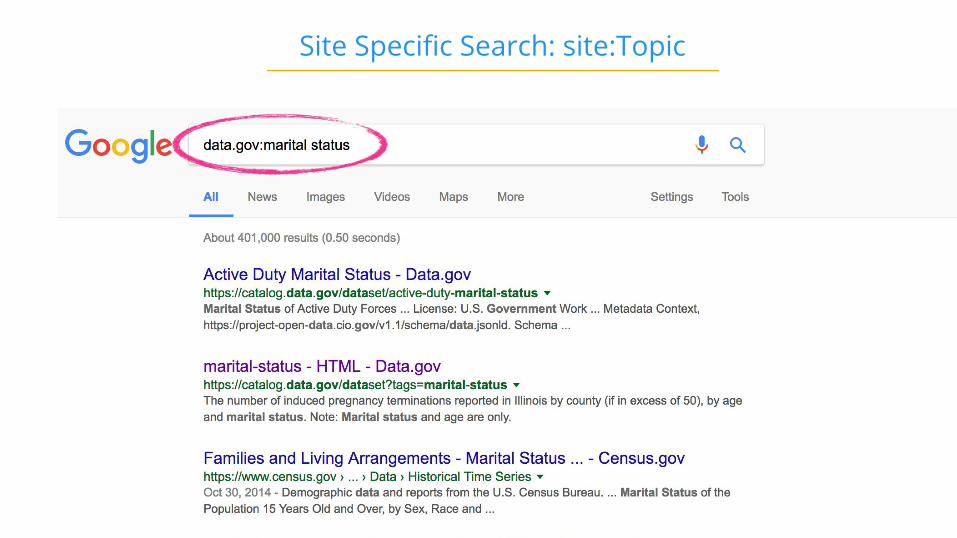
Site Specific Search: site:Topic
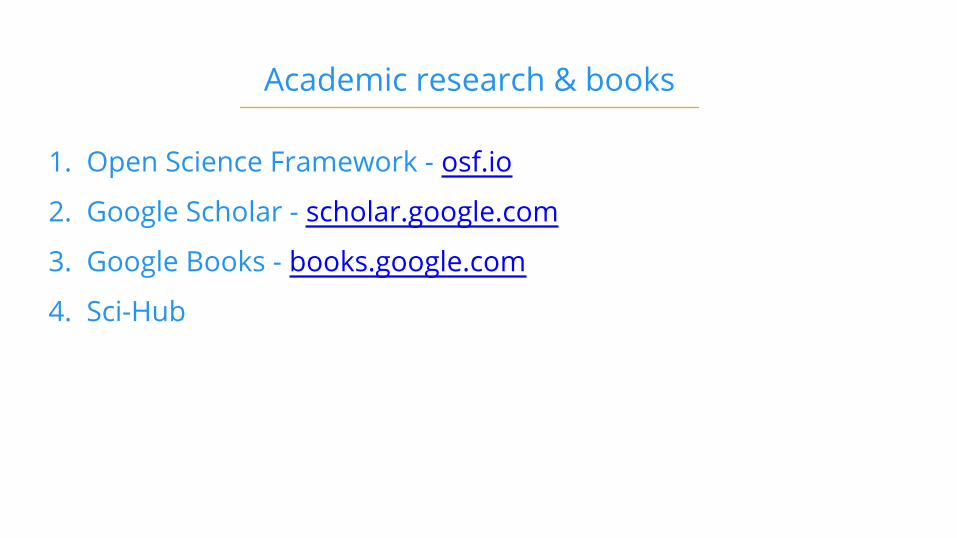
1. Open Science Framework - osf.io
2. Google Scholar - scholar.google.com
3. Google Books - books.google.com
4. Sci-Hub
Academic research & books
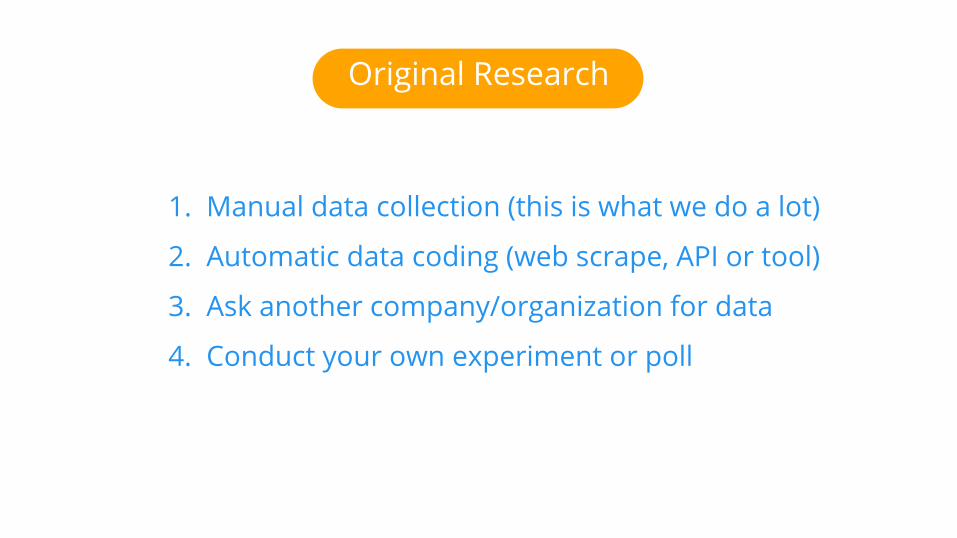
1. Manual data collection (this is what we do a lot)
2. Automatic data coding (web scrape, API or tool)
3. Ask another company/organization for data
4. Conduct your own experiment or poll
Original Research
Key Step 4
Visualize your data
ICCORE Method
Tip 1
What is the goal of each visual?
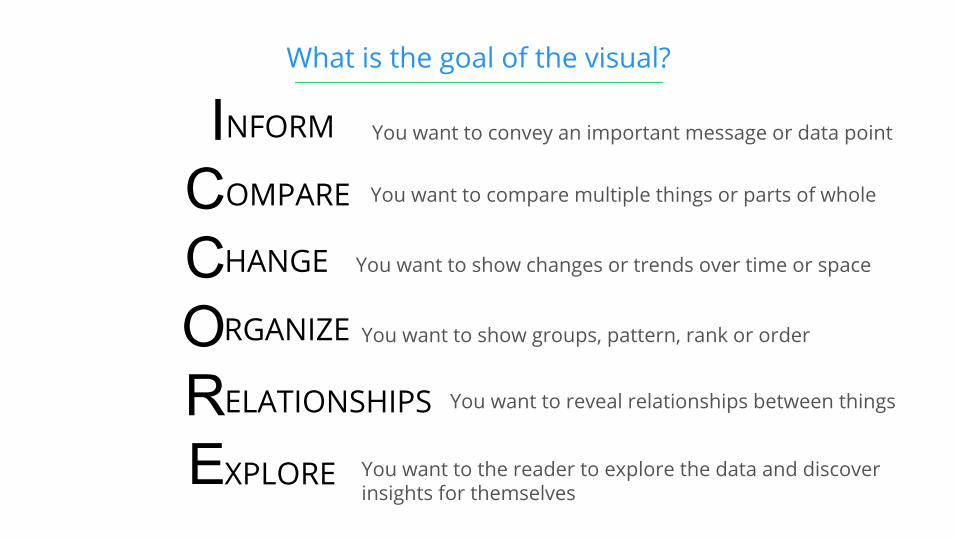
What is the goal of the visual?
ICCORE
NFORM
OMPARE
RGANIZE
ELATIONSHIPS
XPLORE
HANGE
You want to convey an important message or data point
You want to compare multiple things or parts of whole
You want to show changes or trends over time or space
You want to show groups, pattern, rank or order
You want to reveal relationships between things
You want to the reader to explore the data and discover insights for themselves
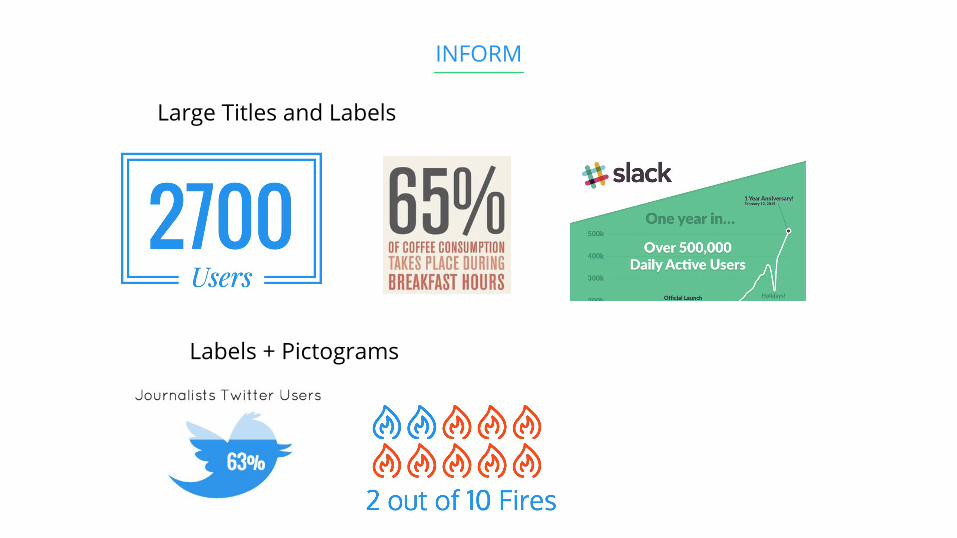
INFORM
Large Titles and Labels
Labels + Pictograms
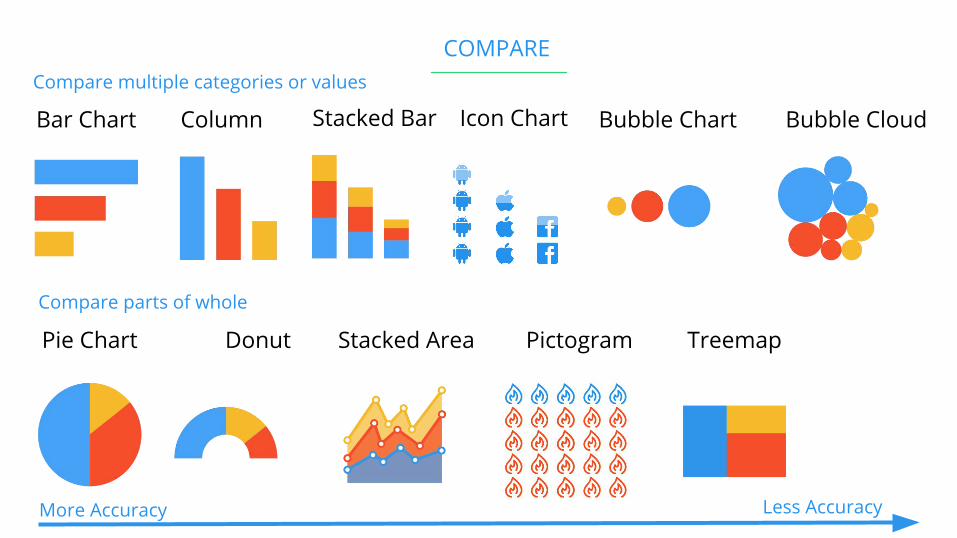
COMPARE
Bar Chart
Pie Chart
Column
Treemap Stacked Area Donut Pictogram
Bubble Chart Bubble CloudStacked Bar Icon Chart
Compare multiple categories or values
Compare parts of whole
More Accuracy Less Accuracy
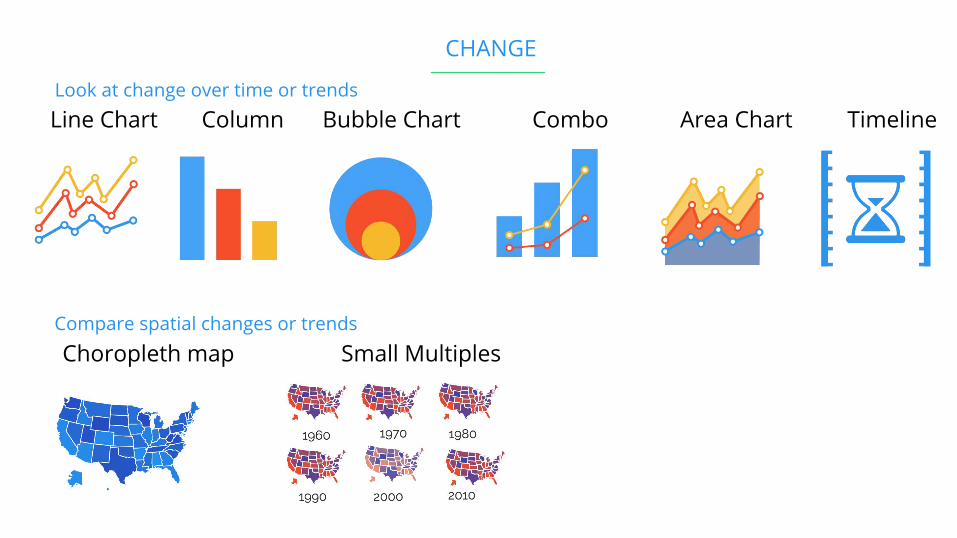
CHANGE
Line Chart
Choropleth map
Column Bubble Chart
Small Multiples
Area ChartCombo TimelineLook at change over time or trends
Compare spatial changes or trends
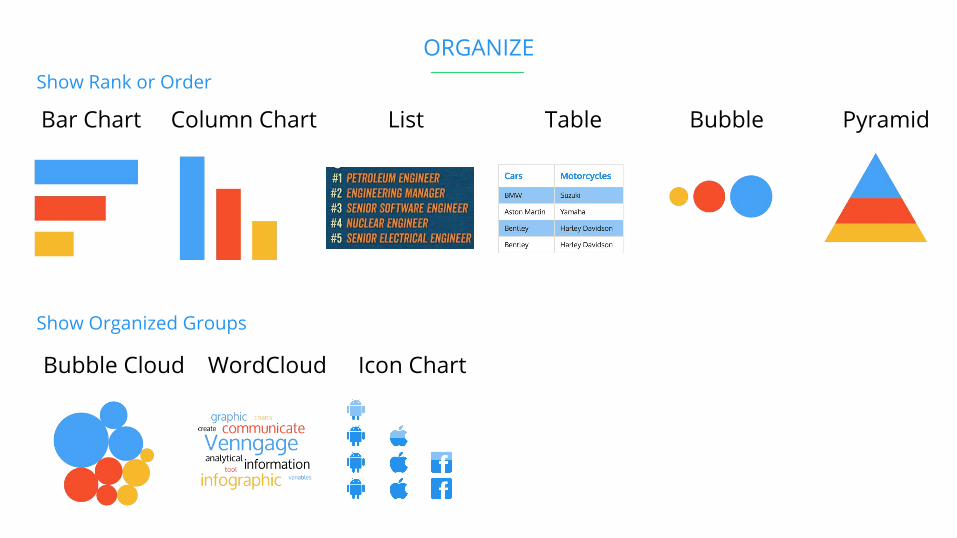
ORGANIZE
Bar Chart
Bubble Cloud
Column Chart List
WordCloud
BubbleTable Pyramid
Show Rank or Order
Show Organized Groups
Icon Chart
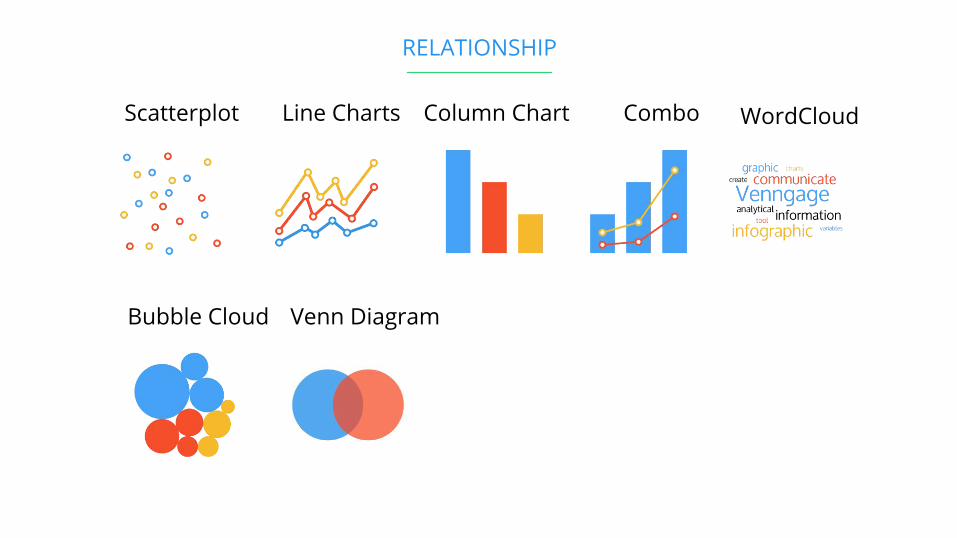
RELATIONSHIP
Bubble Cloud
Scatterplot Line Charts Column Chart WordCloudCombo
Venn Diagram
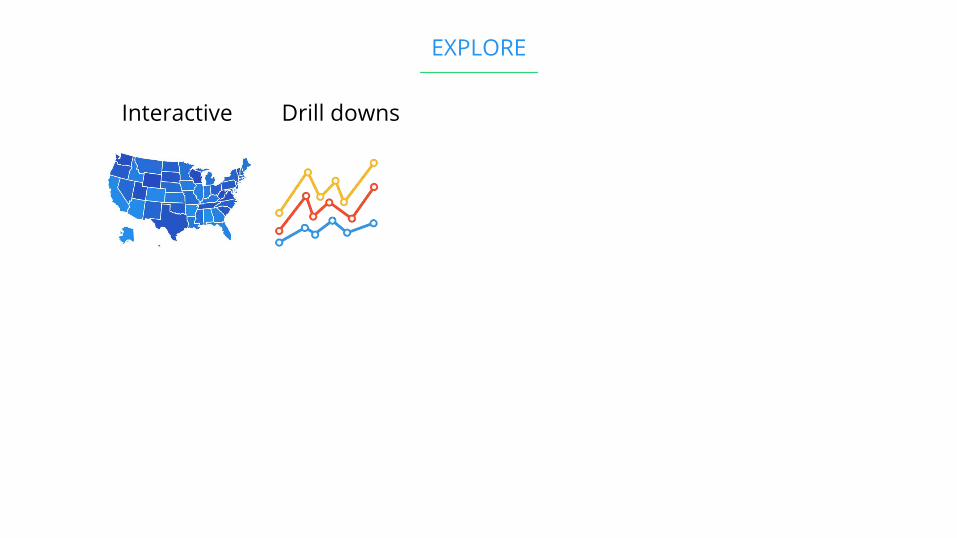
EXPLORE
Interactive Drill downs
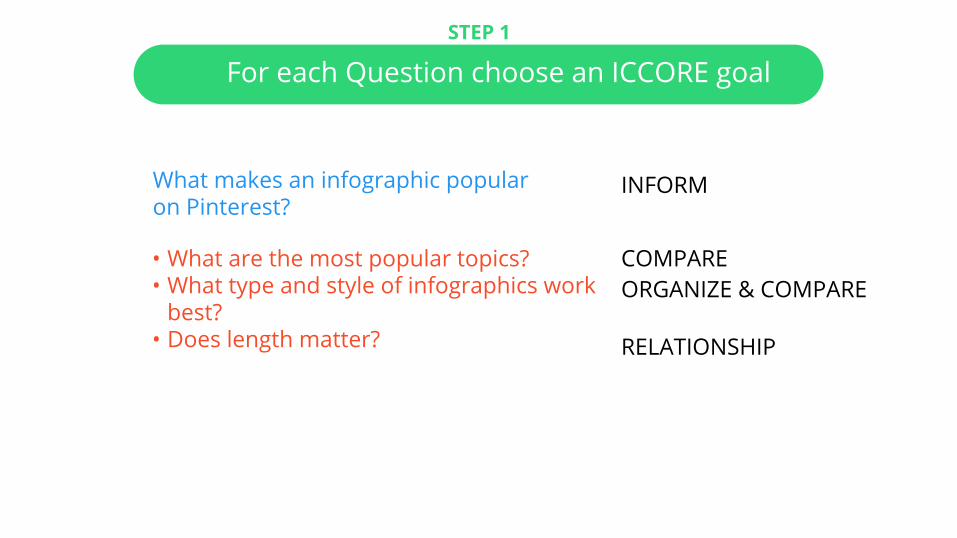
For each Question choose an ICCORE goalSTEP 1
Form a Question Pyramid
What makes an infographic popular on Pinterest?
• What are the most popular topics?• What type and style of infographics work
best?• Does length matter?
INFORM
COMPAREORGANIZE & COMPARE
RELATIONSHIP
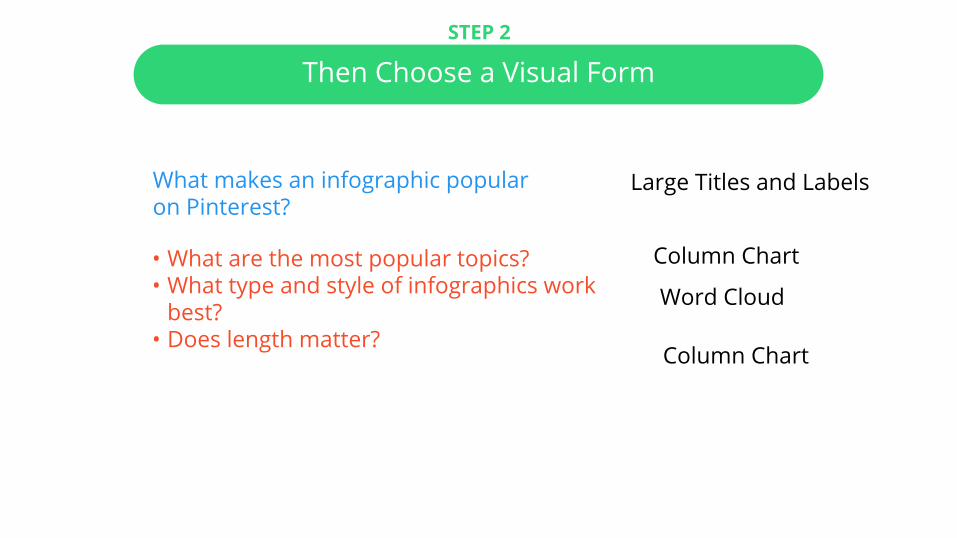
Then Choose a Visual FormSTEP 2
What makes an infographic popular on Pinterest?
• What are the most popular topics?• What type and style of infographics work
best?• Does length matter?
Large Titles and Labels
Column Chart
Word Cloud
Column Chart
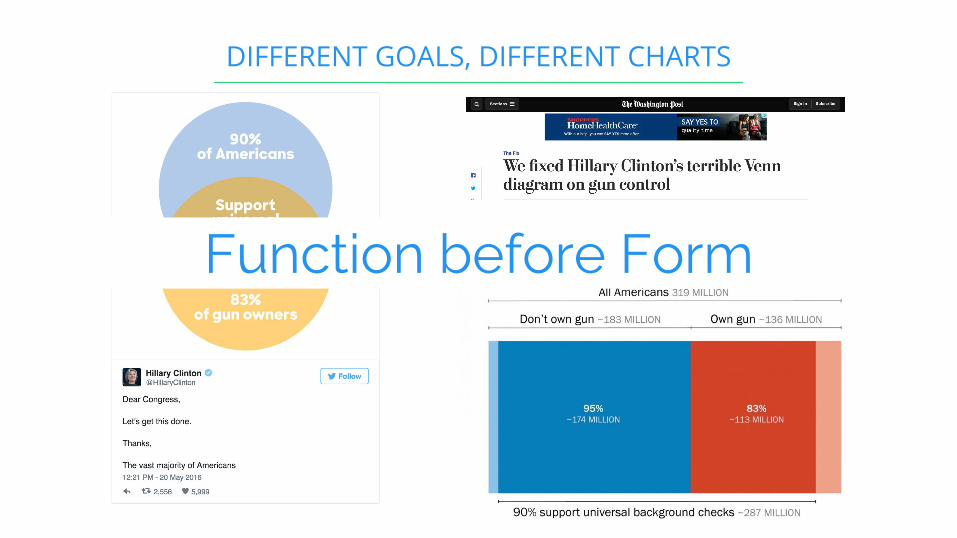
DIFFERENT GOALS, DIFFERENT CHARTS
Function before Form
Key Step 5
Make it Beautiful
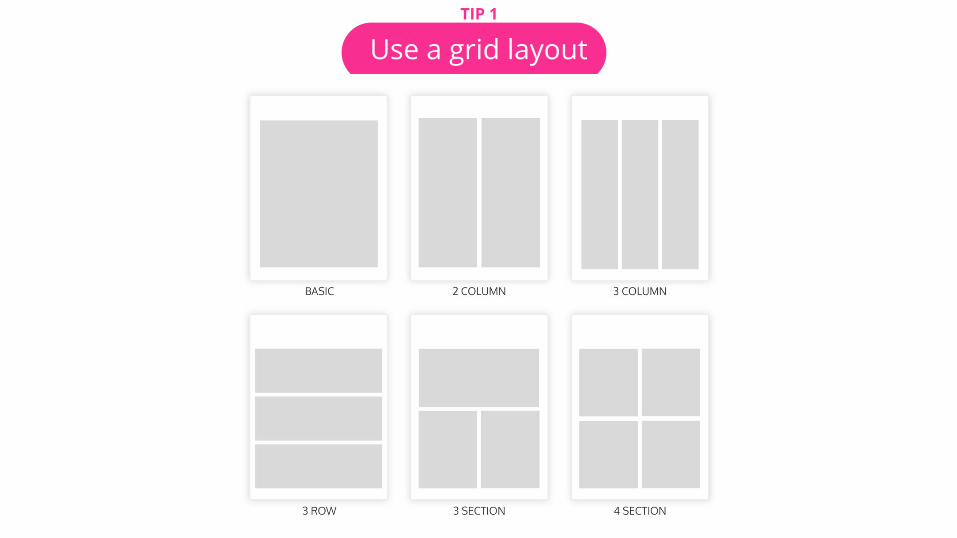
Use a grid layoutTIP 1
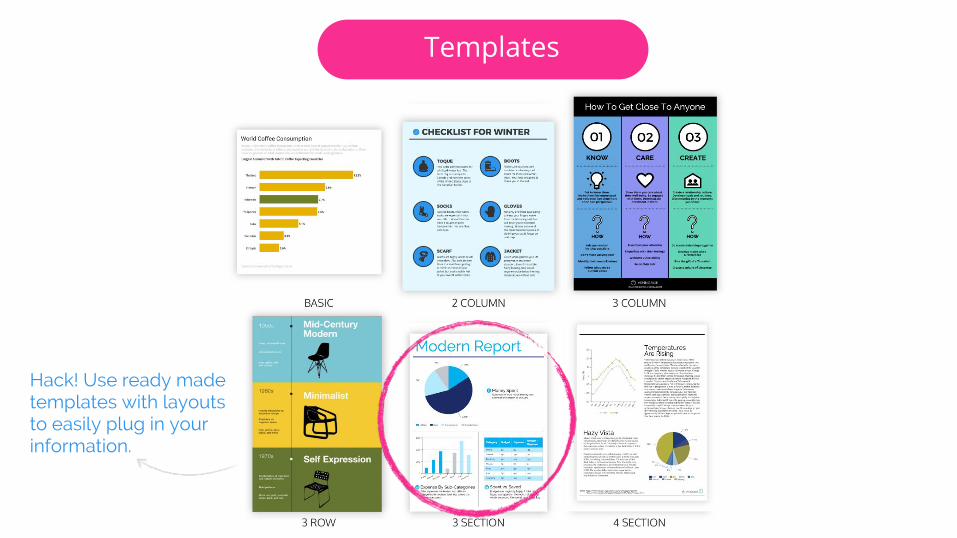
Templates
Hack! Use ready made templates with layouts to easily plug in your information.
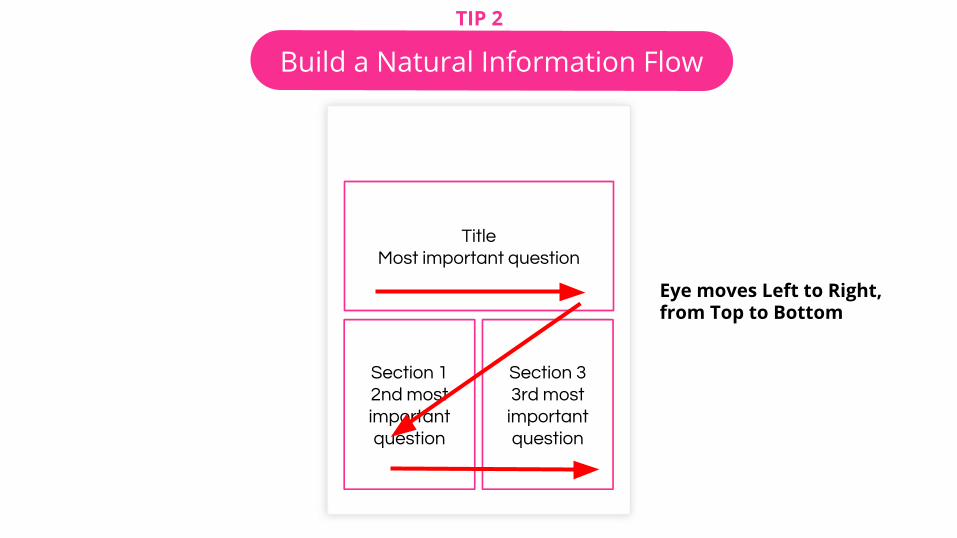
TitleMost important question
Section 12nd most important question
Section 33rd most
important question
Build a Natural Information Flow
TIP 2
Eye moves Left to Right, from Top to Bottom
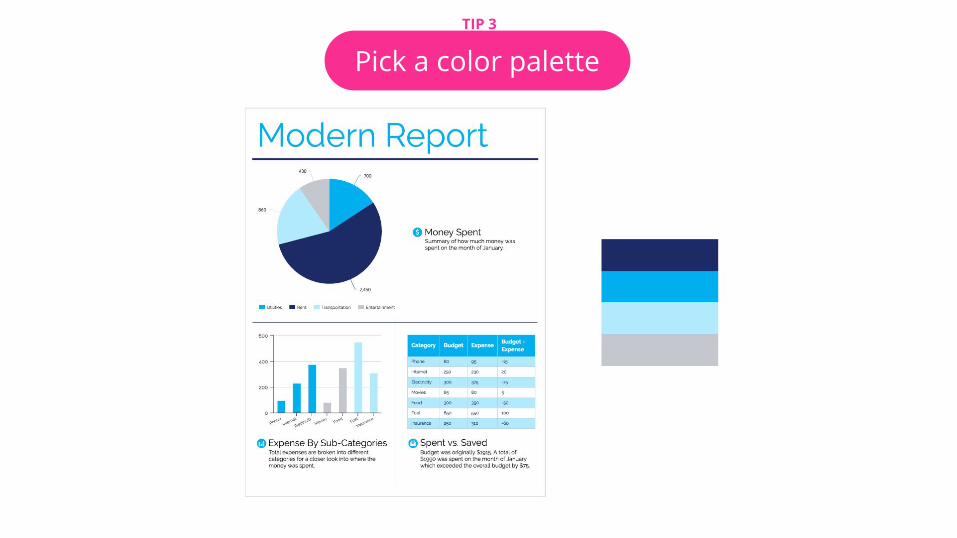
Pick a color paletteTIP 3
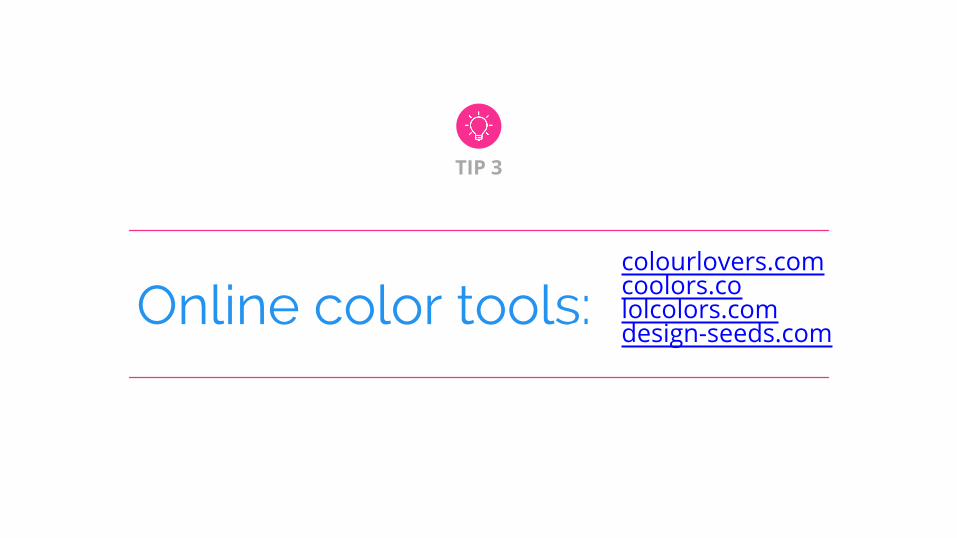
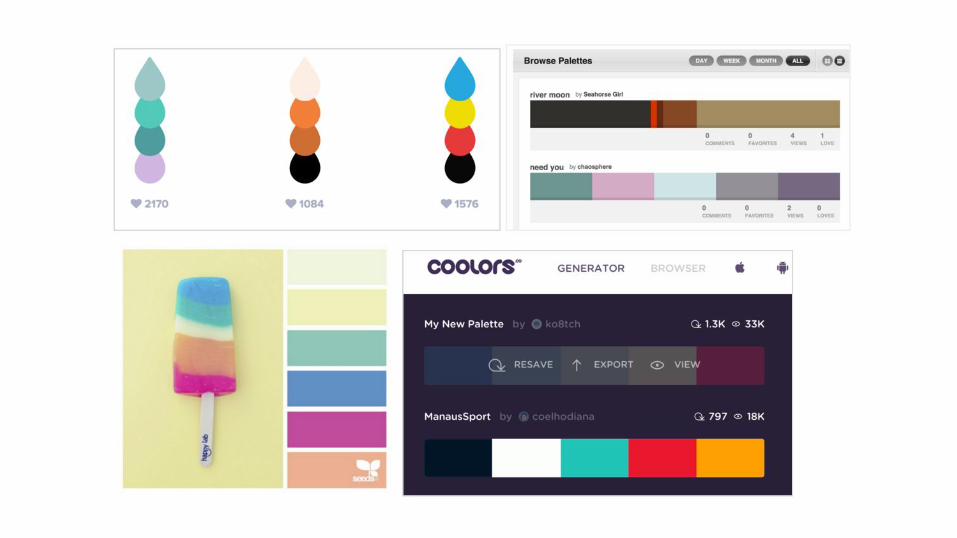
Online color tools:
TIP 3
colourlovers.comcoolors.cololcolors.comdesign-seeds.com
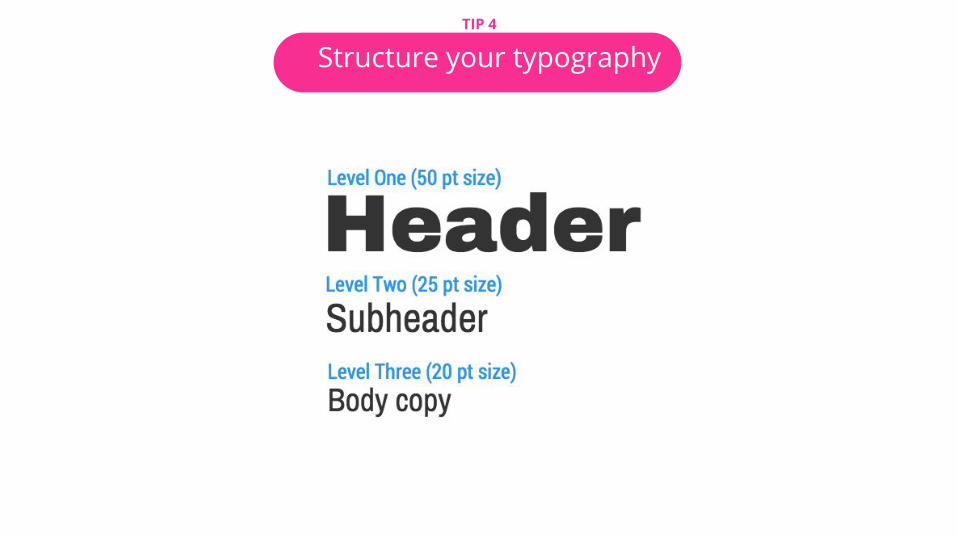
Structure your typographyTIP 4
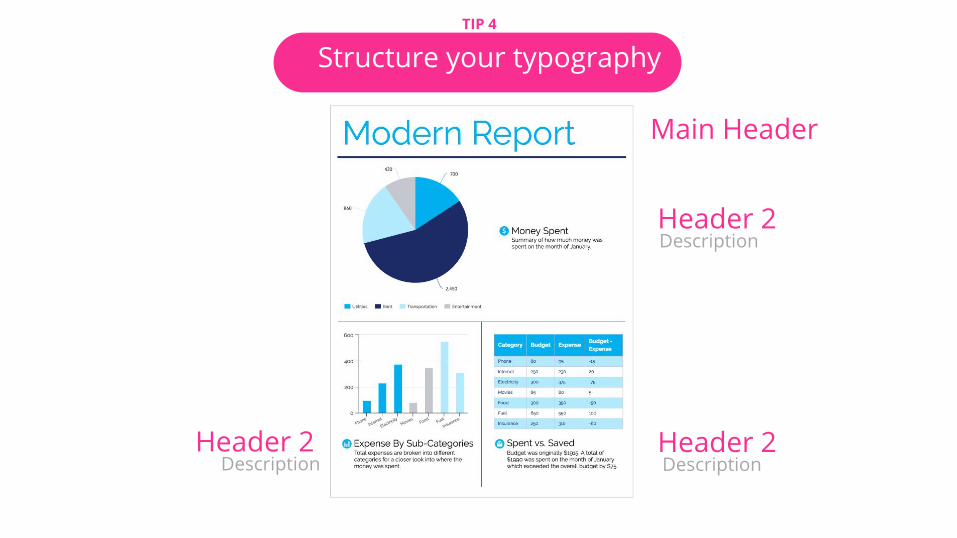
Structure your typographyTIP 4
Main Header
Header 2Description
Header 2Description
Header 2Description
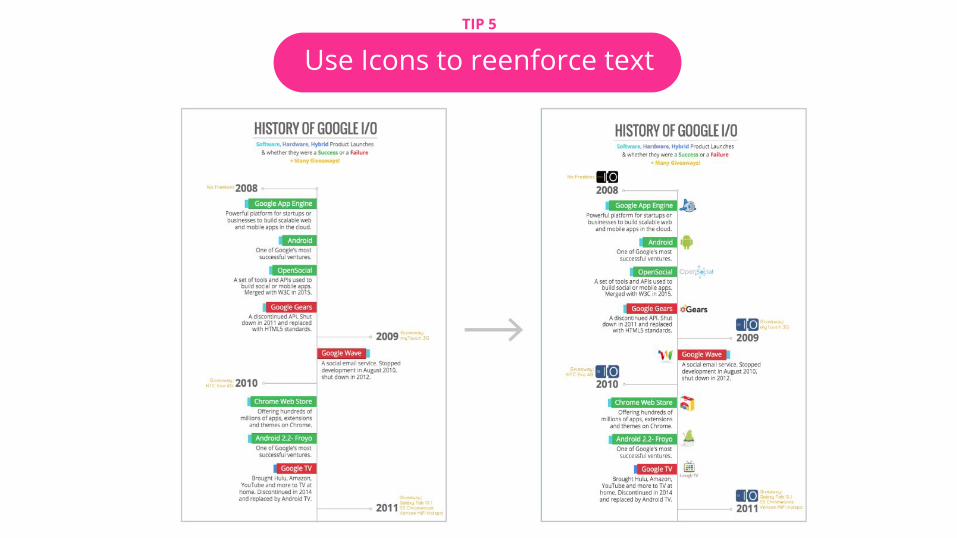
Add Icons
Tip 20
Use Icons to reenforce textTIP 5
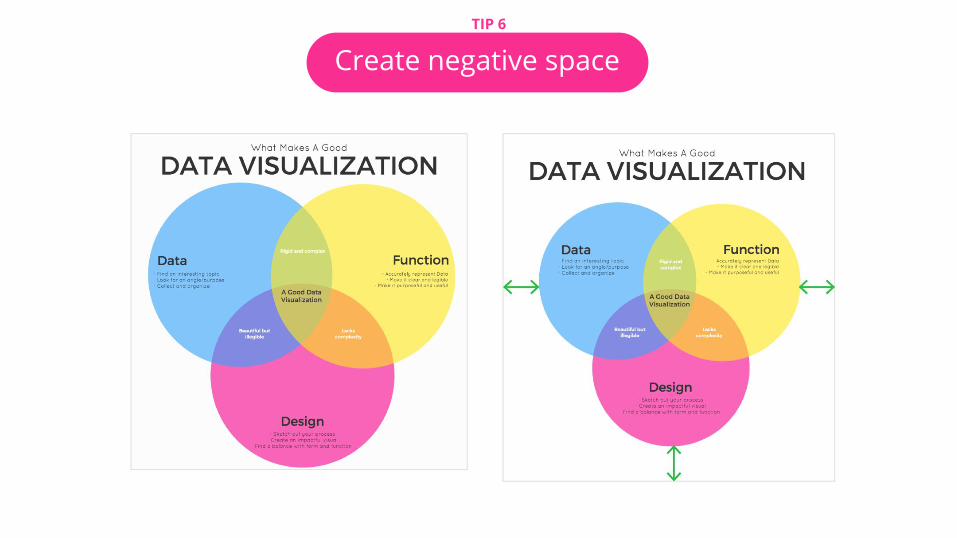
Create negative spaceTIP 6
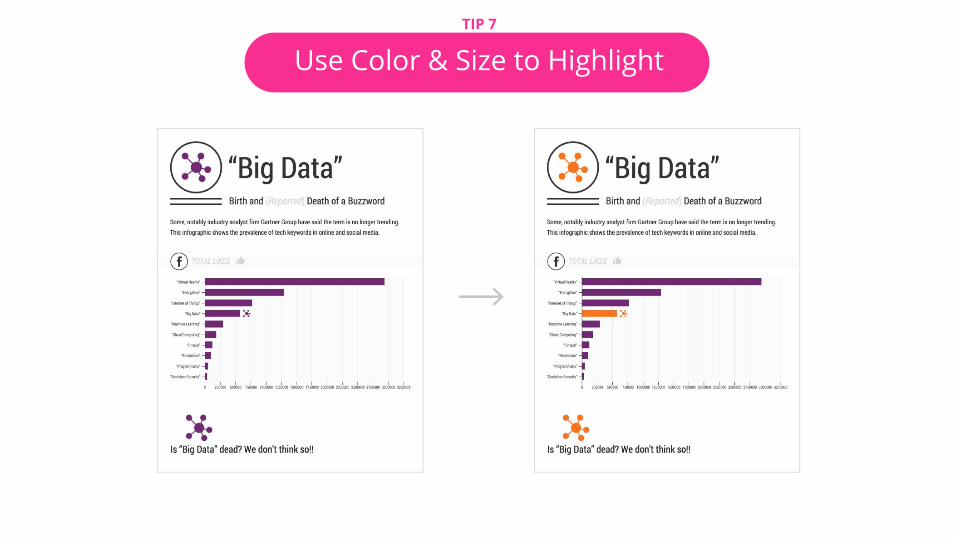
Use Color & Size to HighlightTIP 7
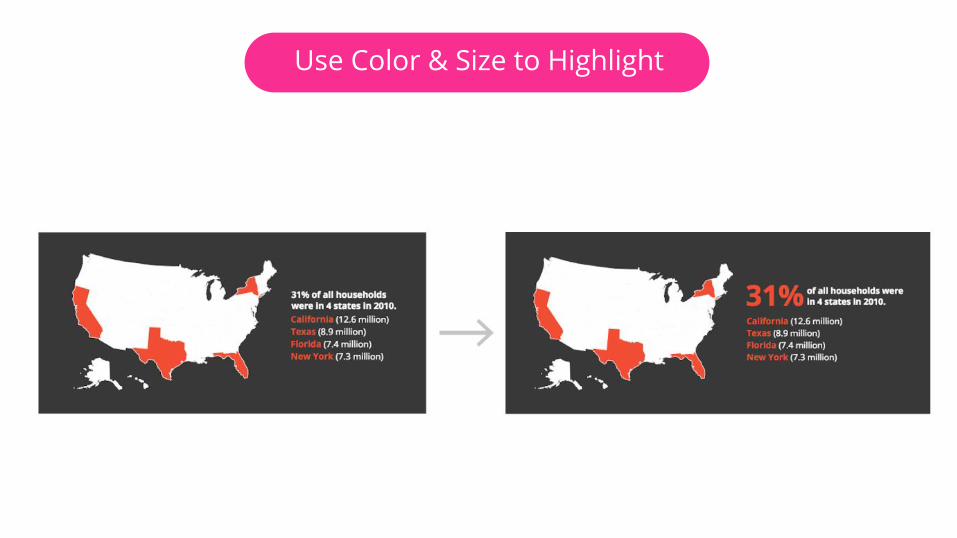
Use Color & Size to Highlight

Short cut to the next level
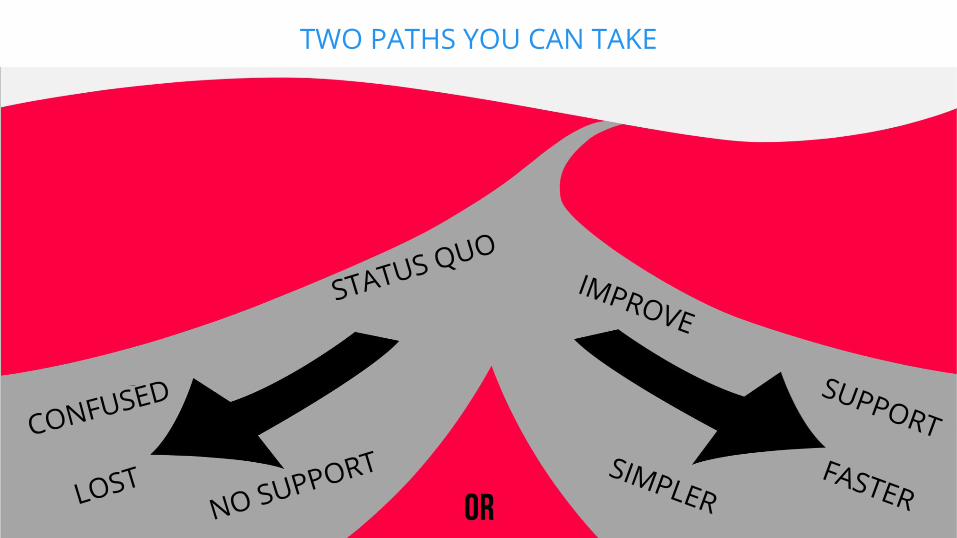
TWO PATHS YOU CAN TAKE
STATUS QUO
CONFUSED
LOSTNO SUPPORT
IMPROVE
SUPPORTFASTER
SIMPLER
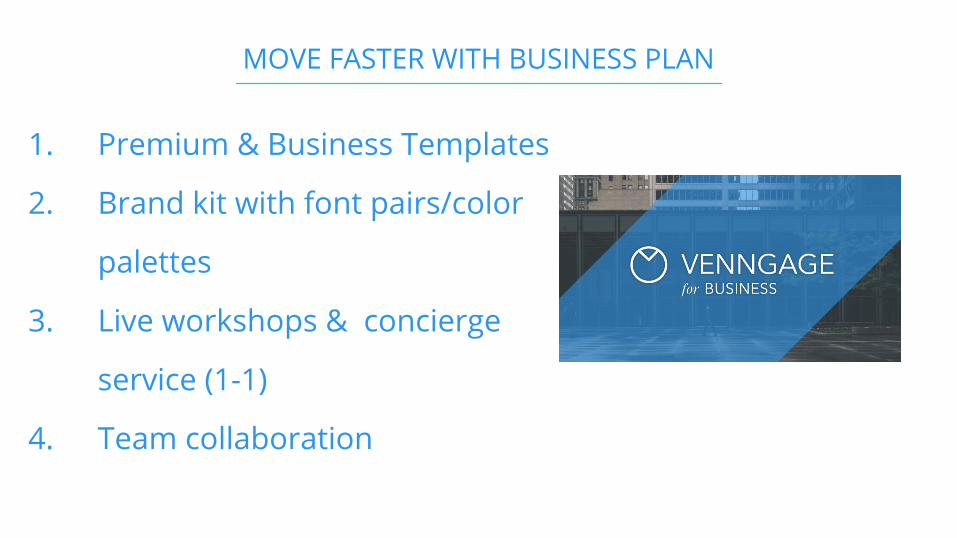
MOVE FASTER WITH BUSINESS PLAN
1. Premium & Business Templates
2. Brand kit with font pairs/color
palettes
3. Live workshops & concierge
service (1-1)
4. Team collaboration
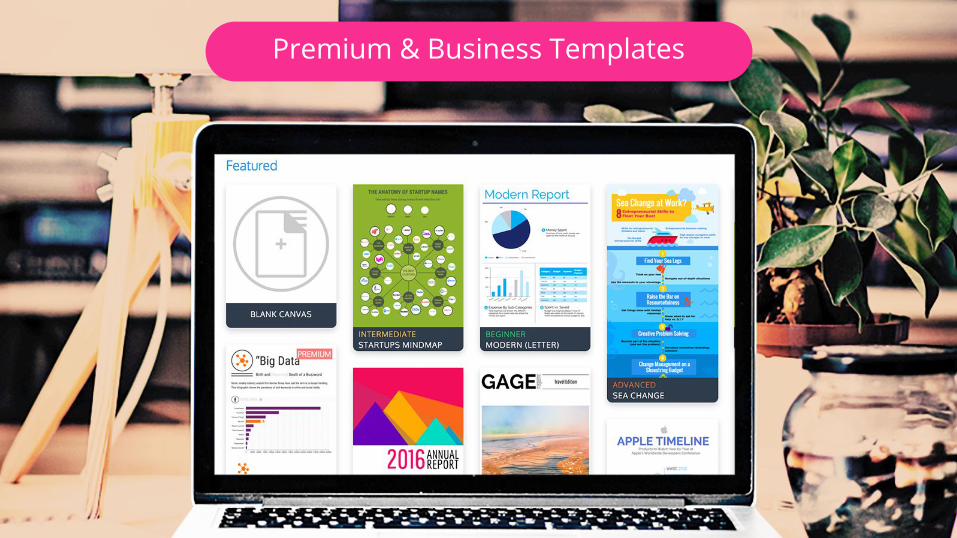
Premium & Business Templates
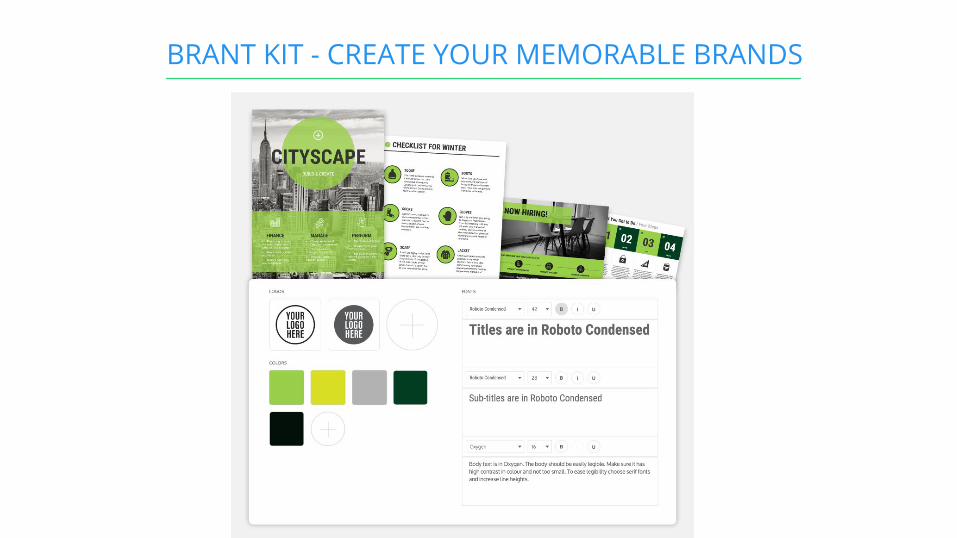
BRANT KIT - CREATE YOUR MEMORABLE BRANDS
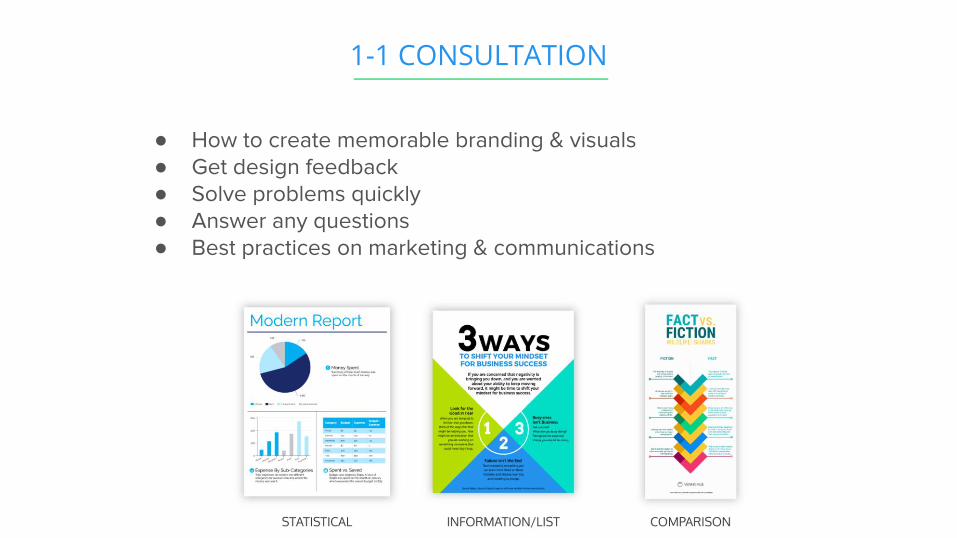
1-1 CONSULTATION
INFOGRAPHICS DOMINATION
Everything you need to know to create professional infographics
● How to create memorable branding & visuals● Get design feedback● Solve problems quickly● Answer any questions● Best practices on marketing & communications
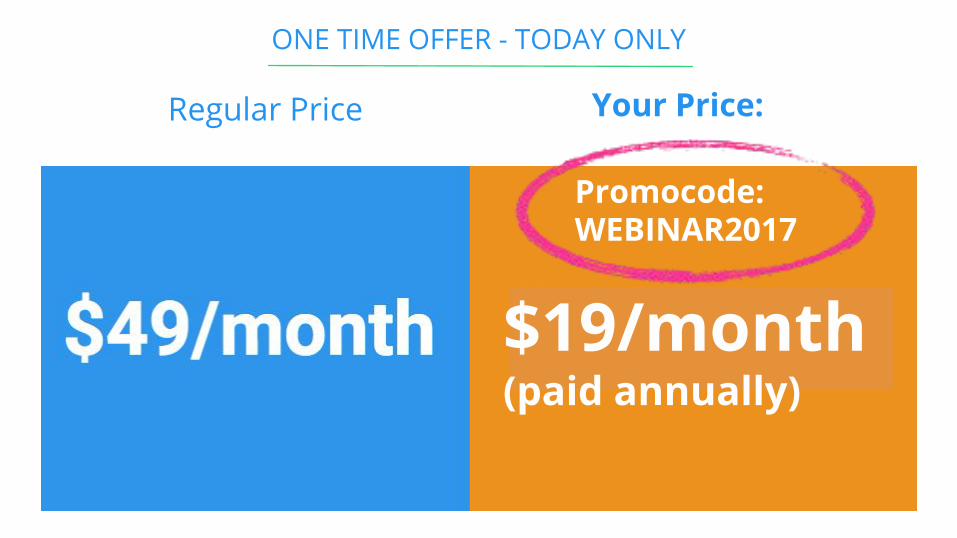
Regular Price Your Price:
Promocode: WEBINAR2017
ONE TIME OFFER - TODAY ONLY
$19/month (paid annually)
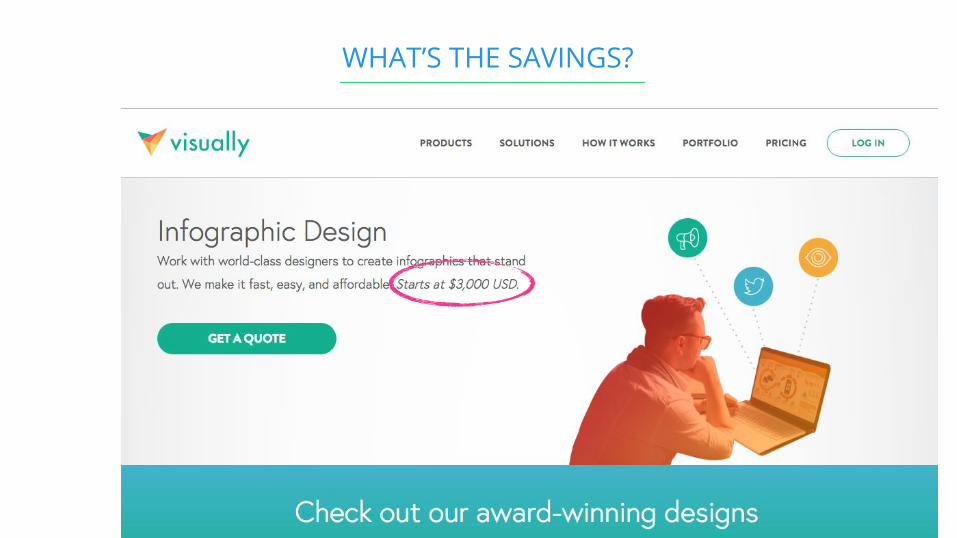
WHAT’S THE SAVINGS?
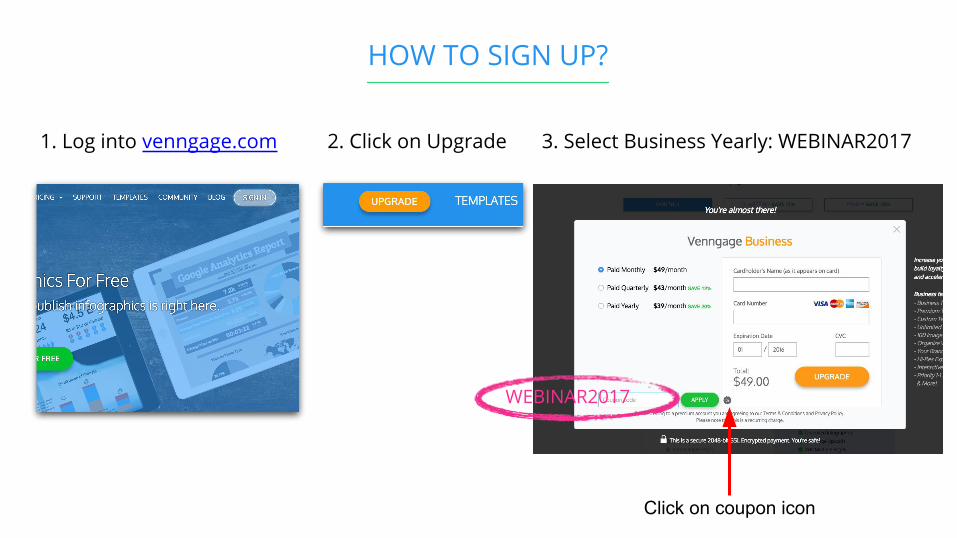
HOW TO SIGN UP?
1. Log into venngage.com 2. Click on Upgrade 3. Select Business Yearly: WEBINAR2017
WEBINAR2017
Click on coupon icon
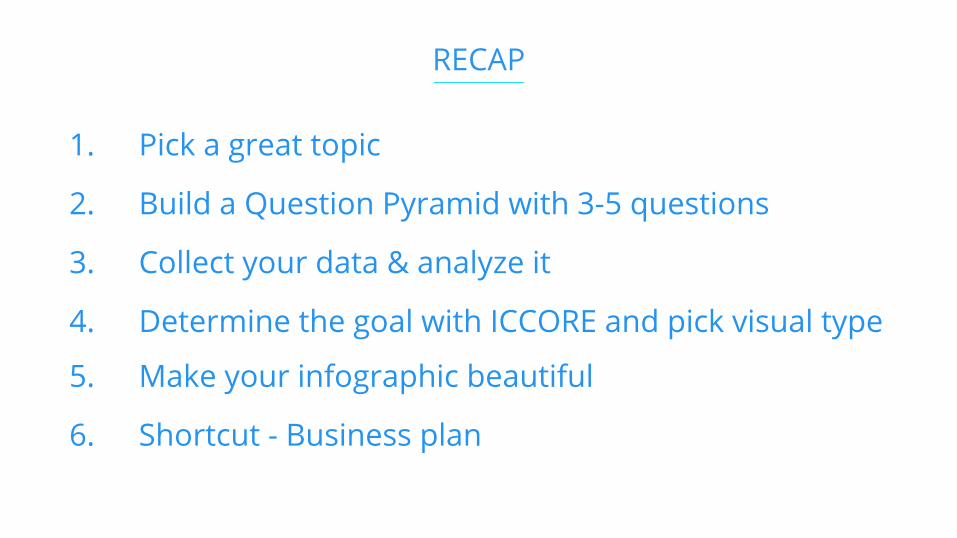
1. Pick a great topic
2. Build a Question Pyramid with 3-5 questions
3. Collect your data & analyze it
4. Determine the goal with ICCORE and pick visual type
5. Make your infographic beautiful
6. Shortcut - Business plan
RECAP
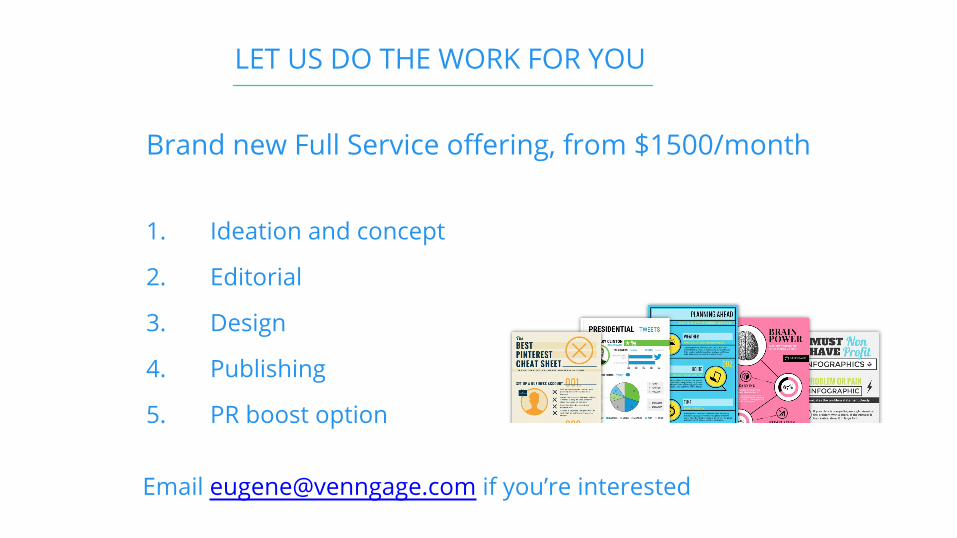
LET US DO THE WORK FOR YOU
Brand new Full Service offering, from $1500/month
1. Ideation and concept
2. Editorial
3. Design
4. Publishing
5. PR boost option
Email [email protected] if you’re interested