Embed Size (px)
Citation preview

GLOBAL DIGITAL FUTURE IN FOCUS
2016 | FIRST EDITION
©comScore | 2
ABOUT THIS REPORT Reporting on over 40 markets worldwide, comScore has a unique perspective on the evolution of digital audiences, behaviours and advertising
Whilst broad in scope, it is not intended to be exhaustive, and we’d encourage you to speak to local representatives as well as explore the insights section of our website for more detailed and country-specific data.
This report highlights key trends that have emerged globally, citing local examples to demonstrate the impact of changes to the online ecosystem.
40+ GLOBAL MARKETS
UNIQUE PERSPECTIVE
DIGITALAUDIENCES
DIGITALBEHAVIOURS
DIGITALADVERTISING

©comScore | 3
THE DIGITAL LANDSCAPE IS MORE GLOBAL THAN EVER

©comScore | Source: comScore MMX, June 2016 | 4
‘NON-US’ HAS SOARED IN SIGNIFICANCE
In the 20 years since 1996, the proportion of non-US internet users measured by comScore has increased from 34% of the global desktop population to 89%
1996 2016
89%
Global non-US internet users
GL
OB
AL

©comScore | 5
Global non-US internet users
GL
OB
AL
‘NON-US’ HAS SOARED IN SIGNIFICANCE
In the 20 years since 1996, the proportion of non-US internet users measured by comScore has increased from 34% of the global desktop population to 89%

6
APAC & EMEA DELIVER THE MAJORITY OF GLOBAL DESKTOP USERS
Over three quarters of desktop internet users are located in the two largest regions, with North America and Latin America almost reaching parity with one another
45%
10%
12%
33%
% of Global Desktop Audience
12%
10%
33%
45%
GL
OB
AL
©comScore | Source: comScore MMX, June 2016 |

©comScore | 7
A MULTI-PLATFORM WORLD HAS CHANGED HOW WE USE DIGITAL THROUGHOUT OUR DAY

©comScore | Source: comScore custom data, October 2016 | 8
EACH PLATFORM ENJOYS ‘PEAK’ DAYPARTS
When looking at the percentage of each platform’s daily impressions by hour, desktop is more evenly distributed, while smartphones and tablets generate more distinct morning and evening peaks
LATE NIGHT 12am – 7am
EARLY MORNING7am – 10am
DAYTIME10am – 5pm
PRIME8pm – 12am
EARLY EVENING5PM – 8pm
UK
PHONE
DESKTOP
TABLET
% of each platform’s average daily impressions by hour
9
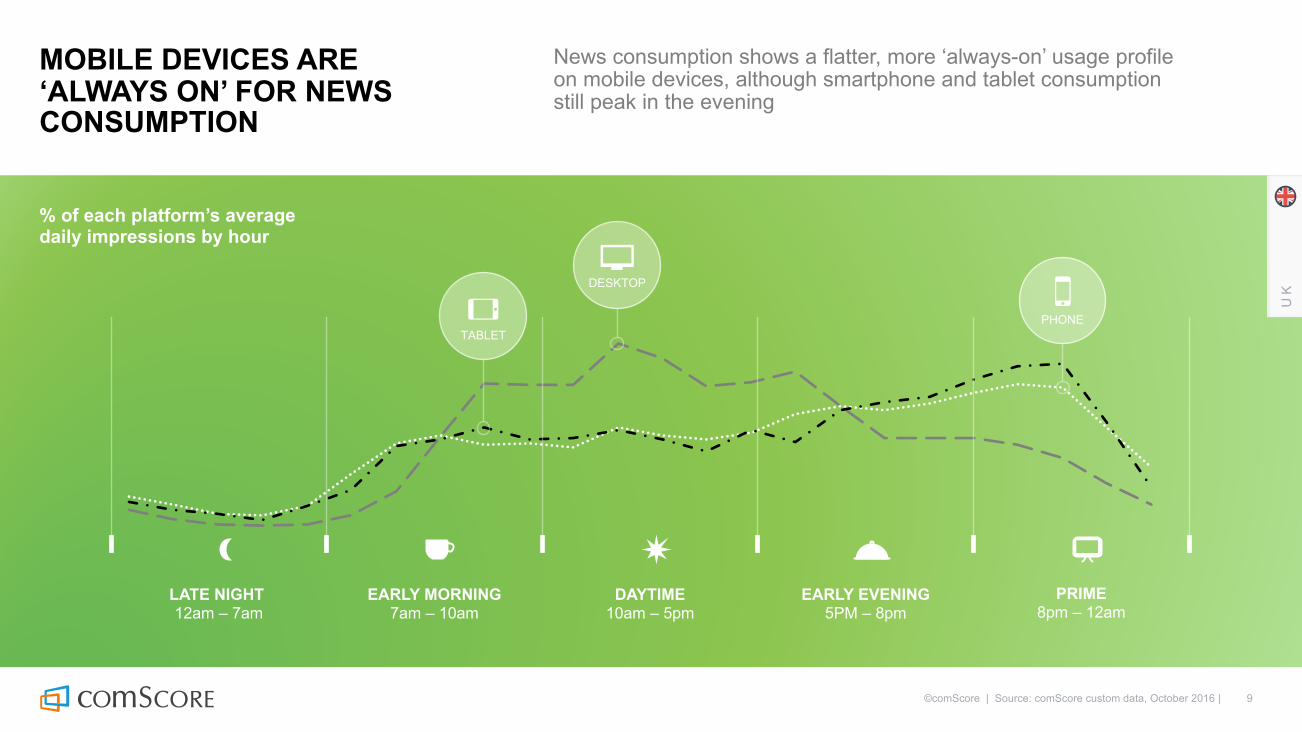
MOBILE DEVICES ARE ‘ALWAYS ON’ FOR NEWS CONSUMPTION
News consumption shows a flatter, more ‘always-on’ usage profile on mobile devices, although smartphone and tablet consumption still peak in the evening
PHONE
DESKTOP
TABLET
UK
LATE NIGHT 12am – 7am
EARLY MORNING7am – 10am
DAYTIME10am – 5pm
PRIME8pm – 12am
EARLY EVENING5PM – 8pm
©comScore | Source: comScore custom data, October 2016 |
% of each platform’s average daily impressions by hour

10
RETAIL IS DEFINED BY MORE PROMINENT PEAKS ON LARGER SCREENS
Tablet devices show one of their largest and longest evening peaks for the retail category, but very limited usage through the rest of the day. Interestingly, desktop retail consumption peaks during the mid-morning period
UK
PHONE
DESKTOP TABLET
LATE NIGHT 12am – 7am
EARLY MORNING7am – 10am
DAYTIME10am – 5pm
PRIME8pm – 12am
EARLY EVENING5PM – 8pm
©comScore | Source: comScore custom data, October 2016 |
% of each platform’s average daily impressions by hour

©comScore | 11
EVEN IN A MULTI-PLATFORM WORLD, DESKTOP IS GROWING AND EVOLVING ITS ROLE

©comScore | Source: comScore MMX, June 2016 | 12
GLOBAL DESKTOP AUDIENCES ARE STILL GROWING
Despite the explosive growth of smartphone and tablet platforms, desktop audiences remain better than stable, showing incremental growth in all regions
+1%North
America
+11%LATAM
+2%EMEA
+4%APAC
Desktop Unique Users
+4%Global
GL
OB
AL

©comScore | Source: comScore MMX, June 2016 | 13
FUNCTION / CONTENT DICTATE CONSUMPTION CHANGES
Taking data from Malaysia as an example, it’s clear that less ‘instant’ categories such as travel and retail have continued to thrive and grow overall time on desktop, despite growing mobile ubiquity that has taken desktop minutes away from categories such as news
MA
LA
YS
IA
Total Minutes (mm)June 2015 > June 2016
Business &Finance
News &Information
Retail
Travel
+18%
+27%
+38%
-10%

©comScore | Source: comScore MMX, June 2016 | 14
DESKTOP OFFERS FOCUSED POCKETS OF VALUABLE AUDIENCES
The shift to mobile and multi-platform usage has been uneven by demographics and categories. The result is strong over- and under-indexes that present challenges and opportunities for publishers and advertisers when recruiting or targeting
Business/Finance Entertainment Games Lifestyles News/Information Portals Retail Social Media Sports Technology Travel
Male & Female
Persons: 15-24 80 102 116 90 90 96 96 101 85 98 79
Persons: 25-34 97 100 95 95 97 99 100 97 95 99 96
Persons: 35-44 105 100 101 101 102 102 102 98 101 99 103
Persons: 45-54 113 99 93 109 108 103 102 102 113 101 114
Persons: 55+ 125 96 85 120 114 104 101 106 124 106 131
Males
Males: 15-24 82 103 129 88 92 96 97 100 103 102 78
Males: 25-34 100 102 104 94 99 99 102 96 116 103 95
Males: 35-44 108 101 104 100 104 102 104 96 119 103 102
Males: 45-54 115 101 95 106 110 103 105 99 128 106 113
Males: 55+ 130 98 81 120 119 105 103 106 146 114 136
Females
Females: 15-24 76 101 102 91 89 96 94 101 64 94 81
Females: 25-34 94 99 85 96 95 99 99 98 71 94 96
Females: 35-44 102 99 97 102 99 103 101 100 81 94 103
Females: 45-54 110 98 91 111 105 102 99 105 96 95 115
Females: 55+ 120 94 89 120 109 103 99 107 102 98 125
UK
Index of unique users

60%
69%
64%
63%
61%
70%
72%
64%
73%
74%
74%
65%
©comScore | Source: comScore MMX Multi-Platform, June 2016 | 15
DESKTOP STILL DOMINATES TIME FOR CERTAIN CATEGORIES
Mobile has overtaken desktop minutes in many regions, but desktop devices still lead for some content types. Portals feature prominently in all of the regions shown, as an example of a category still heavily weighted towards desktop consumption
74%
78%
80%
71%
USA
Canada
Brazil
UK
Desktop % Total Minutes
Finance Info
Politics
Movies
Automotive
Portals
Newspapers
Real Estate
Portals
Tickets
Portals
Portals
Apparel
B2B
Banking
Entertainment
Travel

FR
AN
CE
©comScore | Source: comScore Segment Metrix, June 2016 | 16
GULF OPENING BETWEEN HEAVY AND LIGHT DESKTOP USERS
Another side effect of a more fragmented media mix is the increasing behavioural differences between heavy and light desktop users, even on broad-appeal categories such as social media and travel
100%Social Media
96%Travel
96%Newspapers
59%Comparison
Shopping
62%Social Media
35%Travel
20%Newspapers
14%ComparisonShopping
HEAVY USERS LIGHT USERS
REACH

©comScore | 17
MOBILE DOESN’T CANNIBALISE DESKTOP, ADDS INCREMENTAL TIME AND AUDIENCES

©comScore | Source: comScore MMX Multi-Platform, June 2016 | 18
MOBILE BOOSTS DIGITAL MINUTES, DOESN’T CANNIBALISE DESKTOP
Total minutes on desktop have remained largely flat in the past 12 months, but the impact of mobile is dramatic, adding incremental digital time and opportunity
CANADA BRAZIL UNITED KINGDOM
Desktop MobileTotal minutes
+283%Minutes
+186%Minutes
+134%Mobile
Minutes

©comScore | Source: comScore MMX Multi-Platform, June 2016 | 19
MOBILE IMPACT ON CATEGORIES PROVIDES VARYING OPPORTUNITY
The relative impact of mobile on different content categories has major implications for both publishing and advertising. Social media is heavily dominated by mobile usage in the majority of regions, whereas news appears to vary by location
Mobile mins as % of desktop mins
Brazil Canada UK
Desktop Entertainment Social Media Portals News/Information
100% 100% 100%

©comScore | Source: comScore MMX Multi-Platform, June 2016 | 20
MOBILE HAS ADDED USERS WHO ARE NOT ACTIVE ON DESKTOP
The majority of consumers use mobile to complement desktop usage, but mobile adds incremental audiences that are not active on desktop. Of the selected markets featured, Spain and Brazil especially demonstrate that this is already a significant factor
+8%Canada
+11%USA
+29%Brazil
+12%Argentina
+37%Spain
+7%UK
+22%China
+25%Japan
37%
29%
22%
14%
7%
GL
OB
AL
% incremental users added to desktop by mobile

©comScore | Source: comScore MMX Multi-Platform, June 2016 | 21
DOMINANCE OF MULTI-PLATFORM MAJORITIES
Between the polar extremes of ‘desktop only’ and ‘mobile only’ usage, the overwhelming majority of users now use several platforms within a month
USA
Canada
Brazil
UK
Spain
China
Japan
Argentina
MOBILEONLY
DESKTOPONLY
MULTI-PLATFORM
Multi-platform is the norm
% of unique users
GL
OB
AL

©comScore | 22
PLATFORM SELECTIVITY HAS POLARISED SOME DIGITAL BEHAVIOURS / AUDIENCES

UK
©comScore | Source: comScore MMX Multi-Platform, June 2016 | 23
AVERAGE MINUTES BY PLATFORM ARE POLARISED BY AGE GROUP
Average minutes per user on desktop and mobile platforms are almost mirrored through age brackets, with older users leaning proportionally more heavily on desktop
6000
4000
2000
0
2000
4000
6000
18-24 25-34 35-44 45-54 55+ 6000
4000
2000
0
2000
4000
6000
18-24 25-34 35-44 45-54 55+
Canada
Average mins per userDesktop Mobile

©comScore | Source: comScore MMX Multi-Platform, June 2016 *Japan uses a census-based methodology for mobile measurement | 24
YOUNGER USERS MORE LIKELY TO GO ‘MOBILE ONLY’
In line with spending more minutes on average on mobile devices, younger users across the globe are more likely to abandon desktop altogether – 18 – 34 year olds lead the way in all regions when it comes to mobile only internet usage
Canada Brazil Japan
18–24 25–34 35–44 45–54 55+Mobile only users

25
PLATFORM ADOPTION HAS IMPACTED DEMOGRAPHIC PROFILES
Advertisers and publishers can now use weight of usage as a means of reaching different audiences by platform, to factor into reach & frequency considerations.
MOBILE ONLY (VS. 7% FOR ALL USERS) MULTI PLATFORM (VS. 64% FOR ALL USERS) DESKTOP ONLY (VS. 17% OF 18–54)
13% 26%79%
18–24 years old
25–54 years old
55+ years old
UK
©comScore | Source: comScore MMX Multi-Platform, June 2016 |

©comScore | Source: comScore MMX Multi-Platform, June 2016 | 26
PLATFORM CHOICE INFLUENCED HEAVILY BY CONTENT
With multiple screens available to a growing number of people, it is no surprise that consumption is increasingly following content type. More ad-hoc tasks such as weather and maps are overwhelmingly on mobile devices, but users prefer desktop for retail and official administrative tasks
BR
AZ
IL
Entertainment
Government
Retail
News/Information
Maps
Weather
Desktop Only Multi-Platform Mobile Only% of users by platform

27
‘MOBILE-FIRST’ MATTERS FOR DIGITAL BUSINESSES
The top 20 sites by total digital audience in Canada show how engaging audiences on mobile (including in addition to desktop) has created very few ‘desktop only’ majorities
Desktop-only Mobile
CA
NA
DA
Desktop majority
Desktop majority Desktop
majority
(000) unique users
©comScore | Source: comScore MMX Multi-Platform, June 2016 |
©comScore | Source: comScore Mobile Metrix, June 2016 | 28
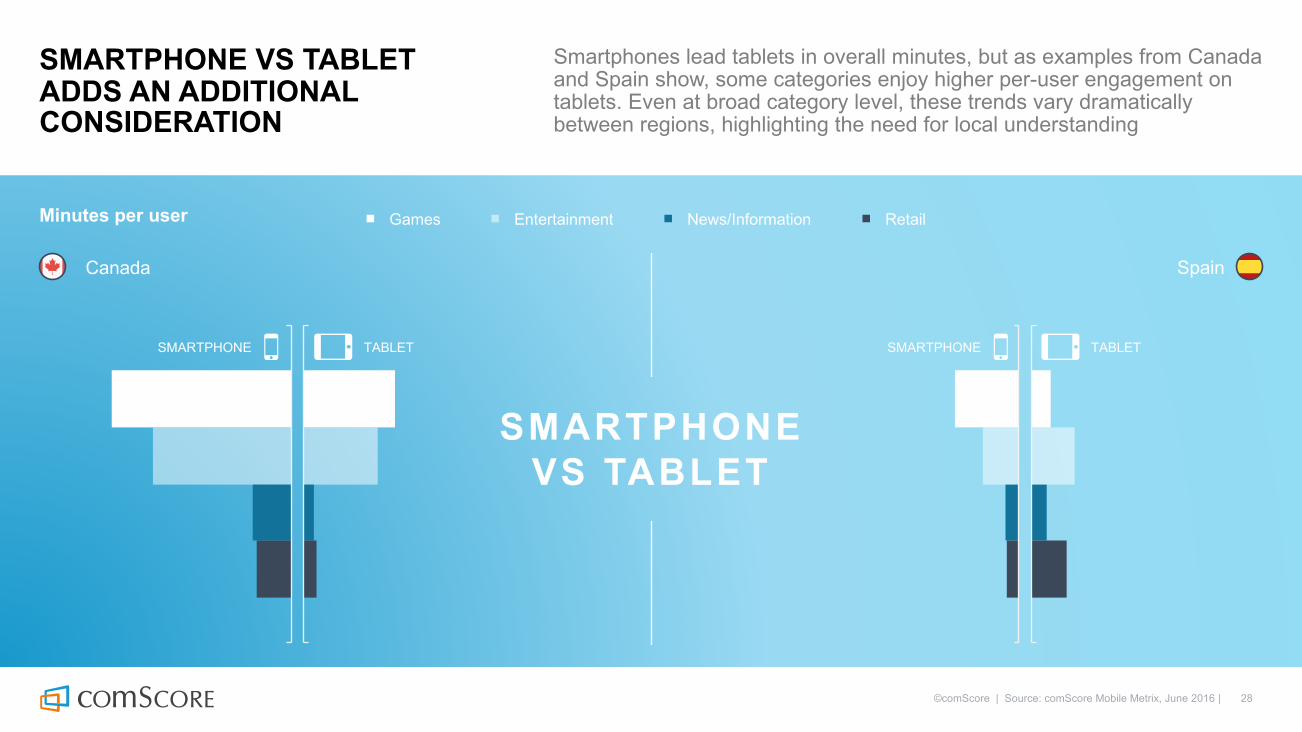
SMARTPHONE VS TABLET ADDS AN ADDITIONAL CONSIDERATION
Smartphones lead tablets in overall minutes, but as examples from Canada and Spain show, some categories enjoy higher per-user engagement on tablets. Even at broad category level, these trends vary dramatically between regions, highlighting the need for local understanding
SMARTPHONE VS TABLET
Games Entertainment News/Information Retail
SMARTPHONE
Canada Spain
TABLET SMARTPHONE TABLET
Minutes per user

©comScore | 29
DIGITAL VIDEO HAS ALSO BECOME MORE FRAGMENTED WITH MOBILE EVOLUTION

30
DESKTOP SCALE AND PER-USER ENGAGEMENT ARE AGE DEPENDENT
Globally speaking, younger users account for the majority of desktop video views, but on a per-user basis, 55+ users consume more video minutes, suggesting a greater number of long-form video for this demographic
MINUTES PER VIEW
VIDEO
15–24
25–34
35–44
45–54
55+
15–24
25–34
35–44
45–54
55+
00.00.00
MOREVIDEOS
FEWERVIDEOS
SHORTERVIDEOS
LONGERVIDEOS
©comScore | Source: comScore Video Metrix, June 2016 |
GL
OB
AL

75%
100%
125%
150%
175%
200%
Total Internet : Total Audience Entertainment Social Networking Portals Newspapers
©comScore | Source: comScore Video Metrix, June 2016 | 31
TOTAL VIDEOS CONSUMED ON DESKTOP CONTINUE TO GROW
Global video minutes have continued to grow on desktop devices, with news, social and entertainment categories showing growth well above average
SOCIAL
NEWS
TOTALAUDIENCE
+2%
Total minutes as a % of October 2014
GL
OB
AL

32
DECLINING MINUTES PER VIDEO SHOWS RISE OF SHORT-FORM / ADS
The overall rise in desktop videos consumed is offset by declining average duration, as viewers enjoy greater volumes of shorter-form content and see more video ads
©comScore | Source: comScore Video Metrix, June 2016 |

©comScore | Source: comScore Video Metrix, June 2016 | 33
YOUNGER USERS POTENTIALLY UNDER-MONETISED ON DESKTOP
Despite consuming more videos overall, younger users consume a smaller percentage of advertising minutes on desktop than older demographics
2.0 2.2
3.12.9
3.3
0.8 0.9 0.9 1.0 1.00.91.1
1.21.4
1.2
2.0 2.1 2.22.5
3.0
18–24 25–34 35–44 45–54 55+
Canada Mexico Germany Australia
Advertising % total mins

©comScore | Source: comScore Video Metrix, June 2016 | 34
VIDEO CATEGORY MONETISATION VARIES DRAMATICALLY
Of the selected categories shown for Argentina and Malaysia, Newspapers are heavily monetised for video, suggesting that advertisers may find ‘blue ocean’ opportunities in other, often premium content categories if video inventory is available
Content % AdsAdvertising % total mins
Newspapers Lifestyles Portals Travel Sports
85%
100%
95%
90%

©comScore | Source: comScore MobiLens, (3 month average), June 2016 | 35
ALL DEMOGRAPHICS INCREASING VIDEO VIEWING ON MOBILE
The % of users watching video on mobile at least once per week has grown significantly. This example from Spain shows a typical pattern that 18-24s lead the way in terms of overall share of users doing so, but growth for 45+ users was proportionally faster
% Watching video on mobile at least once per week (June 2015 vs. June 2016)
+16%
+50%
18-24s 45+
SP
AIN
©comScore | 36
APPS HAVE BECOME A CRUCIAL BATTLEGROUND, WITH HUGE PRIZES AT STAKE

37
ONCE INSTALLED, APPS DELIVER HUGE % OF MOBILE TIME
The value for brands of achieving app success are clear to see, with app usage delivering vast proportions of mobile minutes in every market
USA UKBrazilCanada Spain
87% 87% 90% 90% 82%
Apps as a % of total mobile minutes
©comScore | Source: comScore MMX Multi-Platform, June 2016 |

©comScore | Source: comScore MMX Multi-Platform, June 2016 | 38
APP AUDIENCES APPROACH DESKTOP SCALE
When compared with the largest desktop entity in the same region, largest apps now offer unprecedented reach among consumers, especially in Spain and Brazil
0%
20%
40%
60%
80%
100%
USA Canada UK Spain Brazil
Largest App Largest Desktop EntityLargest app audience as a % largest desktop entity

39
TOP APPS SATURATED BY MAJOR INTERNATIONAL CORPORATIONS
Top apps are dominated by large, international players. Interestingly, some categories such as messaging show increased prominence outside the US.
USA % Reach
Facebook 79Facebook Messenger 69YouTube 61Google Maps 54Google Play 52Google Search 51Gmail 44Instagram 41Pandora Radio 41Amazon Mobile 36
UK % Reach
Facebook 74Facebook Messenger 67YouTube 59WhatsApp Messenger 57Google Play 52Google Search 50Google Maps 44Gmail 37eBay 35Amazon Mobile 34
Brazil % Reach
WhatsApp Messenger 85Google Play 83YouTube 75Google Search 67Facebook 59Facebook Messenger 54Gmail 50Google Maps 36Instagram 35Google Drive 32
©comScore | Source: comScore MMX Multi-Platform, June 2016 |

©comScore | Source: comScore MobiLens / MobiLens Plus June 2016 3 Month Average | 40
THE BARRIER TO ENTRY IS VERY HIGH FOR ANY NEW APP DOWNLOADS
Despite the ubiquity and usage time of mobile devices, a surprisingly small number of users downloads any new apps in a month, meaning that new apps must work very hard to build momentum
42%
38%
19%
28%
25%
26%
12%
36%
% Downloading any number of apps in a month
USA
Canada
France
Germany
Italy
Spain
Japan
UK
©comScore | Source: comScore MobiLens / MobiLens Plus June 2016 3 Month Average | 41
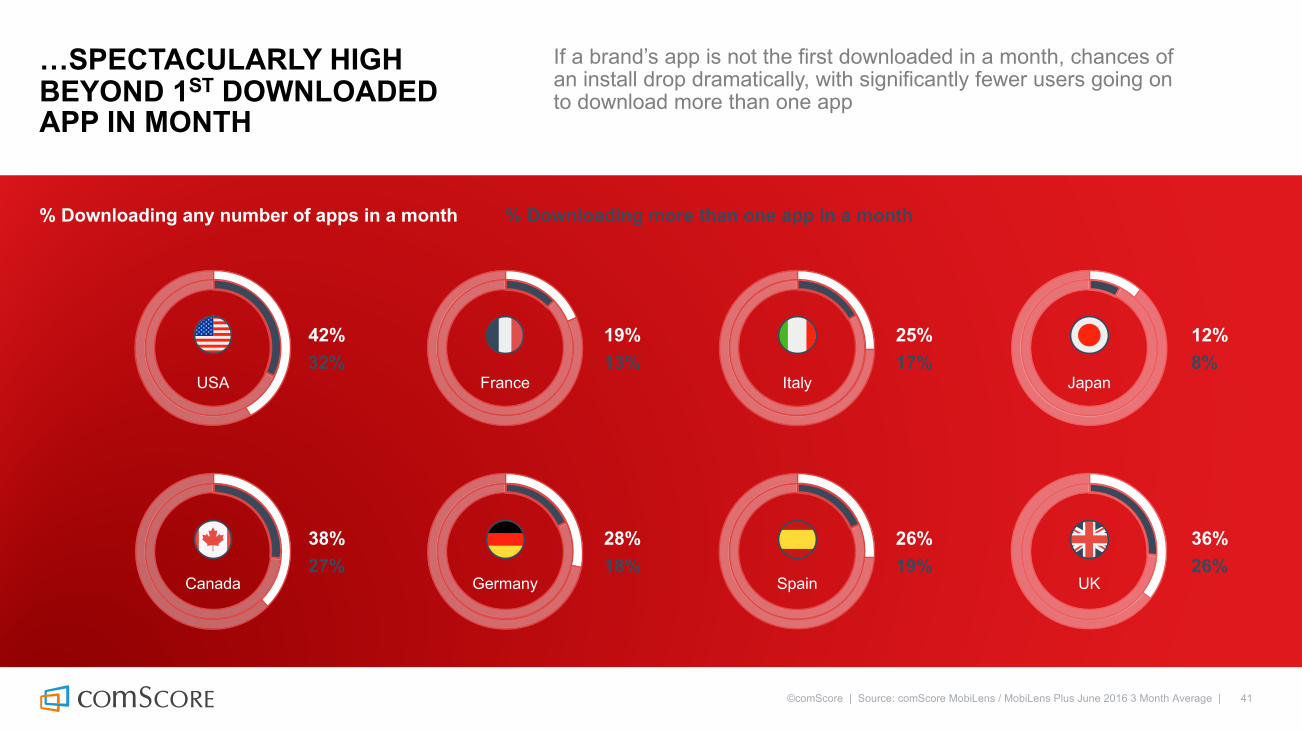
…SPECTACULARLY HIGH BEYOND 1ST DOWNLOADED APP IN MONTH
If a brand’s app is not the first downloaded in a month, chances of an install drop dramatically, with significantly fewer users going on to download more than one app
% Downloading more than one app in a month
USA
Canada
France
Germany
Italy
Spain
Japan
UK
% Downloading any number of apps in a month
32%42%
27%38%
13%19%
18%28%
17%25%
19%26%
8%12%
26%36%

42
PURCHASING VIA APP APPROACHING MOBILE BROWSING LEVELS
Consumers are increasingly turning to apps to make mobile purchases, although brands are yet to translate overwhelming time into greater share of sales vs. mobile browser
4.7
9 9.3
5.44.3
7.7
10.1
14.6
9.3
5.3
France Germany Italy Spain Japan
App Browsing
% of consumers making purchases on mobile devices via web / app
©comScore | Source: comScore MobiLens / MobiLens Plus June 2016 3 Month Average |

©comScore | 43
TRENDS AND TAKEAWAYS
Desktop audiences and time have been complemented, rather than replaced by mobile devices. Desktop still offers large (albeit more focused) demographics and for particular types of content, it is still the platform for scale. Reach and frequency management for advertisers needs to account for multi-platform usage.
Desktop evolution has created polarised audiences and behaviours

©comScore | 44
TRENDS AND TAKEAWAYS
Understanding how different user demographics and content categories have adjusted to a multi-platform world allows bespoke approaches to recruiting audiences or delivering advertising. Mobile-only usage is growing, particularly amongst younger users, but multi-platform usage is the norm.
The uneven move to mobile creates audience and content opportunities

©comScore | 45
TRENDS AND TAKEAWAYS Digital video is growing but fragmenting further. Monetisation is not uniform
Younger audiences consume more videos on desktop devices, but are proportionally under-represented in terms of advertising video, leaving relatively uncluttered opportunities. All demographics are increasing mobile consumption, but at varying rates.

©comScore | 46
TRENDS AND TAKEAWAYS Platform choice is increasingly proactive, but not always mobile-first
New platforms have already added complexity to user journeys. Widespread availability of devices means platform choice is increasingly proactive, based on function, location and time of day. Understanding these nuances allows for sophisticated multi-platform access to consumers almost 24 hours a day.

©comScore | 47
TRENDS AND TAKEAWAYS Mobile apps are a highly-competitive but incredibly lucrative battleground
Mobile apps dominate mobile time and are already approaching even the largest desktop sites in terms of reach. They can provide huge benefit to brands, but the challenge remains getting users to install new apps in a market dominated by large, established brands.


![[Conference];[Comscore statistic]](https://img.pdfslide.net/doc/110x75/554c187eb4c905e7568b4ea3/conferencecomscore-statistic.jpg)