Embed Size (px)
Citation preview


PrinciplesStandards
and
for SchoolMathematics


Copyright © 2000 byThe National Council of Teachers of Mathematics, Inc.
1906 Association Drive, Reston, VA 20191-9988www.nctm.org
All rights reserved
Library of Congress Cataloguing-in-Publication Data:
ISBN 0-87353-480-8
Dynamic Geometry is a registered trademark of Key Curriculum Pressand is used with the permission of the trademark holder.
Photographs by Kathleen Beall
Printed in the United States of America
Permission to photocopy limited material from Principles and Standards for School Mathematics isgranted for educational purposes. Permission must be obtained when content from this publicationis used commercially, when the material is quoted in advertising, when portions are used in otherpublications, or when charges for copies are made. The use of material from Principles and Stan-dards for School Mathematics, other than in those cases described, should be brought to the attentionof the National Council of Teachers of Mathematics.

Table of Contents
Standards 2000 Project . . . . . . . . . . . . . . . . . . . . . . . . . . . . . . . . . . . . . . . vii
Acknowledgments. . . . . . . . . . . . . . . . . . . . . . . . . . . . . . . . . . . . . . . . . . . . viii
Preface . . . . . . . . . . . . . . . . . . . . . . . . . . . . . . . . . . . . . . . . . . . . . . . . . . . . . . . ix
Letter of Appreciation . . . . . . . . . . . . . . . . . . . . . . . . . . . . . . . . . . . . . . . . xv
Chapter 1
A Vision for School Mathematics . . . . . . . . . . . . . . . . . . . . . . . . . . . . 2
Chapter 2
Principles for School Mathematics . . . . . . . . . . . . . . . . . . . . . . . . . 10The Equity Principle . . . . . . . . . . . . . . . . . . . . . . . . . . . . . . . . . . . . . . . . . . 12The Curriculum Principle . . . . . . . . . . . . . . . . . . . . . . . . . . . . . . . . . . . . . . 14The Teaching Principle . . . . . . . . . . . . . . . . . . . . . . . . . . . . . . . . . . . . . . . . 16The Learning Principle . . . . . . . . . . . . . . . . . . . . . . . . . . . . . . . . . . . . . . . . 20The Assessment Principle . . . . . . . . . . . . . . . . . . . . . . . . . . . . . . . . . . . . . . 22The Technology Principle . . . . . . . . . . . . . . . . . . . . . . . . . . . . . . . . . . . . . . 24
Chapter 3
Standards for School Mathematics:Prekindergarten through Grade 12 . . . . . . . . . . . . . . . . . . . . . . 28
Number and Operations . . . . . . . . . . . . . . . . . . . . . . . . . . . . . . . . . . . . . . . 32Algebra . . . . . . . . . . . . . . . . . . . . . . . . . . . . . . . . . . . . . . . . . . . . . . . . . . . . . 37Geometry . . . . . . . . . . . . . . . . . . . . . . . . . . . . . . . . . . . . . . . . . . . . . . . . . . . 41Measurement . . . . . . . . . . . . . . . . . . . . . . . . . . . . . . . . . . . . . . . . . . . . . . . . 44Data Analysis and Probability . . . . . . . . . . . . . . . . . . . . . . . . . . . . . . . . . . . 48Problem Solving . . . . . . . . . . . . . . . . . . . . . . . . . . . . . . . . . . . . . . . . . . . . . . 52Reasoning and Proof . . . . . . . . . . . . . . . . . . . . . . . . . . . . . . . . . . . . . . . . . . 56Communication . . . . . . . . . . . . . . . . . . . . . . . . . . . . . . . . . . . . . . . . . . . . . . 60Connections . . . . . . . . . . . . . . . . . . . . . . . . . . . . . . . . . . . . . . . . . . . . . . . . . 64Representation . . . . . . . . . . . . . . . . . . . . . . . . . . . . . . . . . . . . . . . . . . . . . . . 67
Chapter 4
Standards for Grades Pre-K–2 . . . . . . . . . . . . . . . . . . . . . . . . . . . . . . 72Number and Operations . . . . . . . . . . . . . . . . . . . . . . . . . . . . . . . . . . . . . . . 78Algebra . . . . . . . . . . . . . . . . . . . . . . . . . . . . . . . . . . . . . . . . . . . . . . . . . . . . . 90Geometry . . . . . . . . . . . . . . . . . . . . . . . . . . . . . . . . . . . . . . . . . . . . . . . . . . . 96Measurement . . . . . . . . . . . . . . . . . . . . . . . . . . . . . . . . . . . . . . . . . . . . . . . 102Data Analysis and Probability . . . . . . . . . . . . . . . . . . . . . . . . . . . . . . . . . . 108Problem Solving . . . . . . . . . . . . . . . . . . . . . . . . . . . . . . . . . . . . . . . . . . . . . 116Reasoning and Proof . . . . . . . . . . . . . . . . . . . . . . . . . . . . . . . . . . . . . . . . . 122Communication . . . . . . . . . . . . . . . . . . . . . . . . . . . . . . . . . . . . . . . . . . . . . 128Connections . . . . . . . . . . . . . . . . . . . . . . . . . . . . . . . . . . . . . . . . . . . . . . . . 132Representation . . . . . . . . . . . . . . . . . . . . . . . . . . . . . . . . . . . . . . . . . . . . . . 136
v

Chapter 5
Standards for Grades 3–5 . . . . . . . . . . . . . . . . . . . . . . . . . . . . . . . . . . 142Number and Operations . . . . . . . . . . . . . . . . . . . . . . . . . . . . . . . . . . . . . . 148Algebra . . . . . . . . . . . . . . . . . . . . . . . . . . . . . . . . . . . . . . . . . . . . . . . . . . . . 158Geometry . . . . . . . . . . . . . . . . . . . . . . . . . . . . . . . . . . . . . . . . . . . . . . . . . . 164Measurement . . . . . . . . . . . . . . . . . . . . . . . . . . . . . . . . . . . . . . . . . . . . . . . 170Data Analysis and Probability . . . . . . . . . . . . . . . . . . . . . . . . . . . . . . . . . . 176Problem Solving . . . . . . . . . . . . . . . . . . . . . . . . . . . . . . . . . . . . . . . . . . . . . 182Reasoning and Proof . . . . . . . . . . . . . . . . . . . . . . . . . . . . . . . . . . . . . . . . . 188Communication . . . . . . . . . . . . . . . . . . . . . . . . . . . . . . . . . . . . . . . . . . . . . 194Connections . . . . . . . . . . . . . . . . . . . . . . . . . . . . . . . . . . . . . . . . . . . . . . . . 200Representation . . . . . . . . . . . . . . . . . . . . . . . . . . . . . . . . . . . . . . . . . . . . . . 206
Chapter 6
Standards for Grades 6–8 . . . . . . . . . . . . . . . . . . . . . . . . . . . . . . . . . . 210Number and Operations . . . . . . . . . . . . . . . . . . . . . . . . . . . . . . . . . . . . . . 214Algebra . . . . . . . . . . . . . . . . . . . . . . . . . . . . . . . . . . . . . . . . . . . . . . . . . . . . 222Geometry . . . . . . . . . . . . . . . . . . . . . . . . . . . . . . . . . . . . . . . . . . . . . . . . . . 232Measurement . . . . . . . . . . . . . . . . . . . . . . . . . . . . . . . . . . . . . . . . . . . . . . . 240Data Analysis and Probability . . . . . . . . . . . . . . . . . . . . . . . . . . . . . . . . . . 248Problem Solving . . . . . . . . . . . . . . . . . . . . . . . . . . . . . . . . . . . . . . . . . . . . . 256Reasoning and Proof . . . . . . . . . . . . . . . . . . . . . . . . . . . . . . . . . . . . . . . . . 262Communication . . . . . . . . . . . . . . . . . . . . . . . . . . . . . . . . . . . . . . . . . . . . . 268Connections . . . . . . . . . . . . . . . . . . . . . . . . . . . . . . . . . . . . . . . . . . . . . . . . 274Representation . . . . . . . . . . . . . . . . . . . . . . . . . . . . . . . . . . . . . . . . . . . . . . 280
Chapter 7
Standards for Grades 9–12 . . . . . . . . . . . . . . . . . . . . . . . . . . . . . . . . . 286Number and Operations . . . . . . . . . . . . . . . . . . . . . . . . . . . . . . . . . . . . . . 290Algebra . . . . . . . . . . . . . . . . . . . . . . . . . . . . . . . . . . . . . . . . . . . . . . . . . . . . 296Geometry . . . . . . . . . . . . . . . . . . . . . . . . . . . . . . . . . . . . . . . . . . . . . . . . . . 308Measurement . . . . . . . . . . . . . . . . . . . . . . . . . . . . . . . . . . . . . . . . . . . . . . . 320Data Analysis and Probability . . . . . . . . . . . . . . . . . . . . . . . . . . . . . . . . . . 324Problem Solving . . . . . . . . . . . . . . . . . . . . . . . . . . . . . . . . . . . . . . . . . . . . . 334Reasoning and Proof . . . . . . . . . . . . . . . . . . . . . . . . . . . . . . . . . . . . . . . . . 342Communication . . . . . . . . . . . . . . . . . . . . . . . . . . . . . . . . . . . . . . . . . . . . . 348Connections . . . . . . . . . . . . . . . . . . . . . . . . . . . . . . . . . . . . . . . . . . . . . . . . 354Representation . . . . . . . . . . . . . . . . . . . . . . . . . . . . . . . . . . . . . . . . . . . . . . 360
Chapter 8
Working Together to Achieve the Vision . . . . . . . . . . . . . . . . . . 366
References . . . . . . . . . . . . . . . . . . . . . . . . . . . . . . . . . . . . . . . . . . . . . . . . . . 383
Appendix
Table of Standards and Expectations . . . . . . . . . . . . . . . . . . . . . . 392
vi
vii
Grades Pre-K–2
Jeane Joyner, ChairNorth Carolina Department of Public Instruction, Raleigh, North CarolinaAngela AndrewsScott School, Naperville, IlinoisDouglas H. ClementsState University of New York at Buffalo, Buffalo, New YorkAlfinio FloresArizona State University, Tempe, ArizonaCarol MidgettSouthport Elementary School, Southport,North CarolinaJudith RoitmanUniversity of Kansas, Lawrence, Kansas
Grades 3–5
Barbara Reys, ChairUniversity of Missouri—Columbia, Columbia, MissouriFrancis (Skip) FennellWestern Maryland College, Westminster,MarylandCatherine M. FuegleinWebster Groves School District, WebsterGroves, MissouriMelinda HamiltonRosemont Elementary School, Orlando,Florida, 1998–99Melissa Manzano-AlemánFort Worth Independent School District, Fort Worth, Texas, 1996–97Susan Jo RussellEducation Research Collaborative, TERC,Cambridge, MassachusettsPhilip WagreichUniversity of Illinois at Chicago, Chicago, Illinois
Editors
Jean CarpenterNational Council of Teachers of MathematicsSheila GorgNational Council of Teachers of Mathematics
Grades 6–8
Edward A. Silver, ChairUniversity of Pittsburgh, Pittsburgh, PennsylvaniaMary BouckBattle Creek Public Schools, Battle Creek,Michigan Jean HowardC. R. Anderson Middle School, Helena, MontanaDiana LambdinIndiana University Bloomington, Blooming-ton, Indiana Carol MalloyUniversity of North Carolina at Chapel Hill,Chapel Hill, North CarolinaJames SandefurGeorgetown University, Washington, D.C.
Grades 9–12
Alan Schoenfeld, ChairUniversity of California at Berkeley, Berkeley, CaliforniaSue EddinsIllinois Mathematics and Science Academy,Aurora, IllinoisM. Kathleen HeidPennsylvania State University—UniversityPark Campus, University Park, PennsylvaniaMillie JohnsonWestern Washington University, Bellingham,WashingtonRon LancasterThe Bishop Strachan School, Toronto, OntarioAlfred ManasterUniversity of California—San Diego,La Jolla, CaliforniaMilton NormanGranby High School, Norfolk, Virginia(through 1999)
Cover Design, Book Design,and Illustration
Debra G. KushnerNational Council of Teachers of Mathematics
Standards 2000 Project
Commission on the Future of theStandards
Mary M. Lindquist, ChairColumbus State University, Columbus, GeorgiaShelley FergusonStandards 2000 Outreach Coordinator, National Council of Teachers of MathematicsFred CrouseAnnapolis Valley Regional School Board, Centerville, Nova ScotiaPortia ElliottUniversity of Massachusetts, Amherst,MassachusettsMazie JenkinsMadison Metropolitan School District, Madison,WisconsinJeremy KilpatrickUniversity of Georgia, Athens, GeorgiaMichael KoehlerBlue Valley North High School, OverlandPark, KansasJames R. C. LeitzelUniversity of New Hampshire, Durham, NewHampshire, 1996–98Marilyn MaysNorth Lake College, Irving, TexasRichard SchoenStanford University, Stanford, CaliforniaBonnie Hanson WalkerLamar Consolidated Independent SchoolDistrict, Rosenberg, Texas
Electronic Format Group
Enrique Galindo, ChairIndiana University, Bloomington, Bloomington,IndianaS. Thomas GorskiThe Gilman School, Baltimore, Maryland Beverly HunterBoston College, Chestnut Hill, Massachusetts Eugene KlotzSwarthmore College/Math Forum, Swarthmore,PennsylvaniaNanette SeagoVideo Cases for Mathematics Professional Development, San Diego, CaliforniaLen SimutisEisenhower National Clearinghouse for Mathe-matics and Science Education, Columbus, Ohio
Joan Ferrini-Mundy, ChairUniversity of New Hampshire, Durham,New Hampshire (through 1999); MichiganState University, East Lansing, Michigan
W. Gary Martin, Project DirectorNational Council of Teachers of Mathematics
Writing Group

viii
Additional Writing
Cathy KessellDawn BerkEric Hart
Editorial Assistance
Steve OlsonSister Barbara ReynoldsMarie GaudardBradford FindellMarcia A. FriedmanCharles A. (Andy) ReevesKathleen LayDaniel BreidenbachJoan ArmisteadHarry TunisCharles C. E. Clements
Design and Production Assistance
Jo H. HandersonKevin Chadwick (logo design)
Staff Support
Edward T. Esty,Staff Liaison, 1996–97
Edith Huffman, 1997–98Sharon Soucy-McCrone, 1996–97Alan Cook, Staff Liaison,1995–96
Research Assistance
Hope GersonTodd GrundmeierJohn Beyers Maria Alejandra SortoStephen HwangMargot MaillouxGary LewisCengiz AlacaciMarjorie Henningsen
Clerical Support
Rebecca TottenAna Graef-JonesAlexandra TorresDenise BaxterAimee SpevakClaire WilliamsErin KellyAlphonse McCulloughAyn LowryTeresia KiraguHelen WaldoElizabeth WallaceSusan Suchar
Acknowledgments
Appreciation must also be expressed to members of the NCTMPublications Department not listed above and to members of themany other NCTM departments that supported the efforts of theWriting Group and the Standards 2000 Project. Finally, a specialthank-you to all the persons (too numerous to mention by name)who so generously provided their feedback throughout the prepara-tion of the discussion draft and the final document, with particularthanks to the chairs and members of the Association Review Groupsand to the commissioned reviewers.
National Council ofTeachers of MathematicsLeadership
Presidents
Gail F. Burrill 1996–98Glenda T. Lappan 1998–2000Mary M. Lindquist 1992–94Jack Price 1994–96Lee V. Stiff 2000–2002
Executive Directors
Linda Rosen 1995–97Jim Rubillo (acting) 1997–98John A. Thorpe 1998–present
Board of Directors
Jerry P. Becker 1995–98Diane J. Briars 1994–97Patricia F. Campbell 1996–99Ann M. Carlyle 1997–2000Loring (Terry) Coes III 1997–2000Dwight A. Cooley 1996–99Ian C. deGroot 1991–94Daniel T. Dolan 1991–94Francis (Skip) Fennell 1993–96Joan Ferrini-Mundy 1993–96Linda M. Gojak 1996–99Earlene K. Hemmer 1992–94Christian R. Hirsch 1993–96Peggy House 1995–98Judith E. Jacobs 1999–2002Rita C. Janes 1998–2001David R. Johnson 1991–94Richard Kopan 1997–2000 Roberta Koss 1994–97Steven J. Leinwand 1997–2000Miriam A. Leiva 1992–95Frank K. Lester, Jr. 1999–2002Thomas R. Lewis 1998–2001Karen Longhart 1998–2001Johnny W. Lott 1996–99William J. Masalski 1992–95Carol E. Malloy 1999–2002Sue Ann McGraw 1993–96Beatrice Moore-Harris 1999–2002Beverly W. Nichols 1991–94Sandra M. Powers 1995–98Paul R. Trafton 1994–97Zalman Usiskin 1995–98Irvin E. Vance 1992–95John Van de Walle 1998–2001Lorna Fay Wiggan 1994–97

&Preface
PrinciplesStandards
for
School Mathematics
Principles and Standards for School Mathematics is intended to be a re-source and guide for all who make decisions that affect the mathematicseducation of students in prekindergarten through grade 12. The rec-ommendations in it are grounded in the belief that all students shouldlearn important mathematical concepts and processes with understand-ing. Principles and Standards makes an argument for the importance ofsuch understanding and describes ways students can attain it. Its audi-ence includes mathematics teachers; teacher-leaders in schools and dis-tricts; developers of instructional materials and frameworks; district-level curriculum directors and professional development leaders; thoseresponsible for educating mathematics teachers; preservice teachers;school, state, and provincial administrators; and policymakers. In addi-tion, the document can serve as a resource for researchers, mathemati-cians, and others with an interest in school mathematics. Principles andStandards has been produced by the National Council of Teachers ofMathematics (NCTM), an international professional organizationcommitted to excellence in mathematics teaching and learning for allstudents.
The NCTM had previously produced a landmark trio of Standardsdocuments—Curriculum and Evaluation Standards for School Mathematics(1989), Professional Standards for Teaching Mathematics (1991), and Assess-ment Standards for School Mathematics (1995). These three documentsrepresented a historically important first attempt by a professional orga-nization to develop and articulate explicit and extensive goals for teach-ers and policymakers. Since their release, they have given focus, coher-ence, and new ideas to efforts to improve mathematics education.
ix

From the beginning of its involvement in proposing education stan-dards, NCTM has viewed its efforts as part of an ongoing process ofimproving mathematics education. For standards to remain viable, thegoals and visions they embody must periodically be examined, evalu-ated, tested by practitioners, and revised. In the early 1990s, the Coun-cil began discussing the need for monitoring and updating the existingNCTM Standards. These discussions culminated in the appointment ofthe Commission on the Future of the Standards in 1995. In April 1996,the NCTM Board of Directors approved a process for revising and up-dating the original Standards documents. This project, which wasdubbed “Standards 2000,” illustrates how the setting of standards canserve as a reflective and consensus-building mechanism for all those in-terested in mathematics education.
A number of structures were established within NCTM to initiateStandards 2000. First, the Commission on the Future of the Standardswas appointed in 1995 and charged to—
• oversee the Standards 2000 project and related projects;• collect and synthesize information and advice from within and out-
side NCTM throughout the development of the project;• develop a plan for the dissemination, interpretation, implementation,
evaluation, and subsequent revision of future Standards documents.
The Standards 2000 Writing Group and the Standards 2000 Elec-tronic Format Group were appointed by spring 1997. Each includedindividuals—teachers, teacher educators, administrators, researchers,and mathematicians—with a wide range of expertise. The WritingGroup was charged to establish standards that—
• build on the foundation of the original Standards documents;• integrate the classroom-related portions of Curriculum and Evalua-
tion Standards for School Mathematics, Professional Standards for Teach-ing Mathematics, and Assessment Standards for School Mathematics;
• are organized into four grade bands: prekindergarten throughgrade 2, grades 3–5, grades 6–8, and grades 9–12.
The Electronic Format Group was charged to—
• think of alternative ways to present and distribute the documentthat would result;
• envision ways in which technology-based materials could be incor-porated in the Standards;
• keep the Standards 2000 Writing Group up-to-date on uses oftechnology;
• assist in the work of the Standards 2000 Writing Group by findingexamples of appropriate uses of technology.
The primary work of the Writing Group was carried out in sessionsduring the summers of 1997, 1998, and 1999. Extensive efforts wereundertaken to ensure that the Writing Group was informed by the bestof research and current practice. The writers had access to collectionsof instructional materials, state and province curriculum documents, re-search publications, policy documents, and international frameworksand curriculum materials.
x Principles and Standards for School Mathematics

Additional input was sought for the Writing Group through a seriesof activities orchestrated by the Commission on the Future of the Stan-dards. In February 1997, invitations were extended by the NCTM pres-ident to all the member societies of the Conference Board of the Math-ematical Sciences to form Association Review Groups (ARGs) thatwould “provide sustained advice and information as it reflects on K–12mathematics from the perspective of your organization.” Over thecourse of the project, fourteen Association Review Groups wereformed, and five sets of questions were formulated and submitted tothese groups for their responses. (A list of the Association ReviewGroups, as well as a complete set of questions and publicly released re-sponses from the ARGs, is available at www.nctm.org/standards/.)
NCTM’s Research Advisory Committee commissioned a set of“white papers” summarizing the current state of education research ineight areas of mathematics teaching and learning to serve as back-ground for the Writing Group. In addition, the Conference on Foun-dations for School Mathematics, held in Atlanta in March 1999 withsupport from the National Science Foundation, provided backgroundto the writers concerning theoretical perspectives about teaching andlearning. The papers written for this conference, along with the “whitepapers,” are being published by NCTM as A Research Companion to theNCTM Standards. Two conferences, supported in part by the Eisen-hower National Clearinghouse, also were held to inform the WritingGroup about technology and advise it on the development of the elec-tronic version of Principles and Standards.
A draft version of the Standards, entitled Principles and Standards forSchool Mathematics: Discussion Draft, was produced in October 1998 andcirculated widely for reaction and discussion. Nearly 30 000 copies ofthe draft were furnished to persons interested in reading it, and manytens of thousands more accessed it from NCTM’s Web site. Presenta-tions and discussion sessions were held at all NCTM regional confer-ences in 1998–99, presentations were held at the conferences of manyother organizations, and articles inviting feedback appeared in NCTMpublications. In addition, 25 people were commissioned to review thedraft from the perspective of their particular areas of interest. In total,reactions were submitted by more than 650 individuals and more than70 groups (ranging from school study groups to graduate seminars tosessions held by NCTM Affiliates). The reactions were coded and en-tered into a qualitative database, resulting in the identification of a se-ries of major issues for consideration. A synthesis of the issues and sam-ple responses, as well as printouts of detailed feedback, was madeavailable to the Writing Group for its work during summer 1999. Argu-ments on all sides of the issues were examined in the feedback. In lightof the feedback, using the writers’ best judgment, the Writing Groupmade careful decisions about the stance that Principles and Standardswould take on each of the issues.
In response to a request from the NCTM Board of Directors andwith funding from the National Science Foundation, the National Re-search Council formed a committee of experts from diverse back-grounds to review the process of gathering and analyzing reactions tothe discussion draft, the plan to respond to the issues raised in the reac-tions, and the work of the Writing Group in carrying out that plan inthe final document. The Writing Group was able to benefit greatly
xiPreface

from the committee’s guidance on responding to the comments andsuggestions from reviewers and the field, and the document was im-proved as a result.
Principles and Standards reflects input and influence from many differ-ent sources. Educational research serves as a basis for many of the pro-posals and claims made throughout this document about what it is pos-sible for students to learn about certain content areas at certain levelsand under certain pedagogical conditions. The content and processesemphasized in Principles and Standards also reflect society’s needs formathematical literacy, past practice in mathematics education, and thevalues and expectations held by teachers, mathematics educators, math-ematicians, and the general public. Finally, much of the content in-cluded here is based on the experiences and observations of the class-room teachers, teacher educators, educational researchers, andmathematicians in the Writing Group and on the input the WritingGroup received throughout the drafting of the document.
Principles and Standards includes a number of classroom examples, in-stances of student work, and episodes that illustrate points made in thetext. If drawn from another published source, the example or episodeincludes a citation to that source. If an episode does not have a citationand is written in the past tense, it is drawn from the experiences of aWriting Group member or a teacher colleague, with an indication of itssource (such as unpublished observation notes) where appropriate.Episodes written in the present tense are hypothetical examples basedon the experiences of the writers and are identified as such.
This document presents a vision of school mathematics—a set ofgoals toward which to strive. Throughout the document, this vision formathematics education is expressed using words like “should, will, can,and must” to convey to readers the kind of mathematics teaching andlearning that NCTM proposes. In no sense is this language meant toconvey an assurance of some predetermined outcome; it is, rather, ameans of describing the vision NCTM has constructed.
Principles and Standards is available in both print and electronic hy-pertext formats. Principles and Standards for School Mathematics (Hyper-text Edition) includes tools to enhance navigation of the document, aswell as a more extensive set of electronic examples (e-examples) to illu-minate and enlarge the ideas in the text. It has also made possible theinclusion of links to resource and background material to enhance themessages of Principles and Standards. The e-examples are keyed to par-ticular passages in the text and are signaled by an icon in the margin.The electronic version is available both on CD-ROM and on theWorld Wide Web at standards.nctm.org.
In the coming years, Principles and Standards for School Mathematics willprovide focus and direction to the work of the Council. A number of ini-tiatives related to Principles and Standards have already begun. The Coun-cil has established a task force to develop a series of materials, both printand electronic, with the working title of Navigations to assist and supportteachers as they work in realizing the Principles and Standards in theirclassrooms, much as the Addenda series did following the release of theCurriculum and Evaluation Standards for School Mathematics. A series of in-stitutes, organized by NCTM’s new Academy for Professional Develop-ment, will give leaders a concentrated introduction to Principles and Stan-dards and explore in depth various Standards or themes in the document.
xii Principles and Standards for School Mathematics

Yet another task force is developing a plan and materials to help theCouncil effectively reach out to education administrators. The StandardsImpact Research Group has been established to consider how the overallprocess of Standards-based education improvement set forth in the docu-ment can be better understood and subsequently refined in order to meetthe goal of improving student learning. The E-Standards Task Force isconsidering ways to expand and improve future electronic versions (bothWeb and CD) of the Principles and Standards, and the Illuminations pro-ject is providing Web-based resources to “illuminate” the messages of thedocument, with funding provided by MCI WorldCom. These activities(and many others that will inevitably emerge in the coming years) buildon the solid foundation of Principles and Standards, ensuring that the Na-tional Council of Teachers of Mathematics will continue to provide lead-ership toward its goal of improving the mathematics education of all stu-dents. For current information on these and other efforts and for otherinformation surrounding about the document, visit www.nctm.org.
xiiiPreface

Blank Page

xv
Letter of Appreciationto the National Council of Teachers of Mathematics
Starting in 1989, the National Council of Teachers ofMathematics (NCTM) has developed and disseminated standardsfor curriculum, teaching, and assessment. These documents haveguided many subsequent efforts to improve mathematics instructionin the U.S. While these first efforts predictably met with mixedinterpretations and reactions, they have stimulated broad public andprofessional interest in the nature and formation of such standards.
As the NCTM has undertaken to update and refine the standards,producing the new Principles and Standards for School Mathematics, itrecognized the necessity to enlist the broad critical participation of thediverse expert communities that bear some responsibility for mathe-matics education. In order to provide for this complex advisory func-tion, the NCTM petitioned each of the professional organizations ofthe Conference Board of the Mathematical Sciences (CBMS) to forman Association Review Group (ARG) that would respond, in stages, toa series of substantial and focused questions framed by the Principlesand Standards writing group in the course of its work.
This formidable undertaking has been, in the view of the partici-pating organizations, dramatically successful, to the profit of bothNCTM and the contributing organizations. It was a remarkable andunprecedented process that produced some of the most thoughtfuland disciplined discussions of mathematics curriculum and instruc-tion that we have seen in these professional communities. It contrast-ed with what was felt by some to be the inadequate participation bymathematics professionals in the formation of the original standards.
Of course, Principles and Standards addresses matters of education-al goals and policies for which there is no simple right answer orformulation, and no clear or stable consensus. It represents the viewsof a team of writers assembled by the national professional organiza-tion of mathematics teachers, views deeply informed by the knowl-edge and dispositions of diverse professional communities. What canbe objectively said is that the process of construction of the Principlesand Standards has been open, rigorous, and well informed by theviews of all professionals concerned with mathematics education,and that this has been achieved, in part, thanks to the innovativedesign of the ARG process. Indeed, the quality of that developmentprocess, including the ARGs, has been independently reviewed, atthe invitation of NCTM itself, in a study by the National ResearchCouncil.
With this letter, representatives of the following member organi-zations of CBMS wish to register their appreciation to the NCTMfor the design, and implementation with integrity, of this process.With this, the NCTM has established a model, heretofore all toorare, of how to stage civil, disciplined and probing discourse amongdiverse professionals on matters of mathematics education.
Conference Board of the Mathematical Sciences
Lynne Billard, ChairThomas R. Banchoff, Chair-ElectRaymond L. Johnson, Secretary-TreasurerSadie C. Bragg, Member-at-Large of
Executive Committee
American Mathematical Association ofTwo-Year Colleges
Susan S. Wood, President
American Mathematical SocietyFelix E. Browder, PresidentHyman Bass, President-Elect and Past
Chair of the Committee on Education
Association of Mathematics TeacherEducators
Susan Gay, President
American Statistical AssociationW. Michael O’Fallon, President
Association for Symbolic LogicC. Ward Henson, Secretary-TreasurerJean A. Larson, Chair, Committee on
Education
Association of State Supervisors ofMathematics
Jacqueline P. Mitchell, President
Association for Women in MathematicsJean E. Taylor, President
Benjamin Banneker AssociationBeatrice Moore-Harris, President
Institute for Operations Research andthe Management Sciences
John R. Birge, President
Institute of Mathematical StatisticsMorris L. Eaton, President
Mathematical Association of AmericaThomas R. Banchoff, PresidentKenneth Ross, Chair of the MAA
Association Review Group
National Association of Mathematicians
John W. Alexander, Jr., President
National Council of Supervisors ofMathematics
Jerry Cummins, President
Society for Industrial and AppliedMathematics
Gilbert Strang, President

Blank Page


Imagine a classroom, a school,
or a school district where all students
have access to high-quality, engaging
mathematics instruction.

Imagine a classroom, a school, or a school district where all students have accessto high-quality, engaging mathematics instruction. There are ambitious ex-pectations for all, with accommodation for those who need it. Knowledgeableteachers have adequate resources to support their work and are continuallygrowing as professionals. The curriculum is mathematically rich, offering stu-dents opportunities to learn important mathematical concepts and procedureswith understanding. Technology is an essential component of the environment.Students confidently engage in complex mathematical tasks chosen carefully byteachers. They draw on knowledge from a wide variety of mathematical topics,sometimes approaching the same problem from different mathematical per-spectives or representing the mathematics in different ways until they findmethods that enable them to make progress. Teachers help students make, refine, and explore conjectures on the basis of evidence and use a variety ofreasoning and proof techniques to confirm or disprove those conjectures. Stu-dents are flexible and resourceful problem solvers. Alone or in groups and withaccess to technology, they work productively and reflectively, with the skilledguidance of their teachers. Orally and in writing, students communicate theirideas and results effectively. They value mathematics and engage actively inlearning it.
The vision for mathematics education described in Principles and Stan-dards for School Mathematics is highly ambitious. Achieving it requires solidmathematics curricula, competent and knowledgeable teachers who can in-tegrate instruction with assessment, education policies that enhance andsupport learning, classrooms with ready access to technology, and a com-mitment to both equity and excellence. The challenge is enormous and
3
A Vision for SchoolMathematics
1Chapter

meeting it is essential. Our students deserve and need the best mathe-matics education possible, one that enables them to fulfill personal am-bitions and career goals in an ever-changing world.
Since the release in 1989 of the Curriculum and Evaluation Standardsfor School Mathematics —followed in 1991 by the Professional TeachingStandards for School Mathematics and in 1995 by the Assessment Standardsfor School Mathematics —the National Council of Teachers of Mathe-matics (NCTM) has remained committed to the view that standardscan play a leading role in guiding the improvement of mathematics ed-ucation. As an organization representing teachers of mathematics,NCTM shares with students, school leaders, and parents and othercaregivers the responsibility to ensure that all students receive a high-quality mathematics education. All interested parties must work to-gether to create mathematics classrooms where students of varied back-grounds and abilities work with expert teachers, learning importantmathematical ideas with understanding, in environments that are equi-table, challenging, supportive, and technologically equipped for thetwenty-first century.
The Need for Mathematics in a Changing WorldWe live in a time of extraordinary and accelerating change. New
knowledge, tools, and ways of doing and communicating mathematicscontinue to emerge and evolve. Calculators, too expensive for commonuse in the early eighties, now are not only commonplace and inexpen-sive but vastly more powerful. Quantitative information available tolimited numbers of people a few years ago is now widely disseminatedthrough popular media outlets.
The need to understand and be able to use mathematics in everydaylife and in the workplace has never been greater and will continue to in-crease. For example:
• Mathematics for life. Knowing mathematics can be personallysatisfying and empowering. The underpinnings of everydaylife are increasingly mathematical and technological. For in-stance, making purchasing decisions, choosing insurance orhealth plans, and voting knowledgeably all call for quantitativesophistication.
• Mathematics as a part of cultural heritage. Mathematics is one ofthe greatest cultural and intellectual achievements of human-kind, and citizens should develop an appreciation and under-standing of that achievement, including its aesthetic and evenrecreational aspects.
• Mathematics for the workplace. Just as the level of mathematicsneeded for intelligent citizenship has increased dramatically, sotoo has the level of mathematical thinking and problem solv-ing needed in the workplace, in professional areas rangingfrom health care to graphic design.
• Mathematics for the scientific and technical community. Althoughall careers require a foundation of mathematical knowledge,some are mathematics intensive. More students must pursuean educational path that will prepare them for lifelong work asmathematicians, statisticians, engineers, and scientists.
The need tounderstand and be able
to use mathematics ineveryday life and in the
workplace has neverbeen greater.
4 Principles and Standards for School Mathematics

There is no conflictbetween equity andexcellence.
In this changing world, those who understand and can do mathe-matics will have significantly enhanced opportunities and options forshaping their futures. Mathematical competence opens doors to pro-ductive futures. A lack of mathematical competence keeps those doorsclosed. NCTM challenges the assumption that mathematics is only forthe select few. On the contrary, everyone needs to understand mathe-matics. All students should have the opportunity and the support neces-sary to learn significant mathematics with depth and understanding.There is no conflict between equity and excellence.
Principles and Standards calls for a common foundation of mathe-matics to be learned by all students. This approach, however, does notimply that all students are alike. Students exhibit different talents, abili-ties, achievements, needs, and interests in mathematics. Nevertheless,all students must have access to the highest-quality mathematics in-structional programs. Students with a deep interest in pursuing mathe-matical and scientific careers must have their talents and interests en-gaged. Likewise, students with special educational needs must have theopportunities and support they require to attain a substantial under-standing of important mathematics. A society in which only a few havethe mathematical knowledge needed to fill crucial economic, political,and scientific roles is not consistent with the values of a just democraticsystem or its economic needs.
The Need for Continued Improvement ofMathematics Education
The vision described at the beginning of this chapter is idealized.Despite the concerted efforts of many classroom teachers, administra-tors, teacher-leaders, curriculum developers, teacher educators, mathe-maticians, and policymakers, the portrayal of mathematics teaching andlearning in Principles and Standards is not the reality in the vast majorityof classrooms, schools, and districts. Evidence from a variety of sourcesmakes it clear that many students are not learning the mathematics theyneed or are expected to learn (Kenney and Silver 1997; Mullis et al.1997, 1998; Beaton et al. 1996). The reasons for this deficiency aremany: In some instances, students have not had the opportunity tolearn important mathematics. In other instances, the curriculum offeredto students does not engage them. Sometimes students lack a commit-ment to learning. The quality of mathematics teaching is highly vari-able. There is no question that the effectiveness of mathematics educa-tion in the United States and Canada can be improved substantially.
Standards can play a central role in the process of improvement. Thepreviously released NCTM Standards (NCTM 1989, 1991, 1995) haveinfluenced state standards and curriculum frameworks (Council of ChiefState School Officers 1995; Raimi and Braden 1998), instructional mate-rials (U.S. Department of Education 1999), teacher education (Mathe-matical Association of America 1991), and classroom practice (Ferrini-Mundy and Schram 1997). As with any educational innovation, however,the ideas of the Standards have been interpreted in many different waysand have been implemented with varying degrees of fidelity. Sometimesthe changes made in the name of standards have been superficial or in-complete. For example, some of the pedagogical ideas from the NCTMStandards—such as the emphases on discourse, worthwhile mathematical
5A Vision for School Mathematics

tasks, or learning through problem solving—have been enacted withoutsufficient attention to students’ understanding of mathematics content.Efforts to move in the directions of the original NCTM Standards are byno means fully developed or firmly in place.
The Role and Purpose of StandardsThe introduction to the 1989 Curriculum and Evaluation Standards
noted three reasons for a professional organization to formally adoptstandards: to ensure quality, to indicate goals, and to promote change.One way in which standards documents help meet these goals is byshaping conversations about mathematics education. As with the previ-ous NCTM Standards, Principles and Standards offers common language,examples, and recommendations to engage many groups of people inproductive dialogue. Although there will never be complete consensuswithin the mathematics education profession or among the generalpublic about the ideas advanced in any standards document, the Stan-dards provide a guide for focused, sustained efforts to improve students’school mathematics education. Principles and Standards supplies guid-ance and vision while leaving specific curriculum decisions to the locallevel. This document is intended to—
• set forth a comprehensive and coherent set of goals for mathe-matics for all students from prekindergarten through grade 12that will orient curricular, teaching, and assessment effortsduring the next decades;
• serve as a resource for teachers, education leaders, and policy-makers to use in examining and improving the quality ofmathematics instructional programs;
• guide the development of curriculum frameworks, assess-ments, and instructional materials;
• stimulate ideas and ongoing conversations at the national,provincial or state, and local levels about how best to help stu-dents gain a deep understanding of important mathematics.
An Overview of Principles and StandardsPrinciples and Standards for School Mathematics builds on and consoli-
dates messages from the previous Standards documents. The documentis organized into four main parts:
• Principles for school mathematics (chapter 2)• An overview of the Standards for mathematics education in
prekindergarten through grade 12 (chapter 3)• Standards for four separate grade bands: prekindergarten
through grade 2 (chapter 4), grades 3–5 (chapter 5), grades6–8 (chapter 6), and grades 9–12 (chapter 7)
• A discussion of the steps needed to move toward the visionembodied in Principles and Standards (chapter 8)
The principles are statements reflecting basic precepts that are funda-mental to a high-quality mathematics education. The discussions inchapter 2 elaborate on the underlying assumptions, values, and evidence
Sometimes the changesmade in the name ofstandards have been
superficial or incomplete.
6 Principles and Standards for School Mathematics

One purpose of thisdocument is to offer away to focus curricula.
on which these Principles are founded. The Principles should beuseful as perspectives on which educators can base decisions that af-fect school mathematics. NCTM’s commitment to mathematics forall is reaffirmed in the Equity Principle. In the Curriculum Principle,a focused curriculum is shown to be an important aspect of what isneeded to improve school mathematics. The Teaching Principle makesthe case that students must have opportunities to learn importantmathematics under the guidance of competent and committed teachers.The view of learning that is the basis for the document is taken up inthe Learning Principle. The important roles of assessment and technol-ogy in school mathematics programs are discussed in the Assessmentand Technology Principles.
Chapters 3–7 outline an ambitious and comprehensive set of curricu-lum standards for all students. Standards are descriptions of whatmathematics instruction should enable students to know and do—statements of what is valued for school mathematics education. Each ofthe ten curriculum standards proposed in this document spans the en-tire range from prekindergarten through grade 12. Chapter 3 discusseseach Standard in turn to convey its main ideas. In addition, these dis-cussions give a sense of how the ideas encompassed in a Standard de-velop over all four grade bands, highlighting points at which certainlevels of mastery or closure are appropriate. Chapters 4–7 present theStandards in detail for each grade band.
The first five Standards describe mathematical content goals in theareas of number and operations, algebra, geometry, measurement, anddata analysis and probability. The next five Standards address theprocesses of problem solving, reasoning and proof, connections, com-munication, and representation. In each grade-band chapter, a set of“expectations” is identified and discussed for each Content Standard.The appendix displays the Content Standards and expectations in achart that highlights the increasing sophistication of ideas across thegrades. Each grade-band chapter discusses what each Process Standardshould “look like” in that grade band and what the teacher’s role is insupporting the development of that process.
The mathematical Content and Process Standards discussed in chap-ters 3–7 are inextricably linked. One cannot solve problems without un-derstanding and using mathematical content. Establishing geometricknowledge calls for reasoning. The concepts of algebra can be exam-ined and communicated through representations.
One purpose of this document is to offer teachers, curriculum de-velopers, and those responsible for establishing curriculum frame-works a way to focus curricula. Focus is promoted through attentionto the idea of “moving on.” School mathematics programs should notaddress every topic every year. Instead, students will reach certain lev-els of conceptual understanding and procedural fluency by certainpoints in the curriculum. Teachers should be able to assume that stu-dents possess these understandings and levels of fluency when theyplan their mathematics instruction. Teachers and policymakers canthen fashion instructional programs and curricular frameworks thatdevelop progressively over the grades and that focus on importantmathematical areas.
Chapter 8 discusses what it will take to move toward the vision de-scribed in the previous chapters. In particular, it discusses critical issues
7A Vision for School Mathematics
related to putting the Principles into action and outlines the key rolesplayed by various groups and communities in realizing the vision of thePrinciples and Standards.
As We Move ForwardAttaining the vision described at the beginning of this chapter will
require the talents, energy, and attention of many individuals, includingstudents, teachers, school administrators, teacher-leaders, policymakers,parents and other caregivers, mathematicians, mathematics educators,and the local community. It will require that the vision of this docu-ment be shared and understood and that all concerned be committed toimproving the futures of our children. The task is enormous and essen-tial. All students need an education in mathematics that will preparethem for a future of great and continual change.
The task is enormousand essential.
8 Principles and Standards for School Mathematics

Blank Page

The Principles describe particular features
of high-quality mathematics education.
The power of these Principles as guides and tools
for decision making derives from their interaction.

Principles forSchool Mathematics
2Chapter
11
Decisions made by teachers, school administrators, and other educationprofessionals about the content and character of school mathematics haveimportant consequences both for students and for society. These decisionsshould be based on sound professional guidance. Principles and Standards forSchool Mathematics is intended to provide such guidance. The Principlesdescribe particular features of high-quality mathematics education. TheStandards describe the mathematical content and processes that studentsshould learn. Together, the Principles and Standards constitute a vision toguide educators as they strive for the continual improvement of mathe-matics education in classrooms, schools, and educational systems.
The six principles for school mathematics address overarching themes:
• Equity. Excellence in mathematics education requires equity—high expectations and strong support for all students.
• Curriculum. A curriculum is more than a collection of activities:it must be coherent, focused on important mathematics, and wellarticulated across the grades.
• Teaching. Effective mathematics teaching requires understanding what students know and need to learn and thenchallenging and supporting them to learn it well.
• Learning. Students must learn mathematics with understanding, actively building new knowledge from experienceand prior knowledge.
• Assessment. Assessment should support the learning of importantmathematics and furnish useful information to both teachers andstudents.
• Technology. Technology is essential in teaching and learningmathematics; it influences the mathematics that is taught and enhances students’ learning.

The vision of equity inmathematics educationchallenges a pervasive
societal belief in NorthAmerica that only some
students are capable oflearning mathematics.
These six Principles, which are discussed in depth below, do not referto specific mathematics content or processes and thus are quite differ-ent from the Standards. They describe crucial issues that, although notunique to school mathematics, are deeply intertwined with schoolmathematics programs. They can influence the development of curricu-lum frameworks, the selection of curriculum materials, the planning ofinstructional units or lessons, the design of assessments, the assignmentof teachers and students to classes, instructional decisions in the class-room, and the establishment of supportive professional developmentprograms for teachers. The perspectives and assumptions underlyingthe Principles are compatible with, and foundational to, the Standardsand expectations presented in chapters 3–7.
Each Principle is discussed separately, but the power of these Princi-ples as guides and tools for decision making derives from their interactionin the thinking of educators. The Principles will come fully alive as theyare used together to develop high-quality school mathematics programs.
The Equity PrincipleExcellence in mathematics education requires equity—highexpectations and strong support for all students.
Making the vision of the Principles and Standards for School Mathe-matics a reality for all students, prekindergarten through grade 12, isboth an essential goal and a significant challenge. Achieving this goalrequires raising expectations for students’ learning, developing effectivemethods of supporting the learning of mathematics by all students, andproviding students and teachers with the resources they need.
Educational equity is a core element of this vision. All students, re-gardless of their personal characteristics, backgrounds, or physical chal-lenges, must have opportunities to study—and support to learn—mathematics. Equity does not mean that every student should receiveidentical instruction; instead, it demands that reasonable and appropri-ate accommodations be made as needed to promote access and attain-ment for all students.
Equity is interwoven with the other Principles. All students need ac-cess each year to a coherent, challenging mathematics curriculum taughtby competent and well-supported mathematics teachers. Moreover, stu-dents’ learning and achievement should be assessed and reported in waysthat point to areas requiring prompt additional attention. Technologycan assist in achieving equity and must be accessible to all students.
Equity requires high expectations and worthwhileopportunities for all.
The vision of equity in mathematics education challenges a pervasivesocietal belief in North America that only some students are capable oflearning mathematics. This belief, in contrast to the equally pervasiveview that all students can and should learn to read and write in English,
12 Principles and Standards for School Mathematics

Mathematics can andmust be learned by allstudents.
Some students may needfurther assistance to meethigh mathematicsexpectations.
leads to low expectations for too many students. Low expectationsare especially problematic because students who live in poverty, stu-dents who are not native speakers of English, students with disabilities,females, and many nonwhite students have traditionally been far morelikely than their counterparts in other demographic groups to be thevictims of low expectations. Expectations must be raised—mathematicscan and must be learned by all students.
The Equity Principle demands that high expectations for mathe-matics learning be communicated in words and deeds to all students.Teachers communicate expectations in their interactions with studentsduring classroom instruction, through their comments on students’ pa-pers, when assigning students to instructional groups, through the pres-ence or absence of consistent support for students who are striving forhigh levels of attainment, and in their contacts with significant adults ina student’s life. These actions, along with decisions and actions takenoutside the classroom to assign students to different classes or curricula,also determine students’ opportunities to learn and influence students’beliefs about their own abilities to succeed in mathematics. Schoolshave an obligation to ensure that all students participate in a strong in-structional program that supports their mathematics learning. High ex-pectations can be achieved in part with instructional programs that areinteresting for students and help them see the importance and utility ofcontinued mathematical study for their own futures.
Equity requires accommodating differences to helpeveryone learn mathematics.
Higher expectations are necessary, but they are not sufficient to ac-complish the goal of an equitable school mathematics education for allstudents. All students should have access to an excellent and equitablemathematics program that provides solid support for their learning andis responsive to their prior knowledge, intellectual strengths, and per-sonal interests.
Some students may need further assistance to meet high mathematicsexpectations. Students who are not native speakers of English, for in-stance, may need special attention to allow them to participate fully inclassroom discussions. Some of these students may also need assessmentaccommodations. If their understanding is assessed only in English,their mathematical proficiency may not be accurately evaluated.
Students with disabilities may need increased time to complete as-signments, or they may benefit from the use of oral rather than writtenassessments. Students who have difficulty in mathematics may need ad-ditional resources, such as after-school programs, peer mentoring, orcross-age tutoring. Likewise, students with special interests or excep-tional talent in mathematics may need enrichment programs or addi-tional resources to challenge and engage them. The talent and interestof these students must be nurtured and supported so that they have theopportunity and guidance to excel. Schools and school systems musttake care to accommodate the special needs of some students withoutinhibiting the learning of others.
Technology can help achieve equity in the classroom. For example,technological tools and environments can give all students opportunities
13Principles for School Mathematics

to explore complex problems and mathematical ideas, can furnish struc-tured tutorials to students needing additional instruction and practice onskills, or can link students in rural communities to instructional opportu-nities or intellectual resources not readily available in their locales.Computers with voice-recognition or voice-creation software can offerteachers and peers access to the mathematical ideas and arguments de-veloped by students with disabilities who would otherwise be unable toshare their thinking. Moreover, technology can be effective in attractingstudents who disengage from nontechnological approaches to mathe-matics. It is important that all students have opportunities to use tech-nology in appropriate ways so that they have access to interesting andimportant mathematical ideas. Access to technology must not becomeyet another dimension of educational inequity.
Equity requires resources and support for allclassrooms and all students.
Well-documented examples demonstrate that all children, includingthose who have been traditionally underserved, can learn mathematicswhen they have access to high-quality instructional programs thatsupport their learning (Campbell 1995; Griffin, Case, and Siegler 1994;Knapp et al. 1995; Silver and Stein 1996). These examples shouldbecome the norm rather than the exception in school mathematicseducation.
Achieving equity requires a significant allocation of human and ma-terial resources in schools and classrooms. Instructional tools, curricu-lum materials, special supplemental programs, and the skillful use ofcommunity resources undoubtedly play important roles. An even moreimportant component is the professional development of teachers.Teachers need help to understand the strengths and needs of studentswho come from diverse linguistic and cultural backgrounds, who havespecific disabilities, or who possess a special talent and interest inmathematics. To accommodate differences among students effectivelyand sensitively, teachers also need to understand and confront their ownbeliefs and biases.
The Curriculum PrincipleA curriculum is more than a collection of activities: it must becoherent, focused on important mathematics, and well articulated across the grades.
A school mathematics curriculum is a strong determinant of whatstudents have an opportunity to learn and what they do learn. In a co-herent curriculum, mathematical ideas are linked to and build on oneanother so that students’ understanding and knowledge deepens andtheir ability to apply mathematics expands. An effective mathematicscurriculum focuses on important mathematics—mathematics that will
Access to technologymust not become yet
another dimension ofeducational inequity.
14 Principles and Standards for School Mathematics

A coherent curriculumeffectively organizes andintegrates importantmathematical ideas.
prepare students for continued study and for solving problems in a vari-ety of school, home, and work settings. A well-articulated curriculumchallenges students to learn increasingly more sophisticated mathemati-cal ideas as they continue their studies.
A mathematics curriculum should be coherent.Mathematics comprises different topical strands, such as algebra and
geometry, but the strands are highly interconnected. The interconnec-tions should be displayed prominently in the curriculum and in instruc-tional materials and lessons. A coherent curriculum effectively orga-nizes and integrates important mathematical ideas so that students cansee how the ideas build on, or connect with, other ideas, thus enablingthem to develop new understandings and skills.
Curricular coherence is also important at the classroom level. Re-searchers have analyzed lessons in the videotape study of eighth-grademathematics classrooms that was part of the Third International Mathe-matics and Science Study (Stigler and Hiebert 1999). One importantcharacteristic of the lessons had to do with the internal coherence of themathematics. The researchers found that typical Japanese lessons weredesigned around one central idea, which was carefully developed and ex-tended; in contrast, typical American lessons included several ideas ortopics that were not closely related and not well developed.
In planning individual lessons, teachers should strive to organize themathematics so that fundamental ideas form an integrated whole. Bigideas encountered in a variety of contexts should be established care-fully, with important elements such as terminology, definitions, nota-tion, concepts, and skills emerging in the process. Sequencing lessonscoherently across units and school years is challenging. And teachersalso need to be able to adjust and take advantage of opportunities tomove lessons in unanticipated directions.
A mathematics curriculum should focus on importantmathematics.
School mathematics curricula should focus on mathematics contentand processes that are worth the time and attention of students. Mathe-matics topics can be considered important for different reasons, such astheir utility in developing other mathematical ideas, in linking differentareas of mathematics, or in deepening students’ appreciation of mathe-matics as a discipline and as a human creation. Ideas may also meritcurricular focus because they are useful in representing and solvingproblems within or outside mathematics.
Foundational ideas like place value, equivalence, proportionality, func-tion, and rate of change should have a prominent place in the mathe-matics curriculum because they enable students to understand othermathematical ideas and connect ideas across different areas of mathe-matics. Mathematical thinking and reasoning skills, including makingconjectures and developing sound deductive arguments, are importantbecause they serve as a basis for developing new insights and promotingfurther study. Many concepts and processes, such as symmetry and gener-alization, can help students gain insights into the nature and beauty ofmathematics. In addition, the curriculum should offer experiences that
15Principles for School Mathematics

allow students to see that mathematics has powerful uses in modeling andpredicting real-world phenomena. The curriculum also should emphasizethe mathematics processes and skills that support the quantitative literacyof students. Members of an intelligent citizenry should be able to judgeclaims, find fallacies, evaluate risks, and weigh evidence (Price 1997).
Although any curriculum document is fixed at a point in time, thecurriculum itself need not be fixed. Different configurations of impor-tant mathematical ideas are possible and to some extent inevitable. Therelative importance of particular mathematics topics is likely to changeover time in response to changing perceptions of their utility and tonew demands and possibilities. For example, mathematics topics such asrecursion, iteration, and the comparison of algorithms are receivingmore attention in school mathematics because of their increasing rele-vance and utility in a technological world.
A mathematics curriculum should be well articulatedacross the grades.
Learning mathematics involves accumulating ideas and building suc-cessively deeper and more refined understanding. A school mathematicscurriculum should provide a road map that helps teachers guide studentsto increasing levels of sophistication and depths of knowledge. Suchguidance requires a well-articulated curriculum so that teachers at eachlevel understand the mathematics that has been studied by students atthe previous level and what is to be the focus at successive levels. For ex-ample, in grades K–2 students typically explore similarities and differ-ences among two-dimensional shapes. In grades 3–5 they can identifycharacteristics of various quadrilaterals. In grades 6–8 they may examineand make generalizations about properties of particular quadrilaterals. Ingrades 9–12 they may develop logical arguments to justify conjecturesabout particular polygons. As they reach higher levels, students shouldengage more deeply with mathematical ideas and their understandingand ability to use the knowledge is expected to grow.
Without a clear articulation of the curriculum across all grades, dupli-cation of effort and unnecessary review are inevitable. A well-articulatedcurriculum gives teachers guidance regarding important ideas or majorthemes, which receive special attention at different points in time. It alsogives guidance about the depth of study warranted at particular timesand when closure is expected for particular skills or concepts.
The Teaching PrincipleEffective mathematics teaching requires understanding whatstudents know and need to learn and then challenging andsupporting them to learn it well.
Students learn mathematics through the experiences that teachersprovide. Thus, students’ understanding of mathematics, their ability to
A well-articulatedcurriculum gives
guidance about whenclosure is expected for
particular skills orconcepts.
16 Principles and Standards for School Mathematics

Teaching mathematicswell is a complexendeavor, and there areno easy recipes.
use it to solve problems, and their confidence in, and disposition to-ward, mathematics are all shaped by the teaching they encounter inschool. The improvement of mathematics education for all students re-quires effective mathematics teaching in all classrooms.
Teaching mathematics well is a complex endeavor, and there are noeasy recipes for helping all students learn or for helping all teachers be-come effective. Nevertheless, much is known about effective mathe-matics teaching, and this knowledge should guide professional judg-ment and activity. To be effective, teachers must know and understanddeeply the mathematics they are teaching and be able to draw on thatknowledge with flexibility in their teaching tasks. They need to under-stand and be committed to their students as learners of mathematicsand as human beings and be skillful in choosing from and using a vari-ety of pedagogical and assessment strategies (National Commission onTeaching and America’s Future 1996). In addition, effective teaching re-quires reflection and continual efforts to seek improvement. Teachersmust have frequent and ample opportunities and resources to enhanceand refresh their knowledge.
Effective teaching requires knowing and understandingmathematics, students as learners, and pedagogicalstrategies.
Teachers need several different kinds of mathematical knowledge—knowledge about the whole domain; deep, flexible knowledge aboutcurriculum goals and about the important ideas that are central to theirgrade level; knowledge about the challenges students are likely to en-counter in learning these ideas; knowledge about how the ideas can berepresented to teach them effectively; and knowledge about how stu-dents’ understanding can be assessed. This knowledge helps teachersmake curricular judgments, respond to students’ questions, and lookahead to where concepts are leading and plan accordingly. Pedagogicalknowledge, much of which is acquired and shaped through the practiceof teaching, helps teachers understand how students learn mathematics,become facile with a range of different teaching techniques and instruc-tional materials, and organize and manage the classroom. Teachers needto understand the big ideas of mathematics and be able to representmathematics as a coherent and connected enterprise (Schifter 1999; Ma1999). Their decisions and their actions in the classroom—all of whichaffect how well their students learn mathematics—should be based onthis knowledge.
This kind of knowledge is beyond what most teachers experience instandard preservice mathematics courses in the United States. For exam-ple, that fractions can be understood as parts of a whole, the quotient oftwo integers, or a number on a line is important for mathematics teach-ers (Ball and Bass forthcoming). Such understanding might be charac-terized as “profound understanding of fundamental mathematics” (Ma1999). Teachers also need to understand the different representations ofan idea, the relative strengths and weaknesses of each, and how they arerelated to one another (Wilson, Shulman, and Richert 1987). They needto know the ideas with which students often have difficulty and ways tohelp bridge common misunderstandings.
17Principles for School Mathematics
The Professional Standards forTeaching Mathematics (NCTM1991) presented six standardsfor the teaching of mathematics.They address—
• worthwhile mathematical tasks; • the teacher’s role in discourse; • the student’s role in discourse; • tools for enhancing discourse; • the learning environment; • the analysis of teaching and
learning.

Effective mathematics teaching requires a serious commitment to thedevelopment of students’ understanding of mathematics. Because stu-dents learn by connecting new ideas to prior knowledge, teachers mustunderstand what their students already know. Effective teachers knowhow to ask questions and plan lessons that reveal students’ prior knowl-edge; they can then design experiences and lessons that respond to, andbuild on, this knowledge.
Teachers have different styles and strategies for helping studentslearn particular mathematical ideas, and there is no one “right way” toteach. However, effective teachers recognize that the decisions theymake shape students’ mathematical dispositions and can create rich set-tings for learning. Selecting and using suitable curricular materials,using appropriate instructional tools and techniques, and engaging inreflective practice and continuous self-improvement are actions goodteachers take every day.
One of the complexities of mathematics teaching is that it must bal-ance purposeful, planned classroom lessons with the ongoing decisionmaking that inevitably occurs as teachers and students encounter unan-ticipated discoveries or difficulties that lead them into uncharted terri-tory. Teaching mathematics well involves creating, enriching, maintain-ing, and adapting instruction to move toward mathematical goals,capture and sustain interest, and engage students in building mathemat-ical understanding.
Effective teaching requires a challenging and supportiveclassroom learning environment.
Teachers make many choices each day about how the learning envi-ronment will be structured and what mathematics will be emphasized.These decisions determine, to a large extent, what students learn. Ef-fective teaching conveys a belief that each student can and is expectedto understand mathematics and that each will be supported in his or herefforts to accomplish this goal.
Teachers establish and nurture an environment conducive to learn-ing mathematics through the decisions they make, the conversationsthey orchestrate, and the physical setting they create. Teachers’ actionsare what encourage students to think, question, solve problems, anddiscuss their ideas, strategies, and solutions. The teacher is responsiblefor creating an intellectual environment where serious mathematicalthinking is the norm. More than just a physical setting with desks, bul-letin boards, and posters, the classroom environment communicatessubtle messages about what is valued in learning and doing mathe-matics. Are students’ discussion and collaboration encouraged? Arestudents expected to justify their thinking? If students are to learn tomake conjectures, experiment with various approaches to solving prob-lems, construct mathematical arguments and respond to others’ argu-ments, then creating an environment that fosters these kinds of activi-ties is essential.
In effective teaching, worthwhile mathematical tasks are used to in-troduce important mathematical ideas and to engage and challenge students intellectually. Well-chosen tasks can pique students’ curiosityand draw them into mathematics. The tasks may be connected to the
There is no one “rightway” to teach.
18 Principles and Standards for School Mathematics

Opportunities to reflecton and refineinstructional practice arecrucial.
real-world experiences of students, or they may arise in contexts thatare purely mathematical. Regardless of the context, worthwhile tasksshould be intriguing, with a level of challenge that invites speculationand hard work. Such tasks often can be approached in more than oneway, such as using an arithmetic counting approach, drawing a geomet-ric diagram and enumerating possibilities, or using algebraic equations,which makes the tasks accessible to students with varied prior knowl-edge and experience.
Worthwhile tasks alone are not sufficient for effective teaching.Teachers must also decide what aspects of a task to highlight, how toorganize and orchestrate the work of the students, what questions toask to challenge those with varied levels of expertise, and how to sup-port students without taking over the process of thinking for them andthus eliminating the challenge.
Effective teaching requires continually seekingimprovement.
Effective teaching involves observing students, listening carefully totheir ideas and explanations, having mathematical goals, and using theinformation to make instructional decisions. Teachers who employsuch practices motivate students to engage in mathematical thinkingand reasoning and provide learning opportunities that challenge stu-dents at all levels of understanding. Effective teaching requires contin-uing efforts to learn and improve. These efforts include learning aboutmathematics and pedagogy, benefiting from interactions with studentsand colleagues, and engaging in ongoing professional development andself-reflection.
Opportunities to reflect on and refine instructional practice—during class and outside class, alone and with others—are crucial inthe vision of school mathematics outlined in Principles and Standards.To improve their mathematics instruction, teachers must be able toanalyze what they and their students are doing and consider howthose actions are affecting students’ learning. Using a variety ofstrategies, teachers should monitor students’ capacity and inclinationto analyze situations, frame and solve problems, and make sense ofmathematical concepts and procedures. They can use this informationto assess their students’ progress and to appraise how well the mathe-matical tasks, student discourse, and classroom environment are inter-acting to foster students’ learning. They then use these appraisals toadapt their instruction.
Reflection and analysis are often individual activities, but they can begreatly enhanced by teaming with an experienced and respected col-league, a new teacher, or a community of teachers. Collaborating withcolleagues regularly to observe, analyze, and discuss teaching and stu-dents’ thinking or to do “lesson study” is a powerful, yet neglected,form of professional development in American schools (Stigler andHiebert 1999). The work and time of teachers must be structured toallow and support professional development that will benefit them andtheir students.
19Principles for School Mathematics

The Learning PrincipleStudents must learn mathematics with understanding, actively building new knowledge from experience and priorknowledge.
The vision of school mathematics in Principles and Standards is basedon students’ learning mathematics with understanding. Unfortunately,learning mathematics without understanding has long been a commonoutcome of school mathematics instruction. In fact, learning withoutunderstanding has been a persistent problem since at least the 1930s,and it has been the subject of much discussion and research by psycholo-gists and educators over the years (e.g., Brownell [1947]; Skemp [1976];Hiebert and Carpenter [1992]). Learning the mathematics outlined inchapters 3–7 requires understanding and being able to apply procedures,concepts, and processes. In the twenty-first century, all students shouldbe expected to understand and be able to apply mathematics.
Learning mathematics with understanding is essential.In recent decades, psychological and educational research on the
learning of complex subjects such as mathematics has solidly establishedthe important role of conceptual understanding in the knowledge andactivity of persons who are proficient. Being proficient in a complex do-main such as mathematics entails the ability to use knowledge flexibly,applying what is learned in one setting appropriately in another. One ofthe most robust findings of research is that conceptual understanding isan important component of proficiency, along with factual knowledgeand procedural facility (Bransford, Brown, and Cocking 1999).
The alliance of factual knowledge, procedural proficiency, and con-ceptual understanding makes all three components usable in powerfulways. Students who memorize facts or procedures without understand-ing often are not sure when or how to use what they know, and suchlearning is often quite fragile (Bransford, Brown, and Cocking 1999).Learning with understanding also makes subsequent learning easier.Mathematics makes more sense and is easier to remember and to applywhen students connect new knowledge to existing knowledge in mean-ingful ways (Schoenfeld 1988). Well-connected, conceptually groundedideas are more readily accessed for use in new situations (Skemp 1976).
The requirements for the workplace and for civic participation in thecontemporary world include flexibility in reasoning about and using quan-titative information. Conceptual understanding is an essential componentof the knowledge needed to deal with novel problems and settings. More-over, as judgments change about the facts or procedures that are essentialin an increasingly technological world, conceptual understanding becomeseven more important. For example, most of the arithmetic and algebraicprocedures long viewed as the heart of the school mathematics curriculumcan now be performed with handheld calculators. Thus, more attentioncan be given to understanding the number concepts and the modelingprocedures used in solving problems. Change is a ubiquitous feature of
Conceptualunderstanding is an
important component ofproficiency.
20 Principles and Standards for School Mathematics

Learning withunderstanding is essentialto enable students to solvethe new kinds of problemsthey will inevitably facein the future.
contemporary life, so learning with understanding is essential to enablestudents to use what they learn to solve the new kinds of problems theywill inevitably face in the future.
A major goal of school mathematics programs is to create auton-omous learners, and learning with understanding supports this goal.Students learn more and learn better when they can take control oftheir learning by defining their goals and monitoring their progress.When challenged with appropriately chosen tasks, students becomeconfident in their ability to tackle difficult problems, eager to figurethings out on their own, flexible in exploring mathematical ideas andtrying alternative solution paths, and willing to persevere. Effectivelearners recognize the importance of reflecting on their thinking andlearning from their mistakes. Students should view the difficulty ofcomplex mathematical investigations as a worthwhile challenge ratherthan as an excuse to give up. Even when a mathematical task is difficult,it can be engaging and rewarding. When students work hard to solve adifficult problem or to understand a complex idea, they experience avery special feeling of accomplishment, which in turn leads to a willing-ness to continue and extend their engagement with mathematics.
Students can learn mathematics with understanding.Students will be served well by school mathematics programs that
enhance their natural desire to understand what they are asked to learn.From a young age, children are interested in mathematical ideas.Through their experiences in everyday life, they gradually develop arather complex set of informal ideas about numbers, patterns, shapes,quantities, data, and size, and many of these ideas are correct and ro-bust. Thus children learn many mathematical ideas quite naturally evenbefore they enter school (Gelman and Gallistel 1978; Resnick 1987). Apattern of building new learning on prior learning and experience is es-tablished early and repeated, albeit often in less obvious ways, through-out the school years (see, e.g., Steffe [1994]). Students of all ages have aconsiderable knowledge base on which to build, including ideas devel-oped in prior school instruction and those acquired through everydayexperience (Bransford, Brown, and Cocking 1999).
The kinds of experiences teachers provide clearly play a major role indetermining the extent and quality of students’ learning. Students’ un-derstanding of mathematical ideas can be built throughout their schoolyears if they actively engage in tasks and experiences designed todeepen and connect their knowledge. Learning with understanding canbe further enhanced by classroom interactions, as students proposemathematical ideas and conjectures, learn to evaluate their own think-ing and that of others, and develop mathematical reasoning skills(Hanna and Yackel forthcoming). Classroom discourse and social inter-action can be used to promote the recognition of connections amongideas and the reorganization of knowledge (Lampert 1986). By havingstudents talk about their informal strategies, teachers can help them be-come aware of, and build on, their implicit informal knowledge (Lam-pert 1989; Mack 1990). Moreover, in such settings, procedural fluencyand conceptual understanding can be developed through problem solv-ing, reasoning, and argumentation.
21Principles for School Mathematics

The Assessment PrincipleAssessment should support the learning of important mathe-matics and furnish useful information to both teachers andstudents.
When assessment is an integral part of mathematics instruction, itcontributes significantly to all students’ mathematics learning. Whenassessment is discussed in connection with standards, the focus is some-times on using tests to certify students’ attainment, but there are otherimportant purposes of assessment. Assessment should be more thanmerely a test at the end of instruction to see how students performunder special conditions; rather, it should be an integral part of instruc-tion that informs and guides teachers as they make instructional deci-sions. Assessment should not merely be done to students; rather, itshould also be done for students, to guide and enhance their learning.
Assessment should enhance students’ learning.The assertion that assessment should enhance students’ learning may
be surprising. After all, if assessment ascertains what students havelearned and are able to do, how can it also have positive consequencesfor learning? Research indicates that making assessment an integral partof classroom practice is associated with improved student learning.Black and Wiliam (1998) reviewed about 250 research studies and con-cluded that the learning of students, including low achievers, is gener-ally enhanced in classrooms where teachers include attention to forma-tive assessment in making judgments about teaching and learning.
Good assessment can enhance students’ learning in several ways.First, the tasks used in an assessment can convey a message to studentsabout what kinds of mathematical knowledge and performance are val-ued. That message can in turn influence the decisions students make—for example, whether or where to apply effort in studying. Thus, it isimportant that assessment tasks be worthy of students’ time and atten-tion. Activities that are consistent with (and sometimes the same as) theactivities used in instruction should be included. When teachers use as-sessment techniques such as observations, conversations and interviewswith students, or interactive journals, students are likely to learnthrough the process of articulating their ideas and answering theteacher’s questions.
Feedback from assessment tasks can also help students in settinggoals, assuming responsibility for their own learning, and becomingmore independent learners. For example, scoring guides, or rubrics, canhelp teachers analyze and describe students’ responses to complex tasksand determine students’ levels of proficiency. They can also help stu-dents understand the characteristics of a complete and correct response.Similarly, classroom discussions in which students present and evaluatedifferent approaches to solving complex problems can hone their senseof the difference between an excellent response and one that ismediocre. Through the use of good tasks and the public discussion of
The Assessment Standards forSchool Mathematics (NCTM1995) presented six standardsabout exemplary mathematicsassessment. They address howassessment should—
• reflect the mathematics thatstudents should know and beable to do;
• enhance mathematics learning; • promote equity; • be an open process; • promote valid inference; • be a coherent process.
22 Principles and Standards for School Mathematics
Assessment should notmerely be done to
students; rather, itshould also be done for
students.

Assessment should becomea routine part of theongoing classroomactivity rather than aninterruption.
criteria for good responses, teachers can cultivate in their students boththe disposition and the capacity to engage in self-assessment and reflec-tion on their own work and on ideas put forth by others. Such a focuson self-assessment and peer assessment has been found to have a posi-tive impact on students’ learning (Wilson and Kenney forthcoming).
Assessment is a valuable tool for making instructionaldecisions.
To ensure deep, high-quality learning for all students, assessment andinstruction must be integrated so that assessment becomes a routinepart of the ongoing classroom activity rather than an interruption. Suchassessment also provides the information teachers need to make appro-priate instructional decisions. In addition to formal assessments, such astests and quizzes, teachers should be continually gathering informationabout their students’ progress through informal means, such as askingquestions during the course of a lesson, conducting interviews with in-dividual students, and giving writing prompts.
When teachers have useful information about what students arelearning, they can support their students’ progress toward significantmathematical goals. The instructional decisions made by teachers—such as how and when to review prerequisite material, how to revisit adifficult concept, or how to adapt tasks for students who are strugglingor for those who need enrichment—are based on inferences about whatstudents know and what they need to learn. Assessment is a primarysource of the evidence on which these inferences are based, and the de-cisions that teachers make will be only as good as that evidence.
Assessment should reflect the mathematics that all students needto know and be able to do, and it should focus on students’ under-standing as well as their procedural skills. Teachers need to have aclear sense of what is to be taught and learned, and assessmentshould be aligned with their instructional goals. By providing infor-mation about students’ individual and collective progress toward thegoals, assessment can help ensure that everyone moves productivelyin the right direction.
To make effective decisions, teachers should look for convergence ofevidence from different sources. Formal assessments provide only oneviewpoint on what students can do in a very particular situation—oftenworking individually on paper-and-pencil tasks, with limited time tocomplete the tasks. Overreliance on such assessments may give an in-complete and perhaps distorted picture of students’ performance. Be-cause different students show what they know and can do in differentways, assessments should allow for multiple approaches, thus giving awell-rounded picture and allowing each student to show his or her beststrengths.
Many assessment techniques can be used by mathematics teachers,including open-ended questions, constructed-response tasks, selected-response items, performance tasks, observations, conversations, jour-nals, and portfolios. These methods can all be appropriate for class-room assessment, but some may apply more readily to particular goals.For example, quizzes using simple constructed-response or selected-response items may indicate whether students can apply procedures.
23Principles for School Mathematics

Constructed-response or performance tasks may better illuminate stu-dents’ capacity to apply mathematics in complex or new situations. Ob-servations and conversations in the classroom can provide insights intostudents’ thinking, and teachers can monitor changes in students’thinking and reasoning over time with reflective journals and portfolios.
When teachers are selecting assessment methods, the age, experi-ence, and special needs of students should be considered. Teachers mustensure that all students have an opportunity to demonstrate clearly andcompletely what they know and can do. For example, teachers shoulduse English-enhancing and bilingual techniques to support studentswho are learning English.
When done well, assessment that helps teachers make decisions aboutthe content or form of instruction (often called formative assessment)can also be used to judge students’ attainment (summative assessment).The same sources of evidence can be assembled to build a picture of in-dividual students’ progress toward the goals of instruction. To maximizethe instructional value of assessment, teachers need to move beyond asuperficial “right or wrong” analysis of tasks to a focus on how studentsare thinking about the tasks. Efforts should be made to identify valuablestudent insights on which further progress can be based rather than toconcentrate solely on errors or misconceptions. Although less straight-forward than averaging scores on quizzes, assembling evidence from avariety of sources is more likely to yield an accurate picture of what eachstudent knows and is able to do.
Whether the focus is on formative assessment aimed at guiding in-struction or on summative assessment of students’ progress, teachers’knowledge is paramount in collecting useful information and drawingvalid inferences. Teachers must understand their mathematical goalsdeeply, they must understand how their students may be thinking aboutmathematics, they must have a good grasp of possible means of assess-ing students’ knowledge, and they must be skilled in interpreting assess-ment information from multiple sources. For teachers to attain the nec-essary knowledge, assessment must become a major focus in teacherpreparation and professional development.
The Technology PrincipleTechnology is essential in teaching and learning mathematics;it influences the mathematics that is taught and enhances students’ learning.
Electronic technologies—calculators and computers—are essentialtools for teaching, learning, and doing mathematics. They furnish vi-sual images of mathematical ideas, they facilitate organizing and analyz-ing data, and they compute efficiently and accurately. They can supportinvestigation by students in every area of mathematics, including geom-etry, statistics, algebra, measurement, and number. When technologicaltools are available, students can focus on decision making, reflection,reasoning, and problem solving.
Assembling evidencefrom a variety of sourcesis more likely to yield an
accurate picture.
24 Principles and Standards for School Mathematics

Technology should not beused as a replacement forbasic understandings andintuitions.
The possibilities forengaging students withphysical challenges inmathematics aredramatically increasedwith special technologies.
Students can learn more mathematics more deeply with the appro-priate use of technology (Dunham and Dick 1994; Sheets 1993; Boers-van Oosterum 1990; Rojano 1996; Groves 1994). Technology shouldnot be used as a replacement for basic understandings and intuitions;rather, it can and should be used to foster those understandings and in-tuitions. In mathematics-instruction programs, technology should beused widely and responsibly, with the goal of enriching students’ learn-ing of mathematics.
The existence, versatility, and power of technology make it possibleand necessary to reexamine what mathematics students should learn aswell as how they can best learn it. In the mathematics classrooms envi-sioned in Principles and Standards, every student has access to technol-ogy to facilitate his or her mathematics learning under the guidance ofa skillful teacher.
Technology enhances mathematics learning.Technology can help students learn mathematics. For example, with
calculators and computers students can examine more examples or rep-resentational forms than are feasible by hand, so they can make and ex-plore conjectures easily. The graphic power of technological tools af-fords access to visual models that are powerful but that many studentsare unable or unwilling to generate independently. The computationalcapacity of technological tools extends the range of problems accessi-ble to students and also enables them to execute routine proceduresquickly and accurately, thus allowing more time for conceptualizingand modeling.
Students’ engagement with, and ownership of, abstract mathemati-cal ideas can be fostered through technology. Technology enriches therange and quality of investigations by providing a means of viewingmathematical ideas from multiple perspectives. Students’ learning isassisted by feedback, which technology can supply: drag a node in aDynamic Geometry environment, and the shape on the screenchanges; change the defining rules for a spreadsheet, and watch as de-pendent values are modified. Technology also provides a focus as stu-dents discuss with one another and with their teacher the objects onthe screen and the effects of the various dynamic transformations thattechnology allows.
Technology offers teachers options for adapting instruction to specialstudent needs. Students who are easily distracted may focus more in-tently on computer tasks, and those who have organizational difficultiesmay benefit from the constraints imposed by a computer environment.Students who have trouble with basic procedures can develop anddemonstrate other mathematical understandings, which in turn caneventually help them learn the procedures. The possibilities for engag-ing students with physical challenges in mathematics are dramaticallyincreased with special technologies.
Technology supports effective mathematics teaching.The effective use of technology in the mathematics classroom de-
pends on the teacher. Technology is not a panacea. As with any teachingtool, it can be used well or poorly. Teachers should use technology to
25Principles for School Mathematics

enhance their students’ learning opportunities by selecting or creatingmathematical tasks that take advantage of what technology can do effi-ciently and well—graphing, visualizing, and computing. For example,teachers can use simulations to give students experience with problemsituations that are difficult to create without technology, or they can usedata and resources from the Internet and the World Wide Web to de-sign student tasks. Spreadsheets, dynamic geometry software, and com-puter microworlds are also useful tools for posing worthwhile problems.
Technology does not replace the mathematics teacher. When stu-dents are using technological tools, they often spend time working inways that appear somewhat independent of the teacher, but this im-pression is misleading. The teacher plays several important roles in atechnology-rich classroom, making decisions that affect students’learning in important ways. Initially, the teacher must decide if, when,and how technology will be used. As students use calculators or com-puters in the classroom, the teacher has an opportunity to observe thestudents and to focus on their thinking. As students work with tech-nology, they may show ways of thinking about mathematics that areotherwise often difficult to observe. Thus, technology aids in assess-ment, allowing teachers to examine the processes used by students intheir mathematical investigations as well as the results, thus enrichingthe information available for teachers to use in making instructionaldecisions.
Technology influences what mathematics is taught.Technology not only influences how mathematics is taught and
learned but also affects what is taught and when a topic appears in thecurriculum. With technology at hand, young children can explore andsolve problems involving large numbers, or they can investigate charac-teristics of shapes using dynamic geometry software. Elementary schoolstudents can organize and analyze large sets of data. Middle-grades stu-dents can study linear relationships and the ideas of slope and uniformchange with computer representations and by performing physical ex-periments with calculator-based-laboratory systems. High school stu-dents can use simulations to study sample distributions, and they canwork with computer algebra systems that efficiently perform most ofthe symbolic manipulation that was the focus of traditional high schoolmathematics programs. The study of algebra need not be limited tosimple situations in which symbolic manipulation is relatively straight-forward. Using technological tools, students can reason about more-general issues, such as parameter changes, and they can model and solvecomplex problems that were heretofore inaccessible to them. Technol-ogy also blurs some of the artificial separations among topics in algebra,geometry, and data analysis by allowing students to use ideas from onearea of mathematics to better understand another area of mathematics.
Technology can help teachers connect the development of skills andprocedures to the more general development of mathematical under-standing. As some skills that were once considered essential are ren-dered less necessary by technological tools, students can be asked towork at higher levels of generalization or abstraction. Work with vir-tual manipulatives (computer simulations of physical manipulatives) orwith Logo can allow young children to extend physical experience and
Many ideas in the Technologyprinciple are illustrated in the
electronic examples inthe hypertext edition; see themargin icons in chapters 4–7referring to the CD-ROM that
accompanies this book.
26 Principles and Standards for School Mathematics

to develop an initial understanding of sophisticated ideas like the useof algorithms. Dynamic geometry software can allow experimentationwith families of geometric objects, with an explicit focus on geometrictransformations. Similarly, graphing utilities facilitate the explorationof characteristics of classes of functions. Because of technology, manytopics in discrete mathematics take on new importance in the contem-porary mathematics classroom; the boundaries of the mathematicallandscape are being transformed.
27Principles for School Mathematics

Standards are descriptions of what
mathematics instruction should enable
students to know and do.
Ambitious standards are required to achieve
a society that has the capability to think and
reason mathematically.

29
Standards forSchool MathematicsPrekindergartenthrough Grade 12
3Chapter
What mathematical content and processes should students know and beable to use as they progress through school? Principles and Standards forSchool Mathematics presents NCTM’s proposal for what should be valued inschool mathematics education. Ambitious standards are required to achievea society that has the capability to think and reason mathematically and auseful base of mathematical knowledge and skills.
The ten Standards presented in this chapter describe a connected bodyof mathematical understandings and competencies—a comprehensivefoundation recommended for all students, rather than a menu from whichto make curricular choices. Standards are descriptions of what mathematicsinstruction should enable students to know and do. They specify the un-derstanding, knowledge, and skills that students should acquire fromprekindergarten through grade 12. The Content Standards—Number andOperations, Algebra, Geometry, Measurement, and Data Analysis andProbability—explicitly describe the content that students should learn.The Process Standards—Problem Solving, Reasoning and Proof, Commu-nication, Connections, and Representation—highlight ways of acquiringand using content knowledge.

Growth across the Grades: Aiming for Focus andCoherence
Each of these ten Standards applies across all grades, prekindergartenthrough grade 12. The set of Standards, which are discussed in detail inchapters 4 through 7, proposes the mathematics that all students shouldhave the opportunity to learn. Each Standard comprises a small numberof goals that apply across all grades—a commonality that promotes afocus on the growth in students’ knowledge and sophistication as theyprogress through the curriculum. For each of the Content Standards,chapters 4 through 7 offer an additional set of expectations specific toeach grade band.
The Table of Standards and expectations in the appendix highlightsthe growth of expectations across the grades. It is not expected thatevery topic will be addressed each year. Rather, students will reach acertain depth of understanding of the concepts and acquire certain lev-els of fluency with the procedures by prescribed points in the curricu-lum, so further instruction can assume and build on this understandingand fluency.
Even though each of these ten Standards applies to all grades, em-phases will vary both within and between the grade bands. For instance,the emphasis on number is greatest in prekindergarten through grade 2,and by grades 9–12, number receives less instructional attention. Andthe total time for mathematical instruction will be divided differentlyaccording to particular needs in each grade band—for example, in themiddle grades, the majority of instructional time would address algebraand geometry. Figure 3.1 shows roughly how the Content Standardsmight receive different emphases across the grade bands.
This set of ten Standards does not neatly separate the school mathe-matics curriculum into nonintersecting subsets. Because mathematics asa discipline is highly interconnected, the areas described by the Stan-dards overlap and are integrated. Processes can be learned within theContent Standards, and content can be learned within the Process
30 Principles and Standards for School Mathematics
Fig. 3.1.
The Content Standards should receive different emphases across the
grade bands.
Pre-K–2 3–5 6–8 9–12
Algebra
Number
Geometry
Measurement
Data Analysisand Probability

The areas described bythe Standards overlapand are integrated.
Standards. Rich connections and intersections abound. Number, for ex-ample, pervades all areas of mathematics. Some topics in data analysiscould be characterized as part of measurement. Patterns and functionsappear throughout geometry. The processes of reasoning, proving,problem solving, and representing are used in all content areas.
The arrangement of the curriculum into these Standards is proposedas one coherent organization of significant mathematical content andprocesses. Those who design curriculum frameworks, assessments, in-structional materials, and classroom instruction based on Principles andStandards will need to make their own decisions about emphasis andorder; other labels and arrangements are certainly possible.
Where Is Discrete Mathematics?The 1989 Curriculum and Evaluation Standards for School Mathematics
introduced a Discrete Mathematics Standard in grades 9–12. In Princi-ples and Standards, the main topics of discrete mathematics are included,but they are distributed across the Standards, instead of receiving sepa-rate treatment, and they span the years from prekindergarten throughgrade 12. As an active branch of contemporary mathematics that iswidely used in business and industry, discrete mathematics should be anintegral part of the school mathematics curriculum, and these topicsnaturally occur throughout the other strands of mathematics.
Three important areas of discrete mathematics are integratedwithin these Standards: combinatorics, iteration and recursion, andvertex-edge graphs. These ideas can be systematically developed fromprekindergarten through grade 12. In addition, matrices should be ad-dressed in grades 9–12. Combinatorics is the mathematics of system-atic counting. Iteration and recursion are used to model sequential,step-by-step change. Vertex-edge graphs are used to model and solveproblems involving paths, networks, and relationships among a finitenumber of objects.
31Standards for School Mathematics

Number and OperationsThe Number and Operations Standard describes deep and funda-
mental understanding of, and proficiency with, counting, numbers, andarithmetic, as well as an understanding of number systems and theirstructures. The concepts and algorithms of elementary arithmetic arepart of number and operations, as are the properties and characteristicsof the classes of numbers that form the beginnings of number theory.Central to this Standard is the development of number sense—the abil-ity to decompose numbers naturally, use particular numbers like 100 or1/2 as referents, use the relationships among arithmetic operations tosolve problems, understand the base-ten number system, estimate,make sense of numbers, and recognize the relative and absolute magni-tude of numbers (Sowder 1992).
Historically, number has been a cornerstone of the entire mathe-matics curriculum internationally as well as in the United States andCanada (Reys and Nohda 1994). All the mathematics proposed forprekindergarten through grade 12 is strongly grounded in number. Theprinciples that govern equation solving in algebra are the same as thestructural properties of systems of numbers. In geometry and measure-ment, attributes are described with numbers. The entire area of dataanalysis involves making sense of numbers. Through problem solving,students can explore and solidify their understandings of number.Young children’s earliest mathematical reasoning is likely to be aboutnumber situations, and their first mathematical representations willprobably be of numbers. Research has shown that learning about num-ber and operations is a complex process for children (e.g., Fuson [1992]).
In these Standards, understanding number and operations, developingnumber sense, and gaining fluency in arithmetic computation form thecore of mathematics education for the elementary grades. As theyprogress from prekindergarten through grade 12, students should attain arich understanding of numbers—what they are; how they are representedwith objects, numerals, or on number lines; how they are related to oneanother; how numbers are embedded in systems that have structures andproperties; and how to use numbers and operations to solve problems.
Knowing basic number combinations—the single-digit additionand multiplication pairs and their counterparts for subtraction anddivision—is essential. Equally essential is computational fluency—having and using efficient and accurate methods for computing. Flu-ency might be manifested in using a combination of mental strategiesand jottings on paper or using an algorithm with paper and pencil,particularly when the numbers are large, to produce accurate resultsquickly. Regardless of the particular method used, students should beable to explain their method, understand that many methods exist,and see the usefulness of methods that are efficient, accurate, andgeneral. Students also need to be able to estimate and judge the rea-sonableness of results. Computational fluency should develop in tan-dem with understanding of the role and meaning of arithmetic oper-ations in number systems (Hiebert et.al., 1997; Thornton 1990).
Calculators should be available at appropriate times as computationaltools, particularly when many or cumbersome computations are neededto solve problems. However, when teachers are working with students
Number andOperations Standard
Instructional programsfrom prekindergarten throughgrade 12 should enable allstudents to—
• understand numbers, waysof representing numbers,relationships among num-bers, and number systems;
• understand meanings of op-erations and how they relateto one another;
• compute fluently and makereasonable estimates.
32 Principles and Standards for School Mathematics
Rep
rese
ntat
ion
| C
onne
ctio
ns |
Com
mun
icat
ion
| R
easo
ning
& P
roof
| P
robl
em S
olvi
ng |
Dat
a A
naly
sis
& P
roba
bilit
y |
Mea
sure
men
t |
Geo
met
ry |
Alg
ebra
| N
umbe
r &
Ope
ratio
ns
Historically, numberhas been a cornerstone of
the mathematicscurriculum.

Representing numberswith various physicalmaterials should be amajor part ofmathematics instructionin the elementarygrades.
on developing computational algorithms, the calculator should be setaside to allow this focus. Today, the calculator is a commonly used com-putational tool outside the classroom, and the environment inside theclassroom should reflect this reality.
Understand numbers, ways of representing numbers,relationships among numbers, and number systems
Understanding of number develops in prekindergarten throughgrade 2 as children count and learn to recognize “how many” in sets ofobjects. A key idea is that a number can be decomposed and thoughtabout in many ways. For instance, 24 is 2 tens and 4 ones and also 2 setsof twelve. Making a transition from viewing “ten” as simply the accu-mulation of 10 ones to seeing it both as 10 ones and as 1 ten is an im-portant first step for students toward understanding the structure of thebase-ten number system (Cobb and Wheatley 1988). Throughout theelementary grades, students can learn about classes of numbers andtheir characteristics, such as which numbers are odd, even, prime, com-posite, or square.
Beyond understanding whole numbers, young children can be en-couraged to understand and represent commonly used fractions in con-text, such as 1/2 of a cookie or 1/8 of a pizza, and to see fractions as partof a unit whole or of a collection. Teachers should help students de-velop an understanding of fractions as division of numbers. And in themiddle grades, in part as a basis for their work with proportionality, stu-dents need to solidify their understanding of fractions as numbers. Stu-dents’ knowledge about, and use of, decimals in the base-ten systemshould be very secure before high school. With a solid understanding ofnumber, high school students can use variables that represent numbersto do meaningful symbolic manipulation.
Representing numbers with various physical materials should be amajor part of mathematics instruction in the elementary school grades.By the middle grades, students should understand that numbers can berepresented in various ways, so that they see that 1/4, 25%, and 0.25 areall different names for the same number. Students’ understanding andability to reason will grow as they represent fractions and decimals withphysical materials and on number lines and as they learn to generateequivalent representations of fractions and decimals.
As students gain understanding of numbers and how to representthem, they have a foundation for understanding relationships amongnumbers. In grades 3 through 5, students can learn to compare fractionsto familiar benchmarks such as 1/2. And, as their number sense devel-ops, students should be able to reason about numbers by, for instance,explaining that 1/2 + 3/8 must be less than 1 because each addend is lessthan or equal to 1/2. In grades 6–8, it is important for students to beable to move flexibly among equivalent fractions, decimals, and percentsand to order and compare rational numbers using a range of strategies.By extending from whole numbers to integers, middle-grades students’intuitions about order and magnitude will be more reliable, and theyhave a glimpse into the way that systems of numbers work. High schoolstudents can use variables and functions to represent relationshipsamong sets of numbers, and to look at properties of classes of numbers.
33Standards for School Mathematics
Num
ber & O
perations | Algebra | G
eometry | M
easurement | D
ata Analysis &
Probability | P
roblem S
olving | Reasoning &
Proof | C
omm
unication | Connections | R
epresentation
Although other curricular areas are emphasized more than numberin grades 9–12, in these grades students should see number systemsfrom a more global perspective. They should learn about differencesamong number systems and about what properties are preserved andlost in moving from one system to another.
Understand meanings of operations and how theyrelate to one another
During the primary grades, students should encounter a variety ofmeanings for addition and subtraction of whole numbers. Researchersand teachers have learned about how children understand operationsthrough their approaches to simple arithmetic problems like this:
Bob got 2 cookies. Now he has 5 cookies. How many cookies did Bob havein the beginning?
To solve this problem, young children might use addition and counton from 2, keeping track with their fingers, to get to 5. Or they mightrecognize this problem as a subtraction situation and use the fact that 5 – 2 = 3. Exploring thinking strategies like these or realizing that 7 + 8is the same as 7 + 7 + 1 will help students see the meaning of the opera-tions. Such explorations also help teachers learn what students arethinking. Multiplication and division can begin to have meaning forstudents in prekindergarten through grade 2 as they solve problemsthat arise in their environment, such as how to share a bag of raisinsfairly among four people.
In grades 3–5, helping students develop meaning for whole-numbermultiplication and division should become a central focus. By creatingand working with representations (such as diagrams or concrete objects)of multiplication and division situations, students can gain a sense ofthe relationships among the operations. Students should be able to de-cide whether to add, subtract, multiply, or divide for a particular prob-lem. To do so, they must recognize that the same operation can be ap-plied in problem situations that on the surface seem quite differentfrom one another, know how operations relate to one another, and havean idea about what kind of result to expect.
In grades 6–8, operations with rational numbers should be empha-sized. Students’ intuitions about operations should be adapted as theywork with an expanded system of numbers (Graeber and Campbell1993). For example, multiplying a whole number by a fraction between0 and 1 (e.g., 8 × 1/2) produces a result less than the whole number.This is counter to students’ prior experience (with whole numbers) thatmultiplication always results in a greater number.
Working with proportions is a major focus proposed in these Stan-dards for the middle grades. Students should become proficient in cre-ating ratios to make comparisons in situations that involve pairs ofnumbers, as in the following problem:
If three packages of cocoa make fifteen cups of hot chocolate, how manypackages are needed to make sixty cups?
Students at this level also need to learn operations with integers. Ingrades 9–12, as students learn how to combine vectors and matricesarithmetically, they will experience other kinds of systems involvingnumbers in which new properties and patterns emerge.
The same operationcan be applied in
problem situations thatseem quite different
from one another.
34 Principles and Standards for School Mathematics
Rep
rese
ntat
ion
| C
onne
ctio
ns |
Com
mun
icat
ion
| R
easo
ning
& P
roof
| P
robl
em S
olvi
ng |
Dat
a A
naly
sis
& P
roba
bilit
y |
Mea
sure
men
t |
Geo
met
ry |
Alg
ebra
| N
umbe
r &
Ope
ratio
ns

Developing fluencyrequires a balance andconnection betweenconceptualunderstanding andcomputationalproficiency.
Part of being able tocompute fluently meansmaking smart choicesabout which tools to useand when.
Compute fluently and make reasonable estimatesDeveloping fluency requires a balance and connection between con-
ceptual understanding and computational proficiency. On the one hand,computational methods that are over-practiced without understandingare often forgotten or remembered incorrectly (Hiebert 1999; Kamii,Lewis, and Livingston, 1993; Hiebert and Lindquist 1990). On theother hand, understanding without fluency can inhibit the problem-solving process (Thornton 1990). As children in prekindergartenthrough grade 2 develop an understanding of whole numbers and theoperations of addition and subtraction, instructional attention shouldfocus on strategies for computing with whole numbers so that studentsdevelop flexibility and computational fluency. Students will generate arange of interesting and useful strategies for solving computationalproblems, which should be shared and discussed. By the end of grade 2,students should know the basic addition and subtraction combinations,should be fluent in adding two-digit numbers, and should have methodsfor subtracting two-digit numbers. At the grades 3–5 level, as studentsdevelop the basic number combinations for multiplication and division,they should also develop reliable algorithms to solve arithmetic prob-lems efficiently and accurately. These methods should be applied tolarger numbers and practiced for fluency.
Researchers and experienced teachers alike have found that whenchildren in the elementary grades are encouraged to develop, record,explain, and critique one another’s strategies for solving computationalproblems, a number of important kinds of learning can occur (see, e.g.,Hiebert [1999]; Kamii, Lewis, and Livingston [1993]; Hiebert et al.[1997]). The efficiency of various strategies can be discussed. So cantheir generalizability: Will this work for any numbers or only the twoinvolved here? And experience suggests that in classes focused on thedevelopment and discussion of strategies, various “standard” algorithmseither arise naturally or can be introduced by the teacher as appropri-ate. The point is that students must become fluent in arithmetic com-putation—they must have efficient and accurate methods that are sup-ported by an understanding of numbers and operations. “Standard”algorithms for arithmetic computation are one means of achieving thisfluency.
The development of rational-number concepts is a major goal forgrades 3–5, which should lead to informal methods for calculating withfractions. For example, a problem such as 1/4 + 1/2 should be solvedmentally with ease because students can picture 1/2 and 1/4 or can usedecomposition strategies, such as 1/4 + 1/2 = 1/4 + (1/4 + 1/4). In thesegrades, methods for computing with decimals should be developed andapplied, and by grades 6–8, students should become fluent in computingwith rational numbers in fraction and decimal form. When asked to esti-mate 12/13 + 7/8, only 24 percent of thirteen-year-old students in a na-tional assessment said the answer was close to 2 (Carpenter et al. 1981).Most said it was close to 1, 19, or 21, all of which reflect common com-putational errors in adding fractions and suggest a lack of understandingof the operation being carried out. If students understand addition offractions and have developed number sense, these errors should notoccur. As they develop an understanding of the meaning and representa-tion of integers, they should also develop methods for computing with
35Standards for School Mathematics
Num
ber & O
perations | Algebra | G
eometry | M
easurement | D
ata Analysis &
Probability | P
roblem S
olving | Reasoning &
Proof | C
omm
unication | Connections | R
epresentation

integers. In grades 9–12, students should compute fluently with realnumbers and have some basic proficiency with vectors and matrices insolving problems, using technology as appropriate.
Part of being able to compute fluently means making smart choicesabout which tools to use and when. Students should have experiencesthat help them learn to choose among mental computation, paper-and-pencil strategies, estimation, and calculator use. The particular context,the question, and the numbers involved all play roles in those choices.Do the numbers allow a mental strategy? Does the context call for anestimate? Does the problem require repeated and tedious computa-tions? Students should evaluate problem situations to determinewhether an estimate or an exact answer is needed, using their numbersense to advantage, and be able to give a rationale for their decision.
36 Principles and Standards for School Mathematics
Rep
rese
ntat
ion
| C
onne
ctio
ns |
Com
mun
icat
ion
| R
easo
ning
& P
roof
| P
robl
em S
olvi
ng |
Dat
a A
naly
sis
& P
roba
bilit
y |
Mea
sure
men
t |
Geo
met
ry |
Alg
ebra
| N
umbe
r &
Ope
ratio
ns

AlgebraAlgebra has its historical roots in the study of general methods for
solving equations. The Algebra Standard emphasizes relationshipsamong quantities, including functions, ways of representing mathemati-cal relationships, and the analysis of change. Functional relationshipscan be expressed by using symbolic notation, which allows complexmathematical ideas to be expressed succinctly and change to be ana-lyzed efficiently. Today, the methods and ideas of algebra support math-ematical work in many areas. For example, distribution and communi-cation networks, laws of physics, population models, and statisticalresults can all be represented in the symbolic language of algebra. Inaddition, algebra is about abstract structures and about using the princi-ples of those structures in solving problems expressed with symbols.
Much of the symbolic and structural emphasis in algebra can buildon students’ extensive experiences with number. Algebra is also closelylinked to geometry and to data analysis. The ideas included in the Alge-bra Standard constitute a major component of the school mathematicscurriculum and help to unify it. Algebraic competence is important inadult life, both on the job and as preparation for postsecondary educa-tion. All students should learn algebra.
By viewing algebra as a strand in the curriculum from prekinder-garten on, teachers can help students build a solid foundation of under-standing and experience as a preparation for more-sophisticated workin algebra in the middle grades and high school. For example, system-atic experience with patterns can build up to an understanding of theidea of function (Erick Smith forthcoming), and experience with num-bers and their properties lays a foundation for later work with symbolsand algebraic expressions. By learning that situations often can be de-scribed using mathematics, students can begin to form elementary no-tions of mathematical modeling.
Many adults equate school algebra with symbol manipulation—solving complicated equations and simplifying algebraic expressions.Indeed, the algebraic symbols and the procedures for working withthem are a towering, historic mathematical accomplishment and arecritical in mathematical work. But algebra is more than moving symbolsaround. Students need to understand the concepts of algebra, the struc-tures and principles that govern the manipulation of the symbols, andhow the symbols themselves can be used for recording ideas and gain-ing insights into situations. Computer technologies today can producegraphs of functions, perform operations on symbols, and instanta-neously do calculations on columns of data. Students now need to learnhow to interpret technological representations and how to use the tech-nology effectively and wisely.
Often, algebra has not been treated explicitly in the school curricu-lum until the traditional algebra course offered in middle school orhigh school. By promoting algebra as a strand that is begun in theearly grades, Principles and Standards supports other possibilities forconfiguring programs in the middle grades and secondary schools. TheStandards for grades 6–8 include a significant emphasis on algebra,along with much more geometry than has normally been offered in themiddle grades, and call for the integration of these two areas. The
37Standards for School Mathematics
Num
ber & O
perations | Algebra | G
eometry | M
easurement | D
ata Analysis &
Probability | P
roblem S
olving | Reasoning &
Proof | C
omm
unication | Connections | R
epresentation
All students should learnalgebra.
Algebra StandardInstructional programs
from prekindergarten throughgrade 12 should enable all students to—
• understand patterns, rela-tions, and functions;
• represent and analyzemathematical situations andstructures using algebraicsymbols;
• use mathematical models torepresent and understandquantitative relationships;
• analyze change in variouscontexts.

Standards for grades 9–12, assuming that this strong foundation in al-gebra will be in place by the end of the eighth grade, describe an ambi-tious program in algebra, geometry, and data analysis and statistics andalso call for integration and connections among ideas.
Understand patterns, relations, and functionsEarly experiences with classifying and ordering objects are natural
and interesting for young children. Teachers might help children noticethat red-blue-blue-red-blue-blue can be extended with another red-blue-blue sequence or help them predict that the twelfth term is blue,assuming that the red-blue-blue pattern repeats indefinitely. Initially,students may describe the regularity in patterns verbally rather thanwith mathematical symbols (English and Warren 1998). In grades 3–5,they can begin to use variables and algebraic expressions as they de-scribe and extend patterns. By the end of secondary school, they shouldbe comfortable using the notation of functions to describe relation-ships.
In the lower grades, students can describe patterns like 2, 4, 6, 8, …by focusing on how a term is obtained from the previous number—inthis example, by adding 2. This is the beginning of recursive thinking.Later, students can study sequences that can best be defined and com-puted using recursion, such as the Fibonacci sequence, 1, 1, 2, 3, 5, 8, …, in which each term is the sum of the previous two terms. Recur-sive sequences appear naturally in many contexts and can be studiedusing technology.
As they progress from preschool through high school, studentsshould develop a repertoire of many types of functions. In the middlegrades, students should focus on understanding linear relationships. Inhigh school, they should enlarge their repertoire of functions and learnabout the characteristics of classes of functions.
Many college students understand the notion of function only as arule or formula such as “given n, find 2n for n = 0, 1, 2, and 3” (Vinnerand Dreyfus 1989). By the middle grades, students should be able tounderstand the relationships among tables, graphs, and symbols and tojudge the advantages and disadvantages of each way of representing re-lationships for particular purposes. As they work with multiple repre-sentations of functions—including numeric, graphic, and symbolic—they will develop a more comprehensive understanding of functions(see Leinhardt, Zaslavsky, and Stein 1990; Moschkovich, Schoenfeldand Arcavi 1993; NRC 1998).
Represent and analyze mathematical situations andstructures using algebraic symbols
Students’ understanding of properties of numbers develops graduallyfrom preschool through high school. While young children are skip-counting by twos, they may notice that the numbers they are using endin 0, 2, 4, 6, and 8; they could then use this algebraic observation to ex-tend the pattern. In grades 3–5, as students investigate properties ofwhole-number operations, they may find that they can multiply 18 by14 mentally by computing 18 × 10 and adding it to 18 × 4; they are
Algebra is more thanmoving symbols around.
38 Principles and Standards for School Mathematics
Rep
rese
ntat
ion
| C
onne
ctio
ns |
Com
mun
icat
ion
| R
easo
ning
& P
roof
| P
robl
em S
olvi
ng |
Dat
a A
naly
sis
& P
roba
bilit
y |
Mea
sure
men
t |
Geo
met
ry |
Alg
ebra
| N
umbe
r &
Ope
ratio
ns

using the distributive property of multiplication over addition. Some-times geometric arguments can be understood long before students canreasonably be expected to perform sophisticated manipulations of alge-braic symbols. For example, the diagram in figure 3.2 might help leadupper elementary school students to the conjecture that the sum of thefirst n odd numbers is n2. Middle school students should be able to un-derstand how the diagram relates to the equation. Students in highschool should be able to represent the relationship in general, withsymbols, as 1 + 3 + … + (2n – 1) = n 2, and they should be able to provethe validity of their generalization.
Research indicates a variety of student difficulties with the concept ofvariable (Küchemann 1978; Kieran 1983; Wagner and Parker 1993), sodeveloping understanding of variable over the grades is important. Inthe elementary grades, students typically develop a notion of variable asa placeholder for a specific number, as in — + 2 = 11. Later, they shouldlearn that the variable x in the equation 3x + 2 = 11 has a very differentuse from the variable x in the identity 0 × x = 0 and that both uses arequite different from the use of r in the formula A = πr 2. A thorough un-derstanding of variable develops over a long time, and it needs to begrounded in extensive experience (Sfard 1991).
The notion of equality also should be developed throughout the cur-riculum. As a consequence of the instruction they have received, youngstudents typically perceive the equals sign operationally, that is, as a sig-nal to “do something” (Behr, Erlwanger, and Nichols 1976; Kieran1981). They should come to view the equals sign as a symbol of equiva-lence and balance.
Students should begin to develop their skill in producing equivalentexpressions and solving linear equations in the middle grades, bothmentally and with paper and pencil. They should develop fluency inoperating with symbols in their high school years, with by-hand ormental computation in simple cases and with computer algebra tech-nology in all cases. In general, if students engage extensively in sym-bolic manipulation before they develop a solid conceptual foundationfor their work, they will be unable to do more than mechanical manipu-lations (NRC 1998). The foundation for meaningful work with sym-bolic notation should be laid over a long time.
Use mathematical models to represent and understandquantitative relationships
One of the most powerful uses of mathematics is the mathematicalmodeling of phenomena. Students at all levels should have opportuni-ties to model a wide variety of phenomena mathematically in ways thatare appropriate to their level. In the lower elementary grades, studentscan use objects, pictures, and symbols to model situations that involvethe addition and subtraction of whole numbers. When children demon-strate the situation “Gary has 4 apples, and Becky has 5 more” by ar-ranging counters, they are doing beginning work with modeling.
In grades 3–5 students should use their models to make predictions,draw conclusions, or better understand quantitative situations. Theseuses of models will grow more sophisticated. For instance, in solving aproblem about making punch, middle-grades students might describethe relationships in the problem with the formula P = (8/3)J, where P is
39Standards for School Mathematics
Num
ber & O
perations | Algebra | G
eometry | M
easurement | D
ata Analysis &
Probability | P
roblem S
olving | Reasoning &
Proof | C
omm
unication | Connections | R
epresentation
Fig. 3.2.
Demonstration that 1 + 3 + 5 + 7 = 4 2
the number of cups of punch and J is the number of cups of juice. Thismathematical model that can be used to decide how much punch willbe made from fifty cups of juice.
High school students should be able to develop models by drawingon their knowledge of many classes of functions—to decide, for in-stance, whether a situation would best be modeled with a linear func-tion or a quadratic function—and be able to draw conclusions about thesituation by analyzing the model. Using computer-based laboratories(devices that gather data, such as the speed or distance of an object, andtransmit them directly to a computer so that graphs, tables, and equa-tions can be generated), students can get reliable numerical data quicklyfrom physical experiments. This technology allows them to build mod-els in a wide range of interesting situations.
Analyze change in various contextsUnderstanding change is fundamental to understanding functions
and to understanding many ideas presented in the news. The study ofmathematical change is formalized in calculus, when students study theconcept of the derivative. Research indicates this is not an area that stu-dents typically understand with much depth, even after taking calculus(Smith forthcoming). If ideas of change receive a more explicit focusfrom the early grades on, perhaps students will eventually enter calculuswith a stronger basis for understanding the ideas at that level. Inprekindergarten through grades 2, students can, at first, describe quali-tative change (“I grew taller over the summer”) and then quantitativechange (“I grew two inches in the last year”). Using graphs and tables,students in grades 3–5 can begin to notice and describe change, such asthe changing nature of the growth of a plant—“It grows slowly, thengrows faster, then slows down.” And as they look at sequences, they candistinguish between arithmetic growth (2, 5, 8, 11, 14, …) and geomet-ric growth (2, 4, 8, 16, …). With a strong middle-grades focus on lin-earity, students should learn about the idea that slope represents theconstant rate of change in linear functions and be ready to learn in highschool about classes of functions that have nonconstant rates of change.
Understanding changeis fundamental to
understanding functionsand to understanding
many ideas presented inthe news.
40 Principles and Standards for School Mathematics
Rep
rese
ntat
ion
| C
onne
ctio
ns |
Com
mun
icat
ion
| R
easo
ning
& P
roof
| P
robl
em S
olvi
ng |
Dat
a A
naly
sis
& P
roba
bilit
y |
Mea
sure
men
t |
Geo
met
ry |
Alg
ebra
| N
umbe
r &
Ope
ratio
ns

GeometryThrough the study of geometry, students will learn about geometric
shapes and structures and how to analyze their characteristics and rela-tionships. Spatial visualization—building and manipulating mental rep-resentations of two- and three-dimensional objects and perceiving anobject from different perspectives—is an important aspect of geometricthinking. Geometry is a natural place for the development of students’reasoning and justification skills, culminating in work with proof in thesecondary grades. Geometric modeling and spatial reasoning offer waysto interpret and describe physical environments and can be importanttools in problem solving.
Geometric ideas are useful in representing and solving problems inother areas of mathematics and in real-world situations, so geometryshould be integrated when possible with other areas. Geometric repre-sentations can help students make sense of area and fractions, his-tograms and scatterplots can give insights about data, and coordinategraphs can serve to connect geometry and algebra. Spatial reasoning ishelpful in using maps, planning routes, designing floor plans, and creat-ing art. Students can learn to see the structure and symmetry aroundthem. Using concrete models, drawings, and dynamic geometry soft-ware, students can engage actively with geometric ideas. With well-designed activities, appropriate tools, and teachers’ support, studentscan make and explore conjectures about geometry and can learn to rea-son carefully about geometric ideas from the earliest years of schooling.Geometry is more than definitions; it is about describing relationshipsand reasoning. The notion of building understanding in geometryacross the grades, from informal to more formal thinking, is consistentwith the thinking of theorists and researchers (Burger and Shaughnessy1986; Fuys, Geddes, and Tischler 1988; Senk 1989; van Hiele 1986).
Geometry has long been regarded as the place in the school mathe-matics curriculum where students learn to reason and to see the ax-iomatic structure of mathematics. The Geometry Standard includes astrong focus on the development of careful reasoning and proof, usingdefinitions and established facts. Technology also has an important rolein the teaching and learning of geometry. Tools such as dynamic geom-etry software enable students to model, and have an interactive experi-ence with, a large variety of two-dimensional shapes. Using technology,students can generate many examples as a way of forming and exploringconjectures, but it is important for them to recognize that generatingmany examples of a particular phenomenon does not constitute a proof.Visualization and spatial reasoning are also improved by interactionwith computer animations and in other technological settings(Clements et al. 1997; Yates 1988).
Analyze characteristics and properties of two- andthree-dimensional geometric shapes and developmathematical arguments about geometric relationships
Young students are inclined naturally to observe and describe a varietyof shapes and to begin to notice their properties. Identifying shapes is
41Standards for School Mathematics
Num
ber & O
perations | Algebra | G
eometry | M
easurement | D
ata Analysis &
Probability | P
roblem S
olving | Reasoning &
Proof | C
omm
unication | Connections | R
epresentation
Geometric ideas areuseful in representingand solving problems.
Geometry StandardInstructional programs
from prekindergarten throughgrade 12 should enable allstudents to—
• analyze characteristics andproperties of two- and three-dimensional geometricshapes and develop mathe-matical arguments aboutgeometric relationships;
• specify locations and de-scribe spatial relationshipsusing coordinate geometryand other representationalsystems;
• apply transformations anduse symmetry to analyzemathematical situations;
• use visualization, spatial rea-soning, and geometric mod-eling to solve problems.

important, too, but the focus on properties and their relationshipsshould be strong. For example, students in prekindergarten throughgrade 2 may observe that rectangles work well for tiling because theyhave four right angles. At this level, students can learn about geometricshapes using objects that can be seen, held, and manipulated. Later, thestudy of the attributes of shapes and of their properties becomes moreabstract. In higher grades, students can learn to focus on and discusscomponents of shapes, such as sides and angles, and the properties ofclasses of shapes. For example, using objects or dynamic geometric soft-ware to experiment with a variety of rectangles, students in grades 3–5should be able to conjecture that rectangles always have congruent diag-onals that bisect each other.
Through the middle grades and into high school, as they study suchtopics as similarity and congruence, students should learn to use deduc-tive reasoning and more-formal proof techniques to solve problems andto prove conjectures. At all levels, students should learn to formulateconvincing explanations for their conjectures and solutions. Eventually,they should be able to describe, represent, and investigate relationshipswithin a geometric system and to express and justify them in logicalchains. They should also be able to understand the role of definitions,axioms, and theorems and be able to construct their own proofs.
Specify locations and describe spatial relationships usingcoordinate geometry and other representational systems
At first, young children learn concepts of relative position, such asabove, behind, near, and between. Later they can make and use rectan-gular grids to locate objects and measure the distance between pointsalong vertical or horizontal lines. Experiences with the rectangular co-ordinate plane will be useful as they solve a wider array of problems ingeometry and algebra. In the middle and secondary grades, the coordi-nate plane can be helpful as students work on discovering and analyz-ing properties of shapes. Finding distances between points in the planeby using scales on maps or the Pythagorean relationship is importantin the middle grades. Geometric figures, such as lines in the middlegrades or triangles and circles in high school, can be represented ana-lytically, thus establishing a fundamental connection between algebraand geometry.
Students should gain experience in using a variety of visual and coor-dinate representations to analyze problems and study mathematics. Inthe elementary grades, for example, an interpretation of whole-numberaddition can be demonstrated on the number line. In later years, stu-dents can use the number line to represent operations on other types ofnumbers. In grades 3–5, grids and arrays can help students understandmultiplication. Later, more-complex problems can be considered. Forexample, in trying to minimize the distance an ambulance would have totravel to reach a new hospital from any location in the community, stu-dents in the middle grades might use distances measured along streets.In high school, students can be asked to find the shortest airplane routebetween two cities and compare the results using a map to the resultsusing a globe. If students were trying to minimize the distances of a cartrip to several cities, they might use vertex-edge graphs. High school
Students should gainexperience in using avariety of visual and
coordinate representationsto analyze problems and
study mathematics.
42 Principles and Standards for School Mathematics
Rep
rese
ntat
ion
| C
onne
ctio
ns |
Com
mun
icat
ion
| R
easo
ning
& P
roof
| P
robl
em S
olvi
ng |
Dat
a A
naly
sis
& P
roba
bilit
y |
Mea
sure
men
t |
Geo
met
ry |
Alg
ebra
| N
umbe
r &
Ope
ratio
ns

students should use Cartesian coordinates as a means both to solve prob-lems and to prove their results.
Apply transformations and use symmetry to analyzemathematical situations
Young children come to school with intuitions about how shapes canbe moved. Students can explore motions such as slides, flips, and turnsby using mirrors, paper folding, and tracing. Later, their knowledgeabout transformations should become more formal and systematic. Ingrades 3–5 students can investigate the effects of transformations andbegin to describe them in mathematical terms. Using dynamic geome-try software, they can begin to learn the attributes needed to define atransformation. For example, to transform a figure using a rotation,students need to define the center of rotation, the direction of the rota-tion, and the angle of rotation, as illustrated in figure 3.3. In the middlegrades, students should learn to understand what it means for a trans-formation to preserve distance, as translations, rotations, and reflectionsdo. High school students should learn multiple ways of expressingtransformations, including using matrices to show how figures aretransformed on the coordinate plane, as well as function notation. Theyshould also begin to understand the effects of compositions of transfor-mations. At all grade levels, appropriate consideration of symmetry pro-vides insights into mathematics and into art and aesthetics.
Use visualization, spatial reasoning, and geometricmodeling to solve problems
Beginning in the early years of schooling, students should developvisualization skills through hands-on experiences with a variety of geo-metric objects and through the use of technology that allows them toturn, shrink, and deform two- and three-dimensional objects. Later,they should become comfortable analyzing and drawing perspectiveviews, counting component parts, and describing attributes that cannotbe seen but can be inferred. Students need to learn to physically andmentally change the position, orientation, and size of objects in system-atic ways as they develop their understandings about congruence, simi-larity, and transformations.
One aspect of spatial visualization involves moving between two- andthree-dimensional shapes and their representations. Elementary schoolstudents can wrap blocks in nets—two dimensional figures, usually madeof paper, that can be folded to form three-dimensional objects—as a steptoward learning to predict whether certain nets match certain solids. Bythe middle grades, they should be able to interpret and create top or sideviews of objects. This skill can be developed by challenging them tobuild a structure given only the side view and the front view, as in figure3.4. In grades 3–5, students can determine if it is possible to build morethan one structure satisfying both conditions. Middle-grades and sec-ondary school students can be asked to find the minimum number ofblocks needed to build the structure. High school students should beable to visualize and draw other cross-sections of the structures and of arange of geometric solids.
43Standards for School Mathematics
Num
ber & O
perations | Algebra | G
eometry | M
easurement | D
ata Analysis &
Probability | P
roblem S
olving | Reasoning &
Proof | C
omm
unication | Connections | R
epresentation
Fig. 3.3.
A clockwise rotation of 120°
Fig. 3.4.
A block structure(from a presentation by J. de Lange)
turn center
120°
Side view
Front view

MeasurementMeasurement is the assignment of a numerical value to an attribute
of an object, such as the length of a pencil. At more-sophisticated levels,measurement involves assigning a number to a characteristic of a situa-tion, as is done by the consumer price index. Understanding what ameasurable attribute is and becoming familiar with the units andprocesses that are used in measuring attributes is a major emphasis inthis Standard. Through their school experience, primarily in prekinder-garten through grade 8, students should become proficient in usingmeasurement tools, techniques, and formulas in a range of situations.
The study of measurement is important in the mathematics curricu-lum from prekindergarten through high school because of the practical-ity and pervasiveness of measurement in so many aspects of everydaylife. The study of measurement also offers an opportunity for learningand applying other mathematics, including number operations, geo-metric ideas, statistical concepts, and notions of function. It highlightsconnections within mathematics and between mathematics and areasoutside of mathematics, such as social studies, science, art, and physicaleducation.
Measurement lends itself especially well to the use of concrete mate-rials. In fact, it is unlikely that children can gain a deep understandingof measurement without handling materials, making comparisons phys-ically, and measuring with tools. Measurement concepts should grow insophistication and breadth across the grades, and instructional pro-grams should not repeat the same measurement curriculum year afteryear. However, it should be emphasized more in the elementary andmiddle grades than in high school.
Understand measurable attributes of objects and theunits, systems, and processes of measurement
A measurable attribute is a characteristic of an object that can bequantified. Line segments have length, plane regions have area, andphysical objects have mass. As students progress through the curricu-lum from preschool through high school, the set of attributes they canmeasure should expand. Recognizing that objects have attributes thatare measurable is the first step in the study of measurement. Childrenin prekindergarten through grade 2 begin by comparing and orderingobjects using language such as longer and shorter. Length should be thefocus in this grade band, but weight, time, area, and volume should alsobe explored. In grades 3–5, students should learn about area more thor-oughly, as well as perimeter, volume, temperature, and angle measure.In these grades, they learn that measurements can be computed usingformulas and need not always be taken directly with a measuring tool.Middle-grades students build on these earlier measurement experiencesby continuing their study of perimeter, area, and volume and by begin-ning to explore derived measurements, such as speed. They should alsobecome proficient in measuring angles and understanding angle rela-tionships. In high school, students should understand how decisionsabout unit and scale can affect measurements. Whatever their gradelevel, students should have many informal experiences in understanding
44 Principles and Standards for School Mathematics
Rep
rese
ntat
ion
| C
onne
ctio
ns |
Com
mun
icat
ion
| R
easo
ning
& P
roof
| P
robl
em S
olvi
ng |
Dat
a A
naly
sis
& P
roba
bilit
y |
Mea
sure
men
t |
Geo
met
ry |
Alg
ebra
| N
umbe
r &
Ope
ratio
ns
Instructional programsshould not repeat the
same measurementcurriculum year
after year.
MeasurementStandard
Instructional programsfrom prekindergarten throughgrade 12 should enable allstudents to—
• understand measurableattributes of objects and theunits, systems, and processesof measurement;
• apply appropriate tech-niques, tools, and formulasto determine measurements.

Learning how to choosean appropriate unit is amajor part ofunderstandingmeasurement.
attributes before using tools to measure them or relying on formulas tocompute measurements.
As they progress through school, not only should students’ repertoireof measurable attributes expand, but their understanding of the rela-tionships between attributes should also develop. Students in the ele-mentary grades can explore how changing an object’s attributes affectscertain measurements. For example, cutting apart and rearranging thepieces of a shape may change the perimeter but will not affect the area.In the middle grades this idea can be extended to explorations of howthe surface area of a rectangular prism can vary as the volume is heldconstant. Such observations can offer glimpses of sophisticated mathe-matical concepts such as invariance under certain transformations.
The types of units that students use for measuring and the ways theyuse them should expand and shift as students move through theprekindergarten through grade 2 curriculum. In preschool throughgrade 2, students should begin their study of measurement by usingnonstandard units. They should be encouraged to use a wide variety ofobjects, such as paper clips to measure length, square tiles to measurearea, and paper cups to measure volume. Young children should alsohave opportunities to use standard units like centimeters, pounds, andhours. The “standardization” of units should arise later in the lowergrades, as students notice that using Joey’s foot to measure the length ofthe classroom gives a different length from that found by using Aria’sfoot. Such experiences help students see the convenience and consis-tency of using standard units. As students progress through middleschool and high school, they should learn how to use standard units tomeasure new abstract attributes, such as volume and density. By sec-ondary school, as students are measuring abstract attributes, theyshould use more-complex units, such as pounds per square inch andperson-days.
Understanding that different units are needed to measure differentattributes is sometimes difficult for young children. Learning how tochoose an appropriate unit is a major part of understanding measure-ment. For example, students in prekindergarten through grade 2 shouldlearn that length can be measured using linear tools but area cannot bedirectly measured this way. Young children should see that to measurearea they will need to use a unit of area such as a square region; middle-grades students should learn that square regions do not work for mea-suring volume and should explore the use of three-dimensional units.Students at all levels should learn to make wise choices of units orscales, depending on the problem situation. Choosing a convenient unitof measurement is also important. For example, although the length ofa soccer field can be measured in centimeters, the result may be difficultto interpret and use. Students should have a reasonable understandingof the role of units in measurement by the end of their elementaryschool years.
The metric system has a simple and consistent internal organization.Each unit is always related to the previous unit by a power of 10: a cen-timeter is ten times larger than a millimeter, a decimeter is ten timeslarger than a centimeter, and so forth. Since the customary English sys-tem of measurement is still prevalent in the United States, studentsshould learn both customary and metric systems and should know somerough equivalences between the metric and customary systems—for
45Standards for School Mathematics
Num
ber & O
perations | Algebra | G
eometry | M
easurement | D
ata Analysis &
Probability | P
roblem S
olving | Reasoning &
Proof | C
omm
unication | Connections | R
epresentation
Students should learnboth customary andmetric systems.
example, that a two-liter bottle of soda is a little more than half a gal-lon. The study of these systems begins in elementary school, and stu-dents at this level should be able to carry out simple conversions withinboth systems. Students should develop proficiency in these conversionsin the middle grades and should learn some useful benchmarks for con-verting between the two systems. The study of measurement systemscan help students understand aspects of the base-ten system, such asplace value. And in making conversions, students apply their knowledgeof proportions.
Understanding that all measurements are approximations is a diffi-cult but important concept for students. They should work with thisnotion in grades 3–5 through activities in which they measure certainobjects, compare their measurements with those of the rest of the class,and note that many of the values do not agree. Class discussions of theirobservations can elicit the ideas of precision and accuracy. Middle-grades students should continue to develop an understanding of mea-surements as approximations. In high school, students should come torecognize the need to report an appropriate number of significant digitswhen computing with measurements.
Apply appropriate techniques, tools, and formulas todetermine measurements
Measurement techniques are strategies used to determine a measure-ment, such as counting, estimating, and using formulas or tools. Mea-surement tools are the familiar devices that most people associate withtaking measurements; they include rulers, measuring tapes, vessels,scales, clocks, and stopwatches. Formulas are general relationships thatproduce measurements when values are specified for the variables in theformula.
Students in prekindergarten through grade 2 should learn to use avariety of techniques, including counting and estimating, and such toolsas rulers, scales, and analog clocks. Elementary and middle-grades stu-dents should continue to use these techniques and develop new ones. Inaddition, they ought to begin to adapt their current tools and inventnew techniques to find more-complicated measurements. For example,they might use transparent grid paper to approximate the area of a leaf.Middle-grades students can use formulas for the areas of triangles andrectangles to find the area of a trapezoid. An important measurementtechnique in high school is successive approximation, a precursor tocalculus concepts.
Students should begin to develop formulas for perimeter and area inthe elementary grades. Middle-grades students should formalize thesetechniques, as well as develop formulas for the volume and surface areaof objects like prisms and cylinders. Many elementary and middle-grades children have difficulty with understanding perimeter and area(Kenney and Kouba 1997; Lindquist and Kouba 1989). Often, thesechildren are using formulas such as P = 2l + 2w or A = l × w without un-derstanding how these formulas relate to the attribute being measuredor the unit of measurement being used. Teachers must help students seethe connections between the formula and the actual object. In highschool, as students use formulas in solving problems, they should rec-ognize that the units in the measurements behave like variables under
Understanding thatall measurements are
approximations is adifficult but important
concept for students.
46 Principles and Standards for School Mathematics
Rep
rese
ntat
ion
| C
onne
ctio
ns |
Com
mun
icat
ion
| R
easo
ning
& P
roof
| P
robl
em S
olvi
ng |
Dat
a A
naly
sis
& P
roba
bilit
y |
Mea
sure
men
t |
Geo
met
ry |
Alg
ebra
| N
umbe
r &
Ope
ratio
ns
Many children havedifficulty withunderstanding perimeterand area.
algebraic procedures, and they can use this observation to organizetheir conversions and computations using unit analysis.
Estimating is another measurement technique that should be devel-oped throughout the school years. Estimation activities in prekinder-garten through grade 2 should focus on helping children better under-stand the process of measuring and the role of the size of the unit.Elementary school and middle-grades students should have many op-portunities to estimate measures by comparing them against somebenchmark. For example, a student might estimate the teacher’s heightby noting that the teacher is about one and one-half times as tall as thestudent. Middle-grades students should also use benchmarks to esti-mate angle measures and should estimate derived measurements such asspeed.
Finally, students in grades 3–5 should have opportunities to use mapsand make simple scale drawings. Grades 6–8 students should extendtheir understanding of scaling to solve problems involving scale factors.These problems can help students make sense of proportional relation-ships and develop an understanding of similarity. High school studentsshould study more-sophisticated aspects of scaling, including the effectsof scale changes on a problem situation. They should also come to un-derstand nonlinear scale changes such as logarithmic scaling and howsuch techniques are used in analyzing data and in modeling.
47Standards for School Mathematics
Num
ber & O
perations | Algebra | G
eometry | M
easurement | D
ata Analysis &
Probability | P
roblem S
olving | Reasoning &
Proof | C
omm
unication | Connections | R
epresentation

Data Analysis and ProbabilityThe Data Analysis and Probability Standard recommends that stu-
dents formulate questions that can be answered using data and ad-dresses what is involved in gathering and using the data wisely. Studentsshould learn how to collect data, organize their own or others’ data, anddisplay the data in graphs and charts that will be useful in answeringtheir questions. This Standard also includes learning some methods foranalyzing data and some ways of making inferences and conclusionsfrom data. The basic concepts and applications of probability are alsoaddressed, with an emphasis on the way that probability and statisticsare related.
The amount of data available to help make decisions in business, pol-itics, research, and everyday life is staggering: Consumer surveys guidethe development and marketing of products. Polls help determinepolitical-campaign strategies, and experiments are used to evaluate thesafety and efficacy of new medical treatments. Statistics are often mis-used to sway public opinion on issues or to misrepresent the qualityand effectiveness of commercial products. Students need to knowabout data analysis and related aspects of probability in order to reasonstatistically—skills necessary to becoming informed citizens and intel-ligent consumers.
The increased curricular emphasis on data analysis proposed in theseStandards is intended to span the grades rather than to be reserved forthe middle grades and secondary school, as is common in many coun-tries. NCTM’s 1989 Curriculum and Evaluation Standards for SchoolMathematics introduced standards in statistics and probability at allgrade bands; a number of organizations have developed instructionalmaterials and professional development programs to promote theteaching and learning of these topics. Building on this base, these Stan-dards recommend a strong development of the strand, with conceptsand procedures becoming increasingly sophisticated across the gradesso that by the end of high school students have a sound knowledge ofelementary statistics. To understand the fundamentals of statisticalideas, students must work directly with data. The emphasis on workingwith data entails students’ meeting new ideas and procedures as theyprogress through the grades rather than revisiting the same activitiesand topics. The data and statistics strand allows teachers and studentsto make a number of important connections among ideas and proce-dures from number, algebra, measurement, and geometry. Work in dataanalysis and probability offers a natural way for students to connectmathematics with other school subjects and with experiences in theirdaily lives.
In addition, the processes used in reasoning about data and statisticswill serve students well in work and in life. Some things children learnin school seem to them predetermined and rule bound. In studyingdata and statistics, they can also learn that solutions to some problemsdepend on assumptions and have some degree of uncertainty. The kindof reasoning used in probability and statistics is not always intuitive,and so students will not necessarily develop it if it is not included inthe curriculum.
48 Principles and Standards for School Mathematics
Rep
rese
ntat
ion
| C
onne
ctio
ns |
Com
mun
icat
ion
| R
easo
ning
& P
roof
| P
robl
em S
olvi
ng |
Dat
a A
naly
sis
& P
roba
bilit
y |
Mea
sure
men
t |
Geo
met
ry |
Alg
ebra
| N
umbe
r &
Ope
ratio
ns
The increasedemphasis on data
analysis is intended tospan the grades.
Data Analysis andProbability Standard
Instructional programsfrom prekindergarten throughgrade 12 should enable all students to—
• formulate questions that canbe addressed with data andcollect, organize, and displayrelevant data to answerthem;
• select and use appropriate statistical methods to analyzedata;
• develop and evaluate infer-ences and predictions thatare based on data;
• understand and apply basicconcepts of probability.

Books, newspapers, theWorld Wide Web, andother media are full ofdisplays of data.
Formulate questions that can be addressed with dataand collect, organize, and display relevant data toanswer them
Because young children are naturally curious about their world, theyoften raise questions such as, How many? How much? What kind? orWhich of these? Such questions often offer opportunities for beginningthe study of data analysis and probability. Young children like to designquestions about things close to their experience—What kind of pets doclassmates have? What are children’s favorite kinds of pizza? As stu-dents move to higher grades, the questions they generate for investiga-tion can be based on current issues and interests. Students in grades6–8, for example, may be interested in recycling, conservation, or man-ufacturers’ claims. They may pose questions such as, Is it better to usepaper or plastic plates in the cafeteria? or Which brand of batteries lastslonger? By grades 9–12, students will be ready to pose and investigateproblems that explore complex issues.
Young children can devise simple data-gathering plans to attempt toanswer their questions. In the primary grades, the teacher might helpframe the question or provide a tally sheet, class roster, or chart onwhich data can be recorded as they are collected. The “data” might bereal objects, such as children’s shoes arranged in a bar graph or the chil-dren themselves arranged by interest areas. As students move throughthe elementary grades, they should spend more time planning the datacollection and evaluating how well their methods worked in getting in-formation about their questions. In the middle grades, students shouldwork more with data that have been gathered by others or generated bysimulations. By grades 9–12, students should understand the variouspurposes of surveys, observational studies, and experiments.
A fundamental idea in prekindergarten through grade 2 is that data canbe organized or ordered and that this “picture” of the data provides infor-mation about the phenomenon or question. In grades 3–5, studentsshould develop skill in representing their data, often using bar graphs,tables, or line plots. They should learn what different numbers, symbols,and points mean. Recognizing that some numbers represent the values ofthe data and others represent the frequency with which those valuesoccur is a big step. As students begin to understand ways of representingdata, they will be ready to compare two or more data sets. Books, news-papers, the World Wide Web, and other media are full of displays ofdata, and by the upper elementary grades, students ought to learn to readand understand these displays. Students in grades 6–8 should begin tocompare the effectiveness of various types of displays in organizing thedata for further analysis or in presenting the data clearly to an audience.As students deal with larger or more-complex data sets, they can reorderdata and represent data in graphs quickly, using technology so that theycan focus on analyzing the data and understanding what they mean.
Select and use appropriate statistical methods toanalyze data
Although young children are often most interested in their ownpiece of data on a graph (I have five people in my family), putting all
49Standards for School Mathematics
Num
ber & O
perations | Algebra | G
eometry | M
easurement | D
ata Analysis &
Probability | P
roblem S
olving | Reasoning &
Proof | C
omm
unication | Connections | R
epresentation

the students’ information in one place draws attention to the set ofdata. Later, students should begin to describe the set of data as awhole. Although this transition is difficult (Konold forthcoming), stu-dents may, for example, note that “more students come to school bybus than by all the other ways combined.” By grades 3–5, studentsshould be developing an understanding of aggregated data. As olderstudents begin to see a set of data as a whole, they need tools to de-scribe this set. Statistics such as measures of center or location (e.g.,mean, median, mode), measures of spread or dispersion (range, stan-dard deviation), and attributes of the shape of the data become usefulto students as descriptors. In the elementary grades, students’ under-standings can be grounded in informal ideas, such as middle, concen-tration, or balance point (Mokros and Russell 1995). With increasingsophistication in secondary school, students should choose particularsummary statistics according to the questions to be answered.
Throughout the school years, students should learn what it means tomake valid statistical comparisons. In the elementary grades, studentsmight say that one group has more or less of some attribute than an-other. By the middle grades, students should be quantifying these dif-ferences by comparing specific statistics. Beginning in grades 3–5 andcontinuing in the middle grades, the emphasis should shift from analyz-ing and describing one set of data to comparing two or more sets(Konold forthcoming). As they move through the middle grades intohigh school, students will need new tools, including histograms, stem-and-leaf plots, box plots, and scatterplots, to identify similarities anddifferences among data sets. Students also need tools to investigate as-sociation and trends in bivariate data, including scatterplots and fittedlines in grades 6–8 and residuals and correlation in grades 9–12.
Develop and evaluate inferences and predictions thatare based on data
Central elements of statistical analysis—defining an appropriatesample, collecting data from that sample, describing the sample, andmaking reasonable inferences relating the sample and the population—should be understood as students move through the grades. In theearly grades, students are most often working with census data, such asa survey of each child in the class about favorite kinds of ice cream.The notion that the class can be viewed as a sample from a larger pop-ulation is not obvious at these grades. Upper elementary and earlymiddle-grades students can begin to develop notions about statisticalinference, but developing a deep understanding of the idea of samplingis difficult (Schwartz et al. 1998). Research has shown that students ingrades 5–8 expect their own judgment to be more reliable than infor-mation obtained from data (Hancock, Kaput, and Goldsmith 1992). Inthe later middle grades and high school, students should address theideas of sample selection and statistical inference and begin to under-stand that there are ways of quantifying how certain one can be aboutstatistical results.
In addition, students in grades 9–12 should use simulations to learnabout sampling distributions and make informal inferences. In particu-lar, they should know that basic statistical techniques are used to moni-tor quality in the workplace. Students should leave secondary school
Students should learnwhat it means to make
valid statisticalcomparisons.
50 Principles and Standards for School Mathematics
Rep
rese
ntat
ion
| C
onne
ctio
ns |
Com
mun
icat
ion
| R
easo
ning
& P
roof
| P
robl
em S
olvi
ng |
Dat
a A
naly
sis
& P
roba
bilit
y |
Mea
sure
men
t |
Geo
met
ry |
Alg
ebra
| N
umbe
r &
Ope
ratio
ns

Probability is connectedto other areas ofmathematics.
with the ability to judge the validity of arguments that are based ondata, such as those that appear in the press.
Understand and apply basic concepts of probabilityA subject in its own right, probability is connected to other areas of
mathematics, especially number and geometry. Ideas from probabilityserve as a foundation to the collection, description, and interpretationof data.
In prekindergarten through grade 2, the treatment of probabilityideas should be informal. Teachers should build on children’s develop-ing vocabulary to introduce and highlight probability notions, for ex-ample, We’ll probably have recess this afternoon, or It’s unlikely to raintoday. Young children can begin building an understanding of chanceand randomness by doing experiments with concrete objects, such aschoosing colored chips from a bag. In grades 3–5 students can considerideas of chance through experiments—using coins, dice, or spinners—with known theoretical outcomes or through designating familiarevents as impossible, unlikely, likely, or certain. Middle-grades studentsshould learn and use appropriate terminology and should be able tocompute probabilities for simple compound events, such as the numberof expected occurrences of two heads when two coins are tossed 100times. In high school, students should compute probabilities of com-pound events and understand conditional and independent events.Through the grades, students should be able to move from situationsfor which the probability of an event can readily be determined to situ-ations in which sampling and simulations help them quantify the likeli-hood of an uncertain outcome.
Many of the phenomena that students encounter, especially in school,have predictable outcomes. When a fair coin is flipped, it is equallylikely to come up heads or tails. Which outcome will result on a givenflip is uncertain—even if ten flips in a row have resulted in heads, formany people it is counterintuitive that the eleventh flip has only a 50percent likelihood of being tails. If an event is random and if it is re-peated many, many times, then the distribution of outcomes forms a pat-tern. The idea that individual events are not predictable in such a situa-tion but that a pattern of outcomes can be predicted is an importantconcept that serves as a foundation for the study of inferential statistics.
51Standards for School Mathematics
Num
ber & O
perations | Algebra | G
eometry | M
easurement | D
ata Analysis &
Probability | P
roblem S
olving | Reasoning &
Proof | C
omm
unication | Connections | R
epresentation

Problem SolvingProblem solving means engaging in a task for which the solution
method is not known in advance. In order to find a solution, studentsmust draw on their knowledge, and through this process, they will oftendevelop new mathematical understandings. Solving problems is notonly a goal of learning mathematics but also a major means of doing so.Students should have frequent opportunities to formulate, grapple with,and solve complex problems that require a significant amount of effortand should then be encouraged to reflect on their thinking.
By learning problem solving in mathematics, students should acquireways of thinking, habits of persistence and curiosity, and confidence inunfamiliar situations that will serve them well outside the mathematicsclassroom. In everyday life and in the workplace, being a good problemsolver can lead to great advantages.
Problem solving is an integral part of all mathematics learning, and soit should not be an isolated part of the mathematics program. Problemsolving in mathematics should involve all the five content areas de-scribed in these Standards. The contexts of the problems can vary fromfamiliar experiences involving students’ lives or the school day to appli-cations involving the sciences or the world of work. Good problems willintegrate multiple topics and will involve significant mathematics.
Build new mathematical knowledge through problemsolving
How can problem solving help students learn mathematics? Goodproblems give students the chance to solidify and extend what they knowand, when well chosen, can stimulate mathematics learning. With youngchildren, most mathematical concepts can be introduced through prob-lems that come from their worlds. For example, suppose second graderswanted to find out whether there are more boys or girls in the foursecond-grade classes. To solve this problem, they would need to learnhow to gather information, record data, and accurately add several num-bers at a time. In the middle grades, the concept of proportion might beintroduced through an investigation in which students are given recipesfor punch that call for different amounts of water and juice and are askedto determine which is “fruitier.” Since no two recipes yield the sameamount of juice, this problem is difficult for students who do not have anunderstanding of proportion. As various ideas are tried, with good ques-tioning and guidance by a teacher, students eventually converge on usingproportions. In high school, many areas of the curriculum can be intro-duced through problems from mathematical or applications contexts.
Problem solving can and should be used to help students develop flu-ency with specific skills. For example, consider the following problem,which is adapted from the Curriculum and Evaluation Standards for SchoolMathematics (NCTM 1989, p. 24):
I have pennies, dimes, and nickels in my pocket. If I take three coins out ofmy pocket, how much money could I have taken?
Knowledge is needed to solve this problem—knowledge of the valueof pennies, dimes, and nickels and also some understanding of addition.
52 Principles and Standards for School Mathematics
Rep
rese
ntat
ion
| C
onne
ctio
ns |
Com
mun
icat
ion
| R
easo
ning
& P
roof
| P
robl
em S
olvi
ng |
Dat
a A
naly
sis
& P
roba
bilit
y |
Mea
sure
men
t |
Geo
met
ry |
Alg
ebra
| N
umbe
r &
Ope
ratio
ns
Problem solving is anintegral part of all
mathematics learning.
Problem SolvingStandard
Instructional programsfrom prekindergarten throughgrade 12 should enable allstudents to—
• build new mathematicalknowledge through problemsolving;
• solve problems that arise inmathematics and in othercontexts;
• apply and adapt a variety ofappropriate strategies tosolve problems;
• monitor and reflect on theprocess of mathematicalproblem solving.

The teacher’s role inchoosing worthwhileproblems andmathematical tasks iscrucial.
Working on this problem offers good practice in addition skills. But theimportant mathematical goal of this problem—helping students tothink systematically about possibilities and to organize and record theirthinking—need not wait until students can add fluently.
The teacher’s role in choosing worthwhile problems and mathemati-cal tasks is crucial. By analyzing and adapting a problem, anticipatingthe mathematical ideas that can be brought out by working on theproblem, and anticipating students’ questions, teachers can decide ifparticular problems will help to further their mathematical goals for theclass. There are many, many problems that are interesting and fun butthat may not lead to the development of the mathematical ideas that areimportant for a class at a particular time. Choosing problems wisely,and using and adapting problems from instructional materials, is a diffi-cult part of teaching mathematics.
Solve problems that arise in mathematics and in othercontexts
People who see the world mathematically are said to have a “mathe-matical disposition.” Good problem solvers tend naturally to analyzesituations carefully in mathematical terms and to pose problems basedon situations they see. They first consider simple cases before tryingsomething more complicated, yet they will readily consider a more so-phisticated analysis. For example, a task for middle-grades students pre-sents data about two ambulance companies and asks which company ismore reliable (Balanced Assessment for the Mathematics Curriculum1999a). A quick answer found by looking at the average time customershad to wait for each company turns out to be misleading. A more care-ful mathematical analysis involving plotting response times versus timeof day reveals a different solution. In this task, a disposition to analyzemore deeply leads to a more complete understanding of the situationand a correct solution. Throughout the grades, teachers can help buildthis disposition by asking questions that help students find the mathe-matics in their worlds and experiences and by encouraging students topersist with interesting but challenging problems.
Posing problems comes naturally to young children: I wonder how longit would take to count to a million? How many soda cans would it take tofill the school building? Teachers and parents can foster this inclination byhelping students make mathematical problems from their worlds. Teach-ers play an important role in the development of students’ problem-solving dispositions by creating and maintaining classroom environments,from prekindergarten on, in which students are encouraged to explore,take risks, share failures and successes, and question one another. In suchsupportive environments, students develop confidence in their abilitiesand a willingness to engage in and explore problems, and they will bemore likely to pose problems and to persist with challenging problems.
Apply and adapt a variety of appropriate strategies tosolve problems
Of the many descriptions of problem-solving strategies, some of thebest known can be found in the work of Pólya (1957). Frequently cited
53Standards for School Mathematics
Num
ber & O
perations | Algebra | G
eometry | M
easurement | D
ata Analysis &
Probability | P
roblem S
olving | Reasoning &
Proof | C
omm
unication | Connections | R
epresentation

strategies include using diagrams, looking for patterns, listing all possi-bilities, trying special values or cases, working backward, guessing andchecking, creating an equivalent problem, and creating a simpler prob-lem. An obvious question is, How should these strategies be taught?Should they receive explicit attention, and how should they be inte-grated with the mathematics curriculum? As with any other componentof the mathematical tool kit, strategies must receive instructional atten-tion if students are expected to learn them. In the lower grades, teach-ers can help children express, categorize, and compare their strategies.Opportunities to use strategies must be embedded naturally in the cur-riculum across the content areas. By the time students reach the middlegrades, they should be skilled at recognizing when various strategies areappropriate to use and should be capable of deciding when and how touse them. By high school, students should have access to a wide rangeof strategies, be able to decide which one to use, and be able to adaptand invent strategies.
Young children’s earliest experiences with mathematics comethrough solving problems. Different strategies are necessary as studentsexperience a wider variety of problems. Students must become aware ofthese strategies as the need for them arises, and as they are modeledduring classroom activities, the teacher should encourage students totake note of them. For example, after a student has shared a solutionand how it was obtained, the teacher may identify the strategy by say-ing, “It sounds like you made an organized list to find the solution. Didanyone solve the problem a different way?” This verbalization helps de-velop common language and representations and helps other studentsunderstand what the first student was doing. Such discussion also sug-gests that no strategy is learned once and for all; strategies are learnedover time, are applied in particular contexts, and become more refined,elaborate, and flexible as they are used in increasingly complex problemsituations.
Monitor and reflect on the process of mathematicalproblem solving
Effective problem solvers constantly monitor and adjust what theyare doing. They make sure they understand the problem. If a problemis written down, they read it carefully; if it is told to them orally, theyask questions until they understand it. Effective problem solvers planfrequently. They periodically take stock of their progress to see whetherthey seem to be on the right track. If they decide they are not makingprogress, they stop to consider alternatives and do not hesitate to take acompletely different approach. Research (Garofalo and Lester 1985;Schoenfeld 1987) indicates that students’ problem-solving failures areoften due not to a lack of mathematical knowledge but to the ineffectiveuse of what they do know.
Good problem solvers become aware of what they are doing and fre-quently monitor, or self-assess, their progress or adjust their strategiesas they encounter and solve problems (Bransford et al. 1999). Such re-flective skills (called metacognition) are much more likely to develop in aclassroom environment that supports them. Teachers play an importantrole in helping to enable the development of these reflective habits of
Opportunities to usestrategies must be
embedded naturally inthe curriculum across
the content areas.
54 Principles and Standards for School Mathematics
Rep
rese
ntat
ion
| C
onne
ctio
ns |
Com
mun
icat
ion
| R
easo
ning
& P
roof
| P
robl
em S
olvi
ng |
Dat
a A
naly
sis
& P
roba
bilit
y |
Mea
sure
men
t |
Geo
met
ry |
Alg
ebra
| N
umbe
r &
Ope
ratio
ns
mind by asking questions such as “Before we go on, are we sure we un-derstand this?” “What are our options?” “Do we have a plan?” “Are wemaking progress or should we reconsider what we are doing?” “Whydo we think this is true?” Such questions help students get in the habitof checking their understanding as they go along. This habit shouldbegin in the lowest grades. As teachers maintain an environment inwhich the development of understanding is consistently monitoredthrough reflection, students are more likely to learn to take responsi-bility for reflecting on their work and make the adjustments necessarywhen solving problems.
55Standards for School Mathematics
Num
ber & O
perations | Algebra | G
eometry | M
easurement | D
ata Analysis &
Probability | P
roblem S
olving | Reasoning &
Proof | C
omm
unication | Connections | R
epresentation
Reasoning and ProofMathematical reasoning and proof offer powerful ways of developing
and expressing insights about a wide range of phenomena. People whoreason and think analytically tend to note patterns, structure, or regu-larities in both real-world situations and symbolic objects; they ask ifthose patterns are accidental or if they occur for a reason; and they con-jecture and prove. Ultimately, a mathematical proof is a formal way ofexpressing particular kinds of reasoning and justification.
Being able to reason is essential to understanding mathematics. By de-veloping ideas, exploring phenomena, justifying results, and using mathe-matical conjectures in all content areas and—with different expectationsof sophistication—at all grade levels, students should see and expect thatmathematics makes sense. Building on the considerable reasoning skillsthat children bring to school, teachers can help students learn what math-ematical reasoning entails. By the end of secondary school, studentsshould be able to understand and produce mathematical proofs—arguments consisting of logically rigorous deductions of conclusionsfrom hypotheses—and should appreciate the value of such arguments.
Reasoning and proof cannot simply be taught in a single unit onlogic, for example, or by “doing proofs” in geometry. Proof is a verydifficult area for undergraduate mathematics students. Perhaps studentsat the postsecondary level find proof so difficult because their only ex-perience in writing proofs has been in a high school geometry course,so they have a limited perspective (Moore 1994). Reasoning and proofshould be a consistent part of students’ mathematical experience inprekindergarten through grade 12. Reasoning mathematically is a habitof mind, and like all habits, it must be developed through consistent usein many contexts.
Recognize reasoning and proof as fundamental aspectsof mathematics
From children’s earliest experiences with mathematics, it is impor-tant to help them understand that assertions should always have rea-sons. Questions such as “Why do you think it is true?” and “Does any-one think the answer is different, and why do you think so?” helpstudents see that statements need to be supported or refuted by evi-dence. Young children may wish to appeal to others as sources for theirreasons (“My sister told me so”) or even to vote to determine the bestexplanation, but students need to learn and agree on what is acceptableas an adequate argument in the mathematics classroom. These are thefirst steps toward realizing that mathematical reasoning is based on spe-cific assumptions and rules.
Part of the beauty of mathematics is that when interesting thingshappen, it is usually for good reason. Mathematics students should un-derstand this. Consider, for example, the following “magic trick” onemight find in a book of mathematical recreations:
Write down your age. Add 5. Multiply the number you just got by 2. Add10 to this number. Multiply this number by 5. Tell me the result. I can tellyou your age.
56 Principles and Standards for School Mathematics
Rep
rese
ntat
ion
| C
onne
ctio
ns |
Com
mun
icat
ion
| R
easo
ning
& P
roof
| P
robl
em S
olvi
ng |
Dat
a A
naly
sis
& P
roba
bilit
y |
Mea
sure
men
t |
Geo
met
ry |
Alg
ebra
| N
umbe
r &
Ope
ratio
ns
A mathematical proofis a formal way of
expressing particularkinds of reasoning and
justification.
Reasoning andProof Standard
Instructional programsfrom prekindergarten throughgrade 12 should enable allstudents to—
• recognize reasoning andproof as fundamental as-pects of mathematics;
• make and investigate math-ematical conjectures;
• develop and evaluate mathe-matical arguments andproofs;
• select and use various typesof reasoning and methods ofproof.

Conjecture is a majorpathway to discovery.
The procedure given to find the answer is, Drop the final zero fromthe number you are given and subtract 10. The result is the person’sage. Why does it work? Students at all grade levels can explore and ex-plain problems such as this one.
Systematic reasoning is a defining feature of mathematics. It is foundin all content areas and, with different requirements of rigor, at allgrade levels. For example, first graders can note that even and oddnumbers alternate; third graders can conjecture and justify—informally,perhaps, by paper folding—that the diagonals of a square are perpen-dicular. Middle-grades students can determine the likelihood of an evenor odd product when two number cubes are rolled and the numbersthat come up are multiplied. And high school students could be askedto consider what happens to a correlation coefficient under linear trans-formation of the variables.
Make and investigate mathematical conjecturesDoing mathematics involves discovery. Conjecture—that is, in-
formed guessing—is a major pathway to discovery. Teachers and re-searchers agree that students can learn to make, refine, and test conjec-tures in elementary school. Beginning in the earliest years, teachers canhelp students learn to make conjectures by asking questions: What doyou think will happen next? What is the pattern? Is this true always?Sometimes? Simple shifts in how tasks are posed can help studentslearn to conjecture. Instead of saying, “Show that the mean of a set ofdata doubles when all the values in the data set are doubled,” a teachermight ask, “Suppose all the values of a sample are doubled. Whatchange, if any, is there in the mean of the sample? Why?” High schoolstudents using dynamic geometry software could be asked to make ob-servations about the figure formed by joining the midpoints of succes-sive sides of a parallelogram and attempt to prove them. To make con-jectures, students need multiple opportunities and rich, engagingcontexts for learning.
Young children will express their conjectures and describe theirthinking in their own words and often explore them using concrete ma-terials and examples. Students at all grade levels should learn to investi-gate their conjectures using concrete materials, calculators and othertools, and increasingly through the grades, mathematical representa-tions and symbols. They also need to learn to work with other studentsto formulate and explore their conjectures and to listen to and under-stand conjectures and explanations offered by classmates.
Teachers can help students revisit conjectures that hold in one contextto check to see whether they still hold in a new setting. For instance, thecommon notion that “multiplication makes bigger” is quite appropriatefor young children working with whole numbers larger than 1. As theymove to fractions, this conjecture needs to be revisited. Students maynot always have the mathematical knowledge and tools they need to finda justification for a conjecture or a counterexample to refute it. For ex-ample, on the basis of their work with graphing calculators, high schoolstudents might be quite convinced that if a polynomial function has avalue that is greater than 0 and a value that is less than 0 then it willcross the x-axis somewhere. Teachers can point out that a rigorous proofrequires more knowledge than most high school students have.
57Standards for School Mathematics
Num
ber & O
perations | Algebra | G
eometry | M
easurement | D
ata Analysis &
Probability | P
roblem S
olving | Reasoning &
Proof | C
omm
unication | Connections | R
epresentation
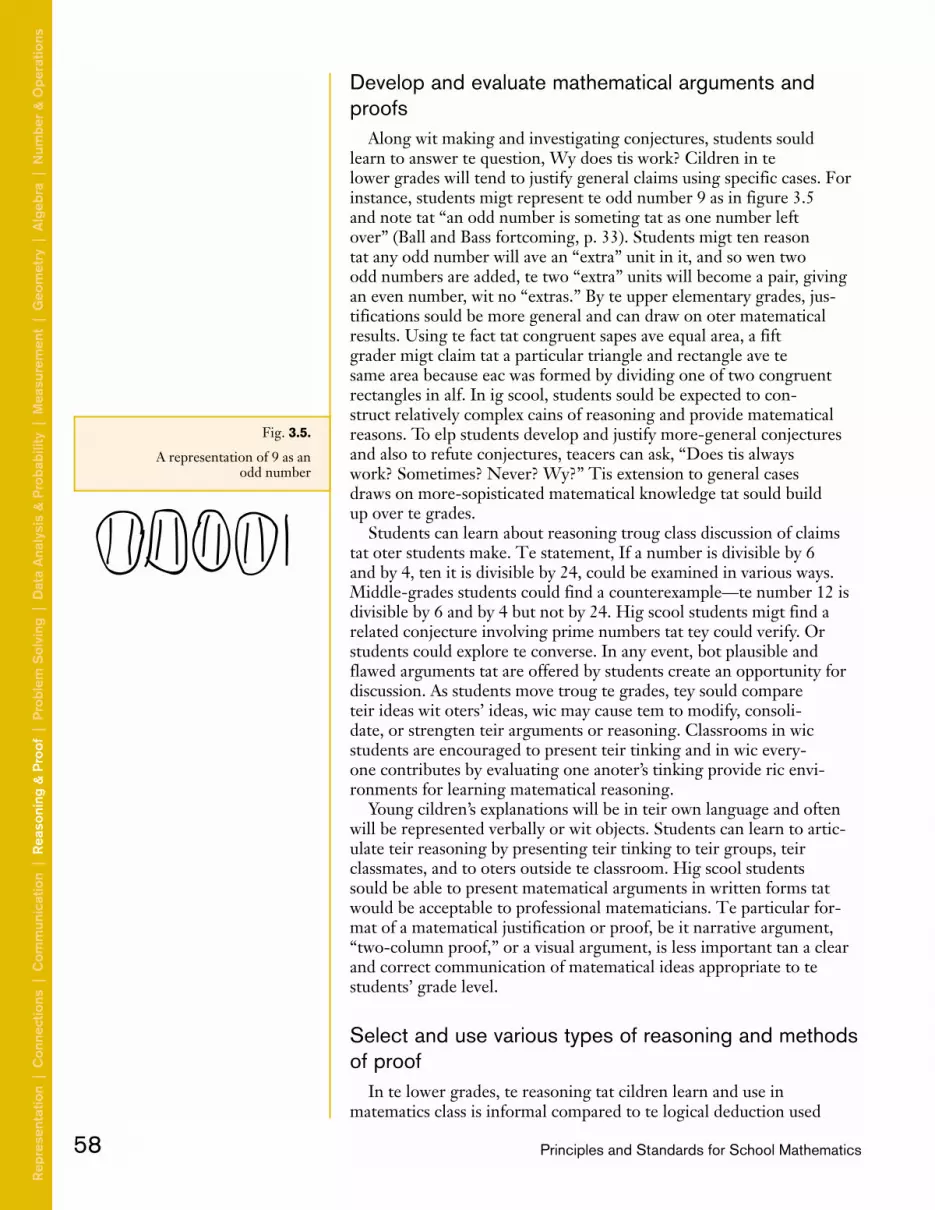
Develop and evaluate mathematical arguments andproofs
Along with making and investigating conjectures, students shouldlearn to answer the question, Why does this work? Children in thelower grades will tend to justify general claims using specific cases. Forinstance, students might represent the odd number 9 as in figure 3.5and note that “an odd number is something that has one number leftover” (Ball and Bass forthcoming, p. 33). Students might then reasonthat any odd number will have an “extra” unit in it, and so when twoodd numbers are added, the two “extra” units will become a pair, givingan even number, with no “extras.” By the upper elementary grades, jus-tifications should be more general and can draw on other mathematicalresults. Using the fact that congruent shapes have equal area, a fifthgrader might claim that a particular triangle and rectangle have thesame area because each was formed by dividing one of two congruentrectangles in half. In high school, students should be expected to con-struct relatively complex chains of reasoning and provide mathematicalreasons. To help students develop and justify more-general conjecturesand also to refute conjectures, teachers can ask, “Does this alwayswork? Sometimes? Never? Why?” This extension to general casesdraws on more-sophisticated mathematical knowledge that should buildup over the grades.
Students can learn about reasoning through class discussion of claimsthat other students make. The statement, If a number is divisible by 6and by 4, then it is divisible by 24, could be examined in various ways.Middle-grades students could find a counterexample—the number 12 isdivisible by 6 and by 4 but not by 24. High school students might find arelated conjecture involving prime numbers that they could verify. Orstudents could explore the converse. In any event, both plausible andflawed arguments that are offered by students create an opportunity fordiscussion. As students move through the grades, they should comparetheir ideas with others’ ideas, which may cause them to modify, consoli-date, or strengthen their arguments or reasoning. Classrooms in whichstudents are encouraged to present their thinking and in which every-one contributes by evaluating one another’s thinking provide rich envi-ronments for learning mathematical reasoning.
Young children’s explanations will be in their own language and oftenwill be represented verbally or with objects. Students can learn to artic-ulate their reasoning by presenting their thinking to their groups, theirclassmates, and to others outside the classroom. High school studentsshould be able to present mathematical arguments in written forms thatwould be acceptable to professional mathematicians. The particular for-mat of a mathematical justification or proof, be it narrative argument,“two-column proof,” or a visual argument, is less important than a clearand correct communication of mathematical ideas appropriate to thestudents’ grade level.
Select and use various types of reasoning and methodsof proof
In the lower grades, the reasoning that children learn and use inmathematics class is informal compared to the logical deduction used
58 Principles and Standards for School Mathematics
Rep
rese
ntat
ion
| C
onne
ctio
ns |
Com
mun
icat
ion
| R
easo
ning
& P
roof
| P
robl
em S
olvi
ng |
Dat
a A
naly
sis
& P
roba
bilit
y |
Mea
sure
men
t |
Geo
met
ry |
Alg
ebra
| N
umbe
r &
Ope
ratio
ns
Fig. 3.5.
A representation of 9 as anodd number

by the mathematician. Over the years of schooling, as teachers help stu-dents learn the norms for mathematical justification and proof, therepertoire of the types of reasoning available to students—algebraic andgeometric reasoning, proportional reasoning, probabilistic reasoning,statistical reasoning, and so forth—should expand. Students need to en-counter and build proficiency in all these forms with increasing sophis-tication as they move through the curriculum.
Young children should be encouraged to reason from what theyknow. A child who solves the problem 6 + 7 by calculating 6 + 6 andthen adding 1 is drawing on her knowledge of adding pairs, of adding 1,and of associativity. Students can be taught how to make explicit theknowledge they are using as they create arguments and justifications.
Early efforts at justification by young children will involve trial-and-error strategies or the unsystematic trying of many cases. With guid-ance and many opportunities to explore, students can learn by theupper elementary grades how to be systematic in their explorations, toknow that they have tried all cases, and to create arguments using cases.One research study (Maher and Martino 1996, p. 195) reported a fifthgrader’s elegant proof by cases in response to the problem in figure 3.6.
Proof by contradiction is also possible with young children. A firstgrader argued from his knowledge of whole-number patterns that thenumber 0 is even: “If 0 were odd, then 0 and 1 would be two odd num-bers in a row. Even and odd numbers alternate. So 0 must be even.” Be-ginning in the elementary grades, children can learn to disprove conjec-tures by finding counterexamples. At all levels, students will reasoninductively from patterns and specific cases. Increasingly over thegrades, they should also learn to make effective deductive argumentsbased on the mathematical truths they are establishing in class.
59Standards for School Mathematics
Num
ber & O
perations | Algebra | G
eometry | M
easurement | D
ata Analysis &
Probability | P
roblem S
olving | Reasoning &
Proof | C
omm
unication | Connections | R
epresentation
Fig. 3.6.
Stephanie’s elegant “proof by cases”produced in grade 5 (from Maherand Martino [1996])
CommunicationCommunication is an essential part of mathematics and mathematics
education. It is a way of sharing ideas and clarifying understanding.Through communication, ideas become objects of reflection, refine-ment, discussion, and amendment. The communication process alsohelps build meaning and permanence for ideas and makes them public.When students are challenged to think and reason about mathematicsand to communicate the results of their thinking to others orally or inwriting, they learn to be clear and convincing. Listening to others’ ex-planations gives students opportunities to develop their own under-standings. Conversations in which mathematical ideas are exploredfrom multiple perspectives help the participants sharpen their thinkingand make connections. Students who are involved in discussions inwhich they justify solutions—especially in the face of disagreement—will gain better mathematical understanding as they work to convincetheir peers about differing points of view (Hatano and Inagaki 1991).Such activity also helps students develop a language for expressingmathematical ideas and an appreciation of the need for precision in thatlanguage. Students who have opportunities, encouragement, and sup-port for speaking, writing, reading, and listening in mathematics classesreap dual benefits: they communicate to learn mathematics, and theylearn to communicate mathematically.
Because mathematics is so often conveyed in symbols, oral and writ-ten communication about mathematical ideas is not always recognizedas an important part of mathematics education. Students do not neces-sarily talk about mathematics naturally; teachers need to help themlearn how to do so (Cobb, Wood, and Yackel 1994). As studentsprogress through the grades, the mathematics about which they com-municate should become more complex and abstract. Students’ reper-toire of tools and ways of communicating, as well as the mathematicalreasoning that supports their communication, should become increas-ingly sophisticated. Support for students is vital. Students whose pri-mary language is not English may need some additional support inorder to benefit from communication-rich mathematics classes, butthey can participate fully if classroom activities are appropriately struc-tured (Silver, Smith, and Nelson 1995).
Students need to work with mathematical tasks that are worthwhiletopics of discussion. Procedural tasks for which students are expected tohave well-developed algorithmic approaches are usually not good can-didates for such discourse. Interesting problems that “go somewhere”mathematically can often be catalysts for rich conversations. Technol-ogy is another good basis for communication. As students generate andexamine numbers or objects on the calculator or computer screen, theyhave a common (and often easily modifiable) referent for their discus-sion of mathematical ideas.
Organize and consolidate their mathematical thinkingthrough communication
Students gain insights into their thinking when they present theirmethods for solving problems, when they justify their reasoning to a
60 Principles and Standards for School Mathematics
Rep
rese
ntat
ion
| C
onne
ctio
ns |
Com
mun
icat
ion
| R
easo
ning
& P
roof
| P
robl
em S
olvi
ng |
Dat
a A
naly
sis
& P
roba
bilit
y |
Mea
sure
men
t |
Geo
met
ry |
Alg
ebra
| N
umbe
r &
Ope
ratio
ns
Communication is anessential part of
mathematics andmathematics education.
CommunicationStandard
Instructional programsfrom prekindergarten throughgrade 12 should enable all students to—
• organize and consolidatetheir mathematical thinkingthough communication;
• communicate their mathe-matical thinking coherentlyand clearly to peers, teachers,and others;
• analyze and evaluate themathematical thinking andstrategies of others;
• use the language of mathe-matics to express mathemat-ical ideas precisely.
Reflection andcommunication areintertwined processes inmathematics learning.
classmate or teacher, or when they formulate a question about some-thing that is puzzling to them. Communication can support students’learning of new mathematical concepts as they act out a situation, draw,use objects, give verbal accounts and explanations, use diagrams, write,and use mathematical symbols. Misconceptions can be identified andaddressed. A side benefit is that it reminds students that they share re-sponsibility with the teacher for the learning that occurs in the lesson(Silver, Kilpatrick, and Schlesinger 1990).
Reflection and communication are intertwined processes in mathe-matics learning. With explicit attention and planning by teachers, com-munication for the purposes of reflection can become a natural part ofmathematics learning. Children in the early grades, for example, canlearn to explain their answers and describe their strategies. Young stu-dents can be asked to “think out loud,” and thoughtful questions posedby a teacher or classmate can provoke them to reexamine their reason-ing. With experience, students will gain proficiency in organizing andrecording their thinking.
Writing in mathematics can also help students consolidate theirthinking because it requires them to reflect on their work and clarifytheir thoughts about the ideas developed in the lesson. Later, they mayfind it helpful to reread the record of their own thoughts.
Communicate their mathematical thinking coherentlyand clearly to peers, teachers, and others
In order for a mathematical result to be recognized as correct, theproposed proof must be accepted by the community of professionalmathematicians. Students need opportunities to test their ideas on thebasis of shared knowledge in the mathematical community of the class-room to see whether they can be understood and if they are sufficientlyconvincing. When such ideas are worked out in public, students canprofit from being part of the discussion, and the teacher can monitortheir learning (Lampert 1990). Learning what is acceptable as evidencein mathematics should be an instructional goal from prekindergartenthrough grade 12.
To support classroom discourse effectively, teachers must build acommunity in which students will feel free to express their ideas. Stu-dents in the lower grades need help from teachers in order to sharemathematical ideas with one another in ways that are clear enough forother students to understand. In these grades, learning to see thingsfrom other people’s perspectives is a challenge for students. Starting ingrades 3–5, students should gradually take more responsibility for par-ticipating in whole-class discussions and responding to one another di-rectly. They should become better at listening, paraphrasing, question-ing, and interpreting others’ ideas. For some students, participation inclass discussions is a challenge. For example, students in the middlegrades are often reluctant to stand out in any way during group interac-tions. Despite this fact, teachers can succeed in creating communication-rich environments in middle-grades mathematics classrooms. By thetime students graduate from high school, they should have internalizedstandards of dialogue and argument so that they always aim to presentclear and complete arguments and work to clarify and complete them
61Standards for School Mathematics
Num
ber & O
perations | Algebra | G
eometry | M
easurement | D
ata Analysis &
Probability | P
roblem S
olving | Reasoning &
Proof | C
omm
unication | Connections | R
epresentation

when they fall short. Modeling and carefully posed questions can helpclarify age-appropriate expectations for student work.
Written communication should be nurtured in a similar fashion. Stu-dents begin school with few writing skills. In the primary grades, theymay rely on other means, such as drawing pictures, to communicate.Gradually they will also write words and sentences. In grades 3–5, stu-dents can work on sequencing ideas and adding details, and their writ-ing should become more elaborate. In the middle grades, they shouldbecome more explicit about basing their writing on a sense of audienceand purpose. For some purposes it will be appropriate for students todescribe their thinking informally, using ordinary language andsketches, but they should also learn to communicate in more-formalmathematical ways, using conventional mathematical terminology,through the middle grades and into high school. By the end of the highschool years, students should be able to write well-constructed mathe-matical arguments using formal vocabulary.
Examining and discussing both exemplary and problematic pieces ofmathematical writing can be beneficial at all levels. Since written assess-ments of students’ mathematical knowledge are becoming increasinglyprevalent, students will need practice responding to typical assessmentprompts. The process of learning to write mathematically is similar tothat of learning to write in any genre. Practice, with guidance, is impor-tant. So is attention to the specifics of mathematical argument, includ-ing the use and special meanings of mathematical language and the rep-resentations and standards of explanation and proof.
As students practice communication, they should express themselvesincreasingly clearly and coherently. They should also acquire and rec-ognize conventional mathematical styles of dialogue and argument.Through the grades, their arguments should become more completeand should draw directly on the shared knowledge in the classroom.Over time, students should become more aware of, and responsive to,their audience as they explain their ideas in mathematics class. Theyshould learn to be aware of whether they are convincing and whetherothers can understand them. As students mature, their communicationshould reflect an increasing array of ways to justify their procedures andresults. In the lower grades, providing empirical evidence or a few ex-amples may be enough. Later, short deductive chains of reasoningbased on previously accepted facts should become expected. In the mid-dle grades and high school, explanations should become more mathe-matically rigorous and students should increasingly state in their sup-porting arguments the mathematical properties they used.
Analyze and evaluate the mathematical thinking andstrategies of others
In the process of working on problems with other students, learnersgain several benefits. Often, a student who has one way of seeing a prob-lem can profit from another student’s view, which may reveal a differentaspect of the problem. For example, students who try to solve the follow-ing problem (Krutetskii 1976, p. 121) algebraically often have difficultysetting up the equations, and they benefit from the insights provided bystudents who approach the problem using visual representations.
Writtencommunication should
be nurtured.
62 Principles and Standards for School Mathematics
Rep
rese
ntat
ion
| C
onne
ctio
ns |
Com
mun
icat
ion
| R
easo
ning
& P
roof
| P
robl
em S
olvi
ng |
Dat
a A
naly
sis
& P
roba
bilit
y |
Mea
sure
men
t |
Geo
met
ry |
Alg
ebra
| N
umbe
r &
Ope
ratio
ns
It is important to avoida premature rush toimpose formalmathematical language.
There are some rabbits and some hutches. If one rabbit is put in eachhutch, one rabbit will be left without a place. If two rabbits are put in eachhutch, one hutch will remain empty. How many rabbits and how manyhutches are there?
It is difficult for students to learn to consider, evaluate, and build onthe thinking of others, especially when their peers are still developingtheir own mathematical understandings. A good setting in which youngstudents can share and analyze one another’s strategies is in solvingarithmetic problems, where students’ invented strategies can becomeobjects of discussion and critique. Students must also learn to questionand probe one another’s thinking in order to clarify underdevelopedideas. Moreover, since not all methods have equal merit, students mustlearn to examine the methods and ideas of others in order to determinetheir strengths and limitations. By carefully listening to, and thinkingabout, the claims made by others, students learn to become criticalthinkers about mathematics.
Use the language of mathematics to expressmathematical ideas precisely
As students articulate their mathematical understanding in the lowergrades, they begin by using everyday, familiar language. This provides abase on which to build a connection to formal mathematical language.Teachers can help students see that some words that are used in every-day language, such as similar, factor, area, or function, are used in mathe-matics with different or more-precise meanings. This observation is thefoundation for understanding the concept of mathematical definitions.It is important to give students experiences that help them appreciatethe power and precision of mathematical language. Beginning in themiddle grades, students should understand the role of mathematical de-finitions and should use them in mathematical work. Doing so shouldbecome pervasive in high school. However, it is important to avoid apremature rush to impose formal mathematical language; students needto develop an appreciation of the need for precise definitions and forthe communicative power of conventional mathematical terms by firstcommunicating in their own words. Allowing students to grapple withtheir ideas and develop their own informal means of expressing themcan be an effective way to foster engagement and ownership.
Technology affords other opportunities and challenges for the devel-opment and analysis of language. The symbols used in a spreadsheetmay be related to, but are not the same as, the algebraic symbols usedgenerally by mathematicians. Students will profit from experiences thatrequire comparisons of standard mathematical expressions with thoseused with popular tools like spreadsheets or calculators.
63Standards for School Mathematics
Num
ber & O
perations | Algebra | G
eometry | M
easurement | D
ata Analysis &
Probability | P
roblem S
olving | Reasoning &
Proof | C
omm
unication | Connections | R
epresentation

ConnectionsWhen students can connect mathematical ideas, their understanding
is deeper and more lasting. They can see mathematical connections inthe rich interplay among mathematical topics, in contexts that relatemathematics to other subjects, and in their own interests and experi-ence. Through instruction that emphasizes the interrelatedness ofmathematical ideas, students not only learn mathematics, they alsolearn about the utility of mathematics.
Mathematics is not a collection of separate strands or standards, eventhough it is often partitioned and presented in this manner. Rather,mathematics is an integrated field of study. Viewing mathematics as awhole highlights the need for studying and thinking about the connec-tions within the discipline, as reflected both within the curriculum of aparticular grade and between grade levels. To emphasize the connections,teachers must know the needs of their students as well as the mathematicsthat the students studied in the preceding grades and what they will studyin the following grades. As the Learning Principle emphasizes, under-standing involves making connections. Teachers should build on students’previous experiences and not repeat what students have already done.This approach requires students to be responsible for what they havelearned and for using that knowledge to understand and make sense ofnew ideas.
Recognize and use connections among mathematicalideas
By emphasizing mathematical connections, teachers can help stu-dents build a disposition to use connections in solving mathematicalproblems, rather than see mathematics as a set of disconnected, isolatedconcepts and skills. This disposition can be fostered through the guid-ing questions that teachers ask, for instance, “How is our work todaywith similar triangles related to the discussion we had last week aboutscale drawings?” Students need to be made explicitly aware of themathematical connections.
The notion that mathematical ideas are connected should permeatethe school mathematics experience at all levels. The mathematical expe-riences of children first entering school have not been separated intocategories, and this integration of mathematics in many contexts shouldcontinue in school. Children can learn to recognize mathematical pat-terns in the rhythms of the songs they sing, identify the hexagonal shapein a honeycomb, and count the number of times they can jump rope suc-cessfully. As students move into grades 3–5, their mathematical activityshould expand into more-abstract contexts. They can begin to see theconnections among arithmetic operations, understanding, for example,how multiplication can be thought of as repeated addition. As they seehow mathematical operations can be used in different contexts, they candevelop an appreciation for the abstraction of mathematics. In grades6–8, students should see mathematics as a discipline of connected ideas.The key mathematical ideas in the middle grades are themselves closelyconnected, and ideas about rational numbers, proportionality, and linearrelationships will pervade much of their mathematical and everyday
64 Principles and Standards for School Mathematics
Rep
rese
ntat
ion
| C
onne
ctio
ns |
Com
mun
icat
ion
| R
easo
ning
& P
roof
| P
robl
em S
olvi
ng |
Dat
a A
naly
sis
& P
roba
bilit
y |
Mea
sure
men
t |
Geo
met
ry |
Alg
ebra
| N
umbe
r &
Ope
ratio
ns
ConnectionsStandard
Instructional programsfrom prekindergarten throughgrade 12 should enable all students to—
• recognize and use connec-tions among mathematicalideas;
• understand how mathe-matical ideas interconnectand build on one another toproduce a coherent whole;
• recognize and apply mathe-matics in contexts outside ofmathematics.

activity. In grades 9–12, students not only learn to expect connectionsbut they learn to take advantage of them, using insights gained in onecontext to solve problems in another.
Throughout the pre-K–12 span, students should routinely ask them-selves, “How is this problem or mathematical topic like things I havestudied before?” From the perspective of connections, new ideas are seenas extensions of previously learned mathematics. Students learn to usewhat they already know to address new situations. Elementary school stu-dents link their knowledge of the subtraction of whole numbers to thesubtraction of decimals or fractions. Middle-grades students recognizeand connect multiple representations of the same mathematical idea, suchas the ratio that represents rate of change and the tilt or slope of a line.High school students connect ideas in algebra and geometry.
Some activities can be especially productive for featuring mathemati-cal connections. For instance, the relationship between the diameterand the circumference of a circle can be studied empirically by collect-ing a variety of circular objects and measuring their circumferences anddiameters. Middle-grades students might collect and graph data for thetwo variables—circumference (C ) and diameter (d ). By doing so, theycan see that all the points lie close to a straight line through (0, 0),which suggests that the ratio of C/d is constant. This activity usuallyleads to an average value for C/d that lies between 3.1 and 3.2—a roughapproximation of π. The problem involves ideas from measurement,data analysis, geometry, algebra, and number.
Understand how mathematical ideas interconnect andbuild on one another to produce a coherent whole
As students progress through their school mathematics experience,their ability to see the same mathematical structure in seemingly differ-ent settings should increase. Prekindergarten through grade 2 studentsrecognize instances of counting, number, and shape; upper elementaryschool students look for instances of arithmetic operations, and middle-grades students look for examples of rational numbers, proportionality,and linear relationships. High school students are ready to look forconnections among the many mathematical ideas they are encounter-ing. For instance, a method for finding the volume of the truncatedsquare pyramid shown at the top of figure 3.7, is suggested by themethod for finding the area of the trapezoid that follows in the figure(Banchoff 1990, pp. 20–22).
As students develop a view of mathematics as a connected and inte-grated whole, they will have less of a tendency to view mathematicalskills and concepts separately. If conceptual understandings are linkedto procedures, students will not perceive mathematics as an arbitrary setof rules. This integration of procedures and concepts should be centralin school mathematics.
Recognize and apply mathematics in contexts outsideof mathematics
School mathematics experiences at all levels should include opportu-nities to learn about mathematics by working on problems arising in
65Standards for School Mathematics
Num
ber & O
perations | Algebra | G
eometry | M
easurement | D
ata Analysis &
Probability | P
roblem S
olving | Reasoning &
Proof | C
omm
unication | Connections | R
epresentation
Fig. 3.7.
Connections between methods forfinding the volume of a truncatedpyramid and for finding the area of atrapezoid
By similarity of triangles,
xx+ h
ab
bx a x h
( ) =
= +( )
Area of small triangle = 12
Area of large triangle = 12
Area of trapezoid =
ax .
b x h+( ).
12
b x h+( ) ax− 12
a
a
b
h
b
x
h
Area of trapezoid =
h a b= +( ).
=12
bx bh ax.+ −12
12
bh ax+ −12
12
12
a x h+( )
contexts outside of mathematics. These connections can be to othersubject areas and disciplines as well as to students’ daily lives. Prekin-dergarten through grade 2 students can learn about mathematics pri-marily through connections with the real world. Students in grades 3–5should learn to apply important mathematical ideas in other subjectareas. This set of ideas expands in grades 6–8, and in grades 9–12 stu-dents should be confidently using mathematics to explain complex ap-plications in the outside world.
The opportunity for students to experience mathematics in a con-text is important. Mathematics is used in science, the social sciences,medicine, and commerce. The link between mathematics and scienceis not only through content but also through process. The processesand content of science can inspire an approach to solving problemsthat applies to the study of mathematics. In the National Science Educa-tion Standards, a yearlong elementary school science activity aboutweather is described (National Research Council 1996, pp. 131–33).The connections to mathematics in this activity are substantial: stu-dents design instruments for measuring weather conditions and planfor how to organize and communicate their data.
Steinberg (1998, p. 97) reports the following incident in whicheleventh-grade students at a high school worked with the CVS Corpo-ration to locate a new pharmacy in a Boston neighborhood:
Although fully aware that the company would probably not relyonly on their calculations in making a monetary decision as towhere to locate a store, the students still felt involved in a realproblem.… Organized into small work teams supported by expertsfrom various departments within the CVS organization, studentsanalyzed demographic and economic data to determine market de-mand for a CVS pharmacy in different neighborhoods. Studentsalso worked with CVS staff to identify and evaluate several possiblelocations for the new store.… Students worked with architects ondesign options for the new store and worked with accountants onfinancing plans.
This project was incorporated into the students’ mathematics andhumanities classes. The students saw the connections of mathematics tothe world of commerce and to other disciplines, and they also saw theconnections within mathematics as they applied knowledge from sev-eral different areas.
Data analysis and statistics are useful in helping students clarify is-sues related to their personal lives. Students in prekindergarten throughgrade 2 who are working on calendar activities can collect data on theweather by recording rainy, cloudy, or sunny days. They can record thedata, count days, generalize about conditions, and make predictions forthe future. Students in grades 3–5 can use the Internet to collaboratewith students in other classrooms to collect and analyze data about acidrain, deforestation, and other phenomena. By grades 9–12, studentsshould be able to use their knowledge of data analysis and mathematicalmodeling to understand societal issues and workplace problems in rea-sonable depth.
The opportunity forstudents to experience
mathematics in acontext is important.
66 Principles and Standards for School Mathematics
Rep
rese
ntat
ion
| C
onne
ctio
ns |
Com
mun
icat
ion
| R
easo
ning
& P
roof
| P
robl
em S
olvi
ng |
Dat
a A
naly
sis
& P
roba
bilit
y |
Mea
sure
men
t |
Geo
met
ry |
Alg
ebra
| N
umbe
r &
Ope
ratio
ns

RepresentationThe ways in which mathematical ideas are represented is fundamen-
tal to how people can understand and use those ideas. Consider howmuch more difficult multiplication is using Roman numerals (for thosewho have not worked extensively with them) than using Arabic base-tennotation. Many of the representations we now take for granted—suchas numbers expressed in base-ten or binary form, fractions, algebraicexpressions and equations, graphs, and spreadsheet displays—are theresult of a process of cultural refinement that took place over manyyears. When students gain access to mathematical representations andthe ideas they represent, they have a set of tools that significantly ex-pand their capacity to think mathematically.
The term representation refers both to process and to product—inother words, to the act of capturing a mathematical concept or relation-ship in some form and to the form itself. The child who wrote her ageas shown in figure 3.8 used a representation. The graph of f (x) = x 3 is arepresentation. Moreover, the term applies to processes and productsthat are observable externally as well as to those that occur “internally,”in the minds of people doing mathematics. All these meanings of repre-sentation are important to consider in school mathematics.
Some forms of representation—such as diagrams, graphical displays,and symbolic expressions—have long been part of school mathematics.Unfortunately, these representations and others have often been taughtand learned as if they were ends in themselves. Representations shouldbe treated as essential elements in supporting students’ understandingof mathematical concepts and relationships; in communicating mathe-matical approaches, arguments, and understandings to one’s self and toothers; in recognizing connections among related mathematical con-cepts; and in applying mathematics to realistic problem situationsthrough modeling. New forms of representation associated with elec-tronic technology create a need for even greater instructional attentionto representation.
Create and use representations to organize, record,and communicate mathematical ideas
Students should understand that written representations of mathe-matical ideas are an essential part of learning and doing mathematics. Itis important to encourage students to represent their ideas in ways thatmake sense to them, even if their first representations are not conven-tional ones. It is also important that they learn conventional forms ofrepresentation to facilitate both their learning of mathematics and theircommunication with others about mathematical ideas.
The fact that representations are such effective tools may obscurehow difficult it was to develop them and, more important, how muchwork it takes to understand them. For instance, base-ten notation is dif-ficult for young children, and the curriculum should allow many oppor-tunities for making connections between students’ emerging under-standing of the counting numbers and the structure of base-tenrepresentation. But as students move through the curriculum, the focustends to be increasingly on presenting the mathematics itself, perhaps
67Standards for School Mathematics
Num
ber & O
perations | Algebra | G
eometry | M
easurement | D
ata Analysis &
Probability | P
roblem S
olving | Reasoning &
Proof | C
omm
unication | Connections | R
epresentation
Fig. 3.8.
A child’s representation of five andone-half
RepresentationStandard
Instructional programsfrom prekindergarten throughgrade 12 should enable all students to—
• create and use representa-tions to organize, record,and communicate mathe-matical ideas;
• select, apply, and translateamong mathematical repre-sentations to solve problems;
• use representations tomodel and interpret physi-cal, social, and mathematicalphenomena.

under the assumption that students who are old enough to think in for-mal terms do not, like their younger counterparts, need to negotiate be-tween their naive conceptions and the mathematical formalisms. Re-search indicates, however, that students at all levels need to work atdeveloping their understandings of the complex ideas captured in con-ventional representations. A representation as seemingly clear as thevariable x can be difficult for students to comprehend.
The idiosyncratic representations constructed by students as theysolve problems and investigate mathematical ideas can play an impor-tant role in helping students understand and solve problems and pro-viding meaningful ways to record a solution method and to describe themethod to others. Teachers can gain valuable insights into students’ways of interpreting and thinking about mathematics by looking attheir representations. They can build bridges from students’ personalrepresentations to more-conventional ones, when appropriate. It is im-portant that students have opportunities not only to learn conventionalforms of representation but also to construct, refine, and use their ownrepresentations as tools to support learning and doing mathematics.
Through the middle grades, children’s mathematical representationsusually are about objects and actions from their direct experience. Pri-mary school students might use objects to represent the number ofwheels on four bicycles or the number of fireflies in a story. They mayrepresent larger numbers of objects using place-value mats or base-tenblocks. In the middle grades, students can begin to create and usemathematical representations for more-abstract objects, such as rationalnumbers, rates, or linear relationships. High school students should useconventional representations as a primary means for expressing and un-derstanding more-abstract mathematical concepts. Through their rep-resentations, they should be ready to see a common structure in mathe-matical phenomena that come from very different contexts.
Representations can help students organize their thinking. Students’use of representations can help make mathematical ideas more concreteand available for reflection. In the lower grades, for example, childrencan use representations to provide a record for their teachers and theirpeers of their efforts to understand mathematics. In the middle grades,they should use representations more to solve problems or to portray,clarify, or extend a mathematical idea. They might, for example, focuson collecting a large amount of data in a weather experiment over anextended time and use a spreadsheet and related graphs to organize andrepresent the data. They might develop an algebraic representation fora real-world relationship (e.g., the number of unit tiles around a rectan-gular pool with dimensions m units by n units where m and n are inte-gers; see fig 3.9) and begin to recognize that symbolic representationsthat appear different can describe the same phenomenon. For instance,the number of tiles in the border of the m × n pool can be expressed as2n + 2m + 4 or as 2(m + 2) + 2n.
Computers and calculators change what students can do with conven-tional representations and expand the set of representations with whichthey can work. For example, students can flip, invert, stretch, and zoomin on graphs using graphing utilities or dynamic geometry software.They can use computer algebra systems to manipulate expressions, andthey can investigate complex data sets using spreadsheets. As studentslearn to use these new, versatile tools, they also can consider ways in
68 Principles and Standards for School Mathematics
Rep
rese
ntat
ion
| C
onne
ctio
ns |
Com
mun
icat
ion
| R
easo
ning
& P
roof
| P
robl
em S
olvi
ng |
Dat
a A
naly
sis
& P
roba
bilit
y |
Mea
sure
men
t |
Geo
met
ry |
Alg
ebra
| N
umbe
r &
Ope
ratio
ns
Fig. 3.9.
Rectangular pool and border
m × n pool

which some representations used in electronic technology differ fromconventional representations. For example, numbers in scientific nota-tion are represented differently in calculators and in textbooks. The al-gebraic expressions on computer algebra systems may look differentfrom those in textbooks.
Select, apply, and translate among mathematicalrepresentations to solve problems
Different representations often illuminate different aspects of a com-plex concept or relationship. For example, students usually learn to rep-resent fractions as sectors of a circle or as pieces of a rectangle or someother figure. Sometimes they use physical displays of pattern blocks orfraction bars that convey the part-whole interpretation of fractions. Suchdisplays can help students see fraction equivalence and the meaning ofthe addition of fractions, especially when the fractions have the same de-nominator and when their sum is less than 1. Yet this form of represen-tation does not convey other interpretations of fraction, such as ratio, in-dicated division, or fraction as number. Other common representationsfor fractions, such as points on a number line or ratios of discrete ele-ments in a set, convey some but not all aspects of the complex fractionconcept. Thus, in order to become deeply knowledgeable about frac-tions—and many other concepts in school mathematics—students willneed a variety of representations that support their understanding.
The importance of using multiple representations should be empha-sized throughout students’ mathematical education. For example, aprekindergarten through grade 2 student should know how to representthree groups of four through repeated addition, skip-counting, or anarray of objects. Primary-grades students begin to see how some repre-sentations make it easier to understand some properties. Using the ar-rays in figure 3.10, a teacher could make commutativity visible.
In grades 3–5, students’ repertoires of representations should expandto include more-complex pictures, tables, graphs, and words to modelproblems and situations. For middle-grades students, representationsare useful in developing ideas about algebra. As students become math-ematically sophisticated, they develop an increasingly large repertoireof mathematical representations as well as a knowledge of how to usethem productively. Such knowledge includes choosing and moving be-tween representations and learning to ask such questions as, Would agraph give me more insight than a symbolic expression to solve thisproblem?
One of the powerful aspects of mathematics is its use of abstraction—the stripping away by symbolization of some features of a problem thatare not necessary for analysis, allowing the “naked symbols” to be oper-ated on easily. In many ways, this fact lies behind the power of mathe-matical applications and modeling. Consider this problem:
From a ship on the sea at night, the captain can see three lighthouses andcan measure the angles between them. If the captain knows the positionof the lighthouses from a map, can the captain determine the position ofthe ship?
When the problem is translated into a mathematical representation,the ship and the lighthouses become points in the plane, and the problem
69Standards for School Mathematics
Num
ber & O
perations | Algebra | G
eometry | M
easurement | D
ata Analysis &
Probability | P
roblem S
olving | Reasoning &
Proof | C
omm
unication | Connections | R
epresentation
Fig. 3.10.
These arrays can help teachers ex-plain commutativity.
4 × 3
3 × 4

can be solved without knowing that it is about ships. Many other prob-lems from different contexts may have similar representations. As soon asthe problem is represented in some form, the classic solution methods forthat mathematical form may be used to solve the problem.
Technological tools now offer opportunities for students to havemore and different experiences with the use of multiple representations.For instance, in prekindergarten through grade 2, teachers and studentscan work with on-screen versions of concrete manipulatives, getting ac-curacy and immediate feedback. Later on, dynamic geometry tools canbe used for generating conjectures. Several software packages allow stu-dents to view a function simultaneously in tabular, graphical, and equa-tion form. Such software can allow students to examine how certainchanges in one representation, such as varying a parameter in the equa-tion ax 2 + bx + c = 0, simultaneously affect the other representations.Computer and calculator simulations can be used to investigate physicalphenomena, such as motion.
As students’ representational repertoire expands, it is important forstudents to reflect on their use of representations to develop an under-standing of the relative strengths and weaknesses of various representa-tions for different purposes. For example, when students learn differentrepresentational forms for displaying statistical data, they need oppor-tunities to consider the kinds of data and questions for which a circlegraph might be more appropriate than a line graph or a box-and-whiskers plot more appropriate than a histogram.
Use representations to model and interpret physical,social, and mathematical phenomena
The term model has many different meanings. So it is not surprisingthat the word is used in many different ways in discussions aboutmathematics education. For example, model is used to refer to physicalmaterials with which students work in school—manipulative models.The term is also used to suggest exemplification or simulation, as inwhen a teacher models the problem-solving process for her students.Yet another usage treats the term as if it were roughly synonymous withrepresentation. The term mathematical model, which is the focus in thiscontext, means a mathematical representation of the elements and rela-tionships in an idealized version of a complex phenomenon. Mathemat-ical models can be used to clarify and interpret the phenomenon and tosolve problems.
In some activities, models allow a view of a real-world phenomenon,such as the flow of traffic, through an analytic structure imposed on it.An example of a general question to be explored might be, How longshould a traffic light stay green to let a reasonable number of cars flowthrough the intersection? Students can gather data about how long (onaverage) it takes the first car to go through, the second car, and so on.They can represent these data statistically, or they can construct ana-lytic functions to work on the problem in the abstract, considering thewait time before a car starts moving, how long it takes a car to get up toregular traffic speed, and so on.
Technological tools now allow students to explore iterative modelsfor situations that were once studied in much more advanced courses.For example, it is now possible for students in grades 9–12 to model
Models allow a view ofa real-world
phenomenon.
70 Principles and Standards for School Mathematics
Rep
rese
ntat
ion
| C
onne
ctio
ns |
Com
mun
icat
ion
| R
easo
ning
& P
roof
| P
robl
em S
olvi
ng |
Dat
a A
naly
sis
& P
roba
bilit
y |
Mea
sure
men
t |
Geo
met
ry |
Alg
ebra
| N
umbe
r &
Ope
ratio
ns

Students’ use ofrepresentations to modelphysical, social, andmathematicalphenomena should growthrough the years.
predator-prey relations. The initial set-up might be that a particularhabitat houses so many wolves and so many rabbits, which are thewolves’ primary food source. When the wolves are well fed, theyreproduce well (and more wolves eat more rabbits); when the wolvesare starved, they die off. The rabbits multiply readily when wolves arescarce but lose numbers rapidly when the wolf population is large.Modeling software that uses difference equations allows students toenter initial conditions and the rules for change and then see whathappens to the system dynamically.
Students’ use of representations to model physical, social, and math-ematical phenomena should grow through the years. In prekinder-garten through grade 2, students can model distributing 24 cookiesamong 8 children, using tiles or blocks in a variety of ways. As studentscontinue to encounter representations in grades 3–5, they begin to usethem to model phenomena in the world around them and to aid themin noticing quantitative patterns. As middle-grades students model andsolve problems that arise in the real and mathematical worlds, theylearn to use variables to represent unknowns and also learn to employequations, tables, and graphs to represent and analyze relationships.High school students create and interpret models of phenomenadrawn from a wider range of contexts—including physical and socialenvironments—by identifying essential elements of the context and bydevising representations that capture mathematical relationshipsamong those elements. With electronic technologies, students can userepresentations for problems and methods that until recently were dif-ficult to explore meaningfully in high school. Iterative numericalmethods, for example, can be used to develop an intuitive concept oflimit and its applications. The asymptotic behavior of functions ismore easily understood graphically, as are the effects of transforma-tions on functions. These tools and understandings give students ac-cess to models that can be used to analyze a greatly expanded range ofrealistic and interesting situations.
71Standards for School Mathematics
Num
ber & O
perations | Algebra | G
eometry | M
easurement | D
ata Analysis &
Probability | P
roblem S
olving | Reasoning &
Proof | C
omm
unication | Connections | R
epresentation

Throughout the early years,
the Standards recommended
here can help parents and
educators give children a
solid affective and cognitive
foundation in mathematics.

During the years from birth to age four, much important mathematicaldevelopment occurs in young children. Whether they are cared for by fam-ily members during their preschool years or receive care from persons out-side their families, all children need their innate desire for learning to benurtured and supported. In kindergarten through grade 2, considerationssuch as high-quality educational settings and experiences become para-mount. Throughout the early years, the Standards and specific expectationsfor mathematics learning recommended here can help parents and educa-tors give children a solid affective and cognitive foundation in mathematics.
Mathematics for the Youngest LearnerThe foundation for children’s mathematical development is established
in the earliest years. Mathematics learning builds on the curiosity and en-thusiasm of children and grows naturally from their experiences. Mathe-matics at this age, if appropriately connected to a child’s world, is morethan “getting ready” for school or accelerating them into elementary arith-metic. Appropriate mathematical experiences challenge young children toexplore ideas related to patterns, shapes, numbers, and space with increas-ing sophistication.
The principle that all children can learn mathematics applies to all ages.Many mathematics concepts, at least in their intuitive beginnings, develop be-fore school. For instance, infants spontaneously recognize and discriminatesmall numbers of objects (Starkey and Cooper 1980). Before they enterschool, many children possess a substantive informal knowledge of mathe-matics. They use mathematical ideas in everyday life and develop mathemati-cal knowledge that can be quite complex and sophisticated (Baroody 1992;
73
Standards for Grades Pre-K–2
4Chapter

Clements et al. 1999; Gelman 1994; Ginsburg, Klein, and Starkey 1998).Children’s long-term success in learning and development requires high-quality experiences during the “years of promise” (Carnegie Corporation1999). Adults can foster children’s mathematical development by provid-ing environments rich in language, where thinking is encouraged, unique-ness is valued, and exploration is supported. Play is children’s work. Adultssupport young children’s diligence and mathematical development whenthey direct attention to the mathematics children use in their play, chal-lenge them to solve problems, and encourage their persistence.
Children learn through exploring their world; thus, interests andeveryday activities are natural vehicles for developing mathematicalthinking. When a parent places crackers in a toddler’s hands and says,“Here are two crackers—one, two,” or when a three-year-old chooseshow she wants her sandwich cut—into pieces shaped like triangles, rec-tangles, or small squares—mathematical thinking is occurring. As achild arranges stuffed animals by size, an adult might ask, “Which ani-mal is the smallest?” When children recognize a stop sign by focusingon the octagonal shape, adults have an opportunity to talk about differ-ent shapes in the environment. Through careful observation, conversa-tions, and guidance, adults can help children make connections betweenthe mathematics in familiar situations and new ones.
Because young children develop a disposition for mathematics fromtheir early experiences, opportunities for learning should be positive andsupportive. Children must learn to trust their own abilities to make senseof mathematics. Mathematical foundations are laid as playmates createstreets and buildings in the sand or make playhouses with empty boxes.Mathematical ideas grow as children count steps across the room or sortcollections of rocks and other treasures. They learn mathematical con-cepts through everyday activities: sorting (putting toys or groceries away),reasoning (comparing and building with blocks), representing (drawingto record ideas), recognizing patterns (talking about daily routines, re-peating nursery rhymes, and reading predictable books), following direc-tions (singing motion songs such as “Hokey Pokey”), and using spatialvisualization (working puzzles). Using objects, role-playing, drawing,and counting, children show what they know.
Children must learnto trust their own
abilities to make senseof mathematics.
74 Principles and Standards for School Mathematics

“Informal” does notmean unplanned orhaphazard.
High-quality learning results from formal and informal experiencesduring the preschool years. “Informal” does not mean unplanned orhaphazard. Since the most powerful mathematics learning for pre-schoolers often results from their explorations with problems and mate-rials that interest them, adults should take advantage of opportunities tomonitor and influence how children spend their time. Adults can pro-vide access to books and stories with numbers and patterns; to musicwith actions and directions such as up, down, in, and out; or to gamesthat involve rules and taking turns. All these activities help childrenunderstand a range of mathematical ideas. Children need things tocount, sort, compare, match, put together, and take apart.
Children need introductions to the language and conventions ofmathematics, at the same time maintaining a connection to their infor-mal knowledge and language. They should hear mathematical languagebeing used in meaningful contexts. For example, a parent may ask achild to get the same number of forks as spoons; or a sibling may betaller than they are, but the same sibling may be shorter than the girlnext door. Young children need to learn words for comparing and forindicating position and direction at the same time they are developingan understanding of counting and number words.
Children are likely to enter formal school settings with various levels ofmathematics understanding. However, “not knowing” more often reflectsa lack of opportunity to learn than an inability to learn. Some children willneed additional support so that they do not start school at a disadvantage.They should be identified with appropriate assessments that are adaptedto the needs and characteristics of young children. Interviews and observa-tions, for example, are more appropriate assessment techniques thangroup tests, which often do not yield complete data. Early assessmentsshould be used to gain information for teaching and for potential early in-terventions rather than for sorting children. Pediatricians and otherhealth-care providers often recognize indicators of early learning difficul-ties and can suggest community resources to address these challenges.
Mathematics Education in Prekindergarten throughGrade 2
Like the years from birth to formal schooling, prekindergartenthrough grade 2 (pre-K–2) is a time of profound developmental changefor young students. At no other time in schooling is cognitive growthso remarkable. Because young students are served in many different educational settings and begin educational programs at various ages, werefer to children at this level as students to denote their enrollment informal educational programs. Teachers of young students—includingparents and other caregivers—need to be knowledgeable about themany ways students learn mathematics, and they need to have high expectations for what can be learned during these early years.
Most students enter school confident in their own abilities, and theyare curious and eager to learn more about numbers and mathematicalobjects. They make sense of the world by reasoning and problem solv-ing, and teachers must recognize that young students can think in so-phisticated ways. Young students are active, resourceful individuals whoconstruct, modify, and integrate ideas by interacting with the physicalworld and with peers and adults. They make connections that clarify and
75Standards for Pre-K–2: Introduction

extend their knowledge, thus adding new meaning to past experiences.They learn by talking about what they are thinking and doing and bycollaborating and sharing their ideas. Students’ abilities to communicatethrough language, pictures, and other symbolic means develop rapidlyduring these years. Although students’ ways of knowing, representing,and communicating may be different from those of adults, by the end ofgrade 2, students should be using many conventional mathematical rep-resentations with understanding.
It is especially important in the early years for every child to develop asolid mathematical foundation. Children’s efforts and their confidencethat mathematics learning is within their reach must be supported.Young students are building beliefs about what mathematics is, aboutwhat it means to know and do mathematics, and about themselves asmathematics learners. These beliefs influence their thinking, perfor-mance, attitudes, and decisions about studying mathematics in lateryears (Kamii 2000). Therefore, it is imperative to provide all studentswith high-quality programs that include significant mathematics pre-sented in a manner that respects both the mathematics and the nature ofyoung children. These programs should build on and extend students’intuitive and informal mathematics knowledge. They should begrounded in a knowledge of child development and take place in envi-ronments that encourage students to be active learners and accept newchallenges. They should develop a strong conceptual framework whileencouraging and developing students’ skills and their natural inclinationto solve problems. Number activities oriented toward problem solvingcan be successful even with very young children and can develop notonly counting and number abilities but also such reasoning abilities asclassifying and ordering (Clements 1984). Recent research has con-firmed that an appropriate curriculum strengthens the development ofyoung students’ knowledge of number and geometry (Griffin and Case1997; Klein, Starkey, and Wakeley 1999; Razel and Eylon 1991).
Mathematics teaching in the lower grades should encourage stu-dents’ strategies and build on them as ways of developing more-generalideas and systematic approaches. By asking questions that lead to clari-fications, extensions, and the development of new understandings,teachers can facilitate students’ mathematics learning. Teachers shouldensure that interesting problems and stimulating mathematical conver-sations are a part of each day. They should honor individual students’thinking and reasoning and use formative assessment to plan instruc-tion that enables students to connect new mathematics learning withwhat they know. Schools should furnish materials that allow students tocontinue to learn mathematics through counting, measuring, construct-ing with blocks and clay, playing games and doing puzzles, listening tostories, and engaging in dramatic play, music, and art.
In prekindergarten through grade 2, mathematical concepts developat different times and rates for each child. If students are to attain themathematical goals described in Principles and Standards for SchoolMathematics, their mathematics education must include much morethan short-term learning of rote procedures. All students need adequatetime and opportunity to develop, construct, test, and reflect on their in-creasing understanding of mathematics. Early education must build onthe principle that all students can learn significant mathematics. Alongwith their expectations for students, teachers should also set equally
Early education mustbuild on the principlethat all students can
learn significantmathematics.
76 Principles and Standards for School Mathematics

Students shouldrecognize when using acalculator is appropriate.
high standards for themselves, seeking, if necessary, the new knowledgeand skills they need to guide and nurture all students. School leadersand teachers must take the responsibility for supporting learning so thatall students leave grade 2 confident and competent in the mathematicsdescribed for this grade band.
The ten Standards presented in this document are not separate top-ics for study but are carefully interwoven strands designed to supportthe learning of connected mathematical ideas. At the core of mathe-matics in the early years are the Number and Geometry Standards.Numbers and their relationships, operations, place value, and attrib-utes of shapes are examples of important ideas from these standards.Each of the other mathematical Content Standards, including Alge-bra, Measurement, and Data Analysis and Probability, contribute to,and is learned in conjunction with, the Number and Geometry Stan-dards. The Process Standards of Problem Solving, Reasoning andProof, Communication, Connections, and Representation support thelearning of, and are developed through, the Content Standards. Andlearning content involves learning and using mathematics processes.
The mathematics program in prekindergarten through grade 2should take advantage of technology. Guided work with calculators canenable students to explore number and pattern, focus on problem-solving processes, and investigate realistic applications. Through theirexperiences and with the teacher’s guidance, students should recognizewhen using a calculator is appropriate and when it is more efficient tocompute mentally. Computers also can make powerful and uniquecontributions to students’ learning by providing feedback and connec-tions between representations. They benefit all students and are espe-cially helpful for learners with physical limitations or those who inter-act more comfortably with technology than with classmates (Clements1999a; Wright and Shade 1994).
Young students frequently possess greater knowledge than they areable to express in writing. Teachers need to determine what students al-ready know and what they still have to learn. Information from a widevariety of classroom assessments—classroom routines, conversations,written work (including pictures), and observations—helps teachersplan meaningful tasks that offer support for students whose understand-ings are not yet complete and helps teachers challenge students who areready to grapple with new problems and ideas. Teachers must maintaina balance, helping students develop both conceptual understanding andprocedural facility (skill). Students’ development of number senseshould move through increasingly sophisticated levels of constructingideas and skills, of recognizing and using relationships to solve prob-lems, and of connecting new learning with old. As discussed in theLearning Principle (chapter 2), skills are most effectively acquired whenunderstanding is the foundation for learning.
Mathematics learning for students at this level must be active, rich innatural and mathematical language, and filled with thought-provokingopportunities. Students respond to the challenge of high expectations,and mathematics should be taught for understanding rather thanaround preconceptions about children’s limitations. This does not meanabandoning children’s ways of knowing and representing; rather, it is aclear call to create opportunities for young students to learn new, im-portant mathematics in ways that make sense to them.
77Standards for Pre-K–2: Introduction

In prekindergarten through grade 2 all students should—
• count with understanding and recognize “how many” in sets of objects;• use multiple models to develop initial understandings of place value and
the base-ten number system;• develop understanding of the relative position and magnitude of whole
numbers and of ordinal and cardinal numbers and their connections;• develop a sense of whole numbers and represent and use them in flexible
ways, including relating, composing, and decomposing numbers;• connect number words and numerals to the quantities they represent,
using various physical models and representations;• understand and represent commonly used fractions, such as 1/4, 1/3, and
1/2.
• understand various meanings of addition and subtraction of wholenumbers and the relationship between the two operations;
• understand the effects of adding and subtracting whole numbers;• understand situations that entail multiplication and division, such as equal
groupings of objects and sharing equally.
• develop and use strategies for whole-number computations, with a focuson addition and subtraction;
• develop fluency with basic number combinations for addition andsubtraction;
• use a variety of methods and tools to compute, including objects, mentalcomputation, estimation, paper and pencil, and calculators.
Instructional programs fromprekindergarten through grade 12should enable all students to—
Understand numbers, ways ofrepresenting numbers, relation-ships among numbers, and numbersystems
Understand meanings of operationsand how they relate to one another
Compute fluently and make rea-sonable estimates
Pre-K–2Standard
for Grades
Expectations
Number and Operations
78 Principles and Standards for School Mathematics

Teachers should notunderestimate whatyoung students canlearn.
Number and OperationsThe concepts and skills related to number and operations are a major
emphasis of mathematics instruction in prekindergarten through grade 2.Over this span, the small child who holds up two fingers in response tothe question “How many is two?” grows to become the second graderwho solves sophisticated problems using multidigit computation strate-gies. In these years, children’s understanding of number develops signif-icantly. Children come to school with rich and varied informal knowl-edge of number (Baroody 1992; Fuson 1988; Gelman 1994). Duringthe early years teachers must help students strengthen their sense ofnumber, moving from the initial development of basic counting tech-niques to more-sophisticated understandings of the size of numbers,number relationships, patterns, operations, and place value.
Students’ work with numbers should be connected to their work withother mathematics topics. For example, computational fluency (havingand using efficient and accurate methods for computing) can both en-able and be enabled by students’ investigations of data; a knowledge ofpatterns supports the development of skip-counting and algebraicthinking; and experiences with shape, space, and number help studentsdevelop estimation skills related to quantity and size.
As they work with numbers, students should develop efficient and ac-curate strategies that they understand, whether they are learning thebasic addition and subtraction number combinations or computing withmultidigit numbers. They should explore numbers into the hundredsand solve problems with a particular focus on two-digit numbers. Al-though good judgment must be used about which numbers are impor-tant for students of a certain age to work with, teachers should be carefulnot to underestimate what young students can learn about number. Stu-dents are often surprisingly adept when they encounter numbers, evenlarge numbers, in problem contexts. Therefore, teachers should regu-larly encourage students to demonstrate and deepen their understandingof numbers and operations by solving interesting, contextualized prob-lems and by discussing the representations and strategies they use.
Understand numbers, ways of representing numbers,relationships among numbers, and number systems
Counting is a foundation for students’ early work with number. Youngchildren are motivated to count everything from the treats they eat to thestairs they climb, and through their repeated experience with the count-ing process, they learn many fundamental number concepts. They can associate number words with small collections of objects and graduallylearn to count and keep track of objects in larger groups. They can estab-lish one-to-one correspondence by moving, touching, or pointing to objects as they say the number words. They should learn that countingobjects in a different order does not alter the result, and they may noticethat the next whole number in the counting sequence is one more thanthe number just named. Children should learn that the last numbernamed represents the last object as well as the total number of objects inthe collection. They often solve addition and subtraction problems bycounting concrete objects, and many children invent problem-solving
79Standards for Pre-K–2: Number and Operations
Num
ber & O
perations | Algebra | G
eometry | M
easurement | D
ata Analysis &
Probability | P
roblem S
olving | Reasoning &
Proof | C
omm
unication | Connections | R
epresentation

strategies based on counting strategies (Ginsburg, Klein, and Starkey1998; Siegler 1996).
Throughout the early years, teachers should regularly give studentsvaried opportunities to continue to develop, use, and practice countingas they quantify collections of objects, measure attributes of shapes,identify locations, and solve problems. Preschool and kindergartenteachers, for example, should use naturally occurring opportunities tohelp students develop number concepts by posing questions such as,How many pencils do we need at this table? Shall we count how manysteps to the playground? Who is third in line? Students often use differ-ent approaches when dealing with smaller numbers versus larger num-bers. They may look at a small group of objects (about six items orfewer) and recognize “how many,” but they may need to count a groupof ten or twelve objects to find a total. The ability to recognize at aglance small groups within a larger group supports the development ofvisually grouping objects as a strategy for estimating quantities.
In these early years, students develop the ability to deal with num-bers mentally and to think about numbers without having a physicalmodel (Steffe and Cobb 1988). Some students will develop this capacitybefore entering school, and others will acquire it during their earlyschool years. Thus, in a first-grade class where students are asked to tellhow many blocks are hidden when the total number, say, seven, isknown but some, say, three, are covered, students will vary in how theydeal with the covered blocks. Some may be able to note that there arefour visible blocks and then count up from there, saying, “Five, six,seven. There are three hidden!” But others may not be able to answerthe question unless they see all the objects; they may need to uncoverand point at or touch the blocks as they count them.
As students work with numbers, they gradually develop flexibility inthinking about numbers, which is a hallmark of number sense. Studentsmay model twenty-five with beans and bean sticks or with two dimes anda nickel, or they may say that it is 2 tens and 5 ones, five more thantwenty, or halfway between twenty and thirty. Number sense develops asstudents understand the size of numbers, develop multiple ways of think-ing about and representing numbers, use numbers as referents, and de-velop accurate perceptions about the effects of operations on numbers(Sowder 1992). Young students can use number sense to reason withnumbers in complex ways. For example, they may estimate the number ofcubes they can hold in one hand by referring to the number of cubes thattheir teacher can hold in one hand. Or if asked whether four plus three ismore or less than ten, they may recognize that the sum is less than tenbecause both numbers are less than five and five plus five makes ten.
Concrete models can help students represent numbers and developnumber sense; they can also help bring meaning to students’ use ofwritten symbols and can be useful in building place-value concepts. Butusing materials, especially in a rote manner, does not ensure under-standing. Teachers should try to uncover students’ thinking as theywork with concrete materials by asking questions that elicit students’thinking and reasoning. In this way, teachers can watch for students’misconceptions, such as interpreting the 2 tens and 3 ones in figure 4.1cmerely as five objects. Teachers should also choose interesting tasks thatengage students in mathematical thinking and reasoning, which buildstheir understanding of numbers and relationships among numbers.
Flexibility in thinkingabout numbers … is a
hallmark of numbersense.
80 Principles and Standards for School Mathematics
Rep
rese
ntat
ion
| C
onne
ctio
ns |
Com
mun
icat
ion
| R
easo
ning
& P
roof
| P
robl
em S
olvi
ng |
Dat
a A
naly
sis
& P
roba
bilit
y |
Mea
sure
men
t |
Geo
met
ry |
Alg
ebra
| N
umbe
r &
Ope
ratio
ns

Using materials,especially in a rotemanner, does not ensureunderstanding.
It is absolutely essential that students develop a solid understandingof the base-ten numeration system and place-value concepts by theend of grade 2. Students need many instructional experiences to de-velop their understanding of the system, including how numbers arewritten. They should understand, for example, that multiples of 10provide bridges when counting (e.g., 38, 39, 40, 41) and that “10” is aspecial unit within the base-ten system. They should recognize thatthe word ten may represent a single entity (1 ten) and, at the sametime, ten separate units (10 ones) and that these representations areinterchangeable (Cobb and Wheatley 1988). Using concrete materialscan help students learn to group and ungroup by tens. For example,such materials can help students express “23” as 23 ones (units), 1 tenand 13 ones, or 2 tens and 3 ones (see fig. 4.1). Of course, studentsshould also note the ways in which using concrete materials to repre-sent a number differs from using conventional notation. For example,when the numeral for the collection shown in figure 4.1 is written,the arrangement of digits matters—the digit for the tens must bewritten to the left of the digit for the units. In contrast, when base-tenblocks or connecting cubes are used, the value is not affected by thearrangement of the blocks.
Technology can help students develop number sense, and it may beespecially helpful for those with special needs. For example, studentswho may be uncomfortable interacting with groups or who may not bephysically able to represent numbers and display corresponding sym-bols can use computer manipulatives. The computer simultaneouslylinks the student’s actions with symbols. When the block arrangementis changed, the number displayed is automatically changed. As withconnecting cubes, students can break computer base-ten blocks intoones or join ones together to form tens.
Place-value concepts can be developed and reinforced using calcu-lators. For example, students can observe values displayed on a calcula-tor and focus on which digits are changing. If students add 1 repeat-edly on a calculator, they can observe that the units digit changes everytime, but the tens digit changes less frequently. Through classroomconversations about such activities and patterns, teachers can helpfocus students’ attention on important place-value ideas. Figure 4.2shows another example—a challenging calculator activity for secondgraders—that could be used to strengthen students’ understanding of
81Standards for Pre-K–2: Number and Operations
Num
ber & O
perations | Algebra | G
eometry | M
easurement | D
ata Analysis &
Probability | P
roblem S
olving | Reasoning &
Proof | C
omm
unication | Connections | R
epresentation
23 ones 1 ten and 13 ones 2 tens and 3 ones
(a) (b) (c)
Fig. 4.1.
Different ways of representing 23

place value. In this activity, students begin at one number and add orsubtract to reach a target number. Since they are not limited in whatthey can add or subtract, activities like this allow them to use variousapproaches to reach the target numbers. They can decide whether toadd or subtract ones or multiples of 10 or how they might use multiplesteps to arrive at the target. By having students share and discuss thedifferent strategies employed by members of a class, a teacher canhighlight the ways in which students use place-value concepts in theirstrategies.
Students also develop understanding of place value through thestrategies they invent to compute (Fuson et al. 1997). Thus, it is not nec-essary to wait for students to fully develop place-value understandingsbefore giving them opportunities to solve problems with two- and three-digit numbers. When such problems arise in interesting contexts, stu-dents can often invent ways to solve them that incorporate and deepentheir understanding of place value, especially when students have oppor-tunities to discuss and explain their invented strategies and approaches.Teachers emphasize place value by asking appropriate questions andchoosing problems such as finding ten more than or ten less than anumber and helping them contrast the answers with the initial number.As a result of regular experiences with problems that develop place-valueconcepts, second-grade students should be counting into the hundreds,discovering patterns in the numeration system related to place value, andcomposing (creating through different combinations) and decomposing(breaking apart in different ways) two- and three-digit numbers.
In addition to work with whole numbers, young students should alsohave some experience with simple fractions through connections toeveryday situations and meaningful problems, starting with the com-mon fractions expressed in the language they bring to the classroom,such as “half.” At this level, it is more important for students to recog-nize when things are divided into equal parts than to focus on fractionnotation. Second graders should be able to identify three parts out offour equal parts, or three-fourths of a folded paper that has beenshaded, and to understand that “fourths” means four equal parts of awhole. Although fractions are not a topic for major emphasis for
Students also developunderstanding of place
value through thestrategies they invent to
compute.
82 Principles and Standards for School Mathematics
Rep
rese
ntat
ion
| C
onne
ctio
ns |
Com
mun
icat
ion
| R
easo
ning
& P
roof
| P
robl
em S
olvi
ng |
Dat
a A
naly
sis
& P
roba
bilit
y |
Mea
sure
men
t |
Geo
met
ry |
Alg
ebra
| N
umbe
r &
Ope
ratio
ns
Fig. 4.2.
A calculator activity to help developunderstanding of place value
Make a New Number
Use a calculator.Start with 78. Do not press clear. Make the next number:
What numbers did youadd or subtract?
98
48
18
118
119
Next make

Teachers should helpstudents recognize thatsolving one kind ofproblem is related tosolving another kind.
pre-K–2 students, informal experiences at this age will help develop afoundation for deeper learning in higher grades.
Understand meanings of operations and how theyrelate to one another
As students in the early grades work with complex tasks in a variety ofcontexts, they also build an understanding of operations on numbers. Ap-propriate contexts can arise through student-initiated activities, teacher-created stories, and in many other ways. As students explain their writtenwork, solutions, and mental processes, teachers gain insight into theirstudents’ thinking. See the “Communication” section of this chapter for amore general discussion of these issues and more examples related to thedevelopment of students’ understanding of number and operations.
An understanding of addition and subtraction can be generated whenyoung students solve “joining” and take-away problems by directlymodeling the situation or by using counting strategies, such as countingon or counting back (Carpenter and Moser 1984). Students developfurther understandings of addition when they solve missing-addendproblems that arise from stories or real situations. Further understand-ings of subtraction are conveyed by situations in which two collectionsneed to be made equal or one collection needs to be made a desiredsize. Some problems, such as “Carlos had three cookies. María gavehim some more, and now he has eight. How many did she give him?”can help students see the relationship between addition and subtraction.As they build an understanding of addition and subtraction of wholenumbers, students also develop a repertoire of representations. Formore discussion, see the section on “Representation” in this chapter.
In developing the meaning of operations, teachers should ensure thatstudents repeatedly encounter situations in which the same numbersappear in different contexts. For example, the numbers 3, 4, and 7 mayappear in problem-solving situations that could be represented by 4 + 3,or 3 + 4, or 7 – 3, or 7 – 4. Although different students may initially usequite different ways of thinking to solve problems, teachers should helpstudents recognize that solving one kind of problem is related to solv-ing another kind. Recognizing the inverse relationship between addi-tion and subtraction can allow students to be flexible in using strategiesto solve problems. For example, suppose a student solves the problem27 + � = 36 by starting at 27 and counting up to 36, keeping track ofthe 9 counts. Then, if the student is asked to solve 36 – 9 = � , he maysay immediately, “27.” If asked how he knows, he might respond, “Be-cause we just did it.” This student understands that 27 and 9 are num-bers in their own right, as well as two parts that make up the whole, 36.He also understands that subtraction is the inverse of addition (Steffeand Cobb 1988). Another student, one who does not use the relation-ship between addition and subtraction, might try to solve the problemby counting back 9 units from 36, which is a much more difficult strat-egy to apply correctly.
In developing the meaning of addition and subtraction with wholenumbers, students should also encounter the properties of operations,such as the commutativity and associativity of addition. Although somestudents discover and use properties of operations naturally, teachers can
83Standards for Pre-K–2: Number and Operations
Num
ber & O
perations | Algebra | G
eometry | M
easurement | D
ata Analysis &
Probability | P
roblem S
olving | Reasoning &
Proof | C
omm
unication | Connections | R
epresentation

bring these properties to the forefront through class discussions. For ex-ample, 6 + 9 + 4 may be easier to solve as 6 + 4 + 9, allowing students toadd 6 and 4 to get 10 and 10 and 9 to get 19. Students notice that addingand subtracting the same number in a computation is equivalent toadding 0. For instance, 40 – 10 + 10 = 40 + 0 = 40. Some students recog-nize that equivalent quantities can be substituted: 8 + 7 = 8 + 2 + 5 be-cause 7 = 2 + 5. They may realize that adding the same number (e.g.,100) to both terms of a difference (e.g., 50 – 10 = 40) does not changethe result (150 – 110 = 40). The use of these properties is a sign of youngstudents’ growing number sense. Different students, however, need dif-ferent amounts of time to make these properties their own. What somestudents learn in one year may take two or more years for others.
In prekindergarten through grade 2, students should also begin todevelop an understanding of the concepts of multiplication and divi-sion. Through work in situations involving equal subgroups within acollection, students can associate multiplication with the repeated join-ing (addition) of groups of equal size. Similarly, they can investigate di-vision with real objects and through story problems, usually ones in-volving the distribution of equal shares. The strategies used to solvesuch problems—the repeated joining of, and partitioning into, equalsubgroups—thus become closely associated with the meaning of multi-plication and division, respectively.
Compute fluently and make reasonable estimatesYoung children often initially compute by using objects and count-
ing; however, prekindergarten through grade 2 teachers need to en-courage them to shift, over time, to solving many computation prob-lems mentally or with paper and pencil to record their thinking.Students should develop strategies for knowing basic number combina-tions (the single-digit addition pairs and their counterparts for subtrac-tion) that build on their thinking about, and understanding of, num-bers. Fluency with basic addition and subtraction number combinationsis a goal for the pre-K–2 years. By fluency we mean that students areable to compute efficiently and accurately with single-digit numbers.Teachers can help students increase their understanding and skill in single-digit addition and subtraction by providing tasks that (a) helpthem develop the relationships within subtraction and addition combi-nations and (b) elicit counting on for addition and counting up for sub-traction and unknown-addend situations.
Teachers should also encourage students to share the strategies theydevelop in class discussions. Students can develop and refine strategies asthey hear other students’ descriptions of their thinking about numbercombinations. For example, a student might compute 8 + 7 by countingon from 8: “…, 9, 10, 11, 12, 13, 14, 15.” But during a class discussion ofsolutions for this problem, she might hear another student’s strategy, inwhich he uses knowledge about 10; namely, 8 and 2 make 10, and 5 moreis 15. She may then be able to adapt and apply this strategy later whenshe computes 28 + 7 by saying, “28 and 2 make 30, and 5 more is 35.”
Students learn basic number combinations and develop strategies forcomputing that make sense to them when they solve problems with in-teresting and challenging contexts. Through class discussions, they cancompare the ease of use and ease of explanation of various strategies. In
Different studentsneed different amounts
of time.
84 Principles and Standards for School Mathematics
Rep
rese
ntat
ion
| C
onne
ctio
ns |
Com
mun
icat
ion
| R
easo
ning
& P
roof
| P
robl
em S
olvi
ng |
Dat
a A
naly
sis
& P
roba
bilit
y |
Mea
sure
men
t |
Geo
met
ry |
Alg
ebra
| N
umbe
r &
Ope
ratio
ns

some cases, their strategies for computing will be close to conventionalalgorithms; in other cases, they will be quite different. Many times, stu-dents’ invented approaches are based on a sound understanding ofnumbers and operations, and they can often be used efficiently and ac-curately. Some sense of the diversity of approaches students use can beseen in figure 4.3, which shows the ways several students in the samesecond-grade class computed 25 + 37. Students 1 and 2 have repre-sented their thinking fairly completely, the first with words and the sec-ond with tallies. Both demonstrate an understanding of the meaning ofthe numbers involved. Students 3 and 4 have each used a process thatresulted in an accurate answer, but the thinking that underlies theprocess is not as apparent in their recordings. Students 5 and 6 both illustrate a common source of error—treating the digits in ways that donot reflect their place value and thus generating an unreasonable result.
During a class discussion, other students reported strategies based oncomposing and decomposing numbers. One student started with 37 andused the fact that 25 could be decomposed into 20 plus 3 plus 2 to solvethe problem as follows: 37 + 20 = 57, 57 + 3 = 60, and 60 + 2 = 62. An-other student used flexible composing and decomposing in other waysto create an equivalent, easier problem: Take 3 from 25 and use it toturn 37 into 40. Then add 40 and 22 to get 62.
As students work with larger numbers, their strategies for computingplay an important role in linking less formal knowledge with more-
85Standards for Pre-K–2: Number and Operations
Num
ber & O
perations | Algebra | G
eometry | M
easurement | D
ata Analysis &
Probability | P
roblem S
olving | Reasoning &
Proof | C
omm
unication | Connections | R
epresentation
Fig. 4.3.
Six students’ solutions to 25 + 37
Student 1 Student 2 Student 3
Student 4 Student 5 Student 6

sophisticated mathematical thinking. Research provides evidence thatstudents will rely on their own computational strategies (Cobb et al.1991). Such inventions contribute to their mathematical development(Gravemeijer 1994; Steffe 1994). Moreover, students who used inventedstrategies before they learned standard algorithms demonstrated a bet-ter knowledge of base-ten concepts and could better extend theirknowledge to new situations, such as finding how much of $4.00 wouldbe left after a purchase of $1.86 (Carpenter et al. 1998, p. 9). Thus,when students compute with strategies they invent or choose becausethey are meaningful, their learning tends to be robust—they are able toremember and apply their knowledge. Children with specific learningdisabilities can actively invent and transfer strategies if given well-designed tasks that are developmentally appropriate (Baroody 1999).
Teachers have a very important role to play in helping students de-velop facility with computation. By allowing students to work in waysthat have meaning for them, teachers can gain insight into students’ de-veloping understanding and give them guidance. To do this well, teach-ers need to become familiar with the range of ways that students mightthink about numbers and work with them to solve problems. Considerthe following hypothetical story, in which a teacher poses this problemto a class of second graders:
We have 153 students at our school. There are 273 students at the schooldown the street. How many students are in both schools?
As would be expected in most classrooms, the students give a vari-ety of responses that illustrate a range of understandings. For exam-ple, Randy models the problem with bean sticks that the class hasmade earlier in the year, using hundreds rafts, tens sticks, and loosebeans. He models the numbers and combines the bean sticks, buthe is not certain how to record the results. He draws a picture ofthe bean sticks and labels the parts, “3 rafts,” “12 tens,” “6 beans”(fig. 4.4).
Ana first adds the hundreds, recording 300 as an intermediate result; then she adds the tens, keeping the answer in her head; shethen adds the ones; and finally she adds the partial results andwrites down the answer. Her written record is shown in figure 4.5.
Research providesevidence that studentswill rely on their own
computational strategies.
86 Principles and Standards for School Mathematics
Rep
rese
ntat
ion
| C
onne
ctio
ns |
Com
mun
icat
ion
| R
easo
ning
& P
roof
| P
robl
em S
olvi
ng |
Dat
a A
naly
sis
& P
roba
bilit
y |
Mea
sure
men
t |
Geo
met
ry |
Alg
ebra
| N
umbe
r &
Ope
ratio
ns
Fig. 4.4.
Randy models 153 and 273 using beans,bean sticks, and rafts of bean sticks.

Meaningful practice isnecessary to developfluency.
Some students use the conventional algorithm (stacking the ad-dends and then adding the ones, adding the tens and renamingthem as hundreds and tens, and finally adding the hundreds) accu-rately, but others write 3126 as their answer, demonstrating a lackof understanding that the teacher needs to address. Becky finds theanswer using mental computation and writes nothing down excepther answer. When asked to explain, she says, “Well, 2 hundreds and1 hundred are 3 hundreds, and 5 tens and 5 tens are 10 tens, or an-other hundred, so that’s 4 hundreds. There’s still 2 tens left over,and 3 and 3 is 6, so it’s 426.”
Meaningful practice is necessary to develop fluency with basic num-ber combinations and strategies with multidigit numbers. The exampleabove illustrates that teachers can learn about students’ understandingand at the same time get information to gauge the need for additionalattention and work. Practice needs to be motivating and systematic ifstudents are to develop computational fluency, whether mentally, withmanipulative materials, or with paper and pencil. Practice can be con-ducted in the context of other activities, including games that requirecomputation as part of score keeping, questions that emerge from chil-dren’s literature, situations in the classroom, or focused activities thatare part of another mathematical investigation. Practice should be pur-poseful and should focus on developing thinking strategies and aknowledge of number relationships rather than drill isolated facts.
The teacher’s responsibility is to gain insight into how students arethinking about various problems by encouraging them to explain whatthey did with the numbers (Carpenter et al. 1989). Teachers also mustdecide what new tasks will challenge students and encourage them toconstruct strategies that are efficient and accurate and that can be gen-eralized. Class discussions and interesting tasks help students build di-rectly on their knowledge and skills while providing opportunities forinvention, practice, and the development of deeper understanding. Stu-dents’ explanations of solutions permit teachers to assess their develop-ment of number sense. As in the previous example, different levels ofsophistication in understanding number relationships can be seen insecond graders’ responses (fig. 4.6) to the following problem. Noticethat all the students used their understanding of counting by fives or offive as a unit in their solutions.
There are 93 students going to the circus. Five students can ride in eachcar. How many cars will be needed?
Students can learn to compute accurately and efficiently throughregular experience with meaningful procedures. They benefit frominstruction that blends procedural fluency and conceptual under-standing (Ginsburg, Klein, and Starkey 1998; Hiebert 1999). This istrue for all students, including those with special educational needs.Many children with learning disabilities can learn when they receivehigh-quality, conceptually oriented instruction. Special instructionalinterventions for those who need them often focus narrowly on skillsinstead of offering balanced and comprehensive instruction that usesthe child’s abilities to offset weaknesses and provides better long-termresults (Baroody 1996). As students encounter problem situations inwhich computations are more cumbersome or tedious, they should be
87Standards for Pre-K–2: Number and Operations
Num
ber & O
perations | Algebra | G
eometry | M
easurement | D
ata Analysis &
Probability | P
roblem S
olving | Reasoning &
Proof | C
omm
unication | Connections | R
epresentation
Fig. 4.5.
A written record of the computation of153 + 273 with intermediate results

encouraged to use calculators to aid in problem solving. In this way,even students who are slow to gain fluency with computation skillswill not be deprived of worthwhile opportunities to solve complexmathematics problems and to develop and deepen their understandingof other aspects of number.
88 Principles and Standards for School Mathematics
Rep
rese
ntat
ion
| C
onne
ctio
ns |
Com
mun
icat
ion
| R
easo
ning
& P
roof
| P
robl
em S
olvi
ng |
Dat
a A
naly
sis
& P
roba
bilit
y |
Mea
sure
men
t |
Geo
met
ry |
Alg
ebra
| N
umbe
r &
Ope
ratio
ns
Fig. 4.6.
Students’ computation strategiesexhibit different levels of sophistication.

Blank Page

In prekindergarten through grade 2 all students should—
• sort, classify, and order objects by size, number, and other properties;• recognize, describe, and extend patterns such as sequences of sounds
and shapes or simple numeric patterns and translate from onerepresentation to another;
• analyze how both repeating and growing patterns are generated.
• illustrate general principles and properties of operations, such ascommutativity, using specific numbers;
• use concrete, pictorial, and verbal representations to develop anunderstanding of invented and conventional symbolic notations.
• model situations that involve the addition and subtraction of wholenumbers, using objects, pictures, and symbols.
• describe qualitative change, such as a student’s growing taller;• describe quantitative change, such as a student’s growing two inches in
one year.
Instructional programs fromprekindergarten through grade 12should enable all students to—
Understand patterns, relations, andfunctions
Represent and analyze mathemati-cal situations and structures usingalgebraic symbols
Use mathematical models to repre-sent and understand quantitativerelationships
Analyze change in various contexts
Pre-K–2Standard
for Grades
Expectations
Algebra
90 Principles and Standards for School Mathematics

Patterns are a way foryoung students torecognize order and toorganize their world.
AlgebraAlgebraic concepts can evolve and continue to develop during
prekindergarten through grade 2. They will be manifested throughwork with classification, patterns and relations, operations withwhole numbers, explorations of function, and step-by-step processes.Although the concepts discussed in this Standard are algebraic, thisdoes not mean that students in the early grades are going to deal withthe symbolism often taught in a traditional high school algebracourse.
Even before formal schooling, children develop beginning conceptsrelated to patterns, functions, and algebra. They learn repetitive songs,rhythmic chants, and predictive poems that are based on repeating andgrowing patterns. The recognition, comparison, and analysis of pat-terns are important components of a student’s intellectual development.When students notice that operations seem to have particular proper-ties, they are beginning to think algebraically. For example, they realizethat changing the order in which two numbers are added does notchange the result or that adding zero to a number leaves that numberunchanged. Students’ observations and discussions of how quantities re-late to one another lead to initial experiences with function relation-ships, and their representations of mathematical situations using con-crete objects, pictures, and symbols are the beginnings of mathematicalmodeling. Many of the step-by-step processes that students use formthe basis of understanding iteration and recursion.
Understand patterns, relations, and functionsSorting, classifying, and ordering facilitate work with patterns, geo-
metric shapes, and data. Given a package of assorted stickers, childrenquickly notice many differences among the items. They can sort thestickers into groups having similar traits such as color, size, or designand order them from smallest to largest. Caregivers and teachers shouldelicit from children the criteria they are using as they sort and groupobjects. Patterns are a way for young students to recognize order and toorganize their world and are important in all aspects of mathematics atthis level. Preschoolers recognize patterns in their environment and,through experiences in school, should become more skilled in noticingpatterns in arrangements of objects, shapes, and numbers and in usingpatterns to predict what comes next in an arrangement. Students know,for example, that “first comes breakfast, then school,” and “Monday wego to art, Tuesday we go to music.” Students who see the digits “0, 1, 2,3, 4, 5, 6, 7, 8, 9” repeated over and over will see a pattern that helpsthem learn to count to 100—a formidable task for students who do notrecognize the pattern.
Teachers should help students develop the ability to form generaliza-tions by asking such questions as “How could you describe this pat-tern?” or “How can it be repeated or extended?” or “How are thesepatterns alike?” For example, students should recognize that the colorpattern “blue, blue, red, blue, blue, red” is the same in form as “clap,clap, step, clap, clap, step.” This recognition lays the foundation for theidea that two very different situations can have the same mathematical
91Standards for Pre-K–2: Algebra
Num
ber & O
perations | Algebra | G
eometry | M
easurement | D
ata Analysis &
Probability | P
roblem S
olving | Reasoning &
Proof | C
omm
unication | Connections | R
epresentation
E-example 4.1
Creating and PredictingVisual Patterns
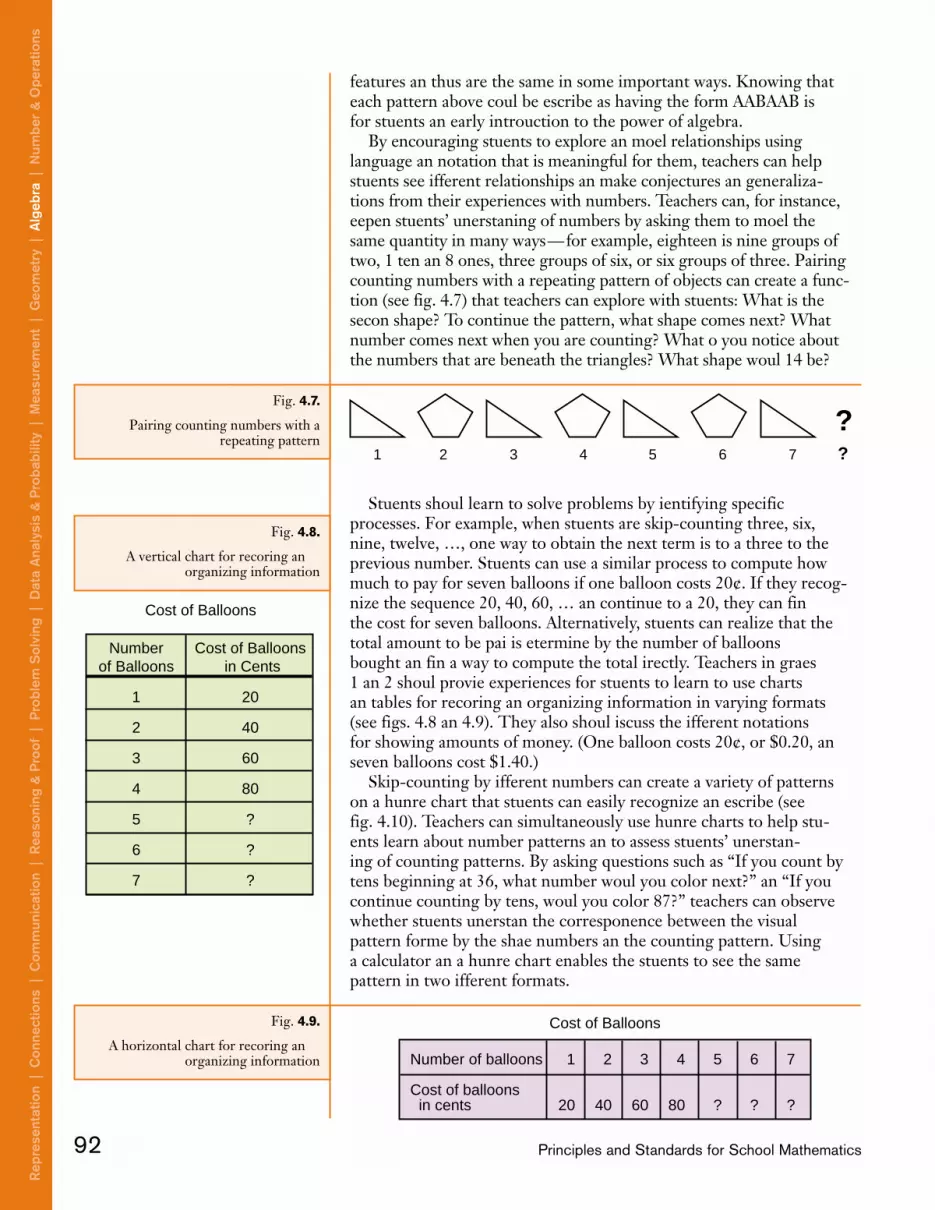
features and thus are the same in some important ways. Knowing thateach pattern above could be described as having the form AABAAB isfor students an early introduction to the power of algebra.
By encouraging students to explore and model relationships usinglanguage and notation that is meaningful for them, teachers can helpstudents see different relationships and make conjectures and generaliza-tions from their experiences with numbers. Teachers can, for instance,deepen students’ understanding of numbers by asking them to model thesame quantity in many ways—for example, eighteen is nine groups oftwo, 1 ten and 8 ones, three groups of six, or six groups of three. Pairingcounting numbers with a repeating pattern of objects can create a func-tion (see fig. 4.7) that teachers can explore with students: What is thesecond shape? To continue the pattern, what shape comes next? Whatnumber comes next when you are counting? What do you notice aboutthe numbers that are beneath the triangles? What shape would 14 be?
Students should learn to solve problems by identifying specificprocesses. For example, when students are skip-counting three, six,nine, twelve, …, one way to obtain the next term is to add three to theprevious number. Students can use a similar process to compute howmuch to pay for seven balloons if one balloon costs 20¢. If they recog-nize the sequence 20, 40, 60, … and continue to add 20, they can findthe cost for seven balloons. Alternatively, students can realize that thetotal amount to be paid is determined by the number of balloonsbought and find a way to compute the total directly. Teachers in grades1 and 2 should provide experiences for students to learn to use chartsand tables for recording and organizing information in varying formats(see figs. 4.8 and 4.9). They also should discuss the different notationsfor showing amounts of money. (One balloon costs 20¢, or $0.20, andseven balloons cost $1.40.)
Skip-counting by different numbers can create a variety of patternson a hundred chart that students can easily recognize and describe (seefig. 4.10). Teachers can simultaneously use hundred charts to help stu-dents learn about number patterns and to assess students’ understand-ing of counting patterns. By asking questions such as “If you count bytens beginning at 36, what number would you color next?” and “If youcontinued counting by tens, would you color 87?” teachers can observewhether students understand the correspondence between the visualpattern formed by the shaded numbers and the counting pattern. Usinga calculator and a hundred chart enables the students to see the samepattern in two different formats.
92 Principles and Standards for School Mathematics
Rep
rese
ntat
ion
| C
onne
ctio
ns |
Com
mun
icat
ion
| R
easo
ning
& P
roof
| P
robl
em S
olvi
ng |
Dat
a A
naly
sis
& P
roba
bilit
y |
Mea
sure
men
t |
Geo
met
ry |
Alg
ebra
| N
umbe
r &
Ope
ratio
ns
1 2 3 4 5 6 7 ?
?
Number of balloons 1 2 3 4 5 6 7
Cost of balloons20 40 60 80 ? ? ? in cents
Cost of Balloons
Fig. 4.7.
Pairing counting numbers with arepeating pattern
Number Cost of Balloonsof Balloons in Cents
1 20
2 40
3 60
4 80
5 ?
6 ?
7 ?
Cost of Balloons
Fig. 4.9.
A horizontal chart for recording andorganizing information
Fig. 4.8.
A vertical chart for recording andorganizing information

Represent and analyze mathematical situations andstructures using algebraic symbols
Two central themes of algebraic thinking are appropriate for youngstudents. The first involves making generalizations and using symbolsto represent mathematical ideas, and the second is representing andsolving problems (Carpenter and Levi 1999). For example, adding pairsof numbers in different orders such as 3 + 5 and 5 + 3 can lead studentsto infer that when two numbers are added, the order does not matter.As students generalize from observations about number and operations,they are forming the basis of algebraic thinking.
Similarly, when students decompose numbers in order to compute,they often use the associative property for the computation. For in-stance, they may compute 8 + 5, saying, “8 + 2 is 10, and 3 more is 13.”Students often discover and make generalizations about other proper-ties. Although it is not necessary to introduce vocabulary such as com-mutativity or associativity, teachers must be aware of the algebraic prop-erties used by students at this age. They should build students’understanding of the importance of their observations about mathemat-ical situations and challenge them to investigate whether specific obser-vations and conjectures hold for all cases.
Teachers should take advantage of their observations of students, asillustrated in this story drawn from an experience in a kindergarten class.
The teacher had prepared two groups of cards for her students.In the first group, the number on the front and back of each carddiffered by 1. In the second group, these numbers differed by 2.The teacher showed the students a card with 12 written on it andexplained, “On the back of this card, I’ve written another number.”She turned the card over to show the number 13. Then she showedthe students a second card with 15 on the front and 16 on the back.
93Standards for Pre-K–2: Algebra
Num
ber & O
perations | Algebra | G
eometry | M
easurement | D
ata Analysis &
Probability | P
roblem S
olving | Reasoning &
Proof | C
omm
unication | Connections | R
epresentation
1 2 3 4 5 6 7 8 9 10
11 12 13 14 15 16 17 18 19 20
21 22 23 24 25 26 27 28 29 30
31 32 33 34 35 36 37 38 39 40
41 42 43 44 45 46 47 48 49 50
51 52 53 54 55 56 57 58 59 60
61 62 63 64 65 66 67 68 69 70
71 72 73 74 75 76 77 78 79 80
81 82 83 84 85 86 87 88 89 90
91 92 93 94 95 96 97 98 99 100
1 2 3 4 5 6 7 8 9 10
11 12 13 14 15 16 17 18 19 20
21 22 23 24 25 26 27 28 29 30
31 32 33 34 35 36 37 38 39 40
41 42 43 44 45 46 47 48 49 50
51 52 53 54 55 56 57 58 59 60
61 62 63 64 65 66 67 68 69 70
71 72 73 74 75 76 77 78 79 80
81 82 83 84 85 86 87 88 89 90
91 92 93 94 95 96 97 98 99 100
Counting by threes Counting by sixes
Fig. 4.10.
Skip-counting on a hundred chart

As she continued showing the students the cards, each time sheasked the students, “What do you think will be on the back?” Soonthe students figured out that she was adding 1 to the number on thefront to get the number on the back of the card.Then the teacher brought out a second set of cards. These werealso numbered front and back, but the numbers differed by 2, forexample, 33 and 35, 46 and 48, 22 and 24. Again, the teachershowed the students a sample card and continued with other cards,encouraging them to predict what number was on the back of eachcard. Soon the students figured out that the numbers on the backsof the cards were 2 more than the numbers on the fronts.When the set of cards was exhausted, the students wanted to playagain. “But,” said the teacher, “we can’t do that until I make an-other set of cards.” One student spoke up, “You don’t have to dothat, we can just flip the cards over. The cards will all be minus 2.”
As a follow-up to the discussion, this teacher could have describedwhat was on each group of cards in a more algebraic manner. The num-bers on the backs of the cards in the first group could be named as“front number plus 1” and the second as “front number plus 2.” Fol-lowing the student’s suggestion, if the cards in the second group wereflipped over, the numbers on the backs could then be described as“front number minus 2.” Such activities, together with the discussionsand analysis that follow them, build a foundation for understanding theinverse relationship.
Through classroom discussions of different representations duringthe pre-K–2 years, students should develop an increased ability to usesymbols as a means of recording their thinking. In the earliest years,teachers may provide scaffolding for students by writing for them untilthey have the ability to record their ideas. Original representations re-main important throughout the students’ mathematical study andshould be encouraged. Symbolic representation and manipulationshould be embedded in instructional experiences as another vehicle forunderstanding and making sense of mathematics.
Equality is an important algebraic concept that students must en-counter and begin to understand in the lower grades. A common expla-nation of the equals sign given by students is that “the answer is coming,”but they need to recognize that the equals sign indicates a relationship—that the quantities on each side are equivalent, for example, 10 = 4 + 6 or4 + 6 = 5 + 5. In the later years of this grade band, teachers should pro-vide opportunities for students to make connections from symbolic nota-tion to the representation of the equation. For example, if a studentrecords the addition of four 7s as shown on the left in figure 4.11, theteacher could show a series of additions correctly, as shown on the right,and use a balance and cubes to demonstrate the equalities.
94 Principles and Standards for School Mathematics
Rep
rese
ntat
ion
| C
onne
ctio
ns |
Com
mun
icat
ion
| R
easo
ning
& P
roof
| P
robl
em S
olvi
ng |
Dat
a A
naly
sis
& P
roba
bilit
y |
Mea
sure
men
t |
Geo
met
ry |
Alg
ebra
| N
umbe
r &
Ope
ratio
ns
Fig. 4.11.
A student’s representation of addingfour 7s (left) and a teacher’s correctrepresentation of the same addition

Use mathematical models to represent and understandquantitative relationships
Students should learn to make models to represent and solveproblems. For example, a teacher may pose the following problem:
There are six chairs and stools. The chairs have four legs and the stoolshave three legs. Altogether there are twenty legs. How many chairs andhow many stools are there?
One student may represent the situation by drawing six circles andthen putting tallies inside to represent the number of legs. Another stu-dent may represent the situation by using symbols, making a first guessthat the number of stools and chairs is the same and adding 3 + 3 + 3 +4 + 4 + 4. Realizing that the sum is too large, the student might adjustthe number of chairs and stools so that the sum of their legs is 20.
Analyze change in various contextsChange is an important idea that students encounter early on. When
students measure something over time, they can describe change bothqualitatively (e.g., “Today is colder than yesterday”) and quantitatively(e.g., “I am two inches taller than I was a year ago”). Some changes arepredictable. For instance, students grow taller, not shorter, as they getolder. The understanding that most things change over time, that manysuch changes can be described mathematically, and that many changesare predictable helps lay a foundation for applying mathematics toother fields and for understanding the world.
95Standards for Pre-K–2: Algebra
Num
ber & O
perations | Algebra | G
eometry | M
easurement | D
ata Analysis &
Probability | P
roblem S
olving | Reasoning &
Proof | C
omm
unication | Connections | R
epresentation

In prekindergarten through grade 2 all students should—
• recognize, name, build, draw, compare, and sort two- and three-dimensional shapes;
• describe attributes and parts of two- and three-dimensional shapes; • investigate and predict the results of putting together and taking apart
two- and three-dimensional shapes.
• describe, name, and interpret relative positions in space and apply ideasabout relative position;
• describe, name, and interpret direction and distance in navigating spaceand apply ideas about direction and distance;
• find and name locations with simple relationships such as “near to” and incoordinate systems such as maps.
• recognize and apply slides, flips, and turns;• recognize and create shapes that have symmetry.
• create mental images of geometric shapes using spatial memory andspatial visualization;
• recognize and represent shapes from different perspectives;• relate ideas in geometry to ideas in number and measurement;• recognize geometric shapes and structures in the environment and specify
their location.
Instructional programs fromprekindergarten through grade 12should enable all students to—
Analyze characteristics and proper-ties of two- and three-dimensionalgeometric shapes and develop math-ematical arguments about geometricrelationships
Specify locations and describe spatial relationships using coordi-nate geometry and other represen-tational systems
Apply transformations and usesymmetry to analyze mathematicalsituations
Use visualization, spatial reasoning,and geometric modeling to solveproblems
Pre-K–2Standard
for Grades
Expectations
Geometry
96 Principles and Standards for School Mathematics

Geometry offers anaspect of mathematicalthinking that isdifferent from, butconnected to, the worldof numbers.
Geometry The geometric and spatial knowledge children bring to school should
be expanded by explorations, investigations, and discussions of shapesand structures in the classroom. Students should use their notions ofgeometric ideas to become more proficient in describing, representing,and navigating their environment. They should learn to represent two-and three-dimensional shapes through drawings, block constructions,dramatizations, and words. They should explore shapes by decomposingthem and creating new ones. Their knowledge of direction and positionshould be refined through the use of spoken language to locate objectsby giving and following multistep directions.
Geometry offers students an aspect of mathematical thinking that isdifferent from, but connected to, the world of numbers. As students be-come familiar with shape, structure, location, and transformations andas they develop spatial reasoning, they lay the foundation for under-standing not only their spatial world but also other topics in mathe-matics and in art, science, and social studies. Some students’ capabilitieswith geometric and spatial concepts exceed their numerical skills.Building on these strengths fosters enthusiasm for mathematics andprovides a context in which to develop number and other mathematicalconcepts (Razel and Eylon 1991).
Analyze characteristics and properties of two- andthree-dimensional geometric shapes and developmathematical arguments about geometric relationships
Children begin forming concepts of shape long before formalschooling. The primary grades are an ideal time to help them refineand extend their understandings. Students first learn to recognize ashape by its appearance as a whole (van Hiele 1986) or through quali-ties such as “pointiness” (Lehrer, Jenkins, and Osana 1998). They maybelieve that a given figure is a rectangle because “it looks like a door.”
Pre-K–2 geometry begins with describing and naming shapes. Youngstudents begin by using their own vocabulary to describe objects, talk-ing about how they are alike and how they are different. Teachers musthelp students gradually incorporate conventional terminology into theirdescriptions of two- and three-dimensional shapes. However, terminol-ogy itself should not be the focus of the pre-K–2 geometry program.The goal is that early experiences with geometry lay the foundation formore-formal geometry in later grades. Using terminology to focus at-tention and to clarify ideas during discussions can help students buildthat foundation.
Teachers must provide materials and structure the environment appro-priately to encourage students to explore shapes and their attributes. Forexample, young students can compare and sort building blocks as theyput them away on shelves, identifying their similarities and differences.They can use commonly available materials such as cereal boxes to ex-plore attributes of shapes or folded paper to investigate symmetry andcongruence. Students can create shapes on geoboards or dot paper andrepresent them in drawings, block constructions, and dramatizations.
97Standards for Pre-K–2: Geometry
Num
ber & O
perations | Algebra | G
eometry | M
easurement | D
ata Analysis &
Probability | P
roblem S
olving | Reasoning &
Proof | C
omm
unication | Connections | R
epresentation
E-example 4.2
Geoboards and Polygons (Part 1)

Students need to see many examples of shapes that correspond tothe same geometrical concept as well as a variety of shapes that arenonexamples of the concept. For example, teachers must ensure thatstudents see collections of triangles in different positions and with dif-ferent sizes of angles (see fig. 4.12) and shapes that have a resemblanceto triangles (see fig. 4.13) but are not triangles. Through class discus-sions of such examples and nonexamples, geometric concepts aredeveloped and refined.
98 Principles and Standards for School Mathematics
Rep
rese
ntat
ion
| C
onne
ctio
ns |
Com
mun
icat
ion
| R
easo
ning
& P
roof
| P
robl
em S
olvi
ng |
Dat
a A
naly
sis
& P
roba
bilit
y |
Mea
sure
men
t |
Geo
met
ry |
Alg
ebra
| N
umbe
r &
Ope
ratio
ns
Fig. 4.12.
Examples of triangles
Fig. 4.13.
Examples of nontriangles
Fig. 4.14.
Two triangles can be combined tomake different shapes.
Students also learn about geometric properties by combining or cut-ting apart shapes to form new shapes. For example, second-grade stu-dents can be challenged to find and record all the different shapes thatcan be created with the two triangles shown in figure 4.14. Interactivecomputer programs provide a rich environment for activities in whichstudents put together or take apart (compose and decompose) shapes.Technology can help all students understand mathematics, and interac-tive computer programs may give students with special instructionalneeds access to mathematics they might not otherwise experience.
Specify locations and describe spatial relationships usingcoordinate geometry and other representational systems
Four types of mathematical questions regarding navigation and mapscan help students develop a variety of spatial understandings: direction(which way?), distance (how far?), location (where?), and representation(what objects?). In answering these questions, students need to developa variety of skills that relate to direction, distance, and position in space.Students develop the ability to navigate first by noticing landmarks,then by building knowledge of a route (a connected series of land-marks), and finally by putting many routes and locations into a kind ofmental map (Clements 1999b).
Teachers should extend young students’ knowledge of relative posi-tion in space through conversations, demonstrations, and stories. Whenstudents act out the story of the three billy goats and illustrate over and

under, near and far, and between, they are learning about location, space,and shape. Gradually students should distinguish navigation ideas suchas left and right along with the concepts of distance and measurement.As they build three-dimensional models and read maps of their own en-vironments, students can discuss which blocks are used to representvarious objects like a desk or a file cabinet. They can mark paths on themodel, such as from a table to the wastebasket, with masking tape toemphasize the shape of the path. Teachers should help students relatetheir models to other representations by drawing a map of the sameroom that includes the path. In similar activities, older students shoulddevelop map skills that include making route maps and using simple co-ordinates to locate their school on a city map (Liben and Downs 1989).
Computers can help students abstract, generalize, and symbolizetheir experiences with navigating. For example, students might “walkout” objects such as a rectangular-shaped rug and then use a computerprogram to make a rectangle on the computer screen. When studentsmeasure the rug with footprints and create a computer-generated rec-tangle with the same relative dimensions, they are exploring scaling andsimilarity. Some computer programs allow students to navigate throughmazes or maps. Teachers should encourage students to move beyondtrial and error as a strategy for moving through desired paths to visual-izing, describing, and justifying the moves they need to make. Usingthese programs, students can learn orientation, direction, and measure-ment concepts.
Apply transformations and use symmetry to analyzemathematical situations
Students can naturally use their own physical experiences with shapesto learn about transformations such as slides (translations), turns (rota-tions), and flips (reflections). They use these movements intuitivelywhen they solve puzzles, turning the pieces, flipping them over, and ex-perimenting with new arrangements. Students using interactive com-puter programs, with shapes often have to choose a motion to solve apuzzle. These actions are explorations with transformations and are animportant part of spatial learning. They help students become con-scious of the motions and encourage them to predict the results ofchanging a shape’s position or orientation but not its size or shape.
Teachers should choose geometric tasks that are accessible to all stu-dents and sufficiently open-ended to engage students with a range ofinterests. For example, a second-grade teacher might instruct the classto find all the different ways to put five squares together so that oneedge of each square coincides with an edge of at least one other square(see fig. 4.15). The task should include keeping a record of the pen-tominoes that are identified and developing a strategy for recognizingwhen they are transformations of another pentomino. Teachers can
99Standards for Pre-K–2: Geometry
Num
ber & O
perations | Algebra | G
eometry | M
easurement | D
ata Analysis &
Probability | P
roblem S
olving | Reasoning &
Proof | C
omm
unication | Connections | R
epresentation
Fig. 4.15.
Examples of pentominoes andnonpentominoes
Pentominoes Not Pentominoes
E-example 4.3
Navigating Paths and Mazes (Part 1)
E-example 4.4
Tangram Challenges (Part 1)

encourage students to develop strategies for being systematic by ask-ing, “How will you know if each pentomino is different from all theothers? Are you certain you have identified all the possibilities?” Theycan challenge students to predict which of their pentominoes, if cutout of grid paper, would fold into an open box and then verify (or re-ject) their predictions by cutting them out and trying to fold them intoboxes.
Teachers should guide students to recognize, describe, and infor-mally prove the symmetric characteristics of designs through the mate-rials they supply and the questions they ask. Students can use patternblocks to create designs with line and rotational symmetry (see fig.4.16) or use paper cutouts, paper folding, and mirrors to investigatelines of symmetry.
Use visualization, spatial reasoning, and geometricmodeling to solve problems
Spatial visualization can be developed by building and manipulat-ing first concrete and then mental representations of shapes, rela-tionships, and transformations. Teachers should plan instruction sothat students can explore the relationships of different attributes orchange one characteristic of a shape while preserving others. In theactivity in figure 4.17, students are holding a long loop of yarn sothat each student’s hand serves as a vertex of the triangle. In thisarrangement, students experiment with changing a shape by increas-ing the number of sides while the perimeter is unchanged. Conver-sations about what they notice and how to change from one shape toanother allow students to hear different points of view and at thesame time give teachers insight into their students’ understanding.Work with concrete shapes, illustrated in this activity, lays a valuablefoundation for spatial sense. To further develop students’ abilities,teachers might ask them to see in their “mind’s eye” the shapes thatwould result when a shape is flipped or when a square is cut diago-nally from corner to corner. Thus, many shape and transformationactivities build spatial reasoning if students are asked to imagine,
100 Principles and Standards for School Mathematics
Rep
rese
ntat
ion
| C
onne
ctio
ns |
Com
mun
icat
ion
| R
easo
ning
& P
roof
| P
robl
em S
olvi
ng |
Dat
a A
naly
sis
& P
roba
bilit
y |
Mea
sure
men
t |
Geo
met
ry |
Alg
ebra
| N
umbe
r &
Ope
ratio
ns
Fig. 4.17.
Making a string triangle
Fig. 4.16.
Symmetries can be found in designs.
Rotational symmetry
Line symmetry

predict, experiment, and check the results of the work themselves(see fig. 4.18).
Classroom activities that enhance visualization, such as asking stu-dents to recall the configuration of the dots on dominoes and deter-mine the number of dots without counting, can promote spatial mem-ory. A teacher could place objects (such as scissors, a pen, a leaf, a paperclip, and a block) on the overhead projector, show the objects briefly,and ask students to name the objects they glimpsed. Or the teachermight have students close their eyes; she could then take one objectaway and ask which one was removed.
In another “quick image” activity, students can be briefly shown asimple configuration such as the one in figure 4.19 projected on a screenand then asked to reproduce it. The configuration is shown again for acouple of seconds, and they are encouraged to modify their drawings.The process may be repeated several times so that they have opportuni-ties to evaluate and self-correct their work (Yackel and Wheatley 1990).Asking, “What did you see? How did you decide what to draw?” is likelyto elicit different explanations, such as “three triangles,” “a sailboat sink-ing,” “a square with two lines through it,” “a y in a box,” and “a sand-wich that has been cut into three pieces.” Students who can see the con-figuration in several ways may have more mathematical knowledge andpower than those who are limited to one perspective.
Spatial visualization and reasoning can be fostered in navigation ac-tivities when teachers ask students to visualize the path they just walkedfrom the library and describe it by specifying landmarks along the routeor when students talk about how solid geometric shapes look from dif-ferent perspectives. Teachers should ask students to identify structuresfrom various viewpoints and to match views of the same structure por-trayed from different perspectives. Using a variety of magazine pho-tographs, older students might discuss the location of the photogra-phers when they took each one.
Teachers should help students forge links among geometry, measure-ment, and number by choosing activities that encourage them to useknowledge from previous lessons to solve new problems. The story ofsecond graders estimating cranberries to fill a jar, described in the “Con-nections” section of this chapter, illustrates a lesson in which students usetheir understanding of number, measurement, geometry, and data tocomplete the tasks. When teachers point out geometric shapes in natureor in architecture, students’ awareness of geometry in the environment isincreased. When teachers invite students to discover why most fire hy-drants have pentagonal caps rather than square or hexagonal ones or whyballs can roll in straight lines but cones roll to one side, they are encour-aging them to apply their geometric understandings. When students areasked to visualize numbers geometrically by modeling various arrange-ments of the same number with square tiles, they also are making con-nections to area. Making and drawing such rectangular arrays of squareshelp primary-grades students learn to organize space and shape, which isimportant to their later understanding of grids and coordinate systems(Battista et al. 1998).
101Standards for Pre-K–2: Geometry
Num
ber & O
perations | Algebra | G
eometry | M
easurement | D
ata Analysis &
Probability | P
roblem S
olving | Reasoning &
Proof | C
omm
unication | Connections | R
epresentation
Fig. 4.18.
Paper cutting can aid spatial visualiza-tion and reasoning.
Fig. 4.19.
In a quick-image activity, students tryto reproduce this image, which hasbriefly been projected on a screen.
E-example 4.2
Geoboards and Polygons (Part 2)

In prekindergarten through grade 2 all students should—
• recognize the attributes of length, volume, weight, area, and time;• compare and order objects according to these attributes;• understand how to measure using nonstandard and standard units;• select an appropriate unit and tool for the attribute being measured.
• measure with multiple copies of units of the same size, such as paperclips laid end to end;
• use repetition of a single unit to measure something larger than the unit,for instance, measuring the length of a room with a single meterstick;
• use tools to measure;• develop common referents for measures to make comparisons and
estimates.
Instructional programs fromprekindergarten through grade 12should enable all students to—
Understand measurable attributesof objects and the units, systems,and processes of measurement
Apply appropriate techniques,tools, and formulas to determinemeasurements
Pre-K–2Standard
for Grades
Expectations
Measurement
102 Principles and Standards for School Mathematics
Measurement is oneof the most widely usedapplications ofmathematics.
Measurement Measurement is one of the most widely used applications of mathe-
matics. It bridges two main areas of school mathematics—geometry andnumber. Measurement activities can simultaneously teach importanteveryday skills, strengthen students’ knowledge of other important top-ics in mathematics, and develop measurement concepts and processesthat will be formalized and expanded in later years.
Teaching that builds on students’ intuitive understandings and infor-mal measurement experiences helps them understand the attributes tobe measured as well as what it means to measure. A foundation in mea-surement concepts that enables students to use measurement systems,tools, and techniques should be established through direct experienceswith comparing objects, counting units, and making connections be-tween spatial concepts and number.
Understand measurable attributes of objects and theunits, systems, and processes of measurement
Children should begin to develop an understanding of attributes bylooking at, touching, or directly comparing objects. They can deter-mine who has more by looking at the size of piles of objects or identifywhich of two objects is heavier by picking them up. They can compareshoes, placing them side by side, to check which is longer. Adultsshould help young children recognize attributes through their conver-sations. “That is a deep hole.” “Let’s put the toys in the large box.”“That is a long piece of rope.” In school, students continue to learnabout attributes as they describe objects, compare them, and orderthem by different attributes. Seeing order relationships, such as that thesoccer ball is bigger than the baseball but smaller than the beach ball, isimportant in developing measurement concepts.
Teachers should guide students’ experiences by making the resourcesfor measuring available, planning opportunities to measure, and en-couraging students to explain the results of their actions. Discoursebuilds students’ conceptual and procedural knowledge of measurementand gives teachers valuable information for reporting progress andplanning next steps. The same conversations and questions that helpstudents build vocabulary help teachers learn about students’ under-standings and misconceptions. For example, when students measure thelength of a desk with rods, the teacher might ask what would happen ifthey used rods that were half as long. Would they need more rods orfewer rods? If students are investigating the height of a table, theteacher might ask what measuring tools would be appropriate and why.
Although a conceptual foundation for measuring many different at-tributes should be developed during the early years, linear measure-ments are the main emphasis. Measurement experiences should includedirect comparisons as well as the use of nonstandard and standard units.For example, teachers might ask young students to find objects in theroom that are about as long as their foot or to measure the length of atable with connecting cubes. Later they can supply standard measure-ment tools, such as rulers, to measure classroom plants and use thosemeasurements to chart the plants’ growth.
103Standards for Pre-K–2: Measurement
Num
ber & O
perations | Algebra | G
eometry | M
easurement | D
ata Analysis &
Probability | P
roblem S
olving | Reasoning &
Proof | C
omm
unication | Connections | R
epresentation
E-example 4.1
Navigating Paths and Mazes (Part 3)

Students need opportunities to expand their beginning understand-ings of attributes other than those related to linear measures and area.Preschool children learn about volume as they pour sand or water fromone container to another. In the classroom, they should continue to ex-plore the capacity of various containers by direct comparisons or bycounting the number of scoops or cups required to fill each one. Theyalso should experiment with filling larger containers with the contentsof smaller ones and conjecture whether a quantity may be too much fora proposed container.
Young students should also have experiences with weighing objects.Balances help them understand comparative weights and reinforce theconcept of equality; for example, they can predict that two cubes willweigh the same as twenty links and then test their prediction. Or theycan measure equal weights of clay for an art project or compare theweights of different-sized blocks. Scales permit students to assign nu-merical values to the weights of objects (as rulers allow them to assignnumerical values for linear measures) and allow them to begin usingstandard measures in meaningful ways. By the end of second grade, stu-dents should relate standard measures such as kilograms or pounds tothe attribute “how heavy.”
Another emphasis at this level should be on developing concepts oftime and the ways it is measured. When students use calendars or se-quence events in stories, they are using measures of time in a realcontext. Opportunities arise throughout the school day for teachers tofocus on time and its measurement through short conversations withtheir students. A teacher might say, for example, “Look at the clock.It’s one o’clock—time for gym! It is just like the picture of the clockon our schedule.” As teachers call attention to the clock, many youngstudents will learn to tell time. However, this is less important thantheir understanding patterns of minutes, hours, days, weeks, andmonths.
Students needopportunities to expand
their beginningunderstandings of
attributes.
104 Principles and Standards for School Mathematics
Rep
rese
ntat
ion
| C
onne
ctio
ns |
Com
mun
icat
ion
| R
easo
ning
& P
roof
| P
robl
em S
olvi
ng |
Dat
a A
naly
sis
& P
roba
bilit
y |
Mea
sure
men
t |
Geo
met
ry |
Alg
ebra
| N
umbe
r &
Ope
ratio
ns

The measurementprocess is identical, inprinciple, for measuringany attribute.
The measurement process is identical, in principle, for measuringany attribute: choose a unit, compare that unit to the object, and re-port the number of units. The number of units can be determined byiterating the unit (repeatedly laying the unit against the object) andcounting the iterations or by using a measurement tool. For example,students can tile a space and count the number of tiles to find thearea. For linear measurement, they can record their height by using ameterstick.
Teachers should provide many hands-on opportunities for studentsto choose tools—some with nonstandard and others with standardunits—for measuring different attributes. Students should learn thatrods and rulers with centimeters and inches may be used to measurelength. They should recognize that different units give different levelsof precision for their measurements. Although for many measurementtasks students will use nonstandard units, it is appropriate for them toexperiment with and use standard measures such as centimeters andmeters and inches and feet by the end of grade 2.
Apply appropriate techniques, tools, and formulas todetermine measurements
If students initially explore measurement with a variety of units, non-standard as well as standard, they will develop an understanding of thenature of units. For example, if some students measure the width of adoor using pencils and others use large paper clips, the number of paperclips will be different from the number of pencils. If some students usesmall paper clips, then the width of the door will measure yet a differ-ent number of units. Similarly, when students cover an area, some usingdominoes and others using square tiles, they will recognize that“domino measurements” have different values from “tile measure-ments.” Such experiences and discussions can create an awareness ofthe need for standard units and tools and of the fact that different mea-suring tools will yield different numerical measurements of the sameobject.
105Standards for Pre-K–2: Measurement
Num
ber & O
perations | Algebra | G
eometry | M
easurement | D
ata Analysis &
Probability | P
roblem S
olving | Reasoning &
Proof | C
omm
unication | Connections | R
epresentation

Measurement concepts and skills can develop together as studentsposition multiple copies of the same units without leaving spaces be-tween them or as they measure by iterating one unit without overlap-ping or leaving gaps. Both types of experiences are necessary. Similarly,using rulers, students learn concepts and procedures, including accuratealignment (e.g., ignoring the leading edge at the beginning of manyrulers), starting at zero, and focusing on the lengths of the units ratherthan only on the numbers on the ruler. By emphasizing the question“What are you counting?” teachers help students focus on the meaningof the measurements they are making.
Teachers cannot assume that students understand measurement fullyeven when they are able to tell how long an object is when it is alignedwith a ruler. Using tools accurately and questioning when measure-ments may not be accurate require concepts and skills that develop overextended periods through many varied experiences. Consider the fol-lowing episode drawn from a classroom experience:
A teacher had given her class a list of things to measure; because shewas interested in finding out how the students will approach thetask, she had left the choice of measuring tools up to them. Mariwas using a ruler when the teacher stopped by the desk to observeher measuring her book. “It’s twelve inches,” Mari said as she wrotethe measurement on the recording sheet. Next she measured herpencil, which was noticeably shorter than the book. The teacherobserved that Mari’s hand slipped as she was aligning her ruler withthe pencil. Mari made no comment but recorded this measurementas twelve inches also.“I notice that you wrote that each of these is twelve inches,” saidthe teacher. “I’m confused. The book looks much longer than thepencil to me. What do you think?”Mari pushed both items close together and studied them. “You’reright,” she said. “The book is longer, but they are both twelveinches.”In her anecdotal records, the teacher noted what happened in orderto address the issue in future lessons and conversations with Mariand the class.
Estimation activities are an early application of number sense; theyfocus students’ attention on the attributes being measured, the processof measuring, the sizes of units, and the value of referents. Thus esti-mating measurements contributes to students’ development of spatialsense, number concepts, and skills. Because precise measurements arenot always needed to answer questions, students should realize that it isoften appropriate to report a measurement as an estimate.
Estimation activitiesare an early application
of number sense.
106 Principles and Standards for School Mathematics
Rep
rese
ntat
ion
| C
onne
ctio
ns |
Com
mun
icat
ion
| R
easo
ning
& P
roof
| P
robl
em S
olvi
ng |
Dat
a A
naly
sis
& P
roba
bilit
y |
Mea
sure
men
t |
Geo
met
ry |
Alg
ebra
| N
umbe
r &
Ope
ratio
ns

Blank Page

108 Principles and Standards for School Mathematics
Pre-K–2Standard
for Grades
Expectations
Data Analysis and Probability
In prekindergarten through grade 2 all students should—
• pose questions and gather data about themselves and their surroundings;• sort and classify objects according to their attributes and organize data
about the objects;• represent data using concrete objects, pictures, and graphs.
• describe parts of the data and the set of data as a whole to determinewhat the data show.
• discuss events related to students’ experiences as likely or unlikely.
Instructional programs fromprekindergarten through grade 12should enable all students to—
Formulate questions that can be ad-dressed with data and collect,organize, and display relevant datato answer them
Select and use appropriate statisticalmethods to analyze data
Develop and evaluate inferences andpredictions that are based on data
Understand and apply basic conceptsof probability

The main purpose ofcollecting data is toanswer questions whenthe answers are notimmediately obvious.
Data Analysis and Probability Informal comparing, classifying, and counting activities can provide
the mathematical beginnings for developing young learners’ under-standing of data, analysis of data, and statistics. The types of activitiesneeded and appropriate for kindergartners vary greatly from those forsecond graders; however, throughout the pre-K–2 years, studentsshould pose questions to investigate, organize the responses, and createrepresentations of their data. Through data investigations, teachersshould encourage students to think clearly and to check new ideasagainst what they already know in order to develop concepts for makinginformed decisions.
As students’ questions become more sophisticated and their data setslarger, their use of traditional representations should increase. By theend of the second grade, students should be able to organize and dis-play their data through both graphical displays and numerical sum-maries. They should be using counts, tallies, tables, bar graphs, and lineplots. The titles and labels for their displays should clearly identify whatthe data represent. As students work with numerical data, they shouldbegin to sort out the meaning of the different numbers—those that rep-resent values (“I have four people in my family”) and those that repre-sent how often a value occurs in a data set (frequency) (“Nine childrenhave four people in their families”). They should discuss when conclu-sions about data from one population might or might not apply to datafrom another population. Considerations like these are the precursorsto understanding the notion of inferences from samples.
Ideas about probability at this level should be informal and focus onjudgments that children make because of their experiences. Activitiesthat underlie experimental probability, such as tossing number cubes ordice, should occur at this level, but the primary purpose for these activi-ties is focused on other strands, such as number.
Formulate questions that can be addressed with data andcollect, organize, and display relevant data to answer them
The main purpose of collecting data is to answer questions when theanswers are not immediately obvious. Students’ natural inclination toask questions must be nurtured. At the same time, teachers should helpthem develop ways to gather information to answer these questions sothat they learn when and how to make decisions on the basis of data. Aschildren enter school and their interests extend from their immediatesurroundings to include other environments, they must learn how tokeep track of multiple responses to their questions and those posed byothers. Students also should begin to refine their questions to get theinformation they need.
Organizing data into categories should begin with informal sortingexperiences, such as helping to put away groceries. These experiencesand the conversations that accompany them focus children’s attentionon the attributes of objects and help develop an understanding of“things that go together,” while building a vocabulary for describing at-tributes and for classifying according to criteria. Young students shouldcontinue activities that focus on attributes of objects and data so that by
109Standards for Pre-K–2: Data Analysis and Probability
Num
ber & O
perations | Algebra | G
eometry | M
easurement | D
ata Analysis &
Probability | P
roblem S
olving | Reasoning &
Proof | C
omm
unication | Connections | R
epresentation

the second grade, they can sort and classify simultaneously, using morethan one attribute.
Students should learn through multiple experiences that how dataare gathered and organized depends on the questions they are trying toanswer. For example, when students are asked to put a counter into abowl to indicate whether they vote for a class trip to the zoo or to themuseum, the responses are organized as the data are gathered (see fig.4.20). To address a particular question such as “What is your favoritebeverage served in the school cafeteria?” real objects such as containersfor chocolate milk, plain milk, or juice can be collected, organized, anddisplayed. At other times, pictures of objects, counters, name cards, ortallies can be contributed by students, organized, and then displayed toindicate preferences.
Methods used by students in different grades to investigate the num-ber of pockets in their clothing provide an example of students’ growthin data investigations during the period through grade 2. Younger stu-dents might count pockets (Burns 1996). They could survey their class-mates and gather data by listing names, asking how many pockets, andnoting that number beside each name. Together the class could createone large graph to show the data about all the students by coloring abar on the graph to represent the number of pockets for each student(see fig. 4.21). In the second grade, however, students might decide tocount the number of classmates who have various numbers of pockets(see fig. 4.22). Their methods of gathering the information, organizingit, and displaying the data are likely to be different because they aregrouping the data—three students have two pockets, five students havefour pockets, and so on. They will have to think carefully about themeaning of all the numbers—some represent the value of a piece ofdata and some represent how many times that value occurs.
Students do not automatically refine their questions, consider alter-native ways of collecting information, or choose the most appropriateway to organize and display data; these skills are acquired through expe-rience, class discussions, and teachers’ guidance. Take, for example, thefollowing episode drawn from a classroom experience:
110 Principles and Standards for School Mathematics
Rep
rese
ntat
ion
| C
onne
ctio
ns |
Com
mun
icat
ion
| R
easo
ning
& P
roof
| P
robl
em S
olvi
ng |
Dat
a A
naly
sis
& P
roba
bilit
y |
Mea
sure
men
t |
Geo
met
ry |
Alg
ebra
| N
umbe
r &
Ope
ratio
ns
Place one cube in a bowlto vote for our class trip.
ooMuseum
Fig. 4.20.
Students can contribute counters tobowls to vote.

111Standards for Grades 3–5: Data Analysis and Probability
Num
ber & O
perations | Algebra | G
eometry | M
easurement | D
ata Analysis &
Probability | P
roblem S
olving | Reasoning &
Proof | C
omm
unication | Connections | R
epresentation
Fig. 4.21.
A bar graph illustrating the number ofpockets in kindergarten students’clothes
Fig. 4.22.
A line-plot graph of the number ofstudents in a second-grade class whohave from one to ten pockets
1 2 3 4 5 6 7 8 9 10
× ××× ×
×× ×
××××
××× ×
××××××
×××
××
×
Number of Pockets
Number ofStudents

The students had become interested in the question of whethermore families had cars with two doors or four doors. As theyplanned, the students had to decide if trucks should be included.What about vans with four doors or station wagons with five doors?After the class had settled on common categories, different groupsof students kept track of the data in different ways. One group putcubes in different cups that represented the different categories.Another group recorded the data using tallies. A third group of stu-dents made a list of families with cars with two doors and those withcars with four doors without attempting to organize the informa-tion or agree on the results of their data collection. The teacherused the students’ work for a class discussion about which groupswere able to answer the question they had posed.
Students’ representations should be discussed, shared with class-mates, and valued because they reflect the students’ understandings.These representations afford teachers opportunities to assess students’understandings and to initiate class discussions about important issuesrelated to representing data. Misconceptions that arise because of stu-dents’ representations of data offer situations for new learning and in-struction. A teacher asked first-grade students to fold a piece of paper inhalf and cut out a heart (adapted from University of North CarolinaMathematics and Science Education Network [1997, p. 19]). When thestudents sorted their hearts into three columns according to size (seefig. 4.23a), some of them stated that the large hearts represented themost popular choice because that column was the tallest. A teachercould use a class discussion of the difference between the sizes and thenumbers of hearts as an early experience with scale and as an opportu-nity for the students to plan how to revise the graph to convey the datamore accurately. By pasting their hearts on equal-sized pieces of paper,the students could create a new graph, shown in figure 4.23b.
112 Principles and Standards for School Mathematics
Rep
rese
ntat
ion
| C
onne
ctio
ns |
Com
mun
icat
ion
| R
easo
ning
& P
roof
| P
robl
em S
olvi
ng |
Dat
a A
naly
sis
& P
roba
bilit
y |
Mea
sure
men
t |
Geo
met
ry |
Alg
ebra
| N
umbe
r &
Ope
ratio
ns
Fig. 4.23.
A misleading data display and itssubsequent revision (source of (a):
University of North CarolinaMathematics and Science Education
1997, p. 19)
(a)Students’ original data display
(b)Students’ revised data display
What Size Heart Did You Make?
Small Medium Large

Data investigations canencourage students towrestle with countingissues.
Select and use appropriate statistical methods toanalyze data
Through their data investigations, young students should developthe idea that data, charts, and graphs give information. When data aredisplayed in an organized manner, class discussions should focus onwhat the graph or other representation conveys and whether the datahelp answer the specific questions that were posed. Teachers should en-courage students to compare parts of the data (“The same number ofchildren have dogs as have cats”) and make statements about the data asa whole (“Most students in the class have lost only two teeth”).
By the end of grade 2, students should begin to question inappropri-ate statements about data, as illustrated in this classroom conversation:Two students, interested in how many of their classmates watched aparticular television show, surveyed only their friends and reportedtheir results to the class. “You didn’t ask me and I watched it!” one girlcomplained. Another student said, “Wait a minute, you didn’t ask meand I didn’t watch it. I bet most kids didn’t watch it.”
Data investigations can encourage students to wrestle with countingissues that are fundamental to all data collection: Whom do I count?How can I be certain I have counted each piece of data once and onlyonce?
The concept of sample is difficult for young students. Most of theirdata gathering is for full populations, such as their own class. Withguidance, students can begin to recognize when conclusions about onepopulation cannot be applied to another, as demonstrated in the follow-ing hypothetical example: A teacher reads a book about whistling to afirst-grade class. The students decide to survey the class and discoverthat eight students can whistle and nineteen cannot. When the teacherasks the class to title the chart they have created, the students agree that
113Standards for Pre-K–2: Data Analysis and Probability
Num
ber & O
perations | Algebra | G
eometry | M
easurement | D
ata Analysis &
Probability | P
roblem S
olving | Reasoning &
Proof | C
omm
unication | Connections | R
epresentation

an appropriate title would be “Most Children Cannot Whistle.” Theteacher then asks, “What do you think would happen if we asked thefourth graders?” The students repeat the survey and discover that al-most every fourth grader can whistle, so they decide to retitle the graph“Number of Students in Our Class Who Can Whistle.”
Develop and evaluate inferences and predictions thatare based on data
Inference and prediction are more-advanced aspects of this Stan-dard. The development of these concepts requires work with samplingthat begins in the next grade band. As appropriate beginnings for theseconcepts, however, teachers should encourage informal discussionsabout whether or not students in other classes would reach a similarconclusion.
Understand and apply basic concepts of probabilityAt this level, probability experiences should be informal and often
take the form of answering questions about the likelihood of events,using such vocabulary as more likely or less likely. Young students enjoythinking about impossible events and often encounter them in thebooks they are learning to read. Questions about more and less likelyevents should come from the students’ experiences, and the answers willoften depend on the community and its location. During the winter, thequestion “Is it likely to snow tomorrow?” has quite different answers inToronto and San Diego.
Teachers should address the beginnings of probability through infor-mal activities with spinners or number cubes that reinforce conceptionsin other Standards, primarily number. For example, as students repeat-edly toss two dice or number cubes and add the results of each toss,they may begin to keep track of the results. They will realize that a sumof 1 is impossible, that a sum of 2 or 12 is rare, and that the sums 6, 7,and 8 are fairly common. Through discussion, they may realize thattheir observations have something to do with the number of ways to geta particular sum from two dice, but the exact calculation of the proba-bilities should occur in higher grades.
Teachers shouldaddress the beginnings of
probability throughinformal activities.
114 Principles and Standards for School Mathematics
Rep
rese
ntat
ion
| C
onne
ctio
ns |
Com
mun
icat
ion
| R
easo
ning
& P
roof
| P
robl
em S
olvi
ng |
Dat
a A
naly
sis
& P
roba
bilit
y |
Mea
sure
men
t |
Geo
met
ry |
Alg
ebra
| N
umbe
r &
Ope
ratio
ns

Blank Page

Instructional programs fromprekindergarten through grade 12should enable all students to—
Build new mathematical knowledgethrough problem solving
Solve problems that arise in mathe-matics and in other contexts
Apply and adapt a variety of appro-priate strategies to solve problems
Monitor and reflect on the processof mathematical problem solving
Pre-K–2Standard
for Grades
Problem Solving
116 Principles and Standards for School Mathematics
Problem solving is a hallmark of mathematical activity and a majormeans of developing mathematical knowledge. It is finding a way toreach a goal that is not immediately attainable. Problem solving is nat-ural to young children because the world is new to them, and they ex-hibit curiosity, intelligence, and flexibility as they face new situations.The challenge at this level is to build on children’s innate problem-solving inclinations and to preserve and encourage a disposition thatvalues problem solving. Teachers should encourage students to use thenew mathematics they are learning to develop a broad range of prob-lem-solving strategies, to pose (formulate) challenging problems, andto learn to monitor and reflect on their own ideas in solving problems.
What should problem solving look like inprekindergarten through grade 2?
Problem solving in the early years should involve a variety of con-texts, from problems related to daily routines to mathematical situa-tions arising from stories. Students in the same classroom are likely tohave very different mathematical understandings and skills; the samesituation that is a problem for one student may elicit an automatic re-sponse from another. For instance, when first-grade students wereworking in small groups to create models of animals with geometricsolids, some had difficulty seeing the parts of animals as geometricshapes. Other students readily saw that they could use seven rectangularprisms to make a giraffe (see figure 4.24). Similarly, the question “Howmany books would there be on the shelf if Marita put six books on itand Al put three more on it?” may not be a problem for the studentwho knows the basic number combination 6 and 3 and its connectionwith the question. For the student who has not yet learned the numbercombination and may not yet know how to represent the task symboli-cally, this problem presents an opportunity to learn the skills needed tosolve similar problems.
Solving problems gives students opportunities to use and extend theirknowledge of concepts in each of the Content Standards. For example,many problems relate to classification, shape, or space: Which blockswill fit on this shelf? Will this puzzle piece fit in the space that remains?How are these figures alike and how are they different? In answering

these questions, students are using spatial-visualization skills and theirknowledge of transformations. Other problems support students’ devel-opment of number sense and understanding of operations: How manymore days until school vacation? There are 43 cards in this group; howmany packets of 10 can we make? If there are 26 students in our classand 21 are here today, how many are absent? When young studentssolve problems that involve comparing and completing collections byusing counting strategies, they develop a better understanding of addi-tion and subtraction and the relationship between these operations.
Posing problems, that is, generating new questions in a problem con-text, is a mathematical disposition that teachers should nurture and de-velop. Through asking questions and identifying what information isessential, students can organize their thoughts, as the following episodedrawn from classroom observations demonstrates:
Lei wanted to know all the ways to cover the yellow hexagon usingpattern blocks. At first she worked with the blocks using fairly undi-rected trial and error. Gradually she became more methodical andplaced the various arrangements in rows. The teacher showed her a pattern-block program on the class computer and how to “glue” the pattern-block designs together on the screen. Lei organized thearrangements by the numbers of blocks used and began predictingwhich attempts would be transformations of other arrangementseven before she completed the hexagons (see fig. 4.25). The nextchallenge Lei set for herself was to see if she could create a hexago-nal figure using only the orange squares. She had experimented withsquare blocks and could not make a hexagon. “But,” she explained toher teacher, “it might be different on the computer,” indicating thatshe felt the computer was a powerful problem-solving tool.
Kyle was certain that he could find more arrangements for hexa-gons than Lei had found. Other students joined the discussions be-tween Lei and Kyle. When this activity created a great demand for“turns” with the pattern blocks and the computer, the teacher tookadvantage of the class’s interest by having students discuss how theywould know when an arrangement of blocks was a duplicate andhow they might keep a written record of their work.
Kyle’s participation illustrates that students are persistent when prob-lems are interesting and challenging. Their interest also stimulates cu-riosity in other students.
117Standards for Pre-K–2: Problem Solving
Num
ber & O
perations | Algebra | G
eometry | M
easurement | D
ata Analysis &
Probability | P
roblem S
olving | Reasoning &
Proof | C
omm
unication | Connections | R
epresentation
Fig. 4.24.
A block giraffe made from seven rec-tangular prisms (Adapted from Russell,Clements, and Sarama [1998, p. 115])
Fig. 4.25.
Organizing arrangements that makehexagons

Students working together often begin to solve problems one wayand, before reaching a solution, change their strategies. In addition, asthey create and modify their strategies, students often recognize theneed to learn more mathematics. The following episode, drawn fromclassroom observation, illustrates how teachers can make a problemmathematically rich.
Several first-grade classes in the same school were planting a gardenin the school courtyard. The students wanted each class to have thesame amount of space for planting; thus, how to divide the area intothree equal parts was greatly debated. A walkway, two shade trees,and several benches complicated the discussions. The studentsbegan to list all their concerns and the questions they needed to an-swer before dividing the area for the garden: How big can the gar-den be? Do the three sections have to be the same shape? How canwe be sure each class has the same amount of space?The teachers drew a large map for each class and indicated the ap-proximate location and amount of space taken by trees, walkway,and benches. In one class the students decided they wanted rectan-gular gardens and needed to measure the courtyard to figure outhow large the rectangles could be. After many measurements andmuch debate, they cut out three rectangles that were four feet bynine feet to show how big each garden could be. When they werenot certain how to use this information on their map, the teachershowed them a scale on a road map and how map scales are used.She suggested appropriate dimensions for the three rectangles,which they cut and glued to their map. The second class began with a discussion of what “the same area”means. They used large-grid paper squares and taped them to theirmap to allocate the maximum space for gardening, counting care-fully to be certain each class had the same number of squares eventhough the shapes of the regions were different. This group alsoneeded to learn about scale to actually make a plan for marking offthe gardens outside. Before voting on how to mark off the gardens, the two groups pre-sented their plans to all the classes.
Deciding how to share land for a garden is an example of a class-room-based problem that facilitates students’ development of problem-solving strategies. The task was complex. The students struggled withhow to share the area equally, how to measure, and how to communi-cate their ideas. However, the project was rich with proposed strategies,counterproposals, and opportunities for the teachers to introduce newmathematics.
Children’s literature is helpful in setting a context for both student-generated and teacher-posed problems. For example, after reading1 Hunter (Hutchins 1982) to her class, a second-grade teacher askedstudents to figure out how many animals, including the hunter, werein the story. Figure 4.26 illustrates several approaches used by thestudents.
Sharing gives students opportunities to hear new ideas and comparethem with their own and to justify their thinking. As students strugglewith problems, seeing a variety of successful solutions improves their
Sharing gives studentsopportunities to hear
new ideas and comparethem with their own.
118 Principles and Standards for School Mathematics
Rep
rese
ntat
ion
| C
onne
ctio
ns |
Com
mun
icat
ion
| R
easo
ning
& P
roof
| P
robl
em S
olvi
ng |
Dat
a A
naly
sis
& P
roba
bilit
y |
Mea
sure
men
t |
Geo
met
ry |
Alg
ebra
| N
umbe
r &
Ope
ratio
ns

chance of learning useful strategies and allows them to determine ifsome strategies are more flexible and efficient. When the teacher in-vited the students to explain their solutions to the 1 Hunter problem,several of them discovered their counting or computational errors andmade corrections during the presentations. Explaining their pictorialand written solutions helped them articulate their thinking and make itprecise.
What should be the teacher’s role in developingproblem solving in prekindergarten through grade 2?
The decisions that teachers make about problem-solving opportuni-ties influence the depth and breadth of students’ mathematics learning.Teachers must be clear about the mathematics they want their studentsto accomplish as they structure situations that are both problematic andattainable for a wide range of students. They make important decisionsabout when to probe, when to give feedback that affirms what is correctand identifies what is incorrect, when to withhold comments and plansimilar tasks, and when to use class discussions to advance the students’mathematical thinking. By allowing time for thinking, believing thatyoung students can solve problems, listening carefully to their explana-tions, and structuring an environment that values the work that stu-dents do, teachers promote problem solving and help students maketheir strategies explicit.
Instead of teaching problem solving separately, teachers shouldembed problems in the mathematics-content curriculum. When teach-ers integrate problem solving into the context of mathematical situa-tions, students recognize the usefulness of strategies. Teachers shouldchoose specific problems because they are likely to prompt particularstrategies and allow for the development of certain mathematical ideas.For example, the problem “I have pennies, dimes, and nickels in mypocket. If I take three coins out of my pocket, how much money could Ihave taken?” can help children learn to think and record their work.
Assessing students’ abilities to solve problems is more difficult thanevaluating computational skills. However, it is imperative that teachers
119Standards for Pre-K–2: Problem Solving
Num
ber & O
perations | Algebra | G
eometry | M
easurement | D
ata Analysis &
Probability | P
roblem S
olving | Reasoning &
Proof | C
omm
unication | Connections | R
epresentation
Fig. 4.26.
Determining the number of animals in1 Hunter
E-example 4.3
Navigating Paths and Mazes (Part 2)

gather evidence in a variety of ways, such as through students’ workand conversations, and use that information to plan how to help indi-vidual students in a whole-class context. Knowing students’ interestsallows teachers to formulate problems that extend the mathematicalthinking of some students and that also reinforce the concepts learnedby other students who have not yet reached the same understandings.Classrooms in which students have ready access to materials such ascounters, calculators, and computers and in which they are encouragedto use a wide variety of strategies support thinking that results in mul-tiple levels of understanding.
Two examples illustrate how conversations with students give teach-ers useful information about students’ thinking. Both examples havebeen drawn from observations of students.
Katie, a kindergarten student, said that her sister in third grade hadtaught her to multiply. “Give me a problem,” she said. The teacherasked, “How much is three times four?” There was a long pause beforeKatie replied, “Twelve!” When the teacher asked how she knew, Katieresponded, “I counted ducks in my head—three groups with fourducks.” Katie, while demonstrating an additive understanding of multi-plication by counting the ducks in each group, was also exhibiting aninterest in, and readiness for, mathematics that is traditionally a focus inthe higher grades. Luis, a second grader, demonstrated fluency withcomposing and decomposing numbers when he announced that hecould figure out multiplication. His teacher asked, “Can you tell mefour times seven?” Luis was quiet for a few moments, and then he gavethe answer twenty-eight. When the teacher asked how he got twenty-eight, Luis replied, “Seven plus three is ten, and four more is fourteen;six more is twenty and one more is twenty-one; seven more is twenty-eight.” Luis’s approach also built on additive thinking but with a farmore sophisticated use of number relationships. He added 7 + 7 + 7 + 7mentally by breaking the sevens into parts to complete tens along theway.
Students are intrigued with calculators and computers and can bechallenged by the mathematics that technology makes available tothem, as shown in the following episode, adapted from Riedesel (1980,pp. 74–75):
Erik, a very capable kindergarten student, observed his teacher usinga calculator and asked how it worked. The teacher showed him howto compute simple additions. Erik took the calculator to the mathcorner and a few minutes later loudly proclaimed, “Five plus fourequals nine. Hey, this thing got it right!” A few minutes later, hewalked over to the teacher and they had the following conversation:
Erik: What does this button mean? Teacher: That’s called the “square root.” It’s a pretty difficult idea in
math. Erik: OK. (He wanders away, but not for long.) But this is a
disaster! I pressed 2, then the square-root key, and I got awhole lot of numbers.
Teacher: Try using 1. (Erik tries this.)Erik: That just gives 1 back.
120 Principles and Standards for School Mathematics
Rep
rese
ntat
ion
| C
onne
ctio
ns |
Com
mun
icat
ion
| R
easo
ning
& P
roof
| P
robl
em S
olvi
ng |
Dat
a A
naly
sis
& P
roba
bilit
y |
Mea
sure
men
t |
Geo
met
ry |
Alg
ebra
| N
umbe
r &
Ope
ratio
ns
E-example 4.4
Tangram Challenges (Part 2)

Teachers should askstudents to reflect on,explain, and justify theiranswers.
Teacher: Try 4. (Erik notes that the result is 2 and asks why. The teachertells him to get the square tiles and put out one.) Is that asquare? (Erik nods.) Try to add more tiles beside this oneuntil it is a square again. (Erik adds one tile.) Is that asquare?
Erik: No, it’s a rectangle. (The teacher asks how he could make itinto a square, and Erik adds two more tiles.)
Teacher: How many tiles are there in all? (Erik responds that there arefour.) Good. Press 4 on the calculator. How long is thebottom of the square?
Erik: Two.Teacher: And here at the left side?
Erik: Two there, too.Teacher: Press the square-root key.
Erik: Hey, it comes out 2!
The teacher challenged Erik to add more tiles until he made an-other square. Erik built a 3 × 3 array, counted the total tiles, enteredthis number into the calculator, and pressed the square-root key. Hefound that the result was the number of rows and also the numberof tiles in each row. Erik kept building squares until at a 9 × 9 arrayhe said his eyes hurt. The teacher asked him what he had found out.
Erik: Well, if you make a square, then all you have to do is countthe tiles and press that number and the square-root keyand the calculator tells you how many tiles there are oneach side.
Teacher: Good work! What else does that number mean?Erik: It means that there are that many rows and that many
tiles in each row. (The teacher congratulates Erik on figuringthis out.) Yeah, I guess if you want to learn something re-ally bad, you can. Tomorrow, I’m going to go up to onehundred!
Teachers should ask students to reflect on, explain, and justify theiranswers so that problem solving both leads to and confirms students’understanding of mathematical concepts. For example, following anestimation activity in a first-grade class, students learned that therewere eighty-three marbles in a jar. There were twenty-five students inthe class, so the teacher asked how many marbles each child could get.Graham said, “Three.” When the teacher asked how he knew, Grahamreplied, “Eighty-three is just a little more than seventy-five, so we onlyget three. There are four quarters in a dollar. There are three quartersin seventy-five cents. So we can only get three.”
Teachers must make certain that problem solving is not reserved forolder students or those who have “got the basics.” Young students canengage in substantive problem solving and in doing so develop basicskills, higher-order-thinking skills, and problem-solving strategies(Cobb et al. 1991; Trafton and Hartman 1997).
121Standards for Pre-K–2: Problem Solving
Num
ber & O
perations | Algebra | G
eometry | M
easurement | D
ata Analysis &
Probability | P
roblem S
olving | Reasoning &
Proof | C
omm
unication | Connections | R
epresentation
122 Principles and Standards for School Mathematics
Instructional programs fromprekindergarten through grade 12should enable all students to—
Recognize reasoning and proof asfundamental aspects of mathematics
Make and investigate mathematicalconjectures
Develop and evaluate mathematicalarguments and proofs
Select and use various types ofreasoning and methods of proof
Pre-K–2Standard
for Grades
Reasoning and Proof
Young students are just forming their store of mathematical knowl-edge, but even the youngest can reason from their own experiences(Bransford, Brown, and Cocking 1999). Although young children areworking from a small knowledge base, their logical reasoning beginsbefore school and is continually modified by their experiences. Teachersshould maintain an environment that respects, nurtures, and encour-ages students so that they do not give up their belief that the world, in-cluding mathematics, is supposed to make sense.
Although they have yet to develop all the tools used in mathematicalreasoning, young students have their own ways of finding mathematicalresults and convincing themselves that they are true. Two important el-ements of reasoning for students in the early grades are pattern-recog-nition and classification skills. They use a combination of ways of justi-fying their answers—perception, empirical evidence, and short chainsof deductive reasoning grounded in previously accepted facts. Theymake conjectures and reach conclusions that are logical and defensiblefrom their perspective. Even when they are struggling, their responsesreveal the sense they are making of mathematical situations.
Young students naturally generalize from examples (Carpenter andLevi 1999), so teachers should guide them to use examples and coun-terexamples to test whether their generalizations are appropriate. Bythe end of second grade, students should be using this method for test-ing their conjectures and those of others.
What should reasoning and proof look like inprekindergarten through grade 2?
The ability to reason systematically and carefully develops when stu-dents are encouraged to make conjectures, are given time to search forevidence to prove or disprove them, and are expected to explain andjustify their ideas. In the beginning, perception may be the predomi-nant method of determining truth: nine markers spread far apart maybe seen as “more” than eleven markers placed close together. Later, asstudents develop their mathematical tools, they should use empiricalapproaches such as matching the collections, which leads to the use ofmore-abstract methods such as counting to compare the collections.Maturity, experiences, and increased mathematical knowledge togetherpromote the development of reasoning throughout the early years.
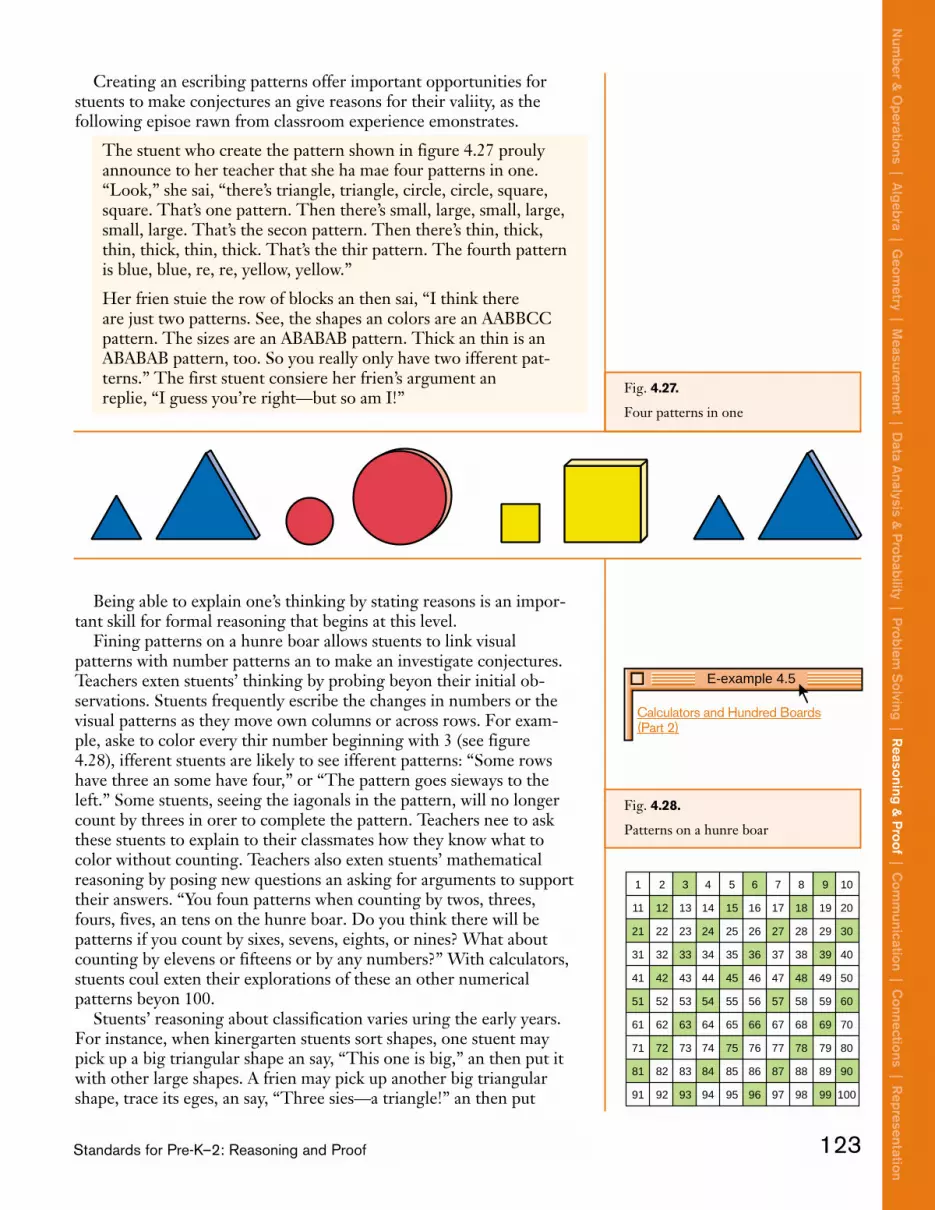
Creating and describing patterns offer important opportunities forstudents to make conjectures and give reasons for their validity, as thefollowing episode drawn from classroom experience demonstrates.
The student who created the pattern shown in figure 4.27 proudlyannounced to her teacher that she had made four patterns in one.“Look,” she said, “there’s triangle, triangle, circle, circle, square,square. That’s one pattern. Then there’s small, large, small, large,small, large. That’s the second pattern. Then there’s thin, thick,thin, thick, thin, thick. That’s the third pattern. The fourth patternis blue, blue, red, red, yellow, yellow.”
Her friend studied the row of blocks and then said, “I think thereare just two patterns. See, the shapes and colors are an AABBCCpattern. The sizes are an ABABAB pattern. Thick and thin is anABABAB pattern, too. So you really only have two different pat-terns.” The first student considered her friend’s argument andreplied, “I guess you’re right—but so am I!”
Being able to explain one’s thinking by stating reasons is an impor-tant skill for formal reasoning that begins at this level.
Finding patterns on a hundred board allows students to link visualpatterns with number patterns and to make and investigate conjectures.Teachers extend students’ thinking by probing beyond their initial ob-servations. Students frequently describe the changes in numbers or thevisual patterns as they move down columns or across rows. For exam-ple, asked to color every third number beginning with 3 (see figure4.28), different students are likely to see different patterns: “Some rowshave three and some have four,” or “The pattern goes sideways to theleft.” Some students, seeing the diagonals in the pattern, will no longercount by threes in order to complete the pattern. Teachers need to askthese students to explain to their classmates how they know what tocolor without counting. Teachers also extend students’ mathematicalreasoning by posing new questions and asking for arguments to supporttheir answers. “You found patterns when counting by twos, threes,fours, fives, and tens on the hundred board. Do you think there will bepatterns if you count by sixes, sevens, eights, or nines? What aboutcounting by elevens or fifteens or by any numbers?” With calculators,students could extend their explorations of these and other numericalpatterns beyond 100.
Students’ reasoning about classification varies during the early years.For instance, when kindergarten students sort shapes, one student maypick up a big triangular shape and say, “This one is big,” and then put itwith other large shapes. A friend may pick up another big triangularshape, trace its edges, and say, “Three sides—a triangle!” and then put
123Standards for Pre-K–2: Reasoning and Proof
Num
ber & O
perations | Algebra | G
eometry | M
easurement | D
ata Analysis &
Probability | P
roblem S
olving | Reasoning &
Proof | C
omm
unication | Connections | R
epresentation
Fig. 4.27.
Four patterns in one
Fig. 4.28.
Patterns on a hundred board
1 2 3 4 5 6 7 8 9 10
11 12 13 14 15 16 17 18 19 20
21 22 23 24 25 26 27 28 29 30
31 32 33 34 35 36 37 38 39 40
41 42 43 44 45 46 47 48 49 50
51 52 53 54 55 56 57 58 59 60
61 62 63 64 65 66 67 68 69 70
71 72 73 74 75 76 77 78 79 80
81 82 83 84 85 86 87 88 89 90
91 92 93 94 95 96 97 98 99 100
E-example 4.5
Calculators and Hundred Boards(Part 2)
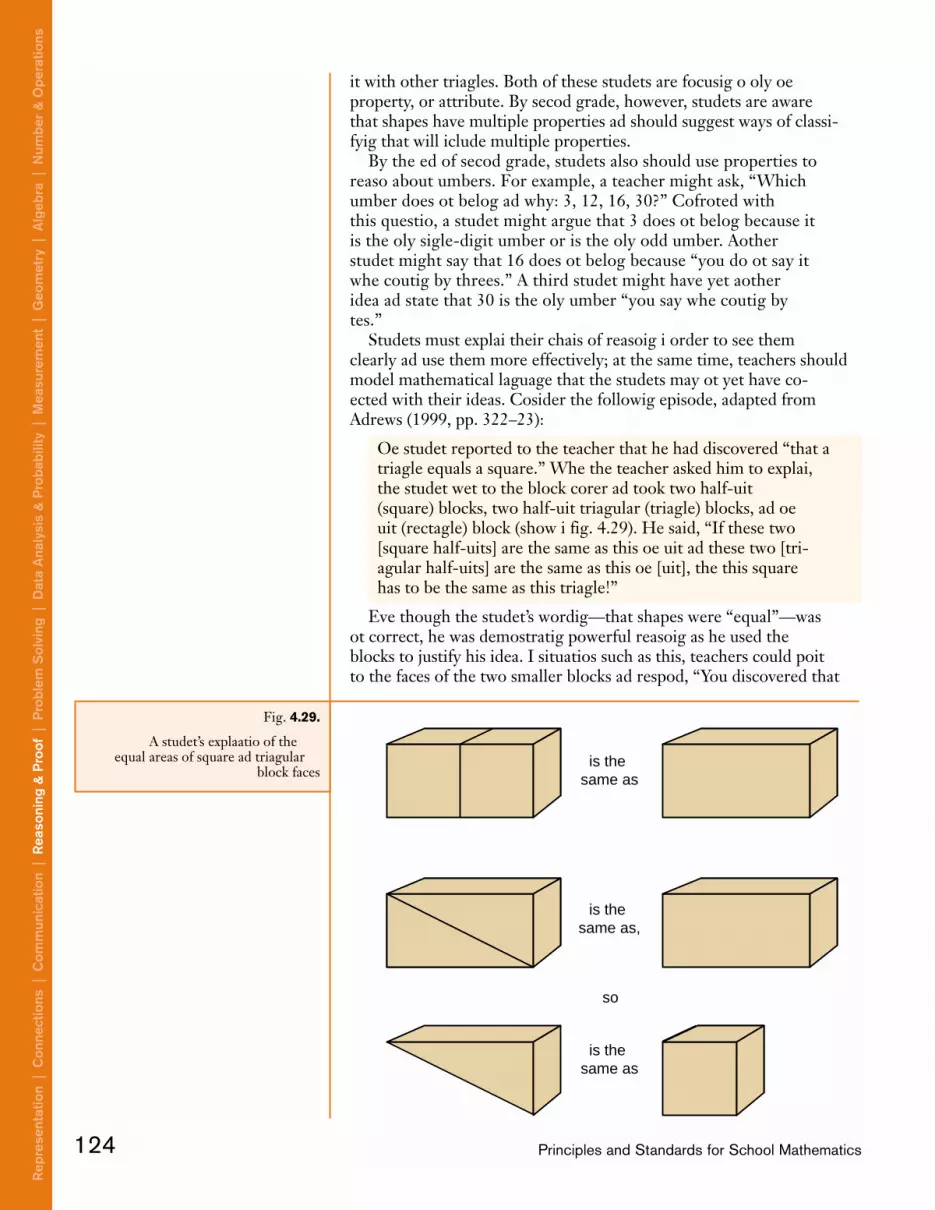
it with other triangles. Both of these students are focusing on only oneproperty, or attribute. By second grade, however, students are awarethat shapes have multiple properties and should suggest ways of classi-fying that will include multiple properties.
By the end of second grade, students also should use properties toreason about numbers. For example, a teacher might ask, “Whichnumber does not belong and why: 3, 12, 16, 30?” Confronted withthis question, a student might argue that 3 does not belong because itis the only single-digit number or is the only odd number. Anotherstudent might say that 16 does not belong because “you do not say itwhen counting by threes.” A third student might have yet anotheridea and state that 30 is the only number “you say when counting bytens.”
Students must explain their chains of reasoning in order to see themclearly and use them more effectively; at the same time, teachers shouldmodel mathematical language that the students may not yet have con-nected with their ideas. Consider the following episode, adapted fromAndrews (1999, pp. 322–23):
One student reported to the teacher that he had discovered “that atriangle equals a square.” When the teacher asked him to explain,the student went to the block corner and took two half-unit(square) blocks, two half-unit triangular (triangle) blocks, and oneunit (rectangle) block (shown in fig. 4.29). He said, “If these two[square half-units] are the same as this one unit and these two [tri-angular half-units] are the same as this one [unit], then this squarehas to be the same as this triangle!”
Even though the student’s wording—that shapes were “equal”—wasnot correct, he was demonstrating powerful reasoning as he used theblocks to justify his idea. In situations such as this, teachers could pointto the faces of the two smaller blocks and respond, “You discovered that
124 Principles and Standards for School Mathematics
Rep
rese
ntat
ion
| C
onne
ctio
ns |
Com
mun
icat
ion
| R
easo
ning
& P
roof
| P
robl
em S
olvi
ng |
Dat
a A
naly
sis
& P
roba
bilit
y |
Mea
sure
men
t |
Geo
met
ry |
Alg
ebra
| N
umbe
r &
Ope
ratio
ns
Fig. 4.29.
A student’s explanation of the equal areas of square and triangular
block facesis the
same as
is the same as,
is the same as
so

Teachers should helpstudents recognize thatall mathematics can andshould be understood.
the area of this square equals the area of this triangle because each ofthem is half the area of the same larger rectangle.”
What should be the teacher’s role in developingreasoning and proof in prekindergarten through grade 2?
Teachers should create learning environments that help students rec-ognize that all mathematics can and should be understood and that theyare expected to understand it. Classrooms at this level should bestocked with physical materials so that students have many opportuni-ties to manipulate objects, identify how they are alike or different, andstate generalizations about them. In this environment, students can dis-cover and demonstrate general mathematical truths using specific ex-amples. Depending on the context in which events such as the one illus-trated by figure 4.29 take place, teachers might focus on differentaspects of students’ reasoning and continue conversations with differentstudents in different ways. Rather than restate the student’s discovery inmore-precise language, a teacher might pose several questions to deter-mine whether the student was thinking about equal areas of the faces ofthe blocks, or about equal volumes. Often students’ responses to in-quiries that focus their thinking help them phrase conclusions in more-precise terms and help the teacher decide which line of mathematicalcontent to pursue.
Teachers should prompt students to make and investigate mathemat-ical conjectures by asking questions that encourage them to build onwhat they already know. In the example of investigating patterns on ahundred board, for instance, teachers could challenge students to con-sider other ideas and make arguments to support their statements: “Ifwe extended the hundred board by adding more rows until we had athousand board, how would the skip-counting patterns look?” or “If wemade charts with rows of six squares or rows of fifteen squares to countto a hundred, would there be patterns if we skip-counted by twos orfives or by any numbers?”
Through discussion, teachers help students understand the role ofnonexamples as well as examples in informal proof, as demonstrated ina study of young students (Carpenter and Levi 1999, p. 8). The stu-dents seemed to understand that number sentences like 0 + 5869 = 5869were always true. The teacher asked them to state a rule. Ann said,“Anything with a zero can be the right answer.” Mike offered a coun-terexample: “No. Because if it was 100 + 100 that’s 200.” Ann under-stood that this invalidated her rule, so she rephrased it, “I said, umm, ifyou have a zero in it, it can’t be like 100, because you want just plainzero like 0 + 7 = 7.”
The students in the study could form rules on the basis of examples.Many of them demonstrated the understanding that a single examplewas not enough and that counterexamples could be used to disprove aconjecture. However, most students experienced difficulty in giving jus-tifications other than examples.
From the very beginning, students should have experiences that helpthem develop clear and precise thought processes. This development ofreasoning is closely related to students’ language development and isdependent on their abilities to explain their reasoning rather than just
125Standards for Pre-K–2: Reasoning and Proof
Num
ber & O
perations | Algebra | G
eometry | M
easurement | D
ata Analysis &
Probability | P
roblem S
olving | Reasoning &
Proof | C
omm
unication | Connections | R
epresentation

give the answer. As students learn language, they acquire basic logicwords, including not, and, or, all, some, if…then, and because. Teachersshould help students gain familiarity with the language of logic by usingsuch words frequently. For example, a teacher could say, “You maychoose an apple or a banana for your snack” or “If you hurry and put onyour jacket, then you will have time to swing.” Later, students shoulduse the words modeled for them to describe mathematical situations:“If six green pattern blocks cover a yellow hexagon, then three bluesalso will cover it, because two greens cover one blue.”
Sometimes students reach conclusions that may seem odd to adults,not because their reasoning is faulty, but because they have differentunderlying beliefs. Teachers can understand students’ thinking whenthey listen carefully to students’ explanations. For example, on hearingthat he would be “Star of the Week” in half a week, Ben protested, “Youcan’t have half a week.” When asked why, Ben said, “Seven can’t go intoequal parts.” Ben had the idea that to divide 7 by 2, there could be twogroups of 3, with a remainder of 1, but at that point Ben believed thatthe number 1 could not be divided.
Teachers should encourage students to make conjectures and to jus-tify their thinking empirically or with reasonable arguments. Most im-portant, teachers need to foster ways of justifying that are within thereach of students, that do not rely on authority, and that gradually in-corporate mathematical properties and relationships as the basis for theargument. When students make a discovery or determine a fact, ratherthan tell them whether it holds for all numbers or if it is correct, theteacher should help the students make that determination themselves.Teachers should ask such questions as “How do you know it is true?”and should also model ways that students can verify or disprove theirconjectures. In this way, students gradually develop the abilities to de-termine whether an assertion is true, a generalization valid, or an an-swer correct and to do it on their own instead of depending on the au-thority of the teacher or the book.
Teachers canunderstand students’thinking when they
listen carefully tostudents’ explanations.
126 Principles and Standards for School Mathematics
Rep
rese
ntat
ion
| C
onne
ctio
ns |
Com
mun
icat
ion
| R
easo
ning
& P
roof
| P
robl
em S
olvi
ng |
Dat
a A
naly
sis
& P
roba
bilit
y |
Mea
sure
men
t |
Geo
met
ry |
Alg
ebra
| N
umbe
r &
Ope
ratio
ns

Blank Page

128 Principles and Standards for School Mathematics
Pre-K–2Standard
for Grades
Communication
Instructional programs fromprekindergarten through grade 12should enable all students to—
Organize and consolidate theirmathematical thinking throughcommunication
Communicate their mathematicalthinking coherently and clearly topeers, teachers, and others
Analyze and evaluate the mathe-matical thinking and strategies ofothers
Use the language of mathematicsto express mathematical ideas precisely
Language, whether used to express ideas or to receive them, is a verypowerful tool and should be used to foster the learning of mathematics.Communicating about mathematical ideas is a way for students to articu-late, clarify, organize, and consolidate their thinking. Students, like adults,exchange thoughts and ideas in many ways—orally; with gestures; andwith pictures, objects, and symbols. By listening carefully to others, stu-dents can become aware of alternative perspectives and strategies. Bywriting and talking with others, they learn to use more-precise mathemat-ical language and, gradually, conventional symbols to express their mathe-matical ideas. Communication makes mathematical thinking observableand therefore facilitates further development of that thought. It encour-ages students to reflect on their own knowledge and their own ways ofsolving problems. Throughout the early years, students should have dailyopportunities to talk and write about mathematics. They should becomeincreasingly effective in communicating what they understand throughtheir own notation and language as well as in conventional ways.
What should communication look like duringprekindergarten through grade 2?
Children begin to communicate mathematically very early in theirlives. They want more milk, a different toy, or three books. The com-munication abilities of most children have developed tremendously be-fore they enter kindergarten. This growth is determined to a large ex-tent by the children’s maturity, how language is modeled for them, andtheir opportunities and experiences. Verbal interaction with families andcaregivers is a primary means for promoting the development of earlymathematical vocabulary.
Language is as important to learning mathematics as it is to learningto read. As students enter school, their opportunities to communicateare expanded by new learning resources, enriched uses of language, andexperiences with classmates and teachers. Students’ developing commu-nication skills can be used to organize and consolidate their mathemati-cal thinking. Teachers should help students learn how to talk aboutmathematics, to explain their answers, and to describe their strategies.Teachers can encourage students to reflect on class conversations and to“talk about talking about mathematics” (Cobb, Wood, and Yackel 1994).
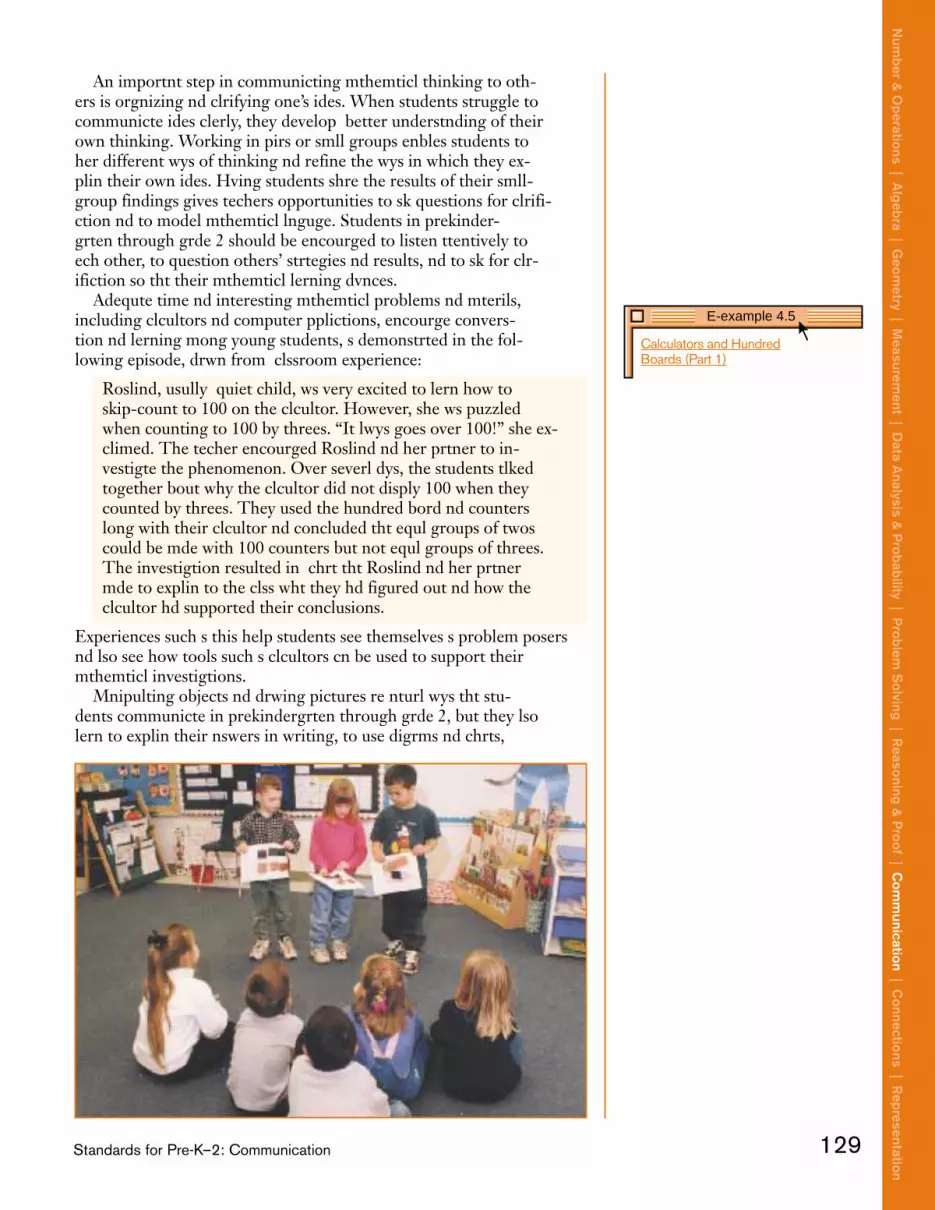
An important step in communicating mathematical thinking to oth-ers is organizing and clarifying one’s ideas. When students struggle tocommunicate ideas clearly, they develop a better understanding of theirown thinking. Working in pairs or small groups enables students tohear different ways of thinking and refine the ways in which they ex-plain their own ideas. Having students share the results of their small-group findings gives teachers opportunities to ask questions for clarifi-cation and to model mathematical language. Students in prekinder-garten through grade 2 should be encouraged to listen attentively toeach other, to question others’ strategies and results, and to ask for clar-ification so that their mathematical learning advances.
Adequate time and interesting mathematical problems and materials,including calculators and computer applications, encourage conversa-tion and learning among young students, as demonstrated in the fol-lowing episode, drawn from a classroom experience:
Rosalinda, usually a quiet child, was very excited to learn how toskip-count to 100 on the calculator. However, she was puzzledwhen counting to 100 by threes. “It always goes over 100!” she ex-claimed. The teacher encouraged Rosalinda and her partner to in-vestigate the phenomenon. Over several days, the students talkedtogether about why the calculator did not display 100 when theycounted by threes. They used the hundred board and countersalong with their calculator and concluded that equal groups of twoscould be made with 100 counters but not equal groups of threes.The investigation resulted in a chart that Rosalinda and her partnermade to explain to the class what they had figured out and how thecalculator had supported their conclusions.
Experiences such as this help students see themselves as problem posersand also see how tools such as calculators can be used to support theirmathematical investigations.
Manipulating objects and drawing pictures are natural ways that stu-dents communicate in prekindergarten through grade 2, but they alsolearn to explain their answers in writing, to use diagrams and charts,
129Standards for Pre-K–2: Communication
Num
ber & O
perations | Algebra | G
eometry | M
easurement | D
ata Analysis &
Probability | P
roblem S
olving | Reasoning &
Proof | C
omm
unication | Connections | R
epresentation
E-example 4.5
Calculators and HundredBoards (Part 1)

and to express ideas with mathematical symbols. Their language shouldbecome more precise as they use words such as angles and faces insteadof corners and sides. Opportunities to express their ideas encourage stu-dents to organize and consolidate their mathematical thinking.
Young students’ abilities to talk and listen are usually more advancedthan their abilities to read and write, especially in the early years of thisgrade band. Therefore, teachers must be diligent in providing experi-ences that allow varied forms of communication as a natural componentof mathematics class, as the following episode, adapted from Andrews(1996, p. 293), demonstrates:
A kindergarten teacher read a story about a family’s journey acrossthe country. She asked the students to make maps to show the routetaken by the family. As they worked in groups, some students incor-porated letters or other symbols into the work. One group drewpictures of each landmark. Another group asked the teacher to helpthem label parts of their map and numbered each step along theway. As each group shared its work with the class, the teacher askedwhat changes they would make next time that might improve theirwork. The maps were hung in the hall, giving the teacher opportu-nities to question the students about the mathematical ideas ofspace and navigation they had used in creating the maps.
What should be the teacher’s role in developingcommunication in prekindergarten through grade 2?
Teachers can create and structure mathematically rich environmentsfor students in a number of ways. They should present problems thatchallenge students mathematically, but they should also let studentsknow they believe that the students can solve them. They should expectstudents to explain their thinking and should give students many oppor-tunities to talk with, and listen to, their peers. Teachers should recognizethat learning to analyze and reflect on what is said by others is essentialin developing an understanding of both content and process. When it isdifficult for young learners to follow the reasoning of a classmate, teach-ers can help by guiding students to rephrase their reasoning in wordsthat are easier for themselves and others to understand. Teachers shouldmodel appropriate conventional vocabulary and help students build suchvocabulary on the basis of shared knowledge and processes.
Teachers should support students’ mathematics learning through thelanguages that they bring to school; they should also help them developstandard English vocabulary and mathematical terms that will enablethem to communicate better with others. Students should be encour-aged and respected when they use their native language as well as Eng-lish in their mathematical communications. If possible, the mathemati-cal terms should be displayed in both English and the native languages.Students who are not yet proficient in English can be paired with otherstudents who speak the same language and with bilingual students orcommunity volunteers, who can support the communication of ideas tothe teacher and the rest of the class.
Teachers also need to be aware that the patterns of communicationbetween students and adults in the school may not necessarily match thepatterns of communication in students’ homes. For example, patterns of
Teachers must bediligent in providing
experiences that allowvaried forms ofcommunication.
130 Principles and Standards for School Mathematics
Rep
rese
ntat
ion
| C
onne
ctio
ns |
Com
mun
icat
ion
| R
easo
ning
& P
roof
| P
robl
em S
olvi
ng |
Dat
a A
naly
sis
& P
roba
bilit
y |
Mea
sure
men
t |
Geo
met
ry |
Alg
ebra
| N
umbe
r &
Ope
ratio
ns

Teachers should modelappropriate conventionalvocabulary.
questioning can be very different. In some cultures, adults generally donot ask questions when the answer is known; they ask questions primar-ily to seek information that they do not have. In school, however, teach-ers frequently ask questions to which the answer is known. Students whoare not accustomed to such questions can be bewildered, since it is obvi-ous that the teacher already knows the answers. Similarly, in some cul-tures, people routinely interrupt one another in conversations, whereasin others, interruptions are considered extremely rude. Students fromthe first group may unduly dominate class discussions. In other cultures,children are expected not to ask questions but to learn by observation. Astudent from such a group may be uncomfortable asking questions inclass (Bransford, Brown, and Cocking 1999). Teachers need to be awareof the cultural patterns in their students’ communities in order to pro-vide equitable opportunities for them to communicate about mathemati-cal thinking.
Building a community of learners, where students exchange mathe-matical ideas not only with the teacher but also with one another,should be a goal in every classroom. Consider the following example,which has been drawn from a classroom experience:
A teacher asked, “How many books do I need to return to the library if I have three nonfiction and four fiction books?” A student who seldom shared his answers with the class voluntarily responded, “Seven.” In the past, if the teacher asked him how hefigured out a problem, the student just shrugged his shoulders. This time, however, the teacher decided to involve another studentand asked her, “How do you think Maury figured it out?” The second student held up three fingers as she answered, “I think hedid it this way. I know there are three, so I just put up four morefingers and then count them all.” This prompted Maury to respond,“I did it a different way. I just knew that three and three make sixand then I counted one more.”
The teacher thus set the stage for two students to explain their meth-ods and for all their classmates to hear and discuss the two ways ofthinking about the same problem.
Just as teachers accept multiple forms of communication from theirstudents, so they should also communicate with the students in a varietyof ways to ensure maximum success for all. For example, because not allchildren at this level are able to follow written instructions, teacherscould decide to read instructions or to draw pictures to represent thesequence and contents of a task.
It is the responsibility of the teacher to recognize appropriate timesto make connections between invented symbols and standard notation.When students present their own representations of their mathematicalknowledge, the presentations are often unique and creative. For in-stance, figure 4.30 is a kindergartner’s notation to remember that a jarheld ten and a half scoops. Teachers must seek to understand what stu-dents are trying to communicate and use that information to advanceindividual students’ learning and that of the class as a whole. The use ofmathematical symbols should follow, not precede, other ways of com-municating mathematical ideas. In this way, teachers help young stu-dents relate their everyday language to mathematical language andsymbols in a meaningful way.
131Standards for Pre-K–2: Communication
Num
ber & O
perations | Algebra | G
eometry | M
easurement | D
ata Analysis &
Probability | P
roblem S
olving | Reasoning &
Proof | C
omm
unication | Connections | R
epresentation
Fig. 4.30.
A child’s notation for 10 1/2

132 Principles and Standards for School Mathematics
Pre-K–2Standard
for Grades
Connections
Instructional programs fromprekindergarten through grade 12should enable all students to—
Recognize and use connectionsamong mathematical ideas
Understand how mathematicalideas interconnect and build on oneanother to produce a coherentwhole
Recognize and apply mathematicsin contexts outside of mathematics
The most important connection for early mathematics developmentis between the intuitive, informal mathematics that students havelearned through their own experiences and the mathematics they arelearning in school. All other connections—between one mathematicalconcept and another, between different mathematics topics, betweenmathematics and other fields of knowledge, and between mathematicsand everyday life—are supported by the link between the students’ in-formal experiences and more-formal mathematics. Students’ abilities toexperience mathematics as a meaningful endeavor that makes senserests on these connections.
When young students use the relationships in and among mathemat-ical content and processes, they advance their knowledge of mathe-matics and extend their ability to apply concepts and skills more effec-tively. Understanding connections eliminates the barriers that separatethe mathematics learned in school from the mathematics learned else-where. It helps students realize the beauty of mathematics and its func-tion as a means of more clearly observing, representing, and interpret-ing the world around them.
Teachers can facilitate these connections in several ways: Theyshould spotlight the many situations in which young students encountermathematics in and out of school. They should make explicit the con-nections between and among the mathematical ideas students are devel-oping, such as subtraction with addition, measurement with numberand geometry, or representations with algebra and problem solving.They should plan lessons so that skills and concepts are taught not asisolated topics but rather as valued, connected, and useful parts of stu-dents’ experiences.
What should connections look like in prekindergartenthrough grade 2?
Young children often connect new mathematical ideas with old onesby using concrete objects. When a preschool child holds up three fin-gers and asks an adult, “Am I this many years old?” he is trying to con-nect the word three with the number that represents his age through aset of concrete objects, his fingers. Teachers should encourage studentsto use their own strategies to make connections among mathematical

ideas, the vocabulary associated with the ideas, and the ways the ideasare represented. For example, students frequently use objects andcounting strategies as they develop their understanding of addition andsubtraction and connect the two operations.
Students can better understand relationships among the many as-pects of mathematics as they engage in purposeful activities. Often ac-tivities that include making estimates provide links among concepts inmultiple Standards (Roche 1996). Consider the following example:
In a second-grade class in which students were investigating fillingjars with scoops of cranberries, the teacher had students first esti-mate the number of scoops needed. They organized the estimatesinto a graph and talked about the range of numbers. After pouringsome scoops into one jar as a referent, the students refined their es-timates and talked about how and why the range was narrowed.Throughout the lesson, which included several more activities, stu-dents worked in groups and repeatedly came back to whole-classdiscussions that involved mathematics expectations about numberand operations, data analysis, and connections.
In another example, the process of making a string of cubes by usingonly two colors of connecting cubes helps students understand addi-tion. It also involves pattern and relates ideas from number and geom-etry. As students try to find different ways of building a string of fourcubes, if order does not matter and there are only two different colors,they may discover that only five different solutions are possible. Fur-ther investigation can reveal that there are six ways to build a string offive cubes (see fig. 4.31). Using this knowledge, some students maygeneralize and predict that a string of six cubes can be built in sevendifferent ways.
Mathematics is embedded in many activities that young students dothroughout the day. For example, in physical education class, childrenmay count the number of times they can jump rope successfully. Theymay measure and compare the amount of time the members of a teamtake to sprint from one end of the gym to the other. Concepts involvinggeometric shapes are reinforced as children form a circle to play agame, take their places around the outer edge of a parachute, or assumetheir positions to play a game on the field. Students explore symmetryin art class as they make hearts by folding and cutting paper. They clas-sify leaves collected on a nature walk in science lessons. In music, theysing songs rich in patterns.
In one first-grade classroom, children used the mathematics of pat-terns to investigate and quantify syllables in names, as related in thisepisode drawn from a classroom experience:
The teacher clapped out a student’s name (one clap for each sylla-ble) and asked the students if they could figure out whose name shewas clapping. They realized that her clapping matched the names ofseveral students. When the class began to try to determine whichstudents had the same number of claps in their names, the teacherdrew the chart shown in figure 4.32 on the board. She added stu-dents’ names as the class identified the number of beats in a name.One student stated that he could not find a name with seven beats.Another student disagreed and illustrated seven beats by including
133Standards for Pre-K–2: Connections
Num
ber & O
perations | Algebra | G
eometry | M
easurement | D
ata Analysis &
Probability | P
roblem S
olving | Reasoning &
Proof | C
omm
unication | Connections | R
epresentation
Five red
Four red and one yellow
Three red and two yellow
Two red and three yellow
One red and four yellow
Five yellow
Fig. 4.31.
Building a string of five cubes by usingonly two colors
E-example 4.6
Cranberries (video vignette)

the beats in her middle name in her total. Other students thenbegan to experiment with middle names and nicknames to matchthe number of beats in other names. One student looked at thechart and questioned whether John Gosha and Timmy Simms wereactually “beat twins.” Even though the number of beats was thesame, the names sounded different. This encouraged the studentsto record their name-beat patterns in a more specific way using thenumber of syllables in each word to help them write different equa-tions with the same sums (see fig. 4.33).
As the students determined the best ways to describe name beatsthrough number, they also were reinforcing their arithmetic skills.They were also actually creating a function that assigned a number toeach student’s name. Such interplay, in which mathematics illuminates asituation and the situation illuminates mathematics, is an important as-pect of mathematical connections.
Seeing the usefulness of mathematics contributes to students’ successin situations requiring mathematical solutions. When students measurethe field for the hundred-yard relay, they truly know the purpose oflearning to measure. Determining when they have saved enough al-lowance money to purchase a prized toy helps students realize the use-fulness and importance of the knowledge of counting, of addition, andof the value of coins. Pointing to the hexagonal pattern in a honeycombillustrates the use of mathematical ideas in describing nature. Surveyingfriends and family members about a favorite vacation site gives meaningand purpose to data collection. Observing the patterns on the fences intown demonstrates how mathematics is used in construction. These associations add purpose and pleasure to the learning of mathematics.
What should be the teacher’s role in developingconnections in prekindergarten through grade 2?
In classrooms where connecting mathematical ideas is a focus,lessons are fluid and take many different formats. Teachers should en-sure that links are made between routine school activities and mathe-matics by asking questions that emphasize the mathematical aspects ofsituations. They should plan tasks in new contexts that revisit topicspreviously taught, enabling students to forge new links between previ-ously learned mathematical concepts and procedures and new applica-tions, always with an eye on their mathematics goals. When teachershelp students make explicit connections—mathematics to other mathe-matics and mathematics to other content areas—they are helping stu-dents learn to think mathematically.
Often connections are best made when students are challenged toapply mathematics learning in extended projects and investigations. As
134 Principles and Standards for School Mathematics
Rep
rese
ntat
ion
| C
onne
ctio
ns |
Com
mun
icat
ion
| R
easo
ning
& P
roof
| P
robl
em S
olvi
ng |
Dat
a A
naly
sis
& P
roba
bilit
y |
Mea
sure
men
t |
Geo
met
ry |
Alg
ebra
| N
umbe
r &
Ope
ratio
ns
Fig. 4.32.
A chart showing the number of beatsin students’ names
Fig. 4.33.
Recording name-beat patterns

Teachers shouldcapitalize on unexpectedlearning opportunities.
they formulate questions and design inquiries, students decide on meth-ods of gathering and recording information and plan representations tocommunicate the data and help them make reasonable conjectures andinterpretations.
Teachers can find in the way a child interprets mathematical situa-tions clues to that child’s understanding. They should listen to studentsin order to assess the connections students bring to their situation, andthey should use this information to plan activities that will further stu-dents’ mathematical knowledge and skills and establish new and differ-ent connections. A teacher can, for example, notice the different under-standings represented by different students’ comments or questionsabout pattern blocks: one student may ask the teacher to name a pattern-block shape; a second student might build a pattern-block design anddirect the teacher’s attention to its symmetry; a third student may ex-plain to the teacher that two pattern-block trapezoids together make ahexagon.
It is the responsibility of the teacher to help students see and experi-ence the interrelation of mathematical topics, the relationships betweenmathematics and other subjects, and the way that mathematics is em-bedded in the students’ world. Teachers should capitalize on unex-pected learning opportunities, such as the lesson in which syllables instudents’ names were recorded as equations. They should ask questionsthat direct students’ thinking and present tasks that help students seehow ideas are related.
135Standards for Pre-K–2: Connections
Num
ber & O
perations | Algebra | G
eometry | M
easurement | D
ata Analysis &
Probability | P
roblem S
olving | Reasoning &
Proof | C
omm
unication | Connections | R
epresentation

136 Principles and Standards for School Mathematics
Pre-K–2Standard
for Grades
Representation
Instructional programs fromprekindergarten through grade 12should enable all students to—
Create and use representations toorganize, record, and communicatemathematical ideas
Select, apply, and translate amongmathematical representations tosolve problems
Use representations to model andinterpret physical, social, andmathematical phenomena
Young students use many varied representations to build new under-standings and express mathematical ideas. Representing ideas and con-necting the representations to mathematics lies at the heart of under-standing mathematics. Teachers should analyze students’ representationsand carefully listen to their discussions to gain insights into the develop-ment of mathematical thinking and to enable them to provide support asstudents connect their languages to the conventional language of mathe-matics. The goals of the Communication Standard are closely linkedwith those of this Standard, with each set contributing to and supportingthe other.
Students in prekindergarten through grade 2 represent theirthoughts about, and understanding of, mathematical ideas through oraland written language, physical gestures, drawings, and invented andconventional symbols (Edwards, Gandini, and Forman 1993). Theserepresentations are methods for communicating as well as powerfultools for thinking. The process of linking different representations, in-cluding technological ones, deepens students’ understanding of mathe-matics because of the connections they make between ideas and theways the ideas can be expressed. Teachers can gain insight into students’thinking and their grasp of mathematical concepts by examining, ques-tioning, and interpreting their representations. Although a striking as-pect of children’s mathematical development in the pre-K–2 years istheir growth in using standard mathematical symbols, teachers at thislevel should encourage students to use multiple representations, andthey should assess the level of mathematical understanding conveyed bythose representations.
What should representation look like in prekindergartenthrough grade 2?
Young students represent their mathematical ideas and procedures inmany ways. They use physical objects such as their own fingers, naturallanguage, drawings, diagrams, physical gestures, and symbols. Throughinteractions with these representations, other students, and the teacher,students develop their own mental images of mathematical ideas. Al-though the representations that children use may not be those tradi-tionally used by adults, students’ representations provide a record of

137Standards for Pre-K–2: Representation
Num
ber & O
perations | Algebra | G
eometry | M
easurement | D
ata Analysis &
Probability | P
roblem S
olving | Reasoning &
Proof | C
omm
unication | Connections | R
epresentation
Fig. 4.34.
Three students’ representations forthe numbers of animals that went offto see the world
Student 1
Student 2 Student 3
their efforts to understand mathematics and also make their under-standing available to others.
Representations make mathematical ideas more concrete and avail-able for reflection. Students can represent ideas with objects that canbe moved and rearranged. Such concrete representations lay the foun-dation for the later use of symbols. Students’ representations are ofteninsightful and many times resemble more-conventional representa-tions. For example, a second grader working with place-value mats andbase-ten blocks can represent 103. The student might point to theblocks and tap at the empty column, explaining, “One hundred, (tap),three.” The tap helps the student connect the zero with the empty tenscolumn.
The following account of a lesson, drawn from a classroom experi-ence, illustrates that what children do and say as they find answers andrepresent their thinking gives teachers information about their levels ofunderstanding.
When a first-grade teacher read Rooster’s Off to See the World (Carle1971), the students’ representations of the number of animals goingoff to see the world varied (see fig. 4.34). Two cats, then three frogs,four turtles, and five fish joined the rooster for a total of fifteen ani-mals. To find how many went on the trip, some students drew theanimals and numbered them. Two students modeled the animalswith counters, counted, and wrote “15” on their papers. Other stu-dents used more traditional notations, although their representa-tions revealed different ways of thinking. One student declared theanswer to be zero, because all the animals had gone home when itgot dark.

The teacher was puzzled, however, by the student whose answerwas 21 (see fig. 4.35). The teacher asked the student to explain. Thestudent responded that she had noticed that there were fireflies inthe story on the page where the animals decided to turn around andgo home. She couldn’t count how many, but she thought there weresix because that was the pattern, so she drew the animals and added.The teacher asked about the list at the top right of the student’spaper, and she responded that she had made the tallies to show howmany, and there were 21.
Representations help students recognize the common mathematicalnature of different situations. Students might represent the followingthree scenarios by writing 5 – 3 = 2. The first problem is to determinethe number of objects left after three objects have been taken from acollection of five. The second problem is, How much taller is a tower offive cubes than a tower of three cubes? The third problem asks thenumber of balls that must be put into a box if it is to have five balls andthere are already three in the box. Students could also represent the sit-uations as 3 + � = 5. Seeing similarities in the ways to represent differ-ent situations is an important step toward abstraction.
Students use representations to organize their thinking. Representa-tions can carry some of the burden of remembering by letting studentsrecord intermediate steps in a process. For example, a student trying tofind the number of wheels in four bicycles and three tricycles drew thepicture shown in figure 4.36. In the first row, the student representedthe number of wheels on the bicycles and in the second, the number of
Seeing similarities inthe ways to represent
different situations is animportant step toward
abstraction.
138 Principles and Standards for School Mathematics
Rep
rese
ntat
ion
| C
onne
ctio
ns |
Com
mun
icat
ion
| R
easo
ning
& P
roof
| P
robl
em S
olvi
ng |
Dat
a A
naly
sis
& P
roba
bilit
y |
Mea
sure
men
t |
Geo
met
ry |
Alg
ebra
| N
umbe
r &
Ope
ratio
ns
Fig. 4.35.
A student’s representation of the number of animals that went off to see
the world

A major responsibility ofteachers is to create alearning environment inwhich students’ use ofmultiple representationsis encouraged.
139Standards for Pre-K–2: Representation
Num
ber & O
perations | Algebra | G
eometry | M
easurement | D
ata Analysis &
Probability | P
roblem S
olving | Reasoning &
Proof | C
omm
unication | Connections | R
epresentation
Fig. 4.36.
A student’s representation of the num-ber of wheels on four bicycles andthree tricycles (Adapted from Flores[1997, p. 86.])
wheels on the tricycles. Thus the student was able to compute the sumsseparately and add them together. The representation served as a place-holder for thoughts that were not yet internalized.
Understanding and using mathematical concepts and procedures isenhanced when students can translate between different representationsof the same idea. In doing so, students appreciate that some representa-tions highlight features of the problem in a better way or make it easierto understand certain properties. For example, a student who representsthree groups of four squares as an array and uses skip-counting (4, 8,12), repeated addition (4 + 4 + 4), and oral language to describe the rep-resentation as three rows of four squares is laying the groundwork forunderstanding multiplication and its properties as well as the area of arectangle.
What should be the teacher’s role in developingrepresentation in prekindergarten through grade 2?
A major responsibility of teachers is to create a learning environmentin which students’ use of multiple representations is encouraged, sup-ported, and accepted by their peers and adults. Teachers should guidestudents to develop and use multiple representations effectively. Stu-dents will thus develop their own perceptions, create their own evi-dence, structure their own analytical processes, and become confidentand competent in their use of mathematics.
Teachers at this level need to listen to what students say, thoughtfullyobserve their mathematical activities, analyze their recordings, and re-flect on the implications of the observations and analyses. Using repre-sentations helps students remember what they did and explain their rea-soning. Representations furnish a record of students’ thinking thatshows both the answer and the process, and they assist teachers in for-mulating questions that can help students reflect on their processes andproducts and advance their understanding of concepts and procedures.The information gathered from these multiple sources makes possible aclearer assessment of what students understand and what mathematicalideas are still developing.
Students should be encouraged to share their different representa-tions to help them consider other perspectives and ways of explainingtheir thinking. Teachers can model conventional ways of representingmathematical situations, but it is important for students to use repre-sentations that are meaningful to them. Transitions to conventional

notations should be connected to the methods and thinking of thestudents. For example, when students use blocks or mental computa-tion to solve a problem like “Find the sum of 17 + 25,” they fre-quently add the tens first. Teachers can write the intermediate stepsfor students as 10 + 20 = 30, 7 + 5 = 12, and 30 + 12 = 42. Studentsshould see their method recorded both horizontally and vertically andshould develop their own ways of keeping track of their work that areclear to them (see fig. 4.37).
Through class discussions of students’ ways of thinking and record-ing, teachers can lay foundations for students’ understanding of con-ventional ways of representing the process of adding numbers. Equallyimportant, students’ work and conversations about their representationscan reveal the extent to which they understand their use of symbols.
Written work often does not reveal a student’s entire thinking, as thefollowing hypothetical story about Armando demonstrates:
Armando does not show marks to cross out any digits or write asmall “1” to represent “borrowing” with paper-and-pencil subtrac-tion, but he consistently writes correct answers (see fig. 4.38).When the teacher probes, Armando explains that he has learned adifferent way to subtract at home. The teacher asks him to explainhis method. “From 8 to 14—that is 6, and we need to add 1 to the 2because we used 14 instead of 4.” He writes 6 in the units place andcontinues, “From 3 to 7 is 4,” and he writes 4 in the tens column.The teacher rephrases the second part of the method, emphasizingplace value: “So, you add 10 to the 20 and then subtract 70 – 30.”Realizing that the method is based on a property the class has re-cently discussed, that the same number can be added to both terms
It is important forstudents to use
representations that aremeaningful to them.
140 Principles and Standards for School Mathematics
Rep
rese
ntat
ion
| C
onne
ctio
ns |
Com
mun
icat
ion
| R
easo
ning
& P
roof
| P
robl
em S
olvi
ng |
Dat
a A
naly
sis
& P
roba
bilit
y |
Mea
sure
men
t |
Geo
met
ry |
Alg
ebra
| N
umbe
r &
Ope
ratio
ns
Fig. 4.37.
Recording a method to find 17 + 25 intwo different ways

of a difference and the result does not change, she invites the classto talk about the process Armando is using. After some discussion,one student explains, “You are adding 10 to 74 because you reallydid 14 – 8, and you also added 10 to 28 because you did 70 – 30. Sothe answer is the same.”
Teachers should help students understand that representations aretools to model and interpret phenomena of a mathematical nature thatare found in different contexts. Teachers should help students representaspects of situations in mathematical terms, possibly by using morethan one representation. Technology may help students who are chal-lenged by oral or written communication find greater success. The pro-cessing schema required in some computer programs can aid studentsin showing what they know. For example, when a student changes therepresentation of a number with base-ten blocks on the screen, thecomputer shows how the corresponding symbols change.
It is important that teachers realize and teach students that any rep-resentations, not only those created by students, are subject to multipleinterpretations. Drawings, charts, graphs, and diagrams, for instance,can be read in different ways. Therefore, teachers should not assumethat students understand a diagram or equation the same way adults do.Communicating the intended meaning and using alternative represen-tations can enhance understanding by students and teachers alike.
141Standards for Pre-K–2: Representation
Num
ber & O
perations | Algebra | G
eometry | M
easurement | D
ata Analysis &
Probability | P
roblem S
olving | Reasoning &
Proof | C
omm
unication | Connections | R
epresentation
Fig. 4.38.
Finding 74 – 28 without “borrowing”

Instruction at this level must be active
and intellectually stimulating.
Nearly three-quarters of U.S. fourth graders
report liking mathematics.

143
Standards for Grades 3–5
5Chapter
Most students enter grade 3 with enthusiasm for, and interest in, learn-ing mathematics. In fact, nearly three-quarters of U.S. fourth graders re-port liking mathematics (Silver, Strutchens, and Zawojewski 1997). Theyfind it practical and believe that what they are learning is important. If themathematics studied in grades 3–5 is interesting and understandable, theincreasingly sophisticated mathematical ideas at this level can maintain stu-dents’ engagement and enthusiasm. But if their learning becomes a processof simply mimicking and memorizing, they can soon begin to lose interest.Instruction at this level must be active and intellectually stimulating andmust help students make sense of mathematics.
This chapter presents a challenging set of mathematical content andprocesses that students in grades 3–5 can and should learn. It also empha-sizes teaching that fosters and builds on students’ mathematical under-standing and thinking. The Content and Process Standards describedhere form the basis for a significant and interconnected mathematics cur-riculum. Interwoven through these Standards are three central mathemat-ical themes—multiplicative reasoning, equivalence, and computationalfluency. They are briefly discussed here and elaborated on throughout thechapter.
Students entering grade 3 should have a good grasp of, and much experi-ence with, additive reasoning. Their understanding of whole numbers isoften based on an additive model—a sequence of numbers used to count indifferent ways—and their computing strategies usually involve counting onor counting back. In grades 3–5, multiplicative reasoning should become afocus. Multiplicative reasoning is more than just doing multiplication or di-vision. It is about understanding situations in which multiplication or divi-

sion is an appropriate operation. It involves a way of viewing situationsand thinking about them (Thompson forthcoming). For example, to es-timate the height of an adult, students might use their own heights as abenchmark and then think of the situation from an additive perspective(the adult is about 50 centimeters taller than the student) or a multi-plicative perspective (the adult is one quarter again as tall as the student).
In grades 3–5, multiplicative reasoning emerges and should be dis-cussed and developed through the study of many different mathematicaltopics. Students’ understanding of the base-ten number system is deep-ened as they come to understand its multiplicative structure. That is,484 is 4 × 100 plus 8 × 10 plus 4 × 1 as well as a collection of 484 indi-vidual objects. Multiplicative reasoning is further developed as studentsuse a geometric model of multiplication, such as a rectangular array, andadapt this model for computing the area of shapes and the volume ofsolids. They also begin to reason algebraically with multiplication, look-ing for general patterns. For example, they explore problems such as,What is the effect of doubling one factor and halving the other in a mul-tiplication problem? The focus on multiplicative reasoning in grades3–5 provides foundational knowledge that can be built on as studentsmove to an emphasis on proportional reasoning in the middle grades.
Equivalence should be another central idea in grades 3–5. Students’ability to recognize, create, and use equivalent representations of num-bers and geometric objects should expand. For example, 3/4 can bethought of as a half and a fourth, as 6/8, or as 0.75; a parallelogram canbe transformed into a rectangle with equal area by cutting and pasting;8 × 25 can be thought of as 8 × 5 × 5 or as 4 × 50; and three feet is thesame as thirty-six inches, or one yard. Students should extend their useof equivalent forms of numbers as they develop new strategies for com-puting and should recognize that different representations of numbersare helpful for different purposes. Likewise, they should explore whenand how shapes can be decomposed and reassembled and what featuresof the shapes remain unchanged. Equivalence also takes center stage asstudents study fractions and as they relate fractions, decimals and per-cents. Examining equivalences provides a way to explore algebraicideas, including properties such as commutativity and associativity.
A major goal in grades 3–5 is the development of computational flu-ency with whole numbers. Fluency refers to having efficient, accurate,and generalizable methods (algorithms) for computing that are basedon well-understood properties and number relationships. Some ofthese methods are performed mentally, and others are carried out usingpaper and pencil to facilitate the recording of thinking. Students shouldcome to view algorithms as tools for solving problems rather than asthe goal of mathematics study. As students develop computational algo-rithms, teachers should evaluate their work, help them recognize effi-cient algorithms, and provide sufficient and appropriate practice so thatthey become fluent and flexible in computing. Students in these gradesshould also develop computational-estimation strategies for situationsthat call for an estimate and as a tool for judging the reasonableness ofsolutions.
This set of Standards reinforces the dual goals that mathematicslearning is both about making sense of mathematical ideas and about ac-quiring skills and insights to solve problems. The calculator is an impor-tant tool in reaching these goals in grades 3–5 (Groves 1994). However,
Three centralmathematical themes arediscussed—multiplicative
reasoning, equivalence,and computational
fluency.
Mathematics learningis both about makingsense of mathematical
ideas and aboutacquiring skills and
insights to solveproblems.
144 Principles and Standards for School Mathematics

Students’ ideas should bevalued and serve as asource of learning.
calculators do not replace fluency with basic number combinations, conceptual understanding, or the ability to formulate and use efficientand accurate methods for computing. Rather, the calculator should sup-port these goals by enhancing and stimulating learning. As a studentworks on problems involving many or complex computations, the calcu-lator is an efficient computational tool for applying the strategies deter-mined by the student. The calculator serves as a tool for enabling stu-dents to focus on the problem-solving process. Calculators can alsoprovide a means for highlighting mathematical patterns and relation-ships. For example, using the calculator to skip-count by tenths or hun-dredths highlights relationships among decimal numbers. For example,4 is one-tenth more that 3.9, or 2.49 is one-hundredth less than 2.5. Stu-dents at this age should begin to develop good decision-making habitsabout when it is useful and appropriate to use other computationalmethods, rather than reach for a calculator. Teachers should create op-portunities for these decisions as well as make judgments about whenand how calculators can be used to support learning.
Teachers in grades 3–5 make decisions every day that influence theirstudents’ opportunities to learn and the quality of that learning. Theclassroom environment they create, the attention to various topics ofmathematics, and the tools they and their students use to explore math-ematical ideas are all important in helping students in grades 3–5 gainincreased mathematical maturity. In these grades teachers should helpstudents learn to work together as part of building a mathematical com-munity of learners. In such a community, students’ ideas are valued andserve as a source of learning, mistakes are seen not as dead ends butrather as potential avenues for learning, and ideas are valued becausethey are mathematically sound rather than because they are arguedstrongly or proposed by a particular individual (Hiebert et al. 1997). Aclassroom environment that would support the learning of mathematicswith meaning should have several characteristics: students feel comfort-able making and correcting mistakes; rewards are given for sustained ef-fort and progress, not the number of problems completed; and studentsthink through and explain their solutions instead of seeking or trying torecollect the “right” answer or method (Cobb et al. 1988). Creating a
145Standards for Grades 3–5: Introduction

classroom environment that fosters mathematics as sense making re-quires the careful attention of the teacher. The teacher establishes themodel for classroom discussion, making explicit what counts as a con-vincing mathematical argument. The teacher also lays the groundworkfor students to be respectful listeners, valuing and learning from oneanother’s ideas even when they disagree with them.
Because of the increasing mathematical sophistication of the curricu-lum in grades 3–5, the development of teachers’ expertise is particularlyimportant. Teachers need to understand both the mathematical contentfor teaching and students’ mathematical thinking. However, teachers atthis level are usually called on to teach a variety of disciplines in addi-tion to mathematics. Many elementary teacher preparation programsrequire minimal attention to mathematics content knowledge. Giventheir primary role in shaping the mathematics learning of their stu-dents, teachers in grades 3–5 often must seek ways to advance their ownunderstanding.
Many different professional development models emphasize the en-hancement of teachers’ mathematical knowledge. Likewise, schools anddistricts have developed strategies for strengthening the mathematicalexpertise in their instructional programs. For example, some elemen-tary schools identify a mathematics teacher-leader (someone who hasparticular interest and expertise in mathematics) and then support thatteacher’s continuing development and create a role for him or her toorganize professional development events for colleagues. Such activitiescan include grade-level mathematics study groups, seminars and work-shops, and coaching and modeling in the classroom. Other schools usemathematics specialists in the upper elementary grades. These are ele-mentary school teachers with particular interest and expertise in mathe-matics who assume primary responsibility for teaching mathematics to agroup of students—for example, all the fourth graders in a school. Thisstrategy allows some teachers to focus on a particular content arearather than to attempt being an expert in all areas.
Ensuring that the mathematics outlined in this chapter is learned byall students in grades 3–5 requires a commitment of effort by teachersto continue to be mathematical learners. It also implies that districts,schools, and teacher preparation programs will develop strategies toidentify current and prospective elementary school teachers for special-ized mathematics preparation and assignment. Each of the models out-lined here—mathematics teacher-leaders and mathematics specialists—should be explored as ways to develop and enhance students’mathematics education experience. For successful implementation ofthese Standards, it is essential that the mathematical expertise of teach-ers be developed, whatever model is used.
Teachers in grades 3–5often must seek ways to
advance their ownunderstanding.
146 Principles and Standards for School Mathematics

Blank Page

148
In grades 3–5 all students should—
• understand the place-value structure of the base-ten number system and beable to represent and compare whole numbers and decimals;
• recognize equivalent representations for the same number and generatethem by decomposing and composing numbers;
• develop understanding of fractions as parts of unit wholes, as parts of acollection, as locations on number lines, and as divisions of whole numbers;
• use models, benchmarks, and equivalent forms to judge the size offractions;
• recognize and generate equivalent forms of commonly used fractions,decimals, and percents;
• explore numbers less than 0 by extending the number line and throughfamiliar applications;
• describe classes of numbers according to characteristics such as thenature of their factors.
• understand various meanings of multiplication and division;• understand the effects of multiplying and dividing whole numbers;• identify and use relationships between operations, such as division as the
inverse of multiplication, to solve problems;• understand and use properties of operations, such as the distributivity of
multiplication over addition.
• develop fluency with basic number combinations for multiplication anddivision and use these combinations to mentally compute related problems,such as 30 × 50;
• develop fluency in adding, subtracting, multiplying, and dividing wholenumbers;
• develop and use strategies to estimate the results of whole-numbercomputations and to judge the reasonableness of such results;
• develop and use strategies to estimate computations involving fractions anddecimals in situations relevant to students’ experience;
• use visual models, benchmarks, and equivalent forms to add and subtractcommonly used fractions and decimals;
• select appropriate methods and tools for computing with whole numbersfrom among mental computation, estimation, calculators, and paper andpencil according to the context and nature of the computation and use theselected method or tool.
Instructional programs fromprekindergarten through grade 12should enable all students to—
Understand numbers, ways of rep-resenting numbers, relationshipsamong numbers, and number systems
Understand meanings of operationsand how they relate to one another
Compute fluently and make reason-able estimates
3–5Standard
for Grades
Expectations
Number and Operations

Students whounderstand the structureof numbers and therelationships amongnumbers can work withthem flexibly.
Number and OperationsIn grades 3–5, students’ development of number sense should con-
tinue, with a focus on multiplication and division. Their understandingof the meanings of these operations should grow deeper as they encounter a range of representations and problem situations, learnabout the properties of these operations, and develop fluency in whole-number computation. An understanding of the base-ten number systemshould be extended through continued work with larger numbers aswell as with decimals. Through the study of various meanings and mod-els of fractions—how fractions are related to each other and to the unitwhole and how they are represented—students can gain facility incomparing fractions, often by using benchmarks such as 1/2 or 1. Theyalso should consider numbers less than zero through familiar modelssuch as a thermometer or a number line.
When students leave grade 5, they should be able to solve problemsinvolving whole-number computation and should recognize that eachoperation will help them solve many different types of problems. Theyshould be able to solve many problems mentally, to estimate a reason-able result for a problem, to efficiently recall or derive the basic numbercombinations for each operation, and to compute fluently with multi-digit whole numbers. They should understand the equivalence of frac-tions, decimals, and percents and the information each type of repre-sentation conveys. With these understandings and skills, they should beable to develop strategies for computing with familiar fractions anddecimals.
Understand numbers, ways of representing numbers,relationships among numbers, and number systems
In grades 3–5, students’ study and use of numbers should be ex-tended to include larger numbers, fractions, and decimals. They needto develop strategies for judging the relative sizes of numbers. Theyshould understand more deeply the multiplicative nature of the numbersystem, including the structure of 786 as 7 × 100 plus 8 × 10 plus 6 × 1.They should also learn about the position of this number in the base-ten number system and its relationship to benchmarks such as 500, 750,800, and 1000. They should explore the effects of operating on num-bers with particular numbers, such as adding or subtracting 10 or 100and multiplying or dividing by a power of 10. In order to develop theseunderstandings, students should explore whole numbers using a varietyof models and contexts. For example, a third-grade class might explorethe size of 1000 by skip-counting to 1000, building a model of 1000using ten hundred charts, gathering 1000 items such as paper clips anddeveloping efficient ways to count them, or using strips that are 10 or100 centimeters long to show the length of 1000 centimeters.
Students who understand the structure of numbers and the relation-ships among numbers can work with them flexibly (Fuson 1992). Theyrecognize and can generate equivalent representations for the samenumber. For example, 36 can be thought of as 30 + 6, 20 + 16, 9 × 4,40 – 4, three dozen, or the square of 6. Each form is useful for a partic-ular situation. Thinking of 36 as 30 + 6 may be useful when multiplying
149Standards for Grades 3–5: Number and Operations
Num
ber & O
perations | Algebra | G
eometry | M
easurement | D
ata Analysis &
Probability | P
roblem S
olving | Reasoning &
Proof | C
omm
unication | Connections | R
epresentation

150 Principles and Standards for School Mathematics
Rep
rese
ntat
ion
| C
onne
ctio
ns |
Com
mun
icat
ion
| R
easo
ning
& P
roof
| P
robl
em S
olvi
ng |
Dat
a A
naly
sis
& P
roba
bilit
y |
Mea
sure
men
t |
Geo
met
ry |
Alg
ebra
| N
umbe
r &
Ope
ratio
ns
Students in these grades should use models and other strategies torepresent and study decimal numbers. For example, they should countby tenths (one-tenth, two-tenths, three-tenths, …) verbally or use a cal-culator to link and relate whole numbers with decimal numbers. As stu-dents continue to count orally from nine-tenths to ten-tenths to eleven-tenths and see the display change from 0.9 to 1.0 to 1.1, they see thatten-tenths is the same as one and also how it relates to 0.9 and 1.1.They should also investigate the relationship between fractions anddecimals, focusing on equivalence. Through a variety of activities, theyshould understand that a fraction such as 1/2 is equivalent to 5/10 andthat it has a decimal representation (0.5). As they encounter a newmeaning of a fraction—as a quotient of two whole numbers (1/2 = 1 ÷ 2= 0.5)—they can also see another way to arrive at this equivalence. Byusing the calculator to carry out the indicated division of familiar frac-tions like 1/4, 1/3, 2/5, 1/2, and 3/4, they can learn common fraction-decimal equivalents. They can also learn that some fractions can be ex-pressed as terminating decimals but others cannot.
Students should understand the meaning of a percent as part of awhole and use common percents such as 10 percent, 33 1/3 percent, or
0 1
14
24
34
18
28
38
48
58
68
78
12
0 1
0 1
Fig. 5.1.
Parallel number lines with unit frac-tions and their multiples
by 36, whereas thinking of it as 6 sixes or 9 fours is helpful when con-sidering equal shares. Students need to have many experiences decom-posing and composing numbers in order to solve problems flexibly.
During grades 3–5, students should build their understanding offractions as parts of a whole and as division. They will need to see andexplore a variety of models of fractions, focusing primarily on familiarfractions such as halves, thirds, fourths, fifths, sixths, eighths, andtenths. By using an area model in which part of a region is shaded, stu-dents can see how fractions are related to a unit whole, compare frac-tional parts of a whole, and find equivalent fractions. They should de-velop strategies for ordering and comparing fractions, often usingbenchmarks such as 1/2 and 1. For example, fifth graders can comparefractions such as 2/5 and 5/8 by comparing each with 1/2—one is a little less than 1/2 and the other is a little more. By using parallel num-ber lines, each showing a unit fraction and its multiples (see fig. 5.1),students can see fractions as numbers, note their relationship to 1, andsee relationships among fractions, including equivalence. They shouldalso begin to understand that between any two fractions, there is alwaysanother fraction.
E-example 5.1
Communication through Games
Students should focus onthe meanings of, andrelationship between,multiplication anddivision.
151Standards for Grades 3–5: Number and Operations
Num
ber & O
perations | Algebra | G
eometry | M
easurement | D
ata Analysis &
Probability | P
roblem S
olving | Reasoning &
Proof | C
omm
unication | Connections | R
epresentation
50 percent as benchmarks in interpreting situations they encounter. Forexample, if a label indicates that 36 percent of a product is water, stu-dents can think of this as about a third of the product. By studying frac-tions, decimals, and percents simultaneously, students can learn tomove among equivalent forms, choosing and using an appropriate andconvenient form to solve problems and express quantities.
Negative integers should be introduced at this level through the useof familiar models such as temperature or owing money. The numberline is also an appropriate and helpful model, and students should rec-ognize that points to the left of 0 on a horizontal number line can berepresented by numbers less than 0.
Throughout their study of numbers, students in grades 3–5 shouldidentify classes of numbers and examine their properties. For example,integers that are divisible by 2 are called even numbers and numbers thatare produced by multiplying a number by itself are called square num-bers. Students should recognize that different types of numbers haveparticular characteristics; for example, square numbers have an oddnumber of factors and prime numbers have only two factors.
Understand meanings of operations and how theyrelate to one another
In grades 3–5, students should focus on the meanings of, and rela-tionship between, multiplication and division. It is important that stu-dents understand what each number in a multiplication or division ex-pression represents. For example, in multiplication, unlike addition, thefactors in the problem can refer to different units. If students are solv-ing the problem 29 × 4 to find out how many legs there are on 29 cats,29 is the number of cats (or number of groups), 4 is the number of legson each cat (or number of items in each group), and 116 is the totalnumber of legs on all the cats. Modeling multiplication problems withpictures, diagrams, or concrete materials helps students learn what thefactors and their product represent in various contexts.
Students should consider and discuss different types of problems thatcan be solved using multiplication and division. For example, if thereare 112 people traveling by bus and each bus can hold 28 people, howmany buses are needed? In this case, 112 ÷ 28 indicates the number ofgroups (buses), where the total number of people (112) and the size ofeach group (28 people in each bus) are known. In a different problem,students might know the number of groups and need to find how manyitems are in each group. If 112 people divide themselves evenly amongfour buses, how many people are on each bus? In this case, 112 ÷ 4 indi-cates the number of people on each bus, where the total number ofpeople and the number of groups (buses) are known. Students need torecognize both types of problems as division situations, should be ableto model and solve each type of problem, and should know the units ofthe result: Is it 28 buses or 28 people per bus? Students in these gradeswill also encounter situations where the result of division includes a re-mainder. They should learn the meaning of a remainder by modelingdivision problems and exploring the size of remainders given a particu-lar divisor. For example, when dividing groups of counters into sets of4, what remainders could there be for groups of different sizes?

Students can extend their understanding of multiplication and divi-sion as they consider the inverse relationship between the two opera-tions. Another way their knowledge can grow is through new multi-plicative situations such as rates (3 candy bars for 59 cents each),comparisons (the book weighs 4 times as much as the tablet), and com-binations (the number of outfits possible from 3 shirts and 2 pairs ofshorts). Examining the effect of multiplying or dividing numbers canalso lead to a deeper understanding of these operations. For example,dividing 28 by 14 and comparing the result to dividing 28 by 7 can leadto the conjecture that the smaller the divisor, the larger the quotient.With models or calculators, students can explore dividing by numbersbetween 0 and 1, such as 1/2, and find that the quotient is larger thanthe original number. Explorations such as these help dispel common,but incorrect, generalizations such as “division always makes thingssmaller.”
Further meaning for multiplication should develop as students buildand describe area models, showing how a product is related to its fac-tors. The area model is important because it helps students develop anunderstanding of multiplication properties (Graeber and Campbell1993). Using area models, properties of operations such as the commu-tativity of multiplication become more apparent. Other relationshipscan be seen by decomposing and composing area models. For example,a model for 20 × 6 can be split in half and the halves rearranged to forma 10 × 12 rectangle, showing the equivalence of 10 × 12 and 20 × 6. Thedistributive property is particularly powerful as the basis of many effi-cient multiplication algorithms. For example, figure 5.2 shows thestrategies three students might use to compute 7 × 28—all involvingthe distributive property.
Compute fluently and make reasonable estimatesBy the end of this grade band, students should be computing fluently
with whole numbers. Computational fluency refers to having efficient andaccurate methods for computing. Students exhibit computational flu-ency when they demonstrate flexibility in the computational methodsthey choose, understand and can explain these methods, and produceaccurate answers efficiently. The computational methods that a studentuses should be based on mathematical ideas that the student under-stands well, including the structure of the base-ten number system,properties of multiplication and division, and number relationships.
A significant amount of instructional time should be devoted to ra-tional numbers in grades 3–5. The focus should be on developing stu-dents’ conceptual understanding of fractions and decimals—what theyare, how they are represented, and how they are related to whole num-bers—rather than on developing computational fluency with rationalnumbers. Fluency in rational-number computation will be a majorfocus of grades 6–8.
Fluency with whole-number computation depends, in large part, onfluency with basic number combinations—the single-digit addition andmultiplication pairs and their counterparts for subtraction and division.Fluency with the basic number combinations develops from well-understood meanings for the four operations and from a focus on
Computational fluencyrefers to having efficientand accurate methods for
computing.
152 Principles and Standards for School Mathematics
Rep
rese
ntat
ion
| C
onne
ctio
ns |
Com
mun
icat
ion
| R
easo
ning
& P
roof
| P
robl
em S
olvi
ng |
Dat
a A
naly
sis
& P
roba
bilit
y |
Mea
sure
men
t |
Geo
met
ry |
Alg
ebra
| N
umbe
r &
Ope
ratio
ns
Fig. 5.2.
Three strategies for computing 7 × 28using the distributive property
7 × 28
7 × 20 is 140
and 7 × 8 is 56
56 + 140 is 196
I thought seven25’s—that’s 175.
Then I need seven 3’sor 21. So the answer is175 + 21 = 196
I did 7 × 30 first.
That’s 210. Then take
off seven 2’s or 14.So it’s 196.

As students developmethods to solvemultidigit computationproblems, they should beencouraged to record andshare their methods.
thinking strategies (Thornton 1990; Isaacs and Carroll 1999). By work-ing on many multiplication problems with a variety of models for mul-tiplication, students should initially learn and become fluent with someof the “easier” combinations. For example, many students will readilylearn basic number combinations such as 3 × 2 or 4 × 5 or the squaresof numbers, such as 4 × 4 or 5 × 5. Through skip-counting, using areamodels, and relating unknown combinations to known ones, studentswill learn and become fluent with unfamiliar combinations. For exam-ple, 3 × 4 is the same as 4 × 3; 6 × 5 is 5 more than 5 × 5; 6 × 8 is double3 × 8. Because division is the inverse of multiplication, students can usethe multiplication combinations to learn division combinations. For ex-ample, 24 ÷ 6 can be thought of as 6 × ? = 24. If by the end of the fourthgrade, students are not able to use multiplication and division strategiesefficiently, then they must either develop strategies so that they are flu-ent with these combinations or memorize the remaining “harder” com-binations. Students should also learn to apply the single-digit basicnumber combinations to related problems, for example, using 5 × 6 tocompute 50 × 6 or 5000 × 600.
Research suggests that by solving problems that require calculation,students develop methods for computing and also learn more about operations and properties (McClain, Cobb, and Bowers 1998; Schifter1999). As students develop methods to solve multidigit computationproblems, they should be encouraged to record and share their meth-ods. As they do so, they can learn from one another, analyze the effi-ciency and generalizability of various approaches, and try one another’smethods. In the past, common school practice has been to present asingle algorithm for each operation. However, more than one efficientand accurate computational algorithm exists for each arithmetic opera-tion. In addition, if given the opportunity, students naturally inventmethods to compute that make sense to them (Fuson forthcoming;Madell 1985). The following episode, drawn from unpublished class-room observation notes, illustrates how one teacher helped students an-alyze and compare their computational procedures for division:
Students in Ms. Spark’s fifth-grade class were sharing their solutionsto a homework problem, 728 ÷ 34. Ms. Sparks asked several studentsto put their work on the board to be discussed. She deliberatelychose students who had approached the problem in several differentways. As the students put their work on the board, Ms. Sparks circu-lated among the other students, checking their homework.Henry had written his solution:
Henry explained to the class, “Twenty 34s plus one more is 21. Iknew I was pretty close. I didn’t think I could add any more 34s, so Isubtracted 714 from 728 and got 14. Then I had 21 remainder 14.”
153Standards for Grades 3–5: Number and Operations
Num
ber & O
perations | Algebra | G
eometry | M
easurement | D
ata Analysis &
Probability | P
roblem S
olving | Reasoning &
Proof | C
omm
unication | Connections | R
epresentation

Michaela showed her solution:
Michaela says, “34 goes into 72 two times and that’s 68. You gottaminus that, bring down the 8, then 34 goes into 48 one time.”
Ricky: I don’t know how to do that.Michaela: You divide, then you multiply, you subtract, then you
bring down.Ricky: I still don’t get it.
Ms. Sparks: Does anyone see any parts of Michaela’s and Henry’swork that are similar?
Christy: They both did 728 divided by 34.Ms. Sparks: Right, they both did the same problem. Do you see any
parts of the ways they solved the problem that looksimilar?
Fanshen: (Hesitantly) Well, there’s a 680 in Henry’s and a 68 inMichaela’s.
Ms. Sparks: So, what is that 68, Michaela?Michaela: Um, it’s the 2 × 34.
Ms. Sparks: Oh, is that 2 × 34? (Ms. Sparks waits. Lots of silence.) So,I don’t get what you’re saying about 2 times 34. Whatdoes this 2 up here in the 21 represent?
Samir: It’s 20.Henry: But 20 times 34 is 680, not 68.
Ms. Sparks: So what if I wrote a 0 here to show that this is 680?Does that help you see any more similarities?
Maya: They both did twenty 34s first.Rita: I get it. Then Michaela did, like, how many more are
left, and it was 48, and then she could do one more 34.
Ms. Sparks saw relationships between the two methods described bystudents, but she doubted that any of her students would initially seethese relationships. Through her questioning, she helped students focuson the ways in which both Michaela’s and Henry’s methods used multi-plication to find the total number of 34s in 728 and helped students
154 Principles and Standards for School Mathematics
Rep
rese
ntat
ion
| C
onne
ctio
ns |
Com
mun
icat
ion
| R
easo
ning
& P
roof
| P
robl
em S
olvi
ng |
Dat
a A
naly
sis
& P
roba
bilit
y |
Mea
sure
men
t |
Geo
met
ry |
Alg
ebra
| N
umbe
r &
Ope
ratio
ns

Estimation serves as animportant companion tocomputation.
clarify what quantities were represented by the notation in Michaela’ssolution. As the class continues their study of division, Ms. Sparksshould encourage this type of explanation and discussion in order tohelp the students understand, explain, and justify their computationalstrategies.
As students move from third to fifth grade, they should consolidateand practice a small number of computational algorithms for addition,subtraction, multiplication, and division that they understand well andcan use routinely. Many students enter grade 3 with methods for addingand subtracting numbers. In grades 3–5 they should extend these meth-ods to adding and subtracting larger numbers and learn to record theirwork systematically and clearly. Having access to more than onemethod for each operation allows students to choose an approach thatbest fits the numbers in a particular problem. For example, 298 × 42can be thought of as (300 × 42) – (2 × 42), whereas 41 × 16 can be com-puted by multiplying 41 × 8 to get 328 and then doubling 328 to get656. Although the expectation is that students develop fluency in com-puting with whole numbers, frequently they should use calculators tosolve complex computations involving large numbers or as part of anextended problem.
Many students are likely to develop and use methods that are not thesame as the conventional algorithms (those widely taught in the UnitedStates). For example, many students and adults use multiplication tosolve division problems or add starting with the largest place ratherthan with the smallest. The conventional algorithms for multiplicationand division should be investigated in grades 3–5 as one efficient way tocalculate. Regardless of the particular algorithm used, students shouldbe able to explain their method and should understand that many meth-ods exist. They should also recognize the need to develop efficient andaccurate methods.
As students acquire conceptual grounding related to rational num-bers, they should begin to solve problems using strategies they developor adapt from their whole-number work. At these grades, the emphasisshould not be on developing general procedures to solve all decimaland fraction problems. Rather, students should generate solutions thatare based on number sense and properties of the operations and thatuse a variety of models or representations. For example, in a fourth-grade class, students might work on this problem:
Jamal invited seven of his friends to lunch on Saturday. He thinks thateach of the eight people (his seven guests and himself) will eat one and ahalf sandwiches. How many sandwiches should he make?
Students might draw a picture and count up the number of sandwiches,or they might use reasoning based on their knowledge of number andoperations—for example, “That would be eight whole sandwiches andeight half sandwiches; since two halves make a whole sandwich, theeight halves will make four more sandwiches, so Jamal needs to maketwelve sandwiches.”
Estimation serves as an important companion to computation. Itprovides a tool for judging the reasonableness of calculator, mental, andpaper-and-pencil computations. However, being able to compute exactanswers does not automatically lead to an ability to estimate or judgethe reasonableness of answers, as Reys and Yang (1998) found in their
155Standards for Grades 3–5: Number and Operations
Num
ber & O
perations | Algebra | G
eometry | M
easurement | D
ata Analysis &
Probability | P
roblem S
olving | Reasoning &
Proof | C
omm
unication | Connections | R
epresentation

work with sixth and eighth graders. Students in grades 3–5 will need tobe encouraged to routinely reflect on the size of an anticipated solution.Will 7 × 18 be smaller or larger than 100? If 3/8 of a cup of sugar isneeded for a recipe and the recipe is doubled, will more than or lessthan one cup of sugar be needed? Instructional attention and frequentmodeling by the teacher can help students develop a range of computa-tional estimation strategies including flexible rounding, the use ofbenchmarks, and front-end strategies. Students should be encouragedto frequently explain their thinking as they estimate. As with exact com-putation, sharing estimation strategies allows students access to others’thinking and provides many opportunities for rich class discussions.
The teacher plays an important role in helping students develop andselect an appropriate computational tool (calculator, paper-and-pencilalgorithm, or mental strategy). If a teacher models the choices shemakes and thinks aloud about them, students can learn to make goodchoices. For example, determining the cost of four notebooks priced at$0.75 is an easy mental problem (two notebooks cost $1.50, so fournotebooks cost $3.00). Adding the cost of all the school supplies pur-chased by the class is a problem in which using a calculator makes sensebecause of the amount of data. Dividing the cost of the class pizza party($45) by the number of students (25) is an appropriate time to make anestimate (a little less than $2 each) or to use a paper-and-pencil algo-rithm or a calculator if a more precise answer is needed.
The teacher plays animportant role in
helping students developand select anappropriate
computational tool.
156 Principles and Standards for School Mathematics
Rep
rese
ntat
ion
| C
onne
ctio
ns |
Com
mun
icat
ion
| R
easo
ning
& P
roof
| P
robl
em S
olvi
ng |
Dat
a A
naly
sis
& P
roba
bilit
y |
Mea
sure
men
t |
Geo
met
ry |
Alg
ebra
| N
umbe
r &
Ope
ratio
ns

Blank Page

In grades 3–5 all students should—
• describe, extend, and make generalizations about geometric and numericpatterns;
• represent and analyze patterns and functions, using words, tables, andgraphs.
• identify such properties as commutativity, associativity, and distributivity anduse them to compute with whole numbers;
• represent the idea of a variable as an unknown quantity using a letter or asymbol;
• express mathematical relationships using equations.
• model problem situations with objects and use representations such asgraphs, tables, and equations to draw conclusions.
• investigate how a change in one variable relates to a change in a secondvariable;
• identify and describe situations with constant or varying rates of changeand compare them.
Instructional programs fromprekindergarten through grade 12should enable all students to—
Understand patterns, relations, andfunctions
Represent and analyze mathemati-cal situations and structures usingalgebraic symbols
Use mathematical models to repre-sent and understand quantitativerelationships
Analyze change in various contexts
3–5Standard
for Grades
Expectations
Algebra
158 Principles and Standards for School Mathematics

AlgebraAlthough algebra is a word that has not commonly been heard in
grades 3–5 classrooms, the mathematical investigations and conversa-tions of students in these grades frequently include elements of alge-braic reasoning. These experiences and conversations provide rich con-texts for advancing mathematical understanding and are also animportant precursor to the more formalized study of algebra in themiddle and secondary grades. In grades 3–5, algebraic ideas shouldemerge and be investigated as students—
• identify or build numerical and geometric patterns; • describe patterns verbally and represent them with tables or
symbols; • look for and apply relationships between varying quantities to
make predictions; • make and explain generalizations that seem to always work in
particular situations; • use graphs to describe patterns and make predictions;• explore number properties;• use invented notation, standard symbols, and variables to
express a pattern, generalization, or situation.
Understand patterns, relations, and functionsIn grades 3–5, students should investigate numerical and geometric
patterns and express them mathematically in words or symbols. Theyshould analyze the structure of the pattern and how it grows orchanges, organize this information systematically, and use their analysisto develop generalizations about the mathematical relationships in thepattern. For example, a teacher might ask students to describe patternsthey see in the “growing squares” display (see fig. 5.3) and express thepatterns in mathematical sentences. Students should be encouraged toexplain these patterns verbally and to make predictions about what willhappen if the sequence is continued.
159Standards for Grades 3–5: Algebra
Num
ber & O
perations | Algebra | G
eometry | M
easurement | D
ata Analysis &
Probability | P
roblem S
olving | Reasoning &
Proof | C
omm
unication | Connections | R
epresentation
Fig. 5.3.
Expressing “growing squares” inmathematical sentences (Adaptedfrom Burton et al. 1992, p. 6)
In this example, one student might notice that the area changes in apredictable way—it increases by the next odd number with each newsquare. Another student might notice that the previous square always fitsinto the “corner” of the next-larger square. This observation might leadto a description of the area of a square as equal to the area of the previ-ous square plus “its two sides and one more.” A student might representhis thinking as in figure 5.4.

160 Principles and Standards for School Mathematics
Rep
rese
ntat
ion
| C
onne
ctio
ns |
Com
mun
icat
ion
| R
easo
ning
& P
roof
| P
robl
em S
olvi
ng |
Dat
a A
naly
sis
& P
roba
bilit
y |
Mea
sure
men
t |
Geo
met
ry |
Alg
ebra
| N
umbe
r &
Ope
ratio
ns
Examples like this one give the teacher important opportunities toengage students in thinking about how to articulate and express a gen-eralization—“How can we talk about how this pattern works for asquare of any size?” Students in grade 3 should be able to predict thenext element in a sequence by examining a specific set of examples. Bythe end of fifth grade, students should be able to make generalizationsby reasoning about the structure of the pattern. For example, a fifth-grade student might explain that “if you add the first n odd numbers,the sum is the same as n × n.”
As they study ways to measure geometric objects, students will haveopportunities to make generalizations based on patterns. For example,consider the problem in figure 5.5. Fourth graders might make a table(see fig. 5.6) and note the iterative nature of the pattern. That is, thereis a consistent relationship between the surface area of one tower andthe next-bigger tower: “You add four to the previous number.” Fifthgraders could be challenged to justify a general rule with reference tothe geometric model, for example, “The surface area is always fourtimes the number of cubes plus two more because there are always foursquare units around each cube and one extra on each end of the tower.”Once a relationship is established, students should be able to use it toanswer questions like, “What is the surface area of a tower with fiftycubes?” or “How many cubes would there be in a tower with a surfacearea of 242 square units?”
In this example, some students may use a table to organize and ordertheir data, and others may use connecting cubes to model the growth ofan arithmetic sequence. Some students may use words, but others mayuse numbers and symbols to express their ideas about the functional re-lationship. Students should have many experiences organizing data andexamining different representations. Computer simulations are an in-teractive way to explore functional relationships and the various waysthey are represented. In a simulation of two runners along a track, stu-dents can control the speed and starting point of the runners and canview the results by watching the race and examining a table and graphof the time-versus-distance relationship. Students need to feel comfort-able using various techniques for organizing and expressing ideas aboutrelationships and functions.
Represent and analyze mathematical situations andstructures using algebraic symbols
In grades 3–5, students can investigate properties such as commuta-tivity, associativity, and distributivity of multiplication over addition. Is3 × 5 the same as 5 × 3? Is 15 × 27 equal to 27 × 15? Will reversing thefactors always result in the same product? What if one of the factors is adecimal number (e.g., 1.5 × 6)? An area model can help students seethat two factors in either order have equal products, as represented bycongruent rectangles with different orientations (see fig. 5.7).
Fig. 5.4.
A possible student observation aboutthe area of the 5 × 5 square in the
“growing squares” pattern
What is the surface area of eachtower of cubes (include the bottom)?As the towers get taller, howdoes the surface area change?
Fig. 5.5.
Finding surface areas of towers ofcubes
Fig. 5.6.
A table used in the “tower of cubes”problem
Number of Surface area in cubes (N ) square units (S)
E-example 5.2
Function Simulation
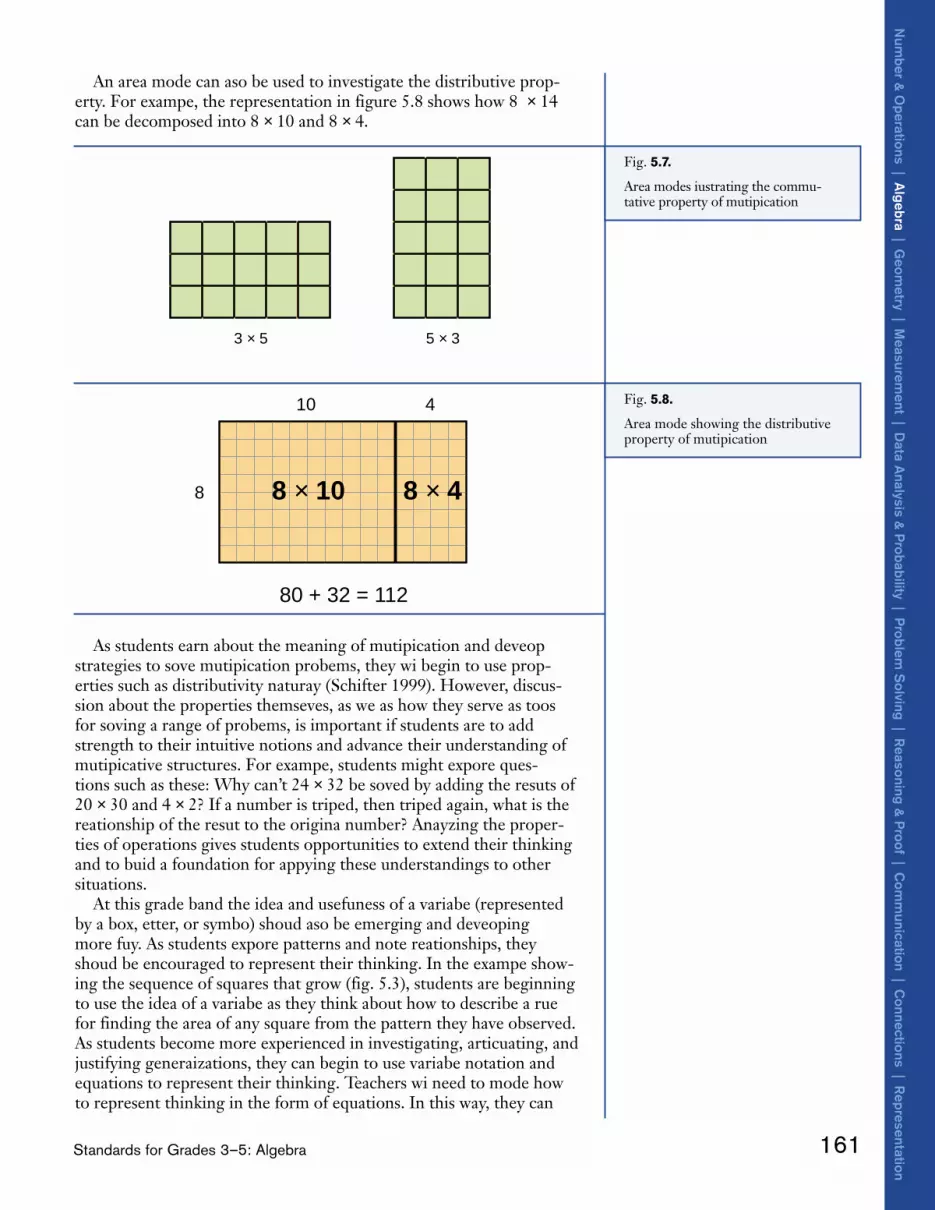
161Standards for Grades 3–5: Algebra
Num
ber & O
perations | Algebra | G
eometry | M
easurement | D
ata Analysis &
Probability | P
roblem S
olving | Reasoning &
Proof | C
omm
unication | Connections | R
epresentation
An area model can also be used to investigate the distributive prop-erty. For example, the representation in figure 5.8 shows how 8 × 14can be decomposed into 8 × 10 and 8 × 4.
As students learn about the meaning of multiplication and developstrategies to solve multiplication problems, they will begin to use prop-erties such as distributivity naturally (Schifter 1999). However, discus-sion about the properties themselves, as well as how they serve as toolsfor solving a range of problems, is important if students are to addstrength to their intuitive notions and advance their understanding ofmultiplicative structures. For example, students might explore ques-tions such as these: Why can’t 24 × 32 be solved by adding the results of20 × 30 and 4 × 2? If a number is tripled, then tripled again, what is therelationship of the result to the original number? Analyzing the proper-ties of operations gives students opportunities to extend their thinkingand to build a foundation for applying these understandings to othersituations.
At this grade band the idea and usefulness of a variable (representedby a box, letter, or symbol) should also be emerging and developingmore fully. As students explore patterns and note relationships, theyshould be encouraged to represent their thinking. In the example show-ing the sequence of squares that grow (fig. 5.3), students are beginningto use the idea of a variable as they think about how to describe a rulefor finding the area of any square from the pattern they have observed.As students become more experienced in investigating, articulating, andjustifying generalizations, they can begin to use variable notation andequations to represent their thinking. Teachers will need to model howto represent thinking in the form of equations. In this way, they can
Fig. 5.7.
Area models illustrating the commu-tative property of multiplication
3 × 5 5 × 3
10 4
8
80 + 32 = 112
8 × 48 × 10
Fig. 5.8.
Area model showing the distributiveproperty of multiplication

Students in grades3–5 develop the ideathat a mathematical
model has bothdescriptive and
predictive power.
162 Principles and Standards for School Mathematics
Rep
rese
ntat
ion
| C
onne
ctio
ns |
Com
mun
icat
ion
| R
easo
ning
& P
roof
| P
robl
em S
olvi
ng |
Dat
a A
naly
sis
& P
roba
bilit
y |
Mea
sure
men
t |
Geo
met
ry |
Alg
ebra
| N
umbe
r &
Ope
ratio
ns
help students connect the ways they are describing their findings tomathematical notation. For example, a student’s description of the sur-face area of a cube tower of any size (“You get the surface area by multi-plying the number of cubes by 4 and adding 2”) can be recorded by theteacher as S = 4 × n + 2. Students should also understand the use of avariable as a placeholder in an expression or equation. For example,they should explore the role of n in the equation 80 × 15 = 40 × n andbe able to find the value of n that makes the equation true.
Use mathematical models to represent and understandquantitative relationships
Historically, much of the mathematics used today was developed tomodel real-world situations, with the goal of making predictions aboutthose situations. As patterns are identified, they can be expressed nu-merically, graphically, or symbolically and used to predict how the pat-tern will continue. Students in grades 3–5 develop the idea that a math-ematical model has both descriptive and predictive power.
Students in these grades can model a variety of situations, includ-ing geometric patterns, real-world situations, and scientific experi-ments. Sometimes they will use their model to predict the next ele-ment in a pattern, as students did when they described the area of asquare in terms of the previous smaller square (see fig. 5.3). At othertimes, students will be able to make a general statement about howone variable is related to another variable: If a sandwich costs $3, youcan figure out how many dollars any number of sandwiches costs bymultiplying that number by 3 (two sandwiches cost $6, three sand-wiches cost $9, and so forth). In this case, students have developed amodel of a proportional relationship: the value of one variable (totalcost, C ) is always three times the value of the other (number of sand-wiches, S ), or C = 3 • S.
In modeling situations that involve real-world data, students need toknow that their predictions will not always match observed outcomesfor a variety of reasons. For example, data often contain measurementerror, experiments are influenced by many factors that cause fluctua-tions, and some models may hold only for a certain range of values.However, predictions based on good models should be reasonably closeto what actually happens.
Students in grades 3–5 should begin to understand that differentmodels for the same situation can give the same results. For example, asa group of students investigates the relationship between the number ofcubes in a tower and its surface area, several models emerge. One stu-dent thinks about each side of the tower as having the same number ofunits of surface area as the number of cubes (n). There are four sidesand an extra unit on each end of the tower, so the surface area is fourtimes the number of cubes plus two (4 • n + 2). Another student thinksabout how much surface area is contributed by each cube in the tower:each end cube contributes five units of surface area and each “middle”cube contributes four units of surface area. Algebraically, the surfacearea would be 2 • 5 + (n – 2) • 4. For a tower of twelve cubes, the firststudent thinks, “4 times 12, that’s 48, plus 2 is 50.” The second studentthinks, “The two end cubes each have 5, so that’s 10. There are 10

163Standards for Grades 3–5: Algebra
Num
ber & O
perations | Algebra | G
eometry | M
easurement | D
ata Analysis &
Probability | P
roblem S
olving | Reasoning &
Proof | C
omm
unication | Connections | R
epresentation
more cubes. They each have 4, so that’s 40. 40 plus 10 is 50.” Studentsin this grade band may not be able to show how these solutions are algebraically equivalent, but they can recognize that these differentmodels lead to the same solution.
Analyze change in various contextsChange is an important mathematical idea that can be studied using
the tools of algebra. For example, as part of a science project, studentsmight plant seeds and record the growth of a plant. Using the data rep-resented in the table and graph (fig. 5.9), students can describe how therate of growth varies over time. For example, a student might expressthe rate of growth in this way: “My plant didn’t grow for the first fourdays, then it grew slowly for the next two days, then it started to growfaster, then it slowed down again.” In this situation, students are focus-ing not simply on the height of the plant each day, but on what has hap-pened between the recorded heights. This work is a precursor to later,more focused attention on what the slope of a line represents, that is,what the steepness of the line shows about the rate of change. Studentsshould have opportunities to study situations that display different pat-terns of change—change that occurs at a constant rate, such as someonewalking at a constant speed, and rates of change that increase or decrease, as in the growing-plant example.
Time Height Change(days) (cm) (cm)
0 0
2 0 0
4 0 0
6 1 1
8 2 1
10 4 2
12 6 2
14 7.5 1.5
16 8.5 1
18 8.5 0
20 9 0.5
0 2 4 6 8 10 12 14 16 18 20 22 24
10
9
8
7
6
5
4
3
2
1
0
Plant Growth
Time (days)
Hei
ght (
cm)
Fig. 5.9.
A table and graph showing growth ofa plant

In grades 3–5 all students should—
• identify, compare, and analyze attributes of two- and three-dimensionalshapes and develop vocabulary to describe the attributes;
• classify two- and three-dimensional shapes according to their properties anddevelop definitions of classes of shapes such as triangles and pyramids;
• investigate, describe, and reason about the results of subdividing,combining, and transforming shapes;
• explore congruence and similarity;• make and test conjectures about geometric properties and relationships
and develop logical arguments to justify conclusions.
• describe location and movement using common language and geometricvocabulary;
• make and use coordinate systems to specify locations and to describe paths;• find the distance between points along horizontal and vertical lines of a
coordinate system.
• predict and describe the results of sliding, flipping, and turning two-dimensional shapes;
• describe a motion or a series of motions that will show that two shapes arecongruent;
• identify and describe line and rotational symmetry in two- and three-dimensional shapes and designs.
• build and draw geometric objects;• create and describe mental images of objects, patterns, and paths;• identify and build a three-dimensional object from two-dimensional
representations of that object;• identify and build a two-dimensional representation of a three-dimensional
object; • use geometric models to solve problems in other areas of mathematics,
such as number and measurement;• recognize geometric ideas and relationships and apply them to other
disciplines and to problems that arise in the classroom or in everyday life.
Instructional programs fromprekindergarten through grade 12should enable all students to—
Analyze characteristics and proper-ties of two- and three-dimensionalgeometric shapes and developmathematical arguments about geometric relationships
Specify locations and describe spatial relationships using coordi-nate geometry and other represen-tational systems
Apply transformations and use symmetry to analyze mathematicalsituations
Use visualization, spatial reasoning,and geometric modeling to solveproblems
3–5Standard
for Grades
Expectations
Geometry
164
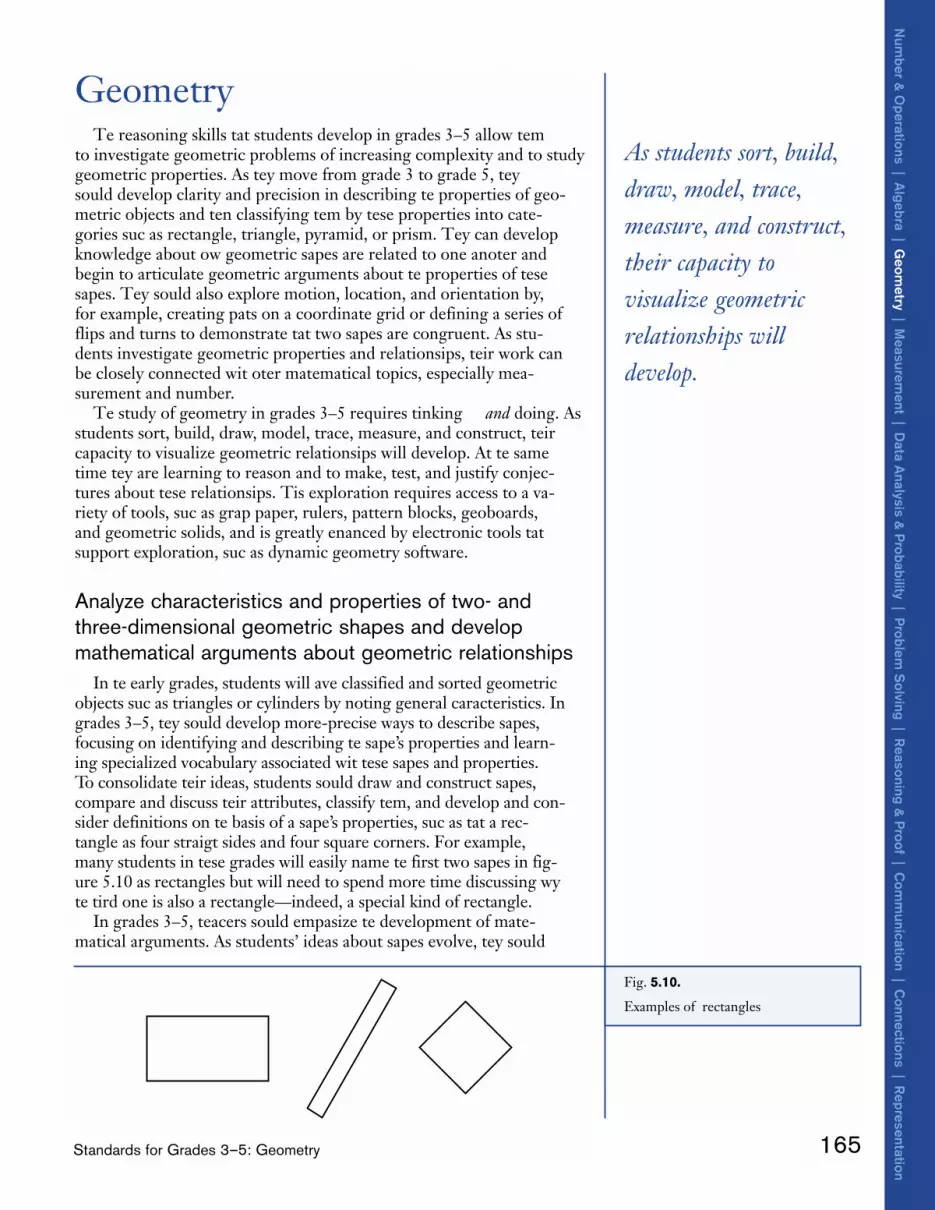
As students sort, build,draw, model, trace,measure, and construct,their capacity tovisualize geometricrelationships willdevelop.
Geometry The reasoning skills that students develop in grades 3–5 allow them
to investigate geometric problems of increasing complexity and to studygeometric properties. As they move from grade 3 to grade 5, theyshould develop clarity and precision in describing the properties of geo-metric objects and then classifying them by these properties into cate-gories such as rectangle, triangle, pyramid, or prism. They can developknowledge about how geometric shapes are related to one another andbegin to articulate geometric arguments about the properties of theseshapes. They should also explore motion, location, and orientation by,for example, creating paths on a coordinate grid or defining a series offlips and turns to demonstrate that two shapes are congruent. As stu-dents investigate geometric properties and relationships, their work canbe closely connected with other mathematical topics, especially mea-surement and number.
The study of geometry in grades 3–5 requires thinking and doing. Asstudents sort, build, draw, model, trace, measure, and construct, theircapacity to visualize geometric relationships will develop. At the sametime they are learning to reason and to make, test, and justify conjec-tures about these relationships. This exploration requires access to a va-riety of tools, such as graph paper, rulers, pattern blocks, geoboards,and geometric solids, and is greatly enhanced by electronic tools thatsupport exploration, such as dynamic geometry software.
Analyze characteristics and properties of two- andthree-dimensional geometric shapes and developmathematical arguments about geometric relationships
In the early grades, students will have classified and sorted geometricobjects such as triangles or cylinders by noting general characteristics. Ingrades 3–5, they should develop more-precise ways to describe shapes,focusing on identifying and describing the shape’s properties and learn-ing specialized vocabulary associated with these shapes and properties.To consolidate their ideas, students should draw and construct shapes,compare and discuss their attributes, classify them, and develop and con-sider definitions on the basis of a shape’s properties, such as that a rec-tangle has four straight sides and four square corners. For example,many students in these grades will easily name the first two shapes in fig-ure 5.10 as rectangles but will need to spend more time discussing whythe third one is also a rectangle—indeed, a special kind of rectangle.
In grades 3–5, teachers should emphasize the development of mathe-matical arguments. As students’ ideas about shapes evolve, they should
165Standards for Grades 3–5: Geometry
Num
ber & O
perations | Algebra | G
eometry | M
easurement | D
ata Analysis &
Probability | P
roblem S
olving | Reasoning &
Proof | C
omm
unication | Connections | R
epresentation
Fig. 5.10.
Examples of rectangles

formulate conjectures about geometric properties and relationships.Using drawings, concrete materials, and geometry software to developand test their ideas, they can articulate clear mathematical argumentsabout why geometric relationships are true. For example: “You can’tpossibly make a triangle with two right angles because if you start withone side of the triangle across the bottom, the other two sides gostraight up. They’re parallel, so they can’t possibly ever meet, so youcan’t get it to be a triangle.”
When students subdivide, combine, and transform shapes, they areinvestigating relationships among shapes. For example, a fourth-gradeclass might investigate the relationship between a rectangle and a non-rectangular parallelogram with equal bases and heights (see fig. 5.11) byasking, “Does one of these shapes have a larger area than the other?”One student might cut the region formed by the parallelogram asshown in figure 5.11 and then rearrange the pieces so that the parallelo-gram visually matches the rectangle. This work can lead to developing ageneral conjecture about the relationship between the areas of rectan-gles and parallelograms with the same base and height. The notion thatshapes that look different can have equal areas is a powerful one thatleads eventually to the development of general methods (formulas) forfinding the area of a particular shape, such as a parallelogram. In thisinvestigation, students are building their ideas about the properties ofclasses of shapes, formulating conjectures about geometric relation-ships, exploring how geometry and measurement are related, and inves-tigating the shapes with equal area.
An understanding of congruence and similarity will develop as stu-dents explore shapes that in some way look alike. They should come tounderstand congruent shapes as those that exactly match and similarshapes as those that are related by “magnifying” or “shrinking.” For ex-ample, consider the following problem involving the creation of shapeswith a particular set of properties:
Make a triangle with one right angle and two sides of equal length. Canyou make more than one triangle with this set of properties? If so, what isthe relationship of the triangles to one another?
As students make triangles with the stipulated properties (see fig. 5.12),they will see that although these triangles share a common set of charac-teristics (one right angle and a pair of sides of equal length), they are notall the same size. However, they are all related in that they look alike; thatis, one is just a smaller or larger version of the other. The triangles aresimilar. Although students will not develop a full understanding of simi-larity until the middle grades, when they focus on proportionality, ingrades 3–5 they can begin to think about similarity in terms of figuresthat are related by the transformations of magnifying or shrinking.
When discussing shapes, students in grades 3–5 should be expandingtheir mathematical vocabulary by hearing terms used repeatedly in con-text. As they describe shapes, they should hear, understand, and usemathematical terms such as parallel, perpendicular, face, edge, vertex, angle,trapezoid, prism, and so forth, to communicate geometric ideas withgreater precision. For example, as students develop a more sophisticatedunderstanding of how geometric shapes can be the same or different, theeveryday meaning of same is no longer sufficient, and they begin to needwords such as congruent and similar to explain their thinking.
166 Principles and Standards for School Mathematics
Rep
rese
ntat
ion
| C
onne
ctio
ns |
Com
mun
icat
ion
| R
easo
ning
& P
roof
| P
robl
em S
olvi
ng |
Dat
a A
naly
sis
& P
roba
bilit
y |
Mea
sure
men
t |
Geo
met
ry |
Alg
ebra
| N
umbe
r &
Ope
ratio
ns
Fig. 5.11.
The relationship between the areas ofa rectangle and a nonrectangular
parallelogram with equal bases andheights
Fig. 5.12.
Right triangles with two sides ofequal length

Specify locations and describe spatial relationships usingcoordinate geometry and other representational systems
In grades 3–5, the ideas about location, direction, and distance thatwere introduced in prekindergarten through grade 2 can be developedfurther. For instance, students can give directions for moving from onelocation to another in their classroom, school, or neighborhood; usemaps and grids; and learn to locate points, create paths, and measuredistances within a coordinate system. Students can first navigate ongrids by using landmarks. For example, the map in figure 5.13 can beused to explore questions like these: What is the shortest possible routefrom the school to the park along the streets (horizontal and verticallines of the grid)? How do you know? Can there be several different“shortest paths,” each of which is equal in length? If so, how many dif-ferent “shortest paths” are there? What if you need to start at theschool, go to the park to pick up your little sister, stop at the store, andvisit the library—in what order should you visit these locations to mini-mize the distance traveled? In this activity, students are using grids anddeveloping fundamental ideas and strategies for navigating them, animportant component of discrete mathematics.
Students at this level also should learn how to use two numbers toname points on a coordinate grid and should realize that a pair of num-bers corresponds to a particular point on the grid. Using coordinates,they can specify paths between locations and examine the symmetry, con-gruence, and similarity of shapes drawn on the grid. They can also ex-plore methods for measuring the distance between locations on the grid.As students’ ideas about the number system expand to include negativenumbers, they can work in all four quadrants of the Cartesian plane.
Apply transformations and use symmetry to analyzemathematical situations
Students in grades 3–5 should consider three important kinds oftransformations: reflections, translations, and rotations (flips, slides, andturns). Younger students generally “prove” (convince themselves) thattwo shapes are congruent by physically fitting one on top of the other,but students in grades 3–5 can develop greater precision as they de-scribe the motions needed to show congruence (“turn it 90˚” or “flip itvertically, then rotate it 180˚”). They should also be able to visualize
167Standards for Grades 3–5: Geometry
Num
ber & O
perations | Algebra | G
eometry | M
easurement | D
ata Analysis &
Probability | P
roblem S
olving | Reasoning &
Proof | C
omm
unication | Connections | R
epresentation
Fig. 5.13.
A map for exploring questions aboutnavigation
LibraryStore
Park
School

what will happen when a shape is rotated or reflected and predict theresult.
Students in grades 3–5 can explore shapes with more than one line ofsymmetry. For example:
In how many ways can you place a mirror on a square so that what you see inthe mirror looks exactly like the original square? Is this true for all squares?Can you make a quadrilateral with exactly two lines of symmetry? Oneline of symmetry? No lines of symmetry? If so, in each case, what kind ofquadrilateral is it?
Although younger students often create figures with rotational sym-metry with, for example, pattern blocks, they have difficulty describingthe regularity they see. In grades 3–5, they should be using languageabout turns and angles to describe designs such as the one in figure5.14: “If you turn it 180 degrees about the center, it’s exactly the same”or “It would take six equal small turns to get back to where you started,but you can’t tell where you started unless you mark it because it looksthe same after each small turn.”
168 Principles and Standards for School Mathematics
Rep
rese
ntat
ion
| C
onne
ctio
ns |
Com
mun
icat
ion
| R
easo
ning
& P
roof
| P
robl
em S
olvi
ng |
Dat
a A
naly
sis
& P
roba
bilit
y |
Mea
sure
men
t |
Geo
met
ry |
Alg
ebra
| N
umbe
r &
Ope
ratio
ns
Fig. 5.14.
Pattern with rotational symmetry
Use visualization, spatial reasoning, and geometricmodeling to solve problems
Students in grades 3–5 should examine the properties of two- andthree-dimensional shapes and the relationships among shapes. Theyshould be encouraged to reason about these properties by using spatialrelationships. For instance, they might reason about the area of a triangleby visualizing its relationship to a corresponding rectangle or other cor-responding parallelogram. In addition to studying physical models ofthese geometric shapes, they should also develop and use mental images.Students at this age are ready to mentally manipulate shapes, and theycan benefit from experiences that challenge them and that can also beverified physically. For example, “Draw a star in the upper right-handcorner of a piece of paper. If you flip the paper horizontally and then turnit 180˚, where will the star be?”
Much of the work students do with three-dimensional shapes in-volves visualization. By representing three-dimensional shapes in twodimensions and constructing three-dimensional shapes from two-

dimensional representations, students learn about the characteristics ofshapes. For example, in order to determine if the two-dimensionalshape in figure 5.15 is a net that can be folded into a cube, studentsneed to pay attention to the number, shape, and relative positions of itsfaces.
Students should become experienced in using a variety of representa-tions for three-dimensional shapes, for example, making a freehand draw-ing of a cylinder or cone or constructing a building out of cubes from aset of views (i.e., front, top, and side) like those shown in figure 5.16.
Technology affords additional opportunities for students to expandtheir spatial reasoning ability. Software such as Logo enables studentsto draw objects with specified attributes and to test and modify the re-sults. Computer games such as Tetris (Pajithov 1996) can help developspatial orientation and eye-hand coordination. Dynamic geometry soft-ware provides an environment in which students can explore relation-ships and make and test conjectures.
Students should have the opportunity to apply geometric ideas andrelationships to other areas of mathematics, to other disciplines, and toproblems that arise from their everyday experiences. There are manyways to make these connections. For example, measurement and geom-etry are closely linked, as illustrated in the problem in figure 5.11,where geometric properties are used to relate the areas of two figures ofdifferent shapes. Geometric models are also important in investigatingnumber relationships. Number lines, arrays, and many manipulativesused for modeling number concepts are geometric realizations of arith-metic relationships. In algebra, students in grades 3–5 often work withgeometric problems to explore patterns and functions (see, for example,the “tower of cubes” problem in fig. 5.5).
In addition to its utility in exploring and understanding other areasof mathematics, geometry is closely associated with other subjects, suchas art, science, and social studies. For example, students’ work on sym-metry can enhance their creation and appreciation of art, and theirwork on coordinate geometry is related to the maps they create or usein their study of the world. The study of geometry promotes a deeperunderstanding of many aspects of mathematics, improves students’ ab-stract reasoning, and highlights relationships between mathematics andthe sciences.
169Standards for Grades 3–5: Geometry
Num
ber & O
perations | Algebra | G
eometry | M
easurement | D
ata Analysis &
Probability | P
roblem S
olving | Reasoning &
Proof | C
omm
unication | Connections | R
epresentation
Fig. 5.15.
A task relating a two-dimensionalshape to a three-dimensional shape
?
Make a building out of ten cubes by looking at the three pictures of it below.
Front view Top view Right side view
Fig. 5.16.
Views of a three-dimensional object(Adapted from Battista and Clements1995, p. 61)
E-example 5.3
Exploring Rectangles andParallelograms

In grades 3–5 all students should—
• understand such attributes as length, area, weight, volume, and size ofangle and select the appropriate type of unit for measuring each attribute;
• understand the need for measuring with standard units and become familiarwith standard units in the customary and metric systems;
• carry out simple unit conversions, such as from centimeters to meters,within a system of measurement;
• understand that measurements are approximations and understand how differences in units affect precision;
• explore what happens to measurements of a two-dimensional shape suchas its perimeter and area when the shape is changed in some way.
• develop strategies for estimating the perimeters, areas, and volumes ofirregular shapes;
• select and apply appropriate standard units and tools to measure length,area, volume, weight, time, temperature, and the size of angles;
• select and use benchmarks to estimate measurements;• develop, understand, and use formulas to find the area of rectangles and
related triangles and parallelograms;• develop strategies to determine the surface areas and volumes of
rectangular solids.
Instructional programs fromprekindergarten through grade 12should enable all students to—
Understand measurable attributesof objects and the units, systems,and processes of measurement
Apply appropriate techniques,tools, and formulas to determinemeasurements
3–5Standard
for Grades
Expectations
Measurement
170 Principles and Standards for School Mathematics

Measurement helpsconnect ideas withinareas of mathematicsand betweenmathematics and otherdisciplines.
171Standards for Grades 3–5: Measurement
Num
ber & O
perations | Algebra | G
eometry | M
easurement | D
ata Analysis &
Probability | P
roblem S
olving | Reasoning &
Proof | C
omm
unication | Connections | R
epresentation
MeasurementMeasurement is a process that students in grades 3–5 use every day
as they explore questions related to their school or home environment.For example, how much catsup is used in the school cafeteria each day?What is the distance from my house to the school? What is the range ofheights of players on the basketball team? Such questions require stu-dents to use concepts and tools of measurement to collect data and todescribe and quantify their world. In grades 3–5, measurement helpsconnect ideas within areas of mathematics and between mathematicsand other disciplines. It can serve as a context to help students under-stand important mathematical concepts such as fractions, geometricshapes, and ways of describing data.
Prior to grade 3, students should have begun to develop an under-standing of what it means to measure an object, that is, identifying anattribute to be measured, choosing an appropriate unit, and comparingthat unit to the object being measured. They should have had manyexperiences with measuring length and should also have explored waysto measure liquid volume, weight, and time. In grades 3–5, studentsshould deepen and expand their understanding and use of measure-ment. For example, they should measure other attributes such as areaand angle. They need to begin paying closer attention to the degree ofaccuracy when measuring and use a wider variety of measurementtools. They should also begin to develop and use formulas for the mea-surement of certain attributes, such as area.
In learning about measurement and learning how to measure, stu-dents should be actively involved, drawing on familiar and accessiblecontexts. For example, students in grades 3–5 should measure objectsand space in their classroom or use maps to determine locations and dis-tances around their community. They should determine an appropriateunit and use it to measure the area of their classroom’s floor, estimatethe time it takes to do various tasks, and measure and represent changein the size of attributes, such as their height.

Understand measurable attributes of objects and theunits, systems, and processes of measurement
Students in grades 3–5 should measure the attributes of a variety ofphysical objects and extend their work to measuring more complex at-tributes, including area, volume, and angle. They will learn that lengthmeasurements in particular contexts are given specific names, such asperimeter, width, height, circumference, and distance. They can begin toestablish some benchmarks by which to estimate or judge the size of ob-jects. For example, they learn that a “square corner” is called a right angleand establish this as a benchmark for estimating the size of other angles.
Students in grades 3–5 should be able to recognize the need to selectunits appropriate to the attribute being measured. Different kinds of unitsare needed for measuring area than for measuring length. At first theymight use convenient nonstandard units such as lima beans to estimatearea and then come to recognize the need for a standard unit such as aunit square. Likewise, the need for a standard three-dimensional unit tomeasure volume grows out of initial experiences filling containers withitems such as rice or packing pieces. As students find that there are spacesbetween the units, that the units are not easy to count, or that the units arenot of a uniform size, they will appreciate the need for a standard unit.
In these grades, more emphasis should be placed on the standardunits that are used to communicate in the United States (the customaryunits) and around the world (the metric system). Students should be-come familiar with the common units in these systems and establishmental images or benchmarks for judging and comparing size. For ex-ample, they may know that a paper clip weighs about a gram, the widthof their forefinger is about a centimeter, or the distance from theirelbow to their fingertip is about a foot.
Students should gain facility in expressing measurements in equiva-lent forms. They use their knowledge of relationships between unitsand their understanding of multiplicative situations to make conver-sions, such as expressing 150 centimeters as 1.5 meters or 3 feet as 36inches. Since students in the United States encounter two systems ofmeasurement, they should also have convenient referents for compar-ing units in different systems—for example, 2 centimeters is a little lessthan an inch, a quart is a little less than a liter, a kilogram is about twopounds. However, they do not need to make formal conversions be-tween the two systems at this level.
Students in grades 3–5 should encounter the notion that measure-ments in the real world are approximate, in part because of the instru-ments used and because of human error in reading the scales of theseinstruments. For example, figure 5.17 describes a measurement task andsummarizes results typical of what groups of students obtain. Such anexercise provides a context in which the teacher can raise, and the classcan consider, the idea of measurement as an estimation process.
Each pair of students will find slightly different measurements, eventhough they are measuring the same object using the same kind of mea-surement tools. The teacher should ask students to discuss the factorsthat may lead to different measurements. Students’ responses will varyaccording to their experience, but by grade 5 they should recognize fac-tors that affect precision. These include the limitations of the measure-ment tool, how precisely students read the scale on the measuring
172 Principles and Standards for School Mathematics
Rep
rese
ntat
ion
| C
onne
ctio
ns |
Com
mun
icat
ion
| R
easo
ning
& P
roof
| P
robl
em S
olvi
ng |
Dat
a A
naly
sis
& P
roba
bilit
y |
Mea
sure
men
t |
Geo
met
ry |
Alg
ebra
| N
umbe
r &
Ope
ratio
ns
Students in grades3–5 should encounter
the notion thatmeasurements in the
real world areapproximate.

instrument (was the scale marked and read in centimeters or millime-ters?), and the students’ perceived need for accuracy. The discussionmight lead to considering the importance of measuring precisely in cer-tain contexts. For instance, carpenters often measure twice and use spe-cial instruments in order to minimize the waste of materials, but an esti-mate might be quite adequate in other instances (e.g., the scout troophiked about 2.5 miles).
Students in grades 3–5 should explore how measurements are af-fected when one attribute to be measured is held constant and the otheris changed. For example, consider the area of four tiles joined along ad-jacent sides (see fig. 5.18). The area of each tile is a square unit. Whenjoined, the area of the resulting polygon is always four square units, butthe perimeter varies from eight to ten units, depending on how the tilesare arranged. Or suppose students are given twenty toothpicks withwhich to build a rectangle. How many different rectangles are possibleif all twenty toothpicks are used? This activity provides an opportunityto discuss the relationship of area to perimeter. It also highlights theimportance of organizing solutions systematically.
Apply appropriate techniques, tools, and formulas todetermine measurements
In grades 3–5, an expanded number of tools and range of measure-ment techniques should be available to students. When using conven-tional tools such as rulers and tape measures for measuring length, stu-dents will need instruction to learn to use these tools properly. Forexample, they will need to recognize and understand the markings on aruler, including where the “0,” or beginning point, is located. Whenstandard measurement tools are difficult to use in a particular situation,they must learn to adapt their tools or invent techniques that will work.In the earlier example (fig. 5.17) measuring the circumference of a clockface with a rigid ruler presented a particular challenge. Using string orsome other flexible object to outline the clock face and then measuringthe string would have been a good strategy. Students should be chal-lenged to develop measurement techniques as needed in order to mea-sure complex figures or objects. For example, they might measure the
173Standards for Grades 3–5: Measurement
Num
ber & O
perations | Algebra | G
eometry | M
easurement | D
ata Analysis &
Probability | P
roblem S
olving | Reasoning &
Proof | C
omm
unication | Connections | R
epresentation
Fig. 5.18.
Polygons with the same area anddifferent perimeters
Fig. 5.17.
A measurement task and typical student results
Height of Circumference LengthTeacher’s Desk of Clockface of Classroom
Measure and compare:
Work in pairs and use your rulers to measure the items indicated on the chart. Record your measurements for each object on the chart.
Objects

area of an irregular polygon or a leaf by covering it with transparentgrid paper and counting units or by breaking it apart into regularshapes that they can measure.
Students in grades 3–5 should develop strategies to estimate mea-surements. For example, to estimate the length of the classroom, theymight estimate the length of one floor tile and then count the numberof tiles across the room and multiply the length by the number of tiles.Another strategy for estimating measurements is to compare the itemto be measured against some benchmark. For example, a student mightestimate the teacher’s height by noting that it is about one and a quartertimes the student’s own height. This particular strategy highlights theuse of multiplicative reasoning, an important indication of advancingunderstanding.
Strategies for estimating measurements are varied and often depend onthe particular situation. By sharing strategies, students can compare andevaluate different approaches. Students also need experience in judgingwhat degree of accuracy is required in a given situation and whether anunderestimate or overestimate is more desirable. For example, in estimat-ing the time needed to get up in the morning, eat breakfast, and walk ordrive to school, an overestimate makes sense. However, an underestimateof the time needed to cook vegetables on the grill might be consideredappropriate, since more time can always be added to the cooking processbut not taken away from it.
As students have opportunities to look for patterns in the results oftheir measurements, they recognize that their methods for measuringthe area and volume of particular objects can be generalized as formu-las. For example, the table in figure 5.19 is typical of what groups ofthird graders might produce when using a transparent grid to deter-
174 Principles and Standards for School Mathematics
Rep
rese
ntat
ion
| C
onne
ctio
ns |
Com
mun
icat
ion
| R
easo
ning
& P
roof
| P
robl
em S
olvi
ng |
Dat
a A
naly
sis
& P
roba
bilit
y |
Mea
sure
men
t |
Geo
met
ry |
Alg
ebra
| N
umbe
r &
Ope
ratio
ns
Fig. 5.19.
Measuring the areas of a set of rectan-gles using a transparent grid
Rectangle Length (cm) Width (cm) Area (cm 2)
A 5 2 10
B 4 3 12
C 1 6 6
D 2 3 6
E 4 4 16
A B C D E

mine the areas of a set of rectangles. As they begin generating the table,they realize that counting all the squares is not necessary once thelength (L) and width (W) of the rectangle are determined with the grid.They test their conjecture that Area = L × W, and it appears to work foreach rectangle in the set. Later, their teacher challenges them to thinkabout whether and why their formula will work for big rectangles aswell as small ones.
Students in grades 3–5 should develop strategies for determiningsurface area and volume on the basis of concrete experiences. Theyshould measure various rectangular solids using objects such as tiles andcubes, organize the information, look for patterns, and then make gen-eralizations. For example, the “tower of cubes” problem in figure 5.5highlights the kind of activity that builds from concrete experiences andleads to generalizations, including the development of general formulasfor measuring surface area and volume. These concrete experiences areessential in helping students understand the relationship between themeasurement of an object and the succinct formula that produces themeasurement.
175Standards for Grades 3–5: Measurement
Num
ber & O
perations | Algebra | G
eometry | M
easurement | D
ata Analysis &
Probability | P
roblem S
olving | Reasoning &
Proof | C
omm
unication | Connections | R
epresentation

In grades 3–5 all students should—
• design investigations to address a question and consider how data-collection methods affect the nature of the data set;
• collect data using observations, surveys, and experiments;• represent data using tables and graphs such as line plots, bar graphs, and
line graphs;• recognize the differences in representing categorical and numerical data.
• describe the shape and important features of a set of data and comparerelated data sets, with an emphasis on how the data are distributed;
• use measures of center, focusing on the median, and understand what eachdoes and does not indicate about the data set;
• compare different representations of the same data and evaluate how welleach representation shows important aspects of the data.
• propose and justify conclusions and predictions that are based on data anddesign studies to further investigate the conclusions or predictions.
• describe events as likely or unlikely and discuss the degree of likelihoodusing such words as certain, equally likely, and impossible;
• predict the probability of outcomes of simple experiments and test thepredictions;
• understand that the measure of the likelihood of an event can berepresented by a number from 0 to 1.
Instructional programs fromprekindergarten through grade 12should enable all students to—
Formulate questions that can beaddressed with data and collect, organize, and display relevant datato answer them
Select and use appropriate statisti-cal methods to analyze data
Develop and evaluate inferences andpredictions that are based on data
Understand and apply basic concepts of probability
3–5Standard
for Grades
Expectations
Data Analysis and Probability
176 Principles and Standards for School Mathematics
Investigations involvingdata should happenfrequently during grades 3–5.
Data Analysis and ProbabilityIn prekindergarten through grade 2, students will have learned that
data can give them information about aspects of their world. Theyshould know how to organize and represent data sets and be able to no-tice individual aspects of the data—where their own data are on thegraph, for instance, or what value occurs most frequently in the dataset. In grades 3–5, students should move toward seeing a set of data as awhole, describing its shape, and using statistical characteristics of thedata such as range and measures of center to compare data sets. Muchof this work emphasizes the comparison of related data sets. As studentslearn to describe the similarities and differences between data sets, theywill have an opportunity to develop clear descriptions of the data and toformulate conclusions and arguments based on the data. They shouldconsider how the data sets they collect are samples from larger popula-tions and should learn how to use language and symbols to describesimple situations involving probability.
Investigations involving data should happen frequently duringgrades 3–5. These can range from quick class surveys to projects thattake several days. Frequent work with brief surveys (How many broth-ers and sisters do people in our class have? What’s the farthest youhave ever been from home?) can acquaint students with particular as-pects of collecting, representing, summarizing, comparing, and inter-preting data. More extended projects can engage students in a cycle ofdata analysis—formulating questions, collecting and representing thedata, and considering whether their data are giving them the informa-tion they need to answer their question. Students in these grades arealso becoming more aware of the world beyond themselves and areready to address some questions that have the potential to influencedecisions. For example, one class that studied playground injuries attheir school gathered evidence that led to the conclusion that the barson one piece of playground equipment were too large for the hands ofmost students below third grade. This finding resulted in a new policyfor playground safety.
Formulate questions that can be addressed with data andcollect, organize, and display relevant data to answer them
At these grade levels, students should pose questions about them-selves and their environment, issues in their school or community, andcontent they are studying in different subject areas: How do fourthgraders spend their time after school? Do automobiles stop at the stopsigns in our neighborhood? How can the amount of water used for com-mon daily activities be decreased? Once a question is posed, students candevelop a plan to collect information to address the question. They maycollect their own data, use data already collected by their school or town,or use other existing data sets such as the census or weather data accessi-ble on the Internet to examine particular questions. If students collecttheir own data, they need to decide whether it is appropriate to conducta survey or to use observations or measurements. As part of their plan,they often need to refine their question and to consider aspects of datacollection such as how to word questions, whom to ask, what and when
177Standards for Grades 3–5: Data Analysis and Probability
Num
ber & O
perations | Algebra | G
eometry | M
easurement | D
ata Analysis &
Probability | P
roblem S
olving | Reasoning &
Proof | C
omm
unication | Connections | R
epresentation
E-example 5.4
Investigating Web Data

to observe, what and how to measure, and how to record their data.When they use existing data, they still need to consider and evaluate theways in which the data were collected.
Students should become familiar with a variety of representationssuch as tables, line plots, bar graphs, and line graphs by creating them,watching their teacher create them, and observing those representa-tions found in their environment (e.g., in newspapers, on cereal boxes,etc.). In order to select and interpret appropriate representations, stu-dents in grades 3–5 need to understand the nature of different kinds ofdata: categorical data (data that can be categorized, such as types oflunch foods) and numerical data (data that can be ordered numerically,such as heights of students in a class). Students should examine classifi-cations of categorical data that produce different views. For example, ina study of which cafeteria foods are eaten and which are thrown out,different classifications of the types of foods may highlight different aspects of the data.
As students construct graphs of ordered numerical data, teachersneed to help them understand what the values along the horizontal andvertical axes represent. Using experience with a variety of graphs,teachers should make sure that students encounter and discuss issuessuch as why the scale on the horizontal axis needs to include valuesthat are not in the data set and how to represent zero on a graph. Stu-dents should also use computer software that helps them organize andrepresent their data, including graphing software and spreadsheets.Spreadsheets allow students to organize and order a large set of dataand create a variety of graphs (see fig. 5.20).
When students are ready to present their data to an audience, theyneed to consider aspects of their representations that will help peopleunderstand them: the type of representation they choose, the scalesused in a graph, and headings and titles. Comparing different represen-tations helps students learn to evaluate how well important aspects ofthe data are shown.
178 Principles and Standards for School Mathematics
Rep
rese
ntat
ion
| C
onne
ctio
ns |
Com
mun
icat
ion
| R
easo
ning
& P
roof
| P
robl
em S
olvi
ng |
Dat
a A
naly
sis
& P
roba
bilit
y |
Mea
sure
men
t |
Geo
met
ry |
Alg
ebra
| N
umbe
r &
Ope
ratio
ns
Fig. 5.20.
Spreadsheet with weather dataA B C D
123456789
101112
1/11/21/31/41/51/61/71/8
0.010.880.430.25
00.250.09
0
5860585651545051
4851504440404747
Daily Precipitation andTemperatures for San Francisco,
California
DatePrecipitation
(inches)Temperature (°F)
Hi Low

Select and use appropriate statistical methods toanalyze data
In prekindergarten through grade 2, students are often most inter-ested in individual pieces of data, especially their own, or which value is“the most” on a graph. A reasonable objective for upper elementary andmiddle-grades students is that they begin to regard a set of data as awhole that can be described as a set and compared to other data sets(Konold forthcoming). As students examine a set of ordered numericaldata, teachers should help them learn to pay attention to importantcharacteristics of the data set: where data are concentrated or clumped,values for which there are no data, or data points that appear to haveunusual values. For example, in figure 5.21 consider the line plot of theheights of fast-growing plants grown in a fourth-grade classroom(adapted from Clement et al. [1997, p. 10]). Students describing thesedata might mention that the shortest plant measures about 14 centime-ters and the tallest plant about 41 centimeters; most of the data are con-centrated from 20 to 23 centimeters; and the plant that grew to a heightof 41 centimeters is very unusual (an outlier), far removed from the restof the data. As teachers guide students to focus on the shape of the dataand how the data are spread across the range of values, the studentsshould learn statistical terms such as range and outlier that help themdescribe the set of data.
179Standards for Grades 3–5: Data Analysis and Probability
Num
ber & O
perations | Algebra | G
eometry | M
easurement | D
ata Analysis &
Probability | P
roblem S
olving | Reasoning &
Proof | C
omm
unication | Connections | R
epresentation
0 5 10 15 20 25 30 35 40
x xxxx
xx
xxxxxxxx
Plant Height in Centimeters
Num
ber
ofpl
ants
Height (in cm) Number of Plants
15
20
22
23
40
Plant Height Data
Much of students’ work with data in grades 3–5 should involve com-paring related data sets. Noting the similarities and differences betweentwo data sets requires students to become more precise in their descrip-tions of the data. In this context, students gradually develop the idea of a“typical,” or average, value. Building on their informal understanding of“the most” and “the middle,” students can learn about three measures ofcenter—mode, median, and, informally, the mean. Students need tolearn more than simply how to identify the mode or median in a dataset. They need to build an understanding of what, for example, the me-dian tells them about the data, and they need to see this value in the con-text of other characteristics of the data. Figure 5.22 shows the results ofplant growth in a third-grade classroom (adapted from Clement et al.[1997, p. 10]). Students should compare the two sets of data from thefourth- and third-grade classrooms. They may note that the median ofthe fourth-grade data is 23 centimeters and the median of the third-grade data is 28 centimeters. This comparison provides information
Fig. 5.21.
Plant height data from a fourth-grade class

that, overall, the set of third-grade plants grew taller than the set offourth-grade plants. But it is also important to look at the distributionsof the data, which tell an even more dramatic story: Although the rangesof the two data sets are about the same, most of the third graders’ plantsgrew taller than all but a few of the fourth graders’ plants.
In grade 5, once students are experienced using the mode and me-dian as part of their data descriptions, they can begin to conceptuallyexplore the role of the mean as a balance point for the data set, usingsmall data sets. The idea of a mean value—what it is, what informationit gives about the data, and how it must be interpreted in the context ofother characteristics of the data—is a complex one, which will continueto be developed in later grades.
Develop and evaluate inferences and predictions thatare based on data
Data can be used for developing arguments that are based on evi-dence and for continued problem posing. As students discuss data gath-ered to address a particular question, they should begin to distinguishbetween what the data show and what might account for the results.For example, a fourth-grade class investigating the sleep patterns offirst graders and fifth graders found that first graders were heaviersleepers than fifth graders, as shown in the graphs in figure 5.23 (Rus-sell, Schifter, and Bastable 1999). They had predicted that first graderswould be lighter sleepers and were surprised by their results. After de-scribing their data, they developed a hypothesis: First graders have ahigher activity level because they play outside more, and this higher ac-tivity level leads to deeper sleep. They realized they would need to col-lect data about a typical day for first and fifth graders in order to inves-tigate their hypothesis. This example demonstrates how students can beencouraged to develop conjectures, show how these are based on thedata, consider alternative explanations, and design further studies to ex-amine their conjectures.
With appropriate experiences, students should begin to understandthat many data sets are samples of larger populations. They can look atseveral samples drawn from the same population, such as differentclassrooms in their school, or compare statistics about their own sampleto known parameters for a larger population, for example, how the me-dian family size for their class compares with the median family size re-ported for their town. They can think about the issues that affect therepresentativeness of a sample—how well it represents the population
180 Principles and Standards for School Mathematics
Rep
rese
ntat
ion
| C
onne
ctio
ns |
Com
mun
icat
ion
| R
easo
ning
& P
roof
| P
robl
em S
olvi
ng |
Dat
a A
naly
sis
& P
roba
bilit
y |
Mea
sure
men
t |
Geo
met
ry |
Alg
ebra
| N
umbe
r &
Ope
ratio
ns
Fig. 5.22.
Plant height data from a third-gradeclass
Height (in cm) Number of Plants
9
14
17
22
23
25
26
27
28
29
30
31
32
33
35
39
40
Plant Height Data
0 5 10 15 20 25 30 35 40
x x x xx xx xx x x x xxx
x
Plant Height in Centimeters
xx
x
xx xx
Num
ber
ofP
lant
s

from which it is drawn—and begin to notice how samples from thesame population can vary.
Understand and apply basic concepts of probabilityStudents in grades 3–5 should begin to learn about probability as a
measurement of the likelihood of events. In previous grades, they willhave begun to describe events as certain, likely, or impossible, but nowthey can begin to learn how to quantify likelihood. For instance, what isthe likelihood of seeing a commercial when you turn on the television?To estimate this probability, students could collect data about the num-ber of minutes of commercials in an hour.
Students should also explore probability through experiments thathave only a few outcomes, such as using game spinners with certainportions shaded and considering how likely it is that the spinner willland on a particular color. They should come to understand and use 0to represent the probability of an impossible event and 1 to representthe probability of a certain event, and they should use common frac-tions to represent the probability of events that are neither certain norimpossible. Through these experiences, students encounter the ideathat although they cannot determine an individual outcome, such aswhich color the spinner will land on next, they can predict the fre-quency of various outcomes.
181Standards for Grades 3–5: Data Analysis and Probability
Num
ber & O
perations | Algebra | G
eometry | M
easurement | D
ata Analysis &
Probability | P
roblem S
olving | Reasoning &
Proof | C
omm
unication | Connections | R
epresentation
12
11
10
9
8
7
6
5
4
3
2
1
Light Medium Heavy Other Light Medium Heavy Other
12
11
10
9
8
7
6
5
4
3
2
1
Num
ber
of S
tude
nts
First graders Fifth graders
(Russell, Schifter, and Bastable 1999)
Num
ber
of S
tude
nts
Type of Sleeper
Light Wakes up to the slightest noiseMedium Wakes up to louder noisesHeavy Sleeps through the night without waking upOther None of the previous three
Fig. 5.23.
A student investigation of sleepinghabits

182 Principles and Standards for School Mathematics
3–5Standard
for Grades
Problem Solving
Instructional programs fromprekindergarten through grade 12should enable all students to—
Build new mathematical knowledgethrough problem solving
Solve problems that arise in mathe-matics and in other contexts
Apply and adapt a variety of appro-priate strategies to solve problems
Monitor and reflect on the processof mathematical problem solving
Problem solving is the cornerstone of school mathematics. Withoutthe ability to solve problems, the usefulness and power of mathematicalideas, knowledge, and skills are severely limited. Students who can effi-ciently and accurately multiply but who cannot identify situations thatcall for multiplication are not well prepared. Students who can both de-velop and carry out a plan to solve a mathematical problem are exhibit-ing knowledge that is much deeper and more useful than simply carry-ing out a computation. Unless students can solve problems, the facts,concepts, and procedures they know are of little use. The goal of schoolmathematics should be for all students to become increasingly able andwilling to engage with and solve problems.
Problem solving is also important because it can serve as a vehicle forlearning new mathematical ideas and skills (Schroeder and Lester1989). A problem-centered approach to teaching mathematics uses in-teresting and well-selected problems to launch mathematical lessonsand engage students. In this way, new ideas, techniques, and mathemat-ical relationships emerge and become the focus of discussion. Goodproblems can inspire the exploration of important mathematical ideas,nurture persistence, and reinforce the need to understand and use vari-ous strategies, mathematical properties, and relationships.
What should problem solving look like in grades 3–5? Students in grades 3–5 should have frequent experiences with prob-
lems that interest, challenge, and engage them in thinking about impor-tant mathematics. Problem solving is not a distinct topic, but a processthat should permeate the study of mathematics and provide a context inwhich concepts and skills are learned. For instance, in the following hy-pothetical example, a teacher poses these questions to her students:
If you roll two number cubes (both with the numbers 1–6 on their faces)and subtract the smaller number from the larger or subtract one numberfrom the other if they are the same, what are the possible outcomes? Ifyou did this twenty times and created a chart and line plot of the results,what do you think the line plot would look like? Is one particular differ-ence more likely than any other differences?
Initially, the students predict that they will roll as many of one dif-ference as of another. As they begin rolling the cubes and making a
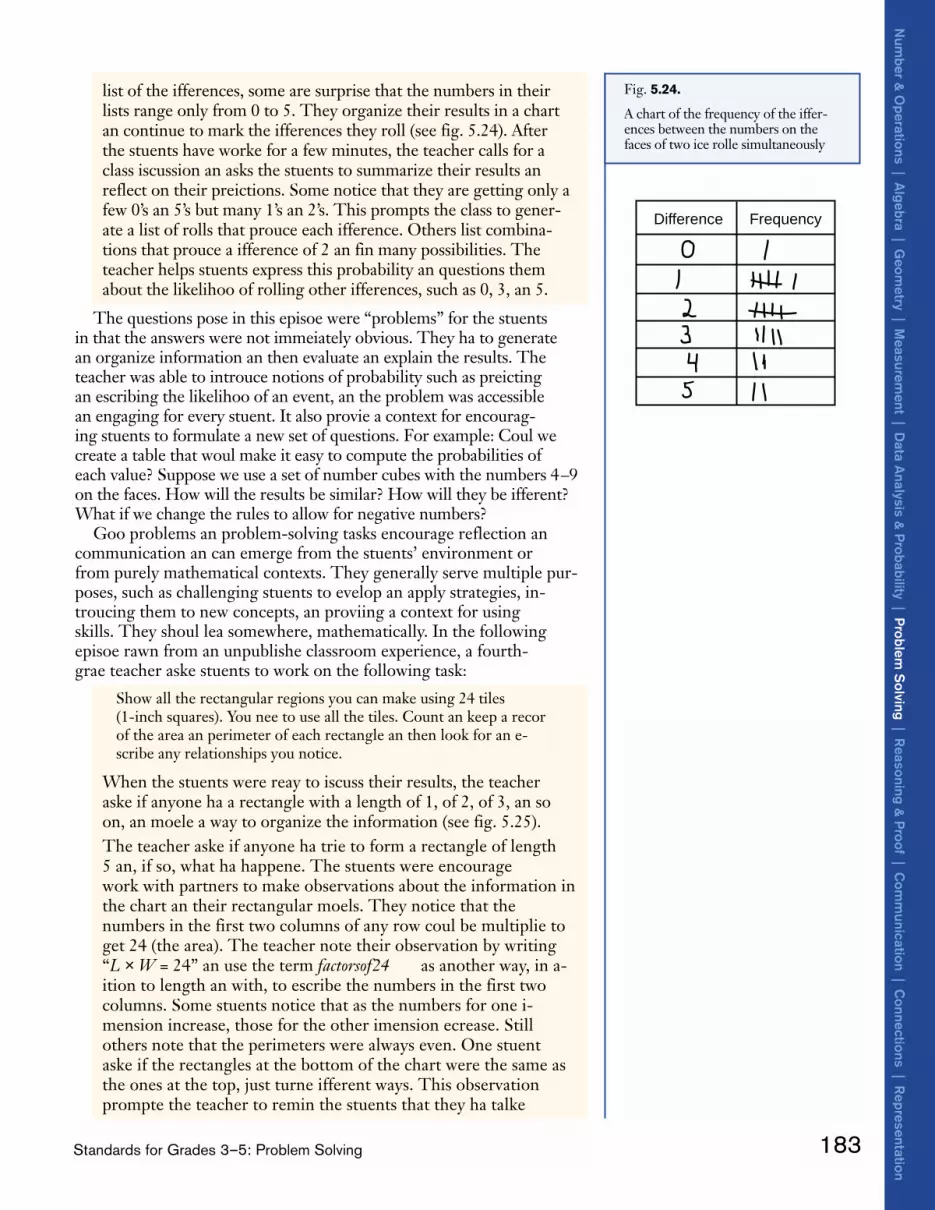
list of the differences, some are surprised that the numbers in theirlists range only from 0 to 5. They organize their results in a chartand continue to mark the differences they roll (see fig. 5.24). Afterthe students have worked for a few minutes, the teacher calls for aclass discussion and asks the students to summarize their results andreflect on their predictions. Some notice that they are getting only afew 0’s and 5’s but many 1’s and 2’s. This prompts the class to gener-ate a list of rolls that produce each difference. Others list combina-tions that produce a difference of 2 and find many possibilities. Theteacher helps students express this probability and questions themabout the likelihood of rolling other differences, such as 0, 3, and 5.
The questions posed in this episode were “problems” for the studentsin that the answers were not immediately obvious. They had to generateand organize information and then evaluate and explain the results. Theteacher was able to introduce notions of probability such as predictingand describing the likelihood of an event, and the problem was accessibleand engaging for every student. It also provided a context for encourag-ing students to formulate a new set of questions. For example: Could wecreate a table that would make it easy to compute the probabilities ofeach value? Suppose we use a set of number cubes with the numbers 4–9on the faces. How will the results be similar? How will they be different?What if we change the rules to allow for negative numbers?
Good problems and problem-solving tasks encourage reflection andcommunication and can emerge from the students’ environment orfrom purely mathematical contexts. They generally serve multiple pur-poses, such as challenging students to develop and apply strategies, in-troducing them to new concepts, and providing a context for usingskills. They should lead somewhere, mathematically. In the followingepisode drawn from an unpublished classroom experience, a fourth-grade teacher asked students to work on the following task:
Show all the rectangular regions you can make using 24 tiles(1-inch squares). You need to use all the tiles. Count and keep a recordof the area and perimeter of each rectangle and then look for and de-scribe any relationships you notice.
When the students were ready to discuss their results, the teacherasked if anyone had a rectangle with a length of 1, of 2, of 3, and soon, and modeled a way to organize the information (see fig. 5.25).The teacher asked if anyone had tried to form a rectangle of length5 and, if so, what had happened. The students were encouragedwork with partners to make observations about the information inthe chart and their rectangular models. They noticed that thenumbers in the first two columns of any row could be multiplied toget 24 (the area). The teacher noted their observation by writing“L × W = 24” and used the term factors of 24 as another way, in ad-dition to length and width, to describe the numbers in the first twocolumns. Some students noticed that as the numbers for one di-mension increased, those for the other dimension decreased. Stillothers noted that the perimeters were always even. One studentasked if the rectangles at the bottom of the chart were the same asthe ones at the top, just turned different ways. This observationprompted the teacher to remind the students that they had talked
183Standards for Grades 3–5: Problem Solving
Num
ber & O
perations | Algebra | G
eometry | M
easurement | D
ata Analysis &
Probability | P
roblem S
olving | Reasoning &
Proof | C
omm
unication | Connections | R
epresentation
Difference Frequency
Fig. 5.24.
A chart of the frequency of the differ-ences between the numbers on thefaces of two dice rolled simultaneously
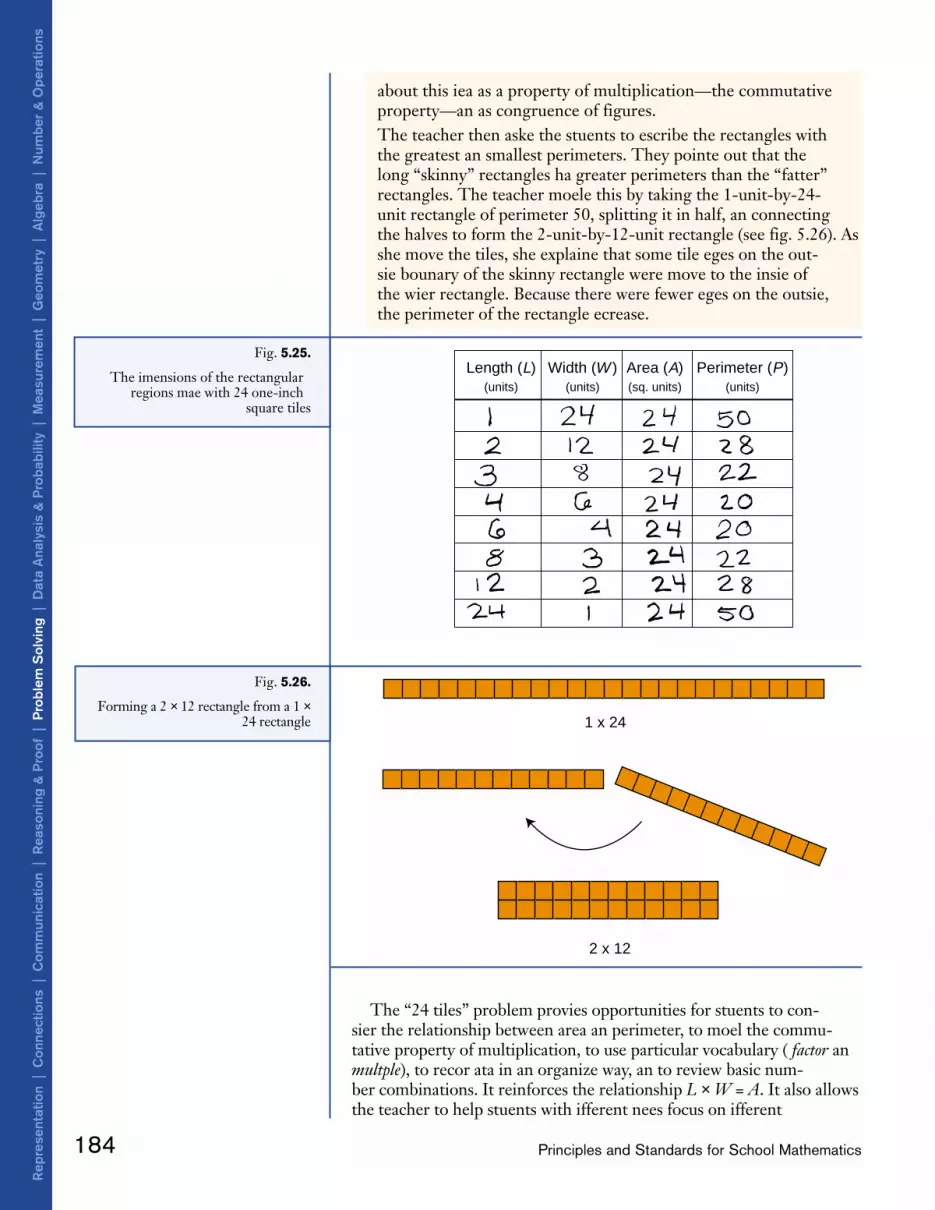
about this idea as a property of multiplication—the commutativeproperty—and as congruence of figures. The teacher then asked the students to describe the rectangles withthe greatest and smallest perimeters. They pointed out that thelong “skinny” rectangles had greater perimeters than the “fatter”rectangles. The teacher modeled this by taking the 1-unit-by-24-unit rectangle of perimeter 50, splitting it in half, and connectingthe halves to form the 2-unit-by-12-unit rectangle (see fig. 5.26). Asshe moved the tiles, she explained that some tile edges on the out-side boundary of the skinny rectangle were moved to the inside ofthe wider rectangle. Because there were fewer edges on the outside,the perimeter of the rectangle decreased.
184 Principles and Standards for School Mathematics
Rep
rese
ntat
ion
| C
onne
ctio
ns |
Com
mun
icat
ion
| R
easo
ning
& P
roof
| P
robl
em S
olvi
ng |
Dat
a A
naly
sis
& P
roba
bilit
y |
Mea
sure
men
t |
Geo
met
ry |
Alg
ebra
| N
umbe
r &
Ope
ratio
ns
Fig. 5.26.
Forming a 2 × 12 rectangle from a 1 ×24 rectangle 1 x 24
2 x 12
Fig. 5.25.
The dimensions of the rectangular regions made with 24 one-inch
square tiles
Length (L) Width (W ) Area (A) Perimeter (P)(units) (units) (sq. units) (units)
The “24 tiles” problem provides opportunities for students to con-sider the relationship between area and perimeter, to model the commu-tative property of multiplication, to use particular vocabulary ( factor andmultiple), to record data in an organized way, and to review basic num-ber combinations. It reinforces the relationship L × W = A. It also allowsthe teacher to help students with different needs focus on different

aspects of the problem—building all the rectangles, organizing the data,looking for patterns, or making and justifying conjectures.
Reflecting on different ways of thinking about and representing aproblem solution allows comparisons of strategies and consideration ofdifferent representations. For example, students might be asked to findseveral ways to determine the number of dots on the boundary of thesquare in figure 5.27 and then to represent their solutions as equations(Burns and Mclaughlin 1990).
Students will likely see different patterns. Several possibilities areshown in figure 5.28. The teacher should ask each student to relate thedrawings to the numbers in their equations. When several differentstrategies have been presented, the teacher can ask students to examinethe various ways of solving the problem and to notice how they arealike and how they are different. This problem offers a natural way tointroduce the concept and term equivalent expressions.
In addition to developing and using a variety of strategies, studentsalso need to learn how to ask questions that extend problems. In thisway, they can be encouraged to follow up on their genuine curiosityabout mathematical ideas. For example, the teacher might ask studentsto create a problem similar to the “dot square” problem or to extend itin some way: If there were a total of 76 dots, how many would be oneach side of the square? Could a square be formed with a total of 75dots? Students could also work with extensions involving dots on theperimeter of other regular polygons. By extending problems and askingdifferent questions, students become problem posers as well as problemsolvers.
What should be the teacher’s role in developingproblem solving in grades 3 through 5?
Teachers can help students become problem solvers by selectingrich and appropriate problems, orchestrating their use, and assessingstudents’ understanding and use of strategies. Students are more likelyto develop confidence and self-assurance as problem solvers in class-rooms where they play a role in establishing the classroom norms andwhere everyone’s ideas are respected and valued. These attitudes areessential if students are expected to make sense of mathematics and totake intellectual risks by raising questions, formulating conjectures,and offering mathematical arguments. Since good problems challengestudents to think, students will often struggle to arrive at solutions. Itis the teacher’s responsibility to know when students need assistance
185Standards for Grades 3–5: Problem Solving
Num
ber & O
perations | Algebra | G
eometry | M
easurement | D
ata Analysis &
Probability | P
roblem S
olving | Reasoning &
Proof | C
omm
unication | Connections | R
epresentation
Fig. 5.27.
The “dot square” problem
Fig. 5.28.
Several possible solutions to the “dotsquare” problem
4 × 8 + 4 = 36 4 × 10 – 4 = 36 10 + 8 + 10 + 8 = 36
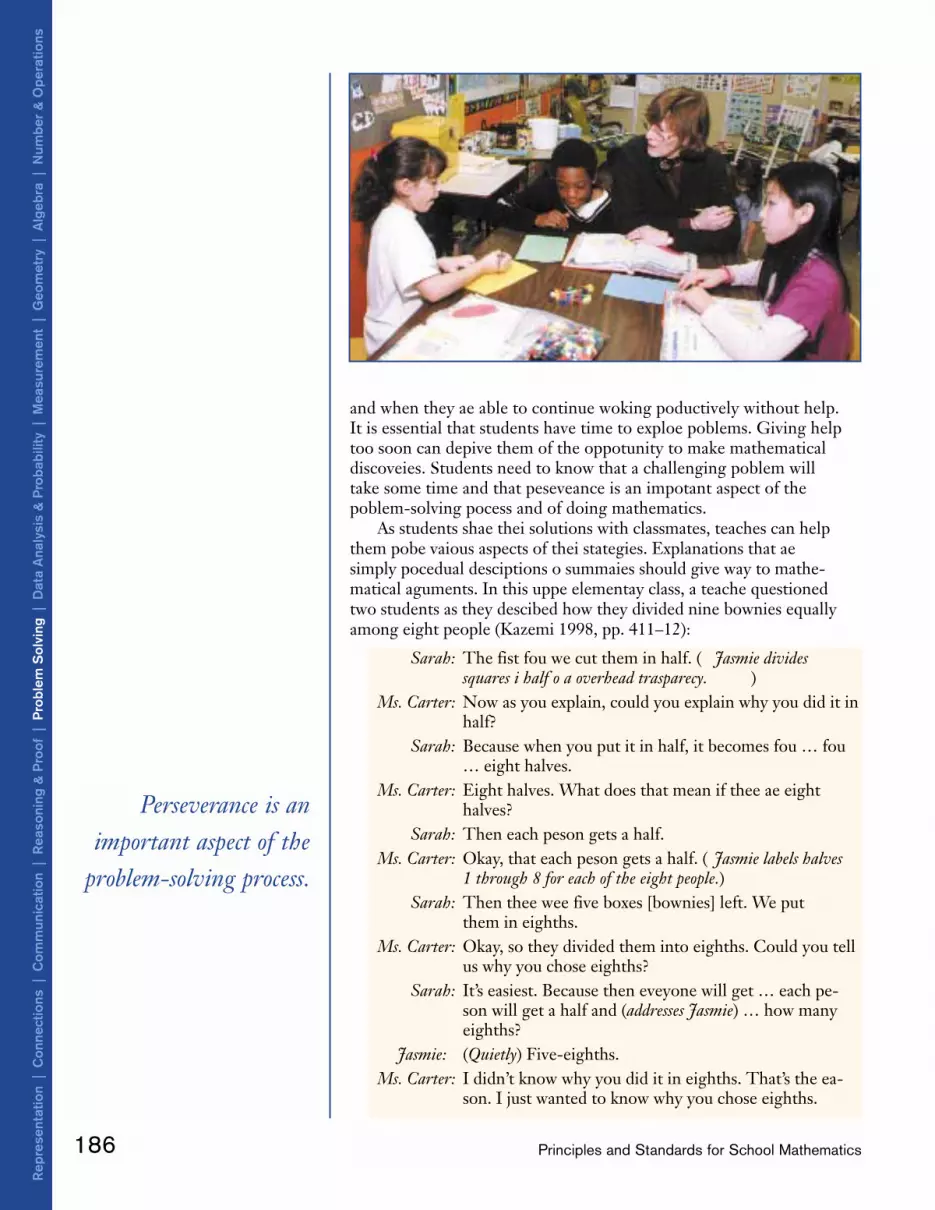
and when they are able to continue working productively without help.It is essential that students have time to explore problems. Giving helptoo soon can deprive them of the opportunity to make mathematicaldiscoveries. Students need to know that a challenging problem willtake some time and that perseverance is an important aspect of theproblem-solving process and of doing mathematics.
As students share their solutions with classmates, teachers can helpthem probe various aspects of their strategies. Explanations that aresimply procedural descriptions or summaries should give way to mathe-matical arguments. In this upper elementary class, a teacher questionedtwo students as they described how they divided nine brownies equallyamong eight people (Kazemi 1998, pp. 411–12):
Sarah: The first four we cut them in half. (Jasmine dividessquares in half on an overhead transparency.)
Ms. Carter: Now as you explain, could you explain why you did it inhalf?
Sarah: Because when you put it in half, it becomes four … four… eight halves.
Ms. Carter: Eight halves. What does that mean if there are eighthalves?
Sarah: Then each person gets a half.Ms. Carter: Okay, that each person gets a half. (Jasmine labels halves
1 through 8 for each of the eight people.)Sarah: Then there were five boxes [brownies] left. We put
them in eighths.Ms. Carter: Okay, so they divided them into eighths. Could you tell
us why you chose eighths?Sarah: It’s easiest. Because then everyone will get … each per-
son will get a half and (addresses Jasmine) … how manyeighths?
Jasmine: (Quietly) Five-eighths.Ms. Carter: I didn’t know why you did it in eighths. That’s the rea-
son. I just wanted to know why you chose eighths.
Perseverance is animportant aspect of the
problem-solving process.
186 Principles and Standards for School Mathematics
Rep
rese
ntat
ion
| C
onne
ctio
ns |
Com
mun
icat
ion
| R
easo
ning
& P
roof
| P
robl
em S
olvi
ng |
Dat
a A
naly
sis
& P
roba
bilit
y |
Mea
sure
men
t |
Geo
met
ry |
Alg
ebra
| N
umbe
r &
Ope
ratio
ns

Jasmine: We did eighths because then if we did eighths, eachperson would get each eighth, I mean one-eighth out ofeach brownie.
Ms. Carter: Okay, one-eighth out of each brownie. Can you just,you don’t have to number, but just show us what youmean by that? I heard the words, but…
Jasmine: (Shades in one-eighth of each of the five brownies that weredivided into eighths.) Person one would get this … (pointsto one-eighth)
Ms. Carter: Oh, out of each brownie.Sarah: Out of each brownie, one person will get one-eighth.
Ms. Carter: One-eighth. Okay. So how much then did they get ifthey got their fair share?
Jasmine &Sarah: They got a half and five-eighths.
Ms. Carter: Do you want to write that down at the top, so I can seewhat you did? ( Jasmine writes 1/2 + 1/8 + 1/8 + 1/8 +1/8 + 1/8 at the top of the overhead transparency.)
In this discussion, the teacher pressed students to give reasons fortheir decisions and actions: What does it mean if there are eight halves?Could you tell us why you chose eighths? Can you show us what youmean by that? She was not satisfied with a simple summary of the stepsbut instead expected the students to give verbal justifications all alongthe way and to connect those justifications with both numbers and rep-resentations. This particular pair of students used a strategy that wasdifferent from that of other students. Although it was not the most effi-cient strategy, it did reveal that these students could solve a problemthey had not encountered before and that they could explain and repre-sent their thinking.
Listening to discussions, the teacher is able to assess students’ under-standing. In the conversation about sharing brownies, the teacher askedstudents to justify their responses in order to gain information abouttheir conceptual knowledge. For any assessment of problem solving,teachers must look beyond the answer to the reasoning behind the solu-tion. This evidence can be found in written and oral explanations,drawings, and models. Reflecting on these assessment data, teachers canchoose directions for future instruction that fit with their mathematicalgoals.
187Standards for Grades 3–5: Problem Solving
Num
ber & O
perations | Algebra | G
eometry | M
easurement | D
ata Analysis &
Probability | P
roblem S
olving | Reasoning &
Proof | C
omm
unication | Connections | R
epresentation

188 Principles and Standards for School Mathematics
3–5Standard
for Grades
Reasoning and Proof
Instructional programs fromprekindergarten through grade 12should enable all students to—
Recognize reasoning and proof asfundamental aspects of mathematics
Make and investigate mathematicalconjectures
Develop and evaluate mathematicalarguments and proofs
Select and use various types ofreasoning and methods of proof
During grades 3–5, students should be involved in an important transi-tion in their mathematical reasoning. Many students begin this grade bandbelieving that something is true because it has occurred before, becausethey have seen several examples of it, or because their experience to dateseems to confirm it. During these grades, formulating conjectures and as-sessing them on the basis of evidence should become the norm. Studentsshould learn that several examples are not sufficient to establish the truthof a conjecture and that counterexamples can be used to disprove a conjec-ture. They should learn that by considering a range of examples, they canreason about the general properties and relationships they find.
Much of the work in these grades should be focused on reasoningabout mathematical relationships, such as the structure of a pattern, thesimilarities and differences between two classes of shapes, or the overallshape of the data represented on a line plot. Students should move fromconsidering individual mathematical objects—this triangle, this number,this data point—to thinking about classes of objects—all triangles, allnumbers that are multiples of 4, a whole set of data. Further, theyshould be developing descriptions and mathematical statements aboutrelationships between these classes of objects, and they can begin to un-derstand the role of definition in mathematics.
Mathematical reasoning develops in classrooms where students are en-couraged to put forth their own ideas for examination. Teachers and stu-dents should be open to questions, reactions, and elaborations from oth-ers in the classroom. Students need to explain and justify their thinkingand learn how to detect fallacies and critique others’ thinking. They needto have ample opportunity to apply their reasoning skills and justify theirthinking in mathematics discussions. They will need time, many variedand rich experiences, and guidance to develop the ability to constructvalid arguments and to evaluate the arguments of others. There is clearevidence that in classrooms where reasoning is emphasized, students doengage in reasoning and, in the process, learn what constitutes acceptablemathematical explanation (Lampert 1990; Yackel and Cobb 1994, 1996).
What should reasoning and proof look like in grades 3through 5?
In grades 3–5, students should reason about the relationships thatapply to the numbers, shapes, or operations they are studying. They

Mathematical reasoningdevelops in classroomswhere students areencouraged to put forththeir own ideas forexamination.
need to define the relationship, analyze why it is true, and determine towhat group of mathematical objects (numbers, shapes, and operations)it can be applied. Consider the following episode drawn from unpub-lished classroom observation notes:
In Ms. Taylor’s third-grade class, students were having a discussionof how to compute 4 × 8. One student, Matt, explained, “I thoughtof 2 × 8, that’s 16, then you just double it.” The teacher asked sev-eral students to restate the idea and then asked the class, “Do youthink Matt’s way of multiplying by 4—by doubling then doublingagain—works with problems other than 4 × 8?” When the responsefrom students was quite mixed, she asked them to try some prob-lems like this themselves before gathering again to discuss Matt’smethod.
This example shows a teacher taking advantage of an opportunityto engage students in mathematical reasoning. By asking the question“Do you think that always works?” she moved the discussion from thespecific problem to a consideration of a general characteristic of mul-tiplication problems—that a factor in a multiplication expression canitself be factored and then the new factors can be multiplied in anyorder.
After students had worked on several problems and had discussedwith a partner why “doubling then doubling again” was a strategyfor multiplying by 4, the teacher reconvened the class for furtherdiscussion. Student responses to whether Matt’s strategy wouldalways work showed a wide range of thinking:
Carol: Because if you have 2 times 8 and 4 times 8, you’re dou-bling the answer. It works every time.
Malia: It has to be doubled because you’re doing the same thingover again. It’s like you did 2 times 8 is 16 and then youdid 2 times 8 is 16 again, so it has to be 32.
Steven: What you’re doing is counting by 8s, so you’re countingahead, you’re skipping some of the 8s. You’re doinganother two of them, so it’s like doubling them up.
Matt: I tried to see if it would work with triples, so I did 2 times8 and 6 times 8, and it worked. You times it by 3 and theanswer is tripled.
These students’ explanations are tied to the specific example, butthere is evidence that some students are constructing arguments thatmay lead to more-general conclusions. Carol is satisfied that “itworks every time” but does not have an argument that is based on thestructure of multiplication. Malia refers to breaking up one of thefactors in the problem into two parts, multiplying the other numberby both parts, and then adding the results—the distributive propertyof multiplication over addition. Steven’s explanation is based onmodeling multiplication as skip-counting, and Matt takes his originalidea further by testing whether multiplying by 6 is the same as multi-plying by 2 then by 3. Although none of these third graders’ argu-ments is stated in a way that is complete or general, they are begin-ning to see what it means to develop and test conjectures aboutmathematical relationships.
189Standards for Grades 3–5: Reasoning and Proof
Num
ber & O
perations | Algebra | G
eometry | M
easurement | D
ata Analysis &
Probability | P
roblem S
olving | Reasoning &
Proof | C
omm
unication | Connections | R
epresentation

Following this discussion, the teacher sent students off to work on aset of multiplication problems. Their work on the problems gaveevidence that some of them were applying aspects of the reasoningdiscussed in the class session. For example, Katherine computed74 × 6 by first computing 74 × 2 and writing the product. Then shedoubled the answer to get the solution to 74 × 4 and added the twoproducts together to get the solution for 74 × 6 (see fig. 5.29). Shewas using thinking similar to Malia’s, which seemed to involve thedistributive property.
During grades 3–5, students should move toward reasoning that de-pends on relationships and properties. Students need to be challengedwith questions such as, What if I gave you twenty more problems likethis to do—would they all work the same way? How do you know?Through comparing solutions and questioning one another’s reasoning,they can begin to learn to describe relationships that hold across manyinstances and to develop and defend arguments about why those rela-tionships can be generalized and to what cases they apply (Maher andMartino 1996).
At these grades, students need experiences in learning about whatconstitutes a convincing argument (Hanna and Yackel forthcoming).For example, in this episode drawn from unpublished classroom obser-vation notes, a third-grade class explored the following problem(adapted from Tierney and Berle-Carman [1995, p. 22]).
Start with two identical rectangular regions—each the same size. Cuteach of the two rectangles in half as shown in figure 5.30. Compare oneof the smaller rectangles to one of the right triangles; do they have thesame area or does one have a larger area than the other?
Initially, the students tried to solve the problem by just looking atthe figure. For example, they reasoned:“The triangle is bigger because it goes way up.”“I think they’re the same because the triangle’s taller, but the rec-tangle’s longer.”As the students worked on this problem, some were convinced thatthey could decide if the areas were equal (or not) by whether or notthey could cut the triangle into a set of haphazard pieces and fitthem on the rectangle so that they cover the space (see fig. 5.31a).Others thought about how to organize the cutting and pasting by,for example, cutting the triangle into two pieces to make it into arectangle that matches the other rectangles (see fig. 5.31b).Still others developed ways to reason about the relationships in thefigure without cutting and pasting. For example: “We folded eachpaper in half and each paper was the same size to begin with, so thehalf that’s a rectangle is the same as the half that’s a triangle.”
At this grade level, many students are just beginning to develop anidea about what constitutes a convincing argument. The first solution—cutting and pasting in a disorganized way—does not make use of theproperties of the two shapes and therefore may not convince the studentdoing the cutting and pasting or other students that the areas are equal.The second solution takes into consideration geometric relationshipsbetween the particular triangle and rectangle and therefore may be more
190 Principles and Standards for School Mathematics
Rep
rese
ntat
ion
| C
onne
ctio
ns |
Com
mun
icat
ion
| R
easo
ning
& P
roof
| P
robl
em S
olvi
ng |
Dat
a A
naly
sis
& P
roba
bilit
y |
Mea
sure
men
t |
Geo
met
ry |
Alg
ebra
| N
umbe
r &
Ope
ratio
ns
Fig. 5.29.
A student’s solution to the problem74 × 6 involves the distributive
property.
Fig. 5.30.
A rectangle cut into halves in twodifferent ways
Fig. 5.31.
Students’ attempts to demonstratethat a triangle has the same area as a
rectangle
(a)
(b)

Posing conjectures andtrying to justify them isan expected part ofstudents’ mathematicalactivity.
convincing. The third solution is the beginning of a logical analysis ofthe relationships among the shapes—that halves of equal areas must beequal to each other.
Students in grades 3–5 should frequently make conjectures aboutmathematical relationships, investigate those conjectures, and makemathematical arguments that are based on their work. They need toknow that posing conjectures and trying to justify them is an expectedpart of students’ mathematical activity. Justification will have a range ofmeanings for students in grades 3–5, but as they progress through thesegrades and have more experiences with making mathematical argu-ments, they should increasingly base their arguments on an analysis ofproperties, structures, and relationships.
Sometimes students’ conjectures about mathematical properties andrelationships will turn out to be wrong. Part of mathematical reasoningis examining and trying to understand why something that looks andseems as if it might be true is not and to begin to use counterexamples inthis context. Coming up with ideas that turn out not to be true is part ofthe endeavor. These “wrong” ideas often are opportunities for importantmathematical discussions and discoveries. For example, a student mightpropose that if both the numerator and denominator of a fraction arelarger than the numerator and denominator, respectively, of anotherfraction, then the first fraction must be larger. This rule works in com-paring 3/4 with 1/2 or 6/4 with 2/3. However, when thinking about thisconjecture more carefully, students will find counterexamples—for example, 3/4 is not larger than 2/2 and 2/6 is smaller than 1/2.
What should be the teacher’s role in developingreasoning and proof in grades 3 through 5?
In order for mathematical experiences such as those described in thissection to happen frequently, the teacher must establish the expectationthat the class as a mathematical community is continually developing,testing, and applying conjectures about mathematical relationships. Inthe episode in Ms. Taylor’s third-grade classroom, where students ex-plored the effects of multiplying by 2 and by 2 again, the teacher lookedfor an opportunity to go beyond finding the solution to an individualproblem to focus on more-general mathematical structures and rela-tionships. In this way, she helped her students recognize reasoning as acentral part of mathematical activity.
Part of the teacher’s role in making reasoning central is to make allstudents responsible both for articulating their own reasoning and forworking hard to understand the reasoning of others, as shown in the fol-lowing episode, drawn from unpublished classroom observation notes.
In a fourth-grade classroom, the students were ordering fractions. Tobegin this activity, the teacher had asked them to identify fractionsthat are more than 1/2 and less than 1. After the students talked inpairs, the teacher asked how they were choosing their fractions:
Patrize: We were talking about how you could get it, and if youmake the top number, the numerator, higher than a half ofthe denominator, but you don’t make it the same as thedenominator like 5/5 ’cause then it will be a whole.
191Standards for Grades 3–5: Reasoning and Proof
Num
ber & O
perations | Algebra | G
eometry | M
easurement | D
ata Analysis &
Probability | P
roblem S
olving | Reasoning &
Proof | C
omm
unication | Connections | R
epresentation

Teacher: It sounds like you have a conjecture. Can someone elseexplain it?
Justin: Like if you have 3/4, half of 4 is 2, so you want the numberhigher than 2 but not 4.
By routinely questioning students in this way, the teacher is establishingthe expectation that students listen carefully to one another’s ideas andtry to understand them.
The teacher should continually remind students of conjectures andmathematical arguments that they have developed as part of the sharedclassroom experience and that can be applied to further work. Teachersshould look for opportunities for students to revise, expand, and updategeneralizations they have made as they develop new mathematical skillsand knowledge. Matt’s idea about tripling in Ms. Taylor’s third-gradeclass could provide the basis for students to reason about a larger classof problems. Even students who seem to have developed a clear argu-ment about a mathematical relationship need to be questioned andchallenged when they are ready to encounter new aspects of the rela-tionship. For example, a class of third graders had spent a great deal oftime working with arrays in their study of multiplication. As a group,they were very sure that multiplication was commutative, and theycould demonstrate this property using an area model. In the fourthgrade, they began encountering larger numbers; when the teacher no-ticed that some students were using commutativity, she asked the classwhat they knew about it. At first they seemed certain that multiplicationis commutative in all cases, but when she pressed, “But would it workfor any numbers? How about 43 279 times 6 892?” they lost their con-fidence. They could no longer use physical models to show commuta-tivity with such large numbers, and they needed further work to de-velop mental images and mathematical arguments based on what theyhad learned from the physical models. It is likely that these studentswill also need to revisit commutativity when they study computationwith fractions and decimals.
The teacher will also have to make decisions about which conjecturesare mathematically significant for students to pursue. To do this, theteacher must take into account the skills, needs, and understandings ofthe students and the mathematical goals for the class.
Teachers should lookfor opportunities for
students to revise,expand, and updategeneralizations they
have made.
192 Principles and Standards for School Mathematics
Rep
rese
ntat
ion
| C
onne
ctio
ns |
Com
mun
icat
ion
| R
easo
ning
& P
roof
| P
robl
em S
olvi
ng |
Dat
a A
naly
sis
& P
roba
bilit
y |
Mea
sure
men
t |
Geo
met
ry |
Alg
ebra
| N
umbe
r &
Ope
ratio
ns

Blank Page

194 Principles and Standards for School Mathematics
3–5Standard
for Grades
Communication
Instructional programs fromprekindergarten through grade 12should enable all students to—
Organize and consolidate theirmathematical thinking throughcommunication
Communicate their mathematicalthinking coherently and clearly topeers, teachers, and others
Analyze and evaluate the mathe-matical thinking and strategies ofothers
Use the language of mathematicsto express mathematical ideas precisely
The ability to read, write, listen, think, and communicate about prob-lems will develop and deepen students’ understanding of mathematics.In grades 3–5, students should use communication as a tool for under-standing and generating solution strategies. Their writing should bemore coherent than in earlier grades, and their increasing mathematicalvocabulary can be used along with everyday language to explain con-cepts. Depending on the purpose for writing, such as taking notes orwriting to explain an answer, students’ descriptions of problem-solvingstrategies and reasoning should become more detailed and coherent.
In grades 3–5, students should become more adept at learning from,and working with, others. Their communication can consist not only ofconversations between student and teacher or one student and anotherstudent but also of students listening to a number of peers and joininggroup discussions in order to clarify, question, and extend conjectures.In classroom discussions, students should become the audience for oneanother’s comments. This involves speaking to one another in order toconvince or question peers. The discourse should not be a goal in itselfbut rather should be focused on making sense of mathematical ideas andusing them effectively in modeling and solving problems. The value ofmathematical discussions is determined by whether students are learningas they participate in them (Lampert and Cobb forthcoming).
What should communication look like in grades 3through 5?
In a grades 3–5 classroom, communication should include sharingthinking, asking questions, and explaining and justifying ideas. It shouldbe well integrated in the classroom environment. Students should beencouraged to express and write about their mathematical conjectures,questions, and solutions. For example, after preparatory work in deci-mals, a fifth-grade teacher engaged her students in the following prob-lem in order to help them think about and develop methods for addingdecimals (episode adapted from Schifter, Bastable, and Russell [1999,pp. 114–20]).
Pretend you are a jeweler. Sometimes people come in to get rings resized.When you cut down a ring to make it smaller, you keep the small portion
E-example 5.1
Communication through Games

of gold in exchange for the work you have done. Recently you have col-lected these amounts:
1.14 g .089 g .3 g
Now you have a repair job to do for which you need some gold. You arewondering if you have enough. Work together with your group to figureout how much gold you have collected. Be prepared to show the class yoursolution. (P. 114)
In this activity, the teacher presented the students with a problem-solving situation. Although they had worked with representing deci-mals, they had not discussed adding them. As was customary in theclass, the students were expected to talk with their peers to solve theproblem and to share their results and thinking with the class. Thestudents used communication as a natural and essential part of theproblem-solving process. As the groups worked, the teacher circulatedamong the students:
Nikki: We could line the numbers up on the right like you dowith other numbers.
Ned: Maybe we should line up the decimals, but I don’t knowwhy we would do that.
Teacher: I think you’re suggesting that you might line this prob-lem up differently from the way you line up whole-number addition. Is that right?
Ned: (Nods.)Teacher: Why do you line whole numbers up the way you do?
What’s the reason for it?Ned: I don’t know. It’s just the way you do it. That’s how we
learned to do it.Malik: I think it would help if we drew a picture, like of the
[base-ten] blocks. Maybe we could figure it out then.(P. 114)
The teacher moved to another group where the students had repre-sented their problem as shown in figure 5.32.
Teacher: What happened to the decimal numbers?Jaron: We just decided to drop the decimals and add the num-
bers like usual. That way we could line them up on theright and add. We left the zero in there, but you canjust leave it out since it doesn’t mean anything.
Teacher: Do you all agree?Johanna &
Jerry: Yes.Teacher: Are you saying, then, that if you start out with 1 and 14
hundredths grams of gold and some other little bits thatit adds up to 206 grams of gold? (P. 115)
Listening carefully to the discussions, the teacher rephrased Ned’ssuggestion in order to make sure she had accurately captured his think-ing, to help him focus on the important mathematical concepts, and toguide him in considering how this problem is related to those more
195Standards for Grades 3–5: Communication
Num
ber & O
perations | Algebra | G
eometry | M
easurement | D
ata Analysis &
Probability | P
roblem S
olving | Reasoning &
Proof | C
omm
unication | Connections | R
epresentation
Fig. 5.32.
Jaron’s group’s incorrect solution to1.14 g + .089 g + .3 g

familiar to him. Ned’s response gave her important assessment informa-tion about whether he understood his method for adding whole num-bers. Although he was able to use an algorithm to add whole numbers,he lacked an understanding of the concepts behind the procedure andtherefore was unsure if or how it could be used or adapted for this newpurpose.
In talking with Jaron’s group, the teacher asked a question that led stu-dents to think about the reasonableness of their response by considering itin relation to its real-world context. The realization that their responsedidn’t make sense caused the students to revisit the problem. In this par-ticular instance, the teacher chose to let students work through their con-fusion. The teacher’s decisions about what to say or not say, what to ask ornot ask, were based on her observations of the students and their conver-sations. For example, What strategies were they using? Were misconcep-tions being challenged? Her goal was to nudge the students to reflect ontheir answer and to do further mathematical reasoning.
After the groups finished their work, the class as a whole had a dis-cussion. Rob reported that the students in his group representedthe problem as shown in figure 5.33 (p. 116).Ned immediately asked why they had decided to line up the num-bers that way, and Rob responded that the group thought theyneeded to line up the tenths with the tenths and the hundredthswith the hundredths to “make it come out right.” Jaron speculatedthat it was possible to drop the zero in .089, since “it doesn’t standfor anything.” Teresa jumped in the conversation by stating, “Youcan’t just drop that zero. It has to be there or you get 89 hundredthsinstead of 89 thousandths, and they’re not the same at all.” Malikcontinued to push for a model, but he was stumped. “If I had theflats be one whole, then the rods are tenths and the units are hun-dredths, but I don’t know how to draw the thousandths except asdots. Then I can’t really tell what’s going on.” Another student,Ben, suggested that the block be one whole, so a flat could betenths, the rod could be hundredths, and the unit could be thou-sandths. He and several other students drew and presented a pictureto illustrate their thinking (see fig. 5.34).
Malik paid close attention during Ben’s explanation, nodding that heunderstood. Teresa was also interested in the explanation, noting thesignificance of how zero was represented. After this presentation, the
196 Principles and Standards for School Mathematics
Rep
rese
ntat
ion
| C
onne
ctio
ns |
Com
mun
icat
ion
| R
easo
ning
& P
roof
| P
robl
em S
olvi
ng |
Dat
a A
naly
sis
& P
roba
bilit
y |
Mea
sure
men
t |
Geo
met
ry |
Alg
ebra
| N
umbe
r &
Ope
ratio
ns
Fig. 5.33.
Rob’s group’s solution to1.14 g + .089 g + .3 g
Fig. 5.34.
Ben’s group’s solution to 1.14 g + .089 g + .3 g

students wrote in their journals, explaining what they thought wasa correct procedure for adding the numbers. Many mentionedthat the demonstration had made it clear that tenths had to beadded to tenths and hundredths to hundredths for the right an-swer. Some made up new problems and made drawings of thebase-ten model.
Because discussion of thinking was a regular occurrence in this class-room, students were comfortable describing their thinking, even if theirideas were different from the ideas of their peers. Besides focusing ontheir own thinking, students also attempted to understand the thinkingof others and in some cases to relate it to their own. Ned, who earlierhad been unable to articulate why he lined up whole numbers in a par-ticular way when he added, questioned Rob about why his group hadlined up the numbers the way they did. Ned was taking responsibilityfor his learning by asking questions about a concept that wasn’t quiteclear to him. Ben thought about Malik’s dilemma and came up with asolution that became clear to Malik.
The use of models and pictures provides a further opportunity forunderstanding and conversation. Having a concrete referent helps stu-dents develop understandings that are clearer and more easily shared(Hiebert et al. 1997). The talk that preceded, accompanied, and fol-lowed Ben’s presentation gave meaning to the base-ten model. Malikhad been “stuck” by viewing the model in one way until Ben showedhim another way to look at it.
Throughout the lesson, the interactions among students were neces-sary in helping them make sense of what they were doing. Becausethere was time to talk, write, model, and draw pictures, as well as occa-sions for work in small groups, large groups, and as individuals, stu-dents who worked best in different ways all had opportunities to learn.
What should be the teacher’s role in developingcommunication in grades 3 through 5?
With appropriate support and a classroom environment where com-munication about mathematics is expected, teachers can work to buildthe capacity of students to think, reason, solve complex problems, andcommunicate mathematically. This involves creating classroom envi-ronments in which intellectual risks and sense making are expected.Teachers must also routinely provide students with rich problems cen-tered on the important mathematical ideas in the curriculum so thatstudents are working with situations worthy of their conversation andthought. In daily lessons, teachers must make on-the-spot decisionsabout which points of the mathematical conversation to pick up on andwhich to let go, and when to let students struggle with an issue andwhen to give direction. For example, the teacher in the episode abovechose to let one group of students struggle with the fact that their an-swer was unreasonable. Teachers must refine their listening, question-ing, and paraphrasing techniques, both to direct the flow of mathemati-cal learning and to provide models for student dialogue. Well-posedquestions can simultaneously elicit, extend, and challenge students’thinking and at the same time give the teacher an opportunity to assessthe students’ understanding.
197Standards for Grades 3–5: Communication
Num
ber & O
perations | Algebra | G
eometry | M
easurement | D
ata Analysis &
Probability | P
roblem S
olving | Reasoning &
Proof | C
omm
unication | Connections | R
epresentation
Teachers may need toexplicitly discussstudents’ effective andineffectivecommunicationstrategies.

Periodically, teachers may need to explicitly discuss students’ effec-tive and ineffective communication strategies. Teachers can modelquestioning and explaining, for example, and then point out and explainthose techniques to their students. They can also highlight examples ofgood communication among students. (“I noticed that Karen and Maliadisagreed on an answer. They not only explained their reasoning toeach other very carefully, but they listened to one another. Each under-stood the other’s reasoning. It was hard, but eventually, they realizedthat one way made more sense than the other.”)
Teachers need to help students learn to ask questions when theydisagree or do not understand a classmate’s reasoning. It is importantthat students understand that the focus is not on who is right orwrong but rather on whether an answer makes sense and can be justi-fied. Students need to learn that mathematical arguments are logicaland connected to mathematical relationships. When making a con-cept or strategy clear to a peer, the student-explainer is forced to re-examine and thus deepen his or her mathematical understanding. Insettings where communication strategies are taught, modeled, andexpected, students will eventually begin to adopt listening, para-phrasing, and questioning techniques in their own mathematical conversations.
Teachers must help students acquire mathematical language to de-scribe objects and relationships. For example, as students use informallanguage such as “the corner-to-corner lines” to describe the diagonalsof a rectangle, the teacher should point out the mathematical term givento these lines. Specialized vocabulary is much more meaningful if it is in-troduced in an appropriate context. Teachers in grades 3–5 should lookfor, and take advantage of, such opportunities to introduce mathematicalterms. In this way, words such as equation, variable, perpendicular, product,and factor should become part of students’ normal vocabulary.
Teachers also need to provide students with assistance in writingabout mathematical concepts. They should expect students’ writing tobe correct, complete, coherent, and clear. Especially in the beginning,
Teachers must helpstudents acquire
mathematical language.
198 Principles and Standards for School Mathematics
Rep
rese
ntat
ion
| C
onne
ctio
ns |
Com
mun
icat
ion
| R
easo
ning
& P
roof
| P
robl
em S
olvi
ng |
Dat
a A
naly
sis
& P
roba
bilit
y |
Mea
sure
men
t |
Geo
met
ry |
Alg
ebra
| N
umbe
r &
Ope
ratio
ns

teachers need to send writing back for revision. Students will also needopportunities to check the clarity of their work with peers. Initially,when they have difficulty knowing what to write about in mathematicsclass, the teacher might ask them to use words, drawings, and symbolsto explain a particular mathematical idea. For example, students couldwrite about how they know that 1/2 is greater than 2/5 and show atleast three different ways to justify this conclusion. To help studentswrite about their reasoning processes, the teacher can pose a problem-solving activity and later ask, “What have you done so far to solve thisproblem, what decisions did you make, and why did you make those de-cisions?” As students respond, the teacher can explain, “This is exactlywhat I’d like you to tell me in your writing.”
Having students compare and analyze different pieces of their workis another way to convey expectations and help them understand whatcomplete and incomplete responses look like. For example, studentswere asked to use pictures and words to explain their thinking for thefollowing question (Kouba, Zawojewski, and Strutchens 1997, p. 119):
José ate 1/2 of a pizza.Ella ate 1/2 of another pizza. José said that he ate more pizza than Ella, but Ella said they both ate thesame amount. Use words and pictures to show that José could be right.
Students’ responses reflected different levels of understanding (seethe examples in fig. 5.35). The first student assumed that each pizza wasthe same size. Although the student used words and drawings in theresponse, the answer was correct only if the units were the same, an assumption that cannot be made from the statement of the problem.The second student suggested by the drawing that the size of 1/2 de-pends on the size of the unit. The teacher might ask this student to ex-plain his or her thinking. The third solution, including written wordsand drawings, was correct and complete in that it communicated whyJosé could be correct. Discussion of various student responses, espe-cially as mathematical concepts and problems become more complex, isan effective way to help students continue to improve their ability tocommunicate.
199Standards for Grades 3–5: Communication
Num
ber & O
perations | Algebra | G
eometry | M
easurement | D
ata Analysis &
Probability | P
roblem S
olving | Reasoning &
Proof | C
omm
unication | Connections | R
epresentation
Fig. 5.35.
Students’ responses to the “pizza”problem (Dossey, Mullis, and Jones1993)
200 Principles and Standards for School Mathematics
3–5Standard
for Grades
Connections
Instructional programs fromprekindergarten through grade 12should enable all students to—
Recognize and use connectionsamong mathematical ideas
Understand how mathematicalideas interconnect and build on oneanother to produce a coherentwhole
Recognize and apply mathematicsin contexts outside of mathematics
Students in grades 3–5 study a considerable amount of new mathe-matical content, and their ability to understand and manage these newideas will rest, in part, on how well the ideas are connected. Connectingmathematical ideas includes linking new ideas to related ideas consid-ered previously. These connections help students see mathematics as aunified body of knowledge rather than as a set of complex and disjointconcepts, procedures, and processes.
What should connections look like in grades 3through 5?
Two big ideas that recur throughout the study of mathematics ingrades 3–5 were elaborated on in the introduction at the beginning of thechapter: equivalence and multiplicative reasoning. Each should receivemajor emphasis at this level, in part because each is connected to so manytopics studied in grades 3–5. For example, students learn that a fractionhas an equivalent decimal representation, that the area of a right triangleis equal to half of the area of a related rectangle, that 150 centimeters isthe same as 1.5 meters, and that the likelihood of getting heads whenflipping a coin is the same as the likelihood of rolling an even number ona number cube. Some equivalences are not obvious to students and thusprompt further exploration to understand “why.” As equivalence contin-ues to emerge in the study of different mathematical content areas, it fos-ters a sense of unity and connectedness in the study of mathematics.Likewise, as students solve problems as diverse as counting the possiblecombinations of shirts and shorts in a wardrobe and measuring the areaof a rectangle, they begin to see and use a similar multiplicative structurein both situations. Their work in developing computational algorithmshighlights properties of multiplication that they can model geometrically,reason about, and express in general terms. Thus, multiplicative struc-tures connect ideas from number, algebra, and geometry. Equivalenceand multiplicative reasoning help students see that mathematics is not aset of isolated topics but rather a web of closely connected ideas.
Real-world contexts provide opportunities for students to connectwhat they are learning to their own environment. Students’ experiencesat home, at school, and in their community provide contexts for worth-while mathematical tasks. For example, ideas of position and direction

The value of amathematical task is notdependent on whether ithas a real-world context.
such as those used in walking from one place to another can be used todevelop the geometric idea of using coordinates to describe a location.In a fourth-grade class, students could make a map on a coordinate sys-tem of the various routes they use to walk to school. With the map, theycould determine and compare the distances traveled. Everyday experi-ences can also be the source of data. In a fifth-grade classroom, studentsmay want to investigate questions about after-school activities. Howmany students participate in such activities? What are the activities?How frequently do they participate? Is the level of participation consis-tent across the year? Is there a way to describe the class on the basis oftheir activities? Encouraging students to ask questions and to use mathe-matical approaches to find answers helps them see the value of mathe-matics and also motivates them to study new mathematical ideas.
There are connections within mathematics, and mathematics is alsoconnected to, and used within, other disciplines. Building on these con-nections provides opportunities to enrich the learning in both areas.For example, in a social studies unit, a fifth-grade class might discussthe population and area of selected states. They can investigate whichstates are most and least crowded. By using almanacs, Web-based data-bases, and maps, they can collect data and construct charts to summa-rize the information. Once the information is collected, they will needto determine how to consider both area and population in order tojudge crowdedness. Such discussions could lead to an informal consid-eration of population density and land use.
In grades 3–5, students should be developing the important processesneeded for scientific inquiry and for mathematical problem solving—inferring, measuring, communicating, classifying, and predicting. Thekinds of investigations that enable students to build these processesoften include significant mathematics as well as science. It is importantthat teachers stimulate discussion about both the mathematics and thescience ideas that emerge from the investigations, whether they occurin a science lesson or a mathematics lesson. For example, studentsmight study the evaporation of liquid from an open container. Howdoes the volume of liquid in the container change over time? Fromwhich type of jar does 100 cubic centimeters of water evaporate faster—one with a large opening or one with a small opening? Figure 5.36(Goldberg 1997, p. 2) shows the results of an experiment to examinethis question. The table shows the volume of water in each jar over afive-day period. Is there a pattern in the data? If so, what are some waysto describe the pattern? How many days will it take for all the water injar 1 to evaporate? A discussion about why the water evaporates fasterfrom a wider container and what might happen if certain conditions arealtered—for example, if a fan is left blowing on the containers—inte-grates concepts of both mathematics and science.
The development of mathematical ideas and the use of mathematicsin other disciplines are intertwined. At times, new ideas develop in apurely mathematical context and are applied to other situations. Atother times, new mathematics arises out of situations in other disci-plines or in real-world contexts. Mathematical investigations that aredrawn strictly from the realm of mathematics are also appropriate andimportant. The value of a mathematical task is not dependent onwhether it has a real-world context but rather on whether it addressesimportant mathematics, is intellectually engaging, and is solvable using
201Standards for Grades 3–5: Connections
Num
ber & O
perations | Algebra | G
eometry | M
easurement | D
ata Analysis &
Probability | P
roblem S
olving | Reasoning &
Proof | C
omm
unication | Connections | R
epresentation

tools the learner has or can draw on. The use of similar mathematicswithin different contexts gives students an appreciation of the power ofmathematics and its generality. As stated in a National Research Coun-cil report (1996, p. 105):
Students at all grade levels and in every domain of science shouldhave the opportunity to use scientific inquiry and develop the abil-ity to think and act in ways associated with inquiry, including askingquestions, planning and conducting investigations, using appropri-ate tools and techniques to gather data, thinking critically and logi-cally about relationships between evidence and explanations, con-structing and analyzing alternative explanations, andcommunicating scientific arguments.
What should be the teacher’s role in developingconnections in grades 3 through 5?
Teachers should select tasks that help students explore and developincreasingly sophisticated mathematical ideas. They should ask ques-tions that encourage and challenge students to explain new ideas anddevelop new strategies based on mathematics they already know. Forexample, asking students to describe two ways they can estimate thecost of twelve notebooks can prompt different strategies. Figure 5.37illustrates two strategies that might emerge—a rounding strategy andanother strategy based on proportionality, a new idea that will receiveconsiderable attention in later grades.
202 Principles and Standards for School Mathematics
Rep
rese
ntat
ion
| C
onne
ctio
ns |
Com
mun
icat
ion
| R
easo
ning
& P
roof
| P
robl
em S
olvi
ng |
Dat
a A
naly
sis
& P
roba
bilit
y |
Mea
sure
men
t |
Geo
met
ry |
Alg
ebra
| N
umbe
r &
Ope
ratio
ns
Time Jar 1 Jar 2(in days) (volume in cc) (volume in cc)
Jar 1 Jar 2
Fig. 5.36.
Results of an evaporation experiment

At times, opportunitiesfor mathematicalinvestigations arisespontaneously in class.
Teachers should help students explore and describe mathematicalconnections and ensure that they see mathematical ideas in a variety ofcontexts and models. For example, as students explain their strategiesfor estimating the cost of the twelve notebooks, the teacher shouldpoint out how the second strategy relates to multiplication and how itcan be modeled using a fractional representation (e.g., 2 for $1 means12 for $6, or 2/1 = 12/6).
Teachers should encourage students to look for mathematical ideasthroughout the school day. For example, geometry can play an importantrole in art, data should have a prominent role in social studies discussions,and communication and problem solving should be integrated with lan-guage arts. Scientific contexts can be especially productive for exploringand using mathematics. Mathematics and science have a long history ofclose ties, and many mathematical notions arose from scientific problems.Teachers should build on everyday experiences to encourage the study ofmathematical ideas through systematic, quantitative investigations ofphenomena that students can experience directly. These may include ap-plications as varied as studying the relationship between the arm span andheight of students, investigating the strength of a particular brand ofpaper towel, or studying the volume and surface area of different cerealboxes.
At times, opportunities for mathematical investigations arise sponta-neously in class. For example, after a fifth-grade class spent some timelearning about environmental issues, a question arose as to whether thewater fountain was an efficient way of getting water to students. Theclass formulated a plan to respond to the question. This included esti-mating how much water the fountain released during a “typical” turn atthe fountain and how much water was actually consumed. In a situationlike this, the teacher plays an important role in helping students under-stand and think about the scientific and mathematical topics that thisinvestigation evokes.
203Standards for Grades 3–5: Connections
Num
ber & O
perations | Algebra | G
eometry | M
easurement | D
ata Analysis &
Probability | P
roblem S
olving | Reasoning &
Proof | C
omm
unication | Connections | R
epresentation
Fig. 5.37.
Two estimation strategies—oneusing rounding and the other basedon proportionality
Estimate the cost of 12 notebooks
������������������������������������������������������������������������������������������
QQQQQQQQQQQQQQQQQQQQQQQQQQQQQQQQQQQQQQQQQQQQQQQQQQQQQQQQQQQQQQQQQQQQQQQQQQQQQQQQQQQQQQQQQQ
¢¢¢¢¢¢¢¢¢¢¢¢¢¢¢¢¢¢¢¢¢¢¢¢¢¢¢¢¢¢¢¢¢¢¢¢¢¢¢¢¢¢¢¢¢¢¢¢¢¢¢¢¢¢¢¢¢¢¢¢¢¢¢¢¢¢¢¢¢¢¢¢¢¢¢¢¢¢¢¢¢¢¢¢¢¢¢¢¢¢
43¢
12 × 4 dimes is 48
dimes, or $4.80.
You can get 2 notebooks
for a little less than a dollar,
so 12 notebooks wouldbe less than $6.00.

Although the teacher’s role includes being alert and responsive to un-expected opportunities, it is also important that teachers plan ahead tointegrate mathematics into other subject areas and experiences that stu-dents will have during the year. Consider, for example, the followingepisode, adapted from Russell, Schifter, and Bastable (1999).
Ms. Watson’s fourth grade runs a snack shop for two weeks everyschool year to pay for a trip to meet the class’s pen pals in a neigh-boring state. Since the students run the whole project, from plan-ning what to sell to recording sales and reordering stock, Ms. Wat-son uses this project as an opportunity for students to develop anduse mathematical ideas. It is clear that a great deal of estimation andcalculation takes place naturally as part of the project: projectingwhat will be needed for the trip, making change, keeping records ofexpenses, calculating income, and so forth. This year Ms. Watsondecided to extend some of the ideas her students had encounteredabout collecting and describing data through their work on thisproject.At the beginning of the project, she gave the class a list of twenty-one items, available at a local warehouse club, that she and the prin-cipal had approved as possible sale items. The students needed todecide which of these products they would sell and how they wouldallocate the $100 provided for their start-up costs to buy certainquantities of those products. They had limited time to make thesedecisions, and the class engaged in a lively discussion about howbest to find out which of the snack items were most popular amongthe students in the school. Some students insisted that they wouldneed to survey all classes in order to get “the correct information.”If they surveyed only some students, this group contended, then“we won’t give everyone a chance, so we won’t know about some-thing that maybe only one person likes.” Others argued that survey-ing one or two classes at each grade level would provide enough ofan idea of what students across the grades like and would result in aset of data they could collect and organize more efficiently. As theytalked, the teacher reminded them of the purpose of their survey:“Will our business fail if we don’t have everyone’s favorite?” Theclass eventually decided to survey one class at each grade. Even thestudents who had worried that a sample would not give them com-plete information had become convinced that this procedure wouldgive them enough information to make good choices about whichsnacks to buy.The students went on to design their survey—which raised new issues—and to collect, organize, and use the data to develop theirbudget. Once they had their data, another intense discussion ensuedabout how to use the information to guide their choices on how tostock their snack shop. They eventually chose to buy the two topchoices in each category (they had classified the snacks into fourcategories), and since that didn’t use up their budget, they orderedadditional quantities of the overall top two snacks.
Ms. Watson used this realistic context to help her students see howdecisions about designing data investigations are tied to the purpose or
Building on connectionscan make mathematics a
challenging, engaging,and exciting domain of
study.
204 Principles and Standards for School Mathematics
Rep
rese
ntat
ion
| C
onne
ctio
ns |
Com
mun
icat
ion
| R
easo
ning
& P
roof
| P
robl
em S
olvi
ng |
Dat
a A
naly
sis
& P
roba
bilit
y |
Mea
sure
men
t |
Geo
met
ry |
Alg
ebra
| N
umbe
r &
Ope
ratio
ns

the problem being addressed. The real restrictions of time and re-sources made it natural for the students to consider how a sample canbe selected to represent a population, and they were able to interprettheir data in light of the decisions they needed to make.
Ultimately, connections within mathematics, connections betweenmathematics and everyday experience, and connections between mathe-matics and other disciplines can support learning. Building on the con-nections can also make mathematics a challenging, engaging, and excit-ing domain of study.
205Standards for Grades 3–5: Connections
Num
ber & O
perations | Algebra | G
eometry | M
easurement | D
ata Analysis &
Probability | P
roblem S
olving | Reasoning &
Proof | C
omm
unication | Connections | R
epresentation

206 Principles and Standards for School Mathematics
3–5Standard
for Grades
Representation
Instructional programs fromprekindergarten through grade 12should enable all students to—
Create and use representations toorganize, record, and communicatemathematical ideas
Select, apply, and translate amongmathematical representations tosolve problems
Use representations to model andinterpret physical, social, andmathematical phenomena
In grades 3–5, students need to develop and use a variety of repre-sentations of mathematical ideas to model problem situations, to inves-tigate mathematical relationships, and to justify or disprove conjectures.They should use informal representations, such as drawings, to high-light various features of problems; they should use physical models torepresent and understand ideas such as multiplication and place value.They should also learn to use equations, charts, and graphs to modeland solve problems. These representations serve as tools for thinkingabout and solving problems. They also help students communicatetheir thinking to others. Students in these grades will use both externalmodels—ones that they can build, change, and inspect—as well as mental images.
What should representation look like in grades 3–5?Students in grades 3–5 should continue to develop the habit of repre-
senting problems and ideas to support and extend their reasoning. Suchrepresentations help to portray, clarify, or extend a mathematical ideaby focusing on essential features. Students represent ideas when theycreate a table of data about weather patterns, when they describe inwords or with a picture the important features of an object such as acylinder, or when they translate aspects of a problem into an equation.Good representations fulfill a dual role: they are tools for thinking andinstruments for communicating. Consider the following problem:
What happens to the area of a rectangle if the lengths of its sides are doubled?
Students who represent the problem in some way are more likely tosee important relationships than those who consider the problem with-out a representation. One student’s initial response to the problem wasthat the new rectangle would be twice the size of the first rectangle.Her thinking might have stopped there, but another student questionedher answer, prompting her to think more deeply. She decided sheneeded a picture to help her think about the problem. Her drawing (seefig. 5.38) helped her consider the complexity of the problem more care-fully and showed her that the new rectangle is not only bigger but thatit is four times bigger than the original rectangle. It was also a way toshow her answer and to justify it to others.

Students will have learned about, and begun to use, many symbolicand graphical representations (e.g., numerals, equals sign, and bargraphs) in the primary grades. In grades 3–5, students should createrepresentations that are more detailed and accurate than is expected inthe primary grades. Their repertoire of symbols, tools, and conven-tional notation should expand and be clearly connected to concepts asthey are explored. For example, in representing algebraic and numericalrelationships, students should become comfortable using equations andunderstanding the equals sign as a balance point in the equation. Manystudents who have only seen equations with an arithmetic expression onthe left side of the equation and a call for the numerical answer on theright side, such as 6 × 30 = � , don’t understand that equations mayhave several symbols on each side, as in 2 × 5 × 6 = 3 × 4 × 5.
Students in grades 3–5 should also become familiar with technologicaltools such as dynamic geometry software and spreadsheets. They shouldlearn to set up a simple spreadsheet (see fig. 5.39) and use it to pose andsolve problems, examine data, and investigate patterns. For example, afourth-grade class could keep track of the daily temperature and otherfeatures of the weather for the whole year and consider questions such asthese: What month is coldest? What would we tell a visitor to expect forweather in October? After two months, they might find that they arehaving difficulty managing and ordering the quantity of data they havecollected. By entering the data in a spreadsheet, they can easily see andselect the data they want, compare certain columns, or graph particularaspects of the data. They can conveniently find the median temperaturefor February or calculate the total amount of rainfall for April. In January,if the class notices that temperature alone is no longer giving themenough information, they can add a column for wind chill to get a moreaccurate summary of the weather they are experiencing.
Learning to interpret, use, and construct useful representationsneeds careful and deliberate attention in the classroom. Teaching formsof representation (e.g., graphs or equations) as ends in themselves is notproductive. Rather, representations should be portrayed as useful tools
207Standards for Grades 3–5: Representation
Num
ber & O
perations | Algebra | G
eometry | M
easurement | D
ata Analysis &
Probability | P
roblem S
olving | Reasoning &
Proof | C
omm
unication | Connections | R
epresentation
Fig. 5.38.
A student’s representation of the re-sults of doubling the lengths of thesides of a rectangle
E-example 5.5
Linking Spreadsheets and Graphing

for building understanding, for communicating information, and fordemonstrating reasoning (Greeno and Hall 1997). Students should be-come flexible in choosing and creating representations—standard ornonstandard, physical models or mental images—that fit the purpose athand. They should also have many opportunities to consider the advan-tages and limitations of the various representations they use.
What should be the teacher’s role in developingrepresentation in grades 3–5?
Learning to record or represent thinking in an organized way, both insolving a problem and in sharing a solution, is an acquired skill for manystudents. Teachers can and should emphasize the importance of repre-senting mathematical ideas in a variety of ways. Modeling this process asthey work through a problem with the class is one way to stimulate stu-dents to use and analyze representations. Talking through why some rep-resentations are more effective than others in a particular situation givesprominence to the process and helps students critique aspects of theirrepresentations. Teachers can strategically choose student representationsthat will be fruitful for the whole class to discuss. For example, considerthe following question, which a third-grade class might explore:
Are there more even or odd products in the multiplication table shown infigure 5.41? Explain why.
Students may initially generate many examples to formulate an an-swer, as illustrated in figure 5.40. Other students may use the multipli-cation table to organize their work, as illustrated in figure 5.41. Orga-nizing the work in this way highlights patterns that support students inthinking more systematically about the problem.
Each representation reveals a different way of thinking about theproblem. Giving attention to the different methods as well as to the dif-ferent representations will help students see the power of viewing aproblem from different perspectives. Observing how different studentsselect and use representations also gives the teacher assessment informa-tion about what aspects of the problem they notice and how they reasonabout the patterns and regularities revealed in their representations.
208 Principles and Standards for School Mathematics
Rep
rese
ntat
ion
| C
onne
ctio
ns |
Com
mun
icat
ion
| R
easo
ning
& P
roof
| P
robl
em S
olvi
ng |
Dat
a A
naly
sis
& P
roba
bilit
y |
Mea
sure
men
t |
Geo
met
ry |
Alg
ebra
| N
umbe
r &
Ope
ratio
ns
Fig. 5.39.
A simple spreadsheet can be used toorganize and examine data, pose
and solve problems, and investigatepatterns.
Fig. 5.40.
An exploration of odd and even num-bers in the multiplication table

As students discuss their ideas and begin to develop conjecturesbased on representations of the problem, the teacher might want torepresent the students’ thinking in other ways in order to support andextend their ideas. For example, when students notice that an evennumber multiplied by an even number always produces an even result,the teacher might record this idea as “even × even = even.” This repre-sentation serves as a summary of the students’ thinking. It suggests away to record the generalization and may prompt students to look forother generalizations of the same type.
Some students will need explicit help in representing problems. Al-though in the rectangle problem (fig. 5.38), the student quickly de-cided on a representation that was effective in showing the importantrelationships, many students need support in constructing pictures,graphs, tables, and other representations. If they have many opportu-nities for using, developing, comparing, and analyzing a variety of rep-resentations, students will become competent in selecting what theyneed for a particular problem.
As students work with a variety of representations, teachers need toobserve carefully how they understand and use them. Representationsdo not “show” the mathematics to the students. Rather, the studentsneed to work with each representation extensively in many contexts aswell as move between representations in order to understand how theycan use a representation to model mathematical ideas and relationships.
By listening carefully to students’ ideas and helping them select andorganize representations that will show their thinking, teachers canhelp students develop the inclination and skills to model problems ef-fectively, to clarify their own understanding of a problem, and to userepresentations to communicate effectively with one another.
209Standards for Grades 3–5: Representation
Num
ber & O
perations | Algebra | G
eometry | M
easurement | D
ata Analysis &
Probability | P
roblem S
olving | Reasoning &
Proof | C
omm
unication | Connections | R
epresentation
Fig. 5.41.
Using a multiplication table to solvean “odd and even numbers” problem
x 1 2 3 4 5 6 7 8 9
1 1 2 3 4 5 6 7 8 9
2 2 4 6 8 10 12 14 16 18
3 3 6 9 12 15 18 21 24 27
4 4 8 12 16 20 24 28 32 36
5 5 10 15 20 25 30 35 40 45
6 6 12 18 24 30 36 42 48 54
7 7 14 21 28 35 42 49 56 63
8 8 16 24 32 40 48 56 64 72
9 9 18 27 36 45 54 63 72 81

Middle-grades students are drawn toward
mathematics if they find both challenge and
support in the mathematics classroom.
Ambitious expectations in
algebra and geometry
stretch the middle-grades program beyond
a preoccupation with number.

211
Standards for Grades 6–8
6Chapter
Middle-grades students should see mathematics as an exciting, useful,and creative field of study. As they enter adolescence, students experiencephysical, emotional, and intellectual changes that mark the middle grades asa significant transition point in their lives. During this time, many studentswill solidify conceptions about themselves as learners of mathematics—about their competence, their attitude, and their interest and motivation.These conceptions will influence how they approach the study of mathe-matics in later years, which will in turn influence their life opportunities.Middle-grades students are drawn toward mathematics if they find bothchallenge and support in the mathematics classroom. Students acquire anappreciation for, and develop an understanding of, mathematical ideas ifthey have frequent encounters with interesting, challenging problems.
In the middle-grades mathematics classroom, young adolescents shouldregularly engage in thoughtful activity tied to their emerging capabilities offinding and imposing structure, conjecturing and verifying, thinking hypo-thetically, comprehending cause and effect, and abstracting and generalizing.In these grades, each student follows his or her own developmental timetable.Some mature early, and others late. Some progress rapidly, others moreslowly. Thus, every middle-grades teacher faces the challenge of dealing withmany aspects of diversity. Yet students also display some commonalities. Forexample, young adolescents are almost universally sensitive to the influence oftheir peers. The differences in intellectual development and emotional matu-rity and the sensitivity of individuals to peer-group perceptions make it espe-cially important for teachers to create classroom environments in whichclearly established norms support the learning of mathematics by everyone.
An ambitious, focused mathematics program for all students in the middlegrades is proposed in these Standards. Ambitious expectations are identifiedin algebra and geometry that would stretch the middle-grades program be-yond a preoccupation with number. In recent years, the possibility and ne-cessity of students’ gaining facility in algebraic thinking have been widely

recognized. Accordingly, these Standards propose a significant amount ofalgebra for the middle grades. In addition, there is a need for increasedattention to geometry in these grades. Facility in geometric thinking isessential to success in the later study of mathematics and also in many sit-uations that arise outside the mathematics classroom. Moreover, geome-try is typically the area in which U.S. students perform most poorly ondomestic and international assessments of mathematics proficiency.Therefore, significantly more geometry is recommended in these Stan-dards for the middle grades than has been the norm. The recommenda-tions are ambitious—they call for students to learn many topics in algebraand geometry and also in other content areas. To guard against fragmen-tation of the curriculum, therefore, middle-grades mathematics curricu-lum and instruction must also be focused and integrated.
Specific foci are identified in several content areas. For example, innumber and operations, these Standards propose that students develop adeep understanding of rational-number concepts, become proficient inrational-number computation and estimation, and learn to think flexiblyabout relationships among fractions, decimals, and percents. This facilitywith rational numbers should be developed through experience withmany problems involving a range of topics, such as area, volume, relativefrequency, and probability. In algebra, the focus is on proficiency in rec-ognizing and working effectively with linear relationships and their cor-responding representations in tables, graphs, and equations; such profi-ciency includes competence in solving linear equations. Students candevelop the desired algebraic facility through problems and contexts thatinvolve linear and nonlinear relationships. Appropriate problem contextscan be found in many areas of the curriculum, such as using scatterplotsand approximate lines of fit to give meaning to the concept of slope ornoting that the relationship between the side lengths and the perimetersof similar figures is linear, whereas the relationship between the sidelengths and the areas of similar figures is nonlinear.
Curricular focus and integration are also evident in the proposed em-phasis on proportionality as an integrative theme in the middle-gradesmathematics program. Facility with proportionality develops throughwork in many areas of the curriculum, including ratio and proportion,percent, similarity, scaling, linear equations, slope, relative-frequencyhistograms, and probability. The understanding of proportionalityshould also emerge through problem solving and reasoning, and it isimportant in connecting mathematical topics and in connecting mathe-matics and other domains such as science and art.
In the recommendations for middle-grades mathematics outlinedhere, students will learn significant amounts of algebra and geometrythroughout grades 6, 7, and 8. Moreover, they will see algebra andgeometry as interconnected with each other and with other contentareas in the curriculum. They will have experience with both the geo-metric representation of algebraic ideas, such as visual models of alge-braic identities, and the algebraic representation of geometric ideas, suchas equations for lines represented on coordinate grids. They will see thevalue of interpreting both algebraically and geometrically such impor-tant mathematical ideas as the slope of a line and the Pythagorean rela-tionship. They also will relate algebraic and geometric ideas to othertopics—for example, when they reason about percents using visual mod-els or equations or when they represent an approximate line of fit for a
Students should learnsignificant amounts ofalgebra and geometry
and see them asinterconnected.
212 Principles and Standards for School Mathematics

Students are expected tolearn serious, substantivemathematics with anemphasis on thoughtfulengagement andmeaningful learning.
scatterplot both geometrically and algebraically. Students can gain adeeper understanding of proportionality if it develops along with foun-dational algebraic ideas such as linear relationships and geometric ideassuch as similarity.
Students’ understanding of foundational algebraic and geometric ideasshould be developed through extended experience over all three years inthe middle grades and across a broad range of mathematics content, in-cluding statistics, number, and measurement. How these ideas are pack-aged into courses and what names are given to the resulting arrangementare far less important than ensuring that students have opportunities tosee and understand the connections among related ideas. This approachis a challenging alternative to the practice of offering a select group ofmiddle-grades students a one-year course that focuses narrowly on alge-bra or geometry. All middle-grades students will benefit from a rich andintegrated treatment of mathematics content. Instruction that segregatesthe content of algebra or geometry from that of other areas is education-ally unwise and mathematically counterproductive.
Principles and Standards for School Mathematics proposes an ambitiousand rich experience for middle-grades students that both prepares themto use mathematics effectively to deal with quantitative situations intheir lives outside school and lays a solid foundation for their study ofmathematics in high school. Students are expected to learn serious, sub-stantive mathematics in classrooms in which the emphasis is onthoughtful engagement and meaningful learning.
For those who make decisions about the design and organization ofmiddle-grades mathematics education, it would be insufficient simplyto announce new and more-ambitious goals like those suggested here.School system leaders need to commit to and support steady, long-term improvement and capacity building to accomplish such goals.The capacity of schools and middle-grades teachers to provide thekind of mathematics education envisioned needs to be built. Special at-tention must be given to the preparation and ongoing professionalsupport of teachers in the middle grades. Teachers need to develop asound knowledge of mathematical ideas and excellent pedagogicalpractices and become aware of current research on students’ mathe-matics learning. Professional development is especially important inthe middle grades because so little attention has been given in moststates and provinces to the special preparation that may be required formathematics teachers at these grade levels. Many such teachers holdelementary school generalist certification, which typically involves lit-tle specific preparation in mathematics. Yet teachers in the middlegrades need to know much more mathematics than is required in mostelementary school teacher-certification programs. Some middle-gradesmathematics teachers hold secondary school mathematics-specialistcertification. But middle-grades teachers need to know much moreabout adolescent development, pedagogical alternatives, and interdis-ciplinary approaches to teaching than most secondary school teacher-certification programs require. In order to accomplish the ambitiousgoals for the middle grades that are presented here, special teacher-preparation programs must be developed.
213Standards for Grades 6–8: Introduction

In grades 6–8 all students should—
• work flexibly with fractions, decimals, and percents to solve problems;• compare and order fractions, decimals, and percents efficiently and find
their approximate locations on a number line;• develop meaning for percents greater than 100 and less than 1;• understand and use ratios and proportions to represent quantitative
relationships;• develop an understanding of large numbers and recognize and
appropriately use exponential, scientific, and calculator notation;• use factors, multiples, prime factorization, and relatively prime numbers to
solve problems;• develop meaning for integers and represent and compare quantities with
them.
• understand the meaning and effects of arithmetic operations with fractions,decimals, and integers;
• use the associative and commutative properties of addition andmultiplication and the distributive property of multiplication over addition tosimplify computations with integers, fractions, and decimals;
• understand and use the inverse relationships of addition and subtraction,multiplication and division, and squaring and finding square roots to simplifycomputations and solve problems.
• select appropriate methods and tools for computing with fractions anddecimals from among mental computation, estimation, calculators orcomputers, and paper and pencil, depending on the situation, and apply theselected methods;
• develop and analyze algorithms for computing with fractions, decimals, andintegers and develop fluency in their use;
• develop and use strategies to estimate the results of rational-numbercomputations and judge the reasonableness of the results;
• develop, analyze, and explain methods for solving problems involvingproportions, such as scaling and finding equivalent ratios.
Instructional programs fromprekindergarten through grade 12should enable all students to—
Understand numbers, ways of rep-resenting numbers, relationshipsamong numbers, and number systems
Understand meanings of operationsand how they relate to one another
Compute fluently and make reason-able estimates
6–8Standard
for Grades
Expectations
Number and Operations
214 Principles and Standards for School Mathematics

Number and OperationsIn grades 6–8, students should deepen their understanding of frac-
tions, decimals, percents, and integers, and they should become profi-cient in using them to solve problems. By solving problems that re-quire multiplicative comparisons (e.g., “How many times as many?” or“How many per?”), students will gain extensive experience with ratios,rates, and percents, which helps form a solid foundation for their un-derstanding of, and facility with, proportionality. The study of rationalnumbers in the middle grades should build on students’ prior knowl-edge of whole-number concepts and skills and their encounters withfractions, decimals, and percents in lower grades and in everyday life.Students’ facility with rational numbers and proportionality can be de-veloped in concert with their study of many topics in the middle-grades curriculum. For example, students can use fractions and deci-mals to report measurements, to compare survey responses fromsamples of unequal size, to express probabilities, to indicate scale fac-tors for similarity, and to represent constant rate of change in a prob-lem or slope in a graph of a linear function.
Understand numbers, ways of representing numbers,relationships among numbers, and number systems
In the middle grades, students should become facile in workingwith fractions, decimals, and percents. Teachers can help studentsdeepen their understanding of rational numbers by presenting prob-lems, such as those in figure 6.1 that call for flexible thinking. For morediscussion of useful representations for rational numbers, see the “Rep-resentation” section of this chapter.
At the heart of flexibility in working with rational numbers is a solidunderstanding of different representations for fractions, decimals, andpercents. In grades 3–5, students should have learned to generate andrecognize equivalent forms of fractions, decimals, and percents, at leastin some simple cases. In the middle grades, students should build onand extend this experience to become facile in using fractions, decimals,and percents meaningfully. Students can develop a deep understandingof rational numbers through experiences with a variety of models, such
215Standards for Grades 6–8: Number and Operations
Num
ber & O
perations | Algebra | G
eometry | M
easurement | D
ata Analysis &
Probability | P
roblem S
olving | Reasoning &
Proof | C
omm
unication | Connections | R
epresentation
If is 3/4, draw thefraction strip for 1/2, for 2/3, for4/3, and for 3/2. Be prepared tojustify your answers.
a.
b.1 1
12
Using the points you are given on the number line above, locate1/2, 2 1/2, and 1/4. Be preparedto justify your answers.
Use the drawing above to justifyin as many different ways as you can that 75% of the squareis equal to 3/4 of the square. You may reposition the shaded squares if you wish.
c.Fig. 6.1.
Problems that require students tothink flexibly about rational numbers
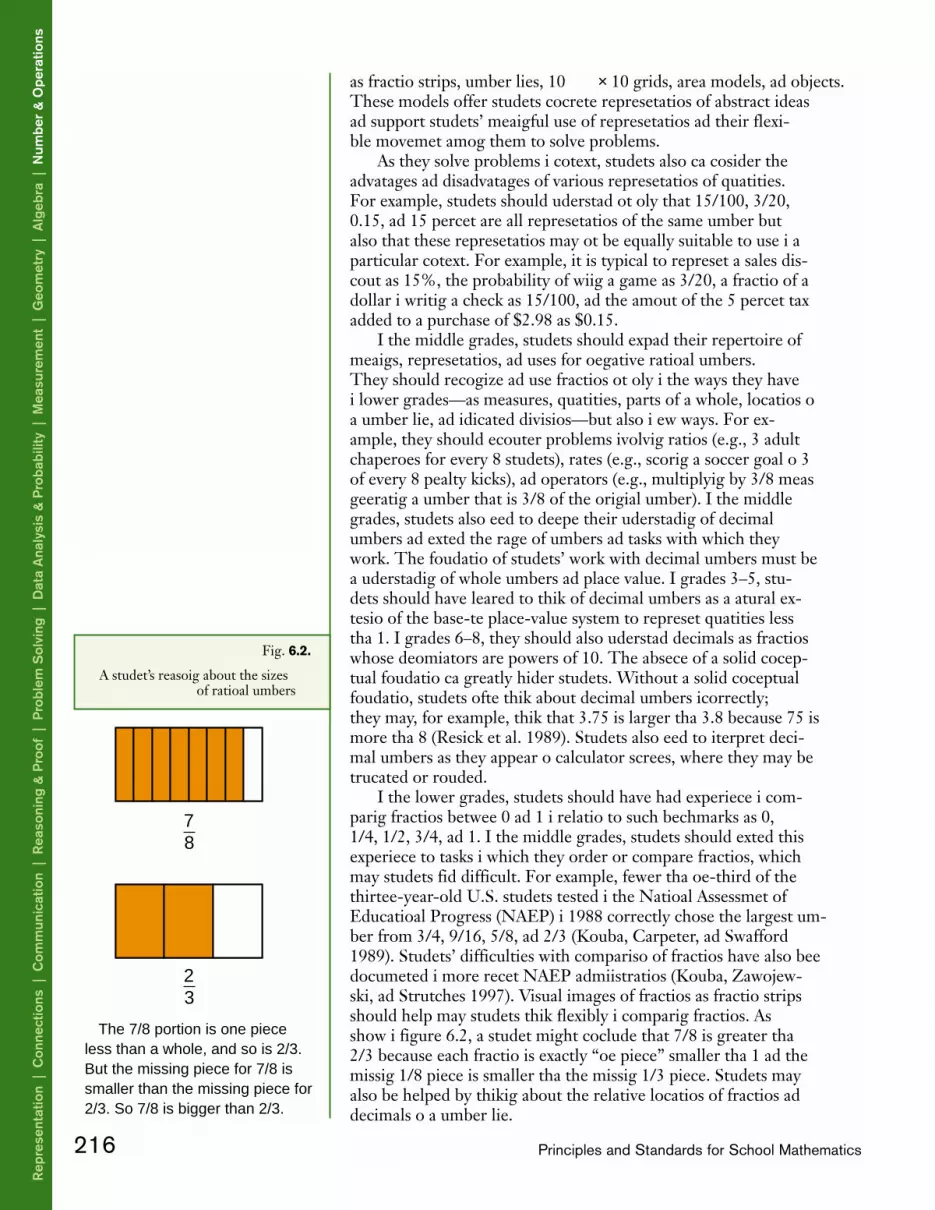
as fraction strips, number lines, 10 × 10 grids, area models, and objects.These models offer students concrete representations of abstract ideasand support students’ meaningful use of representations and their flexi-ble movement among them to solve problems.
As they solve problems in context, students also can consider theadvantages and disadvantages of various representations of quantities.For example, students should understand not only that 15/100, 3/20,0.15, and 15 percent are all representations of the same number butalso that these representations may not be equally suitable to use in aparticular context. For example, it is typical to represent a sales dis-count as 15%, the probability of winning a game as 3/20, a fraction of adollar in writing a check as 15/100, and the amount of the 5 percent taxadded to a purchase of $2.98 as $0.15.
In the middle grades, students should expand their repertoire ofmeanings, representations, and uses for nonnegative rational numbers.They should recognize and use fractions not only in the ways they havein lower grades—as measures, quantities, parts of a whole, locations ona number line, and indicated divisions—but also in new ways. For ex-ample, they should encounter problems involving ratios (e.g., 3 adultchaperones for every 8 students), rates (e.g., scoring a soccer goal on 3of every 8 penalty kicks), and operators (e.g., multiplying by 3/8 meansgenerating a number that is 3/8 of the original number). In the middlegrades, students also need to deepen their understanding of decimalnumbers and extend the range of numbers and tasks with which theywork. The foundation of students’ work with decimal numbers must bean understanding of whole numbers and place value. In grades 3–5, stu-dents should have learned to think of decimal numbers as a natural ex-tension of the base-ten place-value system to represent quantities lessthan 1. In grades 6–8, they should also understand decimals as fractionswhose denominators are powers of 10. The absence of a solid concep-tual foundation can greatly hinder students. Without a solid conceptualfoundation, students often think about decimal numbers incorrectly;they may, for example, think that 3.75 is larger than 3.8 because 75 ismore than 8 (Resnick et al. 1989). Students also need to interpret deci-mal numbers as they appear on calculator screens, where they may betruncated or rounded.
In the lower grades, students should have had experience in com-paring fractions between 0 and 1 in relation to such benchmarks as 0,1/4, 1/2, 3/4, and 1. In the middle grades, students should extend thisexperience to tasks in which they order or compare fractions, whichmany students find difficult. For example, fewer than one-third of thethirteen-year-old U.S. students tested in the National Assessment ofEducational Progress (NAEP) in 1988 correctly chose the largest num-ber from 3/4, 9/16, 5/8, and 2/3 (Kouba, Carpenter, and Swafford1989). Students’ difficulties with comparison of fractions have also beendocumented in more recent NAEP administrations (Kouba, Zawojew-ski, and Strutchens 1997). Visual images of fractions as fraction stripsshould help many students think flexibly in comparing fractions. Asshown in figure 6.2, a student might conclude that 7/8 is greater than2/3 because each fraction is exactly “one piece” smaller than 1 and themissing 1/8 piece is smaller than the missing 1/3 piece. Students mayalso be helped by thinking about the relative locations of fractions anddecimals on a number line.
216 Principles and Standards for School Mathematics
Rep
rese
ntat
ion
| C
onne
ctio
ns |
Com
mun
icat
ion
| R
easo
ning
& P
roof
| P
robl
em S
olvi
ng |
Dat
a A
naly
sis
& P
roba
bilit
y |
Mea
sure
men
t |
Geo
met
ry |
Alg
ebra
| N
umbe
r &
Ope
ratio
ns
The 7/8 portion is one piece less than a whole, and so is 2/3. But the missing piece for 7/8 is smaller than the missing piece for 2/3. So 7/8 is bigger than 2/3.
78
23
Fig. 6.2.
A student’s reasoning about the sizesof rational numbers

Proportionality connectsmany of themathematics topicsstudied in grades 6–8.
Percents, which can be thought about in ways that combine aspects ofboth fractions and decimals, offer students another useful form of rationalnumber. Percents are particularly useful when comparing fractional partsof sets or numbers of unequal size, and they are also frequently encoun-tered in problem-solving situations that arise in everyday life. As with frac-tions and decimals, conceptual difficulties need to be carefully addressedin instruction. In particular, percents less than 1 percent and greater than100 percent are often challenging, and most students are likely to benefitfrom frequent encounters with problems involving percents of these mag-nitudes in order to develop a solid understanding.
Attention to developing flexibility in working with rational numberscontributes to students’ understanding of, and facility with, proportion-ality. Facility with proportionality involves much more than setting tworatios equal and solving for a missing term. It involves recognizing quan-tities that are related proportionally and using numbers, tables, graphs,and equations to think about the quantities and their relationship. Pro-portionality is an important integrative thread that connects many of themathematics topics studied in grades 6–8. Students encounter propor-tionality when they study linear functions of the form y = kx, when theyconsider the distance between points on a map drawn to scale and theactual distance between the corresponding locations in the world, whenthey use the relationship between the circumference of a circle and itsdiameter, and when they reason about data from a relative-frequencyhistogram.
In the middle grades, students should continue to work with wholenumbers in a variety of problem-solving settings. They should developa sense of the magnitude of very large numbers (millions and billions)and become proficient at reading and representing them. For example,they should recognize and represent 2300 000 000 as 2.3 × 10⁹ in scien-tific notation and also as 2.3 billion. Contexts in which large numbersarise naturally are found in other school subjects as well as in everydaylife. For example, a newspaper headline may proclaim, “Clean-UpCosts from Oil Spill Exceed $2 Billion!” or a science textbook may in-dicate that the number of red blood cells in the human body is about1.9 × 1013. Students also need to understand various forms of notationand recognize, for instance, that the number 2.5 × 10¹¹ might appear ona calculator as 2.5E11 or 2.5 11, depending on the make and model ofthe machine. Students’ experiences in working with very large numbersand in using the idea of orders of magnitude will also help build theirfacility with proportionality.
Students can also work with whole numbers in their study of num-ber theory. Tasks, such as the following, involving factors, multiples,prime numbers, and divisibility, can afford opportunities for problemsolving and reasoning.
1. Explain why the sum of the digits of any multiple of 3 is itself divisibleby 3.
2. A number of the form abcabc always has several prime-number factors.Which prime numbers are always factors of a number of this form?Why?
Middle-grades students should also work with integers. In lowergrades, students may have connected negative integers in appropriateways to informal knowledge derived from everyday experiences, such as
217Standards for Grades 6–8: Number and Operations
Num
ber & O
perations | Algebra | G
eometry | M
easurement | D
ata Analysis &
Probability | P
roblem S
olving | Reasoning &
Proof | C
omm
unication | Connections | R
epresentation

below-zero winter temperatures or lost yards on football plays. In themiddle grades, students should extend these initial understandings ofintegers. Positive and negative integers should be seen as useful for not-ing relative changes or values. Students can also appreciate the utility ofnegative integers when they work with equations whose solution re-quires them, such as 2x + 7 = 1.
Understand meanings of operations and how theyrelate to one another
In the middle grades, students should continue to refine their under-standings of addition, subtraction, multiplication, and division as theyuse these operations with fractions, decimals, percents, and integers.Teachers need to be attentive to conceptual obstacles that many stu-dents encounter as they make the transition from operations with wholenumbers.
Multiplying and dividing fractions and decimals can be challengingfor many students because of problems that are primarily conceptualrather than procedural. From their experience with whole numbers,many students appear to develop a belief that “multiplication makes big-ger and division makes smaller.” When students solve problems in whichthey need to decide whether to multiply or divide fractions or decimals,this belief has negative consequences that have been well researched(Greer 1992). Also, a mistaken expectation about the magnitude of acomputational result is likely to interfere with students’ making sense ofmultiplication and division of fractions or decimals (Graeber and Tanen-haus 1993). Teachers should check to see if their students harbor thismisconception and then take steps to build their understanding.
Figure 6.3 illustrates how students might use dynamic geometrysoftware to examine how the product 3 • y is affected by the magnitudeof y for nonnegative y-values. In this illustration, the product is repre-sented as the area of a 3 × y rectangle. As a student changes the value ofy by dragging a point along the vertical axis, the area of the rectanglechanges. Referring to the area of the 3 × 1 rectangle, students can seethat the area of the 3 × y rectangle is smaller when y is less than 1 andlarger when y is greater than 1. That is, in contrast to the expectationthat multiplication makes bigger, multiplying 3 by a number smallerthan 1 results in a product that is less than 3.
Teachers can help students extend their understanding of additionand subtraction with whole numbers to decimals by building on a solidunderstanding of place value. Students should be able to compute 1.4 +0.67 by applying their knowledge about 140 + 67 and their under-standing of the magnitude of the numbers involved in the computa-tion. Without such a foundation, students may operate with decimalnumbers inappropriately by, say, placing the decimal point in thewrong place after multiplying or dividing. Teachers can also help stu-dents add and subtract fractions correctly by helping them developmeaning for numerator, denominator, and equivalence and by encour-aging them to use benchmarks and estimation (see fig. 6.4). Studentswho have a solid conceptual foundation in fractions should be lessprone to committing computational errors than students who do nothave such a foundation.
218 Principles and Standards for School Mathematics
Rep
rese
ntat
ion
| C
onne
ctio
ns |
Com
mun
icat
ion
| R
easo
ning
& P
roof
| P
robl
em S
olvi
ng |
Dat
a A
naly
sis
& P
roba
bilit
y |
Mea
sure
men
t |
Geo
met
ry |
Alg
ebra
| N
umbe
r &
Ope
ratio
ns
y
1 2 3
1.2
1 2 3
Area = 1.2 • 3 = 3.6
1.0
y
Area = 0.9 • 3 = 2.7
Area = 1 • 3 = 3
y
1 2 3
1.0
1.0
0.9
Fig. 6.3.
This dynamic area model shows theeffect of multiplying by a number
less than 1.
E-example 6.1
Dynamically Linking Areaand Multiplication

The division of fractions has traditionally been quite vexing for stu-dents. Although “invert and multiply” has been a staple of conventionalmathematics instruction and although it seems to be a simple way to re-member how to divide fractions, students have for a long time had diffi-culty doing so. Some students forget which number is to be inverted,and others are confused about when it is appropriate to apply the pro-cedure. A common way of formally justifying the “invert and multiply”procedure is to use sophisticated arguments involving the manipulationof algebraic rational expressions—arguments beyond the reach of manymiddle-grades students. This process can seem very remote and myste-rious to many students. Lacking an understanding of the underlying ra-tionale, many students are therefore unable to repair their errors andclear up their confusions about division of fractions on their own. Analternative approach involves helping students understand the divisionof fractions by building on what they know about the division of wholenumbers. If students understand the meaning of division as repeatedsubtraction, they can recognize that 24 ÷ 6 can be interpreted as “Howmany sets of 6 are there in a set of 24?” This view of division can alsobe applied to fractions, as seen in figure 6.5. To solve this problem, stu-dents can visualize repeatedly cutting off 3/4 yard of ribbon. The 5yards of ribbon would provide enough for 6 complete bows, with a re-mainder of 2/4, or 1/2, yard of ribbon, which is enough for only 2/3 ofa bow. Carefully sequenced experiences with problems such as these canhelp students build an understanding of division of fractions.
Students’ understanding of operations with fractions, decimals, andintegers can also be enhanced as they examine the validity and utility ofproperties of operations, such as the commutative and associative proper-ties of addition and multiplication, with which they are familiar from theirexperiences with whole numbers. These properties can be used to simplifymany computations with fractions, for example, 3 × (4/5 × 2/3) can be ex-pressed as (3 × 2/3) × 4/5, which makes the calculation easier. The familiardistributive properties for whole-number operations can also be applied tofractions, decimals, and integers. Students already know that 3 × 26 can becomputed by decomposing 26 and using the distributive property of mul-tiplication over addition to get (3 × 20 + 3 × 6); in a similar fashion, theycan compute 3 × 2 1/2 by expressing it as (3 × 2 + 3 × 1/2).
From earlier work with whole numbers, students should be familiarwith the inverse relationship between the operation pairs of addition-subtraction and multiplication-division. In the middle grades, they can
219Standards for Grades 6–8: Number and Operations
Num
ber & O
perations | Algebra | G
eometry | M
easurement | D
ata Analysis &
Probability | P
roblem S
olving | Reasoning &
Proof | C
omm
unication | Connections | R
epresentation
2/3 + 3/4 = 5/7.
Wait a minute!Something’s wrong!Both numbers are bigger than 1/2, so the answer has to be more than 1.
0 1 2 3 4 5
Number of Bows
1 2 3 4 5 6 2/3
If 5 yards of ribbon are cut into pieces that are each 3/4 yard long to make bows, how many bows can be made?
Fig. 6.4.
Using benchmarks to estimate theresults of a fraction computation
Fig. 6.5.
Using the idea of division as repeatedsubtraction to solve a problem in-volving fractions
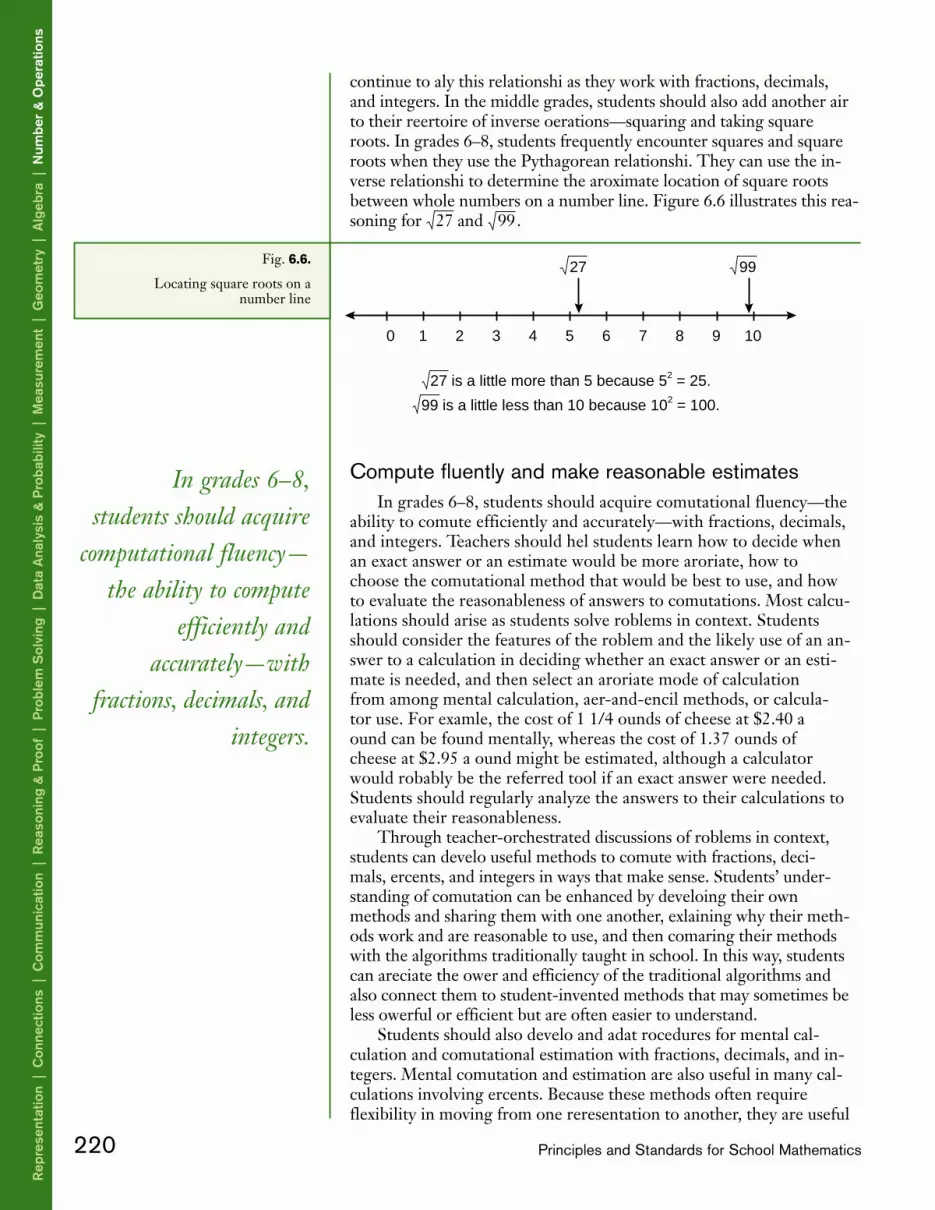
continue to apply this relationship as they work with fractions, decimals,and integers. In the middle grades, students should also add another pairto their repertoire of inverse operations—squaring and taking squareroots. In grades 6–8, students frequently encounter squares and squareroots when they use the Pythagorean relationship. They can use the in-verse relationship to determine the approximate location of square rootsbetween whole numbers on a number line. Figure 6.6 illustrates this rea-soning for 27 and 99.
Compute fluently and make reasonable estimates In grades 6–8, students should acquire computational fluency—the
ability to compute efficiently and accurately—with fractions, decimals,and integers. Teachers should help students learn how to decide whenan exact answer or an estimate would be more appropriate, how tochoose the computational method that would be best to use, and howto evaluate the reasonableness of answers to computations. Most calcu-lations should arise as students solve problems in context. Studentsshould consider the features of the problem and the likely use of an an-swer to a calculation in deciding whether an exact answer or an esti-mate is needed, and then select an appropriate mode of calculationfrom among mental calculation, paper-and-pencil methods, or calcula-tor use. For example, the cost of 1 1/4 pounds of cheese at $2.40 apound can be found mentally, whereas the cost of 1.37 pounds ofcheese at $2.95 a pound might be estimated, although a calculatorwould probably be the preferred tool if an exact answer were needed.Students should regularly analyze the answers to their calculations toevaluate their reasonableness.
Through teacher-orchestrated discussions of problems in context,students can develop useful methods to compute with fractions, deci-mals, percents, and integers in ways that make sense. Students’ under-standing of computation can be enhanced by developing their ownmethods and sharing them with one another, explaining why their meth-ods work and are reasonable to use, and then comparing their methodswith the algorithms traditionally taught in school. In this way, studentscan appreciate the power and efficiency of the traditional algorithms andalso connect them to student-invented methods that may sometimes beless powerful or efficient but are often easier to understand.
Students should also develop and adapt procedures for mental cal-culation and computational estimation with fractions, decimals, and in-tegers. Mental computation and estimation are also useful in many cal-culations involving percents. Because these methods often requireflexibility in moving from one representation to another, they are useful
In grades 6–8,students should acquire
computational fluency—the ability to compute
efficiently andaccurately—with
fractions, decimals, andintegers.
220 Principles and Standards for School Mathematics
Rep
rese
ntat
ion
| C
onne
ctio
ns |
Com
mun
icat
ion
| R
easo
ning
& P
roof
| P
robl
em S
olvi
ng |
Dat
a A
naly
sis
& P
roba
bilit
y |
Mea
sure
men
t |
Geo
met
ry |
Alg
ebra
| N
umbe
r &
Ope
ratio
ns
0 1 2 3 4 5 6 7 8 9 10
27 99
27 is a little more than 5 because 52 = 25.
99 is a little less than 10 because 102 = 100.
Fig. 6.6.
Locating square roots on anumber line

in deepening students’ understanding of rational numbers and helpingthem think flexibly about these numbers.
Instruction in solving proportions should include methods thathave a strong intuitive basis. The so-called cross-multiplication methodcan be developed meaningfully if it arises naturally in students’ work,but it can also have unfortunate side effects when students do not ade-quately understand when the method is appropriate to use. Other ap-proaches to solving proportions are often more intuitive and also quitepowerful. For example, when trying to decide which is the better buy—12 tickets for $15.00 or 20 tickets for $23.00—students might choose touse a scaling strategy (finding the cost for a common number of tickets)or a unit-rate strategy (finding the cost for one ticket). (See fig. 6.7.)
As different ways to think about proportions are considered and dis-cussed, teachers should help students recognize when and how variousways of reasoning about proportions might be appropriate to solve prob-lems. Further discussion about ways to approach a contextualized prob-lem involving a proportional relationship is found in the “Connections”section of this chapter.
221Standards for Grades 6–8: Number and Operations
Num
ber & O
perations | Algebra | G
eometry | M
easurement | D
ata Analysis &
Probability | P
roblem S
olving | Reasoning &
Proof | C
omm
unication | Connections | R
epresentation
Which is the better buy—12 tickets for $15.00 or 20 tickets for $23.00?
Scaling Strategy Unit-Rate Strategy12 tickets for $15.00 → 60 tickets for $75.00. $15.00 for 12 tickets → $1.25 for 1 ticket.20 tickets for $23.00 → 60 tickets for $69.00. $23.00 for 20 tickets → $1.15 for 1 ticket.
So 20 tickets for $23.00 is the better buy.
Fig. 6.7.
Two approaches to solving a probleminvolving proportions

In grades 6–8 all students should—
• represent, analyze, and generalize a variety of patterns with tables, graphs,words, and, when possible, symbolic rules;
• relate and compare different forms of representation for a relationship;• identify functions as linear or nonlinear and contrast their properties from
tables, graphs, or equations.
• develop an initial conceptual understanding of different uses of variables;• explore relationships between symbolic expressions and graphs of lines,
paying particular attention to the meaning of intercept and slope;• use symbolic algebra to represent situations and to solve problems,
especially those that involve linear relationships;• recognize and generate equivalent forms for simple algebraic expressions
and solve linear equations.
• model and solve contextualized problems using various representations,such as graphs, tables, and equations.
• use graphs to analyze the nature of changes in quantities in linearrelationships.
Instructional programs fromprekindergarten through grade 12should enable all students to—
Understand patterns, relations, andfunctions
Represent and analyze mathemati-cal situations and structures usingalgebraic symbols
Use mathematical models to repre-sent and understand quantitativerelationships
Analyze change in various contexts
6–8Standard
for Grades
Expectations
Algebra
222 Principles and Standards for School Mathematics

Algebra Students in the middle grades should learn algebra both as a set of con-
cepts and competencies tied to the representation of quantitative relation-ships and as a style of mathematical thinking for formalizing patterns,functions, and generalizations. In the middle grades, students should workmore frequently with algebraic symbols than in lower grades. It is essentialthat they become comfortable in relating symbolic expressions containingvariables to verbal, tabular, and graphical representations of numerical andquantitative relationships. Students should develop an initial understand-ing of several different meanings and uses of variables through represent-ing quantities in a variety of problem situations. They should connecttheir experiences with linear functions to their developing understandingsof proportionality, and they should learn to distinguish linear relationshipsfrom nonlinear ones. In the middle grades, students should also learn torecognize and generate equivalent expressions, solve linear equations, anduse simple formulas. Whenever possible, the teaching and learning of al-gebra can and should be integrated with other topics in the curriculum.
Understand patterns, relations, and functions The study of patterns and relationships in the middle grades should
focus on patterns that relate to linear functions, which arise when thereis a constant rate of change. Students should solve problems in whichthey use tables, graphs, words, and symbolic expressions to representand examine functions and patterns of change. For example, considerthe following problem:
Charles saw advertisements for two cellular telephone companies. Keep-in-Touch offers phone service for a basic fee of $20.00 a month plus $0.10for each minute used. ChitChat has no monthly basic fee but charges$0.45 a minute. Both companies use technology that allows them tocharge for the exact amount of time used; they do not “round up” the timeto the nearest minute, as many of their competitors do. Compare thesetwo companies’ charges for the time used each month.
Students might begin by making a table, picking convenient num-bers of minutes, and finding the corresponding costs for the two com-panies, as shown in figure 6.8a. Using a graphing calculator, studentsmight then plot the points as ordered pairs (minutes, cost) on the coor-dinate plane, obtaining a graph for each of the two companies (see fig.6.8b). Some students might describe the pattern in each graph verbally:“Keep-in-Touch costs $20.00 and then $0.10 more per minute.” Othersmight write an equation to represent the cost ( y) in dollars in terms ofthe number of minutes (x), such as y = 20.00 + 0.10x.
Before the students solve the problem, a teacher might ask them touse their table and graph to focus on important basic issues regarding
223Standards for Grades 6–8: Algebra
Num
ber & O
perations | Algebra | G
eometry | M
easurement | D
ata Analysis &
Probability | P
roblem S
olving | Reasoning &
Proof | C
omm
unication | Connections | R
epresentation
Fig. 6.8.
Students can compare the chargesfor two telephone companies bymaking a table (a) and by represent-ing the charges on a graphing calcu-lator (b).
No. of minutes 0 10 20 30 40 50 60
Keep-in-Touch $20.00 $21.00 $22.00 $23.00 $24.00 $25.00 $26.00
ChitChat $0.00 $4.50 $9.00 $13.50 $18.00 $22.50 $27.00
(a) (b)

the relationships they represent. By asking, “How much would eachcompany charge for 25 minutes? For 100 minutes?” the teacher couldfind out if students can interpret and extend the patterns. Since thetable identifies only a small number of distinct points, a teacher couldask why it is legitimate to connect the points on the graph to make aline. Students might also be asked why one graph (for ChitChat) in-cludes the origin but the other (for Keep-in-Touch) does not (see fig.6.8b). Most students will recognize that the ChitChat graph includesthe origin because there is no charge if no calls are made but the Keep-in-Touch graph includes (0, 20) because the company charges $20.00even if the telephone is not used.
Many students will naturally seek a formula to express these patterns,but questions such as the following would be a good catalyst for others:How can you find the cost for any number of minutes for the Keep-in-Touch plan? For the ChitChat plan? What aspects of the stated priceschedule are indicated in the graph? How? Students are likely to ob-serve the constant difference between both the successive entries in thetable and the coordinates of the points for each company along astraight line. They may explain the pattern underlying the function bysaying, “Whenever you talk for one more minute, you pay $0.10 more(or $0.45 more), so the points go up the same amount each time.” Oth-ers might say that a straight line is reasonable because each companycharges a constant amount for each minute. Teachers should encouragestudents to explain their observations in their own words. Their expla-nations will provide the teacher with important insights into the stu-dents’ thinking, particularly how well they recognize and represent lin-ear relationships.
A solution to the stated problem requires comparing data from thetwo companies. A teacher might want to ask additional questions aboutthis comparison: Which company is cheaper if you use the telephoneinfrequently? If you use it frequently? If you cannot spend more than$50.00 in a month but you want to talk for as many minutes as possible,which company would be the better choice? Considering questionssuch as these can lay the groundwork for a pivotal question: Is there anumber of minutes that costs the same for both companies? Such ques-tions could give rise to many observations. For example, most studentswill notice in their table that something important happens between 50and 60 minutes, namely, using ChitChat becomes more expensive thanusing Keep-in-Touch. From the graph, some students may observe thatthis shift occurs at about 57 minutes: Keep-in-Touch is the cheapercompany when a customer uses more than 57 minutes in a month. Ex-periences such as this can lay a foundation for solving systems of simul-taneous equations.
The problem could also easily be extended or adapted in ways thatwould draw students’ attention to important characteristics of the linegraph for each company’s charges. For example, to draw attention tothe y-intercept, students could be asked to use a graphing calculator toexamine how the graph would be affected if Keep-in-Touch increasedor decreased its basic fee or if ChitChat decided to begin charging abasic fee. Students’ attention could be drawn to the slope by askingthem to consider the steepness of the lines using a question such as,What happens to the graph for Keep-in-Touch if the company in-creases its cost per minute from $0.10 to $0.15? Through experiences
Students shoulddevelop a general
understanding of, andfacility with, slope and
y-intercept and theirmanifestations in tables,
graphs, and equations.
224 Principles and Standards for School Mathematics
Rep
rese
ntat
ion
| C
onne
ctio
ns |
Com
mun
icat
ion
| R
easo
ning
& P
roof
| P
robl
em S
olvi
ng |
Dat
a A
naly
sis
& P
roba
bilit
y |
Mea
sure
men
t |
Geo
met
ry |
Alg
ebra
| N
umbe
r &
Ope
ratio
ns

Students can identify thestrengths and thelimitations of differentforms of representation.
such as these, students should develop a general understanding of, andfacility with, slope and y-intercept and their manifestations in tables,graphs, and equations.
The problem could also easily be extended to nonlinear relation-ships if, for instance, the companies did not charge proportionally forportions of minutes used. If they rounded to the nearest minute, thenthe cost for each company would be graphed as a step function ratherthan a linear function. In another variation, a nonlinear pricing schemefor a third company could be introduced.
Another important topic for class discussion is comparing and con-trasting the merits of graphical, tabular, and symbolic representations inthis example. A teacher might ask, “Which helps us see better the pointat which the two companies switch position and Keep-in-Touch be-comes the more economical—a table or a graph?” “Is it easier to see therate per minute from the graph or from the equation?” or “How canyou determine the rate per minute from the table?” Through discus-sion, students can identify the strengths and the limitations of differentforms of representation. Graphs give a picture of a relationship andallow the quick recognition of linearity when change is constant. Alge-braic equations typically offer compact, easily interpreted descriptionsof relationships between variables.
Represent and analyze mathematical situations andstructures using algebraic symbols
Working with variables and equations is an important part of themiddle-grades curriculum. Students’ understanding of variable shouldgo far beyond simply recognizing that letters can be used to stand forunknown numbers in equations (Schoenfeld and Arcavi 1988). The fol-lowing equations illustrate several uses of variable encountered in themiddle grades:
27 = 4x + 31 = t (1/t)A = LWy = 3x
The role of variable as “place holder” is illustrated in the first equation:x is simply taking the place of a specific number that can be found bysolving the equation. The use of variable in denoting a generalizedarithmetic pattern is shown in the second equation; it represents anidentity when t takes on any real value except 0. The third equation is aformula, with A, L, and W representing the area, length, and width, re-spectively, of a rectangle. The third and fourth equations offer examplesof covariation: in the fourth equation, as x takes on different values, yalso varies.
Most students will need extensive experience in interpreting rela-tionships among quantities in a variety of problem contexts before theycan work meaningfully with variables and symbolic expressions. Anunderstanding of the meanings and uses of variables develops graduallyas students create and use symbolic expressions and relate them to ver-bal, tabular, and graphical representations. Relationships among quanti-ties can often be expressed symbolically in more than one way, provid-ing opportunities for students to examine the equivalence of various
225Standards for Grades 6–8: Algebra
Num
ber & O
perations | Algebra | G
eometry | M
easurement | D
ata Analysis &
Probability | P
roblem S
olving | Reasoning &
Proof | C
omm
unication | Connections | R
epresentation

algebraic expressions. Fairly simple equivalences can be involved: thecost (in dollars) of using Keep-in-Touch can be expressed as y = 0.10x +20, as y = 20 + 0.10x, as 20 + 0.10x = y, and as 0.10x + 20 = y. Complexsymbolic expressions also can be examined, such as the equivalence of 4 + 2L + 2W and (L + 2)(W + 2) – LW when representing the number ofunit tiles to be placed along the border of a rectangular pool withlength L units and width W units; see the “Representation” section ofthis chapter for a discussion of this example.
A problem such as the one in figure 6.9 (adapted from EducationalDevelopment Center, Inc. 1998, p. 41) could give students valuable ex-perience in deciding whether two expressions are equivalent. A teachermight encourage students to begin solving this problem by drawingseveral more boxes of various sizes so they can look for a pattern. Somestudents will probably note that the caramels are also arranged in a rec-tangular pattern, which is narrower and shorter than the rectangulararrangement of chocolates. Using this observation, they might report,“To find the length and width of the caramel rectangle, take 1 off thelength and 1 off the width of the chocolate rectangle. Multiply thelength and width of the caramel rectangle to find the number ofcaramels.” If L and W are the dimensions of the array of chocolates,and C is the number of caramels, then this generalization could be ex-pressed symbolically as C = (L – 1)(W – 1). Other students might findand use the number of chocolates to find the number of caramels. Forexample, for a 3 × 5 box of chocolates, they might propose starting withthe 15 chocolates, then taking off 3 because “there is one less column ofcaramels” and then taking off 5 “because there is one less row ofcaramels.” This could be expressed generally as C = LW – L − W. Al-though both expressions for the number of caramels are likely to seemreasonable to many students, they do not yield the same answer. Forthe 3 × 5 array, the first produces the correct answer, 8 caramels. Thesecond gives the answer 7 caramels. Either examining a few more boxeswith different dimensions or reconsidering the process represented bythe second equation would confirm that the second equation needs tobe corrected by adding 1 to obtain C = LW – L – W + 1. The algebraicequivalence of (L – 1)(W – 1) and LW – L – W + 1 can be demonstratedin general using the distributive property of multiplication over sub-traction.
Through a variety of experiences such as these, students can learnthe strengths and limitations of various methods for checking the equiv-alence of expressions. In some instances, the equivalence of algebraic ex-pressions can be demonstrated geometrically; see the “Geometry” sec-tion of this chapter for a demonstration that (a + b)2 = a 2 + 2ab + b 2.
Most middle-grades students will need considerable experience withlinear equations before they will be comfortable and fluent in transform-ing or solving them. Although students will probably acquire facilitywith equations at different times during the middle grades, by the end ofgrade 8, students should be able to solve equations like 84 – 2x = 5x + 12for the unknown number, to recognize as identities such equations as 1 =t(1/t) (when t is not 0), to apply formulas such as V = πr 2h, and to recog-nize that equations such as y = –3x + 10 represent linear functions thatare satisfied by many ordered pairs (x, y). Students should be able to useequations of the form y = mx + b to represent linear relationships, andthey should know how the values of the slope (m) and the y-intercept (b)
226 Principles and Standards for School Mathematics
Rep
rese
ntat
ion
| C
onne
ctio
ns |
Com
mun
icat
ion
| R
easo
ning
& P
roof
| P
robl
em S
olvi
ng |
Dat
a A
naly
sis
& P
roba
bilit
y |
Mea
sure
men
t |
Geo
met
ry |
Alg
ebra
| N
umbe
r &
Ope
ratio
ns
Fig. 6.9.
The Super Chocolates problem
Super Chocolates are arranged in boxes so that a caramel is placed in the center of each array of four chocolates, as shown below. The dimensions of the box tell you how many columns and how many rows of chocolates come in the box. Develop a method to find the number of caramels in any box if you know its dimensions. Explain and justify your method using words, diagrams, or expressions.
2 × 4
3 × 5
2 × 2

Students’ facility withsymbol manipulationcan be enhanced if it isbased on extensiveexperience withquantities in contexts.
affect the line. For example, in the “cellular telephone” problemdiscussed earlier, they should recognize that y = 0.10x + 20 and y = 0.45xare both linear equations, that the graph of the latter will be steeper thanthat of the former, and that the former intersects the y-axis at (0, 20)rather than at the origin.
Students’ facility with symbol manipulation can be enhanced if it isbased on extensive experience with quantities in contexts throughwhich students develop an initial understanding of the meanings anduses of variables and an ability to associate symbolic expressions withproblem contexts. Fluency in manipulating symbolic expressions can befurther enhanced if students understand equivalence and are facile withthe order of operations and the distributive, associative, and commuta-tive properties.
Use mathematical models to represent and understandquantitative relationships
A major goal in the middle grades is to develop students’ facilitywith using patterns and functions to represent, model, and analyze a va-riety of phenomena and relationships in mathematics problems or inthe real world. With computers and graphing calculators to producegraphical representations and perform complex calculations, studentscan focus on using functions to model patterns of quantitative change.Students should have frequent experiences in modeling situations withequations of the form y = kx, such as relating the side lengths and theperimeters of similar shapes. Opportunities can be found in many otherareas of the curriculum; for example, scatterplots and approximate linesof fit can model trends in data sets. Students also need opportunities tomodel relationships in everyday contexts, such as the “cellular tele-phone” problem.
Students also should have experience in modeling situations and re-lationships with nonlinear functions, such as compound-interest prob-lems, the relationship between the length of the radius of a circle andthe area of the circle, or situations like the one in figure 6.10. If stu-dents have only a few points to examine, it can be difficult to see that
227Standards for Grades 6–8: Algebra
Num
ber & O
perations | Algebra | G
eometry | M
easurement | D
ata Analysis &
Probability | P
roblem S
olving | Reasoning &
Proof | C
omm
unication | Connections | R
epresentation

With a graphingcalculator or computer
graphing software,students can test some
conjectures more easilythan with paper-and-
pencil methods.
the graph for this problem is not linear. As more points are graphed,however, the curve becomes more apparent. Students could use graph-ing calculators or computer graphing tools to do problems such as this.
When doing experiments or dealing with real data, students mayencounter “messy data,” for which a line or a curve may not be an exactfit. They will need experience with such situations and assistance fromthe teacher to develop their ability to find a function that fits the datawell enough to be useful as a prediction tool. In their later study of sta-tistics, students may learn sophisticated methods to determine lines ofbest fit for data. In the middle grades when students encounter a set ofpoints suggesting a linear relationship, they can simply use a ruler to tryseveral lines until they find one that appears to be a good fit and then
228 Principles and Standards for School Mathematics
Rep
rese
ntat
ion
| C
onne
ctio
ns |
Com
mun
icat
ion
| R
easo
ning
& P
roof
| P
robl
em S
olvi
ng |
Dat
a A
naly
sis
& P
roba
bilit
y |
Mea
sure
men
t |
Geo
met
ry |
Alg
ebra
| N
umbe
r &
Ope
ratio
ns
Length 1 2 3 4 5 6 7 8 9 10 11 … 36
Width 36 18 12 9 7.2 6 5.14 4.5 4 3.6 3.27 … 1
Look at the table and examine the pattern of the difference between consecutive entries for the length and the width. As the length increases by 1, the width decreases, but not at a constant rate. What do you expect the graph of the relationship between L and W to look like? Will it be a straight line? Why or why not?
Solution:
The graph is not a straight line because the rate of change is not constant. Instead the graph appears to be a curve that bends sharply downward and then becomes more level.
40
35
30
25
20
15
10
5
0 1 2 3 4 5 6 7
Length
Wid
th
Consider rectangles with a fixed area of 36 square units. The width (W ) of the rectangles varies in relation to the length (L) according to the formula W = 36/L. Make a table showing the widths for all the possible whole-number lengths for these rectangles up to L = 36.
Solution:
Fig. 6.10.
A problem involving a nonlinearrelationship, with an associated table
and graph

write an equation for that line. An example of this sort of activity, re-lated to a scatterplot of measurements, can be found in the “DataAnalysis and Probability” section of this chapter. With a graphing cal-culator or computer graphing software, students can test some conjec-tures more easily than with paper-and-pencil methods.
Analyze change in various contexts In their study of algebra, middle-grades students should encounter
questions that focus on quantities that change. Recall, for example, thatChitChat charges $0.45 a minute for phone calls. The cost per minutedoes not change, but the total cost changes as the telephone is used.This can be seen quite readily from the two graphs in figure 6.11. Themeaning of the term flat rate can be seen in the cost-per-minute graph,which shows points along a horizontal line at y = 0.45, representing aconstant rate of $0.45 a minute. The total-cost graph shows pointsalong a straight line that includes the origin and has a slope of 0.45.
Students may be confused when they first encounter two differentgraphs to represent different relationships in the same situation. Teach-ers can assist students in understanding what relationships are repre-sented in the two graphs by asking such questions as these: When thenumber of minutes is 4, what do the values of the corresponding pointon each graph represent? When the number of minutes is 8? Why isthe y-value of the cost-per-minute graph constant at 0.45? How muchdoes the total-cost graph increase from 5 minutes to 6 minutes? Why?How would each graph change, if at all, if the cost per minute werechanged to $0.20?
A slight modification of the problem, such as the addition of a thirdtelephone company with a different pricing scheme, can allow theanalysis of change in nonlinear relationships:
Quik-Talk advertises monthly cellular phone service for $0.50 a minute forthe first 60 minutes but only $0.10 a minute for each minute thereafter.Quik-Talk also charges for the exact amount of time used.
229Standards for Grades 6–8: Algebra
Num
ber & O
perations | Algebra | G
eometry | M
easurement | D
ata Analysis &
Probability | P
roblem S
olving | Reasoning &
Proof | C
omm
unication | Connections | R
epresentation
Fig. 6.11.
These two graphs representdifferent relationships in ChitChat’spricing scheme.
Number of Minutes
Cos
t per
Min
ute
0 1 2 3 4 5 6 7 8 9 10
Number of Minutes
Tota
l Cos
t for
Cal
ls$3.60
$3.15
$2.70
$2.25
$1.80
$1.35
$0.90
$0.45
0 1 2 3 4 5 6 7 8 9 10
$3.60
$3.15
$2.70
$2.25
$1.80
$1.35
$0.90
$0.45

A teacher might ask students to graph the rates of change in this exam-ple. Figure 6.12 shows the cost-per-minute graph and a total-cost graphfor Quik-Talk’s pricing scheme. Students can answer questions aboutthe relationships represented in the graphs: Why does the cost-per-minute graph consist of two different line segments? How can we tellfrom the graph that the pricing scheme changes after 60 minutes? Whyis part of the total-cost function steeper than the rest of the graph?
Comparing the cost-per-minute graph to the total-cost graph forphone calls can help students develop a clearer understanding of the re-lationship between change (cost per minute) and accumulation (totalcost of calls). These concepts are precursors to the later study of changein calculus.
Students’ examination of graphs of change and graphs of accumula-tion can be facilitated with specially designed computer software. Suchsoftware allows students to change either the number of minutes usedin one month by dragging a horizontal “slider” (see fig. 6.13) or thecost per minute by dragging a vertical slider. They can then observe thecorresponding changes in the graphs and in the symbolic expression forthe relationship. Technological tools can also help students examine thenature of change in many other settings. For example, students couldexamine distance-time relationships using computer-based laboratories,as discussed in the “Measurement” section of this chapter. Such experi-ences with appropriate technology, supported by careful planning byteachers and interactions with classmates, can help students develop asolid understanding of some fundamental notions of change.
230 Principles and Standards for School Mathematics
Rep
rese
ntat
ion
| C
onne
ctio
ns |
Com
mun
icat
ion
| R
easo
ning
& P
roof
| P
robl
em S
olvi
ng |
Dat
a A
naly
sis
& P
roba
bilit
y |
Mea
sure
men
t |
Geo
met
ry |
Alg
ebra
| N
umbe
r &
Ope
ratio
ns
Fig. 6.12.
These two graphs represent different relationships in Quik-Talk’s
pricing scheme.
Number of Minutes
Cos
t per
Min
ute
$0.50
$0.40
$0.30
$0.20
$0.10
Number of Minutes
Tota
l Cos
t for
Cal
ls
$40.00
$30.00
$20.00
$10.00
0 10 20 30 40 50 60 70 80 90 1000 10 20 30 40 50 60 70 80 90 100
E-example 6.2
Comparing Cost Functions

231Standards for Grades 6–8: Algebra
Num
ber & O
perations | Algebra | G
eometry | M
easurement | D
ata Analysis &
Probability | P
roblem S
olving | Reasoning &
Proof | C
omm
unication | Connections | R
epresentation
Fig. 6.13.
Computer software can help studentsunderstand some fundamental no-tions of change.
Number of Minutes Number of Minutes
Cellular Phone Costs
Cos
t per
Min
ute
1 2 3 4 5 6 7 8 9 10
Tota
l Cos
t for
Cal
ls
$3.90
$3.60
$3.30
$3.00
$2.70
$2.40
$2.10
$1.80
$1.50
$1.20
$0.90
$0.60
$0.30
(8, $2.40)
Slider for Cost
Slider for Number of Minutes
Y = .30 x
0 1 2 3 4 5 6 7 8 9 10
$3.90
$3.60
$3.30
$3.00
$2.70
$2.40
$2.10
$1.80
$1.50
$1.20
$0.90
$0.60
$0.30
0
1 2 3 4 5 6 7 8 9 10
$0.50
$0.40
$0.30
$0.20
$0.10

In grades 6–8 all students should—
• precisely describe, classify, and understand relationships among types oftwo- and three-dimensional objects using their defining properties;
• understand relationships among the angles, side lengths, perimeters, areas,and volumes of similar objects;
• create and critique inductive and deductive arguments concerninggeometric ideas and relationships, such as congruence, similarity, and thePythagorean relationship.
• use coordinate geometry to represent and examine the properties ofgeometric shapes;
• use coordinate geometry to examine special geometric shapes, such asregular polygons or those with pairs of parallel or perpendicular sides.
• describe sizes, positions, and orientations of shapes under informaltransformations such as flips, turns, slides, and scaling;
• examine the congruence, similarity, and line or rotational symmetry ofobjects using transformations.
• draw geometric objects with specified properties, such as side lengths orangle measures;
• use two-dimensional representations of three-dimensional objects tovisualize and solve problems such as those involving surface area andvolume;
• use visual tools such as networks to represent and solve problems;• use geometric models to represent and explain numerical and algebraic
relationships;• recognize and apply geometric ideas and relationships in areas outside the
mathematics classroom, such as art, science, and everyday life.
Instructional programs fromprekindergarten through grade 12should enable all students to—
Analyze characteristics and proper-ties of two- and three-dimensionalgeometric shapes and developmathematical arguments about geometric relationships
Specify locations and describe spatial relationships using coordinategeometry and other representationalsystems
Apply transformations and use symmetry to analyze mathematicalsituations
Use visualization, spatial reasoning,and geometric modeling to solveproblems
6–8Standard
for Grades
Expectations
Geometry
232 Principles and Standards for School Mathematics

Geometry Students should come to the study of geometry in the middle grades
with informal knowledge about points, lines, planes, and a variety oftwo- and three-dimensional shapes; with experience in visualizing anddrawing lines, angles, triangles, and other polygons; and with intuitivenotions about shapes built from years of interacting with objects intheir daily lives.
In middle-grades geometry programs based on these recommenda-tions, students investigate relationships by drawing, measuring, visualiz-ing, comparing, transforming, and classifying geometric objects.Geometry provides a rich context for the development of mathematicalreasoning, including inductive and deductive reasoning, making andvalidating conjectures, and classifying and defining geometric objects.Many topics treated in the Measurement Standard for the middlegrades are closely connected to students’ study of geometry.
Analyze characteristics and properties of two- andthree-dimensional geometric shapes and developmathematical arguments about geometric relationships
Middle-grades students should explore a variety of geometric shapesand examine their characteristics. Students can conduct these explo-rations using materials such as geoboards, dot paper, multiple-lengthcardboard strips with hinges, and dynamic geometry software to createtwo-dimensional shapes.
Students must carefully examine the features of shapes in order toprecisely define and describe fundamental shapes, such as special typesof quadrilaterals, and to identify relationships among the types ofshapes. A teacher might ask students to draw several parallelograms ona coordinate grid or with dynamic geometry software. Students shouldmake and record measurements of the sides and angles to observe someof the characteristic features of each type of parallelogram. They shouldthen generate definitions for these shapes that are correct and consis-tent with the commonly used ones and recognize the principal relation-ships among elements of these parallelograms. A Venn diagram like theone shown in figure 6.14 might be used to summarize observations thata square is a special case of a rhombus and rectangle, each of which is aspecial case of a parallelogram.
The teacher might also ask students to draw the diagonals of multi-ple examples of each shape, as shown in figure 6.15, and then measurethe lengths of the diagonals and the angles they form. The results canbe summarized in a table like that in figure 6.16. Students should ob-serve that the diagonals of these parallelograms bisect each other, whichthey might propose as a defining characteristic of a parallelogram.Moreover, they might observe, the diagonals are perpendicular inrhombuses (including squares) but not in other parallelograms and thediagonals are of equal length in rectangles (including squares) but notin other parallelograms. These observations might suggest other defin-ing characteristics of special quadrilaterals, for instance, that a square isa parallelogram with diagonals that are perpendicular and of equal
233Standards for Grades 6–8: Geometry
Num
ber & O
perations | Algebra | G
eometry | M
easurement | D
ata Analysis &
Probability | P
roblem S
olving | Reasoning &
Proof | C
omm
unication | Connections | R
epresentation
Fig. 6.14.
A diagram showing the relationshipsamong types of parallelograms
Parallelograms
Rectangles RhombusesSquares
Fig. 6.15.
Students can draw the diagonals ofparallelograms to make further observations.
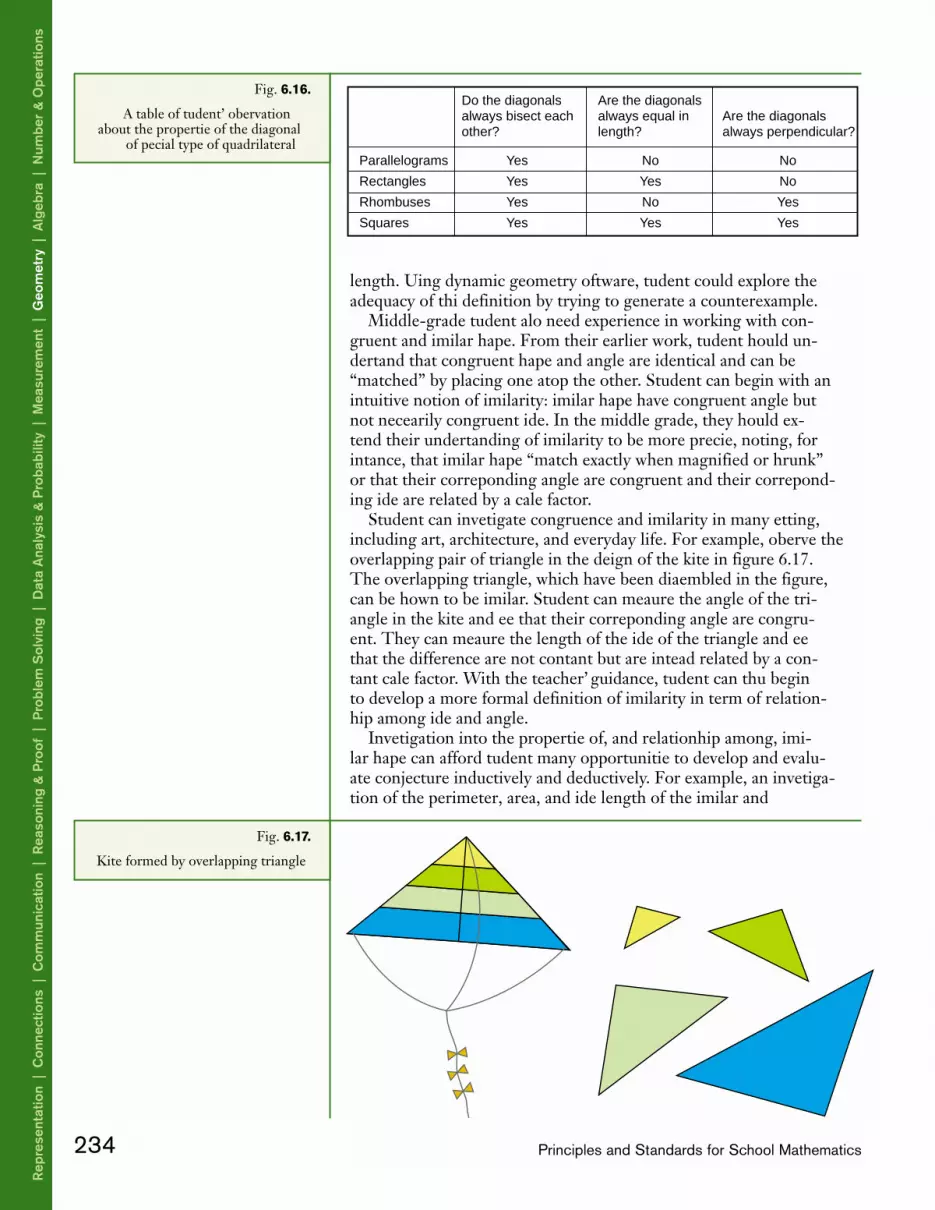
length. Using dynamic geometry software, students could explore theadequacy of this definition by trying to generate a counterexample.
Middle-grades students also need experience in working with con-gruent and similar shapes. From their earlier work, students should un-derstand that congruent shapes and angles are identical and can be“matched” by placing one atop the other. Students can begin with anintuitive notion of similarity: similar shapes have congruent angles butnot necessarily congruent sides. In the middle grades, they should ex-tend their understanding of similarity to be more precise, noting, forinstance, that similar shapes “match exactly when magnified or shrunk”or that their corresponding angles are congruent and their correspond-ing sides are related by a scale factor.
Students can investigate congruence and similarity in many settings,including art, architecture, and everyday life. For example, observe theoverlapping pairs of triangles in the design of the kite in figure 6.17.The overlapping triangles, which have been disassembled in the figure,can be shown to be similar. Students can measure the angles of the tri-angles in the kite and see that their corresponding angles are congru-ent. They can measure the lengths of the sides of the triangles and seethat the differences are not constant but are instead related by a con-stant scale factor. With the teacher’s guidance, students can thus beginto develop a more formal definition of similarity in terms of relation-ships among sides and angles.
Investigations into the properties of, and relationships among, simi-lar shapes can afford students many opportunities to develop and evalu-ate conjectures inductively and deductively. For example, an investiga-tion of the perimeters, areas, and side lengths of the similar and
234 Principles and Standards for School Mathematics
Rep
rese
ntat
ion
| C
onne
ctio
ns |
Com
mun
icat
ion
| R
easo
ning
& P
roof
| P
robl
em S
olvi
ng |
Dat
a A
naly
sis
& P
roba
bilit
y |
Mea
sure
men
t |
Geo
met
ry |
Alg
ebra
| N
umbe
r &
Ope
ratio
ns
Fig. 6.16.
A table of students’ observationsabout the properties of the diagonals
of special types of quadrilateralsParallelograms Yes No No
Rectangles Yes Yes No
Rhombuses Yes No Yes
Squares Yes Yes Yes
Do the diagonals always bisect each other?
Are the diagonals always perpendicular?
Are the diagonals always equal in length?
Fig. 6.17.
Kite formed by overlapping triangles

congruent triangles in the kite example could reveal relationships andlead to generalizations. Teachers might encourage students to formulateconjectures about the ratios of the side lengths, of the perimeters, andof the areas of the four similar triangles. They might conjecture thatthe ratio of the perimeters is the same as the scale factor relating theside lengths and that the ratio of the areas is the square of that scale fac-tor. Then students could use dynamic geometry software to test theconjectures with other examples. Students can formulate deductive ar-guments about their conjectures. Communicating such reasoning accu-rately and clearly prepares students for creating and understandingmore-formal proofs in subsequent grades.
Specify locations and describe spatial relationships usingcoordinate geometry and other representational systems
Geometric and algebraic representations of problems can be linkedusing coordinate geometry. Students could draw on the coordinate planeexamples of the parallelograms discussed previously, examine their char-acteristic features using coordinates, and then interpret their propertiesalgebraically. Such an investigation might include finding the slopes ofthe lines containing the segments that compose the shapes. From manyexamples of these shapes, students could make important observationsabout the slopes of parallel lines and perpendicular lines. Figure 6.18helps to illustrate for one specific rhombus what might be observed ingeneral: the slopes of parallel lines (in this instance, the opposite sides ofthe rhombus) are equal and the slopes of perpendicular lines (in this in-stance, the diagonals of the rhombus) are negative reciprocals. Theslopes of the diagonals are
and
Apply transformations and use symmetry to analyzemathematical situations
Transformational geometry offers another lens through which to in-vestigate and interpret geometric objects. To help them form images ofshapes through different transformations, students can use physical ob-jects, figures traced on tissue paper, mirrors or other reflective surfaces,figures drawn on graph paper, and dynamic geometry software. Theyshould explore the characteristics of flips, turns, and slides and shouldinvestigate relationships among compositions of transformations. Theseexperiences should help students develop a strong understanding of lineand rotational symmetry, scaling, and properties of polygons.
From their experiences in grades 3–5, students should know that ro-tations, slides, and flips produce congruent shapes. By exploring the po-sitions, side lengths, and angle measures of the original and resultingfigures, middle-grades students can gain new insights into congruence.They could, for example, note that the images resulting from transfor-mations have different positions and sometimes different orientations
235Standards for Grades 6–8: Geometry
Num
ber & O
perations | Algebra | G
eometry | M
easurement | D
ata Analysis &
Probability | P
roblem S
olving | Reasoning &
Proof | C
omm
unication | Connections | R
epresentation
Fig. 6.18.
A rhombus drawn on the coordinateplane
(–5, –5)
(9, 3)
(–3, 11)
(11, 19)y
x
19 511 5
2416
32
– –( )– –( )
= =
11 33 9
812
23
−− −
=−
= .−
E-example 6.3
Linking Length, Perimeter,Area, and Volume

from those of the original figure (the preimage), although they have thesame side lengths and angle measures as the original. Thus congruencedoes not depend on position and orientation.
Transformations can become an object of study in their own right.Teachers can ask students to visualize and describe the relationshipamong lines of reflection, centers of rotation, and the positions ofpreimages and images. Using dynamic geometry software, studentsmight see that each point in a reflection is the same distance from theline of reflection as the corresponding point in the preimage, as shownin figure 6.19a. In a rotation, such as the one shown in figure 6.19b,students might note that the corresponding vertices in the preimageand image are the same distance from the center of rotation and thatthe angles formed by connecting the center of rotation to correspond-ing pairs of vertices are congruent.
Teachers can pose additional challenges to develop students’ under-standing of transformations and congruence. For example, given thethree pairs of congruent shapes in figure 6.20, students might be askedto identify a transformation applied to transform one shape into theother. Most students who have had extensive experience with transfor-mations should see that the first pair appears to be related by a reflec-tion, the second pair by a translation, and the third pair by either a reflection or a rotation. As students develop a more sophisticated un-derstanding of transformations, they could be asked to describe thetransformation more exactly, using distance, angles, and headings. Thetransformation for the second pair of shapes, for example, is a transla-tion of 1.5 cm at a 45-degree angle.
Teachers may also want students to consider what happens whentransformations are composed. For example, the image produced whena figure is reflected through one line and the resulting image is re-flected through a different line will be either a translation of the preim-age if the lines of reflection are parallel or a rotation if they intersect.To assess students’ understanding of transformations, teachers can givestudents two congruent shapes and have them specify a transformationor a composition of transformations that will map one to the other.This can be done using dynamic geometry software.
Transformations can also be used to help students understand similar-ity and symmetry. Work with magnifications and contractions, called di-lations, can support students’ developing understanding of similarity. For
236 Principles and Standards for School Mathematics
Rep
rese
ntat
ion
| C
onne
ctio
ns |
Com
mun
icat
ion
| R
easo
ning
& P
roof
| P
robl
em S
olvi
ng |
Dat
a A
naly
sis
& P
roba
bilit
y |
Mea
sure
men
t |
Geo
met
ry |
Alg
ebra
| N
umbe
r &
Ope
ratio
ns
Fig. 6.19.
Using dynamic geometry software,students can explore the results of re-
flections (a) and rotations (b).A
B
A ′
B ′
D
C
D ′H ′
I ′
J ′
H
I
J
K
C ′G
E
F
GC = 0.67 inchesGC ′ = 0.67 inches
m ∠ I ′KI = 45°m ∠ J ′KJ = 45°m ∠ H ′KH = 45°
IK = 1.36 inchesI ′K = 1.36 inchesJ K = 0.78 inchesJ ′K = 0.78 inches
(a) (b)
Fig. 6.20.
Three pairs of congruent shapes
E-example 6.4
Congruence, Similarity, andSymmetry through Transformations

Students’ skills invisualizing andreasoning about spatialrelationships arefundamental ingeometry.
example, dilation of a shape affects the length of each side by a constantscale factor, but it does not affect the orientation or the magnitude ofthe angles. In a similar manner, rotations and reflections can help stu-dents understand symmetry. Students can observe that when a figurehas rotational symmetry, a rotation can be found such that the preim-age (original shape) exactly matches the image but its vertices map todifferent vertices. Looking at line symmetry in certain classes of shapescan also lead to interesting observations. For example, isosceles trape-zoids have a line of symmetry containing the midpoints of the parallelopposite sides (often called bases). Students can observe that the pair ofsides not intersected by the line of symmetry (often called the legs) arecongruent, as are the two corresponding pairs of angles. Students canconclude that the diagonals are the same length, since they can be re-flected onto each other, and that several pairs of angles related to thosediagonals are also congruent. Further exploration reveals that rectan-gles and squares also have a line of symmetry containing the midpointsof a pair of opposite sides (and other lines of symmetry as well) and allthe resulting properties.
Use visualization, spatial reasoning, and geometricmodeling to solve problems
Students’ skills in visualizing and reasoning about spatial relation-ships are fundamental in geometry. Some students may have difficultyfinding the surface area of three-dimensional shapes using two-dimen-sional representations because they cannot visualize the unseen faces ofthe shapes. Experience with models of three-dimensional shapes andtheir two-dimensional “nets” is useful in such visualization (see fig. 6.25in the “Measurement” section for an example of a net). Students alsoneed to examine, build, compose, and decompose complex two- andthree-dimensional objects, which they can do with a variety of media,including paper-and-pencil sketches, geometric models, and dynamicgeometry software. Interpreting or drawing different views of buildings,such as the base floor plan and front and back views, using dot papercan be useful in developing visualization. Students should build three-dimensional objects from two-dimensional representations; draw ob-jects from a geometric description; and write a description, including itsgeometric properties, for a given object.
Students can also benefit from experience with other visual models,such as networks, to use in analyzing and solving real problems, such asthose concerned with efficiency. To illustrate the utility of networks,students might consider the problem and the networks given in figure6.21 (adapted from Roberts [1997, pp. 106–7]). The teacher could askstudents to determine one or several efficient routes that Carolinemight use for the streets on map A, share their solutions with the class,and describe how they found them. Students should note the start-endpoint of each route and the number of different routes that they find.Students could then find an efficient route for map B. They shouldeventually conclude that no routes in map B satisfy the conditions ofthe problem. They should discuss why no such route can be found; theteacher might suggest that students count the number of paths attachedto each node and look at where they “get stuck” in order to better
237Standards for Grades 6–8: Geometry
Num
ber & O
perations | Algebra | G
eometry | M
easurement | D
ata Analysis &
Probability | P
roblem S
olving | Reasoning &
Proof | C
omm
unication | Connections | R
epresentation

understand why they reach an impasse. To extend this investigation,students could look for efficient paths in other situations or they mightchange the conditions of the map B problem to find the pathway withthe least backtracking. Such an investigation in the middle grades is aprecursor of later work with Hamiltonian circuits, a foundation forwork with sophisticated networks.
Visual demonstrations can help students analyze and explain mathe-matical relationships. Eighth graders should be familiar with one of themany visual demonstrations of the Pythagorean relationship—the dia-gram showing three squares attached to the sides of a right triangle.Students could replicate some of the other visual demonstrations of therelationship using dynamic geometry software or paper-cutting proce-dures, and then discuss the associated reasoning.
Geometric models are also useful in representing other algebraic re-lationships, such as identities. For example, the visual demonstrationsof the identity (a + b)2 = a2 + 2ab + b2 in figure 6.22 makes it easy to re-member. A teacher might begin by asking students to draw a squarewith side lengths (2 + 5). Students could then partition the square asshown in fig. 6.22a, calculate the area of each section, and finally rep-resent the total area. Students could then apply this approach to the
238 Principles and Standards for School Mathematics
Rep
rese
ntat
ion
| C
onne
ctio
ns |
Com
mun
icat
ion
| R
easo
ning
& P
roof
| P
robl
em S
olvi
ng |
Dat
a A
naly
sis
& P
roba
bilit
y |
Mea
sure
men
t |
Geo
met
ry |
Alg
ebra
| N
umbe
r &
Ope
ratio
ns
Fig. 6.21.
Networks used to solve efficiencyproblems
Fig. 6.22.
Geometric representation demonstrat-ing the identity (a + b)2 = a2 + 2ab + b2
Map A Map B
Caroline’s job is to collect money from parking meters. She wants to find an efficient route that starts and ends at the same place and travels on each street only once.
A. The streets she has to cover are shown in map A. Find and trace such a route for her.
B. A new street, shown in map B, may be added to her route. Can youfind an efficient route that includes the new street?
2 5
2
5
(2 + 5)2 = 2 • 2 + 2 • 5 + 2 • 5 + 5 • 5
= 4 + 10 + 10 + 25
= 49
a b
a
b
(a + b)2 = a • a + a • b + a • b + b • b
= a2 + 2ab + b 2
(a) (b)
E-example 6.5
Exploring the PythagoreanRelationship

general case of a square with sides of length (a + b), as shown in figure6.22b, which demonstrates the identity (a + b)2 = a2 + 2ab + b2.
Many investigations in middle-grades geometry can be connected toother school subjects. Nature, art, and the sciences provide opportuni-ties for the observation and the subsequent exploration of geometryconcepts and patterns as well as for appreciating and understanding thebeauty and utility of geometry. For example, the study in nature or artof golden rectangles (i.e., rectangles in which the ratio of the lengths isthe golden ratio, (1 + 5 )/2) or the study of the relationship betweenthe rigidity of triangles and their use in construction helps students seeand appreciate the importance of geometry in our world.
239Standards for Grades 6–8: Geometry
Num
ber & O
perations | Algebra | G
eometry | M
easurement | D
ata Analysis &
Probability | P
roblem S
olving | Reasoning &
Proof | C
omm
unication | Connections | R
epresentation
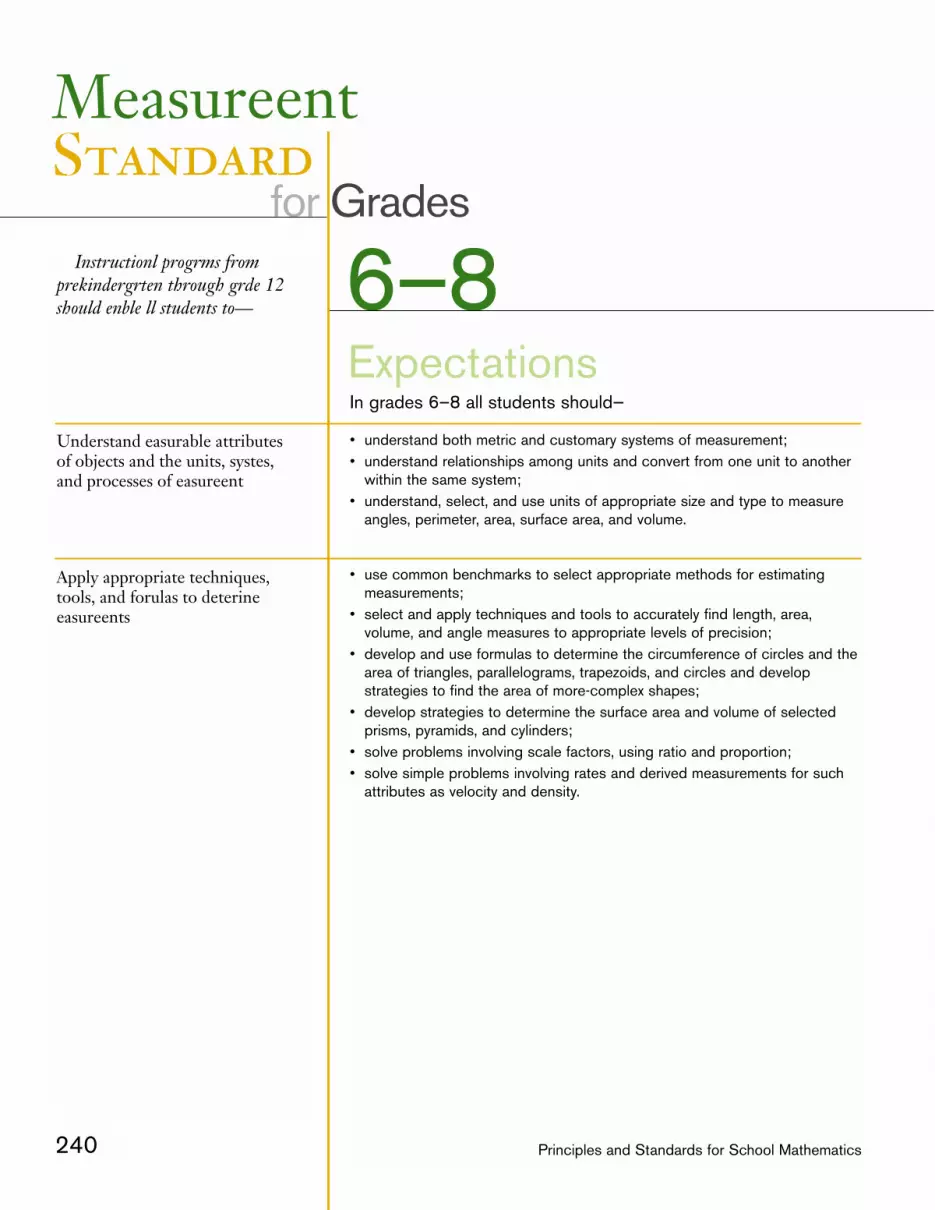
In grades 6–8 all students should—
• understand both metric and customary systems of measurement;• understand relationships among units and convert from one unit to another
within the same system;• understand, select, and use units of appropriate size and type to measure
angles, perimeter, area, surface area, and volume.
• use common benchmarks to select appropriate methods for estimatingmeasurements;
• select and apply techniques and tools to accurately find length, area,volume, and angle measures to appropriate levels of precision;
• develop and use formulas to determine the circumference of circles and thearea of triangles, parallelograms, trapezoids, and circles and developstrategies to find the area of more-complex shapes;
• develop strategies to determine the surface area and volume of selectedprisms, pyramids, and cylinders;
• solve problems involving scale factors, using ratio and proportion;• solve simple problems involving rates and derived measurements for such
attributes as velocity and density.
Instructional programs fromprekindergarten through grade 12should enable all students to—
Understand measurable attributesof objects and the units, systems,and processes of measurement
Apply appropriate techniques,tools, and formulas to determinemeasurements
6–8Standard
for Grades
Expectations
Measurement
240 Principles and Standards for School Mathematics
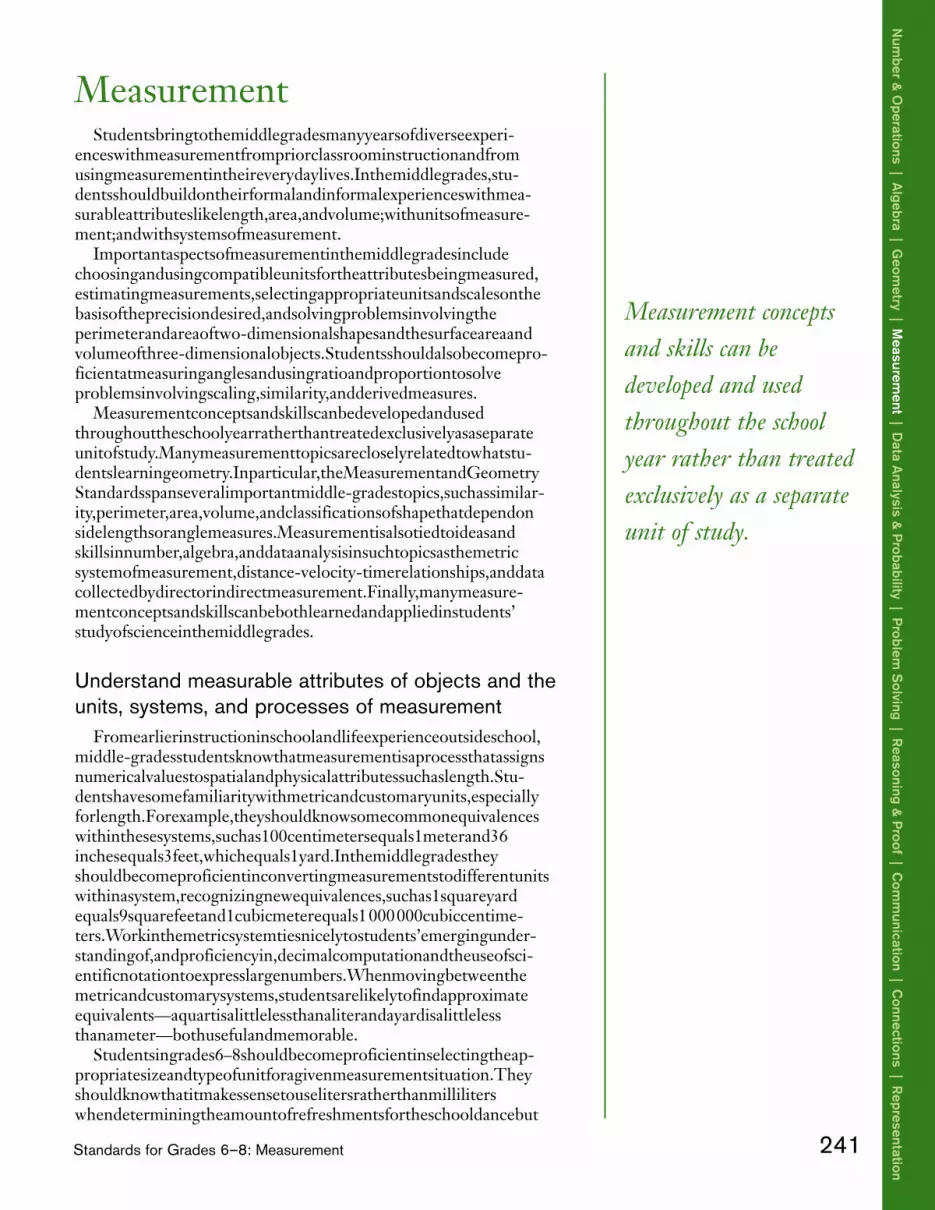
Measurement conceptsand skills can bedeveloped and usedthroughout the schoolyear rather than treatedexclusively as a separateunit of study.
Measurement Students bring to the middle grades many years of diverse experi-
ences with measurement from prior classroom instruction and fromusing measurement in their everyday lives. In the middle grades, stu-dents should build on their formal and informal experiences with mea-surable attributes like length, area, and volume; with units of measure-ment; and with systems of measurement.
Important aspects of measurement in the middle grades includechoosing and using compatible units for the attributes being measured,estimating measurements, selecting appropriate units and scales on thebasis of the precision desired, and solving problems involving theperimeter and area of two-dimensional shapes and the surface area andvolume of three-dimensional objects. Students should also become pro-ficient at measuring angles and using ratio and proportion to solveproblems involving scaling, similarity, and derived measures.
Measurement concepts and skills can be developed and usedthroughout the school year rather than treated exclusively as a separateunit of study. Many measurement topics are closely related to what stu-dents learn in geometry. In particular, the Measurement and GeometryStandards span several important middle-grades topics, such as similar-ity, perimeter, area, volume, and classifications of shape that depend onside lengths or angle measures. Measurement is also tied to ideas andskills in number, algebra, and data analysis in such topics as the metricsystem of measurement, distance-velocity-time relationships, and datacollected by direct or indirect measurement. Finally, many measure-ment concepts and skills can be both learned and applied in students’study of science in the middle grades.
Understand measurable attributes of objects and theunits, systems, and processes of measurement
From earlier instruction in school and life experience outside school,middle-grades students know that measurement is a process that assignsnumerical values to spatial and physical attributes such as length. Stu-dents have some familiarity with metric and customary units, especiallyfor length. For example, they should know some common equivalenceswithin these systems, such as 100 centimeters equals 1 meter and 36inches equals 3 feet, which equals 1 yard. In the middle grades theyshould become proficient in converting measurements to different unitswithin a system, recognizing new equivalences, such as 1 square yardequals 9 square feet and 1 cubic meter equals 1000000 cubic centime-ters. Work in the metric system ties nicely to students’ emerging under-standing of, and proficiency in, decimal computation and the use of sci-entific notation to express large numbers. When moving between themetric and customary systems, students are likely to find approximateequivalents—a quart is a little less than a liter and a yard is a little lessthan a meter—both useful and memorable.
Students in grades 6–8 should become proficient in selecting the ap-propriate size and type of unit for a given measurement situation. Theyshould know that it makes sense to use liters rather than milliliterswhen determining the amount of refreshments for the school dance but
241Standards for Grades 6–8: Measurement
Num
ber & O
perations | Algebra | G
eometry | M
easurement | D
ata Analysis &
Probability | P
roblem S
olving | Reasoning &
Proof | C
omm
unication | Connections | R
epresentation

that milliliters may be quite appropriate when measuring a smallamount of a liquid for a science experiment.
In the middle grades, students expand their experiences with measure-ment. Although students may have developed an initial understanding ofarea and volume, many will need additional experiences in measuring di-rectly to deepen their understanding of the area of two-dimensionalshapes and the surface area and volume of three-dimensional objects.Even in the middle grades, some measurement of area and volume by ac-tually covering shapes and filling objects can be worthwhile for many stu-dents. Through such experiences, teachers can help students clarify con-cepts associated with these topics. For example, many students experiencesome confusion about why square units are always used to measure areaand cubic units to measure volume, especially when the shapes or objectsbeing measured are not squares or cubes. If they move rapidly to usingformulas without an adequate conceptual foundation in area and volume,many students could have underlying confusions such as these that wouldinterfere with their working meaningfully with measurements.
Frequent experiences in measuring surface area and volume can alsohelp students develop sound understandings of the relationships amongattributes and of the units appropriate for measuring them. For exam-ple, some students may hold the misconception that if the volume of athree-dimensional shape is known, then its surface area can be deter-mined. This misunderstanding appears to come from an incorrect over-generalization of the very special relationship that exists for a cube: Ifthe volume of a cube is known, then its surface area can be uniquely de-termined. For example, if the volume of a cube is 64 cubic units, thenits surface area is 96 square units. But this relationship is not true forrectangular prisms or for other three-dimensional objects in general. Toaddress and correct this misunderstanding, a teacher can have studentsuse a fixed number of stacking cubes to build different rectangularprisms and then record the corresponding surface area of each arrange-ment. Because the number of cubes is the same, the volume is identicalfor all, but the surface area varies. Although a single counterexample is
242 Principles and Standards for School Mathematics
Rep
rese
ntat
ion
| C
onne
ctio
ns |
Com
mun
icat
ion
| R
easo
ning
& P
roof
| P
robl
em S
olvi
ng |
Dat
a A
naly
sis
& P
roba
bilit
y |
Mea
sure
men
t |
Geo
met
ry |
Alg
ebra
| N
umbe
r &
Ope
ratio
ns

Students who have hadexperience indetermining and usingbenchmark angles areless likely to misread aprotractor.
sufficient to demonstrate mathematically that volume does not deter-mine surface area, one example may not dispel the misconception for allstudents. Some students will benefit from repeating this activity withseveral different fixed volumes. Students can reap an additional benefitfrom this activity by considering how the shapes of rectangular prismswith a fixed volume are related to their surface areas. By observing pat-terns in the tables they construct for different fixed volumes, studentscan note that prisms of a given volume that are cubelike (i.e., whose lin-ear dimensions are nearly equal) tend to have less surface area thanthose that are less cubelike. Experiences such as this contribute to ageneral understanding of the relationship between shape and size, ex-tend students’ earlier work in patterns of variation in the perimetersand areas of rectangles, and lay a foundation for a further examinationof surface area and volume in calculus.
Apply appropriate techniques, tools, and formulas todetermine measurements
When students measure an object, the result should make sense; esti-mates and benchmarks can help students recognize when a measure-ment is reasonable. Students can use their sense of the size of commonunits to estimate measurements; for example, the height of the class-room door is about two meters, it takes about ten minutes to walk fromthe middle school to the high school, or the textbook weighs about twopounds. They should also be able to use commonly understood bench-marks to estimate large measurements; for instance, the distance be-tween the middle school and the high school is about the length of tenfootball fields.
Students should become proficient in composing and decomposingtwo- and three-dimensional shapes in order to find the lengths, areas,and volumes of various complex objects. In addition, they should de-velop an understanding of different angle relationships and be proficientin measuring angles. Toward this end, they should learn to use a protrac-tor to measure angles directly. Just as lower-grades students need helplearning to use a ruler to measure length, so middle-grades students alsoneed help with the mechanics of using a protractor—aligning it properlywith the vertex and sides of the angle to be measured and reading thecorrect size of the angle on the scale. Students who have had experiencein determining and using benchmark angles are less likely to misread aprotractor. Estimating that an angle is less than 90 degrees should pre-vent a student from misreading a measurement of 150 degrees for a 30-degree angle. Students can develop a repertoire of benchmark angles, in-cluding right angles, straight angles, and 45-degree angles. They shouldbe able to offer reasonable estimates for the measurement of any anglebetween 0 degrees and 180 degrees. Checking the reasonableness of ameasurement should be a part of the process.
In the middle grades, students should also develop an understanding ofprecision and measurement error. By examining and discussing how ob-jects are measured and how the results are expressed, teachers can helptheir students understand that a measurement is precise only to one-halfof the smallest unit used in the measurement. That is, when students saythat the length of a book, to the nearest quarter inch, is 12 1/4 inches,
243Standards for Grades 6–8: Measurement
Num
ber & O
perations | Algebra | G
eometry | M
easurement | D
ata Analysis &
Probability | P
roblem S
olving | Reasoning &
Proof | C
omm
unication | Connections | R
epresentation

they should be aware that the measurement could be off by 1/8 inch.Thus, the absolute error in the measurement is ±1/8 inch in this instance.Similarly, if they use a protractor to measure angles to the nearest degree,they will be precise within 1/2 degree.
An understanding of the concepts of perimeter, area, and volume isinitiated in lower grades and extended and deepened in grades 6–8.Whenever possible, students should develop formulas and proceduresmeaningfully through investigation rather than memorize them. Evenformulas that are difficult to justify rigorously in the middle grades,such as that for the area of a circle, should be treated in ways that helpstudents develop an intuitive sense of their reasonableness.
One particularly accessible and rich domain for such investigation isareas of parallelograms, triangles, and trapezoids. Students can developformulas for these shapes using what they have previously learned abouthow to find the area of a rectangle, along with an understanding thatdecomposing a shape and rearranging its component parts withoutoverlapping does not affect the area of the shape. For example, figure6.23 illustrates how students could use their knowledge of the area of arectangle to generate formulas for the area of a parallelogram and a tri-angle. Once students develop these formulas, they can also generate aformula for the area of a trapezoid. A teacher might have students beginworking with isosceles trapezoids and then try to generalize their for-mula for any trapezoid. As suggested in figure 6.24, students can usewhat they know about rectangles, parallelograms, and triangles in sev-eral different ways. They might decompose an isosceles trapezoid intotwo triangles and a rectangle and rearrange these shapes to form a rec-tangle, or they might duplicate the trapezoid and arrange the twoshapes to form a parallelogram.
244 Principles and Standards for School Mathematics
Rep
rese
ntat
ion
| C
onne
ctio
ns |
Com
mun
icat
ion
| R
easo
ning
& P
roof
| P
robl
em S
olvi
ng |
Dat
a A
naly
sis
& P
roba
bilit
y |
Mea
sure
men
t |
Geo
met
ry |
Alg
ebra
| N
umbe
r &
Ope
ratio
ns
Fig. 6.23.
Students can use their knowledge ofthe area of a rectangle to generate a
formula for the area of a parallelogram(a) and for the area of a triangle (b).
(a) (b)
Fig. 6.24.
An isosceles trapezoid can be decom-posed and rearranged or duplicated
in order to find a formula for its area.

Students in the middle grades should also develop formulas for thesurface areas and volumes of three-dimensional objects. Teachers canhelp students develop formulas for the volumes of prisms, pyramids, andcylinders and for the surface areas of right prisms and cylinders by hav-ing them construct models, measure the dimensions, estimate the areasand volumes, and look for patterns and relationships related to lengths,areas, and volumes. In their work with three-dimensional objects, stu-dents can make use of what they know about two-dimensional shapes.For example, they can relate the surface area of a three-dimensional ob-ject to the area of its two-dimensional net. Students might determinethe surface area of a cylinder by determining the area of its net (thetwo-dimensional figure produced by cutting the cylinder and laying itflat), which consists of a rectangle and two circles (see fig. 6.25). Thus,students can develop a formula for the surface area of a cylinder be-cause they can find the areas of the circles and the rectangle that com-pose its net.
It is important that middle-grades students understand similarity,which is closely related to their more general understanding of propor-tionality and to the idea of correspondence. Students can use measure-ment to explore the meaning of similarity and later to apply the con-cept to solve problems. The important observation that themeasurements of the corresponding angles of similar shapes are equalis often a starting point for work with similarity. Measurement is alsouseful for determining the relationships between the side lengths andthe perimeters and areas of similar shapes and the surface areas andvolumes of similar objects. Students need to understand that theperimeters of pairs of similar shapes are proportional to their corre-sponding side lengths but that their areas are proportional to thesquares of the corresponding side lengths. Similarly, through investiga-tion they should recognize that the surface areas of similar objects areproportional to the squares of the lengths of their corresponding sidesbut that their volumes are proportional to the cubes of those lengths.
Problems that involve constructing or interpreting scale drawingsoffer students opportunities to use and increase their knowledge of sim-ilarity, ratio, and proportionality. Such problems can be created frommany sources, such as maps, blueprints, science, and even literature.For example, in Gulliver’s Travels, a novel by Jonathan Swift, many pas-sages suggest problems related to scaling, similarity, and proportional-ity. Another interesting springboard for such problems is “One InchTall,” a poem by Shel Silverstein (1974) (see fig. 6.26).
245Standards for Grades 6–8: Measurement
Num
ber & O
perations | Algebra | G
eometry | M
easurement | D
ata Analysis &
Probability | P
roblem S
olving | Reasoning &
Proof | C
omm
unication | Connections | R
epresentation
Fig. 6.25.
Students can determine the surfacearea of a cylinder by determining thearea of its net.

246 Principles and Standards for School Mathematics
Rep
rese
ntat
ion
| C
onne
ctio
ns |
Com
mun
icat
ion
| R
easo
ning
& P
roof
| P
robl
em S
olvi
ng |
Dat
a A
naly
sis
& P
roba
bilit
y |
Mea
sure
men
t |
Geo
met
ry |
Alg
ebra
| N
umbe
r &
Ope
ratio
ns
One Inch Tall
If you were only one inch tall, you’d ride a worm to school.The teardrop of a crying ant would be your swimming pool.A crumb of cake would be a feastAnd last you seven days at least,A flea would be a frightening beastIf you were one inch tall.
If you were only one inch tall, you’d walk beneath the door,And it would take about a month to get down to the store.A bit of fluff would be your bed,You’d swing upon a spider’s thread,And wear a thimble on your headIf you were one inch tall.
You’d surf across the kitchen sink upon a stick of gum.You couldn’t hug your mama, you’d just have to hug her thumb.You’d run from people’s feet in fright,To move a pen would take all night,(This poem took fourteen years to write—’Cause I’m just one inch tall).
—Shel Silverstein
Fig. 6.26
“One Inch Tall,” by Shel Silverstein(1974). Used with permission.
In connection with the poem, a teacher could pose a problem like thefollowing:
Use ratios and proportions to help you decide whether the statements inShel Silverstein’s poem are plausible. Imagine that you are the person de-scribed in the poem, and assume that all your body parts changed in pro-portion to the change in your height. Choose one of the following to in-vestigate and write a complete report of your investigation, includingdetails of any measurements you made or calculations you performed:• In the poem the author says that you could ride a worm to school. Is this
statement plausible? Would it be true that you could ride a worm if youwere 1 inch tall? Use the fact that common earthworms are about 5inches long with diameters of about 1/4 inch.
• In the poem the author says that you could wear a thimble on your head.Would this be true if you were only 1 inch tall? Use one of the thimblesin the activity box to help you decide.
To solve this problem, students need to use proportionality to imag-ine a scale model of a student shrunk to a height of 1 inch. They needto consider the resulting circumference of a student’s head or the result-ing length of a student’s legs in relation to the diameter of a cross sec-tion of a worm. Because middle-grades students’ heights vary greatly,scale factors will vary greatly within a class, which can generate a livelydiscussion. A student who is 4 feet 8 inches tall would use a 56:1 ratio asa scale factor; in contrast, a student who is 5 feet tall would use a scalefactor based on a 60:1 ratio. After discussing this problem and pointingout that an author can legitimately use poetic license to create images

that do not conform to reality, a teacher might extend the investigationby asking students to evaluate the plausibility of other statements in thepoem that intrigue them. Alternatively, a teacher might select a state-ment, for example, “And it would take about a month to get down tothe store,” which refers to a rate given as a distance-time relationship.Students could use a stopwatch and a tape measure to get distance-timereadings for a typical student. They could then determine how far awaythe store would need to be in order for the assertion to be plausible,given a proportional change in the rate of walking for a student shrunkto 1 inch.
Students should also have opportunities to consider other kinds ofrates, such as monetary exchange rates, which can afford practice withdecimal computation and experience with ratios and rates expressed assingle numbers. Experience with cost-per-item rates are also valuable;see the examples in the “Problem Solving” and “Algebra” sections inthis chapter.
Teachers can use technological tools such as computer-based labora-tories (CBLs) to expand the set of measurement experiences, especiallythose involving rates and derived measures, and to relate measurementto other topics in the curriculum. For example, using the CBL to mea-sure a student’s distance from an object as she walks away from or to-ward it and plotting the corresponding points on a distance-time graphcan be very instructive. Different paths generate different graphs. Dif-ferent start-end points and variations in speed can also affect the graphs.Students could generate many such graphs with specific kinds of varia-tion and then discuss the graphs to help them relate this experience totheir developing understandings of linear relationships, proportionality,and slopes and rates of change. Questions such as the following might beuseful:
• For which graphs does the relationship between distance and timeappear to be linear? For which is the relationship nonlinear? Why?
• For the graphs that depict a linear relationship, how does the speedat which the person walks appear to affect the graph? Why?
• Which graphs portray a proportional relationship between distanceand time? Are there any graphs that depict proportional relation-ships that are not also linear? Are there any that depict linear rela-tionships that are not also proportional? Why?
• Would it be possible to generate a distance-time graph that depictsa relationship that is linear but not proportional? That is propor-tional but not linear? Why?
A teacher can use such experiences, whether in the mathematics classor in collaboration with a science teacher, not only to enrich students’understanding of topics in measurement but also to provide a spring-board for the study of data representation and analysis.
247Standards for Grades 6–8: Measurement
Num
ber & O
perations | Algebra | G
eometry | M
easurement | D
ata Analysis &
Probability | P
roblem S
olving | Reasoning &
Proof | C
omm
unication | Connections | R
epresentation

In grades 6–8 all students should—
• formulate questions, design studies, and collect data about a characteristicshared by two populations or different characteristics within one population;
• select, create, and use appropriate graphical representations of data,including histograms, box plots, and scatterplots.
• find, use, and interpret measures of center and spread, including mean andinterquartile range;
• discuss and understand the correspondence between data sets and theirgraphical representations, especially histograms, stem-and-leaf plots, boxplots, and scatterplots.
• use observations about differences between two or more samples to makeconjectures about the populations from which the samples were taken;
• make conjectures about possible relationships between two characteristicsof a sample on the basis of scatterplots of the data and approximate linesof fit;
• use conjectures to formulate new questions and plan new studies toanswer them.
• understand and use appropriate terminology to describe complementaryand mutually exclusive events;
• use proportionality and a basic understanding of probability to make andtest conjectures about the results of experiments and simulations;
• compute probabilities for simple compound events, using such methods asorganized lists, tree diagrams, and area models.
Instructional programs fromprekindergarten through grade 12should enable all students to—
Formulate questions that can beaddressed with data and collect, organize, and display relevant datato answer them
Select and use appropriate statisti-cal methods to analyze data
Develop and evaluate inferencesand predictions that are based ondata
Understand and apply basic concepts of probability
6–8Standard
for Grades
Expectations
Data Analysis and Probability
248 Principles and Standards for School Mathematics

Middle-grades studentsshould formulatequestions and designexperiments or surveysto collect relevant data.
Data Analysis and ProbabilityPrior to the middle grades, students should have had experiences col-
lecting, organizing, and representing sets of data. They should be facileboth with representational tools (such as tables, line plots, bar graphs,and line graphs) and with measures of center and spread (such as me-dian, mode, and range). They should have had experience in usingsome methods of analyzing information and answering questions, typi-cally about a single population.
In grades 6–8, teachers should build on this base of experience to helpstudents answer more-complex questions, such as those concerning rela-tionships among populations or samples and those about relationshipsbetween two variables within one population or sample. Toward thisend, new representations should be added to the students’ repertoire.Box plots, for example, allow students to compare two or more samples,such as the heights of students in two different classes. Scatterplots allowstudents to study related pairs of characteristics in one sample, such asheight versus arm span among students in one class. In addition, stu-dents can use and further develop their emerging understanding of pro-portionality in various aspects of their study of data and statistics.
Formulate questions that can be addressed with data andcollect, organize, and display relevant data to answer them
Middle-grades students should formulate questions and design experi-ments or surveys to collect relevant data so that they can compare char-acteristics within a population or between populations. For example, ateacher might ask students to examine how various design characteristicsof a paper airplane—such as its length or the number of paper clips at-tached to its nose—affect the distance it travels and its consistency offlight. Students would then plan experiments in which they collect datathat would allow them to compare the effects of particular design fea-tures. In addition to helping students design their experiments logically,the teacher should help them consider other factors that might affect thedata, such as wind or inconsistencies in launching the planes.
Because laboratory experiments involving data collection are part ofthe middle-grades science curriculum, mathematics teachers may find ituseful to collaborate with science teachers so that they are consistent intheir design of experiments. Such collaboration could be extended sothat students might collect the data for an experiment in science classand analyze it in mathematics class.
In addition to collecting their own data, students should learn to findrelevant data in other resources, such as Web sites or print publications.Consumer Reports, for example, regularly compares the characteristics ofvarious products, such as the quality of peanut butter; the longevity ofrechargeable batteries; or the cost, size, and fuel efficiency of automo-biles. When using data from other sources, students need to determinewhich data are appropriate for their needs, understand how the datawere gathered, and consider limitations that could affect interpretation.
Middle-grades students should learn to use absolute- and relative-frequency bar graphs and histograms to represent the data they collectand to decide which form of representation is appropriate for different
249Standards for Grades 6–8: Data Analysis and Probability
Num
ber & O
perations | Algebra | G
eometry | M
easurement | D
ata Analysis &
Probability | P
roblem S
olving | Reasoning &
Proof | C
omm
unication | Connections | R
epresentation

purposes. For example, suppose students were considering the follow-ing question:
Compare the distance traveled by a paper airplane constructed using onepaper clip with the distance traveled by a plane that is built with two paperclips. Which one travels farther when thrown indoors?
In an experiment conducted to answer this question, one studentmight throw one of the airplanes forty times while team members mea-sure and record the distance traveled each time. The group might laterdo the same for the other paper airplane. The teacher might then havethe students use a relative-frequency histogram to represent the data, asshown in figure 6.27. For comparison, the teacher might suggest thatstudents display both sets of data using box plots, as in figure 6.28.
Select and use appropriate statistical methods toanalyze data
In the middle grades, students should learn to use the mean, and con-tinue to use the median and the mode, to describe the center of a set ofdata. Although the mean often quickly becomes the method of choice
250 Principles and Standards for School Mathematics
Rep
rese
ntat
ion
| C
onne
ctio
ns |
Com
mun
icat
ion
| R
easo
ning
& P
roof
| P
robl
em S
olvi
ng |
Dat
a A
naly
sis
& P
roba
bilit
y |
Mea
sure
men
t |
Geo
met
ry |
Alg
ebra
| N
umbe
r &
Ope
ratio
ns
Fig. 6.27.
A relative-frequency histogram fordata for a paper airplane with one
paper clip
Fig. 6.28.
Box plots for the paper airplane data
Distance Traveled in Feet
Rel
ativ
e F
requ
ency
50%
40%
30%
20%
10%
15 18 21 24 27 30 33
Airplane withone paper clip
Airplane withtwo paper clips
Distance Traveled in Feet
15 16 17 18 19 20 21 22 23 24 25 26 27 28 29 30 31 32 33

The teacher has animportant role inproviding experiencesthat help studentsconstruct a solidunderstanding of themean and its relation toother measures of center.
for students when summarizing a data set, their knack for computing themean does not necessarily correspond to a solid understanding of itsmeaning or purpose (McClain 1999). Students need to understand thatthe mean “evens out” or “balances” a set of data and that the medianidentifies the “middle” of a data set. They should compare the utility ofthe mean and the median as measures of center for different data sets. Asseveral authors have noted (e.g., Uccellini [1996]; Konold [forthcom-ing]), students often fail to apprehend many subtle aspects of the meanas a measure of center. Thus, the teacher has an important role in pro-viding experiences that help students construct a solid understanding ofthe mean and its relation to other measures of center.
Students also need to think about measures of center in relation to thespread of a distribution. In general, the crucial question is, How dochanges in data values affect the mean and median of a set of data? To ex-amine this question, teachers could have students use a calculator to createa table of values and compute the mean and median. Then they couldchange one of the data values in the table and see whether the values ofthe mean and the median are also changed. These relationships can be ef-fectively demonstrated using software through which students can controla data value and observe how the mean and median are affected. For ex-ample, using software that produces line plots for data sets, students couldplot a set of data and mark the mean and median on the line. The studentscould then change one data value and observe how the mean and medianchange. By repeating this process for various data points, they can noticethat changing one data value usually does not affect the median at all, un-less the moved value is at the middle of the data set or moves across themiddle, but that every change in a value affects the mean. Thus, the meanis more likely to be influenced by extreme values, since it is affected by theactual data values, but the median involves only the relative positions ofthe values. Other similar problems can be useful in helping students un-derstand the different sensitivities of the mean and median; for example,the mean is very sensitive to the addition or deletion of one or two ex-treme data points, whereas the median is far less sensitive to such changes.
Students should consider how well different graphs represent importantcharacteristics of data sets. For example, they might notice that it is easierto see symmetry or skewness in a graph than in a table of values. Graphs,however, can lose some of the features of the data, as can be demonstratedby generating a family of histograms for a single set of data, using differentbin sizes: the different histograms may convey different pictures of thesymmetry, skewness, or variability of the data set. Another example is seenwhen comparing a histogram and a box plot for the same data, such asthose for the one-clip plane in figures 6.27 and 6.28. Box plots do not con-vey as much specific information about the data set, such as where clustersoccur, as histograms do. But box plots can provide effective comparisonsbetween two data sets because they make descriptive characteristics suchas median and interquartile range readily apparent.
Develop and evaluate inferences and predictions thatare based on data
In collecting and representing data, students should be driven by adesire to answer questions on the basis of the data. In the process, theyshould make observations, inferences, and conjectures and develop new
251Standards for Grades 6–8: Data Analysis and Probability
Num
ber & O
perations | Algebra | G
eometry | M
easurement | D
ata Analysis &
Probability | P
roblem S
olving | Reasoning &
Proof | C
omm
unication | Connections | R
epresentation
E-example 6.6
Relating Mean and Median

questions. They can use their developing facility with rational numbersand proportionality to refine their observations and conjectures. For ex-ample, when considering the relative-frequency histogram in figure6.27, most students would observe that “the paper plane goes between15 and 21 feet about as often as it goes between 24 and 33 feet,” butsuch an observation is not very precise about the frequency. A teachercould press students to make more-precise statements: “The plane goesbetween 15 and 21 feet about 45 percent of the time.”
Box plots are useful when making comparisons between popula-tions. A teacher might pose the following question about the box plotsin figure 6.28:
From the box plots (in fig. 6.28), which type of plane appears to flyfarther? Which type of plane is more consistent in the distance it flies?
From the relative position of the two graphs, students can infer that thetwo-clip plane generally flies slightly farther than the one-clip plane.Students can answer the second question by using the spreads of thedata portrayed in the box plots to argue that the one-clip plane is morevariable in the distance it travels than the two-clip plane.
Scatterplots are useful for detecting and examining relationships be-tween two characteristics of a population. For example, a teacher mightask students to consider if a relationship exists between the length and thewidth of warblers’ eggs (activity adapted from Encyclopaedia BritannicaEducational Corporation [1998, pp. 104–19]). She might provide the stu-dents with data and ask the students to make a scatterplot in which eachpoint displays the length and the width of an egg, as shown in figure 6.29.Most students will note that the relationship between the length and thewidth of the eggs seems to be direct (or positive); that is, longer eggs alsotend to be wider. Many students will also note that the points on thisscatterplot approximate a straight line, thus suggesting a nearly linear re-lationship between length and width. To make this relationship evenmore apparent, the teacher could have students draw an approximate lineof fit for the data, as has been done in figure 6.29. Students could applytheir developing understanding of the slope of a line to determine that
252 Principles and Standards for School Mathematics
Rep
rese
ntat
ion
| C
onne
ctio
ns |
Com
mun
icat
ion
| R
easo
ning
& P
roof
| P
robl
em S
olvi
ng |
Dat
a A
naly
sis
& P
roba
bilit
y |
Mea
sure
men
t |
Geo
met
ry |
Alg
ebra
| N
umbe
r &
Ope
ratio
ns
Fig. 6.29.
A scatterplot showing the relationshipbetween the length and the width of
warblers’ eggs (Encyclopaedia Britan-nica Educational Corporation 1998,
p. 109)
Length (in Millimeters)
Wid
th (
in M
illim
eter
s)
15
14
13
12
11
1013 14 15 16 17 18 19 20
2 mm
1.5 mm

Scatterplots are usefulfor detecting andexamining relationshipsbetween twocharacteristics of apopulation.
the slope is approximately three-fourths and that therefore the ratio ofthe width to the length of warblers’ eggs is approximately 3:4.
Teachers can also help students learn to use scatterplots to considerthe relationship between two characteristics in different populations.For example, students could measure the height and arm span forgroups of middle school and high school students and then make a scat-terplot in which the points for middle school students are plotted withone color and the points for high school students are plotted with a sec-ond color. Students can make observations about the differences be-tween the two samples, such as that students in the high school sampleare generally taller than those in the middle school sample. They canalso use the plots to examine possible similarities. In particular, if stu-dents draw an approximate line of fit for each set of points, they can de-termine whether the slopes are approximately equal (i.e., the lines areapproximately parallel), which would indicate that the relationship be-tween height and arm span is about the same for both middle schooland high school students.
Because linearity is an important idea in the middle grades, studentsshould encounter many scatterplots that have a nearly linear shape. Butteachers should also have students explore plots that represent nonlin-ear relationships. For example, in connection with their study of geom-etry and measurement, students could measure the lengths of the basesof several similar triangles and use formulas to find their areas or graphpaper to estimate their areas. Creating a scatterplot of the lengths ofthe bases and the areas will make evident the quadratic relationship be-tween length and area in similar figures.
Teachers should encourage students to plot many data sets and lookfor relationships in the plots; computer graphing software and graphingcalculators can be very helpful in this work. Students should see a rangeof examples in which plotting data sets suggests linear relationships,nonlinear relationships, and no apparent relationship at all. When ascatterplot suggests that a relationship exists, teachers should help stu-dents determine the nature of the relationship from the shape and di-rection of the plot. For example, for an apparently linear relationship,students could use their understanding of slope to decide whether therelationship is direct or inverse. Students should discuss what the rela-tionships they have observed might reveal about the sample, and theyshould also discuss whether their conjectures about the sample mightapply to larger populations containing the sample. For example, if asample consists of students from one sixth-grade class in a school, howvalid might the inferences made from the sample be for all sixth gradersin the school? For all middle-grades students in the school? For all sixthgraders in the city? For all sixth graders in the country? Such discus-sions can suggest further studies students might undertake to test thegenerality of their conjectures.
Understand and apply basic concepts of probability Teachers should give middle-grades students numerous opportuni-
ties to engage in probabilistic thinking about simple situations fromwhich students can develop notions of chance. They should use appro-priate terminology in their discussions of chance and use probability to
253Standards for Grades 6–8: Data Analysis and Probability
Num
ber & O
perations | Algebra | G
eometry | M
easurement | D
ata Analysis &
Probability | P
roblem S
olving | Reasoning &
Proof | C
omm
unication | Connections | R
epresentation

make predictions and test conjectures. For example, a teacher mightgive students the following problem:
Suppose you have a box containing 100 slips of paper numbered from 1through 100. If you select one slip of paper at random, what is the proba-bility that the number is a multiple of 5? A multiple of 8? Is not a multipleof 5? Is a multiple of both 5 and 8?
Students should be able to use basic notions of chance and some basicknowledge of number theory to determine the likelihood of selecting anumber that is a multiple of 5 and the likelihood of not selecting a mul-tiple of 5. In order to facilitate classroom discussion, the teacher shouldhelp students learn commonly accepted terminology. For example, stu-dents should know that “selecting a multiple of 5” and “selecting a num-ber that is not a multiple of 5” are complementary events and that because40 is in the set of possible outcomes for both “selecting a multiple of 5”and “selecting a multiple of 8,” they are not mutually exclusive events.
Teachers can help students relate probability to their work with dataanalysis and to proportionality as they reason from relative-frequencyhistograms. For example, referring to the data displayed in figure 6.27,a teacher might pose questions like, How likely is it that the next timeyou throw a one-clip paper airplane, it goes at least 27 feet? No morethan 21 feet?
Although the computation of probabilities can appear to be simplework with fractions, students must grapple with many conceptual chal-lenges in order to understand probability. Misconceptions about proba-bility have been held not only by many students but also by many adults(Konold 1989). To correct misconceptions, it is useful for students tomake predictions and then compare the predictions with actual out-comes.
Computer simulations may help students avoid or overcome erro-neous probabilistic thinking. Simulations afford students access to rela-tively large samples that can be generated quickly and modified easily.Technology can thus facilitate students’ learning of probability in atleast two ways: With large samples, the sample distribution is morelikely to be “close” to the actual population distribution, thus reducingthe likelihood of incorrect inferences based on empirical samples. Witheasily generated samples, students can focus on the analysis of the datarather than be distracted by the demands of data collection. If simula-tions are used, teachers need to help students understand what the sim-ulation data represent and how they relate to the problem situation,such as flipping coins.
Although simulations can be useful, students also need to developtheir probabilistic thinking by frequent experience with actual experi-ments. Many can be quite simple. For example, students could be askedto predict the probability of various outcomes of flipping two coinssixty times. Some students will incorrectly expect that there are threeequally likely outcomes of flipping two coins once: two heads, two tails,and one of each. If so, they may predict that each of these will occurabout twenty times. If groups of students conducted this experiment,they could construct a relative-frequency bar graph from the pooleddata for the entire class. Then they could discuss whether the results ofthe experiment are consistent with their predictions. If students are ac-customed to reasoning from and about data, they will understand that
Computer simulationsmay help students avoid
or overcome erroneousprobabilistic thinking.
254 Principles and Standards for School Mathematics
Rep
rese
ntat
ion
| C
onne
ctio
ns |
Com
mun
icat
ion
| R
easo
ning
& P
roof
| P
robl
em S
olvi
ng |
Dat
a A
naly
sis
& P
roba
bilit
y |
Mea
sure
men
t |
Geo
met
ry |
Alg
ebra
| N
umbe
r &
Ope
ratio
ns

discrepancies between predictions and outcomes from a large and rep-resentative sample must be taken seriously. The detection of discrepan-cies can lead to learning when students turn to classmates and theirteacher for alternative ways to think about the possible results of flip-ping two coins (or other similar compound events). Teachers can thenintroduce students to various methods—organized lists, tree diagrams,and area models—to help them understand and compute the probabili-ties of compound events.
Using a problem like the following, a teacher might assess students’understanding of probability in a manner that includes data analysis andreveals possible misconceptions:
For the one-clip paper airplane, which was flight-tested with the resultsshown in the relative-frequency histogram (in fig. 6.27), what is the proba-bility that exactly one of the next two throws will be a dud (i.e., it willtravel less that 21 feet) and the other will be a success (i.e., it will travel 21feet or more)?
To solve this problem, students would need to understand the data rep-resentation in figure 6.27 and use ratios to estimate that there is about a45 percent chance that a throw will be a dud and about a 55 percentchance that it will be a success. Then they would need to use somemethod for handling the compound event and deal with the fact thatthere are two ways it might occur. Students who understand all that isrequired might produce a tree diagram like the one in figure 6.30 toshow that the total probability is 198/400, or .495, since each of the twopossibilities—“dud first, then success” and “success first, then dud”—has a probability of 99/400.
255Standards for Grades 6–8: Data Analysis and Probability
Num
ber & O
perations | Algebra | G
eometry | M
easurement | D
ata Analysis &
Probability | P
roblem S
olving | Reasoning &
Proof | C
omm
unication | Connections | R
epresentation
Fig. 6.30.
A tree diagram for determining theprobability of a compound event,given sample data
First throw Second throw
less than 21 feet9
201120
99400
99400
99400
198.495
400
× =
= =+
1120
920
99400
× =21 feet or more
less than 21 feet
21 feet or more
less than 21 feet
21 feet or more
1120
1120
1120
920
920
920

Through problem solving, students can experience the power andutility of mathematics. Problem solving is central to inquiry and appli-cation and should be interwoven throughout the mathematics curricu-lum to provide a context for learning and applying mathematical ideas.Middle-grades students whose curriculum is based on the Standards inthis document will benefit from frequent opportunities for both inde-pendent and collaborative problem-solving experiences. They will en-gage profitably in complex investigations, perhaps occasionally workingfor several days on a single problem and its extensions.
What should problem solving look like in grades 6through 8?
Problem solving in grades 6–8 should promote mathematical learn-ing. Students can learn about, and deepen their understanding of,mathematical concepts by working through carefully selected problemsthat allow applications of mathematics to other contexts. Many interest-ing problems can be suggested by everyday experiences, such as readingliterature or using cellular telephones, in-line skates, kites, and paperairplanes.
Instruction in grades 6–8 should take advantage of the expandingmathematical capabilities of students to include more-complex prob-lems that integrate such topics as probability, statistics, geometry, andrational numbers. Situations and approaches should build on and ex-tend the mathematical understanding, skills, and language that studentshave acquired.
Well-chosen problems can be particularly valuable in developing ordeepening students’ understanding of important mathematical ideas. Con-sider the following problem that might be used by a teacher who wantsher students to think about various ways to use ratios and proportions:
A baseball team won 48 of its first 80 games. How many of its next 50games must the team win in order to maintain the ratio of wins to losses?
Students can solve this problem in many ways. One student might ex-press the ratio of wins in the first 80 games as 48/80 and note that theratio is a little more than one-half; that is, the team wins a little morethan half the time. She might then estimate that in the next 50 games
6–8Standard
for Grades
Problem Solving
Instructional programs fromprekindergarten through grade 12should enable all students to—
Build new mathematical knowledgethrough problem solving
Solve problems that arise in mathe-matics and in other contexts
Apply and adapt a variety of appro-priate strategies to solve problems
Monitor and reflect on the processof mathematical problem solving
256 Principles and Standards for School Mathematics
Well-chosen problemscan be particularlyvaluable in developingor deepening students’understanding ofimportant mathematicalideas.
the team should win about 28 games. She could compare the resultingratio of 28/50 to the given ratio of 48/80 and adjust her estimate untilthe two ratios are equivalent. Another student might look at the ratioof wins to losses, 48:32, and simplify it to 3:2. Restating this result as“3 wins in every 5 games” and noting that there are 10 sets of 5 gamesin the 50 games to be played, he could conclude that 30 games is thesolution. Yet another student might use a proportion, 48/80 = x/50, tofind the solution. A fourth student might use percents or decimals (asnewspapers do when reporting the “standings” of baseball teams). Thisstudent might divide 48 by 80 and represent the ratio as 60 percentand then find 60 percent of 50 games, or represent it as 0.600 and mul-tiply by 50, to determine that 30 games must be won to maintain thesuccess rate. Such problems help students develop and use a variety ofproblem-solving strategies and approaches, and sharing these methodswithin the classroom affords students opportunities to assess thestrengths and limitations of alternative approaches to considering them.
After students have had similar experiences with ratios, rates, andproportions in grades 6 and 7, a teacher who wanted to extend anddeepen her eighth-grade students’ understanding of the topics mightuse a problem like the following:
Over the past few weeks, the American Movie Corporation has introducedtwo new kinds of candy at the concession stands in movie theaters in town.For three weeks, two theaters have offered Apple Banana Chews. For twoweeks, five other theaters sold Mango Orange Nips. Only one of the twotypes of candy was sold at each theater, and all the theaters showed thesame movies and had roughly the same attendance each week during theintroductory period. During that period, 660 boxes of Apple BananaChews and 800 boxes of Mango Orange Nips were sold. Suppose you havebeen hired by the company to help them determine which candy sold bet-ter. Use the information to decide which type of candy was more popular,and carefully and completely explain the basis for your answer.
This problem can help students see the need to go beyond superficialapproaches and to dig deeply into their understanding of ratios andrates. For some students, an initial response will be that Mango OrangeNips (MONs) were more popular because more were sold. In an earlyclass discussion, other students might point out to them that such a di-rect comparison is misleading because the two types of candy were soldat different numbers of theaters and for different amounts of time. Fromthis discussion, a need to probe more deeply into the relationships in theproblem will be apparent. Students are likely next to consider ratios orrates, which they have learned to use to express quantitative relation-ships. By inviting individuals or groups of students to present possiblesolutions, the teacher can initiate a lively discussion of competing ap-proaches and arguments. Some students will consider the average num-ber of candies sold for each theater—330 boxes of ABCs (Apple BananaChews) per theater versus 160 boxes of MONs per theater—and con-clude that ABCs were more popular. Other students will consider a dif-ferent rate, namely, the average number of candies sold each week—220boxes of ABCs per week versus 400 boxes of MONs per week—and con-clude that MONs were more popular. Because each of these answers isdifferent and seems to be based on a sensible approach, neither answercan be argued to be “better” than the other. So students can see thatthey must go beyond these simple rates to answer the question. The
257Standards for Grades 6–8: Problem Solving
Num
ber & O
perations | Algebra | G
eometry | M
easurement | D
ata Analysis &
Probability | P
roblem S
olving | Reasoning &
Proof | C
omm
unication | Connections | R
epresentation

teacher can then help them develop a more complex rate—the averagenumber of boxes of candy per theater per week—that incorporates allthe information in the problem and yields a defensible solution: the ratesare 110 for ABCs and 80 for MONs, so ABCs are the better sellers.
Teachers should regularly ask students to formulate interesting prob-lems based on a wide variety of situations, both within and outside mathe-matics. Teachers should also give students frequent opportunities to ex-plain their problem-solving strategies and solutions and to seek generalmethods that apply to many problem settings. These experiences shouldengender in students important problem-solving dispositions—an orienta-tion toward problem finding and problem posing; an interest in, and ca-pacity for, explaining and generalizing; and a propensity for reflecting ontheir work and monitoring their solutions. They should be expected to ex-plain their ideas and solutions in words first, and then teachers can helpthem learn to use conventional mathematical symbols or their own formsof representations, as appropriate, to convey their thinking.
The availability of technology—in the form of computers and scien-tific or graphing calculators—allows middle-grades students to dealwith “messy,” complex problems. The technology can alleviate much ofthe drudgery that until recently often constrained middle-schoolmathematics to using only problems with “nice numbers.” Computers,calculators, and electronic data-gathering devices, such as calculator-based laboratories (CBLs) or rangers (CBRs), offer means of gatheringor analyzing data that in years past might have been considered tootroublesome to deal with. Similarly, classroom Internet connectionsmake it possible for students to find information for use in posing andsolving a wide variety of problems. For example, students might be in-terested in investigating whether it is cost-effective to recycle aluminumcans at their school, or they might explore weather patterns in differentregions. Graphing calculators and easy-to-use computer software en-able students to move between different representations of data and tocompute with large quantities of data and with messy numbers, bothlarge and small, with relative ease. As a result, problems in the middlegrades can and should respond to students’ questions and engage theirinterests.
What should be the teacher’s role in developingproblem solving in grades 6 through 8?
Students’ learning about and through problem solving and their dis-positions toward mathematics are shaped by teachers’ instructional de-cisions and actions. Teachers can make problem solving an integral partof the class’s mathematical activity by choosing interesting problemsthat incorporate important mathematical ideas from the curriculum. Tohelp students develop a problem-solving orientation, teachers can allowthem to choose or create some of the problems to be solved. Teacherscan help build students’ problem-analysis skills by including tasks thathave extraneous information or insufficient information. And they canchallenge students with problems that have more than one answer, suchas the following (adapted from Gelfand and Shen [1993], p. 3):
Make a sum of 1000, using some eights (8s) with some plus signs (+s)inserted.
Problems in the middlegrades can and should
respond to students’questions and engage
their interests.
258 Principles and Standards for School Mathematics
Rep
rese
ntat
ion
| C
onne
ctio
ns |
Com
mun
icat
ion
| R
easo
ning
& P
roof
| P
robl
em S
olvi
ng |
Dat
a A
naly
sis
& P
roba
bilit
y |
Mea
sure
men
t |
Geo
met
ry |
Alg
ebra
| N
umbe
r &
Ope
ratio
ns
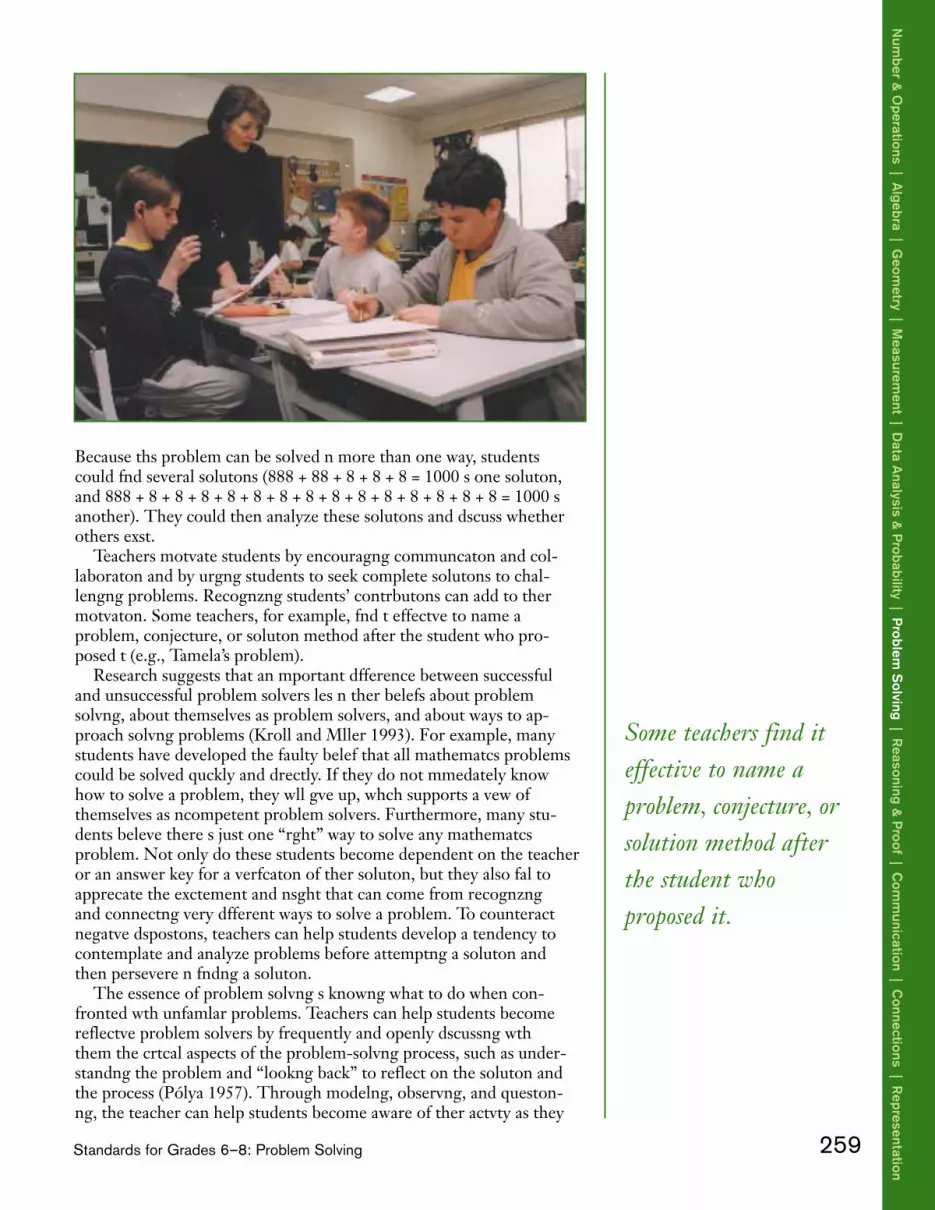
Some teachers find iteffective to name aproblem, conjecture, orsolution method afterthe student whoproposed it.
Because this problem can be solved in more than one way, studentscould find several solutions (888 + 88 + 8 + 8 + 8 = 1000 is one solution,and 888 + 8 + 8 + 8 + 8 + 8 + 8 + 8 + 8 + 8 + 8 + 8 + 8 + 8 + 8 = 1000 isanother). They could then analyze these solutions and discuss whetherothers exist.
Teachers motivate students by encouraging communication and col-laboration and by urging students to seek complete solutions to chal-lenging problems. Recognizing students’ contributions can add to theirmotivation. Some teachers, for example, find it effective to name aproblem, conjecture, or solution method after the student who pro-posed it (e.g., Tamela’s problem).
Research suggests that an important difference between successfuland unsuccessful problem solvers lies in their beliefs about problemsolving, about themselves as problem solvers, and about ways to ap-proach solving problems (Kroll and Miller 1993). For example, manystudents have developed the faulty belief that all mathematics problemscould be solved quickly and directly. If they do not immediately knowhow to solve a problem, they will give up, which supports a view ofthemselves as incompetent problem solvers. Furthermore, many stu-dents believe there is just one “right” way to solve any mathematicsproblem. Not only do these students become dependent on the teacheror an answer key for a verification of their solution, but they also fail toappreciate the excitement and insight that can come from recognizingand connecting very different ways to solve a problem. To counteractnegative dispositions, teachers can help students develop a tendency tocontemplate and analyze problems before attempting a solution andthen persevere in finding a solution.
The essence of problem solving is knowing what to do when con-fronted with unfamiliar problems. Teachers can help students becomereflective problem solvers by frequently and openly discussing withthem the critical aspects of the problem-solving process, such as under-standing the problem and “looking back” to reflect on the solution andthe process (Pólya 1957). Through modeling, observing, and question-ing, the teacher can help students become aware of their activity as they
259Standards for Grades 6–8: Problem Solving
Num
ber & O
perations | Algebra | G
eometry | M
easurement | D
ata Analysis &
Probability | P
roblem S
olving | Reasoning &
Proof | C
omm
unication | Connections | R
epresentation

solve problems. For example, consider how the following problemmight be used to develop students’ skill in problem solving (Schroederand Lester 1989, p. 40):
On centimeter graph paper outline all the shapes that have an area of 14square cm and a perimeter of 24 cm. For each shape you draw, at least oneside of each square must share a side with another square.
Students may initially assume that the shapes referred to are rectan-gles. Under that assumption, students can discover that the problemhas no solution. A teacher might allow this line of thinking to surfaceearly so that it can be addressed. Once students understand that shapesother than rectangles are possible, they might approach the problemby experimenting with a few shapes, using graph paper or 14 squarecutouts. If students do not begin to recognize that haphazard experi-mentation is not likely to produce a complete solution, questioning bythe teacher might help them. The teacher can help students develop asystematic way to keep track of the shapes that have been tried. Theteacher can also ask provocative questions that encourage students tofind all possibilities: What makes two shapes “different”? Are shapesdifferent if one is a flip of the other? What strategies can be used tocreate new shapes from old ones in a way that preserves both the areaand the perimeter? In this problem, students draw on their knowledgeof various of geometric ideas, such as area, perimeter, and congruenceand transformations that preserve area and perimeter. Moreover, theyengage in a process that is applicable to a wide variety of problems:gradually understanding a problem more deeply and then working sys-tematically to determine all possible solutions. As research has shown,effective problem solvers move flexibly among aspects of the problem-solving process as they work through a problem (Kroll and Miller1993).
Although it is not the main focus of problem solving in the middlegrades, learning about problem solving helps students become familiarwith a number of problem-solving heuristics, such as looking for pat-terns, solving a simpler problem, making a table, and working back-ward. These general strategies are useful when no known approach to aproblem is readily apparent. These processes may have been used in theelementary grades, but middle-grades students need additional experi-ence and instruction in which they consider how to use these strategiesappropriately and effectively.
Students also should be encouraged to monitor and assess them-selves. Good problem solvers realize what they know and don’t know,what they are good at and not so good at; as a result they can use theirtime and energy wisely. They plan more carefully and more effectivelyand take time to check their progress periodically. These habits of mindare important not only in making students better problem solvers butalso in helping students become better learners of mathematics.
For several reasons, students should reflect on their problem solvingand consider how it might be modified, elaborated, streamlined, orclarified: Through guided reflection, students can focus on the mathe-matics involved in solving a problem, thus solidifying their understand-ing of the concepts involved. They can learn how to generalize and ex-tend problems, leading to an understanding of some of the structureunderlying mathematics. Students should understand that the problem-
Students should reflecton their problem solving
and consider how itmight be modified,
elaborated, streamlined,or clarified.
260 Principles and Standards for School Mathematics
Rep
rese
ntat
ion
| C
onne
ctio
ns |
Com
mun
icat
ion
| R
easo
ning
& P
roof
| P
robl
em S
olvi
ng |
Dat
a A
naly
sis
& P
roba
bilit
y |
Mea
sure
men
t |
Geo
met
ry |
Alg
ebra
| N
umbe
r &
Ope
ratio
ns

solving process is not finished until they have looked back at their solu-tion and reviewed their process.
An important aspect of a problem-solving orientation toward mathe-matics is making and examining conjectures raised by solving a problemand posing follow-up questions. For example, according to thePythagorean relationship, if squares are built on the legs and the hy-potenuse of any right triangle, then the areas of the squares on the legswill together sum to the area of the square on the hypotenuse. Thiswell-known relationship, summarized with the formula a2 + b2 = c2,where a and b are the lengths of the triangle’s legs and c is the length ofits hypotenuse, is used frequently to solve numerical and algebraicproblems. It can be the source of much interesting problem posing andgeneralization for middle-grades students. A teacher might orchestratea discussion in which students pose a variety of “what if ” questionsabout variants and extensions of the Pythagorean relation (Brown andWalter 1983), for example, Would the area relationship hold if we builtsomething other than squares on the sides of right triangles, say forequilateral triangles? Or regular hexagons? Or semicircles? Will theareas still sum in the same way? Such conjectures can easily be exam-ined by using interactive geometry software, which can also facilitatestudents’ search for a counterexample to disprove a conjecture. Al-though formal proof of a generalization of the Pythagorean relationshipmay be beyond the reach of most students in the middle grades, somestudents might be able to use their developing understanding of pro-portionality and similarity to argue that the generalization holds be-cause the areas of similar figures are proportional to the square of thelengths of their corresponding sides.
By reflecting on their solutions, such as in this extension of thePythagorean relationship, students use a variety of mathematical skills,develop a deeper insight into the structure of mathematics, and gain adisposition toward generalizing. The teacher can ensure that classroomdiscussion continues until several solution paths have been considered,discussed, understood, and evaluated. It should become second naturefor students to talk about connections among problems; to propose, cri-tique, and value alternative approaches to solving problems; and to beadept in explaining their approaches.
261Standards for Grades 6–8: Problem Solving
Num
ber & O
perations | Algebra | G
eometry | M
easurement | D
ata Analysis &
Probability | P
roblem S
olving | Reasoning &
Proof | C
omm
unication | Connections | R
epresentation

Reasoning is an integral part of doing mathematics. Students shouldenter the middle grades with the view that mathematics involves exam-ining patterns and noting regularities, making conjectures about possi-ble generalizations, and evaluating the conjectures. In grades 6–8 stu-dents should sharpen and extend their reasoning skills by deepeningtheir evaluations of their assertions and conjectures and using inductiveand deductive reasoning to formulate mathematical arguments. Theyshould expand the audience for their mathematical arguments beyondtheir teacher and their classmates. They need to develop compelling ar-guments with enough evidence to convince someone who is not part oftheir own learning community.
What should reasoning and proof look like in grades 6through 8?
In the middle grades, students should have frequent and diverse ex-periences with mathematics reasoning as they—
• examine patterns and structures to detect regularities; • formulate generalizations and conjectures about observed regularities;• evaluate conjectures;• construct and evaluate mathematical arguments.
Students should discuss their reasoning on a regular basis with theteacher and with one another, explaining the basis for their conjecturesand the rationale for their mathematical assertions. Through these ex-periences, students should become more proficient in using inductiveand deductive reasoning appropriately.
Students can use inductive reasoning to search for mathematical rela-tionships through the study of patterns. Consider an example from aclassroom in which rising seventh-grade students were studying figu-rate numbers (drawn from classroom observation and partially de-scribed in Malloy [1997]).
The teacher began by explaining triangular numbers and then askedthe students to generate representations for the first five triangularnumbers. The students visualized the structure of the numbers to
6–8Standard
for Grades
Reasoning and Proof
Instructional programs fromprekindergarten through grade 12should enable all students to—
Recognize reasoning and proof asfundamental aspects of mathematics
Make and investigate mathematicalconjectures
Develop and evaluate mathematicalarguments and proofs
Select and use various types ofreasoning and methods of proof
262 Principles and Standards for School Mathematics

draw successive dot triangles, each time adding at the bottom arow containing one more dot than the bottom row in the previoustriangle (see fig. 6.31). Next the teacher asked the students to pre-dict (without drawing) how many dots would be needed for thenext triangular number. Reflecting on what they had done to gen-erate the sequence thus far, they quickly concluded that the sixthtriangular number would have six more dots than the fifth trian-gular number. These students were engaged in recursive reason-ing about the structure of this sequence of numbers, using thejust-formed number to generate the next number. This approachwas repeated for several more “next” numbers in the sequence,and it worked well.
The teacher then asked the students to find the 100th term in thesequence. Most students knew that the value of the 100th term is100 more than the value of the 99th term, but because they did notalready know the value of the 99th term, they were not able to findthe answer quickly. The teacher suggested that they make a chart torecord their observations about triangular numbers and to look fora pattern or a relationship to help them find the 100th triangularnumber. The students began with a display that reflected what theyhad already observed (see fig. 6.32). They examined the display foradditional patterns. Tamika commented that she thought there wasa pattern relating the differences and the numbers. She explainedthat if the consecutive differences are multiplied, the product istwice the number that is “between” them in the display; for exam-ple, the product of 4 and 5 is twice as large as 10.
The teacher asked the students to check to see if Tamika’s observa-tion was true for other numbers in the display. After they verifiedthe observation, the teacher asked them to use this method to findthe next triangular number. Some students were unable to see howit could be done, but Curtis used Tamika’s observation as follows:“Using Tamika’s method, the seventh number is (7)(8)/2, which is28.” Several students checked this answer by using the recursive
263Standards for Grades 6–8: Reasoning and Proof
Num
ber & O
perations | Algebra | G
eometry | M
easurement | D
ata Analysis &
Probability | P
roblem S
olving | Reasoning &
Proof | C
omm
unication | Connections | R
epresentation
Fig. 6.31.
First five triangular numbers
Fig. 6.32.Triangular numbers
First Second Third Fourth Fifth
Term First Second Third Fourth Fifth Sixth
Number 1 3 6 10 15 21
Difference 2 3 4 5 6

method of adding 7 to the sixth triangular number to find the sev-enth triangular number (21 + 7 = 28). The teacher then asked thestudents to check Tamika’s method for the next few triangularnumbers to verify that it worked in those instances. She next askedif Tamika’s method could be used to find the 100th triangular num-ber. Darnell said, “If Tamika is right, the hundredth triangularnumber should be (100)(101)/2.”In general, the students agreed that the method of multiplying anddividing by 2 was useful because it seemed to work and because itdid not require knowing the nth term in order to find the (n + 1)thterm. However, some students were not convinced that the methodwas correct. It lacked the intuitive appeal of the recursive methodthey used first, and it did not appear to have a mathematical basis.The teacher decided that it was worth additional class time to de-velop a mathematical argument to support Tamika’s method. Shebegan by asking students to notice that each triangular number isthe sum of consecutive whole numbers, which they readily sawfrom the dot triangles. Then the teacher demonstrated Gauss’smethod for finding the sum of consecutive whole numbers, apply-ing it to the first seven whole numbers. She asked the students toadd the numbers from 1 to 7 to those in the reversed sequence, 7to 1, as shown in figure 6.33, to see that the seventh triangularnumber—1 + 2 + 3 + 4 + 5 + 6 + 7— could also be expressed as(7)(8)/2. After the students completed this exercise, the teacherasked them to express the general relationship in words. Theystruggled, but they came up with this general rule: If you want tofind a particular triangular number, you multiply your number bythe next number and divide by 2. The students wrote the rule thisway: (number)(number + 1)/2.
The example illustrates what reasoning and proof can look like in themiddle grades. Although mathematical argument at this level lacks theformalism and rigor often associated with mathematical proof, it sharesmany of its important features, including formulating a plausible con-jecture, testing the conjecture, and displaying the associated reasoningfor evaluation by others. The teacher and students used inductive rea-soning to reach a generalization. They noted regularities in a pattern(growth of triangular numbers), formulated a conjecture about the reg-ularities (Tamika’s rule), and developed and discussed a convincing ar-gument about the truth of the conjecture.
Middle-grades students can develop arguments to support theirconclusions in varied topics, such as number theory, properties of geo-metric shapes, and probability. For example, students who encounter therules of divisibility by 2 and by 3 in number theory know that even num-bers are divisible by 2 and numbers whose digits add to a number
264 Principles and Standards for School Mathematics
Rep
rese
ntat
ion
| C
onne
ctio
ns |
Com
mun
icat
ion
| R
easo
ning
& P
roof
| P
robl
em S
olvi
ng |
Dat
a A
naly
sis
& P
roba
bilit
y |
Mea
sure
men
t |
Geo
met
ry |
Alg
ebra
| N
umbe
r &
Ope
ratio
ns
Fig. 6.33.
Gauss’s method—the sum of the firstseven counting numbers
Students can see that the sums of the pairsof addends can be represented as 7 × 8, or 56.
Because each number is listed twice, they divide56 by 2, resulting in (7)(8)/2 = 56/2 = 28.

Students need to knowthe limitations ofinductive reasoning aswell as its possibilities.
divisible by 3 are divisible by 3. A teacher might ask students toformulate a rule for divisibility by 6 and develop arguments to supporttheir rule.
Some students might begin by listing some multiples of 6: 12, 18, 24,and 30. They could examine the numbers and try to detect patterns re-sembling those in other rules they have learned. Students might ob-serve that all the numbers are even, which allows them to infer divisibil-ity by 2. They could also look at the sums of the digits of the multiplesand notice that the sums of the digits are all divisible by 3, just as in thetest for divisibility by 3. Noting that 2 • 3 = 6, they might conclude thatif the number is divisible both by 2 and by 3, then it must be divisibleby 6, which might lead them to form the following conjecture for de-termining whether a number is divisible by 6: Check to see if the num-ber is even and if the sum of its digits is divisible by 3.
The teacher should also challenge students to consider possible limi-tations of their reasoning. For example, she could ask them to use 12 asan example to consider whether it is always true that the product of twofactors of a number is itself a factor of that number. The studentsshould note that although 6 and 4 are both factors of 12, 6 • 4 is not. Inthis way, the teacher can help students become appropriately cautiousin making inferences about divisibility on the basis of factors. Such anexploration should lead to the correct generalization that combiningcriteria for divisibility, which worked with divisibility by 6, works onlywhen the two factors are relatively prime.
What should be the teacher’s role in developingreasoning and proof in grades 6 through 8?
Teachers in the middle grades can help students appreciate and usethe power of mathematical reasoning by regularly engaging students inthinking and reasoning in the classroom. Fostering a mathematicallythoughtful environment is vital to supporting the development of stu-dents’ facility with mathematical reasoning.
The teacher plays an important role by creating or selecting tasksthat are appropriate to the ages and interests of middle-grades studentsand that call for reasoning to investigate mathematical relationships.Tasks that require the generation and organization of data to make, val-idate, or refute a conjecture are often appropriate. For example, the ex-amination of patterns associated with figurate numbers discussed aboveshows how a teacher can use the task both to stimulate student investi-gation and to develop facility with mathematical reasoning and argu-mentation. Suitable tasks can arise in everyday life, although many willarise within mathematics itself.
Teachers also serve as monitors of students’ developing facility withreasoning. In order to use inductive reasoning appropriately, studentsneed to know its limitations as well as its possibilities. Because many el-ementary and middle-grades tasks rely on inductive reasoning, teachersshould be aware that students might develop an incorrect expectationthat patterns always generalize in ways that would be expected on thebasis of the regularities found in the first few terms. The following hy-pothetical example shows how a teacher could help students develop ahealthy appreciation for the power and limits of inductive reasoning.
265Standards for Grades 6–8: Reasoning and Proof
Num
ber & O
perations | Algebra | G
eometry | M
easurement | D
ata Analysis &
Probability | P
roblem S
olving | Reasoning &
Proof | C
omm
unication | Connections | R
epresentation

A teacher asks students to determine how many segments of differ-ent lengths can be made by connecting pegs on a square geoboardthat is 5 units on each side (a 5 × 5 square geoboard). Because thenumber of segments is large and some students will have difficultybeing systematic in representing the segments on their geoboards,the teacher encourages the students to examine simpler cases to de-velop a systematic way to generate the different segments. The stu-dents approach this task by examining the number of segments onvarious subsquares on a 5 × 5 geoboard, looking at the growthfrom a 1 × 1 square to a 4 × 4 square, as shown in figure 6.34.
The teacher helps the students see that each successive square con-tains the previous square within it. Thus, the number of segmentson a 3 × 3 square can be found by adding the number of segmentsfound on a 2 × 2 square to the number of new segments that can becreated using the “new” pegs within the 3 × 3 square. The teacherhas the students verify—by direct measurement or by treating thediagonal lengths as hypotenuses of right triangles—that all seg-ments are really of different lengths. The students then record thenumber of segments of different lengths in each square and notethe pattern of growth, as shown in figure 6.35.
The teacher orchestrates a class discussion about the numbers inthe table. Most students quickly detect a pattern of growth and areprepared to predict the answer for a 5 × 5 geoboard—20 differentsegments—because (2 + 3 + 4 + 5) + 6 = 14 + 6 = 20. In fact, manystudents are prepared to state a more general conjecture: Thenumber of segments for an N × N square geoboard is the sum2 + 3 + … + (N + 1).
266 Principles and Standards for School Mathematics
Rep
rese
ntat
ion
| C
onne
ctio
ns |
Com
mun
icat
ion
| R
easo
ning
& P
roof
| P
robl
em S
olvi
ng |
Dat
a A
naly
sis
& P
roba
bilit
y |
Mea
sure
men
t |
Geo
met
ry |
Alg
ebra
| N
umbe
r &
Ope
ratio
ns
Fig. 6.34.
Segments of different lengths on ageoboard
Fig. 6.35.
Students can record in a table likethis one data about the number ofsegments of different lengths on a
geoboard.
1 × 1 2 × 2 3 × 3 4 × 4
Size of Number of Segments of Total Number ofSquare Different Lengths: Old + New Different Lengths
1 × 1 2 2
2 × 2 2 + 3 5
3 × 3 (2 + 3) + 4 9
4 × 4 (2 + 3 + 4) + 5 14
5 × 5 ? ?

After the students have made their prediction, the teacher asksthem to check its accuracy by actually making all the possible seg-ments of different lengths on a 5 × 5 geoboard, as in figure 6.36.Because of their prior experience in systematically generating allpossible segments, most of the students are able to find all the pos-sibilities. In fact, most recognize that they need only to count the“new” segments and check to be sure that the segments are of dif-ferent lengths from one another and from the segments alreadycounted in the previous cases. The students note that there aretwenty segments, as predicted, and most are content with the ob-servation that all the new segments are of different lengths. Butsome students discover that two segments—AB and CD in figure6.36—are both five units long. Thus, there are only nineteendifferent lengths, rather than twenty as predicted. Most of the stu-dents are surprised at this result, although they recognize that it iscorrect.
A teacher can use an example such as this as a powerful reminder thatstudents should be cautious when generalizing inductively from a smallnumber of cases, because not all patterns generalize in ways that wemight wish or expect from early observations. This important lesson al-lows students to develop a healthy skepticism in their work with pat-terns and generalization.
Teachers need to monitor students’ developing facility not only withinductive reasoning but also with deductive reasoning. In the middlegrades, students begin to consider assertions such as the following: Thediagonals of any given rectangle are equal in length. (See the “Geometry”section of this chapter for more discussion of how this assertion might begenerated and verified by students.) An assertion such as this is tricky, atleast in part because it is an implicitly conditional statement: If a shape isa rectangle, then its diagonals are equal in length. Thus, it is probably notsurprising that some students will misapply this idea by inferring that anyquadrilateral with diagonals of equal length must be a rectangle. Doingso reflects the erroneous view that if a statement is true then its converseis true. In this instance, the converse is not true because nonrectangularisosceles trapezoids also have diagonals of equal length, as do many otherquadrilaterals.
Teachers in the middle grades need to be mindful of complexities inlogical thinking and be alert in order to help students reason correctly.In this example, a teacher might have students use dynamic geometrysoftware to investigate which types of quadrilaterals have diagonals ofequal length. The software could allow students to see changes in thelengths of the diagonals instantly as they change the shape of thequadrilateral. A teacher might have students investigate quadrilateralsin general and particular types of quadrilaterals, including rectangles,squares, parallelograms, rhombuses, and trapezoids. The teacher mightask students to note which shapes have diagonals of equal length. If noone found such a shape, the teacher could ask them to construct anisosceles trapezoid with a given set of vertices, and the students wouldthen see that this trapezoid has diagonals of equal length. This type ofinvestigation can lead students to understand that even when a state-ment is true, its converse may be false.
267Standards for Grades 6–8: Reasoning and Proof
Num
ber & O
perations | Algebra | G
eometry | M
easurement | D
ata Analysis &
Probability | P
roblem S
olving | Reasoning &
Proof | C
omm
unication | Connections | R
epresentation
Fig. 6.36.
Line segments on a 5 × 5 geoboard
A
B
C
D

In classrooms where students are challenged to think and reasonabout mathematics, communication is an essential feature as studentsexpress the results of their thinking orally and in writing. This type ofenvironment is desirable at all grade levels, but there are a few distinc-tive features of such classrooms in the middle grades. For example, themathematics under discussion in grades 6–8 is generally more complexand perhaps more abstract than the mathematics in the lower grades.
A second distinctive feature relates to the norms for evaluating thethinking of members of a classroom learning community. When studentsin grades 6–8 explain their thinking, they can be held to standards thatare more stringent than would likely be applied to younger students,though not as demanding as might be applied in high school. Each stu-dent should be expected not only to present and explain the strategy heor she used to solve a problem but also to analyze, compare, and contrastthe meaningfulness, efficiency, and elegance of a variety of strategies. Ex-planations should include mathematical arguments and rationales, notjust procedural descriptions or summaries (Yackel and Cobb 1996).
A third distinguishing feature pertains to the social norms in amiddle-grades classroom rather than to the content of the students’discussions. During adolescence, students are often reluctant to doanything that causes them to stand out from the group, and many mid-dle-grades students are self-conscious and hesitant to expose theirthinking to others. Peer pressure is powerful, and a desire to fit in isparamount. Teachers should build a sense of community in middle-grades classrooms so students feel free to express their ideas honestlyand openly, without fear of ridicule.
What should communication look like in grades 6through 8?
Consider an extended example (adapted from Silver and Smith[1997]) of mathematical communication in a middle-grades classroom.
The students began by working collaboratively in pairs to solve thefollowing problem, adapted from Bennett, Maier, and Nelson (1998):
A certain rectangle has length and width that are whole numbers ofinches, and the ratio of its length to its width is 4 to 3. Its area is 300square inches. What are its length and width?
6–8Standard
for Grades
Communication
Instructional programs fromprekindergarten through grade 12should enable all students to—
Organize and consolidate theirmathematical thinking throughcommunication
Communicate their mathematicalthinking coherently and clearly topeers, teachers, and others
Analyze and evaluate the mathe-matical thinking and strategies ofothers
Use the language of mathematicsto express mathematical ideas precisely
268 Principles and Standards for School Mathematics

Teachers should build asense of community inmiddle-grades classroomsso students feel free toexpress their ideashonestly and openly,without fear of ridicule.
As the students worked on the problem, the teacher circulatedaround the room, monitoring the work of the pairs and respondingto their questions. She also noted different approaches that wereused by the students and made decisions about which students shewould ask to present solutions.After most students had a chance to solve the problem, the teacherasked Lee and Randy to present their method. They proceeded tothe overhead projector to explain their work. After briefly restatingthe problem, Lee indicated that 3 times 4 is equal to 12 and thatthey needed “a number that both 3 and 4 would go into.” Theteacher asked why they had multiplied 3 by 4. Randy replied thatthe ratio of the length to the width was given as “4 to 3” in theproblem. Lee went on to say that they had determined that “3 goesinto 15 five times and that 4 goes into 20 five times.” Since 15times 20 is equal to 300, the area of the given rectangle, they con-cluded that 15 inches and 20 inches were the width and length ofthe rectangle.The teacher asked if there were questions for Lee or Randy. Echo-ing the teacher’s query during the presentation of the solution, Ty-ronne said that he did not understand their solution, particularlywhere the 12 had come from and how they knew it would helpsolve the problem. Neither Lee nor Randy was able to explain whythey had multiplied 3 by 4 or how the result was connected to theirsolution. The teacher then indicated that she also wondered howthey had obtained the 15 and the 20. The boys reiterated that theyhad been looking for a number “that both 3 and 4 went into.” Inreply, Darryl asked how the boys had obtained the number 5. Leeand Randy responded that 5 was what “3 and 4 go into.” At thispoint, Keisha said “Did you guys just guess and check?” Lee andRandy responded in unison, “Yeah!” Although Lee and Randy’sfinal answer was correct and although it contained a kernel of goodmathematical insight, their explanation of their solution methodleft other students confused.To address the confusion generated by Lee and Randy, the teacherdecided to solicit another solution. Because the teacher had seenRachel and Keisha use a different method, she asked them to ex-plain their approach. Keisha made a sketch of a rectangle, labelingthe length 4 and the width 3. She explained that the 4 and 3 werenot really the length and width of the rectangle but that the num-bers helped remind her about the ratio. Then Rachel explained thatshe could imagine 12 squares inside the rectangle because 3 times 4is equal to 12, and she drew lines to subdivide the rectangle accord-ingly. Next she explained that the area of the rectangle must beequally distributed in the 12 “inside” squares. Therefore, they di-vided 300 by 12 to determine that each square contains 25 squareinches. At the teacher’s suggestion, Rachel wrote a 25 in each squarein the diagram to make this point clear. Keisha then explained thatin order to find the length and width of the rectangle, they had todetermine the length of the side of each small square. She arguedthat since the area of each square was 25 square inches, the side ofeach square was 5 inches. Then, referring to the diagram in figure
269Standards for Grades 6–8: Communication
Num
ber & O
perations | Algebra | G
eometry | M
easurement | D
ata Analysis &
Probability | P
roblem S
olving | Reasoning &
Proof | C
omm
unication | Connections | R
epresentation
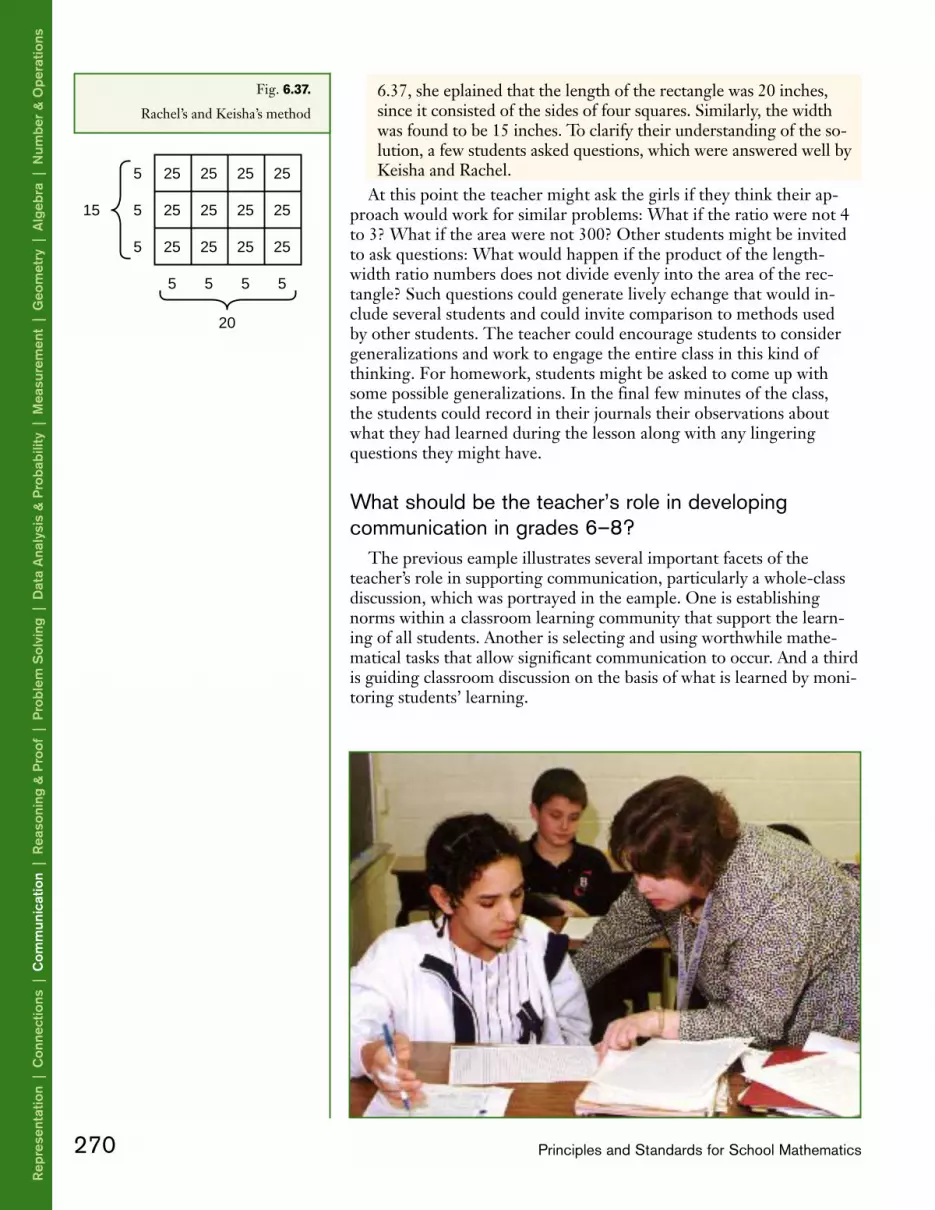
6.37, she explained that the length of the rectangle was 20 inches,since it consisted of the sides of four squares. Similarly, the widthwas found to be 15 inches. To clarify their understanding of the so-lution, a few students asked questions, which were answered well byKeisha and Rachel.
At this point the teacher might ask the girls if they think their ap-proach would work for similar problems: What if the ratio were not 4to 3? What if the area were not 300? Other students might be invitedto ask questions: What would happen if the product of the length-width ratio numbers does not divide evenly into the area of the rec-tangle? Such questions could generate lively exchange that would in-clude several students and could invite comparison to methods usedby other students. The teacher could encourage students to considergeneralizations and work to engage the entire class in this kind ofthinking. For homework, students might be asked to come up withsome possible generalizations. In the final few minutes of the class,the students could record in their journals their observations aboutwhat they had learned during the lesson along with any lingeringquestions they might have.
What should be the teacher’s role in developingcommunication in grades 6–8?
The previous example illustrates several important facets of theteacher’s role in supporting communication, particularly a whole-classdiscussion, which was portrayed in the example. One is establishingnorms within a classroom learning community that support the learn-ing of all students. Another is selecting and using worthwhile mathe-matical tasks that allow significant communication to occur. And a thirdis guiding classroom discussion on the basis of what is learned by moni-toring students’ learning.
270 Principles and Standards for School Mathematics
Rep
rese
ntat
ion
| C
onne
ctio
ns |
Com
mun
icat
ion
| R
easo
ning
& P
roof
| P
robl
em S
olvi
ng |
Dat
a A
naly
sis
& P
roba
bilit
y |
Mea
sure
men
t |
Geo
met
ry |
Alg
ebra
| N
umbe
r &
Ope
ratio
ns
Fig. 6.37.
Rachel’s and Keisha’s method
5 25 25 25 25
5 25 25 25 25
5 25 25 25 25
5 5 5 5
15
20

Facilitating students’mathematics learningthrough classroomdiscussion requires skilland good judgment.
The middle-grades mathematics teacher should strive to establish acommunication-rich classroom in which students are encouraged toshare their ideas and to seek clarification until they understand. Insuch a classroom community, communication is central to teachingand learning mathematics and to assessing students’ knowledge. Thefocus in such classrooms is trying to make sense of mathematics to-gether. Explaining, questioning, debating, and sense making are thusnatural and expected activities. To achieve this kind of classroom,teachers need to establish an atmosphere of mutual trust and respect,which can be gained by supporting students as they assume substantialresponsibility for their own mathematics learning and that of theirpeers. When teachers build such an environment, students understandthat it is acceptable to struggle with ideas, to make mistakes, and to beunsure. This attitude encourages them to participate actively in tryingto understand what they are asked to learn because they know thatthey will not be criticized personally, even if their mathematical think-ing is critiqued.
Communication should be focused on worthwhile mathematicaltasks. Teachers should identify and tasks that—
• relate to important mathematical ideas; • are accessible to multiple methods of solution; • allow multiple representations; • afford students opportunities to interpret, justify, and conjecture.
Although the task in the example was in many ways quite simple, it pro-vided students with an opportunity to use their understanding of areaand ratio—important ideas in the middle grades. The task was simpleenough that all students could do it, difficult enough to challenge stu-dents to think and reason, and rich enough to allow students to engageat different levels.
Teachers also need to monitor students’ learning in order to directclassroom discourse appropriately. Facilitating students’ mathematicslearning through classroom discussion requires skill and good judg-ment. In the example, to be sure her objectives were met, the teacherskillfully steered the “mathematical direction” of the conversation bycalling on particular students to present a different solution. Teachersmust consider numerous issues in orchestrating a classroom conversa-tion. Who speaks? When? Why? For how long? Who doesn’t? Whynot? It is important that everyone have opportunities to contribute, al-though it is not necessary to give equal speaking time to all students.
Clearly, the students in the example were accustomed to being askedregularly, not only by the teacher but also by other students, to explaintheir mathematical thinking and reasoning. The teacher and severalstudents pressed for justification and explanation as each solution waspresented. Because not all students regularly participate in whole-classdiscussions, teachers need to monitor their participation to ensure thatsome are not left entirely out of the discussion for long periods. But en-couraging all students to speak can sometimes conflict with advancingthe mathematical goals of a lesson because students’ contributions mayoccasionally be irrelevant or lack mathematical substance. But evenwhen this happens, the teacher and students can derive some benefit. Itcan be productive for the teacher to pick up on and probe incorrect or
271Standards for Grades 6–8: Communication
Num
ber & O
perations | Algebra | G
eometry | M
easurement | D
ata Analysis &
Probability | P
roblem S
olving | Reasoning &
Proof | C
omm
unication | Connections | R
epresentation

incomplete responses. Only by examining misconceptions and errorscan students deal with them appropriately.
Teachers can use class discussions as opportunities for ongoing as-sessment of their teaching and of students’ learning. Making mentalnotes about missed teaching opportunities and about students’ difficul-ties or confusions may help in making decisions about follow-uplessons.
Classroom communication can contribute to multiple goals. The les-son in the example generated at least four instructional directions. Inthe next few lessons, the teacher and her class explored the use of alge-braic representations and solution methods for related problems as theysought a method that would work for a larger range of values for theareas and the ratios of the sides. The teacher later examined with theclass how the area of a rectangle is affected when its length and widthare each multiplied by the same factor. The teacher’s informal assess-ment of the students’ understanding during work on the task led her totake Lee and Randy aside later in the week to help them clarify theirthinking. Finally, to acquaint her students with the scoring guidelinesthat would be used on the state proficiency test, she had them preparewritten solutions for this problem and then score one another’s solu-tions using the guidelines. In this way, they learned valuable lessonsabout the need for accuracy, precision, and completeness in their writ-ten communication.
Teachers can use oral and written communication in mathematics togive students opportunities to—
• think through problems; • formulate explanations; • try out new vocabulary or notation; • experiment with forms of argumentation; • justify conjectures; • critique justifications; • reflect on their own understanding and on the ideas of others.
To help students reflect on their learning, teachers can ask them towrite commentaries on what they learned in a lesson or a series oflessons and on what remains unclear to them. To strive for clarity in ex-plaining their ideas, students can write a letter to a younger student ex-plaining a difficult concept (e.g., “Here’s what it means for two figuresto be similar. Let me start with rectangles.…”). In the example, journalwriting and individual homework offered all the students opportunitiesfor individual reflection and communication. Working in pairs also af-forded opportunities for communication. This approach is often veryeffective with students in the middle grades because they can try outtheir ideas in the relative privacy of a small group before opening them-selves up to the entire class.
Even when students are working in small groups, the teacher has animportant role to play in ensuring that the discourse contributes to themathematics learning of the group members and helps to further theteacher’s mathematical goals. For example, when students ask questionsabout the task requirements or about the correctness of their work, theteacher should respond in ways that keep their focus on thinking and
Working in pairs isoften a very effective
approach with studentsin the middle grades.
272 Principles and Standards for School Mathematics
Rep
rese
ntat
ion
| C
onne
ctio
ns |
Com
mun
icat
ion
| R
easo
ning
& P
roof
| P
robl
em S
olvi
ng |
Dat
a A
naly
sis
& P
roba
bilit
y |
Mea
sure
men
t |
Geo
met
ry |
Alg
ebra
| N
umbe
r &
Ope
ratio
ns
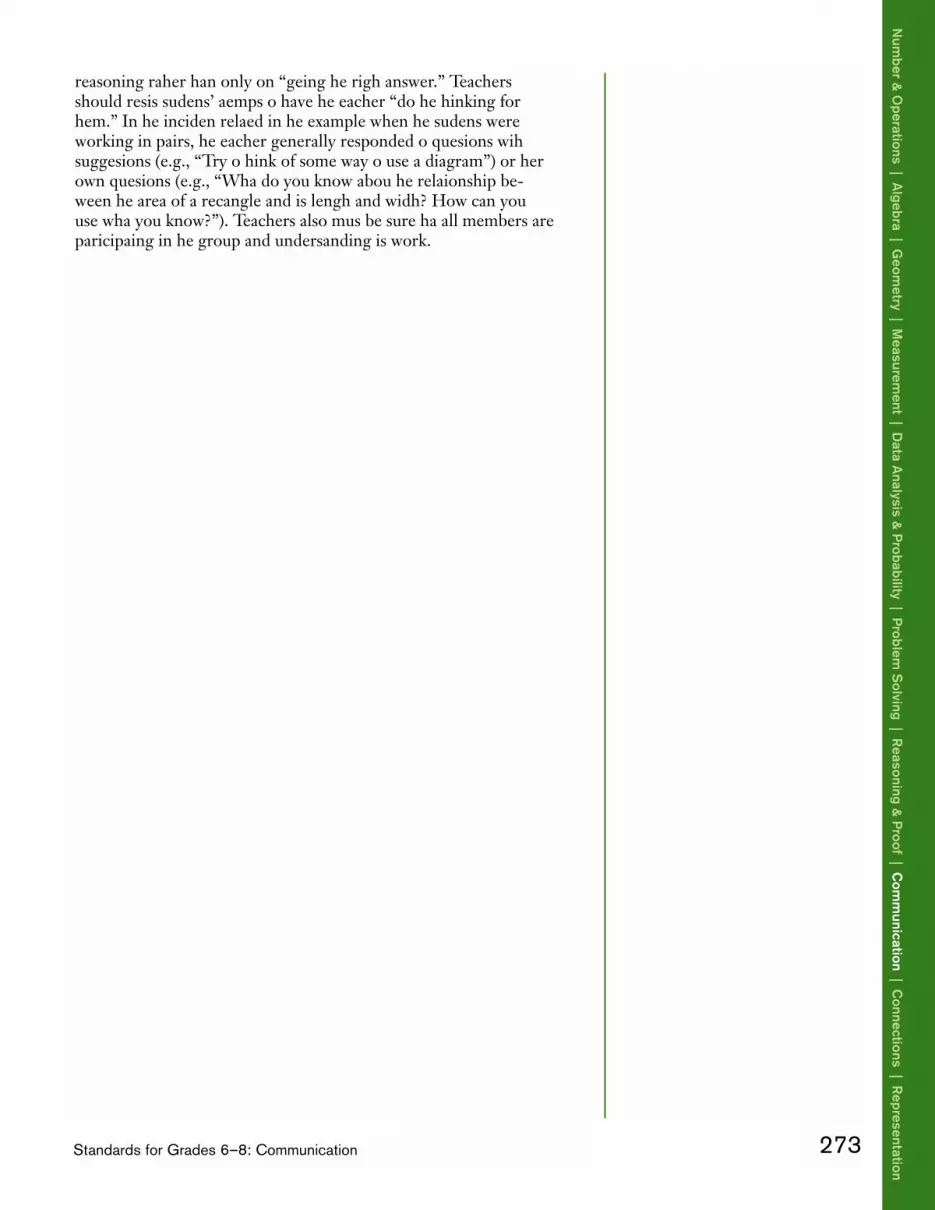
reasoning rather than only on “getting the right answer.” Teachersshould resist students’ attempts to have the teacher “do the thinking forthem.” In the incident related in the example when the students wereworking in pairs, the teacher generally responded to questions withsuggestions (e.g., “Try to think of some way to use a diagram”) or herown questions (e.g., “What do you know about the relationship be-tween the area of a rectangle and its length and width? How can youuse what you know?”). Teachers also must be sure that all members areparticipating in the group and understanding its work.
273Standards for Grades 6–8: Communication
Num
ber & O
perations | Algebra | G
eometry | M
easurement | D
ata Analysis &
Probability | P
roblem S
olving | Reasoning &
Proof | C
omm
unication | Connections | R
epresentation
Thinking mathematically involves looking for connections, and mak-ing connections builds mathematical understanding. Without connec-tions, students must learn and remember too many isolated conceptsand skills. With connections, they can build new understandings onprevious knowledge. The important mathematical foci in the middlegrades—rational numbers, proportionality, and linear relationships—are all intimately connected, so as middle-grades students encounter di-verse new mathematical content, they have many opportunities to useand make connections.
This chapter on grades 6–8 mathematics contains numerous illustra-tions of mathematical connections. Many of the formulas students de-velop and use in the “Measurement” section draw on their knowledgeof algebra, geometry, and measurement. The kite example in the“Geometry” section engages students in examining the perimeter andarea of similar figures to investigate proportional relationships. Severalexamples in the “Data Analysis” section illustrate how gathering, repre-senting, and analyzing data can help students develop insights intoother mathematical ideas, including variation and change, probability,and ratio and proportion. The “cellular telephone” problem in the “Al-gebra” section demonstrates how connections among various forms ofrepresentation provide insights into patterns and regularities in prob-lem situations. Clearly, rich problem contexts involve connections toother disciplines (e.g., science, social studies, art) as well as to the realworld and to the daily life experiences of middle-grades students.
What should connections look like in grades 6 through 8?Mathematics classes in the middle grades should continually provide
opportunities for students to experience mathematics as a coherentwhole through the curriculum used and the questions teachers andclassmates ask. Students reveal the ways they are connecting ideas whenthey answer questions such as, What made you think of that? Why doesthat make sense? Where have we seen a problem like this before? Howare these ideas related? Did anyone think about this in a different way?How does today’s work relate to what we have done in earlier units ofstudy? From these discussions, students can develop new connectionsand enhance their own understanding of mathematics by listening totheir classmates’ thinking.
6–8Standard
for Grades
Connections
Instructional programs fromprekindergarten through grade 12should enable all students to—
Recognize and use connectionsamong mathematical ideas
Understand how mathematicalideas interconnect and build on oneanother to produce a coherentwhole
Recognize and apply mathematicsin contexts outside of mathematics
274 Principles and Standards for School Mathematics
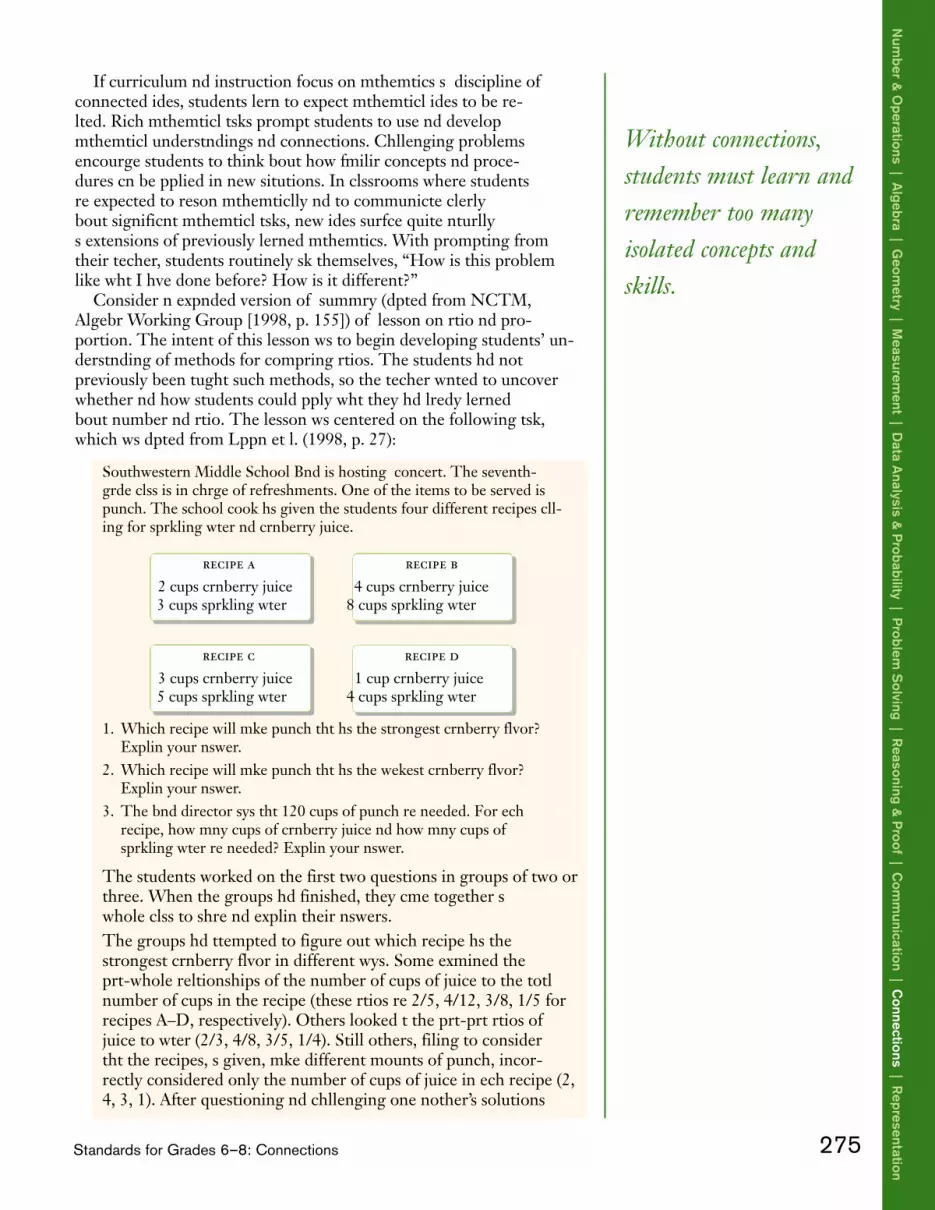
Without connections,students must learn andremember too manyisolated concepts andskills.
275Standards for Grades 6–8: Connections
Num
ber & O
perations | Algebra | G
eometry | M
easurement | D
ata Analysis &
Probability | P
roblem S
olving | Reasoning &
Proof | C
omm
unication | Connections | R
epresentation
If curriculum and instruction focus on mathematics as a discipline ofconnected ideas, students learn to expect mathematical ideas to be re-lated. Rich mathematical tasks prompt students to use and developmathematical understandings and connections. Challenging problemsencourage students to think about how familiar concepts and proce-dures can be applied in new situations. In classrooms where studentsare expected to reason mathematically and to communicate clearlyabout significant mathematical tasks, new ideas surface quite naturallyas extensions of previously learned mathematics. With prompting fromtheir teacher, students routinely ask themselves, “How is this problemlike what I have done before? How is it different?”
Consider an expanded version of a summary (adapted from NCTM,Algebra Working Group [1998, p. 155]) of a lesson on ratio and pro-portion. The intent of this lesson was to begin developing students’ un-derstanding of methods for comparing ratios. The students had notpreviously been taught such methods, so the teacher wanted to uncoverwhether and how students could apply what they had already learnedabout number and ratio. The lesson was centered on the following task,which was adapted from Lappan et al. (1998, p. 27):
Southwestern Middle School Band is hosting a concert. The seventh-grade class is in charge of refreshments. One of the items to be served ispunch. The school cook has given the students four different recipes call-ing for sparkling water and cranberry juice.
recipe a recipe b2 cups cranberry juice 4 cups cranberry juice3 cups sparkling water 8 cups sparkling water
recipe c recipe d3 cups cranberry juice 1 cup cranberry juice5 cups sparkling water 4 cups sparkling water
1. Which recipe will make punch that has the strongest cranberry flavor?Explain your answer.
2. Which recipe will make punch that has the weakest cranberry flavor?Explain your answer.
3. The band director says that 120 cups of punch are needed. For eachrecipe, how many cups of cranberry juice and how many cups ofsparkling water are needed? Explain your answer.
The students worked on the first two questions in groups of two orthree. When the groups had finished, they came together as awhole class to share and explain their answers.The groups had attempted to figure out which recipe has thestrongest cranberry flavor in different ways. Some examined thepart-whole relationships of the number of cups of juice to the totalnumber of cups in the recipe (these ratios are 2/5, 4/12, 3/8, 1/5 forrecipes A–D, respectively). Others looked at the part-part ratios ofjuice to water (2/3, 4/8, 3/5, 1/4). Still others, failing to considerthat the recipes, as given, make different amounts of punch, incor-rectly considered only the number of cups of juice in each recipe (2,4, 3, 1). After questioning and challenging one another’s solutions

and comparing methods, the class decided to move on to the lastquestion to see if they could resolve the differences in their answers.Each group was assigned to determine the amounts of juice andwater needed for just one of the recipes. Below are four of thestrategies the groups used to work through this part of the problem.
Group with recipe A
We figured out that each recipe would make 5 cups: 2 of juice and 3of water. So to make 120 cups, it would take 120 divided by 5, andthat is 24, the number of recipes needed. Since we need 2 cups ofjuice and 3 cups of water for one recipe, we need 2 × 24 = 48 cups ofjuice and 3 × 24 = 72 cups of water for the 24 recipes. And since 48cups of juice + 72 cups of water makes 120 cups of punch that mustbe right.
Group with recipe B
We thought that 4 cups of juice and 8 cups of water is the sameratio as 1 cup of juice and 2 cups of water. We then thought aboutthe 120 cups of punch as divided into three groups of 40 cups each:40 + 40 + 40 = 120. We need 1 part juice, so that is 40 cups, and 2parts water, so that is 80 cups. This makes 120 cups of punch, andyou still have a ratio of 1 part juice to 2 parts water.
Group with recipe C
We tried to double the recipe, but that was not enough. So weadded another batch and that still was not enough. So we just keptadding recipes and seeing how many total cups of punch we had.We kept up this pattern until we got 120 cups. So we had [a tablelike that shown in fig. 6.38]. That means we had 45 cups of juiceand 75 cups of water.
Later in the class discussion, this group noticed that they couldhave gone directly from 3/5 to 45/75 by multiplying the numeratorand denominator by 15 because they needed 15 recipes.
Group with recipe D
We tried various numbers. First we tried 20 cups of juice. Thismeans we needed 4 times as much water or 80 cups of water. Butthis was too small because 20 + 80 is only 100. So we tried 30 cupsof juice, so that meant 30 × 4 = 120 cups of water. This time we hadtoo much punch, 30 + 120 = 150. Next we tried 25 cups of juice.And 25 × 4 = 100, so we had 100 cups of water. But this made 125cups of punch, which was close but too much. So we tried 24 cupsof juice, which needed 24 × 4 = 96 cups of water. This worked be-cause 24 + 96 = 120 cups of punch.
276 Principles and Standards for School Mathematics
Rep
rese
ntat
ion
| C
onne
ctio
ns |
Com
mun
icat
ion
| R
easo
ning
& P
roof
| P
robl
em S
olvi
ng |
Dat
a A
naly
sis
& P
roba
bilit
y |
Mea
sure
men
t |
Geo
met
ry |
Alg
ebra
| N
umbe
r &
Ope
ratio
ns
Fig. 6.38.
Chart for punch recipes
Cups of juice
Cups of water
Cups of punch
3
5
8
6
10
16
9
15
24
12
20
32
15
25
40
18
30
48
21
35
56
24
40
64
27
45
72
30
50
80
33
55
88
36
60
96
39
65
104
42
70
112
45
75
120

After the groups had shared their approaches to the third question,the teacher continued the conversation by encouraging the class totalk about the similarities and differences among the strategies.
The “making punch” problem had brought numerous mathematicalideas to the forefront: fractions, ratios, proportions, operations, magni-tude, scaling, number sense, patterns, and so on. By bringing previouslyunderstood mathematical ideas or processes to bear on this problem,the students were developing understandings that laid a foundation forthe later study of such topics as rates of change and linear relationships.
Since the task required the students to explain their strategies, all thestudents had an opportunity to enhance their understanding of ratios bylistening to the others’ different ideas. For example, the group withrecipe D used a “guess and check” approach to solve the problem. Thegroup with recipe C made a table and used the ideas of scaling ratiosand adding iteratively in the same way that students find equivalentfractions. The groups with recipes A and B thought about comparingquantities and using ratios.
None of the students mentioned that the answers to the first twoquestions would have been more obvious if they had solved the thirdproblem first. For each recipe, we can add the number of cups of cran-berry juice to the number of cups of water to determine how muchpunch one recipe makes. We divide this number into 120 to determinethe multiples—24, 10, 15, and 24, respectively—of the ingredients thatare needed. Because recipes A–D use 2, 4, 3, and 1 cup of cranberryjuice initially, they will use 48, 40, 45, and 24 cups of cranberry juice,respectively, when multiplied to serve 120 people. Clearly, recipe D hasthe weakest cranberry flavor and recipe A has the strongest. This find-ing confirms the students’ previous answers and approaches.
What should be the teacher’s role in developingconnections in grades 6 through 8?
The teacher’s role includes selecting problems that connect mathe-matical ideas within topics and across the curriculum; it also includeshelping students build on their current mathematical ideas to developnew ideas. The teacher’s orchestration of the “making punch” lessonallowed the students to make the connections explicit and to focus onthe relationships and commonalities among their strategies. Theteacher took advantage of an opportunity to foster the students’ dispo-sition to look for connections as well as to use connections. In situa-tions like this, it is essential that the teacher recognize and understandthe mathematical concepts being developed, not just to teach the ab-stract manipulation but also to orchestrate the conversation. Theteacher needs to be able to make quick decisions about next steps. It isalso important to encourage students to use words and notation appro-priately to support their understanding of new concepts, such as pro-portionality and algebra.
It is sometimes quite effective to revisit a problem to help studentsconnect familiar ideas to new concepts or skills. Indeed, the “makingpunch” problem has potential for connections to proportionality andlinearity. For instance, students could make a graph, plotting values
277Standards for Grades 6–8: Connections
Num
ber & O
perations | Algebra | G
eometry | M
easurement | D
ata Analysis &
Probability | P
roblem S
olving | Reasoning &
Proof | C
omm
unication | Connections | R
epresentation

from the first and third rows of the tablein figure 6.38. These points lie on a line.If y represents the total number of cups ofpunch and x the number of cups of juice,then the line has equation y = (8/3)x (seefig. 6.39). To answer question 3—whichasks how much juice and how muchwater are needed for 120 cups ofpunch—students can substitute 120 for yin this equation and compute x to findthe number of cups of juice. They wouldsubtract this number from 120 to findthe amount of sparkling water needed.This equation works equally well forfinding how much juice is needed for anyother quantity of punch, so they see thepower of expressing a relationship ingeneral terms. Here the slope of the lineis the ratio of the amount of punch to theamount of juice. Of course, having usedthis method to answer question 3 for allrecipes, students can easily answer theother two questions. A teacher mightalso revisit the “making punch” problemto assess students’ understanding of tabu-lar, graphical, and symbolic representa-tions for linear relationships.
Teachers can also enhance students’understanding of mathematics by usingother disciplines as sources of problems.Science and social studies are rich in op-portunities to learn about measurement,data, and algebra; art and computergraphics can be used to make sense ofshape, symmetry, similarity, and transfor-mations of geometric figures. Environ-mental studies offers a context for thestudy of large numbers (analyzing popu-lation growth), measurement (finding thepercent of different types of trash inlandfills by volume and considering recy-cling alternatives), or data and statistics(studying the effects of pollution on ani-mal and plant populations).
In many schools, teachers are inter-ested in fostering interdisciplinary stud-ies. The mathematics teacher may work
278 Principles and Standards for School Mathematics
Rep
rese
ntat
ion
| C
onne
ctio
ns |
Com
mun
icat
ion
| R
easo
ning
& P
roof
| P
robl
em S
olvi
ng |
Dat
a A
naly
sis
& P
roba
bilit
y |
Mea
sure
men
t |
Geo
met
ry |
Alg
ebra
| N
umbe
r &
Ope
ratio
ns
Fig. 6.39.
A graph of the numbers of cupsof juice and punch reveals a linear relationship.
y
xNumber of Cups of Juice
Num
ber
of C
ups
of P
unch
120
117
114
111
108
105
102
99
96
93
90
87
84
81
78
75
72
69
66
63
60
57
54
51
48
45
42
39
36
33
30
27
24
21
18
15
12
9
6
3
0
3 6 9 12 15 18 21 24 27 30 33 36 39 42 45

Merely applyingmathematics in otherdisciplines does notconstitute a sufficientmathematicscurriculum.
with teachers of other subjects to develop integrated units of study. Forexample, middle-grades science classes might study populations ofwildlife such as deer, fish, eagles, or sharks (see Curcio and Bezuk[1994]). If students will be expected to use sampling techniques in sci-ence class to determine the population of a species, it is important thatthe mathematics and science teachers discuss students’ understanding ofdifferent sampling techniques and of the idea of randomness. It is alsoimportant that science teachers understand that students are likely touse scaling and equivalent ratios to estimate the total population ratherthan cross multiplication and formal algebraic symbol manipulation tofind their solutions.
In the same spirit, mathematics teachers can build on and connect todisciplines other than science and social studies. For example, languagearts teachers can describe the strategies they teach for writing convinc-ing arguments. The mathematics teachers may then be able to help stu-dents use the strategies when appropriate in formulating mathematicalarguments. They may also be better able to help students recognize andanalyze forms of argumentation and justification that are peculiar tomathematics. Again, students benefit from teachers’ efforts to under-stand how other subjects are taught and to make connections betweenthe subjects explicit.
Conversations about students’ experiences, understandings, and fa-miliarity with procedures give teachers of other subjects an opportu-nity to learn about elements of the mathematics curriculum, such as al-gorithms and the level of abstract symbol manipulation that studentsmight use. Without such conversations, those who are not mathe-matics teachers may expect students to understand and use proceduresthat are not part of their repertoire or teachers may fail to build onideas with which students are already conversant. Students may missan opportunity to apply and extend their reasoning skills or to see thatmathematical ideas can be used in other disciplines. This is not toimply that merely applying mathematics in science, social studies, orany other discipline constitutes a sufficient middle-grades mathematicscurriculum. The point is that interdisciplinary experiences serve asways to revisit mathematical ideas and they help students see the use-fulness of mathematics both in school and at home. If all the middle-grades teachers in a school do their best to connect content areas,mathematics and other disciplines will be seen as permeating life andnot as just existing in isolation.
279Standards for Grades 6–8: Connections
Num
ber & O
perations | Algebra | G
eometry | M
easurement | D
ata Analysis &
Probability | P
roblem S
olving | Reasoning &
Proof | C
omm
unication | Connections | R
epresentation

Representation is central to the study of mathematics. Students candevelop and deepen their understanding of mathematical concepts andrelationships as they create, compare, and use various representations.Representations—such as physical objects, drawings, charts, graphs,and symbols—also help students communicate their thinking.
Representations are ubiquitous in the middle-grades mathematicscurriculum proposed here. The study of proportionality and linear rela-tionships is intertwined both with students’ learning to use variablesflexibly in order to represent unknowns and with their learning to em-ploy tables, graphs, and equations as tools for representation and analy-sis. Middle-grades students who are taught with this Standard in mindwill learn to recognize, compare, and use an array of representationalforms for fractions, decimals, percents, and integers. They also willlearn to use representational forms such as exponential and scientificnotation when working with large and small numbers and to use a vari-ety of graphical tools to represent and analyze data sets.
What should representation look like in grades 6through 8?
Students in the middle grades solve many problems in which theycreate and use representations to organize and record their thinkingabout mathematical ideas. For example, they use representations to de-velop or apply their understanding of proportionality when they makeor interpret scale drawings of figures or scale models of objects, whenthey connect the geometric notion of similarity with numerical ratios,and when they draw relative-frequency histograms for data sets. Whilesolving challenging problems, students might use standard representa-tions, but they can also develop and use nonstandard representationsthat work well for a particular problem.
When solving problems involving proportionality, students can cre-ate representations that blend visual and numerical information to de-pict relationships among quantities. Consider the following problem:
The Copy Cat printing shop has a printer that uses only black, red, andblue cartridges. All the cartridges print the same number of pages. Theblack cartridges are replaced 4 times as often as the red ones. And duringthe time in which 3 red cartridges need to be replaced, 5 blue cartridgeswill also need to be replaced.
6–8Standard
for Grades
Representation
Instructional programs fromprekindergarten through grade 12should enable all students to—
Create and use representations toorganize, record, and communicatemathematical ideas
Select, apply, and translate amongmathematical representations tosolve problems
Use representations to model andinterpret physical, social, andmathematical phenomena
280 Principles and Standards for School Mathematics

1. What fraction of Copy Cat’s printing is in black?2. What percent of the printing is in blue?3. In a month, 60 black cartridges are used. What is the total number of
red and blue cartridges used in that month?
Students can use a variety of approaches to represent and solve thisproblem, including both standard and nonstandard forms of representa-tion. Some students will find it natural to develop and use a discretemodel like the one shown in figure 6.40. With such a representation,students can merge the information from the two ratios in the problemstatement. They can see that in every set of 20 cartridges used at CopyCat, 12 are black, 3 are red, and 5 are blue. They can conclude that12/20 (or 6/10, 3/5, or 0.6) of the printing is in black, which answersthe first question. To answer the second question, a student mightimagine replicating this set of 20 five times to see that Copy Cat uses 25blue cartridges in every 100 used. Thus, 25 percent of the printing is inblue. To answer the third question, students could note that a set of 60black cartridges comprises 5 sets of 12 cartridges and that a total of 8red and blue cartridges are used in the time that 12 black cartridges areused. Thus, it follows that 40 red and blue cartridges—15 red and 25blue—are used in the time that it takes to use 60 black cartridges.
The power of representations that blend visual and numerical infor-mation can be appreciated in solving many problems involving ratios,proportions, and percents. Consider the following problem:
A group of students has $60 to spend on dinner. They know that the totalcost, after adding tax and tip, will be 25 percent more than the food pricesshown on the menu. How much can they spend on the food so that thetotal cost will be $60?
Of the various ways this problem might be represented, many studentswould find the representation in figure 6.41 useful. In this figure, a rec-tangular bar represents the total of $60. This total must include theprice of the food plus 25 percent more for tax and tip. To show this re-lationship, the bar is segmented into five equal parts, of which four rep-resent the price of the food and one the tax and tip. Because there arefive equal parts and the total is $60, each part must be $12. Therefore,
281Standards for Grades 6–8: Representation
Num
ber & O
perations | Algebra | G
eometry | M
easurement | D
ata Analysis &
Probability | P
roblem S
olving | Reasoning &
Proof | C
omm
unication | Connections | R
epresentation
Fig. 6.40.
This representation for the “printingcartridges” problem combines visualand numerical information.
Black Red
Black12
Red3
Blue5
4 1 3 5: :

the total price allowed for food is $48. This type of visual representa-tion for numerical quantities is quite adaptable and can be used to solvemany problems involving fractions, percents, ratios, and proportions(see, e.g., some problems in Curriculum Development Institute of Sin-gapore 1997, or Bennett, Maier, and Nelson 1988). For example, therepresentation in figure 6.41 could also help students see and under-stand that when one quantity is 125 percent of a second quantity, thenthe second is 80 percent of the first.
The study of linear functions, with the associated patterns and rela-tionships, is another major focus in the middle grades. By consideringproblems in a variety of contexts, students should become familiar with arange of representations for linear relationships, including tables, graphs,and equations. Students need to learn to use these representations flexiblyand appropriately. In the “Algebra” section of this chapter, several exam-ples are discussed, notably the “cellular telephone” problem, throughwhich students could develop a repertoire of representations.
Students also need to examine relationships among representationsfor linear functions. The use of graphing calculators or appropriatecomputer software can greatly facilitate such an examination and canallow students to see such important relationships as the one betweenthe value of k in the equation y = kx and the slope of the correspondingline.
Students will be better able to solve a range of algebra problems ifthey can move easily from one type of representation to another. In themiddle grades, students often begin with tables of numerical data to ex-amine a pattern underlying a linear function, but they should also learnto represent those data in the form of a graph or equation when theywish to characterize the generalized linear relationship. Students shouldalso become flexible in recognizing equivalent forms of linear equationsand expressions. This flexibility can emerge as students gain experiencewith multiple ways of representing a contextualized problem. For ex-ample, consider the following problem, which is adapted from Ferrini-Mundy, Lappan, and Phillips (1997):
A rectangular pool is to be surrounded by aceramic-tile border. The border will be onetile wide all around. Explain in words, withnumbers or tables, visually, and with sym-bols the number of tiles that will be neededfor pools of various lengths and widths.
Some students would solve this problem by using a table to record thevalues for various lengths and widths of rectangular pools and for thecorresponding number of tiles on the border. From the table, they could
282 Principles and Standards for School Mathematics
Rep
rese
ntat
ion
| C
onne
ctio
ns |
Com
mun
icat
ion
| R
easo
ning
& P
roof
| P
robl
em S
olvi
ng |
Dat
a A
naly
sis
& P
roba
bilit
y |
Mea
sure
men
t |
Geo
met
ry |
Alg
ebra
| N
umbe
r &
Ope
ratio
ns
Fig. 6.41.
One possible representation for the“food, tax, and tip” problem
$60
Cost of food Taxand tip
E-example 6.2
Comparing Cost Functions

discern a generalization and then express it as an equation, as is sug-gested in the response and the accompanying work shown in figure 6.42.
Other students might reason about the situation geometrically (or vi-sually) rather than numerically. Here are three other possible studentresponses:
I drew several pictures and saw this pattern. You need L + 2 tilesacross the top and the same number across the bottom. And youalso need W tiles on the left and W tiles on the right. So all to-gether, the number of tiles needed is T = 2(L + 2) + 2W. I pictured it in my head. First, place one tile at each of the cornersof the pool. Then you just need L tiles across the top and the bot-tom, and W tiles along each of the sides. So all together, the num-ber of tiles needed is 4 + 2L + 2W. You can find the number of tiles needed by finding the area of thewhole rectangle (pool plus tile border) and then subtracting offthe area of the pool. The area of the pool and deck together is(L + 2)(W + 2). The area of the pool alone is LW. So all together,
the number of tiles needed is (L + 2)(W + 2) – LW.
These three responses differ in the way in which particular geometric(visual) features are considered. For example, in the first two solutions,the tile border is related to the perimeter of the large rectangle com-prising the tiles and the pool but with different decompositions of theperimeter. In contrast, the third response considers the area of the largerectangle and derives the number of tiles as the area of the border,which is legitimate because the tiles are unit squares.
By working on problems like the “tiled pool” problem, students gain ex-perience in relating symbolic representations of situations and relationshipsto other representations, such as tables and graphs. They also see that sev-eral apparently different symbolic expressions often can be used to repre-sent the same relationship between quantities or variables in a situation.The latter observation sets the stage for students to understand equivalent
283Standards for Grades 6–8: Representation
Num
ber & O
perations | Algebra | G
eometry | M
easurement | D
ata Analysis &
Probability | P
roblem S
olving | Reasoning &
Proof | C
omm
unication | Connections | R
epresentation
Fig. 6.42.
Student work for the “tiled pool”problem
Leng
th 3
Width 4
Pool Pool NumberLength Width of Tiles
1 1 8
2 1 10
3 1 12
3 2 14
3 3 16
3 4 18
The formula for the number of tiles is T = 2(L + W ) + 4. I made a table with columns for L, W, and T. I drew some pictures. Then I counted the tiles for those pictures, filled in the numbers in the table, and looked for a pattern. It’s easy! You always just add the length to the width, double that answer, and then add 4.

symbolic expressions as different symbolic forms that represent the samerelationship. In the “tiled pool” problem, for example, a class could discusswhy the four expressions obtained for the total number of tiles should beequivalent. They could then examine ways to demonstrate the equivalencesymbolically. For example, they might observe from their sketches thatadding two lengths to two widths (2L + 2W ) is actually the same as addingthe length and width and then doubling: 2(L + W ). They should recognizethis pictorial representation for the distributive property of multiplicationover addition—a useful tool in rewriting variable expressions and solvingequations. In this way, teachers may be able to develop approaches to alge-braic symbol manipulation that are meaningful to students.
Finally, it is important that middle-grades students have opportunitiesto use their repertoire of mathematical representations to solve relativelylarge-scale, motivating, and significant problems that involve modelingphysical, social, or mathematical phenomena. The goal of this sort ofmathematical modeling is for students to gain experience in using themathematics they know and an appreciation of its utility for understandingand solving applied problems. For example, students might decide to in-vestigate problems associated with trash disposal and recycling by collect-ing data on the volume of paper discarded in their classroom or home overa period of weeks or months. After organizing their data using graphs, ta-bles, or charts, the students could think about which representations aremost useful for illuminating regularities in the data. From their observa-tions, the students might be able to offer thoughtfully justified estimates ofthe volume and types of paper discarded in their entire school, school dis-trict, or city in a week, month, or year. Drawing on what they have learnedin science and social studies, they might then make recommendations forreducing the flow of paper into landfills or incinerators.
What should be the teacher’s role in developingrepresentation in grades 6 through 8?
Mathematics teachers help students learn to use representations flexiblyand appropriately by encouraging them as they create and use representa-tions to support their thinking and communication. Teachers help stu-dents develop facility with representations by listening, questioning, andmaking a sincere effort to understand what they are trying to communi-cate with their drawings or writings, especially when idiosyncratic, uncon-ventional representations are involved. Teachers need to use sound profes-sional judgment when deciding when and how to help students movetoward conventional representations. Although using conventional repre-sentational forms has many advantages, introducing representations be-fore students are able to use them meaningfully can be counterproductive.
Teachers play a significant role in helping students develop meaningfor important forms of representation. For example, middle-grades stu-dents need many experiences to develop a robust understanding of thevery complex notion of variable. Teachers can help students move froma limited understanding of variable as a placeholder for a single numberto the idea of variable as a representation for a range of possible valuesby providing experiences that use variable expressions to describe nu-merical data (Demana and Leitzel 1988).
Teachers need to give students experiences in using a wide range ofvisual representations and introduce them to new forms of representa-
Middle-gradesstudents have
opportunities to solverelatively large-scale,
motivating, andsignificant problems that
involve modeling.
284 Principles and Standards for School Mathematics
Rep
rese
ntat
ion
| C
onne
ctio
ns |
Com
mun
icat
ion
| R
easo
ning
& P
roof
| P
robl
em S
olvi
ng |
Dat
a A
naly
sis
& P
roba
bilit
y |
Mea
sure
men
t |
Geo
met
ry |
Alg
ebra
| N
umbe
r &
Ope
ratio
ns

tions that are useful for solving certain types of problems. Vertex-edgegraphs, for instance, can be used to represent abstract relationshipsamong people or objects in many different kinds of situations. Take asituation in which several students might be working in differentgroups (for math review, history research, and a science project) or in-volved in different activities (basketball team and band). Each groupwants to arrange a different meeting time to accommodate the stu-dents who are involved in more than one group. To help solve thisscheduling problem, a teacher might suggest that students make agraph in which the vertices represent the groups and an edge betweentwo groups indicates that there is some student who is a member ofboth groups. Figure 6.43 shows a possible vertex-edge graph involvingthe five groups, where an edge represents a relationship—commonmembership. This graph illustrates that no student participates in boththe math-review group and history-research group (e.g., there is noedge joining those vertices) and that at least one student participates inboth the math-review group and band practice (e.g., there is an edgebetween those vertices). The information in this graph can identify thepotential scheduling conflicts so they can be avoided by scheduling allconnected activities at different times.
Another new type of representation that teachers might wish to in-troduce their students to is a NOW-NEXT equation, which can beused to define relationships among variables iteratively. The equationNEXT = NOW + 10 would mean that each term in a pattern is foundby adding 10 to the previous term. This notational form can be used asan alternative to the equation form of the general term when a recur-sive relationship is being highlighted. The data in figure 6.44 can berepresented in a summarized form both as y = 10x (where x must be awhole number) and as NEXT = NOW + 10.
The teacher thus has an important role in helping middle-grades stu-dents develop confidence and competence both in creating their ownrepresentations when they are needed to solve a challenging problemand in selecting flexibly and appropriately from an extensive repertoireof conventional representations. Whether helping students to use theirown invented representations or introducing them to conventionalforms, teachers should help students use representations meaningfully.By encouraging students to discuss the graphs, pictures, or symbolsthey are using in their work, teachers can monitor their developing flu-ency with representations. When students see how others interpretwhat they have written and how others have represented the sameideas, they can evaluate representations thoughtfully and recognizecharacteristics that make a representation flexible, appropriate, and use-ful. Through such a process, most students will come to appreciate thesimplicity and effectiveness of conventional forms of representation andthe role of representations in enabling communication with others.
285Standards for Grades 6–8: Representation
Num
ber & O
perations | Algebra | G
eometry | M
easurement | D
ata Analysis &
Probability | P
roblem S
olving | Reasoning &
Proof | C
omm
unication | Connections | R
epresentation
Fig. 6.43.
A vertex-edge graph used to identifypotential scheduling conflicts
Fig. 6.44.
Values for the terms in a pattern rep-resented by a NOW = NEXT equation
Math-reviewgroup
Basketballpractice
Bandpractice
Science-projectgroup
History-researchgroup
x y
1 10
2 20
3 30
4 40… …
y = 10x
NEXT = NOW +10

To ensure that students will have a wide range
of career and educational choices, the secondary school
mathematics program must be both broad and deep.

287
Standards for Grades 9–12
7Chapter
Students in secondary school face choices and decisions that will deter-mine the course of their lives. As they approach the end of required school-ing, they must have the opportunity to explore their career interests—which may change during high school and later—and their options forpostsecondary education. To ensure that students will have a wide range ofcareer and educational choices, the secondary school mathematics programmust be both broad and deep.
The high school years are a time of major transition. Students enterhigh school as young teenagers, grappling with issues of identity and withtheir own mental and physical capacities. In grades 9–12, they develop inmultiple ways—becoming more autonomous and yet more able to workwith others, becoming more reflective, and developing the kinds of per-sonal and intellectual competencies that they will take into the workplaceor into postsecondary education.
These Standards describe an ambitious foundation of mathematicalideas and applications intended for all students. Through its emphasis onfundamental mathematical concepts and essential skills, this foundationwould give all students solid preparation for work and citizenship, positivemathematical dispositions, and the conceptual basis for further study. Ingrades 9–12, students should encounter new classes of functions, new geo-metric perspectives, and new ways of analyzing data. They should begin tounderstand aspects of mathematical form and structure, such as that allquadratic functions share certain properties, as do all functions of otherclasses—linear, periodic, or exponential. Students should see the interplayof algebra, geometry, statistics, probability, and discrete mathematics andvarious ways that mathematical phenomena can be represented. Throughtheir high school experiences, they stand to develop deeper understandingsof the fundamental mathematical concepts of function and relation, invari-ance, and transformation.

In high school, students should build on their prior knowledge,learning more-varied and more-sophisticated problem-solving tech-niques. They should increase their abilities to visualize, describe, andanalyze situations in mathematical terms. They need to learn to use awide range of explicitly and recursively defined functions to model theworld around them. Moreover, their understanding of the properties ofthose functions will give them insights into the phenomena being mod-eled. Their understanding of statistics and probability could providethem with ways to think about a wide range of issues that have impor-tant social implications, such as the advisability of publicizing anecdotalevidence that can cause health scares or whether DNA “fingerprinting”should be considered strong or weak evidence.
Secondary school students need to develop increased abilities in jus-tifying claims, proving conjectures, and using symbols in reasoning.They can be expected to learn to provide carefully reasoned argumentsin support of their claims. They can practice making and interpretingoral and written claims so that they can communicate effectively whileworking with others and can convey the results of their work with clar-ity and power. They should continue to develop facility with such tech-nological tools as spreadsheets, data-gathering devices, computer alge-bra systems, and graphing utilities that enable them to solve problemsthat would require large amounts of computational time if done byhand. Massive amounts of information—the federal budget, school-board budgets, mutual-fund values, and local used-car prices—are nowavailable to anyone with access to a networked computer (Steen 1997).Facility with technological tools helps students analyze these data. Agreat deal is demanded of students in the program proposed here, butno more than is necessary for full quantitative literacy.
All students are expected to study mathematics each of the four yearsthat they are enrolled in high school, whether they plan to pursue thefurther study of mathematics, to enter the workforce, or to pursueother postsecondary education. The focus on conceptual understandingprovides the underpinnings for a wide range of careers as well as forfurther study, as Hoachlander (1997, p. 135) observes:
Most advanced high school mathematics has rigorous, interestingapplications in the work world. For example, graphic designers rou-tinely use geometry. Carpenters apply the principles of trigonome-try in their work, as do surveyors, navigators, and architects.…Algebra pervades computing and business modeling, from everydayspreadsheets to sophisticated scheduling systems and financial plan-ning strategies. Statistics is a mainstay for economists, marketingexperts, pharmaceutical companies, and political advisers.
With the experience proposed here in making connections and solvingproblems from a wide range of contexts, students will learn to adapt flexi-bly to the changing needs of the workplace. The emphasis on facility withtechnology will result in students’ ability to adapt to the increasingly tech-nological work environments they will face in the years to come. By learn-ing to think and communicate effectively in mathematics, students will bebetter prepared for changes in the workplace that increasingly demandteamwork, collaboration, and communication (U.S. Department of Labor1991; Society for Industrial and Applied Mathematics 1996). Note thatthese skills are also needed increasingly by people who will pursue careers
All students areexpected to study
mathematics each of thefour years that they areenrolled in high school.
288 Principles and Standards for School Mathematics

in mathematics or science. With its emphasis on fundamental concepts,thinking and reasoning, modeling, and communicating, the core is a foun-dation for the study of more-advanced mathematics. Consider, for exam-ple, the recommendations for precalculus courses generated at the Prepar-ing for a New Calculus conference (Gordon et al. 1994, p. 56):
Courses designed to prepare students for the new calculus should:• cover fewer topics … with more emphasis on fundamental concepts.• place less emphasis on complex manipulative skills.• teach students to think and reason mathematically, not just to perform
routine operations.…• emphasize modeling the real world and develop problem-solving skills.• make use of all appropriate calculator and computer technologies.…• promote experimentation and conjecturing.• provide a solid foundation in mathematics that prepares students to
read and learn mathematical material at a comparable level on theirown.
A central theme of Principles and Standards for School Mathematics isconnections. Students develop a much richer understanding of mathe-matics and its applications when they can view the same phenomenafrom multiple mathematical perspectives. One way to have students seemathematics in this way is to use instructional materials that are inten-tionally designed to weave together different content strands. Anothermeans of achieving content integration is to make sure that courses ori-ented toward any particular content area (such as algebra or geometry)contain many integrative problems—problems that draw on a variety ofaspects of mathematics, that are solvable using a variety of methods,and that students can access in different ways.
High school students with particular interests could study mathematicsthat extends beyond what is recommended here in various ways. One ap-proach is to include in the program material that extends these ideas indepth or sophistication. Students who encounter these kinds of enrichedcurricula in heterogeneous classes will tend to seek different levels of un-derstanding. They will, over time, learn new ways of thinking from theirpeers. Other approaches make use of supplementary courses. For instance,students could enroll in additional courses concurrent with the program.Or the material proposed in these Standards could be included in a three-year program that allows students to take supplementary courses in thefourth year. In any of these approaches, the curriculum can be designed sothat students can complete the foundation proposed here and choose fromadditional courses such as computer science, technical mathematics, statis-tics, and calculus. Whatever the approach taken, all students learn thesame core material while some, if they wish, can study additional mathe-matics consistent with their interests and career directions.
These Standards are demanding. It will take time, patience, and skillto implement the vision they represent. The content and pedagogicaldemands of curricula aligned with these Standards will require extendedand sustained professional development for teachers and a large degreeof administrative support. Such efforts are essential. We owe our chil-dren no less than a high degree of quantitative literacy and mathematicalknowledge that prepares them for citizenship, work, and further study.
289Standards for Grades 9–12: Introduction

In grades 9–12 all students should—
• develop a deeper understanding of very large and very small numbers andof various representations of them;
• compare and contrast the properties of numbers and number systems,including the rational and real numbers, and understand complex numbersas solutions to quadratic equations that do not have real solutions;
• understand vectors and matrices as systems that have some of theproperties of the real-number system;
• use number-theory arguments to justify relationships involving wholenumbers.
• judge the effects of such operations as multiplication, division, andcomputing powers and roots on the magnitudes of quantities;
• develop an understanding of properties of, and representations for, theaddition and multiplication of vectors and matrices;
• develop an understanding of permutations and combinations as countingtechniques.
• develop fluency in operations with real numbers, vectors, and matrices,using mental computation or paper-and-pencil calculations for simple casesand technology for more-complicated cases.
• judge the reasonableness of numerical computations and their results.
Instructional programs fromprekindergarten through grade 12should enable all students to—
Understand numbers, ways of rep-resenting numbers, relationshipsamong numbers, and number systems
Understand meanings of operationsand how they relate to one another
Compute fluently and make reason-able estimates
9–12Standard
for Grades
Expectations
Number and Operations
290 Principles and Standards for School Mathematics

High school studentsshould understand fullythe concept of a numbersystem.
Number and OperationsIn high school, students’ understanding of number is the foundation
for their understanding of algebra, and their fluency with number oper-ations is the basis for learning to operate fluently with symbols. Stu-dents should enter high school with an understanding of the basic oper-ations and fluency in using them on integers, fractions, and decimals. Ingrades 9–12, they will develop an increased ability to estimate the re-sults of arithmetic computations and to understand and judge the rea-sonableness of numerical results displayed by calculators and comput-ers. They should use the real numbers and learn enough about complexnumbers to interpret them as solutions of quadratic equations.
High school students should understand more fully the concept of anumber system, how different number systems are related, and whetherthe properties of one system hold in another. Their increased ability touse algebraic symbolism will enable them to make generalizations aboutproperties of numbers that they might discover. They can study and usevectors and matrices. They need to develop deeper understandings ofcounting techniques, which further develops the conceptual underpin-nings for the study of probability.
Understand numbers, ways of representing numbers,relationships among numbers, and number systems
High school students should become increasingly facile in dealingwith very large and very small numbers as part of their deepening un-derstanding of number. Such numbers occur frequently in the sciences;examples are Avogadro’s number (6.02 × 10 23) in chemistry or the verysmall numbers used in describing the size of the nucleus of a cell in bi-ology. As citizens, students will need to grasp the difference between$1 billion, the cost of a moderate-sized government project, and $1 trillion, a significant part of the national budget.
They need to become familiar with different ways of representingnumbers. As part of their developing technological facility, studentsshould become adept at interpreting numerical answers on calculator orcomputer displays. They should recognize 1.05168475E-12 as a verysmall number given in scientific notation, 6.66666667 as the approxi-mate result of dividing 20 by 3, and ERROR as a response for either aninvalid operation or a number that overflows the capacity of the device.
Students’ understanding of the mathematical development of num-ber systems—from whole numbers to integers to rational numbers andthen on to real and complex numbers—should be a basis for their workin finding solutions for certain types of equations. Students should un-derstand the progression and the kinds of equations that can and cannotbe solved in each system. For example, the equation 3x = 1 does nothave an integer solution but does have a rational-number solution; theequation x3 = 2 does not have a rational-number solution but does havea real-number solution; and the equation x 2 + 4 = 0 does not have areal-number solution but does have a complex-number solution.
Whereas middle-grades students should have been introduced to irra-tional numbers, high school students should develop an understandingof the system of real numbers. They should understand that given an
291Standards for Grades 9–12: Number and Operations
Num
ber & O
perations | Algebra | G
eometry | M
easurement | D
ata Analysis &
Probability | P
roblem S
olving | Reasoning &
Proof | C
omm
unication | Connections | R
epresentation

origin and a unit of measure, every point on a line corresponds to a realnumber and vice versa. They should understand that irrational numberscan only be approximated by fractions or by terminating or repeatingdecimals. They should understand the difference between rational andirrational numbers. Their understanding of irrational numbers needs toextend beyond πand 2.
High school students can use their understanding of numbers to ex-plore new systems, such as vectors and matrices. By working with ex-amples that include forces or velocities, students can learn to appreci-ate vectors as a means of simultaneously representing magnitude anddirection. Using matrices, students can also see connections amongmajor strands of mathematics: they can use matrices to solve systems oflinear equations, to represent geometric transformations (some ofwhich can involve creating computer graphics), and to represent andanalyze vertex-edge graphs.
Properties that hold in some systems may not hold in others. Soteachers and students should explicitly discuss the associative, commu-tative, and distributive properties, and students should learn to examinewhether those properties hold in the systems they study. The explo-ration of the properties of matrices may be particularly interesting,since the system of matrices is often the first that students encounter inwhich multiplication is not commutative.
In grades 9–12, students can use algebraic arguments in many areas,including in their study of number. Consider, for example, a simplenumber-theory problem such as the following:
What can you say about the number that results when you subtract 1 fromthe square of an odd integer?
It is easy to verify that the number that results is even, and that it isdivisible by 4. But if students try a few examples, such as starting with 3or 5, they may note that the results they obtain are divisible by 8. Theymight wonder if this property will hold in general. Proving that it doesinvolves finding useful representations. If students decide to express anarbitrary odd integer as 2n + 1 and the resulting number as A, somequick computations show that A = (2n + 1)2 – 1 = 4n2 + 4n = 4(n)(n + 1).The observation that either n or (n + 1) must be even gives an addi-tional factor of 2, showing that A must be divisible by 8. Working suchproblems deepens students’ understanding of number while providingpractice in symbolic representation, reasoning, and proof.
Understand meanings of operations and how theyrelate to one another
As high school students’ understanding of numbers grows, theyshould learn to consider operations in general ways, rather than only inparticular computations. The questions in figure 7.1 call for reasoningabout the properties of the numbers involved rather than for followingprocedures to arrive at exact answers. Such reasoning is important injudging the reasonableness of results. Although the questions can be ap-proached by substituting approximate values for the numbers repre-sented by a through h, teachers should encourage students to arrive atand justify their conclusions by thinking about properties of numbers.
292 Principles and Standards for School Mathematics
Rep
rese
ntat
ion
| C
onne
ctio
ns |
Com
mun
icat
ion
| R
easo
ning
& P
roof
| P
robl
em S
olvi
ng |
Dat
a A
naly
sis
& P
roba
bilit
y |
Mea
sure
men
t |
Geo
met
ry |
Alg
ebra
| N
umbe
r &
Ope
ratio
ns

For example, to determine the point whose coordinate is closest to ab, ateacher might suggest considering the sign of ab and whether the mag-nitude of ab is greater or less than that of b. Likewise, students shouldbe able to explain why, if e is positioned as given in figure 7.1, the mag-nitude of e is greater than that of e. Listening to students explain theirreasoning gives teachers insights into the sophistication of their argu-ments as well as their conceptual understanding.
Developing understandings of the properties of numbers can alsohelp students solve problems like the following:
1. The graphs of the functions f (x) = x, g(x) = x, h(x) = x 2, and j(x) = x 3
are shown [in fig. 7.2]. Identify which function corresponds to whichgraph and explain why.
2. Given f (x) = 30/x 2 and a > 0, which is larger: f (a) or f (a + 2)? Explainwhy.
The first question is answered easily if one notices that if x is between 0and 1, x 3 < x 2 < x < x . To answer the second, a student would have torecognize that x 2 is an increasing function for positive x and then beable to reason that if x is positive, 30/x 2 decreases as x increases. Hence,f (a) > f (a + 2) for a > 0.
Students should also extend their understanding of operations tonumber systems that are new to them. They should learn to representtwo-dimensional vectors in the coordinate plane and determine vectorsums (see fig. 7.3). Dynamic geometry software can be used to illustratethe properties of vector addition. As students learn to represent systemsof equations using matrices, they should recognize how operations onthe matrices correspond to manipulations of such systems.
The organized lists and tree diagrams that students will have used inthe elementary and middle grades to count outcomes or compute prob-abilities can be used in high school to work on permutations and com-binations. Consider, for example, the task of determining how many
293Standards for Grades 9–12: Number and Operations
Num
ber & O
perations | Algebra | G
eometry | M
easurement | D
ata Analysis &
Probability | P
roblem S
olving | Reasoning &
Proof | C
omm
unication | Connections | R
epresentation
–2 –1 0 1 2
a b c d e f g h
Given the points with coordinates a, b, c, d, e, f, g, and h as shown,Which point is closest to ab? To c ? To 1/f ? To e ? To h ? Explain your reasoning.
Fig. 7.1.
These questions call for reasoningwithout exact values.
Fig. 7.2.
Graphs of four functions
Fig. 7.3.
A simple vector sum
0.2 0.4 0.6 0.8 1.0
1.0
0.8
0.6
0.4
0.2
(a, b)
(c, d )
(a + c, b + d )
E-example 7.1
Exploring Vectors and Vector Sums

two-person committees can be chosen from a group of seven people.Students should learn that the tree diagram they draw to represent thenumber of possibilities has a multiplicative structure: there are sevenmain branches, representing the first choice of committee member, andsix branches off each of those, representing the choice of the secondmember. They also need to understand that this method of enumerat-ing committees results in “double counting”: each committee of theform (person 1, person 2) is also represented as (person 2, person 1).Hence the number of two-person subcommittees is
The students should also understand and be able to explain why thenumber of two-person committees is the same as the number of five-person committees that can be chosen from a group of seven people.This kind of reasoning provides the conceptual underpinnings for workin probability.
Compute fluently and make reasonable estimatesStudents should be able to decide whether a problem calls for a
rough estimate, an approximation to an appropriate degree of precision,or an exact answer. They should select a suitable method of computingfrom among mental mathematics, paper-and-pencil computations, andthe use of calculators and computers and be proficient with eachmethod. Electronic computation technologies provide opportunities forstudents to work on realistic problems and to perform difficult compu-tations, for example, computing roots and powers of numbers or per-forming operations with vectors and matrices. However, students mustbe able to perform relatively simple mental computations as the basisfor making reasonable estimates and sensible predictions and to spotpotential sources of error. Suppose, for example, that a student wants toknow the cube root of 49, enters the expression 49^1/3 into a calcula-tor, and the number 16.3333333 is displayed in response. The studentshould note immediately that there has been an error, because the cuberoot of 49 should be between 3 and 4, and 16 • 16 • 16 is much largerthan 49. To have the calculator compute the cube root, the studentwould need to have entered 49^(1/3).
Students should beable to decide whether a
problem calls for arough estimate, an
approximation, or anexact answer.
294 Principles and Standards for School Mathematics
Rep
rese
ntat
ion
| C
onne
ctio
ns |
Com
mun
icat
ion
| R
easo
ning
& P
roof
| P
robl
em S
olvi
ng |
Dat
a A
naly
sis
& P
roba
bilit
y |
Mea
sure
men
t |
Geo
met
ry |
Alg
ebra
| N
umbe
r &
Ope
ratio
ns
72
7 62
= ×.

Blank Page

In grades 9–12 all students should—
• generalize patterns using explicitly defined and recursively definedfunctions;
• understand relations and functions and select, convert flexibly among, anduse various representations for them;
• analyze functions of one variable by investigating rates of change,intercepts, zeros, asymptotes, and local and global behavior;
• understand and perform transformations such as arithmetically combining,composing, and inverting commonly used functions, using technology toperform such operations on more-complicated symbolic expressions;
• understand and compare the properties of classes of functions, includingexponential, polynomial, rational, logarithmic, and periodic functions;
• interpret representations of functions of two variables.
• understand the meaning of equivalent forms of expressions, equations,inequalities, and relations;
• write equivalent forms of equations, inequalities, and systems of equationsand solve them with fluency—mentally or with paper and pencil in simplecases and using technology in all cases;
• use symbolic algebra to represent and explain mathematical relationships;• use a variety of symbolic representations, including recursive and
parametric equations, for functions and relations;• judge the meaning, utility, and reasonableness of the results of symbol
manipulations, including those carried out by technology.
• identify essential quantitative relationships in a situation and determine theclass or classes of functions that might model the relationships;
• use symbolic expressions, including iterative and recursive forms, torepresent relationships arising from various contexts;
• draw reasonable conclusions about a situation being modeled.
• approximate and interpret rates of change from graphical and numerical data.
Instructional programs fromprekindergarten through grade 12should enable all students to—
Understand patterns, relations, andfunctions
Represent and analyze mathemati-cal situations and structures usingalgebraic symbols
Use mathematical models to repre-sent and understand quantitativerelationships
Analyze change in various contexts
9–12Standard
for Grades
Expectations
Algebra
296 Principles and Standards for School Mathematics
High school algebrashould provide studentswith insights intomathematicalabstraction andstructure.
Algebra In the vision of school mathematics in these Standards, middle-grades
students will learn that patterns can be represented and analyzed mathe-matically. By the ninth grade, they will have represented linear functionswith tables, graphs, verbal rules, and symbolic rules and worked withand interpreted these representations. They will have explored somenonlinear relationships as well.
In high school, students should have opportunities to build on theseearlier experiences, both deepening their understanding of relations andfunctions and expanding their repertoire of familiar functions. Studentsshould use technological tools to represent and study the behavior ofpolynomial, exponential, rational, and periodic functions, among oth-ers. They will learn to combine functions, express them in equivalentforms, compose them, and find inverses where possible. As they do so,they will come to understand the concept of a class of functions andlearn to recognize the characteristics of various classes.
High school algebra also should provide students with insights intomathematical abstraction and structure. In grades 9–12, students shoulddevelop an understanding of the algebraic properties that govern themanipulation of symbols in expressions, equations, and inequalities.They should become fluent in performing such manipulations by ap-propriate means—mentally, by hand, or by machine—to solve equa-tions and inequalities, to generate equivalent forms of expressions orfunctions, or to prove general results.
The expanded class of functions available to high school students formathematical modeling should provide them with a versatile and pow-erful means for analyzing and describing their world. With utilities forsymbol manipulation, graphing, and curve fitting and with programma-ble software and spreadsheets to represent iterative processes, studentscan model and analyze a wide range of phenomena. These mathemati-cal tools can help students develop a deeper understanding of real-world phenomena. At the same time, working in real-world contextsmay help students make sense of the underlying mathematical conceptsand may foster an appreciation of those concepts.
Understand patterns, relations, and functionsHigh school students’ algebra experience should enable them to cre-
ate and use tabular, symbolic, graphical, and verbal representations andto analyze and understand patterns, relations, and functions with moresophistication than in the middle grades. In helping high school stu-dents learn about the characteristics of particular classes of functions,teachers may find it helpful to compare and contrast situations that aremodeled by functions from various classes. For example, the functionsthat model the essential features of the situations in figure 7.4 are quitedifferent from one another. Students should be able to express themusing tables, graphs, and symbols.
For the first situation, students might begin by generating a table ofvalues. If C is the cost in cents of mailing a letter and P is the weight ofthe letter in ounces, then the function C = 33 + (P – 1)(22) describes C asa function of P for positive integer values of P up through 13. Students
297Standards for Grades 9–12: Algebra
Num
ber & O
perations | Algebra | G
eometry | M
easurement | D
ata Analysis &
Probability | P
roblem S
olving | Reasoning &
Proof | C
omm
unication | Connections | R
epresentation

should understand that this situation has some linear qualities. For real-number values of P, the points on the graph of C = 33 + (P – 1)(22) lie ona line, and the rate of change is constant at 22 cents per ounce. However,the actual cost of postage and the linear function agree only at positiveinteger values of P. Students must realize that the graph of postal cost as afunction of weight is a step function, as seen in figure 7.5.
For the second situation described in figure 7.4, teachers could en-courage students to find a general expression for the function and notehow its form differs from the step function that describes the postalcost. Some students might generate an iterative or recursive definitionfor the function, using the population of a given year (NOW) to deter-mine the population of the next year (NEXT):
NEXT = (1.02) • NOW, start at 6 billion
(See the discussion of NOW-NEXT equations in the “Representation”section of chapter 6.) Moreover, students should be able to recognizethat this situation can be represented explicitly by the exponential func-tion f (n) = 6(1.02)n, where f (n) is the population in billions and n is thenumber of years since 1999. A discussion of whether this formula islikely to be a good model forever would help students see the limita-tions of mathematical models.
For the third situation, students could begin by graphing the givendata. It will help them to know that everywhere on earth except at theequator, the period of sunlight during the day increases for six monthsof the year and decreases for the other six. From the graph, they shouldbe able to see that the daily increase in daylight is nonconstant over thefirst half of the year and that the decrease in the second half of the yearalso is nonconstant. Students could be asked to find a function thatmodels the data well. The teacher could tell them that the length of
298 Principles and Standards for School Mathematics
Rep
rese
ntat
ion
| C
onne
ctio
ns |
Com
mun
icat
ion
| R
easo
ning
& P
roof
| P
robl
em S
olvi
ng |
Dat
a A
naly
sis
& P
roba
bilit
y |
Mea
sure
men
t |
Geo
met
ry |
Alg
ebra
| N
umbe
r &
Ope
ratio
ns
Situation 1: In February 2000 the cost of sending a letter by first-class mail was 33¢ for the first ounce and an additional 22¢ for each additional ounce or portion thereof through 13 ounces.
Situation 2: During 1999 the population of the world hit 6 billion. The expected average rate of growth is predicted to be 2 percent a year.
Situation 3: A table of data gives the number of minutes of daylight in Chicago, Illinois, every other day from 1 January 2000 through 30 December 2000.
551, 553, 555, 557, 559, 562, 565, 568, 571, 575, 579, 582, 586, 591, 595, 599, 604, 609, 614, 619, 624, 629, 634, 639, 644, 650, 655, 661, 666, 672, 677, 683, 689, 694, 700, 706, 711, 717, 723, 728, 734, 740, 745, 751, 757, 762, 768, 773, 779, 785, 790, 796, 801, 806, 812, 817, 822, 827, 832, 837, 842, 847, 852, 856, 861, 865, 870, 874, 878, 881, 885, 889, 892, 895, 898, 901, 903, 905, 907, 909, 911, 912, 913, 914, 914, 914, 914, 914, 914, 913, 912, 911 909, 907, 905, 903, 901, 898, 895, 892, 889, 885, 882, 878, 874, 870, 866, 861, 857, 852, 848, 843, 838, 833, 828, 823, 818, 813, 807, 802, 797, 791, 786, 781, 775, 770, 764, 758, 753, 747, 742, 736, 731, 725, 719, 714, 708, 703, 697, 691, 686, 680, 675, 669, 664, 658, 653, 648, 642, 637, 632, 627, 622, 617, 612, 607, 603, 598, 594, 590, 585, 581, 578, 574, 571, 567, 564, 561, 559, 557, 554, 553, 551, 550, 549, 548, 547, 547, 547, 548, 548, 549, 550
Number of 1 2 3 4 5 … P
Cost in cents 33 33 + 22 33 + 2(22) 33 + 3(22) 33 + 4(22) … 33 + (P – 1)(22)
ounces
Fig. 7.4.
Three situations that can be modeledby functions of different classes
Fig. 7.5.
A comparison of step and linearfunctions
Cos
t in
Cen
ts
Weight in Ounces
1 2 3 4 5 6 7 8 9 10
240
220
200
180
160
140
120
100
80
60
40
20

299Standards for Grades 9–12: Algebra
Num
ber & O
perations | Algebra | G
eometry | M
easurement | D
ata Analysis &
Probability | P
roblem S
olving | Reasoning &
Proof | C
omm
unication | Connections | R
epresentation
daylight can indeed be modeled by a function of the form T(t) = Tave +TA(θ) sin(ω t + ϕ), where t is measured in months, Tave = average day-light time = 12 hours; TA(θ) = amplitude, depending on latitude θ(changes sign at the equator); ω = frequency = 2π/12, and ϕ = phase (de-pending on choice of the initial time, t0). Students will see such formu-las in their physics courses and need to understand that formulas ex-press models of physical phenomena. It is also important to note thatthe parameters in physical equations have units.
After exploring and modeling each of the three situations individu-ally, students could be asked to compare the situations. For example,they might be asked to find characteristics that are common to two ormore of the functions. Some students might note that over the inter-vals given, the first function is nondecreasing, the second is strictly in-creasing, and the third both increases and decreases. Students need tobe sensitive to the facts that functions that are increasing over someintervals don’t necessarily stay increasing and that increasing func-tions may have very different rates of increase, as these three examplesillustrate.
Students could also be asked to consider the advantages and disad-vantages of the different ways the three functions were represented.The teacher should help students realize that depending on what onewants to know, different representations of these functions can be moreor less useful. For instance, a table may be the most convenient way toinitially represent the postage function in the first example. The samemay be so for the third example if the goal is to determine quickly howmuch sunlight there will be on a given day. Despite the convenience ofbeing able to “read” a value directly, however, the table may obscure theperiodicity of the phenomenon. The periodicity becomes apparentwhen the function is represented graphically or symbolically. Similarly,although students may first create tables when presented with the sec-ond situation, graphical and symbolic representations of the exponen-tial function may help students develop a better understanding of thenature of exponential growth.
High school students should have substantial experience in exploringthe properties of different classes of functions. For instance, theyshould learn that the function f (x) = x 2 – 2x – 3 is quadratic, that itsgraph is a parabola, and that the graph opens “up” because the leadingcoefficient is positive. They should also learn that some quadratic equa-tions do not have real roots and that this characteristic corresponds tothe fact that their graphs do not cross the x-axis. And they should beable to identify the complex roots of such quadratics.
In addition, students should learn to recognize how the values ofparameters shape the graphs of functions in a class. With access tocomputer algebra systems (CAS)—software on either a computer orcalculator that carries out manipulations of symbolic expressions orequations, can compute or approximate values of functions or solu-tions to equations, and can graph functions and relations—studentscan easily explore the effects of changes in parameter as a means ofbetter understanding classes of functions. For example, explorationswith functions of the form y = ax 2 + bx + c lead to some interesting re-sults. The consequences of changes in the parameters a and c on thegraphs of functions are relatively easy to observe. Changes in b are notas obvious: changing b results in a translation of the parabola along a

nonvertical line. Moreover, a trace of the vertices of the parabolasformed as b is varied forms a parabola itself. Exploring functions ofthe form f (x) = a (x – h)2 + b(x – h) + c and seeing how their graphschange as the value of h is changed also provides a basis for under-standing transformations and coordinate changes.
As high school students study several classes of functions and becomefamiliar with the properties of each, they should begin to see that classi-fying functions as linear, quadratic, or exponential makes sense becausethe functions in each of these classes share important attributes. Manyof these attributes are global characteristics of the functions. Consider,for example, the graphs of the three exponential functions of the formf (x) = a • b x + c, with a > 0 and b > 1, given in figure 7.6.
To help students notice and describe characteristics of these threefunctions, teachers might ask, “What happens to each of these func-tions for large positive values of x? For large negative values of x?Where do they cross the y-axis?” One student might note that the val-ues of each function increase rapidly for large positive values of x. An-other student could point out that the y-intercept of each graph appearsto be a + c. Teachers should then encourage students to explore whathappens in cases where a < 0 or 0 < b < 1. Students should find thatchanging the sign of a will reflect the graph over a horizontal line,whereas changing b to 1/b will reflect the graph over the y-axis. Thegraphs will retain the same shape. This type of exploration should helpstudents see that all functions of the form f (x) = a • b x + c share certainproperties. Through analytic and exploratory work, students can learnthe properties of this and other classes of functions.
Represent and analyze mathematical situations andstructures using algebraic symbols
Fluency with algebraic symbolism helps students represent and solveproblems in many areas of the curriculum. For example, proving that thesquare of any odd integer is 1 more than a multiple of 8 (see the relateddiscussion in the “Number” section of this chapter) can involve repre-senting odd numbers and operating on that representation algebraically.Likewise, the equations in figure 7.7 suggest an algebraic justification of
300 Principles and Standards for School Mathematics
Rep
rese
ntat
ion
| C
onne
ctio
ns |
Com
mun
icat
ion
| R
easo
ning
& P
roof
| P
robl
em S
olvi
ng |
Dat
a A
naly
sis
& P
roba
bilit
y |
Mea
sure
men
t |
Geo
met
ry |
Alg
ebra
| N
umbe
r &
Ope
ratio
ns
Fig. 7.6.
Graphs of exponential functions ofthe form f(x) = a • bx + c
–5 5 10 15
20
15
10
5
–5 5 10 15
20
15
10
5
–5 5 10 15 20 25 30
30
25
20
15
10
5
g(x ) = 3 • 2x + 4 h(x) = 2 • 3x – 1 k (x) = 2 • 1.1x
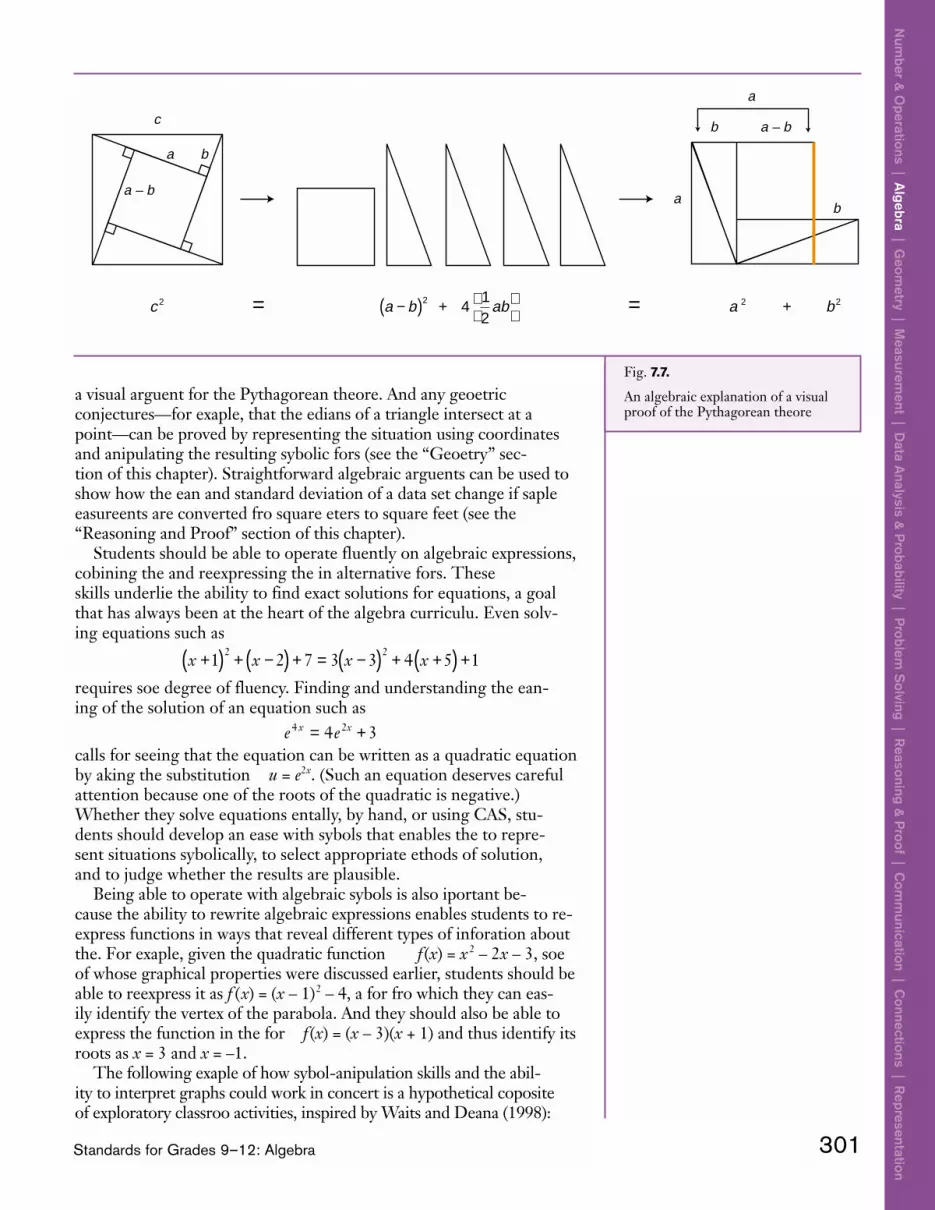
a visual argument for the Pythagorean theorem. And many geometricconjectures—for example, that the medians of a triangle intersect at apoint—can be proved by representing the situation using coordinatesand manipulating the resulting symbolic forms (see the “Geometry” sec-tion of this chapter). Straightforward algebraic arguments can be used toshow how the mean and standard deviation of a data set change if samplemeasurements are converted from square meters to square feet (see the“Reasoning and Proof” section of this chapter).
Students should be able to operate fluently on algebraic expressions,combining them and reexpressing them in alternative forms. Theseskills underlie the ability to find exact solutions for equations, a goalthat has always been at the heart of the algebra curriculum. Even solv-ing equations such as
requires some degree of fluency. Finding and understanding the mean-ing of the solution of an equation such as
calls for seeing that the equation can be written as a quadratic equationby making the substitution u = e2x. (Such an equation deserves carefulattention because one of the roots of the quadratic is negative.)Whether they solve equations mentally, by hand, or using CAS, stu-dents should develop an ease with symbols that enables them to repre-sent situations symbolically, to select appropriate methods of solution,and to judge whether the results are plausible.
Being able to operate with algebraic symbols is also important be-cause the ability to rewrite algebraic expressions enables students to re-express functions in ways that reveal different types of information aboutthem. For example, given the quadratic function f (x) = x 2 – 2x – 3, someof whose graphical properties were discussed earlier, students should beable to reexpress it as f (x) = (x – 1)2 – 4, a form from which they can eas-ily identify the vertex of the parabola. And they should also be able toexpress the function in the form f (x) = (x – 3)(x + 1) and thus identify itsroots as x = 3 and x = –1.
The following example of how symbol-manipulation skills and the abil-ity to interpret graphs could work in concert is a hypothetical compositeof exploratory classroom activities, inspired by Waits and Demana (1998):
301Standards for Grades 9–12: Algebra
Num
ber & O
perations | Algebra | G
eometry | M
easurement | D
ata Analysis &
Probability | P
roblem S
olving | Reasoning &
Proof | C
omm
unication | Connections | R
epresentation
Fig. 7.7.
An algebraic explanation of a visualproof of the Pythagorean theorem
a
a
b
b
a – b
c aba b a b2 2 2 2412
= =
+−( ) +
c
a b
a – b
x x x x+( ) + −( ) + = −( ) + +( ) +1 2 7 3 3 4 5 12 2
e ex x4 24 3= +

A teacher asks her students to analyze the function
and make as many observations about it as they can. Some studentsbegin by trying to graph the function, plotting points by hand.Some students use a CAS and others perform long division byhand, producing the equivalent form
Some graph the original function or the equivalent form on a com-puter or on graphing calculators; the zoom feature enables them tosee various views of the graph, as seen in figure 7.8.It is hard to interpret some of the graphs near x = 2, a matter the classreturns to later. Focusing on a graph where the zoom-out feature hasbeen used a number of times (see fig. 7.8c), some students observe,“The graph looks like a straight line.” The teacher asks the class todecide whether it is a line and, if so, what the equation of the linemight be. To investigate the question, the teacher suggests that theyfind several values of f (x) for large positive and negative values of xand use curve-fitting software to find the equation of the line passingthrough those points. Different groups choose different x-values and,as a result, obtain slightly different values for the slope and the y-in-tercept. However, when the class discusses their findings, they dis-cover that the lines that fit those points all seemed “close” to the liney = 2x + 15. Some students point out that this function is part of theresult they obtained after performing the long division. The class concludes that the line y = 2x + 15 is a good approximationto f (x) for large x-values but that it is not a perfect fit. This conclu-sion leads to the question of how the students might combine thegraphs of g(x) = 2x + 15 and h(x) = 36/(x – 2) to deduce the shape ofthe graph of f(x). Hand-drawn and computer plots help students ex-plore how the graph of each function “contributes to” the graph ofthe sum. Examining the behavior of
leads to a discussion of what “really” happens near x = 2, of why thefunction appears to be linear for large values of x, and of the needto develop a sense of how algebraic and graphical representations offunctions are related, even when graphing programs or calculatorsare available.
Students in grades 9–12 should develop understandings of algebraicconcepts and skill in manipulating symbols that will serve them in situa-tions that require both. Success in the example shown in figure 7.9, forexample, requires more than symbol manipulation. There are severalways to approach this problem, each of which requires understanding al-gebraic concepts and facility with algebraic symbols. For example, tocomplete the first row of the table, students need only know how toevaluate f (x) and g (x) for a given value of x. However, to complete thesecond row, students must know what it means to compose functions,including the role of the “inner” and “outer” function and the numbers
302 Principles and Standards for School Mathematics
Rep
rese
ntat
ion
| C
onne
ctio
ns |
Com
mun
icat
ion
| R
easo
ning
& P
roof
| P
robl
em S
olvi
ng |
Dat
a A
naly
sis
& P
roba
bilit
y |
Mea
sure
men
t |
Geo
met
ry |
Alg
ebra
| N
umbe
r &
Ope
ratio
ns
Fig. 7.8.Different views of the function
–10 –8 –6 –4 –2 2 4 6 8
4
2
–2
–4
(a)
–100 –80 –60 –40 –20 20 40 60 80
40
20
–20
–40
(b)
–1000 –800 –600 –400 –200 200 400 600 800
400
200
–200
–400
(c)
f xx x
x( ) =
+ + –
2 11 62
2
f x xx
( ) = + + 2 1536
2−( ) .
h xx
( ) = 36– 2
f xx x
x( ) =
+ +
−
2 11 6
2
2

on which they act in a composition. They also must understand how toread the symbols f (g (x)) and g ( f (x)). Students might reason, using an in-tuitive understanding of the inverse of a function, that because g (x) = 4,x must be either 1 or –3. They can then determine that x cannot be 1,because g ( f (1)) is not 81.
Use mathematical models to represent and understandquantitative relationships
Modeling involves identifying and selecting relevant features of areal-world situation, representing those features symbolically, analyzingand reasoning about the model and the characteristics of the situation,and considering the accuracy and limitations of the model. In the pro-gram proposed here, middle-grades students will have used linear func-tions to model a range of phenomena and explored some nonlinearphenomena. High school students should study modeling in greaterdepth, generating or using data and exploring which kinds of functionsbest fit or model those data.
Teachers may find that having students generate data helps generateinterest in creating mathematical models. For example, students couldconduct an experiment to study the relationship between the time ittakes a skateboard to roll down a ramp of fixed length and the heightof the ramp (Zbiek and Heid 1990). Teams of students might set rampsat different heights and repeatedly roll skateboards down the rampsand measure the time. Once students have gathered and plotted thedata, they can analyze the physical features of the situation to createappropriate mathematical models. Their knowledge of the characteris-tics of various classes of functions should help them select potentialmodels. In this situation, as the height of the ramp is increased, lesstime is needed, suggesting that the function is decreasing. Students candiscuss the suitability of linear, quadratic, exponential, and rationalfunctions by arguing from their data or from the physics of the situa-tion. Curve-fitting software allows students to generate possible mod-els, which they can examine for suitability on the basis of the data andthe situation.
In making choices about what kinds of situations students will model,teachers should include examples in which models can be expressed initerative, or recursive, form. Consider the following example, adaptedfrom National Research Council (1998, p. 80), of the elimination of amedicine from the circulatory system.
A student strained her knee in an intramural volleyball game, and her doc-tor prescribed an anti-inflammatory drug to reduce the swelling. She is to
303Standards for Grades 9–12: Algebra
Num
ber & O
perations | Algebra | G
eometry | M
easurement | D
ata Analysis &
Probability | P
roblem S
olving | Reasoning &
Proof | C
omm
unication | Connections | R
epresentation
If f(x) = x2 – 1 and g(x) = (x + 1)2, complete the table below.
x f(x) g(x) f (g(x)) g(f(x))
2 80 16
4 81
Fig. 7.9.
A composition-of-functions problem(Adapted from Tucker [1995])
E-example 7.2
Medicine: Applying Graphs, Tablesand Equations

take two 220-milligram tablets every 8 hours for 10 days. If her kidneys fil-tered 60% of this drug from her body every 8 hours, how much of thedrug was in her system after 10 days? How much of the drug would havebeen in her system if she had continued to take the drug for a year?
Teachers might ask students to conjecture about how much of thedrug would be in the volleyball player’s system after 10 days. Theymight also ask about whether the drug keeps accumulating noticeablyin the athlete’s system. Students will tend to predict that it does, andthey can be asked to examine the accumulation in their analysis.
Students might begin by calculating a few values of the amount ofthe drug in the player’s system and looking for a pattern. They can pro-ceed to model the situation directly, representing it informally as
NEXT = 0.4(NOW) + 440, start at 440 or more formally as
where n represents the dose number (dose 31 would be taken at 240hours, or 10 days) and an represents the amount of the drug in the sys-tem just after the nth dose. By looking at calculator or spreadsheet com-putations like those in figure 7.10, students should be able to see thatthe amount of the drug in the bloodstream reaches an after-dosage“equilibrium” value of about 733 1/3 milligrams. Students should learnto express the relationship in one of the iterative forms given above.Then the mathematics in this example can be pursued in various ways.At the most elementary level, the students can simply verify the equilib-rium value by showing that 0.4(733 1/3) + 440 = 733 1/3 milligrams.They can be asked to predict what would happen if the initial dose ofthe anti-inflammatory drug were different, to run the simulation, andto explain the result they obtain.
This investigation opens the door to explorations of finite sequencesand series and to the informal consideration of limits. (For example,spreadsheet printouts for “large n” for various dosages strongly suggestthat the sequence {an} of after-dosage levels converges.) Expanding thefirst few terms reveals that this is a finite geometric series:
Students might find it interesting to pursue the behavior of this series.To investigate other aspects of the modeling situation, students could
also be asked to address questions like the following:
• If the athlete stops taking the drug after 10 days, how long does it takefor her system to eliminate most of the drug?
• How could you determine a dosage that would result in a targeted after-dosage equilibrium level, such as 500 milligrams?
304 Principles and Standards for School Mathematics
Rep
rese
ntat
ion
| C
onne
ctio
ns |
Com
mun
icat
ion
| R
easo
ning
& P
roof
| P
robl
em S
olvi
ng |
Dat
a A
naly
sis
& P
roba
bilit
y |
Mea
sure
men
t |
Geo
met
ry |
Alg
ebra
| N
umbe
r &
Ope
ratio
ns
a a a nn n1 1440 0 4 440 1 31= and = . + for ,+ ≤ ≤
a
a
a
a
1
2
32 2
42
440 440 1
440 0 4 440 440 1 0 4
440 0 4 440 0 4 440 440 1 0 4 0 4
440 0 4 440 0 4 440
= =
= + . = + .
= + . + . = + . + .
= + . + .
( )( ) ( )
( ) ( ) ( ) ( )( )( ) ( ) ( ) ++ .
= + . + . .
0 4 440
440 1 0 4 0 4 0 4
3
2 3
( ) ( )( ) + ( )( )
A B1234567891011121314151617181920
2122232425
440616
686.4714.56
725.824730.3296
732.13184732.852736
733.1410944733.2564376733.3025751
733.32103733.328412
733.3313648733.3325459733.3330184733.3332073733.3332829733.3333132733.3333253733.3333301733.333332
733.3333328733.3333331
Fig. 7.10.
A spreadsheet computation of the“drug dosage” problem

Increasingly, discussionsof change are found inthe popular press andnews reports.
Students should also be made aware that problems such as this describeonly one part of a treatment regimen and that doctors would be alert tothe possibility and implications of various complicating factors.
In grades 9–12, students should encounter a wide variety of situa-tions that can be modeled recursively, such as interest-rate problems orsituations involving the logistic equation for growth. The study of re-cursive patterns should build during the years from ninth throughtwelfth grade. Students often see trends in data by noticing change inthe form of differences or ratios (How much more or less? How manytimes more or less?). Recursively defined functions offer students a nat-ural way to express these relationships and to see how some functionscan be defined recursively as well as explicitly.
Analyze change in various contextsIncreasingly, discussions of change are found in the popular press
and news reports. Students should be able to interpret statements suchas “the rate of inflation is decreasing.” The study of change in grades9–12 is intended to give students a deeper understanding of the ways inwhich changes in quantities can be represented mathematically and ofthe concept of rate of change.
The “Algebra” section of this chapter began with examples of threedifferent real-world contexts in which very different kinds of changeoccurred. One situation was modeled by a step function, one by an ex-ponential function, and one by a periodic function. Each of these func-tions changes in different ways over the interval given. As discussed ear-lier, students should recognize that the step function is nonlinear butthat it has some linear qualities. To many students, the kind of changedescribed in the second situation sounds linear: “Each year the popula-tion changes by 2 percent.” However, the change is 2 percent of theprevious year’s population; as the population grows, the increase growsas well. Students should come to realize that functions of this type growvery rapidly. In the third example, students can see that not only is thefunction periodic but because it is, its rate of change is periodic as well.
Chapter 6 gives an example in which middle-grades students are askedto compare the costs of two different pricing schemes for telephone calls:a flat rate of $0.45 a minute versus a rate of $0.50 a minute for the first 60minutes and $0.10 a minute for each minute thereafter. In examples ofthis type, the dependent variable typically changes (over some interval) afixed amount for each unit change in the independent variable. In highschool, students should analyze situations in which quantities change inmuch more complex ways and in which the relationships between quanti-ties and their rates of change are more subtle. Consider, for example, thesituation (adapted from Carlson [1998, p. 147]) in figure 7.11.
Working problems of this type builds on the understandings ofchange developed in the middle grades and lays groundwork for thestudy of calculus. Because students tend to confuse velocity with posi-tion, teachers should help them think carefully about which variables arerepresented in the diagram and about how they change. First, for exam-ple, students must realize that the variable on the vertical axis is velocity,rather than position. To answer part a of the question, they need to rea-son that because the velocity of car A is greater than that of car B atevery point in the interval 0 < t < 1, car A has necessarily traveled a
305Standards for Grades 9–12: Algebra
Num
ber & O
perations | Algebra | G
eometry | M
easurement | D
ata Analysis &
Probability | P
roblem S
olving | Reasoning &
Proof | C
omm
unication | Connections | R
epresentation

greater distance than car B. They can read the answer to part b directlyoff the graph: at t = 1 hour, both cars are traveling at the same velocity.Answering part c calls for at least an intuitive understanding of instanta-neous rate of change. Acceleration is the rate of change of velocity. Att = 1 hour, the velocity of car B is increasing more rapidly than that ofcar A, so car B is accelerating more rapidly than car A at t = 1 hour. Partd is particularly counterintuitive for students (Carlson 1998). Since car Bis accelerating more rapidly than car A near t = 1 hour, students tend tothink that car B is “catching up” with car A, and it is, although it is stillfar behind. Some will interpret the intersection of the graphs to meanthat the cars meet. Teachers need to help students focus on the relativevelocities of the two cars. Questions such as “Which car is moving fasterover the interval from t = 0.75 hour to t = 1 hour?” can help students re-alize that car A is not only ahead of car B but moving faster and hencepulling away from car B. Car B starts catching up with car A only after t = 1 hour.
306 Principles and Standards for School Mathematics
Rep
rese
ntat
ion
| C
onne
ctio
ns |
Com
mun
icat
ion
| R
easo
ning
& P
roof
| P
robl
em S
olvi
ng |
Dat
a A
naly
sis
& P
roba
bilit
y |
Mea
sure
men
t |
Geo
met
ry |
Alg
ebra
| N
umbe
r &
Ope
ratio
ns
Spe
ed
Time in Hours
t = 0 hr. t = 1 hr.
Car A
Car B
The given graph represents velocity vs. time for two cars. Assume that the cars start from the same position and are traveling in the same direction.
(a) State the relationship between the position of car A and that of carB at t = 1 hr. Explain.
(b) State the relationship between the velocity of car A and that of car B at t = 1 hr. Explain.
(c) State the relationship between the acceleration of car A and that ofcar B at t = 1 hr. Explain.
(d ) How are the positions of the two cars related during the timeinterval between t = 0.75 hr. and t = 1 hr.? (That is, is onecar pulling away from the other?) Explain.
Fig. 7.11.
A problem requiring a sophisticatedunderstanding of change

Blank Page

In grades 9–12 all students should—
• analyze properties and determine attributes of two- and three-dimensionalobjects;
• explore relationships (including congruence and similarity) among classes oftwo- and three-dimensional geometric objects, make and test conjecturesabout them, and solve problems involving them;
• establish the validity of geometric conjectures using deduction, provetheorems, and critique arguments made by others;
• use trigonometric relationships to determine lengths and angle measures.
• use Cartesian coordinates and other coordinate systems, such asnavigational, polar, or spherical systems, to analyze geometric situations;
• investigate conjectures and solve problems involving two- and three-dimensional objects represented with Cartesian coordinates.
• understand and represent translations, reflections, rotations, and dilations ofobjects in the plane by using sketches, coordinates, vectors, functionnotation, and matrices;
• use various representations to help understand the effects of simpletransformations and their compositions.
• draw and construct representations of two- and three-dimensionalgeometric objects using a variety of tools;
• visualize three-dimensional objects from different perspectives and analyzetheir cross sections;
• use vertex-edge graphs to model and solve problems;• use geometric models to gain insights into, and answer questions in, other
areas of mathematics;• use geometric ideas to solve problems in, and gain insights into, other
disciplines and other areas of interest such as art and architecture.
Instructional programs fromprekindergarten through grade 12should enable all students to—
Analyze characteristics and proper-ties of two- and three-dimensionalgeometric shapes and developmathematical arguments about geometric relationships
Specify locations and describe spatial relationships using coordinategeometry and other representationalsystems;
Apply transformations and use symmetry to analyze mathematicalsituations
Use visualization, spatial reasoning,and geometric modeling to solveproblems
9–12Standard
for Grades
Expectations
Geometry
308 Principles and Standards for School Mathematics
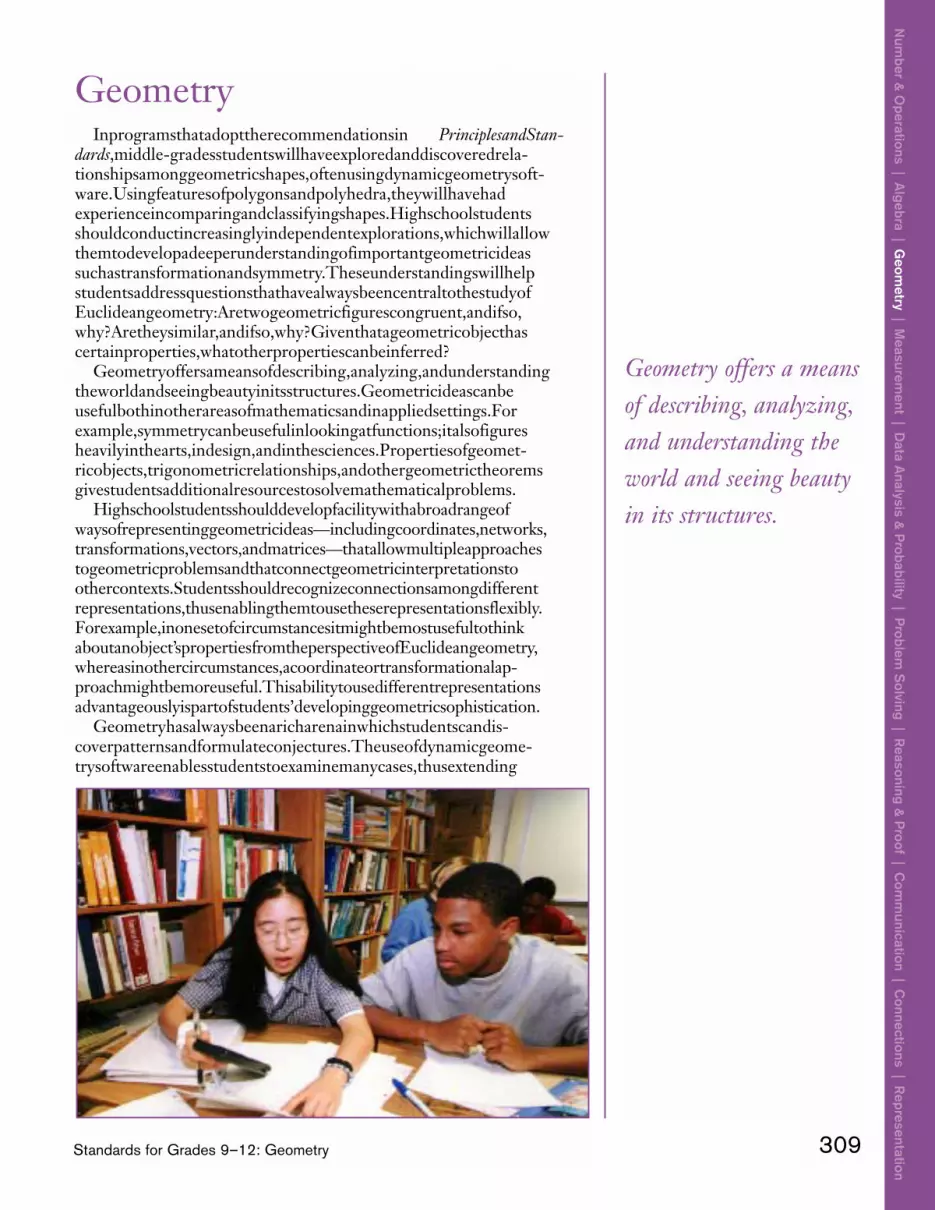
Geometry offers a meansof describing, analyzing,and understanding theworld and seeing beautyin its structures.
GeometryIn programs that adopt the recommendations in Principles and Stan-
dards, middle-grades students will have explored and discovered rela-tionships among geometric shapes, often using dynamic geometry soft-ware. Using features of polygons and polyhedra, they will have hadexperience in comparing and classifying shapes. High school studentsshould conduct increasingly independent explorations, which will allowthem to develop a deeper understanding of important geometric ideassuch as transformation and symmetry. These understandings will helpstudents address questions that have always been central to the study ofEuclidean geometry: Are two geometric figures congruent, and if so,why? Are they similar, and if so, why? Given that a geometric object hascertain properties, what other properties can be inferred?
Geometry offers a means of describing, analyzing, and understandingthe world and seeing beauty in its structures. Geometric ideas can beuseful both in other areas of mathematics and in applied settings. Forexample, symmetry can be useful in looking at functions; it also figuresheavily in the arts, in design, and in the sciences. Properties of geomet-ric objects, trigonometric relationships, and other geometric theoremsgive students additional resources to solve mathematical problems.
High school students should develop facility with a broad range ofways of representing geometric ideas—including coordinates, networks,transformations, vectors, and matrices—that allow multiple approachesto geometric problems and that connect geometric interpretations toother contexts. Students should recognize connections among differentrepresentations, thus enabling them to use these representations flexibly.For example, in one set of circumstances it might be most useful to thinkabout an object’s properties from the perspective of Euclidean geometry,whereas in other circumstances, a coordinate or transformational ap-proach might be more useful. This ability to use different representationsadvantageously is part of students’ developing geometric sophistication.
Geometry has always been a rich arena in which students can dis-cover patterns and formulate conjectures. The use of dynamic geome-try software enables students to examine many cases, thus extending
309Standards for Grades 9–12: Geometry
Num
ber & O
perations | Algebra | G
eometry | M
easurement | D
ata Analysis &
Probability | P
roblem S
olving | Reasoning &
Proof | C
omm
unication | Connections | R
epresentation

their ability to formulate and explore conjectures. Judging, constructing,and communicating mathematically appropriate arguments, however,remain central to the study of geometry. Students should see the powerof deductive proof in establishing the validity of general results fromgiven conditions. The focus should be on producing logical argumentsand presenting them effectively with careful explanation of the reason-ing, rather than on the form of proof used (e.g., paragraph proof or two-column proof). A particular challenge for high school teachers is to inte-grate technology in their teaching as a way of encouraging students toexplore ideas and develop conjectures while continuing to help them un-derstand the need for proofs or counterexamples of conjectures.
Analyze characteristics and properties of two- and three-dimensional geometric shapes and develop mathematicalarguments about geometric relationships
Students should enter high school understanding the properties of,and relationships among, basic geometric objects. In high school, thisknowledge can be extended and applied in various ways. Studentsshould become increasingly able to use deductive reasoning to establishor refute conjectures and should be able to use established knowledgeto deduce information about other situations. For example, a teachermight ask students to solve problems like that in figure 7.12.
Students need to put together a number of logical deductions inorder to solve this problem. The following proof demonstrates an abil-ity to select and focus on important elements in the diagram, and itshows a solid understanding of the concepts involved and how they canbe assembled to solve the problem. Note particularly how the fictionalstudent finds different connections to be sure her reasoning is sound.
First, I noticed that since AB and DE are parallel, angles B and Emust be congruent. Also, angles ACB and DCE are congruent, sincethey are vertical. So now I know that the two triangles (ABC corre-sponds to DEC ) are similar by angle-angle similarity. But that tellsme that their corresponding sides are proportional. Since DE =4(AB), I know that all the sides of triangle DEC are 4 times as largeas the corresponding sides of triangle ABC, so CD = 4(15) = 60. Now I just need to find the other side of triangle DEC to find itsperimeter. But DF makes it into 2 right triangles, so I can use the
310 Principles and Standards for School Mathematics
Rep
rese
ntat
ion
| C
onne
ctio
ns |
Com
mun
icat
ion
| R
easo
ning
& P
roof
| P
robl
em S
olvi
ng |
Dat
a A
naly
sis
& P
roba
bilit
y |
Mea
sure
men
t |
Geo
met
ry |
Alg
ebra
| N
umbe
r &
Ope
ratio
ns
Fig. 7.12.
A geometric problem requiring deduction and proof
In this figure, AB l l DE and DF ⊥ CE. Determine the perimeter of ABC and the perimeter of CDE. Explain completely how you found your answers and how you know they are correct.
A
B C
F E
48 52
D
13 15

Using dynamic geometrysoftware, students canquickly generate andexplore a range ofgeometric examples.
Pythagorean theorem on each of those. FE 2 + 482 = 522, so FE is 20.(Actually, I just noticed that this is just 4 times a 5-12-13 triangle, butI saw that too late.) Then looking at CDF, this is 12 times a 3-4-5 tri-angle, so CF must be 36. (I checked using the Pythagorean theoremand got the same answer.) So the perimeter is 52 + 60 + 56 = 168.Once I find the perimeter of ABC, I’m done. But that’s easy, sincethe scale factor from DEC to ABC is 25%. I can just divide 168 by 4and get 42. The reason that works is that each of the sides of ABC is25% of its corresponding side in DEC, so the whole perimeter ofABC will be 25% of DEC. We already proved that in class anyway.
High school students should begin to organize their knowledgeabout classes of objects more formally. Finding precise descriptions ofconditions that characterize a class of objects is an important first step.For example, students might define a trapezoid as a quadrilateral withat least one pair of parallel sides. They should realize that such a defini-tion includes parallelograms, rectangles, and squares as special classes oftrapezoids. Students might also ask, “How much information do I needto be sure a quadrilateral is a trapezoid? Do I need also to know some-thing about its diagonals and angles? Can I get by with just some of thisinformation?” As their ability to make logical deductions grows, stu-dents should be able to develop characterizations that follow directlyfrom the properties of parallel lines and similar triangles. Alternatively,the class of trapezoids could be characterized in terms of its diagonals:If the diagonals of a quadrilateral cut each other so that the ratios of thecorresponding segments of the diagonal are equal, then the quadrilat-eral is a trapezoid.
A teacher might ask a class to consider, on the basis of this character-ization, how trapezoids are related to other classes of quadrilaterals. Inconsidering parallelograms, students may note that the diagonals bisecteach other, so each is cut in a 1:1 ratio and therefore the parts are pro-portional. The obvious conclusion that parallelograms (and many otherclasses of quadrilaterals) may be considered a special kind of trapezoidmay seem unusual to those who think of a trapezoid as a quadrilateralwith exactly one pair of parallel sides. However, it is important for stu-dents to see that the definition chosen will determine the conclusionsthat can be drawn.
One of the most important challenges in mathematics teaching hasto do with the roles of evidence and justification, especially in increas-ingly technological environments. Using dynamic geometry software,students can quickly generate and explore a range of geometric exam-ples. If they have not learned the appropriate uses of proof and mathe-matical argumentation, they might argue that a conjecture must bevalid simply because it worked in all the examples they tried. Despitethe possibility of students’ developing such a misconception, in a class-room in which students understand the roles of experimentation, con-jecture, and proof, being able to generate and explore many examplescan result in deeper and more-extended mathematical investigationsthan might otherwise be possible. The following hypothetical exampleillustrates how students might investigate relationships in a dynamicgeometry environment and justify or refute conclusions.
The students are asked to draw a triangle, construct a new triangleby joining the midpoints of its three sides, and calculate the ratio of
311Standards for Grades 9–12: Geometry
Num
ber & O
perations | Algebra | G
eometry | M
easurement | D
ata Analysis &
Probability | P
roblem S
olving | Reasoning &
Proof | C
omm
unication | Connections | R
epresentation

the area of the midpoint triangle to the area of the original triangle(see fig. 7.13a). As they drag one vertex to create many different tri-angles, the students notice that the ratio of the two areas appears toremain constant at 0.25.Jake says he thinks that this relationship will always hold. He saysthat since the base of each of the four small triangles is a midline,each side of the midpoint triangle should be half as long as the par-allel side of the large triangle. Each midline cuts the altitude in half,so the height of each small triangle is half that of the large triangle.Dividing each of these lengths by 2 divides the area by 4, so the areaof the small triangle is one-fourth of the area of the large one.Berta agrees with Jake’s answer and thinks she can show that it mustbe true. She explains how she has extended the midlines and thesides of the triangles to form three pairs of parallel lines and is nowable to determine many pairs of congruent angles. She reasons,using parallelism, that the corresponding sides are congruent anddetermines that the three small triangles formed at the vertices ofthe original triangle are congruent by angle-side-angle. She is con-fident that the midpoint triangle should be congruent to the otherthree, but when the teacher asks her how she can be sure, she is un-able to give an explanation. The teacher asks one question: “Do youknow anything about the sides of that triangle?” Her friend Dawnquickly notes that all its sides are shared with the sides of the otherthree, which indicates that it would have to be the same size. Hope has a somewhat different way of looking at the situation. Shenotices that the lengths of the corresponding sides of the midpointtriangle and the original triangle are in a ratio of 1:2, so they mustbe similar. Thus, the area of the midpoint triangle must be one-fourth the area of the original on the basis of the class’s earlier ob-servation that the areas of similar triangles are related by the squareof their scale factor. The teacher asks the class to think about therelationship between Hope’s method and Jake’s method.The students decide to test whether a constant ratio exists for thearea of a “midpoint” quadrilateral to the area of a convex quadrilat-eral (see figure 7.13b). It appears that the area ratio in this case is0.5. They are able to prove this relationship by dividing a quadrilat-eral into two triangles and employing the methods they used in theprevious investigation. The students begin to wonder whether theyhave discovered a big idea. Does a constant ratio hold for otherpolygons? For the first few convex pentagons they try (see fig.7.13c), the area ratio appears to be constant at 0.7 (see Zbiek [1996]for a discussion about how this problem can be solved using tech-nology). When they are unable to generate a proof, they decide tocheck more examples. When they do so, they begin to see somevariation in the ratios. This development is disappointing to thestudents, who were hoping that the result they proved for trianglesand quadrilaterals would be general. Their teacher points out thatthey really should be encouraged by their results. They have made aseries of conjectures, produced proofs of some conjectures, and pro-duced counterexamples to show when other conjectures do nothold. That kind of careful thinking, he says, is truly mathematical.
312 Principles and Standards for School Mathematics
Rep
rese
ntat
ion
| C
onne
ctio
ns |
Com
mun
icat
ion
| R
easo
ning
& P
roof
| P
robl
em S
olvi
ng |
Dat
a A
naly
sis
& P
roba
bilit
y |
Mea
sure
men
t |
Geo
met
ry |
Alg
ebra
| N
umbe
r &
Ope
ratio
ns
E-example 7.3
Midpoint Connections and Area
(a)
(b)
(c)
Fig. 7.13.
Exploring and extending the resultsof connecting the midpoints of the
adjacent sides of polygons

Applied problems can furnish both rich contexts for using geometricideas and practice in modeling and problem solving. For example, right-triangle trigonometry is useful in solving a range of practical problems.Teachers can introduce students to problems such as the following,which is adapted from Hamilton and Hamilton (1993):
People working in the building trades sometimes need to divert their con-struction around obstacles. Although they often use simple offsets of 90°, 45°,or 30°, other angles are sometimes needed in areas where space is limited. A construction worker needs to reroute an underground pipe in order toavoid the root systems of two trees. She needs to raise the path of her pipe23 inches over a distance of over 86 inches [see fig. 7.14], and then con-tinue on a course parallel to that of the original pipe. What angles shouldshe cut in order to accomplish this?
When a section of pipe is cut at an angle, the cross section is an ellipse. If oneof the two resulting pieces is rotated 180 degrees about the axis going throughthe center of the pipe and then repositioned, the elliptical cross sectionsmatch each other, so the two pipes can be joined smoothly [see fig. 7.15].
A second cut will be needed to send the pipe on in the original direction, asin [figure 7.14]. The angles marked θ are equal in measure, as are the anglesmarked φ. In order to proceed, the pipe fitter needs to find the two angles atwhich to cut the materials as well as the length C of the connecting piece.
To find θ and φ, students need to observe that 2θ + β = 180°, 2φ+ (90˚ – β) = 270°, and tan(β) = 23/86. Working through this kind of prob-lem can help students develop visualization skills and see how what theyhave learned can be applied in meaningful contexts.
Specify locations and describe spatial relationships usingcoordinate geometry and other representational systems
Geometric problems can be presented and approached in variousways. For example, many problems from Euclidean geometry, such asshowing that the medians of any triangle intersect at a point, can be
313Standards for Grades 9–12: Geometry
Num
ber & O
perations | Algebra | G
eometry | M
easurement | D
ata Analysis &
Probability | P
roblem S
olving | Reasoning &
Proof | C
omm
unication | Connections | R
epresentation
86 inches
θ θ
β23 inches
Cφ φ
θ θθ
θ
Fig. 7.14.
The rerouting of an undergroundpipe
Fig. 7.15.
Cutting and repositioning a pipe

approached through coordinate geometry. Although it is possible touse a different variable for the coordinates of each vertex (especially ifa CAS package is effectively used), a “without loss of generality” argu-ment can be used to lower the level of symbolic complexity. This typeof argument relies on conveniently placing a coordinate plane over ageneral triangle (or other figure), often so that the coordinate axis co-incides with a side of the triangle. By making clever choices aboutnaming the coordinates of the vertices, taking care, of course, to besure that the choices do not introduce unintended conditions, the cal-culations can be quite reasonable. Once they have obtained a repre-sentation like that in figure 7.16, students could determine the equa-tions of two of the medians, find the point at which they intersect,and show that the third median passes through that point. Althoughproofs of this kind can be difficult for high school students, grapplingwith them may stimulate growth in students’ understanding of geom-etry, algebraic variables, and generality.
In grades 9–12 students should also explore problems for whichusing other coordinate systems is helpful. They should have some fa-miliarity with spherical and simple polar coordinate systems, as well aswith systems used in navigation. Using rectangular coordinates, for ex-ample, students should learn to represent points that lie on a circle ofradius 3 centered at the origin as
for –3 ≤ x ≤ 3. With polar coordinates, these pairs are represented moresimply as (3, θ) for 0 ≤ θ ≤ 2π, where θis measured in radians. Studentsshould be able to explain why both of these forms describe the pointson a circle. The polar-coordinate representation is simpler in this ex-ample and may be more useful for solving certain problems.
Apply transformations and use symmetry to analyzemathematical situations
Middle-grades students should have had experience with such basicgeometric transformations as translations, reflections, rotations, and di-lations (including contractions). In high school they will learn to repre-sent these transformations with matrices, exploring the properties ofthe transformations using both graph paper and dynamic geometry
314 Principles and Standards for School Mathematics
Rep
rese
ntat
ion
| C
onne
ctio
ns |
Com
mun
icat
ion
| R
easo
ning
& P
roof
| P
robl
em S
olvi
ng |
Dat
a A
naly
sis
& P
roba
bilit
y |
Mea
sure
men
t |
Geo
met
ry |
Alg
ebra
| N
umbe
r &
Ope
ratio
ns
x
y
(0, 0)
(b, c)
(a, 0)
(a + b, c)
(2b, 2c)
(2a, 0)
Fig. 7.16.
A diagram that shows the use of coordinate geometry to prove thatthe medians of a triangle intersect
x x, ± −( )9 2

tools. For example, students who are familiar with matrix multiplicationcould be introduced to matrix representations of transformationsthrough tasks such as the one in figure 7.17.
By graphing the triangle and its image, students can see that the firstquestion amounts to determining P, Q, R, and S in the following trans-formation matrix, where the vertices of the triangles are collected into a2 × 3 matrix for convenience:
They might solve the resulting set of equations, showing that the trans-formation matrix is
Alternatively, they might observe that they need to find an M so that
and explore various possibilities until observing that
Other transformations with easily accessible matrix representations in-clude reflections over either axis and about the line y = –x, rotationsabout the origin that are multiples of 90 degrees, and dilations from theorigin. Students should understand that multiplying transformationmatrices corresponds to composing the transformations represented.They should also understand that transformations have many practicalapplications.
Use visualization, spatial reasoning, and geometricmodeling to solve problems
Creating and analyzing perspective drawings, thinking about how linesor angles are formed on a spherical surface, and working to understandorientation and drawings in a three-dimensional rectangular coordinate
315Standards for Grades 9–12: Geometry
Num
ber & O
perations | Algebra | G
eometry | M
easurement | D
ata Analysis &
Probability | P
roblem S
olving | Reasoning &
Proof | C
omm
unication | Connections | R
epresentation
P QR S
− − −
=
− − −
5 41 7
85
1 75 4
58
0 11 0
.
Mxy
yx
•
=
0 11 0
=
•
xy
yx
.
Fig. 7.17.
Representing a reflection using a ma-trix (See a similar example in Senket al. [1996].)
(–8, 5)C
(–4, 7)B
(–5, 1)A
A ′ B ′
C ′
(1, –5) (7, –4)
(5, –8)
Consider a triangle ABC with vertices A = (–5, 1), B = (–4, 7), and C = (–8, 5).
Reflect the triangle over the line y = x to obtain the triangle A′B ′C ′as shown.
Determine a matrix M such that MA = A′, MB = B ′, and MC = C ′, where the points are represented as vectors.
Explore the properties of the matrix M.

system all afford opportunities for students to think and reason spatially.With the expanding role of computer graphics in the workplace, studentswill have increased needs and opportunities to use visualization as aproblem-solving tool. Schooling should provide rich mathematical settingsin which they can hone their visualization skills. Visualizing a building rep-resented in architectural plans, the shape of a cross section formed when aplane slices through a cone (a conic section) or another solid object, or theshape of the solid swept out when a plane figure is rotated about an axis be-come easier when students work with physical models, drawings, and soft-ware capable of manipulating three-dimensional representations.
Geometric relationships explain procedures used by artists for draw-ing in perspective (see Smith [1995]), as demonstrated by the followingperspective problem adapted from Consortium for Mathematics and ItsApplications (1999, pp. 65–67):
An artist wants to draw a set of evenly spaced telephone poles along theside of a straight road, starting with two telephone poles as shown in figure7.18a below. Where should the third telephone pole be placed so that itappears as far from the second as the second is from the first?
The intersection of the line through the bottoms of the telephonepoles with the line through their tops is the vanishing point for thisfamily of mutually parallel lines in the perspective drawing. Since thetops and bottoms of the two telephone poles are corners of a rectangleand since the type of transformation used in producing perspectivedrawings preserves intersections, drawing the diagonals of the trans-formed rectangle locates the image of its center under the transforma-tion. Drawing the line through the center to the vanishing point locatesthe midpoints of the telephone poles (fig. 7.18b).
The midpoint of the second telephone pole is also the center of therectangle whose sides are the first and third telephone poles (fig. 7.18c).Thus the line from the top of the first telephone pole through the mid-point of the second pole intersects the ground at the bottom of thethird telephone pole (fig. 7.18c); the top of the third pole can be locatedsimilarly. Finally, removing the lines used in the construction yields the
316 Principles and Standards for School Mathematics
Rep
rese
ntat
ion
| C
onne
ctio
ns |
Com
mun
icat
ion
| R
easo
ning
& P
roof
| P
robl
em S
olvi
ng |
Dat
a A
naly
sis
& P
roba
bilit
y |
Mea
sure
men
t |
Geo
met
ry |
Alg
ebra
| N
umbe
r &
Ope
ratio
ns
Fig. 7.18.
Locating telephone poles so that theyappear equidistant in a perspective
drawing
(a) The two telephone poles (b) The vanishing point, thehorizon, and the center ofthe rectangle
(c) The diagonals of arectangle determine thelocation of the thirdtelephone pole.
(d) The three telephonepoles in perspective

desired perspective drawing (fig. 7.18d). The process can be continuedto locate other telephone poles along the same line.
Although problems formulated for mathematics classes are typicallystated with great precision, underspecified problems that students needto formulate clearly for themselves also play an important role. The fol-lowing problem (Keynes 1998, p. 109) draws on students’ knowledge ofgeometric and trigonometric relationships and on their spatial-visual-ization skills. The way it is posed compels students to determine whatadditional information is needed, an important aspect of working prob-lems in real-world contexts.
You are installing track lighting in an old warehouse that is being remod-eled into a restaurant. The lights can adequately illuminate up to 15 feetfrom the bulbs and, at that distance, illuminate a circle with a 6-foot diam-eter. Figure out where to place the tracks and the bulbs to provide formaximum illumination of the customer area.
Students might compile a list of questions such as these: Is the ceil-ing flat or vaulted? What is the height of the ceiling? What is thesquare footage of the customer area? A discussion of this type furthersstudents’ abilities to solve real problems, which are typically much moreopen-ended than those found in textbooks.
The following problem comes from discrete mathematics. Vertex-edge graphs can be used to find optimal solutions to problems involvingpaths, networks, or relationships among a finite number of objects.This example, adapted from Coxford et al. (1998, p. 326), illustratesthese ideas.
Seven small towns in Smith County are connected to one another by dirtroads, as shown in the diagram in figure 7.19. (The diagram depicts onlythe beginnings, ends, and lengths of the roads. The roads may be straightor curved.) The distances are given in kilometers. The county, which has alimited budget, wants to pave some roads so that people can get fromevery town to every other town on paved roads, either directly or indi-rectly, but they want to minimize the total number of kilometers paved.Find a network of paved roads that will fulfill these requirements.
The diagram in figure 7.19 is a vertex-edge graph modeling the roadnetwork. The goal is to find a subnetwork of the given network that isconnected, contains no circuits, includes all the cities (vertices), andminimizes the sum of the distances represented by each edge in the net-work. Such a network is called a minimal spanning tree. There are many
317Standards for Grades 9–12: Geometry
Num
ber & O
perations | Algebra | G
eometry | M
easurement | D
ata Analysis &
Probability | P
roblem S
olving | Reasoning &
Proof | C
omm
unication | Connections | R
epresentation
Fig. 7.19.
A vertex-edge graph depicting thelengths of roads between towns
C
G
B
A
D E
10
15
25
20
2013 14
19
25
18
26
18
F

ways to approach this problem, and students should be encouraged toshare as many different approaches as possible with the class. Studentscan and will approach this problem in many ways, many of which willmatch the standard, formal solution methods. Students should first begiven the opportunity to think about the characteristics of a paved roadnetwork that will satisfy the given requirements. This will often leadthem to formulate the definition of a minimal spanning tree for them-selves. Then they can begin to find a solution systematically. For exam-ple, students often proceed as follows: First, choose the shortest edge(AB). Then choose the shortest remaining edge (BD). Continue in thisway, but never choose an edge that closes a circuit. One solution foundby using this method is AB, BD, EF, BF, FG, CD (total length = 88).
Another commonly tried method is to start at A, then go to the“nearest neighbor,” then the nearest neighbor from there, and so on.This leads to AB, BD, DC, and then a dead end, since moving on fromC creates a circuit. Students might try to resolve this dead-end problemby starting at a different vertex, or they might try to modify theirmethod by finding the nearest neighbor to any vertex that has alreadybeen reached (and, as always, not creating a circuit). This latter ap-proach leads to AB, BD, DC, BF, EF, FG (total length = 88). As studentstry these different methods, they should be encouraged to fully specifytheir methods as algorithms, compare algorithms with other students,and consider which algorithms produce the desired results and whichseem to be easier or more efficient. As it turns out, these two solutionmethods commonly used by students are the two most commonly usedstandard algorithms, namely, Kruskal’s algorithm and Prim’s algorithm.
Students should learn how to formulate and apply other vertex-edge-graph models to solve problems. For example, they can use criti-cal paths to optimally schedule large projects like a school dance or aconstruction project. Using each edge exactly once (an Euler path), stu-dents can plan an optimal snow-plowing route or an optimal layout formoving people efficiently through a museum. Using each vertex ex-actly once (a Hamiltonian path), students can find an optimal route forcollecting money from ATM machines or an optimal path for a robotto follow in a manufacturing plant. Vertex-coloring methods can beused to solve problems that involve conflict management, such as opti-mally assigning frequencies to radio stations or scheduling committeemeetings.
318 Principles and Standards for School Mathematics
Rep
rese
ntat
ion
| C
onne
ctio
ns |
Com
mun
icat
ion
| R
easo
ning
& P
roof
| P
robl
em S
olvi
ng |
Dat
a A
naly
sis
& P
roba
bilit
y |
Mea
sure
men
t |
Geo
met
ry |
Alg
ebra
| N
umbe
r &
Ope
ratio
ns

Blank Page

In grades 9–12 all students should—
• make decisions about units and scales that are appropriate for problemsituations involving measurement.
• analyze precision, accuracy, and approximate error in measurementsituations;
• understand and use formulas for the area, surface area, and volume ofgeometric figures, including cones, spheres, and cylinders;
• apply informal concepts of successive approximation, upper and lowerbounds, and limit in measurement situations;
• use unit analysis to check measurement computations.
Instructional programs fromprekindergarten through grade 12should enable all students to—
Understand measurable attributesof objects and the units, systems,and processes of measurement
Apply appropriate techniques,tools, and formulas to determinemeasurements
9–12Standard
for Grades
Expectations
Measurement
320 Principles and Standards for School Mathematics

Opportunities to useand understandmeasurement arisenaturally during highschool in other areas ofmathematics, in science,and in technicaleducation.
MeasurementStudents should enter grades 9–12 with a good understanding of
measurement concepts and well-developed measurement skills. In addi-tion to reading measurements directly from instruments, studentsshould have calculated distances indirectly and used derived measures,such as rates.
Opportunities to use and understand measurement arise naturallyduring high school in other areas of mathematics, in science, and intechnical education. Measuring the number of revolutions per minuteof an engine, vast distances in astronomy, or microscopic molecular dis-tances extends students’ facility with derived measures and indirectmeasurement. Calculator- and computer-based measurement instru-ments facilitate the collection, storage, and analysis of real-time mea-surement data. Through logarithmic scaling, students can graphicallyrepresent a relatively large range of measurements. Insight into formu-las for the volume or surface area of a cone or a sphere can be gained byapplying methods of successive approximation. These aspects of mea-surement, along with considerations of precision and error, are impor-tant in the students’ high school experience.
Understand measureable attributes of objects and theunits, systems, and processes of measurement
Students should enter high school adept at using rates to express mea-surements of some attributes. Cars and buses travel at velocities expressedin miles per hour or kilometers per hour, the growth of plants is recordedin centimeters per day, and birth rates are often reported in births per1000 people. By the time students reach high school, they should be readyto make sound decisions about how quantities should be measured andrepresented, depending on the situation and the problem under considera-tion. For example, the velocity of an insect measured as 4 centimeters asecond is easier to understand than a velocity of 0.00004 kilometers a sec-ond, although they are equal. Students extend their understanding of mea-surement in the sciences, where many measurements are indirect. For ex-ample, they can determine the height of a bridge if they know it takesthree seconds for a ball dropped off the bridge to hit the water below.
With the widespread use of calculator and computer technologies forgathering and displaying data, students should understand that selec-tions of scale and viewing window become important choices. For ex-ample, the line f (x) = x appears to intersect the two coordinate axes atan angle of 45 degrees only when the horizontal and vertical scales arethe same. Likewise, circles viewed on screens where the horizontal andvertical scales differ look like ellipses. The local and global behavior ofa function shown in different viewing windows can appear very differ-ent; at times, small differences in choices can lead to significant differ-ences in the visual messages. Teachers can help students understandhow to make strategic choices about scale and viewing window so thatthey can solve the problems they are addressing most effectively.
Nonlinear scales help represent some naturally occurring phenom-ena. For example, human ears have the ability to differentiate amongsounds of low intensity that are very close together, but they do not
321Standards for Grades 9–12: Measurement
Num
ber & O
perations | Algebra | G
eometry | M
easurement | D
ata Analysis &
Probability | P
roblem S
olving | Reasoning &
Proof | C
omm
unication | Connections | R
epresentation

distinguish as well among sounds of high intensity. Consequently, mea-sures of sound intensity are often displayed on a logarithmic scale, tiedto equally spaced decibel units as shown in the chart in figure 7.20(units are in newtons per square meter). Students should be able tocompare, for example, the loudness of a whisper (20 decibels) with thatof a vacuum cleaner (80 decibels), noting that for each ten-decibel in-crease, the sound intensity increases by a factor of 10.
Apply appropriate techniques, tools, and formulas todetermine measurements
High school students should be able to make reasonable estimatesand sensible judgments about the precision and accuracy of the valuesthey report. Teachers can help students understand that measurementsof continuous quantities are always approximations. For example, sup-pose a situation calls for determining the mass of a bar of gold bullionin the shape of a rectangular prism whose length, width, and height aremeasured as 27.9 centimeters, 10.2 centimeters, and 6.4 centimeters,respectively. Knowing that the density is 19 300 kilograms per cubicmeter, students might compute the mass as follows:
The students need to understand that reporting the mass with thisdegree of precision would be misleading because it would suggest a de-gree of accuracy far greater than the actual accuracy of the measure-ment. Since the lengths of the edges are reported to the nearest tenth ofa centimeter, the measurements are precise only to 0.05 centimeter.That is, the edges could actually have measures in the intervals 27.9 ±0.05, 10.2 ± 0.05, and 6.4 ± 0.05. If students calculate the possible maxi-mum and minimum mass, given these dimensions, they will see that atmost one decimal place in accuracy is justified.
As suggested by the example above, units should be reported alongwith numerical values in measurement computations. The followingproblem requires both an understanding of derived measurements andfacility in unit analysis—keeping track of units during computations:
While driving through Canada in the late 1990s, a U.S. tourist put 60liters of gas in his car. The gas cost Can$0.50 a liter (Can$ stands forCanadian dollars). The exchange rate at that time was Can$1.49 for eachUS$1.00 (United States dollar). The price for a gallon of gasoline in the
322 Principles and Standards for School Mathematics
Rep
rese
ntat
ion
| C
onne
ctio
ns |
Com
mun
icat
ion
| R
easo
ning
& P
roof
| P
robl
em S
olvi
ng |
Dat
a A
naly
sis
& P
roba
bilit
y |
Mea
sure
men
t |
Geo
met
ry |
Alg
ebra
| N
umbe
r &
Ope
ratio
ns
0 10 20 30 40 50 60 70 80 90 100 110 120 130 140
10–5 10–4 10–3 10–2 10–1 100 101 102 103 104 105 106 107 108 109
Barely audiblewhisper
Vacuuming Listening toWalkman
Jet engines heardfrom nearby
Decibels
Sound intensity innewtons per m2
Fig. 7.20.
A chart showing that the decibelscale is logarithmic
Mass = density volume
kgm 10
mcm
cm
kg
3 6
3
33
( ) ( )
=
( )
=
⋅⋅ ⋅19300
11821 312
35 1513216
.
.

United States was US$0.99. The driver wanted to compare prices and de-cide whether a tank of gas was cheaper in the United States or Canada.
The cost of the gasoline in Canada follows:
Teachers can help students recognize that in order to compute thecost of the same quantity of gasoline in the United States, it is necessaryto convert between both monetary systems and units of volume. Thus,in addition to knowing the exchange rate, it is necessary to know thatthere are approximately 3.79 liters in each gallon of gas. The cost of 60liters of gasoline at the U.S. price can then be seen to be
so the gas is less expensive in the United States. This computation illus-trates how unit analysis can be helpful in keeping track of the conversions.
An important measurement idea, which also helps to establish thegroundwork for some fundamental ideas of calculus, is that the measure-ments of some quantities can be determined by sequences of increas-ingly accurate approximations. For example, suppose that students areexploring ways to find the volumes of three-dimensional solids. Studentsshould know that the volume of any right cylinder is the product of itsheight and the area of its base. Thus the volume of a right circular cylin-der would be πr 2h, where r is the radius of its base and h is its height.But how could students determine the volume of a cone?
To illustrate, the right circular cone shown in figure 7.21 has base ra-dius 5 centimeters and height 10 centimeters. Using similar triangles,students should be able to see that slicing the cone parallel to the baseat 2-centimeter intervals yields four nearly cylindrical disks and a smallcone, each of height 2 centimeters. Each of those five figures would fitcompletely inside a cylinder that is 2 centimeters high and that has thesame radius as its bottom cross section. Hence, the cumulative volumeis less than 2(π × 52 + π × 42 + π × 32 + π × 22 + π × 12) cm3 = 110πcm3.At the same time, each of the five figures contains as a subset a cylinderthat has the radius of its top cross section. Thus the cumulative volumemust be at least 2(π × 42 + π × 32 + π × 22 + π × 12 + π × 02) cm3 = 60πcm3. Repeating the process with 1-centimeter-thick slices would helpstudents see that as they take thinner slices of the cone, the overesti-mates and underestimates of the volume get increasingly close to eachother. (Indeed, the averages of the underestimates and overestimatesrapidly approach the actual volume of (83 1/3)πcm3.) Informally, suchexperiences serve as an introduction to the idea of approximation byusing upper and lower bounds and to the idea of limits. Whether or notthese ideas are pursued later in formal coursework, they can introducepowerful ways of thinking about mathematical phenomena and helpstudents establish a basic familiarity with core ideas of calculus.
323Standards for Grades 9–12: Measurement
Num
ber & O
perations | Algebra | G
eometry | M
easurement | D
ata Analysis &
Probability | P
roblem S
olving | Reasoning &
Proof | C
omm
unication | Connections | R
epresentation
5 cm
{
5 cm
{2 cm }
2 cm
{
2 cm } 1cm
{
2 cm }
4 cm
{2 cm }3 cm
{2 cm }
Fig. 7.21.
Slices of a cone can be used to ap-proximate the volume of the cone byusing upper and lower bounds.
Can$0.50 1 L
L = CAN$30.00• 60
US$0.99 1 gal
1 gal3.79 L
LCan$1.49US$1.00
Can$23.35,• • •60

In grades 9–12 all students should—
• understand the differences among various kinds of studies and which typesof inferences can legitimately be drawn from each;
• know the characteristics of well-designed studies, including the role ofrandomization in surveys and experiments;
• understand the meaning of measurement data and categorical data, ofunivariate and bivariate data, and of the term variable;
• understand histograms, parallel box plots, and scatterplots and use them todisplay data;
• compute basic statistics and understand the distinction between a statisticand a parameter.
• for univariate measurement data, be able to display the distribution, describeits shape, and select and calculate summary statistics;
• for bivariate measurement data, be able to display a scatterplot, describe itsshape, and determine regression coefficients, regression equations, andcorrelation coefficients using technological tools;
• display and discuss bivariate data where at least one variable is categorical;• recognize how linear transformations of univariate data affect shape, center,
and spread;• identify trends in bivariate data and find functions that model the data or
transform the data so that they can be modeled.
• use simulations to explore the variability of sample statistics from a knownpopulation and to construct sampling distributions;
• understand how sample statistics reflect the values of population parametersand use sampling distributions as the basis for informal inference;
• evaluate published reports that are based on data by examining the design of thestudy, the appropriateness of the data analysis, and the validity of conclusions;
• understand how basic statistical techniques are used to monitor processcharacteristics in the workplace.
• understand the concepts of sample space and probability distribution andconstruct sample spaces and distributions in simple cases;
• use simulations to construct empirical probability distributions;• compute and interpret the expected value of random variables in simple cases;• understand the concepts of conditional probability and independent events;• understand how to compute the probability of a compound event.
Instructional programs fromprekindergarten through grade 12should enable all students to—
Formulate questions that can beaddressed with data and collect, organize, and display relevant datato answer them
Select and use appropriate statisti-cal methods to analyze data
Develop and evaluate inferencesand predictions that are based ondata
Understand and apply basic concepts of probability
9–12Standard
for Grades
Expectations
Data Analysis and Probability
324
In grades 9–12 studentsshould gain a deepunderstanding of theissues entailed indrawing conclusions inlight of variability.
Data Analysis and ProbabilityStudents whose mathematics curriculum has been consistent with the
recommendations in Principles and Standards should enter high schoolhaving designed simple surveys and experiments, gathered data, andgraphed and summarized those data in various ways. They should be fa-miliar with basic measures of center and spread, able to describe theshape of data distributions, and able to draw conclusions about a singlesample. Students will have computed the probabilities of simple andsome compound events and performed simulations, comparing the re-sults of the simulations to predicted probabilities.
In grades 9–12 students should gain a deep understanding of the is-sues entailed in drawing conclusions in light of variability. They willlearn more-sophisticated ways to collect and analyze data and drawconclusions from data in order to answer questions or make informeddecisions in workplace and everyday situations. They should learn toask questions that will help them evaluate the quality of surveys, obser-vational studies, and controlled experiments. They can use their ex-panding repertoire of algebraic functions, especially linear functions, tomodel and analyze data, with increasing understanding of what it meansfor a model to fit data well. In addition, students should begin to under-stand and use correlation in conjunction with residuals and visual dis-plays to analyze associations between two variables. They should be-come knowledgeable, analytical, thoughtful consumers of theinformation and data generated by others.
As students analyze data in grades 9–12, the natural link between sta-tistics and algebra can be developed further. Students’ understandingsof graphs and functions can also be applied in work with data.
Basic ideas of probability underlie much of statistical inference. Prob-ability is linked to other topics in high school mathematics, especiallycounting techniques (Number and Operations), area concepts (Geome-try), the binomial theorem, and relationships between functions and thearea under their graphs (Algebra). Students should learn to determinethe probability of a sample statistic for a known population and to drawsimple inferences about a population from randomly generated samples.
Formulate questions that can be addressed with data andcollect, organize, and display relevant data to answer them
Students’ experiences with surveys and experiments in lower gradesshould prepare them to consider issues of design. In high school, stu-dents should design surveys, observational studies, and experiments thattake into consideration questions such as the following: Are the issuesand questions clear and unambiguous? What is the population? Howshould the sample be selected? Is a stratified sample called for? Whatsize should the sample be? Students should understand the concept ofbias in surveys and ways to reduce bias, such as using randomization inselecting samples. Similarly, when students design experiments, theyshould begin to learn how to take into account the nature of the treat-ments, the selection of the experimental units, and the randomizationused to assign treatments to units. Examples of situations studentsmight consider are shown in figure 7.22.
325Standards for Grades 9–12: Data Analysis and Probability
Num
ber & O
perations | Algebra | G
eometry | M
easurement | D
ata Analysis &
Probability | P
roblem S
olving | Reasoning &
Proof | C
omm
unication | Connections | R
epresentation

There are many reasons to be careful in conducting surveys and ana-lyzing the results. In the survey example, the ambiguity of the questionabout computer usage makes it impossible to interpret the resultsmeaningfully. Students designing surveys must also deal with samplingprocedures. The goal of a survey is to generalize from a sample to thepopulation from which it is drawn. Students must understand that asample is most likely to be representative when it has been randomlychosen from the population.
Nonrandomness in sampling may also limit the conclusions that canbe drawn from observational studies. For instance, in the observationalstudy example, it is not certain that the number of people riding trainsreflects the number of people who would ride trains if more were avail-able or if scheduling were more convenient. Similarly, it would be inap-propriate to draw conclusions about the percentage of the populationthat ice skates on the basis of observational studies done either in
There are manyreasons to be careful inconducting surveys and
analyzing the results.
326 Principles and Standards for School Mathematics
Rep
rese
ntat
ion
| C
onne
ctio
ns |
Com
mun
icat
ion
| R
easo
ning
& P
roof
| P
robl
em S
olvi
ng |
Dat
a A
naly
sis
& P
roba
bilit
y |
Mea
sure
men
t |
Geo
met
ry |
Alg
ebra
| N
umbe
r &
Ope
ratio
ns
Survey
An opinion survey asked people, “Do you use a computer?”
Maria answered Yes because she thought the question meant had she ever used a computer.
Eric answered No because he thought the question was asking whether he used one regularly.
Alex answered No because he only played games on the computer and didn’t think this counted as “using” one.
The ambiguity of the question renders the results of the survey useless and makes any conclusions drawn from those results very questionable.
Observational Study
The city of New York has sufficient funds to run one additional commuter train each weekday. Officials must decide whether it would be better to add a train during the morning or the evening rush hour.
Determining the average number of commuters currently riding the train from 6:00 to 9:00 A.M. and the average number riding from 4:00 to 6:00 P.M. on weekdays would provide valuable information about the habits of current riders.
However, conclusions based on this information might not take into account people who currently drive to work to avoid overcrowding on trains.
Experiment
An experiment to determine which brand of tires lasts longest tests one brand on the front wheels and one brand on the rear wheels of cars in rural Montana.
Many factors could explain experimental differences; for example, front-wheel drive or frequent or infrequent braking can systematically cause uneven wear.
To minimize the number of extraneous or confounding factors, it would be better to randomly assign two tires of each kind to the wheels of each car. Also, to broaden the base of applicability, the test should be performed under conditions that involve city as well as rural driving.
Fig. 7.22.
Three kinds of situations in whichstatistics are used

Describing center,spread, and shape isessential to the analysisof both univariate andbivariate data.
Florida or in Quebec. Students need to be aware that any conclusionsabout cause and effect should be made very cautiously in observationalstudies. They should also know how certain kinds of systematic obser-vations, such as random testing of manufacturing parts taken from anassembly line, can be used for purposes of quality control.
In designed experiments, two or more experimental treatments (orconditions) are compared. In order for such comparisons to be valid,other sources of variation must be controlled. This is not the situation inthe tire example, in which the front and rear tires are subjected to differ-ent kinds of wear. Another goal in designed experiments is to be able todraw conclusions with broad applicability. For this reason, new tiresshould be tested on all relevant road conditions. Consider another de-signed experiment in which the goal is to test the effect of a treatment(such as getting a flu shot) on a response (such as getting the flu) forolder people. This is done by comparing the responses of a treatmentgroup, which gets treatment, with those of a control group, which doesnot. Here, the investigators would randomly choose subjects for theirstudy from the population group to which they want to generalize, say,all males and females aged 65 or older. They would then randomly as-sign these individuals to the control and treatment groups. Note that in-teresting issues arise in the choice of subjects (not everyone wants to oris able to participate—could this introduce bias?) and in the concept of acontrol group (are these seniors then at greater risk of getting the flu?).
Select and use appropriate statistical methods toanalyze data
Describing center, spread, and shape is essential to the analysis of bothunivariate and bivariate data. Students should be able to use a variety ofsummary statistics and graphical displays to analyze these characteristics.
The shape of a distribution of a single measurement variable can beanalyzed using graphical displays such as histograms, dotplots, stem-and-leaf plots, or box plots. Students should be able to construct thesegraphs and select from among them to assist in understanding the data.They should comment on the overall shape of the plot and on pointsthat do not fit the general shape. By examining these characteristics ofthe plots, students should be better able to explain differences in mea-sures of center (such as mean or median) and spread (such as standarddeviation or interquartile range). For example, students should recog-nize that the statement “the mean score on a test was 50 percent” maycover several situations, including the following: all scores are 50 per-cent; half the scores are 40 percent and half the scores are 60 percent;half the scores are 0 percent and half the scores are 100 percent; onescore is 100 percent and 50 scores are 49 percent. Students should alsorecognize that the sample mean and median can differ greatly for askewed distribution. They should understand that for data that areidentified by categories—for example, gender, favorite color, or ethnicorigin—bar graphs, pie charts, and summary tables often display infor-mation about the relative frequency or percent in each category.
Students should learn to apply their knowledge of linear transforma-tions from algebra and geometry to linear transformations of data. Theyshould be able to explain why adding a constant to all observed values ina sample changes the measures of center by that constant but does not
327Standards for Grades 9–12: Data Analysis and Probability
Num
ber & O
perations | Algebra | G
eometry | M
easurement | D
ata Analysis &
Probability | P
roblem S
olving | Reasoning &
Proof | C
omm
unication | Connections | R
epresentation

change measures of spread or the general shape of the distribution.They should also understand why multiplying each observed value bythe same constant multiplies the mean, median, range, and standard de-viation by the same factor (see the related discussion in the “Reasoningand Proof” section of this chapter).
The methods used for representing univariate measurement data alsocan be adapted to represent bivariate data where one variable is cate-gorical and the other is a continuous measurement. The levels of thecategorical variable split the measurement variable into groups. Stu-dents can use parallel box plots, back-to-back stem-and-leaf, or same-scale histograms to compare the groups. The following problem fromMoore (1990, pp. 108–9) illustrates conclusions that can be drawn fromsuch comparisons:
U.S. Department of Agriculture regulations group hot dogs into three types:beef, meat, and poultry. Do these types differ in the number of calories theycontain? The three boxplots to the left display the distribution of caloriesper hot dog among brands of the three types. The box ends mark the quar-tiles, the line within the box is the median, and the whiskers extend to thesmallest and largest individual observations. We see that beef and meat hotdogs are similar but that poultry hot dogs as a group show considerablyfewer calories per hot dog.
Analyses of the relationships between two sets of measurement dataare central in high school mathematics. These analyses involve findingfunctions that “fit” the data well. For instance, students could examinethe scatterplot of bivariate measurement data shown in figure 7.23 andconsider what type of function (e.g., linear, exponential, quadratic)might be a good model. If the plot of the data seems approximately lin-ear, students should be able to produce lines that fit the data, to com-pare several such lines, and to discuss what best fit might mean. Thisanalysis includes stepping back and making certain that what is beingdone makes sense practically.
The dashed vertical line segments in figure 7.23 represent residuals—the differences between the y-values predicted by the linear model and
328 Principles and Standards for School Mathematics
Rep
rese
ntat
ion
| C
onne
ctio
ns |
Com
mun
icat
ion
| R
easo
ning
& P
roof
| P
robl
em S
olvi
ng |
Dat
a A
naly
sis
& P
roba
bilit
y |
Mea
sure
men
t |
Geo
met
ry |
Alg
ebra
| N
umbe
r &
Ope
ratio
ns
Movie Screen and Box-Office Revenue
Number of Screens
Box
-Offi
ce R
even
ues
($10
000s
)
1200
1000
800
600
400
200
00 500 1000 1500 2000 2500
Fig. 7.23.
Fitting a line to the data displayed ina scatterplot (Adapted from Burrill
et al. [1999, pp. 14–15, 20])
200
180
160
140
120
100
80
Cal
orie
s pe
r F
rank
Beef Meat Poultry

Students shouldunderstand thatcorrelation does notimply a cause-and-effectrelationship.
the actual y-values—for three data points. Teachers can help students ex-plore several ways of using residuals to define best fit. For example, a can-didate for best-fitting line might be chosen to minimize the sum of theabsolute values of residuals; another might minimize the sum of squaredresiduals. Using dynamic software, students can change the position ofcandidate lines for best fit and see the effects of those changes on squaredresiduals. The line illustrated in figure 7.23, which minimizes the sum ofthe squares of the residuals, is called the least-squares regression line. Usingtechnology, students should be able to compute the equation of the least-squares regression line and the correlation coefficient, r.
Students should understand that the correlation coefficient r givesinformation about (1) how tightly packed the data are about the regres-sion line and (2) about the strength of the relationship between the twovariables. Students should understand that correlation does not imply acause-and-effect relationship. For example, the presence of certainkinds of eye problems and the loss of sensitivity in people’s feet can berelated statistically. However, the correlation may be due to an underly-ing cause, such as diabetes, for both symptoms rather than to onesymptom’s causing the other.
Develop and evaluate inferences and predictions thatare based on data
Once students have determined a model for a data set, they can usethe model to make predictions and recognize and explain the limitationsof those predictions. For example, the regression line depicted in figure7.23 has the equation y = 0.33x – 93.9, where x represents the number ofscreens and y represents box-office revenues (in units of $10 000). Tohelp students understand the meaning of the regression line, its role inmaking predictions and inferences, and its limitations and possible ex-tensions, teachers might ask questions like the following:
1. Predict the revenue of a movie that is shown on 800 screens nation-wide. Of a movie that is shown on 2500 screens. Discuss the accuracyand limitations of your predictions.
2. Explain the meaning of a slope of 0.33 in the screen-revenue context.3. Explain why the y-intercept of the regression line does not have mean-
ing in the box-office-revenue context.4. What other variables might help in predicting box-office revenues?
A parameter is a single number that describes some aspect of an en-tire population, and a statistic is an estimate of that value computedfrom some sample of the population. To understand terms such asmargin of error in opinion polls, it is necessary to understand how statis-tics, such as sample proportions, vary when different random samplesare chosen from a population. Similarly, sample means computed frommeasurement data vary according to the random sample chosen, so it isimportant to understand the distribution of sample means in order toassess how well a specific sample mean estimates the population mean.
Understanding how to draw inferences about a population from ran-dom samples requires understanding how those samples might be dis-tributed. Such an understanding can be developed with the aid of simu-lations. Consider the following situation:
329Standards for Grades 9–12: Data Analysis and Probability
Num
ber & O
perations | Algebra | G
eometry | M
easurement | D
ata Analysis &
Probability | P
roblem S
olving | Reasoning &
Proof | C
omm
unication | Connections | R
epresentation
E-example 7.4
Exploring Least Squares
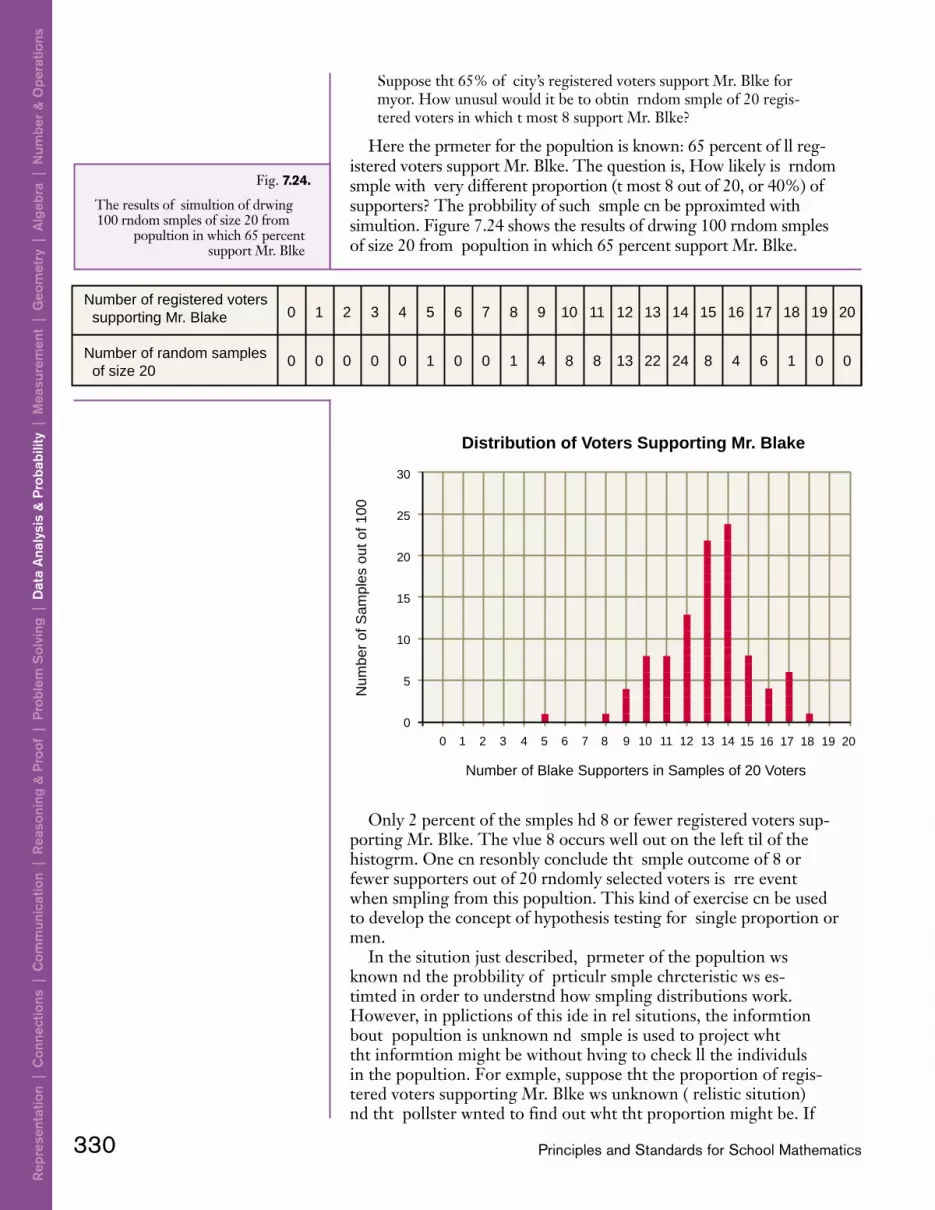
Suppose that 65% of a city’s registered voters support Mr. Blake formayor. How unusual would it be to obtain a random sample of 20 regis-tered voters in which at most 8 support Mr. Blake?
Here the parameter for the population is known: 65 percent of all reg-istered voters support Mr. Blake. The question is, How likely is a randomsample with a very different proportion (at most 8 out of 20, or 40%) ofsupporters? The probability of such a sample can be approximated with asimulation. Figure 7.24 shows the results of drawing 100 random samplesof size 20 from a population in which 65 percent support Mr. Blake.
Only 2 percent of the samples had 8 or fewer registered voters sup-porting Mr. Blake. The value 8 occurs well out on the left tail of thehistogram. One can reasonably conclude that a sample outcome of 8 orfewer supporters out of 20 randomly selected voters is a rare eventwhen sampling from this population. This kind of exercise can be usedto develop the concept of hypothesis testing for a single proportion ormean.
In the situation just described, a parameter of the population wasknown and the probability of a particular sample characteristic was es-timated in order to understand how sampling distributions work.However, in applications of this idea in real situations, the informationabout a population is unknown and a sample is used to project whatthat information might be without having to check all the individualsin the population. For example, suppose that the proportion of regis-tered voters supporting Mr. Blake was unknown (a realistic situation)and that a pollster wanted to find out what that proportion might be. If
330 Principles and Standards for School Mathematics
Rep
rese
ntat
ion
| C
onne
ctio
ns |
Com
mun
icat
ion
| R
easo
ning
& P
roof
| P
robl
em S
olvi
ng |
Dat
a A
naly
sis
& P
roba
bilit
y |
Mea
sure
men
t |
Geo
met
ry |
Alg
ebra
| N
umbe
r &
Ope
ratio
ns
Distribution of Voters Supporting Mr. Blake
Number of Blake Supporters in Samples of 20 Voters
Num
ber
of S
ampl
es o
ut o
f 100
30
25
20
15
10
5
0
0 1 2 3 4 5 6 7 8 9 10 11 12 13 14 15 16 17 18 19 20
Number of registered voters supporting Mr. Blake
Number of random samples of size 20
0 1 2 3 4 5 6 7 8 9 10 11 12 13 14 15 16 17 201918
0 0 0 0 0 1 0 0 1 4 8 8 13 22 24 8 4 6 001
Fig. 7.24.
The results of a simulation of drawing100 random samples of size 20 from a
population in which 65 percentsupport Mr. Blake

the pollster surveyed a sample of 20 voters and found that 65 percentof them support the candidate, is it reasonable to expect that about 65percent of all voters support the candidate? What if the sample was200 voters? 2000 voters? As indicated above, the proportion of voterswho supported Mr. Blake could vary substantially from sample to sam-ple in samples of 20. There is much less variation in samples of 200. Byperforming simulations with samples of different sizes, students cansee that as sample size increases, variation decreases. In this way, theycan develop the intuitive underpinnings for understanding confidenceintervals.
A similar kind of reasoning about the relationship between the char-acteristics of a sample and the population from which it is drawn liesbehind the use of sampling for monitoring process control and qualityin the workplace.
Understand and apply basic concepts of probabilityIn high school, students can apply the concepts of probability to pre-
dict the likelihood of an event by constructing probability distributionsfor simple sample spaces. Students should be able to describe samplespaces such as the set of possible outcomes when four coins are tossedand the set of possibilities for the sum of the values on the faces that aredown when two tetrahedral dice are rolled.
High school students should learn to identify mutually exclusive,joint, and conditional events by drawing on their knowledge of combi-nations, permutations, and counting to compute the probabilities asso-ciated with such events. They can use their understandings to addressquestions such as those in following series of examples.
The diagram at the right shows the results of a two-question survey ad-ministered to 80 randomly selected students at Highcrest High School. • Of the 2100 students in the school, how many would you expect to play
a musical instrument?
331Standards for Grades 9–12: Data Analysis and Probability
Num
ber & O
perations | Algebra | G
eometry | M
easurement | D
ata Analysis &
Probability | P
roblem S
olving | Reasoning &
Proof | C
omm
unication | Connections | R
epresentation
Do you play a musical instrument?
Yes
Yes
No
No
14 32
20 14
Do
you
play
on
a s
port
s te
am?

• Estimate the probability that an arbitrary student at the school plays ona sports team and plays a musical instrument. How is this related to esti-mates of the separate probabilities that a student plays a musical instru-ment and that he or she plays on a sports team?
• Estimate the probability that a student who plays on a sports team alsoplays a musical instrument.
High school students should learn to compute expected values. Theycan use their understanding of probability distributions and expectedvalue to decide if the following game is fair:
You pay 5 chips to play a game. You roll two tetrahedral dice with facesnumbered 1, 2, 3, and 5, and you win the sum of the values on the facesthat are not showing.
Teachers can ask students to discuss whether they think the game isfair and perhaps have the students play the game a number of times tosee if there are any trends in the results they obtain. They can thenhave the students analyze the game. First, students need to delineatethe sample space. The outcomes are indicated in figure 7.25. The num-bers on the first die are indicated in the top row. The numbers on thesecond die are indicated in the first column. The sums are given in theinterior of the table. Since all outcomes are equally likely, each cell inthe table has a probability of 1/16 of occurring.
Students can determine that the probability of a sum of 2 is 1/16; of a 3, 1/8; of a 4, 3/16; of a 5, 1/8; of a 6, 3/16; of a 7, 1/8; of an 8, 1/8;of a 10, 1/16. The expected value of a player’s “income” in chips fromrolling the dice is
If a player pays a five-chip fee to play the game, on average, theplayer will win 0.5 chips. The game is not statistically fair, since theplayer can expect to win.
Students can also use the sample space to answer conditional proba-bility questions such as “Given that the sum is even, what is the proba-bility that the sum is a 6?” Since ten of the sums in the sample space areeven and three of those are 6s, the probability of a 6 given that the sumis even is 3/10.
The following situation, adapted from Coxford et al. (1998, p. 469),could give rise to a very rich classroom discussion of compound events.
In a trial in Sweden, a parking officer testified to having noted the positionof the valve stems on the tires on one side of a car. Returning later, the of-ficer noted that the valve stems were still in the same position. The officernoted the position of the valve stems to the nearest “hour.” For example,in figure 7.26 the valve stems are at 10:00 and at 3:00. The officer issued aticket for overtime parking. However, the owner of the car claimed he hadmoved the car and returned to the same parking place. The judge who presided over the trial made the assumption that thewheels move independently and the odds of the two valve stems return-ing to their previous “clock” positions were calculated as 144 to 1. Thedriver was declared to be innocent because such odds were consideredinsufficient—had all four valve stems been found to have returned totheir previous positions, the driver would have been declared guilty(Zeisel 1968).
332 Principles and Standards for School Mathematics
Rep
rese
ntat
ion
| C
onne
ctio
ns |
Com
mun
icat
ion
| R
easo
ning
& P
roof
| P
robl
em S
olvi
ng |
Dat
a A
naly
sis
& P
roba
bilit
y |
Mea
sure
men
t |
Geo
met
ry |
Alg
ebra
| N
umbe
r &
Ope
ratio
ns
Fig. 7.25.
The sample space for the roll of twotetrahedral dice
1
1
2
2
3
3
5
2 3 4 6
3 4 5 7
4 5 6 8
6 7 8 105
First die
Sec
ond
die
21
163
18
43
165
18
63
167
18
818
101
165 5
+
+
+
+
+
+
+
= . chips.

Given the assumption that the wheels move independently, studentscould be asked to assess the probability that if the car is moved, two (orfour) valve stems would return to the same position. They could do soby a direct probability computation, or they might design a simulation,either by programming or by using spinners, to estimate this probabil-ity. But is it reasonable to assume that two front and rear wheels or allfour wheels move independently? This issue might be resolved empiri-cally. The students might drive a car around the block to see if itswheels do rotate independently of one another and decide if the judge’sassumption was justified. They might consider whether it would bemore reasonable to assume that all four wheels move as a unit and askrelated questions: Under what circumstances might all four wheelstravel the same distance? Would all the wheels travel the same distanceif the car was driven around the block? Would any differences be largeenough to show up as differences in “clock” position? In this way, stu-dents can learn about the role of assumptions in modeling, in additionto learning about the computation of probabilities.
Students could also explore the effect of more-precise measurementson the resulting probabilities. They could calculate the probabilities if,say, instead of recording markings to the nearest hour on the clockface,the markings had been recorded to the nearest half or quarter hour.This line of thinking could raise the issue of continuous distributionsand the idea of calculating probabilities involving an interval of valuesrather than a finite number of values. Some related questions are, Howcould a practical method of obtaining more-precise measurements bedevised? How could a parking officer realistically measure tire-markingpositions to the nearest clock half-hour? How could measurement er-rors be minimized? These could begin a discussion of operational defi-nitions and measurement processes.
Students should be able to investigate the following question byusing a simulation to obtain an approximate answer:
How likely is it that at most 25 of the 50 people receiving a promotion arewomen when all the people in the applicant pool from which the promo-tions are made are well qualified and 65% of the applicant pool is female?
Those students who pursue the study of probability will be able tofind an exact solution by using the binomial distribution. Either way,students are likely to find the result rather surprising.
333Standards for Grades 9–12: Data Analysis and Probability
Num
ber & O
perations | Algebra | G
eometry | M
easurement | D
ata Analysis &
Probability | P
roblem S
olving | Reasoning &
Proof | C
omm
unication | Connections | R
epresentation
Fig. 7.26.
A diagram of tires with valves at the10:00 and 3:00 positions

9–12Standard
for Grades
Problem Solving
To meet new challenges in work, school, and life, students will haveto adapt and extend whatever mathematics they know. Doing so effec-tively lies at the heart of problem solving. A problem-solving disposi-tion includes the confidence and willingness to take on new and diffi-cult tasks. Successful problem solvers are resourceful, seeking outinformation to help solve problems and making effective use of whatthey know. Their knowledge of strategies gives them options. If thefirst approach to a problem fails, they can consider a second or athird. If those approaches fail, they know how to reconsider the prob-lem, break it down, and look at it from different perspectives—all ofwhich can help them understand the problem better or make progresstoward its solution. Part of being a good problem solver is being agood planner, but good problem solvers do not adhere blindly toplans. Instead, they monitor progress and consider and make adjust-ments when things are not going as well as they should (Schoenfeld1985).
In high school, students’ repertoires of problem-solving strategiesexpand significantly because students are capable of employing more-complex methods and their abilities to reflect on their knowledge andact accordingly have grown. Thus, students should emerge from highschool with the disposition, knowledge, and strategies to deal with thenew challenges they will encounter.
As in the earlier grades, problems and problem solving play an es-sential role in students’ learning of mathematical content and in help-ing students make connections across mathematical content areas.Much of school mathematics can be seen as the codification of an-swers to sets of interesting problems. Accordingly, much of themathematics that students encounter can be introduced by posing in-teresting problems on which students can make legitimate progress.(See, for example, the use of such an example in Mr. Robinson’s class,as described in the “Connections” section of this chapter.) Approach-ing the content in this way does more than motivate students. It re-veals mathematics as a sense-making discipline rather than one inwhich rules for working exercises are given by the teacher to be mem-orized and used by students.
Instructional programs fromprekindergarten through grade 12should enable all students to—
Build new mathematical knowledgethrough problem solving
Solve problems that arise in mathe-matics and in other contexts
Apply and adapt a variety of appro-priate strategies to solve problems
Monitor and reflect on the processof mathematical problem solving
334 Principles and Standards for School Mathematics

Most mathematicalconcepts orgeneralizations can beeffectively introducedusing a problemsituation.
What should problem solving look like in grades 9through 12?
Problem solving plays a dual role in the high school curriculum. Onthe one hand, solving problems that have been strategically chosen andcarefully sequenced is a fundamental vehicle for learning mathematicalcontent (see the “counting rectangles” problem later in this section). Inaddition to carefully designing problems, teachers should seize unex-pected opportunities (see the discussion of Ms. Rodriguez’s class later inthis section) to use problems to engage students in important mathe-matical ideas and to develop a deep understanding of those ideasthrough such engagement. Most mathematical concepts or generaliza-tions can be effectively introduced using a problem situation that helpsstudents see important aspects of the idea to be generalized. For exam-ple, rather than begin the consideration of the volume of a sphere byreminding students of the formula or technique for computing the vol-ume, a teacher might begin by posing a question such as “How mightyou find the volume of a sphere whose radius is ten centimeters?” Asstudents consider possible approaches, they can come to appreciate thedifficulties inherent in what appears to be an easy question. In other in-stances, their proposed solutions may either directly lead to the desiredconclusion or serve as a springboard to class discussions of the idea.
On the other hand, a major goal of high school mathematics is toequip students with knowledge and tools that enable them to formulate,approach, and solve problems beyond those that they have studied.High school students should have significant opportunities to develop abroad repertoire of problem-solving (or heuristic) strategies. Theyshould have opportunities to formulate and refine problems becauseproblems that occur in real settings do not often arrive neatly packaged.Students need experience in identifying problems and articulating themclearly enough to determine when they have arrived at solutions. Thecurriculum should include problems for which students know the goalto be achieved but for which they need to specify—or perhaps gatherfrom other sources—the kinds of information needed to achieve it. Re-call, for example, the “track lighting” problem discussed in the “Geom-etry” section of this chapter. In addressing the problem, students wouldneed to know about the geometry of the floor plan, about the structureand height of the ceiling, about the positioning of the “customer area,”and about the areas that should receive priority lighting.
The following problem serves multiple purposes. It gives studentsan opportunity to build their content knowledge during the problem-solving process, to learn or practice some heuristic strategies, and tomake connections among various ways of thinking about the samemathematical content. It might be posed during a unit on combina-torics or as part of an ongoing series of problems that are given out ofcontext so that students have to determine the relevant approaches forthemselves.
How many rectangles are there on a standard 8 × 8 checkerboard? Countonly those rectangles (including squares) whose sides lie on grid lines. Forexample, there are nine rectangles on a 2 × 2 board, as shown in figure 7.27.
There are numerous ways to approach and solve this problem. Stu-dents should be given significant latitude to explore it rather than be led
335Standards for Grades 9–12: Problem Solving
Num
ber & O
perations | Algebra | G
eometry | M
easurement | D
ata Analysis &
Probability | P
roblem S
olving | Reasoning &
Proof | C
omm
unication | Connections | R
epresentation
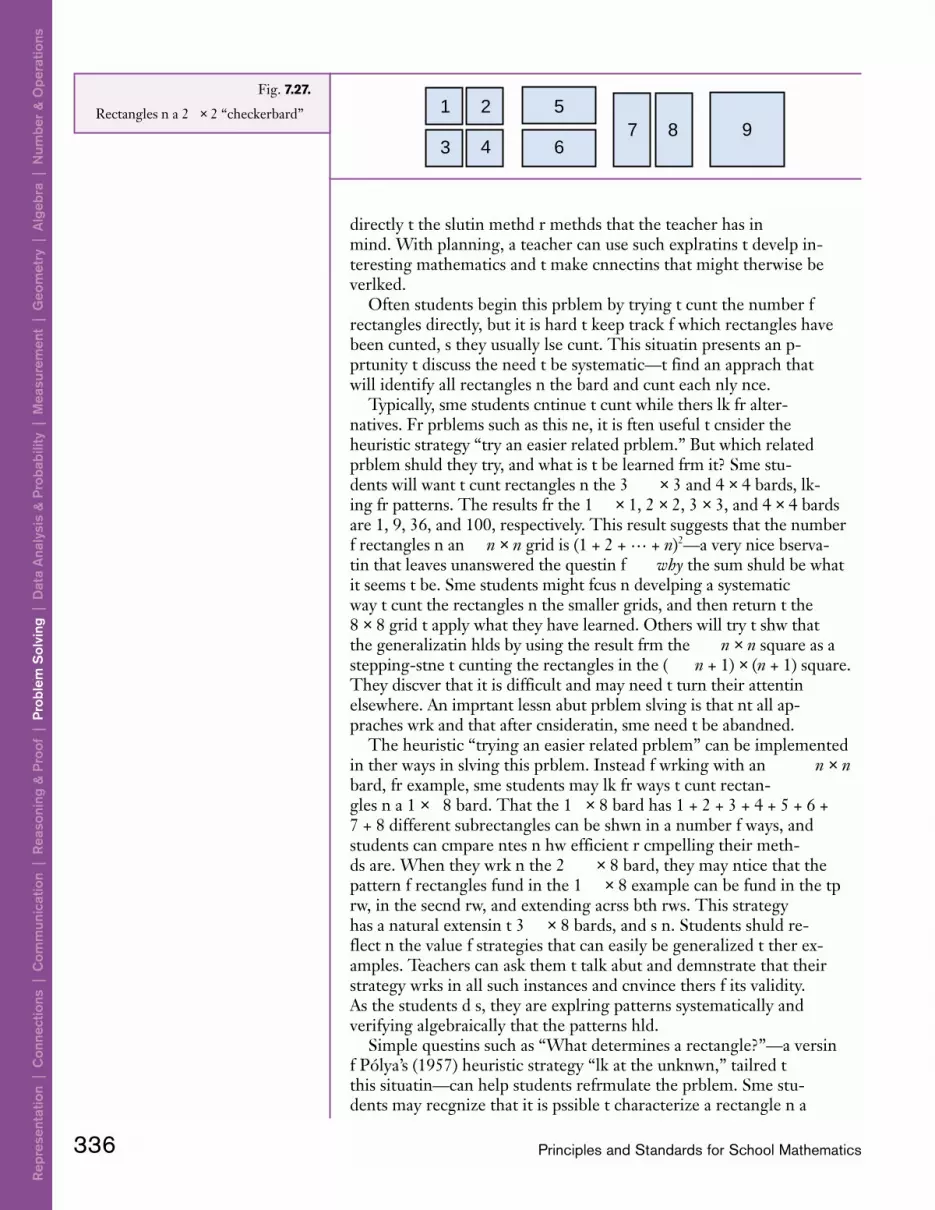
directly to the solution method or methods that the teacher has inmind. With planning, a teacher can use such explorations to develop in-teresting mathematics and to make connections that might otherwise beoverlooked.
Often students begin this problem by trying to count the number ofrectangles directly, but it is hard to keep track of which rectangles havebeen counted, so they usually lose count. This situation presents an op-portunity to discuss the need to be systematic—to find an approach thatwill identify all rectangles on the board and count each only once.
Typically, some students continue to count while others look for alter-natives. For problems such as this one, it is often useful to consider theheuristic strategy “try an easier related problem.” But which relatedproblem should they try, and what is to be learned from it? Some stu-dents will want to count rectangles on the 3 × 3 and 4 × 4 boards, look-ing for patterns. The results for the 1 × 1, 2 × 2, 3 × 3, and 4 × 4 boardsare 1, 9, 36, and 100, respectively. This result suggests that the numberof rectangles on an n × n grid is (1 + 2 + … + n)2—a very nice observa-tion that leaves unanswered the question of why the sum should be whatit seems to be. Some students might focus on developing a systematicway to count the rectangles on the smaller grids, and then return to the8 × 8 grid to apply what they have learned. Others will try to show thatthe generalization holds by using the result from the n × n square as astepping-stone to counting the rectangles in the (n + 1) × (n + 1) square.They discover that it is difficult and may need to turn their attentionelsewhere. An important lesson about problem solving is that not all ap-proaches work and that after consideration, some need to be abandoned.
The heuristic “trying an easier related problem” can be implementedin other ways in solving this problem. Instead of working with an n × nboard, for example, some students may look for ways to count rectan-gles on a 1 × 8 board. That the 1 × 8 board has 1 + 2 + 3 + 4 + 5 + 6 + 7 + 8 different subrectangles can be shown in a number of ways, andstudents can compare notes on how efficient or compelling their meth-ods are. When they work on the 2 × 8 board, they may notice that thepattern of rectangles found in the 1 × 8 example can be found in the toprow, in the second row, and extending across both rows. This strategyhas a natural extension to 3 × 8 boards, and so on. Students should re-flect on the value of strategies that can easily be generalized to other ex-amples. Teachers can ask them to talk about and demonstrate that theirstrategy works in all such instances and convince others of its validity.As the students do so, they are exploring patterns systematically andverifying algebraically that the patterns hold.
Simple questions such as “What determines a rectangle?”—a versionof Pólya’s (1957) heuristic strategy “look at the unknown,” tailored tothis situation—can help students reformulate the problem. Some stu-dents may recognize that it is possible to characterize a rectangle on a
336 Principles and Standards for School Mathematics
Rep
rese
ntat
ion
| C
onne
ctio
ns |
Com
mun
icat
ion
| R
easo
ning
& P
roof
| P
robl
em S
olvi
ng |
Dat
a A
naly
sis
& P
roba
bilit
y |
Mea
sure
men
t |
Geo
met
ry |
Alg
ebra
| N
umbe
r &
Ope
ratio
ns
1
3 4 6
297 8
5Fig. 7.27.
Rectangles on a 2 × 2 “checkerboard”

grid by specifying two opposite corners. They could then count thenumber of rectangles that have a fixed upper left corner on the 8 × 8grid as follows: Pick any corner on the grid. If there are m grid linesbelow that corner and n grid lines to the right of it, the number of rec-tangles on the grid with that point as an upper left corner is m × n. Thenumber of rectangles can then be indicated, as shown in figure 7.28,where the product written in each square of the grid is the number ofrectangles on the whole grid that have the same upper left corner as thesquare. The task becomes to add the 64 numbers in the grid. The firstcolumn sums to 8(8 + 7 + … + 1), the second column to 7(8 + 7 + … + 1),and so on. Hence the sum of the columns is (8 + 7 + … + 1) (8 + 7 + … + 1) =(8 + 7 + … + 1)2. This result confirms the conjecture that some studentshad made earlier, when they examined the 1 × 1, 2 × 2, 3 × 3, and 4 × 4grids, and presents an opportunity to see how one approach can shedlight on a result obtained by another method. Also, once the pattern isapparent, the students should be encouraged to abstract and representtheir results for more-general cases. They should, for instance, be ableto conjecture that the number of rectangles on an n × m board is (1 + 2 + … + n)(1 + 2 + … + m). From other work they might have doneadding sequences of consecutive integers, they should be able to repre-sent this as [(n)(n + 1)(m)(m + 1)/4].
Other heuristics may also prove useful. Some students may notice thateach rectangle in the 8 × 8 grid is determined by the lines on which itstop and bottom borders lie (there are choices) and the lines on whichits left and right borders lie (also choices). So there are rectan-gles in the 8 × 8 grid. This approach can be generalized to show thatthere are rectangles in an n × m grid. Thus, this problem pro-vides students with an opportunity to review counting techniques andshow their power, as well as to use their prior knowledge in other ap-proaches to solving the problem. Moreover, just as the class has not
337Standards for Grades 9–12: Problem Solving
Num
ber & O
perations | Algebra | G
eometry | M
easurement | D
ata Analysis &
Probability | P
roblem S
olving | Reasoning &
Proof | C
omm
unication | Connections | R
epresentation
8 × 8 7 × 8 6 × 8 5 × 8 4 × 8 3 × 8 2 × 8 1 × 8
8 × 7 7 × 7 6 × 7 5 × 7 4 × 7 3 × 7 2 × 7 1 × 7
8 × 6 7 × 6 6 × 6 5 × 6 4 × 6 3 × 6 2 × 6 1 × 6
8 × 5 7 × 5 6 × 5 5 × 5 4 × 5 3 × 5 2 × 5 1 × 5
8 × 4 7 × 4 6 × 4 5 × 4 4 × 4 3 × 4 2 × 4 1 × 4
8 × 3 7 × 3 6 × 3 5 × 3 4 × 3 3 × 3 2 × 3 1 × 3
8 × 2 7 × 2 6 × 2 5 × 2 4 × 2 3 × 2 2 × 2 1 × 2
8 × 1 7 × 1 6 × 1 5 × 1 4 × 1 3 × 1 2 × 1 1 × 1
Fig. 7.28.
The number of rectangles in an 8 × 8grid
92
92
92
92
•
n m+
+
•1
21
2
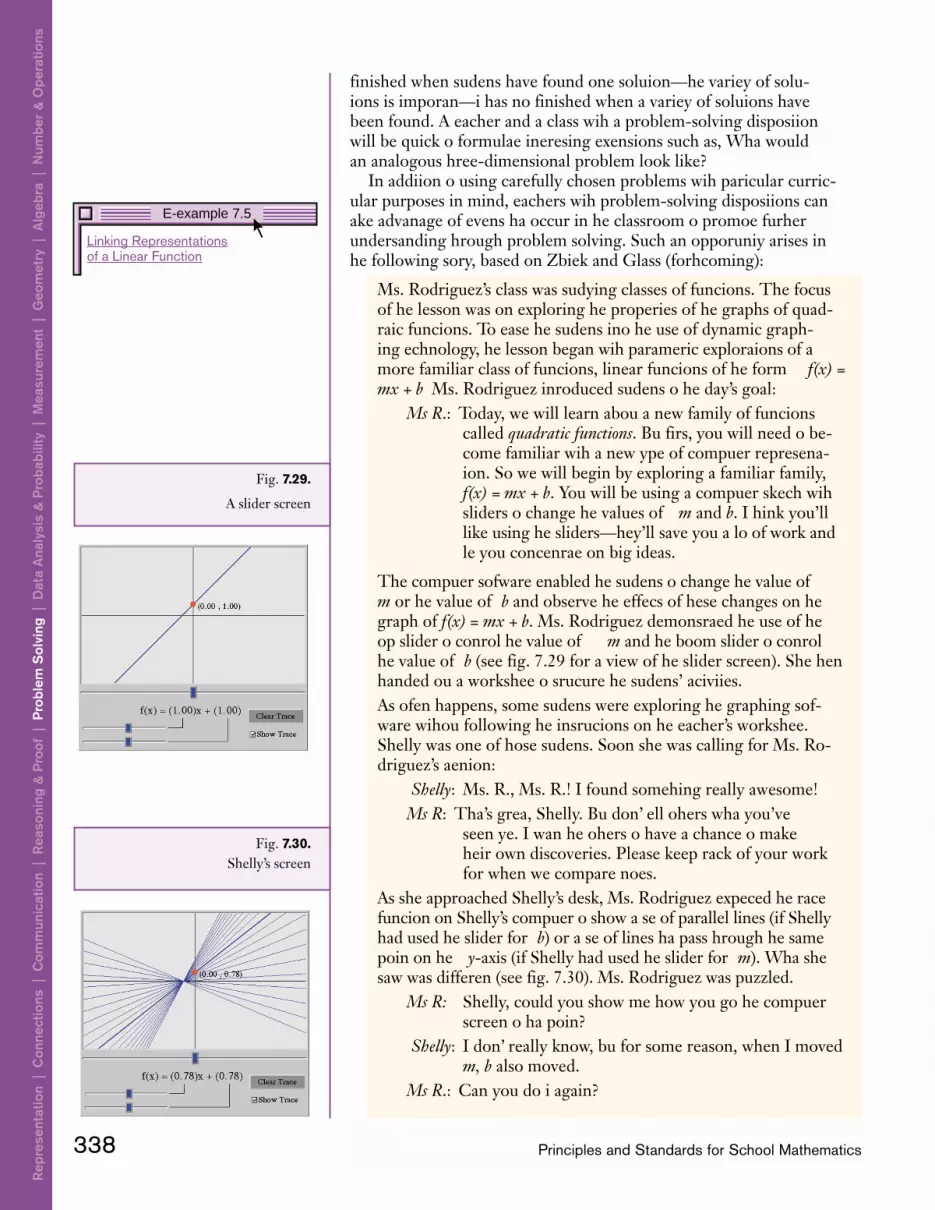
finished when students have found one solution—the variety of solu-tions is important—it has not finished when a variety of solutions havebeen found. A teacher and a class with a problem-solving dispositionwill be quick to formulate interesting extensions such as, What wouldan analogous three-dimensional problem look like?
In addition to using carefully chosen problems with particular curric-ular purposes in mind, teachers with problem-solving dispositions cantake advantage of events that occur in the classroom to promote furtherunderstanding through problem solving. Such an opportunity arises inthe following story, based on Zbiek and Glass (forthcoming):
Ms. Rodriguez’s class was studying classes of functions. The focusof the lesson was on exploring the properties of the graphs of quad-ratic functions. To ease the students into the use of dynamic graph-ing technology, the lesson began with parametric explorations of amore familiar class of functions, linear functions of the form f(x) =mx + b. Ms. Rodriguez introduced students to the day’s goal:
Ms. R.: Today, we will learn about a new family of functionscalled quadratic functions. But first, you will need to be-come familiar with a new type of computer representa-tion. So we will begin by exploring a familiar family,f(x) = mx + b. You will be using a computer sketch withsliders to change the values of m and b. I think you’lllike using the sliders—they’ll save you a lot of work andlet you concentrate on big ideas.
The computer software enabled the students to change the value ofm or the value of b and observe the effects of these changes on thegraph of f(x) = mx + b. Ms. Rodriguez demonstrated the use of thetop slider to control the value of m and the bottom slider to controlthe value of b (see fig. 7.29 for a view of the slider screen). She thenhanded out a worksheet to structure the students’ activities.As often happens, some students were exploring the graphing soft-ware without following the instructions on the teacher’s worksheet.Shelly was one of those students. Soon she was calling for Ms. Ro-driguez’s attention:
Shelly: Ms. R., Ms. R.! I found something really awesome!Ms. R.: That’s great, Shelly. But don’t tell others what you’ve
seen yet. I want the others to have a chance to maketheir own discoveries. Please keep track of your workfor when we compare notes.
As she approached Shelly’s desk, Ms. Rodriguez expected the tracefunction on Shelly’s computer to show a set of parallel lines (if Shellyhad used the slider for b) or a set of lines that pass through the samepoint on the y-axis (if Shelly had used the slider for m). What shesaw was different (see fig. 7.30). Ms. Rodriguez was puzzled.
Ms. R.: Shelly, could you show me how you got the computerscreen to that point?
Shelly: I don’t really know, but for some reason, when I movedm, b also moved.
Ms. R.: Can you do it again?
338 Principles and Standards for School Mathematics
Rep
rese
ntat
ion
| C
onne
ctio
ns |
Com
mun
icat
ion
| R
easo
ning
& P
roof
| P
robl
em S
olvi
ng |
Dat
a A
naly
sis
& P
roba
bilit
y |
Mea
sure
men
t |
Geo
met
ry |
Alg
ebra
| N
umbe
r &
Ope
ratio
ns
Fig. 7.29.
A slider screen
Fig. 7.30.Shelly’s screen
E-example 7.5
Linking Representationsof a Linear Function

Shelly demonstrated, clicking on m and b in such a way that bothsliders moved at the same time and rate. Since the m and b scaleswere the same, as she moved m, b moved the same amount.
Ms. R.: What’s the really awesome thing you are seeing?Shelly: Look! They all intersect at the same point.
Ms. R.: That is really interesting! Ms. Rodriguez found this observation intriguing and decided thatexploring the situation might lead to some interesting insights. Sheasked Shelly to show the class how she created the pattern. SoonMichael, intrigued by Shelly’s result, tried her technique on anotherfunction, with the result shown in figure 7.31.
Michael: Look at what happened! I got the same thing as Shelly,but I started with a different function.
At Ms. Rodriguez’s request, Michael demonstrated his finding forthe class.
Ms. R.: Tell us what you mean when you say you “got the samething.”
Michael: All my lines crossed at one point.Jerod: I tried a different one, and mine crossed at one point!
Ms. Rodriguez saw this development as an opportunity for groupproblem solving and knew that she could entice her students with achallenge. She asked, “Can anyone come up with a similar picturefor another linear function?” The room buzzed with activity as stu-dents tried Shelly’s technique. Some students helped one anotherlearn the technique while Ms. Rodriguez helped others. Every timethe students applied Shelly’s technique to a linear function, their setof equations passed through one point. As the students comparedtheir results, they began to notice that the points of intersectionalways had the x-value –1, a fact that rippled rapidly through the
339Standards for Grades 9–12: Problem Solving
Num
ber & O
perations | Algebra | G
eometry | M
easurement | D
ata Analysis &
Probability | P
roblem S
olving | Reasoning &
Proof | C
omm
unication | Connections | R
epresentation
Fig. 7.31.
Michael’s screen
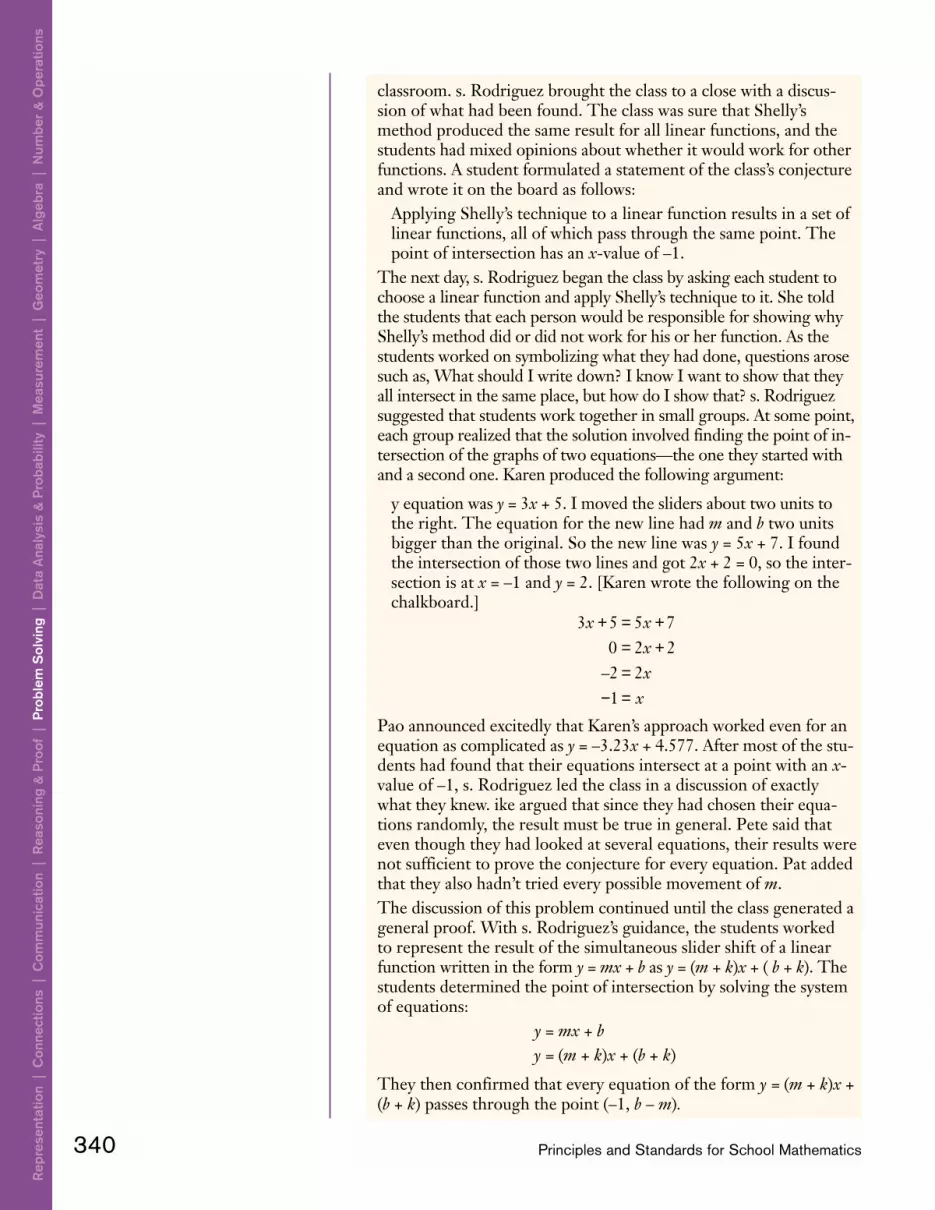
classroom. Ms. Rodriguez brought the class to a close with a discus-sion of what had been found. The class was sure that Shelly’smethod produced the same result for all linear functions, and thestudents had mixed opinions about whether it would work for otherfunctions. A student formulated a statement of the class’s conjectureand wrote it on the board as follows:
Applying Shelly’s technique to a linear function results in a set oflinear functions, all of which pass through the same point. Thepoint of intersection has an x-value of –1.
The next day, Ms. Rodriguez began the class by asking each student tochoose a linear function and apply Shelly’s technique to it. She toldthe students that each person would be responsible for showing whyShelly’s method did or did not work for his or her function. As thestudents worked on symbolizing what they had done, questions arosesuch as, What should I write down? I know I want to show that theyall intersect in the same place, but how do I show that? Ms. Rodriguezsuggested that students work together in small groups. At some point,each group realized that the solution involved finding the point of in-tersection of the graphs of two equations—the one they started withand a second one. Karen produced the following argument:
My equation was y = 3x + 5. I moved the sliders about two units tothe right. The equation for the new line had m and b two unitsbigger than the original. So the new line was y = 5x + 7. I foundthe intersection of those two lines and got 2x + 2 = 0, so the inter-section is at x = –1 and y = 2. [Karen wrote the following on thechalkboard.]
Pao announced excitedly that Karen’s approach worked even for anequation as complicated as y = –3.23x + 4.577. After most of the stu-dents had found that their equations intersect at a point with an x-value of –1, Ms. Rodriguez led the class in a discussion of exactlywhat they knew. Mike argued that since they had chosen their equa-tions randomly, the result must be true in general. Pete said thateven though they had looked at several equations, their results werenot sufficient to prove the conjecture for every equation. Pat addedthat they also hadn’t tried every possible movement of m. The discussion of this problem continued until the class generated ageneral proof. With Ms. Rodriguez’s guidance, the students workedto represent the result of the simultaneous slider shift of a linearfunction written in the form y = mx + b as y = (m + k)x + ( b + k). Thestudents determined the point of intersection by solving the systemof equations:
y = mx + by = (m + k)x + (b + k)
They then confirmed that every equation of the form y = (m + k)x +(b + k) passes through the point (–1, b – m).
340 Principles and Standards for School Mathematics
Rep
rese
ntat
ion
| C
onne
ctio
ns |
Com
mun
icat
ion
| R
easo
ning
& P
roof
| P
robl
em S
olvi
ng |
Dat
a A
naly
sis
& P
roba
bilit
y |
Mea
sure
men
t |
Geo
met
ry |
Alg
ebra
| N
umbe
r &
Ope
ratio
ns
3 5 5 70 2 22 21
x xxx
x
+ = += +=
− =–

Teaching is itself aproblem-solving activity.
Ms. Rodriguez may well have felt very satisfied at the end of thisepisode, since her class had had an opportunity to explore a strikinggraphical pattern observed by a student. The exploration had includedconsidering whether it would always work and if so, why. Pursuing theanswer to that question helped her students see the linkage between al-gebraic and graphical representations of functions and understand howalgebraic arguments can be used to establish the truth of a mathemati-cal conjecture. It gave them an opportunity to review and apply previ-ously learned knowledge of solving systems of equations. She will haveto revise her instructional plan for the coming weeks. However, this ex-perience has helped reinforce her students’ dispositions toward posingand solving problems as well as their algebraic fluency. Indeed, the situ-ation may have helped her students realize that mathematical situationscan be interesting and worthy of exploration. Thus problem posing andproblem solving led to a deeper understanding of both content andprocess.
What should be the teacher’s role in developingproblem solving in grades 9 through 12?
As Halmos (1980) writes, problem solving is the “heart of mathe-matics.” Successful problem solving requires knowledge of mathe-matical content, knowledge of problem-solving strategies, effectiveself-monitoring, and a productive disposition to pose and solve prob-lems. Teaching problem solving requires even more of teachers, sincethey must be able to foster such knowledge and attitudes in their stu-dents. A significant part of a teacher’s responsibility consists of planningproblems that will give students the opportunity to learn importantcontent through their explorations of the problems and to learn andpractice a wide range of heuristic strategies. The teacher must becourageous, for even well-planned lessons can veer into uncharted ter-ritory. Students may make novel suggestions as they try to solve prob-lems; they may make observations that give rise to new conjectures orexplorations; they may suggest generalizations whose validity may beunknown to the teacher. Teachers must exercise judgment in decidingwhat responses to pursue and recognize the potential for both produc-tive learning and improved attitudes when students generate new ideas,but they must also acknowledge that not all responses lead to fruitfuldiscussions and that time constraints do not allow them to pursue everyinteresting idea. It is the teacher’s job to make the tough calls. Theteacher must also be reflective in order to create an environment inwhich students are inclined to reflect on their work as they engage in it(Thompson 1992). In short, teaching is itself a problem-solving activity.Effective teachers of problem solving must themselves have the knowl-edge and dispositions of effective problem solvers.
341Standards for Grades 9–12: Problem Solving
Num
ber & O
perations | Algebra | G
eometry | M
easurement | D
ata Analysis &
Probability | P
roblem S
olving | Reasoning &
Proof | C
omm
unication | Connections | R
epresentation

9–12Standard
for Grades
Reasoning and Proof
Mathematics should make sense to students; they should see it as rea-soned and reasonable. Their experience in school should help them rec-ognize that seeking and finding explanations for the patterns they ob-serve and the procedures they use help them develop deeperunderstandings of mathematics. As illustrated throughout this chapter,opportunities for mathematical reasoning and proof pervade the highschool curriculum. Students should develop an appreciation of mathe-matical justification in the study of all mathematical content. In highschool, their standards for accepting explanations should become morestringent, and they should develop a repertoire of increasingly sophisti-cated methods of reasoning and proof.
What should reasoning and proof look like in grades 9through 12?
Reasoning and proof are not special activities reserved for specialtimes or special topics in the curriculum but should be a natural, ongo-ing part of classroom discussions, no matter what topic is being studied.In mathematically productive classroom environments, students shouldexpect to explain and justify their conclusions. When questions such as,What are you doing? or Why does that make sense? are the norm in amathematics classroom, students are able to clarify their thinking, tolearn new ways to look at and think about situations, and to developstandards for high-quality mathematical reasoning (Collins et al. 1989).
Consider the following hypothetical classroom scenario:
Mr. Hamilton’s class at Manorville High School has established e-mail contact with a high school class in Osaka, Japan. The twogroups of students begin by gathering and sharing informationabout their classes. They exchange data about the number of peoplein each student’s family, about how far each student lives from theschool, and about the number and type of pets each student has.The Japanese students have heard that houses and apartments inNorth America are very large, and they want to compare the livingareas of the students in Manorville with their own. Each class makesa list of the floor areas in their families’ houses or apartments. Theycompute the mean, the median, the mode, the range, and the stan-dard deviation for their data and share them electronically.
Instructional programs fromprekindergarten through grade 12should enable all students to—
Recognize reasoning and proof asfundamental aspects of mathematics
Make and investigate mathematicalconjectures
Develop and evaluate mathematicalarguments and proofs
Select and use various types ofreasoning and methods of proof
342 Principles and Standards for School Mathematics

Reasoning and proof arenot special activitiesreserved for special timesin the curriculum.
When the data arrive from their Japanese friends, Mr. Hamilton’sstudents realize that they will have to do a bit more work before acomparison can be made. It has not occurred to them that the in-formation from the Japanese students would be reported in squaremeters whereas all their measurements are recorded as square feet.At first Angela thinks that they will need to get the original dataabout the Japanese room sizes, convert the measurements to feet,and recompute the size of each living area before they can deter-mine the statistics. Shanika points out that a spreadsheet would dothe conversions quickly but thinks that they will still have to ask forthe original data. Mr. Hamilton suggests that before asking theJapanese students to enter all those extra data, they might workwith the summary statistics they have and see if they can find a wayto compare them directly with their own.The class decides to focus first on the mode. They know that themode of the areas corresponds to the measurement of an actual liv-ing area. They think that if they figure out how to convert thatvalue from square meters to square feet, they might be able to getstarted on the other statistics. Jacob observes that a meter is roughlyequal to 3.3 feet. He proposes that they multiply the mode of theJapanese data by 3.3 to convert square meters to square feet. Mr.Hamilton asks the class if they agree. Several students nod, butShanika objects. She points out that they aren’t thinking about thefact that the mode is given in square meters and that 1 square meteris equal to about 10.9 square feet. Angela says she doesn’t under-stand where that number comes from so Shanika draws her a dia-gram (see fig. 7.32) and explains. “See, suppose this is 1 meter by 1meter. We could make it 3.3 feet by 3.3 feet, then when we multiplyto find the area, we get about 10.9 square feet.” Her reasoningmakes sense to the rest of the class, so they convert the mode value.
Mr. Hamilton asks them to think about which of the other statisticscould be converted in the same way. Angela says that they can usethe same method to convert the median. At that point, two morestudents join the conversation.
Chuen: You can do it with the average of two numbers. Thefirst number would get multiplied by 10.9, and sowould the second, then you average them. But if youjust factor out the 10.9, you get the average of the twonumbers you had times 10.9.
Robert: If it works when we average two numbers that way, itought to work when we average more numbers.
343Standards for Grades 9–12: Reasoning and Proof
Num
ber & O
perations | Algebra | G
eometry | M
easurement | D
ata Analysis &
Probability | P
roblem S
olving | Reasoning &
Proof | C
omm
unication | Connections | R
epresentation
1 meter 3.3 feet
1 m
eter
3.3
feet1 square
meter10.9 square
feet~~
Fig. 7.32.Shanika’s diagram for explaining theconversion from square meters tosquare feet

Chuen tries the mean of three numbers and announces that themethod works in that case also. Mr. Hamilton asks the class to showit would always work. With some help, they argue that for any valuesx1, x2, and x3,
Shanika then observes, “It doesn’t matter how many x’s you have.You can always factor out the 10.9.”The discussion of standard deviation is similar. Damon says he triedthe method with some simple numbers and it worked, so hethought it should be true. “OK,” says Mr. Hamilton. “So we thinkit’s likely to be true. But how do we know it will be? Are there anyhints in anything we have written down?” Damon then suggeststhat they write out the formula for standard deviation and replaceall the values of x with 10.9x. It takes a while to work through thedetails, but the class ultimately shows that if every number in a dataset is multiplied by a constant, the standard deviation of the result-ing data set equals the standard deviation of the original data setmultiplied by the same constant.
An important point in this example is that reasoning and proof en-abled students to abstract and codify their observations. Chuen’s initialobservation was that if each of two numbers is multiplied by 10.9, themean of the resulting numbers is 10.9 times the mean of the originalnumbers. The reasoning he used ultimately produced the argument thatif every number in a data set is multiplied by a constant, the mean of theresulting data set equals the mean of the original data set multiplied bythat constant. The fact that this argument could be made algebraicallyfurnished a mechanism for making a similar argument about the stan-dard deviation. In this way, results with similar justifications can emerge.
Sometimes developing a proof is a natural way of thinking through aproblem. For example, a teacher posed the problem of finding four con-secutive integers whose sum is 44. The students tried the task and de-cided it was impossible. The teacher responded, “OK, so you couldn’tfind the integers. How do you know that someone else won’t be able tofind them?” The students worked quietly for a few minutes, and onestudent offered, “Look, if you call the first number n, the next three aren + 1, n + 2, and n + 3. Add those four numbers and set them equal to44. You get 4n + 6 = 44, and the solution to that equation is n = 9 1/2.So no whole number does it.” Here the proof works nicely to explainwhy something is impossible.
The habit of asking why is essential for students to develop soundmathematical reasoning. In one class, imagine a student wants to dividean 8 1/2 inch × 11 inch sheet of paper into three columns of equalwidth. The student is ready to measure off lengths of 2 5/6 inches, butthe teacher says, “Let me show you a carpenter’s trick.” He places a 12-inch ruler at an angle on the page so that the 0-inch and 12-inch markson the ruler are on the left- and right-hand edges, respectively, andmakes marks at the 4- and 8-inch points on the ruler. He then repeatsthe procedure, with the ruler farther down the page. Drawing linesthrough the 4-inch marks and the 8-inch marks divides the page neatlyinto three equal parts. The teacher then says, “Carpenters use this trickto divide boards into thirds (see fig. 7.33). My questions to you are,
Sometimes developinga proof is a natural way
of thinking through aproblem.
344 Principles and Standards for School Mathematics
Rep
rese
ntat
ion
| C
onne
ctio
ns |
Com
mun
icat
ion
| R
easo
ning
& P
roof
| P
robl
em S
olvi
ng |
Dat
a A
naly
sis
& P
roba
bilit
y |
Mea
sure
men
t |
Geo
met
ry |
Alg
ebra
| N
umbe
r &
Ope
ratio
ns
10 9 10 9 10 9 10 91 2 3 1 2 3. . . . .x x x x x x+ + = + +( )

Why does it work? Can you find similar procedures to divide a boardinto four, five, or any number of equal parts?
The repertoire of proof techniques that students understand and useshould expand through the high school years. For example, they shouldbe able to make direct arguments to establish the validity of a conjecture.Such reasoning has long been at the heart of Euclidean geometry, but itshould be used in all content areas: consider, for example, the number-theory arguments discussed in the “Number and Operations” section ofthis chapter or the arguments given about the effect on some statistics ofa data set of multiplying every element in the data set by a given constant.Students should understand that having many examples consistent with aconjecture may suggest that the conjecture is true but does not prove it,whereas one counterexample demonstrates that a conjecture is false. Stu-dents should see the power of deductive proofs in establishing results.They should be able to produce logical arguments and present formalproofs that effectively explain their reasoning, whether in paragraph,two-column, or some other form of proof.
Because conjectures in some situations are not conducive to directmeans of verification, students should also have some experience with in-direct proofs. And since iterative and recursive methods are increasinglycommon (see, e.g., the “drug dosage” problem discussed in the “Algebra”section in this chapter), students should learn that certain types of resultsare proved using the technique of mathematical induction.
Students should reason in a wide range of mathematical and appliedsettings. Spatial reasoning gives insight into geometric results, espe-cially in two- and three-dimensional geometry. Probabilistic reasoningis helpful in analyzing the likelihood that an event will occur. Statisticalreasoning allows students to assess risks and make generalizations abouta population by using representative samples drawn from that popula-tion. Algebra is conducive to symbolic reasoning. Students who can usemany types of reasoning and forms of argument will have resources formore-effective reasoning in everyday situations.
What should be the teacher’s role in developingreasoning and proof in grades 9 through 12?
To help students develop productive habits of thinking and reason-ing, teachers themselves need to understand mathematics well (Borkoand Putnam 1996). Through the classroom environments they create,mathematics teachers should convey the importance of knowing thereasons for mathematical patterns and truths. In order to evaluate the
345Standards for Grades 9–12: Reasoning and Proof
Num
ber & O
perations | Algebra | G
eometry | M
easurement | D
ata Analysis &
Probability | P
roblem S
olving | Reasoning &
Proof | C
omm
unication | Connections | R
epresentation
12
8
4
12
8
4
Fig. 7.33.
A carpenter’s method for trisecting aboard
validity of proposed explanations, students must develop enough confi-dence in their reasoning abilities to question others’ mathematical argu-ments as well as their own. In this way, they rely more on logic than onexternal authority to determine the soundness of a mathematical argu-ment.
As in other grades, teachers of mathematics in high school shouldstrive to create a climate of discussing, questioning, and listening intheir classes. Teachers should expect their students to seek, formulate,and critique explanations so that classes become communities of in-quiry. Teachers should also help students discuss the logical structure oftheir own arguments. Critiquing arguments and discussing conjecturesare delicate matters: plausible guesses should be discussed even if theyturn out to be wrong. Teachers should make clear that the ideas are atstake, not the students who suggest them. With guidance, studentsshould develop high standards for accepting explanations, and theyshould understand that they have both the right and the responsibilityto develop and defend their own arguments. Such expectations werevisible in the Manorville High School episode: Informal reasoning anda few calculations suggested to students how a summary statistic givenin one unit seemed to be related to the same statistic given in a differentunit. In that classroom, however, informal reasoning and supporting ex-amples were a starting point rather than an end point. In a supportiveenvironment, students were encouraged to furnish a carefully reasonedargument for verifying their conjecture that would meet the standardsof the broader mathematics community.
346 Principles and Standards for School Mathematics
Rep
rese
ntat
ion
| C
onne
ctio
ns |
Com
mun
icat
ion
| R
easo
ning
& P
roof
| P
robl
em S
olvi
ng |
Dat
a A
naly
sis
& P
roba
bilit
y |
Mea
sure
men
t |
Geo
met
ry |
Alg
ebra
| N
umbe
r &
Ope
ratio
ns

Blank Page
9–12Standard
for Grades
Communication
Changes in the workplace increasingly demand teamwork, collabora-tion, and communication. Similarly, college-level mathematics coursesare increasingly emphasizing the ability to convey ideas clearly, bothorally and in writing. To be prepared for the future, high school studentsmust be able to exchange mathematical ideas effectively with others.
However, there are more-immediate reasons for emphasizing mathe-matical communication in high school mathematics. Interacting withothers offers opportunities for exchanging and reflecting on ideas;hence, communication is a fundamental element of mathematics learn-ing. For that reason, it plays a central role in all the classroom episodesin this chapter. Sharing ideas and building on the work of others wereessential ingredients in the ability of Ms. Rodriguez’s class to provide ananalytic explanation of a surprising visual result (see the discussion in the“Problem Solving” section). Communication was also important in theepisode about converting the unit of measurement for various statisticsin the “Reasoning and Proof” section where informal observations ledto discussions of specific cases that were ultimately abstracted andproved as general results. Making connections among the various geo-metric examples in the upcoming “Connections” section depends heav-ily on the exchange of information. Students’ written work is valuablefor assessment, as readers will see in the discussion in the “Representa-tion” section, where the students’ incorrect distance-versus-time graphgives the teacher insights into their misconceptions. In all these exam-ples, the act of formulating ideas to share information or arguments toconvince others is an important part of learning. When ideas are ex-changed and subjected to thoughtful critiques, they are often refined andimproved (Borasi 1992; Moschkovich 1998). In the process, studentssharpen their skills in critiquing and following others’ logic. As studentsdevelop clearer and more-coherent communication (using verbal expla-nations and appropriate mathematical notation and representations),they will become better mathematical thinkers.
What does communication look like in grades 9through 12?
In high school, there should be substantial growth in students’ abili-ties to structure logical chains of thought, express themselves coherently
Instructional programs fromprekindergarten through grade 12should enable all students to—
Organize and consolidate theirmathematical thinking throughcommunication
Communicate their mathematicalthinking coherently and clearly topeers, teachers, and others
Analyze and evaluate the mathe-matical thinking and strategies ofothers
Use the language of mathematicsto express mathematical ideas precisely
348 Principles and Standards for School Mathematics

To be prepared for thefuture, high schoolstudents must be able toexchange mathematicalideas effectively withothers.
and clearly, listen to the ideas of others, and think about their audiencewhen they write or speak. The relationships students wish to expresssymbolically and with graphs, as well as the notation and representationsfor expressing them, should become increasingly sophisticated. Conse-quently, communication in grades 9–12 can be distinguished from thatin lower grades by higher standards for oral and written exposition andby greater mathematical sophistication.
High school students should be good critics and good self-critics.They should be able to generate explanations, formulate questions, andwrite arguments that teachers, coworkers, or mathematicians wouldconsider logically correct and coherent. Whether they are making theirpoints using spreadsheets, geometric diagrams, natural language, or al-gebraic symbols, they should use mathematical language and symbolscorrectly and appropriately. Students also should be good collaboratorswho work effectively with others.
Proofs should be a significant part of high school students’ mathe-matical experience, as well as an accepted method of communication.The following episode, drawn from real experience, illustrates the partthat mathematical communication plays in the development of in-creased understanding.
Marta and Nancy attended the biweekly mathematics competitionin their school district’s mathematics league and encountered thefollowing problem:
A string is stretched corner to corner on a floor tiled with square tiles. Ifthe floor is 28 tiles long and 35 tiles wide, over how many tiles does thestring pass?
They didn’t solve the problem, but they reported to their facultysponsor, Ms. Koech, that they had heard a fellow contestant say thathe got the answer by adding the two sides and subtracting theirgreatest common divisor. Not content with a formula “droppedfrom the sky,” Ms. Koech encouraged the girls to see if this methodalways works and if so, why. Over a period of days the girls devel-oped some intuitions about the problem and tried various ways ofsharing them with their teacher. Marta, who had a broken leg,demonstrated one emerging insight by dragging her cast along thetiles on the classroom floor.
Marta: See? The string crosses everything!Ms. Koech: I’m not sure I know what you
mean. Nancy: Watch this part of the floor (she
outlines a 3 × 2 tile pattern likethat shown and points to the pointsof intersection of the imaginedstring and the edges of the tiles).Here it crosses. Here it crosses.It hits the lines five times—andthat comes from the 2 and the3! (Nancy has counted the numberof points of intersection of thestring with the vertical and hori-zontal line segments and notices
349Standards for Grades 9–12: Communication
Num
ber & O
perations | Algebra | G
eometry | M
easurement | D
ata Analysis &
Probability | P
roblem S
olving | Reasoning &
Proof | C
omm
unication | Connections | R
epresentation

350 Principles and Standards for School Mathematics
Rep
rese
ntat
ion
| C
onne
ctio
ns |
Com
mun
icat
ion
| R
easo
ning
& P
roof
| P
robl
em S
olvi
ng |
Dat
a A
naly
sis
& P
roba
bilit
y |
Mea
sure
men
t |
Geo
met
ry |
Alg
ebra
| N
umbe
r &
Ope
ratio
ns
Fig. 7.34.
A 9 × 6 tile configuration
that the total is the same as the sum of 2 and 3.) Ms. Koech: That’s interesting! Have you seen that happen in other
cases?Marta: Yes! It works for most small numbers.
Ms. Koech: What do you mean—most?Marta: Well, it didn’t work for this one. (Marta shows Ms. Koech
a drawing of a 3 × 6 tiling pattern for which there are sevenpoints of intersection.)
Nancy: Why is this one different?
Ms. Koech suggested that the students pursue Nancy’s question.Over a period of days they determined that the relationship breaksdown when the string passes through a corner of a tile “inside” thepattern. Gradually and after pursuing some approaches that lednowhere, they realized that whenever the number of intersectionswas the same as the sum of the dimensions of the rectangle, the di-mensions of the room are relatively prime. Thinking back toMarta’s cast clicking over the tiles—each time it clicked, shetouched another tile—they realized that they could trace along thestring and see how many times the string “exits” a tile. Except at thestart of the path, the string exits a tile each time it crosses either avertical or a horizontal line segment. Moreover, the string has tocross every vertical and horizontal line segment as it traverses thetiled room from one corner to the other. So the number of tiles thestring crosses can be determined by the number of horizontal andvertical line segments in the tile configuration. After a number ofattempts—first for specific cases such as the 3 × 2 and 3 × 4 config-urations and then in general—the students were able to show that ifn and m (the dimensions of the rectangle) are relatively prime, thestring passes over (m + n – 1) tiles.With this result established, they returned to the general problem.A close look at the 9 × 6 tile configuration (see fig. 7.34) shows thatthe area the string passes through can be considered as three 3 × 2configurations. Thus the string passes over three times as many tilesin the 9 × 6 configuration as it passes over in the 3 × 2 configura-tion. This happens to be 3(2 + 3 – 1) = 6 + 9 – gcd(6, 9) tiles, whichconforms with the method they had heard from their fellow contes-tant. From this analysis, the generalization to m + n – gcd(m, n) wasa natural next step. The students wrote up their results for a re-gional student mathematics publication.
A formal explanation follows: Suppose n and m have a gcd of g. Thesmaller, relatively prime grid is (n/g) × (m/g). The students discoveredthat the number of grid lines crossed there is (n/g) + (m/g) – 1, whichindicates that when a string passes through g of them, it passes throughg[(n/g) + (m/g) – 1] = n + m – g grid lines.
In this example, communication serves at least two purposes. First,it is motivational: Marta and Nancy kept working at the problem inpart because it was a collaborative effort, and they were discussingtheir work. Second, repeated attempts to explain their reasoning toeach other and to their teacher helped Marta and Nancy clarify theirthinking and focus on essential elements of the problem. Notice that

Teachers should helpstudents learn to readincreasinglytechnical text.
the teacher offered some key observations and questions: “I’m not surewhat you mean.” “Have you seen this happen in other cases?” “Whatdo you mean, most?” Nancy then asked the question that launched thegirls’ exploration: “Why is this one different?” This focus was a majorfactor in their success in eventually solving the problem.
What should be the teacher’s role in developingcommunication in grades 9 through 12?
High school teachers can help students use oral communication tolearn and to share mathematics by creating a climate in which all stu-dents feel safe in venturing comments, conjectures, and explanations.Teachers must help students clarify their statements, focus carefully onproblem conditions and mathematical explanations, and refine theirideas. Orchestrating classroom conversations so that the appropriatelevel of discourse and mathematical argumentation is maintained re-quires that teachers know mathematics well and have a clear sense oftheir mathematical goals for students. Teachers should help studentsbecome more precise in written mathematics and have them learn toread increasingly technical text. In both written and oral communica-tion, teachers need to attend to their students and carefully interpretwhat the students know from what they say or write.
Communication can be used in many ways as a vehicle for assessmentand learning. Early in a mathematics course or when a new topic isbeing introduced, teachers can request information about the students’knowledge of the topic. At the beginning of a tenth-grade unit on cir-cles, for example, a teacher might ask students to tell her everything theyknow about circles. The teacher could then compile the responses, dis-tribute copies of them the next day, and ask the students to agree or dis-agree with each of the statements. Students should justify the stance theytook. The teacher could look at students’ incorrect observations and de-sign a lesson to address those misconceptions. In this way, the students’knowledge becomes a starting point for instruction, and the teacher canestablish the idea that the students are expected to have reasons for theirmathematical opinions. Activities such as this can serve to establish a
351Standards for Grades 9–12: Communication
Num
ber & O
perations | Algebra | G
eometry | M
easurement | D
ata Analysis &
Probability | P
roblem S
olving | Reasoning &
Proof | C
omm
unication | Connections | R
epresentation

classroom climate conducive to the respectful exchange of ideas. Moregenerally, having students present work to the class at the chalkboard,overhead projector, or flip chart—and having the class respond to whatis presented rather than having only the teacher judge the correctness ofwhat has been said—can be a valuable way to foster classroom commu-nication. Over time, such activities help students sharpen their ideasthrough attempts to communicate orally and in writing.
There are various ways that teachers can help students communicateeffectively using written mathematics. Problems that require explana-tions can be assigned regularly, and the class can discuss and comparethe adequacy of those explanations. The following exercises can helpstudents sharpen their mathematical writing skills:
• Imagine you are talking to a student in your class on the telephone andwant the student to draw some figures. The other student cannot see thefigures. Write a set of directions so that the other student can draw thefigures exactly as shown [in figure 7.35]. (California State Department ofEducation 1989, p. 7)
• Suppose you are hired as a consultant to help a business choose betweentwo options (e.g., which taxicab company is the better one to use orwhich telephone plan is a better buy). Write a memo saying which op-tion is better and why. (For a similar activity, see Balanced Assessmentfor the Mathematics Curriculum [2000, pp. 16–17].)
• Make a design plan for a dog house. The dog house will be made out ofwood cut from a 4' by 8' sheet of plywood, and its volume should be rea-sonably large. Explain why you made the choices you have made inputting together the design plan (adapted from National ResearchCouncil [1989, p. 32]).
Such exercises also serve as good assessment devices that can helpteachers understand students’ thinking.
Writing is a valuable way of reflecting on and solidifying what oneknows, and several kinds of exercises can serve this purpose. For example,teachers can ask students to write down what they have learned about aparticular topic or to put together a study guide for a student who was ab-sent and needs to know what is important about the topic. Students whohave done a major project or worked on a substantial long-range problemcan be asked to compare some of their early work with later work and ex-plain how the later work reflects greater understanding. In these ways,teachers can help students develop skills in mathematical communicationthat will serve them well both inside and outside the classroom. Usingthese skills will in turn help students develop deeper understandings of themathematical ideas about which they speak, hear, read, and write.
352 Principles and Standards for School Mathematics
Rep
rese
ntat
ion
| C
onne
ctio
ns |
Com
mun
icat
ion
| R
easo
ning
& P
roof
| P
robl
em S
olvi
ng |
Dat
a A
naly
sis
& P
roba
bilit
y |
Mea
sure
men
t |
Geo
met
ry |
Alg
ebra
| N
umbe
r &
Ope
ratio
ns
Fig. 7.35.
Figures to be described orally so theycan be reproduced

Blank Page

9–12Standard
for Grades
Connections
When students can see the connections across different mathematicalcontent areas, they develop a view of mathematics as an integrated whole.As they build on their previous mathematical understandings while learn-ing new concepts, students become increasingly aware of the connectionsamong various mathematical topics. As students’ knowledge of mathe-matics, their ability to use a wide range of mathematical representations,and their access to sophisticated technology and software increase, theconnections they make with other academic disciplines, especially the sci-ences and social sciences, give them greater mathematical power.
What should connections look like in grades 9through 12?
Students in grades 9–12 should develop an increased capacity to linkmathematical ideas and a deeper understanding of how more than oneapproach to the same problem can lead to equivalent results, eventhough the approaches might look quite different. (See, e.g., the“counting rectangles” problem in the “Problem Solving” section in thischapter.) Students can use insights gained in one context to prove ordisprove conjectures generated in another, and by linking mathematicalideas, they can develop robust understandings of problems.
The following hypothetical example highlights the connectionsamong what would appear to be very different representations of, andapproaches to, a mathematical problem.
The students in Mr. Robinson’s tenth-grade mathematics class sus-pect they are in for some interesting problem solving when he startsclass with this story: “I have a dilemma. As you may know, I have afaithful dog and a yard shaped like a right triangle. When I go awayfor short periods of time, I want Fido to guard the yard. Because Idon’t want him to get loose, I want to put him on a leash and securethe leash somewhere on the lot. I want to use the shortest leash pos-sible, but wherever I secure the leash, I need to make sure the dogcan reach every corner of the lot. Where should I secure the leash?” After Mr. Robinson responds to the usual array of questions andcomments (such as “Do you really have a dog?” “Only a mathteacher would have a triangle-shaped lot—or notice that the lot was
Instructional programs fromprekindergarten through grade 12should enable all students to—
Recognize and use connectionsamong mathematical ideas
Understand how mathematicalideas interconnect and build on oneanother to produce a coherentwhole
Recognize and apply mathematicsin contexts outside of mathematics
354 Principles and Standards for School Mathematics

When students can seethe connections acrosscontent areas, theydevelop a view ofmathematics as anintegrated whole.
triangular!” “What type of dog is it?”), he asks the students to workin groups of three. All their usual tools, including compass, straight-edge, calculator, and computer with geometry software, are avail-able. They are to come up with a plan to solve the problem.Jennifer dives into the problem right away, saying, “Let’s make asketch using the computer.” With her group’s agreement, she pro-duces the sketch in figure 7.36.
As Mr. Robinson circulates around the room, he observes eachgroup long enough to monitor its progress. On his first pass, Jen-nifer’s group seems to be experimenting somewhat randomly withdragging the point D to various places, but on his second pass, theirwork seems more systematic. To assess what members of the groupunderstand, he asks how they are doing:
Mr. R: Joe, can you bring me up-to-date on the progress ofyour group?
Joe: We’re trying to find out where to put the point.Jeff: We don’t want the point too close to the corners of the
triangle. Jennifer: I get it! We want all the lengths to be equal! They all
work against each other.
Before moving on to work with other groups, Mr. Robinson workswith the members of Jennifer’s group on clarifying their ideas, usingmore-standard mathematical language, and checking with one an-other for shared understanding. Jennifer clarifies her idea, and thegroup decides that it seems reasonable. They set a goal of findingthe position for D that results in the line segments DA, DB, and DCall being the same length. When Mr. Robinson returns, the grouphas concluded that point D has to be the midpoint of the hy-potenuse, otherwise, they say, it could not be equidistant from Band C. (Mr. Robinson notes to himself that the group’s conclusion isnot adequately justified, but he decides not to intervene at thispoint; the work they will do later in creating a proof will ensure thatthey examine this reasoning.)
Mr. R: What else would you need to know?Jeff: We’re not sure yet whether D is the same distance from
all three vertices.
355Standards for Grades 9–12: Connections
Num
ber & O
perations | Algebra | G
eometry | M
easurement | D
ata Analysis &
Probability | P
roblem S
olving | Reasoning &
Proof | C
omm
unication | Connections | R
epresentation
Fig. 7.36.
Jennifer’s computer-drawn sketch ofthe “dog in the yard” problem
C
A B
D
m DC = 2.12 inches
m DB = 3.12 inchesm DA = 1.70 inches

Jennifer: It has to be! At least I think it is. It looks like it’s thecenter of a circle.
Small-group conversations continue until several groups have madeobservations and conjectures similar to those made in Jennifer’sgroup. Mr. Robinson pulls the class back together to discuss theproblem. When the students converge on a conjecture, he writes iton the board as follows:
Conjecture: The midpoint of the hypotenuse of a right triangle is equi-distant from the three vertices of the triangle.
He then asks the students to return to their groups and work to-ward providing either a proof or a counterexample. The groupscontinue to work on the problem, settling on proofs and selectinggroup members to present them on the overhead projector. As al-ways, Mr. Robinson emphasizes the fact that there might be a num-ber of different ways to prove the conjecture.Remembering Mr. Robinson’s mantra about placing the coordinatesystem to “make things eeeasy,” one group places the coordinates as shown in figure 7.37a, yielding a common distance of .Alfonse, who is explaining this solution, proudly remarks that it re-minds him of the Pythagorean theorem. Mr. Robinson builds onthat observation, noting to the class that if the students drop a per-pendicular from M to AC, each of the two right triangles that resulthas legs of length a and b; thus the length of the hypotenuses, MCand MA, are indeed . Jennifer’s group returns to her earlier comment about the threepoints A, B, and C being on a circle. After lengthy conversationswith, and questions from, Mr. Robinson, that group produces a sec-ond proof based on the properties of inscribed angles (fig. 7.37b).
356 Principles and Standards for School Mathematics
Rep
rese
ntat
ion
| C
onne
ctio
ns |
Com
mun
icat
ion
| R
easo
ning
& P
roof
| P
robl
em S
olvi
ng |
Dat
a A
naly
sis
& P
roba
bilit
y |
Mea
sure
men
t |
Geo
met
ry |
Alg
ebra
| N
umbe
r &
Ope
ratio
ns
B
M
AC
•
•
•
• •
•
•
• •
M
M
A
(a, b)
(0, 2b)
(0, 0)
(2a, 0)
•
•
• •
•B
B
C
D
AC
(a)
(c)
(b)
(d)
•
•
• •
B
M
A = A ′
M ′
B ′
C = C ′
•
•
Fig. 7.37.
Diagrams corresponding to fourproofs of the midpoint-of-
hypotenuse theorem
a b2 2+
a b2 2+

Pedro presents his group’s solution showing how they constructed arectangle that includes the three vertices of the right triangle (fig.7.37c) and reasoned about the properties of the diagonals of a rec-tangle. Anna presents a solution using transformational geometry(figure 7.37d). Since M and M′ are the midpoints of AB and A ′B ′,respectively, the triangle MAM ′ is similar to the triangle BAB ′, witheach of the sides of the smaller triangle half the length of the corre-sponding side of the larger triangle. The same relationship holdsfor triangles BMC and BAB ′. Using this fact and the fact that BAB ′is isosceles (since BA reflects onto B′A), Anna shows that triangleMAM ′ is congruent to triangle CMB, from which it follows thatCM and MA are the same length.Mr. Robinson congratulates the students on the quality of theirwork and on the variety of approaches they used. He points out thatsome basic mathematical ideas such as congruence were actuallypart of the mathematics in a number of their solutions and thatsome of their thinking, such as Alfonse’s comment about thePythagorean theorem, highlighted connections to other mathemati-cal ideas. Taking a step backward to reflect, the students begin tosee how different approaches—using coordinate geometry, Euclid-ean geometry, and transformational geometry—are all connected.Mr. Robinson notes that it is good to have all these ways of thinkingin their mathematical “tool kit.” Any one of them might be the keyto solving the next problem they encounter.
Although the students learned a great deal from working on the prob-lem, the class was not yet finished with it. Mr. Robinson had selectedthis problem for the class to work on because it supports a number of in-teresting explorations and because the students would be exploring theproperties of triangles and circles as they worked on it. And, indeed, asthe students worked on the problem, they remarked that they were “see-ing circles everywhere.” (The following discussion is inspired by Gold-enberg, Lewis, and O’Keefe [1992].)
357Standards for Grades 9–12: Connections
Num
ber & O
perations | Algebra | G
eometry | M
easurement | D
ata Analysis &
Probability | P
roblem S
olving | Reasoning &
Proof | C
omm
unication | Connections | R
epresentation

One group decides to look at the set of all the right triangles they canfind, given a fixed hypotenuse. A group member starts by construct-ing a right triangle with the given hypotenuse and then dragging theright angle (fig. 7.38a). Another group decides to fix the position ofthe right angle and look at the set of right triangles whose hy-potenuses are the given length (fig. 7.38b). They observe that theplot of the midpoints of the hypotenuses of the right triangles ap-pears to trace out the arc of a circle. At first the students are ready todismiss the circular pattern as a coincidence. But Mr. Robinson, see-ing the potential for making a connection, asks questions such as,“Why do you think you get that pattern?” and “Does the circle inyour pattern have anything to do with the circle in Jennifer’s group’ssolution?” As the groups begin to understand Mr. Robinson’s ques-tions, they begin to see the connections among the circles in theirnew drawings, the definition of a circle, and the fact that their prob-lem deals with points that are equally distant from a third point. Mr. Robinson adds a final challenge for homework: can the studentsconnect this problem (or problems related to it) to real-world situa-tions or to other mathematics? The students create posters illustrat-ing the mathematical connections they see. Most of the posters depictsituations similar to the original problem in which something, forsome reason, needs to be positioned the same distance from the ver-tices of a right triangle. One group, however, creates an experimentthat they demonstrate for the class in one of the dark, windowlessrooms in the building. They put on the floor a large sheet of whitechart paper with a right triangle drawn on it, place candles (all of thesame height) at each vertex, and stand an object shorter than the can-dles inside the triangle. The class watches the shadows of the objectchange as one of the group members moves it around inside the tri-angle. The three shadows are of equal length only when the object isplaced at the midpoint of the hypotenuse—a phenomenon that de-lights both Mr. Robinson and his students. This activity concludesthe discussion of right triangles, but it is far from the end of the class’swork. Mr. Robinson reminds the students of the problem that startedtheir discussion and asks them how the problem might be extended.“After all,” he says, “not all backyards have right angles or are trian-gular in shape.” This comment sets the stage for abstracting and gen-eralizing some of their work—and for making more connections.
358 Principles and Standards for School Mathematics
Rep
rese
ntat
ion
| C
onne
ctio
ns |
Com
mun
icat
ion
| R
easo
ning
& P
roof
| P
robl
em S
olvi
ng |
Dat
a A
naly
sis
& P
roba
bilit
y |
Mea
sure
men
t |
Geo
met
ry |
Alg
ebra
| N
umbe
r &
Ope
ratio
ns
(a) A trace of the locus of thevertices of right angles witha common hypotenuse
(b) A trace of the locus of midpoints of hypotenuses offixed length in triangles witha common right angle
Fig. 7.38.
Dynamic representations of right tri-angles (from Goldenberg, Lewis, and
O’Keefe [1992, p. 257])

Rich problems, a climatethat supportsmathematical thinking,and access tomathematical toolscontribute to students’seeing connections.
What should be the teacher’s role in developingconnections in grades 9 through 12?
The story of Mr. Robinson’s classroom indicates many of the ways inwhich teachers can help students seek and make use of mathematicalconnections. Problem selection is especially important because studentsare unlikely to learn to make connections unless they are working onproblems or situations that have the potential for suggesting such link-ages. Teachers need to take special initiatives to find such integrativeproblems when instructional materials focus largely on content areasand when curricular arrangements separate the study of content areassuch as geometry, algebra, and statistics. Even when curricula offerproblems that cut across traditional content boundaries, teachers willneed to develop expertise in making mathematical connections and inhelping students develop their own capacity for doing so.
One essential aspect of helping students make connections is estab-lishing a classroom climate that encourages students to pursue mathe-matical ideas in addition to solving the problem at hand. Mr. Robinsonstarted with a problem that allowed for multiple approaches and solu-tions. While the students worked the problem, they were encouraged topursue various leads. Incorrect statements weren’t simply judged wrongand dismissed; Mr. Robinson helped the students find the kernels ofcorrect ideas in what they had said, and those ideas sometimes led tonew solutions and connections. The students were encouraged to re-flect on and compare their solutions as a means of making connections.When they had done just about everything they were able to do withthe given problem, they were encouraged to generalize what they haddone. Rich problems, a climate that supports mathematical thinking,and access to a wide variety of mathematical tools all contribute to stu-dents’ ability to see mathematics as a connected whole.
359Standards for Grades 9–12: Connections
Num
ber & O
perations | Algebra | G
eometry | M
easurement | D
ata Analysis &
Probability | P
roblem S
olving | Reasoning &
Proof | C
omm
unication | Connections | R
epresentation

If mathematics is the “science of patterns” (Steen 1988), representa-tions are the means by which those patterns are recorded and analyzed.As students become mathematically sophisticated, they develop an in-creasingly large repertoire of mathematical representations and theknowledge of how to use them productively. This knowledge includeschoosing specific representations in order to gain particular insights orachieve particular ends.
The importance of representations can be seen in every section ofthis chapter. If large or small numbers are expressed in scientific nota-tion, their magnitudes are easier to compare and they can more readilybe used in computations. Representation is pervasive in algebra. Graphsconvey particular kinds of information visually, whereas symbolic ex-pressions may be easier to manipulate, analyze, and transform. Mathe-matical modeling requires representations, as illustrated in the “drugdosage” problem and in the “pipe offset” problem. The use of matricesto represent transformations in the plane illustrates how geometric op-erations can be represented visually yet also be amenable to symbolicrepresentation and manipulation in a way that helps students under-stand them. The various methods for representing data sets furtherdemonstrate the centrality of this topic.
A wide variety of representations can be seen in the examples in thischapter. By using various representations for the “counting rectangles”problem in the “Problem Solving” section, students could find differentsolutions and compare them. The use of algebraic symbolism to explaina striking graphical phenomenon is central to the “string traversingtiles” task in the “Communication” section. Representations facilitatereasoning and are the tools of proof: they are used to examine statisticalrelationships and to establish the validity of a builder’s shortcut. Theyare at the core of communication and support the development of un-derstanding in Marta’s and Nancy’s work on the “string traversing tiles”problem. Although at one level the story of Mr. Robinson’s class is aboutconnections, at another level it is about representation: one group of stu-dents places coordinates that “make things eeeasy,” the class gains in-sights from dynamic representations of geometric objects, and the stu-dents produce proofs in coordinate and Euclidean geometry. A majorlesson of that story is that different representations support differentways of thinking about and manipulating mathematical objects. An ob-ject can be better understood when viewed through multiple lenses.
9–12Standard
for Grades
Representation
Instructional programs fromprekindergarten through grade 12should enable all students to—
Create and use representations toorganize, record, and communicatemathematical ideas
Select, apply, and translate amongmathematical representations tosolve problems
Use representations to model andinterpret physical, social, andmathematical phenomena
360 Principles and Standards for School Mathematics
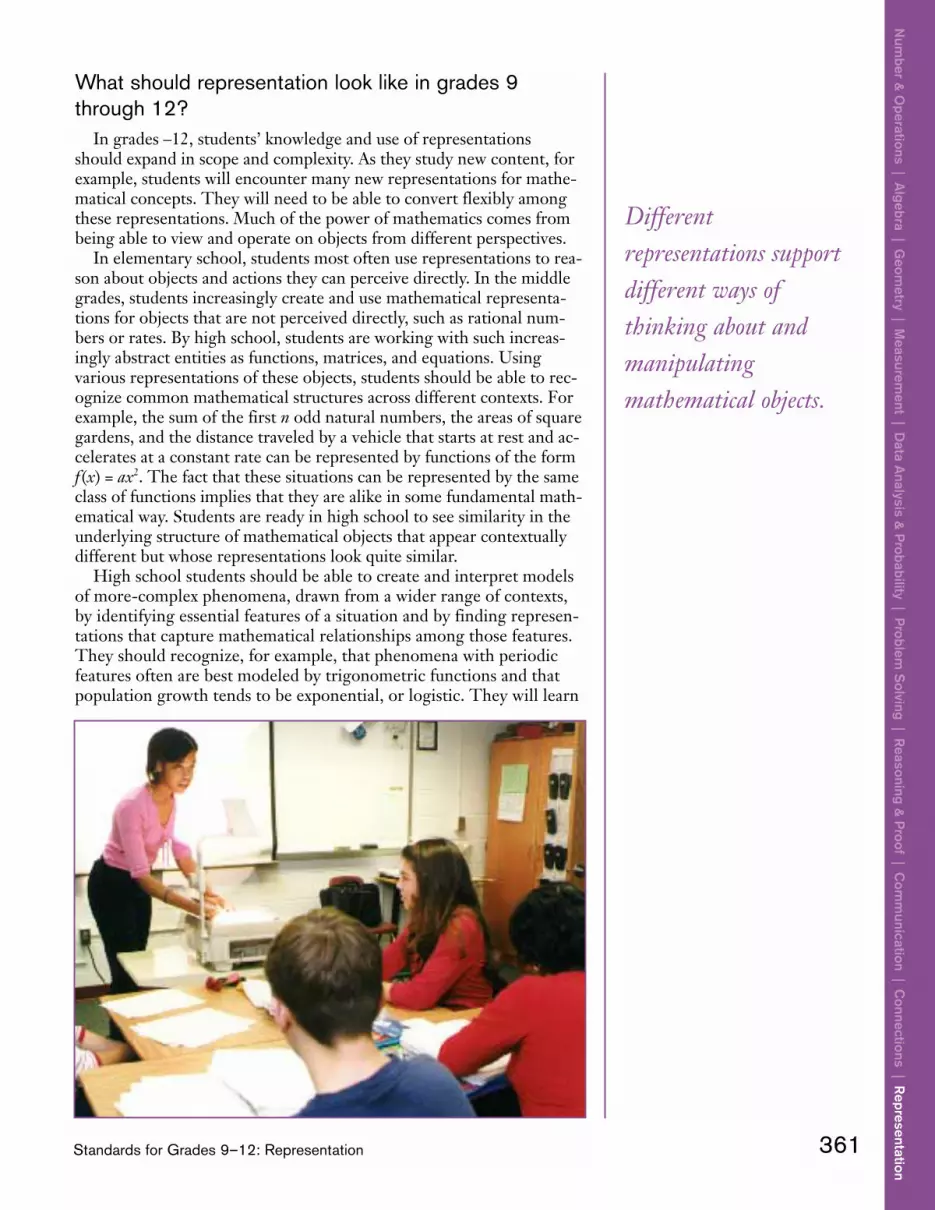
Differentrepresentations supportdifferent ways ofthinking about andmanipulatingmathematical objects.
What should representation look like in grades 9through 12?
In grades 9–12, students’ knowledge and use of representationsshould expand in scope and complexity. As they study new content, forexample, students will encounter many new representations for mathe-matical concepts. They will need to be able to convert flexibly amongthese representations. Much of the power of mathematics comes frombeing able to view and operate on objects from different perspectives.
In elementary school, students most often use representations to rea-son about objects and actions they can perceive directly. In the middlegrades, students increasingly create and use mathematical representa-tions for objects that are not perceived directly, such as rational num-bers or rates. By high school, students are working with such increas-ingly abstract entities as functions, matrices, and equations. Usingvarious representations of these objects, students should be able to rec-ognize common mathematical structures across different contexts. Forexample, the sum of the first n odd natural numbers, the areas of squaregardens, and the distance traveled by a vehicle that starts at rest and ac-celerates at a constant rate can be represented by functions of the formf (x) = ax2. The fact that these situations can be represented by the sameclass of functions implies that they are alike in some fundamental math-ematical way. Students are ready in high school to see similarity in theunderlying structure of mathematical objects that appear contextuallydifferent but whose representations look quite similar.
High school students should be able to create and interpret modelsof more-complex phenomena, drawn from a wider range of contexts,by identifying essential features of a situation and by finding represen-tations that capture mathematical relationships among those features.They should recognize, for example, that phenomena with periodicfeatures often are best modeled by trigonometric functions and thatpopulation growth tends to be exponential, or logistic. They will learn
361Standards for Grades 9–12: Representation
Num
ber & O
perations | Algebra | G
eometry | M
easurement | D
ata Analysis &
Probability | P
roblem S
olving | Reasoning &
Proof | C
omm
unication | Connections | R
epresentation

to describe some real-world phenomena with iterative and recursiverepresentations.
Consider the graph of the concentration of CO2 in the atmosphereas a function of time and latitude during the period from 1986 through1991 (see fig. 7.39) (Sarmiento 1993). Teachers might use an examplesuch as this to help students understand and interpret several aspects ofrepresentation. Students could discuss the trends in the change in con-centration of CO2 as a function of time as well as latitude. Doing sowould draw on their knowledge about classes of functions and theirability to interpret three-dimensional graphs. They should be able tosee a roughly linear increase across time, coupled with a sinusoidal fluc-tuation with the seasons. Focusing on the change in the character of thegraph as a function of latitude, students should note that the amplitudeof the sinusoidal function lessens from north to south. Students can testwhether the trends they observe in the graph correspond to recent the-oretical work on CO2 concentration in the atmosphere. For example,the author of the article attributes the sinusoidal fluctuation to seasonalvariations in the amount of photosynthesis taking place in the terrestrialbiosphere. Students could discuss the differences in amplitude acrossseasons in the Northern and Southern Hemispheres.
Electronic technologies provide access to problems and methods thatuntil recently were difficult to explore meaningfully in high school. Inorder to use the technologies effectively, students will need to becomefamiliar with the representations commonly used in technological set-tings. For example, solving equations or multiplying matrices using acomputer algebra system calls for learning how to input and interpretinformation in formats used by the system. Many software tools thatstudents might use include special icons and symbols that carry particu-lar meaning or are needed to operate the tool; students will need tolearn about these representations and distinguish them from the mathe-matical objects they are manipulating.
What should be the teacher’s role in developingrepresentation in grades 9 through 12?
An important part of learning mathematics is learning to use the lan-guage, conventions, and representations of mathematics. Teachersshould introduce students to conventional mathematical representations
362 Principles and Standards for School Mathematics
Rep
rese
ntat
ion
| C
onne
ctio
ns |
Com
mun
icat
ion
| R
easo
ning
& P
roof
| P
robl
em S
olvi
ng |
Dat
a A
naly
sis
& P
roba
bilit
y |
Mea
sure
men
t |
Geo
met
ry |
Alg
ebra
| N
umbe
r &
Ope
ratio
ns
1986 1987 1988 1989 1990 1991
340 345 350 355 360
CO2 concentration in microatmospheres
90°N60°N
30°NEquator
30°S60°S
90°S
Fig. 7.39.
A three-dimensional graph of the con-centration of CO2 in the atmosphere
as a function of time and latitude(Adapted from Sarmiento [1993])

Part of the teacher’s roleis to help studentsconnect their personalimages to more-conventionalrepresentations.
and help them use those representations effectively by building on thestudents’ personal and idiosyncratic representations when necessary. It isimportant for teachers to highlight ways in which different representa-tions of the same objects can convey different information and to em-phasize the importance of selecting representations suited to the particu-lar mathematical tasks at hand (Yerushalmy and Schwartz 1993;Moschkovich, Schoenfeld, and Arcavi 1993). For example, tables of val-ues are often useful for quick reference, but they provide little informa-tion about the nature of the function represented. Consider the table inthe “Algebra” section in this chapter that gives the number of minutes ofdaylight in Chicago every other day for the year 2000. The values in thetable suggest that the function is initially increasing and then becomesdecreasing. Knowledge of the context of a graph of those values suggeststhat the behavior is actually periodic. Similarly, algebraic and graphicalrepresentations of functions may provide different information. Someglobal properties of functions, such as asymptotic behavior or the rate ofgrowth of a function, are often most readily apparent from graphs. Butinformation about specific aspects of a function—the exact value of f (π)or exact values of x where f (x) has a maximum or a minimum—may bestbe determined using an algebraic representation of the function. Sup-pose g(x) is given by the equation g(x) = f (x) + 1, for all x. The analyticdefinitions of f (x) and g (x) may offer the most-effective ways of comput-ing specific values of f (x) and g(x), but graphing the function reveals thatthe “shape” of g(x) is precisely the same as that of f (x)—that the graph ofg(x) is obtained by translating the graph of f (x) one unit upward.
As in all instruction, what matters is what the student sees, hears, andunderstands. Often, students interpret what teachers may considerwonderfully lucid presentations in ways that are very different fromthose their teachers intended (Confrey 1990; Smith, diSessa, andRoschelle 1993). Or they may invent representations of content that areidiosyncratic and have personal meaning but do not look at all like con-ventional mathematical representations (Confrey, 1991; Hall et al.1989). Part of the teacher’s role is to help students connect their per-sonal images to more-conventional representations. One very usefulwindow into students’ thinking is student-generated representations.To illustrate this point, consider the following problem (adapted fromHughes-Hallett et al. [1994, p. 6]) that might be presented to a tenth-grade class:
A flight from SeaTac Airport near Seattle, Washington, to LAX Airport inLos Angeles has to circle LAX several times before being allowed to land.Plot a graph of the distance of the plane from Seattle against time fromthe moment of takeoff until landing.
Students could work individually or in pairs to produce distance-ver-sus-time graphs for this problem, and teachers could ask them to pre-sent and defend those graphs to their classmates. Graphs produced bythis class, or perhaps by students in other classes, could be handed outfor careful critique and comment. When they perform critiques, stu-dents get a considerable amount of practice in communicating mathe-matics as well as in constructing and improving on representations, andthe teacher gets information that can be helpful in assessment. Onerepresentation of the flight that a student might produce is shown infigure 7.40.
363Standards for Grades 9–12: Representation
Num
ber & O
perations | Algebra | G
eometry | M
easurement | D
ata Analysis &
Probability | P
roblem S
olving | Reasoning &
Proof | C
omm
unication | Connections | R
epresentation

This representation indicates a number of interesting and not un-common misunderstandings, in which literal features of the story (theplane flying at constant height or circling around the airport) are converted inappropriately into features of the graph (Dugdale 1993;Leinhardt, Zaslavsky, and Stein 1990). Representations of this type canprovoke interesting classroom conversations, revealing what the stu-dents really understand about graphing. This revelation puts theteacher in a better position to move the class toward a more nearly ac-curate representation, as sketched in figure 7.41.
Mathematics is one of humankind’s greatest cultural achievements. Itis the “language of science,” providing a means by which the worldaround us can be represented and understood. The mathematical repre-sentations that high school students learn afford them the opportunityto understand the power and beauty of mathematics and equip them touse representations in their personal lives, in the workplace, and in further study.
364 Principles and Standards for School Mathematics
Rep
rese
ntat
ion
| C
onne
ctio
ns |
Com
mun
icat
ion
| R
easo
ning
& P
roof
| P
robl
em S
olvi
ng |
Dat
a A
naly
sis
& P
roba
bilit
y |
Mea
sure
men
t |
Geo
met
ry |
Alg
ebra
| N
umbe
r &
Ope
ratio
ns
Fig. 7.41.
A more nearly accurate representa-tion of the airplane’s distance from
its take-off point against the timefrom takeoff to landing
Fig. 7.40.
A representation that a student mightproduce of an airplane’s distance
from its take-off point against thetime from takeoff to landing

Blank Page

Making the vision
of mathematics
teaching and learning
a reality requires a
strong system of
support at both the local
and the national levels.

Working Togetherto Achievethe Vision
8Chapter
Imagine a classroom in which the Principles and Standards described in thisvolume have come to life. Students of varied backgrounds and abilities areworking with their teachers to learn important mathematical ideas. Expecta-tions are high for all students, including those who need extra support to learnmathematics well. Students are engaged by the mathematics they are learn-ing, study it every year they are in school, and accept responsibility for theirown mathematics learning. The classroom environment is equitable, challeng-ing, and technologically equipped for the twenty-first century.
This vision of mathematics education—introduced in chapter 1, givenfocus in the Principles described in chapter 2, and more fully elaborated inthe discussions of the Standards in chapters 3–7—is enticing. But whatwould it take to realize this vision? Let us look beyond the classroom to abroader context:
Imagine that all mathematics teachers continue to learn new mathematics con-tent and keep current on education research. They collaborate on problems ofmathematics teaching and regularly visit one another’s classrooms to learnfrom, and critique, colleagues’ teaching. In every school and district, mathe-matics teacher-leaders are available, serving as expert mentors to their col-leagues, recommending resources, orchestrating interaction among teachers,and advising administrators. Education administrators and policymakers at alllevels understand the nature of mathematical thinking and learning, help cre-ate professional and instructional climates that support students’ and teachers’growth, understand the importance of mathematics learning, and provide thetime and resources for teachers to teach and students to learn mathematics well.Institutions of higher learning collaborate with schools to study mathematics
367

368 Principles and Standards for School Mathematics
education and to improve teacher preparation and professional development.Professional mathematicians take an interest in, and contribute construc-tively to, setting the content goals for mathematics in grades K–12 and fordeveloping teachers’ mathematical knowledge. Professional organizations,such as the National Council of Teachers of Mathematics, provide leader-ship, resources, and professional development opportunities to improvemathematics education. And families, politicians, business and communityleaders, and other stakeholders in the system are informed about educationissues and serve as valuable resources for schools and children.
Making the vision of mathematics teaching and learning a reality re-quires a strong system of support at both the local and the national lev-els. The National Council of Teachers of Mathematics proposes thatthe Principles and Standards—grounded in decades of research andpractice and refined in an extensive, collaborative process of review andrevision—serve as a basis for realizing the vision.
Putting the Principles into Action The Principles in chapter 2 offer perspectives that can guide decision
makers in mathematics education. If essential supports of good mathe-matics classrooms are missing, not all students can learn the mathe-matics they need. Teachers need to work in environments where theycan act, and continue to develop, as professionals. Mathematics teach-ing and learning should take place in a broader context that embracesand supports high-quality mathematics instruction. The following sec-tions highlight each of the Principles in turn, showing how they canshape answers to important questions in mathematics education.
How can all students have access to high-qualitymathematics education?
A major area of policy that affects students’ access to mathematicseducation is “tracking,” which is the long-term, often permanent,placement of students in classes, courses, or groups that offer differ-ent curricula according to the students’ perceived mathematical abili-ties. Historically, tracking has consistently resulted in a select groupof students being enrolled in mathematics courses that challenge andenrich them while others—often poor or minority students—areplaced in mathematics classes that concentrate on remediation or donot offer significant mathematical substance (Wheelock 1992). Forexample, many middle-grades and high school students have been ex-cluded from experiences in which they could learn significantamounts of algebra, instead spending much of their time reviewingthe mathematics content studied in the elementary grades. As a re-sult, these students are unable to experience a full program of highschool mathematics across the range of content areas. Principles andStandards takes a strong stance: All students should have a commonfoundation of challenging mathematics, whether those students willenter the workplace after high school or pursue further study inmathematics and science.
The EquityPrinciple
Excellence in mathematicseducation requires equity—high expectations andstrong support for all students.

369Working Together to Achieve the Vision
Taking this stance necessitates addressing the unique mathematicalneeds of all students. Students with exceptional promise in mathematicsand deep interest in advanced mathematical study need appropriate op-portunities to pursue their interests. Students with special learningneeds in mathematics must be supported both by their classroom teach-ers and by special education staff. Special-needs educators responsiblefor mathematics instruction should participate in mathematics profes-sional development, which will allow them to collaborate with class-room teachers in assessing and analyzing students’ work in order toplan instruction.
Teachers and school and district leaders face complex decisions abouthow best to structure different curricular options. One traditional wayfor students to learn additional mathematics in which they have a par-ticular interest is differential pacing—allowing some students to moverapidly through the mathematical content expected of all so that theycan go on to additional areas. However, some alternatives to differentialpacing may prove advantageous. For example, curricula can be offeredin which students can explore mathematics more deeply rather thanmore rapidly. This model allows them to develop deep insights into im-portant concepts that prepare them well for later experiences instead ofexperiencing a more cursory treatment of a broader range of topics. Orschools can offer supplementary mathematics opportunities in areas notstudied by all students or in extracurricular activities such as mathe-matics clubs or competitions.
Schools face difficult decisions about grouping—whether studentsshould be offered mathematics instruction in homogeneous or hetero-geneous groups. Students can effectively learn mathematics in hetero-geneous groups if structures are developed to provide appropriate, dif-ferentiated support for a range of students. Structures that excludecertain groups of students from a challenging, comprehensive mathe-matics program should be dismantled. All such efforts should be moni-tored and evaluated to ensure that students are well served.
Are good instructional materials chosen, used, andaccepted?
Choices of mathematics instructional materials can be controversial.Teachers should be prepared to work with new curricular materials, andthey need considerable time to “live with” curricula in order to discovertheir strengths and weaknesses. Only then can they develop the kinds ofknowledge necessary to make materials work well in particular contexts.The selection of curriculum and materials, therefore, needs to be along-term collaborative process involving teachers, teacher-leaders, andadministrators. Extensive field-testing should be conducted, with infor-mation and interactions at the district level so that choices are madewisely and support structures are put in place.
If instructional materials are not consistent with the expectations offamilies and community members or do not seem reasonable to them,serious difficulties can arise. For that reason, teachers and administra-tors should help families understand the goals and content of curricularmaterials, and community members should be consulted and informedabout decisions regarding curricula and materials. Choices of instruc-tional materials should be based on a community’s agreed-on goals for
The CurriculumPrinciple
A curriculum is more than acollection of activities: itmust be coherent, focusedon important mathematics,and well articulated acrossthe grades.
370 Principles and Standards for School Mathematics
mathematics education. Principles and Standards, together with province,state, and local frameworks, offers proposals for such goals.
Developers of instructional materials and frameworks should drawon research in their efforts to implement the ideas of standards. Weurge them to use Principles and Standards as a guide when making themany decisions involved in creating curricula. Similarly, through theevaluation and study of curricular efforts and through discussions of theideas in this document, the mathematics education community can con-tinue to develop a base of knowledge to guide the direction of mathe-matics education in prekindergarten through grade 12.
How can teachers learn what they need to know? Teachers need to know and use “mathematics for teaching” that
combines mathematical knowledge and pedagogical knowledge. Theymust be information providers, planners, consultants, and explorers ofuncharted mathematical territory. They must adjust their practices andextend their knowledge to reflect changing curricula and technologiesand to incorporate new knowledge about how students learn mathe-matics. They also must be able to describe and explain why they areaiming for particular goals.
Preservice preparation is the foundation for mathematics teaching,but it gives teachers only a small part of what they will need to knowand understand throughout their careers. No matter how well preparedteachers are when they enter the profession, they need sustained, ongo-ing professional development in order to offer students a high-qualitymathematics education. They must continue to learn new or additionalmathematics content, study how students learn mathematics, analyze is-sues in teaching mathematics, and use new materials and technology.Teachers must develop their own professional knowledge using re-search, the knowledge base of the profession, and their own experiencesas resources. Preservice education, therefore, needs to prepare teachersto learn from their own teaching, from their students, from curriculummaterials, from colleagues, and from other experts.
Unfortunately, the preparation today’s teachers have received is inmany instances inadequate for the needs of tomorrow. The reality issimple: unless teachers are able to take part in ongoing, sustained pro-fessional development, they will be handicapped in providing high-quality mathematics education. The current practice of offering occa-sional workshops and in-service days does not and will not suffice.
Most mathematics teachers work in relative isolation, with little sup-port for innovation and few incentives to improve their practice. Yetmuch of teachers’ best learning occurs when they examine their teach-ing practices with colleagues. Research indicates that teachers are betterable to help their students learn mathematics when they have opportu-nities to work together to improve their practice, time for personal re-flection, and strong support from colleagues and other qualified profes-sionals (see, e.g., Brown and Smith [1997]; Putnam and Borko [2000];Margaret Smith [forthcoming]). The educational environment must becharacterized by trust and respect for teachers and by patience as theywork to develop, analyze, and refine their practice. Too often we placethe responsibility for change solely on the shoulders of teachers andthen blame them when things do not work as expected. We need
The TeachingPrinciple
Effective mathematicsteaching requires under-standing what studentsknow and need to learnand then challenging andsupporting them to learnit well.
371Working Together to Achieve the Vision
instead to address issues in a systemic way, providing teachers with theresources they need for professional growth.
Such shifts in the system are feasible. The typical structures of teach-ers’ workdays often inhibit community building, but structures can bechanged. In some cultures, shared discussions of students and teachingare the norm. In Japan and China, the workdays of teachers includetime for meeting together to analyze recent lessons and to plan for up-coming lessons (Ma 1999; Stigler and Hiebert 1999). During this “les-son study,” teachers plan the lesson, teach the lesson with colleagueswatching, revise the lesson collaboratively, teach the revised lesson,evaluate and reflect again, and share the results in written form. Part ofthe planning includes predicting what groups of students will do whenpresented with particular problems and tasks. The ongoing analysis ofpractice is thus built into the fabric of teaching, not treated as an addedtask that teachers must organize themselves. Although this level of pro-fessional collaboration may be hard for U.S. and Canadian teachers toimagine within the constraints of the prevailing professional culture andsystem, it illustrates the potential power of learning communities to im-prove mathematics teaching and learning. Finding ways to establishsuch communities should be a primary goal for schools and districtsthat are serious about improving mathematics education.
Do all students have time and the opportunity to learn? Learning mathematics with understanding requires consistent access
to high-quality mathematics instruction. In the elementary grades, stu-dents should study mathematics for at least an hour a day under theguidance of teachers who enjoy mathematics and are prepared to teachit well. Achieving this objective takes thoughtful administrativearrangements, such as orchestrating shared teaching responsibilities orusing mathematics specialists.
Every middle-grades and high school student should be required tostudy the equivalent of a full year of mathematics in each grade. Ways oforganizing programs will vary according to local goals and situations.Some schools are using such organizational alternatives as block schedul-ing. The impact of such alternatives on students’ learning needs furtherstudy. It is not clear, for example, whether long intervals between periodsof intensive study benefit or detract from students’ learning or whethermathematics-intensive workplace activity can support students’ mathemat-ical engagement and growth. All middle-grades and high school studentsshould be expected to spend a substantial amount of time every day work-ing on mathematics outside of class, in activities ranging from typicalhomework assignments and projects to problem solving in the workplace.
A significant challenge to realizing the vision portrayed in Principlesand Standards is disengagement. Too many students disengage fromschool mathematics, which creates a serious problem not only for theirteachers but also for a society that increasingly depends on a quantita-tively literate citizenry. Students may become uninvolved for variousreasons. Many, for example, find it difficult to sustain the motivationand effort required to learn what can be a challenging school subject.They may find the subject as taught to be uninteresting and irrelevant.
Disengagement is too often reinforced in both overt and subtle waysby the attitudes and actions of adults who have influence with students.
The LearningPrinciple
Students must learn mathe-matics with understanding,actively building newknowledge from experienceand prior knowledge.
372 Principles and Standards for School Mathematics
Some parents and other authority figures, as well as societal influenceslike the media, convey the message that not everyone is expected to besuccessful in mathematics and thus that disengagement from schoolmathematics is acceptable. Such societal tolerance makes it less likely thatall students will be motivated to sustain the effort needed to learn mathe-matics, which in turn makes the job of their teachers even more challeng-ing. Some teachers also believe that many students cannot learn mathe-matics, which supports those students in their beliefs that they cannotlearn mathematics, which then leads to further disengagement. Thus, avicious cycle takes hold. It affects school mathematics in profound waysand is especially prevalent in the middle grades and high school.
Although the challenge presented by disengagement is formidable, itis not insurmountable. Teachers need to uphold high expectations thatall children should learn with understanding, including children of mi-norities or from poor communities. Many teachers have found that ifthey teach mathematics in ways similar to those advanced in Principlesand Standards—for example, by approaching traditional topics in waysthat emphasize conceptual understanding and problem solving—manyapparently uninterested students can become quite engaged.
Are assessments aligned with instructional goals? High-stakes assessments—from nationally normed achievement tests to
state, province, or locally developed measures of students’ performance—are a particular concern for educators. If they are not aligned with schooland community goals for mathematics education and with the curriculum,teachers and students are left in a precarious position. If teachers are com-mitted to pursuing goals and practices consistent with those in Principlesand Standards, satisfying the sometimes contradictory requirements of thelocal, state, or province assessment system is challenging. It is not realisticfor teachers simply to ignore the pressure of these tests. Students may bepenalized if they do not perform well, staff or school evaluations may de-pend on demonstrating progress, and decisions about resource allocationand salaries may be tied to test scores. Yet “teaching to the test”—a politi-cal reality when the consequences of test scores are significant—can un-dermine the integrity of instruction. To put teachers in the position of de-ciding between what they believe best enhances their students’ learningand what is required to survive in the educational system puts them in anuntenable position. High-stakes assessments must be closely linked to thegoals teachers are being asked to achieve; where they are not, teachersmust be supported in the decisions they make.
The assessment of students’ understanding can be enhanced by theuse of multiple forms of assessment, such as portfolios, group projects,and writing questions. However, students and parents alike may findthese forms unfamiliar in the mathematics classroom. Teachers needsupport from administrators in helping students and parents understandthe utility and purpose of such approaches in improving mathematicsinstruction.
Is technology supporting learning? To make technology an essential part of classrooms, the techno-
logical tools must be selected and used in ways that are compatible with
The AssessmentPrinciple
Assessment should supportthe learning of importantmathematics and furnishuseful information to bothteachers and students.

373Working Together to Achieve the Vision
the instructional goals. When technological tools are considered essen-tial instructional materials for all students, then decisions about re-sources must reflect this view, despite the costs of purchases and up-grades. Schools, districts, or provinces that integrate technology inmathematics teaching and learning face challenging issues of equity.The need for high-quality technology is as great in urban and rural set-tings as in suburban schools—perhaps greater.
Decisions to incorporate new technology also require that teachersbe prepared and supported in using it to serve instructional goals.Teachers must themselves experience how technology can enhance thelearning of significant mathematics and explore models for incorporat-ing it in their classroom practice. Moreover, technology must be em-bedded in the mathematics program rather than be treated as just an-other flashy add-on. Without coherent, comprehensive implementationplans, the incorporation of new technology is likely to fall short in im-proving mathematics teaching and learning.
Roles and ResponsibilitiesThe sections that follow discuss the kinds of commitments and ac-
tions that various communities must make to realize the vision of Prin-ciples and Standards. The role of teachers, of course, is central. Thechoices that mathematics teachers make every day determine the qual-ity and effectiveness of their students’ mathematics education. Butteachers alone do not make all the decisions—they are part of a com-plex instructional system. Others—students themselves; mathematicsteacher-leaders; school, district, and state or province administrators;higher-education faculty; families, other caregivers, and communitymembers; and professional organizations and policymakers—have re-sources, influence, and responsibilities that can enable teachers andtheir students to be successful.
Mathematics TeachersMathematics teachers must develop and maintain the mathematical
and pedagogical knowledge they need to teach their students well. Oneway to do this is to collaborate with their colleagues and to create theirown learning opportunities where none exist. They should also seek outhigh-quality professional development opportunities that fit their learn-ing needs. By pursuing sources of information, building communities ofcolleagues, and participating in professional development, teachers cancontinue to grow as professionals.
Mathematics teachers generally are responsible for what happens intheir own classrooms and can try to ensure that their classrooms supportlearning by all students. For example, whether or not their school hasimplemented tracking, teachers must challenge and hold high expecta-tions for all their students, not just those they believe are “gifted.” Ele-mentary school students need at least an hour of mathematics instruc-tion each day. The decisions teachers make in the classroom about howto offer all students experiences with important mathematics and how toaccommodate the wide-ranging interests, talents, and experiences of
The TechnologyPrinciple
Technology is essential inteaching and learningmathematics; it influencesthe mathematics that istaught and enhances students’ learning.

374 Principles and Standards for School Mathematics
students are essential to giving all students access to mathematics. Al-though many matters bearing on their classrooms are beyond teachers’sole control, they need to take the initiative in discussing trends and op-portunities in mathematics education with administrators.
Teachers must help students be confident, engaged mathematicslearners. In the elementary grades, convincing students that they can domathematics and helping them enjoy it are important goals. Typically,student disengagement has been a serious problem in the middle gradesand high school. Teachers at those levels should work to keep studentsinvolved in relevant classroom activities, assign projects that make con-nections between mathematics and students’ daily lives, and allow stu-dents multiple avenues to display what they have learned. Learning ex-periences based in the workplace have also proved effective inmotivating students who are at risk of becoming disengaged fromschool.
Mathematics teachers can foster reinforcement of their efforts byfamilies and other community members by maintaining dialogue aimedat the improvement of mathematics education. Communicating aboutmathematics goals, students’ learning, teaching, and programs helpsfamilies and other caregivers understand the kind of mathematics learn-ing in which children are engaged. Giving them opportunities to askquestions, express concerns, and experience classroom activities can bevery useful in shaping improvements. Many groups of teachers organize“Math Nights” at least once a year. At such events, usually held duringthe evening for the convenience of parents, students and their parentswork together on engaging mathematics activities. Newsletters, home-work assignments that involve family collaboration, and other meanscan help maintain communication between home and school. To do allof this well, teachers need to understand their mathematical goals andtheir perspectives on mathematics education and be able to articulatethem in compelling ways.
Mathematics teachers ultimately control the range of mathematicalideas made available to their students. They have the responsibility toensure that a full range of mathematical content and processes, such asthose described in this document, are taught and that mathematical em-phases fit together into a coherent whole. They can do so by using theavailable textbooks, support materials, technology, and other instruc-tional resources effectively and tailoring these resources to their particu-lar situations so that their goals for mathematics instruction and theirstudents’ needs are met. Teachers need to seek out support and profes-sional development as they implement current or new curricula. Theyshould constantly evaluate curricular materials and offer suggestions toteacher-leaders and administrators, and they should find ways to be in-volved in choosing the instructional materials for their school or district.
Integrating assessment into instruction and using a variety of sourcesof evidence to evaluate the learning of each student is challenging. Itmay be especially difficult in the face of mandated high-stakes assess-ments. Although teachers may at times feel trapped between their goalsfor their students’ mathematics learning and those of high-stakes tests,they are not powerless. If teachers recognize that required tests are notaligned with meaningful instructional goals, they should voice theirconcerns to their teacher-leaders and administrators and seek ways toparticipate in decisions about testing.
Teachers must helpstudents be confident,engaged mathematics
learners.

375Working Together to Achieve the Vision
Teacher-leaders’ supporton a day-to-day basiscan be crucial to ateacher’s work life.
Mathematics StudentsLearning mathematics is stimulating, rewarding, and at times diffi-
cult. Mathematics students, particularly in the middle grades and highschool, can do their part by engaging seriously with the material andstriving to make mathematical connections that will support their learn-ing. If students are committed to communicating their understandingsclearly to their teachers, then teachers are better able to plan instruc-tion and respond to students’ difficulties. Productive communicationrequires that students record and revise their thinking and learn to askgood questions as part of learning mathematics.
Beyond the classroom, students need to build time into their days towork on mathematics. They need to learn how to use resources such asthe Internet to pursue their mathematical questions and interests. Asstudents begin to identify potential careers, they can take the initiative inresearching the mathematics requirements for those careers and investi-gate whether their school programs offer the necessary preparation.
Mathematics Teacher-LeadersThere is an urgent and growing need for mathematics teacher-
leaders—specialists positioned between classroom teachers and admin-istrators who can assist with the improvement of mathematics educa-tion. The kinds of roles and influences that such leaders can have, aswell as the nature of their position and responsibility, will vary widely.In recent years, schools have increasingly turned to teachers in the sys-tem as potential leaders. Sometimes leaders are teachers on special as-signment, released from the classroom for an extended period to workin one or several school buildings. In other situations, leaders are re-leased from a portion of their classroom teaching so that they can workdirectly with other teachers. No matter what the particular arrange-ment may be, mathematics teacher-leaders should take responsibilityfor focusing on mathematics through their work with teachers, admin-istrators, and families and other community members.
Teacher-leaders can have a significant influence by assisting teachersin building their mathematical and pedagogical knowledge. Leadersface the challenge of changing the emphasis of the conversation amongteachers from “activities that work” to the analysis of practice. Teacher-leaders in some settings work with their colleagues to design profes-sional development plans for individual teachers, for a school, or for alarger system. They can arrange collaborative investigations or discus-sion groups with teachers at a school site, encourage participation inworkshops at the school or district level, promote attendance at profes-sional conferences, organize the study of professional resources such asPrinciples and Standards and articles in professional journals, recommendInternet sites that discuss mathematics teaching, and provide informa-tion about in-service programs or graduate courses. Teachers can bene-fit greatly from the knowledge and support of peers and mentors asthey move in the directions recommended in Principles and Standards.Teacher-leaders’ support on a day-to-day basis—ranging from conver-sations in the hall to in-classroom coaching to regular grade-level anddepartmental seminars focused on how students learn mathematics—can be crucial to a teacher’s work life.

376 Principles and Standards for School Mathematics
Teacher-leaders should have the knowledge and expertise to play arole in the design of curriculum frameworks and the selection of in-structional materials, and they should ensure that teachers are involvedin these processes, too. Schools and districts can also rely on mathe-matics teacher-leaders to organize and lead the piloting and implemen-tation of new instructional materials. They might help teachers in aschool begin working through the materials themselves, reading anddiscussing any commentary about student learning found in the materi-als, analyzing students’ work, and designing and critiquing lessons. Inthis way, the materials can serve as a means for teachers to learn.
Teacher-leaders also have a role in working with administrators andpolicymakers to help guide their decisions about the improvement ofmathematics education. They can help ensure that teachers and adminis-trators develop and share a common perspective about goals for mathe-matics teaching and learning. Doing so involves keeping everyone in-formed of new directions and emphases in mathematics education andfacilitating substantive discussions and planning sessions aimed at reachingcommon goals. Finally, like all teachers, mathematics teacher-leaders mustthemselves engage in ongoing learning and professional development.
School, District, and State or Province AdministratorsAdministrators at every level have responsibilities for shaping the in-
structional mission in their jurisdictions, providing for the professionaldevelopment of teachers, designing and implementing policies, and al-locating resources. To deploy their influence well on behalf of mathe-matics education, administrators who understand the goals of mathe-matics instruction—including those described in Principles andStandards—can work to create institutions in which teachers have accessto human and material resources that will help them attain those goals.In particular, administrators can identify individuals or teams of teach-ers as leaders in establishing mathematics communities, and they canensure that such learning communities develop, flourish, and grow be-yond a few teachers. When administrators themselves become part ofthe mathematics learning community, they develop deeper understand-ings of the goals of mathematics instruction. They can understand bet-ter what they are seeing in mathematics classrooms (Nelson 1999) andcan make more-informed judgments about the curricular, technologi-cal, and pedagogical resources teachers need.
If they are truly committed to the improvement of mathematics edu-cation, administrators at all levels should ensure that mathematics ex-pertise and leadership are developed in their schools or systems. Ad-ministrators can influence the quality of mathematics education bysupporting the professional growth of mathematics teachers. They canarrange for meaningful professional development workshops, providelibraries and Web access to instructional and other materials, and fostercross-school conversations about goals and instructional practices. Ad-ministrators can help arrange teachers’ work schedules so that mean-ingful collaboration with colleagues is part of the school day. They canshape work environments so that they are conducive to productive pro-fessional interactions, they can include such interactions as part ofteachers’ work, and they can establish a program of mathematicsteacher-leaders within the school or system.
Administrators at all levels should ensure
that mathematicsexpertise and leadership
are developed in theirschools or systems.

377Working Together to Achieve the Vision
Administrators andpolicymakers mustcarefully consider theimpact of high-stakesassessments on theinstructional climate in schools.
Perhaps the most important sphere of influence for administrators isthe area of structures and policies. Through their decisions about hir-ing, teaching assignments, evaluation, and mentoring for new teachers,administrators have powerful opportunities to strengthen the focus onmathematics. They also have a role in guaranteeing equitable access forstudents and in arranging time and space for effective mathematics in-struction. They can work to align curricular materials, technology, andassessments at all levels with agreed-on goals for mathematics educa-tion, such as those represented in Principles and Standards.
Administrators can support the improvement of mathematics educa-tion by establishing effective processes for the analysis and selection ofinstructional materials. These processes, whether at the classroom,school, or system level, should involve wide consultation with teachersand teacher-leaders and a deep and careful analysis of the materials.Many districts pilot-test one or more programs before making a finaldecision. No matter how decisions about the selection of instructionalmaterials are made, they should always be guided by school, state orprovince, and national goals for mathematics instruction. Furthermore,the adoption of new instructional materials is only a beginning. Nomatter how well curricular materials may be designed, they are unlikelyto lead to the continuing improvement of instruction unless plans forimplementation and professional development are formulated alongwith the plan for adoption.
Finally, to make long-term progress in improving students’ learning,administrators and policymakers must carefully consider the impact ofhigh-stakes assessments on the instructional climate in schools, and theymust understand what can be learned from assessments and what cannot.If a test focuses primarily on the acquisition of superficial skills ratherthan on the deep mathematical understandings described in this docu-ment, its use in making decisions that promote constructive change willbe limited and perhaps even counterproductive. Decisions about placingstudents in different instructional situations and evaluations of teachers’effectiveness should never be based on a single test score, especiallywhen that test has been designed to measure how well students carry outroutine procedures. Implementing and sustaining assessment policiesand practices that support high-quality mathematics education is a diffi-cult but essential part of administrators’ responsibilities.
Higher-Education FacultyFaculty in two-year and four-year colleges and universities have a
significant impact on school mathematics, primarily through their workwith students who will become teachers. They have considerable influ-ence on whether teachers enter the profession with the strong knowl-edge of the mathematics needed to teach pre-K–12 mathematics, ofstudent learning, and of mathematics teaching. They can also modelthe effective practices they believe teachers should employ.
The first few years in teachers’ careers are critical to their persistencein mathematics teaching and to their dispositions toward continuedprofessional growth and learning. The in-service education and profes-sional development of teachers, especially in content knowledge, arenot the exclusive mission of any single type of institution, so a signifi-cant leadership role is available for higher education. Teachers need

378 Principles and Standards for School Mathematics
in-service and graduate education that help them grow mathematicallyand as practitioners.
Faculty members in institutions of higher education should be partnersin the development of school-based mathematics communities. Teachereducators, mathematicians, and practicing teachers working together cancreate a rich intellectual environment that will promote veteran teachers’growth and demonstrate to new teachers the value of learning communi-ties. Mathematics education researchers and teacher educators can col-laborate with classroom teachers to investigate research questions basedin classroom practice or to look at mathematics as it occurs in classrooms.In such contexts, higher-education faculty can serve as resources tomathematics teachers at all levels and also learn from them.
In recent decades, research in mathematics education has coalescedas a powerful field of intellectual study. The efforts of education andmathematics faculty can result in increased knowledge and the im-proved preparation of teachers, teacher-leaders, administrators, and re-searchers. Such ongoing efforts, in collaboration with school personnel,are a major aspect of improving mathematics teaching and learning.
Families, Other Caregivers, and Community MembersTeachers and administrators should invite families, other caregivers,
and community members to participate in examining and improvingmathematics education. All partners in this enterprise need to under-stand the changing goals and priorities of school mathematics, as ex-pressed in the Principles in chapter 2. Families need to know what op-tions are available for their children and why an extensive and rigorousmathematics education is important. When parents understand andsupport the schools’ mathematics program, they can be invaluable inconvincing their daughters and sons of the need to learn mathematicsand to take schooling seriously. Families become advocates for educa-tion standards when they understand the importance of a high-qualitymathematics education for their children.
Families can establish learning environments at home that enhance thework initiated at school. Respect shown to and for teachers is often car-ried over from parent to child. By providing a quiet place for a child toread and attend to homework and by monitoring students’ work, familiescan signal that they believe mathematics is important. Such attention andappreciation of mathematics is not lost on students.
If families and other members of the public do not understand the in-tent of, and rationale for, improvements in mathematics education, theycan halt even the most carefully planned initiatives. Principles and Stan-dards was written with the hope that the conversations it engenders willultimately generate a widespread commitment to improving mathe-matics education. As part of this effort, it is the responsibility of the edu-cation community to inform the general public and its elected represen-tatives about the goals and priorities in mathematics education, therebyempowering them to participate knowledgeably in its improvement.
Professional Organizations and PolicymakersProfessional organizations can provide national and regional leadership
and expertise in support of the continuing improvement of mathematics
Families becomeadvocates for education
standards when theyunderstand the
importance of a high-quality mathematics
education for theirchildren.

379Working Together to Achieve the Vision
Local, state, andprovincial curricularframeworks andstandards need ongoingexamination andrevision.
education. The National Council of Teachers of Mathematics (NCTM),using Principles and Standards as a focus, will offer its members manymeans of professional development, including conferences, classroom re-sources, research publications, and Web-based materials. NCTM is alsoengaged in a variety of efforts to educate the public and to support parentsand other caregivers as they encourage their children in mathematics. (Seethe NCTM Web site at www.nctm.org for details.) Professional organiza-tions like the NCTM are positioned to promote policies that supporthigh-quality mathematics education. For instance, they can work to estab-lish certification and accreditation requirements that include high expecta-tions for teachers’ knowledge of content, teaching, and students. Throughtheir members, publications, and meetings, professional organizations canfocus attention on mathematics education issues.
High-quality mathematics education is vital to the health of mathe-matics as a discipline, and mathematical professional societies have aclear stake in this enterprise. Mathematics education serves as thepipeline for future mathematicians, statisticians, and mathematicsteachers as well as scientists, engineers, and all professionals who usemathematics. The public needs to be well informed about, not intimi-dated by, mathematics if it is to support ongoing research, develop-ment, and funding in mathematics and related fields. The nature of un-dergraduate mathematics programs is closely intertwined with K–12mathematics education, and efforts to improve mathematics teachingand learning from kindergarten through graduate school can be coordi-nated across professional organizations. Issues about the mathematicalpreparation of teachers are currently being addressed by the Confer-ence Board of the Mathematical Sciences (CBMS) in its “MathematicalEducation of Teachers” project (CBMS 2000). All professional organi-zations concerned with the mathematical sciences can help improvemathematics education through coordinated, collaborative efforts.
Policymakers at national and local levels are in a unique position toview the broad range of influences on mathematics education and to makedecisions that promote improvements in the field. They can allocate thefunding and resources needed to continue the study and implementationof improvements. They can also examine teacher-certification standardsand accreditation requirements to ensure that teachers have the strongand deep content knowledge needed today. In the same way that standardsneed ongoing examination and revision, so do local, state, and provincialcurricular frameworks and standards. With Principles and Standards avail-able as a resource to identify key issues in contemporary mathematics edu-cation, policymakers can ensure that that process occurs and can promoteprogrammatic activity that is designed to further address those issues.
Using Principles and Standards EffectivelyPrinciples and Standards for School Mathematics has both an immediate
and a long-term role in realizing the vision of improved mathematicseducation. First, it sets out a carefully developed and ambitious but at-tainable set of expectations for school mathematics. Educators, families,policymakers, and others can use the ideas contained in this volume toguide the decisions they make about mathematics education, from

380 Principles and Standards for School Mathematics
classroom practice to establishing local and state education standardsand frameworks. The interest generated by NCTM’s original Curricu-lum and Evaluation Standards for School Mathematics (1989) demonstratesthe extent to which various groups with a stake in mathematics educa-tion are committed to its improvement. Principles and Standards is in-tended to build on and extend that commitment. It represents a collec-tive judgment, based on research, practice, and an extended consultativeprocess, about what students need to learn in order to be prepared forthe future.
Principles and Standards is also a tool for better understanding the is-sues and challenges involved in improving mathematics education. Itoffers information and ideas that those with responsibility for mathe-matics education—whether at the local, state or provincial, or nationallevel—need in order to engage in constructive dialogues about mathe-matics teaching, curricula, and assessment. Any vision of school mathe-matics teaching and learning needs ongoing examination; it needs to berefined continually in light of the greater understanding achievedthrough practice, research, and evidence-based critiques. The processthat NCTM put in place for developing Principles and Standards reflectsa commitment to ongoing discussion and reflection. This document,therefore, should be seen as part of a work in progress that can helpguide decision makers in developing excellent mathematics programs,not as a prescription to be rigidly imposed on others. (See Kilpatrickand Silver [2000] and Ferrini-Mundy [2000] for additional discussion.)
ConclusionAchieving high standards in mathematics education calls for clear
goals. It calls for the active participation of teachers, administrators,policymakers, higher-education faculty, curriculum developers, re-searchers, families, students, and community members.
Principles and Standards is provided as a catalyst for the continued im-provement of mathematics education. It represents our best current un-derstanding of mathematics teaching and learning and the contextualfactors that shape them. It was created with the input and collaborationof members of all the communities mentioned above. It articulates highbut attainable standards.
Realizing the vision of mathematics education described in this docu-ment requires the continued creation of high-quality instructional ma-terials and technology. It requires enhanced preparation for teachersand increased opportunities for professional growth. It requires the cre-ation of assessments aligned with curricular goals. Realizing the visiondepends on the participation of all the constituencies mentioned abovein reflecting on, supporting, and improving educational practice. Weshould not underestimate the difficulty of the task, but it can be done.Now is the time to undertake the collaborative efforts that will makethe vision come alive. We owe our children nothing less.
Principles andStandards is provided
as a catalyst for thecontinued improvement
of mathematicseducation.

Blank Page

Blank Page

Andrews, Angela Giglio. “Developing Spatial Sense—a MovingExperience.” Teaching Children Mathematics 2 (January 1996):290–93.
———— . “Solving Geometric Problems by Using Unit Blocks.”Teaching Children Mathematics 6 (February 1999): 318–23.
Balanced Assessment for the Mathematics Curriculum. HighSchool Assessment Package 2. White Plains, N.Y.: Dale Seymour Publications, 1999b.
———— . Middle Grades Assessment Package 1. White Plains, N.Y.:Dale Seymour Publications, 1999a.
Ball, Deborah Loewenberg, and Hyman Bass. “Making Believe:The Collective Construction of Public Mathematical Knowl-edge in the Elementary Classroom.” In Constructivism in Ed-ucation, edited by D. Phillips, Yearbook of the National Soci-ety for the Study of Education. Chicago, Ill.: University ofChicago Press, forthcoming.
Banchoff, Thomas F. “Dimension.” On the Shoulders of Giants:New Approaches to Numeracy, edited by Lynn Arthur Steen,pp. 11–59. Washington, D.C.: National Academy Press,1990.
Baroody, Arthur J. “The Development of Basic Counting,Number, and Arithmetic Knowledge among Children Clas-sified as Mentally Handicapped.” In International Review ofResearch in Mental Retardation, edited by Laraine MastersGlidden, pp. 51–103. New York: Academic Press, 1999.
———— . “The Development of Preschoolers’ Counting Skillsand Principles.” In Pathways to Number: Children’s DevelopingNumerical Abilities, edited by Jacqueline Bideaud, Claire Meljac, and Jean-Paul Fischer, pp. 99–126. Hillsdale, N.J.:Lawrence Erlbaum Associates, 1992.
———— . “An Investigative Approach to the Mathematics In-struction of Children Classified as Learning Disabled.” InCognitive Approaches to Learning Disabilities, edited by D. KimReid, Wayne P. Hresko, and H. Lee Swanson, pp. 547–615.Austin, Tex.: Pro-Ed, 1996.
———— . 3-D Geometry: Seeing Solids and Silhouettes. Investiga-tions in Number, Data, and Space. Palo Alto, Calif.: DaleSeymour Publications, 1995.
Battista, Michael T., Douglas H. Clements, Judy Arnoff,Kathryn Battista, and Caroline Van Auken Borrow. “Stu-dents’ Spatial Structuring of 2D Arrays of Squares.” Journalfor Research in Mathematics Education 29 (November 1998):503–32.
Beaton, Albert E., Ina V. S. Mullis, Michael O. Martin, EugenioJ. Gonzalez, Dana L. Kelly, and Teresa A. Smith. Mathe-matics Achievement in the Middle School Years: IEA’s Third In-ternational Mathematics and Science Study (TIMSS). ChestnutHill, Mass.: Boston College, TIMSS International StudyCenter, 1996.
Behr, Merlyn, Stanley Erlwanger, and Eugene Nichols. HowChildren View Equality Sentences. PMDC Technical Reportno. 3. Tallahassee, Fla.: Florida State University, 1976.(ERIC Document Reproduction Service no. ED144802).
Bennett, Albert, Eugene Maier, and Ted Nelson. Math and theMind’s Eye. Portland, Oreg.: The Math Learning Center,1988.
Black, Paul, and Dylan Wiliam. “Inside the Black Box: RaisingStandards through Classroom Assessment.” Phi Delta Kappan(October 1998): 139–48.
Boers-van Oosterum, Monique Agnes Maria. “Understandingof Variables and Their Uses Acquired by Students in Tradi-tional and Computer-Intensive Algebra.” Ph.D. diss., Uni-versity of Maryland College Park, 1990.
Borasi, Raffaella. Learning through Inquiry. Portsmouth, N.H.:Heinemann, 1992.
Borko, Hilda, and Ralph T. Putman. “Learning to Teach.” InHandbook of Educational Psychology, edited by David C.Berliner and Robert C. Calfee, pp. 673–708. New York:Macmillan, 1996.
Bransford, John D., Ann L. Brown, and Rodney R. Cocking,eds. How People Learn: Brain, Mind, Experience, and School.Washington, D.C.: National Academy Press, 1999.
Brown, Catherine A., and Margaret S. Smith. “Supporting theDevelopment of Mathematical Pedagogy.” MathematicsTeacher 90 (February 1997): 138–43.
Brown, Stephen I., and Marion Walter. The Art of Problem Pos-ing. Hillsdale, N.J.: Lawrence Erlbaum Associates, 1983.
Brownell, William A. “The Place of Meaning in the Teaching ofArithmetic.” Elementary School Journal 47 (January 1947):256–65.
Burger, William F., and J. Michael Shaughnessy. “Characteriz-ing the van Hiele Levels of Development in Geometry.”Journal for Research in Mathematics Education 17 (January1986): 31–48.
Burns, Marilyn. Fifty Problem-Solving Lessons, Grades 1–6.Sausalito, Calif.: Math Solutions Publications, 1996.
Burns, Marilyn, and Cathy McLaughlin. A Collection of MathLessons from Grades 6 through 8. Sausalito, Calif.: Math Solu-tions Publications, 1990.
Burrill, Gail F., Jack C. Burrill, Patrick W. Hopfensperger, andJames M. Landwehr. Exploring Regression: Data-DrivenMathematics. White Plains, N.Y.: Dale Seymour Publica-tions, 1999.
Burton, Grace, Douglas Clements, Terrence Coburn, John DelGrande, John Firkins, Jeane Joyner, Miriam A. Leiva, MaryM. Lindquist, and Lorna Morrow. Third-Grade Book. Cur-riculum and Evaluation Standards for School Mathematics Ad-denda Series, Grades K–6, edited by Miriam A. Leiva. Reston, Va.: National Council of Teachers of Mathematics,1992.
California State Department of Education. A Question of Think-ing: A First Look at Students’ Performance on Open-Ended Ques-tions in Mathematics. Sacramento, Calif.: California Assess-ment Program, California State Department of Education,1989.
383References
References

Campbell, Patricia. Project IMPACT: Increasing MathematicsPower for All Children and Teachers. Phase 1, Final Report.College Park, Md.: Center for Mathematics Education, Uni-versity of Maryland, 1995.
Carle, Eric. Rooster’s Off to See the World. Natick, Mass.: PictureBook Studio, 1971.
Carlson, Marilyn P. “A Cross-Sectional Investigation of the De-velopment of the Function Concept.” In Research in CollegiateMathematics Education 3, edited by Alan H. Schoenfeld, JimKaput, and Ed Dubinsky, pp. 114–62. Washington, D.C.:Conference Board of the Mathematical Sciences, 1998.
Carnegie Corporation of New York. Years of Promise: A Compre-hensive Learning Strategy for America’s Children, ExecutiveSummary. June 1999. Available online atwww.carnegie.org//execsum.html.
Carpenter, Thomas P., Mary Kay Corbitt, Henry S. Kepner, Jr.,Mary Montgomery Lindquist, and Robert E. Reys. Resultsfrom the Second Mathematics Assessment of the National Assess-ment of Educational Progress. Reston, Va.: National Council ofTeachers of Mathematics, 1981.
Carpenter, Thomas P., Elizabeth Fennema, Penelope L. Peter-son, Chi-Pang Chiang, and Megan Loef. “Using Knowledgeof Children’s Mathematics Thinking in Classroom Teaching:An Experimental Study.” American Education Research Journal26 (1989): 499–531.
Carpenter, Thomas P., Megan L. Franke, Victoria R. Jacobs,Elizabeth Fennema, and Susan B. Empson. “A LongitudinalStudy of Invention and Understanding in Children’s Multi-digit Addition and Subtraction.” Journal for Research inMathematics Education 29 (January 1998): 3–20.
Carpenter, Thomas P., and Linda Levi. “Developing Concep-tions of Algebraic Reasoning in the Primary Grades.” Paperpresented at the annual meeting of the American Educa-tional Research Association, Montreal, April 1999.
Carpenter, Thomas P., and James M. Moser. “The Acquisitionof Addition and Subtraction Concepts in Grades Onethrough Three.” Journal for Research in Mathematics Education15 (May 1984): 179–202.
Clement, Jennie, Erin DiPerna, Jean Gavin, Sally Hanner, EricJames, Angie Putz, Mark Rohlfing, and Susan Wainwright.Children’s Work with Data. Madison, Wis.: Wisconsin Centerfor Education Research, University of Wisconsin—Madison,1997.
Clements, Douglas H. “Geometric and Spatial Thinking inYoung Children.” In Mathematics in the Early Years, edited byJuanita V. Copley, pp. 66–79. Reston, Va.: National Councilof Teachers of Mathematics, 1999b.
———— . “Training Effects on the Development and Generaliza-tion of Piagetian Logical Operations and Knowledge ofNumber.” Journal of Educational Psychology 76, no. 5 (1984):766–76.
———— . “Young Children and Technology.” In Dialogue on EarlyChildhood Science, Mathematics, and Technology Education,edited by G. D. Nelson, pp. 92–105. Washington, D.C.:American Association for the Advancement of Science,1999a.
Clements, Douglas H., Michael T. Battista, Julie Sarama, andSudha Swaminathan. “Development of Students’ SpatialThinking in a Unit on Geometric Motions and Area.” Ele-mentary School Journal 98, no. 2 (1997): 171–86.
Clements, Douglas H., Sudha Swaminathan, Mary Anne ZeitlerHannibal, and Julie Sarama. “Young Children’s Concepts ofShape.” Journal for Research in Mathematics Education 30(March 1999): 192–212.
Cobb, Paul, and Grayson Wheatley. “Children’s Initial Under-standings of Ten.” Focus on Learning Problems in Mathematics10, no. 3 (1988): 1–28.
Cobb, Paul, Terry Wood, and Erna Yackel. “Discourse, Mathe-matical Thinking, and Classroom Practice.” In Contexts forLearning: Sociocultural Dynamics in Children’s Development.New York: Oxford University Press, 1994.
Cobb, Paul, Terry Wood, Erna Yackel, John Nicholls, GraysonWheatley, Beatriz Trigatti, and Marcella Perlwitz. “Assess-ment of a Problem-Centered Second-Grade MathematicsProject.” Journal for Research in Mathematics Education 22(January 1991): 3–29.
Cobb, Paul, Erna Yackel, Terry Wood, Grayson Wheatley, andGraceann Merkel. “Creating a Problem-Solving Atmos-phere.” Arithmetic Teacher 36 (September 1988): 46–47.
Collins, Alan, John Seely Brown, and Susan Newman. “Cogni-tive Apprenticeship: Teaching the Crafts of Reading, Writ-ing, and Mathematics.” In Knowing, Learning, and Instruction:Essays in Honor of Robert Glaser, edited by Lauren B. Resnick,pp. 453–94. Hillsdale, N.J.: Lawrence Erlbaum Associates,1989.
Conference Board of the Mathematical Sciences. CBMS Mathe-matical Education of Teachers Project Draft Report. Washington,D.C.: Conference Board of the Mathematical Sciences,March 2000. Available on the Web at www.maa.org/cbms.
Confrey, Jere. “Learning to Listen: A Student’s Understandingof Powers of Ten.” In Radical Constructivism in MathematicsEducation, edited by Ernst von Glasersfeld, pp. 111–38.Boston: Kluwer Academic Publishers, 1991.
———— . “A Review of the Research on Student Conceptions inMathematics, Science, and Programming.” In Review of Re-search in Education, vol.16, edited by Courtney Cazden, pp.3–56. Washington, D.C.: American Educational ResearchAssociation, 1990.
Consortium for Mathematics and Its Applications. Mathematics:Modeling Our World. Cincinnati, Ohio: South-Western Edu-cational Publishing, 1999.
Council of Chief State School Officers. State Curriculum Frame-works in Mathematics and Science: How Are They Changingacross the States? Washington, D.C.: Council of Chief StateSchool Officers, 1995.
Coxford, Arthur F., James T. Fey, Christian R. Hirsch, HaroldL. Schoen, Gail Burrill, Eric W. Hart, and Ann E. Watkins,with Mary Jo Messenger and Beth Ritsema. ContemporaryMathematics in Context: A Unified Approach, Course, 2, Part B.Core-Plus Mathematics Project. Chicago: Everyday Learn-ing Corp., 1998.
Curcio, Frances R., and Nadine S. Bezuk, with others. Under-standing Rational Numbers and Proportions. Curriculum andEvaluation Standards for School Mathematics Addenda Series,Grades 5–8. Reston, Va.: National Council of Teachers ofMathematics, 1994.
Curriculum Development Institute of Singapore. PrimaryMathematics 6B. Singapore: Federal Publications, 1997.
384 Principles and Standards for School Mathematics

Demana, Franklin, and Joan Leitzel. “Establishing FundamentalConcepts through Numerical Problem Solving.” In The Ideasof Algebra, K–12, 1988 Yearbook of the National Council ofTeachers of Mathematics, edited by Arthur F. Coxford, pp.61–68. Reston, Va.: National Council of Teachers of Mathe-matics, 1988.
Dossey, John A., Ina V. S. Mullis, and Chancey O. Jones. CanStudents Do Mathematical Problem Solving? Results from Constructed-Response Questions in NAEP’s 1992 MathematicsAssessment. 23-FR-01. Washington, D.C.: National Centerfor Education Statistics, August 1993.
Dugdale, Sharon. “Functions and Graphs: Perspectives on Student Thinking.” In Integrating Research on the GraphicalRepresentation of Functions, edited by Thomas Romberg, Elizabeth Fennema, and Thomas Carpenter, pp. 101–29.Hillsdale, N.J.: Lawrence Erlbaum Associates, 1993.
Dunham, Penelope H., and Thomas P. Dick. “Research onGraphing Calculators.” Mathematics Teacher 87 (September1994): 440–45.
Education Development Center, Inc. Using Algebraic Thinking:Patterns, Numbers, and Shapes. Mathscape: Seeing and Think-ing Mathematically series. Mountain View, Calif.: CreativePublications, 1998.
Edwards, Carolyn, Lella Gandini, and George Forman. TheHundred Languages of Children: The Reggio Emilia Approach toEarly Childhood Education. Norwood, N.J.: Ablex PublishingCorp., 1993.
Encyclopaedia Britannica Educational Corporation. Insights intoData. Mathematics in Context. Chicago: Encyclopaedia Bri-tannica Education Corp., 1998.
English, Lyn D., and Elizabeth A. Warren. “Introducing theVariable through Pattern Exploration.” Mathematics Teacher91 (February 1998): 166–70.
Ferrini-Mundy, Joan. “The Standards Movement in Mathe-matics Education: Reflections and Hopes.” In LearningMathematics for a New Century, edited by Maurice J. Burke,pp. 37–50. Reston, Va.: National Council of Teachers ofMathematics, 2000.
Ferrini-Mundy, Joan, Glenda Lappan, and Elizabeth Phillips.“Experiences with Patterning.” Teaching Children Mathematics3 (February 1997): 282–88.
Ferrini-Mundy, Joan, and Thomas Schram, eds. The Recognizingand Recording Reform in Mathematics Education Project: Insights,Issues, and Implications. Journal for Research in Mathematics Ed-ucation Monograph No. 8. Reston, Va.: National Council ofTeachers of Mathematics, 1997.
Flores, Alfinio. “Sí Se Puede, ‘It Can Be Done’: Quality Mathe-matics in More than One Language.” In Multicultural andGender Equity in the Mathematics Classroom: The Gift of Diver-sity, 1997 Yearbook of the National Council of Teachers ofMathematics, edited by Janet Trentacosta, pp. 81–91. Reston, Va.: National Council of Teachers of Mathematics,1997.
Fuson, Karen C. Children’s Counting and Concepts of Number.New York: Springer-Verlag New York, 1988.
———— . “Number and Operation.” In A Research Companion toNCTM’s Standards, edited by Jeremy Kilpatrick, W. GaryMartin, and Deborah Schifter. Reston, Va.: National Councilof Teachers of Mathematics, forthcoming.
———— . “Research on Learning and Teaching Addition andSubtraction of Whole Numbers.” In Analysis of Arithmetic forMathematics Teaching, edited by Gaea Leinhardt, Ralph Putnam, and Rosemary A. Hattrup, pp. 53–188. Hillsdale,N.J.: Lawrence Erlbaum Associates, 1992.
Fuson, Karen C., Diana Wearne, James C. Hiebert, Hanlie G.Murray, Pieter G. Human, Alwyn I. Olivier, Thomas P. Carpenter, and Elizabeth Fennema. “Children’s ConceptualStructures for Multidigit Numbers and Methods of Multi-digit Addition and Subtraction.” Journal for Research inMathematics Education 28 (March 1997): 130–62.
Fuys, David, Dorothy Geddes, and Rosamond Tischler. The vanHiele Model of Thinking in Geometry among Adolescents. Journalfor Research in Mathematics Education Monograph No. 3. Re-ston, Va.: National Council of Teachers of Mathematics,1988.
Garofalo, Joe, and Frank K. Lester, Jr. “Metacognition, Cogni-tive Monitoring, and Mathematical Performance.” Journalfor Research in Mathematics Education 16 (May 1985): 163–76.
Gelfand, Israel M., and Alexander Shen. Algebra. Boston:Birkhäuser Boston, 1993.
Gelman, Rochel. “Constructivism and Supporting Environ-ments.” In Implicit and Explicit Knowledge: An Educational Ap-proach, edited by Dina Tirosh, pp. 55–82, vol. 6 of HumanDevelopment, edited by S. Strauss. Norwood, N.J.: AblexPublishing Corp., 1994.
Gelman, Rochel, and C. R. Gallistel. The Child’s Understandingof Number. Cambridge: Harvard University Press, 1978.
Ginsburg, Herbert P., Alice Klein, and Prentice Starkey. “TheDevelopment of Children’s Mathematical Thinking: Con-necting Research with Practice.” In Child Psychology in Prac-tice, edited by Irving E. Sigel and K. Ann Renninger, pp.401–76, vol. 4 of Handbook of Child Psychology, edited byWilliam Damon. New York: John Wiley & Sons, 1998.
Goldberg, Howard. “Evaporation I.” TIMS Laboratory Investiga-tions. Dubuque, Iowa: Kendall/Hunt Publishing Co., 1997.
Goldenberg, Paul, Philip Lewis, and James O’Keefe. “DynamicRepresentation and the Development of a Process Under-standing of Function.” In The Concept of Function: Aspects ofEpistemology and Pedagogy, edited by Ed Dubinsky and Guershon Harel, pp. 235–60. MAA notes no. 25. Washing-ton, D.C.: Mathematical Association of America, 1992.
Gordon, Sheldon P., Deborah Hughes-Hallett, Arnold Ostebee,and Zalman Usiskin. “Report of the Content Workshops.” InPreparing for a New Calculus: Conference Proceedings, MAANotes no. 36, edited by Anita E. Solow, pp. 55–59. Washing-ton, D.C.: Mathematical Association of America, 1994.
Graeber, Anna O., and Patricia F. Campbell. “Misconceptionsabout Multiplication and Division.” Arithmetic Teacher 40(March 1993): 408–11.
Graeber, Anna O., and Elaine Tanenhaus. “Multiplication andDivision: From Whole Numbers to Rational Numbers.” InResearch Ideas for the Classroom, Middle Grades Mathematics,National Council of Teachers of Mathematics Research In-terpretation Project, edited by Douglas T. Owens, pp.99–117. New York: Macmillan Publishing Co., 1993.
Gravemeijer, Koeno Pay Eskelhoff. Developing Realistic Mathe-matics Instruction. Utrecht, Netherlands: Freudenthal Insti-tute, 1994.
385References

Greeno, James G., and Roger B. Hall. “Practicing Representa-tion: Learning with and about Representational Forms.” PhiDelta Kappan (January 1997): 361–67.
Greer, Brian. “Multiplication and Division as Models of Situa-tions.” In Handbook of Research on Mathematics Teaching andLearning, edited by Douglas A. Grouws, pp. 276–95. NewYork: Macmillan Publishing Co., 1992.
Griffin, Sharon, and Robbie Case. “Re-thinking the PrimarySchool Math Curriculum: An Approach Based on CognitiveScience.” Issues in Education 3, no. 1 (1997): 1–49.
Griffin, Sharon A., Robbie Case, and Robert S. Siegler. “Right-start: Providing the Central Conceptual Prerequisites forFirst Formal Learning of Arithmetic to Students at Risk forSchool Failure.” In Classroom Lessons: Integrating CognitiveTheory and Classroom Practice, edited by Kate McGilly, pp.25–49. Cambridge: MIT Press, 1994.
Groves, Susie. “Calculators: A Learning Environment to Pro-mote Number Sense.” Paper presented at the annual meet-ing of the American Educational Research Association, NewOrleans, April 1994.
Hall, Rogers, Dennis Kibler, Etienne Wenger, and ChrisTruxaw. “Exploring the Episodic Structure of Algebra StoryProblem Solving.” Cognition and Instruction 6, no. 3 (1989):223–83.
Halmos, P. R. “The Heart of Mathematics.” American Mathe-matical Monthly 87, no. 7 (1980): 519–24.
Hamilton, Johnny E., and Margaret S. Hamilton. Math to BuildOn: A Book for Those Who Build. Clinton, N.C.: ConstructionTrades Press, 1993.
Hancock, Chris, James J. Kaput, and Lynn T. Goldsmith. “Au-thentic Inquiry with Data: Critical Barriers to ClassroomImplementation.” Educational Psychologist 27, no. 3 (1992):337–64.
Hanna, Gila, and Erna Yackel. “Reasoning and Proof.” In A Re-search Companion to NCTM’s Standards, edited by Jeremy Kil-patrick, W. Gary Martin, and Deborah Schifter. Reston, Va.:National Council of Teachers of Mathematics, forthcoming.
Hatano, Giyoo, and Kayoko Inagaki. “Sharing Cognitionthrough Collective Comprehension Activity.” In Perspectiveson Socially Shared Cognition, edited by Lauren B. Resnick,John M. Levine, and Stephanie D. Teasley, pp. 331–48.Washington, D.C.: American Psychological Association,1991.
Hiebert, James. “Relationships between Research and theNCTM Standards.” Journal for Research in Mathematics Edu-cation 30 (January 1999): 3–19.
Hiebert, James, and Thomas P. Carpenter. “Learning andTeaching with Understanding.” In Handbook of Research onMathematics Teaching and Learning, edited by Douglas A.Grouws, pp. 65–97. New York: Macmillan Publishing Co.,1992.
Hiebert, James, Thomas P. Carpenter, Elizabeth Fennema,Karen C. Fuson, Diana Wearne, Hanlie Murray, AlwynOlivier, and Piet Human. Making Sense: Teaching and Learn-ing Mathematics with Understanding. Portsmouth, N.H.:Heinemann, 1997.
Hiebert, James, and Mary Lindquist. “Developing Mathemati-cal Knowledge in the Young Child.” In Mathematics for theYoung Child, edited by Joseph N. Payne, pp. 17–36. Reston,Va.: National Council of Teachers of Mathematics, 1990.
Hoachlander, Gary. “Organizing Mathematics Educationaround Work.” In Why Numbers Count: Quantitative Literacyfor Tomorrow’s America, edited by Lynn Arthur Steen, pp.122–36. New York: College Entrance Examination Board,1997.
Hughes-Hallett, Deborah, Andrew M. Gleason, Daniel E.Flath, Sheldon P. Gordon, David O. Lomen, David Lovelock, William G. McCallum, Brad G. Osgood, AndrewPasquale, Jeff Tecosky-Feldman, Joe B. Thrash, Karen R.Thrash, and Thomas W. Tucker, with the assistance of OttoK. Bretscher. Calculus. New York: John Wiley & Sons, 1994.
Hutchins, Pat. 1 Hunter. New York: Greenwillow Books, 1982.
Isaacs, Andrew C., and William M. Carroll. “Strategies forBasic-Facts Instruction.” Teaching Children Mathematics 5(May 1999): 508–15.
Kamii, Constance, and Ann Dominick. “The Harmful Effects ofAlgorithms in Grades 1–4,” In The Teaching and Learning ofAlgorithms in School Mathematics, 1998 Yearbook of the Na-tional Council of Teachers of Mathematics, edited by LornaJ. Morrow, pp. 130–40. Reston, Va.: National Council ofTeachers of Mathematics, 1998.
Kamii, Constance, Barbara A. Lewis, and Sally Jones Liv-ingston. “Primary Arithmetic: Children Inventing TheirOwn Procedures.” Arithmetic Teacher 41 (December 1993):200–203.
Kamii, Constance K., with Leslie Baker Housman. Young Chil-dren Reinvent Arithmetic: Implications of Piaget’s Theory. 2nded. New York: Teachers College Press, 2000.
Kazemi, Elham. “Discourse That Promotes Conceptual Under-standing.” Teaching Children Mathematics 4 (March 1998):410–14.
Kenney, Patricia Ann, and Vicky L. Kouba. “What Do StudentsKnow about Measurement?” In Results from the Sixth Mathe-matics Assessment of the National Assessment of EducationalProgress, edited by Patricia Ann Kenney and Edward A. Silver, pp. 141–63. Reston, Va.: National Council of Teach-ers of Mathematics, 1997.
Kenney, Patricia Ann, and Edward A. Silver, eds. Results from theSixth Mathematics Assessment of the National Assessment of Edu-cational Progress. Reston, Va.: National Council of Teachersof Mathematics, 1997.
Keynes, Harvey B. “Preparing Students for Postsecondary Edu-cation.” In High School Mathematics at Work: Essays and Exam-ples for the Education of All Students, edited by National Re-search Council, Mathematical Sciences Education Board, pp.107–10. Washington, D.C.: National Academy Press, 1998.
Kieran, Carolyn. “Concepts Associated with the Equality Sym-bol.” Educational Studies in Mathematics 12 (August 1981):317–26.
———— . “Relationships between Novices’ Views of AlgebraicLetters and Their Use of Symmetric and Asymmetric Equa-tion-Solving Procedures.” In Proceedings of the Fifth AnnualMeeting of PME-NA, vol. 1, edited by J. C. Bergeron and N.Herscovics, pp. 161–68. Montreal: Université de Montréal,1983.
386 Principles and Standards for School Mathematics

Kilpatrick, Jeremy, and Edward A. Silver. “Unfinished Business:Challenges for Mathematics Educators in the NextDecades.” In Learning Mathematics for a New Century, editedby Maurice J. Burke, pp. 223–35. Reston, Va.: NationalCouncil of Teachers of Mathematics, 2000.
Klein, Alice, Prentice Starkey, and Ann Wakeley. “EnhancingPre-kindergarten Children’s Readiness for School Mathe-matics.” Paper presented at the annual meeting of the Amer-ican Educational Research Association, Montreal, April1999.
Knapp, Michael S., Nancy E. Adelman, Camille Marder,Heather McCollum, Margaret C. Needels, Christine Padilla,Patrick M. Shields, Brenda J. Turnbull, and Andrew A.Zucker. Teaching for Meaning in High-Poverty Schools. NewYork: Teachers College Press, 1995.
Konold, Clifford. “Informal Conceptions of Probability.” Cogni-tion and Instruction 6, no. 1 (1989): 59–98.
———— . “Probability, Statistics, and Data Analysis.” In A Re-search Companion to NCTM’s Standards, edited by Jeremy Kilpatrick, W. Gary Martin, and Deborah Schifter. Reston,Va.: National Council of Teachers of Mathematics, forth-coming.
Kouba, Vicky L., Thomas P. Carpenter, and Jane O. Swafford.“Number and Operations.” In Results from the Fourth Mathe-matics Assessment of the National Assessment of EducationalProgress, edited by Mary Montgomery Lindquist, pp. 64–93.Reston, Va.: National Council of Teachers of Mathematics,1989.
Kouba, Vicki L., Judith S. Zawojewski, and Marilyn E.Strutchens. “What Do Students Know about Numbers andOperations?” In Results from the Sixth Mathematics Assessmentof the National Assessment of Educational Progress, edited by Patricia Ann Kenney and Edward A. Silver, pp. 87–140. Reston, Va.: National Council of Teachers of Mathematics,1997.
Kroll, Diana Lambdin, and Tammy Miller. “Insights from Re-search on Mathematical Problem Solving in the MiddleGrades.” In Research Ideas for the Classroom, Middle GradesMathematics, National Council of Teachers of MathematicsResearch Interpretation Project, edited by Douglas T.Owens, 58–77. New York: Macmillan Publishing Co., 1993.
Krutetskii, V. A. The Psychology of Mathematical Abilities in School-children. Chicago: University of Chicago Press, 1976.
Küchemann, D. “Children’s Understanding of Numerical Vari-ables.” Mathematics in School 7, no. 4 (1978): 23–26.
Lampert, Magdalene. “Arithmetic as Problem Solving.” Arith-metic Teacher 36 (March 1989): 34–36.
———— . “Teaching Multiplication.” Journal of Mathematical Be-havior 5, no. 3 (December 1986): 241–80.
———— . “When the Problem Is Not the Question and the Solu-tion Is Not the Answer: Mathematical Knowing and Teach-ing.” American Educational Research Journal 27, no. 1 (Spring1990): 29–63.
Lampert, Magdalene, and Paul Cobb. “Communications andLanguage.” In A Research Companion to NCTM’s Standards,edited by Jeremy Kilpatrick, W. Gary Martin, and DeborahSchifter. Reston, Va.: National Council of Teachers ofMathematics, forthcoming.
Lappan, Glenda, James T. Fey, William M. Fitzgerald, Susan N.Friel, and Elizabeth Difanis Phillips. Comparing and Scaling:Ratio, Proportion, and Percents. Connected Mathematics series.Palo Alto, Calif.: Dale Seymour Publications, 1998.
Lehrer, Richard. “Developing Understanding of Measurement.”In A Research Companion to NCTM’s Standards, edited by Jeremy Kilpatrick, W. Gary Martin, and Deborah Schifter.Reston, Va.: National Council of Teachers of Mathematics,forthcoming.
Lehrer, Richard, Michael Jenkins, and Helen Osana. “Longitu-dinal Study of Children’s Reasoning about Space and Geom-etry.” In Designing Learning Environments for Developing Un-derstanding of Geometry and Space, edited by Richard Lehrerand Daniel Chazan, pp. 137–67. Mahwah, N.J.: LawrenceErlbaum Associates, 1998.
Leinhardt, Gaea, Orit Zaslavsky, and Mary Kay Stein. “Func-tions, Graphs, and Graphing: Tasks, Learning, and Teach-ing.” Review of Educational Research 60, no. 1 (1990): 1–64.
Liben, Lynn S., and Roger M. Downs. “Understanding Maps asSymbols: The Development of Map Concepts in Children.”In Advances in Child Development and Behavior, vol. 22, editedby Hayne W. Reese, pp. 145–201. San Diego, Calif.: Acade-mic Press, 1989.
Lindquist, Mary M., and Vicky L. Kouba. “Measurement.” In Results from the Fourth Mathematics Assessment of the National Assessment of Educational Progress, edited by MaryMontgomery Lindquist, pp. 35–43. Reston, Va.: NationalCouncil of Teachers of Mathematics, 1989.
Ma, Liping. Knowing and Teaching Elementary Mathematics:Teachers’ Understanding of Fundamental Mathematics in Chinaand the United States. Mahwah, N.J.: Lawrence Erlbaum As-sociates, 1999.
Mack, Nancy K. “Learning Fractions with Understanding:Building on Informal Knowledge.” Journal for Research inMathematics Education 21 (January 1990): 16–32.
Madell, Rob. “Children’s Natural Processes.” Arithmetic Teacher32 (March 1985): 20–22.
Maher, Carolyn A., and Amy M. Martino. “The Developmentof the Idea of Mathematical Proof: A Five-Year Case Study.”Journal for Research in Mathematics Education 27 (March1996): 194–214.
Malloy, Carol E. “Mathematics Projects Promote Students’ Al-gebraic Thinking.” Mathematics Teaching in the Middle School2 (February 1997): 282–88.
Mathematical Association of America, Committee of the Math-ematical Education of Teachers. A Call for Change: Recom-mendations for the Mathematical Preparation of Teachers ofMathematics, edited by James R. C. Leitzel. Washington,D.C.: Mathematical Association of America, 1991.
McClain, Kay. “Reflecting on Students’ Understanding ofData.” Mathematics Teaching in the Middle School 4 (March1999): 374–80.
McClain, Kay, Paul Cobb, and Janet Bowers. “A Contextual In-vestigation of Three-Digit Addition and Subtraction.” In TheTeaching and Learning of Algorithms in School Mathematics,1998 Yearbook of the National Council of Teachers ofMathematics, edited by Lorna J. Morrow, pp. 141–50. Reston, Va.: National Council of Teachers of Mathematics,1998.
387References

Mokros, Jan, and Susan Jo Russell. “Children’s Concepts of Av-erage and Representativeness.” Journal for Research in Mathe-matics Education 26 (January 1995): 20–39.
Moore, David S. “Uncertainty.” On the Shoulders of Giants: NewApproaches to Numeracy, edited by Lynn Arthur Steen, pp.95–137. Washington, D.C.: National Academy Press, 1990.
Moore, R. C. “Making the Transition to Formal Proof.” Educa-tional Studies in Mathematics 27, no. 3 (1994): 249–66.
Moschkovich, Judit N. “Resources for Refining MathematicalConceptions: Case Studies in Learning about Linear Func-tions.” Journal of the Learning Sciences 7, no. 2 (1998):209–37.
Moschkovich, Judit, Alan H. Schoenfeld, and Abraham Arcavi.“Aspects of Understanding: On Multiple Perspectives andRepresentations of Linear Relations and Connections amongThem.” In Integrating Research on the Graphical Representationof Functions, edited by Thomas A. Romberg, Elizabeth Fennema, and Thomas P. Carpenter, pp. 69–100. Hillsdale,N.J.: Lawrence Erlbaum Associates, 1993.
Mullis, Ina V. S., Michael O. Martin, Albert E. Beaton, EugenioJ. Gonzales, Dana L. Kelly, and Teresa A. Smith. MathematicsAchievement in the Primary School Years: IEA’s Third Interna-tional Mathematics and Science Study (TIMSS). Chestnut Hill,Mass.: Boston College, TIMSS International Study Center,1997.
National Commission on Teaching and America’s Future. WhatMatters Most: Teaching for America’s Future. New York: Na-tional Commission on Teaching and America’s Future, 1996.
National Council of Teachers of Mathematics. Assessment Stan-dards for School Mathematics. Reston, Va.: National Council ofTeachers of Mathematics, 1995.
———— . Curriculum and Evaluation Standards for School Mathe-matics. Reston, Va.: National Council of Teachers of Mathe-matics, 1989.
———— . Professional Standards for Teaching Mathematics. Reston,Va.: National Council of Teachers of Mathematics, 1991.
National Council of Teachers of Mathematics, Algebra WorkingGroup. “A Framework for Constructing a Vision of Algebra:A Discussion Document.” Appendix E in The Nature and Roleof Algebra in the K–14 Curriculum: Proceedings of a NationalSymposium, May 27 and 28, 1997, edited by the NationalCouncil of Teacher of Mathematics and the National Re-search Council, pp. 145–90. Washington, D.C.: NationalAcademy Press, 1998. Available on the Web atbooks.nap.edu/books/0309061474/html/R1.html.
National Research Council. High School Mathematics at Work:Essays and Examples for the Education of All Students. Washing-ton, D.C.: National Academy Press, 1998.
———— . National Science Education Standards. Washington, D.C.:National Academy Press, 1996.
National Research Council, Mathematical Sciences EducationBoard. Everybody Counts: A Report to the Nation on the Futureof Mathematics Education. Washington, D.C.: National Acad-emy Press, 1989.
Nelson, Barbara S. Building New Knowledge by Thinking: HowAdministrators Can Learn What They Need to Know aboutMathematics Education Reform. Newton, Mass.: Center for theDevelopment of Teaching, Education Development Center,1999.
Pajitnov, Alexeyo. Tetris. San Francisco, Calif.: Blue PlanetSoftware, 1996.
Pólya, George. How to Solve It: A New Aspect of MathematicalMethod. 2nd ed. Princeton, N.J.: Princeton University Press,1957.
Price, Glenda. “Quantitative Literacy across the Curriculum.”In Why Numbers Count: Quantitative Literacy for Tomorrow’sAmerica, edited by Lynn Arthur Steen, pp. 155–60. NewYork: College Entrance Examination Board, 1997.
Putnam, Ralph T., and Hilda Borko. “What Do New Views ofKnowledge and Thinking Have to Say about Research onTeacher Learning?” Educational Researcher 29 (January-February 2000): 4–15.
Raimi, Ralph A., and Lawrence S. Braden. State MathematicsStandards: An Appraisal of Math Standards in Forty-six States,the District of Columbia, and Japan. Washington, D.C.:Thomas B. Fordham Foundation, 1998.
Razel, Micha, and Bat-Sheva Eylon. “Developing MathematicsReadiness in Young Children with the Agam Program.”Paper presented at the Fifteenth Conference of the Interna-tional Group for the Psychology of Mathematics Education,Genoa, Italy, 1991.
Resnick, Lauren B. Education and Learning to Think. Washing-ton, D.C.: National Academy Press, 1987.
Resnick, Lauren B., Pearla Nesher, Francois Leonard, MariaMagone, Susan Omanson, and Irit Peled. “Conceptual Basesof Arithmetic Errors: The Case of Decimal Fractions.” Jour-nal for Research in Mathematics Education 20 (January 1989):8–27.
Reys, Robert E., and Der-Ching Yang. “Relationship betweenComputational Performance and Number Sense amongSixth- and Eighth-Grade Students in Taiwan.” Journal forResearch in Mathematics Education 29 (March 1998): 225–37.
Reys, Robert E., and Nobuhiko Nohda, eds. Computational Al-ternatives for the Twenty-first Century: Cross-Cultural Perspec-tives from Japan and the United States. Reston, Va.: NationalCouncil of Teachers of Mathematics, 1994.
Riedesel, C. Alan. Teaching Elementary School Mathematics. 3rded. Englewood Cliffs, N.J.: Prentice-Hall, 1980.
Roberts, Fred S. “The Role of Applications in Teaching Dis-crete Mathematics.” In Discrete Mathematics in the Schools,edited by Joseph G. Rosenstein, Deborah S. Franzblau, andFred S. Roberts, pp. 105–17. DIMACS Series in DiscreteMathematics and Theoretical Computer Science, vol. 36.Providence, R.I.: American Mathematical Society and Na-tional Council of Teachers of Mathematics, 1997.
Roche, Robert. “Cranberry Estimation.” In Estimation, pro-duced by WGBH Boston. Teaching Math, a Video Library,K–4. Boston: WGBH Boston, 1996.
Rojano, Teresa. “Developing Algebraic Aspects of ProblemSolving within a Spreadsheet Environment.” In Approaches toAlgebra: Perspectives for Research and Teaching, edited by Na-dine Bednarz, Carolyn Kieran, and Lesley Lee. Boston:Kluwer Academic Publishers, 1996.
Russell, Susan Jo, Douglas H. Clements, and Julie Sarama.“Building a Town.” In Quilt Squares and Block Towns: 2-D and3-D Geometry, edited by Catherine Anderson and BeverlyCory, pp. 113–18. Menlo Park, Calif.: Dale Seymour Publi-cations, 1998.
388 Principles and Standards for School Mathematics

Russell, Susan Jo, Deborah Schifter, and Virginia Bastable.Working with Data Casebook. Pilot-test draft. DevelopingMathematical Ideas. Newton, Mass.: Education Develop-ment Center, 1999.
Sarmiento, Jorge L. “Thousand-Year Record Documents Risein Atmospheric CO2.” Chemical and Engineering News, 31May 1993, pp. 30–43.
Schifter, Deborah. “Reasoning about Operations: Early Alge-braic Thinking in Grades K–6.” In Developing MathematicalReasoning in Grades K–12, 1999 Yearbook of the NationalCouncil of Teachers of Mathematics, edited by Lee V. Stiff,pp. 62–81. Reston, Va.: National Council of Teachers ofMathematics, 1999.
Schifter, Deborah, Virginia Bastable, and Susan Jo Russell.Building a System of Tens Casebook. Developing MathematicalIdeas: Number and Operations, Part 1. Parsippany, N.J.:Dale Seymour Publications, 1999.
Schoenfeld, Alan H. Mathematical Problem Solving. Orlando,Fla.: Academic Press, 1985.
———— . “What’s All the Fuss about Metacognition?” In Cogni-tive Science and Mathematics Education, edited by Alan H.Schoenfeld, pp. 189–215. Hillsdale, N.J.: Lawrence ErlbaumAssociates, 1987.
———— . “When Good Teaching Leads to Bad Results: TheDisasters of Well Taught Mathematics Classes.” EducationalPsychologist 23 (Spring 1988): 145–66.
Schoenfeld, Alan H., and Abraham Arcavi. “On the Meaning ofVariable.” Mathematics Teacher 81 (September 1988): 420–27.
Schroeder, Thomas L., and Frank K. Lester, Jr. “DevelopingUnderstanding in Mathematics via Problem Solving.” InNew Directions for Elementary School Mathematics, 1989 Year-book of the National Council of Teachers of Mathematics,edited by Paul R. Trafton, pp. 31–42. Reston, Va.: NationalCouncil of Teachers of Mathematics, 1989.
Schwartz, Daniel L., Susan R. Goldman, Nancy J. Vye, andBrigid J. Barron. “Aligning Everyday and Mathematical Rea-soning: The Case of Sampling Assumptions.” In Reflections onStatistics: Learning, Teaching, and Assessment in Grades K–12 ,edited by Suzanne P. Lajoie, pp. 233–73. Mahwah, N.J.:Lawrence Erlbaum Associates, 1998.
Senk, Sharon L. “Van Hiele Levels and Achievement in WritingGeometry Proofs.” Journal for Research in Mathematics Educa-tion 20 (May 1989): 309–21.
Senk, Sharon L., Denisse R. Thompson, Steven S. Viktora,Rheta Rubenstein, Judy Halvorson, James Flanders, NatalieJakucyn, Gerald Pillsbury, and Zalman Usiskin. UCSMP Ad-vanced Algebra. 2nd ed. Glenview, Ill.: Scott, Foresman &Co., 1996.
Sfard, Ana. “On the Dual Nature of Mathematical Conceptions:Reflections on Processes and Objects as Different Sides ofthe Same Coin.” Educational Studies in Mathematics 22 (1991):1–36.
Sheets, Charlene. “Effects of Computer Learning and Problem-Solving Tools on the Development of Secondary School Stu-dents’ Understanding of Mathematical Functions.” Ph.D.diss., University of Maryland College Park, 1993.
Siegler, Robert S. Emerging Minds: The Process of Change in Chil-dren’s Thinking. New York: Oxford University Press, 1996.
Silver, Edward A., Jeremy Kilpatrick, and Beth G. Schlesinger.Thinking through Mathematics: Fostering Inquiry and Commu-nication in Mathematics Classrooms. New York: College En-trance Examination Board, 1990.
Silver, Edward A., and Margaret S. Smith. “Implementing Re-form in the Mathematics Classroom: Creating MathematicalDiscourse Communities.” In Reform in Math and ScienceEducation: Issues for Teachers. Columbus, Ohio: EisenhowerNational Clearinghouse for Mathematics and Science Education, 1997. CD-ROM.
Silver, Edward A., Margaret Schwan Smith, and Barbara ScottNelson. “The QUASAR Project: Equity Concerns MeetMathematics Education Reform in the Middle School.” InNew Directions for Equity in Mathematics Education, edited byWalter G. Secada, Elizabeth Fennema, and Lisa Byrd Adajian, pp. 9–56. New York: Cambridge University Press,1995.
Silver, Edward A., and Mary Kay Stein. “The QUASAR Project:The ‘Revolution of the Possible’ in Mathematics Instruc-tional Reform in Urban Middle Schools.” Urban Education 30(January1996): 476–521.
Silver, Edward A., Marilyn E. Strutchens, and Judith S. Zawo-jewski. “NAEP Findings regarding Race/Ethnicity and Gen-der: Affective Issues, Mathematics Performance, and Instruc-tional Context.” In Results from the Sixth MathematicsAssessment of the National Assessment of Educational Progress,edited by Patricia Ann Kenney and Edward A. Silver, pp.33–59. Reston, Va.: National Council of Teachers of Mathe-matics, 1997.
Silverstein, Shel. “One Inch Tall.” In Where the Sidewalk Ends:The Poems and Drawings of Shel Silverstein, p. 55. New York:Harper and Row, 1974.
Skemp, Richard R. “Relational Understanding and InstrumentalUnderstanding.” Mathematics Teaching 77 (December 1976):20–26. Reprinted in Arithmetic Teacher (November 1978):9–15.
Smith, John P. III, Andrea A. diSessa, and Jeremy Roschelle.“Misconceptions Reconceived: A Constructivist Analysis ofKnowledge in Transition.” Journal of the Learning Sciences 3,no. 2 (1993): 115–63.
Smith, Erick. “Patterns, Functions, and Algebra.” In A ResearchCompanion to NCTM’s Standards, edited by Jeremy Kilpatrick,W. Gary Martin, and Deborah Schifter. Reston, Va.: National Council of Teachers of Mathematics, forthcoming.
Smith, Margaret S. “Balancing on a Sharp, Thin Edge: A Studyof Teacher Learning in the Context of Mathematics Instruc-tional Reform.” Elementary School Journal (forthcoming).
Smith, Ray. An Introduction to Perspective. New York: D K Pub-lishing, 1995.
Society for Industrial and Applied Mathematics. SIAM Report onMathematics in Industry. Philadelphia: Society for Industrialand Applied Mathematics, 1996.
Sowder, Judith T. “Making Sense of Numbers in School Mathe-matics.” In Analysis of Arithmetic for Mathematics Teaching,edited by Gaea Leinhardt, Ralph Putman, and Rosemary A.Hattrup, pp. 1–51. Hillsdale, N.J.: Lawrence Erlbaum Asso-ciates, 1992.
Starkey, Prentice, and Robert G. Cooper, Jr. “Perception ofNumbers by Human Infants.” Science 210 (November 1980):1033–35.
389References

Steen, Lynn Arthur. “Preface: The New Literacy.” In WhyNumbers Count: Quantitative Literacy for Tomorrow’s America,edited by Lynn Arthur Steen, pp. xv–xxviii. New York: Col-lege Entrance Examination Board, 1997.
———— . “The Science of Patterns.” Science 240 (April 1988): pp.611–16.
Steffe, Leslie P. “Children’s Multiplying Schemes.” In The Devel-opment of Multiplicative Reasoning in the Learning of Mathe-matics, edited by Guershon Harel and Jere Confrey, pp. 3–39.Albany, N.Y.: State University of New York Press, 1994.
Steffe, Leslie P., and Paul Cobb. Construction of ArithmeticalMeanings and Strategies. New York: Springer-Verlag, 1988.
Stigler, James W., and James Hiebert. The Teaching Gap: BestIdeas from the World’s Teachers for Improving Education in theClassroom. New York: The Free Press, 1999.
Thompson, Alba G. “Teachers’ Beliefs and Conceptions: A Syn-thesis of the Research.” In Handbook of Research on Mathe-matics Teaching and Learning, edited by Douglas A. Grouws,pp. 127–46. New York: Macmillan Publishing Co., 1992.
Thompson, Patrick W. “To Understand Post-counting Num-bers and Operations.” In A Research Companion to NCTM’sStandards, edited by Jeremy Kilpatrick, W. Gary Martin, andDeborah Schifter. Reston, Va.: National Council of Teachersof Mathematics, forthcoming.
Thornton, Carol A. “Strategies for the Basic Facts.” In Mathe-matics for the Young Child, edited by Joseph N. Payne, pp.133–51. Reston, Va.: National Council of Teachers ofMathematics, 1990.
Tierney, Cornelia C., and Mary Berle-Carman. Fractions: FairShares. Investigations in Number, Data, and Space. PaloAlto, Calif.: Dale Seymour Publications, 1995.
Trafton, Paul R., and Christina L. Hartman. “Developing Num-ber Sense and Computational Strategies in Problem-Centered Classrooms.” Teaching Children Mathematics 4 (De-cember 1997): 230–33.
Tucker, Alan. “New GRE Mathematical Reasoning Test.” Focus15 (February 1995): 14–16.
Uccellini, John C. “Teaching the Mean Meaningfully.” Mathe-matics Teaching in the Middle School 2 (November–December1996): 112–15.
University of North Carolina Mathematics and Science Educa-tion Network. Teach-Stat Activities: Statistical Investigations forGrades 3 through 6. Palo Alto, Calif.: Dale Seymour Publica-tions, 1997.
U.S. Department of Education. Exemplary and Promising Mathe-matics Programs. Washington, D.C.: U.S. Department of Ed-ucation, 1999.
U.S. Department of Labor, Secretary’s Commission on Achiev-ing Necessary Skills. What Work Requires of Schools: A SCANSReport for America 2000. Washington, D.C.: U.S. Depart-ment of Labor, 1991.
van Hiele, Pierre M. Structure and Insight: A Theory of Mathe-matics Education. Orlando, Fla.: Academic Press, 1986.
Vinner, Shlomo, and Tommy Dreyfus. “Images and Definitionsfor the Concept of Function.” Journal for Research in Mathe-matics Education 20 (July 1989): 356–66.
Wagner, Sigrid, and Sheila Parker. “Advancing Algebra.” In Re-search Ideas for the Classroom, High School Mathematics, editedby Patricia S. Wilson, pp. 119–39. New York: MacmillanPublishing Co., 1993.
Waits, Bert, and Franklin Demana. “The Role of Hand-HeldComputer Symbolic Algebra in Mathematics Education inthe Twenty-first Century: A Call for Action!” Paper pre-sented at the Technology and NCTM Standards 2000 Con-ference, Arlington, Va., June 1998.
Wheelock, Anne. Crossing the Tracks: How “Untracking” CanSave America’s Schools. New York: New Press, 1992.
Wilson, Linda, and Patricia Ann Kenney. “Assessment.” In A Re-search Companion to NCTM’s Standards, edited by Jeremy Kil-patrick, W. Gary Martin, and Deborah Schifter. Reston, Va.:National Council of Teachers of Mathematics, forthcoming.
Wilson, S. M., L. S. Shulman, and A. Richert. “One HundredFifty Ways of Knowing.” In Exploring Teachers’ Thinking,edited by James Calderhead, pp. 104–24. London: Cassell,1987.
Wright, June L., and Daniel D. Shade. Young Children: ActiveLearners in a Technological Age. Washington, D.C.: NationalAssociation for the Education of Young Children, 1994.
Yackel, Erna, and Paul Cobb. “The Development of YoungChildren’s Understanding of Mathematical Argumentation.”Paper presented at the annual meeting of the American Edu-cational Research Association, New Orleans, 1994.
———— . “Sociomathematical Norms, Argumentation, and Au-tonomy in Mathematics.” Journal for Research in MathematicsEducation 27 (July 1996): 458–77.
Yackel, Erna, and Grayson H. Wheatley. “Promoting Visual Im-agery in Young Pupils.” Arithmetic Teacher 37 (February1990): 52–58.
Yates, Billy Charles. “The Computer as an Instructional Aid andProblem Solving Tool: An Experimental Analysis of Two In-structional Methods for Teaching Spatial Skills to JuniorHigh School Students.” (Doctoral diss., University of Ore-gon.) Dissertation Abstracts International 49 (1988): 3612-A.(University Microfilms no. DA8903857).
Yerushalmy, Michal, and Judah L. Schwartz. “Seizing the Op-portunity to Make Algebra Mathematically and Pedagogi-cally Interesting.” In Integrating Research on the Graphical Rep-resentation of Functions, edited by Thomas A. Romberg,Elizabeth Fennema, and Thomas P. Carpenter, pp. 41–68.Hillsdale, N.J.: Lawrence Erlbaum Associates, 1993.
Zbiek, Rose Mary. “The Pentagon Problem: Geometric Rea-soning with Technology.” Mathematics Teacher 89 (February1996): 86–90.
Zbiek, Rose Mary, and B. Glass. “Conjecturing and FormalReasoning about Functions in a Dynamic Environment.”Proceedings of the Twelfth International Conference on Technologyin Collegiate Mathematics, edited by G. Goodell. Reading,Mass.: Addison Wesley Longman, forthcoming.
Zbiek, Rose Mary, and M. Kathleen Heid. “The Skateboard Ex-periment: Mathematical Modeling for Beginning Algebra.”Computing Teacher 18, no. 2 (1990): 32–36.
Zeisel, Hans. “Statistics as Legal Evidence.” In International En-cyclopedia of the Social Sciences, vol. 15, edited by David L.Sills, pp. 246–50. New York: Crowell Collier and Macmillan,1968.
390 Principles and Standards for School Mathematics

Appendix
Table of Standards and Expectations
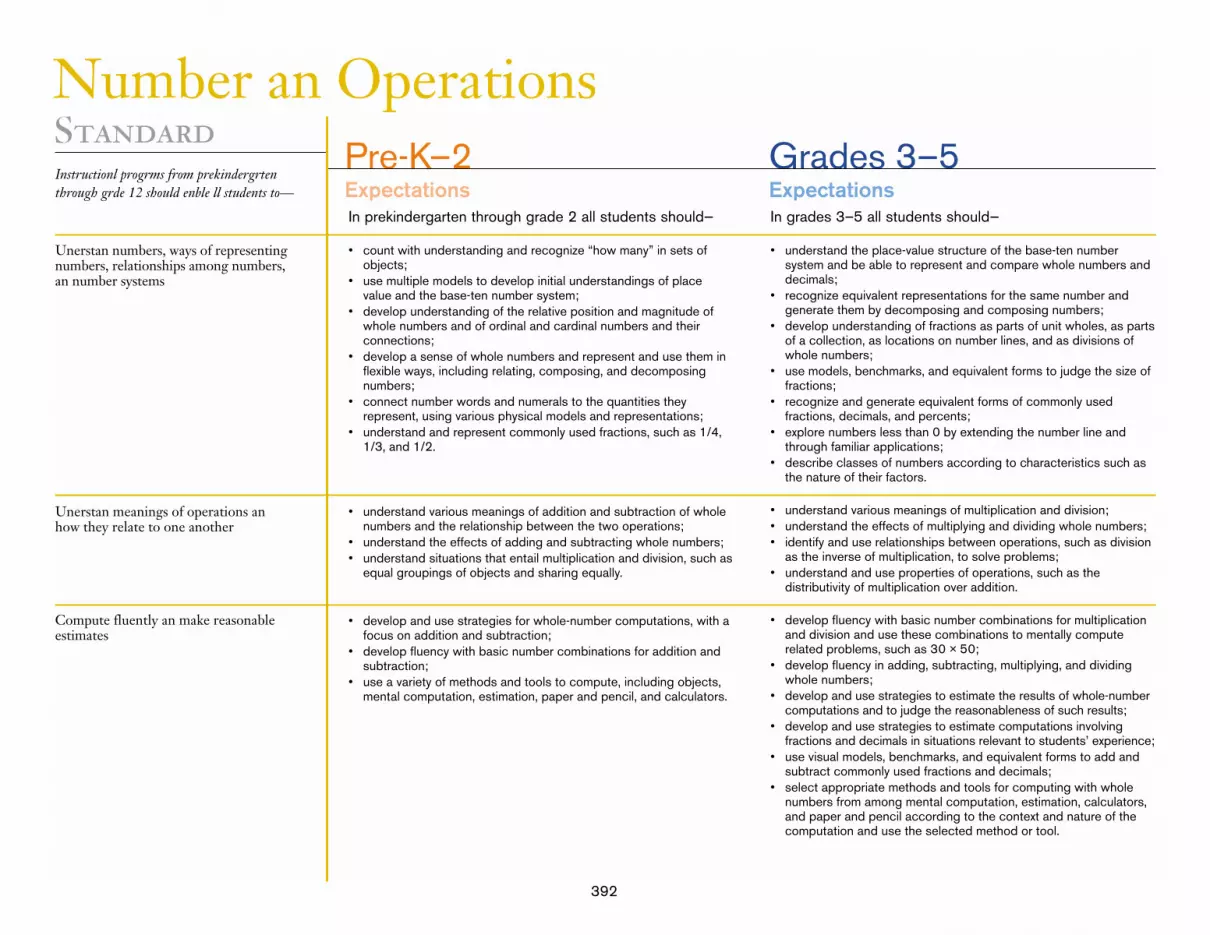
Pre-K–2Expectations
Grades 3–5Expectations
Number and OperationsInstructional programs from prekindergartenthrough grade 12 should enable all students to—
Standard
Understand numbers, ways of representingnumbers, relationships among numbers,and number systems
Understand meanings of operations andhow they relate to one another
Compute fluently and make reasonable estimates
In prekindergarten through grade 2 all students should—
• count with understanding and recognize “how many” in sets of objects;
• use multiple models to develop initial understandings of placevalue and the base-ten number system;
• develop understanding of the relative position and magnitude ofwhole numbers and of ordinal and cardinal numbers and their connections;
• develop a sense of whole numbers and represent and use them inflexible ways, including relating, composing, and decomposingnumbers;
• connect number words and numerals to the quantities they represent, using various physical models and representations;
• understand and represent commonly used fractions, such as 1/4,1/3, and 1/2.
• understand various meanings of addition and subtraction of wholenumbers and the relationship between the two operations;
• understand the effects of adding and subtracting whole numbers;• understand situations that entail multiplication and division, such as
equal groupings of objects and sharing equally.
• develop and use strategies for whole-number computations, with afocus on addition and subtraction;
• develop fluency with basic number combinations for addition andsubtraction;
• use a variety of methods and tools to compute, including objects,mental computation, estimation, paper and pencil, and calculators.
In grades 3–5 all students should—
• understand the place-value structure of the base-ten number system and be able to represent and compare whole numbers anddecimals;
• recognize equivalent representations for the same number andgenerate them by decomposing and composing numbers;
• develop understanding of fractions as parts of unit wholes, as partsof a collection, as locations on number lines, and as divisions ofwhole numbers;
• use models, benchmarks, and equivalent forms to judge the size offractions;
• recognize and generate equivalent forms of commonly used fractions, decimals, and percents;
• explore numbers less than 0 by extending the number line andthrough familiar applications;
• describe classes of numbers according to characteristics such asthe nature of their factors.
• understand various meanings of multiplication and division;• understand the effects of multiplying and dividing whole numbers;• identify and use relationships between operations, such as division
as the inverse of multiplication, to solve problems;• understand and use properties of operations, such as the
distributivity of multiplication over addition.
• develop fluency with basic number combinations for multiplicationand division and use these combinations to mentally compute related problems, such as 30 × 50;
• develop fluency in adding, subtracting, multiplying, and dividingwhole numbers;
• develop and use strategies to estimate the results of whole-numbercomputations and to judge the reasonableness of such results;
• develop and use strategies to estimate computations involving fractions and decimals in situations relevant to students’ experience;
• use visual models, benchmarks, and equivalent forms to add andsubtract commonly used fractions and decimals;
• select appropriate methods and tools for computing with wholenumbers from among mental computation, estimation, calculators,and paper and pencil according to the context and nature of thecomputation and use the selected method or tool.
392

Grades 6–8Expectations
Grades 9–12Expectations
Number and OperationsInstructional programs from prekindergartenthrough grade 12 should enable all students to—
Standard
Understand numbers, ways of representingnumbers, relationships among numbers,and number systems
Understand meanings of operations andhow they relate to one another
Compute fluently and make reasonable estimates
In grades 6–8 all students should—
• work flexibly with fractions, decimals, and percents to solve problems;
• compare and order fractions, decimals, and percents efficiently andfind their approximate locations on a number line;
• develop meaning for percents greater than 100 and less than 1;• understand and use ratios and proportions to represent quantita-
tive relationships;• develop an understanding of large numbers and recognize and
appropriately use exponential, scientific, and calculator notation;• use factors, multiples, prime factorization, and relatively prime
numbers to solve problems;• develop meaning for integers and represent and compare
quantities with them.
• understand the meaning and effects of arithmetic operations withfractions, decimals, and integers;
• use the associative and commutative properties of addition andmultiplication and the distributive property of multiplication over addition to simplify computations with integers, fractions, and decimals;
• understand and use the inverse relationships of addition and subtraction, multiplication and division, and squaring and findingsquare roots to simplify computations and solve problems.
• select appropriate methods and tools for computing with fractionsand decimals from among mental computation, estimation, calculators or computers, and paper and pencil, depending on thesituation, and apply the selected methods;
• develop and analyze algorithms for computing with fractions, decimals, and integers and develop fluency in their use;
• develop and use strategies to estimate the results of rational-number computations and judge the reasonableness of the results;
• develop, analyze, and explain methods for solving problems involving proportions, such as scaling and finding equivalent ratios.
In grades 9–12 all students should—
• develop a deeper understanding of very large and very small numbers and of various representations of them;
• compare and contrast the properties of numbers and numbersystems, including the rational and real numbers, and understandcomplex numbers as solutions to quadratic equations that do nothave real solutions;
• understand vectors and matrices as systems that have some of theproperties of the real-number system;
• use number-theory arguments to justify relationships involvingwhole numbers.
• judge the effects of such operations as multiplication, division, andcomputing powers and roots on the magnitudes of quantities;
• develop an understanding of properties of, and representations for,the addition and multiplication of vectors and matrices;
• develop an understanding of permutations and combinations ascounting techniques.
• develop fluency in operations with real numbers, vectors, and matrices, using mental computation or paper-and-pencil calculationsfor simple cases and technology for more-complicated cases.
• judge the reasonableness of numerical computations and their results.
393

Pre-K–2Expectations
Grades 3–5Expectations
AlgebraInstructional programs from prekindergartenthrough grade 12 should enable all students to—
Standard
Understand patterns, relations, and functions
Represent and analyze mathematicalsituations and structures using algebraicsymbols
Use mathematical models to representand understand quantitative relationships
Analyze change in various contexts
In prekindergarten through grade 2 all students should—
• sort, classify, and order objects by size, number, and other properties;
• recognize, describe, and extend patterns such as sequences ofsounds and shapes or simple numeric patterns and translate fromone representation to another;
• analyze how both repeating and growing patterns are generated.
• illustrate general principles and properties of operations, such ascommutativity, using specific numbers;
• use concrete, pictorial, and verbal representations to develop anunderstanding of invented and conventional symbolic notations.
• model situations that involve the addition and subtraction of wholenumbers, using objects, pictures, and symbols.
• describe qualitative change, such as a student’s growing taller;• describe quantitative change, such as a student’s growing two
inches in one year.
In grades 3–5 all students should—
• describe, extend, and make generalizations about geometric andnumeric patterns;
• represent and analyze patterns and functions, using words, tables,and graphs.
• identify such properties as commutativity, associativity, and distributivity and use them to compute with whole numbers;
• represent the idea of a variable as an unknown quantity using a letter or a symbol;
• express mathematical relationships using equations.
• model problem situations with objects and use representationssuch as graphs, tables, and equations to draw conclusions.
• investigate how a change in one variable relates to a change in asecond variable;
• identify and describe situations with constant or varying rates ofchange and compare them.
394

Grades 6–8Expectations
Grades 9–12Expectations
AlgebraInstructional programs from prekindergartenthrough grade 12 should enable all students to—
Standard
Understand patterns, relations, and functions
Represent and analyze mathematicalsituations and structures using algebraicsymbols
Use mathematical models to representand understand quantitative relationships
Analyze change in various contexts
In grades 6–8 all students should—
• represent, analyze, and generalize a variety of patterns with tables,graphs, words, and, when possible, symbolic rules;
• relate and compare different forms of representation for a relationship;
• identify functions as linear or nonlinear and contrast their propertiesfrom tables, graphs, or equations.
• develop an initial conceptual understanding of different uses ofvariables;
• explore relationships between symbolic expressions and graphs oflines, paying particular attention to the meaning of intercept andslope;
• use symbolic algebra to represent situations and to solve prob-lems, especially those that involve linear relationships;
• recognize and generate equivalent forms for simple algebraic expressions and solve linear equations.
• model and solve contextualized problems using various representa-tions, such as graphs, tables, and equations.
• use graphs to analyze the nature of changes in quantities in linearrelationships.
In grades 9–12 all students should—
• generalize patterns using explicitly defined and recursively definedfunctions;
• understand relations and functions and select, convert flexiblyamong, and use various representations for them;
• analyze functions of one variable by investigating rates of change,intercepts, zeros, asymptotes, and local and global behavior;
• understand and perform transformations such as arithmeticallycombining, composing, and inverting commonly used functions,using technology to perform such operations on more-complicatedsymbolic expressions;
• understand and compare the properties of classes of functions, including exponential, polynomial, rational, logarithmic, and periodicfunctions;
• interpret representations of functions of two variables.
• understand the meaning of equivalent forms of expressions, equa-tions, inequalities, and relations;
• write equivalent forms of equations, inequalities, and systems ofequations and solve them with fluency—mentally or with paper andpencil in simple cases and using technology in all cases;
• use symbolic algebra to represent and explain mathematical relationships;
• use a variety of symbolic representations, including recursive andparametric equations, for functions and relations;
• judge the meaning, utility, and reasonableness of the results ofsymbol manipulations, including those carried out by technology.
• identify essential quantitative relationships in a situation and determine the class or classes of functions that might model the relationships;
• use symbolic expressions, including iterative and recursive forms,to represent relationships arising from various contexts;
• draw reasonable conclusions about a situation being modeled.
• approximate and interpret rates of change from graphical and numerical data.
395

Pre-K–2Expectations
Grades 3–5Expectations
GeometryInstructional programs from prekindergartenthrough grade 12 should enable all students to—
Standard
Analyze characteristics and properties oftwo- and three-dimensional geometricshapes and develop mathematical arguments about geometric relationships
Specify locations and describe spatial relationships using coordinate geometryand other representational systems
Apply transformations and use symmetryto analyze mathematical situations
Use visualization, spatial reasoning, andgeometric modeling to solve problems
In prekindergarten through grade 2 all students should—
• recognize, name, build, draw, compare, and sort two- and three-dimensional shapes;
• describe attributes and parts of two- and three-dimensionalshapes;
• investigate and predict the results of putting together and takingapart two- and three-dimensional shapes.
• describe, name, and interpret relative positions in space and applyideas about relative position;
• describe, name, and interpret direction and distance in navigatingspace and apply ideas about direction and distance;
• find and name locations with simple relationships such as “near to”and in coordinate systems such as maps.
• recognize and apply slides, flips, and turns;• recognize and create shapes that have symmetry.
• create mental images of geometric shapes using spatial memoryand spatial visualization;
• recognize and represent shapes from different perspectives;• relate ideas in geometry to ideas in number and measurement;• recognize geometric shapes and structures in the environment and
specify their location
In grades 3–5 all students should—
• identify, compare, and analyze attributes of two- and three-dimensional shapes and develop vocabulary to describe the attributes;
• classify two- and three-dimensional shapes according to their prop-erties and develop definitions of classes of shapes such as trian-gles and pyramids;
• investigate, describe, and reason about the results of subdividing,combining, and transforming shapes;
• explore congruence and similarity;• make and test conjectures about geometric properties and relation-
ships and develop logical arguments to justify conclusions.
• describe location and movement using common language and geometric vocabulary;
• make and use coordinate systems to specify locations and to describe paths;
• find the distance between points along horizontal and vertical linesof a coordinate system.
• predict and describe the results of sliding, flipping, and turningtwo-dimensional shapes;
• describe a motion or a series of motions that will show that twoshapes are congruent;
• identify and describe line and rotational symmetry in two- andthree-dimensional shapes and designs.
• build and draw geometric objects;• create and describe mental images of objects, patterns, and paths;• identify and build a three-dimensional object from two-dimensional
representations of that object;• identify and build a two-dimensional representation of a three-
dimensional object; • use geometric models to solve problems in other areas of mathe-
matics, such as number and measurement;• recognize geometric ideas and relationships and apply them to
other disciplines and to problems that arise in the classroom or ineveryday life.
396

Grades 6–8Expectations
Grades 9–12Expectations
GeometryInstructional programs from prekindergartenthrough grade 12 should enable all students to—
Standard
Analyze characteristics and properties oftwo- and three-dimensional geometricshapes and develop mathematical arguments about geometric relationships
Specify locations and describe spatial relationships using coordinate geometryand other representational systems
Apply transformations and use symmetryto analyze mathematical situations
Use visualization, spatial reasoning, andgeometric modeling to solve problems
In grades 6–8 all students should—
• precisely describe, classify, and understand relationships amongtypes of two- and three-dimensional objects using their definingproperties;
• understand relationships among the angles, side lengths, perimeters,areas, and volumes of similar objects;
• create and critique inductive and deductive arguments concerninggeometric ideas and relationships, such as congruence, similarity,and the Pythagorean relationship.
• use coordinate geometry to represent and examine the propertiesof geometric shapes;
• use coordinate geometry to examine special geometric shapes,such as regular polygons or those with pairs of parallel orperpendicular sides.
• describe sizes, positions, and orientations of shapes under informal transformations such as flips, turns, slides, and scaling;
• examine the congruence, similarity, and line or rotational symmetryof objects using transformations.
• draw geometric objects with specified properties, such as sidelengths or angle measures;
• use two-dimensional representations of three-dimensional objectsto visualize and solve problems such as those involving surfacearea and volume;
• use visual tools such as networks to represent and solve problems;• use geometric models to represent and explain numerical and
algebraic relationships;• recognize and apply geometric ideas and relationships in areas
outside the mathematics classroom, such as art, science, andeveryday life.
In grades 9–12 all students should—
• analyze properties and determine attributes of two- and three-dimensional objects;
• explore relationships (including congruence and similarity) amongclasses of two- and three-dimensional geometric objects, makeand test conjectures about them, and solve problems involvingthem;
• establish the validity of geometric conjectures using deduction,prove theorems, and critique arguments made by others;
• use trigonometric relationships to determine lengths and anglemeasures.
• use Cartesian coordinates and other coordinate systems, such asnavigational, polar, or spherical systems, to analyze geometric situations;
• investigate conjectures and solve problems involving two- andthree-dimensional objects represented with Cartesian coordinates.
• understand and represent translations, reflections, rotations, anddilations of objects in the plane by using sketches, coordinates,vectors, function notation, and matrices;
• use various representations to help understand the effects of simple transformations and their compositions.
• draw and construct representations of two- and three-dimensionalgeometric objects using a variety of tools;
• visualize three-dimensional objects from different perspectives andanalyze their cross sections;
• use vertex-edge graphs to model and solve problems;• use geometric models to gain insights into, and answer questions
in, other areas of mathematics;• use geometric ideas to solve problems in, and gain insights into,
other disciplines and other areas of interest such as art and architecture.
397

Pre-K–2Expectations
Grades 3–5Expectations
MeasurementInstructional programs from prekindergartenthrough grade 12 should enable all students to—
Standard
Understand measurable attributes of objects and the units, systems, andprocesses of measurement
Apply appropriate techniques, tools, andformulas to determine measurements
In prekindergarten through grade 2 all students should—
• recognize the attributes of length, volume, weight, area, and time;• compare and order objects according to these attributes;• understand how to measure using nonstandard and standard units;• select an appropriate unit and tool for the attribute being measured.
• measure with multiple copies of units of the same size, such aspaper clips laid end to end;
• use repetition of a single unit to measure something larger thanthe unit, for instance, measuring the length of a room with a singlemeterstick;
• use tools to measure;• develop common referents for measures to make comparisons and
estimates.
In grades 3–5 all students should—
• understand such attributes as length, area, weight, volume, andsize of angle and select the appropriate type of unit for measuringeach attribute;
• understand the need for measuring with standard units and become familiar with standard units in the customary and metricsystems;
• carry out simple unit conversions, such as from centimeters tometers, within a system of measurement;
• understand that measurements are approximations and understandhow differences in units affect precision;
• explore what happens to measurements of a two-dimensionalshape such as its perimeter and area when the shape is changedin some way.
• develop strategies for estimating the perimeters, areas, andvolumes of irregular shapes;
• select and apply appropriate standard units and tools to measurelength, area, volume, weight, time, temperature, and the size of angles;
• select and use benchmarks to estimate measurements;• develop, understand, and use formulas to find the area of rectan-
gles and related triangles and parallelograms;• develop strategies to determine the surface areas and volumes of
rectangular solids.
398

Grades 6–8Expectations
Grades 9–12Expectations
MeasurementInstructional programs from prekindergartenthrough grade 12 should enable all students to—
Standard
Understand measurable attributes of objects and the units, systems, andprocesses of measurement
Apply appropriate techniques, tools, andformulas to determine measurements
In grades 6–8 all students should—
• understand both metric and customary systems of measurement;• understand relationships among units and convert from one unit to
another within the same system;• understand, select, and use units of appropriate size and type to
measure angles, perimeter, area, surface area, and volume.
• use common benchmarks to select appropriate methods for estimating measurements;
• select and apply techniques and tools to accurately find length,area, volume, and angle measures to appropriate levels of precision;
• develop and use formulas to determine the circumference of circlesand the area of triangles, parallelograms, trapezoids, and circlesand develop strategies to find the area of more-complex shapes;
• develop strategies to determine the surface area and volume of selected prisms, pyramids, and cylinders;
• solve problems involving scale factors, using ratio and proportion;• solve simple problems involving rates and derived measurements
for such attributes as velocity and density.
In grades 9–12 all students should—
• make decisions about units and scales that are appropriate forproblem situations involving measurement.
• analyze precision, accuracy, and approximate error in measurementsituations;
• understand and use formulas for the area, surface area, and volumeof geometric figures, including cones, spheres, and cylinders;
• apply informal concepts of successive approximation, upper andlower bounds, and limit in measurement situations;
• use unit analysis to check measurement computations.
399

Pre-K–2Expectations
Grades 3–5Expectations
Data Analysis and ProbabilityInstructional programs from prekindergartenthrough grade 12 should enable all students to—
Standard
Formulate questions that can be addressedwith data and collect, organize, and display relevant data to answer them
Select and use appropriate statisticalmethods to analyze data
Develop and evaluate inferences and predictions that are based on data
Understand and apply basic concepts ofprobability
In prekindergarten through grade 2 all students should—
• pose questions and gather data about themselves and their surroundings;
• sort and classify objects according to their attributes and organizedata about the objects;
• represent data using concrete objects, pictures, and graphs.
• describe parts of the data and the set of data as a whole to determine what the data show.
• discuss events related to students’ experiences as likely or unlikely.
In grades 3–5 all students should—
• design investigations to address a question and consider howdata-collection methods affect the nature of the data set;
• collect data using observations, surveys, and experiments;• represent data using tables and graphs such as line plots, bar
graphs, and line graphs;• recognize the differences in representing categorical and numerical
data.
• describe the shape and important features of a set of data andcompare related data sets, with an emphasis on how the data aredistributed;
• use measures of center, focusing on the median, and understandwhat each does and does not indicate about the data set;
• compare different representations of the same data and evaluatehow well each representation shows important aspects of the data.
• propose and justify conclusions and predictions that are based ondata and design studies to further investigate the conclusions orpredictions.
• describe events as likely or unlikely and discuss the degree of likelihood using such words as certain, equally likely, and impossible;
• predict the probability of outcomes of simple experiments and testthe predictions;
• understand that the measure of the likelihood of an event can berepresented by a number from 0 to 1.
400

Grades 6–8Expectations
Grades 9–12Expectations
Data Analysis and ProbabilityInstructional programs from prekindergartenthrough grade 12 should enable all students to—
Standard
Formulate questions that can be addressedwith data and collect, organize, and dis-play relevant data to answer them
Select and use appropriate statisticalmethods to analyze data
Develop and evaluate inferences and pre-dictions that are based on data
Understand and apply basic concepts ofprobability
In grades 6–8 all students should—
• formulate questions, design studies, and collect data about a char-acteristic shared by two populations or different characteristicswithin one population;
• select, create, and use appropriate graphical representations ofdata, including histograms, box plots, and scatterplots.
• find, use, and interpret measures of center and spread, includingmean and interquartile range;
• discuss and understand the correspondence between data setsand their graphical representations, especially histograms, stem-and-leaf plots, box plots, and scatterplots.
• use observations about differences between two or more samplesto make conjectures about the populations from which the sampleswere taken;
• make conjectures about possible relationships between two char-acteristics of a sample on the basis of scatterplots of the data andapproximate lines of fit;
• use conjectures to formulate new questions and plan new studiesto answer them.
• understand and use appropriate terminology to describe comple-mentary and mutually exclusive events;
• use proportionality and a basic understanding of probability tomake and test conjectures about the results of experiments andsimulations;
• compute probabilities for simple compound events, using suchmethods as organized lists, tree diagrams, and area models.
In grades 9–12 all students should—
• understand the differences among various kinds of studies andwhich types of inferences can legitimately be drawn from each;
• know the characteristics of well-designed studies, including therole of randomization in surveys and experiments;
• understand the meaning of measurement data and categoricaldata, of univariate and bivariate data, and of the term variable;
• understand histograms, parallel box plots, and scatterplots and usethem to display data;
• compute basic statistics and understand the distinction between astatistic and a parameter.
• for univariate measurement data, be able to display the distribution,describe its shape, and select and calculate summary statistics;
• for bivariate measurement data, be able to display a scatterplot, describe its shape, and determine regression coefficients, regressionequations, and correlation coefficients using technological tools;
• display and discuss bivariate data where at least one variable iscategorical;
• recognize how linear transformations of univariate data affectshape, center, and spread;
• identify trends in bivariate data and find functions that model thedata or transform the data so that they can be modeled.
• use simulations to explore the variability of sample statistics from aknown population and to construct sampling distributions;
• understand how sample statistics reflect the values of populationparameters and use sampling distributions as the basis for informalinference;
• evaluate published reports that are based on data by examining thedesign of the study, the appropriateness of the data analysis, andthe validity of conclusions;
• understand how basic statistical techniques are used to monitorprocess characteristics in the workplace.
• understand the concepts of sample space and probability distribu-tion and construct sample spaces and distributions in simple cases;
• use simulations to construct empirical probability distributions;• compute and interpret the expected value of random variables in
simple cases;• understand the concepts of conditional probability and independent
events;• understand how to compute the probability of a compound event.
401

Problem SolvingStandardInstructional programs from prekindergartenthrough grade 12 should enable all students to—
• Build new mathematical knowledge through problem solving• Solve problems that arise in mathematics and in other contexts• Apply and adapt a variety of appropriate strategies to solve problems • Monitor and reflect on the process of mathematical problem solving
Reasoning and ProofStandardInstructional programs from prekindergartenthrough grade 12 should enable all students to—
• Recognize reasoning and proof as fundamental aspects of mathematics• Make and investigate mathematical conjectures• Develop and evaluate mathematical arguments and proofs • Select and use various types of reasoning and methods of proof
CommunicationStandardInstructional programs from prekindergartenthrough grade 12 should enable all students to—
• Organize and consolidate their mathematical thinking through communication • Communicate their mathematical thinking coherently and clearly to peers,
teachers, and others • Analyze and evaluate the mathematical thinking and strategies of others • Use the language of mathematics to express mathematical ideas precisely
ConnectionsStandardInstructional programs from prekindergartenthrough grade 12 should enable all students to—
• Recognize and use connections among mathematical ideas • Understand how mathematical ideas interconnect and build on one another to
produce a coherent whole • Recognize and apply mathematics in contexts outside of mathematics
RepresentationStandardInstructional programs from prekindergartenthrough grade 12 should enable all students to—
• Create and use representations to organize, record, and communicatemathematical ideas
• Select, apply, and translate among mathematical representations to solve problems • Use representations to model and interpret physical, social, and mathematical
phenomena
402


