Embed Size (px)
Citation preview
-
PATTERNS OF RURAL-URBAN MIGRATION IN SOUTH AFRICA
By
A T NTSHIDI
Student No. 23260742 ORCID No: 0000-0002-4399-678X
A mini-dissertation submitted in partial fulfilment of the Masters of Social Science in
Population Studies and Sustainable Development degree at the North-West University,
Mafikeng Campus
Supervisor: Professor. Ayiga Natal
October 2017
i
Acknowledgements
My heartfelt gratitude goes to Professor Ayiga Natal, who tirelessly supervised and directed me in
this tedious academic journey. “KISIRERENG IJO LOKASUBAN”. Mr. Kennedy Machira, who
continuously assisted me during the write-up of this mini-dissertation. May the Lord bless you
abundantly.
Above all, glory and honour to “the giver of life, the Almighty God, the Father, the Son and the
Holy Spirit.” I Thank God for good health, tolerance, perseverance, patience and assurance during
this journey.
My gratitude is also extended to all my lecturers for the encouragement they rendered when I
needed it most. To all my colleagues, this programme was made easier because together we stand.
Kgomotso Makgeledisa and Nimrod Mhambi, you’re constant and consistent advice is highly
appreciated. Ntswaki Letsapo, Victor Gaowelwe and Shuping Molema and Oratile Monareng,
your emotional support can never go unnoticed. “KEA LEBOGA BARATIWA BAKA!”
Not forgetting my awesome, blessed family; Obakeng Moremong, Tshepiso Ntshidi, Thapelo
Africa and my angel Rorisang Ntshidi, for the unceasing prayers, inspiration, motivation and
financial and emotional support during my studies. Without you, I would be nowhere in life. My
giant gratitude goes to NSFAS and NRF, the financial sources that have made it possible for me
to be what I am today. THANK YOU!

ii
Dedication
I dedicate this to Martha Ntshidi, the most loving grandmother in the whole world. Without you
I am nothing but with you the future is certain. I LOVE YOU OUMA!
iii
Declaration
I, Abigail Tumisang Ntshidi, hereby declare that this mini-dissertation, which is submitted to the
North-West University (Mafikeng Campus), for the degree of Master of Social Sciences in
Population Studies and Sustainable Development, is my own work and has not been submitted for
a degree in any university.
Abigail Tumisang Ntshidi
Signature: ……………………
Date: 11/09/2017
iv
Abstract
Background: In South Africa, rural-urban migration trends are increasing at a fast rate, from 15
per 1000 in 2001 to about 28 per 1000 in 2011, with people aged 0-14 years joining the migration
stream. This movement has its own advantages and disadvantages for both the place of origin and
the destination and has resulted in extensive social-economic pressure, especially in the receiving
areas.
Objective: The study investigated the patterns of rural-urban migration among native South
Africans between 2001 and 2011 using census ten per cent sample data based on usual place of
residence.
Method: Basic descriptive statistics were used to describe variables in terms of frequencies and
percentages. Bivariate analysis and logistic regression model were used to estimate factors
associated with rural-urban migration in South Africa over the two study periods.
Results: The prevalence of rural-urban migration in 2001 and 2011 were 53,998 and 117,604
respectively. Furthermore the study found that South Africans who were aged 31 or older
represented the largest proportion of the migrants in 2001 (36.8%) and 2011 (39.2%). This was
followed by youth aged 14 years and younger. Moreover, the study found people with physical
disabilities was associated with decreased likelihood to migrate in 2001 (OR=0.69, 95% CI [0.66-
0.71], p < 0.001) and more likely to migrate in 2011 (OR=1.25, 95% CI [1.20-1.28], p < 0.001).
In respect to gender, in 2001, females were more likely to transfer to urban areas, (OR=1.12, 95%
CI [1.09-1.13], p < 0.001) compared to males (reference point). Conversely, it was found that
females were significantly more likely (OR=1.01, 95% CI [0.90-0.92], p<0.001) to move to urban
areas than their male counterparts in 2011. Other factors such as marital status, level of education,
employment status, and father alive and mother alive, and income status were significant predictors
of rural-urban migration. It is worth noting that children ever born (CEB) to migrants had an
insignificant association with rural-urban migration in 2001 and CEB was found to be a significant
predictor of rural-urban migration in 2011.
v
Conclusion:
The study concludes that the high rate of migration of the disabled from rural areas to the urban
areas in the two periods leads to a recommendation that those urban areas should have facilities
that are equipped to accommodate disabled people. Furthermore, the results also show that rural-
urban migrants in South Africa are young, educated, largely unemployed and never married.
Migrants with the above characteristics pose serious social and security challenges in the urban
areas of destination. Their predominance in the Southern African migration stream could explain
the increasing level of violence and other crimes in urban areas of South Africa. It is therefore
recommended that the South African government and the private sector create effective
programmes that can provide employment opportunities and skills development for the
abovementioned migrants.
vi
Table of Contents
Acknowledgements .......................................................................................................................... i
Dedication ....................................................................................................................................... ii
Declaration ..................................................................................................................................... iii
Abstract .......................................................................................................................................... iv
Abbreviations and Acronyms ........................................................................................................ ix
List of Tables .................................................................................................................................. x
List of figures ................................................................................................................................. xi
Chapter One .................................................................................................................................... 1
Introduction ..................................................................................................................................... 1
1.0 Background of the Study ..................................................................................................... 1
1.1 Problem statement ................................................................................................................ 5
1.2 Objective of the study .......................................................................................................... 6
1.3 Research questions ............................................................................................................... 6
1.4 Study hypotheses ................................................................................................................. 7
1.5 Study rationale/Significance of the study ............................................................................ 7
1.6 Layout of the thesis .............................................................................................................. 9
Chapter Two.................................................................................................................................. 10
Literature Review.......................................................................................................................... 10
2.1 Introduction ........................................................................................................................ 10
2.2 State of migration in the developing and developed countries .......................................... 11
2.2.1 Rural-urban migration in Sub-Saharan Africa ............................................................ 13
2.2.2 South African experience of rural-urban migration ................................................... 14
2.3 Factors influencing rural-urban migration ......................................................................... 15
2.3.1 Socio-economic factors .................................................................................................. 15
vii
2.3.1.1 Education and rural-urban migration ...................................................................... 16
2.3.1.2 Income status and rural-urban migration ................................................................ 17
2.3.1.3 Employment and rural-urban migration .................................................................. 18
2.3.2 Demographic characteristics .......................................................................................... 21
2.3.2.1 Age and rural-urban migration ................................................................................ 22
2.3.2.2 Gender and rural-urban migration .......................................................................... 22
2.3.2.3 Race and rural-urban migration .............................................................................. 23
2.3.2.4 Disability status and rural-urban migration ............................................................ 24
2.3.3 Individual factors............................................................................................................ 25
2.3.3.1 Parental survival and rural-urban migration ........................................................... 26
2.3.3.2 Marital status and rural-urban migration ................................................................ 27
2.3.3.3 Children ever born and rural-urban migration ........................................................ 28
2.4 Theoretical framework ....................................................................................................... 29
2.5 The conceptual framework ................................................................................................ 30
Chapter Three................................................................................................................................ 34
Methodology ................................................................................................................................. 34
3.1 Introduction ........................................................................................................................ 34
3.2 Study setting....................................................................................................................... 34
3.3 Study Design ...................................................................................................................... 35
3.4 Data Source ........................................................................................................................ 36
3.5 Variables and Measures ..................................................................................................... 36
3.5.1 Dependent Variable .................................................................................................... 37
3.5.2 Independent Variables ................................................................................................ 37
3.6 Analytical procedures ........................................................................................................ 40
3.6.1 Univariate analysis ..................................................................................................... 40
viii
3.6.2 Bivariate analysis ........................................................................................................ 41
3.6.3 Multivariate analysis................................................................................................... 42
3.7 Data quality ........................................................................................................................ 43
3.6 Limitation of the study ...................................................................................................... 48
Chapter four .................................................................................................................................. 50
Results ........................................................................................................................................... 50
4.1 Introduction ........................................................................................................................ 50
4.2 Demographic profile of the study population .................................................................... 50
4.3 Differentials of migration status by selected background characteristics .......................... 54
4.4 Differentials in migration rate of the selected factors. ....................................................... 59
4.5 Predictors of rural-urban migration ................................................................................... 63
4.6 Discussion .......................................................................................................................... 68
Chapter five ................................................................................................................................... 71
Summary of Findings, Conclusions and Recommendations ........................................................ 71
5.1 Introduction ........................................................................................................................ 71
5.2 Summary of the findings .................................................................................................... 71
5.3 Conclusion ......................................................................................................................... 72
5.4 Recommendations .............................................................................................................. 73
References ..................................................................................................................................... 74
ix
Abbreviations and Acronyms
CEB : Children Ever Born
IOM : International Organization of Migration
NDP : National Development Plan
RSA : Republic of South Africa
SADC : Southern Africa Development Communities
SPSS : Statistical Package for the Social Sciences
SSA : Sub-Saharan Africa
STATSA : Statistics South Africa
WHO : World Health Organization
x
List of Tables
Table 3.1: Definition of variables ……………………………………………………………….39
Table 3.2: Myer index calculation for 2001 …………………………………………………….44
Table 3.3: Myer index calculation for 2011 …………………………………………….………45
Table 4.1: Percentage distribution of the study population by selected background
Characteristics..52
Table 4.2: Differentials in migration status by selected background characteristics 2001 and
2011……………………………………………………………………………….....56
Table 4.3: Differentials in migration rate …………………………………………………..…...59
Table 4.4: Binary logistic regression showing Odds Ratios of factors predicting migration in
2001 and 2011…...………………………………………………………………….65
xi
List of figures
Figure 2.1 Conceptual framework………………………………………………………… 32
Figure 3.1 South Africa map ……………………………………………………………… 35
Figure 3.2 Myer blended index graph ………………………………………………………46
1
Chapter One
Introduction
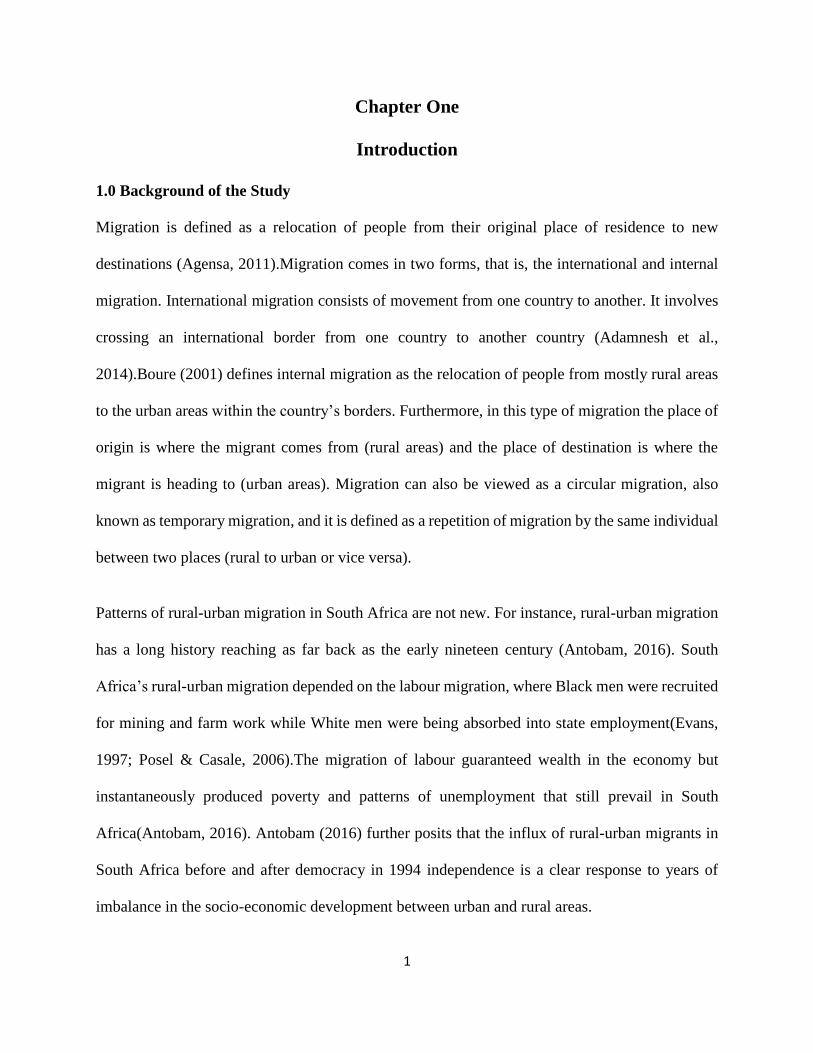
1.0 Background of the Study
Migration is defined as a relocation of people from their original place of residence to new
destinations (Agensa, 2011).Migration comes in two forms, that is, the international and internal
migration. International migration consists of movement from one country to another. It involves
crossing an international border from one country to another country (Adamnesh et al.,
2014).Boure (2001) defines internal migration as the relocation of people from mostly rural areas
to the urban areas within the country’s borders. Furthermore, in this type of migration the place of
origin is where the migrant comes from (rural areas) and the place of destination is where the
migrant is heading to (urban areas). Migration can also be viewed as a circular migration, also
known as temporary migration, and it is defined as a repetition of migration by the same individual
between two places (rural to urban or vice versa).
Patterns of rural-urban migration in South Africa are not new. For instance, rural-urban migration
has a long history reaching as far back as the early nineteen century (Antobam, 2016). South
Africa’s rural-urban migration depended on the labour migration, where Black men were recruited
for mining and farm work while White men were being absorbed into state employment(Evans,
1997; Posel & Casale, 2006).The migration of labour guaranteed wealth in the economy but
instantaneously produced poverty and patterns of unemployment that still prevail in South
Africa(Antobam, 2016). Antobam (2016) further posits that the influx of rural-urban migrants in
South Africa before and after democracy in 1994 independence is a clear response to years of
imbalance in the socio-economic development between urban and rural areas.
2
Rural-urban migration occurred in South Africa from the 1960s until the early 1990s.This was an
outcome of the apartheid policies such as the Group Areas Act and Influx Control Legislation that
restricted the movement of Black Africans in an attempt to regulate, control and limit their
movement (Gelderblom, 1994; Agensa, 2011). This was aimed at developing White economic
opportunities by the forceful removal of Blacks from their commercial lands to the so-called
‘homelands’ and also to control the urbanization and migration patterns of Blacks (Kok, 2003).
The demise of apartheid in South Africa resulted in the abolition of these acts and policies and
ended the control and restrictions of movement of the Black population into and within urban areas
(Antobam, 2016). This explains the recent high rate of Black rural-urban migration. More than
70% of urban dwellers today are Blacks (Boure, 2001). Although the apartheid era has come to an
end, many South Africans are still imprisoned in the legacy of the apartheid homeland policy and
find it hard to escape this situation (Landau, 2012).Furthermore, the apartheid policies had serious
ramifications on the age and gender structure of the population in various regions, and strikingly
negative consequences for social cohesion and family stability (Collinson, 2007). Wentzel et al.
(2006) posit that the long-lasting impact of apartheid still remains and South Africa’s spatial
distribution still reflects it’s planning. Migration involves the poorest and most marginalized
people who live in rural areas and former homeland areas or townships (Antobam, 2016).
The problem of rural-urban migration is not unique to South Africa as there is an avalanche of
literature that points to the fact that both African and European countries are also faced with the
same problem. For instance, in Europe, the advent of industrialisation across cities remains the
major factor that caused people to move from less developed rural areas to support the growing
economies in urban areas (Hatton & Williamson, 1998). This situation increased the influx or
3
movement of people from the rural areas to the urban settlements. However, this tendency has a
number of effects on the receiving cities. For instance, rural-urban migration results in increased
demands for social services, and increased population density which results in shortage of
infrastructure such as housing, lack of employment, shortage of food and increased morbidity
levels as a result of environmental degradations (Todaro, 1969; Agensa, 2011;Hatton and
Williamson ,1998). These problems are also prevalent in South Africa as the rural-urban migration
has increased to unparalleled proportions since democracy in 1994 ;it is estimated that 80% of the
South African population will be residing in urban areas in 2050 (SAnews.gov, 2017). Like in the
rest of the developing world, this rapid urban growth has placed significant pressure on natural
and human systems that underpin and maintain settlements. Thus it is evident that urbanization
and migration have played a key role in shaping the urban experience.
The movement of people from rural to urban areas has become a common practice on the African
continent. However, the migration challenges vary from one region to another. For instance, in
West and North African regions, Haas (2016) indicated that the regions have a number of migrants
that either move within their regions or from the continent in order to seek better economic gains
(Awumbaii, et al., 2011). For example, people move from one region to another seeking arable
and fertile land, a situation which triggers a problem both for the sending region and the receiving
region. It is imperative to note that migration creates a shortage of skilled labour in the sending
regions and cause much socio-economic risk for and from migrants as they try to settle in the
receiving regions (Agensa, 2011).
In Southern Africa, South Africa is one of the countries which have a large number of internal and
international migrants. The Gross Domestic Product growth rate has been slowing down from 4.2
4
in 2000 to 1.3 in 2015 and a change in the inflation rate from 7.02 in 2000 to 3.8 in 2015, movement
of people from rural to urban areas in the country increased from 52.5% in 2000 to 64.8% in 2015
(World Bank, 2016).
The increased patterns of rural-urban migration settlements have resulted in a lot of social
problems in the form of high demand for social services such as health care facilities, housing, and
led to inadequate food supply and an increased level of morbidity. Due to the high level of
urbanisation that the country has experienced over the past decades since 1994, there have been
high levels of immigration among the native South Africans seeking better economic
empowerment (Awumbila et al., 2011). For instance, growing businesses and the high levels of
urbanisation have translated into people leaving their place of birth, predominantly rural, to the
urban set-up (Landau, 2012).
Studies that have explored the effect of rural-urban migration in South Africa were either limited
in their scope or did not account for other significant factors such as the effect of parental survival
status on migration decisions, and to understand migration from rural and urban perspective so as
to provide a feasible policy direction to solve migration challenges in South Africa. For instance,
in his study, titled “Migration into Rustenburg local municipality between 1996 and 2001”, Kibet
(2013) opines that the majority of the migrants are migrating to Rustenburg because of the
employment opportunities in mining, and migrants from other provinces such as Gauteng and
KwaZulu-Natal relocate to Rustenburg to sell their skills. This study is thoroughly done but it is
not a true reflection of rural-urban migration in South Africa as it only deals with a specific
geographical area. Some important indicators such as individual influence on rural-urban
migration were omitted in the study as its direction was towards socio-demographic indicators that
the current study seeks to pursue. Boure (2001) made strides towards an explanation of internal
5
migration in South Africa; the study concentrated on investigating the determinants of internal
migration and did not comprehensively pursue the contribution of the individual factors to
migration status. The main objective of the study was to examine the influence of the selected
determinants of a migrant’s decision to migrate, but did not highlight the contribution of individual
factors to rural-urban migration.
Despite numerous studies carried out (Kibet, et al 2013, Kok, et al, 2003 and Boure, 2001) and
policies made (Department of Rural Development and Land Reform framework policy, 1996) over
time to improve on the state of rural-urban migration in South Africa, the rural-urban migration is
still prevalent in the country, with undesirable effects becoming a common phenomenon in the
country. There is complicity on the part of the government as there is little enforcement of laws
and policies that try and control the behavioural trends in rural-urban migration in relation to its
effect (Boure, 2001). Against this background, the current study explores the patterns and trends
of rural-urban migration in South Africa using South African 2001 and 2011 census data in order
to investigate the pull and push factors influencing rural–urban migration. In this regard, particular
attention was placed on socio-economic, demographic and individual perspectives.
1.1 Problem statement
Rural-urban migration in South African has been increasing at an alarming rate. It increased from
15 per 1000 in 2001 to 28 per 1000 in 2011 (South Africa Statistics, 2012). The youth have a high
prevalence in the rural-urban migration stream (Stats SA, 2006). This is a cause of concern as
6
trained human resources are moved from rural to urban areas, a phenomenon also known as brain-
drain (Kimani, 2016).This phenomenon retards the development of rural areas as not only skilled
human resources, but also the most able age group is transplanted away from where the impact on
development is the greatest. On the other hand rural-urban migration creates a problem of
population explosion in urban areas leading urban congestion, which creates deficits in social
facilities, lack of basic food commodities, a scramble for housing, and unemployment(Gross, et
al., 2009). Other negative aspects of rural-urban migration are family dissolution among the
migrants from the sending areas and increased environment degradation in the receiving areas,
among others (Somik et al., (2006).
This study therefore attempted to assess the patterns of rural-urban migration in South Africa. In
doing so the 2001 and 2011 censuses were used.
1.2 Objective of the study
The main objective of the study was to examine the patterns of rural-urban migration in South
Africa. To achieve this objective, the following specific objectives were examined:
i. To determine the prevalence of rural-urban migration in South Africa for the periods 2001
and 2011; and
ii. To examine the socio-economic, demographic and individual factors influencing rural-
urban migration in South Africa for 2001 and 2011.
1.3 Research questions
The following research questions were used to augment the specific objectives;
i. What was the migration–flow of rural-urban migration in 2001 and 2011?; and
7
ii. What were the socio-economic, demographic and individual factors that influenced rural-
urban migration in South Africa in 2001 and 2011?
1.4 Study hypotheses
The following study hypotheses were tested in the study:
i. Disabled people are less likely to migrate to urban areas ;
ii. People who are unemployed are more likely to migrate than people who are employed;
iii. People having secondary or higher education are more likely to migrate than people with no
or primary education;
iv. There is no difference in the migration of males and females in South Africa;
v. People with both living parents are more likely to migrate than people with only one parent
surviving;
vi. Migrants with more than two children are more likely to move to urban areas.
1.5 Study rationale/Significance of the study
Currently, our understanding of rural-urban migration phenomenon in South Africa is limited in
terms of relevant measurement that could predict future movement of the population and
overcoming data limitations (South Africa Statistics, 2012). This is in partly due to lack of analysis
of large scale data that can shed more light on migration, especially regarding factors and processes
that influence rural-urban migration decisions in South Africa. The need for a study on migration
is further compelled by the widespread migration streams from rural to urban areas that started
manifesting itself after the end of apartheid.
8
The rationale of the study is that rural-urban migration produces developmental problems for both
the sending and receiving areas. These include overcrowding and congestion in receiving areas. It
also results in strains on urban social services, and both unemployment and underemployment can
emanate.
Therefore, the study is to assist policy makers to formulate policies that will help to prevent or at
least reduce the migration-flow of migrants from rural to urban areas. For example, this can be
achieved through creating opportunities in rural areas through rural development policies and
programmes that can create employment opportunities, schooling opportunities and provision of
facilities, among others. Policies are needed for the increasing of urban infrastructure so that urban
areas are able to accommodate the increasing number of urban residents.
The study is contributing to the recent scholarly debate in area of rural-urban migration and its
determinants using nationally representative census data collected between 2001 and 2011 and
provide essential information about rural–urban migration based on socio-economic and
demographic perspectives.
Lastly this study will contribute and provide solutions to service providers in planning for the
provision of community services and facilities that have to be aligned with the migration and
urbanization trends. This will in turn assist the relevant authorities to meet the needs and demands
of the influx of migrants in the urban setting. Furthermore, rural areas also need to be developed
and to be provided with services that will improve the wellbeing of its residents and enhance
sustainable human development.
9
1.6 Layout of the thesis
The mini-dissertation is organized into five Chapters. Chapter one is the introductory chapter
which presents the background to the study, the statement of the problem, objectives of the study,
rationale of the study, objectives and study hypotheses. In the second chapter the literature review
and the theoretical and conceptual frameworks of the study are presented. The methodology used
in the study, which comprises study design, source of data and methods of data analysis are
presented in chapter three. Chapter four is devoted to the results of the study. The chapter describes
the study population assessed the prevalence of rural-urban migration and identified some of the
factors influencing rural-urban migration. The summary, conclusion, and recommendations of the
study are presented chapter five.
10
Chapter Two
Literature Review
2.1 Introduction
Many scholars have dealt with the rural-urban migration (Adepoju, 1998; Antobam, 2016; Boure,
2001; Agensa, 2011). This practice is not only common in South Africa but it is universal in nature.
Time brings many changes with it and people find themselves compelled to move from one place
to another in pursuit of different goals such as education and economic interests (Antobam, 2016).
South Africa is not spared from this scourge as families are torn apart and social cohesion is
disturbed ( Bennett, et al., 2015). However, not all is lost as there are also benefits of people
intermingling with each other. While there is concern about the decay of morals due to movements,
Ubuntu (humanness) a South African philosophy that is highly held still holds meaning to the
society. Ubuntu is togetherness, kindness, honest and good principles towards one another and
encourages people to unite as one (Makgoro, 1997). Although the values that moulded uniqueness
as South Africans according to our ethnic groups are desirable, it is no longer possible to have
those divisions as time is dynamic. The hybrid values that develop from the grouping of people
from different backgrounds, different walks of life and different beliefs and values make South
African communities unique as a rainbow nation. However, the rule of nature has it that everyone
has to maintain their territory. As such, internal migration causes social ills as people clash for
survival over jobs and other social opportunities, which culminate in social ills such as xenophobia
(Antobam, 2016). Therefore, this literature review is carried out in the study in order to identify
the gaps existent in the previous studies and to add onto literature that examines the subject from
11
other perspectives. The study is based on relevant theoretical and conceptual frameworks that are
existent in other fields of studies.
2.2 State of migration in the developing and developed countries
South Africa is faced with internal movements as a lot of social and economic challenges and
opportunities are experienced and compel people to move (Antobam, 2016). However, this rural-
urban migration is not uncommon to other countries as evidenced by scholarly works around the
world (Bull-Kamanga, 2003; Chowdhury, et al., 1972; Cris Beauchemin, et al., 2014). Both
developed and developing countries are faced with the same predicament. This is because rural-
urban migration provides opportunities for people to enhance their socio-economic livelihood
(Crivello, 2011). Statistics reports and records present that rural-urban migration is so common
with 50.5% of the world’s population dwelling in urban areas (World Bank, 2016).Rural-urban
migration is a universal phenomenon and it is not a unique practice to South Africa. The new
constitutional dispensation in 1994 loosened the stringent and repressive laws of apartheid that
restricted and limited movements of people between urban and rural areas (Boure, 2001). Internal
movements have been made easy as people are now free to pursue their careers and economic
opportunities anywhere in the country (Boure, 2001). However, the majority of migrants are the
youth. This has not been easy as the population explosion in cities causes a lot of pressure on
service delivery, housing and food supplies. While most old school South Africans bemoan the
erosion of Ubuntu in the society, it is good to note that this philosophy still holds water in our
society as evidenced by the court’s judgement in State versus Makwanyane. This negative effect
of rural-urban migration cannot be allowed to cloud one’s judgement as there are benefits in the
intermingling of people from different places. Many scholars have dealt with this issue and this
12
study approaches the same subject through the lens of the socio-economic, demographic and
individual influence on rural-urban migration areas.
The trend of urbanization has been geometrically increasing each year in the developed
countries(Yao Lu, 2015).For instance, countries such as those in Europe, Latin America and the
Caribbean, Northern America and Oceania have rapidly urbanized in the last years (World Bank,
2016).Urbanization has had significant implications on the three demographic phases namely,
fertility, mortality and migration. It is imperative to note that the more people migrate to urban
areas the greater socio-demographic challenges they have. For example, migrants with more
children in the urban setting experience more challenges to health care, nutritional support and
later experience economic burden (Todara & Smith, 2003). This situation ultimately has an impact
on mortality and morbidity which consequently affects their socio-economic livelihood (Bull-
Kamanga, 2003).
Studies have it that the majority of those that migrate have requisite skills. Cris Beauchemin et al.,
(2014) posit that Dakar migrants are wealthier and educated, thus, their migration projects are
costly and highly supported by the migration laws. This is due to the fact that the migrants in turn
support the development of their places of birth via sending remittances. However, according to
the study by Isiugo-Abanihe (2014), Nigerian internal migration is selective in terms of education,
skills and professions. Migrants in Nigeria are relocating due to the attractive economic
opportunities in urban settings. In other African countries, migrants have been associated with a
number of factors, including high levels of crime, inadequate housing, and inadequate social
services as result of high population influx (Onokala, et al., 2013).
13
2.2.1 Rural-urban migration in Sub-Saharan Africa
In sub-Saharan Africa, migration rate is lowest in comparison to the whole world (World
Bank,2016). However,the intra-regional migration is very high in the sub-Saharan Africa(SSA)
region; for instance, most people migrate from one African country to another. As a result of socio-
economic circumstances, a high proportion of people who migrate are either skilled or unskilled
(Kok, et al., 2003).
In Sub-Saharan Africa, the movement of people is not balanced as well. This is because most
African countries have high levels of urbanization. There are increased levels of development
which attract an influx of skilled, semi-skilled and unskilled labour from the rural to the urban
sector(Agensa, 2011). This results ina high proportion of squatter settlements in the urban sector
due to the need of people to support urbanization development (Bouare, 2001). For instance, the
International Organization for Migration(IOM) indicates that high levels of urbanization translate
into increased level of squatter settlement and decreased life expectancy due to inadequate support
as a result of the increased population in urban areas. As such, in the urban sectors, the majority
of the middle class is not capable of supporting themselves due to low wages and the high rate
of unemployment(Antobam, 2016). For example, the unemployment rate in Nigeria has increased
to 13.3% in the second quarter of 2016 from 12.1% in the first quarter of 2016; this is the highest
unemployed rate since 2009 (Nigeria National Bureau of Statistics, 2016). The unemployment rate
in Kenya increased to 40% in 2011 from from 12.7% in 2006 (Kenya National Bureau of
Statistics,2016). In the above mentioned countries the unemployment rates have increased
gradually over the years resulting in massive protests and high crime rates. South Africa is also
faced with similar challenges concerning rural-urban migration which culminated in a population
explosion and causes problems in social service delivery(Boure, 2001).
14
2.2.2 South African experience of rural-urban migration
Rural-urban migration and its impact on the South African society first became embedded,
established and concentrated in the late decades of the nineteenth century as mining activities
catapulted the country onto the world’s monetary stage (Boure, 2001). As South Africa evolved,
entrepreneurial society and agriculture turned into a less alluring employment option as people left
their place of origin to seek for jobs in the mines at the end of the 1800s. As such, various
population groups began migrating towards urban settings (Kok & Collinson , 2006).This resulted
in the bulk rural-urban migration of Blacks and rural Afrikaners. However, these population groups
had different motives and outcomes for their rural-urban migration, with Blacks being mining
labourers while the rural Afrikaners (Whites) were being absorbed into state employment (Boure,
2001). On the same note, internal migration predominantly became a cause of concern and thus,
became a foremost preoccupation of the apartheid government (Collinson, et al., 2006). The
apartheid government took steps to regulate and control the movement of the Black population in
order to enhance economic opportunities of the White minority and to control and limit African
urbanization (Kok & Collinson , 2006; Evans, 1997)
With the advent of the new political era in 1994, this has changed as there are now free
interprovincial movements (Boure, 2001). For example, there have been major rapid growths
taking place in South African small cities due to increasing economic activity in cities such as
Rustenburg, Ekurhuleni, Polokwane, Nelspruit and Vanderbiljpark (Stats SA, 2006). These cities
are among the fastest growing urban areas with an average annual population growth rate of 1.6%
and 2.9 % over the last decade compared to Cape Town with 1.4% (Stats SA, 2012).The reason
for this trend is abrogation of the apartheid laws that restricted the movement of people from rural
to urban areas (Gelderblom & Kok, 1994). There has been some economic growth in urban areas,
15
which pulls people to urban areas in search of better living opportunities (Collinson, 2007).
However, with such a trend of amplified urbanization there are consequences such as social
tensions, leading to xenophobic attacks from natives on foreigners (Awumbaii, et al., 2011).
Furthermore this results in a high unemployment rate in urban settlements and high crime rate
which create enormous environmental glitches and health risks which at the end pose challenges
for government service provision(Haas & Marie-Laurence, 2016).Not only are the effects of rural-
urban migration felt at the government and social level, but households have also been affected. It
is, therefore, imperative for the current study to investigate the patterns of rural-urban migration
and to recommend appropriate policies to deal with the consequences of rural-urban migration in
South Africa.
2.3 Factors influencing rural-urban migration
2.3.1 Socio-economic factors
Migration of people from rural to urban areas is considered to be the most significant socio-
economic factor which results in a number of positives to both rural and urban areas (Bull-
Kamanga, 2003).According to Lee (1966) and Ravenstain’s (1889) theory, a better economic
environment in cities has an impetus to increase the livelihood of the people and this attracts the
movement of people from rural to the urban sector. For instance, such socio-economic factors
result in people getting better pay, and developing their rural households after earning better
salaries from urban settlements. This also helps in increasing life expectancy of the population.
Furthermore, according to Lee (1966) and Ravenstain’s (1889) theory, better income levels is a
direct benefit to the life of the people in the economy.
16
The influx of people with different socio-economic backgrounds into the urban setting often
creates an imbalance in the cities. This generates xenophobic attacks, labour exploitation, poor
housing and the high crime rates, high divorce rate, drug abuse and the spread of HIV/AIDS (Cris
Beauchemin, et al., 2014). It is therefore imperative to explore the trends on how education
influenced rural urban migration in the country from the perspective of the 2001 and 2011 Census
data.
2.3.1.1 Education and rural-urban migration
According to a study by Hussein (2005), education levels of migrants pressurize them to make a
decision to advance their education. Hussein (2005) further states that migrants with secondary
education have a significantly better chance to migrate to urban settlements as compared to their
counterparts with primary education. Furthermore, Caldwell (1969) posits that those individuals
with a high level of education are equipped with requisite skills which will enhance their
employment options and offer better opportunity in urban areas. This in turn, provides educated
migrants with a better competitive advantage to settle in urban settings. However, according to
Lee’s theory (1966), the only minor exception to the rule occurs with people who have post
graduate qualifications. Those with post-graduate degrees are less likely to migrate than those who
graduate with an under-graduate qualification (Antobam, 2016). Although there is this occurrence
in the pattern, it can be said that any college graduate, including those who hold post-graduate
qualifications, are twice as likely to migrate as someone who did not finish school. It would appear
that from these differences those educational status characteristics of individuals reflect
professional training (Funnah, 2001).
17
Therefore educational characteristics are meticulously related to migration; the more educated a
person is, the better the chances for them to migrate to other places in search of self-enhancement
in terms of employment and a better livelihood for themselves and their families (Crivello, 2011).
However, the connection between migration and education is not always positive. For instance,
people can migrate to an urban area in pursuit of educational attainment but end up not being able
to obtain it due to social inequalities and insufficient access to necessary funds to finance their
educational attainment (Nunn, et al., 2014).
2.3.1.2 Income status and rural-urban migration
Previous studies posit that income has a bearing on the state of rural-urban migration around the
world. For instance, in China, increased income has been associated with high levels of rural-urban
migration (Gugler, 2004). On the same note, in another Asian Tiger (Taiwan), the government
standardized the rate of income among the people in order to reduce the movement of workers and
provide stability with the performance of organization (Yao Lu, 2015). However, the situation is
completely different in Africa. Agensa (2011) and Casale et al. (2006) reiterated that the
inadequate policy to police migration at an internal level has no effect to make people stay in a
province for a period of time. In his study, Agensa (2011) pointed out that lack of policies to
support local people have no influence on their migration status. Similarly Casale et al. (2006)
indicated that internal migration is inadequately supported by government, and is a source of
xenophobia as foreigners provide cheap labour and receive low pay without complaints.
On the same note, it is observed that the income differential between rural and urban areas is the
key element for internal migration (Boure, 2001). For instance, in the Harris-Todaro model, the
model assumes that the migration decision is based on expected income differentials between rural
18
and urban areas rather than just wage differentials. This implies that rural-urban migration in a
context of high urban unemployment can be economically rational if expected urban income
exceeds expected rural income (Zhu & Zhongmin, 2004). Similarly, Walker & Kennan (2006),
reiterated that the association between income and migration decisions is driven by both
geographic differences in mean wages and by a tendency to move in search of a better location
match when the income realization in the current location is unfavourable.
Rural-to-urban migration causes overcrowding and unemployment in cities as migration rates
surpass urban job creation rates, with many people ending up in unproductive or underproductive
employment in the informal sector. Thus, the current study anticipates evaluating the income status
relation to rural-urban migration in South Africa using census 2001 and 2011.
2.3.1.3 Employment and rural-urban migration
In Europe, employment has caused people to move internally within the Euro-Zone seeking for
better jobs. For example, the World Bank (2016) indicates that as a result of the economic crisis
in Greece, the majority of people moved from Greece to other Euro-nations in pursuit of better
jobs that would enrich them for their survival. In Tanzania, industrialization of the city of Dar-es-
salaam has seen the majority of the people from the upland region of the country start to patronise
Dar-es-salaam because of its economic progress (Bull-Kamanga, 2003). For instance, a majority
of the people who are predominantly traders visit the port-city seeking for better trade
opportunities. Furthermore, the city position of the port remains the major pull factor as it gives
high employment to the people due to extensive activities coming from the port (Brettell, 2017).
In South Africa, the urban growth of the metropolitan areas such as Gauteng and North West
province, in addition to the high level of mining in these provinces, leads the majority of local
19
South Africans to choose to visit these provinces to seek employment due to the economic growth
and mining activities (Kibet, 2013). This results in many families migrating to the cities upon
getting either permanent jobs or some long-term temporary mining jobs.
In another aspect, as the population of the country increases, the economic activities meant to
support the population follow. These results in a high level of school service demand and job
creation to support the growing population, hence it is a pull factor that attracts or increases influx
of migrants at local level (South African Government, 2012). Unemployment with an alternative
of job related activities has resulted in high levels of rural-urban migration. For instance, in the
Rural-urban migration in Nigeria: consequences on housing, health-care and employment study,
the results indicate that 94% of the respondents moved from their place of birth to the urban areas
because of the high rate of unemployment in the rural areas (Johannie, 1988; Adnafu et al., 2014).
With the growing number of people migrating from the rural areas to the urban centres, there are
also likely to be problems of overcrowding which intensifies the problems of communicable
diseases and pollution (Posel & Casale, 2006). A significant cause of urban employment problems
is the astonishing growth in urbanisation and the incapability of these urban centres to utilize or
absorb the urban labour that was created through the process of urbanization (Cleveland, 1991;
Agensa, 2011). The other problem is the extremely slow pace of industrialization as compared to
urbanization (Nunn, et al., 2014). Furthermore, Nigeria has precipitated the most perilous
magnitudes of capitalism by intentionally establishing inequality and poverty in society (Gross, et
al., 2009). The approach used by the Nigerian government is organized by the bourgeoisie and has
resulted in the establishment of poverty through the process of generating unemployment (Johnnie,
1988). Similarly, in India, unemployment is a major push factor because people leave their spouses
20
in the rural areas in seeking employment opportunities (Hina, et al., 2015). In the South African
situation, rural dwellers, too, migrate to urban areas in search of employment opportunities in order
to be able to provide for their families that are left behind (Posel & Casale, 2006).
On the same note, employed people with continuing alternative income generating activities have
less preference of being internal migrants (Ullah & Sofi, 2013). A study by Lu (2015) indicates
that a stable economic growth is always short of labour in that it offers both skilled and semi-
skilled workers a living. This implies that rural-urban migration cannot be suppressed as the
economy that is growing has an opportunity to create more employment for the people. Therefore,
the current study plans to explore the effect of employment status on the rural-urban migration
over the period 2001 and 2011 in South Africa using census datasets.
Around the world, the majority of the youth are moving from one region to the other in pursuit of
socio-economic interests. For instance, the majority of migrants are separated from their parents
because of education gains. For example, in South Africa most of the youth migrate from rural
areas to urban areas in pursuit of furthering their studies in the universities or colleges (Kalule-
Sabiti & Kibet, 2006). According to Landau (2012), the high level of youth out-migration from
rural areas leaves behind the dependent population which is contributing to economic growth at a
slow pace. These results in the slow economic development of rural areas compared to their urban
counterparts.
Economic development in South Africa differs across the provinces; for instance, some
universities have better infrastructure and courses. For example, supposedly a university offers the
best agricultural course. This causes a high level of internal migration from other provinces such
Mpumalanga. Recently, internal migration of the youth in academic pursuits has resulted in a
21
struggle and headache for them and their parents. In South Africa, higher education institutions
nationwide have been involved in strikes and that resulted in universities closing prematurely.
Therefore, this resulted in students from other provinces struggling to find temporary
accommodation while waiting for the re-opening of universities. Furthermore, among adults, when
they get a job in another province they intend to move along with their family, including children,
causing children to be victims of internal migration. (Hall & Posel, 2012). Hall (2010) posits that
families are better off sticking together even if it means moving around with children in pursuit of
better living conditions.
Assuming the significance of employment for financial security, identity, social inclusion and
well-being, it is crucial to gain an understanding of employment and how rural-urban migration
affects the quality of finding employment in urban settlement.
2.3.2 Demographic characteristics
Migration is a process that affects socio-economic and demographic dynamics of the society. So
it is imperative to study the effects or impact of migration on demographic factors in order to be
able to create policies to deal with the consequences of rural-urban migration within the country’s
borders. The factors that this study investigates in terms of demographic factors are as follows;
age, population group, disability status and gender.
22
2.3.2.1 Age and rural-urban migration
Due to the rural –urban migration, the urban areas experience influx of people in their reproductive
ages that are able to increase the population growth and change the structure of the population in
urban area; this results in the increase of slums, crime and environmental problems (Burns &
Grove, 2001). Therefore, based on the aforementioned discussion, there is a need to explore the
effects of age in form of the children, adolescents, young adults and adults in the country using
census data.
2.3.2.2 Gender and rural-urban migration
Weeks et al., (2010) posit that rural-urban migration is gender selective; for instance, in South
Africa during the Apartheid era, males were the predominant migrants due to the high demand of
mining labour systems. The female internal migration rate was low because females were
considered perpetual minors in the African tradition social systems (Weeks, et al., 2010).They
were expected to seek permission from their husbands to migrate (Collinson, et al., 2006).
However, the position has shifted as females can now migrate to urban areas in pursuit of
educational opportunities or to advance their careers (Agensa, 2011).Modern day females are the
ones that migrate a lot due to women empowerment such as the Affirmative Action strategy.
Women are now able to make their own decisions without conforming to the social norms that
state that men are the decision makers (Collinson, 2007). Additionally, the gender selective
internal migration often results in the imbalanced gender ratio which affects marriages, family
dislocations and reproductive behaviour in rural areas. However, urban cities are faced with
problems such as overcrowding or congestion, strains on urban social services and unemployment
(Boure, 2001).
23
Furthermore, according to Wiest (2016), migration is not only gender-selective but age-selective.
For instance, migration selects young women which results in an uneven spatial development in
both the source areas and hosting areas. Chort (2014) further states that women’s migration
decision is not well thought out or executed carefully due to the fact that they are forced to migrate
due to their current circumstances, such as single motherhood with the sole responsibility for their
children and need to provide for them. This normally results in the uncalculated cost or restriction
experienced in the destination areas (Chort, 2014). However, Wiest (2016) states that women
correctly plan to relocate, especially the young women that are given more preference in the
employment sector, especially those with skills. Thus it is imperative that this study investigates
the effects of gender on rural-urban migration.
2.3.2.3 Race and rural-urban migration
Race has been associated with push factors that affect communities. For instance, a study by
Silverstein (2005), argues that race created a number of integration challenges among the white
migrants who were moving from one community to another in search of economic stability.
Accordingly, Kritz & Gurak (2015) reiterated that migrants experience a lot of challenges as a
result of their racial status, more especially when they migrate to an area that is predominantly
occupied by people with varying races. In South Africa, studies indicate that since 1994, the black
population mobility increased tremendously, and Blacks were found to be more prone to rural-
urban migration as compared to other races such as Whites, Indians, and mixed races (Kibet,
2013).The Black/African population mobility spans from the rural dimensions to urban areas.
Previous studies highlight that racial migration is a precursor of a number of social factors such
as seeking high social and economic power, agricultural stability and matrimony reasons (Casale&
Posel, 2006; Todaro& Smith 2003). However, the majorities are Black/Africans and there are still
24
cultural differences which sometimes lead to xenophobic practices among the indigenous people
and such conditions lead to integration problems and difficulties in host communities (Posel &
Casale, 2006). It is thus imperative to explore the trends on how race affects rural urban migration
in the country from 2001 and 2011 Census data perspectives.
2.3.2.4 Disability status and rural-urban migration
Many studies do not account for the people living with disabilities as one of the key contributing
factors in rural-urban migration under the demographic variables. According to the White Paper
on the Integrated National Disability strategy (2003), rural areas do not have sufficient equipment
or services to cater or care for people living with disabilities, hence, in the urban areas it is required
by law that each and every facility offers services that will enable people living with disabilities
to utilize public facilities such as toilets without any problems. Rural areas lack such facilities and
specialized doctors to deal with people with disabilities (Antobam, 2016; Funnah, 2001). Thus,
those with disabilities prefer to migrate to urban areas. However, the migration decision is not only
based on the service attainable in the urban areas, but also on whether the person can afford them.
Funnah’s (2008) thesis, The Socio-economic and Demographic Characteristics of rural-urban
youth migration in the North West Province of South Africa, based on the 1996 South African
census, found that a small proportion of the youth in 1996 had some kind of disability, whereas
92.4% did not have disability. The study further explains that those with multiple disabilities are a
burden to their families and cannot be easily integrated into the society in the rural areas. Thus, it
is imperative for those with multiple disabilities to be in an environment which is suitable and able
to care for them efficiently and also specialized in such services (Funnah, 2001). Furthermore,
those care centres are mostly established in the urban areas. It is therefore imperative to explore
25
the trends on how people with disabilities influence rural-urban migration in the country from 2001
and 2011 Census data perspectives.
2.3.3 Individual factors
Individual factors in this study are considered to be factors that affect the individual’s decision to
migrate such as parental survival, marital status and children ever born. According to the
neoclassical theory, understanding migration as an individual-decision for income expansion is
grounded on cost-benefit calculation (Corker, 2013). Furthermore, the deprivation theory concurs
with the neoclassical theory in viewing individuals as the main actors in migration decision but
assumes that individuals who are less advantaged within a community have the utmost inspiration
to migrate from their place of origin (Agensa, 2011). Both theories articulate that migration seems
to be the only option to those individuals who are disadvantaged in the rural areas and is a means
of improving their socio-economic positions by migrating to the urban setting.
However the new economics of migration theory differs from the neoclassical and deprivation
theories. The new economics of migration theory views an individual decision-maker in the
migration process as not an individual decision at all but it is mostly influenced by the family
opinions and the decision is made by the family rather the individual. For example, the family
decides or chooses to send a family member to migrate to maximise expected outcomes for the
group. The migration of an individual and/or family or community member is a considered
decision based on expected better opportunities or outcomes at the place of destination (Antobam,
2016).
26
2.3.3.1 Parental survival and rural-urban migration
Parental survival has an impact on an individual’s decision to migrate from a rural area to urban
settlement. If the parents are not alive the individual is often forced to migrate to other places in
search of employment in order to be able to provide for his siblings especially if the migrant is
from a poor family that depends on day-to-day income. It is identified by researchers such as
(Agensa, 2011; Nunn et al., 2014 and Crivello, 2011) that migrants often have significant family
responsibilities including caring for siblings, assisting parents, and contributing economically to
the household.
In Mexico, the situation of an absent father in a household has been on the rise due to fathers
migrating to the United States in search of better living opportunities that can enable them to care
for their families financially (Nobles, 2013). This results in the family structure being shattered,
meaning that the mother has to care for all the children by herself, although in some circumstances
the father is in constant touch with his family by sending remittances to the mother in order to
support his children and provide for their necessities (Nobles, 2013).
According to Noble (2013), 1 in 5 children in Mexico will experiences the father’s migration to
the United States. The level is significantly higher in the rural communities of Mexico than in the
urban areas. This therefore, demonstrates the wealth difference between rural and urban areas.
Rural fathers depart to the United States for the benefit of their families and to be able to provide
for their needs rather than those in the urban areas whose decisions to migrate might not be based
on the family’s needs but rather on furthering his career (Haas &Marie-Laurence, 2016).
Furthermore, male migration encourages female-headed households and family disintegration.
Similarly, in South Africa, most households are female-headed. This is the result of high male
27
migration levels in the country in pursuit of employment opportunities in the urban areas (Agensa,
2011).
According to Hall (2010), female rural-urban migration increased by 34% from 11%in 2009; this
includes the women who came with their children to the urban areas. However, some women left
their children in the rural areas. In South Africa it has become a norm that children are left behind
in the rural areas under the custody of their grandparents, while their mothers and their fathers
pursue their education and careers in order to be able to provide for their children (Posel & Casale,
2006). In Nairobi, for instance, mothers who migrate to other places without any family or
connection end up staying in the slums and their children’s life expectancy is cut short due to the
insufficient water, sanitation and toilets, not to mention diseases found in such places (Konsiega,
et al., 2006).
Therefore it is imperative to study the relation between an individual’s decision to migrate and
parent’s survival. It is stated that if both parents are alive, there is a higher chance of individuals
deciding to migrate to urban areas because they will have parental support, both financial and
emotional, rather than those without parents who may inherit parental responsibilities towards their
siblings(Nunn, et al., 2014).
2.3.3.2 Marital status and rural-urban migration
Around the world, the increase of female migration has led to a decline in marital rates. This
changes the basic household and family structure. The decline of marital rate may be that woman
prefers to migrate while they are single in order to make their own decisions without seeking
28
permission from their partners (Adepoju, 1998; Hina et al., 2015). It also enables them to migrate
freely in search of employment opportunities. Similarly, according to Casale and Pasel (2003),
without seeking any permission whatsoever from a male person, women are more inclined to
migrate at any time they wish. Casale and Posel, (2003) found that regression results demonstrate
that married women are less likely to migrate than their unmarried counterparts. This is because
women are expected to look after and care for the children while the men earn a living to support
their families (Crivello, 2011). The other point on regression results indicate that an adult female
who has children under the age of 6 years is less likely to migrate. On the contrary, if an adult
woman has children of school-going age (7-14 years), the odds of migrating to other places are
more likely (Brettell, 2017).
2.3.3.3 Children ever born and rural-urban migration
Previous studies have shown that children less than 14 years are likely to experience forced
migration by their parents (Brettell, 2017; Hall & Posel, 2012; Wiest, 2016). For instance, military
parents may be relocated due to their work and their children are forced to move with them every
time without being consulted, because of their inability to make mature decisions and as a result
of their minor status ( Bennett, et al., 2015). These circumstances may either be positive or negative
on the child’s growth and development (Konsiega, et al., 2006). Studies have shown that children
who do not have a place to call home often find it difficult to integrate into the society or
community they are currently living in (Hall & Posel, 2012). According to Hall (2012), in
Australia, a large number of children have lost their childhood due to their forced participation in
illegal hard labour. In Kenya, children are often forced to work, especially those children residing
in the rural areas, where the parents perceive them as investments. Those children start providing
for their individual households by working in the agricultural fields. It has been perceived and
29
observed that child labour laws do not really apply in the rural setting, unlike in the urban areas
(Konsiega, et al., 2006).
Furthermore, studies indicate that when parents migrate or separate, children are either forced to
relocate with one parent or both parents to a new place, or they are left behind by their parents and
are then indirectly affected by migration (Cebotari, et al., 2016).On the same note, sometimes
children are left behind in their place of birth while one parent or both parents migrate. Such
children experience difficulties in their education, physiologically and emotionally. In the study
by Cebotori et al., (2016), the results show that indeed children are affected psychosocially,
especially by migration of the mother rather than the father; however, such results are gender
selective.
The literature indicates that there is a connection between children (whether left behind at the
birthplace or those who migrated to a new destination and migration decision of parents) and their
health conditions ( Bennett, et al., 2015).Such conditions have their pros and cons in relation to
the child’s health, whether physical, mental or emotional. Thus it is important to observe or study
the trends of children migration in South Africa and come up with policies to deal with the
nightmare of forced child migration (Atnafu, et al., 2014).
2.4 Theoretical framework
The current study adopts the pull-push theory by Lee which was developed in 1966. The theory
states that the Push and Pull factors influence the acts of migration. The push factors are factors
linked to the source area such as underemployment or unemployed opportunities, poor living
conditions, low income, lack of public services such as education facilities. Pull factors are
connected with the hosting area. Those may include better job opportunities, better living
30
conditions, better education prospects and better medical care (Lee, 1966). These push and pull
factors are used as a springboard and foundation to the study in order to explain why people move
from one place to another.
Studies that have used this model in the past, like “Elderly Migration: An Analysis of Push and
Pull Factors” by Grieg Robertson Alley (1996), used the theory of push and pull. Thet’s (2014)
study titled “Pull and Push Factors of Migration: A Case Study in the Urban Area of Monywa
Township, Myanmar,” was based on this theory and used the following variables to test the
correlation between age, gender, occupation, educational level of migrants, house location, better
living condition, employment, and political factors and migration.
The above studies did not explore the individual factors in testing for the correlation of socio-
economic characteristics and the independent variables used. Therefore, this current study is
imperative because its variables tested against the migration status include individual factors such
as father alive, mother alive, marital status and children ever born. As such, the study engages the
Push and Pull theory in order to hypothesise and test how race, age, disability gender, education,
income status , employment status , maternal and paternal survival , marital status and number of
children ever born in the family estimate rural-urban migration in South Africa between 2001 and
2011.
2.5 The conceptual framework
Migration is cautiously believed to be a significant feature of livelihoods in developed countries
where migrants pursue better living (Isiugo-Abanihe & Uche , 2014). Lee, in 1966, re-evaluated
the concepts that contribute to the act of migration and divided them into push factors and pull
factors; this is known to be a useful framework for arranging factors encouraging migration. Those
31
push and pull concepts have components. For instance, pull factors are associated with the negative
conditions in the area of origin such as unemployment, bad climate, poor living conditions and
lack of adequate medical centres, whereas pull factors are described as factors that attract the
individual to migrate such as better living conditions, better income opportunities, and educational
opportunities, and health care centres, among others.
32
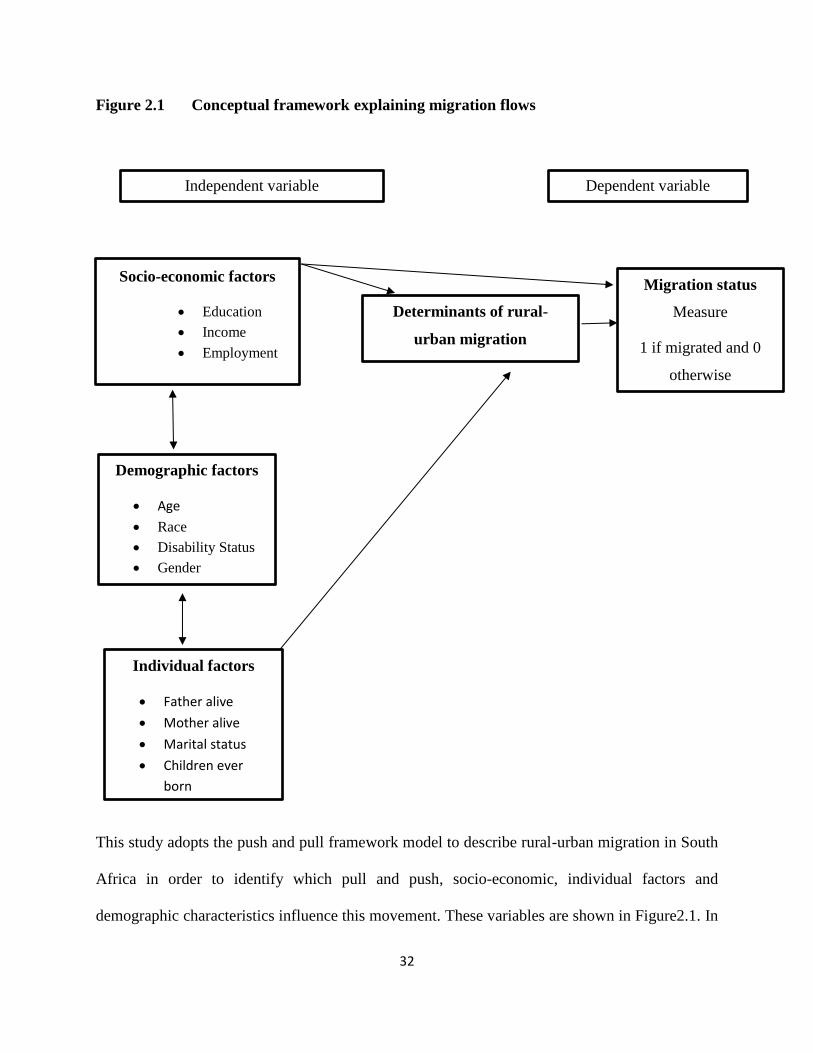
Figure 2.1 Conceptual framework explaining migration flows
This study adopts the push and pull framework model to describe rural-urban migration in South
Africa in order to identify which pull and push, socio-economic, individual factors and
demographic characteristics influence this movement. These variables are shown in Figure2.1. In
Socio-economic factors
Education
Income
Employment
Demographic factors
Age
Race
Disability Status
Gender
Individual factors
Father alive
Mother alive
Marital status
Children ever
born
Independent variable Dependent variable
Determinants of rural-
urban migration
Migration status
Measure
1 if migrated and 0
otherwise
33
the conceptual model, different measurement of the demographic, socio-economic and
individual’s variables are conceptualized to affect the probability of the variable outcomes. The
framework is significant and primarily used to define and test the findings on the characteristics
of migrants in the study.
34
Chapter Three
Methodology
3.1 Introduction
This chapter presents the methodology used in the study. It specifically describes the study settings
and study design. Also described in this chapter are data source, the variables which the study used
and their measurements. The data quality assessment and analysis methods are also described in
this chapter.
3.2 Study setting
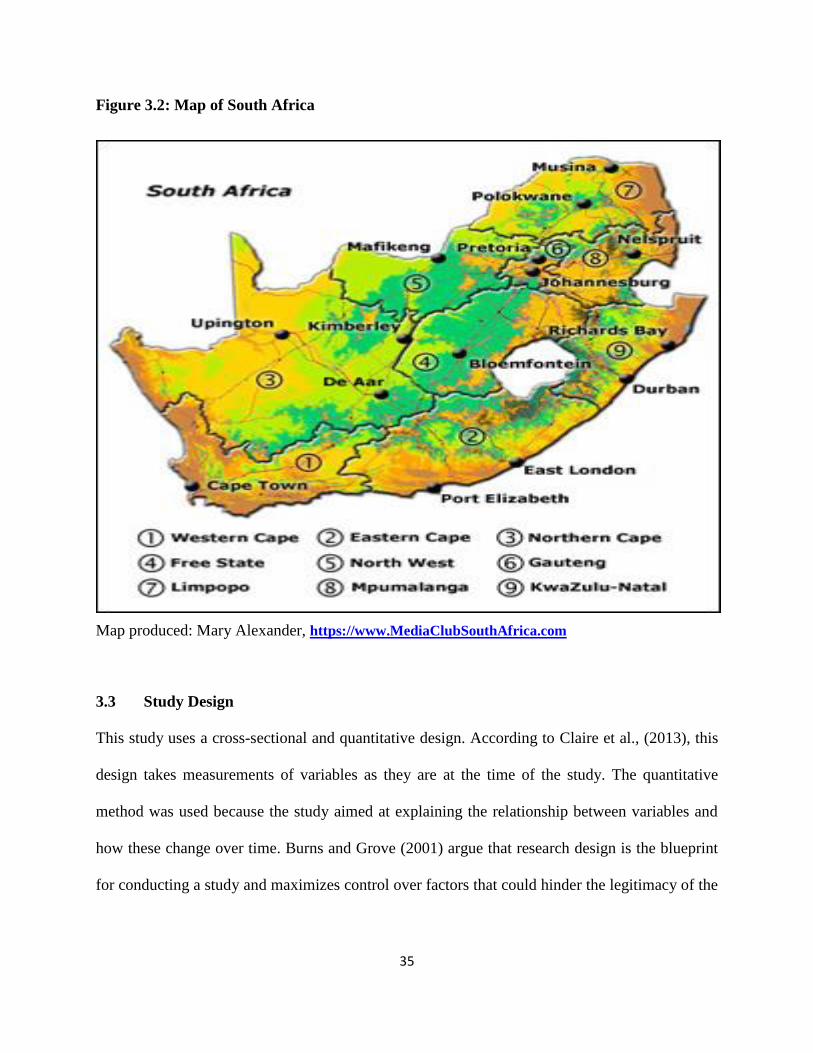
The Republic of South Africa lies at the southern part of the African continent, stretching from
latitude 22 ֯ to 35 ֯ S and longitudinally from 17 ֯ to 33 ֯ E. The country is divided into nine
provinces, namely, Mpumalanga, KwaZulu-Natal, Northern Cape, North West, Limpopo, Free
State, Western Cape, Eastern Cape and Gauteng. According to the World Bank (2016), the total
population of the country in 2015 was estimated to be 54.9 million. The South African population
growth rate was estimated at about 1.6 % in 2015 down from 2.6 % in the 1960s. Labour force
participation by gender stands at 43.8% females and 61.2% of males; and the unemployment rate
was 23% for males and 27% for females in 2014. Urbanization rate of South Africa was estimated
to be 37% in 2015 (Kibet, 2013).
35
Figure 3.2: Map of South Africa
Map produced: Mary Alexander, https://www.MediaClubSouthAfrica.com
3.3 Study Design
This study uses a cross-sectional and quantitative design. According to Claire et al., (2013), this
design takes measurements of variables as they are at the time of the study. The quantitative
method was used because the study aimed at explaining the relationship between variables and
how these change over time. Burns and Grove (2001) argue that research design is the blueprint
for conducting a study and maximizes control over factors that could hinder the legitimacy of the
36
findings. Study design assists a researcher in strategizing and implementing the study in order to
obtain valid results.
3.4 Data Source
The study is based on data obtained from the 2001 and 2011 South African 10% sample Censuses.
The 2001 and 2011 Censuses are the latest censuses that were conducted after the democratic
transition in 1994 and are datasets that are capable of addressing the aims and objectives of the
study from a national perspective. The main objective of collecting census data is to provide up-
to-date information on population variables for planners, policymakers, researchers and
development managers which would assist in the establishment, implementation, monitoring and
evaluation of initiatives aimed at improving the quality of life of the population. Both censuses
used the de facto method of population count. The censuses collected information on previous
place of residence and usual place of residence. The information provided by a census confirms
whether a person has migrated or not. If it turns out that the person has moved, census data will
indicate where the person moved to or from.
The sample technique utilized for both censuses was the systematic stratified sample of
households. By using this method, clusters were selected from a list of enumeration areas (EAs)
as defined in the 2001 and 2011 censuses. The reason for using the 10 % sample size is because it
is feasible and it is nationally representative.
3.5 Variables and Measures
In this section, the main variables used in the study are described. Rural-urban migration is viewed
as circular migration also known as temporary migration and it is defined as a repetition of
migration by the same individual between two places (rural to urban or vice versa). The definition
37
of migration in the South African context by Kok et al (2003) refers to those movements that
involve a change in usual place of residence from one magisterial district to another.
3.5.1 Dependent Variable
The response variable used in the study was derived from usual place of residence and was
recorded and renamed as migration status. In the census questionnaire respondents were asked
“Where were you born? How long have lived in this area?”
From this question a variable on migration status was generated.
Migrants here are defined as individuals born within rural dwellings of South Africa who have
migrated to the urban areas. Migration events in this paper are considered to be the place of birth
as origin and urban area as the destination. For purposes of easier analysis the original response
variable presented by the data set was recorded to form a new binary response variable. This re-
coded variable was categorized as ‘never migrated and ever migrated’. The category ‘never
migrated ‘comprised respondents who reported to have never moved from their current
geographical location in the last 10 year period and those in the category ‘ever migrated’ are those
reported to have relocated from their original place of birth and participated in the circular rural-
urban migration.
3.5.2 Independent Variables
A number of predictor variables were identified and these together with response variables are
presented in Table 3.1. Some of these variables are continuous and categorical in nature. The
independent predictor variables comprise demographic, socio-economic and individual
characteristics. The demographic variables include age, gender, population group, people with
38
disabilities. The socio-economic variables referred to in this study are level of education, income
status and employment status. That is, there is evidence of linkages between education, earnings
and market productivity. In other words, migrants who are more educated tend to migrate more in
search of better paying jobs in the urban areas where their skills can be more effectively used to
enhance themselves in the work environment. Conversely, migrants who fail to complete high
school face very limited and diminished employment prospects. Other variables (individual
variables) included as predictor variables are survival of parents, children ever born and marital
status.
Furthermore, current age of respondents is categorized in 5 and 10 years group in order to be able
to include all the population ranging from 0- 31+years. Gender is classified as males or females.
With regard to population group the respondents are categorized as African, coloured,
Indian/Asian, white and others. Disability status is conveniently categorised as yes or no; education
variable used was the highest level of education attended categorized as: no education, primary
school, secondary school and tertiary. Income status was categorized as yes or no. Employment
status was classified as employed or unemployment. Father alive was categorised as yes or no,
also for mother alive. Marital status of respondents was classified as never married, married,
cohabiting or separated. Lastly children ever born defined as the actual number of children born
alive to women (Haub, 2013)was classified as less than 2, 3 to 4 children or 5 children and above.
Some of the above predictor variables where re-coded from their original codes as reflected in the
Census data into a form that is applicable to the objectives of the current study. Especially, the
following variables were re-coded: age of respondents (<14, 15-19.20-30, 31+), level of education
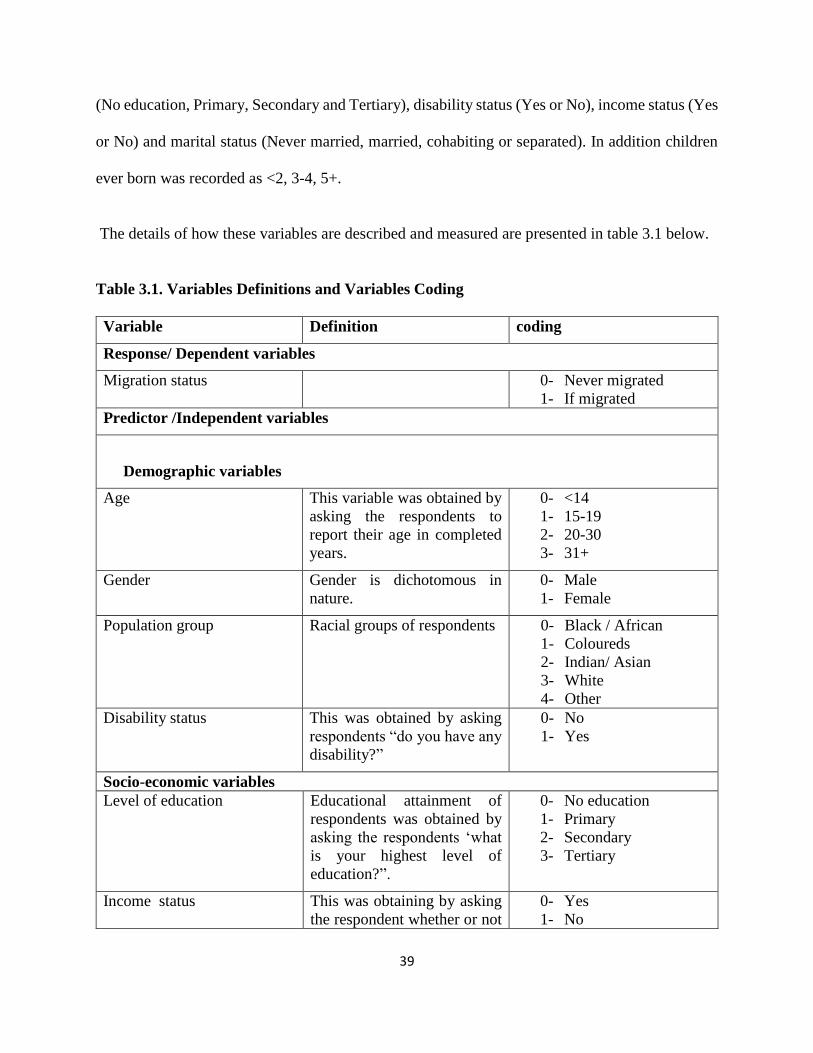
39
(No education, Primary, Secondary and Tertiary), disability status (Yes or No), income status (Yes
or No) and marital status (Never married, married, cohabiting or separated). In addition children
ever born was recorded as <2, 3-4, 5+.
The details of how these variables are described and measured are presented in table 3.1 below.
Table 3.1. Variables Definitions and Variables Coding
Variable Definition coding
Response/ Dependent variables
Migration status 0- Never migrated
1- If migrated
Predictor /Independent variables
Demographic variables
Age This variable was obtained by
asking the respondents to
report their age in completed
years.
0- <14
1- 15-19
2- 20-30
3- 31+
Gender Gender is dichotomous in
nature.
0- Male
1- Female
Population group Racial groups of respondents 0- Black / African
1- Coloureds
2- Indian/ Asian
3- White
4- Other
Disability status This was obtained by asking
respondents “do you have any
disability?”
0- No
1- Yes
Socio-economic variables
Level of education Educational attainment of
respondents was obtained by
asking the respondents ‘what
is your highest level of
education?”.
0- No education
1- Primary
2- Secondary
3- Tertiary
Income status This was obtaining by asking
the respondent whether or not
0- Yes
1- No
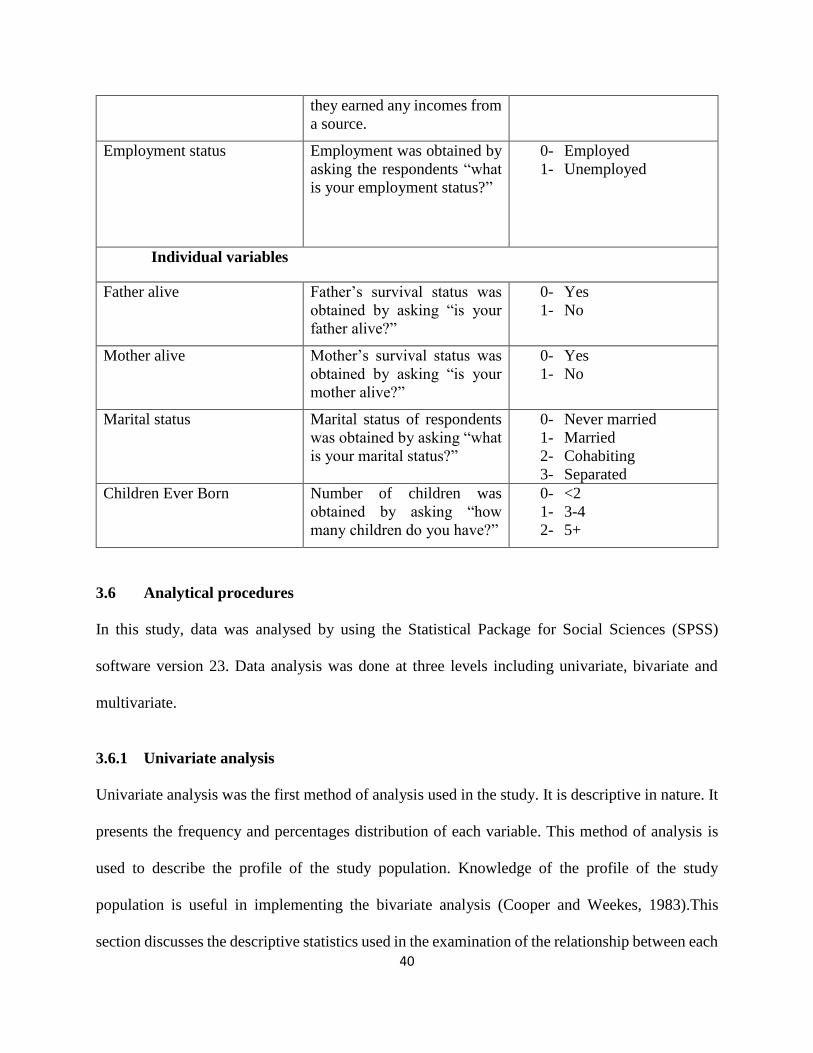
40
they earned any incomes from
a source.
Employment status
Employment was obtained by
asking the respondents “what
is your employment status?”
0- Employed
1- Unemployed
Individual variables
Father alive Father’s survival status was
obtained by asking “is your
father alive?”
0- Yes
1- No
Mother alive Mother’s survival status was
obtained by asking “is your
mother alive?”
0- Yes
1- No
Marital status Marital status of respondents
was obtained by asking “what
is your marital status?”
0- Never married
1- Married
2- Cohabiting
3- Separated
Children Ever Born Number of children was
obtained by asking “how
many children do you have?”
0- <2
1- 3-4
2- 5+
3.6 Analytical procedures
In this study, data was analysed by using the Statistical Package for Social Sciences (SPSS)
software version 23. Data analysis was done at three levels including univariate, bivariate and
multivariate.
3.6.1 Univariate analysis
Univariate analysis was the first method of analysis used in the study. It is descriptive in nature. It
presents the frequency and percentages distribution of each variable. This method of analysis is
used to describe the profile of the study population. Knowledge of the profile of the study
population is useful in implementing the bivariate analysis (Cooper and Weekes, 1983).This
section discusses the descriptive statistics used in the examination of the relationship between each
41
of the socio-economic, demographic and individual factors and rural-urban migration in South
Africa.
3.6.2 Bivariate analysis
Bivariate analysis was the second method of analysis that was used in the study. According to
Shumate and Palazzo (2010), bivariate analysis is conducted through four stages. Firstly, it is used
to evaluate whether the value of the Migration status (dependent variable) is correlated to the
values of the each social-economic, demographic and individual factors (independent variables)
through detecting the nature of the relationship between the two variables, especially in relation to
the reference category. Secondly, it is used to demonstrate the direction of relationship between
the associated variables. Here the variables may be related positively or inversely. Thirdly, it is
used to evaluate the significance of the association between the variables. Lastly, it is used to
estimate the strength of the association between the dependent and the independent variables. Each
demographic, socio-economic and individual variable was statistically analysed together with the
response variables. This task is done in the form of cross tabulations which indicated frequency
and percentage distribution. Bivariate analysis of the response variable and each of predictor
variables allowed a clear indication of pattern of ‘rural-urban migration’ under varying
measurements of demographic, socio-economic and household predictor variables.
The Pearson Chi-square test was used to test for the association between the demographic, socio-
economic and individual characteristics of respondents and the dependent variable “migration
status.” Pearson Chi-square test is selected due to the categorical nature of the dependent and
independent variables. The equation used for the Pearson chi-square test was of the form:
42
x2 = ∑ (0𝑖𝑗−𝐸𝑖𝑗
𝐸𝑖𝑗)
2𝑖
𝑖=1
Associations are determined at confidence interval of 95% and a significance level of 5% estimated
to have a significant relationship with the response variables. All variables which produced p-
values of less than 0.05 in the Pearson Chi-square test were estimated to have a significant
relationship with the dependent variable. Therefore, the further the p-value is from 0.05, the
stronger the relationship between the predictor and the dependent variable.
3.6.3 Multivariate analysis
At multivariate level, the binary logistic regression (BLR) method was used to identify the
demographic, socio-economic and individual variables that predicted migration status in the
Pearson’s Chi-square for further testing and investigation at the multivariate level. These are
variables which had a p value of less than 0.05.Here the method was applicable to the response
variable “migration status”. Migration status was measured as never migrated and coded “0,” or
ever migrated and coded “1”.The method was chosen because it is suitable for use in studies in
which the dependent variable has binary outcomes irrespective of whether the predictor variables
are continuous, binary or categorical in nature (Hosmer & Lameshow, 2000). The model is also
suitable for this study because the model does not make any assumptions about the distribution of
the predictor variables. Logistic regression is simply an extension of the bivariate analysis in the
sense that more than two variables can be analysed at once (Menard, 2002; Hosmer and
Lemeshow, 2000).The never migrated status was used as the reference category. The binary
logistic regression model used was of the form:
43
𝐥𝐨𝐠 (𝒑
𝟏 − 𝒑) = 𝛂 + ∑ 𝜷𝒊 𝒙𝒊 + 𝝐𝒊
𝒊=𝒏
𝐢=𝟏
Where p is the probability of migrating and 1-p is the probability of not migrating, βi is the vector
of Odd Ratio and xi is the vector of the hypothesized variables in the study defined from
demographic, socio-economic and individual perspectives, 𝜶 is the constant and 𝜺 is the stochastic
error term.
3.7 Data quality
Blended- Myer index
Myer index evaluates the quality of single-year age distributions while Whipple’s index examines
the preference or avoidance of reporting of ages ending with each of the ten digits 0-9. The index
is first calculated by calculating the weighted population report on age ending with each of the ten
digits and then expressed as the “blended population” on each digit as a percentage of total
“blended” population. It is based on the assumption that there are no systematic irregularities on
the ages reported. The aggregate population of each age ending in one of the ten digits should be
almost 10% of the total blended population (Kpedekpo, 1982). The sum of the blended population
on each digit is expected to be equal to 10% of the total blended population. A sum of more than
10% of the total blended population at a given digit suggests the presence of over-selection or
preference of age ending in that digit, while a negative deviation suggests avoidance of ages ending
in that digit(Bureau, 1985).
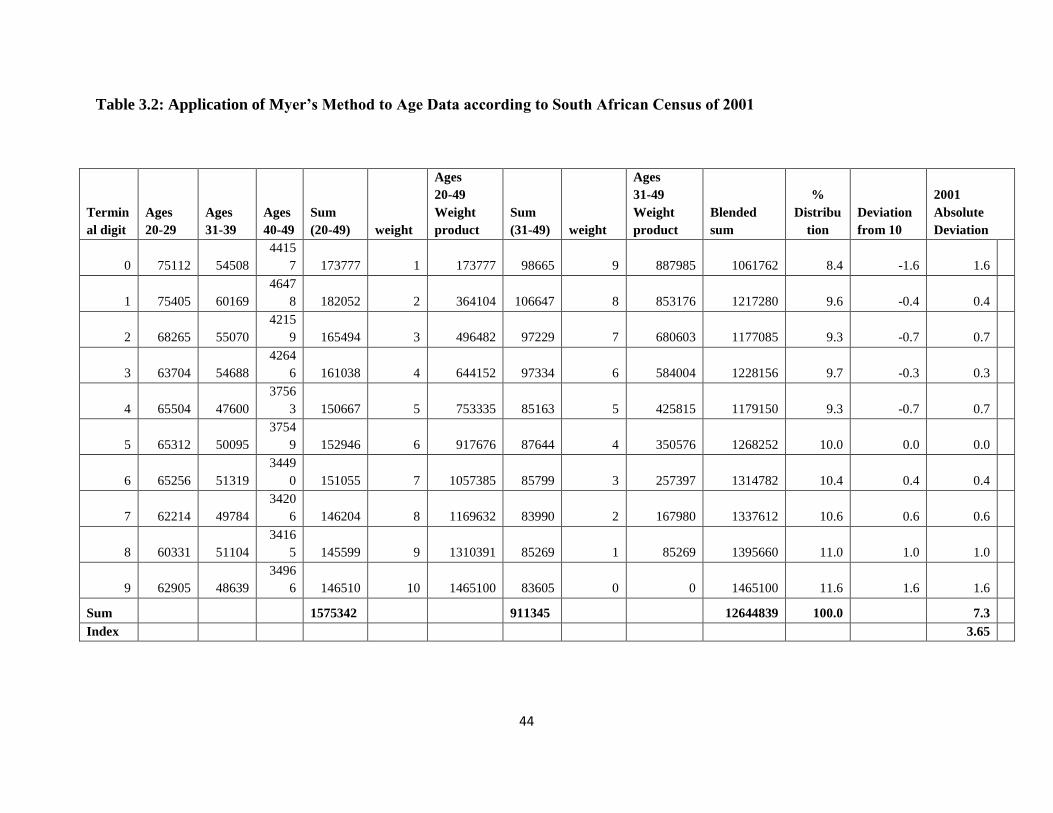
44
Table 3.2: Application of Myer’s Method to Age Data according to South African Census of 2001
Termin
al digit
Ages
20-29
Ages
31-39
Ages
40-49
Sum
(20-49) weight
Ages
20-49
Weight
product
Sum
(31-49) weight
Ages
31-49
Weight
product
Blended
sum
%
Distribu
tion
Deviation
from 10
2001
Absolute
Deviation
0 75112 54508
4415
7 173777 1 173777 98665 9 887985 1061762 8.4 -1.6 1.6
1 75405 60169
4647
8 182052 2 364104 106647 8 853176 1217280 9.6 -0.4 0.4
2 68265 55070
4215
9 165494 3 496482 97229 7 680603 1177085 9.3 -0.7 0.7
3 63704 54688
4264
6 161038 4 644152 97334 6 584004 1228156 9.7 -0.3 0.3
4 65504 47600
3756
3 150667 5 753335 85163 5 425815 1179150 9.3 -0.7 0.7
5 65312 50095
3754
9 152946 6 917676 87644 4 350576 1268252 10.0 0.0 0.0
6 65256 51319
3449
0 151055 7 1057385 85799 3 257397 1314782 10.4 0.4 0.4
7 62214 49784
3420
6 146204 8 1169632 83990 2 167980 1337612 10.6 0.6 0.6
8 60331 51104
3416
5 145599 9 1310391 85269 1 85269 1395660 11.0 1.0 1.0
9 62905 48639
3496
6 146510 10 1465100 83605 0 0 1465100 11.6 1.6 1.6
Sum 1575342 911345 12644839 100.0 7.3 Index 3.65

45
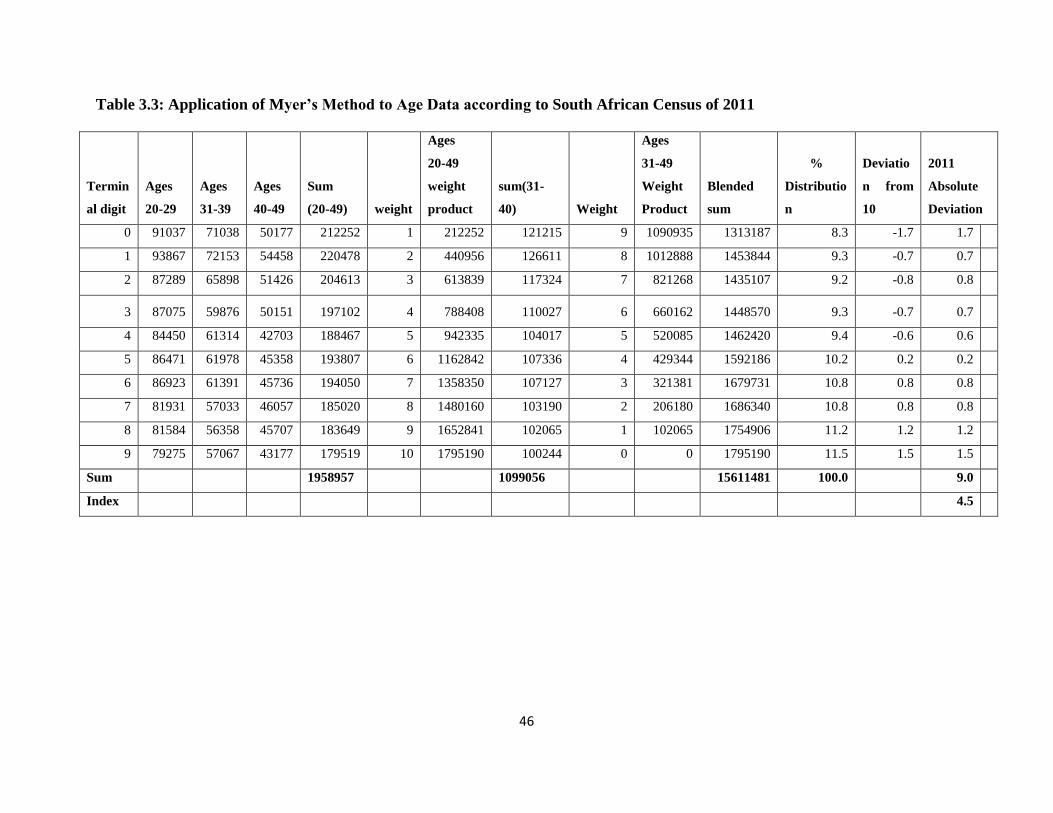
46
Table 3.3: Application of Myer’s Method to Age Data according to South African Census of 2011
Termin
al digit
Ages
20-29
Ages
31-39
Ages
40-49
Sum
(20-49) weight
Ages
20-49
weight
product
sum(31-
40) Weight
Ages
31-49
Weight
Product
Blended
sum
%
Distributio
n
Deviatio
n from
10
2011
Absolute
Deviation
0 91037 71038 50177 212252 1 212252 121215 9 1090935 1313187 8.3 -1.7 1.7
1 93867 72153 54458 220478 2 440956 126611 8 1012888 1453844 9.3 -0.7 0.7
2 87289 65898 51426 204613 3 613839 117324 7 821268 1435107 9.2 -0.8 0.8
3 87075 59876 50151 197102 4 788408 110027 6 660162 1448570 9.3 -0.7 0.7
4 84450 61314 42703 188467 5 942335 104017 5 520085 1462420 9.4 -0.6 0.6
5 86471 61978 45358 193807 6 1162842 107336 4 429344 1592186 10.2 0.2 0.2
6 86923 61391 45736 194050 7 1358350 107127 3 321381 1679731 10.8 0.8 0.8
7 81931 57033 46057 185020 8 1480160 103190 2 206180 1686340 10.8 0.8 0.8
8 81584 56358 45707 183649 9 1652841 102065 1 102065 1754906 11.2 1.2 1.2
9 79275 57067 43177 179519 10 1795190 100244 0 0 1795190 11.5 1.5 1.5
Sum
1958957
1099056
15611481 100.0
9.0
Index 4.5
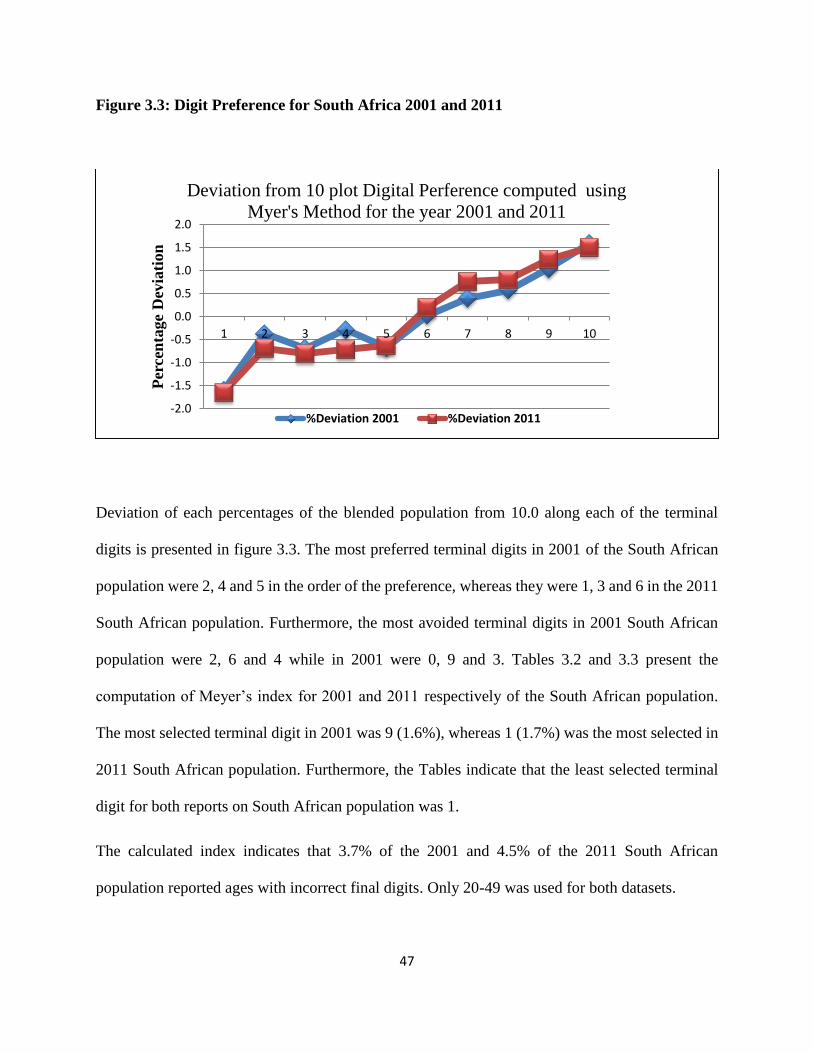
47
Figure 3.3: Digit Preference for South Africa 2001 and 2011
Deviation of each percentages of the blended population from 10.0 along each of the terminal
digits is presented in figure 3.3. The most preferred terminal digits in 2001 of the South African
population were 2, 4 and 5 in the order of the preference, whereas they were 1, 3 and 6 in the 2011
South African population. Furthermore, the most avoided terminal digits in 2001 South African
population were 2, 6 and 4 while in 2001 were 0, 9 and 3. Tables 3.2 and 3.3 present the
computation of Meyer’s index for 2001 and 2011 respectively of the South African population.
The most selected terminal digit in 2001 was 9 (1.6%), whereas 1 (1.7%) was the most selected in
2011 South African population. Furthermore, the Tables indicate that the least selected terminal
digit for both reports on South African population was 1.
The calculated index indicates that 3.7% of the 2001 and 4.5% of the 2011 South African
population reported ages with incorrect final digits. Only 20-49 was used for both datasets.
-2.0
-1.5
-1.0
-0.5
0.0
0.5
1.0
1.5
2.0
1 2 3 4 5 6 7 8 9 10
Per
cen
tage
Dev
iati
on
Deviation from 10 plot Digital Perference computed using
Myer's Method for the year 2001 and 2011
%Deviation 2001 %Deviation 2011
48
3.6 Limitation of the study
The study would have been better if a longitudinal approach was used in order to study the
changing patterns of the people in a closely spaced time span. This would have been a better way
to understand the socio-economic and individual factors affecting migration in South Africa at
provincial level. However, due to the challenges in obtaining such data, the study used census data
which is a cross sectional data that does not take into consideration the recursive data collection,
which translates to the major limitation of the study.
A Census is a national counting of all household and individuals residing in the country and most
of the questions asked are general in nature. Since a census generally enumerates all the individuals
in a country it is expected to have problems such as over-enumeration and under-enumeration
errors, it is believed that those who are under-enumerated are not evenly spread in geographical
terms and their effects thus become more pronounced for smaller administrative areas leading to
record bias. Another major limitation of census data is that most questions are left unanswered
with responses like ‘unspecified’ or ‘not applicable’ are being used to answer questions on issues
like disability status. Furthermore, a census could not provide or determine whether the
respondents were from rural or urban areas and it is not suitable to determine the causes of rural-
urban migration. Thirdly, another limitation from using census data was that persons who lived in
the same place at the time of Census 2001as that in which they were enumerated at the time of
Census 2011,were regarded as non-migrants, irrespective of whether they may have moved in
between and then returned.
In terms of the sample size of the population, the researcher believed that the higher the sample
size, the fewer errors it has and the statistic results can be generalised for the whole population.

49
With regard to intermittent flows over the 10 years period, it can be said that the long inter-
censual period acts as a severe limitation (Agensa, 2011)
50
Chapter four
Results
4.1 Introduction
The previous chapter presented the source of data and defined the analysis process of the study. In
this chapter, the results of the analysis are presented. The first part presents and discusses the
descriptive univariate analysis which describes the profile of the study population. In the second
part, the results of the bivariate analysis which examined the association between demographic,
socio-economic and individual characteristics are presented. In the third part, the results of the
binary logistical regression which identified the predictors of rural-urban migration are presented.
4.2 Demographic profile of the study population
The total number of South African, including rural-urban migrants and non-migrants, was
36,880,250 and only 53, 998 were rural-urban migrants prior to 2001; this figure is obtained from
the 2001 census data under the ‘five years ago’ variable. In the 2001 census questionnaire
respondents were asked “Five years ago (at the time of Census '96) was (the person) living in this
place (i.e. this suburb, ward, village, farm, informal settlement)?”
Table 4.1 presents the demographic profile of the study population. The variables included in the
profile are age, gender, population group, disability, education, income, employment status, father
alive, mother alive, marital status and children ever born. Table 4.1 below shows the rural-urban
migrants in 2001 was 53998 and whereas in 2011 were 117604. Furthermore, the tables indicate
that the median age of the study population was about 26 years in both the 2001 and 2011 censuses,
51
which is considered to be young. The majority of them were in the 31 years or older age group
followed by those in the less than 14 years age group. The people aged 31 years or older were
40.9% in 2001 and this dramatically increased to 53.5% in 2011. In 2001, 25.9% of migrants were
within the ages of 0-14 years compared to those in 2011 with a slight decrease to 16.6 %.In 2001,
10.5% of the study population was within the 15-19 year age group while in 2011 the same age
group comprised6.8%.Only 22.7% in 2001 were within the age group of 20-31 years and that
slightly increased by 1% in 2011.
In terms of gender, the study found that in both 2001 and 2011 datasets, female migrants were
more than their male counterparts. The females constituted a higher percentage, 52.2% in 2001
and 50.1% in 2011, compared to males at 49.8% in 2001 and a slight increase to 49.9% in 2011.
With regard to population groups, the study found that in 2001, Black/ Africans formed the
majority of the population in South Africa and contributed 79.3%, and Indians/ Asians were the
minority with a population of 2.5%. In similarity, in 2011, the Black/African population increased
to 80.2% whereas the Indian/Asians slightly decreased to 2.4%.
Table 4.1 below indicates that the highest proportion of the population had no disability, 92.7% in
2001 and 76.5% in 2011 respectively. Furthermore, the table below shows that the majority of the
population in 2001 had attained secondary education, at 40.3%. Only 7.0% of the population
analysed attained tertiary education in 2001. However, in 2011 the proportions of the population
with secondary and tertiary education were 46.7% and 23.1% respectively, which indicated an
increase from the 2001 level.
52
With regard to income, the study found that in 2001 the majority of the study subjects, comprising
62.0%, earned no income as compared to 33.0% in 2011 which indicated that there was a decline
in the population not earning any income between 2001 and 2011. Looking at employment status,
the majority of the study population was unemployed with 72.7% in 2001as compared to 41.7%
in 2011. Additionally, it can be observed from table 4.1below that a considerable percentage of
people in 2001 had surviving fathers (58.0%) and mothers (74.7%) compared to 52.1% and 33.4%
respectively in 2011. The data presented indicates a decrease in paternal and maternal survival
between 2001 and 2011. Regarding the marital status of the study population, in 2001 the majority
(61.8%) indicated that they were not married, and 5.0% were cohabiting. However, the proportion
of not married decreased intensively to 46.4%, whiles the proportion cohabiting increased to 7.3%
in 2011. Finally, table 4.1 below shows that the majority (70.5%) of the study population had five
or more children in 2001. However, in 2011, the proportion of study population having five or
more children increased to 75.0%.
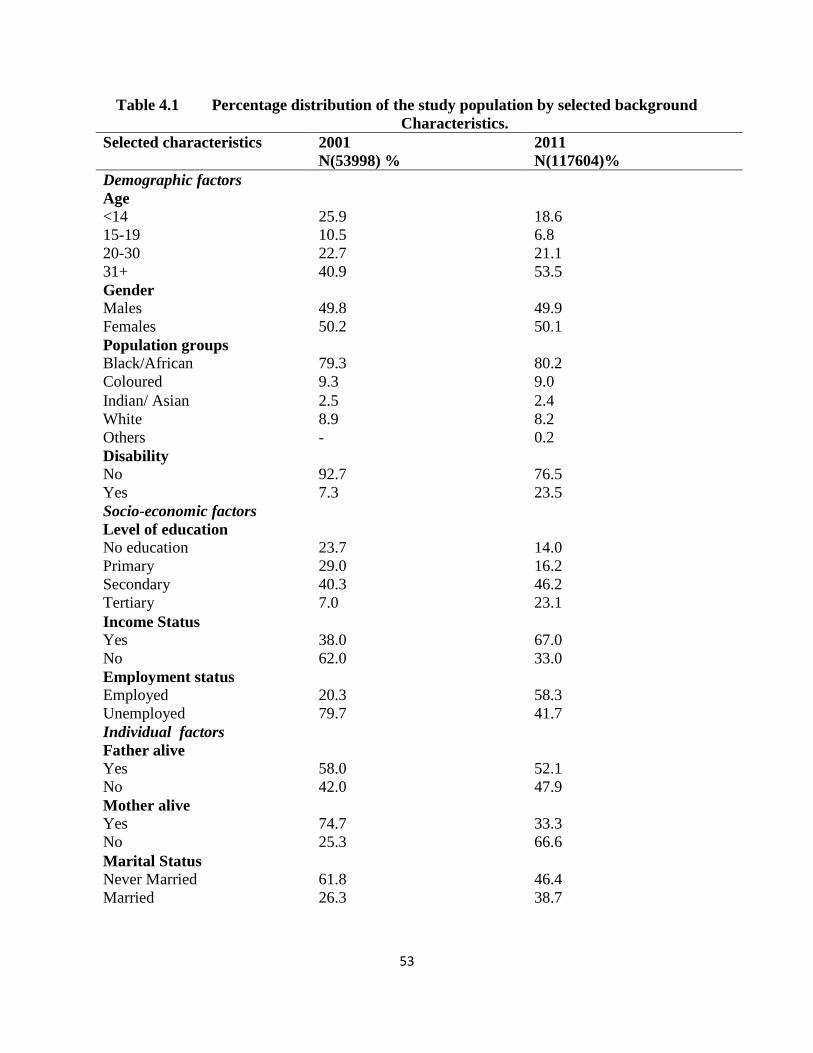
53
Table 4.1 Percentage distribution of the study population by selected background
Characteristics.
Selected characteristics 2001
N(53998) %
2011
N(117604)%
Demographic factors
Age
<14 25.9 18.6
15-19 10.5 6.8
20-30 22.7 21.1
31+ 40.9 53.5
Gender
Males 49.8 49.9
Females 50.2 50.1
Population groups
Black/African 79.3 80.2
Coloured 9.3 9.0
Indian/ Asian 2.5 2.4
White 8.9 8.2
Others - 0.2
Disability
No 92.7 76.5
Yes 7.3 23.5
Socio-economic factors
Level of education
No education 23.7 14.0
Primary 29.0 16.2
Secondary 40.3 46.2
Tertiary 7.0 23.1
Income Status
Yes 38.0 67.0
No 62.0 33.0
Employment status
Employed 20.3 58.3
Unemployed 79.7 41.7
Individual factors
Father alive
Yes 58.0 52.1
No 42.0 47.9
Mother alive
Yes 74.7 33.3
No 25.3 66.6
Marital Status
Never Married 61.8 46.4
Married 26.3 38.7
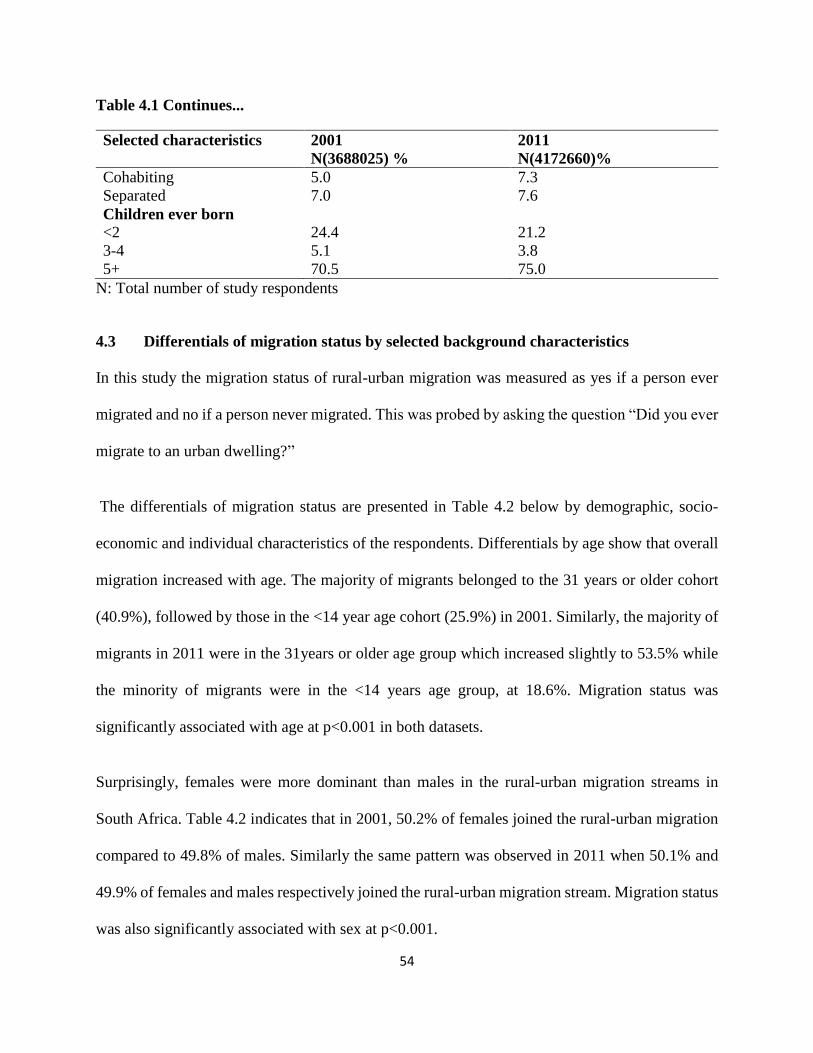
54
Table 4.1 Continues...
Selected characteristics 2001
N(3688025) %
2011
N(4172660)%
Cohabiting 5.0 7.3
Separated 7.0 7.6
Children ever born
<2 24.4 21.2
3-4 5.1 3.8
5+ 70.5 75.0
N: Total number of study respondents
4.3 Differentials of migration status by selected background characteristics
In this study the migration status of rural-urban migration was measured as yes if a person ever
migrated and no if a person never migrated. This was probed by asking the question “Did you ever
migrate to an urban dwelling?”
The differentials of migration status are presented in Table 4.2 below by demographic, socio-
economic and individual characteristics of the respondents. Differentials by age show that overall
migration increased with age. The majority of migrants belonged to the 31 years or older cohort
(40.9%), followed by those in the <14 year age cohort (25.9%) in 2001. Similarly, the majority of
migrants in 2011 were in the 31years or older age group which increased slightly to 53.5% while
the minority of migrants were in the <14 years age group, at 18.6%. Migration status was
significantly associated with age at p<0.001 in both datasets.
Surprisingly, females were more dominant than males in the rural-urban migration streams in
South Africa. Table 4.2 indicates that in 2001, 50.2% of females joined the rural-urban migration
compared to 49.8% of males. Similarly the same pattern was observed in 2011 when 50.1% and
49.9% of females and males respectively joined the rural-urban migration stream. Migration status
was also significantly associated with sex at p<0.001.
55
Empirical evidence suggests that most of the rural-urban migrants in South Africa are
Blacks/African followed by Whites while the Coloureds and Indian/Asians make up a much
smaller proportion of migrants. Table 4.2 shows that in 2001, 77.4% of Black/Africans migrated
compared to 11.6% of Whites and 2.3% of Indian/Asians. However, in 2011 both the
Black/African and White population groups had the same proportion of 42.5% rural-urban
migrants while Indian/Asian migrants increased to 6.5%. Migration status was significantly
associated with population group at p<0.001.
As expected, the majority of rural-urban migrants did not have disabilities. The proportion of rural-
urban migrants who did not have disabilities was 92.7% in 2001 and 76.5% in 2011. The migration
experience by disability in 2001 and 2011 suggests that the volume of migration by disability status
declined between 2001 and 2011. Migration status was significantly associated with disability
status at p<0.0001 over the 2001 and 2011 periods.
Differentials in migration by level of education and income status were also assessed. The data
presented in Table4.2 shows that in 2001, people with secondary education (40.3%) dominated the
rural-urban migration stream followed by those with primary education (29.0%). However, in
2011, migrants with secondary education increased to 46.7% and those with primary education
decreased to 16.2%. In addition, migrants with tertiary education increased from only 7.0% in
2001 to 23.1% in 2011. Furthermore, in 2001, 62.0% of migrants did not have any income
compared to 33.0% in 2011 which is an indication that increased income opportunities decreased
the migration rate in 2011.
The level of education and income were significantly associated with the migration status of
respondents at p<0.001 in 2001 and 2011. Additionally, an assessment of the effect of employment
56
status shows that in 2001, about 72.2% and 27.3% of migrants were unemployed and employed
respectively compared to 41.7% and 58.3% respectively in 2011. The results show that
employment status was significantly associated with migration status of respondents at p<0.001 in
2001 and 2011.
Regarding differentials in migration status by paternal and maternal survival, data in Table 4.2
show that 58% and 42% of migrants had surviving and dead fathers respectively, compared to
52.1% of migrants whose fathers had died and 47.9% of migrants whose mothers were alive in
2011. In addition, in 2001 and 2011, the majority of migrants (74.7% and 33.4% respectively)
comprised people whose mothers were alive. This finding suggests that unlike father’s survival,
migration was highly likely if a mother had died than if a father had died. Paternal and maternal
survival status were significantly associated with migration status of respondents at p<0.001 in
2001 and 2011.
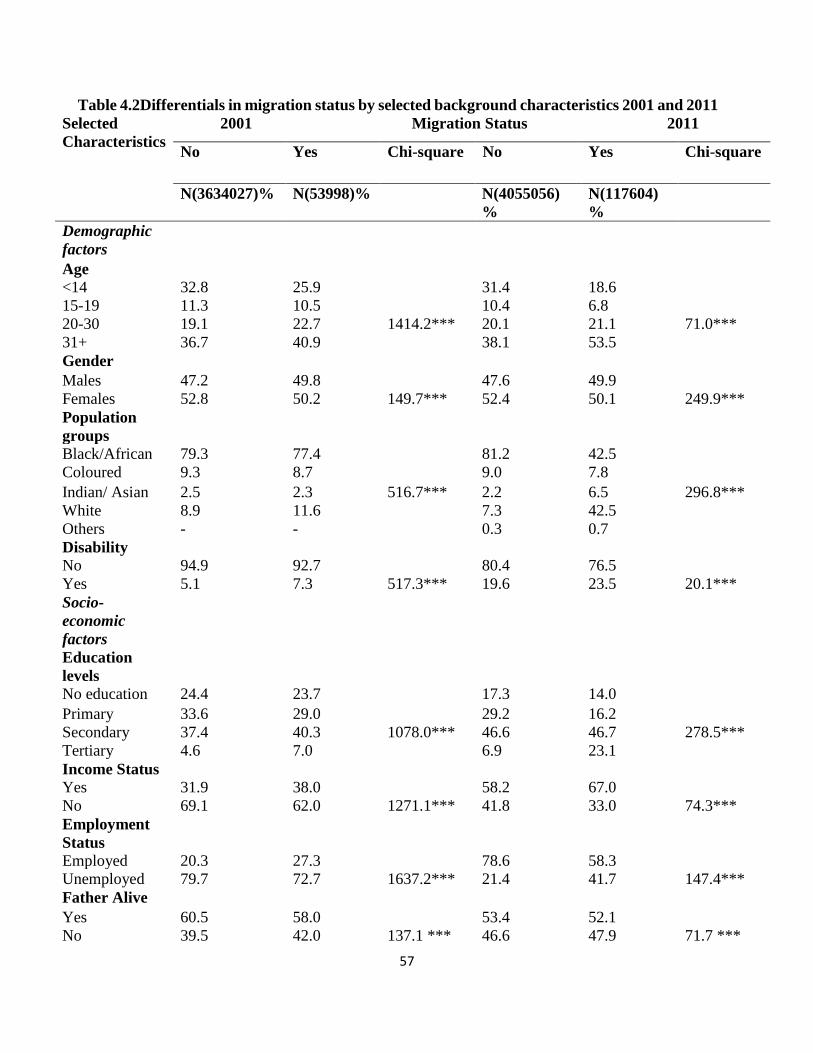
57
Table 4.2Differentials in migration status by selected background characteristics 2001 and 2011
Selected
Characteristics
2001 Migration Status 2011
No Yes Chi-square No Yes Chi-square
N(3634027)% N(53998)% N(4055056)
%
N(117604)
%
Demographic
factors
Age
<14 32.8 25.9 31.4 18.6
15-19 11.3 10.5 10.4 6.8
20-30 19.1 22.7 1414.2*** 20.1 21.1 71.0***
31+ 36.7 40.9 38.1 53.5
Gender
Males 47.2 49.8 47.6 49.9
Females 52.8 50.2 149.7*** 52.4 50.1 249.9***
Population
groups
Black/African 79.3 77.4 81.2 42.5
Coloured 9.3 8.7 9.0 7.8
Indian/ Asian 2.5 2.3 516.7*** 2.2 6.5 296.8***
White 8.9 11.6 7.3 42.5
Others - - 0.3 0.7
Disability
No 94.9 92.7 80.4 76.5
Yes 5.1 7.3 517.3*** 19.6 23.5 20.1***
Socio-
economic
factors
Education
levels
No education 24.4 23.7 17.3 14.0
Primary 33.6 29.0 29.2 16.2
Secondary 37.4 40.3 1078.0*** 46.6 46.7 278.5***
Tertiary 4.6 7.0 6.9 23.1
Income Status
Yes 31.9 38.0 58.2 67.0
No 69.1 62.0 1271.1*** 41.8 33.0 74.3***
Employment
Status
Employed 20.3 27.3 78.6 58.3
Unemployed 79.7 72.7 1637.2*** 21.4 41.7 147.4***
Father Alive
Yes 60.5 58.0 53.4 52.1
No 39.5 42.0 137.1 *** 46.6 47.9 71.7 ***
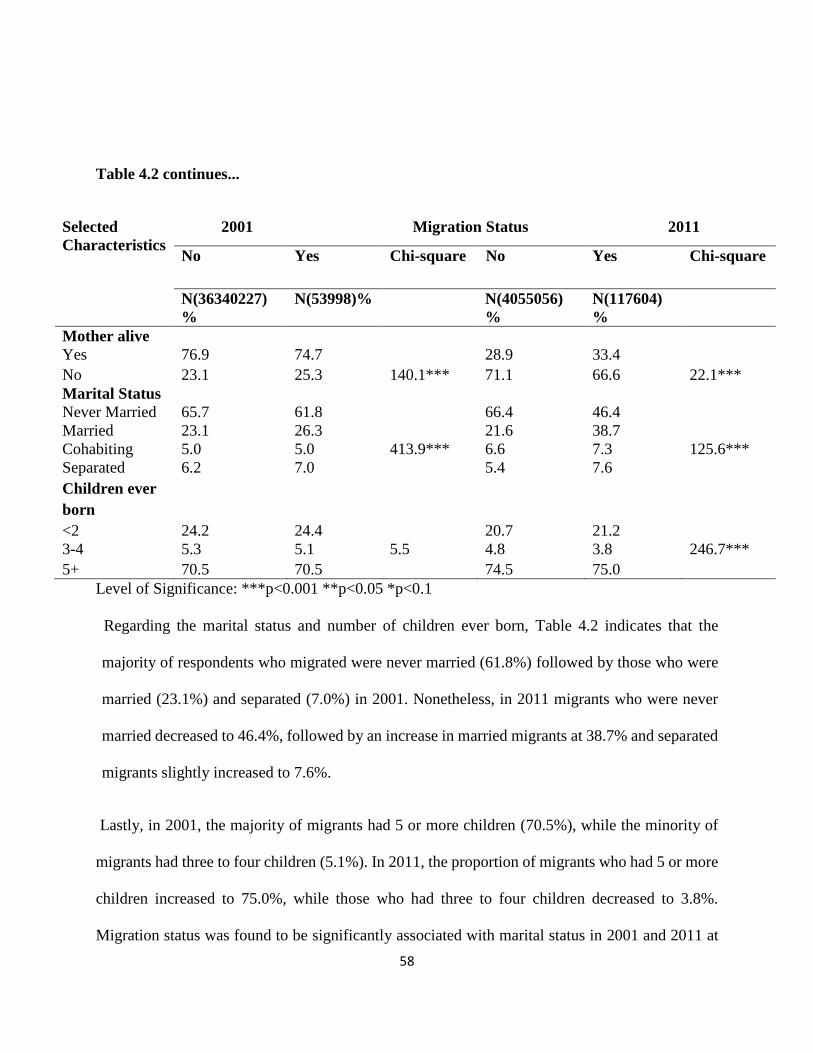
58
Table 4.2 continues...
Selected
Characteristics
2001 Migration Status 2011
No Yes Chi-square No Yes Chi-square
N(36340227)
%
N(53998)% N(4055056)
%
N(117604)
%
Mother alive
Yes 76.9 74.7 28.9 33.4
No 23.1 25.3 140.1*** 71.1 66.6 22.1***
Marital Status
Never Married 65.7 61.8 66.4 46.4
Married 23.1 26.3 21.6 38.7
Cohabiting 5.0 5.0 413.9*** 6.6 7.3 125.6***
Separated 6.2 7.0 5.4 7.6
Children ever
born
<2 24.2 24.4 20.7 21.2
3-4 5.3 5.1 5.5 4.8 3.8 246.7***
5+ 70.5 70.5 74.5 75.0
Level of Significance: ***p<0.001 **p<0.05 *p<0.1
Regarding the marital status and number of children ever born, Table 4.2 indicates that the
majority of respondents who migrated were never married (61.8%) followed by those who were
married (23.1%) and separated (7.0%) in 2001. Nonetheless, in 2011 migrants who were never
married decreased to 46.4%, followed by an increase in married migrants at 38.7% and separated
migrants slightly increased to 7.6%.
Lastly, in 2001, the majority of migrants had 5 or more children (70.5%), while the minority of
migrants had three to four children (5.1%). In 2011, the proportion of migrants who had 5 or more
children increased to 75.0%, while those who had three to four children decreased to 3.8%.
Migration status was found to be significantly associated with marital status in 2001 and 2011 at
59
p<0.001. On the contrary, children ever born were not statistically associated with migration status
in 2001, although children ever born were significantly associated with migration status p<0.001
in the year 2011.
4.4 Differentials in migration rate of the selected factors.
The differentials in migration rate of the selected factors are presented in Table 4.3. The table
shows that overall the South African rural-urban migration rate has increased from 2001 to 2011
in all the selected variables of the study.
Differentials by age show that overall migration increased with age. The migration rate of migrants
aged 31 years or more increased from 16.3 per 1000 in 2001 to 39.1 per 1000 in 2011, followed
by those in the 20-30 year age cohorts; their migration rate moved from 17.3 per 1000 in 2001 to
about 29.3 per 1000 in 2011.This overall increase in age differentials is due to the influx of young
people joining the migration stream.
Interestingly, migration rate of males was higher than females. In 2001,male’s migration rate was
15.5 and it increased to 29.5 per 1000 in 2011 as compared to their female counterparts whose
migration rate moved from 13.9 per 1000 to 27.0 per 1000 in 2011.
It was expected that for the South African rural-urban migration rate, the Black/African population
should be higher compared to other racial groups. However, that is not the case, as the White
population migration rate has increased extremely as compared to other population groups, from
19.9 per 1000 in 2001 to 144.5 per 1000 in 2011, followed by Indians/Asians whose migration rate
increased from 13.7 per 1000 in 2001 to 78.9 per 1000 in 2011.
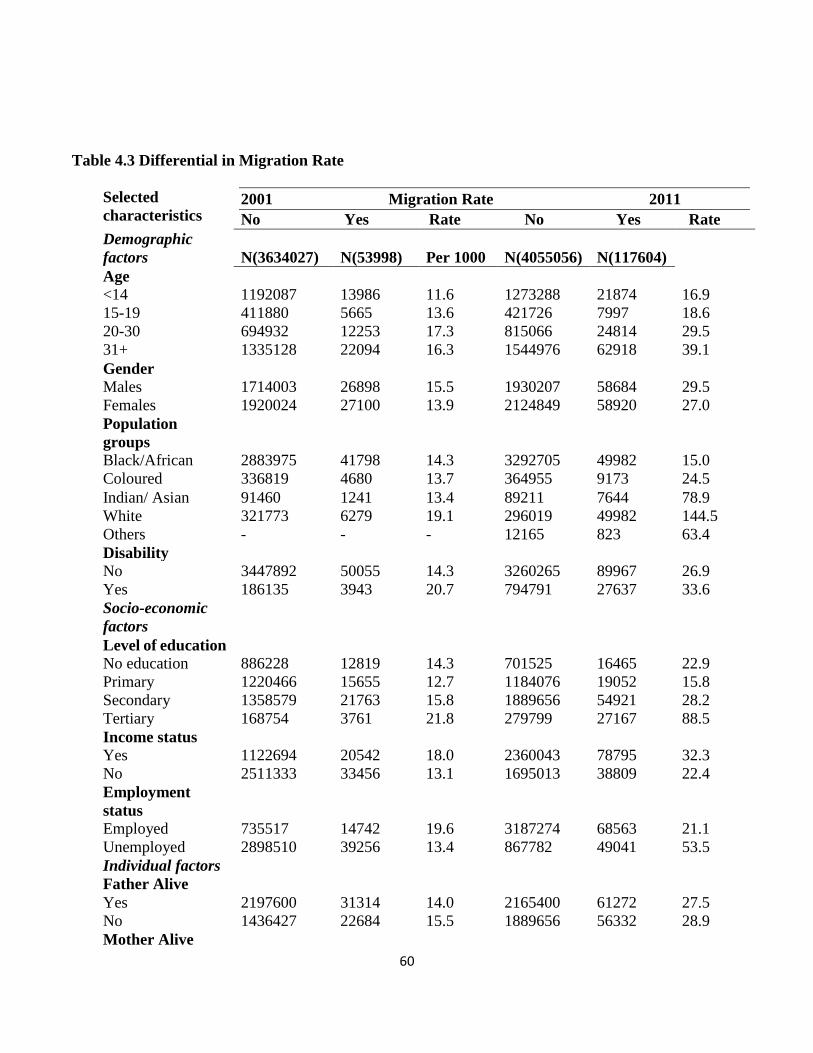
60
Table 4.3 Differential in Migration Rate
Selected
characteristics 2001 Migration Rate 2011
No Yes Rate No Yes Rate
Demographic
factors N(3634027) N(53998)
Per 1000
N(4055056)
N(117604)
Age
<14 1192087 13986 11.6 1273288 21874 16.9
15-19 411880 5665 13.6 421726 7997 18.6
20-30 694932 12253 17.3 815066 24814 29.5
31+ 1335128 22094 16.3 1544976 62918 39.1
Gender
Males 1714003 26898 15.5 1930207 58684 29.5
Females 1920024 27100 13.9 2124849 58920 27.0
Population
groups
Black/African 2883975 41798 14.3 3292705 49982 15.0
Coloured 336819 4680 13.7 364955 9173 24.5
Indian/ Asian 91460 1241 13.4 89211 7644 78.9
White 321773 6279 19.1 296019 49982 144.5
Others - - - 12165 823 63.4
Disability
No 3447892 50055 14.3 3260265 89967 26.9
Yes 186135 3943 20.7 794791 27637 33.6
Socio-economic
factors
Level of education
No education 886228 12819 14.3 701525 16465 22.9
Primary 1220466 15655 12.7 1184076 19052 15.8
Secondary 1358579 21763 15.8 1889656 54921 28.2
Tertiary 168754 3761 21.8 279799 27167 88.5
Income status
Yes 1122694 20542 18.0 2360043 78795 32.3
No 2511333 33456 13.1 1695013 38809 22.4
Employment
status
Employed 735517 14742 19.6 3187274 68563 21.1
Unemployed 2898510 39256 13.4 867782 49041 53.5
Individual factors
Father Alive
Yes 2197600 31314 14.0 2165400 61272 27.5
No 1436427 22684 15.5 1889656 56332 28.9
Mother Alive
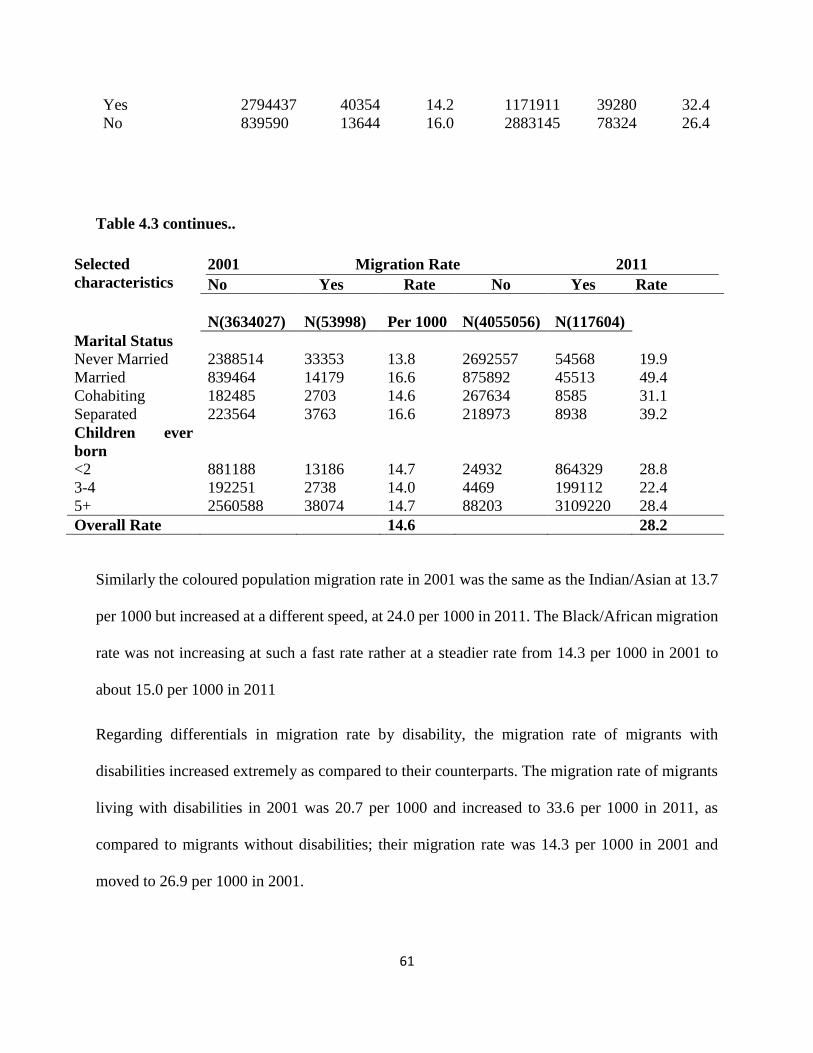
61
Yes 2794437 40354 14.2 1171911 39280 32.4
No 839590 13644 16.0 2883145 78324 26.4
Table 4.3 continues..
Selected
characteristics
2001 Migration Rate 2011
No Yes Rate No Yes Rate
N(3634027) N(53998)
Per 1000
N(4055056)
N(117604)
Marital Status
Never Married 2388514 33353 13.8 2692557 54568 19.9
Married 839464 14179 16.6 875892 45513 49.4
Cohabiting 182485 2703 14.6 267634 8585 31.1
Separated 223564 3763 16.6 218973 8938 39.2
Children ever
born
<2 881188 13186 14.7 24932 864329 28.8
3-4 192251 2738 14.0 4469 199112 22.4
5+ 2560588 38074 14.7 88203 3109220 28.4
Overall Rate 14.6 28.2
Similarly the coloured population migration rate in 2001 was the same as the Indian/Asian at 13.7
per 1000 but increased at a different speed, at 24.0 per 1000 in 2011. The Black/African migration
rate was not increasing at such a fast rate rather at a steadier rate from 14.3 per 1000 in 2001 to
about 15.0 per 1000 in 2011
Regarding differentials in migration rate by disability, the migration rate of migrants with
disabilities increased extremely as compared to their counterparts. The migration rate of migrants
living with disabilities in 2001 was 20.7 per 1000 and increased to 33.6 per 1000 in 2011, as
compared to migrants without disabilities; their migration rate was 14.3 per 1000 in 2001 and
moved to 26.9 per 1000 in 2001.
62
Regarding differentials in migration rate by level of education, Table 4.3 indicates that migration
rate increases with education attainment of respondents. Migration rate of migrants with tertiary
education increased from 21.8 per 1000 in 2001 to 88.5 per 1000 in 2011, followed by migrants
with secondary education, who moved from 15.8 per 1000 in 2001 to about 28.3 per 1000 in 2011.
Furthermore, for those with no education, their migration rate was higher than those with primary
education attainment.
Regarding differentials in migration rate by income status and employment status, Table 4.3 shows
that the migration rate of income earners was higher than their counterparts. For those with income,
their migration rate increased from 18.0 per 1000 in 2001 to 32.0 per1000 in 2001 when compared
to their counterparts who did not earn any income. Furthermore, as expected, the migration rate of
migrants who were unemployed is greater than those who are employed. In 2001, the migration
rate of unemployed migrants was less (13.4 per 1000) than those who are employed (19.6 per1000).
However, the migration rate of those who are employed increased at a slow pace (21.1 per 1000)
as compared to the unemployed (53.5 per 1000) in 2001.
Regarding differentials in migration rate by paternal and maternal survival, Table 4.3 shows that
for migrants whose fathers were alive, their migration rate was less (14.0 per 1000) as compared
to their counterparts at 15.5 per 1000 in 2001. However, in 2011 the migration rate of those whose
father was not alive increased to 28.9 per 1000 as compared to those with father alive at 27.5 per
1000. For migrants with surviving mothers, their migration rate increased from 14.2 per 1000 in
2001 to 32.4 per 1000in 2011 as compared to their counterparts.
Lastly, for differentials in migration rate by marital status and children ever born, Table 4.3
indicates that the migration rate of those married and separated are the same at 16.6 per 1000 in
2001.However, their migration rate increased differently, for instance, the rate of those who are
63
married increased to 49.9 per1000, while those who are separated increased to 39.2 per 1000in
2011. Additionally, regarding children ever born to migrants, the migration rate of all groups was
similar in 2001. However, in 2011, for migrants who had five or more children, their migration
rate increased from 14.7 per 1000 to 28.4 per 1000as compared to migrants with three or four
children, whose migration rate moved from 14.0 to 22.4 per 1000.
4.5 Predictors of rural-urban migration
Results for predictors of rural-urban migration are presented in Table 4.4. Based on the results,
in 2001, the age of the respondents was statistically significant in influencing rural-urban migration
in the country. For instance, in 2001 those that were aged 31 years or older were associated with
an increased likelihood (OR=1.07, 95%CI [1.04-1.09], p<0.001) of migrating to urban areas
compared to the reference group aged <14.On the contrary, the study found that those aged 15-19
(OR=0.71) and 20-31(OR=0.83) were significantly less likely to migrate compared to their
counterparts aged 14 and below. In 2011, the age groups 15-19 and 20-31 portrayed a different
picture compared to 2001 in that there was an increased likelihood to move to urban settings at
these ages. The study showed that migrants who were aged 31years or older were more likely
(OR=2.28, 95%CI [2.25-2.32], p<0.001) to transfer into urban areas compared to their counterparts
aged 14 years or lower. In respect to gender, in 2001, females were more likely to transfer to urban
areas at Odd Ratio of 1.12 compared to males (reference point). Conversely, it was found that
females were significantly more likely (OR=1.01, p<0.001) to move to urban areas than their male
counterparts in 2011.
Conversely, in 2001, the Coloured (OR=0.74, p<0.001), Indian/ Asian (OR=0.71, p<0.001) and
White (OR=0.70, p<0.001) populations were significantly less likely to migrate to urban areas as
64
compared to the Black/African (Reference point). Being Coloured, Indian/Asian and White were
significant predictors of rural-urban migration at p<0.001.On the contrary, for 2011 the study
found an inverse relationship on rural-urban migration by race. Coloureds were associated with
increased likelihood (OR=1.64, 95%CI [1.61-1.68], p<0.001) of migrating from rural-urban
settlement than their Black/African counterparts. On the same note, the study found that
Indians/Asians had a higher likelihood (OR=5.01, 95%CI {4.88-5.14}, p<0.001) of migrating than
Black/Africans. Furthermore, Whites were also significantly more likely to migrate (OR=11.22,
95%CI [11.08-11.37], p<0.001) than Black/Africans.
Table 4.4 also presents the effects of disability status and level of education on migration showing
that although persons with disability (OR=0.69, 95%CI [0.66-0.71], p<0.001), tertiary education
(OR=0.71, 95%CI [0.69-0.74], p<0.001), primary education (OR=0.65, 95% CI [0.63-0.67],
p<0.001) and with secondary education were significant less likely (OR=0.58, 95% CI [0.55-0.60],
p<0.001) to have migrated in 2001, those with disability were significantly more likely to have
migrated (OR=1.25, 95%CI [1.20-1.28], p<0.001) in 2011. The table also shows that those with
secondary level education (OR=1.25, 95% CI [1.24-1.27], p<0.001) and tertiary education have
significantly more likelihood (OR=4.36, 95%CI [4.55-4.45], p<0.001) to have migrated in 2011,
but those with primary education were less likely (OR= 0.70, p<0.001) to have migrated in 2011.
The respondents were also significantly less likely to have migrated in 2001 if they received an
income (OR=0.73, 95%CI {0.72-0.74}, p<0.001); if their fathers were dead (OR=0.90, 95%CI
[0.89-0.92], p<0.001); if their mothers were dead (OR=0.83, 95%CI [0.87-0.91], p<0.001); and if
they were separated (OR=0.88, 95%CI [0.84-0.93], p<0.001), married (OR=0.83, 95%CI [0.80-
0.85], p<0.001) or cohabiting (OR=1.00, 95% CI [0.97-1.04], p<0.001) in 2001. The respondents
were also significantly less likely to have migrated in 2011 if their fathers had died (OR=0.95,
65
95%CI [0.94-0.96], p<0.001) and if their mothers had died (OR=0.03, 95%CI [0.03-0.03],
p<0.001). Furthermore, respondents with five or more children were significantly less likely
(OR=0.96, 95% CI [0.92-1.00], p<0.05) to have migrated in 2001. A similar result was observed
for 2011 (OR=0.98, 95%CI [1.00-1.00], p<0.001) for respondents with five or more children and
three or four children (OR=0.78, 95%CI [0.75-0.80], p<0.001).
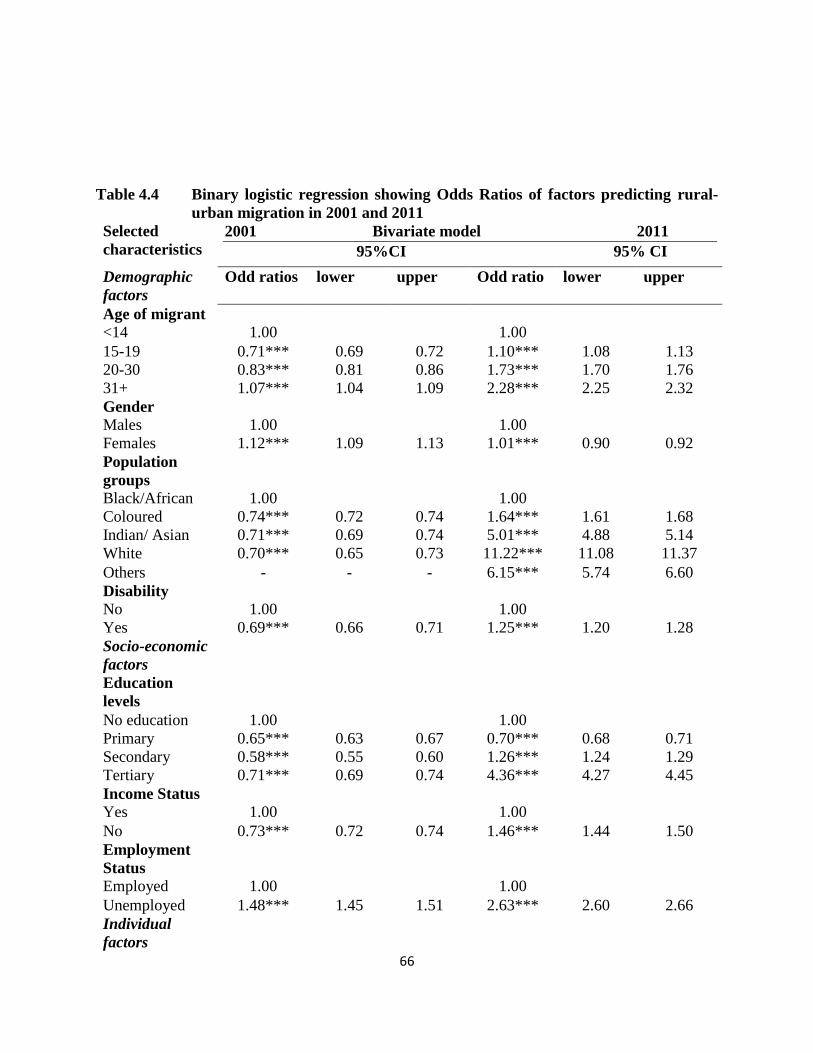
66
Table 4.4 Binary logistic regression showing Odds Ratios of factors predicting rural-
urban migration in 2001 and 2011
Selected
characteristics
2001 Bivariate model 2011
95%CI 95% CI
Demographic
factors
Odd ratios lower upper Odd ratio lower upper
Age of migrant
<14 1.00 1.00
15-19 0.71*** 0.69 0.72 1.10*** 1.08 1.13
20-30 0.83*** 0.81 0.86 1.73*** 1.70 1.76
31+ 1.07*** 1.04 1.09 2.28*** 2.25 2.32
Gender
Males 1.00 1.00
Females 1.12*** 1.09 1.13 1.01*** 0.90 0.92
Population
groups
Black/African 1.00 1.00
Coloured 0.74*** 0.72 0.74 1.64*** 1.61 1.68
Indian/ Asian 0.71*** 0.69 0.74 5.01*** 4.88 5.14
White 0.70*** 0.65 0.73 11.22*** 11.08 11.37
Others - - - 6.15*** 5.74 6.60
Disability
No 1.00 1.00
Yes 0.69*** 0.66 0.71 1.25*** 1.20 1.28
Socio-economic
factors
Education
levels
No education 1.00 1.00
Primary 0.65*** 0.63 0.67 0.70*** 0.68 0.71
Secondary 0.58*** 0.55 0.60 1.26*** 1.24 1.29
Tertiary 0.71*** 0.69 0.74 4.36*** 4.27 4.45
Income Status
Yes 1.00 1.00
No 0.73*** 0.72 0.74 1.46*** 1.44 1.50
Employment
Status
Employed 1.00 1.00
Unemployed 1.48*** 1.45 1.51 2.63*** 2.60 2.66
Individual
factors
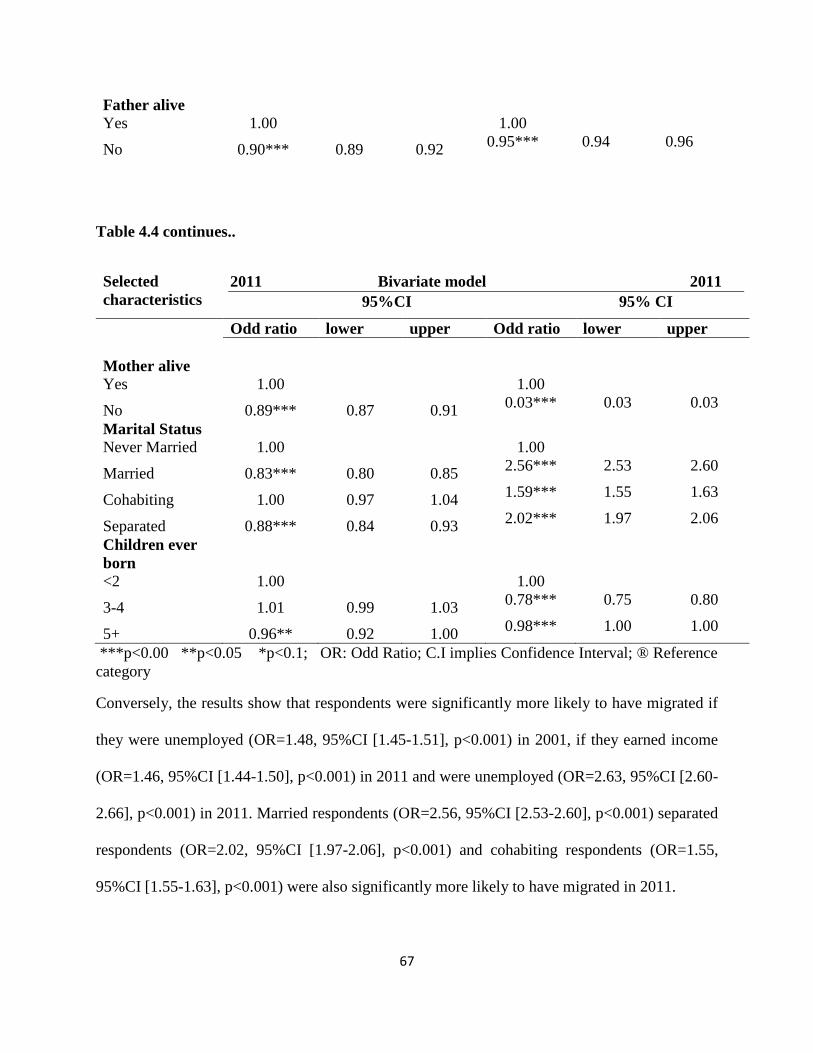
67
Father alive
Yes 1.00 1.00
No 0.90*** 0.89 0.92 0.95*** 0.94 0.96
Table 4.4 continues..
Selected
characteristics
2011 Bivariate model 2011
95%CI 95% CI
Odd ratio lower upper Odd ratio lower upper
Mother alive
Yes 1.00 1.00
No 0.89*** 0.87 0.91 0.03*** 0.03 0.03
Marital Status
Never Married 1.00 1.00
Married 0.83*** 0.80 0.85 2.56*** 2.53 2.60
Cohabiting 1.00 0.97 1.04 1.59*** 1.55 1.63
Separated 0.88*** 0.84 0.93 2.02*** 1.97 2.06
Children ever
born
<2 1.00 1.00
3-4 1.01 0.99 1.03 0.78*** 0.75 0.80
5+ 0.96** 0.92 1.00 0.98*** 1.00 1.00
***p<0.00 **p<0.05 *p<0.1; OR: Odd Ratio; C.I implies Confidence Interval; ® Reference
category
Conversely, the results show that respondents were significantly more likely to have migrated if
they were unemployed (OR=1.48, 95%CI [1.45-1.51], p<0.001) in 2001, if they earned income
(OR=1.46, 95%CI [1.44-1.50], p<0.001) in 2011 and were unemployed (OR=2.63, 95%CI [2.60-
2.66], p<0.001) in 2011. Married respondents (OR=2.56, 95%CI [2.53-2.60], p<0.001) separated
respondents (OR=2.02, 95%CI [1.97-2.06], p<0.001) and cohabiting respondents (OR=1.55,
95%CI [1.55-1.63], p<0.001) were also significantly more likely to have migrated in 2011.
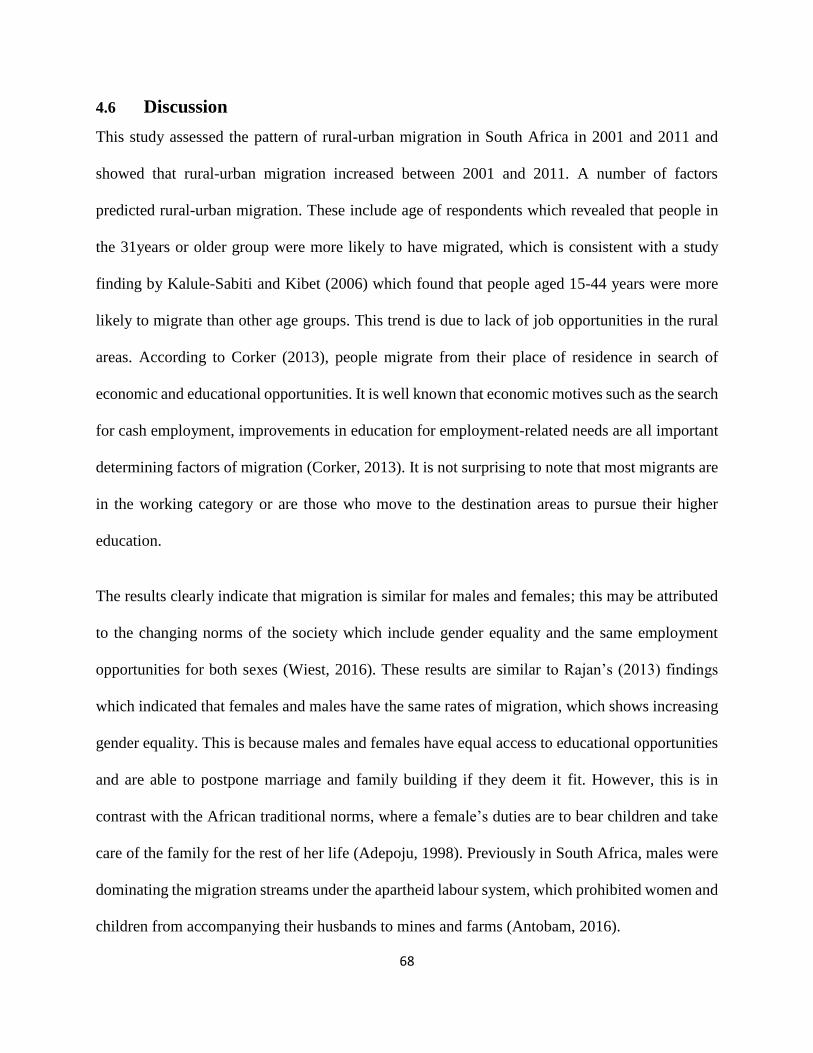
68
4.6 Discussion
This study assessed the pattern of rural-urban migration in South Africa in 2001 and 2011 and
showed that rural-urban migration increased between 2001 and 2011. A number of factors
predicted rural-urban migration. These include age of respondents which revealed that people in
the 31years or older group were more likely to have migrated, which is consistent with a study
finding by Kalule-Sabiti and Kibet (2006) which found that people aged 15-44 years were more
likely to migrate than other age groups. This trend is due to lack of job opportunities in the rural
areas. According to Corker (2013), people migrate from their place of residence in search of
economic and educational opportunities. It is well known that economic motives such as the search
for cash employment, improvements in education for employment-related needs are all important
determining factors of migration (Corker, 2013). It is not surprising to note that most migrants are
in the working category or are those who move to the destination areas to pursue their higher
education.
The results clearly indicate that migration is similar for males and females; this may be attributed
to the changing norms of the society which include gender equality and the same employment
opportunities for both sexes (Wiest, 2016). These results are similar to Rajan’s (2013) findings
which indicated that females and males have the same rates of migration, which shows increasing
gender equality. This is because males and females have equal access to educational opportunities
and are able to postpone marriage and family building if they deem it fit. However, this is in
contrast with the African traditional norms, where a female’s duties are to bear children and take
care of the family for the rest of her life (Adepoju, 1998). Previously in South Africa, males were
dominating the migration streams under the apartheid labour system, which prohibited women and
children from accompanying their husbands to mines and farms (Antobam, 2016).
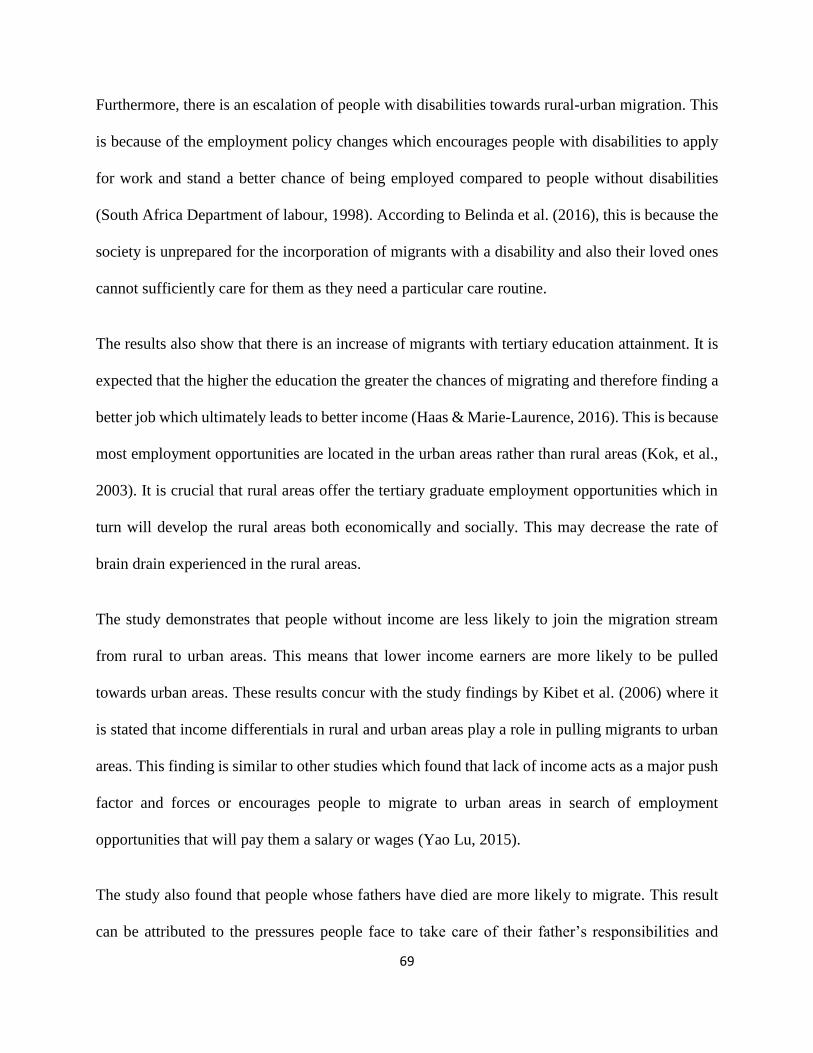
69
Furthermore, there is an escalation of people with disabilities towards rural-urban migration. This
is because of the employment policy changes which encourages people with disabilities to apply
for work and stand a better chance of being employed compared to people without disabilities
(South Africa Department of labour, 1998). According to Belinda et al. (2016), this is because the
society is unprepared for the incorporation of migrants with a disability and also their loved ones
cannot sufficiently care for them as they need a particular care routine.
The results also show that there is an increase of migrants with tertiary education attainment. It is
expected that the higher the education the greater the chances of migrating and therefore finding a
better job which ultimately leads to better income (Haas & Marie-Laurence, 2016). This is because
most employment opportunities are located in the urban areas rather than rural areas (Kok, et al.,
2003). It is crucial that rural areas offer the tertiary graduate employment opportunities which in
turn will develop the rural areas both economically and socially. This may decrease the rate of
brain drain experienced in the rural areas.
The study demonstrates that people without income are less likely to join the migration stream
from rural to urban areas. This means that lower income earners are more likely to be pulled
towards urban areas. These results concur with the study findings by Kibet et al. (2006) where it
is stated that income differentials in rural and urban areas play a role in pulling migrants to urban
areas. This finding is similar to other studies which found that lack of income acts as a major push
factor and forces or encourages people to migrate to urban areas in search of employment
opportunities that will pay them a salary or wages (Yao Lu, 2015).
The study also found that people whose fathers have died are more likely to migrate. This result
can be attributed to the pressures people face to take care of their father’s responsibilities and
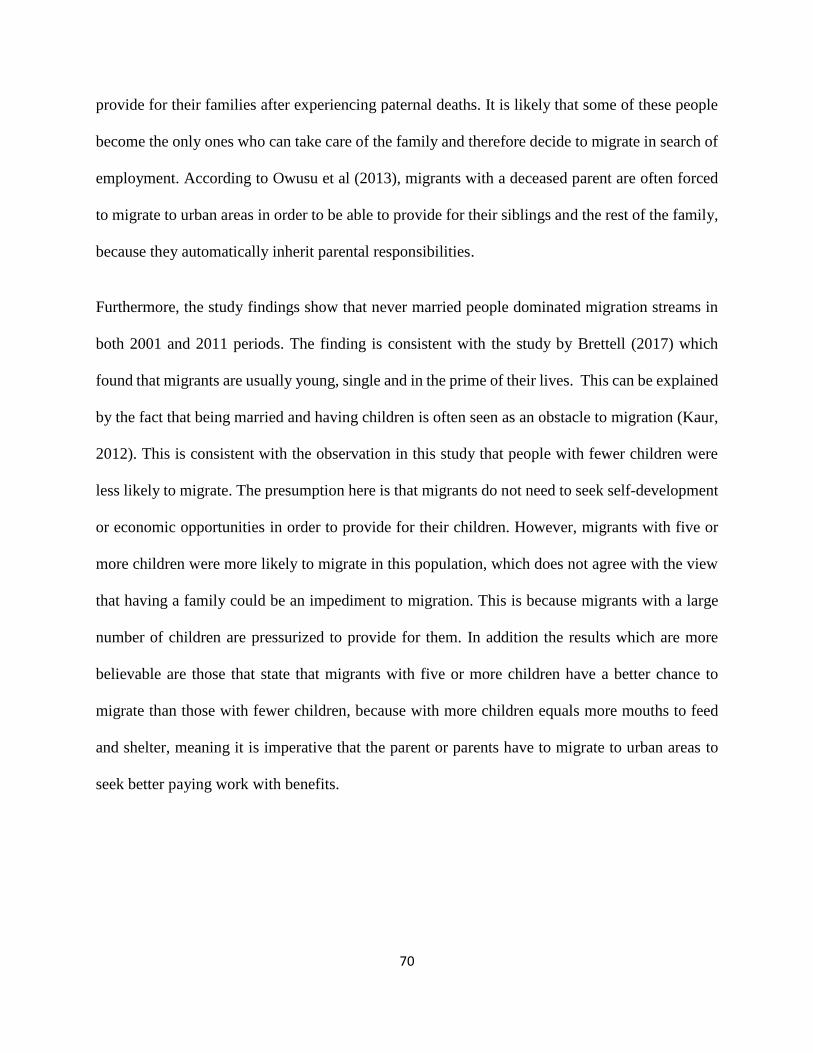
70
provide for their families after experiencing paternal deaths. It is likely that some of these people
become the only ones who can take care of the family and therefore decide to migrate in search of
employment. According to Owusu et al (2013), migrants with a deceased parent are often forced
to migrate to urban areas in order to be able to provide for their siblings and the rest of the family,
because they automatically inherit parental responsibilities.
Furthermore, the study findings show that never married people dominated migration streams in
both 2001 and 2011 periods. The finding is consistent with the study by Brettell (2017) which
found that migrants are usually young, single and in the prime of their lives. This can be explained
by the fact that being married and having children is often seen as an obstacle to migration (Kaur,
2012). This is consistent with the observation in this study that people with fewer children were
less likely to migrate. The presumption here is that migrants do not need to seek self-development
or economic opportunities in order to provide for their children. However, migrants with five or
more children were more likely to migrate in this population, which does not agree with the view
that having a family could be an impediment to migration. This is because migrants with a large
number of children are pressurized to provide for them. In addition the results which are more
believable are those that state that migrants with five or more children have a better chance to
migrate than those with fewer children, because with more children equals more mouths to feed
and shelter, meaning it is imperative that the parent or parents have to migrate to urban areas to
seek better paying work with benefits.
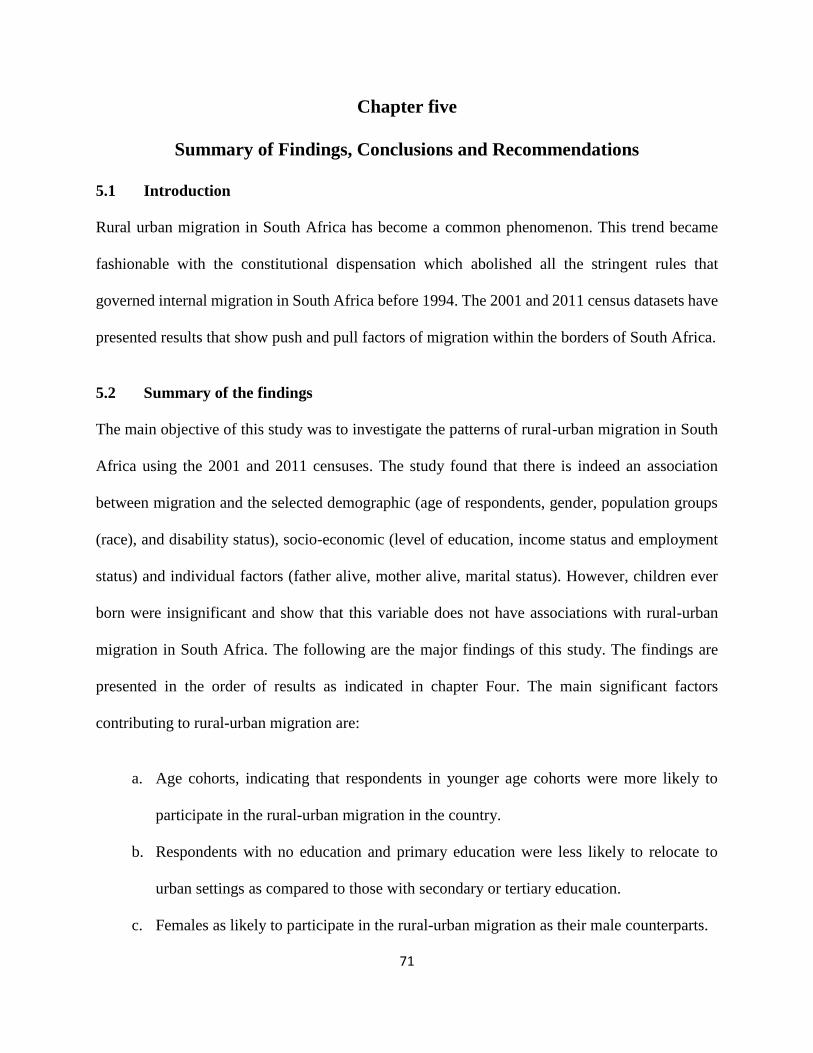
71
Chapter five
Summary of Findings, Conclusions and Recommendations
5.1 Introduction
Rural urban migration in South Africa has become a common phenomenon. This trend became
fashionable with the constitutional dispensation which abolished all the stringent rules that
governed internal migration in South Africa before 1994. The 2001 and 2011 census datasets have
presented results that show push and pull factors of migration within the borders of South Africa.
5.2 Summary of the findings
The main objective of this study was to investigate the patterns of rural-urban migration in South
Africa using the 2001 and 2011 censuses. The study found that there is indeed an association
between migration and the selected demographic (age of respondents, gender, population groups
(race), and disability status), socio-economic (level of education, income status and employment
status) and individual factors (father alive, mother alive, marital status). However, children ever
born were insignificant and show that this variable does not have associations with rural-urban
migration in South Africa. The following are the major findings of this study. The findings are
presented in the order of results as indicated in chapter Four. The main significant factors
contributing to rural-urban migration are:
a. Age cohorts, indicating that respondents in younger age cohorts were more likely to
participate in the rural-urban migration in the country.
b. Respondents with no education and primary education were less likely to relocate to
urban settings as compared to those with secondary or tertiary education.
c. Females as likely to participate in the rural-urban migration as their male counterparts.
72
d. The rate of participation in rural-urban migration of people living with disabilities
increased throughout the 10 year period and high numbers of them are relocating to urban
areas.
e. Migrants with both parents alive were more likely to move from rural areas to urban areas
compared to those with deceased parents.
f. Respondents who are unemployed and those who were not earning any income were
more likely to participate in rural-urban migration.
5.3 Conclusion
From the results of the study, it can be concluded that rural-urban migration has been an important
process in South Africa over the study period in terms of its influence on the population dynamics
and resource distribution. It also shows that since the end of apartheid, rural-urban migration has
become a very significant process in factors such as population redistribution in South Africa. The
results also show that, as is the case elsewhere, rural-urban migrants in South Africa are young,
educated, largely unemployed and never married. Migrants with the above characteristics pose
serious social and security challenges in the urban areas of destination. Their predominance in the
Southern African migration stream could explain the increasing level of violence and other crimes
in urban areas of South Africa. The large number of young, unemployed, never married and
educated rural out-migrants could be explained by the high level of unemployment in rural areas;
lack of opportunities for good education and improved services in rural areas; and dysfunctional
family structures which have become a major feature of South Africa’s family institutions.
However, migrating to urban areas has its own costs. These include lack of integration mechanisms
in urban areas leading to the upsurge in violent crimes; isolation and emotional depression leading
73
to drug abuse; and urban destitution and prostitution due to lack of income in rural areas leading
to the spread of sexually transmitted infections including HIV and AIDS among migrant
communities.
5.4 Recommendations
Given the above findings of the study, the following are recommended in order to reduce rural-
urban migration streams and change the characteristics of migrants as well as to provide for the
wellbeing of migrants in places of destination.
a) This study has demonstrated that most migrants are the youth. It is imperative that the National
Youth Policy which is more able to address the needs of this vulnerable population is in place.
The policy should, among other things, address the serious level of unemployment in rural
areas and provision of vital services such as education, sports and recreation facilities and other
social services in rural areas and be able implement those services.
b) Due to the equal nature of female and male rural-urban migration, it is suggested or
recommended that the government should ensure and provide adequate and equal access for
women to basic needs in the places of destination in regard to employment opportunities,
education, shelter and other basic services. It is imperative that women know their rights and
have information about violence against them, whether sexual or gender-based violence and
address violence in all forms aggressively.
c) The rural-urban migration of people with disabilities has been increasing for the last 10 years,
disability facilities in the urban areas need to be upgraded in order to ensure that persons with
disabilities in urban areas become properly integrated and functional.
d) There is a need to implement policies that will check the welfare of children as they are
migrating to other provinces as a result of their parents’ migration. This policy is to assist in
74
solving problems that children are subjected to such as child labour, child trafficking and all
sorts of abuse in the receiving destination.
e) With the high awareness of the importance of education to the people, rural areas only offer
primary and secondary education facilities, whereas urban areas offer colleges (FET) and
universities; this situation encourages students to migrate to urban areas in order to be enrolled
in higher education facilities. These students find it difficult to return to rural areas due to
unemployment. Therefore, it is recommended that higher educational institutions be developed
in the rural areas to check the outflow of students from rural areas. It is also recommended that
government and the non-government organizations offer students paid vocational placements
in rural areas immediately after the completion of their studies.
References
Adepoju, A., 1998. Linkages between internal and international migration: the African situation..
Published in selected articles initially published in 1984 to commemorate the 50th Anniversary of
International Social Science Journal, UNESCO, Paris.
Afsar, R., 2000. Rural-Urban Migration in Bangladesh: Causes,Consequences and Challenges.
Dhaka.: University Press Limited.
75
Agensa, R., 2011. Rural to urban migration as household decision evidence from Kenya.. Review
of Development Economics.
Alley, G. R., 1996. “Elderly Migration: An Analysis of Push and Pull Factors”. New York:
University Press.
Antobam, S., 2016. Migration,Urbanisation and Development in South Africa. Social Developmet
of South Africa: Advances and Emerging Issues, pp. 117-143.
Atnafu, A., Oucho, L. & Zeitlyn, B., 2014. Poverty,youth and rural-urban migration in Ethiopia.
Migrating out of Poverty, pp. 1-23.
Awumbaii, M., Alhassan, O. & Badasu, M. D., 2011. Socio-Cultural Dimensions of Migration in
Ghana. Ghana: Woeli Publishing Services.
Bennett, R., Hosegood,V., Newell, M.-L. & McGrath, N., 2015. Understanding Family Migration
in Rural South Africa: Exploring Children’s Inclusion in the Destination Households of Migrant
Parents. POPULATION, SPACE AND PLACE, 21(1), pp. 310-321.
Boure, O., 2001. Determinants of internal migration in South Africa..In Southern African Journal
of Demography. ISSN:1682448.Population Association of Southern Africa, pp. 23-28..
Brettell, C. B., 2017. Marriage and Migration. Annual Review of Anthropology Vol. 46:- (Volume
publication date November 2017) .
Bull-Kamanga, L., 2003. Urban development and the accumulation of disaster risk and other life-
threatening risks in Africa, Environment and Urbanization, vol. 15, No. 1. p. 93–204.
Bureau, U. C., 1985. Evaluating Census of the Population and Housing. Washington DC: Bureau
of the Census.
Burns, N. & Grove, S., 2001. The practice of nursing research:Conduct, critique and utilization
(4th ed). W.B.Saunders. USA: Philadelphia, Pennsylvania.
Caldwell, J., 1969. African Rural-Urban Migration: The movement to Ghana's Town Cambera.
Canberra: Australian National University Press.
76
Cebotari, V., Valentina , M. & Siegel, M., 2016. Child development and migrant transnationalism:
the health of children who stay behind in Ghana and Nigeria. Journal of Development Studies,,
53(3).
Chort, I., 2014. Mexican migration to the U.S A: What do unrealised migration intentions tell us
about gender equality?. World Development Australian National U.P, 59(1), pp. 535-552.
Chowdhury, A., Aziz & Stoeckel, K. J., 1972. Out Migration from a Rural Areas of Bangladesh̕,.
Rural Society vol. 37, no. 2..
Claire, B., Craig , H.-S. & Ashraf, K., 2013. Fundamentals of Social Research Methods: An
African perspective. 5th edition. Cape Town: Juta & Company LTD.
Cleveland, D., 1991. Migration in West Africa: A Savanna Village. Perspective Africa, 61. pp. ,
222-46..
Collinson, M., 2007. Migration, settlement change and health and post-apartheid South Africa:
Triangulating health and demographic surveillance with national census data. Scandinavian
Journal of Public Heath.
Collinson, M., Kok, P. & Mark, P., 2006. Migration and urbanization in South Africa. Pretoria:
Statistics South Africa.
Corker, J., 2013. Internal migration to Kinshasa 1970-2007:Investigating migrant characteristics
in times of insecurity and economic crises. Busan, South Korea, IUSSP, p. 26.
Cris Beauchemin, P. S., Bruno, S. & Marie-Laurence, F., 2014. New patterns of migration between
Senegal and Europe. migration between Africa and Europe, pp. 1-33.
Crivello, G., 2011. Becoming somebody: youth transitions through education and migration in
Peru. Journal of youth studies, 14(4), pp. 395-411.
Department of Rural Development, 1998. Department of RuralDevelopment and Land Reform
framework policy. Pretoria: Department of Rural Development.
Evans, I., 1997. Bureaucracy and Race. Berkeley: University of California.
Funnah, T. P., 2001. The Socio-economic and demographic characteristics of rural-urban youth
migration in the North West Province of South Africa. Mahikeng: North West university.
77
Gelderblom, G. & Kok, P., 1994. Urbanization: South Africa's Challenges,Vol.1:Dynamics.
Pretoria: HSRC.
Gross, S., Chew, C. & Matthias, 2009. Shrinking Cities: Causes and Effects of Urban Population
Losses in the Twentieth Century. Nature and Culture, p. 231–254.
Gugler, J., 2004. World Cities Beyond the West, Globalization, Development and Inequality..
Cambridge: Cambridge University Press.
Haas, H. D. & Marie-Laurence, F., 2016. African migration: trends, patterns, drivers. Comparative
Migration Studies. a Springer open Journal.
Hall, K., 2010. "Migrant mothers and mobile children: New possibilities for exploring child
poverty dynamics in South Africa. Johannesburg,South Africa., University Press.
Hall, K. & Posel, . D., 2012. Inequalities in children’s house-hold contexts: place, parental
presence and migration.. Cape Town: University Cape Town.
Harris , J. R. & Todaro, M. P., 1970. Migration, Unemployment and Development: A Two-sector
Analysis. The American Economic Review, vol. 60, no. 1, pp. 126-38..
Hatton, T. J. & Williamson, J. G., 1998. The Age of Mass Migration Causes and Economic Impact.
Oxford: Oxford University press.
Haub, C., 2013. Trends in adolescent fertility: A mixed picture.. [Online]
Available at: http://www.prb.org/Publications/Articles/2013/adolescent-fertility.aspx
[Accessed 29 April 2017].
Hina, K., Tanveer , A. N. & Muhammand, A. K., 2015. Socio-economic determinates of rural-
urban migration in Pakistan. J.Asian Dev, 4(3), pp. 1-14.
Hosmer, D. W. & Lameshow, S., 2000. Applied logistic regression. 2nd edition.. s.l.:Wiley.
Hossain, K., 2003. Male involvement in family planning in Bangladesh: factors constraining low
use and the potential for augmenting the CPR. Bangladesh: Centre for Policy Dialogue.
Isiugo-Abanihe & Uche , C., 2014. Migration in Nigeria:A Country Profile 2014, s.l.: International
Organization for Migration.
78
Johnnie, P. B., 1988. Rural-urban migration in Nigeria: Consequences on housing, health-care and
employment.Migr World Mag., pp. 22-9..
Kalule-Sabiti, I. & Kibet, M., 2006. Youth Migration and Poverty. Journal of Youth Development,
Vol. 2, pp. 37-48.
Kaur, R., 2012. Marriage and Migration: Citizenship and Marital Experience in Cross-border
Marriages between Uttar Pradesh, West Bengal and Bangladesh. REVIEW OF WOMEN’S
STUDIES vol xlvii no 43, pp. 78-89.
Kennan, J. & Walker, R. J., 2011. The effects of expected income of individual migration decisons.
Econometrica. Journal of the econometric society: An international society for the advancement
of economic theory in its relation to statistics and mathematics, Vol 79(No 1), pp. 211-251.
Kenya National Bureau of Statistics, 2015. KNBS. [Online]
Available at: http://www.knbs.or.ke/
[Accessed 24 November 2016].
Kibet, M., 2013. Migration into Rustenburg local municipality between 1996 and 2001.. Journal
of Social Development in Africa, pp. 65-85.
Kimani, N., 2016. Brain Drain: Can Africa keep its best and brightest?. Daily Maverick, 09 May.
Kok, P. & Collinson , M., 2006. "Migration and urbanisation in South Africa". Report 03-04-02,
Pretoria: Statistics South Africa..
Kok, P. O., Donovan, M., Boure, O. & Van Zyl, J., 2003. Post Apartherid Patterns of internal
Migration in South Africa. Pretoria: Human Sciences Research Council.
Konsiega, A., Zulu, E. M. & Ye, Y., 2006. Assessing the Effect of Mother's Migration on
Childhood Mortality in the Informal Settlements of Nairobi, s.l.: s.n.
Kpedekpo, 1982. Essentials of Demographic Analysis for Africa. London: Heinemann educational
books Ltd.
Kritz , M. M. & Gurak, D. T., 2015. U.S. Immigrants in Dispersed and Traditional Settlements:
National Origin Heterogeneity. International Migration Review, 49(1), pp. 106-141.
79
Landau, L. B., 2012. Changing Local Government Responses to Migration in South Africa. Die
Erde. Journal of Geographical society of Berlin Vol 143, No 3.
Lee, E., 1966. Lee, E. "Theory of Migration" in M. Kefyfitz (ed), Demography, Vol.3 ,No.1..
America: A publication asociation of America .
Makgoro, Y., 1997. "Ubuntu and the Law in South Africa" in Colloquium Constitution and Law.
Potchefstroom: University Press.
Mckay, A. & Boakye, L.-Y., 2006. Migration Between Ghana's Rural and Urban Areas:The
Impact on Migrants. Welfare. United Kingdom: University of Bath.
Menard, S., 2002. Applied logistic regression. 2nd edition.Pretoria: SAGE..
Nigeria National Bureau of Statistics, 2016. Gross Domestic Product (GDP) Report. Abuja –
Nigeria: National Bureau of Statistics.
Nobles, J., 2013. Migration and Father Absence: Shifting Family Structure in Mexico. HHS Public
Access , Author Manuscript.
Nunn, C., McMichael, C., Gifford, S. M. & Correa-Velez, I., 2014. ‘I came to this country for a
better life’: factors mediating employment trajectories among young people who migrated to
Australia as refugees during adolescence. Journal of youth studies, 17(9), pp. 1205-1220.
Onokala, C. K., Ajaero & Paience, C., 2013. The Effects of Rural-Urban Migration on Rural
Communities of Southeastern Nigeria. International Journal of Population Research Volume 2013
(2013), Article ID 610193, 10 pages, p. 10.
Owusu, S. A., Adaawen & Boabang, December 2013. North-South Migration and Remittances in
Ghana. African Review of Economics and Finance, Vol. 5, No.1,, pp. 29-45.
Posel, D., 2003. "The Collection of National Household Survey Data in South Africa (1993-1999):
Rendering Labour Migration Invisible".. Development Southern Africa, p. 361 – 368..
Posel, D. & Casale, D., 2003. "What has been Happening to Internal Labour Migration. in South
Africa, 1993 – 1999?" The South African Journal of Economics 71(3), p. 455 –479.
80
Posel, D. & Casale, D., 2006. "Internal migration and household poverty in post-apartheid South
Africa". In Poverty and Policy in Post-Apartheid South Africa. Pretoria: Human Sciences Research
Council Press.
Ravenstein, E. G., 1889. The Laws of Migration. Journal of the Royal Statistical Society, pp. 241-
305.
Reza, C. D., Partridge, A., Kekana, D. & Musundwa, S., 2013. Rural Livelihoods in South Africa:
Saldru Working Paper 122.NIDS Discussion Paper 2013/4, Cape Town: SALDRU, University of
Cape Town.
SAnews.gov, 2017. Brand South Africa. [Online]
Available at: https://www.brandsouthafrica.com/governance/government/iudf-270515
Shumate, M. & Palazzolo, E. T., 2010. Exponential random graph (p*) models as a method for
social network analysis in communication research.. Communication Methods and Measures,
4(4):, pp. 341-371..
Silverstein, . A. P., 2005. IMMIGRANT RACIALIZATION AND THE NEW SAVAGE SLOT:
Race, Migration, and mmigration in the New Europe. Annual Review of Anthropology, Volume
Vol. 34:363-384.
Somik, V. L., Harris, S. & Zmarak, S., 2006. Rural-Urban Migration in Developing Countries:
ASurvey of Theoretical Predictions and Empirical Findings. World Bank Policy Research Working
Paper No. 3915, p. 63.
South Africa Department of Labour, 1998. Technical Assistance Guidelines on the Employment of
People with Disabilities, Pretoria: Department of Labour Chief Directorate of Communication.
South Africa Statistics, 2012. Census 2011 Provinces at a glance / Statistics South Africa, Pretoria:
Statistics South Africa.
South African Government, 2012. South African Government. [Online]
Available at: http://www.gov.za/issues/national-development-plan-2030
[Accessed 3 November 2016].
Stats SA, 2006. Migration and Changing Settlement Patterns: Reports no.03-04-01(2006),
Pretoria: Statistic South Africa.
81
Swanson & Dalene, M., 2007. Ubuntu: An African contribution to (re)search for/with a‘humble
togetherness’. Journal of Contemporary Issues in Education, pp. 53-67.
Thet, K.-K., 2014. Pull and Push Factors of Migration: A Case Study in the Urban Area of Monywa
Township, Myanmar,. News from the world statistic , 1(4), pp. 1-7.
Todara, M. P., 1969. A model of labour migration and urban unemployment in less developed
countries.. The American Economic Review, vol. 59, pp. 138-148..
Todara, M. & Smith, P., 2003. Economic Development, eighth edition. 11th ed. New York:
Addison Wesley.
Ullah, A. I. & Sofi, M. D., 2013. The Influence of Factors of Migration on the Migration Status of
Rural-Urban Migrants in Dhaka, Bangladesh. HUMAN GEOGRAPHIES—Journal of Studies and
Research in Human 46 Geography, p. 45–52.
Venture, D. E., 2013. IOM Addresses the Health of Migrants in the Southern Africa Mining Sector.
New York: International Organization for Migration (IOM).
Weeks, J., Davis, J. & Lopez-Carr, D., 2010. Migration, Remittances, and Cattle: Implications for
Land Use Change and Food Security in Central America:Papers of the Global Land Project Open
Science Meeting., Central America: Arizona State University Press.
Wenzel , M., Viljoen, J. & Kok, P., 2006. "Contemporary South African migration patterns and
intentions"In: P.Kok, D. Gelderblom, J.O. Oucho and J. van Zyl (eds)Migration in South and
Southern Africa. Dynamics and determinants. Cape Town: HSRC Press.
Wiest, K., 2016. Women and Migration in Rural Europe: Labour Markets, Representations and
Policies. England: Palgrave Macmillan .
Wiest, K., 2016. Women and Migration in Rural Europe: Labour Markets, Representations and
Policies. England: Palgrave Macmillan.
World Bank, 2016. Annual Report. [Online]
Available at: http://www.worldbank.org/en/about/annual-report
[Accessed 2016 November 1].
Yao Lu, 2015. Internal migration, international migration, and physical growth of left-behind
children: A study of two settings. Health & Place, Volume 36, pp. 118-126.
82
Zhu , Y. & Zhongmin, W., 2004. Income Differential and Out-migration: the Impacts of Between-
gap and Within-gap. Journal of Chinese Economic and Business Studies Volume 2, Issue 1, pp.
27-37.


