Embed Size (px)
Citation preview

Pelly, pInong, end R_roch
WORKING PAPERS
AIroli moNay
Agriculture and RuralDevelopment Department
The World BankApril 1988
WPS 6
Farm-Nonfarm Linkagesin
Rural Sub-Saharan Africa
Steven Haggblade,Peter B. Hazell,
and James Brown
The links between agricultural growth and the rural nonfarmeconomy, known to be strong in Asia, are weaker in Africa butstill important to the rural poor. Crucial for strengthening theselinks are policies and investments that (1) promote smallholders,(2) improve rumral infrastructure, (3) encourage commerce andservices, (4) foster the development of rural towns, and (5)explicitly recognize women as key actors in rural development.
The Policy, Pnanid Reach Campln disnixes PPR Wadingl Papes to dimnate the findi gs of mk pingresa Mnd t6aiammge the exchange of ides amoig BDank aff and *1 odithe interested in developaent issues. Ibese papes cany the names ofthe ainois,relect oly thir views, nd should be used and cted acoidingly. The findings irncpxexatios. and cmclusions are theaudion own They shald notbeattibuted to theWad Bank. itsBandat Directousits management. t anyofitsmenberccnuies.
Pub
lic D
iscl
osur
e A
utho
rized
Pub
lic D
iscl
osur
e A
utho
rized
Pub
lic D
iscl
osur
e A
utho
rized
Pub
lic D
iscl
osur
e A
utho
rized

Contents
If* Introduction ...... .......... ................... .................... 1
II. Deiiin ...................................... .......... ....... ...... 3
III. Importance of Nonagricultural Activities in Africa'sRuralo nt. ........................................ . 4
CA. Emnloymentistribution...... ......... . ............................. 4
AB. SInoe. ...... .... .................................. ............. 6
C. .....................I...........b.i........ .... ....ee..... 1
IV. Charac teristics of Rural Nonfarm Enterprise........................................ 6
D. Sizmae ......................... .... ............ . ..... ........ 8Be Composition ...e.....e...... b*oo**ooooee 7C. Employment dest ............................. 7D. Female participation ...*,**o...................................... 8
V. Structural TGransformation by the Rural Nonfarm Activity... 9
A. Megatrens...................................................... 9B. Changes by size and locality.................-........ 12C. Effect of distance from urban centersn..... 13D. Changes over time 13E. Correlates of g r ow th........ o..... o.... .... o......... 15
VI. Magnitude of the Farm-Nonfarm Linkages.nkae**eOg*Oe s****O*0 18
A. Capital flo.s .................... . 18B. Labor flos. 19C. Backward ln k a g es........ ... 0......... ...... . ..... 19D. Forward li n k a g es..... 20E. Consumption lns21Fe Ca.t ion 23
VII. Probable Magnitude of the Agricultural GrowthMultipliers...... ...... .... ......... . .... . ................ 24
A. Direct cross-regional estimationm.....oti... on....... 24B. A model of regional agricultural multiplierseoseeeeo** 26C. Macroeconomic consequences and simulationsations...... 30
VIII. Conclusions.. c l u si..................... . ..o n s ........... 31
A. Implications for policy..... ......................... 31B. Implications for researche............................ 34C. Magnitude of multiplierse............................e 35

Notes ............ ........... ............. 37
Tables ..................................... ....... * 42
Figures ............................ ........... ........... 51
References 55
Steven Haggblade is Assistant Professor at Syracuse University, NewYork. Peter Hazell is a Senior Economist in the Agricultural PoliciesDivision of the Agriculture and Rural Development Department, the WorldBank. James Brown is the Agro-Industries Adviser, also of the Agriculture anRural Development Department, the World Bank, Washington, DC.
The work for this paper was part of a study by the Bank's Agriculturand Rural Development Department on Sustainable Agricultural Growth in Africa

FARM-NONFARM LINKAGES ;N RURAL SUB-SAHARAN AFRICA l/
STEVE HAGGBLADESyracuse University
and
PETER HAZELL AND JAMES BROWNThe World Bank, Washington, DC
I. INTRODUCTION
Based largely on evidence from Asia, Johnaton and Kilby (1975),
Mellor (1976), and Mellor and Johnston (1984) argue that a development
strategy focused on small ferms will generate rapid, equitable and
geographically dispersed growth because of labor initensive linkages with
the rural nonfarm economy. Using examples from India, Pakistan, and
Taiwan, Jchnston and Kilby (1975) highlight the potential importance of
production linkages. They point to small farmer demand for fertilizer,
construction inputs, and equipment and repair services provided by rural
blacksmiths. But farmers also purchase consumer goods. Mellor (1976),
dellor and Lele (1973) and Hazell and Roell (1983), in particular, have
called attention to the potential power of agricultural consumption
linkages. They conclude that middle-sized peasant farmers--to a much
greater extent than their large scale and urban counterparts--spend
incremental income on labor-intensive rurally produced goods, thereby
generating important second-round demand multipliers. Hirschman's (1958)
early indictment of agriculture as a low-linkage, underpowered engine of
growth erred, according to Mellor (1976), because it ignored these
important agricultural consumptiun linkages.
Several empirical studies have documented the power of farm-non-
farm linkages in Asia. Based on data from India, Rangarajan (1982) founld
that a one percent addition to the agricultural growth rate stimulated a
0.5 percent addition to the growth rate of industrial output, and a 0.7
percent addition to the growth rate of national income. Bell, Hazell and

- 2 -
Slade (1982), examining rural growth linkages in the Nuda River Region of
Malaysia, compute an agriculturally induced rural income multiplier of 0.8.
Employment multipliers are also substantial. Evidence from the Philippines
(Gibb, 1974) and India (Krishna, 1976; Mellor and Mudahar, 1974) places
agriculture-to-nonfarm employment elasticities between 1.0 and 1.3.
Although decomposition of the growth multipliers in rare, Bell, Hazoll, and
Slade (1985), in their Muda. study, do provide a breakdown, estimating the
contribution of the consumer demand generated by agricultural growth to be
double the production linkages.
As attention turns increasingly to Sub-Saharan Africa, government
leaders and donors alike view small farmer agriculture as r- necessary
centerpiece of development efforts. Equity, nutrition ant *ty
considerations argue persuasively for such a focus. In adCLa .' .n, many
believe that a small farmer strategy will generate maximu growth rates,
Asia-style, through linkage multipliers with the rural economy.
But no one has yet marshalled the empirical evidence necessary for
assessing the power of agricultural growth linkages in Africa. It may now
be possible to do so given the accumulation, over the past 25 years, of a
body of detailed survey work examining the structure of Africa's rural
nonfarm economy. 2/ This paper examines that evidence. First, it
systematically reviews empirical evidence on the nature and magnitude of
the African rural nonfarm economy. It then explores differences across
locality size, across countries and over time, in an effort to assess
likely patterns of growth. A subsequent review of key production and
consumption parameters allows an estimate of the magnitude of the
agricultural growth multipliers in Africa. The paper concludes with a
brief discussion of policies and programs that will be necessary if farm-
nonfarm growth linkages are to achieve their full potential.

-3-
II. DUtFNITIONS
Before embarking on a review of rural nonfarm activities, it is
necessary to specify what we mean by both "rural" and "nonfarm". Concepts
and definitions of "rurAl", in particular, vary dramatically, as Anderson
and Leiserson (1980) and Chuta and Liedholm (1979) have emphasized. The
progression from rural to urban traverses a continuum of settlement pat-
terns, population and functional densities, making any attempt to partition
the universe necessarily arbitrary. Conceptually, we prefer to think of
rural as depending on the function more than the size of a locality. Like
Gibb (1974) and Anderson and Leiserson (1980), we consider as rural any
locality that exists primarily to service an agricultural hinterland. In
contrast, urban economies are driven by manufacturing, government or sone
other motor independent of agriculture. Given this view, "rural" areas uay
include towns of substantial size, perhaps as large as several hundred
thousand. Admittedly this definition is difficult to apply across a large
number of countries, as it requires intimate knowledge of the regional
economies of each. And in rost cases, we remain prisoners of the rural-
urban delineations made by those who have collected the economic data of
interest in this review. In order to deal with this problem and also to
emphasize the spatial features that are so important to the development of
the rural nonfarm economy, we shall, wherever possible, provide analyses
which highlight differences in nonfarm activities across locality size and
region.
.Nonfarm" activities include all economic activity other than crop
and livestock production, encompassing services, construction, mining,
commerce and manufacturing. In this review, we follow convention and
define nonfarm activities to also include agroindustrial activities which
store, process and market agricultural commodities.

III. INPORTANCZ OF NON-AGRICULTURAL ACTIVITIES IN AFRICA RURAL ECONONY
A. Eployment
Respecting individual country definitions of "rural", Table 1
indicates that rural nonfarm enterprises provide the primary source of
employment for between 3 percent and 63 percent of the labor force in rural
Sub-Saharan Africa. 4' Although highly variable, nonfarm shares of rural
employment typically fall in the 10-20 percent range, in contrast to the
20-30 percent figures commonly reported for Asia (Table 3 and Chuta and
Liedholm, 1979). Figures from both continents should be viewed as minimum
estimates because they frequently exclude rural towns (see Note 3).
Different perceptions of female participation in the work force
contribute to the wide range in African rural nonfarm employment shares.
In Western Nigeria and Benin, shares of nonfarm activity in rural
employment attain 63 percent and 41 percent, respectively, because of high
female participation rates and because survey designers in those countries
have classified 75 to 85 percent of active women as working primarily
outside of agriculture. At the other extreme, women in Chad appear to
participate at low overall rates and virtually exclusively in agriculture.
Whether these apparently wide variations stem from reporting biases
(Simmons, 1976a; Haggblade, Hazell and Brown, 1987), seasonal variation or
actual differences in women'. participation rates, there can be no doubt
that the role of women significantly affects assessments of the magnitude
of rural nonfarm employment.
Seasonal and part-time nonfarm activities also generate
significant amounts of rural employment, occupying between 7 and 30 percent
of the rural labor force (Table 1). Because the overall level of nonfarm
activity runs countercyclically to the agricultural calendar, distinct
seasonal rhythms characterize nonfarm employment, with nonagricultural
activity reaching its peak in the dry season immediately after harvest

(Ancey, 1974; Anderson and Leiserson, 1980; Chernicovsky *t al., 1985;
Delgado, 1979; ILO, 1985b; Liedhola and Chuta, 1976; Hatlon at al., 1979;
Mueller and Zevering, 1970; Norman, Simmons and Hays, 1982; Okafor, 1983;
Thomi and Yankson, 1983). Focusing exclusively on agricultural households,
farm management surveys in numerous ; :tcan countLies have found 15 to 65
percent of farmers with secondary employment in nonfarm enterpr.ses, and
time allocation studies of farm households have found 15 to 40 percent of
total family working hours devoted to income generating nonfarm activities
(Anthony et al., 1979; Cleave, 1974; Hill, 1977; ILO, 1985b and 1985c;
Luning, 1967; Norman, 1972; Okafor, 1983).
B. Income
Africa's rural inhabitants typically derive between 25 and 30
percent of their income from nonfarm sources (Table 2). And because
nonfarm activities are monetized to a much larger extent than is
agricultural production, nonfarm earnings constitute an even larger share
of cash income. Panel B of Table 2 indicates that nonagricultural income
regularly accounts for 30 to 50 percent of rural cash incomes.
C. Income Distribution
Available data on African rural nonfarm earnings do not show the
clear pattern of equity enhancement that analysts have regularly reported
in Asian studies (e.g., Bell, Hazell and Slade, 1982; Kilby and Liedholm,
1986). Researchers in Northern Nigeria (Matlon, 1979) and Lesotho
(Van der Weil, cited in ILO 1982h) have found that high-income rural
dwellers derive a greater share of their earnings from nonfarm sources than
do the poor. Less detailed evidence from rural Tanzania (Collier, Radwan
and Wangwe, 1986) and from farm families in Zambia (Ghai and Radwan, 1984),
Uganda (ILO, 1985d) and Zimbabwe (Weinrich, 1975) suggest similarly
inequitable trends. But support for the equity enhancing view of rural
nonfarm incomes does emerge from some studies: from rural Botswana

-6-
(Botswana, 1976), Zaria Region, Northern Nigeria (Natlon, Simmons and Hays,
1982), and farm households in Gambia (IL, 1985b). Noreover, some
activitie&, such as female-dominated food preparation, do appear
consistently to enhance income equality (see Simmons, 1976a; Norman,
Simons and Hays, 1982; Botswana, 1976; and Nilimo and Fisseha, 1986).
Ultimately, even if the impact of nonfarm earnings on relative income
equality is uncertain or negative, access to nonfarn earnlngs does
nonetheless improve the absolute incom levels of the poor.
IV. CHARACTISTICS OF RURAL NO1ARM ENTERPRISZS
A. Al"g
Whether they use employment or capital investment as the
yardstick, studies of African rural nonfarm activity overwhelmingly
conclude that nonfarm enterprises are small (see Page, 1979; Chuta and
Liedholm, 1979; Anderson and Leiserson, 1980; Page and Steel, 1984;
Liedhols and Head, 1986). In countries such as Burkina Faso, Ghana, Kenya,
Sierra Leone and Zambia, one-person enterprises constitute about half of
all rural nonfarm enterprises; and well over 95 percent employ five people
or less (Wilcock and Chuta, 1982; Thcmi and Yankson, 1985; Freeman and
Norcliffe, 1985; Williams and NcClintock, 1981; Liedholm and Chuta, 1976;
Milimo and Fisseha, 1986).
The large-scale firms that do operate in rural areas are
frequently limited to trading establishments--either distributors or
wholesalers of major agricultural commodities--and resource-based
menufacturers who take advantage of weight-reducing production processes or
specialize in the preliminary processing of perishable commodities.
Studies in Ghana (Andrae, 1981), Kenya (Freeman and Norcliffe, 1985), and
Zaire (Congo, 1968) clearly point to the concentration of large-scale rural
industries in sawmilling, mining and food processing.

-7-
Average fixed capital per enterprise coomonly ranges between $500
and $4,000 in African rural nonfarm activities. Enterprises such as grain
Dills, sawmills and wholesaling require on the order of $1,000 to $10,000
per enterprise; while traditional crafts, personal services and repairs
require capital in the range of only $50 to $600 (see Haggblade, Hazell and
Brown, 1987; Haggblade, 1982; Wilcock and Chuta, 1981; Freeman and
Norcliffe, 1985; and Liedholm and Chuta, 1976).
B. Comnooltion
Aggregate employment data for rural Africa remain in short supply
because most studies have focused on limited portions of the rural economy,
often on farm households; others, although interested in the nonfarm
economy, rarely include commercial and service establishments,
concentrating instead on manufacturing and repair enterprises. Nonetheless
some available data, coming mainly from population censuses do allow a
comprehensive view of the rural economy (Table 3, Panel A). Amid wide
vaviation, these data indicate that commercial establishments typically
predominate, employing 30-40 percent of the rural nonfarm workforce.
Services and manufacturing comprise about 25 percent each, with
construction and mining accounting for the remainder. The data in Table 4
indicate that, within manufacturing, food preparation, tailoring, carpentry
and metal working activities predominate.
C. Emloyment Density
While a steady stream of micro research has greatly increased our
understanding of the African rural nonfarm economy over the past 25 years,
differences in survey coverage complicate cross-country comparisons. They
make it difficult to meaningfully compare employment percentages across
surveys, because activity shares are computed as percentages of different
bases depending on the comprehensiveness of the survey coverage. One
solution to this problem--a solution adopted by Steel (1979), Kilby (1987)
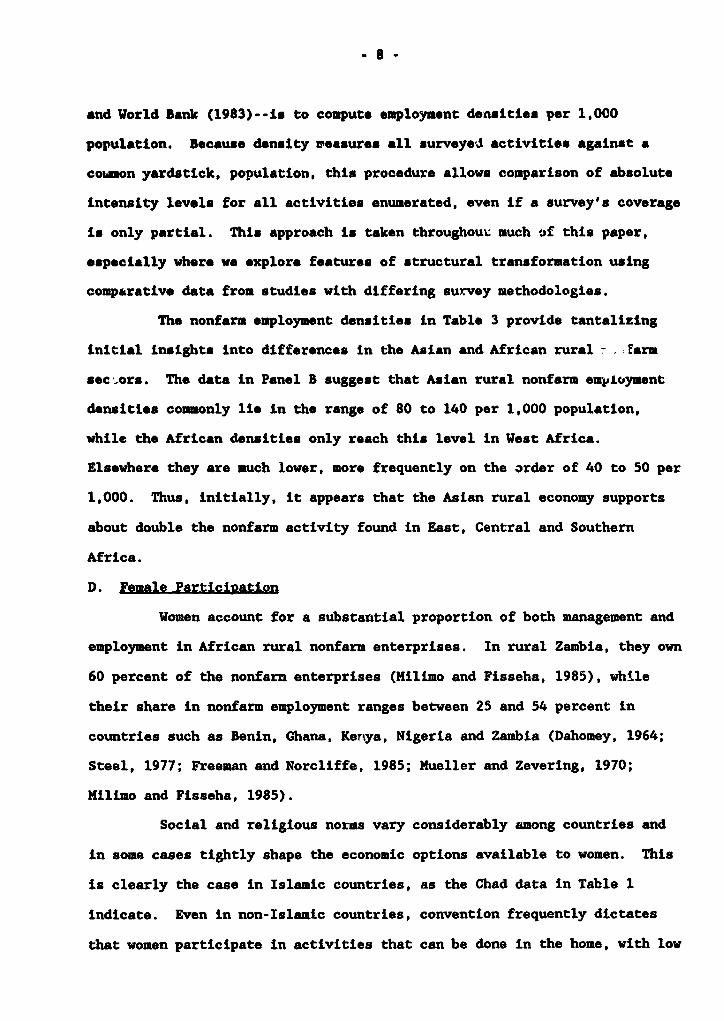
and World Bank (1983)--is to compute employment densities per 1,000
population. Because density reasures all surveyed activities against a
coumon yardstick, population, this procedure allows comparison of absolute
intensity levels for all activities enumerated, even if a survey's coverage
is only partial. This approach is taken throughouw much of this paper,
especially where we explore features of structural transformation using
comparative data from studies with differing survey methodologies.
The nonfarm employment densities in Table 3 provide tantalizing
initial insights into differences in the Asian and African rural f- arm
sec ors. The data in Panel B suggest that Asian rural nonfarm employment
densities conaonly lie in the range of 80 to 140 per 1,000 population,
while the African densities only reach this level in West Africa.
Elsewhere they are much lower, more frequently on the order of 40 to 50 per
1,000. Thus, initially, it appears that the Asian rural economy supports
about double the nonfarm activity found in East, Central and Southern
Africa.
D. Female Particigation
Women account for a substantial proportion of both management and
employment in African rural nonfarm enterprises. In rural Zambia, they own
60 percent of the nonfarn enterprises (Hilimo and Fisseha, 1985), while
their share in nonfarm employment ranges between 25 and 54 percent in
countries such as Benin, Ghana, Kertya, Nigeria and Zambia (Dahomey, 1964;
Steel, 1977; Freeman and Norcliffe, 1985; Mueller and Zevering, 1970;
Milimo and Fisseha, 1985).
Social and religious norm vary considerably among countries and
in some cases tightly shape the economic options available to women. This
is clearly the case in Islamic countries, as the Chad data in Table 1
indicate. Even in non-Islamic countries, convention frequently dictates
that women participate in activities that can be done in the home, with low

9-
capital requirements, and with skills they already have. This leads to
their predominance in food preparation, food services, basket making, and
in some regions, ceramics, weaving and tailoring. Across West Africa, and
in many other regions as well, women also play a major role in retailing
and trade. Because child-rearing, differential access to education, and
other social e pectations restrict female participation rates in formal
sector employment, women participate much more actively in informal
activities. In Ghana and Kenya, for example, women's share of formal
sector employment reaches only 10 and 14 percent, respectively, compared to
54 and 25 percent share.% in informal, small enterprises (Steel, 1977; IIO,
1972).
V. STRUCTURAL TRANSFORMATION OF THE RURAL NONFARM ECONOMY
A. hegatrendS 4
In evaluating the present structure of Africa's rural nonfarm
enterprises, as well as the potential for farm-nonfarm growth linkages, it
is useful to step back and review the grand lines of the economic
transformation that has been taking place over many centuries in the
African countryside. Begin long ago, with a countryside populated by self-
sufficient, primarily agricultural households. No market exchanges take
place, but within each household family members engage in both farm and
nonfarm activitie4s. By fiat, the head of household allocates labor and
capital among activities and commodities among consumers.
Specialization emerges very early on in response to differing
resource endowments and skills, technical change, opportunities for trade
with outside regions, introduction of new crops, population growth and a
host of other factors. Increased agricultural productivity per worker and
the shift of employment out of agriculture are key features of that
specialization, which is fundamental to economic growth. With improved

farm productivity, households can begin to concentrate on selected
activities beyond their own subsistence needs. As specialization becomes
possible, comodity and resource exchanges develop among households, and
the share of consumption from own production declines.
Initially, social protocols regulate exchanges among households.
Families transfer capital through rotacing credit societies (Bauman, 1977;
DeLancey 1978; Hiracle, Miracle and Cohen, 1980). They exchange labor
through reciprocal cooperative work parties (Erasmus, 1956; Moore, 1975)
and comodities through ethnic rpecialization (Dahomey, 1964 and Hill,
1977) or reciprocal giv'
Eventually markets develop--labor markets, rural financial markets
and commodity markets. They operate alongside social allocation mechanisms
and ultimately supplant them, but the time frame is very long. Even today
across rural Africa, only about 20 percent of all labor flows pass through
labor markets, including no more than five percent channeled through
reciprocal work parties. 5/ The remaining 80 percent is allocated within
families by household heads. Capital flows likewise remain predominantly
intra-family, available evidence from rural nonfarm enterprises suggesting
that today only in the order of ten percent of capital flows pass through
formal f.nancial markets. 6/
As specialization continues, nonfarm activity increases its
relative importance in the rural economy; some nonfarm enterprises split
off from the farm household, giving rise to full-time nonfarm households.
Evidence from Kenya suggests that transport, financial services and metal
working are among the first activities to split off from the farm
household, while weaving and tailoring, resource extraction and
construction zemain integrated longer (Freeman and Norcliffe, 1985).
The growing proportion of nonfarm economic activity and the
emergence of independent nonfarm enterprises go hand in hand with spatial

- 11 -
concentration of population in village centers and rural towns. The
concentration of people and activities generates a volume of demand
sufficient to support specialized production units. Attesting to the
importance of this link, all available evidence indicates dramatically
higher proportions of nonfarm activity in rural towns than in dispersed
rural settlements (Table 5; Hatlon, 1977; Liedholm and Chuta, 1976;
Anderson and Leiserson, 1980; Haggblade; Hazell and Brown, 1987).
Growth of rural towns and the consequent physical separation of
farm and nonfarm activities accelerates the move to market exchanges of
both inputs and outputs. In part, the difficulties of rural communications
and transport prevent household heads from exerting control over input
allocation and production decisions across distances. In addition, because
they are specialized, nonfarm households must sell their wares to purchase
food and other necessities. Today, available evidence shows a surprisingly
consistent 60 percent cash share in total rural transactions in Africa
(Collier, Radwan and Wangwe, 1986; Ghai and Radwan, 1983b; ILO, 1982a,
1982e, 1983 and 1985d; Cote d'Ivoire, 1967; King and Byerlee, 1977; Malawi,
1984; Hassell and Parnes, 1969; and Oates, 1984). However, disaggregation
reveals substantial differences between the rates of monetization of
agricultural and nonagricultural commodities. Nonfarm entrepreneurs
exchange the overwhelming majority of their goods and services for cash,
while, continent wide, farmers sell only about 30 percent of all foodcrop
production (FAO, 1986; Ancey, 1974; Cleave, 1974; Leunquin, 1960;
Srivastava and Livingstone, 1983; Norman, Pryor and Gibb, 1979; Delgado,
1979; Hedlund and Landahl, 1983; Wilcock and Chuta, 1982; Anthony, et al.,
1979). Although farmers market the bulk of their cash crops, these
typically account for a small share of total farm production.
In some cases, rural nonfarm activitles do not develop from the
specialization of polyvalent rural households but instead are implanted by
- 12 -
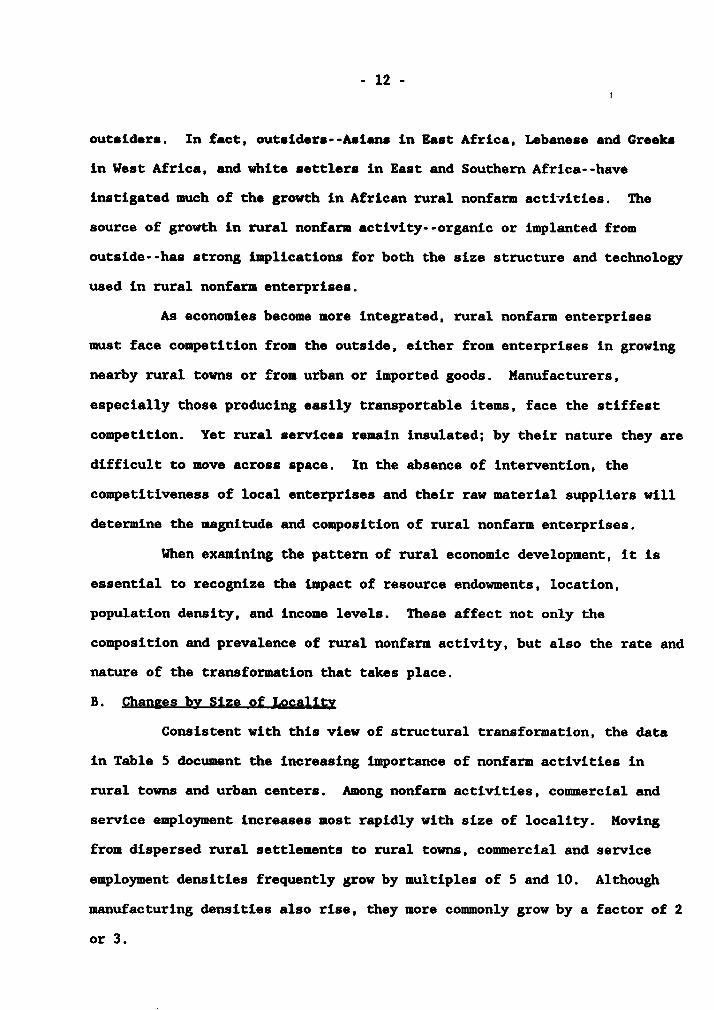
outsiders. In fact, outsiders--Asians in East Africa, Lebanese and Greeks
in West Africa, and white settlers in East and Southern Africa--have
instigated much of the growth in African rural nonfarm activities. The
source of growth in rural nonfarm activity--organic or implanted from
outside--has strong implications for both the size structure and technology
used in rural nonfarm enterprises.
As economies become more integrated, rural nonfarm enterprises
must face competition from the outside, either from enterprises in growing
nearby rural towns or from urban or imported goods. Manufacturers,
especially those producing easily transportable items, face the stiffest
competition. Yet rural services remain insulated; by their nature they are
difficult to move across space. In the absence of intervention, the
competitiveness of local enterprises and their raw material suppliers will
determine the magnitude and composition of rural nonfarm enterprises.
When examining the pattern of rural economic development, it is
essential to recognize the impact of resource endowments, location,
population density, and income levels. These affect not only the
composition and prevalence of rural nonfarm activity, but also the rate and
nature of the transformation that takes place.
B. Changes by Size of Locality
Consistent with this view of structural transformation, the data
in Table 5 document the increasing importance of nonfarm activities in
rural towns and urban centers. Among nonfarm activities, commercial and
service employment increases most rapidly with size of locality. Moving
from dispersed rural settlements to rural towns, commercial and service
employment densities frequently grow by multiples of 5 and 10. Although
manufacturing densities also rise, they more commonly grow by a factor of 2
or 3.

- 13 -
Within sectors--especially within manufacturing--some activities
fare better than others. Data from Zambia and Sierra Lone indicate that
artisanal activities such as spinning, weaving and pottery decline
dramatically in importance with increasing locality size, undoubtedly the
victims of competition from lower-priced manufactured substitutes. At the
other extreme, trading, restaurants, food preparation, and repair work
flourish as town size increases. 7/
C. Effect of Distance from Urban Conters
Evidence from Ivory Coast identifies the types of rural nonfarm
activities which are most likely to be bulldozed by competition from urban
and imported manufacturers. Table 6 indicates that basket making and
weaving diminish precipitously$in importance with proximity to major urban
centers. Pottery also declines, although to a lesser extent. Because
these activities constitute the three largest rural industries in Bouake
Region, it is not surprising that manufacturing in the aggregate may fare
less well than commerce and services as rural structural transformation
proceeds. Certainly it is necessary to distinguish between declining
industries--such as pottery, weaving, basket making, mat making and wood
carving--and ascendant manufacturing activities such as food processing
and, to a lesser extent, tailoring, carpentry and metalwork.
D. Changes Over Time
Time series data tracing changes in Africa's rural nonfarm
employment are limited and fragile. Using aggregate labor force data for
major subregions of the world, both Anderson and Leiserson (1980) and ILO
(1979) make cautious judgements about long-term trends in rural nonfarm
employment. They conclude that, over the past 20 years, total rural
employment has been growing more rapidly than agricultural employment in
all regions of the world, including Africa. Therefore, they reason, the
share of nonfarm activities in total rural employment has been growing as

- 14.-
well. Although both sets of authors acknowledge the frailty of the
underlying data, their conclusions are consistent with the view of a rural
structural transformation involving increasing specialization and
diversification out of agriculture.
For individual countries, time series data on trends in rural
nonfarm employment are available only for Sierra Leone and Rwanda. O The
Sierrf fLeone data are based on rigorous surveys of identical areas and
firms, first in 1974 ard subsequently in 1980 (Chuta and Liedholm, 1982).
Unfortunately, sample sizes in the 1980 follow-up survey were not
sufficiently large to permit inferences on trends in the most dispersed
rural settlements, those below 2,000 in population. Nor do they include
data for comercial, non-repair service firms, or for any enterprise
employing over 50 workers. In practice the firm size cutoff should not
pose a problem of incomplete coverage except in Freetown, which falls in
the size category of cities over 250,000.
The results from Sierra Leone, displayed in Table 7, lead to
several important conclusions. First, they indicate that repair services
and food processing have grown most rapidly, both overall and in small and
medium rural towns. Second, while manufacturing in general appears to have
declined in the smallest localities (2,000-20,000 persons), tailoring and
welding have held constant, and they, along with carpentry, have grown very
rapidly in the medium sized towns (20,000-250,000), These observations are
consistent with the previously cited spatial evidence suggesting that
repair services and food processing grow most rapidly with the development
of rural towns.
The Rwanda time series data (Vanvali, 1985), tracing changes in
rural nonfarm employment between 1978 and 1983, are more conjectural than
those from Sierra Leone, since they splice together two very different data
sets, the 1978 population census and the results of a more recent

- 15 -
agricultural census. Nevertheless. they once again point to service,
commerce and restaurants as the fastest growing nonfarm sectors. While
overall manufacturing grew more slowly than services and commerce, the
Rwanda data, like those from Sierra Leone, do point to woodworking, metal
work and textiles as among most buoyant rural industrial activities.
E. Correlates of Growth in the Rural Nonfarm EcJjw
We hypothesize that several factors affect the growth of the rural
nonfarm economy.
1. DeveloDMent of rural towns. In part this may be due to the
benefits of economies of scale as well as the prospects for
centralized, cost-effective provision of key infrastructure
and services.
2. Leyel of infrastucture. Decreases !n the cost of
information and transport flows improve the efficiency with
which rural labor and financial markets channel inputs into
activities yielding the highest returns. Noreover, decreased
transport costs open up rural resources and markets to viable
exploitation, facilitating movement to a more specialized,
productive rural economy.
3. Per capita income. Engel's Law mandates this tandem movement
for the overall economy, and if definitions of "rural' reoain
liberal enough to encompass the nonfarm growth in rural
towns, increases in income will lead to an increase in the
nonfarm share of total rural income.
- 16 -
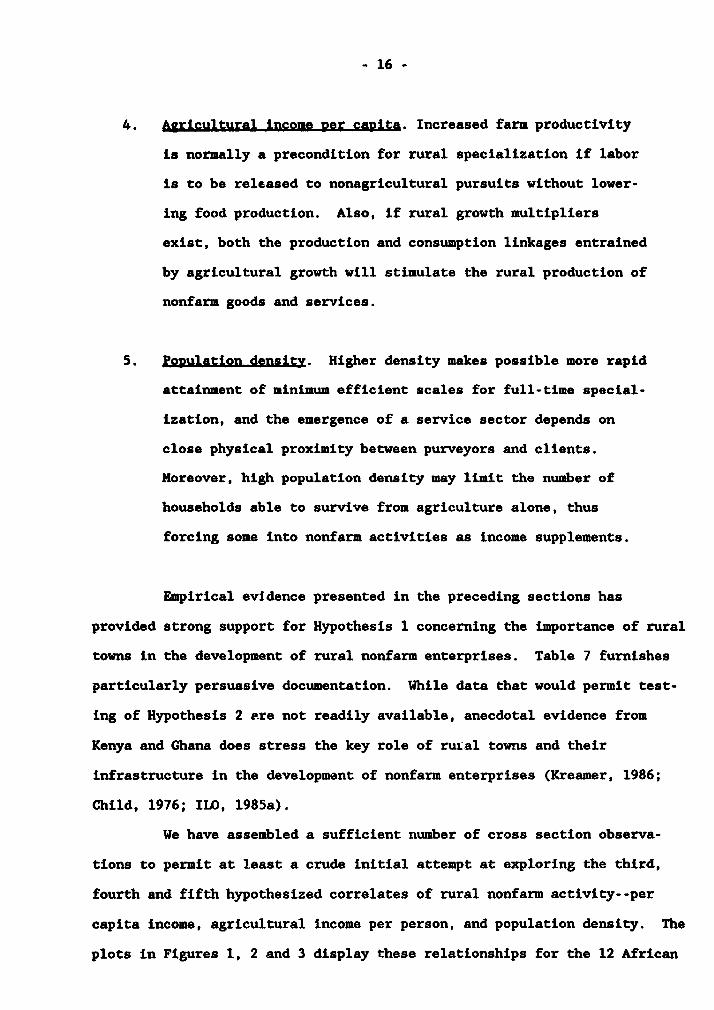
4. Agricultural income Rer caRita. Increased farm productivity
is normally a precondition for rural specialization if labor
is to be released to nonagricultural pursuits without lower-
ing food production. Also, if rural growth multipliers
exist, both the production and consumption linkages entrained
by agricultural growth will stimulate the rural production of
nonfarm goods and services.
5. PoRulation density. Higher density makes possible more rapid
attainment of minimum efficient scales for full-time special-
ization, and the emergence of a service sector depends on
close physical proximity between purveyors and clients.
Moreover, high population density may limit the number of
households able to survive from agriculture alone, thus
forcing some into nonfarm activities as income supplements.
Empirical evidence presented in the preceding sections has
provided strong support for Hypothesis 1 concerning the importance of rural
towns in the development of rural nonfarm enterprises. Table 7 furnishes
particularly persuasive documentation. While data that would permit test-
ing of Hypothesis 2 are not readily available, anecdotal evidence from
Kenya and Ghana does stress the key role of rural towns and their
infrastructure in the development of nonfarm enterprises (Kreamer, 1986;
Child, 1976; IID, 1985a).
We have assembled a sufficient number of cross section observa-
tions to permit at least a crude initial attempt at exploring the third,
fourth and fifth hypothesized correlates of rural nonfarm activity--per
capita income, agricultural income per person, and population density. The
plots in Figures 1, 2 and 3 display these relationships for the 12 African

- 17 -
and 4 Asian countries for which comparable data are available. The 12
African countries include all those on Table 3 except Zimbabwe and
Mozambique, for which it was not possible to break out employment in rural
towns, and Ivory Coast where data from only one region was available. We
have plotted nonfarm employment percentages rather than densities, because
in cases such as these, where complete rural employment data are available,
percentages are less susceptible than are densities to noise introduced
through differences in working age classifications and measured female
participation rates. The raw data come from the same sources reported in
Table 3 adjusted to include rural towns up to 250,000 in size.
Figures 1 and 2 depict a positive relationship between rural
nonfarm employment and both per capita GNP and agricultural income, thus
supporting Hypotheses 3 and 4. Correlation coefficients for the African
countries portrayed stand at .41 and .33, respectively. Extending the
range of observation, the Asian data reinforce both of these conclusions.
In addition, Figure 2 indicates that, for any given level of agricultural
income, Asian countries generate higher levels of nonfarm employment than
do their African counterparts, thus suggesting that agricultural
multipliers may be higher in Asia.
Only in testing the effect of population density do the African
cross-section data appear ambiguous. Except for Rwanda, the outlier in the
lower right, the African data imply essentially no correlation between
population density and rural nonfarm employment. Yet extrapolation to
population density levels common in Asian countries does suggest a positive
relationship. Perhaps 50-100 people per square kilometer represents a
threshold level necessary for population density to play a discernible role
in stimulating rural nonfarm activity. Lending credence to this notion,
the Nigerian data in Figure 4 indicate a strong .87 correlation between
population density and adult rural nonfarm employment (.78 for children) in
- 18 -
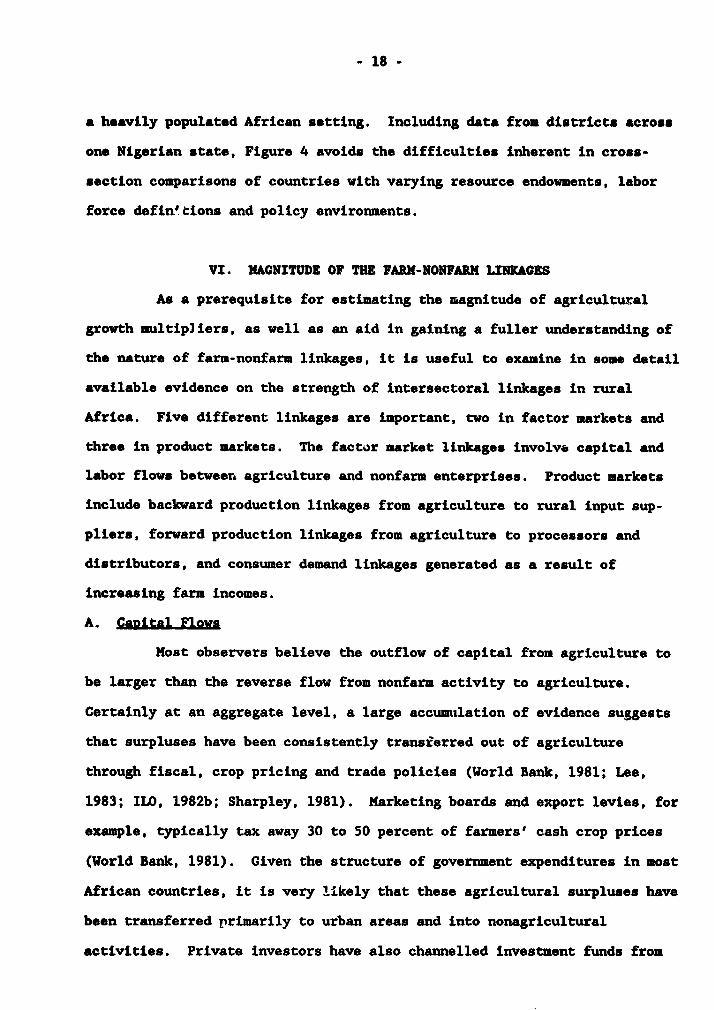
a heavily populated African setting. Including data from districts across
one Nigerian state, Figure 4 avoids the difficulties inherent in cross-
section comparisons of countries with varying resource endowments, labor
force defin'tions and policy environments.
VI. MAGNITUDE OF THE FARM-NONFARM LINKAGES
As a prerequisite for estimating the magnitude of agricultural
growth multipliers, as well as an aid in gaining a fuller understanding of
the nature of farm-nonfarm linkages, it is useful to examine in some detail
available evidence on the strength of intersectoral linkages in rural
Africa. Five different linkages are important, two in factor markets and
three in product markets. The factor market linkages involve capital and
labor flows betweer. agriculture and nonfarm enterprises. Product markets
include backward production linkages from agriculture to rural input sup-
pliers, forward production linkages from agriculture to processors and
distributors, and consumer demand linkages generated as a result of
increasing farm incomes.
A. Capital Flows
Host observers believe the outflow of capital from agriculture to
be larger than the reverse flow from nonfarm activity to agriculture.
Certainly at an aggregate level, a large accumulation of evidence suggests
that surpluses have been consistently transferred out of agriculture
through fiscal, crop pricing and trade policies (World Bank, 1981; Lee,
1983; ILD, 1982b; Sharpley, 1981). Marketing boards and export levies, for
example, typically tax away 30 to 50 percent of farmers' cash crop prices
(World Bank, 1981). Given the structure of government expenditures in most
African countries, it is very likely that these agricultural surpluses have
been transferred primarily to urban areas and into nonagricultural
activities. Private investors have also channelled investment funds from
- 19 -
agriculture to nonfarm activities (Freeman and Norcliffe, 1985; Okelo,
1973; and Williams and McClintock, 1981). Evidence from Kenya an4 Sierra
Leone suggests that agricultural surpluses account for between 15 and 40
percent of nonfarm investment funds (Child, 1977; Liedholm and Chuta 1976).
Surpluses generated in nonfarm activities likewise furnish funds
for productivity enhancing investments in agriculture. Kitching (1977), in
a review of sixteen farm management surveys from East Africa, finds
repeated evidence of nonfarm earnings playing a crucial role in farmer
acquisition of productive agricultural assets, especially land. The posi-
tive impact of off-farm earnings on agricultural investment has also been
observed in Kenya (Collier and Lal, 1986; Haugerud, 1984), Nalawi (Cleave,
1974), Nigeria (Berry, 1975) Tanzania (Cleave, 1971) and Uganda (Nassel and
Parnes, 1969).
B. LaboL FlwEl
Monfarm labor usage moves contracyclically to demands of the
agricultural calendar resulting in substantial seasonal labor flows between
the rural farm and nonfarm sectors. We estimate that 20 to 40 percent of
the rural labor force works in both farm and nonfarm activities, this range
representing the sizeable magnitude of the labor flows moving back and
forth between the rural farm and nonfarm sectors. 10/
C. Backward Linkages from Agriculture to Rural Input Suppliers
Rural enterprises can supply some of the agricultural inputs
required by farmers. For example, seasonal data from Sierra Leone indicate
that blacksmithing activity reaches its peak during the height of the
agricultural season because of the demand for repair services (Liedholm and
Chuta, 1976). Of course, the type and magnitude of backward linkages
varies depending on agricultural technology, size of holding, type of crop,
and whether production is irrigated or rainfed.

- 20 -
In general, the backward linkages in Africa appear to be weaker
than those measured in Asia. To see why, recall that Johnston and Kilby
(1975), in evaluating the magnitude of backward linkages in Asia, identify
fertilizer, followed by equipment and finally cement and building materials
as the three key production inputs to agriculture. In Africa, probably
only Nigeria, with its petroleum and large market can aspire to viable
fertilizer production. Furthermore, topography and hydrology severely
limit irrigation potential in Africa (Delgado, 1984) and therefore the
demand for pumps and other irrigation equipment, cement and building
materials.
But the potential for production lir.kages lies not necessarily in
today's technology, it lies rather in what will be required to generate the
first round of future agriculturally-propelled growth. It is increasingly
clear that peak season labor bottlenecks constrain output in most areas, so
some form of biological or mechanical solution will have to address that
problem (Eicher and Baker, 1982; Mellor, Delgado and Blackie, 1987). If
the most economic solutions turn out to be mechanical, backward nonfarm
linkage multipliers may grow. The multipliers computed below use a range
of estimates of equipment inputs to generate a sense of the magnitude of
the growth linkages that can be reasonably expected from this quarter.
D. Forward Linkages from Agriculture to Processors and Distributors
Table 8 attempts to break out from total rural nonfarm employment
only activities related to agriculture, either supplying inputs or
processing outputs. Because many firms service a multiplicity of clients,
this is not possible to do with great precision, although three tentative
conclusions do emerge. First, backward linkages appear far smaller than
the forward processing linkages from agriculture. Even if all metal
working, blacksmithing and metal repair were related to agriculture, the

- 21 -
forward processing and distribution links would be at least double the
backward linkages in Kenya and over 15 times as great in Zambia.
Second, food processing clearly achieves prominent stature among
forward linkages. Although bread baking requires imported wheat flour,
virtually all other processing activities involve transformation of local
agricultural production. Furthermore, oil extraction, sugar production,
tea drying and packaging, coffee and cocoa dehulling and drying are often
performed in rural areas by large scale enterprises. While we know these
large scale activities take place predominantly in rural areas, the small
scale orientation of much of the past research causes those activities to
elude the statistical net. Hence even the substantial figures in Table 8
understate the magnitude of rural agroprocessing.
Finally, distribution of agricultural products generates, after
food processing, the second largest of the forward linkages from
agriculture. If retailing of local agricultural produce is approximately
proportional to the share of marketed farm production in total rural
consumer cash expenditure, then about 50 percent of rural retailing
represents a forward distribution link from agriculture. 31/ Applying this
proportion to data from Zambia, Table 8 indicates that distribution
furnishes between 15 and 50 percent of total agricultural linkages, the
higher proportion prevailing in rural towns.
E. Consumption Links
As per capita farm incomes rise, the demand for local services,
housing, durables, and higher quality foods typically increases more
rapidly than the demand for foodgrains. The Asian experience suggests that
the production of these commodities and services is labor intensive, hence
rural employment in the non-foodgrain sector increases quite rapidly with
per capita farm incomes (Mellor, 1976; Gibb, 1974; Bell, Hazell and Slade,
1982). Bs.t these patterns of growth may depend on a combination of high

- 22 -
population density and adequate transport facilities to make rural services
accessible to the villages and so may be less applicable to large parts of
Sub-Saharan Africa. We hypothesize that the absence of relatively cheap,
labor-intensive goods and services in rural areas will result in a slower
shift of demand from foods to services in Sub-Saharan Africa than in Asia,
with consequent weaker demand linkages to the rural nonfarm economy.
Of the few household expenditure studies which allow assessment of
African rural consumption linkages, the most comparable were uiadertaken for
farm households in Gusau, Northern Nigeria (Hazell and Roell, 1983), rural
households in Sierra Leone (King and Byerlee, 1977), and households in
three villages in Zaria Province, Northern Nigeria (Simmons, 1976b). These
are suumarized in Table 9 together with comparable results for farm house-
holds from two Asian studies: the Mud& region of Malaysia (Hazoll and
Roell, 1983) and North Arcot district, South India (Hazell and Ramasamy,
forthcoming).
As the data in Table 9 indicate, African spending patterns support
far less rural nonfarm activity than do those in Asia. Average expenditure
on rurally produced nonfoods averages about 18 percent in Muda and North
Arcot, double the roughly nine percent prevailing in Gusau and Sierra
Leone. And with the marginal budget shares, crucial predictors of the
linkages to be anticipated from growing incomes, the gap widens. African
consumers in Gusau and Sierra Leone spend only 11 to 12 percent of
incremental income on rurally-produced nonfoods, while the comparable Asian
figures from M uda and Gusau stand at 31 to 26 percent, triple those in
Africa. In part, this difference arises because African consumers spend
far more of their average and marginal income on rurally-produced foods.
While total rural consumption linkages (on foods plus non-foods) are
approximately equal in the cases reviewed, the Asia data indicate greater
diversity into nonfoods.

- 23 -
Transportation networks and proximlty to rural towns appears to
contributo to the much higher Asian incro ental consumption on rurally-
produced goods and services. A comparison of the African consumption
studies reveals that households ln Zaria Region, Nigeria spend a
significantly greater portion of their income on nonfoods, especially ser-
vlces, than do consumers in Sierra Leone and in Gusau. This difference
arises, at least in part, because Simmons (1976b) dellberately selected her
three Zaria study villages for their proximity to ths urban center of
Zaria. Consequently consumers in the study villages had easy access to a
wider range of consumer goods and services than are available in most rural
African villages. Contrasting the Gusau and Nuda studies reinforces this
conclusion. In Mudt, with its dense population and sx¢ellent transporta-
tion system, consumers spend larger income increments on rurally-produced
nonfarm goods and services than do households in Gusau where villages are
typically much more removed from market centers and are faced with very
limited means of transport.
The Sierra Leone study (King and Byerlee, 1977 and 1978) also
supports two themes that emerged from the time-series and locality-size
employment data. First, it indicates that consumption linkages are much
stronger for rural services than for rurally-manufactured goods. Marginal
budget shares for rural services stand at 11.2 percent while those for
rurally-manufactured goods reach only 1.1 percent. Second, King and
Byerlee's results underline the Importance of rural towns. Their data
indicate that consumers allocate 5.5 percent or incremental expenditure on
goods and services produced in rural towns, almost triple the rate of
spending on products made in large urban areas.
F. Caution
The available evidence examined thus far has suggested that
African farm-nonfarm linkages may be lower than those found in Asia.

- 24 -
However, it is important to bear in mind that available measures may bias
the African rural linkage estimates downward because of a key feature of
the African rural economy--the high share of nonmarketed goods and services
ln total consumption. Because they are not marketed, many rural African
goods and services are not measured. The Gusau consumption study, for
example, does not impute a value for consumption of home produced nonfood
cou'odities. And none of the studies values nontraded household services--
cooking, cleaning, laundry and child care. Furthermore, major agricultural
improvements take the form of labor time invested in tree crop planting,
land clearing, leveling or ridging. A recent study in Nigeria estimated
that 80 percent of total agricultural investment took this form, while only
the remaining 20 percent represented cash expenditure on equipment
(AdesimL, 1983). Performed primarily with unremunerated family workers,
labor-based investments are normally excluded from calculations of the
value of agricultural investment. Because the Asian economies are more
highly monetized, more of these services enter the measured consumption
accounts. Thus, in the same way GNP comparisons exaggerate income gaps
between rich and poor countries--because the development of labor markets
monetize what were previously intra-household labor flows and becas e high
female workforce participation leads to booming restaurant, laundry, house
cleaning and childcare businesses--the Asia-Africa comparisons are likely
to overstate the apparent linkage gap between the two regions. The
differences may well diminish in the future as rural Africa becomes
increasingly monetized.
VII. PROBABLE MAGNITUDE OF THE AGRICULTURAL GROWTH NULTIPLIERS
A. Direct Cross-Regional Estimation
Available regional data from Togo and Sierra Leone (ILO, 1982d,
Natlon et al., 1979), enable us to relate regional differences in rural

- 25 -
nonfarm earnings to differences in agricultural income. These data repro-
duced and plotted in Haggblade, Hazell and Brown (1987), show a clear posi-
tive relationship between per capita agricultural income and per capita
rural nonfarm earnings, reinforcing results from our earlier cross-country
analysis reported in Figures 1-3.
By regressing rural nonfarm income on agricultural earnings, we
can use these data to generate crude estimates of the agricultural growth
multipliers. Equations (1) and (2) display the results of two ordinary
least square regressions of per capita nonfarm income (RNFY) on per capita
farm income (AGY). The figures in parentheses are standard errors. Note
that the Sierra Leone regression includes all regions except Scarcies,
which is an atypical rural region, one with a high proportion of fishing
income which is clearly unrelated to agriculture.
(1) Togo RNFY - 5.8 + .43AGY R2 - .56
(.22)
(2) Sierra Leone RNFY - 4.2 + .14AGY R2 - .31
(.09)
It would be improper to infer strict causality from these
relationships, because there may be other exogenous sources of growth in
rural nonfarm income. Yet given the overwhelmingly agricultural character
of rural Togo, the results in equation (1) suggest that in rural Togo a $1
increase in agricultural income leads to a $.43 increase in regional
nonfarm earnings. But the Sierra Leone estimate, even after removing the
outlier region, is far lower. It implies that a $1 increase in farm income
generates only an additional $.14 in nonfarm earnings. Closer inspection
of the survey methodology reveals the reason for this low figure. The
Sierra Leone data exclude income from households primarily engaged in trad-

- 26 -
Lug. Becauso commerce generates consistently the highest share of African
rural nonfarm income, the Sierra Leone data likely seriously underestimate
total rural nonfarm earnings. For present purposes, one advantage of thio
omisoson is that it reduces the coverage of the nonfarm multiplier to prin-
cipally production linkages. Supporting the notions advanced previously,
this interpretation suggests that rural productlon linkages from agricul-
ture are in fact very low, at least in the predominantly hand hoe agricul-
ture of Sierra Leone.
B. A Model of Regional Agricultural Multipliers
In view of the limited opportunities for direct estimation of
growth multipliers, much of what we can learn must come from modeling.
'-azell (1984) has developed a particularly useful model that allows
estimtion of regional growth multipliers based on three basic parameters,
two production and one consumption. Values for each can be obtained from
ferm management, rural nonfarm enterprise, and consumption surveys.
Although small, the model allows us to assess three important features of
farm-nonfarm linkages: (a) differences in African and Asian growth
multipliers; (b) the implications of alternative types of agricultural
growth on the ensuing nonfarm linkages; and (c) breakdown of the total
multiplier into its production- and consumption-based components.
Described in detail in Hazell (1984) and in Haggblade, Hazell and
Brown (1987), the model characterizes the supply structure of rural regions
as follows. ~/ The supply of their major tradable output--foodgrains or
export crops--is typically fixed by technology and, in Asia by land, in
Africa by labor. In contrast, output of nontradables--primarily rural
services, but including some income-elastic agricultural products such as
fruits, vegetables and meat, and some rural manufactures--is elastic.
Assuming the prices of all traded commodities are fixed outside the region,
Hazoll derives a model which estimates the increase in regional value added

- 27 -
that would occur if, through development of new technology or lnvestment ln
agriculture, government were able to relax the supply constralnt limltlng
output of major agrlcultural tradables. Given a one-unit lncrease ln value
added from the region's major tradable agrlcultural output, the model
estimates the resultlng total increase ln regiona' value added as a
function of three parameters: consumers' marglnal budget share spent on
nontradables, producers' demand for nontradable intermediate inputs as a
ratlo of gross regional output, and the ratlo of value added to gross
reglonal output.
Three studies have used Hazell's model to estimate the magnltude
of a!;rLcultural growth linkages. Hazell (1984) has applied the model to
estimate Asian growth multipllers, Rogers (1986), using data from
Mauritania, has computed multipliers for Sahelian West Africa, and
Haggblade, Hazell and Brown (1987) have used the model to compare growth
multipllers in Africa and Asla as well as to contrast growth linkages
resultlng from alternative agricultural growth strategies.
Several important concluslons emerge from these modellng efforts.
The flrst concern the accuracy of the model and the magnltude of Asian
growth linkages. Hazell (1984) ln his initial formulation, used the model
to estimate regional agrLcultural growth sultipliers for the Muda River
Region of Malaysia, a moderately prosperous rlce growing region that had
been studied ln great detall by Bell, Hazell and Slade (1982). The small,
three-parameter model generated a regional agricultural growth multlplier
of 1.82, indicatlng that a $1 increase in value added from tradable
agrlcultural output would result in an additlonal $0.82 lncrease ln
reglonal income. Thls result lles very close to the 1.83 value addod
multiplier reported by Bell, Hazell and Slade (1982) after a much more
careful analysls, lending credibility to the smaller model's projectLons.
A second detalled study, undertaken by Hazell, Ramasamy and Rajagopalan

- 28 -
(forthcoming) in the North Arcot region of South India, also computes an
agricultural growth multiplier of 1.83. In this case too, the small three-
parameter model generated virtually identical results.
Applying the model to African agriculture, Rogers (1986) computes
much lower multipliers. Using a slight variant of the Hazell model along
with data from Mauritania, Rogers estimates agricultural growth multipliers
under a range of conditions. Most estimates clump around 1.27. eiven the
harsh rural economy of Mauritania, this estimate very likely paints an
unduly pessimistic picture of agricultural growth multipliers throughout
the rest of Sub-Saharan Africa.
Using what are probably more representative African data--
consumption parameters from Sierra Leone and Nigeria along with production
parameters from farm and nonfarm budget studies across the continent--
Haggblade, Hazell and Brown (1987) estimate agricultural growth multipliers
on the order of 1.5. This estimate places the African growth multipliers
at about 60 percent of the magnitude of those estimated in Asia; a $1
increase in value added from agricultural tradables produces an additional
0.50 of rural income in Africa compared to about $0.83 in the Asian
countries for which we have evidence. These Africa multipliers of about
1.5 are also strikingly close to the 1.43 direct cross-regional estimate
reported earl'er for Togo (Section VII A).
The model can also shed light on.potential differences in rural
linkages generated by alternative agricultural growth strategies.
Haggblade, Hazell and Brown (1987) use African farm management data to
compare rural income multipliers likely to emanate from small farmer growth
strategies with strategies based on promotion of estate agriculture. Under
a range of probable production yarameters, the model predicts regional
multipliers in the range of 1.45 and 1.55 for both small and large farmer
strategies. The surprising similarity between estate and smallholder

- 29 -
multipliers occurs because while large farmers are more dependent on
purchased inputs (as reflected in their lower value added to gross output
ratios) and hence have potentially stronger links to the nonfarm economy,
the potential does not materialize because many of those inputs are
produced in urban areas or overseas. But this result assumes identical
consumption patterns among small farmers and estateholders. If estate
families are found to have more urbanized expenditure patterns--and
unfortunately consumption data are simply unavailable indicating whether or
not this is so--the estate-dominated regions would generate regional growth
multipliers of only about 1.31, substantially below those of smallholders.
Finally, the model has been used to separate out the contribution
of consumption and production linkages in overall regional multipliers
(Haggblade, Hazell and Brown, 1987). Under conditions prevailing in Sub-
Saharan Africa, that work indicates that consumption linkages account for
about 80 percent of total agricultural growth multipliers. In Asia, on the
other hand, the relative importance of consumption linkages appears much
smaller. 1'a the Muda region of Malaysia, consumption linkages account for
about 60 percent of the total multiplier, while in North Arcot the
consumption share drops to 50 percent (Bell, Hazell and Slade 1982; Hazell,
Ramasamy and Rajagopalan, forthcoming). This does not arise because the
consumption linkages are more powerful in Africa than in Asia; the marginal
budget share for nontradables is smaller in Africa. Rather, the different
relative importance of consumption and production in overall growth
multipliers reflects the much weaker inter-industry linkages in Africa.
The weak African production linkages likely stem, as discussed earlier,
from the much lower level of mechanical input use in Africa along with the
absence of important construction and maintenance associated with Asian
irrigated agriculture. Reiterating inferences drawn from the Togo and
Sierra Leone direct multiplier estimates above, the modeling efforts

- 30 -
project weak African agricultural production llnkages with the rest of the
rural economy.
C. Macroeconomic Consequences and Simulations
The foregoing analysis presumes that regional growth is an end in
itself, and it gives no regard to spillover effects that might be induced
elsewhere in the national economy. For example, imports into a rural
region are leakages as far as regional growth is concerned. But if these
goods are produced in other rural areas, or if they create jobs for the
urban poor, they will still be desirable from the national viewpoint.
Similarly, savings that are invested outside the region represent a loss to
regional growth, but they are nevertheless valuable in furthering national
economic growth. Conversely, regional growth may incur costs elsewhere in
the economy. For example, labor and capital will be less likely to move
from rural to urban areas if rural regions are growing successfully, and
this will act to dampen the growth of the urban economy.
To measure the full indirect impact of agricultural growth in the
national economy requires a general equilibrium modeling approach. Byerlee
has undertaken such work for Nigeria (Byerlee, 1973) and Sierra Leone
(Byerlee, et al., 1977). Using a macroeconomic simulation model, he
analyzes the impact of government policies for expanding, alternatively,
the production of export and food crops. For Nigeria, his results show
that policies which expand food crop production increase value added in
nonagriculture by Naira 0.23 for each Naira 1.00 increase in value added in
agriculture. 13/ In contrast, policies to increase export crop production
lead to between 0.73 and 0.96 Naira of additional value added in
nonagriculture for each Natra 1.00 Increase in agricultural value added.
The results for Sierra Leone are more modest, probably reflecting
the much weaker industrial base of that country. Increases in food crop
production have a similar impact on the national economy as in Nigeria:

- 31 -
each Leone 1.00 of additional value added in agriculture generates Leone
0.29 of nonagricultural value added. But the linkages emanating from
increased export crop production are weaker than in Nigeria--Leone 0.42 of
value added in nonagriculture for each Leone 1.00 of additional value added
in agriculture.
These results are generally consistent with the size of our
regional multipliers. This would seem to suggest that any positive spill-
over effects arising beyond a region's boundaries are largely offset by
negative spillover effects.
There are no directly comparable studies for Asia, but modeling
studies of India (Rangarajan, 1982) and South Korea (Adelman, 1984) suggest
stronger linkage effects from agricultural growth on the national economy
than in Sub-Saharan Africa.
VIII. CONCLUSIONS
A. ImDlications for Polic=
Several themes have recurred throughout this review. Together,
they point in clear directions for policy makers and practitioners
interested in balanced rural growth and in maximizing the rural nonfarm
spinoffs of agricultural progress.
e Agricultural growth will be essential in launching successive
rounds of growth in rural areas. Consumption linkages appear particularly
important. Raising fcrm labor productivity is therefore important, not
only because it permits the release of labor from agriculture to
nonagricultural pursuits, but because it boosts per capita income to levels
that enable consumer diversification from food into nonfood items.
* Government policies affect not only the magnitude of agricultural
growth but also the ability of rural nonfarm enterprises to respond to the
increased demand. Investment codes and related legislation which have

- 32 -
discriminated against small, rural nonfarm firms (Haggblade, Liedholm and
Mead, 1986; Page, 1979; World Bank, 1982, 1987), together with hisi:oric
urban policy biases (World Bank 1981), will need to be redressed if rural
nonfarm enterprises are to achieve their potential for income generation
and economic decentralization.
* The historical focus on manufacturing, by both policy makers and
researchers (Haggblade, Hazell and Brown, 1987) seems now worthy of
redirection. Spatial, time series and consumption data uniformly point,
not to manufacturing, but rather to commerce and services as key growth
sectors over the course of Africa's rural structural transformation.
Services, in particular, are the activities best insulated crom urban
competition; hence consumption leakages are smallest in this sector.
Service and commercial enterprise should not he excluded from assistance
programs as has frequently been the practice in the past.
* Rural towns emerge as focal points in the development of the rural
nonfarm economy. Cross-section data systematically identify much higher
densities of nonfarm activity in rural towns than in dispersed rural
settlements. By providing nonfarm enterprises with larger markets, rural
towns offer firms the potential to exploit economies of scale. Prospects
for sharing equipment as well as the emergence of repair and support
facilities induce enterprise establishment in rural towns. Moreover, the
emergence of rural towns enables policy makers to provide necessary
productive infrastructure at lower cost than would be possible under widely
dispersed settlement patterns.
° For rural towns to play their role in a balanced rural development
process, it will be essential to assure adequate economic and social infra-
structure to support nascent modern nonfarm activities. Physical infra-
structure will undoubtedly plav a key role. Anecdotal evidence on the rise
of secondary cities in developing countries identifies ground
- 33 -
transportation--roads or railroads--as necessary first infrastructural
investments (Rondinelli and Ruddle, 1978; Rondinelli, 1983). The
consumption data from Africa and Asia reinforce this notion, highlighting
the importance of road access to rural towns in stimulating agricultural
consumption linkages. Beyond that, the spotty record of rural
electrification programs alone in fostering industrialization (Fluitman,
1983; Okelo, 1973) suggests a need to review evidence on complementarities,
sequencing and necessary additional conditions for generating productive
impact frid infrastructural investments. Institutional infrastructure will
also be essential in fostering the transition to a more specialized,
productive rural economy. Efficient rural financial markets will be
particularly important. It appears that improvements on this front will
require integration of the existing informal credit markets with the formal
banking system. Labor markets are also essential, and their increased
efficiency will follow in the wake of improved communication and transport
infrastructure.
3 Because much current writing emphasizes the need for investments
in infrastructure, policy makers can all too easily overlook the collateral
need for investments in people. Since services will be among the most
rapidly growing rural nonfarm a4tivities, investment in human capital will
likely be essential for realizing those potential gairs. Services depend
more on skilled people than on equipment and infrastructure.
* Many programs of direct assistance to rural nonfarm enterprises,
although by no means all, have been cost effective. 14 The record of
technical assistance and projects providing modern workshop facilities have
been most checkered; two-thirds of 17 recent project evaluations have found
benefit/cost (B/C) ratios below one (Haggblade, 1982; Kilby, 1979). On the
other hand, credit projects, especially those supplying working capital,
have enjoyed greater success. A recent evaluation of seven small

- 34 -
enterprise credit projects found that all have B/C ratios in excess of one
(Kinly and d'Zmura, 1985). Overall it appears, as Kilby (1979) originally
suggested and subsequent appraisals have confirmed, that programs which aim
to provide a complete package of financial, technical and management
assistance--nursery industrial estates, for example--are generally less
effective than programs that identify and provide a single missing
ingredient necessary for enterprise success.
* Women dominate many of the nonfarm activities that will grow most
rapidly during structural transformation--activities such as food
processing and preparation, tailoring, trading and many services. They
likewise hold major interest in many of the declining rural nonfarm
occupations--basket making, mat making, ceramics and weaving.
Consequently, women will be key actors in the economic transition of
Africa's rural economy. 15/ To facilitate their contribution to an
accelerated rural transformation will require assistance agencies and
governments explicitly recognizing the key role to be played by women.
B. Implications for Research
This review, in sorting through the delicate and spotty available
evidence, has identified several key priorities for future research.
* To improve our confidence in estimates of growth multipliers, the
key parameters to be measured are the marginal budget shares and expendi-
ture elasticities for rurally-produced nontradables. Those who analyze,
and especially those who collect, rural consumption data can perform a
vital service by tagging and highlighting the locational features of rural
consumption decisions.
a On the supply side of the rural nonfarm economy, it will be parti-
cularly important to start filling in descriptive and analytical profiles
of the service and commercial sectors of the rural economy as a complement
to the important, detailed work already undertaken on rural manufacturing

- 35 -
and repair. Research in the future should also include both large and
small, formal and informal firms within its purview. Subsector research
offers is a promising means of doing this (Boomgard et al., 1986). By
looking at key final product markets one at a time and reviewing the entire
network of resource flows from raw materials to consumer, the subsector
approach integrates analysis of the relevant manufacturing, commercial and
service segments of the economy. And by including large and small firms
together, it provides useful indications of their competitive or
complementary relationships in alternative channels thereby providing
insights into future dynamics in each commodity subsystem.
i Finally, we need a detailed review of the links between rural
infrastructure and the stimulation of rural nonfarm activity. Questions of
sequencing, complementarities, substitutability, necessary collateral in-
puts, and effective methods of financing and maintenance remain obscured.
C. Magnitude of MultiRliers
Based on the limited evidence available to date, we estimate
Africa's rural agricultural growth multipliers to be in the order of 1.5.
That is, a $1 increase in agricultural incomes will generate about 50 cents
of additional rural income, primarily among suppliers of rural nonfarm
goods and services. This initial estimate places the African multipliers
at about 60 percent of what they appear to be in a few Asian countries for
which we have estimates.
Different types of agricultural growth--smallholder as opposed to
estates, cash as opposed to food crops, tree crops as opposed annuals,
mechanized as opposed to animal traction or hand hoe agriculture--may
generate different multipliers. But initial estimates, based on simple
modeling calculations, suggest surprisingly little variation. Contrasting
small farmers and estates, and tree crops as opposed to annuals, we have
found that the multipliers vary little within the range tested. We must

- 36 -
caution that farm management and especially consumption profiles of the
very wealthiest farms remain elusive. As data from these very hlgh income
farmers become available, the range of agricultural growth multipliers may
well widen. But it remains to be seen whether presumably lower rural
consumption linkages will be offset by potentially greater production
links.
We hypothesize that African multipliers are lower than those found
in Asia because of a combination of different policies and different
natural environments. The nature of African rainfall patterns and geology
of river basins preclude cost effective irrigation on a scale as large as
in Asia. Hence backward linkages into pump supply, canal construction and
maintenance, all currently important in Asian countries, will simply be
unavailable in Africa. Population density also remains much lower in
Africa, requiring larger geographic market areas than in Asia to support
minimum viable scales of business activity. This diminishes the
competitiveness of rural nonfarm producers contesting markets with large
urban suppliers. In addition, African consumption patterns seem less
diversified into nonfoods than in Asia. But at this stage it is not
possible to say whether these differences arise from different income
levels, differing preferences for urban and imported goods, measurement
error stemming from the large share of nonmonetized goods and service
transfers in Africa, or simply result from an array of existing fiscal,
trade and pricing policies which couple with lower levels of productive
infrastructure to induce lower second-round supply responses in rural
Africa. We have much still to learn.

FOOTNOTES
We would like to thank Dennis Anderson, Arthur Gibb, Peter Kilby,Carl Liedholm and Vijay Vyas for helpful comments on an earlierdraft. We are likewise grateful to Yacob Fisseha and ChrisWindheuser for help in locating elusive data and to Kwesi Amissahand Nandinee Kutty for research assistance. The views expressedherein are the authors' and should not be attributed to the WorldBank or its affiliated organizations.
2.1 See, among others, Kilby, 1962; Liedholm, 1973; Liedholm andChuta, 1976; Steel, 1977; Chuta and Liedholm, 1979; Page, 15,9;Anderson and Leiserson, 1980; rage and Steel, 1984; Liedholm andMead, 1986; Kilby and Liedholm, 1986; Milimo and Fisseha, 1986;Liedholm and Mead, 1987.
Definitional differences may account for some of the apparentvariation in rural nonfarm employment across countries.Individual country definiticns of rural, age of economicparticipation and female participation rates follow:
Benin: Rural - not explicitly defined. Implicitly incl.udespopulation in localities of less than 9,500 persons.Economically active - all people over 15 years of age.Women's participation rate - 73 percent versus 95percent for men.
Cameroon: Rural. - all areas outside of provincial, departmental,arrondissement and district headquarters and outsideselected settlements over 5,000 with high schools,hospitals or train stations. Economically active -population 6 and over. Women's participation - 38percent versus 62 percent for men.
Chad: Rural - all population living outside of prefectureheadquarters or in localities of less than 5,000 in theSouth and less than 3,000 in the North. Economicallyactive - all people over 15 years of age. Women'sparticipation rate - 28 percent versus 94 percent formen.
Ghana: Rural - localities under 5,000 according to officialdefinition. But economic activity breakdown onlyavailable for towns under 10,000. Data in table referto towns under 10,000 as rural. Economically active -all people over 15 years of age. Women's participationrate - not given explicitly but is evidently 33 percentlower than men's.
Ivory Coast,Bouake Region: Rural - entire Bouake region including rural towns.
Economically active - population aged 15-59. Women'sparticipation rate - not specified.
Malawi: Rural - undefined. Rural towns taken as all urban areasoutside of Lilongwe, Blantyre and Zomba. Economicallyactive - all persons over 10 years of age. Women's

- 38 -
participation rate - 44 percent versus 52 percent formen.
Mali: Rural - areas outside of legally designated "communes".Implicitly settlements over 3,000. Economically active- not defined. Women's participation rate - not given.
Mauritania: Rural - not defined. Taken as all regions except threeexcept with over 85 percent population designated asurban. Essentially all localities under 10,000.Economically active - all persons over 12 years of age.Women's participation rate - 25 percent versus 82percent for men.
Mozambique: Rural - all areas outside 12 major cities. Twelve citysizes not cited. Economically active - all persons over12 years of age. Women's participation rate - 81percent versus 78 percent for men.
Rwanda: Rural - areas outside perfecture headquarters and twoother localities designated as urban. Economicallyactive - all persons over seven years of age. Women'sparticipation rate - not given.
Senegal: Rural - localities less than 1,000. Economically active_ all persons over six years of age. Women'sparticipation rate - 23 percent versus 60 percent formen.
SierraLeone: Rural - census definition, all towns under 5,000. Since
employment not broken down by town, rural defined hereas all districts with at least 75 percent of theirpopulation in localities of under 2,000. Economicallyactive - all persons over 12 years of age. Women'sparticipation rate - equal to that of men. Eachaccounts for 50 percent of labor force.
Tanzania: Rural - regional and district headquarters plus townsover 5,000. Economically active - all persons over fiveyears of age. Women's participation rate - 55 percentversus 54 percent for men.
Togo: Rural - all areas outside Lome and six legallydesignated "communes". Economically active - populationover 12 years of age. Women's participation rate - notgiven.
Zimbabwe: Rural - population living in towns under 2,500. During1969 census urban - any locality over 150 if majority ofmales employed in non-agricultural occupations.Economically active - population over 15. Women'sparticipation rate - 48 percent versus 80 percent formen.

- 39 -
India: Rural - localities with population 5,000 or loss.Economically active - no age cutoff; apparently includesworkers of all ages who worked the major part of theprevious year. Women's participation - 15 percentversus 51 percent for men. Unlike other countries, thisis calculated as a percentage of total rather thanworking age population.
South Korea: Rural - unincorporated rural areas (myeons). Implicitlyincludes settlements under 20,000. Economically active- all persons over 14. Women's participation rate - 33percent versus 79 percent for men.
Taiwan: Rural - undefined. Breakdown here follows Shih (1983)who defines rural as total population minus the fivelargest cities and three metropolitan countries.Effectively excludes all cities over 250,000 as well astwo suburban counties surrounding Taipei. Economicallyactive - all persons over 15. Women's participation -33 percent versus 79 percent for men.
Thailand: Rural - sanitary districts and non-municipal areas i.e.,all non-urban areas. Urban - cities over 50,000; townsover 10.000 and density over 3,000 per square kilometeror which contain an administrative seat; and communesestablished as appropriate and without regard to size.Economically active - all persons over 11. Women'sparticipation - 65 percent versus 77 percent for men.
Av This conception of the rural economic transformation draws on awealth of antecedent views, most explicitly expressed by Johnstonand Kilby (1975), but also drawing on Anderson and Leiserson(1980), Anthony et al. (1979) and Binswanger (1983), Byerlee andEicher (1974), Liedholm (1973), and Vyas and Nathai (1978).
African rural nonfarm entrepreneurs commonly hire or apprentice 50to 70 percent of their workers from outside the family (Aluko,1972 and 1973; Malawi, 1980; Milimo and Fisseha, 1986; Mozambique,1983; Rwanda, 1978; Tanzania, 1982; Wilcock and Chuta, 1982;Williams and McClintock, 1981; all data reported in Haggblade,Hazell and Brown, 1987, Table 13). In agriculture, nonfamilylabor usage averages closer to 15-20 percent of total farmemployment (Eicher and Baker, 1982; Byerlee, 1980; Anthony et al.,1979; Cleave, 1974; Collier and Lal, 1986; Collier, Radwan andWargwe, 1986; Ghai and Radwan, 1983b; Natlon et al., 1979; Norman,1972; Norman, Pryor and Gibbs, 1979; Oates, 1984; Robertson andHughs, 1978; Spencer and Byerlee, 1976; and Weinrich, 1975).Combining these estimates with the labor force data in Table 1, weestimate that about 20 percent of Africa's rural labor force ischanneled through labor markets (60 percent of nonfarm workers x a15 percent employment share + 15 percent of agricultural labor xan 85 percent rural employment share - 22 percent of ruralemployment). Further evidence indicates that exchange laborrarely exceeds five percent of labor flows (Hill, 1977; ILO 1985band 1985c; Norman, Pryor and Gibbs, 1979; Oates, 1984; Weinrich,1975).

- 40 -
See Adayemo, 1985; Aluko et.al., 1972 and 1973; Child, 1977;Liedholm and Chuta, 1976; Olufokunbi, 1981; Schadler, 1968 andThomi and Yankson, 1985. Their data are reproduced in Haggblade,Hazell and Brown, 1987.
1/ See Haggblade, Hazell and Brown's (1987) analysis of data fromZambia, (Milimo and Fisseha, 1986) and Sierra Leone (Liedholm andChuta, 1976).
Kilby (1987) has also begun looking at time series data on nonfarmemployment in Kenya. However, his analysis is not readilycomparable with the others cited here, because his data track only"informal sector" firms, essentially those employing between oneand nine workers. While important on employment and equitygrounds, trends in informal nonfarm activity may not berepresentative of the entire rural nonfarm economy given that the"informal sector" accounts for only about 20 percent of nonfarmactivity (Ndua and Ng'ethe, 1984).
2/ Vanvali's data are reproduced in Haggblade, Hazell and Brown(1987).
IQ/ Table 1 indicates that between 7 and 30 percent of the Africanrural labor force engages in nonfarm activity as a secondarysource of employment, with agriculture presumably their primaryoccupation. Farm management data indicate this secondaryemployment may be even higher. The data cited earlier (SectionIII.A) indicate that 15 to 65 percent of farmers engage in nonfarmactivities at certain seasons of the year. Given that farmemployment typically accounts for 85 percent of rural employment,this leads to an estimated 13 (15 x .85) to 42 percent (65 x .85)of the rural labor force with secondary nonfarm employment. Wemust add to that the flip side of the coin, the primarily nonfarmworkers who work seasonally in agriculture, to arrive at the totalshare of the rural labor force moving seasonally between farm andnonfarm activities. Given that as much as 75 percent of ruralnonfarm workers may participate in agriculture (Mbithi and Chege,1973), this results in an additional 7.5 to 15 percent of therural laborforce (.75 x 10 to 20 percent primarily engaged innonfarm activity). Thus the total flow lies between about 15 (7.+ 7.5) and 57 percent (42 + 15). Within this interval, we believethat 20 to 40 percent represents the most likely norm.
Considerable evidence indicates that 60 percent of ruralconsumption involves cash purchases, while the remaining 40percent derives from own consumption of home-produced food (seeSection V.A). Combining this with rural consumption data fromSierra Leone (King and Byerlee, 1977) and Nigeria (Hazell andRoell, 1983) results in the following stylized disaggregation ofrural consumption: 40 percent non-marketed, home-produced food; 30percent purchases of locally produced food; 5 percent importedfoods; and 25 percent nonfood goods and services. Given theseparameters, the share of locally produced food in total rural cashexpenditure stands at 50 percent [30/,30 + 5 + 25)]. Specificcomputation for Sierra Leone results in a 40 percent estimate.while use of the Gusau, Nigeria data leads to an estimate of 58

- 41 -
percent. Thus 50 percent probably represents a reasonableaverage.
12/ The model is a two-sector, semi-input-output model in which theoutput of tradables is given exogenously, and the output ofnontradables is elastic and is determined by the region's demandfor nontradables. The demand for nontradables consists ofhousehold demand, which is assumed to be a linear function ofregional value added (or income), and nontradable productionintermediates, which are assumed to be proportional to regionalgross output. Within this model, the regional value addedmultiplier for a one unit increasc in value added from tradablesis 1/(1 - a - fly), where P is consumers' marginal budget share fornontradables, a is producers' nontradable intermediate inputs as aratio of gross regional output, and v is the ratio of value addedto gross regional output.
These results are not strictly Keynesian multipliers (a.1 inSection VII B). Rather they are derived as ratios of the changesin farm and nonfarm income arising from policy-induced movementsalong the production frontier.
See Ashe, 1985; Blayney and Otero, 1985; Deures, 1981; Farbman,1981; Goldmark, Rosengard and Mooney, 1982; Goldmark et al., 1982;Goldmark and Rosengard, 1983 and 1985; Haggblade, 1982; Hunter,1980; Kilby, 1979, 1982 and 1987; Kilby and Bangasser, 1978; Kilbyand d'Zmura, 1985; Lassen, Traore, Brown and Walton, 1985;Levitsky, 1985; Liedholm, 1985; and Livingstone, 1977 and 1980.Liedholm and Mead (1987) provide a particularly succinct recentdistillation of the findings of the small enterprise evaluationliterature.
15/ Lele (1986) reaches this same conclusion through a different chainof reasoning.

- 42 -
IkblJJ: Primary Employment in African RuralNonfarm Enterprises
(percent)
Rural LaborC o u n t r y Force Employed in
Nonfarm Enterprises a/Total Male Female
A. Primary Employment
Benin (1961) 41 10 77Cameroon (1976) 10 - --Chad (1964) 3 4 .1Ghana (1960) 27 13 89Ivory Coast, Bouake Region (1963) 10 -- --Kenya (1970) 28 -- --Malawi (1977) 11 17 4Mali (1976) 8 -- --Mauritania (1977) 21 -- --Mozambique (1963) 9 19 1Nigeria, 3-District W. State (1966) 63 19 87Rwanda (1978) 5 -- --Senegal (1970-71) 18 --Sierra Leone (1974, Males 1976) 14 19 --Tanzania (1978) 6 10 2Togo (1970) 26 -- -Uganda, 4 villages (1967) 20Zimbabwe (1982) 20 -- --
B. Secondary Emoloyment
Benin (1961) 7 -- --Chad (1964) -- 4 --
Western Nigeria, 3 states (1966) -- 20Sierra Leone (1976) -- 11 --
Tanzania (1980) 17 --Zambia, 2 regions 30 -- --
g./ See Note 3 for individual country definitions of rural.
Sources: Beni: Rpubliqua du 0chomey (1904) Nigeria: NteU:r and Zwaring (1070)C_aroo: Repubique Unle du Cameroo (1076) Rvnda: IRanda (1978)Chad: Republique du Tchad (1966) Sasegai: Republique du Senegal (1973)aana: Gbane (1964) Sierra Leone: Halo (1976) frm Dyor.l.. et &I. (1977Ivory Coast: Republiqu. de Cott d'Iveiri (1965) Agregate from Tbom (1083)Ieowa: W. (1972). cited in Cbute and Lledbols (1970) Tanznia, 1976: United Republic of TSnzania (1982blaia: Malawi Governent (1980) Tanznia, 1980: Coller et a1. (1966)
Hall: Republique du Hall (1960) Uganda: V'endt, et ai. (1972)Mauritania: Rpuiblique do Kuriteni. (1979) Z1ia: Ibdiund end Lendahl (1983)
oxbaique: RUpubUca Popuir de Hosalque (1983) Zimabwe: Zibabw. (1965)

- 43 -
Tablo_Z: Share of Nonfarm Earnings in Total RuralIncome in Sub-Saharan Africa
(percent)
Agricultural NonfarmCountry Income Income
A. Total Rural Income
Botswana (1974-75) 56-75 24-44Ghana, Akwapim (1965-66) 58-72 14-28Ghana, Eastern Region (1967-68) 58-82 18-42Ghana, Heads of Household in E. Region 25-50 50-75Ghana, Five Villages 70-84 16-30Ivory Coast, South East Region (1963) 71 29Kenya (1969) 69 31Kenya (1976) 72 28Lesotho (1977-78) 23 77Northern Nigeria, Kano Region 72 28Northern Nigeria, Zaria Region 78 22Sierra Leone (1974) 64 36Sierra Leone (1975-76) 81 19Tanzania (1969) 79 21Tanzania (1975) 77 23
B. Rural Cash Income
Ghana, Akwapim (1965-66) 55-78 22-45Ghana, Cocoa Farmers (1968-70) 77 23Ghana, Eastern Region (1967-68) 45-68 32-55Ghana, Heads of Household in E. Region 17-45 55-83Ivory Coast, Bouake Region (1970) 58-76 24-42Liberia, Western Region (1973) 69 31Tanzania (1969) 64 36Tanzania (1975) 57 43Zambia, Luapuala Province (1977) 79 21Zambia, Three Provinces (1982) 76 24
A/ Remittances account for 2/3 of rural income. Domestic nonfarm incomeis 12 percent of total, or 34 percent of domestic rural value added.
Source: Dotawna: Chernihovsky ot *l. (1985) p.51Mxans: ILW (192f), pp. 51, 53, 54, 57; IW (1085.)Ivory Coast: Ivory Coast (1067)
Kenya: 1W (1982s)Lesotbo: National Accounts, cited In IW (198Sb) p.15
Liberia: Ministry of Planing and Zoomoic Affaira (Liberia). cited In IL (l9821) p.58Nigeria, Kmno Region: Matlon (1070); Zarl Region: Norxma, Pryor nd Oibbs (1079)8ierrs Leone: Chuta and Liadhola (1979)
Tanzania: IL (1982a)
Uganda: Nassel and Parnes (1969) p. 3 15Zmbia, Luapaula: Mlabo (Z_bia), cited In IW (19C2S)
Zmbil, Three Provinces: Due nd Nindunda (1985)

- 44 -
ZEaLlm: "Manitude and Composition ofALriLeg Rurol bnaDers *pl aymt I
Total X ol"mat Cooesit.ic of laf eam Rqmminat
*am lsfars Dnunas Mmutacturing Ccsetruoctim Commerce b abme Other
A. . eetae
AFRICABanin. 1061 55.6 41.4 0.0 17.2 1.2 75.2 3.3 0.0Cameroon. 1976 .9.6 10.4 0.2 23.0 6.6 16.1 31.4 19.9Chad. 194 906.0 8.1 0.0 12.7 6.1 20.6 58.4 0.0Ghana, 1200 73.2 26.6 5.7 26.6 9.1 44.4 12.0 0.0Ivory Coast. eusk. Region. 163 90.0 10.0 0.0 34.1 0.0 50.7 15.2 0.0Malawi, 1977 69.0 11.0 0.6 24.9 14.9 23.5 19.4 16.4Mali, 1976 91.7 6.3 o.e 39.6 0.6 0.0 14.9 34.7Mauritania, 1077 78.2 20.6 1.9 17.3 5.6 34.1 40.9 0.0Moanbiquo, 1080 91.0 9.0 0.0 50.9 5.6 17.6 25.9 0.0Rwenda, 1078 05.1 4.9 0.5 23.4 13.2 11.0 40.2 2.7Senegal. 1070171 62.3 17.7 2.4 34.3 4.3 30.3 20.5 o.aSierra Leon. 1074 66.2 13.8 5.4 20.3 7.9 44.0 21.4 0.0Tanzania, 1978 03.0 6.1 0.0 19.6 0.0 9.6 28.1 47.7Togo, 1970 74.5 25.5 0.1 16.6 4.2 26.7 7.0 42.4Zimbabw. 1902 60.0 20.0 0.0 46.6 0.0 6.1 27.4 17.9
ASIAIndia, 1980 61.1 18.9South Korea, 1660 61.6 16.4Taiwan, 1900 33.1 66.9ThaiLand, 1980 69.3 30.7
_. s loe nt ear 1000 Ebculatlon
AFRICAlenin, l98 265.6 166.0 0.0 32.4 2.2 147.1 6.3 0.0Caron, 1076 359.3 41.7 0.1 9.9 3.6 6.7 13.1 6.3Chad, 1064 302.1 9.5 0.0 1.2 0.6 2.0 5.6 0.0Ghana. 1060 277.6 101.8 5.8 29.4 9.3 45.2 12.2 0.0Ivory Coast, Bake Rlegion, 1963 424.4 47.0 0.0 16.0 0.0 23.6 7.1 0.0Halawl. 1977 374.0 46.3 0.4 11.5 6.9 10.9 0.0 7.6Mali. 1076 333.9 30.3 0.3 12.1 0.2 a.7 4.5 10.5Mauritania, 1977 249.6 65.6 1.3 11.3 3.6 aa.4 26.6 0.0Mboambique. 1060 450.6 44.5 0.0 22.6 2.5 7.6 11.5 0.0Rwanda. 1978 544.0 27.8 2.6 6.5 3.7 3.1 11.2 0.6Senegal. 1970/71 121.3 26.1 0.6 9.0 1.1 10.0 5.4 0.1Sierra Lone. 1974 530.4 65.0 4.6 17.3 6.7 36.2 16.2 0.0Tanzania. 1976 425.8 27.6 0.0 5.4 0.0 2.7 6.4 13.2Togo, 1970 266.5 91.9 0.1 17.1 3.9 24.5 7.8 38.9Zimbabwe. 1982 233.0 58.2 0.; 27.1 0.0 4.7 15.9 10.4
ASIAIndia, 1980 282.0 61.0South Korea, 1080 339.0 75.0Taiwan, 1980 151.0 257.0Thailand. 1965 312.0 137.0
St See Note 3 for individual coantry definitianc of rural and of the workforce.h/ Includes transport.
Sources: Benin: Republique du Dahoney (19064) India: India (1981)Cameroon Ropubliqge du Ca_eroun (1976) South Korea: Korea (10m0a and losob)Chad: Republique du Tobad (1066) Taiwan: Shib (1983) nd China (1962)Ghana: GOana (1964) Thailand: Thailand (1985)Ivory Coast: lopublique do Cote d'Ivoire (1965)Malawi: Fblawi Government (1980)Mali: Mali (1980)Mauritania: Republique Ilamique do auritanie (1979)Hosmbique: Republica Popular do FOC_iqu9 (1083)Rwan": Rwanda (1076)Senegal: Republique du Senegal (1973)Sierra Leoas: Tbomoa (1983)Tanzania: United Republic of Tanzania (1962)Togo: Togo (1974)Zimbabwo: Zimbabwe (1985)

- 45 -
Table_A: Activity Breakdown ofRural Manufacturing Employment
(percent)
Burkina SierraFaso *J Zambia bl Kenya cl NigerLa dl Leone *1
Item 1980 1986 1977 1972/73 1976
Food/AgriculturalProcessing 55 55 22 2 5 f/
Clothing Products 25 6 22 56 53
Wood Products 1 32 43 11 19
Metal Products 8 4 6 4 19
Other 21 3 7 27 4
A/ Eastern ORD, 1980.Six Rural Provinces, 1986.
WJ Central Province Village Centers, 1977.s/ Four States, 1972/73; enterprise, not employment percentages.
/ All Rural, 1976.f/ Includes only bakeries.
Source: Burkina Faso: Wilcock and Chuta (1982); firms below 50 persons.
Kenya: Norcliffe, Freeman, and Miles (1984), cited in Liedholm and Mead
(1986); firms below 50 persons.
Nigeria: Aluko et al. (1972 and 1973); firms below 50 persons.
enterprise, not employment percentages.
Sierra Leone: Liedholm and Chuta (1976); firms below 50 persons.
Zambia: Milimo and Fisseha (1986).
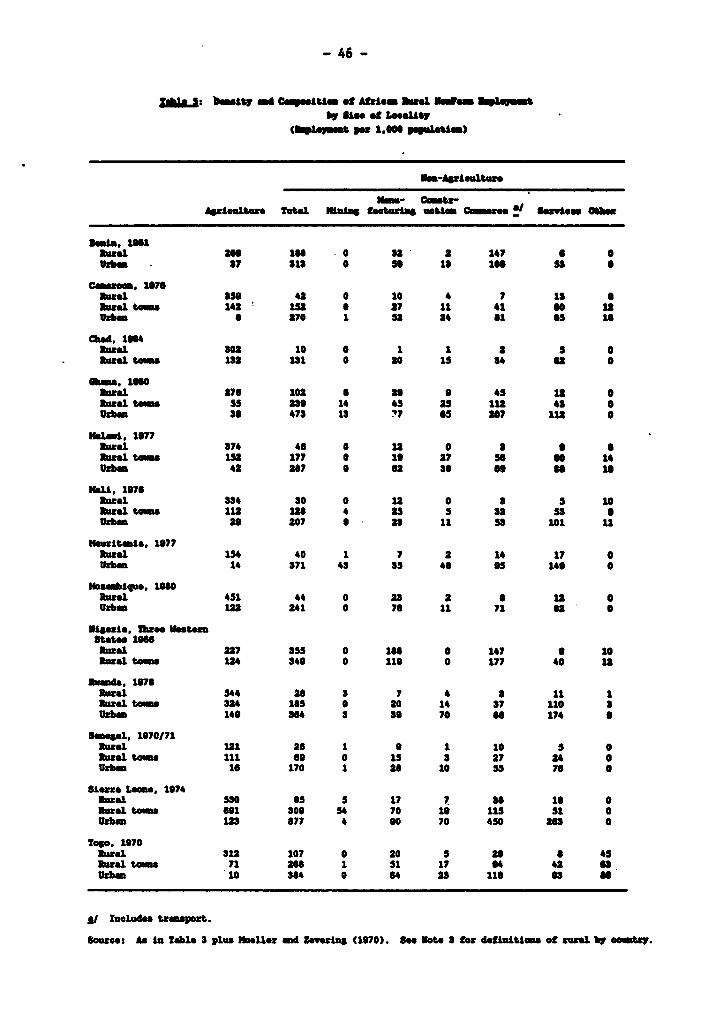
- 46 -
Zi3a&2z bmmatty id Ca.Mettles of Afzi.m Rural Nwiffea aw8.q mtIV Use oft 1a.ml
(_almt 1,000 . puw.lmlm)
SKs- Cmntv-AWIMeUlMz 2etal Iaia. fetmeWim netlm CMent! Uute Otbee~am
Pinto. 166hmtl an6 1in 0 32 a 147 a 0utbin 3 7 313 0 so 13 16 53 0
Cmwzoin 1076anal 350 42 0 10 4 7 13 a
ue _te 142 ' 1 0 27 11 41 60 12Uxb a 270 1 U 24 1 e5 1i
mOA. 1864htl 302 10 0 1 1 a 5 S
zel toe 1s2 131 0 20 15 34 U 0
==a. 1660Naal 276 102 * 20 0 45 12 0atal t4me 55 230 14 45 25 11 43 00Ihs 30 473 1S 77 65 207 112 0
Welai. 1077Ntral 374 46 0 12 0 3 0atal tme _ 12 177 0 1 27 so s0 14
tIhe 42 287 0 a 3s a 1s
HlS. 1976Naal 334 30 0 12 0 3 5 10Nal towrn 112 126 4 2S 5 32 53 0U_he 20 207 9 23 11 53 101 11
Heuzltsia, 1977Rural 154 40 1 7 2 14 17 0Uil_a 14 371 43 35 46 05 149 0
IHs4biu. 106Ruta 451 44 0 23 2 a 12 0Uhbes 122 241 0 76 11 71 62 0
Nigeri, 1hz.s WesteStates le"html 227 355 0 1U 0 147 0 10html tme 124 349 0 116 0 177 40 12
hesia. 1976Raale 544 28 3 7 4 3 11 1Ntal t4una 324 165 0 20 14 37 110 aUxb_ 140 364 3 39 70 6 174 0
htesal, 1070/71html 121 26 1 0 1 10 5 0bal tourse 111 6a 0 15 3 27 24 0
11_e 16 170 1 28 10 35 76 0
Sierra Leas., 1974hMU1 530 a5 5 17 7 is 10 0html town 691 309 54 70 10 115 51 0UxbI 123 877 4 90 70 650 263 0
Togo. 1970htrl 312 107 0 20 5 26 a 45ht1l t4mm 71 2U 1 51 17 04 42 aUzde 10 304 0 64 2S 11U 03 as
SI Inolude tzesporzt.
Source: As In Table 3 plue IHOller od ZIeuw (1970). Se Note. 3 for df*ait4ese ototal by goOta.
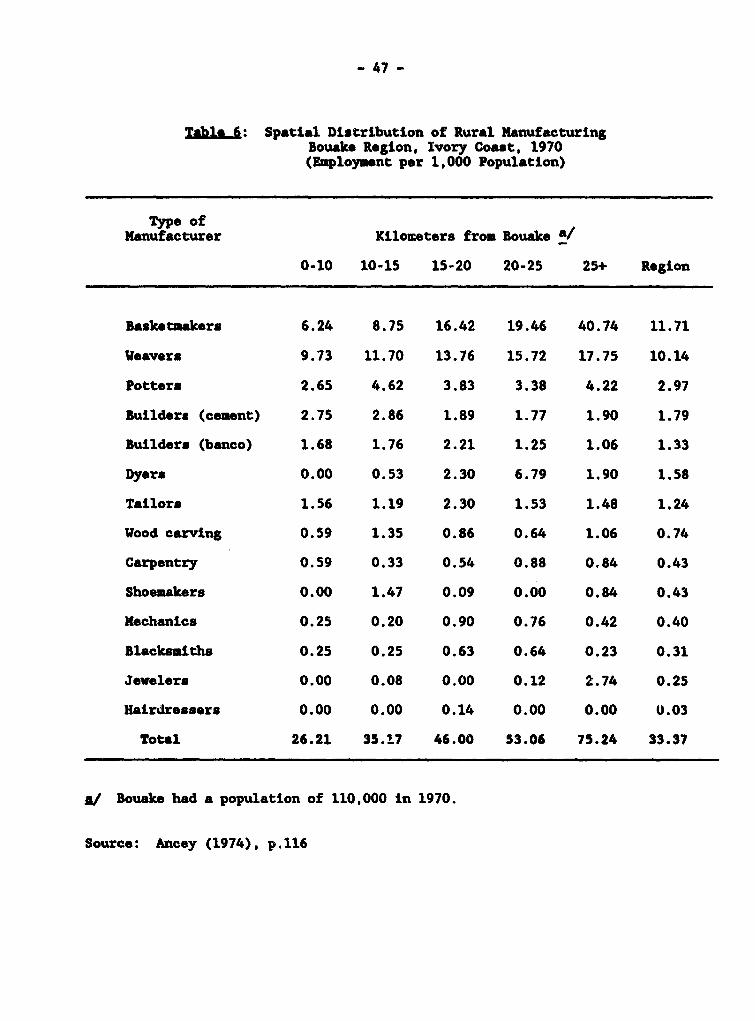
- 47 -
Table 6: Spatial Distribution of Rural ManufacturingBouake Region, Ivory Coast, 1970(Employment per 1,000 Population)
Type ofManufacturer Kilometers from Bouake */
0-10 10-15 15-20 20-25 25+ Region
Basketmakers 6.24 8.75 16.42 19.46 40.74 11.71
Weavers 9.73 11.70 13.76 15.72 17.75 10.14
Potters 2.65 4.62 3.83 3.38 4.22 2.97
Builders (cement) 2.75 2.86 1.89 1.77 1.90 1.79
Builders (banco) 1.68 1.76 2.21 1.25 1.06 1.33
Dyers 0.00 0.53 2.30 6.79 1.90 1.58
Tailors 1.56 1.19 2.30 1.53 1.48 1.24
Wood carving 0.59 1.35 0.86 0.64 1.06 0.74
Carpentry 0.59 0.33 0.54 0.88 0.84 0.43
Shoemakers 0.00 1.47 0.09 0.00 0.84 0.43
Mechanics 0.25 0.20 0.90 0.76 0.42 0.40
Blacksmiths 0.25 0.25 0.63 0.64 0.23 0.31
Jewelers 0.00 0.08 0.00 0.12 2.74 0.25
Hairdressers 0.00 0.00 0.14 0.00 0.00 U.03
Total 26.21 35.17 46.00 53.06 75.24 33.37
g/ Bouake had a population of 110,000 in 1970.
Source: Ancey (1974), p.116

- 48 -
T-ble7Z: Rates of Growth in Nonfar- Employmentby Locality Size
Sierra Leone, 1974-1980(percent compound growth)
Locality SizeActivity
2,000-20,000 20,000-250,000 250,000+
Repairs 15.0 5.2 15.0Radio 22.0 19.2 b/Motor vehicle 17.0 2.4 20.0Watch a/ a/ 13.0
Food Processing 14.0 33.0 21.0Bakery 3.4 14.0 32.0Other 39.0 b/ a/
Woodwork 0.5 8.8 7.6Carving 0.0 b/ 24.0Carpentry -0.6 8.6 3.6Other b/ a/ 0.0
Clothing 0.7 1.8 5.0Tailoring 0.0 3.8 4.9Tie Dyeing -3.0 -8.5 a/Shoemaking -4.3 16.0 6.2Other a/ a/ 0.0
Metalwork -5.8 9.4 10.0Welding 0.0 23.0 6.6Blacksmithing -5.5 1.8 22.0Goldsmithing a/ a/ a/Other 0.0 0.0 0.0
Other Manufacturing a/ 7.2 _/
m/ Greater than zero but less than one percent.k/ Value for 1974 is zero.
Source: Chuta and Liedholm (1982), pp. 104-105.
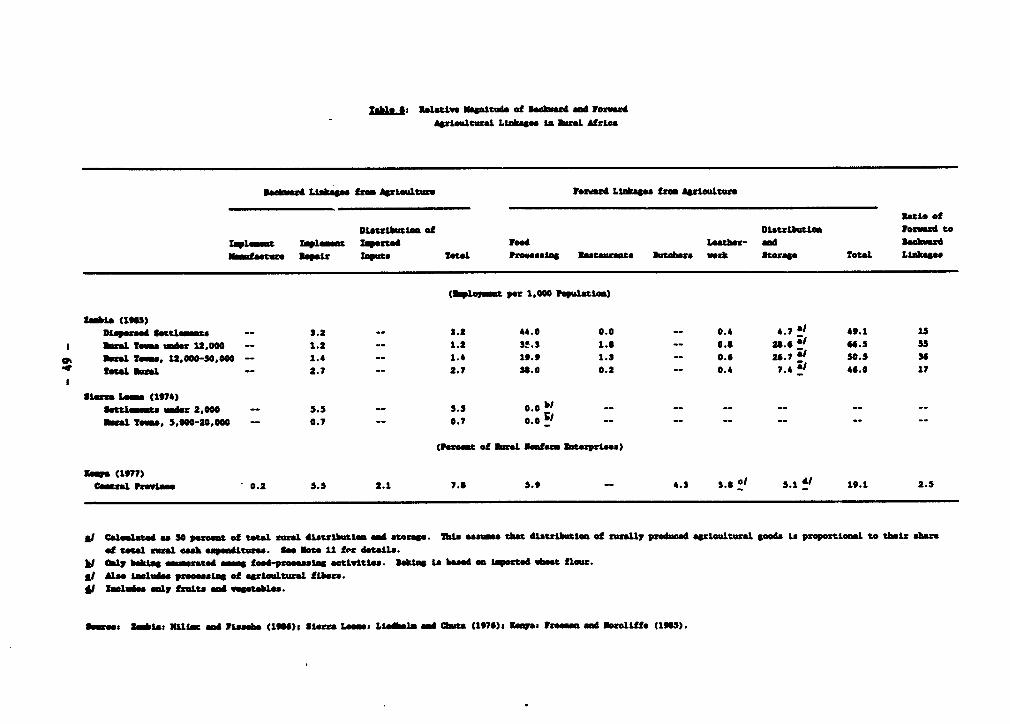
able: Relative Nag.t04 of 3e.hvez4 4 logwz4szxioltua Llkage IA Regal Afrsia
3e~ag4 LiNkale fm tr_umlt Ford& Ltnae fSm Agurltte
Rtatio ofDistribution of DistLbutrsX Vogve04 to
Zqlmmt Tmlmmt Iqiutted Food Leathaw- and Za_rszs_ataz RePSs toot Tota ptooesla Rastaurea Rutabag w*or Stogae Total Ll kage.
(aIogmmt per 1,06 population)
206ia (1965)DipeAaettlna -- 3.2 -- 3.2 44.0 0.0 -- 0.4 4.71 49.1 15
s I TS. _st 11.000 -- 1.2 -- 1.2 M.5 1.9 -- 0.6 26.6 ".5 55Wal sm_, 12,000-50,000 -- 1.4 -- 1.4 1i.9 1.3 -- 0.6 26.7' 30.5 3
< bStaloi1l -- 2.7 -- 2.7 56.0 0.2 -- 0.4 7.41 46.0 17
Slog Lema (1974)lettlmrts _r 2,000 -- 5.5 5.5 0.0 bI -- -- -- -- -- --
aL TWsN. 5,000-20,000 0.7 -- 0.7 0.0 ;/ -- -- -- -- -- --
(otos_t of Rural Soot m htertsos)
1X_a (1977)Cea PCec i g 0.2 5.5 2.1 7.S 5.9 -- 4.3 o. f 5.1 di 19.1 2.5
Al Calated as 50 petoma of tot rural ditzlbutlaa md sto*rop. Ibis ame that distribtLom of ruzly pxodooad atloutual good. in proportional to thelr abasof total sural cash e.p_itue. ea ote 11 fe details.
ki Sly baksn mnstated me _roe-peeIft activities. Rang is bed emported wbmat flou.I LImo Ialuie pecessng of aguriultural fsors.ji mluie emly fruts e getable.
Soee,s kmhia: Whm MO WIsseha (16)i Sierra Lesta Lioeil m bita (1976)t twas Freeman_ ad N_gollffe (196).

T hlL: bierl _oaelwd ExdiftsAr. Bsbvler in Selected Ca trie
Abcwe Dole sare hrginel &We" Shar. ExpEnditure 9lmaticities
ara Zaire _bre flraI Zaire Nor"h Rural Zire No
_AmU Sierra roin. Hod. Artb Goemob Sierra r_ic Hodes Are" Savw Siarre Proince Hude Areot
Nl.Ngerls Lme.Nioerls baoia SlZdla U.Nifet. Lees. N.Higerie Malaysia S. ladle N.NHierie LonsS N.Niglerls .bl ls SIAdis
bed Aleel eNd Te_a.. 10.7 78.7 7 C 0.7 78.5 76.1 679 - 17.7 63.0 0.94 0.92 - 0.SY 0.11
CIethieg "d pao w_* 7.1 7.0 11.4 56. 4.1 6.9 7.4 - 6.1 7.7 1.24 1.06 - 1.86 1.61
eAmw _PWAdh1_m 4.8 . . 8.4 3.1 4.4 . - 8.7 2.4 1.06 . - 1.09 0.77
belag 0.8 . 2.6 4.1 n.*. 0.4 . - 12.4 ".m. 1.40 . - .0 M.*
Traaeet 1.9 2.2 1.5 1.6 2.6 1.7 *.0 - 3.1 3.4 1.41 I.1 - 1.67 1.2I
11_es, 1.1 2.1 0.6 1.4 . 7.1 - 1.9 1.25 3.1 8.48 -
W _ome an Hoelth 1.1 1.4 . 2.6 1.6 1.6 0. - *.2 2.4 1.42 0.87 - 1.7 1.3
serviesiN mmdeimi medReligiousm bliaio 3.3 4.6 18.5 18.1 9.1 4.4 8.1 - 01.7 19.8 1.5 1.1 - 1.76 2.12
8 ~ ~ Los~ Grow*
Pbde, 75.8 s.0 46.4 U.0 70.8 6. - 24.8 4.8 0.98 0.6 - 0A 0.77
I _f_ee 0.4 11.6 . 1.1 17.4 11.8 17.6 - U.6 10.6 1.94 1.41 - 2.06 1.77
Fee 5.4 8.0 10.8 11.8 8.6 1.8 - 18.1 12.0 1.07 0.J6 - 0.10 0.98
efeede X10.9 18.4 . 1.8 7.4 22.6 14.8 - 1.4 6.6 1.1U 1.07 - 1.10 1.17
_nees: beu. Ibrser_ Nipels. I1671-? ObaelI and 01 ell * o1)
SiUn Lean., lbr l (Mao med krtm. 1 7
brim Pimeina. br_te,, Ngewia., 19w71 1om. 1976
1o blepm. 1978-78 0bml N _bell * 1ow
bt Ire, swab zd;e. 16548 01m1 _N bam,. 1106

- 51 -
Figure 1
RuralI Nonfarm Employmentas a Function of GNP/Capita
-~ 80-~~4J
+
60-
40
4-a rt ~~*0 **
a, ~ ~ ~
+
20-
1,000 2,000 3,000
Gross National Product per Capita ($1980)
Note 1: Rural includes rural towns up to 250,OCO in size,
* Africa.
+ Asia.
Source: See Table 3.

- 52 -
Figure 2
RuralI Nonfarm Employmentas a Function of Agricultural Income
80
I ~~~~~~~~~~+
o 60U-I-
5X. *
W 404- *++r +
a,. **
+
2) **20
£4-
100 200 300
Agricultural Income Per Capita ($1980)
* Africa.
+ Asia.
Note 1 Rural includes rural towns up to 250,000 in size.
Source: As in Table 3.

- 53 -
Figure 3
Rural1 Nonfarm Employmentas a Function of Rural Population Density
80 -
C +
60
E
U-
40
20 * *
40--4- *+
E
100 200 300
Rural Population Density per Square Kilometer
* Africa.
+ Asia.
Note 1: Rural includes rural towns up to 250,000 in size.
Source: As in Table 3.

- 54 -
Figure 4
PoDulation Density and Nonfarm Employmentin Seven Districts,
Anambra State, Nigeria
804-
0 *
b { * 0a. ~~~~~~~~~~~*
60k
0~~~~~~~~~~~~~~
0
0 40 * 0+
0 I ~~~~~~~~~~++0
2 0 - + +
.4-
0~~~~~~~~~~~
200 400 600 800 1,000
Rural Population Density per Square Kilometer
Men.o Women.+ Children.
Source: Okafor (1983).

- 55 -
REFERENCES
Adelman, Irma. 1984. "Beyond Export-Led Growth." World Development 12(9): 937-49.
Adesimi, A.A. 1983. "Capital Formation in Traditional Agriculture: ACase Study of Farm Households in Ondo State of Nigeria," Savings andDevelopment 7(2): 151-161.
Adeyemo, Remi. 1983. "Credit as an Input in Marketing: A Study of theNature and Use of Credit by Food Marketers in Anambra State ofNigeria," Savings and Development 7(1): 63-73.
Aluko, S.A.; Oguntoye, O.A.; and Afonja, A.D. 1972. Small ScaleIndustries: Western State of Nigeria. Ile-Ife: Industrial ResearchUnit, University of Ife.
Aluko, S.A.; Oguntoye, O.A.; and Afonja, A.0. 1973. Small ScaleIndustries: Midwestern, Kwara and Lagos State. Ile-Ife: IndustrialResearch Unit, University of Ife.
Ancey, Gerard. 1974. Relations de voisinage ville-campagne. Une analyeappliquee en Bouake acuon ts eln(oed1oWParis, ORSTOM, Memoires ORSTOM No. 70.
Anderson, Dennis and Leiserson, Mark. 1980. "Rural Non-Farm Employment inDeveloping Countries." Economic Development and Cultural Change.(January), pp. 227-248.
Andrae, Gunilla. 1981. Industry in Ghana: Production, Form, and SpatialStructure. Uppsala, Sweden: Scandinavian Institute of AfricanStudies.
Anthony, K.R.M., Johnston, B.F., Jones, W.O. and Uchendu, V.C. 1979.Agricultural Change in Tropical Africa. Ithaca: Cornell UniversityPress.
Ashe, Jeffrey. 1985. The PISCES II Experience: Local Efforts in Micro-Enterprise Development. 2 Vols. Washington, D. C.: U.S. Agency forInternational Developme-it.
Bell, Clive; Hazell, Peter and Slade, Roger. 1982. Project Evaluation inRegional Perspective: A Study of an Irrigation Project in NorthwestMalaysia. Baltimore: The Johns Hopkins University Press.
Berry, Sara S. 1975. Cocoa, Custom and Socio-Economic Change in RuralWestern Nigeria. Oxford: Clarendon Press.
Binswanger, Hans P. 1983. "Agricultural Growth and Rural NonfarmActivities." Finance and Development (June):38-40.
- 56 -
Blayney, Robert G. and Otero, Maria. 1985. "Small and Micro-Enterprises:Contributions to Development and Future Directions for AIDS Support."Washington, D.C.: Employment and Enterprise Development Division.Bureau of Science and Technology. USAID.
Boomgard, James J.; Davies, Stephen P.; Haggblade, Steve, and Mead, DonaldC. 1986. "Subsector Analysis: Its Nature, Conduct and PotentialContribution to Small Enterprise Development." East Lansing:Michigan State University, Department of Agricultural Economics. MSUInternational Development Working Paper No. 26.
Botswana, Government of. 1976. The Rural Income Distribution Survey inBotswana 1974/75. Gabowne, Botswana: Central Statistics uffice,inistry of Finance and Development Planning.
Bouman, F.J.A. 1977. "Indigenous Savings and Credit Societies in theThird World: A Message." Savings and Development 1(4):184-214.
Brandt, Hartmut; Gerken, Elbert and Schubert, Bernd. 1972. The IndustrialTown as a Factor of Economic and Social Development: The Example oJunia, Uganda. Munchen: Weltforum, Ve-rlag.
Byerlee, Derek. 1973. "Indirect Employment and Income DistributionEffects of Agricultural Development Strategies: A SimulationApproach Applied to Nigeria." East Lansing: Michigan StateUniversity, Department of Agricultural Economics. African RuralEmployment Paper No. 9.
Byerlee, Derek. 1980. "Rural Labor Markets in West Africa with Emphasison the Semi Arid Tropics." in ICRISAT, "Proceedings of theInternational Workshop on Socioeconomic Constraints to Development ofSemi-Arid Tropical Agriculture, 19-23 February 1979, Hyderbad, India.pp.348-356.
Byerlee, Derek and Eicher, Carl K. 1974. "Rural Employment, Migration andEconomic Development: Theoretical Issues and Empirical Evidence fromAfrica," in Agricultural Policy in Developing Countries. N. Islam,ed. New York: Macmillan, pp. 273-313.
Bylerlee, Derek; Eicher, Carl; Liedholm, Carl and Spencer, Dunstan, S.C.1977. "Rural Employment in Tropical Africa: Summary of Findings."African Rural Economy Working Paper No. 20. East Lansing, MI:Michigan State University.
Cameroun, Republique Unie. 1976. Recensement General de la Population etde l'Habitat d'Avril, Vol. 1. Yaounde, Cameroun: Bureau Central duRecensement.
Chernichovsky, Dov; Lucas, Robert E.B. and Mueller, Eva. 1985. "TheHousehold Economy of Rural Botswana: An African Case." WashingtonD.C.: World Bank. Staff Working Paper No. 715.

- 57 -
Child, Frank C. 1977. "Small-Scale Rural Industry in Kenya." LosAngeles: University of California. African Studies CenterOccasional Paper No. 17.
China, Republic of. 1982. An Extract Report on the 1980 Census ofPopulation and Housing, Taiwan-Fukin Area, Republic of China.Taipei: Population Census Office of the Executive Yuan.
Chuta, Enyinna and Liedholm, Carl. 1979. "Rural Non-Farm Employment: AReview of the State of the Art." East Lansing: Michigan StateUniversity, Department of Agricultural Economics. MSU RuralDevelopment Paper No. 4.
Chuta, Enyinna and Liedholm, Carl. 1982. "Employment Growth and Change inSierra Leone Small-Scale Industry, 1974-80." International LabourReview 121(1):101-113.
Cleave, John H. 1974. African Farmers: Labour Use in the Development ofSmall-holder Agriculture. New York: Praeger.
Collier, Paul and Lal, Deepak. 1986. Labour and Poverty in Kenya, 1900-1980. Oxford: Clarendon Press.
Collier, Paul; Radwan, Samir, and Wangwe, Samuel; with Albert Wagner.1986. Labour and Poverty in Rural Tanzania. Oxford: ClarendonPress.
Congo, Republique Democratique de. 1968. Enquete sur les entreprisesindustrielles, agricoles, commerciales et de service. Kinshasa,Za1re: Ministere de IEconomie Nationale.
Cote dllvoire, Republique de. 1965. Etude Regionale de Bouake 1962-1964:la Synthese generale. Abidjan, Is ry Coast: Ministere du Plan.
Cote dllvoire, Republique de. 1967. Region du Sud-Est, Etude Socio-economi ue: les Comptes Economiques. Paris: Societe d' Etudes pourle Deveiopment Economique et soc al.
Dahomey, Republique du. 1964. Enquete Demographique au Dahomey, 1961,Resultats Definitifs. Paris: Republique Francalse, Ministere de laCooperation, INSEE.
DeLancey, Mark V. 1978. "Savings and Credit Institutions in Rural WestAfrica: Introduction." Rural Africana 2(Fall):1-8.
Delgado, Christopher L. 1979. "The Southern Fulani Farming System inUpper Volta: A Model for the Integration of Crop and LivestockProduction in the West African Savannah." East Lansing: MichiganState University, Department of Agricultural Economics. AfricanRural Economy Paper No. 20.

- 58 -
Delgado, Christopher L. 1984. "The Role of Science and Policy inAlleviating Long-Run Food Production Problems in Africa." (Mimeo)Paper presented atthe 67th meeting of the Board for InternationalFood and Development (BIFAD), Washington, D.C., Dec. 5.
Devres, Inc. 1981. "Small Scale Enterprise (SSE) Development: A Summaryof Descriptions and Evaluations of SSE Projects and an Assessment ofApproaches Used in SSE Development by AID, the World Bank and OtherFunding Agencies." Washington, D.C.: Devres.
Due, Jean M. and Mindenda, Timothy. 1985. "Women's Contributions toFarming Systems and Household Income in Zambia." East Lansing:Michigan State University. Office of Women in InternationalDevelopment. Working Paper No. 85.
Eicher, Carl K. and Baker, Doyle C. 1982. "Research on AgriculturalDevelopment in Sub-Saharan Africa: A Critical Survey." EastLansing: Michigan State University, Department of AgriculturalEconomics, MSU. International Development Paper No. 1.
Erasmus, Charles T. 1956. "Culture, Structure and Process: The Occurrenceand Disappearance of Reciprocal Farm Labor." Southwestern Journal ofAnthropology 12: 444-469.
Farbman, M. 1981. The Pisces Studies: Assisting the Smallest EconomicActivities of Urban Poor. Washington, D.C.: USAID.
Fluitman, Fred. 1983. "The Socio-Economic Impact of Rural Electrificationin Developing Countries: A Review of Evidence." Geneva: WorldEmployment Programme Working Paper, WEP 2-22/WP. 126.
Food and Agriculture Organization. 1986. African Agriculture: The Next25 Years. Rome, FAO.
Freeman, Donald B. and Norcliffe, G.B. 1985. "Rural Enterprise in Kenya:Development and Spatial Organization of the Nonfarm Sector."University of Chicago, Department of Geography. Research Paper No.214.
Ghal, Dharam and Radwan, Samir. ed. 1983a. Agrarian Policies and RuralPoverty in Africa. Geneva: ILO.
Ghai, Dharam and Radwan, Samir. 1983b. "Growth and Inequality: RuralDevelopment in Malawi, 1964-78." in Dharam Ghai and Samir Radwan ed.Agrarian Policies and Rural Poverty in Africa. Geneva: ILO.
Ghana, Census Office. 1964. 1960 Popoulation Census of Ghana. Accra,Ghana.
Gibb, Arthur. 1974. 'Agricultural Modernization, Non-Farm Employment andLow Level Urbanization: A Case Study of a Central Luzon Sub-Region."Ph.D. Thesis, University of Michigan.

- 59 -
Goldark, Susan; Deschamps, Jean-Jacques; Recinnos, Joseph; and Glover,Beatrice. 1982. An Impact Evaluation of The Industrial Bank ofPeru's Rural Development Fund. Washington, D.C.: DevelopmentAlternatives, Inc.
Goldmark, Susan; Mooney, Timothy and Rosengard, Jay. 1982. Aid toEntrepreneus: An Evaluation of the Partnership for ProductivityProject in upper Volta. Washington, D.C.: Development Alternatives,Inc.
6oldmark, Susan and Rosengard, Jay. 1983. "Credit to IndonesianEntrepreneurs: An Assessment of the Badan Kredit Kecamatan Program.Washington, D.C.: Development Alternatives Inc.
Goldmark, Susan and Rosengard, Jay. 1985. A Manual to Evaluate Small-Scale Enterprise Development Projects. Washington, D.C.: U.S.Agency for Internationai Development, Program Design and EvaluationMethods, Report No. 6.
Haggblade, Steve. 1982. Rural Industrial Officer's Handbook. Gaborone,Botswana: Ministry of Camerce and Industry.
Haggblade, Steve; Hazell, Peter; and Brown, James. 1987. "Farm NonfarmLinkages in Rural Sub-Saharan Africa: Empirical Evidence and PolicyImplications." Washington, D.C.: World Bank. Agriculture and RuralDevelopment Deparment Discussion Paper No. ARU 67.
Haggblade, Steve; Liedholm, Carl and Mead, Donald, C. 1986. 'The Effectof Policy and Policy Reform on Non-Agricultural Enterprises andEmployment in Developing Countries: A Review of Past Experiences.'East Lansing: Michigan State University, Departbent of AgriculturalEconomics, MSU. International Development Working Paper No. 27.
Haugerud, Angelique. 1984. 'Household Dynamics and Rural PoliticalEconomy Among Emba Farmers in the Kenya Highlands." Ph.D.Dissertation, Northwestern University.
Hazell, Peter B.R. 1984. 'Rural Growth Linkages and Rural DevelopmentStrategy." (Mimeo) Washington, DeC.: International Food PolicvResearch Institute. Paper prepared for the Fourth European Congressof Agricultural Economics, Kiel, Germany, September 3-7, 1984.
Hazell, Peter B.R.; Ramasamy, C. and Rajagopalan, V. forthcoming. "AnAnalysis of the Growth Linkage Effects of Agricultural AgriculturalGrowth on the Regional Economy." in Peter Hazell and C. Ramasamy ed.Technological Change and Rural Welfare: A Study of the High YieldingRice Yarietles In Tamrli Nadu. India. Washlngton, D.C.: IFPRI.
Hazell, Peter and Ramasamy, C. 1986. "Household Expenditure Patterns andthe Growth of the Nonfarm Economy." (M1imeo) Paper presented at theIFPRI/TNAU Workshop on Growth Linkages, Oatacamund, India, Feb. 14-16, 1986.
Hazell, Peter, B.R. and Roell, Alisa. 1983. 'Rural Growth Linkages:Household Expenditure Patterns in Malaysia and Nigeria." Washington,D.C.: International Food Policy Research Institute. Research ReportNo. 41.
It

- 60 -
Hedlund, Hans and Landahl, Muts. 1983. Migration and Change, RuralZambia. Uppsala, Sweden: The Scandinavian Institute of AtricanStud1es.
Hill, Polly. 1977. Rural Housa: A Village and Setting. Cambridge,England: Cambridge University Press.
Hirschman, A.O. 1958. The Strategy of Economic Development. New Haven,CT: Yale University Press.
Hunter, John. 1979. "The Successful and the Unsuccessful Enterprise: AnAnalysis of Fifty Small Business Enterprises Supported by theBotswana Enterprises Development Unit." Gaborone, Botswana: Instituteof Development Management.
India. 1981. Census of India 1981: Series 1, Paper 3, ProvisionalPopulation Totals, Workers and Non-WorKers. New uelhi: uftice of theReglstrar General and Census Commissioner.
International Labour Office. 1972. Employment, Incomes and Equality: AStrategy for increasing Productive Employment in Kenya. Geneva:ILO.
I.L.O. 1979. Poverty and Employment in Rural Areas of DevelopingCountries. Geneva: ILO. Advisory Committee on Rural Development,Ninth Session, 27 November - 6 December 1979.
I.L.O. 1982a. Basic Needs in Danger: A Basic Needs Oriented DevelopmentStrategy for Tanzania. Addis Ababa: ILO. Job and Skills Programmefor Africa.
I.L.O. 1982b. Disparites de revenus entre les villes et les campagnes auCameroun. Job and Skills Program for Africa (JASPA). Addis Abeba:ILU.
I.L.O. 1982c. Disparites de revenus entre les villes et les campagnes auMali. Job and Skills Program for Africa (JASPA). Addls Abeba: ILU.
I.L.O. 1982d. Disparites de revenus entre les villes et les campagnes auTogo. Job and Skills Program for Africa (JASPA). Addis Abeba: IL.
I.L.O. 1982e. Disparites de revenus entre les villes et les campagnes enAfrique noire francophone: rapport de synthese. Job and SkillsProgram for Africa (JASPA). Addis Abeba: ILO.
I.L.O. 1982f. Rural-Urban Gap and Income Distribution (A Comparative Sub-Regional Study): Fhe Case ot G2hana. Addls Ababa: ILO. Job andSkills Programme tor Atrica.
I.L.O. 1982g. Rural-Urban Gap and Income Distribution (A Comparative Sub-Regisonal S y The Case of Kenya. Addls Ababa: ILU. Job andN i Ple rogramme tor Af rica.

- 61 -
I.L.0. 1982h. Rural-Urban GaP and Income Distribution (A Comrarative Sub-Resional S-t-udy)-: The Ca-se of Lesotho. AaddRs Ababa: IL0. Job andSKlIS Programme tor Atrica.
I.L.0. 19821. Rural-Urban Gap and Income Distribution (A Comparative Sub-Regional Study): The Case of Llberia. AddlS Ababa: IL0. Job anldSk1Ils rrogramme or Atrica.
I.L.0. 1982j. Rural-Urban GaP and Income Distribution (A Comparative Sub-Re 1onal S-tudy): The Case of Za-mbFa. Add1s Ababa: ILU. Job andSk1s Programme for Afr ca.
I.L.0. 1983. Patterns of Industrialization and Impact on Emploment andIncomes in African Countries: The Case of Kenya. Addis Abba: ILU.Job and Skills Programme for Africa.
I.L.0. 1985a. Informal Sector in Africa: Jobs and Skills Programme forAfrica. Addis Ababa: IL0.
I.L.O.Aft98Ib.Smh&Iboltle AgutditiucivitCeaCdsieoEnsimbieal SI dieAh ba:ILo. Job and Skills Programme for Africa.
I.L.0. 1985c. Labor Use and Productivity and Technological Change inAfrican Smaliholder Agriculture: The Case of Sudan. Addis Ababa:IL0. Job and Skills Programme for Africa.
I.L.0. 1985d. Labor Use and Productivity and Technological Change inAfrican Smallholder Agriculture: The Case of Uganda. Addis Ababa:MLr. job and SKIt is Programme tor Africa.
I.L.0. 1985e. Labor Use and Productivity and Technological Change inAfrican Smallholder Agriculture: The Case of Ghana. Addis Ababa:IL0. Job and Skills Programme tor AfrTca.
Johnston, Bruce F. and Kilby, Peter. 1975. Agriculture and StructuralTransformation: Economic Strategies in Late-Develioping Countries.London: Oxford University Press.
Kilby, Peter. 1962. The Development of Small Industry in Eastern Nigeria.Lagos, Nigeria: USAID.
Kilby, Peter. 1979. "Evaluating Technical Assistance." World Development7(3).
Kilby, Peter. 1982. Small Scale Industry in Kenya." East Lansing:Michigan Stace University, Department of Agricultural Economics. MSURural Development Series Working Paper No. 20.
Kilby, Peter. 1987. uSmall-Scale Manufacturing in Kenya," (mimeo)Washington, D.C.: Smithsonian Institution, The Wilson Center.

- 62 -
Kilby, Peter and Bangasser, P. 1978. 'Assessing Technical Cooperation:The Case of Rural Industry." International Labour Review. 117:
Kilby, Peter and D'Zmura, David. 1985. "Searching for Benefits.'Washington, D.C.: U.S. AID. Evaluation Special Study No. 28.
Kilby, Peter and Liedholm, Carl. 1986. "The Role of Nonfarm Activities inthe Rural Economy." Employment and Enterprise Development PolicyAnalysis Discussion Paper #7. Cambridge, MA: Harvard Institute forInternational Development.
King, Robert P. and Byerlee, Derek. 1977. "Income Distribution,Consumption Patterns and Consumption Linkages in Rural Sierra Leone."East Lansing: Michigan State University, Department of AgriculturalEconomics, African Rural Economy Paper No.16.
King, Robert P. and Byerlee, Derek. 1978. "Factor Intensities andLocational Linkages of Rural Consumption Patterns in Rural SierraLeone." American Journal of Agricultural Economics (May): 197-206.
Kitching, G.N. 1977. Economic and Social Inequality in Rural East Africa:The Present as a Clue-to the Past. Monograp Ho. 1. swansea:University of Swansea, Centre for Devlopment Studies.
Korea, Republic of. 1980a. 1980 Population and Housing Census Report:Volume 1, Complete Enumeration, Whole Country. Seoul: NationalBureau of Statistics, Economic Planning Board.
Korea, Republic of. 1980b. 1980 Population and Housing Census Report:volume 2, Fifteen Percent Sample Survey, Economic Activity. Seoul:NWational Bureau of Statistics, Economic Planning Board.
Kreamer, Ross G. 1986. "Gari Processing in Ghana: A Study ofEntrepreneurship and Technical Change in Tropical Africa." CornellInternational Agrticultural Economics Study, AE Research 86-30.Ithaca, New York: Cornell University, Department of AgriculturalEconomics.
Krishna, Raj. 1976. Rural Unemplonment: A Survey of Concepts andEstimates for India. Staff Working Paper No.Z34. Washnngton, D.C.:World Bank.
Lassen, Cheryl; Traore, Richard; Brown, Alex and Walton, Joshua. 1985."Credit and Enterprise Development Training That Reach The SmallProducer Majority in Burkina Faso: Midterm Evaluation of Associationpour la Productivite/Burkina Faso." Washington, D.C.: Partnershipfor Productivity.
Lee, Eddy. 1983. "Export,led Rural Development: The Ivory Coast." inDharam Ghai and Samir Radwan ed. Agrarian Policies and Rural Povertyin Africa. Geneva: ILO.

- 63 -
Lele, Uma. 1986. 'Women and Structural Transformation." EconomicDevelopment and Cultural Change 34(2):195-221.
Leurquin, P. P. 1960. Le niveau de vie des populations rurales du RuandaUrundi. Paris: Editions Nauvelaerts.
Levitsky, Jacob. 1986. World Bank Lending to Small Enterprises: AReview. Washington, D.C.: World Bank, Industry and Flnance' Series,Volume 16.
Liedholm, Carl. 1973. "Research on Employment in the Rural Non-FarmSector in Africa." East Lansing: Michigan State University,Department of Agricultural Economics. African Rural Economy PaperNo. 5.
Liedholm, Carl. 1985. 'Small Scale Enterprise Credit Schemes,Administrative Costs and the Role of Inventory Norms." East Lansing:Michigan State University, Department of Agricultural Economics, MSUInternational Development Working Paper No.25.
Liedholm, Carl and Chuta, Enyinna. 1976. "The Economics of Rural andUrban Small-Scale Industries in Sierra Leone." East Lansing:Michigan State University, Department of Agricultural Economics.African Rural Economy paper No. 14.
Liedholm, C. and Chuta, Enyinna. 1982. "Employment Growth and Change inSierra Leone Small-Scale Industry: 1974-80." International LabourReview, 121:
Liedholm, Carl and Mead, Donald C. 1986. "Small-Scale Industry in Africa:An Overview." in Robert J. Berg and Jennifer S. Whitaker, eds.Strategies for African Development. Berkeley, CA: University ofcalitornia Press.
Liedholm, Carl and Mead, Donald. 1987. "Small-Scale Industries inDeveloping Countries: Empirical Evidence and Policy Implications."East Lansing: Michigan State University.
Livingstone, Ian. 1977. "Rural Indutries for Developing Countries: AnEvaluation of Kenya's Rural Industrial Development Programme."Journal of Modern African Studies 15:2 (June).
Livingstone, Ian. 1980. "Alternative Approaches to Small IndustryPromotion: Tanzania, Kenya and Botswana." Gaborone, Botswana:Institute of Development Management, Occasional Paper No.7.
Luning, H.A. 1967. Economic Aspects of Low Labor-Income Farming.Wageningen, Netherlinds, Centre for Agricultural Publicat0ons andDocumentation, Agricultural Research Report No.699.
Malawi Government. 1980. Malawi Population Census, 1977. Final Report,Volume II. Zombi: Naional Statistical Office.

- 64 -
Malawi Government. 1984. National Sample Survev of Agriculture 1980/81,Volume III, Income and Expenditure, Crop Storage, Livestock,Resources and Nutrition. Zomba, Malawi: National StatisticalOfflce.
Mali, Bureau de Recensement. 1980. Recensement general de la population,decembre 1976: resultats definitifs. 3 vol. Bamako, Mall.
Massel, Benton F. and Parnes, Andres. 1969. "Estiimation of ExpenditureElastioities from a Sample of Rural Households in Uganda." Bulletinof The Oxford Institute of Economics and Statistics 31: 313-329.
Natlon, Peter J. 1979. "Income Distribution Among Farmers in NorthernNigeria: Empirical Results and Policy Implications." East Lansing:Michigan State University, Department of Agricultural Economics.African Rural Economy Paper No. 18.
Matlon, Peter; Eponou, Thomas; Franzel, Steven; Byerlee, Derek and Baker,Doyle. 1979. "Poor Rural Households Technical Change, and IncomeDistribution in Developing Countries: Two Case Studies from WestAfrica." East Lansing: Michigan State University, Department ofAgricultural Economics. African Rural Economy Working Paper No. 29.
Mauritanie, Republique Islamique de. 1979. Recensement General de laPopulation 1977: Volume I, Resultats Prioritaires. Nouakchott:Ministere de PEconomie et des finances.
Mbithi, Philip M. and Chege, Fred E. 1973. "Linkages Between Agricultureand Rural Small Scale Enterprises." in Frank C. Child and Mary E.Kempe ed. Small Scale Enterprise. Occasional Paper No.6. Nairobi,Kenya: Institute of DevelQpment Studies.
Mellor, John W. 1976. The New Economics of Growth: A Strategy for Indiaand The Developing World. Ithaca, New York: Cornell UniversityPress.
- Mellor, John W.; Delgado, Christopher; and Blackie, Malcolm J., eds. 1987.Accelerating Food Production in Sub-Saharan Africa. Baltimore: TheJohns Hopkins University Press.
Mellor, John W. and Johnston, Bruce F. 1984. "The World Food Equation:Interrelations Among Development, Employment, and Food Consumption,"Journal of Economic Literature 22(June):524-531.
Mellor, John and Lele, Uma J. 1973. "Growth Linkages of the New FoodGrain Technologies," Indian Journal of Agricultural Economics 18:1(January-March): pp. 35-55.
Mellor, John W. and Mudahar, Mohinder S. 1974. "Modeling Agriculture,Employment and Economic Growth: A Simulation Model," Occasional PaperNo.75, Employment and Income Distribution Project, Ithaca, New York:Cornell University, Department of Agricultural Economics.

- 65 -
Milimo, John T. and Fisseha, Yacob. 1986. 'Rural Small Scale Enterprisesin Zambia: Results of a 1985 Country-Wide Survey." East Lansing,Michigan State University, Department of Agricultural Economics. MSUInternational Development Papers, Working Paper No. 28.
Miracle, Marvin P., Miracle, Diane F., and Cohen, Laurie. 1980. "InformalSavings Mobilization in Africa." Economic Development and CulturalChange 28:4(July):701-724.
Moore, M.P. 1975. "Cooperative Labor in Peasant Agriculture." Journal ofPeasant Studies 2:270-279.
Mocambique, Republica Popular de. 1983. 1 Recenseamento Geral dePopulacao. Maputo, Mozambique: Corselho Coordenador deReconseamento.
Mueller, P. and Zevering, K.H. 1969. uEmployment Promotion Through RuralDevelopment: A Pilot Project in Western Nigeria." InternationalLabour Review 100 (2): 111-130.
Mueller, P. and Zevering, K.H. 1970. "Socio-economic Conditions in theIfo, Otta, and Ilaro Districts of the Western State of Nigeris." anI.L.O. Fact-finding Report for the Pilot Project for Rural EmploymentPromotion in the Western State, (nonofficial working paper).Ministry of Economic Planning and Reconstruction of the Western Stateof Nigeria, Ibadan.
Ndua, Gichiri and Ng'ethe, Njunga. 1984. uThe Role of the Informal Sectorin the Development of Small and Intermediate Size Cities: TheInformal Sector in Nkuru." Working Paper No.417. Nairobi ,Kenya:Institute of Development Studies.
Norman, David W. 1972. An Economic Study of Three Villages in ZariaProvice. Zaria, Nigeria, Ahmadu Bello University, 5amaruMiscellaneous paper No.37.
Norman, David W.; Pryor, David H.; and Gibbs, Chrisotpher J.N. 1979.'Technical Change and the Small Farmer in Hausaland, NorthernNigeria." East Lansing: Michigan State University, Department ofAgricultural Economics. African Rural Economy Paper No.21.
Norman, David W.; Simmons, Enny B.; and Hays, Henry M. 1982. Farai.ngSystems in the Nigerian Savanna: Research and Strategiestor-Development. Boulder, Colorado: Westview Press.
Oates, Peter M. 1984. The Economic Environment of Farmers in Lindi andMtwara Regions: An Assessment of Constraints and Potential. Vol. 1Main Report. Surrey England: Land Resources Development Centre,Overseas Development Administration.

- 66 -
Okafor, Francis C. 1983. "Rural Employment Diversification in AudinbuaState, Nigeria: Its Mature and Implications for Development.Labour, Capital and Society, 16 (2): 226-39.
Okelo, Jasper A. 1973. "Rural Enterprise Survey in Kakamega District,Kenya." a report of the consultant to Danida (Mimeo) Nairobi, Kenya.
Olufokumbi, Banwo. 1981. "Sources of Credit to Agricultural FoodMarketers in Southwestern Nigeria." Savings and Development5(313):189-201.
Page, John M., Jr. 1979. Small Enterprises in African Development: ASurvey. Washington, D.C.: World Bank. Staff WorKing Paper No. 363.
Page, John M., Jr. and Steel, William F. 1984. Small EnterpriseDevelopment: Economic Issues from African 7xperience. Washington,D.C.: World Bank. Technical Paper No. 26.
Rangarajan, C. 1982. Agricultural Growth and Industrial Performance inIndia. Research Report No. 33. Washington, D.C.: InternationalFood Policy Research Institute.
Robertson, A.F. and Hughes, G.A. 1978. 'The Family Farm in Buganda."Development of Change 9(1978):415-439.
Rogers, Glenn Roy. 1986. "The Theory of Output-Income Multipliers withConsumption Linkages: An Application to Mauritania." Ph.D.dissertation, University of Wisconson, Madison.
Rondinelli, Dennis A. and Ruddle, Kenneth. 1978. Urbanization and RuralDevelopment: A Spatial Policy for Equitable Growth. New York:Praeger.
Rondinelli, Dennis A. 1983. Secondary Cities in Developing Countries:Policies for Diffusing Urbanization. Beverly H1lls, CA: SagePubl1cations.
Rwanda, Bureau National de Recensement. 1978. Recensement general de lapopulation et de l'habitat, 1978. vol.1,2,5. Kigali, Rwanda.
Schadler, K. 1968. Crafts, Small-Scale Industries and IndustrialEducation in Tanzania. Munich: Weltforum Verlag.
Senegal, Republique du. 1973. Ensuete Demographique Nationale 1970-71:Analyse de Resultats du Deuxieme Passage Portant sur la PopulationActive. Dakar: Ministere de Finances et des Affaires Economiques,Direction de la Satistique.
Sharpley, Jennifer. 1981. "Resource Transfers Between the Agriculturaland Non-Agricultural Sectors: 1964-1977," in Tony Killick ed.PaPers on the Kenyan Econormy: Performance, Problems and Policies.Na robi: Heinemann.

- 67 -
Shih, J.T. 1983. "Decentralized Industrialization and Rural NonfarmEmployment in Taiwan." Industry of Free China 60:2 (August):1-20.
Simmons, Emmy B. 1976a. Economic Research on Women in Rural Developmentin Northern Nigeria. OLC Paper No. 10, Washington, D.C.: OverseasUia-son Committee.
Simmons, Emmy B. 1976b. "Rural Household Expenditures in Three Villages inZaria Province, May 1970-uly 1971.0 Samaru Misacellaneous Paper 56,Institute for Agricultural Research, Ahmadu Bello University, Zaria,Nigeria.
Spencer, Dunstan S.C. and Byerlee, Derek. 1976. "Technical Changes, LaborUse, and Small Farmer Development: Evidence from Sierra Leone.eAmerican Journal of Agricultural Economics 58:874-880.
Srivastava, R.K. and Livingstone, I. 1983. "Growth and Distribution: TheCase of Mozambique." in Dharam Ghai and Samir Radwan ed. AgrarianPolicies and Rural Poverty in Africa. Geneva: ILO.
Steel, William F. 1977. Small-Scale Employment in Production inDeveloping Countries: EVidence from Ghana. New York: Praeger.
Steel, William F. 1979. "Development of the Urban Artisanal Sector inGhana and Cameroun," Journal of Modern African Studies. 17(Oct.1979).
Tanzania, United Republic of. 1982. 1978 Population Census Volume VIIBasic Demographic and Socio-Economic Characteristics. Dar es Salaam,Tanzania: ministry or Pianning and Economic Affairs, Bureau ofStatistics.
Tchad, Republique du. 1966. Enquete demographique au Tchad 1964 Tome II.Tableaux statistiques detailies. Paris: Republique Francalse,Secretariat dEtat aux Affaires Etrangeres Charge de la Cooperation.
Thailand. 1985. Report of the Labor Force Survey, Whole Kingdom, Round 1,January 1985. Bangkok: National Statistical Office.
Thomi, W.H. and Yankson, P.W.K. 1985. Small Scale Industries andDecentralization in Ghana: A Preliminary Report on Small ScaleIndustries in Small and Medium Sized Towns in Ghana. Frankfurt andAccra: Institut fur Wirtschaftsund Sozialgeographie and Department ofGeography.
Thomas, Armand C. 1983. The Population of Sierra Leone: An Analysis ofPopulation Census Data. Freetown.
Togo, Ministere du Plan, Direction de la Statistique. 1974. Recensementgeneral de la population (mars-avril 1970). 3 vol. Lome, Togo.

- 68 -
Vanvali, M. 1985. *Reflexions Interrogatives sur V'Emploi Rural Non-Agricole en Rwander en 1983." Kigali, Rwanda: (Mimeo) Mtinstre ofPlan, December.
Weinrich, A.I.K.H. 1975. African Farmers in Rhodesia: Old and NewPeasant Communities in Karangaland. New York: Oxford UniversityPress.
Wilcock, David and Chuta, Enyinna. 1982. "Employment in Rural Industriesin Eastern upper Volta." International Labour Review. 121(July/Aug.): 455-68.
Williams, K.G. and McClintock, H. 1981. Small-Scale Enterprises in Meruand Bungoma Districts, Kenya. Kenya Research Project Working PaperV1o. 1. Nottingham, England: University of Nottingham, Institute ofPlanning Studies.
World Bank. 1981. Accelerated Development in Sub-Saharan Africa: AnAgenda for Action. Washington# D.C.: World Bank.
World Bank. 1982. Trade and Employment Policies for IndustrialDevelopment. Washington, .C.: world Bank.
World Bank. 1983. Thailand: Rural Growth and Employment. Washington,D.C.: World Bank.
World Bank. 1987. 1987 World Development Report. Washington, D.C.: WorldBank.
Zimbabwe, Central Statistics Office. 1985. 1982 Population Census: MainDemographic Features of the Population of Zimbabwe: An Advarnfce-ReportBased on a len vercent bampie. HarareMfZibabwe.
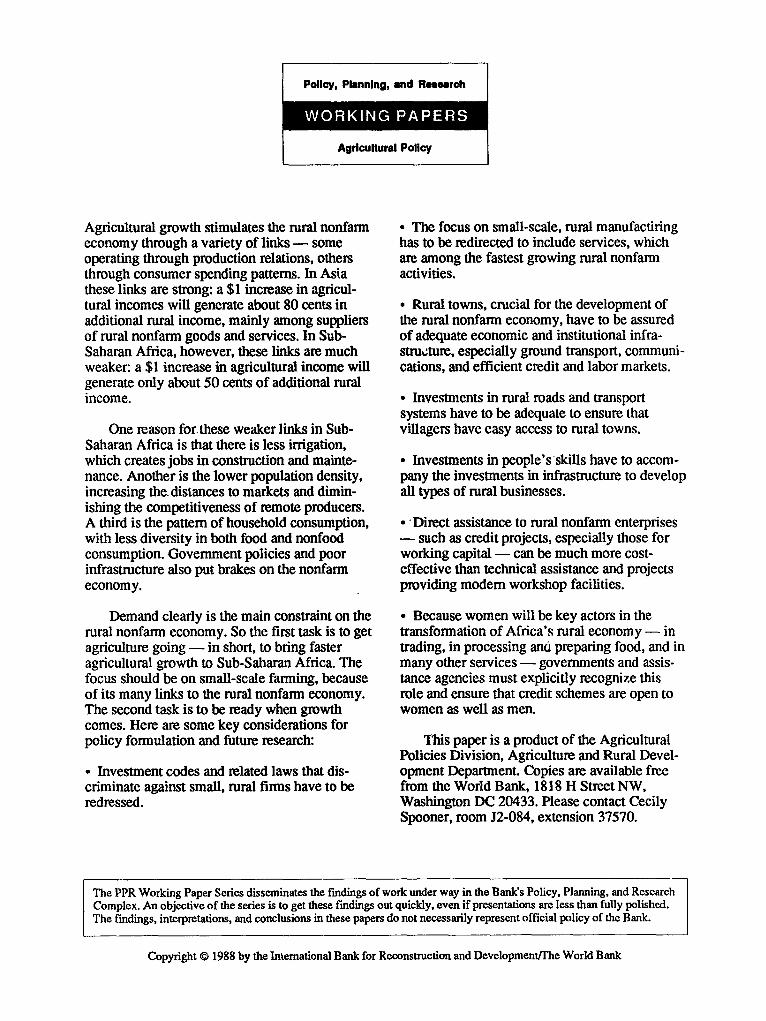
Polac,Pnning, and R"entrh
Agricultural Policy
Agricultural growth stimulates the rural nonfarm * The focus on small-scale, rural manufactiringeconomy thiough a variety of links - some has to be redirected to include services, whichoperating through production relations, others are among the fastest growing rural nonfarmthrough consumer spending pattems. In Asia activities.these links are strong: a $1 increase in agricul-tural incomes wili generate about 80 cents in * Rural towns, crucial for the development ofadditional rural income, mainly among suppliers the rural nonfarm economy, have to be assuredof rural nonfarm goods and services. In Sub- of adequate economic and institutional infra-Saharan Africa, however, these links are much structure, especially ground transport, communi-weaker: a $1 increase in agricultural income will cations, and efficient credit and labor markets.generate only about 50 cents of additional ruralincome. * Investments in rural roads and transport
systems have to be adequate to ensure thatOne reason for these weaker links in Sub- villagers have casy access to rural towns.
Saharan Africa is that there is less irrigation,which creates jobs in construction and mainte- * Investments in people's skills have to accom-nance. Another is the lower population density, pany the investments in infrastructure to developincreasing the. distances to markets and dimin- all types of rural businesses.ishing the competitiveness of remote producers.A third is the pattem of household consumption, * Direct assistance to rural nonfarm enterpriseswith less diversity in both food and nonfood - such as credit projects, especially those forconsumption. Govemment policies and poor working capital - can be much more cost-infrastructure also put brakes on the nonfarm effective than technical assistance and projectseconomy. providing modem workshop facilities.
Demand clearly is the main constraint on the * Because women will be key actors in therural nonfarm economy. So the first task is to get transfonnation of Africa's rural economy - inagriculture going - in short, to bring faster trading, in processing and preparing food, and inagricultural growth to Sub-Saharan Africa. The many other services - governments and assis-focus should be on small-scale farming, because tance agencies must explicitly recognize thisof its many links to the rural nonfarm economy. role and ensure that credit schemes are open toThe second task is to be ready when growth women as well as men.comes. Here are some key considerations forpolicy formulation and future research: This paper is a product of the Agricultural
Policies Division, Agriculture and Rural Devel-* Investment codes and related laws that dis- opment Department. Copies are available freecriminate against small, rural firms have to be from the World Bank, 1818 H Street NW,redressed. Washington DC 20433. Please contact Cecily
Spooner, room J2-084, extension 37570.
The PPR Working Paper Series disseminates thB fadings of work under way in the Bank's Policy, Plading, and ResearchComplex. An objective of the series is to get these findings out quickly, even if presentations are less than fuUy polished.The findings, interpTetations, and conclusions in these papers do not necessarily represent of ficial policy of the Bank.
Copyright 0 1988 by the Intemational Bank for Reconstruction and Development/Te World Bank

Title Author Date
WPS1 Imports Under a Foreign Exchange Cristian Moran March 1988Constraint
WPS2 Issues in Adjustment Lending Vinod Thomas March 1988
WPS3 CGE Models for the Analysis of TradePolicy in Developing Countries Jaime de Melo March 1988
WPS4 Inflationary Rigidities andStabilization Policies Miguel A. Kiguel April 1988
Nissan Liviatan
WPS5 Comparisons of Real Outputin Manufacturing Angus Maddison April 1988
Bart van Ark
WPS6 Farm/Nonfarm Linkages in Rural Sub-Saharan Africa Steven Haggblade April 1988
Peter B. HazellJames Brown
WPS7 Institutional Analysis of CreditCooperatives Avishay Braverman April 1988
J. Luis Guasch
WPS8 Prospects for Equitable Growth inRural Sub-Saharan Africa Steven Haggblade April 1988
Peter B. Hazell
For information on obtaining copies of papers, contact the Research Administrator'Office, 473-1022.


