Embed Size (px)
Citation preview

4 de octubre de 2022
CUADRO MACROECÓNOMICO
PRESUPUESTOS GENERALES DEL ESTADO 2023

2
PRESUPUESTOS GENERALES DEL ESTADO 2023
Indicador diario de actividadNivel de 20T1 = PIB 20T1
Fuente: Ministerio de Asuntos Económicos y Transformación Digital.
Producto Interior Bruto% variación interanual
Fuente: Instituto Nacional de Estadística.
ACTIVIDAD Y PIB
85
90
95
100
105
110
115
mar.-20
abr.-20
may.-20
jun.-20
jul.-20
ago.-20
sep.-20
oct.-20
nov.-20
dic.-20
ene.-21
feb.-21
mar.-21
abr.-21
may.-21
jun.-21
jul.-21
ago.-21
sep.-21
oct.-21
nov.-21
dic.-21
ene.-22
feb.-22
mar.-22
abr.-22
may.-22
jun.-22
jul.-22
ago.-22
sep.-22
85
90
95
100
105
110
115
mar.-20
abr.-20
may.-20
jun.-20
jul.-20
ago.-20
sep.-20
oct.-20
nov.-20
dic.-20
ene.-21
feb.-21
mar.-21
abr.-21
may.-21
jun.-21
jul.-21
ago.-21
sep.-21
oct.-21
nov.-21
dic.-21
ene.-22
feb.-22
mar.-22
abr.-22
may.-22
jun.-22
jul.-22
ago.-22
sep.-22
85
90
95
100
105
110
115
mar.-20
abr.-20
may.-20
jun.-20
jul.-20
ago.-20
sep.-20
oct.-20
nov.-20
dic.-20
ene.-21
feb.-21
mar.-21
abr.-21
may.-21
jun.-21
jul.-21
ago.-21
sep.-21
oct.-21
nov.-21
dic.-21
ene.-22
feb.-22
mar.-22
abr.-22
may.-22
jun.-22
jul.-22
ago.-22
sep.-22
-4,4
17,9
4,2
6,6 6,7 6,8
-10
-5
0
5
10
15
20
21T1
21T2
21T3
21T4
22T1
22T2
-4,4
17,9
4,2
6,6 6,7 6,8
-10
-5
0
5
10
15
20
21T1
21T2
21T3
21T4
22T1
22T2
-4,4
17,9
4,2
6,6 6,7 6,8
-10
-5
0
5
10
15
20
21T1
21T2
21T3
21T4
22T1
22T2

3
PRESUPUESTOS GENERALES DEL ESTADO 2023
210221
210
0
100
200
300
400
500
600
1997
1998
1999
2001
2002
2003
2005
2006
2007
2009
2010
2011
2013
2014
2015
2017
2018
2019
2021
2022
221210
0
100
200
300
400
500
600
1997
1998
1999
2001
2002
2003
2005
2006
2007
2009
2010
2011
2013
2014
2015
2017
2018
2019
2021
2022
221210
0
100
200
300
400
500
600
1997
1998
1999
2001
2002
2003
2005
2006
2007
2009
2010
2011
2013
2014
2015
2017
2018
2019
2021
2022
ago.-1934%
sep.-2218%
Zona euro 22T1 15,5%
0%
5%
10%
15%
20%
25%
30%
35%
40%
45%
2005
2006
2007
2008
2009
2010
2011
2012
2013
2014
2015
2016
2017
2018
2019
2020
2021
2022
Afiliación a la Seguridad SocialMillones de altas
Desempleados <25 añosParo registrado. Miles
Fuente: Ministerio de Inclusión, Seguridad Social y Migraciones, SEPE.
Afiliados con contrato temporal% empleados en el Régimen General
MERCADO DE TRABAJO
ago.-1934%
sep.-2218%
Zona euro 22T1 15,5%
0%
5%
10%
15%
20%
25%
30%
35%
40%
45%
2005
2006
2007
2008
2009
2010
2011
2012
2013
2014
2015
2016
2017
2018
2019
2020
2021
2022
ago.-1934%
sep.-2218%
Zona euro 22T1 15,5%
0%
5%
10%
15%
20%
25%
30%
35%
40%
45%
2005
2006
2007
2008
2009
2010
2011
2012
2013
2014
2015
2016
2017
2018
2019
2020
2021
2022
221
18,0
18,5
19,0
19,5
20,0
20,5
ene
feb
mar abr
may jun jul
ago
sep
oct
nov
dic
2019 2020 2021 2022
18,0
18,5
19,0
19,5
20,0
20,5
ene
feb
mar abr
may jun jul
ago
sep
oct
nov
dic
2019 2020 2021 2022
18,0
18,5
19,0
19,5
20,0
20,5
ene
feb
mar abr
may jun jul
ago
sep
oct
nov
dic
2019 2020 2021 2022

4
PRESUPUESTOS GENERALES DEL ESTADO 2023
SECTOR EXTERIOR
Exportaciones% de variación acumulado desde 19T4
Balanza por cuenta corriente% del PIB
-40.000
-30.000
-20.000
-10.000
0
10.000
20.000
19T4
20T1
20T2
20T3
20T4
21T1
21T2
21T3
21T4
22T1
22T2
Exportación de bienes y serviciosImportación de bienes y serviciosDemanda externa
-40.000
-30.000
-20.000
-10.000
0
10.000
20.000
19T4
20T1
20T2
20T3
20T4
21T1
21T2
21T3
21T4
22T1
22T2
Exportación de bienes y serviciosImportación de bienes y serviciosDemanda externa
-40.000
-30.000
-20.000
-10.000
0
10.000
20.000
19T4
20T1
20T2
20T3
20T4
21T1
21T2
21T3
21T4
22T1
22T2
Exportación de bienes y serviciosImportación de bienes y serviciosDemanda externa
-6%
-4%
-2%
0%
2%
4%
6%
8%
18T1
18T2
18T3
18T4
19T1
19T2
19T3
19T4
20T1
20T2
20T3
20T4
21T1
21T2
21T3
21T4
22T1
22T2
Rentas Cuenta de capital ServiciosBienes Cap. financiación
-6%
-4%
-2%
0%
2%
4%
6%
8%
18T1
18T2
18T3
18T4
19T1
19T2
19T3
19T4
20T1
20T2
20T3
20T4
21T1
21T2
21T3
21T4
22T1
22T2
Rentas Cuenta de capital ServiciosBienes Cap. financiación
-6%
-4%
-2%
0%
2%
4%
6%
8%
18T1
18T2
18T3
18T4
19T1
19T2
19T3
19T4
20T1
20T2
20T3
20T4
21T1
21T2
21T3
21T4
22T1
22T2
Rentas Cuenta de capital ServiciosBienes Cap. financiación
Fuente: Banco de España.

5
PRESUPUESTOS GENERALES DEL ESTADO 2023
Fuente: Banco de España.
*Los datos de 2022 a 2025 son previsiones contenidas en el Programa de Estabilidad.
Deuda de las Administraciones Públicas% PIB
DEUDA PÚBLICA
120,4%118,3%
115,2%
112,4%110,9%
109,7%
116,1%
106%
110%
114%
118%
122%
126%
2020 2021 2022* 2023* 2024* 2025*
Anual Trimestral
120,4%118,3%
115,2%
112,4%110,9%
109,7%
116,1%
106%
110%
114%
118%
122%
126%
2020 2021 2022* 2023* 2024* 2025*
Anual Trimestral
120,4%118,3%
115,2%
112,4%110,9%
109,7%
116,1%
106%
110%
114%
118%
122%
126%
2020 2021 2022* 2023* 2024* 2025*
Anual Trimestral
120,4%118,3%
115,2%
112,4%110,9%
109,7%
116,1%
106%
110%
114%
118%
122%
126%
2020 2021 2022* 2023* 2024* 2025*
Anual Trimestral
120,4%118,3%
115,2%
112,4%110,9%
109,7%
116,1%
106%
110%
114%
118%
122%
126%
2020 2021 2022* 2023* 2024* 2025*
Anual Trimestral
120,4%118,3%
115,2%
112,4%110,9%
109,7%
116,1%
106%
110%
114%
118%
122%
126%
2020 2021 2022* 2023* 2024* 2025*
Anual Trimestral

6
PRESUPUESTOS GENERALES DEL ESTADO 2023
Fuente: INE.
El último dato se refiere al indicador adelantado.
IPCTasa interanual
INFLACIÓN (I)

7
PRESUPUESTOS GENERALES DEL ESTADO 2023
Fuente: Eurostat.
IPC Armonizado avance septiembre 2022Tasa de variación interanual
INFLACIÓN (II)
10,0% 9,3%
0,0%
5,0%
10,0%
15,0%
20,0%
25,0%
30,0%
Esto
nia
Litu
ania
Leto
nia
País
es B
ajos
Eslo
vaqu
ia
Gre
cia
Bélg
ica
Aust
ria
Alem
ania
Eslo
veni
a
Euro
zona
Portu
gal
Italia
Espa
ña
Chi
pre
Luxe
mbu
rgo
Irlan
da
Finl
andi
a
Mal
ta
Fran
cia
10,0% 9,3%
0,0%
5,0%
10,0%
15,0%
20,0%
25,0%
30,0%
Esto
nia
Litu
ania
Leto
nia
País
es B
ajos
Eslo
vaqu
ia
Gre
cia
Bélg
ica
Aust
ria
Alem
ania
Eslo
veni
a
Euro
zona
Portu
gal
Italia
Espa
ña
Chi
pre
Luxe
mbu
rgo
Irlan
da
Finl
andi
a
Mal
ta
Fran
cia

8
PRESUPUESTOS GENERALES DEL ESTADO 2023
IPCTasa intermensual
INFLACIÓN (III)
REDUCCIÓNIVA
ELECTRICIDAD
REDUCCIÓNIMPUESTOS
ELECTRICIDAD
TENSIONES RUSIA-UCRANIA+
INCREMENTO PRECIOSDERECHOS DE EMISIÓN
TENSIONES GEOPOLÍTICAS+
MÁXIMO HISTÓRICO EN COSTES DE ENVÍO DE MERCANCÍAS
GUERRA EN UCRANIA+
CIERREPUERTO SHANGHAI
RUSIAINICIA CORTES DE GAS Y PETRÓLEO
PRIMER PAQUETE
DE MEDIDAS
SEGUNDO PAQUETE
DE MEDIDASBONIFICACIÓN TRANSPORTE
CIERRE DE NORDSTREAM
EFECTOFILOMENA
NORMALIZACIÓNPRECIOS ENERGÉTICOS
TRAS COVID-19
ene feb
–0,6 –0,8–0,4
–0,2
2 0 2 22 0 2 1
–0,3
0,3
3,0
0,8 0,81,2
0,3
1,8
0,80,5 0,5 0,5
1,21,0
0,0
1,9
–0,6*
mar abr may jun jul ago sep oct nov dic ene feb mar abr may jun jul ago sep
Fuente: Instituto Nacional de Estadística. * Indicador adelantado
9
PRESUPUESTOS GENERALES DEL ESTADO 2023
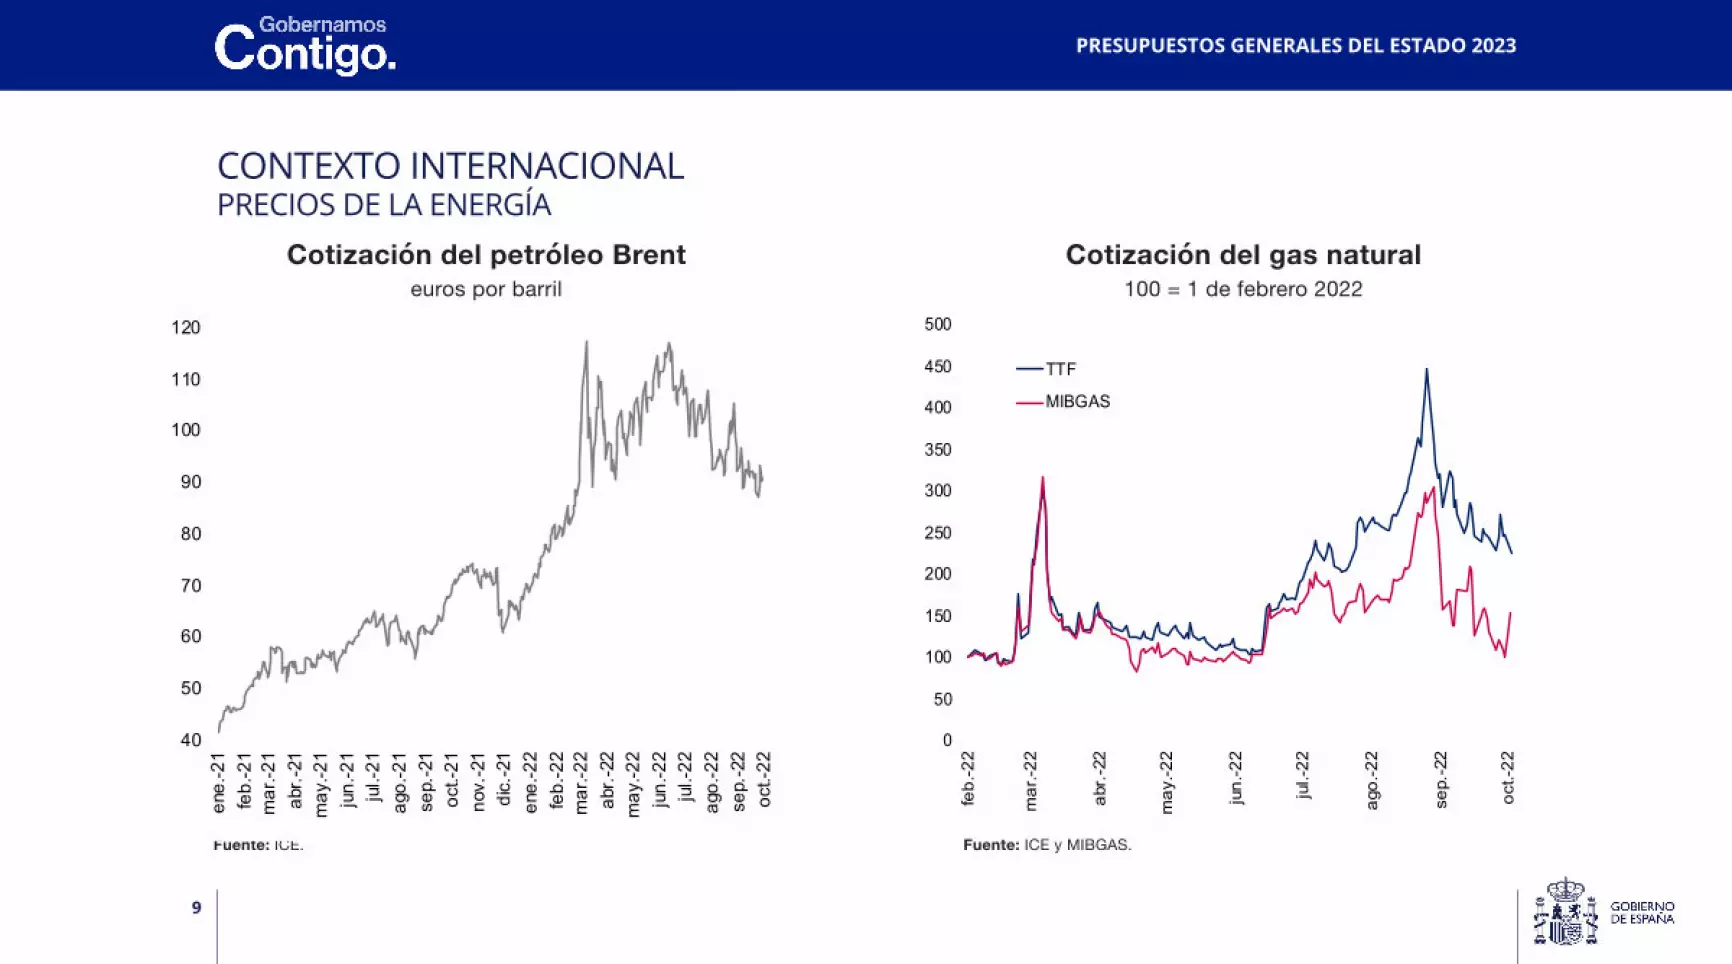
Cotización del gas natural100 = 1 de febrero 2022
Cotización del petróleo Brenteuros por barril
Fuente: ICE. Fuente: ICE y MIBGAS.
CONTEXTO INTERNACIONALPRECIOS DE LA ENERGÍA
40
50
60
70
80
90
100
110
120
ene.-21
feb.-21
mar.-21
abr.-21
may.-21
jun.-21
jul.-21
ago.-21
sep.-21
oct.-21
nov.-21
dic.-21
ene.-22
feb.-22
mar.-22
abr.-22
may.-22
jun.-22
jul.-22
ago.-22
sep.-22
oct.-2240
50
60
70
80
90
100
110
120
ene.-21
feb.-21
mar.-21
abr.-21
may.-21
jun.-21
jul.-21
ago.-21
sep.-21
oct.-21
nov.-21
dic.-21
ene.-22
feb.-22
mar.-22
abr.-22
may.-22
jun.-22
jul.-22
ago.-22
sep.-22
oct.-2240
50
60
70
80
90
100
110
120
ene.-21
feb.-21
mar.-21
abr.-21
may.-21
jun.-21
jul.-21
ago.-21
sep.-21
oct.-21
nov.-21
dic.-21
ene.-22
feb.-22
mar.-22
abr.-22
may.-22
jun.-22
jul.-22
ago.-22
sep.-22
oct.-22
0
50
100
150
200
250
300
350
400
450
500
feb.-22
mar.-2
2
abr.-22
may.-2
2
jun.-22
jul.-22
ago.-22
sep.-22
oct.-22
TTF
MIBGAS
0
50
100
150
200
250
300
350
400
450
500
feb.-22
mar.-2
2
abr.-22
may.-2
2
jun.-22
jul.-22
ago.-22
sep.-22
oct.-22
TTF
MIBGAS
0
50
100
150
200
250
300
350
400
450
500
feb.-22
mar.-2
2
abr.-22
may.-2
2
jun.-22
jul.-22
ago.-22
sep.-22
oct.-22
TTF
MIBGAS

10
PRESUPUESTOS GENERALES DEL ESTADO 2023
95
100
105
110
115
120
125
130
2018
2019
2020
2021
2022
2023
2024
2025
2026
2027
2028
2029
2030
2031
PIB inercial PIB con impacto plan
95
100
105
110
115
120
125
130
2018
2019
2020
2021
2022
2023
2024
2025
2026
2027
2028
2029
2030
2031
PIB inercial PIB con impacto plan
95
100
105
110
115
120
125
130
2018
2019
2020
2021
2022
2023
2024
2025
2026
2027
2028
2029
2030
2031
PIB inercial PIB con impacto plan
Fuente: Elaboración propia.
Impacto macroeconómico del Plan de Recuperación sobre el PIB2015 = 100
PLAN DE RECUPERACIÓNIMPACTO AGREGADO 2021-2031

11
PRESUPUESTOS GENERALES DEL ESTADO 2023
TRANSICIÓN ECOLÓGICA TRANSFORMACIÓN DIGITAL IGUALDAD DE GÉNERO COHESIÓN SOCIAL
EMISIONES GEIGENERACIÓN
ELÉCTRICARENOVABLE
VIVIENDAS CONBANDA ANCHA
HABILIDADESDIGITALES
AVANZADAS
BRECHA DE GÉNERO EN TASA
DE ACTIVIDAD
MUJERESDIRECTIVAS
ABANDONOESCOLAR
TEMPRANO
HOGARES CON TODOS LOS MIEM-
BROS EN PARO
2018 5.878 38,4% 86% - 10,2 32% 18% 1.124
2019 5.463 37,6% 91% - 9,5 33% 17% 1.027
2020 4.586 44,2% 95% - 9,3 35% 16% 1.149
2021 - 46,7% 96% 38% 8,1 33% 13% 1.133
Kg per capita de emisiones de gasescon efecto invernadero
Peso sobrela generación total
Porcentaje sobre el total
Proporción de la población total
Diferencia entre hombres y mujeres
en puntos porcentuales
Porcentaje de mujeres mayores de 15 años
Proporción de la población entre 18 y 24 años que no ha completado la secundaria
Miles
Fuente: Ministerio de Asuntos Económicos y Transformación Digital.
INDICADORES ECONÓMICOS COMPLEMENTARIOS

12
PRESUPUESTOS GENERALES DEL ESTADO 2023
2021 2022 2023
Tipos de interés a corto plazo (Euribor a tres meses) -0,5 0,2 2
Tipos de interés a largo plazo (bono a 10 años, España) 0,3 2,5 3,5
Tipo de cambio (dólares/euro) 1,2 1,1 1
Crecimiento del PIB mundial (excluida la zona euro) 6,4 2,9 3
Crecimiento del PIB de la zona euro 5,2 3,1 0,9
Mercados españoles de exportación 9,3 11,7 4,3
Precio del petróleo Brent (dólares/barril) 70,7 101,8 96,9
Precio del gas natural (euros/MWh) 47,4 114,5 118,8
CUADRO MACROECONÓMICOHIPÓTESIS SUBYACENTES

13
PRESUPUESTOS GENERALES DEL ESTADO 2023
2022 2023
PIB real 4,4 2,1
Consumo privado 1,2 1,3
Consumo público -1 0,4
FBCF bienes equipo 6,6 9,5
FBCF construcción 3,8 8,4
Exportaciones 17,9 7,3
Importaciones 9,9 8,2
2022 2023
Deflactor PIB 4,0 3,8
Deflactorconsumo privado 7,7 4,1
Empleo (ETC) 2,9 0,6
Tasa de paro 12,8 12,2
Capacidad de Financiación (%PIB) 2,5 2,9
CUADRO MACROECONÓMICO

14
PRESUPUESTOS GENERALES DEL ESTADO 2023
Gracias