Embed Size (px)
Citation preview
109
Dynamics of Governance, Investment and economic Growth in Nigeria
Adeniyi O. Adenuga and Osaretin EVBUOMWAN*
Abstract
There is a general argument that, in all countries, the process of economic growth, governance
and investment/capital formation is closely intertwined. The importance of the soundness and
effectiveness of governance in attaining increased investment and sustained economic growth
cannot be overemphasized. The specific objectives were to estimate the short-run dynamics as
well as the error-correction mechanism of governance, investment ratio, price level, prime
lending rate, openness and financial sector development on economic growth. The hypothesis
that governance and investment promotes economic growth in Nigeria was validated. The
findings reveal that the significance of the error correction mechanism (ECM1) supports
cointegration and suggests the existence of long-run steady-state equilibrium between economic
growth, investment and governance. In fact, the ECM1 indicates a feedback of about 58.8 per
cent of the previous quarter’s disequilibrium.
JEL Classification Numbers: C01, C22, E6, E62, G1, G18, H11, H54
Key words: Governance, Economic Growth, Investment, Vector Error Correction, Africa, Nigeria
* Adenuga and Evbuomwan, are Assistant Director and Assistant Economist in Macroeconomic Modeling Division
of the Research Department, Central Bank of Nigeria, Abuja. The views expressed in this paper are those of the
authors and do not represent the opinions of the Central Bank of Nigeria nor its Board of Directors.
Authors’ telephone numbers are: +234946235926, +2348037882841 and +2348068818642.
E-mail : [email protected]; [email protected]; [email protected]; and [email protected]
110
1. INTRODUCTION
In the past years, particularly after Nigeria got political independence in October 1, 1960, there
has been several national development plans. First, was the National Development Plan (1962-
68), during which the public sector intervened heavily in the economy. This belief was based on
the notion that failure of the market could be corrected by the direct involvement of the public
sector, to the extent that the living standard of the Nigerian citizens would be improved.
However, this approach is fraught with inefficiency in the allocation of resources, wastages and
slow growth, in spite of the huge human and natural resources. Comparatively, those countries
on the same level of development with Nigeria in the 1980s, particularly the Asian countries
have since grew and economically developed above what is being recorded currently in Nigeria.
The importance of the soundness and effectiveness of governance in attaining and sustaining economic
growth cannot be overemphasized. The concept of governance adopted in this paper is that of the World
Bank (2010), which covers an agglomeration of the six dimensions of governance - voice and
accountability, political stability and absence of violence, government effectiveness, and regulatory
quality, rule of law and control of corruption. This represents a multidimensional view of the Worldwide
Governance Indicators (WGI) of several countries over 1996 – 2009 prepared by (Kaufmann et al., 2010).
In essence, Governance could be seen as consisting of the traditions and institutions by which authority in
a country is exercised. This includes the process by which governments are selected, monitored and
replaced; the capacity of the government to effectively formulate and implement sound policies; and the
respect of citizens and the state for the institutions that govern economic and social interactions among
them, (World Bank 2010).
Empirical evidence reveals that investment and good governance are key determinants of
sustainable long-term economic growth. In recent years, there has been mounting debate about
the importance of domestic investment to economic development, especially in developing
economies such as Nigeria. In order to contribute to this debate, Akanbi (2010) using time series
spanning 1970 – 2006 empirically examines the pattern of domestic investment that is consistent
with a neoclassical supply-side model of the Nigerian economy. The results revealed that a well-
111
structured and stable socio-economic environment will boost domestic investment over the long-
run.
The rationale for this paper is motivated to add-value to the existing literature by examining the
impact of governance and domestic investment on economic growth in Nigeria under a
democratic regime, using quarterly series. Specifically, the questions this paper attempts to
address are: Does governance have any significant impact on investment and economic growth
in Nigeria?
Following the introduction as part one, the paper is organized as follows. Part two discusses the
trend in investment and economic growth from 1999 to 2010. Part three provides a review of
literature and theoretical framework on the role of governance, investment and economic growth.
Part four presents the econometric methodology and the model while empirical results are
reported and discussed in part five. The analysis of findings, policy implications and conclusion
are covered in part six.
2.0 TREND OF GOVERNANCE, INVESTMENT AND ECONOMIC GROWTH
RATES IN NIGERIA
The various theoretical strands on the link between investment and economic growth shall be
explored in the next section. The role of investment in the growth process cannot be
overemphasized. There are other factors that could contribute to sustainable economic growth.
These include human capital formation, increased productivity and technological progress, as
well as the discovery of new mineral resources (Obadan and Odusola, 2001; p. 31). Therefore,
increased capacity growth requires the government of an economy to formulate and implement
favourable policies and measures that support investment in its entirety. Notwithstanding, there
could be a considerable increase in output in the short-run through more efficient utilization of
existing resources by economic agents (households, firms and government), sustainable
economic growth however, over the long-run requires an increase in productive capacity which
can only be achieved through increasing the rate of investment and improving its quality.
Nigeria has had several types of governments since its independence in 1960. This has brought
about different types of governance methods. From a parliamentary form of government in 1960
112
when the federation comprised three major regions, Nigeria has experienced a number of civilian
and military governments. In 1999, Nigeria embraced democracy and this ended the 16 years of
consecutive military rule. Nigeria‘s present democratization, which culminated in the country‘s
Fourth Republic commenced, bringing with it hopes and expectations given that the country
suffered from chronic economic stagnation and deterioration of most of its democratic
institutions.
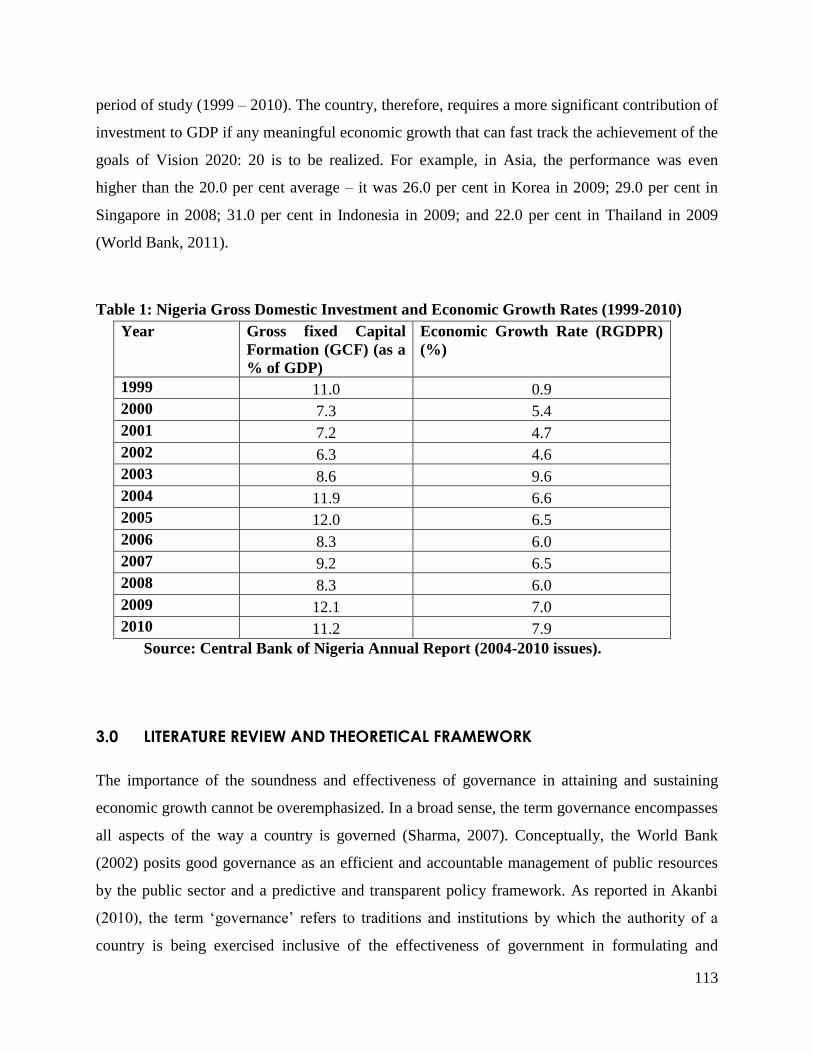
From the available data that show the trend in gross fixed capital formation as a ratio of GDP and
economic growth rate, domestic output growth has shown positive developments since the
advent of democracy in Nigeria in May 1999. Even though at low ebb of 0.9 per cent at the
inception of the democratic era in 1999, it increased to 9.6 per cent at the end of the first
democratic tenure of the Nigerian government in 2003.
The economy witnessed growth rate of 7.9 per cent in 2010 compared with 7.0 per cent in 2009
(table 1 below). The economy was vibrant as growth in domestic output was robust and broad-
based in 2010, due to sound economic management policies and vast economic reforms put in
place by the democratic government. This achieved growth was attributed, largely, to the
performance of the non-oil sector, which grew by 8.5 per cent, complemented by a significant
increase in oil sector output.
Available statistics show that the ratio of gross fixed capital formation (GCF) in GDP was 11.0
per cent in 1999. It declined through 2001 to 8.6 per cent in 2003, and rose to 12.0 per cent in
2005. While it fell to 8.3 per cent in 2008, it increased to 11.2 per cent in 2010 (table 1 below).
From the pattern of the ratio of GCF to GDP, it is evident that there are some elements of
instability in this ratio over the period of study. This development can be attributed to the
government‘s inconsistent policies, inadequate infrastructure and lack of enabling environment
in the country. Therefore, in modeling investment in Nigeria, it is necessary to incorporate the
critical role of governance.
Comparatively, modern growing economies where investment accounts for about 20.0 per cent
or more of GDP, in Nigeria, the same accounted for 12.1 per cent in 2010, the highest during the
113
period of study (1999 – 2010). The country, therefore, requires a more significant contribution of
investment to GDP if any meaningful economic growth that can fast track the achievement of the
goals of Vision 2020: 20 is to be realized. For example, in Asia, the performance was even
higher than the 20.0 per cent average – it was 26.0 per cent in Korea in 2009; 29.0 per cent in
Singapore in 2008; 31.0 per cent in Indonesia in 2009; and 22.0 per cent in Thailand in 2009
(World Bank, 2011).
Table 1: Nigeria Gross Domestic Investment and Economic Growth Rates (1999-2010)
Year Gross fixed Capital
Formation (GCF) (as a
% of GDP)
Economic Growth Rate (RGDPR)
(%)
1999 11.0 0.9
2000 7.3 5.4
2001 7.2 4.7
2002 6.3 4.6
2003 8.6 9.6
2004 11.9 6.6
2005 12.0 6.5
2006 8.3 6.0
2007 9.2 6.5
2008 8.3 6.0
2009 12.1 7.0
2010 11.2 7.9
Source: Central Bank of Nigeria Annual Report (2004-2010 issues).
3.0 LITERATURE REVIEW AND THEORETICAL FRAMEWORK
The importance of the soundness and effectiveness of governance in attaining and sustaining
economic growth cannot be overemphasized. In a broad sense, the term governance encompasses
all aspects of the way a country is governed (Sharma, 2007). Conceptually, the World Bank
(2002) posits good governance as an efficient and accountable management of public resources
by the public sector and a predictive and transparent policy framework. As reported in Akanbi
(2010), the term ‗governance‘ refers to traditions and institutions by which the authority of a
country is being exercised inclusive of the effectiveness of government in formulating and
114
implementing sound policies, the respect for the rule of law, the state of the institutions that
govern against corrupt practices, and the stability of the political environment.
Empirical evidence shows that public investment still represents a large share of total investment
in the majority of developing countries, (Khan, 1996). There is a general argument that, in all
countries, the process of economic growth and investment/capital formation is closely
intertwined. The Neo-classical and Marxist have placed emphasis on capital accumulation as the
engine of economic growth. The Organisation of Economic Cooperation and Development
(OECD) 2001 reveal that a country‘s economic performance over a period is determined to a
large extent by its governance performances (i.e. political, institutional, and legal environment).
It is widely accepted that long-term economic growth of a country will lead to a significant
improvement in the welfare of its citizens.
Extensive literature exists with respect to country-specific and cross country investigations on
broad effects of governance and investment on economic growth (See Martinez-Vasquez,
McNab and Everhart, 2005; Kauffmann and Kraay, 2003; Sharma, 2007; Cooray, 2009; Udah,
2010; and Turner, 2011). While some studies have centered on the role of governance in
stimulating private investment to induce economic performance (e.g Bamidele and Englama,
1998; Apkokodje, 1998; Udah, 2010), others have placed focus on public investment via
government expenditure (Cooray, 2009; and Vasquez et al, 2005).
Blejer and Khan‘s (1994) examined the role of government policy in stimulating Investment and
derived an explicit functional relationship between the principle policy instruments and private
capital formation. Using the model they investigated the extent of the crowding out phenomenon.
Their study made a distinction between government investment that is related to the development
of infrastructure and government investment of other kind.
In addition, Yahyaoui, Chatti & Chtourou (2008) and Atsushi & Yasuhisa (2005) made mention
of public investment, natural resource management as well as reduction of transaction costs as
channels through which state institutions can influence economic growth. While the former
elaborated that state defective institutions create a market for nonproductive activities such as
115
rent seeking, corruption, and also generate high transaction costs which create economic
inefficiencies, Atsushi & Yasuhisa (2005) found that natural resource riches can be a key driver
in spurring growth if a government has the ability to formulate and implement sound and
effective resource management policies. This is relevant to my research due to the fact that some
countries have been able to attain this proper resource management, while others have fallen
victim to the ―natural resource curse‖.
In Nigeria, Apkokodje (1998) identified that in the late 1970s and early 1980s, most developing
countries of Africa (including Nigeria) experienced unprecedented and severe economic crisis.
These crisis manifested itself in several ways such as persistent macroeconomic imbalances,
widening saving-investment gap, high rates of domestic inflation, chronic balance of payment
problems and huge budget deficit His findings elaborated the negative impact of real exchange
rate and high inflation on private investment in Nigeria. The paper also emphasized the adverse
effect of large budget deficits on private capital formation.
Bamidele and Englama (1998) investigated the relationship between macroeconomic
environment and private investment behavior in Nigeria. Their results revealed that high cost of
doing business was attributable to policy reversals, political instability and poor infrastructural
facilities. They therefore cited macroeconomic stability, reliable and efficient infrastructure,
diversified export base, political stability and transparency as propellants of economic growth
and development in Nigeria.
Udah (2010) analyzes the extent to which government size and other factors have been
successful in improving the conditions needed to stimulate private investment in Nigeria.
Government size is found not to complement private investment initiative due to inefficiency in
government expenditure and poor service delivery. On the other hand, the reforms effort in the
banking system yielded positive results due to the significance of private sector credit in
stimulating private investment in Nigeria. Furthermore, interest rate, political stability and
external debt were found to be significant factors.
116
In a similar study like ours, Akanbi (2010) examined the significant role played by governance in
explaining the long-term pattern of domestic investment in the Nigerian economy from 1970 to
2006. The results conform to the findings of existing literature that real output, user cost of
capital, and the level of financial development are significant determinants of domestic
investment in Nigeria. The results from the long-run estimation and the impulse responses
revealed that a well-structured and stable socio-economic environment will boost domestic
investment over the long run. Therefore, in modeling domestic investment for Nigeria, it is
imperative to incorporate the significant role played by governance.
Despite the burgeoning literature that exists on governance and economic growth, limited studies
have particularly focused on the analysis of institutional and political environments as
determining factors in explaining domestic investment and how it translates to sustainable long –
term economic growth in developing economies. The purpose of the present study is to address
the question of how government quality as measured by governance indicators and government
size underpins the growth process through domestic investment in an emerging economy such as
Nigeria.
Theoretically, approaches such as the Keynesian model, cash-flow model and the neoclassical
model have been used to model investment behaviour. The most common being the neoclassical
model (Akanbi, 2010). In the Keynesian model, increase in government expenditure (on
infrastructures) leads to higher economic growth. Contrary to this view, the neo-classical growth
models argue that government fiscal policy (intervention) helps to improve failure that might
arise from the inefficiencies in the market. The simple neo-classical growth model (Solow, 1956;
Swan, 1956) established that output in a given economy at any given time can be produced using
a combination of labour and capital, while the extended version of the model includes technical
progress to account for efficiency. The modern version of the model also makes distinction
between physical and human capital (Romer, 1986; Lucas, 1988).
117
4.0 METHODOLOGY AND THE MODEL
The paper employs a vector error correction mechanism (VECM) technique after cointegration
has been established among the variables. The VECM is adopted to estimate the effects of
governance and investment on economic growth. According to Ang and McKibbin (2007), once
the variables are cointegrated; it becomes easy to distinguish between the short-run dynamics
and long-run relationship. Therefore, to capture both the long-run and the short-run dynamics of
governance, investment, economic growth and other variables in Nigeria, an error correction
model (ECM) using the Johansen and Juselius (1990) multivariate cointegration techniques was
employed. The estimation is conducted using the econometric computer software package,
EViews version 7.2. Quarterly series spanning 1999:q1 to 2010:q4 are adopted. This is to ensure
enough data points to cater for loss of degree of freedom. The data are sourced from the Central
Bank of Nigeria‘s Statistical Bulletin, December 2009 and its 2010 Annual Report.
From the literature and theoretical review, and following Akanbi (2010), the multivariate
equation (1) to be estimated is specified below:
0 1 2 3 4 5 6
...................(1)t
yr ircpi govn plr open fsd
Where: yr = output (real GDP); cpi = price; ir = investment ratio (gross fixed capital formation
divided by GDP); govn = governance (the concept of governance adopted in this paper is that of
the World Bank (2010), which covers an agglomeration of the six dimensions of governance -
voice and accountability, political stability and absence of violence, government effectiveness,
regulatory quality, rule of law and control of corruption ), an average of the worldwide
governance indicators of the World Bank (2010) was utilised; plr = nominal prime lending rate
(lending rate for high networth customers to the deposit money banks in Nigeria); open =
openness of the economy (sum of export and import divided by GDP); fsd = financial sector
development (broad money supply divided GDP).
The a-priori expectations of the explanatory variables are as expressed below:
1 4 2 3 5 6, 0; 0; 0; 0; 0
118
5.0 EMPIRICAL INVESTIGATION AND RESULTS
5.1 Results of Summary Statistics and Unit Root Tests
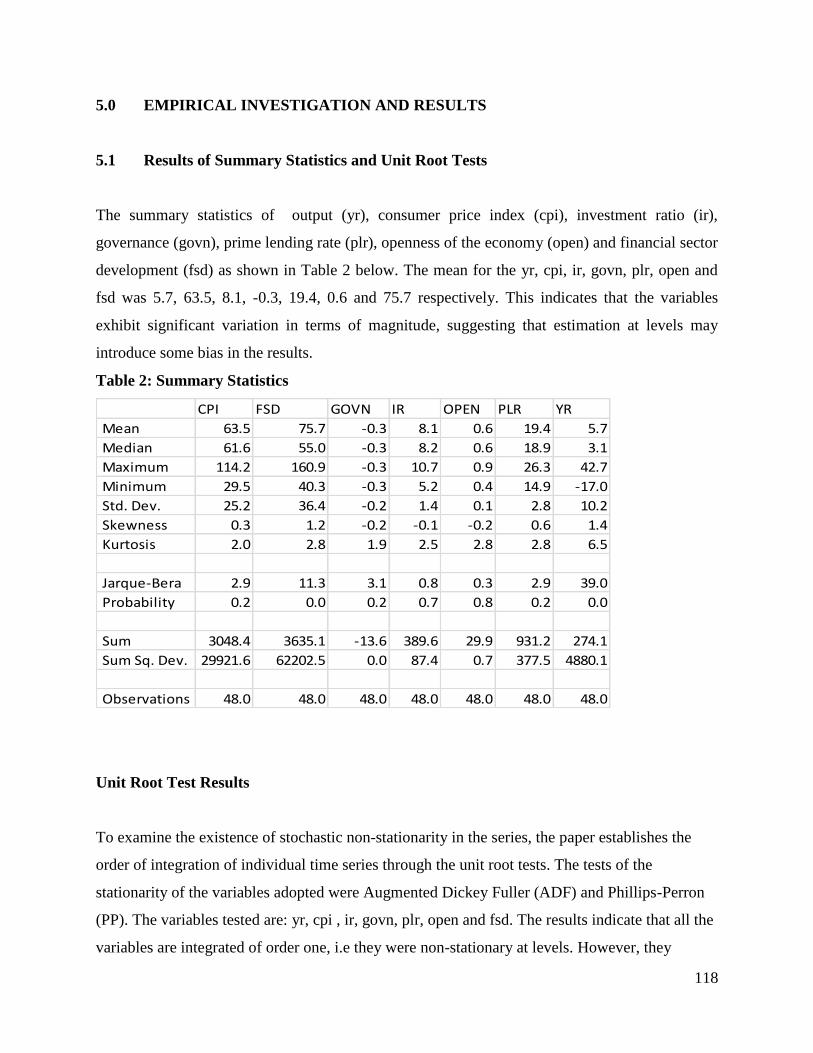
The summary statistics of output (yr), consumer price index (cpi), investment ratio (ir),
governance (govn), prime lending rate (plr), openness of the economy (open) and financial sector
development (fsd) as shown in Table 2 below. The mean for the yr, cpi, ir, govn, plr, open and
fsd was 5.7, 63.5, 8.1, -0.3, 19.4, 0.6 and 75.7 respectively. This indicates that the variables
exhibit significant variation in terms of magnitude, suggesting that estimation at levels may
introduce some bias in the results.
Table 2: Summary Statistics
CPI FSD GOVN IR OPEN PLR YR
Mean 63.5 75.7 -0.3 8.1 0.6 19.4 5.7
Median 61.6 55.0 -0.3 8.2 0.6 18.9 3.1
Maximum 114.2 160.9 -0.3 10.7 0.9 26.3 42.7
Minimum 29.5 40.3 -0.3 5.2 0.4 14.9 -17.0
Std. Dev. 25.2 36.4 -0.2 1.4 0.1 2.8 10.2
Skewness 0.3 1.2 -0.2 -0.1 -0.2 0.6 1.4
Kurtosis 2.0 2.8 1.9 2.5 2.8 2.8 6.5
Jarque-Bera 2.9 11.3 3.1 0.8 0.3 2.9 39.0
Probability 0.2 0.0 0.2 0.7 0.8 0.2 0.0
Sum 3048.4 3635.1 -13.6 389.6 29.9 931.2 274.1
Sum Sq. Dev. 29921.6 62202.5 0.0 87.4 0.7 377.5 4880.1
Observations 48.0 48.0 48.0 48.0 48.0 48.0 48.0
Unit Root Test Results
To examine the existence of stochastic non-stationarity in the series, the paper establishes the
order of integration of individual time series through the unit root tests. The tests of the
stationarity of the variables adopted were Augmented Dickey Fuller (ADF) and Phillips-Perron
(PP). The variables tested are: yr, cpi , ir, govn, plr, open and fsd. The results indicate that all the
variables are integrated of order one, i.e they were non-stationary at levels. However, they
119
became stationary after first difference, which implies that they are I(1) series. Given the unit-
root properties of the variables, we proceeded to establish whether or not there is a long-run
cointegrating relationship among the variables in equation (1) by using the Johansen full
information maximum likelihood method36
. Quarterly data from 1990 to 2010 was utilized to
achieve this.
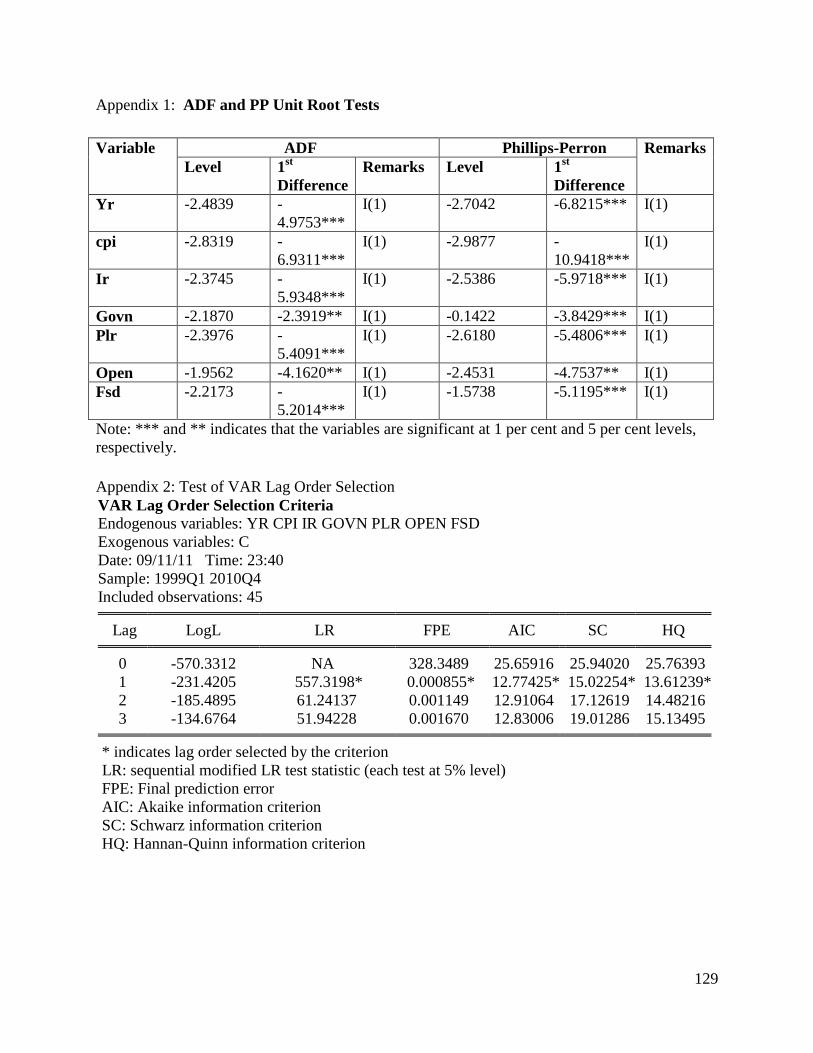
The unit root tests results are presented in appendix 1. Before conducting the cointegration test,
the appropriate optimal lag-length that would give standard normal error terms that do not suffer
from non-normality, autocorrelation and heteroskedasticity was determined. Four (4) lags (since
the model adopts quarterly data and there are large numbers of observations) were allowed at the
beginning. The VAR order selection results indicated lag one for all the information criteria.
5.2 Cointegration Test using Johansen-Juselius Technique
The cointegration tests are undertaken based on the Johansen and Juselius (1990) maximum
likelihood framework. The essence is to establish whether a long-run relationship(s) exist among
the variables of interest.
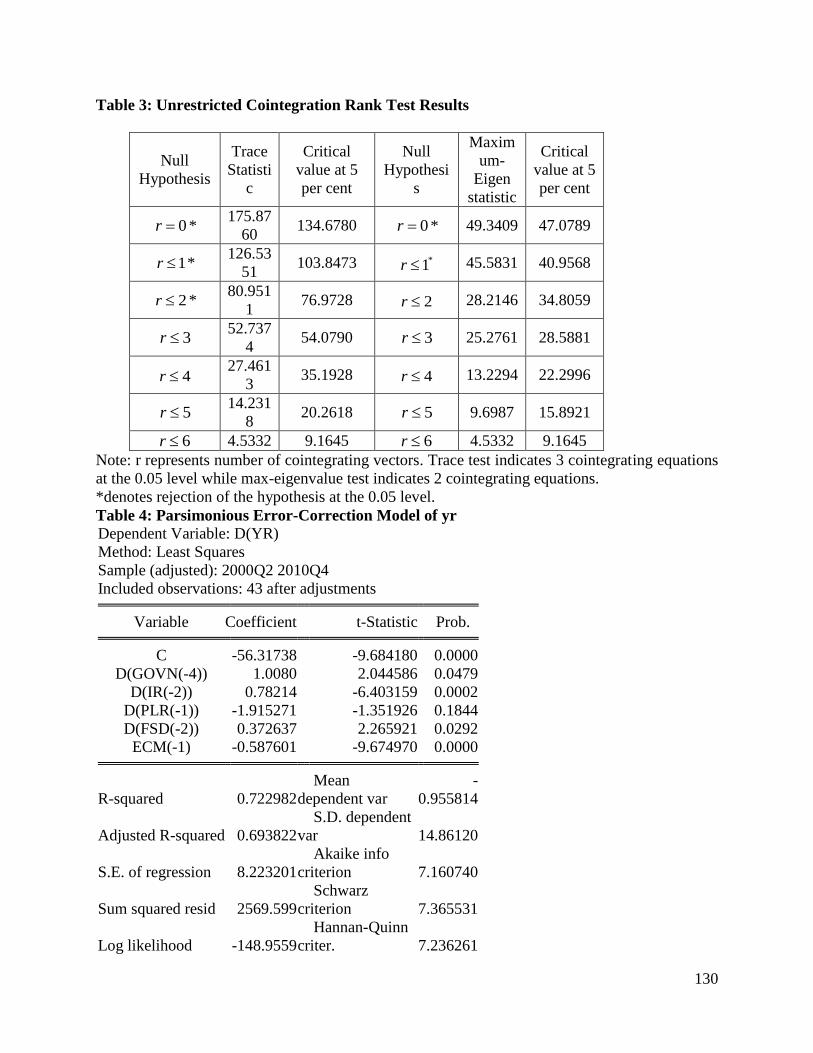
Starting with the null hypothesis that there is no cointegrating vector ( 0r ) in the model, the
results show that there exist three cointegrating relations in the model as both the trace ( trace )
and maximum eigenvalue ( max ) statistics reject the null of 0r against the alternative 1r
at 5 per cent level of significance. This is indicative of three cointegrating vectors in the model,
which drive the relationship toward equilibrium in the long-run (the table 6 below). It is
necessary to note that even though the result of the Johansen cointegration test revealed that the
trace statistic indicates 3 cointegrating equations, the maximum-eigenvalue statistic indicates 2
cointegrating equations, which is a conflict. This is recognized in the literature and it was shown
1 The Johansen/Juselius approach produces asymptotically optimal estimates because it incorporates a
parametric correction for serial correlation (which comes from the underlying vector autoregression (VAR)) and the
system nature of the estimator means that the estimates are robust to simultaneity bias.
Moreover, the Johansen method is capable of detecting multiple cointegrating relationships (if they exist)
and it does not suffer from problems associated with normalization.
120
that since the trace statistics takes into account, all of the smallest eigenvalues, it possesses more
power than the maximal eigenvalue statistic. Furthermore, Johansen and Juselius (1990)
recommend the use of the trace statistics when there is a conflict between the two statistics.
The conclusion drawn from table 3 in the appendix shows that there exists a [C1]long-run
relationship between yr, cpi, ir, govn, plr, open and fsd. The selection was based on the result of
the cointegrating equation with the lowest log-likelihood which was used for the analysis of the
long-run relationship. The cointegrating vector (long-run relationship) for output can be obtained
by normalizing the estimates of the unconstrained cointegrating vector on output. The
parameters/long-run elasticities of the cointegrating vector for the long-run output are presented
in equations (2). The identified cointegrating equation can then be used as an error-correction
term (ecm) in the overparameterised error correction model, which would be refined to derive
the parsimonious model. The component is the error correction term (as indicated in equation
(3)), akin to the residual generated from the static regression when the Engle-Granger (E-G) two-
step approach is adopted.
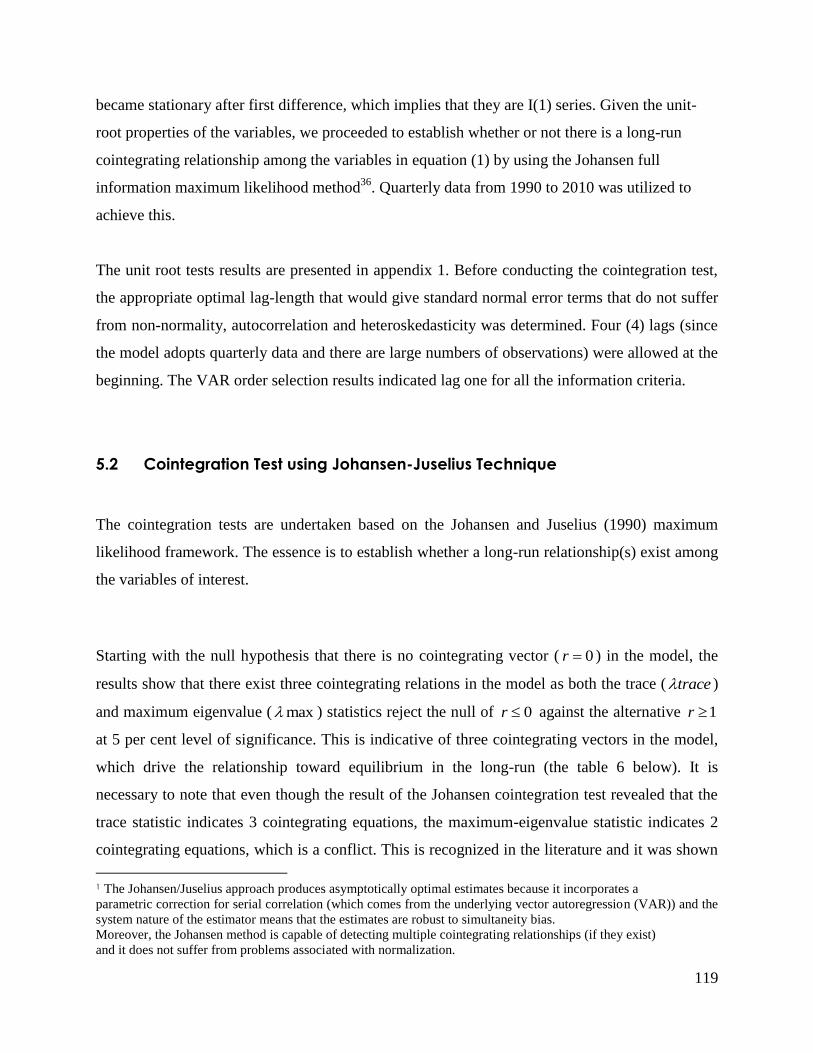
The normalized cointegrating vector was extracted from the cointegration result above and is
expressed as:
0.020068 1.690788 102.5866 0.547302 1.847807 0.021955 64.16180...(2)yr cpi ir govn plr open fsd
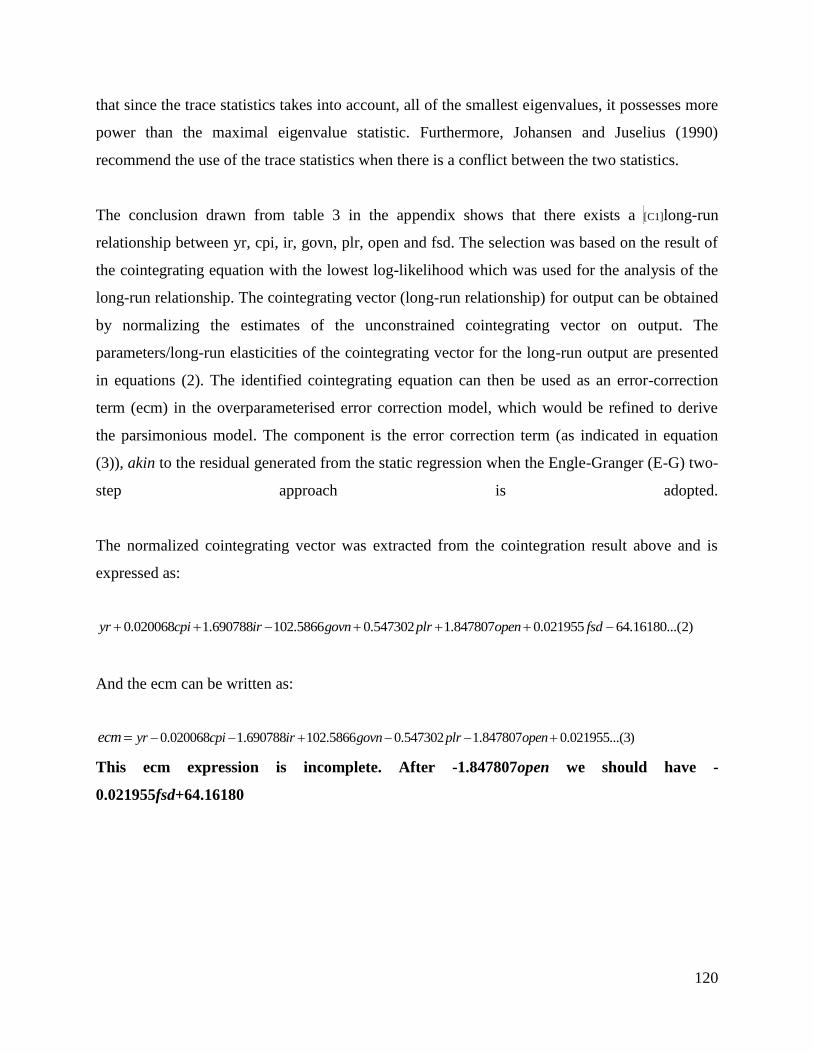
And the ecm can be written as:
0.020068 1.690788 102.5866 0.547302 1.847807 0.021955...(3)yr cpi ir govn plr openecm
This ecm expression is incomplete. After -1.847807open we should have -
0.021955fsd+64.16180
121
5.3 Vector Error Correction Model (VEC) Framework
The results indicate that the variables in the output model in equation (1) tend to move together
in the long-run as predicted by economic theory. In the short-run, deviations from this
relationship could occur due to shocks to any of the variables. In addition, the dynamics
governing the short-run behavior of economic growth are different from those in the long-run.
Due to this difference, the short-run interactions and the adjustments to long-run equilibrium are
important because of the policy implications. According to Engle and Granger (1987), if
cointegration exists between non-stationary variables, then an error-correction representation of
the type specified by equation (4) below exists for these variables. Given the fact that the
variables of the economic growth equation are cointegrated, the next step is the estimation of the
short-run dynamics within a vector error correction model (VECM) in order to capture the speed
of adjustment to equilibrium in the case of any shock to any of the independent variables.
5.3.1 The Over-parameterised Error-Correction Model
The generalized specification framework of the over-parameterised VEC model is expressed
below:
1 1 1 1 1
0
1 0 0 0 0
1 1
1
0 0
...(4)
k k k k k
i t i i t i i t i i t i i t i
i i i i i
k k
i t i i t i t
i i
yr yr cpi ir govn plr
open fsd ecm
where:
indicate the first difference of a series.
0 , i , i , i , i , i , i , i and are the parameters of the model to be estimated.
―i‖ is the number of lags included for the first difference of both the dependent and independent
variables.
1tecm is the lagged error correction term and t represent time period. The error term, t of
equation (4) has the same explanations as that in equation (1) as earlier discussed while is
expected to be less than one, negative and statistically significant. The negative sign of the
122
1tecm term indicate long-run convergence of the model to equilibrium as well as explaining the
proportion and the time it takes for the disequilibrium to be corrected during each period in order
to return the disturbed system to equilibrium.
As is the tradition, the over-parameterised model was reduced to achieve parsimonious models,
which are data admissible, theory consistent and interpretable. Parsimony maximizes the
goodness of fit of the model with a minimum number of explanatory variables. The reduction
process is mostly guided by statistical considerations, economic theory and interpretability of the
estimates (Adam, 1992). Thus, our parsimonious reduction process made use of a stepwise
regression procedure (through the elimination of those variables and their lags that are not
significant), before finally arriving at an interpretable model. The parsimonious error-correction
model is in the appendix as table 4. Thus, the discussion of the parameter estimates of the model
would be useful for policy implications, recommendations and conclusion.
6.0 Analysis of Findings, Policy Implications and Conclusion
6.1 Analysis of Findings
By examining the overall fit of the model, it can be observed that the parsimonious model have
better fit compared with the over-parameterised model, as indicated by a higher value of the F-
statistic 24.79 and it is significant at the 5.0 per cent level. It can be observed from the results
that the coefficient of the error correction term ECM1 (-1) have the expected negative sign and it
is highly significant at the 1.0 per cent level of significance. The significance of the error
correction mechanism (ECM1) supports cointegration and suggests the existence of long-run
steady-state equilibrium between economic growth and governance, prime lending rate and
financial sector development. In fact, the ECM1 indicates a feedback of about 58.8 per cent of
the previous quarter‘s disequilibrium. The adjusted R2
of 0.69 indicates that about 69.0 per cent
of the variation in economic growth is explained by governance in the past one year (four quarter
lag), prime lending rate in the previous quarter and financial sector development in the last six
months (two quarter lag).
123
The findings suggest that in the short run, a unit change in governance performance indicator in
the past one year will induce 1 unit change in output and it conforms to economic theory with 5.0
per cent level of significance. In the case of the investment ratio, a unit change in the investment
ratio lead to a rise of 0.78 unit change in output in the short-run and the coefficient is rightly
signed and in line with theory. The variable is significant at 1.0 per cent level.
The prime lending rate has the correct sign even though is not significant, its inclusion in the
model retains the parsimony of the model. A unit change in financial sector development lagged
by two quarters will lead to a rise of 0.37 unit change in output in the short-run and the
coefficient is rightly signed with 5.0 per cent level of significance.
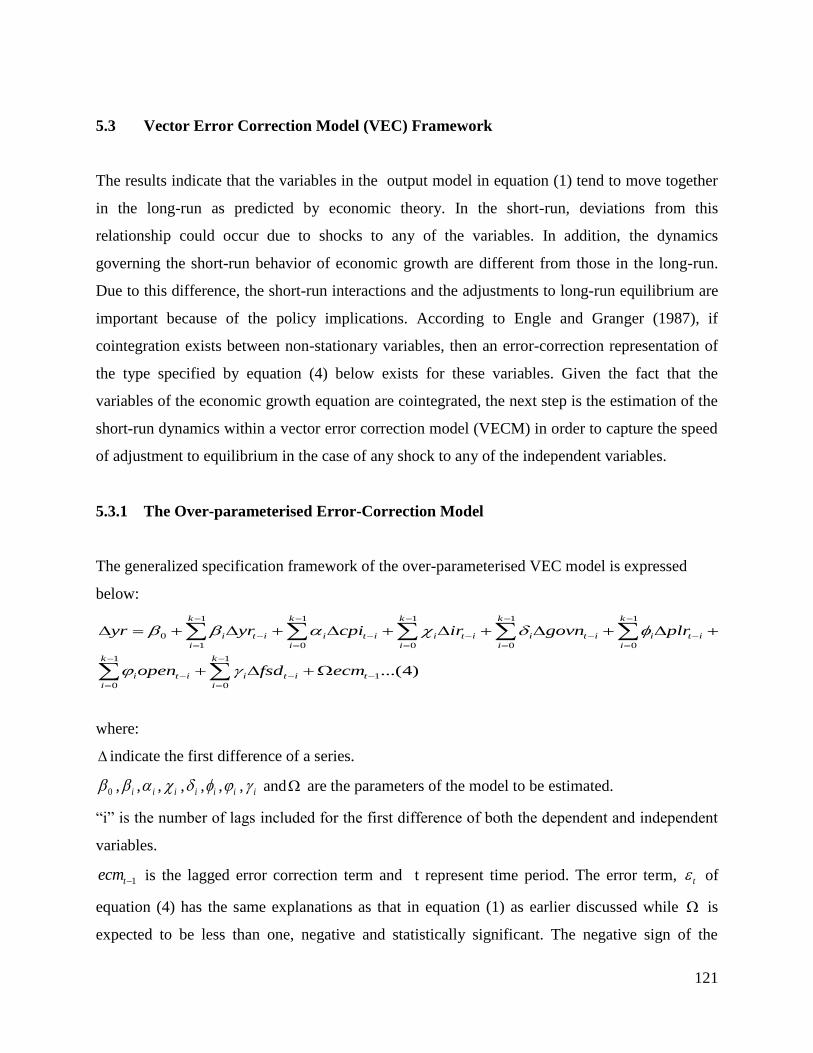
The residual graph, which shows the actual and fitted observations, is depicted below in Fig. 1. It
indicates that the fitted observations are as close as possible to their observed value, which is the
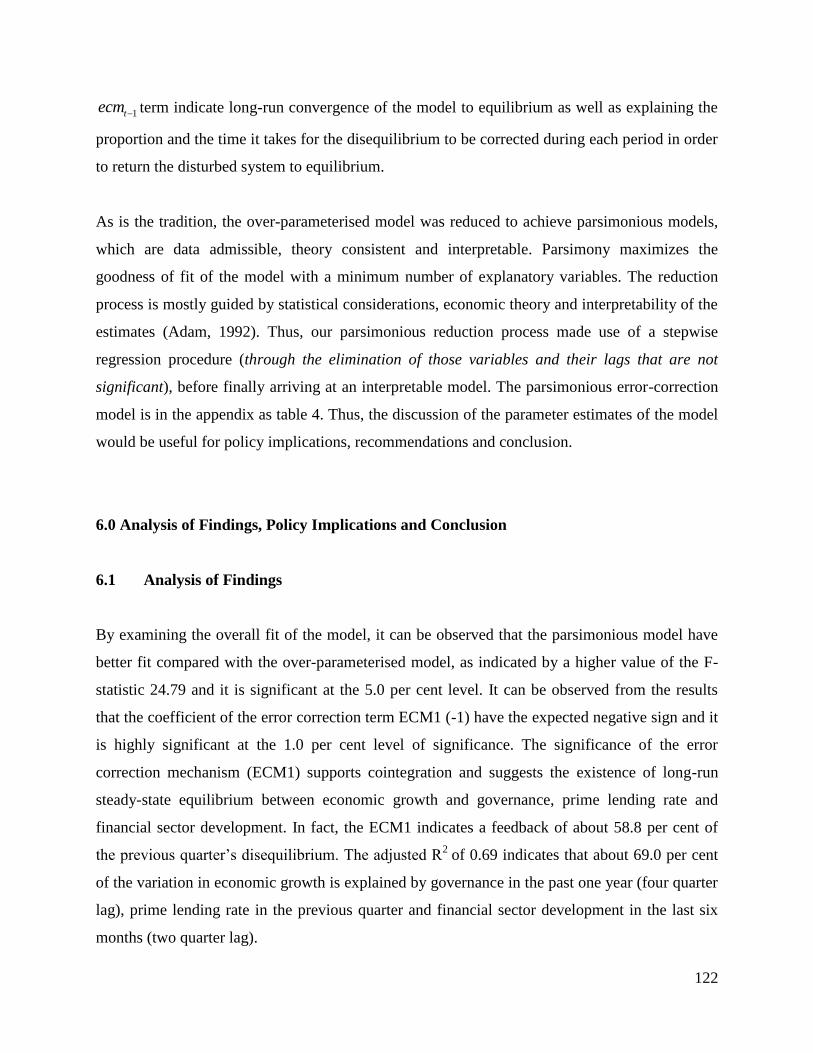
hallmark of ordinary least squares (OLS) estimation. The recursive residual also falls within the
2 . .S E as indicated below in figure 2. The CUSUMSQ test is based on a normalized version of
the cumulative sums of squared residuals. Under its null hypothesis of parameter stability, the
CUSUMSQ statistic will start at zero and end the sample with a value of 1. In the same vein, a
set of 2 standard error bands is usually plotted around zero and any statistic lying outside these
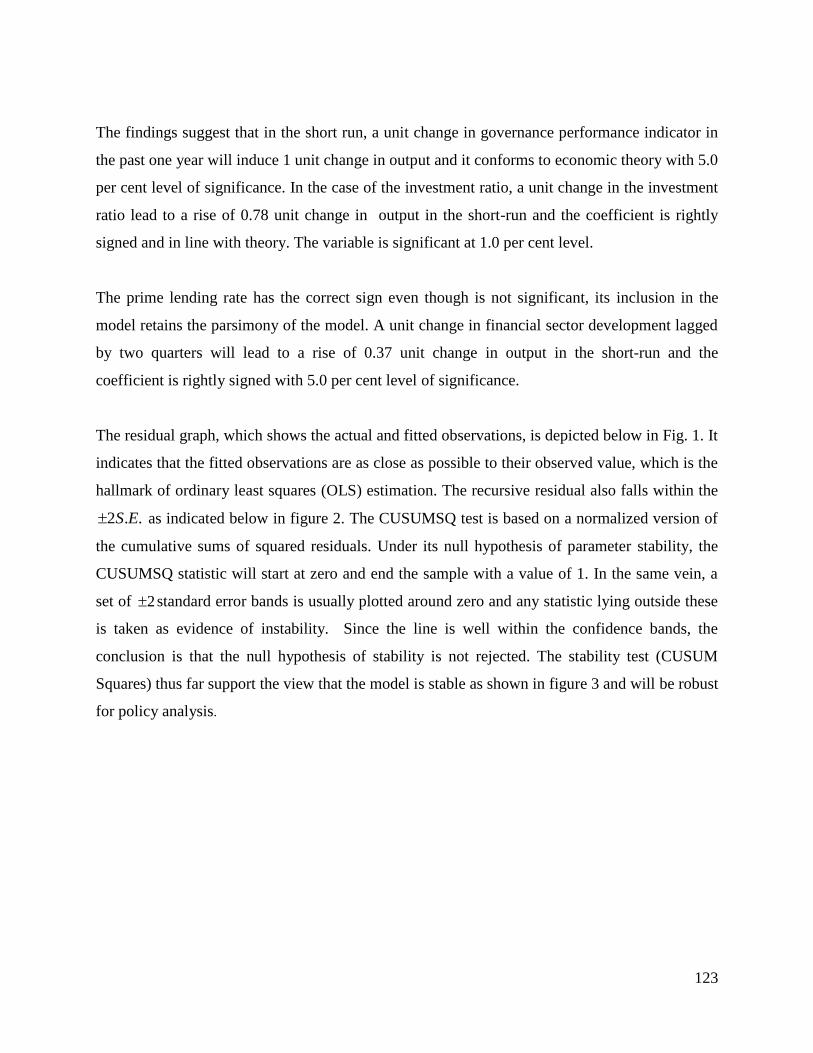
is taken as evidence of instability. Since the line is well within the confidence bands, the
conclusion is that the null hypothesis of stability is not rejected. The stability test (CUSUM
Squares) thus far support the view that the model is stable as shown in figure 3 and will be robust
for policy analysis.
124
Figure 1
Figure 2:
Figure 3:
-20
-15
-10
-5
0
5
10
15
20
2001 2002 2003 2004 2005 2006 2007 2008 2009 2010
CUSUM 5% Significance
-30 -20 -10
0 10 20 30
-60 -40 -20 0 20 40
00 01 02 03 04 05 06 07 08 09 10 R e s i d u a l A c t u a l F i t t e d
-30 -20 -10
0 10 20 30
2001 2002 2003 2004 2005 2006 2007 2008 2009 2010
R e c u r s i v e R e s i d u a l s ±
2
S . E .
125
6.2 Policy Implications
The economic implications of the above findings are as follows:
With the positive relationship between governance variable and economic growth, it
follows that effective governance will promote/support economic growth in Nigeria. This
will impact a positive change in the economic development of the country and the
citizenry are expected to be better for it. This result is in tandem with (Akanbi, 2010) and
Udah (2010).
There is an evidence of positive relationship between investment ratio of second lag and
output. This implies that investment made in the economy would impact on output after
six months. Hence, other things being equal, in a secure and stable socio-economic
environment, increase investment is expected to lead to higher output for the country.
The direct relationship between financial sector development (fsd) and output shows that
improvement in fsd would lead to higher output, other things being equal. There will also
be a multiplier effect on the overall economy. This indicates that if the financial
institutions perform their intermediation role effectively, the much needed growth could
be attained.
The inverse relationship between the prime lending rate and output conforms to theory,
even though not significant. This suggests that a unit change in the prime lending rate
would culminate into a decline of 1.9 unit change in output, ceteris paribus. Hence,
banks, in particular, are expected to work towards lowering the lending rate to a more
acceptable level without necessarily discouraging savings, in order to increase loans
availability to investors. This will require the Government to improve on those
constraints and bottlenecks, such as infrastructure, power, water and roads that are
putting pressures on the cost of funds, forcing banks to increase lending rate. The idea is
to encourage borrowing and investment in the economy.
126
6.2 Conclusions
The paper examined the dynamics of governance, investment and economic growth in Nigeria
from 1999:q1 to 2010:q4 using cointegration and vector error correction approach. The specific
objectives were to estimate the short-run dynamics as well as the error-correction mechanism of
the price level, investment ratio, governance, prime lending rate, openness and financial sector
development on economic growth. In the process of doing this, the hypothesis that governance
and investment promotes economic growth in Nigeria was validated.
The adjusted R2
of 0.69 indicates that about 69.0 per cent of the variation in economic growth is
explained by governance in the past one year (four quarter lag), prime lending rate in the
previous quarter and financial sector development in the last six months. The coefficient of the
error correction term ECM1 (-1) have the expected negative sign and it is highly significant at
the 1.0 per cent level of significance. The significance of the error correction mechanism
(ECM1) supports cointegration and suggests the existence of long-run steady-state equilibrium
between economic growth and governance, prime lending rate and financial sector development.
In fact, the ECM1 indicates a feedback of about 58.8 per cent of the previous quarter‘s
disequilibrium.
References
Adam, C. S. 1992. Recent developments in econometric methods: an application to the demand
for money in Kenya. African Econ. Res. Consortium (AERC), 15: 1–52.
Akanbi, O. A. 2010. ―Role of Governance in Explaining Domestic Investment in Nigeria‖,
Economic Research Southern Africa, Working Paper Number 168, University of Pretoria, South
Africa.
Akpokodje, G. (1998) "Macroeconomic Policies and Private Investment in Nigeria", In:
Rekindling Investment for Economic Development in Nigeria by Ben. E. Aigbokhan (ed)
Selected Papers for the 1998 Annual Conference, The Nigerian Economic Society.
Ang, J. B., and McKibbin, W. J. 2007. ―Financial liberalization, financial sector development
and growth: Evidence from Malaysia‖, Journal of Development Economics, 84, 215-233.
127
Atsushi, I. and Yasuhisa, O. 2005. ―Natural Resources, Economic Growth and Good
Governance: An Empirical Note‖, Japan Bank for International Cooperation (JBIC) and
International Monetary Fund. No. 21.
De, P. 2010. ―Governance, Institutions, and Regional Infrastructure in Asia‖, ADBI Working
Paper 183. Tokyo: Asian Development Bank Institute. Available:
http://www.adbi.org/workingpaper/2010/01/04/3425.gov.institutions.region.infrastructure.asia/
Engle, R. F. and Granger, C. W. J., 1987. ―Co-integration and Error Correction: Representation,
Estimation, and Testing, Econometrica, 55,391-407.
Johansen, S. and K. Juselius 1990. ―Maximum Likelihood Estimation and Inference on
Cointegration with Applications to the Demand for Money‖, Oxford Bulletin Econ. Stat., No 52
http://ideas.repec.org/a/bla/obuest/v52y1990i2p169-210.html
Kaufmann D., Kraay, A., Mastruzzi, M., 2010. ―The Worldwide Governance Indicators:
Methodology and Analytical Issues‖.
Kaufmann, D. and Aart Kraay 2003. ―Governance Redux: The Empirical Challenge,‖ Global
Competitiveness Report (Geneva: World Economic Forum).
Khan, M. S. 1996. ―Government Investment and Economic growth in the Developing
World‖, The Pakistan Development Review 35: 4 Part I (Winter).
Martinez-Vazquez, McNab, R. M. and Everhart, S. S. (2005). ―Corruption, Investment and
Growth in Developing Countries, Working Paper Series, Defense Resources Management
Institute, Monterey, CA 93943-5138.
Mordi, C. N. O. 2008. ―Introduction to Vector Autoregression (VAR) Models‖, a paper presented
to staff of the Research Department of the Central Bank of Nigeria, Abuja, September.
Obadan, M. I. and Odusola, A. F. 2001. ―Savings, Investment and Growth Patterns in
Developed and Developing Countires‖, Monograph Series No. 1, Ibadan: National Centre for
Economic Management and Administration.
Obadan, M. I. and Edo, S. E. 2008. ―Nigeria‘s Economic Governance Structures and Growth
Performance in Perspective‖, The Nigerian Journal of Economic and Social Studies”, Volume
50, Number 1, March, pp.99-118.
OECD, 2001. ―The Well-being of Nations: The Role of Human and Social Capital‖, OECD
Paris.
128
Sharma, S. D., 2007. “Democracy, Good Governance, and Economic Development‖, Taiwan
Journal of Democracy, Volume 3, No.1. pp. 29-62.
Turner, K., (2011). ―The Importance of Good Governance in Achieving Economic Growth for
Developing Nations: An Analysis of Sub-Saharan Africa‖, Bryant Economic Research Paper,
Vol. 4. No. 4.
World Bank, 1992. Governance and Development, International Bank for Reconstruction and
Development, Washington D. C.
World Bank, 1998. Development Indicators, Washington, D. C. The World Bank.
World Bank 2010. ―Worldwide Governance Indicators‖.
Yahyaoui, A., Chatti, O., Chtourou, N. 2008. ―Governance, Quality of Institutions and Economic
Growth: Empirical Evidence from a Cross-National Analysis‖, Faculté des Sciences
Economiques et de Gestion de Sfax, Vol. 12, No. 35.
129
Appendix 1: ADF and PP Unit Root Tests
Variable ADF Phillips-Perron Remarks
Level 1st
Difference
Remarks Level 1st
Difference
Yr -2.4839 -
4.9753***
I(1) -2.7042 -6.8215*** I(1)
cpi -2.8319 -
6.9311***
I(1) -2.9877 -
10.9418***
I(1)
Ir -2.3745 -
5.9348***
I(1) -2.5386 -5.9718*** I(1)
Govn -2.1870 -2.3919** I(1) -0.1422 -3.8429*** I(1)
Plr -2.3976 -
5.4091***
I(1) -2.6180 -5.4806*** I(1)
Open -1.9562 -4.1620** I(1) -2.4531 -4.7537** I(1)
Fsd -2.2173 -
5.2014***
I(1) -1.5738 -5.1195*** I(1)
Note: *** and ** indicates that the variables are significant at 1 per cent and 5 per cent levels,
respectively.
Appendix 2: Test of VAR Lag Order Selection
VAR Lag Order Selection Criteria
Endogenous variables: YR CPI IR GOVN PLR OPEN FSD
Exogenous variables: C
Date: 09/11/11 Time: 23:40
Sample: 1999Q1 2010Q4
Included observations: 45
Lag LogL LR FPE AIC SC HQ
0 -570.3312 NA 328.3489 25.65916 25.94020 25.76393
1 -231.4205 557.3198* 0.000855* 12.77425* 15.02254* 13.61239*
2 -185.4895 61.24137 0.001149 12.91064 17.12619 14.48216
3 -134.6764 51.94228 0.001670 12.83006 19.01286 15.13495
* indicates lag order selected by the criterion
LR: sequential modified LR test statistic (each test at 5% level)
FPE: Final prediction error
AIC: Akaike information criterion
SC: Schwarz information criterion
HQ: Hannan-Quinn information criterion
130
Table 3: Unrestricted Cointegration Rank Test Results
Null
Hypothesis
Trace
Statisti
c
Critical
value at 5
per cent
Null
Hypothesi
s
Maxim
um-
Eigen
statistic
Critical
value at 5
per cent
0r * 175.87
60 134.6780 0r * 49.3409 47.0789
1r * 126.53
51 103.8473 *1r 45.5831 40.9568
2r * 80.951
1 76.9728 2r 28.2146 34.8059
3r 52.737
4 54.0790 3r 25.2761 28.5881
4r 27.461
3 35.1928 4r 13.2294 22.2996
5r 14.231
8 20.2618 5r 9.6987 15.8921
6r 4.5332 9.1645 6r 4.5332 9.1645
Note: r represents number of cointegrating vectors. Trace test indicates 3 cointegrating equations
at the 0.05 level while max-eigenvalue test indicates 2 cointegrating equations.
*denotes rejection of the hypothesis at the 0.05 level.
Table 4: Parsimonious Error-Correction Model of yr
Dependent Variable: D(YR)
Method: Least Squares
Sample (adjusted): 2000Q2 2010Q4
Included observations: 43 after adjustments
Variable Coefficient t-Statistic Prob.
C -56.31738 -9.684180 0.0000
D(GOVN(-4)) 1.0080 2.044586 0.0479
D(IR(-2)) 0.78214 -6.403159 0.0002
D(PLR(-1)) -1.915271 -1.351926 0.1844
D(FSD(-2)) 0.372637 2.265921 0.0292
ECM(-1) -0.587601 -9.674970 0.0000
R-squared 0.722982
Mean
dependent var
-
0.955814
Adjusted R-squared 0.693822
S.D. dependent
var 14.86120
S.E. of regression 8.223201
Akaike info
criterion 7.160740
Sum squared resid 2569.599
Schwarz
criterion 7.365531
Log likelihood -148.9559
Hannan-Quinn
criter. 7.236261

131
F-statistic 24.79379
Durbin-Watson
stat 1.935935
Prob(F-statistic) 0.000000


