Embed Size (px)
Citation preview

SNF REPORT NO. 30/01
Cost Estimates and Investment Decisions
by
Kjetil Emhjellen Magne Emhjellen Petter Osmundsen
SNF-project No. 7220: “Gassmarkeder, menneskelig kapital og selskapsstrategier”
The project is financed by the Research Council of Norway
FOUNDATION FOR RESEARCH IN ECONOMICS AND BUSINESS ADMINISTRATION BERGEN, AUGUST 2001
© Dette eksemplar er fremstilt etter avtale med KOPINOR, Stenergate 1, 0050 Oslo. Ytterligere eksemplarfremstilling uten avtale og i strid med åndsverkloven er straffbart og kan medføre erstatningsansvar.

_______________________________________________________________________________________Presentation at 24th International Conference of International Association for Energy Economics (IAEE),
2001: An Energy Odyssey?, Houston, Texas, April 25-27, 2001.
ISBN 82-491-0151-00 ISSN 0803-4036
_______________________________________________________________________________________Presentation at 24th International Conference of International Association for Energy Economics (IAEE),
2001: An Energy Odyssey?, Houston, Texas, April 25-27, 2001.
1
Cost Estimates and Investment Decisions*
By
Kjetil Emhjellen**, Magne Emhjellen*** and Petter Osmundsen****,
**Telemark University College *** Stavanger University College
**** Stavanger University College / Norwegian School of Economics and Bus. Adm.
Abstract
When evaluating new investment projects, oil companies traditionally use the discounted cashflow method. This method requires expected cashflows in the numerator and a risk adjusted required rate of return in the denominator in order to calculate net present value. The capital expenditure (CAPEX) of a project is one of the major cashflows used to calculate net present value. Usually the CAPEX is given by a single cost figure, with some indication of its probability distribution. In the oil industry and many other industries, it is a common practice to report a CAPEX that is the estimated 50/50 (median) CAPEX instead of the estimated expected (expected value) CAPEX. In this article we demonstrate how the practice of using a 50/50 (median) CAPEX, when the cost distributions are asymmetric, causes project valuation errors and therefore may lead to wrong investment decisions with acceptance of projects that have negative net present values. Keywords: Investment Decision, Expected Value, Construction Cost Estimation, Capital Expenditures (CAPEX), Probability Distribution of CAPEX. Jel.no.: G31, L72, M21 ∗ We are grateful to Kjell Løvås for useful comments. Financial support from The Norwegian Research Council is appreciated. ** Kjetil Emhjellen, Telemark University College, Department of Engineering, Po Box 203, N-3901 Porsgrunn, Norway Tel: (47) 35575201, Fax: (47) 35575204, Email: [email protected] *** Magne Emhjellen, Stavanger University College, Department of Business Administration, Po Box 2557 Ullandhaug, 4091 Stavanger, Norway Tel: (47) 51 83 15 82, Fax: (47) 51 83 15 50, Email: [email protected] **** Petter Osmundsen, Stavanger University College, Section of Petroleum Economics, Po Box 2557 Ullandhaug, 4091 Stavanger, Norway. Tel: (47) 51 83 15 68, Fax: (47) 51 83 17 50, Email: [email protected], Internet: http://www.nhh.no/for/cv/osmundsen-petter.htm

_______________________________________________________________________________________Presentation at 24th International Conference of International Association for Energy Economics (IAEE),
2001: An Energy Odyssey?, Houston, Texas, April 25-27, 2001.
2
1. Introduction According to McMillan (1992), cost estimation is particularly difficult in the construction industry, often leading to considerable cost overruns. The explanations are that there often is large uncertainty - often related to new technology - and that the uniqueness of the projects limits the learning process. One might expect that cost overruns have the same probability as completing the project below the cost estimate. However, observations clearly indicate an overrepresentation of cost overruns. This is due to two types of selection bias: 1) project selection; it is typically the projects with the most optimistic internal cost estimates that are being pursued by the investing firm, and 2) tender selection; competition sees to that tenders with pessimistic and realistic cost estimates are ruled out. A project's capital expenditures (CAPEX) is one of the major cashflows used to calculate net present value (along with e.g. operational expenditures (OPEX) and income). The CAPEX is developed through a cost estimate, very often by a company's internal cost estimation department. Usually the CAPEX is given by a single cost estimate, with some indication of the probability distribution for this cost estimate. In this article we demonstrate how the practice of using a 50/50 (median) CAPEX, when the cost distributions are asymmetric, causes project valuation errors and therefore may lead to wrong decisions with acceptance of projects with negative net present values. 2. Case: Estimation Failures in Norwegian Offshore Development Projects In the beginning of the 1990s, the Norwegian petroleum industry experienced a cost level that did not justify new offshore development projects. To reduce development time and costs drastically on the Norwegian shelf, economic and technical task forces were appointed, with members from the oil companies, the suppliers and government. This process, known as NORSOK, was inspired by the cost reduction initiative CRINE on the UK shelf. A consensus was reached in the Norwegian petroleum industry to implement a number of organisational and contractual changes. Much attention has been devoted to reducing the lead time. Deep water offshore development projects are extremely capital intensive, and getting the field on stream at an early stage may be decisive for a positive project appraisal (net present value analyses). To reduce the development time, contract award (and to some extent fabrication) has started before detailed engineering was completed. This has led to a considerable increase in estimation risk. For a number of extraction facilities there have been considerable amounts of reengineering and refabrication, causing delays and cost overruns. In some cases this has been due to updated information about reservoir characteristics and a wish to implement new technology. In other cases the initial engineering and planning were simply inadequate. Previously, oil companies (the licence groups, represented by the operators) coordinated deliveries from contractors that were specialised within, respectively, project management,

_______________________________________________________________________________________Presentation at 24th International Conference of International Association for Energy Economics (IAEE),
2001: An Energy Odyssey?, Houston, Texas, April 25-27, 2001.
3
engineering, module fabrication, at-shore/inshore hook-up or marine operations. Today, the Norwegian offshore development market is dominated by 3 to 4 major entities marketing themselves as capable of carrying out total enterprise contracts and/or projects from concept development to offshore installation and start up. Hence, the project management tasks which previously had to be carried out by a project team managed by the client, have after 1994 been carried out by the major offshore contractors, regulated by EPCI-contracts (Engineering, Procurement, Construction, Installation). The large size of the contracts, and the new coordination tasks that were to be performed, implied a considerable increase of risk for the turnkey suppliers. In the previous fabrication contracts, founded on cost-plus principles, most of the risk was borne by the oil companies. In the EPCI-contracts, however, an even split of cost overruns and savings, relative to a target sum was introduced. There was an upper limit to the cost overruns to be borne by the contractor, but this cap was substantial compared to the contractor's financial strength. Thus, in a situation of a considerable increase in risk, a higher fraction of the risk is now borne by the contractors. The performance of the new contractual and organisational solutions in Norwegian offshore development projects was evaluated by a government study (Government Report NOU 1999:11).1 For the new type of development projects, implemented after 1994, the study reports aggregate cost overruns exceeding 4 billion dollars. Still, development costs are estimated to have fallen; but not to the extent of the over-optimistic expectations. As a result, the main contractors have experienced financial problems. Moreover, clients have been forced to pay in excess of their contractual obligations in order to secure delivery of the contract object when contractor's financial stability is jeopardised. A poor technical definition and a resulting under-estimation of scope has also caused schedule delays and subsequent losses to the oil companies that they were unable to recover through liquidated damages paid by contractors. Experience gained by the Norwegian oil industry indicates that there should be more focus on developing better technical specifications prior to the award of EPCI contracts; planning time has been suboptimal. Furthermore, incentive contracts need to be curtailed to the financial capacity of the supplier. The choice of design time - which influences the amount of risk - must be seen in conjunction with the risk sharing arrangements.2 Also, the need for improved cost estimation has been clearly demonstrated. The 50/50 (median) CAPEX cost estimation procedure has been - and is - used by the two major Norwegian oil companies, Statoil and Norsk Hydro. It is also this type of cost estimate that all companies on the Norwegian shelf are to report to the Norwegian Ministry of Oil and Energy and the Norwegian Oil Directorate. 3. Probability Distributions of Costs A cost estimate for a project is a prediction or forecast of the total cost of carrying out the project, which can be illustrated by a distribution curve. Illustration A shows a distribution that is symmetric from the mode, median, and expected value.
1 The cost overruns are also analysed from a contractual and organizational perspective, see Osmundsen (2000). 2 For a discussion of risk sharing in the petroleum sector, see Osmundsen (1999) and Olsen and Osmundsen (2000).

_______________________________________________________________________________________Presentation at 24th International Conference of International Association for Energy Economics (IAEE),
2001: An Energy Odyssey?, Houston, Texas, April 25-27, 2001.
4
P R O JE C TC O ST
P R O B A BILITY
P 10/90 M O D EM E D IANE X P . V A LU E
P 90/10
P R O JE C TC O ST
P R O B A BILITY
P 10/90 M O D EM E D IANE X P . V A LU E
P 90/10
Illustration A: CAPEX distribution of a project with symmetric distribution The P10/90 (P10) project cost value is defined as the cost level with 90% probability of overruns, and 10% probabilty to underrun. Conversely, the P90/10 (P90) value is the value with 10% probability to overrun, and 90% probability to underrun. The median, also called 50/50 estimate (P50/50), is the value with equal probability (50 %) that the cost will be higher or lower. In a symmetric distribution, the mode, median, and expected values coincide. This is not the case for an asymmetric distribution. Illustration B depicts an asymmetric distribution of project cost, which is positively skewed. In such a distribution, the mode, median and expected value are different and, respectively, in increasing size (Wonnacott, 1990).
PROJECT COST
PROBABILITY
BASEESTIMATE(MODE)
P50/50(MEDIAN)
EXPECTEDVALUE
P90/10P10/90 PROJECT COST
PROBABILITY
BASEESTIMATE(MODE)
P50/50(MEDIAN)
EXPECTEDVALUE
P90/10P10/90
Illustration B: Project cost estimate with an asymmetric distribution (positively skewed) The statistical figures of median, mode, and expected value represent a special value in a skewed distribution (Wonnacott, 1990; Humphrey, 1991; Austeng and Hugsted, 1993). As explained, the median (P 50/50) is the value that has the same probability (50%) of overrun as underrun. In a lottery of all possible project cost values, the mode is the single value that has the highest probability to be drawn. Thus, the modal value is the cost that reflects the top

_______________________________________________________________________________________Presentation at 24th International Conference of International Association for Energy Economics (IAEE),
2001: An Energy Odyssey?, Houston, Texas, April 25-27, 2001.
5
point of the distribution curve. The expected value - also referred to as a weighted average - is the sum of all outcome times the respective probabilities. Expected value is the anticipated total cost of a project. Consequently, the expected value should be the reported investment cost figure (CAPEX) for a project (Humphrey, 1991; Clark and Lorenzoni, 1985). We add two more remarks that we will come back to: 1) standard deviation is measured from the expected value, which statistically makes the expected value easier to calculate during the development of the estimate, and 2) income, and other costs/expenditures, e.g., OPEX, are reported as expected values and used in net present value calculations. For the sake of consistent comparisons, all cash flows including CAPEX should be expected values. 4. The Current Practice and its Problems In contradiction to the conclusions of the discussion above, the oil industry and many other industries adhere to a common practice of reporting a CAPEX that is the estimated 50/50 (median) instead of the expected value. The 50/50 CAPEX estimate is usually reported together with a) the base estimate (which is the sum of all defined cost elements, i.e. sum of all cost elements' modal values), and b) the contingency (usually defined as "The amount of money in a cost estimate to cover the difference between the 50/50-Estimate and the Base Estimate.") (North Sea, 20013) In order to illustrate details on problems in cost estimation practice, a reported cost estimate for a North Sea Project after a cost risk analysis is shown in Illustration C (North Sea, 2001).
3 North Sea (2001), Cost Estimation Procedure and Cost Estimate from a North Sea Project. Oil company that prefers to be anonymous, Norway. The cost reporting practice of any oil company operating in Norwegian North Sea sector is similar to this company's practice, due to governmental requirements on reporting of cost estimates.

_______________________________________________________________________________________Presentation at 24th International Conference of International Association for Energy Economics (IAEE),
2001: An Energy Odyssey?, Houston, Texas, April 25-27, 2001.
6
Package Cost-item Base Conting. 50/50Management Topside+bridge 210 6 216
Jacket+piles 15 7 22OFC Modific. 15 1 16
Topside+bri. Engineering 324 15 339Equipm. Topside 538 6 544Equipm. OFC mod. 33 10 43Bulk 282 18 300Structure 44 2 46Onshore fabrication 570 27 597
Jackets+ EPC 190 22 212Piles Piles 30 3 33
0Marine Platform inst. 280 12 292
Flotel 78 32 110Logistics 117 26 143Marine operat.risk 12 22 34
OFC mod.+ Engineering 52 24 76Ram416 Materials 25 9 34
Prefabrication 20 4 24Offshore instum. 98 29 127Topside HUC 120 16 136Hidden work 20 20
Misc. Operational cost 48 3 51Capital spares 60 -10 50SUM 3181 284 3465
Illustration C: Example of CAPEX estimation from a North Sea Project (all values in million Norwegian kroner, MNOK) Observe that each separate cost item is reported as a base (mode) value, a 50/50 estimate (P50 or median), and a contingency defined to be the difference between the 50/50 value and the base value. The 50/50 values of each separate cost item is estimated by Monte Carlo simulations. Some of the potential problems (probable errors) observed in the example:
1. Estimated CAPEX for the total project is reported as a 50/50 estimate, even though the distribution is likely to be slightly skewed. We believe systematically reporting 50/50 values instead of expected values to be incorrect (a system error in cost estimation practice).
2. The 50/50 values for each cost component are added to generate the total project's 50/50 value. We believe that adding 50/50 values for each cost component not necessarily gives you the total project 50/50 value.
5. The Central Limit Theorem The cost estimation practice described above may be based on an incorrect interpretation of the Central Limit Theorem. The Central Limit Theorem, first stated by Liapounov in 1901(DeGroot, 1986), gives us the opportunity under certain conditions to approximate the uncertainty distributions of a sum of independent variables by a normal distribution. Thus, in the aggregated normal distribution curve the expected value and the 50/50 (median) value will
_______________________________________________________________________________________Presentation at 24th International Conference of International Association for Energy Economics (IAEE),
2001: An Energy Odyssey?, Houston, Texas, April 25-27, 2001.
7
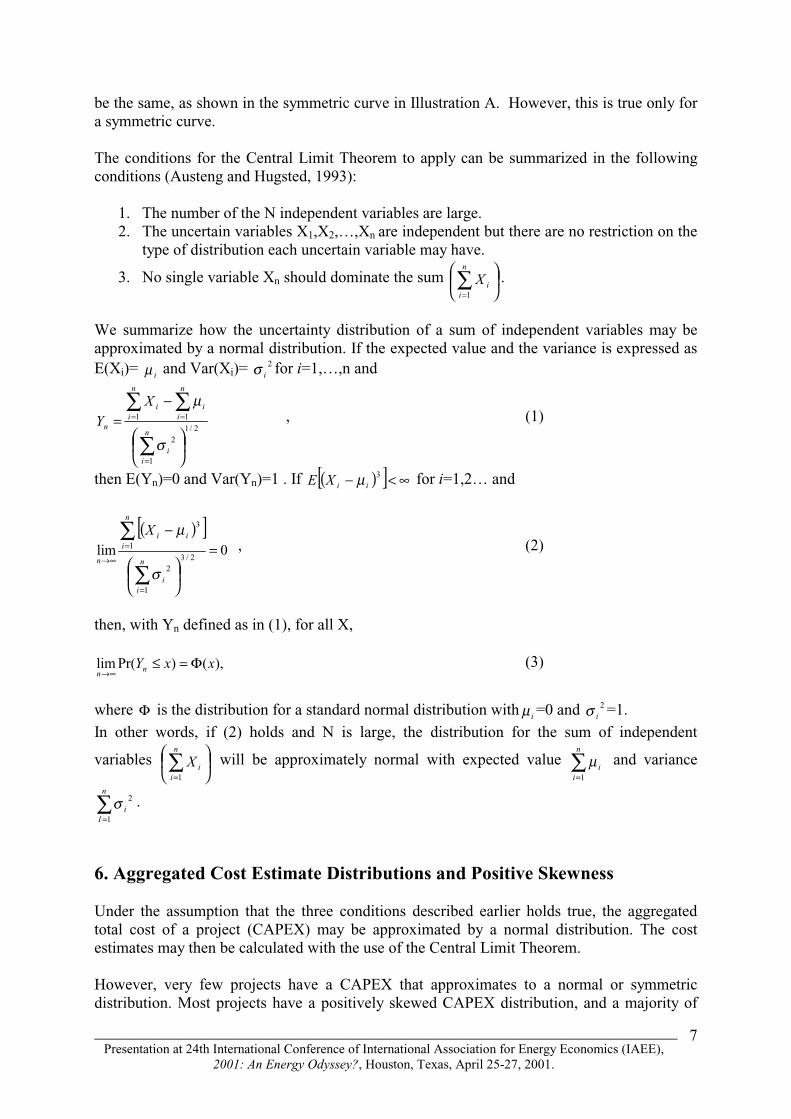
be the same, as shown in the symmetric curve in Illustration A. However, this is true only for a symmetric curve. The conditions for the Central Limit Theorem to apply can be summarized in the following conditions (Austeng and Hugsted, 1993):
1. The number of the N independent variables are large. 2. The uncertain variables X1,X2,…,Xn are independent but there are no restriction on the
type of distribution each uncertain variable may have.
3. No single variable Xn should dominate the sum
∑
=
n
iiX
1
.
We summarize how the uncertainty distribution of a sum of independent variables may be approximated by a normal distribution. If the expected value and the variance is expressed as E(Xi)= iµ and Var(Xi)= 2
iσ for i=1,…,n and
2/1
1
2
1 1
−=
∑
∑ ∑
=
= =
n
ii
n
i
n
iii
n
XY
σ
µ , (1)
then E(Yn)=0 and Var(Yn)=1 . If ( )[ ] ∞<− 3iiXE µ for i=1,2… and
( )[ ]0lim
2/3
1
2
1
3
=
−
∑
∑
=
=
∞→ n
ii
n
iii
n
X
σ
µ , (2)
then, with Yn defined as in (1), for all X,
),()Pr(lim xxYnn
Φ=≤∞→
(3)
where Φ is the distribution for a standard normal distribution with iµ =0 and 2
iσ =1. In other words, if (2) holds and N is large, the distribution for the sum of independent
variables
∑
=
n
iiX
1
will be approximately normal with expected value ∑=
n
ii
1
µ and variance
∑=
n
Ii
1
2σ .
6. Aggregated Cost Estimate Distributions and Positive Skewness Under the assumption that the three conditions described earlier holds true, the aggregated total cost of a project (CAPEX) may be approximated by a normal distribution. The cost estimates may then be calculated with the use of the Central Limit Theorem. However, very few projects have a CAPEX that approximates to a normal or symmetric distribution. Most projects have a positively skewed CAPEX distribution, and a majority of

_______________________________________________________________________________________Presentation at 24th International Conference of International Association for Energy Economics (IAEE),
2001: An Energy Odyssey?, Houston, Texas, April 25-27, 2001.
8
the single cost elements that makes up a CAPEX are also positively skewed. Typically, the distribution's spread and skewness are also underestimated. Our hyphothesis that most projects have a positively skewed CAPEX are above explained by selection biases of projects and tenders, and the belief that the three conditions for the Central Limit Theorem to hold usually are not met with respect to project cost. Another explanation is the asymmetric nature of cost savings and overruns. If a project is carried out in an ideal manner, the cost would creep down towards an absolute project minimum cost that is unique for this project. However, this minimum cost will have an absolute lower limit, that could of course never be below zero. Conversely, if a project is poorly carried out, e.g., by refabrication due to insufficient engineering, the cost would increase but there would be no absolute upper limit. Cost overruns in the range of 300 per cent are not unheard of. Therefore, the cost for a project has a greater chance of being 50 percent above than estimated CAPEX than it does of being 50 percent below. Humphrey (1991) agrees: " In practice, estimates and uncertainties will not follow a normal distribution or even be symmetrical about the mean; a cost for a venture has a greater chance of being 50 percent higher than the estimated cost than it does for being 50 percent lower." When we do not have normal distributions, the general approach is to employ simulations using the Monte Carlo technique. 7. Monte Carlo Simulations Based on the North Sea Project example, we want to illustrate possible errors of the cost estimation practice.
• First, demonstrate that the expected value for the total cost, given each cost element's 50/50 value from the example project and given an assumed skewed distribution, to be different from the reported 50/50 value of MNOK 3465. This would demonstrate that these two figures are different and that expected values should be reported.
• Second, if the total cost estimates uncertainty distribution has a 50/50 value that is different from the sum of each cost elements 50/50 value (MNOK 3465), then this would demonstrate that the practice of adding several cost elements' 50/50 value does not give the 50/50 cost estimate for the total project.
Assuming a skewed beta-curve with expected values for each cost element that were 20% higher than median value, and a standard deviation of 25% of median, where minimum value was one - 1 - standard deviation below median, and maximum value three - 3 - standard deviations above median, we undertake Monte Carlo simulation (using @-Risk; Palisade, 1998). Illustration D shows the aggregated results from this example.
Exp. value 4158 50/50 4153 P10 3806 P90 4524
Illustration D: Results from Monte Carlo CAPEX Simulation (uncorrelated, 2000 iterations).

_______________________________________________________________________________________Presentation at 24th International Conference of International Association for Energy Economics (IAEE),
2001: An Energy Odyssey?, Houston, Texas, April 25-27, 2001.
9
First, observe that the expected value is MNOK 4158, i.e. MNOK 693 higher than our example project 50/50 value of MNOK 3465. Second, we observe that the total project 50/50 value is MNOK 4153, i.e. MNOK 688 higher than our example project 50/50 value MNOK 3465. Correlated cost elements Since many cost elements are likely to be correlated, we also test the effect of correlations on our example distribution by correlating 7 cost elements with a factor of 0,7. Illustration E shows the aggregated results from this example.
Exp. value 415850/50 4134P10 3402P90 4943
Illustration E: Results from Monte Carlo CAPEX Simulation with correlated cost elements (2000 iterations). Observe that the expected value is the same as in the uncorrelated simulation and that the 50/50 and mode value have become slightly smaller. However, the distribution have got a larger spread, the P10 (P10/90) and P90 (P90/10) values have moved further away from the expected value. Thus, correlated elements will influence on the spread of the distribution and also to some degree on the skewness. (We also looked at dependency between cost elements (one cost element a constant factor of another) and obtained the result that dependency, like correlation, increases distribution skewness and standard deviation. 8. Conclusions We draw two conclusions from this example:
1. Expected value for a skewed uncertainty distribution curve (MNOK 4158) differs from the 50/50 estimate given in our project example (MNOK 3465). The difference is MNOK 693, which definitively impact net present value calculations. In general, the 50/50 value is a too low CAPEX estimate, when the cost distribution is positively skewed. Thus, the use of 50/50 CAPEX may lead to wrong net present calculations, possibly leading to incorrect investment decisions. (The more skewed, the larger the difference between the expected value and the 50/50 estimate.)
2. The total 50/50 value for the skewed distribution curve (MNOK 4153), differs from the sum of 50/50 estimate for each cost elements (MNOK 3465). The difference in our example is MNOK 688. Thus, to aggregate each cost element's median values and expect them to be the total project cost median (50/50) value is incorrect. The more skewed the uncertainty distribution of each cost element is, the larger the estimation errors.

_______________________________________________________________________________________Presentation at 24th International Conference of International Association for Energy Economics (IAEE),
2001: An Energy Odyssey?, Houston, Texas, April 25-27, 2001.
10
References Austeng, Kjell and Hugsted, Reidar (1993), Trinnvis kalkulasjon i bygg og anlegg (Stepwise
Calculation in Construction), Norges Tekniske Høgskole, Institutt for bygg- og anleggsteknikk, Trondheim, Norway.
Clark, Forrest D. and Lorenzoni, A.B. (1985), Applied Cost Engineering, Second edition,
Revised and Expanded, Marcel Dekker, Inc., New York. DeGroot, Morris H. (1986), The Central Limit Theorem for The Sum of Independent
Variables, Probability and Statistics, Second Edition, Addison-Wesley Pubilishing Company, Inc.
Humphreys, Kenneth K. (1991), Jelen's Cost and Optimization Engineering, Third Edition,
McGraw-Hill, Inc. McMillan, J. (1992), Games, Strategies & Managers, Oxford University Press. NOU 1999:11, Government Report, Analyse av investeringsutviklingen på sokkelen (Analysis
of Investments on the Norwegian Continental Shelf). Olsen, T.E. and P. Osmundsen (2000), "Sharing of Endogenous Risk in Construction",
Working paper 88/2000, Stavanger University College. Osmundsen, P. (1999), Risk Sharing and Incentives in Norwegian Petroleum Extraction,
Energy Policy 27, 549-555. Osmundsen, P. (1999), ”Norsok og kostnadsoverskridelser sett ut i fra økonomisk kontrakts-
og insentivteori” (Norsok and Cost Overruns seen from the Perspective of Contract and Incentive Theory), Scientific Enclosure to Government Report NOU 1999: 11 (Analysis of Investments on the Norwegian Continental Shelf).
Palisade Corporation (1998), @ Risk,Windows, Version July, 1997. Palisade Corporation, 31
Decker Road, Newfield, NY USA 14867. Wonnacott, Thomas H. and Wonnacott, Ronald J. (1990), Introductory Statistics, fifth edition,
John Wiley & Sons, Inc


