Embed Size (px)
Citation preview
1 23
Journal of the Indian Society ofRemote Sensing ISSN 0255-660X J Indian Soc Remote SensDOI 10.1007/s12524-012-0233-4
Understanding the Spatial Variability ofChlorophyll a and Total Suspended MatterDistribution Along the Southwest Bayof Bengal Using In-Situ and OCM-2 &MODIS-Aqua MeasurementsD. Poornima, R. Shanthi, S. Raja,G. Vijayabaskara Sethubathi,T. Thangaradjou, T. Balasubramanian,K. N. Babu & A. K. Shukla

1 23
Your article is protected by copyright and all
rights are held exclusively by Indian Society of
Remote Sensing. This e-offprint is for personal
use only and shall not be self-archived in
electronic repositories. If you wish to self-
archive your work, please use the accepted
author’s version for posting to your own
website or your institution’s repository. You
may further deposit the accepted author’s
version on a funder’s repository at a funder’s
request, provided it is not made publicly
available until 12 months after publication.
RESEARCH ARTICLE
Understanding the Spatial Variability of Chlorophylla and Total Suspended Matter Distribution Alongthe Southwest Bay of Bengal Using In-Situ and OCM-2& MODIS-Aqua Measurements
D. Poornima & R. Shanthi & S. Raja & G. Vijayabaskara Sethubathi &T. Thangaradjou & T. Balasubramanian & K. N. Babu & A. K. Shukla
Received: 28 February 2012 /Accepted: 8 August 2012# Indian Society of Remote Sensing 2013
Abstract Spatial and temporal distribution of chloro-phyll a (chl a) and Total Suspended Matter (TSM) andinter comparison of Ocean Color Monitor-2 (OCM-2)and Moderate Resolution Imaging Spectro-radiometer(MODIS-Aqua) derived chlorophyll a and TSM wasmade along the southwest Bay of Bengal (BoB). Thein-situ chl a and TSM concentration measured duringdifferent seasons were ranged from 0.09 to 10.63 μgl−1
and 11.04–43.75 mgl−1 respectively. OCM-2 andMODIS derived chl a showed the maximum(6–8 μgl−1) at nearshore waters and the minimum(0–1 μgl−1) along the offshore waters. OCM-2 derivedTSM imageries showed the maximum (50–60 mgl−1)along the nearshore waters of Palk Strait and the mod-erate concentration (2–5 mgl−1) was observed in theoffshore waters. MODIS derived minimum TSM con-centration (13.244 mgl−1) was recorded along theoffshore waters, while the maximum concentrationof 15.78 mgl−1 was found along the Kodiakarai
region. The inter-comparison of OCM-2 andMODIS chla data (R200.549, n049, p<0.001, SEE0±0.117) indi-cate that MODIS data overestimates chl a concentrationin the nearshore waters of the southern BoB comparedto the OCM-2. The correlation between OCM-2 andMODIS-Aqua TSM data (R200.508, N053, P<0.001and SEE0±0.024) confirms that variation in the rangeof values measured by OCM-2 (2–60 mgl−1) and theMODIS (13–16 mgl−1) derived TSM values. Despiteproblems in range of measurements, persistent cloudcover etc., the launch of satellites like OCM-2 withrelatively high spatial resolutions makes job easier andpossible to monitor chl a distribution and sedimentdischarges on day to day basis in the southwest BoB.
Keywords Chlorophyll a . TSM . OCM-2 .
MODIS-Aqua . Bay of Bengal . Seasonal distribution
Introduction
India has 8,118 km long coastline and positioned inthe central part of Indian Ocean, supporting vastresources in the sea around and in the oceanic islands(Tang et al. 2002). The Bay of Bengal (BoB) is one ofthe largest fresh water and sediment input sites of theworld ocean, receiving about 2,000 million tons ofsediment annually (UNEP 2002) and its nutrients andcirculation dynamics along the coast has paramount
J Indian Soc Remote SensDOI 10.1007/s12524-012-0233-4
D. Poornima : R. Shanthi : S. Raja :G. V. Sethubathi :T. Thangaradjou (*) : T. BalasubramanianCentre of Advanced Study in Marine Biology,Faculty of Marine Sciences, Annamalai University,Parangipettai 608 502( Tamilnadu, Indiae-mail: [email protected]
K. N. Babu :A. K. ShuklaMarine, Geo and Planetary Sciences Group,Space Applications Centre (ISRO),Ahmedabad 380 015, India
Author's personal copy
importance in understanding the ocean properties likechlorophyll concentration, currents, sea surface temper-ature, oceanic fronts and eddies, suspended particulatematter, dissolved organic matter etc. (Dey and Singh2003).
Remote sensing of ocean water quality involvesmainly the estimation of chlorophyll a (chl a) andTotal Suspended Matter (TSM) from sensor-derivedradiances and these are optically active and can ade-quately represent the ocean water quality. Coastalwaters are optically very complex with a greater influ-ence of river inputs and local geological phenomenaand are also characterized by the presence of excep-tionally high phytoplankton pigments, TSM and dis-solved organic matter (Raaj et al. 2008). Chl a isthe major photosynthetic pigment of marine phy-toplankton that has been used as an indicator ofbiomass of phytoplankton or productivity in theoceans (Beebe 2008). TSM are the most common typeof pollutants both in terms of weight and volumes inthe surface of the water column are helpful in deter-mining water dynamics and spread of pollutants(Ritchie et al. 1990) become main constituent forbiogeochemical processes (Doerffer et al. 1989),affects the penetration of light and the transport ofnutrients and shoreline morphology among other pro-cesses (Kunte 2008).
The capability of visible bands of multi-spectralsatellite data has been demonstrated to detect the con-tent of water column within certain depth (Gordon etal. 1975; Surendran et al. 2006). Absorption and back-scattering caused by phytoplankton and TSM, in bothopen sea and coastal waters, affect the optical proper-ties of water and the optical penetration depth (Dengand Li 2003). The configuration of OCM payload isidentical to the IRS-P4 (Oceansat 1), the spectralbands application also same except for band 6 shiftedfrom 660–680 nm to 610–630 nm and band 7 shiftedfrom 745–785 nm to 725–755 nm. Understanding thespatial and temporal distribution and variability of chla and TSM is of great scientific interest because TSMplays a major role in controlling the penetration oflight into the sea and hence has a huge impacton primary productivity and ecology. However, thelaunch of satellites like OCM-2 and MODIS withrelatively high resolution sensors onboard havemade it possible to monitor sediment dischargeand chl a concentration on day-to-day basis dueto global coverage of land and ocean water every
one or two days. In this context, we have attemp-ted to study the spatial and temporal distributionand inter comparison of OCM-2 and MODIS-Aquaderived chl a and TSM data to study seasonalchanges in chl a and TSM concentration alongthe southwest BoB.
Materials and Methods
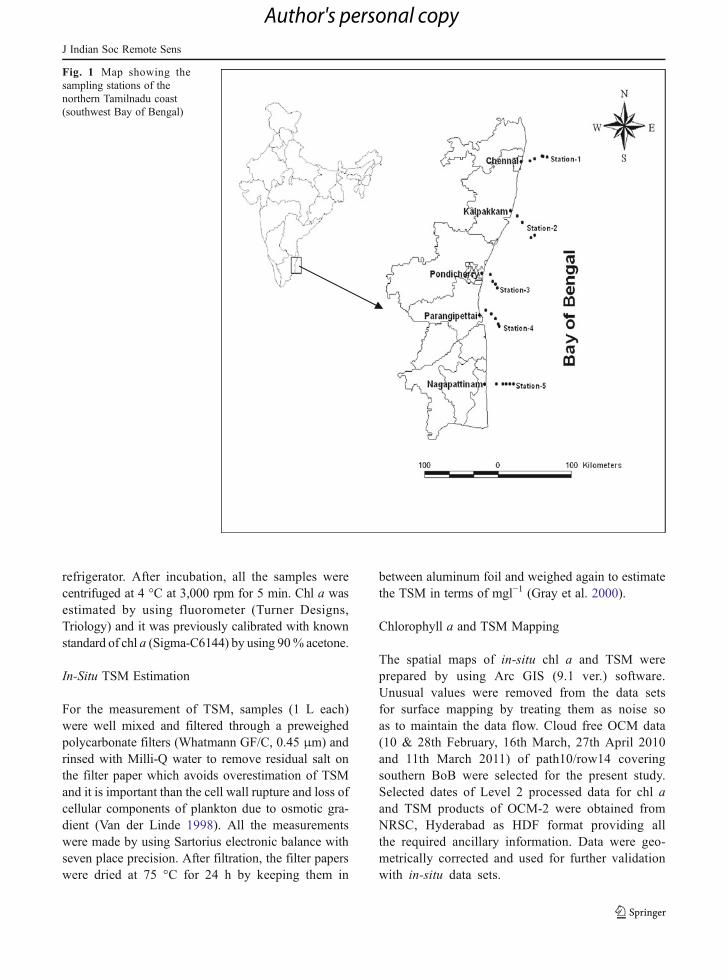
In-situ measurements were made during cruises (CRVSagar Poorvi and CRV Sagar Paschmi of NIOT) andmonthly coastal sampling along northern Tamilnaducoast, southwest BoB between January 2010 and March2011. Five sampling stations viz. Chennai, Kalpakkam,Pondicherry, Parangipettai and Nagapattinam were fixedwith the help of Global Positioning System (GPS)covering longitude of 79°E to 80°E and latitude of10°N to 13°N and transect were made perpendic-ular to the shoreline (Fig. 1). Field work forOctober, November and December months were notcarried out owing to the monsoon (northeast monsoon).The data collected were grouped into different seasonsnamely postmonsoon (January to March), summer(April to June) and premonsoon (July to September) tostudy the spatial and temporal variability of chl a andTSM along the southwest BoB.
In-Situ Chlorophyll a Measurements
Surface water samples (1 L) were collected by usingNiskin water sampler from five sampling stations be-tween 10.00 a.m. to 1.00 p.m. coinciding with thesatellite overpass time and 1 ml of saturated mercurychloride was added to the sample to avoid any plank-tonic multiplications and the samples were kept in anice box and transported to the lab for further analysis.Chl a concentration was measured by following themethods of UNESCO (1994). The samples were fil-tered immediately through 47 mm GF/C filter papers(Whatmann International Ltd.). One ml of 1 % mag-nesium carbonate suspension was added on to thefilter paper to form a thin bed, which will serve as aprecaution against the development of any acidity andsubsequent degradation of pigments. After filtration,the filter papers were ground with 10 ml of 90 %acetone and transferred to the amber glass screw captubes separately. Then the tubes are wrapped in alumin-ium foil and incubated for 24 h in darkness in
J Indian Soc Remote Sens
Author's personal copy
refrigerator. After incubation, all the samples werecentrifuged at 4 °C at 3,000 rpm for 5 min. Chl a wasestimated by using fluorometer (Turner Designs,Triology) and it was previously calibrated with knownstandard of chl a (Sigma-C6144) by using 90% acetone.
In-Situ TSM Estimation
For the measurement of TSM, samples (1 L each)were well mixed and filtered through a preweighedpolycarbonate filters (Whatmann GF/C, 0.45 μm) andrinsed with Milli-Q water to remove residual salt onthe filter paper which avoids overestimation of TSMand it is important than the cell wall rupture and loss ofcellular components of plankton due to osmotic gra-dient (Van der Linde 1998). All the measurementswere made by using Sartorius electronic balance withseven place precision. After filtration, the filter paperswere dried at 75 °C for 24 h by keeping them in
between aluminum foil and weighed again to estimatethe TSM in terms of mgl−1 (Gray et al. 2000).
Chlorophyll a and TSM Mapping
The spatial maps of in-situ chl a and TSM wereprepared by using Arc GIS (9.1 ver.) software.Unusual values were removed from the data setsfor surface mapping by treating them as noise soas to maintain the data flow. Cloud free OCM data(10 & 28th February, 16th March, 27th April 2010and 11th March 2011) of path10/row14 coveringsouthern BoB were selected for the present study.Selected dates of Level 2 processed data for chl aand TSM products of OCM-2 were obtained fromNRSC, Hyderabad as HDF format providing allthe required ancillary information. Data were geo-metrically corrected and used for further validationwith in-situ data sets.
Fig. 1 Map showing thesampling stations of thenorthern Tamilnadu coast(southwest Bay of Bengal)
J Indian Soc Remote Sens
Author's personal copy
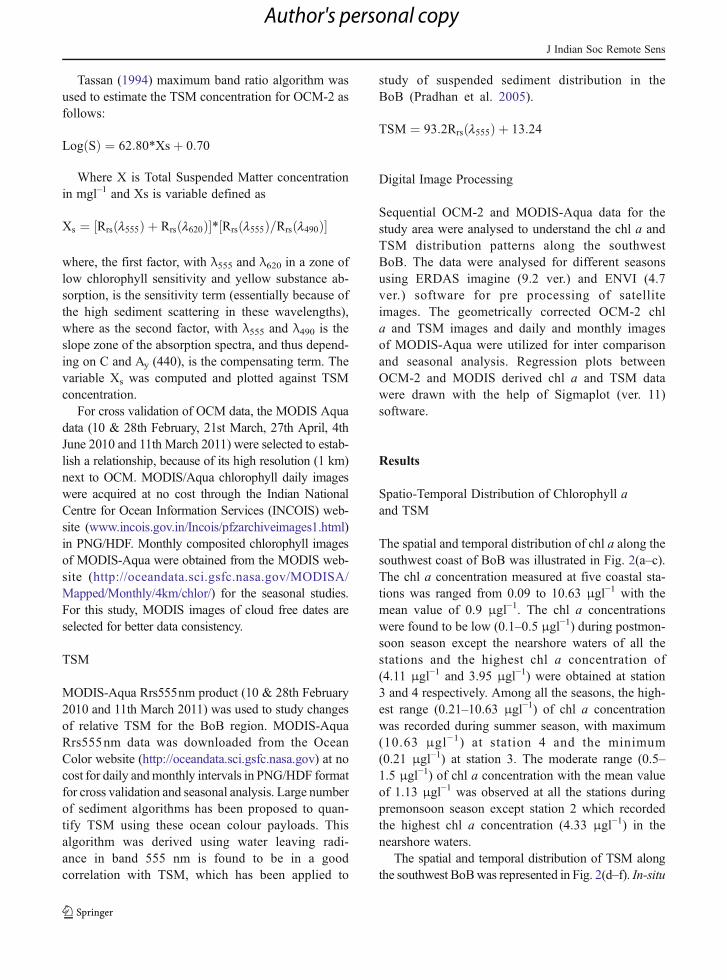
Tassan (1994) maximum band ratio algorithm wasused to estimate the TSM concentration for OCM-2 asfollows:
Log Sð Þ ¼ 62:80*Xsþ 0:70
Where X is Total Suspended Matter concentrationin mgl–1 and Xs is variable defined as
Xs ¼ Rrs l555ð Þ þ Rrs l620ð Þ½ �* Rrs l555ð Þ=Rrs l490ð Þ½ �
where, the first factor, with λ555 and λ620 in a zone oflow chlorophyll sensitivity and yellow substance ab-sorption, is the sensitivity term (essentially because ofthe high sediment scattering in these wavelengths),where as the second factor, with λ555 and λ490 is theslope zone of the absorption spectra, and thus depend-ing on C and Ay (440), is the compensating term. Thevariable Xs was computed and plotted against TSMconcentration.
For cross validation of OCM data, the MODIS Aquadata (10 & 28th February, 21st March, 27th April, 4thJune 2010 and 11th March 2011) were selected to estab-lish a relationship, because of its high resolution (1 km)next to OCM. MODIS/Aqua chlorophyll daily imageswere acquired at no cost through the Indian NationalCentre for Ocean Information Services (INCOIS) web-site (www.incois.gov.in/Incois/pfzarchiveimages1.html)in PNG/HDF. Monthly composited chlorophyll imagesof MODIS-Aqua were obtained from the MODIS web-site (http://oceandata.sci.gsfc.nasa.gov/MODISA/Mapped/Monthly/4km/chlor/) for the seasonal studies.For this study, MODIS images of cloud free dates areselected for better data consistency.
TSM
MODIS-Aqua Rrs555nm product (10 & 28th February2010 and 11th March 2011) was used to study changesof relative TSM for the BoB region. MODIS-AquaRrs555nm data was downloaded from the OceanColor website (http://oceandata.sci.gsfc.nasa.gov) at nocost for daily andmonthly intervals in PNG/HDF formatfor cross validation and seasonal analysis. Large numberof sediment algorithms has been proposed to quan-tify TSM using these ocean colour payloads. Thisalgorithm was derived using water leaving radi-ance in band 555 nm is found to be in a goodcorrelation with TSM, which has been applied to
study of suspended sediment distribution in theBoB (Pradhan et al. 2005).
TSM ¼ 93:2Rrs l555ð Þ þ 13:24
Digital Image Processing
Sequential OCM-2 and MODIS-Aqua data for thestudy area were analysed to understand the chl a andTSM distribution patterns along the southwestBoB. The data were analysed for different seasonsusing ERDAS imagine (9.2 ver.) and ENVI (4.7ver.) software for pre processing of satelliteimages. The geometrically corrected OCM-2 chla and TSM images and daily and monthly imagesof MODIS-Aqua were utilized for inter comparisonand seasonal analysis. Regression plots betweenOCM-2 and MODIS derived chl a and TSM datawere drawn with the help of Sigmaplot (ver. 11)software.
Results
Spatio-Temporal Distribution of Chlorophyll aand TSM
The spatial and temporal distribution of chl a along thesouthwest coast of BoB was illustrated in Fig. 2(a–c).The chl a concentration measured at five coastal sta-tions was ranged from 0.09 to 10.63 μgl−1 with themean value of 0.9 μgl−1. The chl a concentrationswere found to be low (0.1–0.5 μgl−1) during postmon-soon season except the nearshore waters of all thestations and the highest chl a concentration of(4.11 μgl−1 and 3.95 μgl−1) were obtained at station3 and 4 respectively. Among all the seasons, the high-est range (0.21–10.63 μgl−1) of chl a concentrationwas recorded during summer season, with maximum(10.63 μgl−1) at station 4 and the minimum(0.21 μgl−1) at station 3. The moderate range (0.5–1.5 μgl−1) of chl a concentration with the mean valueof 1.13 μgl−1 was observed at all the stations duringpremonsoon season except station 2 which recordedthe highest chl a concentration (4.33 μgl−1) in thenearshore waters.
The spatial and temporal distribution of TSM alongthe southwest BoBwas represented in Fig. 2(d–f). In-situ
J Indian Soc Remote Sens
Author's personal copy
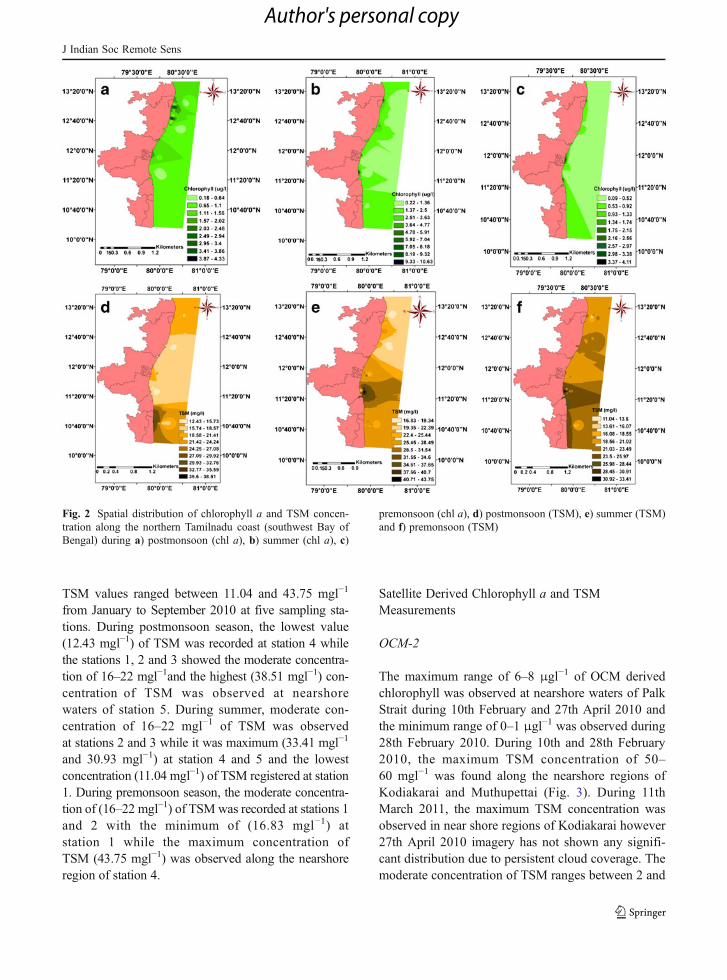
TSM values ranged between 11.04 and 43.75 mgl−1
from January to September 2010 at five sampling sta-tions. During postmonsoon season, the lowest value(12.43 mgl−1) of TSM was recorded at station 4 whilethe stations 1, 2 and 3 showed the moderate concentra-tion of 16–22 mgl−1and the highest (38.51 mgl−1) con-centration of TSM was observed at nearshorewaters of station 5. During summer, moderate con-centration of 16–22 mgl−1 of TSM was observedat stations 2 and 3 while it was maximum (33.41 mgl−1
and 30.93 mgl−1) at station 4 and 5 and the lowestconcentration (11.04 mgl−1) of TSM registered at station1. During premonsoon season, the moderate concentra-tion of (16–22 mgl−1) of TSM was recorded at stations 1and 2 with the minimum of (16.83 mgl−1) atstation 1 while the maximum concentration ofTSM (43.75 mgl−1) was observed along the nearshoreregion of station 4.
Satellite Derived Chlorophyll a and TSMMeasurements
OCM-2
The maximum range of 6–8 μgl−1 of OCM derivedchlorophyll was observed at nearshore waters of PalkStrait during 10th February and 27th April 2010 andthe minimum range of 0–1 μgl−1 was observed during28th February 2010. During 10th and 28th February2010, the maximum TSM concentration of 50–60 mgl−1 was found along the nearshore regions ofKodiakarai and Muthupettai (Fig. 3). During 11thMarch 2011, the maximum TSM concentration wasobserved in near shore regions of Kodiakarai however27th April 2010 imagery has not shown any signifi-cant distribution due to persistent cloud coverage. Themoderate concentration of TSM ranges between 2 and
Fig. 2 Spatial distribution of chlorophyll a and TSM concen-tration along the northern Tamilnadu coast (southwest Bay ofBengal) during a) postmonsoon (chl a), b) summer (chl a), c)
premonsoon (chl a), d) postmonsoon (TSM), e) summer (TSM)and f) premonsoon (TSM)
J Indian Soc Remote Sens
Author's personal copy
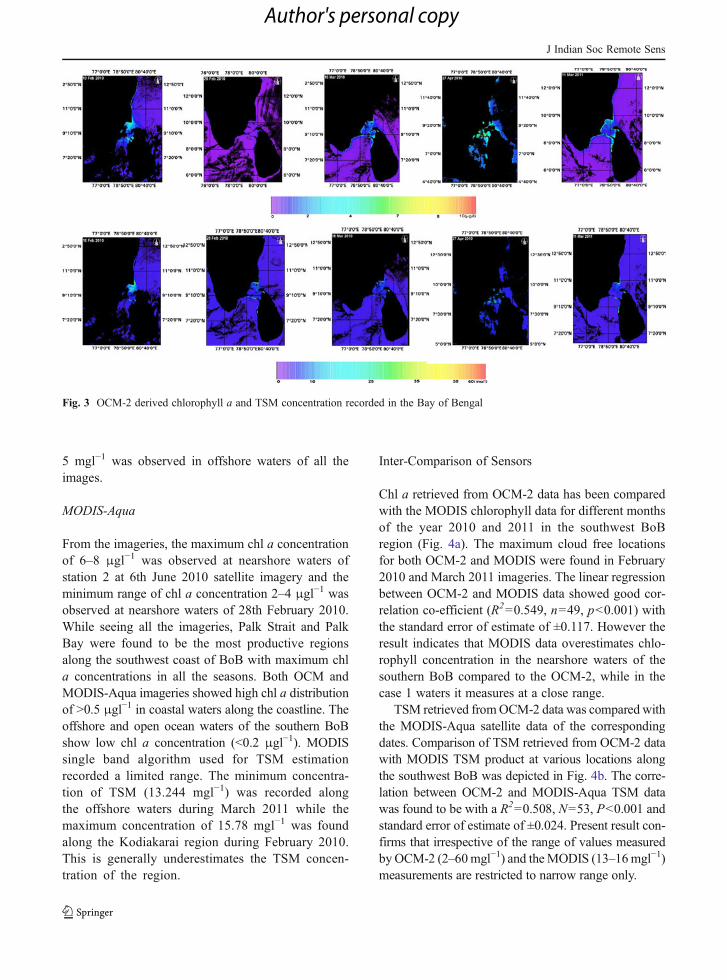
5 mgl−1 was observed in offshore waters of all theimages.
MODIS-Aqua
From the imageries, the maximum chl a concentrationof 6–8 μgl−1 was observed at nearshore waters ofstation 2 at 6th June 2010 satellite imagery and theminimum range of chl a concentration 2–4 μgl−1 wasobserved at nearshore waters of 28th February 2010.While seeing all the imageries, Palk Strait and PalkBay were found to be the most productive regionsalong the southwest coast of BoB with maximum chla concentrations in all the seasons. Both OCM andMODIS-Aqua imageries showed high chl a distributionof >0.5 μgl−1 in coastal waters along the coastline. Theoffshore and open ocean waters of the southern BoBshow low chl a concentration (<0.2 μgl−1). MODISsingle band algorithm used for TSM estimationrecorded a limited range. The minimum concentra-tion of TSM (13.244 mgl−1) was recorded alongthe offshore waters during March 2011 while themaximum concentration of 15.78 mgl−1 was foundalong the Kodiakarai region during February 2010.This is generally underestimates the TSM concen-tration of the region.
Inter-Comparison of Sensors
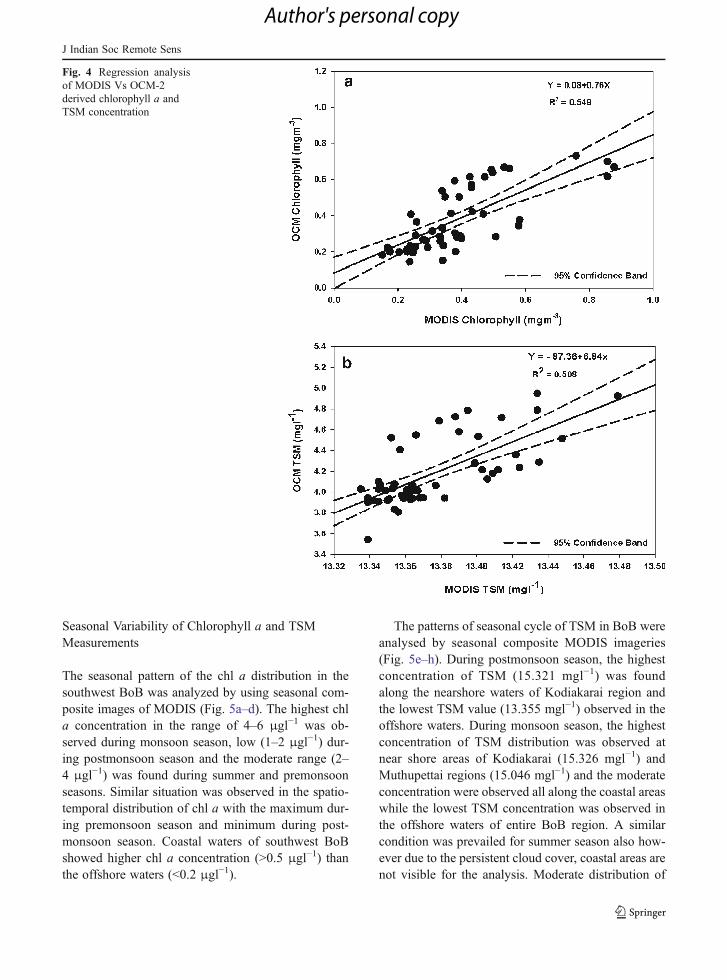
Chl a retrieved from OCM-2 data has been comparedwith the MODIS chlorophyll data for different monthsof the year 2010 and 2011 in the southwest BoBregion (Fig. 4a). The maximum cloud free locationsfor both OCM-2 and MODIS were found in February2010 and March 2011 imageries. The linear regressionbetween OCM-2 and MODIS data showed good cor-relation co-efficient (R200.549, n049, p<0.001) withthe standard error of estimate of ±0.117. However theresult indicates that MODIS data overestimates chlo-rophyll concentration in the nearshore waters of thesouthern BoB compared to the OCM-2, while in thecase 1 waters it measures at a close range.
TSM retrieved fromOCM-2 data was compared withthe MODIS-Aqua satellite data of the correspondingdates. Comparison of TSM retrieved from OCM-2 datawith MODIS TSM product at various locations alongthe southwest BoB was depicted in Fig. 4b. The corre-lation between OCM-2 and MODIS-Aqua TSM datawas found to be with a R200.508, N053, P<0.001 andstandard error of estimate of ±0.024. Present result con-firms that irrespective of the range of values measuredbyOCM-2 (2–60mgl−1) and theMODIS (13–16mgl−1)measurements are restricted to narrow range only.
Fig. 3 OCM-2 derived chlorophyll a and TSM concentration recorded in the Bay of Bengal
J Indian Soc Remote Sens
Author's personal copy
Seasonal Variability of Chlorophyll a and TSMMeasurements
The seasonal pattern of the chl a distribution in thesouthwest BoB was analyzed by using seasonal com-posite images of MODIS (Fig. 5a–d). The highest chla concentration in the range of 4–6 μgl−1 was ob-served during monsoon season, low (1–2 μgl−1) dur-ing postmonsoon season and the moderate range (2–4 μgl−1) was found during summer and premonsoonseasons. Similar situation was observed in the spatio-temporal distribution of chl a with the maximum dur-ing premonsoon season and minimum during post-monsoon season. Coastal waters of southwest BoBshowed higher chl a concentration (>0.5 μgl−1) thanthe offshore waters (<0.2 μgl−1).
The patterns of seasonal cycle of TSM in BoB wereanalysed by seasonal composite MODIS imageries(Fig. 5e–h). During postmonsoon season, the highestconcentration of TSM (15.321 mgl−1) was foundalong the nearshore waters of Kodiakarai region andthe lowest TSM value (13.355 mgl−1) observed in theoffshore waters. During monsoon season, the highestconcentration of TSM distribution was observed atnear shore areas of Kodiakarai (15.326 mgl−1) andMuthupettai regions (15.046 mgl−1) and the moderateconcentration were observed all along the coastal areaswhile the lowest TSM concentration was observed inthe offshore waters of entire BoB region. A similarcondition was prevailed for summer season also how-ever due to the persistent cloud cover, coastal areas arenot visible for the analysis. Moderate distribution of
Fig. 4 Regression analysisof MODIS Vs OCM-2derived chlorophyll a andTSM concentration
J Indian Soc Remote Sens
Author's personal copy
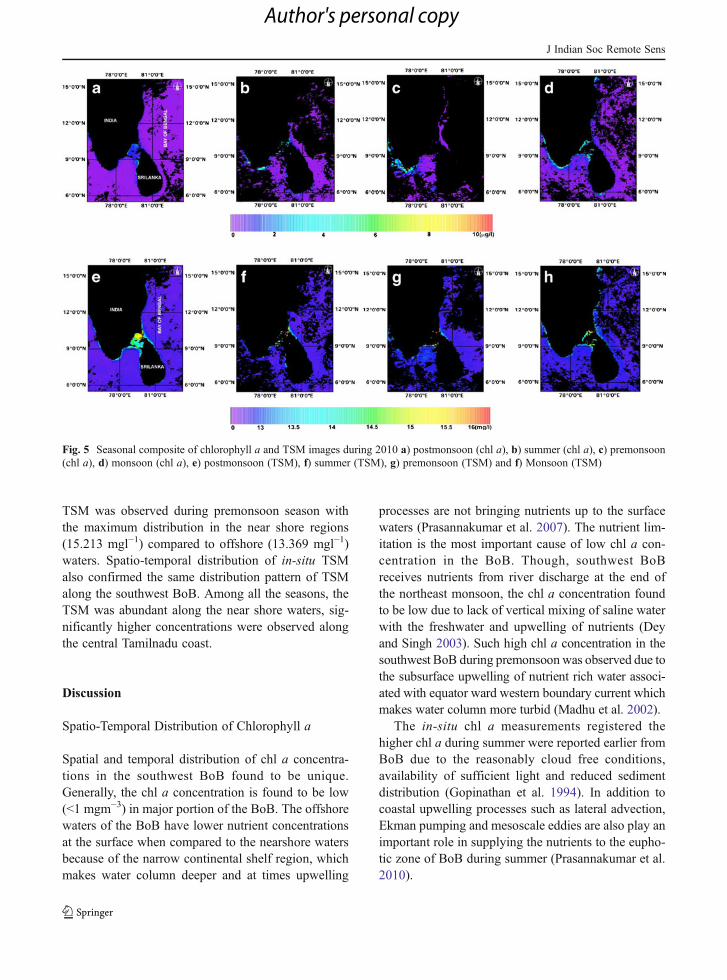
TSM was observed during premonsoon season withthe maximum distribution in the near shore regions(15.213 mgl−1) compared to offshore (13.369 mgl−1)waters. Spatio-temporal distribution of in-situ TSMalso confirmed the same distribution pattern of TSMalong the southwest BoB. Among all the seasons, theTSM was abundant along the near shore waters, sig-nificantly higher concentrations were observed alongthe central Tamilnadu coast.
Discussion
Spatio-Temporal Distribution of Chlorophyll a
Spatial and temporal distribution of chl a concentra-tions in the southwest BoB found to be unique.Generally, the chl a concentration is found to be low(<1 mgm−3) in major portion of the BoB. The offshorewaters of the BoB have lower nutrient concentrationsat the surface when compared to the nearshore watersbecause of the narrow continental shelf region, whichmakes water column deeper and at times upwelling
processes are not bringing nutrients up to the surfacewaters (Prasannakumar et al. 2007). The nutrient lim-itation is the most important cause of low chl a con-centration in the BoB. Though, southwest BoBreceives nutrients from river discharge at the end ofthe northeast monsoon, the chl a concentration foundto be low due to lack of vertical mixing of saline waterwith the freshwater and upwelling of nutrients (Deyand Singh 2003). Such high chl a concentration in thesouthwest BoB during premonsoonwas observed due tothe subsurface upwelling of nutrient rich water associ-ated with equator ward western boundary current whichmakes water column more turbid (Madhu et al. 2002).
The in-situ chl a measurements registered thehigher chl a during summer were reported earlier fromBoB due to the reasonably cloud free conditions,availability of sufficient light and reduced sedimentdistribution (Gopinathan et al. 1994). In addition tocoastal upwelling processes such as lateral advection,Ekman pumping and mesoscale eddies are also play animportant role in supplying the nutrients to the eupho-tic zone of BoB during summer (Prasannakumar et al.2010).
Fig. 5 Seasonal composite of chlorophyll a and TSM images during 2010 a) postmonsoon (chl a), b) summer (chl a), c) premonsoon(chl a), d) monsoon (chl a), e) postmonsoon (TSM), f) summer (TSM), g) premonsoon (TSM) and f) Monsoon (TSM)
J Indian Soc Remote Sens
Author's personal copy
Spatio-Temporal Distribution of TSM
The BoB receives many perennial river inflows in-cluding Ganges, Krishna, Godavari and Mahanadibesides several seasonal river inputs like Palar, Vellarand Coleroon all forming fertile, heavily populateddeltas and wetlands. Large scale fluvial discharge alsobrings large amount of sediment and contributes to thehigh TSM in this Bay throughout the year (Sridhar etal. 2008a) all makes BoB as one of the largest sedi-ment input sites of the world. In general, the distribu-tion of TSM in surface waters was abundant duringpremonsoon season especially the southern part of theBay which is an area where southwest monsoon windsare prevalent during June–September and makes thewater column more turbid, moreover along the south-ern Tamilnadu coast, the southwest monsoon bringsrainfall during this period and subsequent land runoffsadds significant TSM input into the Sea (Ram and Rao2005). The highest concentration (43.75 mgl−1) ofTSM was observed at station 4 might be because ofthe influence of brackish water resources like Vellarand Coleroon rivers, Mudasalodai backwater andPitchavaram mangroves (Sundararajan and Natesan2010) all discharging significant quantities of TSMduring tidal exchanges. In all the stations higher con-centration of TSM was noticed in nearshore regions,such higher TSM within the surf zones are result outdue to river discharge and littoral drift, resuspension ofbottom sediments shear stresses generated by waveaction and also the tidal currents (Sridhar et al.2008). During summer season, the TSM was moderateor less (11.04 mgl−1) in surface as well as subsurfacewaters this could be due to the increased near surfacestratification due to warm SST and less stronger windswhich inhibits the vertical mixing in the BoB(Prasannakumar et al. 2007).
Satellite Derived Chlorophyll Measurements
Generally, the BoB is considered to be less productiveduring summer monsoon than the Arabian Sea(Prasannakumar et al. 2007) because of the nutrientsbrought from river discharge and surface runoff arethought to be removed in the deeper waters of the BoBbecause of its narrow shelf (Qasim 1977) which makesupper layers become less productive due to lack ofnutrients and heavy cloud cover also inhibits the bio-logical production in the BoB (Muraleedharan et al.
2007; Prasannakumar et al. 2010). Both OCM-2 andMODIS data detected the high chl a ranges along thecoastal areas with increased chl a concentrations nearto Palk Bay region. But compared to OCM-2, MODISdetected high chl a regions during February 10, 2010were very well owing to the different over pass times.The present study also clearly identified that utiliza-tion of remote sensing data for monitoring the chl aconcentration in the southern BoB is very limitedowing to the persistent cloud cover problem.
Satellite Derived TSM Measurements
The role played by rivers in the coastal waters, nearriver mouths can be studied by measuring sedimentconcentrations using nearly daily data from satellitessuch as MODIS-Aqua and OCM-2 (Prasad and Singh2010). Using OCM-2 data, higher concentration (50–60 mgl−1) of TSM was observed at Kodiakarai andMuthupettai on February 2010 along the near shorewaters, which is always turbulent and makes the watercolumn turbid in nature. The moderate concentrationof TSM ranges between 2 and 5 mgl−1 was observedalong the offshore waters of all the images due to thevery limited discharges and dispersal from the land.As MODIS-Aqua imagery uses single band algorithmto estimate the TSM, this data also underestimates theTSM especially in case II waters, moreover the dataalso within a narrow range and it has not shown anysignificant seasonal variations for the region. Becauseof this reasons alone Raaj et al. (2008) developed sitespecific TSM algorithm with 510 and 555 nm and itcan be used only during north east monsoon periodover Vedaranyam coastal region. Achieving accept-able precision is difficult in MODIS because of itslow spatial resolution and analysis of algorithm sensi-tivity (Reza 2008). Compared to the MODIS-Aqua,OCM-2 (360 m) provides more reliable data on TSMbecause of its high spatial resolution and the 3 bandalgorithm used for OCM-2 data is capable of detectingconsiderably higher range of TSM both in near shoreand offshore regions, but still it underestimates theactual TSM concentration persist in the region.
Inter-Comparison of Sensors
Chl a retrieved from OCM-2 was compared withMODIS satellite data a correlation co-efficient ofR200.549 was obtained between them. Similar to this,
J Indian Soc Remote Sens
Author's personal copy
Singh and Chaturvedi (2010) got a correlation co-efficient of R200.657 between MODIS and IRS-P4OCM derived chl a concentration and Prasad andSingh (2010) showed low chl in the BoB than in theArabian Sea. Though different studies find good rela-tionship between OCM and MODIS datasets the rangeof correlation differs consistently for different regions.This change might be due to the differences in in-situmeasurements, algorithms used and range of chl avalues recorded during the study period etc. Thoughthere is a linear regression in chl a measurementsindicates that there is clear underestimation of chl aby OCM-2 and overestimation of chl a by MODISdata sets. A comparison of OCM-2 and MODIS de-rived TSM data showed good correlation of R200.508. Many studies compared the different satellitemeasurements and in-situ sampling points andobtained good correlation (Dekker et al. 2001; Hu etal. 2007 and Petus et al. 2010). Unless the data ofdifferent sensors are generated by the same algorithminter-comparison of such sensors will not result inmore meaningful conclusions.
Seasonal Variability in Chlorophyll Concentration
Seasonal and inter-annual variability of chl a concen-tration in the BoB and Arabian Sea was studied byseveral workers using OCM-1, SeaWiFS and MODISdata (Chaturvedi and Narain 2003; Tang et al. 2004;Sarangi et al. 2005; Dwivedi et al. 2006; Nezlin 2008).For the present study, the seasonal variability of chl awas studied by using seasonal composites of MODISChl a images due to the limited OCM-2 datasets. Thehigh concentration of chl a was observed during sum-mer and premonsoon seasons and the low concentra-tions were observed during postmonsoon and monsoonseasons confirming the results of Munikrishna (2010).In contrast, Sarangi et al. (2008) reported that OCM-1showed reduced chl a concentration (0.3 mgm−3) duringsummer due to surface heating and higher concentra-tions of chl a (2.0 mgm−3) during months of winterseason which is produced by the winter cooling phe-nomena in southern BoB. Both OCM-2 andMODIS chla images showed discrete patches of higher chlorophyllconcentration (>0.5 μgl−1) near the coastal waters and itwas found to be more abundant in Palk Bay and PalkStrait regions. Sarangi et al. (2001) stated that this couldbe due to the bathymetry and seasonal wind from thecontinental shelf towards coastal boundary which
induces the coastal upwelling. Dey and Singh (2003)also observed abrupt decrease of chlorophyll con-centration from 1 to 3 mgm−3 in the coastal areasto <0.5 mgm−3 after 11–12 km from the coast.This is very prominent in the BoB region owing to thenarrow continental shelf region and limited externalinputs in the region.
Seasonal Changes in TSM Concentration
For Seasonal analysis, increased TSM was common inmonsoon season largely due to higher river runoffwith high suspended load and due to littoral currentsthat carry high suspended sediment around the BoB(Sridhar et al. 2008). Moreover, station 4 surroundedby the two seasonal rivers like Vellar and Coleroonwhich discharges enormous quantities of TSM duringmonsoon season. In the southern BoB region, the longshore sediment transport was high during northeastmonsoon season and it was comparatively less duringthe premonsoon season (Saravanan and Chandrasekar2010).
Irrespective seasons, the TSM was abundant alongthe near shore regions significantly higher concentra-tions were observed in the Palk Strait compared to theother parts of the BoB is attributed to the very shallowdepth (10−15 m) of the region. Circulations of watermass observed in the BOB are clockwise circulationduring the southwest monsoon and the counter clock-wise circulation during the northeast monsoon. Duringthe southwest monsoon, the coastal circulation isnorthward and the net sediment transport is from southto north as it was recorded in the present study. Duringthe northeast monsoon, the coastal sediment driftssouthward with an anticlockwise movement. The sed-iment transported from the north to south mostly sinkin the Palk Bay region (Sridhar et al. 2008). This couldbe one of the reasons for the shallow nature of the seain the region. Rajawat et al. (2005) also observed largesediment plumes in postmonsoon season in the PalkBay with the higher TSM throughout the year. Next tothis region, highest concentration was observed atstation-5 along the near shore region of Nagapattinamwas due to the fresh water carried by the rivers ofKaduvaiyaru, Odampochiyar, Vedharanyam canal andUppanar in the region and annual net sediment trans-portation rate of about 1.07×10⁶m3/year in the northerlydirection at Nagapattinam region (Chandrasekar 1992).During postmonsoon season, the lowest value of TSM
J Indian Soc Remote Sens
Author's personal copy
was observed at station 3 as a consequence of thesuspended load from river discharge in Pondicherryand Cuddalore area are less as compared to Vellar andColeroon coastal waters.
Though, the southern BoB registered higher chlo-rophyll concentrations at nearshore waters, the season-al variations are found to be very less. BoBexperiences the onset and retreat monsoon, it is lessproductive when compared to the Arabian Sea due tothe lack of availability of nutrients in the upper layers,absence of upwelling process arising due to strongstratification of water column, weaker winds and per-sistent cloud cover which reduces the light availabilityin surface water. TSM showed marked variations bothspatially and temporally since it is subjected to theinfluence of topography, water discharge, tidal cur-rents, wind wave etc. Long term observations couldalone capable of bringing any clear characteristics oftemporal and spatial patterns. Impact of rivers oncoastal regions differs with season especially duringthe monsoon and non-monsoon months, this was morecritical in the regions like southern BoB were largeseasonal rivers confluence with the Bay. Under thiscondition, continuous monitoring of rivers at rivermouth, coastal region and open sea is difficult andexpensive. However, launch of satellites like OCM-2and MODIS-Aqua with relatively high spatial resolu-tions makes job easier and possible to monitor chl adistribution and sediment discharges on day to daybasis.
Acknowledgments Authors are thankful to the Space Appli-cation Centre, Government of India, Ahmedabad for financialassistance throughOcean Color Monitor-2 validationprogramme. We are grateful to authorities of AnnamalaiUniversity for support and encouragement. We thank theVessel Management Cell,mastersand the crew of the CruiseResearch Vessel Sagar Poorvi and Paschmi of National Instituteof Ocean Technology for their timelyhelp. Thanks are also due tothe anonymous reviewers for their critical comments andsuggestions.
References
Beebe, W. (2008). Production and life. In Svedrup, E.V.Ambrust (Ed.), An introduction to the World’s Oceans(pp. 371–388). New York: McGraw-Hill.
Chandrasekar, N. (1992). Beach placer mineral explorationalong the central Tamilnadu coast. Ph.D. Thesis, MaduraiKamaraj University: Madurai.
Chaturvedi, N., & Narain, A. (2003). Chlorophyll distributionpattern in the Arabian Sea: seasonal and regional variabil-ity, as observed from SeaWiFS data. International Journalof Remote Sensing, 24(3), 511–518.
Dekker, A. G., Vos, R. J., & Peters, S. W. M. (2001).Comparison of remote sensing data, model results and insitu data for total suspended matter (TSM) in the southernFrisian lakes. Science of the Total Environment, 268, 197–214.
Deng, M., & Li, Y. (2003). Use of SeaWiFS imagery to detectthree-dimensional distribution of suspended sediment.International Journal of Remote Sensing, 24(3), 519–534.
Dey, S., & Singh, R. P. (2003). Comparison of chlorophylldistribution in the northeastern Arabian Sea and southernBay of Bengal using IRS-P4 ocean color monitor data.Remote Sensing of Environment, 85, 424–428.
Doerffer, R., Fischer, J., Stossel, M., & Brockman, C. (1989).Analysis of thematic mapper data for studying the sus-pended matter distribution in the coastal area of theGerman bight (North Sea). Remote Sensing of Environment,28, 61–73.
Dwivedi, R. M., Raman, M., Parab, S., Matondkar, S. G. P., &Nayak, S. (2006). Influence of northeasterly trade winds onintensity of winter bloom in the Northern Arabian Sea.Current Science, 90(10), 1397–1406.
Gopinathan, C. P., Rodrigo, J. X., Kasim, H. M., & Rajagopalan,M. S. (1994). Phytoplankton pigments in relation to primaryproduction and nutrients in the inshore waters of Tuticorin,southeast coast of India. Indian Journal of Marine Sciences,23, 209–212.
Gordon, H. R., Brown, O. B., & Jacobs, M. M. (1975).Computed relationships between the inherent and apparentoptical properties of a flat homogeneous ocean. AppliedOptics, 14, 417–427.
Gray, J.R., Glysson, G.D., Turcios, L.M., & Schwarz, G.E.(2000). Comparability of suspended-sediment concentra-tion and total suspended solids data. U.S. GeologicalSurvey., Water-Resources Investigation Report, 00–4191,1–14.
Hu, C., Wang, Y., Yang, Q., He, S., Hu, L., & He, M. (2007).Comparison of ocean color data products from MERIS,MODIS and SeaWiFS: preliminary results for the eastchina seas. In: Proceedings of ‘Envisat symposium 2007’,Montreux Switzerland, pp. 23–27
Kunte, P. D. (2008). Sediment concentration and bed formstructures of Gulf of Cambay from remote sensing.International Journal of Remote Sensing, 29(8), 2169–2182.
Madhu, N. V., Maheswaran, P. A., Jyothibabu, R., Sunil, V.,Revichandran, C., Balasubramanian, T., Gopalakrishnan,T. C., & Nair, K. K. C. (2002). Enhanced biological pro-duction off Chennai triggered by October 1999 super cy-clone (Orissa). Current Science, 82(12), 1472–1479.
Munikrishna, K. (2010). Variability of SeaWiFS derivedchlorophyll-a concentrations in waters off central east coastof India, 1998–2003. International Journal of AppliedEarth Observation Geoinformatics, 12, 101–109.
Muraleedharan, K. R., Jasmine, P., Achuthankutty, C. J.,Revichandran, C., Dineshkumar, P. K., Anand, P., &Rejoman, G. (2007). Influence of basin-scale and meso-scale physical processes on biological productivity in the
J Indian Soc Remote Sens
Author's personal copy
Bay of Bengal during the summer monsoon. Progress inOceanography, 72, 364–383.
Nezlin, N. P. (2008). Seasonal and interannual variability ofremotely sensed chlorophyll. Environmental Chemistry, 5,333–349.
Petus, C., Chust, G., Gohin, F., Doxaran, D., Froidefond, J. M.,& Sagarminaga, Y. (2010). Estimating turbidity and totalsuspended matter in the Adour River plume (South Bay ofBiscay) using MODIS 250-m imagery. Continental ShelfResearch, 30, 379–392.
Pradhan, Y., Thomaskutty, A. V., Rajawat, A. S., & Nayak, S.(2005). Improved regional algorithm to retrieve total sus-pended particulate matter using IRS-P4 ocean colour mon-itor data. Pure & Applied Optics, 7, 343–349.
Prasad, A. K., & Singh, R. P. (2010). Chlorophyll, calcite andsuspended sediment concentration in the Bay of Bengaland the Arabian Sea at the river mouths. Advances in SpaceResearch, 45, 61–69.
Prasannakumar, S., Nuncio, M., Narvekar, J., Ramaiah, N.,Sardesai, S., Gauns, M., Fernandes, V., Paul, J. T.,Jyothibabu, R., & Jayaraj, K. A. (2010). Seasonal cycleof physical forcing and biological response in the Bay ofBengal. Indian Journal of Marine Science, 39(3), 388–405.
Prasannakumar, S., Nunico, M., Ramaiah, N., Sardesai, S.,Narvekar, J., Fernandes, V., & Paul, J.T. (2007). Eddy-mediated biological productivity in the Bay of Bengalduring fall and spring intermonsoons. Deep Sea Research,(I: Oceanographic Research Paper), 54(9), 1619–1640.
Qasim, S. Z. (1977). Biological productivity of the IndianOcean. Indian Journal of Marine Science, 6, 122–137.
Raaj, R., Ramalingam, M., Ghosh, S. K., & Kothyari, U. C.(2008). Mapping of suspended sediments using site specif-ic seasonal algorithms. Journal of Indian Society of RemoteSensing, 36, 61–68.
Rajawat, A. S., Gupta, M., Pradhan, Y., Thomaskutty, A. V., &Nayak, S. (2005). Coastal processes along the Indian coast-case studies based on synergisitic use of IRS-P4 OCM andIRS-1C/1D data. Indian Journal of Marine Sciences, 34(4),459–472.
Ram, P. S., & Rao, L. V. G. (2005). Upwelling features near SriLanka in the Bay of Bengal. In: Prasad, K. V. S. R. (Ed.),Proceedings of national symposium on half a centuryprogress in oceanographic studies of North Indian Oceansince Prof. La Fond’s Contributions (HACPO), p. 30–33.
Reza, M. M. (2008). Assessment of suspended sediment con-centration in surface waters, using MODIS images.American Journal of Applied Sciences, 5(7), 798–804.
Ritchie, J. C., Cooper, C. M., & Schiebe, F. R. (1990). Therelationship of MSS and TM digital data with suspendedsediments, chlorophyll, and temperature in Moon lake,Mississippi. Remote Sensing of Environment, 33, 137–148.
Sarangi, R. K., Chauhan, P., & Nayak, S. (2001). Chlorophyll-aconcentration along west coast of India using IRS-P3MOS-B data. Journal of Indian Society of RemoteSensing, 29(4), 197–201.
Sarangi, R. K., Chauhan, P., & Nayak, S. R. (2005). Inter-annualvariability of phytoplankton blooms in the northern
Arabian Sea during winter monsoon period (February–March) using IRS-P4 OCM data. Indian Journal ofMarine Sciences, 34(2), 163–173.
Sarangi, R. K., Nayak, S., & Panigrahy, R. C. (2008). Monthlyvariability of chlorophyll and associated physical parame-ters in the southwest Bay of Bengal water using remotesensing data. Indian Journal of Marine Sciences, 37(3),256–266.
Saravanan, S., & Chandrasekar, N. (2010). Potential littoralsediment transport along the coast of south eastern coastof India. Earth Sciences Research Journal, 14(2), 153–160.
Singh, R. P., & Chaturvedi, P. (2010). Comparison of chloro-phyll concentration in the Bay of Bengal and the ArabianSea using IRS-P4 OCM and MODIS-Aqua. Indian Journalof Marine Sciences, 39(3), 334–340.
Sridhar, P. N., Ali, M. M., Vethamony, P., Babu, M. T.,Ramana, I. V., & Jayakumar, B. (2008). Seasonal oc-currence of unique sediment plume in the Bay ofBengal. Eos Transactions American Geophysical Union, 89(3), 22–23.
Sridhar, P. N., Ramana, I. V., Ali, M. M., & Veeranarayana, B.(2008). Understanding the suspended sediment dynamicsin the coastal waters of the Bay of Bengal using highresolution ocean colour data. Current Science, 94(11),1499–1502.
Sundararajan, M., & Natesan, U. (2010). Sedimentary processesand mineral dispersion along Point Calimere, southeastcoast of India. World Applied Sciences Journal, 9(5),514–520.
Surendran, A., Selvavinayagam, K., Ramachandran, S., &Manoharan, N. (2006). Validations of suspended sedimentconcentration (SSC) derived using ocean colour monitor(OCM) data off Chennai coast, India. Journal of IndianSociety of Remote sensing, 34(4), 405–413.
Tang, D. L., Kawamura, H., Dien, T. V., & Lee, M. A. (2004).Offshore phytoplankton biomass increase and its oceano-graphic causes in the South China Sea. Marine EcologyProgress Series, 268, 31–41.
Tang, D. L., Kawamura, H., & Luis, A. J. (2002). Short termvariability of phytoplankton blooms associated with a coldeddy in the north western Arabian Sea. Remote Sensing ofEnvironment, 81, 81–89.
Tassan, S. (1994). Local algorithm using SeaWiFS data forretrieval of phytoplankton pigment, suspended sedimentsand yellow substances in coastal waters. Applied Optics,12, 2369–2378.
UNEP (2002). Global Environmental Outlook 3. United NationsEnvironment Programme. London and New York:Earthscan.
UNESCO (1994). Protocols for the joint global ocean flux study(JGOFS) core measurements. IOC Manuals and Guides,UNESCO Paris, 29, 97–100.
Van der Linde, D. W. (1998). Protocol for the determination oftotal suspended matter in oceans and coastal zones(Technical Note No. I.98): Joint Research Centre, Ispra,pp. 182.
J Indian Soc Remote Sens
Author's personal copy


