Embed Size (px)
Citation preview
10MARINE METEOROLOGY
CHAPTER 38. WEATHER ELEMENTS .............................................................................................................603CHAPTER 39. TROPICAL CYCLONES .............................................................................................................637CHAPTER 40. WEATHER OBSERVATIONS ....................................................................................................663CHAPTER 41. WEATHER ROUTING ................................................................................................................693
10

603
CHAPTER 38
WEATHER ELEMENTS
GENERAL DESCRIPTION OF THE ATMOSPHERE
3800. Introduction
Weather is the state of the Earth's atmosphere with
respect to temperature, humidity, precipitation, visibility,
cloudiness, and other factors. Climate refers to the average
long-term meteorological conditions of a place or region.
All weather may be traced to the effect of the Sun on
the Earth. Most changes in weather involve large-scale
horizontal motion of air. Air in motion is called wind. This
motion is produced by differences in atmospheric pressure,
which are attributable both to differences in temperature
and the nature of the motion itself.
Weather is of vital importance to the mariner. The
wind and state of the sea affect dead reckoning. Reduced
visibility limits piloting. The state of the atmosphere affects
electronic navigation and radio communication. If the skies
are overcast, celestial observations are not available. Under
certain conditions, refraction and dip are disturbed. When
wind was the primary motive power, knowledge of the
areas of favorable winds was of great importance. Modern
vessels are still affected considerably by wind and sea.
3801. The Atmosphere
The atmosphere is a relatively thin shell of air, water
vapor, and suspended particulates surrounding the Earth.
Air is a mixture of gases and, like any gas, is elastic and
highly compressible. Although extremely light, it has a
definite weight which can be measured. A cubic foot of air
at standard sea-level temperature and pressure weighs 1.22
ounces, or about 1/817th the weight of an equal volume of
water. Because of this weight, the atmosphere exerts a
pressure upon the surface of the Earth of about 15 pounds
per square inch.
As altitude increases, air pressure decreases due to the
decreased weight of air above. With less pressure, the
density decreases. More than three-fourths of the air is
concentrated within a layer averaging about 7 statute miles
thick, called the troposphere. This is the region of most
"weather," as the term is commonly understood.
The top of the troposphere is marked by a thin
transition zone called the tropopause, immediately above
which is the stratosphere. Beyond this lie several other
layers having distinctive characteristics. The average height
of the tropopause ranges from about 5 miles or less at high
latitudes to about 10 miles at low latitudes.
The standard atmosphere is a conventional vertical
structure of the atmosphere characterized by a standard sea-
level pressure of 1013.25 hectopascals of mercury (29.92
inches) and a sea-level air temperature of 15° C (59° F). The
temperature decreases with height at the standard lapse
rate, a uniform 2° C (3.6° F) per thousand feet to 11
kilometers (36,089 feet), and above that remains constant at
-56.5° C (-69.7° F).
The jet stream refers to relatively strong (greater than
60 knots) quasi-horizontal winds, usually concentrated
within a restricted layer of the atmosphere. Research has
indicated that the jet stream is important in relation to the
sequence of weather. There are two commonly known jet
streams. The sub-tropical jet stream (STJ) occurs in the
region of 30°N during the northern hemisphere winter,
decreasing in summer. The core of highest winds in the STJ
is found at about 12km altitude (40,000 feet) in the region
of 70°W, 40°E, and 150°E, although considerable
variability is common. The polar frontal jet stream (PFJ)
is found in middle to upper-middle latitudes and is discon-
tinuous and variable. Maximum jet stream winds have been
measured by weather balloons at 291 knots.
3802. General Circulation of the Atmosphere
The heat required to warm the air is supplied originally
by the Sun. As radiant energy from the Sun arrives at the
Earth, about 29 percent is reflected back into space by the
Earth and its atmosphere, 19 percent is absorbed by the
atmosphere, and the remaining 52 percent is absorbed by
the surface of the Earth. Much of the Earth's absorbed heat
is radiated back into space. Earth's radiation is in compara-
tively long waves relative to the short-wave radiation from
the Sun because it emanates from a cooler body. Long-
wave radiation, readily absorbed by the water vapor in the
air, is primarily responsible for the warmth of the
atmosphere near the Earth's surface. Thus, the atmosphere
acts much like the glass on the roof of a greenhouse. It
allows part of the incoming solar radiation to reach the
surface of the Earth but is heated by the terrestrial radiation
passing outward. Over the entire Earth and for long periods
of time, the total outgoing energy must be equivalent to the
incoming energy (minus any converted to another form and
retained), or the temperature of the Earth and its atmosphere
would steadily increase or decrease. In local areas, or over
relatively short periods of time, such a balance is not
604 WEATHER ELEMENTS
required. In fact it does not exist, resulting in changes such
as those occurring from one year to another, in different
seasons and in different parts of the day.
The more nearly perpendicular the rays of the Sun
strike the surface of the Earth, the more heat energy per unit
area is received at that place. Physical measurements show
that in the tropics, more heat per unit area is received than
is radiated away, and that in polar regions, the opposite is
true. Unless there were some process to transfer heat from
the tropics to polar regions, the tropics would be much
warmer than they are, and the polar regions would be much
colder. Atmospheric motions bring about the required
transfer of heat. The oceans also participate in the process,
but to a lesser degree.
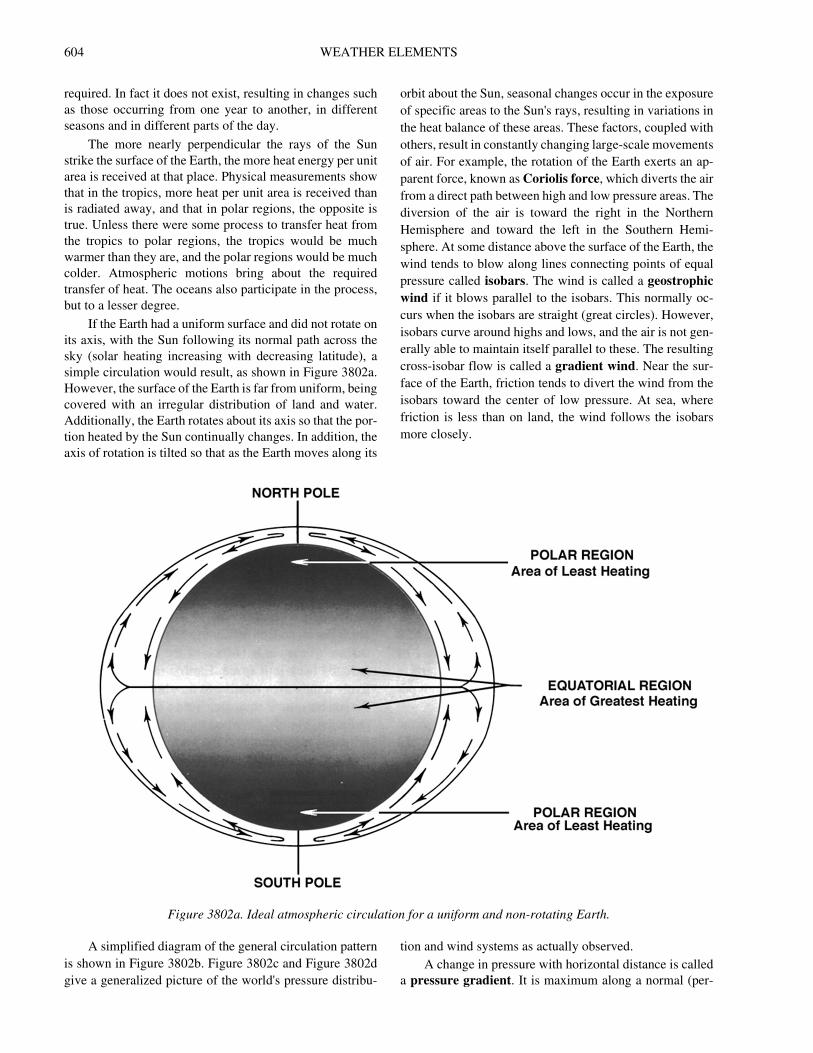
If the Earth had a uniform surface and did not rotate on
its axis, with the Sun following its normal path across the
sky (solar heating increasing with decreasing latitude), a
simple circulation would result, as shown in Figure 3802a.
However, the surface of the Earth is far from uniform, being
covered with an irregular distribution of land and water.
Additionally, the Earth rotates about its axis so that the por-
tion heated by the Sun continually changes. In addition, the
axis of rotation is tilted so that as the Earth moves along its
orbit about the Sun, seasonal changes occur in the exposure
of specific areas to the Sun's rays, resulting in variations in
the heat balance of these areas. These factors, coupled with
others, result in constantly changing large-scale movements
of air. For example, the rotation of the Earth exerts an ap-
parent force, known as Coriolis force, which diverts the air
from a direct path between high and low pressure areas. The
diversion of the air is toward the right in the Northern
Hemisphere and toward the left in the Southern Hemi-
sphere. At some distance above the surface of the Earth, the
wind tends to blow along lines connecting points of equal
pressure called isobars. The wind is called a geostrophic
wind if it blows parallel to the isobars. This normally oc-
curs when the isobars are straight (great circles). However,
isobars curve around highs and lows, and the air is not gen-
erally able to maintain itself parallel to these. The resulting
cross-isobar flow is called a gradient wind. Near the sur-
face of the Earth, friction tends to divert the wind from the
isobars toward the center of low pressure. At sea, where
friction is less than on land, the wind follows the isobars
more closely.
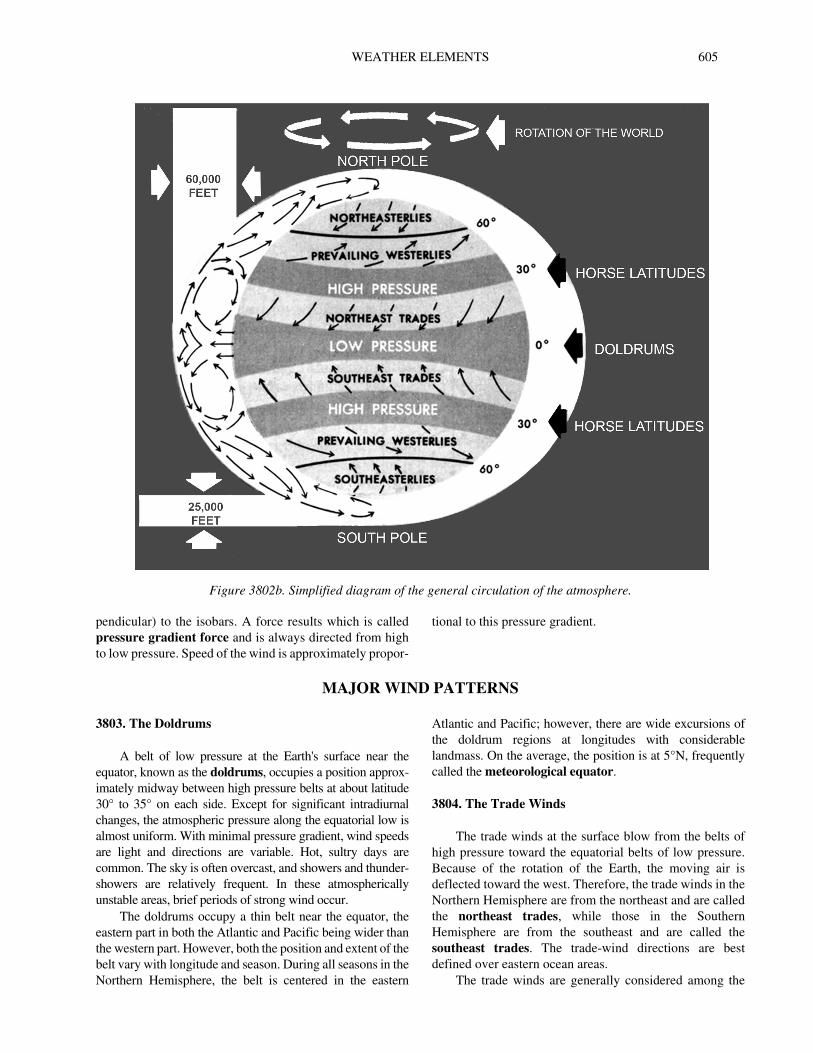
A simplified diagram of the general circulation pattern
is shown in Figure 3802b. Figure 3802c and Figure 3802d
give a generalized picture of the world's pressure distribu-
tion and wind systems as actually observed.
A change in pressure with horizontal distance is called
a pressure gradient. It is maximum along a normal (per-
Figure 3802a. Ideal atmospheric circulation for a uniform and non-rotating Earth.
WEATHER ELEMENTS 605
pendicular) to the isobars. A force results which is called
pressure gradient force and is always directed from high
to low pressure. Speed of the wind is approximately propor-
tional to this pressure gradient.
MAJOR WIND PATTERNS
3803. The Doldrums
A belt of low pressure at the Earth's surface near the
equator, known as the doldrums, occupies a position approx-
imately midway between high pressure belts at about latitude
30° to 35° on each side. Except for significant intradiurnal
changes, the atmospheric pressure along the equatorial low is
almost uniform. With minimal pressure gradient, wind speeds
are light and directions are variable. Hot, sultry days are
common. The sky is often overcast, and showers and thunder-
showers are relatively frequent. In these atmospherically
unstable areas, brief periods of strong wind occur.
The doldrums occupy a thin belt near the equator, the
eastern part in both the Atlantic and Pacific being wider than
the western part. However, both the position and extent of the
belt vary with longitude and season. During all seasons in the
Northern Hemisphere, the belt is centered in the eastern
Atlantic and Pacific; however, there are wide excursions of
the doldrum regions at longitudes with considerable
landmass. On the average, the position is at 5°N, frequently
called the meteorological equator.
3804. The Trade Winds
The trade winds at the surface blow from the belts of
high pressure toward the equatorial belts of low pressure.
Because of the rotation of the Earth, the moving air is
deflected toward the west. Therefore, the trade winds in the
Northern Hemisphere are from the northeast and are called
the northeast trades, while those in the Southern
Hemisphere are from the southeast and are called the
southeast trades. The trade-wind directions are best
defined over eastern ocean areas.
The trade winds are generally considered among the
Figure 3802b. Simplified diagram of the general circulation of the atmosphere.
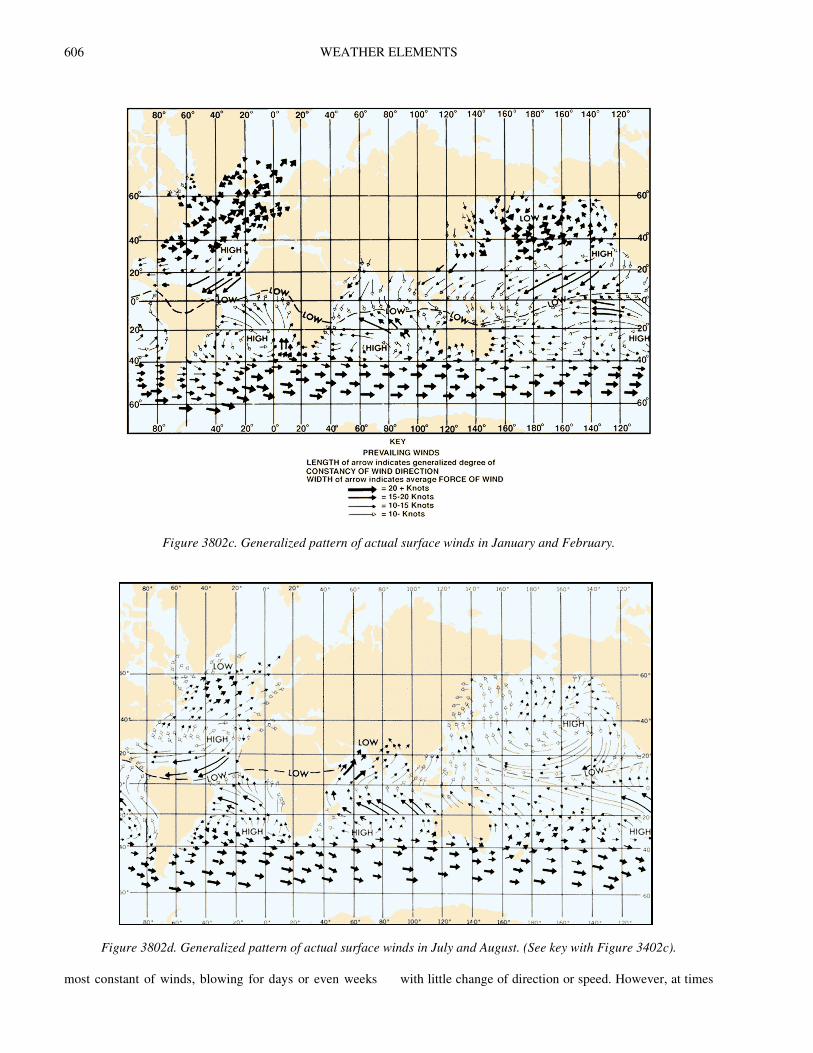
606 WEATHER ELEMENTS
most constant of winds, blowing for days or even weeks with little change of direction or speed. However, at times
Figure 3802c. Generalized pattern of actual surface winds in January and February.
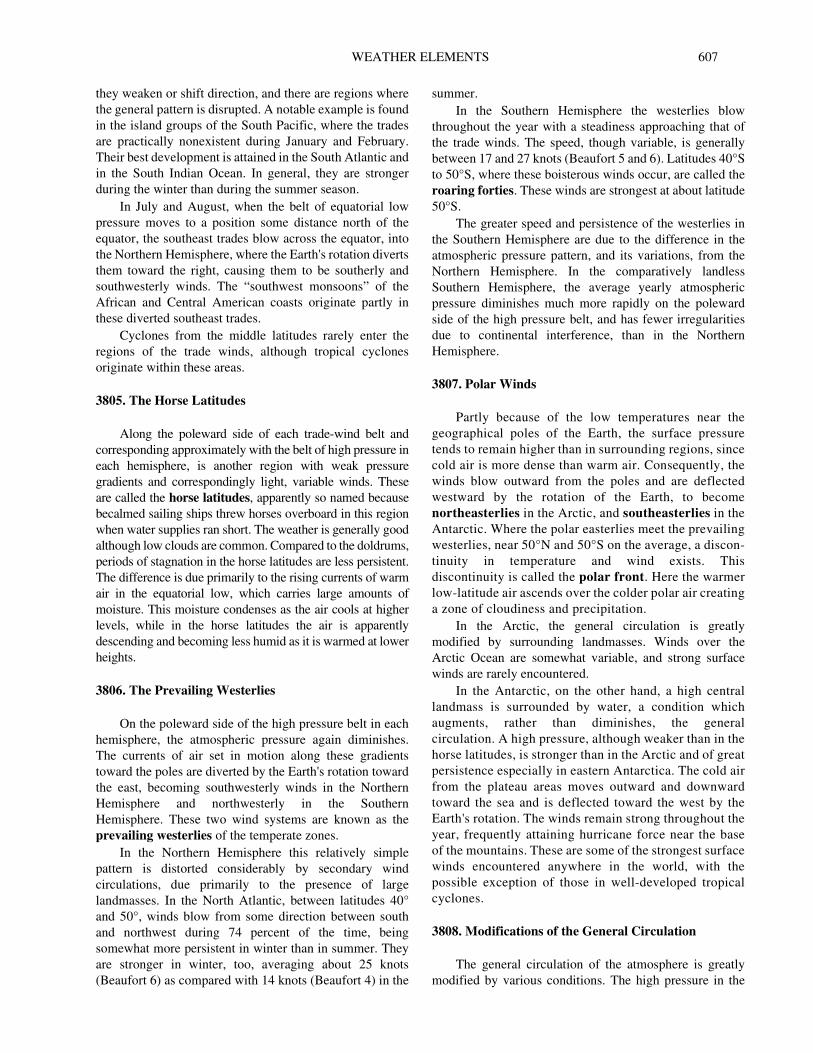
Figure 3802d. Generalized pattern of actual surface winds in July and August. (See key with Figure 3402c).
WEATHER ELEMENTS 607
they weaken or shift direction, and there are regions where
the general pattern is disrupted. A notable example is found
in the island groups of the South Pacific, where the trades
are practically nonexistent during January and February.
Their best development is attained in the South Atlantic and
in the South Indian Ocean. In general, they are stronger
during the winter than during the summer season.
In July and August, when the belt of equatorial low
pressure moves to a position some distance north of the
equator, the southeast trades blow across the equator, into
the Northern Hemisphere, where the Earth's rotation diverts
them toward the right, causing them to be southerly and
southwesterly winds. The “southwest monsoons” of the
African and Central American coasts originate partly in
these diverted southeast trades.
Cyclones from the middle latitudes rarely enter the
regions of the trade winds, although tropical cyclones
originate within these areas.
3805. The Horse Latitudes
Along the poleward side of each trade-wind belt and
corresponding approximately with the belt of high pressure in
each hemisphere, is another region with weak pressure
gradients and correspondingly light, variable winds. These
are called the horse latitudes, apparently so named because
becalmed sailing ships threw horses overboard in this region
when water supplies ran short. The weather is generally good
although low clouds are common. Compared to the doldrums,
periods of stagnation in the horse latitudes are less persistent.
The difference is due primarily to the rising currents of warm
air in the equatorial low, which carries large amounts of
moisture. This moisture condenses as the air cools at higher
levels, while in the horse latitudes the air is apparently
descending and becoming less humid as it is warmed at lower
heights.
3806. The Prevailing Westerlies
On the poleward side of the high pressure belt in each
hemisphere, the atmospheric pressure again diminishes.
The currents of air set in motion along these gradients
toward the poles are diverted by the Earth's rotation toward
the east, becoming southwesterly winds in the Northern
Hemisphere and northwesterly in the Southern
Hemisphere. These two wind systems are known as the
prevailing westerlies of the temperate zones.
In the Northern Hemisphere this relatively simple
pattern is distorted considerably by secondary wind
circulations, due primarily to the presence of large
landmasses. In the North Atlantic, between latitudes 40°
and 50°, winds blow from some direction between south
and northwest during 74 percent of the time, being
somewhat more persistent in winter than in summer. They
are stronger in winter, too, averaging about 25 knots
(Beaufort 6) as compared with 14 knots (Beaufort 4) in the
summer.
In the Southern Hemisphere the westerlies blow
throughout the year with a steadiness approaching that of
the trade winds. The speed, though variable, is generally
between 17 and 27 knots (Beaufort 5 and 6). Latitudes 40°S
to 50°S, where these boisterous winds occur, are called the
roaring forties. These winds are strongest at about latitude
50°S.
The greater speed and persistence of the westerlies in
the Southern Hemisphere are due to the difference in the
atmospheric pressure pattern, and its variations, from the
Northern Hemisphere. In the comparatively landless
Southern Hemisphere, the average yearly atmospheric
pressure diminishes much more rapidly on the poleward
side of the high pressure belt, and has fewer irregularities
due to continental interference, than in the Northern
Hemisphere.
3807. Polar Winds
Partly because of the low temperatures near the
geographical poles of the Earth, the surface pressure
tends to remain higher than in surrounding regions, since
cold air is more dense than warm air. Consequently, the
winds blow outward from the poles and are deflected
westward by the rotation of the Earth, to become
northeasterlies in the Arctic, and southeasterlies in the
Antarctic. Where the polar easterlies meet the prevailing
westerlies, near 50°N and 50°S on the average, a discon-
tinuity in temperature and wind exists. This
discontinuity is called the polar front. Here the warmer
low-latitude air ascends over the colder polar air creating
a zone of cloudiness and precipitation.
In the Arctic, the general circulation is greatly
modified by surrounding landmasses. Winds over the
Arctic Ocean are somewhat variable, and strong surface
winds are rarely encountered.
In the Antarctic, on the other hand, a high central
landmass is surrounded by water, a condition which
augments, rather than diminishes, the general
circulation. A high pressure, although weaker than in the
horse latitudes, is stronger than in the Arctic and of great
persistence especially in eastern Antarctica. The cold air
from the plateau areas moves outward and downward
toward the sea and is deflected toward the west by the
Earth's rotation. The winds remain strong throughout the
year, frequently attaining hurricane force near the base
of the mountains. These are some of the strongest surface
winds encountered anywhere in the world, with the
possible exception of those in well-developed tropical
cyclones.
3808. Modifications of the General Circulation
The general circulation of the atmosphere is greatly
modified by various conditions. The high pressure in the
608 WEATHER ELEMENTS
horse latitudes is not uniformly distributed around the belts,
but tends to be accentuated at several points, as shown in
Figure 3802c and Figure 3802d. These semi-permanent
highs remain at about the same places with great
persistence.
Semi-permanent lows also occur in various places, the
most prominent ones being west of Iceland and over the
Aleutians (winter only) in the Northern Hemisphere, and in
the Ross Sea and Weddell Sea in the Antarctic areas. The
regions occupied by these semi-permanent lows are
sometimes called the graveyards of the lows, since many lows
move directly into these areas and lose their identity as they
merge with and reinforce the semi-permanent lows. The low
pressure in these areas is maintained largely by the migratory
lows which stall there, with topography also important,
especially in Antarctica.
Another modifying influence is land, which undergoes
greater temperature changes than does the sea. During the
summer, a continent is warmer that its adjacent oceans.
Therefore, low pressures tend to prevail over the land. If a
climatological belt of high pressure encounters a continent,
its pattern is distorted or interrupted, whereas a belt of low
pressure is intensified over the same area. In winter, the op-
posite effect takes place, belts of high pressure being
intensified over land and those of low pressure being
weakened.
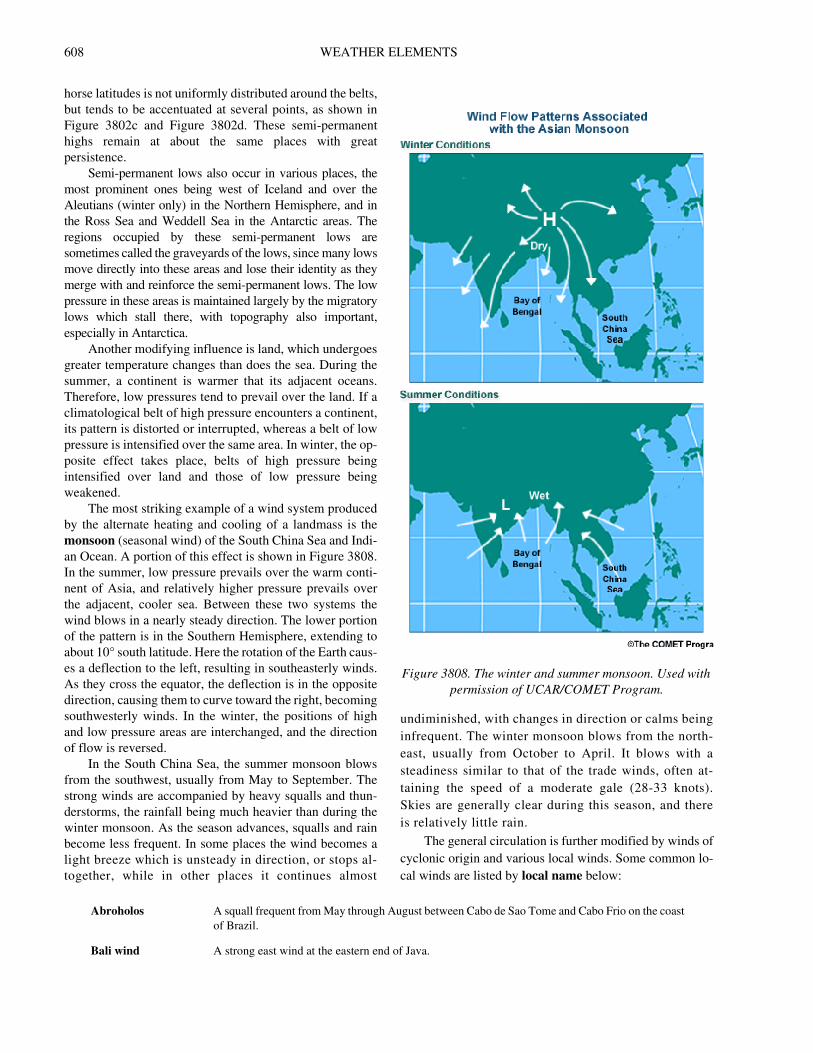
The most striking example of a wind system produced
by the alternate heating and cooling of a landmass is the
monsoon (seasonal wind) of the South China Sea and Indi-
an Ocean. A portion of this effect is shown in Figure 3808.
In the summer, low pressure prevails over the warm conti-
nent of Asia, and relatively higher pressure prevails over
the adjacent, cooler sea. Between these two systems the
wind blows in a nearly steady direction. The lower portion
of the pattern is in the Southern Hemisphere, extending to
about 10° south latitude. Here the rotation of the Earth caus-
es a deflection to the left, resulting in southeasterly winds.
As they cross the equator, the deflection is in the opposite
direction, causing them to curve toward the right, becoming
southwesterly winds. In the winter, the positions of high
and low pressure areas are interchanged, and the direction
of flow is reversed.
In the South China Sea, the summer monsoon blows
from the southwest, usually from May to September. The
strong winds are accompanied by heavy squalls and thun-
derstorms, the rainfall being much heavier than during the
winter monsoon. As the season advances, squalls and rain
become less frequent. In some places the wind becomes a
light breeze which is unsteady in direction, or stops al-
together, while in other places it continues almost
undiminished, with changes in direction or calms being
infrequent. The winter monsoon blows from the north-
east, usually from October to April. It blows with a
steadiness similar to that of the trade winds, often at-
taining the speed of a moderate gale (28-33 knots).
Skies are generally clear during this season, and there
is relatively little rain.
The general circulation is further modified by winds of
cyclonic origin and various local winds. Some common lo-
cal winds are listed by local name below:
Figure 3808. The winter and summer monsoon. Used with
permission of UCAR/COMET Program.
Abroholos A squall frequent from May through August between Cabo de Sao Tome and Cabo Frio on the coast
of Brazil.
Bali wind A strong east wind at the eastern end of Java.
WEATHER ELEMENTS 609
Barat A heavy northwest squall in Manado Bay on the north coast of the island of Celebes, prevalent from
December to February.
Barber A strong wind carrying damp snow or sleet and spray that freezes upon contact with objects,
especially the beard and hair.
Bayamo A violent wind blowing from the land on the south coast of Cuba, especially near the Bight of
Bayamo.
Bentu de Soli An east wind on the coast of Sardinia.
Bora A cold, northerly wind blowing from the Hungarian basin into the Adriatic Sea. See also FALL
WIND.
Borasco A thunderstorm or violent squall, especially in the Mediterranean.
Brisa, Briza 1. A northeast wind which blows on the coast of South America or an east wind which blows on
Puerto Rico during the trade wind season. 2. The northeast monsoon in the Philippines.
Brisote The northeast trade wind when it is blowing stronger than usual on Cuba.
Brubu A name for a squall in the East Indies.
Bull’s Eye Squall A fair weather squall characteristic of the ocean off the coast of South Africa. It is named for the
peculiar appearance of the small isolated cloud marking the top of the invisible vortex of the storm.
Cape Doctor The strong southeast wind which blows on the South African coast. Also called the DOCTOR.
Caver, Kaver A gentle breeze in the Hebrides.
Chubasco A violent squall with thunder and lightning, encountered during the rainy season along the west
coast of Central America.
Churada A severe rain squall in the Mariana Islands during the northeast monsoon. They occur from
November to April or May, especially from January through March.
Cierzo See MISTRAL.
Contrastes Winds a short distance apart blowing from opposite quadrants, frequent in the spring and fall in the
western Mediterranean.
Cordonazo The “Lash of St. Francis.” Name applied locally to southerly hurricane winds along the west coast
of Mexico. It is associated with tropical cyclones in the southeastern North Pacific Ocean. These
storms may occur from May to November, but ordinarily affect the coastal areas most severely near
or after the Feast of St. Francis, October 4.
Coromell A night land breeze prevailing from November to May at La Paz, near the southern extremity of the
Gulf of California.
Doctor 1. A cooling sea breeze in the Tropics.
2. See HARMATTAN. 3. The strong SE wind which blows on the south African coast. Usually
called CAPE DOCTOR.
Elephanta A strong southerly or southeasterly wind which blows on the Malabar coast of India during the
months of September and October and marks the end of the southwest monsoon.
Etesian A refreshing northerly summer wind of the Mediterranean, especially over the Aegean Sea.
Gregale A strong northeast wind of the central Mediterranean.
Harmattan The dry, dusty trade wind blowing off the Sahara Desert across the Gulf of Guinea and the Cape Verde
Islands. Sometimes called the DOCTOR because of its supposed healthful properties.
Knik Wind A strong southeast wind in the vicinity of Palmer, Alaska, most frequent in the winter.
Kona Storm A storm over the Hawaiian Islands, characterized by strong southerly or southwesterly winds and
heavy rains.
Leste A hot, dry, easterly wind of the Madeira and Canary Islands.
610 WEATHER ELEMENTS
Levanter A strong easterly wind of the Mediterranean, especially in the Strait of Gibraltar, attended by
cloudy, foggy, and sometimes rainy weather especially in winter.
Levantera A persistent east wind of the Adriatic, usually accompanied by cloudy weather.
Levanto A hot southeasterly wind which blows over the Canary Islands.
Leveche A warm wind in Spain, either a foehn or a hot southerly wind in advance of a low pressure area
moving from the Sahara Desert. Called a SIROCCO in other parts of the Mediterranean area.
Maestro A northwesterly wind with fine weather which blows, especially in summer, in the Adriatic. It is
most frequent on the western shore. This wind is also found on the coasts of Corsica and Sardinia.
Matanuska Wind A strong, gusty, northeast wind which occasionally occurs during the winter in the vicinity of
Palmer, Alaska.
Mistral A cold, dry wind blowing from the north over the northwest coast of the Mediterranean Sea,
particularly over the Gulf of Lions. Also called CIERZO. See also FALL WIND.
Morning Glory A rare meteorological phenomenon consisting of a low-level atmospheric solitary wave and
associated cloud, occasionally observed in different locations around the world. The wave often
occurs as an amplitude-ordered series of waves forming bands of roll clouds. Regularly occurs in the
southern part of the Gulf of Carpentaria.
Norte A strong cold northeasterly wind which blows in Mexico and on the shores of the Gulf of Mexico.
It results from an outbreak of cold air from the north. It is the Mexican extension of a norther.
Nashi, N’aschi A northeast wind which occurs in winter on the Iranian coast of the Persian Gulf, especially near the
entrance to the gulf, and also on the Makran coast. It is probably associated with an outflow from
the central Asiatic anticyclone which extends over the high land of Iran. It is similar in character but
less severe than the BORA.
Papagayo A violent northeasterly fall wind on the Pacific coast of Nicaragua and Guatemala. It consists of the
cold air mass of a norte which has overridden the mountains of Central America. See also
TEHUANTEPECER.
Pampero A fall wind of the Argentine coast.
Santa Ana A strong, hot, dry wind blowing out into San Pedro Channel from the southern California desert
through Santa Ana Pass.
Shamal A summer northwesterly wind blowing over Iraq and the Persian Gulf, often strong during the day,
but decreasing at night.
Sharki A southeasterly wind which sometimes blows in the Persian Gulf.
Sirocco A warm wind of the Mediterranean area, either a foehn or a hot southerly wind in advance of a low
pressure area moving from the Sahara or Arabian deserts. Called LEVECHE in Spain.
Squamish A strong and often violent wind occurring in many of the fjords of British Columbia. Squamishes
occur in those fjords oriented in a northeast-southwest or east-west direction where cold polar air
can be funneled westward. They are notable in Jervis, Toba, and Bute inlets and in Dean Channel
and Portland Canal. Squamishes lose their strength when free of the confining fjords and are not
noticeable 15 to 20 miles offshore.
Suestado A storm with southeast gales, caused by intense cyclonic activity off the coasts of Argentina and
Uruguay, which affects the southern part of the coast of Brazil in the winter.
Sumatra A squall with violent thunder, lightning, and rain, which blows at night in the Malacca Straits,
especially during the southwest monsoon. It is intensified by strong mountain breezes.
Taku Wind A strong, gusty, east-northeast wind, occurring in the vicinity of Juneau, Alaska, between October
and March. At the mouth of the Taku River, after which it is named, it sometimes attains hurricane force.
WEATHER ELEMENTS 611
AIR MASSES
3809. Types of Air Masses
Because of large differences in physical characteristics
of the Earth's surface, particularly the oceanic and continen-
tal contrasts, the air overlying these surfaces acquires
differing values of temperature and moisture. The processes
of radiation and convection in the lower portions of the tro-
posphere act in differing characteristic manners for a number
of well-defined regions of the Earth. The air overlying these
regions acquires characteristics common to the particular ar-
ea, but contrasts those of other areas. Each distinctive part of
the atmosphere, within which common characteristics pre-
vail over a reasonably large area, is called an air mass.
Air masses are named according to their source
regions. Four regions are generally recognized: (1)
equatorial (E), the doldrums area between the north and
south trades; (2) tropical (T), the trade wind and lower
temperate regions; (3) polar (P), the higher temperate
latitudes; and (4) Arctic or Antarctic (A), the north or south
polar regions of ice and snow. This classification is a
general indication of relative temperature, as well as
latitude of origin.
Air masses are further classified as maritime (m) or
continental (c), depending upon whether they form over
water or land. This classification is an indication of the
relative moisture content of the air mass. Tropical air might
be designated maritime tropical (mT) or continental
tropical (cT). Similarly, polar air may be either maritime
polar (mP) or continental polar (cP). Arctic/Antarctic air,
due to the predominance of landmasses and ice fields in the
high latitudes, is rarely maritime Arctic (mA). Equatorial
air is found exclusively over the ocean surface and is
designated neither (cE) nor (mE), but simply (E).
A third classification sometimes applied to tropical and
polar air masses indicates whether the air mass is warm (w)
or cold (k) relative to the underlying surface. Thus, the
symbol mTw indicates maritime tropical air which is
warmer than the underlying surface, and cPk indicates
continental polar air which is colder than the underlying
surface. The w and k classifications are primarily
indications of stability (i.e., change of temperature with
increasing height). If the air is cold relative to the surface,
the lower portion of the air mass will be heated, resulting in
instability (temperature markedly decreases with increasing
height) as the warmer air tends to rise by convection.
Conversely, if the air is warm relative to the surface, the
lower portion of the air mass is cooled, tending to remain
close to the surface. This is a stable condition (temperature
increases with increasing height).
Two other types of air masses are sometimes recognized.
These are monsoon (M), a transitional form between cP and
E; and superior (S), a special type formed in the free
atmosphere by the sinking and consequent warming of air
aloft.
Atmospheric pressure is directly related to the density
of the air mass above any given point on the Earth's surface.
Temperature distribution is the most significant regulator or
contributor to atmospheric density. Since temperature de-
creases considerably as you move higher in the
troposphere, temperature (density) distribution in the lower
troposphere contributes greatly to atmospheric pressure
measured at sea-level. Air masses not only are character-
ized by temperature and moisture, but they also represent
distributions of sea-level pressure. Examples of character-
istic weather systems associated with air masses include the
Arctic High, Bermuda High, Aleutian Low, Icelandic Low,
Siberian High, and the Azores High.
3810. Isobars and Wind
Isobars are lines that connect points of equal sea-level
pressure across the Earth's surface. Isobars can be thought
of as lines of equal density and representative of the three
dimensional density structure of the atmosphere. The
Tehuantepecer A violent squally wind from north or north-northeast in the Gulf of Tehuantepec (south of southern
Mexico) in winter. It originates in the Gulf of Mexico as a norther which crosses the isthmus and
blows through the gap between the Mexican and Guatamalan mountains. It may be felt up to 100
miles out to sea. See also PAPAGAYO.
Tramontana A northeasterly or northerly winter wind off the west coast of Italy. It is a fresh wind of the fine
weather mistral type.
Vardar A cold fall wind blowing from the northwest down the Vardar valley in Greece to the Gulf of
Salonica. It occurs when atmospheric pressure over eastern Europe is higher than over the Aegean
Sea, as is often the case in winter. Also called VARDARAC.
Warm Braw A foehn wind in the Schouten Islands, north of New Guinea.
Williwaw A sudden blast of wind descending from a mountainous coast to the sea, in the Strait of Magellan or
the Aleutian Islands.
White Squall A sudden, strong gust of wind coming up without warning, noted by whitecaps or white, broken
water; usually seen in whirlwind form in clear weather in the tropics.
612 WEATHER ELEMENTS
distance between isobars changes depending on the density
difference; the closer the isobars are together, the greater
the pressure difference or pressure gradient. As mentioned
earlier in this chapter, the pressure gradient or pressure
gradient force at sea-level is the force that drives the wind
over the ocean.
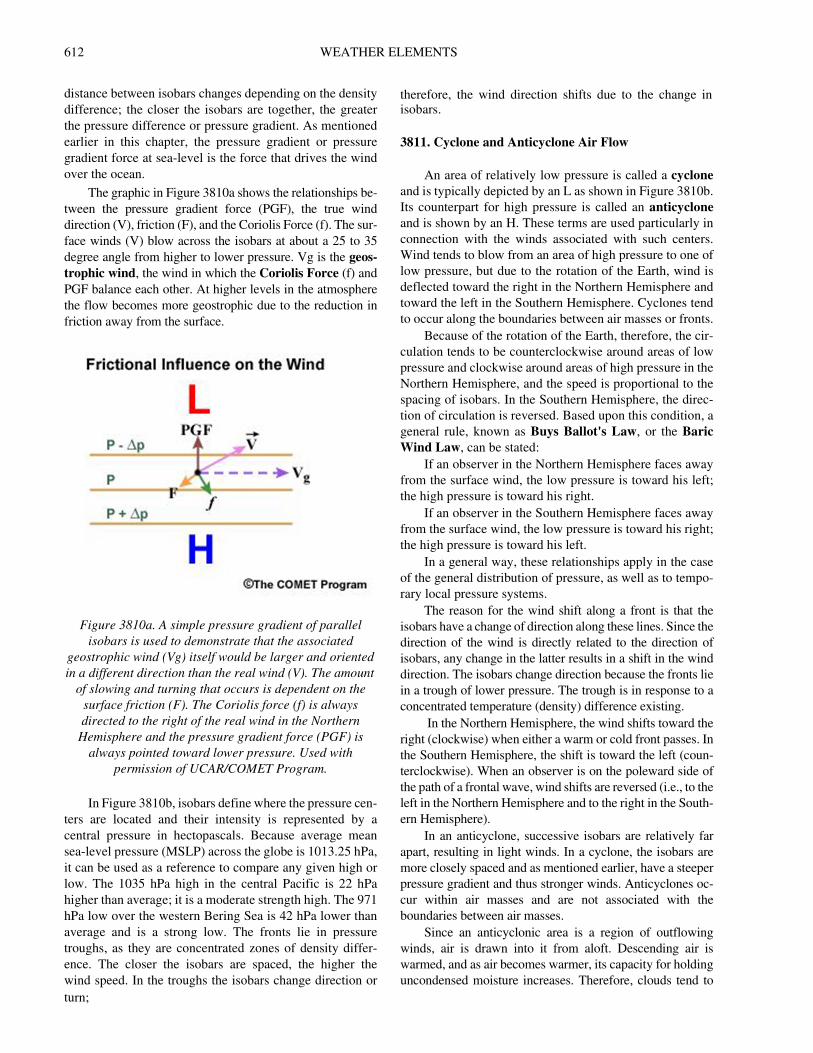
The graphic in Figure 3810a shows the relationships be-
tween the pressure gradient force (PGF), the true wind
direction (V), friction (F), and the Coriolis Force (f). The sur-
face winds (V) blow across the isobars at about a 25 to 35
degree angle from higher to lower pressure. Vg is the geos-
trophic wind, the wind in which the Coriolis Force (f) and
PGF balance each other. At higher levels in the atmosphere
the flow becomes more geostrophic due to the reduction in
friction away from the surface.
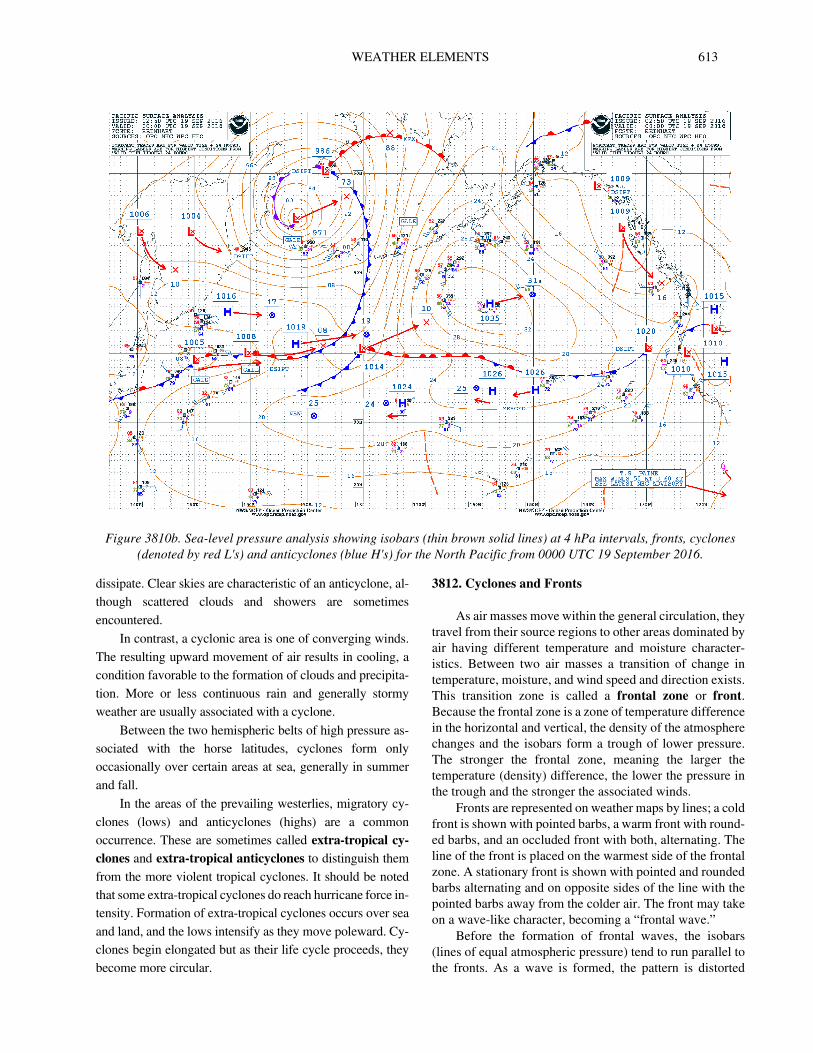
In Figure 3810b, isobars define where the pressure cen-
ters are located and their intensity is represented by a
central pressure in hectopascals. Because average mean
sea-level pressure (MSLP) across the globe is 1013.25 hPa,
it can be used as a reference to compare any given high or
low. The 1035 hPa high in the central Pacific is 22 hPa
higher than average; it is a moderate strength high. The 971
hPa low over the western Bering Sea is 42 hPa lower than
average and is a strong low. The fronts lie in pressure
troughs, as they are concentrated zones of density differ-
ence. The closer the isobars are spaced, the higher the
wind speed. In the troughs the isobars change direction or
turn;
therefore, the wind direction shifts due to the change in isobars.
3811. Cyclone and Anticyclone Air Flow
An area of relatively low pressure is called a cyclone
and is typically depicted by an L as shown in Figure 3810b.
Its counterpart for high pressure is called an anticyclone
and is shown by an H. These terms are used particularly in
connection with the winds associated with such centers.
Wind tends to blow from an area of high pressure to one of
low pressure, but due to the rotation of the Earth, wind is
deflected toward the right in the Northern Hemisphere and
toward the left in the Southern Hemisphere. Cyclones tend
to occur along the boundaries between air masses or fronts.
Because of the rotation of the Earth, therefore, the cir-
culation tends to be counterclockwise around areas of low
pressure and clockwise around areas of high pressure in the
Northern Hemisphere, and the speed is proportional to the
spacing of isobars. In the Southern Hemisphere, the direc-
tion of circulation is reversed. Based upon this condition, a
general rule, known as Buys Ballot's Law, or the Baric
Wind Law, can be stated:
If an observer in the Northern Hemisphere faces away
from the surface wind, the low pressure is toward his left;
the high pressure is toward his right.
If an observer in the Southern Hemisphere faces away
from the surface wind, the low pressure is toward his right;
the high pressure is toward his left.
In a general way, these relationships apply in the case
of the general distribution of pressure, as well as to tempo-
rary local pressure systems.
The reason for the wind shift along a front is that the
isobars have a change of direction along these lines. Since the
direction of the wind is directly related to the direction of
isobars, any change in the latter results in a shift in the wind
direction. The isobars change direction because the fronts lie
in a trough of lower pressure. The trough is in response to a
concentrated temperature (density) difference existing.
In the Northern Hemisphere, the wind shifts toward the
right (clockwise) when either a warm or cold front passes. In
the Southern Hemisphere, the shift is toward the left (coun-
terclockwise). When an observer is on the poleward side of
the path of a frontal wave, wind shifts are reversed (i.e., to the
left in the Northern Hemisphere and to the right in the South-
ern Hemisphere).
In an anticyclone, successive isobars are relatively far
apart, resulting in light winds. In a cyclone, the isobars are
more closely spaced and as mentioned earlier, have a steeper
pressure gradient and thus stronger winds. Anticyclones oc-
cur within air masses and are not associated with the
boundaries between air masses.
Since an anticyclonic area is a region of outflowing
winds, air is drawn into it from aloft. Descending air is
warmed, and as air becomes warmer, its capacity for holding
uncondensed moisture increases. Therefore, clouds tend to
Figure 3810a. A simple pressure gradient of parallel
isobars is used to demonstrate that the associated
geostrophic wind (Vg) itself would be larger and oriented
in a different direction than the real wind (V). The amount
of slowing and turning that occurs is dependent on the
surface friction (F). The Coriolis force (f) is always
directed to the right of the real wind in the Northern
Hemisphere and the pressure gradient force (PGF) is
always pointed toward lower pressure. Used with
permission of UCAR/COMET Program.
WEATHER ELEMENTS 613
dissipate. Clear skies are characteristic of an anticyclone, al-
though scattered clouds and showers are sometimes
encountered.
In contrast, a cyclonic area is one of converging winds.
The resulting upward movement of air results in cooling, a
condition favorable to the formation of clouds and precipita-
tion. More or less continuous rain and generally stormy
weather are usually associated with a cyclone.
Between the two hemispheric belts of high pressure as-
sociated with the horse latitudes, cyclones form only
occasionally over certain areas at sea, generally in summer
and fall.
In the areas of the prevailing westerlies, migratory cy-
clones (lows) and anticyclones (highs) are a common
occurrence. These are sometimes called extra-tropical cy-
clones and extra-tropical anticyclones to distinguish them
from the more violent tropical cyclones. It should be noted
that some extra-tropical cyclones do reach hurricane force in-
tensity. Formation of extra-tropical cyclones occurs over sea
and land, and the lows intensify as they move poleward. Cy-
clones begin elongated but as their life cycle proceeds, they
become more circular.
3812. Cyclones and Fronts
As air masses move within the general circulation, they
travel from their source regions to other areas dominated by
air having different temperature and moisture character-
istics. Between two air masses a transition of change in
temperature, moisture, and wind speed and direction exists.
This transition zone is called a frontal zone or front.
Because the frontal zone is a zone of temperature difference
in the horizontal and vertical, the density of the atmosphere
changes and the isobars form a trough of lower pressure.
The stronger the frontal zone, meaning the larger the
temperature (density) difference, the lower the pressure in
the trough and the stronger the associated winds.
Fronts are represented on weather maps by lines; a cold
front is shown with pointed barbs, a warm front with round-
ed barbs, and an occluded front with both, alternating. The
line of the front is placed on the warmest side of the frontal
zone. A stationary front is shown with pointed and rounded
barbs alternating and on opposite sides of the line with the
pointed barbs away from the colder air. The front may take
on a wave-like character, becoming a “frontal wave.”
Before the formation of frontal waves, the isobars
(lines of equal atmospheric pressure) tend to run parallel to
the fronts. As a wave is formed, the pattern is distorted
Figure 3810b. Sea-level pressure analysis showing isobars (thin brown solid lines) at 4 hPa intervals, fronts, cyclones
(denoted by red L's) and anticyclones (blue H's) for the North Pacific from 0000 UTC 19 September 2016.
614 WEATHER ELEMENTS
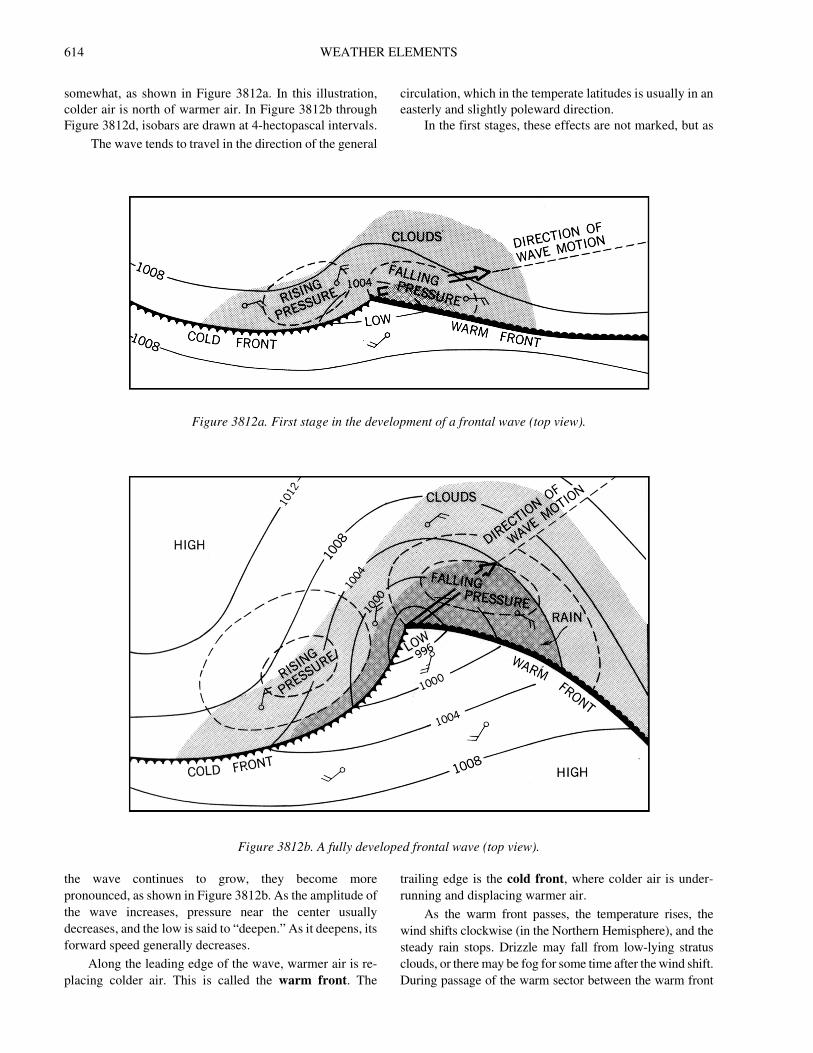
somewhat, as shown in Figure 3812a. In this illustration,
colder air is north of warmer air. In Figure 3812b through
Figure 3812d, isobars are drawn at 4-hectopascal intervals.
The wave tends to travel in the direction of the general
circulation, which in the temperate latitudes is usually in an
easterly and slightly poleward direction.
In the first stages, these effects are not marked, but as
the wave continues to grow, they become more
pronounced, as shown in Figure 3812b. As the amplitude of
the wave increases, pressure near the center usually
decreases, and the low is said to “deepen.” As it deepens, its
forward speed generally decreases.
Along the leading edge of the wave, warmer air is re-
placing colder air. This is called the warm front. The
trailing edge is the cold front, where colder air is under-
running and displacing warmer air.
As the warm front passes, the temperature rises, the
wind shifts clockwise (in the Northern Hemisphere), and the
steady rain stops. Drizzle may fall from low-lying stratus
clouds, or there may be fog for some time after the wind shift.
During passage of the warm sector between the warm front
Figure 3812a. First stage in the development of a frontal wave (top view).
Figure 3812b. A fully developed frontal wave (top view).
WEATHER ELEMENTS 615
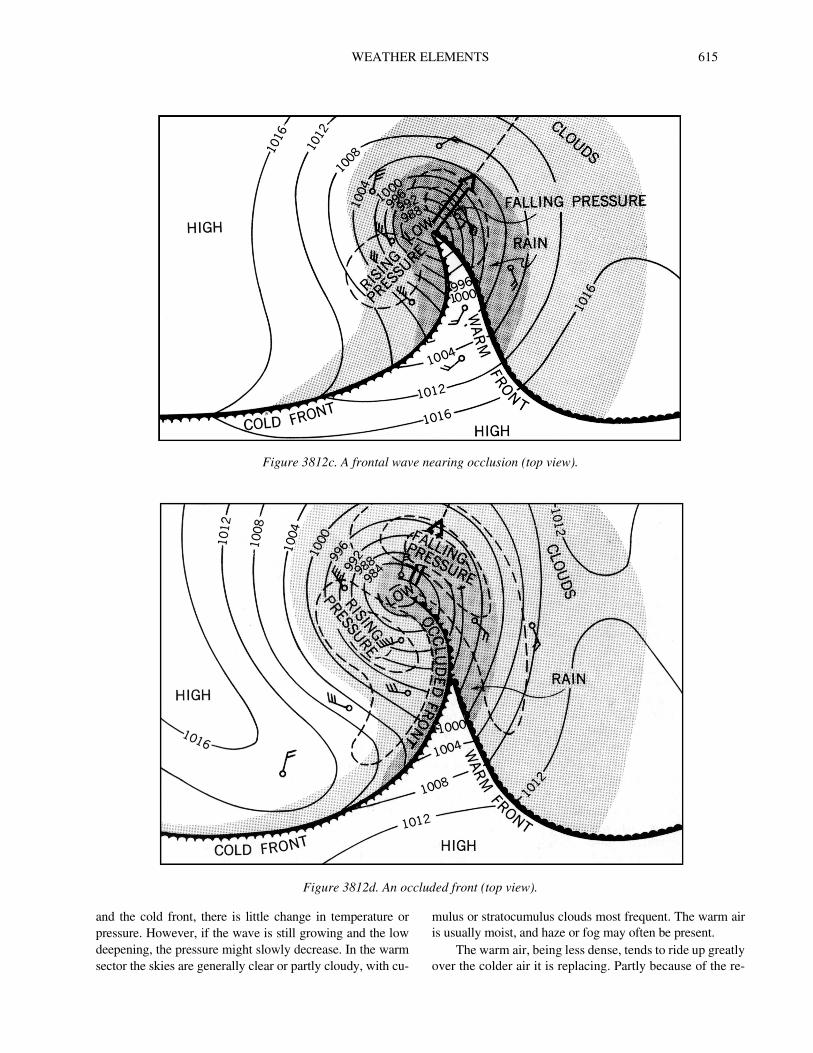
and the cold front, there is little change in temperature or
pressure. However, if the wave is still growing and the low
deepening, the pressure might slowly decrease. In the warm
sector the skies are generally clear or partly cloudy, with cu-
mulus or stratocumulus clouds most frequent. The warm air
is usually moist, and haze or fog may often be present.
The warm air, being less dense, tends to ride up greatly
over the colder air it is replacing. Partly because of the re-
Figure 3812c. A frontal wave nearing occlusion (top view).
Figure 3812d. An occluded front (top view).
616 WEATHER ELEMENTS
placement of cold, dense air with warm, light air, the
pressure decreases. Since the slope is gentle, the upper part
of a warm frontal surface may be many hundreds of miles
ahead of the surface portion. The decreasing pressure, indi-
cated by a “falling barometer,” is often an indication of the
approach of such a wave. In a slow-moving, well-devel-
oped wave, the barometer may begin to fall several days
before the wave arrives. Thus, the amount and nature of the
change of atmospheric pressure between observations,
called pressure tendency, is of assistance in predicting the
approach of such a system.
The advancing cold air, being more dense, tends to ride
under the warmer air at the cold front, lifting it to greater
heights. The slope here is such that the upper-air portion of
the cold front is behind the surface position relative to its
motion. After a cold front has passed, the pressure increas-
es, giving a rising barometer.
The approach of a well-developed warm front (i.e.,
when the warm air is mT) is usually heralded not only by
falling pressure, but also by a more-or-less regular se-
quence of clouds. First, cirrus appear. These give way
successively to cirrostratus, altostratus, altocumulus, and
nimbostratus. Brief showers may precede the steady rain
accompanying the nimbostratus.
As the faster moving, steeper cold front passes, the wind
veers (shifts clockwise in the Northern Hemisphere and
counterclockwise in the Southern Hemisphere), the
temperature falls rapidly, and there are often brief and
sometimes violent squalls with showers, frequently
accompanied by thunder and lightning. Clouds are usually of
the convective type. A cold front usually coincides with a
well-defined wind-shift line (a line along which the wind
shifts abruptly from southerly or southwesterly to northerly
or northwesterly in the Northern Hemisphere, and from
northerly or northwesterly to southerly or southwesterly in
the Southern Hemisphere). At sea, a series of brief showers
accompanied by strong, shifting winds may occur along or
some distance (up to 200 miles) ahead of a cold front. These
are called squalls (in common nautical use, the term squall
may be additionally applied to any severe local storm
accompanied by gusty winds, precipitation, thunder, and
lightning), and the line along which they occur is called a
squall line.
Because of its greater speed and steeper slope, which
may approach or even exceed the vertical near the Earth's
surface (due to friction), a cold front and its associated
weather pass more quickly than a warm front. After a cold
front passes, the pressure rises, often quite rapidly, the vis-
ibility usually improves, and the clouds tend to diminish.
Clear, cool or cold air replaces the warm hazy air.
As the wave progresses and the cold front approaches
the slower moving warm front, the low becomes deeper and
the warm sector becomes smaller, as shown in Figure
3812c.
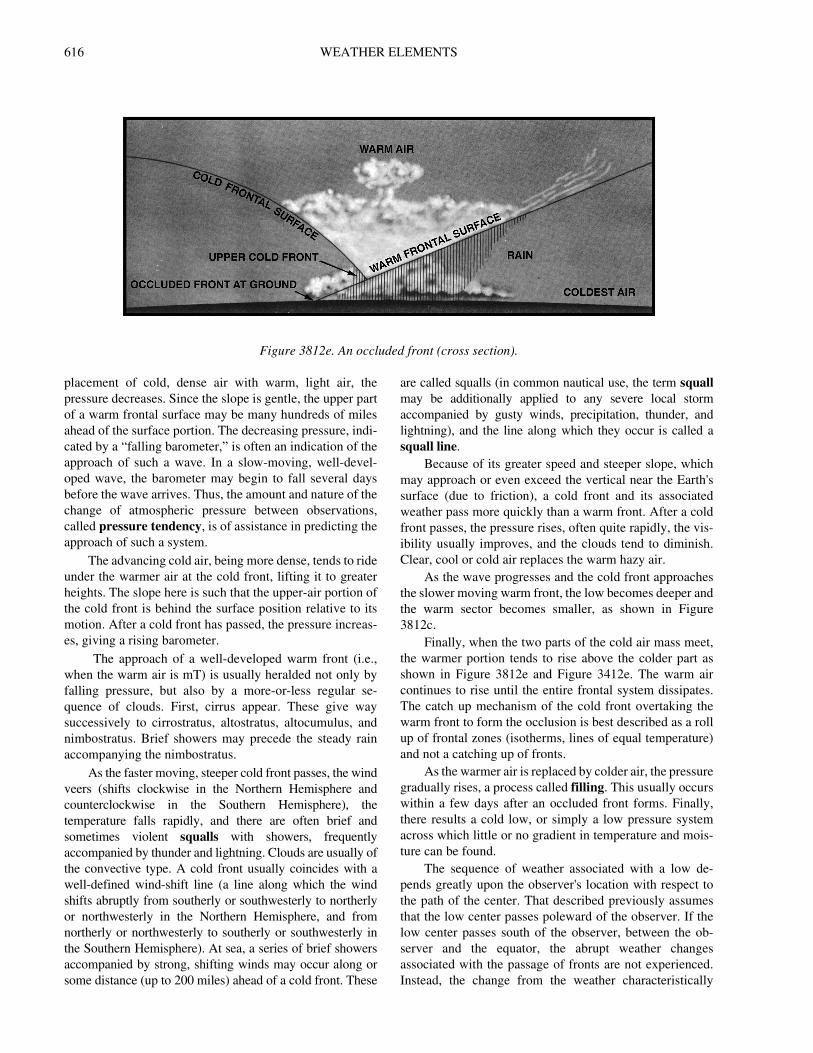
Finally, when the two parts of the cold air mass meet,
the warmer portion tends to rise above the colder part as
shown in Figure 3812e and Figure 3412e. The warm air
continues to rise until the entire frontal system dissipates.
The catch up mechanism of the cold front overtaking the
warm front to form the occlusion is best described as a roll
up of frontal zones (isotherms, lines of equal temperature)
and not a catching up of fronts.
As the warmer air is replaced by colder air, the pressure
gradually rises, a process called filling. This usually occurs
within a few days after an occluded front forms. Finally,
there results a cold low, or simply a low pressure system
across which little or no gradient in temperature and mois-
ture can be found.
The sequence of weather associated with a low de-
pends greatly upon the observer's location with respect to
the path of the center. That described previously assumes
that the low center passes poleward of the observer. If the
low center passes south of the observer, between the ob-
server and the equator, the abrupt weather changes
associated with the passage of fronts are not experienced.
Instead, the change from the weather characteristically
Figure 3812e. An occluded front (cross section).
WEATHER ELEMENTS 617
found ahead of a warm front, to that behind a cold front,
takes place gradually. The exact sequence is dictated by the
distance from the center, the severity and age of the low.
Although each low generally follows this pattern, no
two are ever exactly alike. Other centers of low pressure
and high pressure, and the air masses associated with them,
even though they may be 1,000 miles or more away, influ-
ence the formation and motion of individual low centers
and their accompanying weather. Particularly, a high stalls
or diverts a low. This is true of temporary highs as well as
semi-permanent highs, but not to as great a degree.
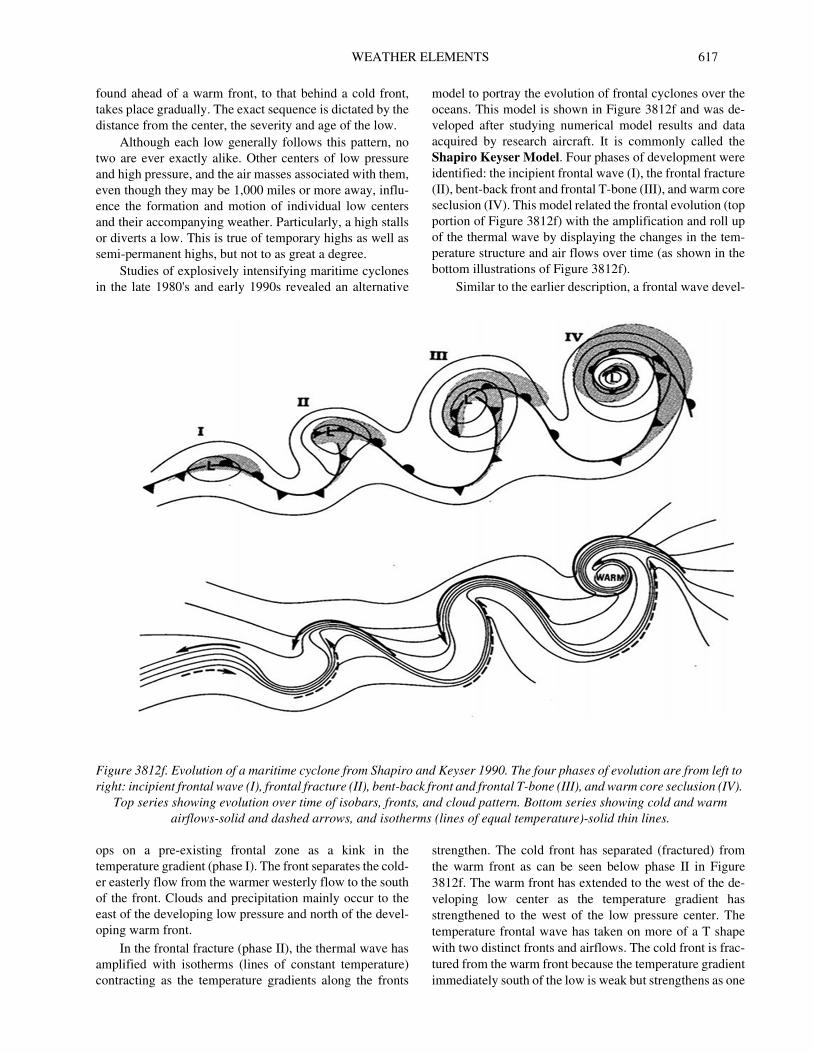
Studies of explosively intensifying maritime cyclones
in the late 1980's and early 1990s revealed an alternative
model to portray the evolution of frontal cyclones over the
oceans. This model is shown in Figure 3812f and was de-
veloped after studying numerical model results and data
acquired by research aircraft. It is commonly called the
Shapiro Keyser Model. Four phases of development were
identified: the incipient frontal wave (I), the frontal fracture
(II), bent-back front and frontal T-bone (III), and warm core
seclusion (IV). This model related the frontal evolution (top
portion of Figure 3812f) with the amplification and roll up
of the thermal wave by displaying the changes in the tem-
perature structure and air flows over time (as shown in the
bottom illustrations of Figure 3812f).
Similar to the earlier description, a frontal wave devel-
ops on a pre-existing frontal zone as a kink in the
temperature gradient (phase I). The front separates the cold-
er easterly flow from the warmer westerly flow to the south
of the front. Clouds and precipitation mainly occur to the
east of the developing low pressure and north of the devel-
oping warm front.
In the frontal fracture (phase II), the thermal wave has
amplified with isotherms (lines of constant temperature)
contracting as the temperature gradients along the fronts
strengthen. The cold front has separated (fractured) from
the warm front as can be seen below phase II in Figure
3812f. The warm front has extended to the west of the de-
veloping low center as the temperature gradient has
strengthened to the west of the low pressure center. The
temperature frontal wave has taken on more of a T shape
with two distinct fronts and airflows. The cold front is frac-
tured from the warm front because the temperature gradient
immediately south of the low is weak but strengthens as one
Figure 3812f. Evolution of a maritime cyclone from Shapiro and Keyser 1990. The four phases of evolution are from left to
right: incipient frontal wave (I), frontal fracture (II), bent-back front and frontal T-bone (III), and warm core seclusion (IV).
Top series showing evolution over time of isobars, fronts, and cloud pattern. Bottom series showing cold and warm
airflows-solid and dashed arrows, and isotherms (lines of equal temperature)-solid thin lines.
618 WEATHER ELEMENTS
moves farther south along the cold.
The process continues in phase III as the frontal wave
continues to amplify. Temperature gradients continue to
constrict as they intensify and thus the fronts strengthen.
The warm front that extended further west of the low center
in from phase II begins to wrap eastward under (equator-
ward of) the low center. At this point it is referred to as the
bent-back front. Often the highest winds in this phase are on
the cold side (west, in this case) of the bent-back front
where the isobars have the tightest packing or gradient. This
is in the vicinity of the arrow head in the bottom image of
phase III.
Phase IV is the mature phase of the evolution. In this
final phase, the bent-back front has encircled the low pres-
sure center as the thermal wave rolls up like an ocean wave.
In the lower troposphere, warm air has pooled over the vi-
cinity of the low center and is surrounded by cooler air. This
warm pool is called a warm seclusion and is a sign of the
cyclone nearing or reaching its lowest pressure and stron-
gest intensity. Highest winds often occur equatorward
(south and southwest in the Northern Hemisphere) of the
low center on the cold side of the bent-back front. Warm se-
clusions were once thought to be rare but are a frequent
occurrence in strong ocean cyclones. Wind speed estimates
from space-based radar instruments called scatterometers
often show the highest winds in this region on the cold
(equatorward) side of the encircling bent-back front.
3813. Ocean Storm Evolution Example
The following are examples of a North Atlantic storm
from 2011 that reached hurricane force strength. The series
of four graphics (as seen in Figures 3413a through d) in-
cludes infrared (thermal) satellite imagery of clouds, sea-
level pressure, wind speed, and infrared satellite image for
phases I, II, III, and IV of the cyclone. The graphics illus-
trate the relationship between the frontal evolution of the
fronts and the wind field. Each cyclone is different due to
the complexity of the atmosphere; however, the main fron-
tal features and wind field are fairly typical of a winter
maritime cyclone in either the North Atlantic or Pacific.
Wind speeds are shown by the color bar in the center of the
figure.
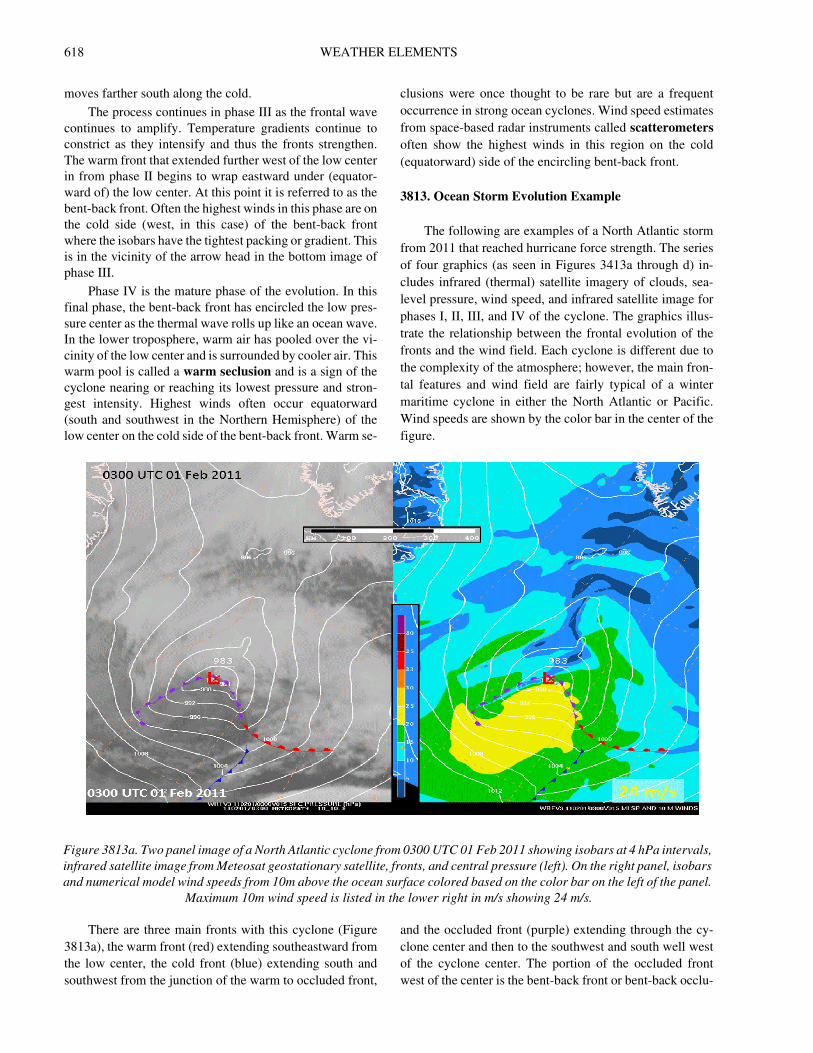
There are three main fronts with this cyclone (Figure
3813a), the warm front (red) extending southeastward from
the low center, the cold front (blue) extending south and
southwest from the junction of the warm to occluded front,
and the occluded front (purple) extending through the cy-
clone center and then to the southwest and south well west
of the cyclone center. The portion of the occluded front
west of the center is the bent-back front or bent-back occlu-
Figure 3813a. Two panel image of a North Atlantic cyclone from 0300 UTC 01 Feb 2011 showing isobars at 4 hPa intervals,
infrared satellite image from Meteosat geostationary satellite, fronts, and central pressure (left). On the right panel, isobars
and numerical model wind speeds from 10m above the ocean surface colored based on the color bar on the left of the panel.
Maximum 10m wind speed is listed in the lower right in m/s showing 24 m/s.
WEATHER ELEMENTS 619
sion. It is very similar to a warm front through the low
center and then behaves much more like a cold front to the
west. The highest winds in this example at this time were in
the zone south of the low center in the colder air between
the bent-back and cold front.
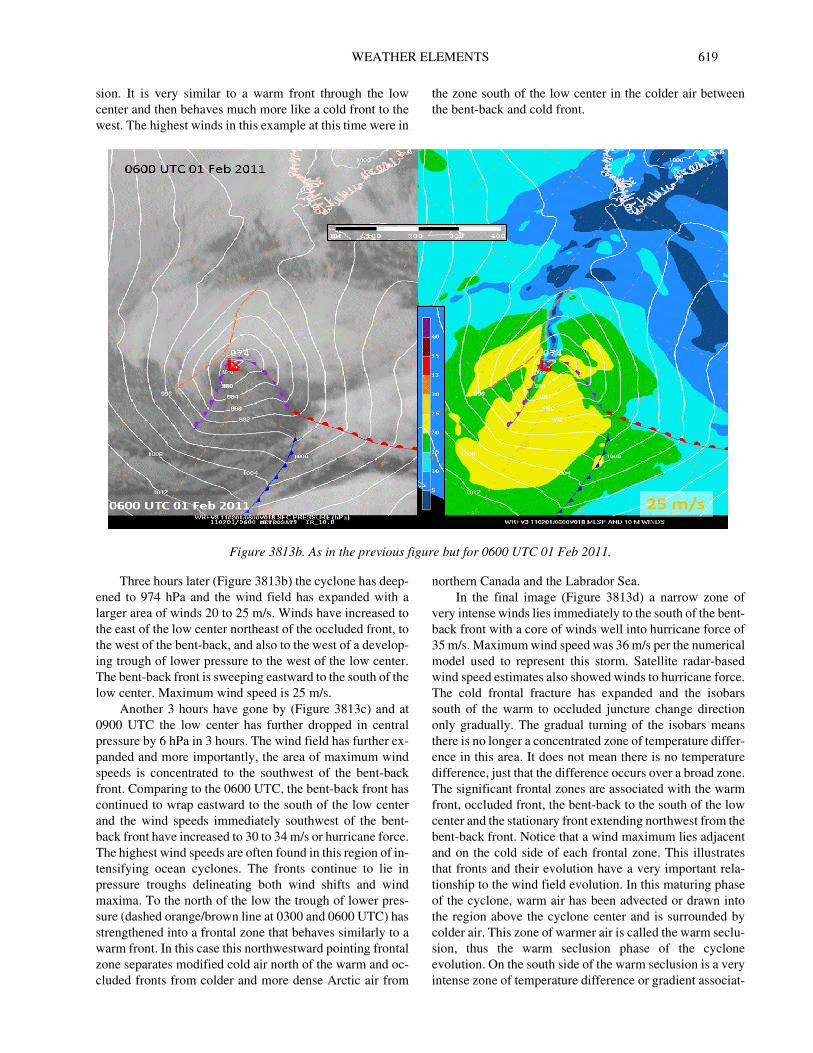
Three hours later (Figure 3813b) the cyclone has deep-
ened to 974 hPa and the wind field has expanded with a
larger area of winds 20 to 25 m/s. Winds have increased to
the east of the low center northeast of the occluded front, to
the west of the bent-back, and also to the west of a develop-
ing trough of lower pressure to the west of the low center.
The bent-back front is sweeping eastward to the south of the
low center. Maximum wind speed is 25 m/s.
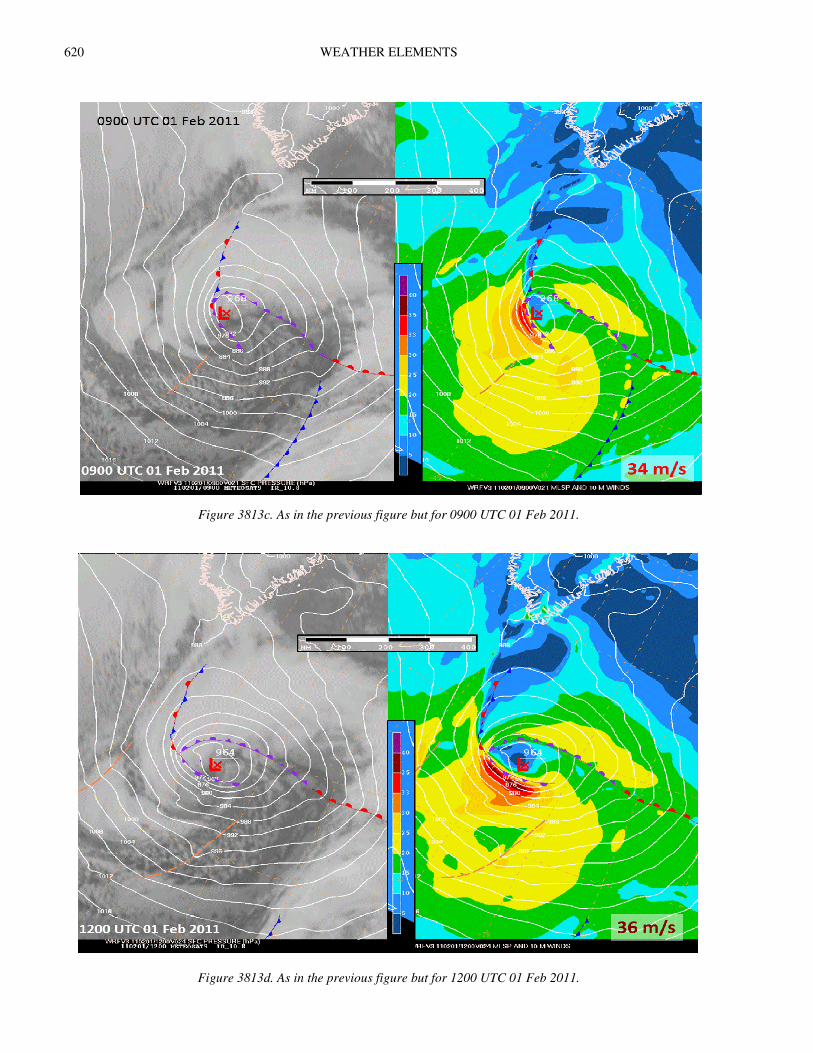
Another 3 hours have gone by (Figure 3813c) and at
0900 UTC the low center has further dropped in central
pressure by 6 hPa in 3 hours. The wind field has further ex-
panded and more importantly, the area of maximum wind
speeds is concentrated to the southwest of the bent-back
front. Comparing to the 0600 UTC, the bent-back front has
continued to wrap eastward to the south of the low center
and the wind speeds immediately southwest of the bent-
back front have increased to 30 to 34 m/s or hurricane force.
The highest wind speeds are often found in this region of in-
tensifying ocean cyclones. The fronts continue to lie in
pressure troughs delineating both wind shifts and wind
maxima. To the north of the low the trough of lower pres-
sure (dashed orange/brown line at 0300 and 0600 UTC) has
strengthened into a frontal zone that behaves similarly to a
warm front. In this case this northwestward pointing frontal
zone separates modified cold air north of the warm and oc-
cluded fronts from colder and more dense Arctic air from
northern Canada and the Labrador Sea.
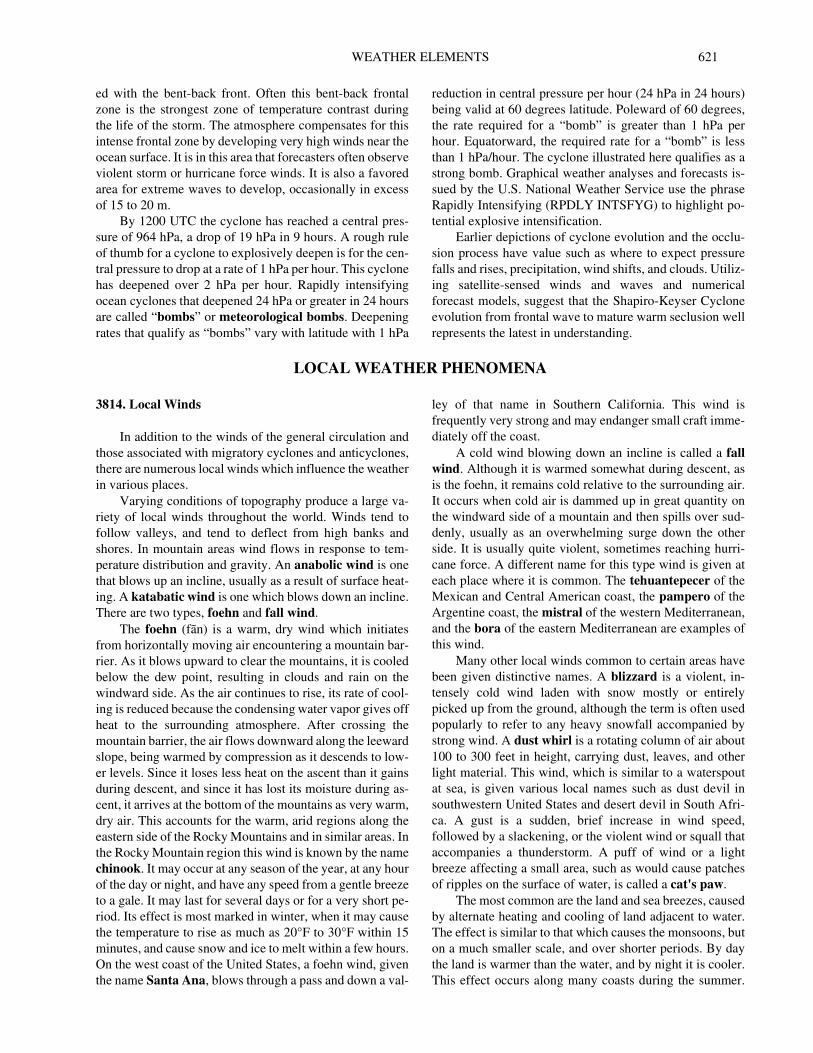
In the final image (Figure 3813d) a narrow zone of
very intense winds lies immediately to the south of the bent-
back front with a core of winds well into hurricane force of
35 m/s. Maximum wind speed was 36 m/s per the numerical
model used to represent this storm. Satellite radar-based
wind speed estimates also showed winds to hurricane force.
The cold frontal fracture has expanded and the isobars
south of the warm to occluded juncture change direction
only gradually. The gradual turning of the isobars means
there is no longer a concentrated zone of temperature differ-
ence in this area. It does not mean there is no temperature
difference, just that the difference occurs over a broad zone.
The significant frontal zones are associated with the warm
front, occluded front, the bent-back to the south of the low
center and the stationary front extending northwest from the
bent-back front. Notice that a wind maximum lies adjacent
and on the cold side of each frontal zone. This illustrates
that fronts and their evolution have a very important rela-
tionship to the wind field evolution. In this maturing phase
of the cyclone, warm air has been advected or drawn into
the region above the cyclone center and is surrounded by
colder air. This zone of warmer air is called the warm seclu-
sion, thus the warm seclusion phase of the cyclone
evolution. On the south side of the warm seclusion is a very
intense zone of temperature difference or gradient associat-
Figure 3813b. As in the previous figure but for 0600 UTC 01 Feb 2011.
620 WEATHER ELEMENTS
Figure 3813c. As in the previous figure but for 0900 UTC 01 Feb 2011.
Figure 3813d. As in the previous figure but for 1200 UTC 01 Feb 2011.
WEATHER ELEMENTS 621
ed with the bent-back front. Often this bent-back frontal
zone is the strongest zone of temperature contrast during
the life of the storm. The atmosphere compensates for this
intense frontal zone by developing very high winds near the
ocean surface. It is in this area that forecasters often observe
violent storm or hurricane force winds. It is also a favored
area for extreme waves to develop, occasionally in excess
of 15 to 20 m.
By 1200 UTC the cyclone has reached a central pres-
sure of 964 hPa, a drop of 19 hPa in 9 hours. A rough rule
of thumb for a cyclone to explosively deepen is for the cen-
tral pressure to drop at a rate of 1 hPa per hour. This cyclone
has deepened over 2 hPa per hour. Rapidly intensifying
ocean cyclones that deepened 24 hPa or greater in 24 hours
are called “bombs” or meteorological bombs. Deepening
rates that qualify as “bombs” vary with latitude with 1 hPa
reduction in central pressure per hour (24 hPa in 24 hours)
being valid at 60 degrees latitude. Poleward of 60 degrees,
the rate required for a “bomb” is greater than 1 hPa per
hour. Equatorward, the required rate for a “bomb” is less
than 1 hPa/hour. The cyclone illustrated here qualifies as a
strong bomb. Graphical weather analyses and forecasts is-
sued by the U.S. National Weather Service use the phrase
Rapidly Intensifying (RPDLY INTSFYG) to highlight po-
tential explosive intensification.
Earlier depictions of cyclone evolution and the occlu-
sion process have value such as where to expect pressure
falls and rises, precipitation, wind shifts, and clouds. Utiliz-
ing satellite-sensed winds and waves and numerical
forecast models, suggest that the Shapiro-Keyser Cyclone
evolution from frontal wave to mature warm seclusion well
represents the latest in understanding.
LOCAL WEATHER PHENOMENA
3814. Local Winds
In addition to the winds of the general circulation and
those associated with migratory cyclones and anticyclones,
there are numerous local winds which influence the weather
in various places.
Varying conditions of topography produce a large va-
riety of local winds throughout the world. Winds tend to
follow valleys, and tend to deflect from high banks and
shores. In mountain areas wind flows in response to tem-
perature distribution and gravity. An anabolic wind is one
that blows up an incline, usually as a result of surface heat-
ing. A katabatic wind is one which blows down an incline.
There are two types, foehn and fall wind.
The foehn (fãn) is a warm, dry wind which initiates
from horizontally moving air encountering a mountain bar-
rier. As it blows upward to clear the mountains, it is cooled
below the dew point, resulting in clouds and rain on the
windward side. As the air continues to rise, its rate of cool-
ing is reduced because the condensing water vapor gives off
heat to the surrounding atmosphere. After crossing the
mountain barrier, the air flows downward along the leeward
slope, being warmed by compression as it descends to low-
er levels. Since it loses less heat on the ascent than it gains
during descent, and since it has lost its moisture during as-
cent, it arrives at the bottom of the mountains as very warm,
dry air. This accounts for the warm, arid regions along the
eastern side of the Rocky Mountains and in similar areas. In
the Rocky Mountain region this wind is known by the name
chinook. It may occur at any season of the year, at any hour
of the day or night, and have any speed from a gentle breeze
to a gale. It may last for several days or for a very short pe-
riod. Its effect is most marked in winter, when it may cause
the temperature to rise as much as 20°F to 30°F within 15
minutes, and cause snow and ice to melt within a few hours.
On the west coast of the United States, a foehn wind, given
the name Santa Ana, blows through a pass and down a val-
ley of that name in Southern California. This wind is
frequently very strong and may endanger small craft imme-
diately off the coast.
A cold wind blowing down an incline is called a fall
wind. Although it is warmed somewhat during descent, as
is the foehn, it remains cold relative to the surrounding air.
It occurs when cold air is dammed up in great quantity on
the windward side of a mountain and then spills over sud-
denly, usually as an overwhelming surge down the other
side. It is usually quite violent, sometimes reaching hurri-
cane force. A different name for this type wind is given at
each place where it is common. The tehuantepecer of the
Mexican and Central American coast, the pampero of the
Argentine coast, the mistral of the western Mediterranean,
and the bora of the eastern Mediterranean are examples of
this wind.
Many other local winds common to certain areas have
been given distinctive names. A blizzard is a violent, in-
tensely cold wind laden with snow mostly or entirely
picked up from the ground, although the term is often used
popularly to refer to any heavy snowfall accompanied by
strong wind. A dust whirl is a rotating column of air about
100 to 300 feet in height, carrying dust, leaves, and other
light material. This wind, which is similar to a waterspout
at sea, is given various local names such as dust devil in
southwestern United States and desert devil in South Afri-
ca. A gust is a sudden, brief increase in wind speed,
followed by a slackening, or the violent wind or squall that
accompanies a thunderstorm. A puff of wind or a light
breeze affecting a small area, such as would cause patches
of ripples on the surface of water, is called a cat's paw.
The most common are the land and sea breezes, caused
by alternate heating and cooling of land adjacent to water.
The effect is similar to that which causes the monsoons, but
on a much smaller scale, and over shorter periods. By day
the land is warmer than the water, and by night it is cooler.
This effect occurs along many coasts during the summer.
622 WEATHER ELEMENTS
Between about 0900 and 1100 local time the temperature of
the land becomes greater than that of the adjacent water.
The lower levels of air over the land are warmed, and the air
rises, drawing in cooler air from the sea. This is the sea
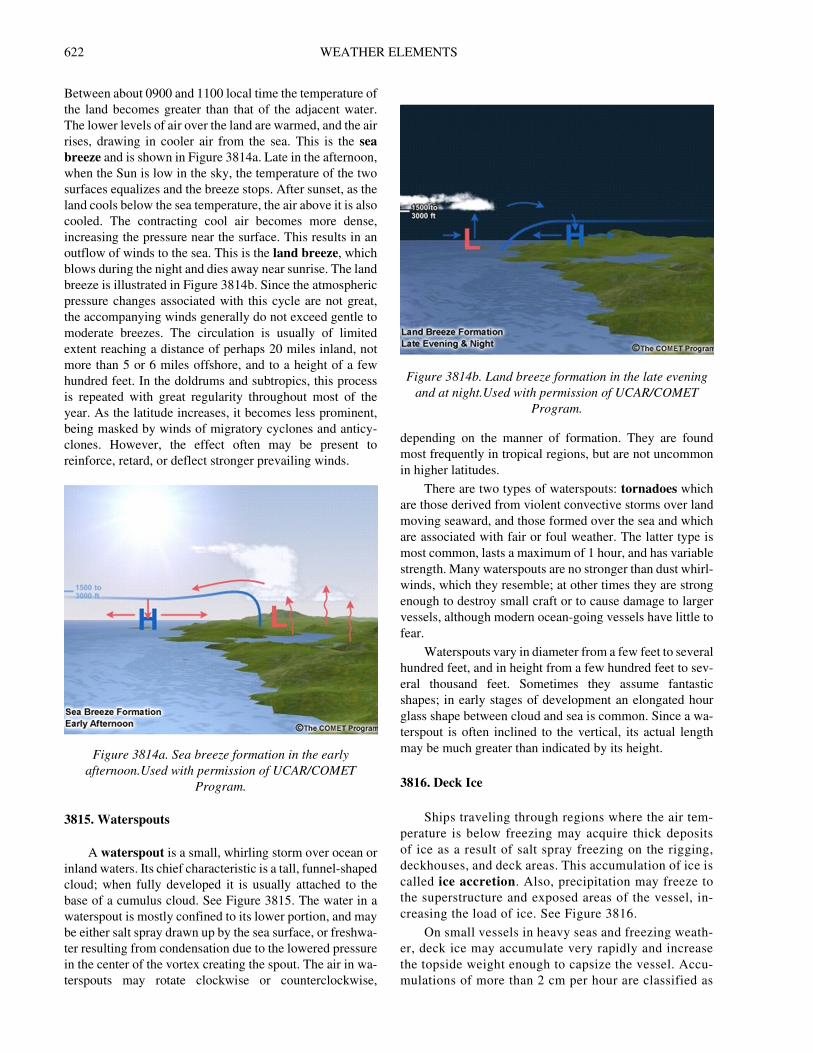
breeze and is shown in Figure 3814a. Late in the afternoon,
when the Sun is low in the sky, the temperature of the two
surfaces equalizes and the breeze stops. After sunset, as the
land cools below the sea temperature, the air above it is also
cooled. The contracting cool air becomes more dense,
increasing the pressure near the surface. This results in an
outflow of winds to the sea. This is the land breeze, which
blows during the night and dies away near sunrise. The land
breeze is illustrated in Figure 3814b. Since the atmospheric
pressure changes associated with this cycle are not great,
the accompanying winds generally do not exceed gentle to
moderate breezes. The circulation is usually of limited
extent reaching a distance of perhaps 20 miles inland, not
more than 5 or 6 miles offshore, and to a height of a few
hundred feet. In the doldrums and subtropics, this process
is repeated with great regularity throughout most of the
year. As the latitude increases, it becomes less prominent,
being masked by winds of migratory cyclones and anticy-
clones. However, the effect often may be present to
reinforce, retard, or deflect stronger prevailing winds.
3815. Waterspouts
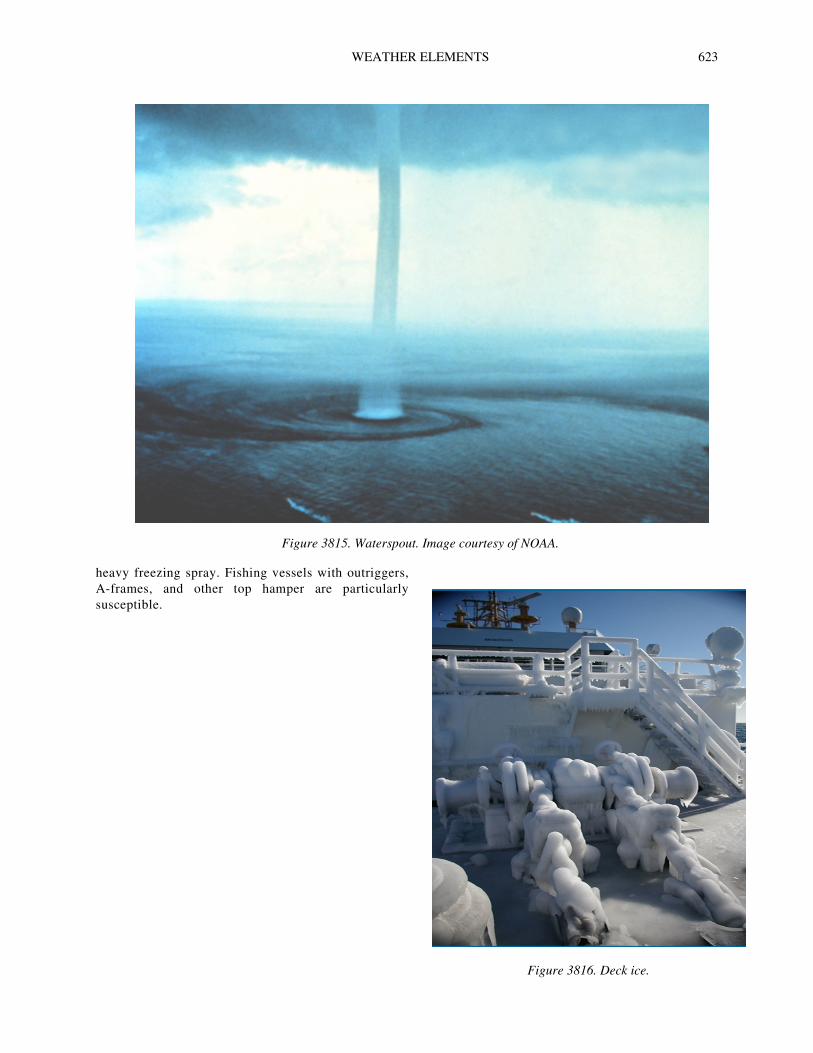
A waterspout is a small, whirling storm over ocean or
inland waters. Its chief characteristic is a tall, funnel-shaped
cloud; when fully developed it is usually attached to the
base of a cumulus cloud. See Figure 3815. The water in a
waterspout is mostly confined to its lower portion, and may
be either salt spray drawn up by the sea surface, or freshwa-
ter resulting from condensation due to the lowered pressure
in the center of the vortex creating the spout. The air in wa-
terspouts may rotate clockwise or counterclockwise,
depending on the manner of formation. They are found
most frequently in tropical regions, but are not uncommon
in higher latitudes.
There are two types of waterspouts: tornadoes which
are those derived from violent convective storms over land
moving seaward, and those formed over the sea and which
are associated with fair or foul weather. The latter type is
most common, lasts a maximum of 1 hour, and has variable
strength. Many waterspouts are no stronger than dust whirl-
winds, which they resemble; at other times they are strong
enough to destroy small craft or to cause damage to larger
vessels, although modern ocean-going vessels have little to
fear.
Waterspouts vary in diameter from a few feet to several
hundred feet, and in height from a few hundred feet to sev-
eral thousand feet. Sometimes they assume fantastic
shapes; in early stages of development an elongated hour
glass shape between cloud and sea is common. Since a wa-
terspout is often inclined to the vertical, its actual length
may be much greater than indicated by its height.
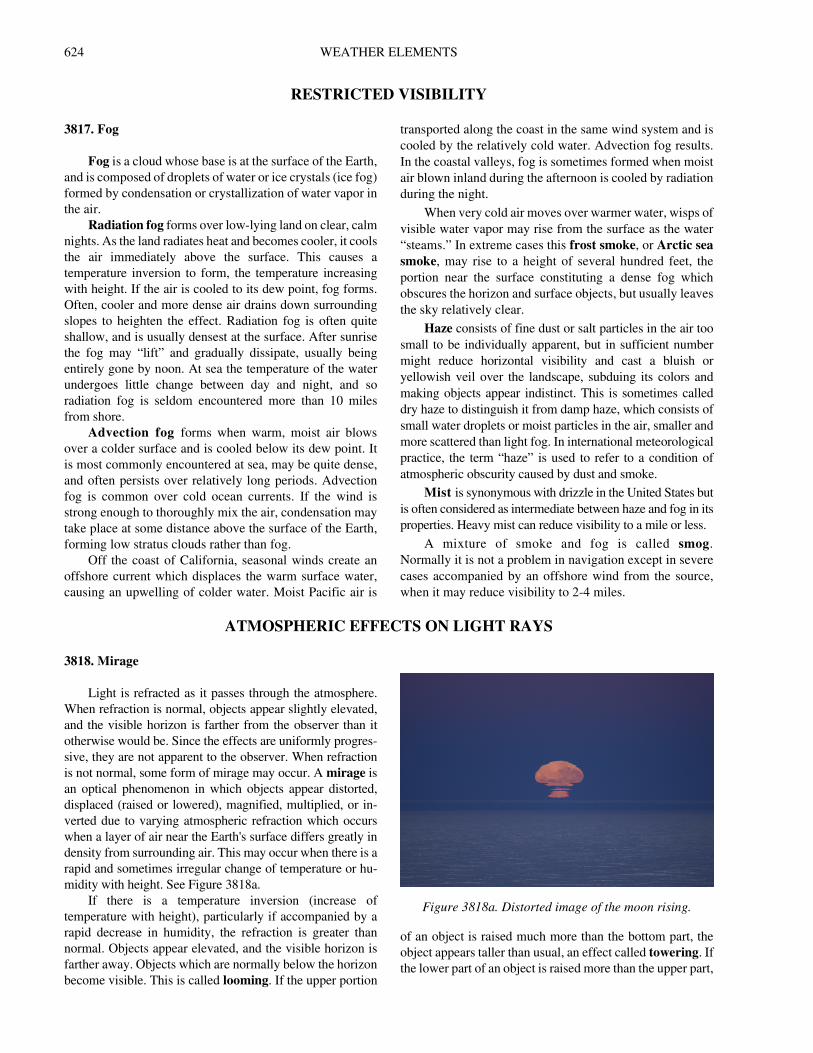
3816. Deck Ice
Ships traveling through regions where the air tem-
perature is below freezing may acquire thick deposits
of ice as a result of salt spray freezing on the rigging,
deckhouses, and deck areas. This accumulation of ice is
called ice accretion. Also, precipitation may freeze to
the superstructure and exposed areas of the vessel, in-
creasing the load of ice. See Figure 3816.
On small vessels in heavy seas and freezing weath-
er, deck ice may accumulate very rapidly and increase
the topside weight enough to capsize the vessel. Accu-
mulations of more than 2 cm per hour are classified as
Figure 3814a. Sea breeze formation in the early
afternoon.Used with permission of UCAR/COMET
Program.
Figure 3814b. Land breeze formation in the late evening
and at night.Used with permission of UCAR/COMET
Program.
WEATHER ELEMENTS 623
heavy freezing spray. Fishing vessels with outriggers,
A-frames, and other top hamper are particularly
susceptible.
Figure 3815. Waterspout. Image courtesy of NOAA.
Figure 3816. Deck ice.
624 WEATHER ELEMENTS
RESTRICTED VISIBILITY
3817. Fog
Fog is a cloud whose base is at the surface of the Earth,
and is composed of droplets of water or ice crystals (ice fog)
formed by condensation or crystallization of water vapor in
the air.
Radiation fog forms over low-lying land on clear, calm
nights. As the land radiates heat and becomes cooler, it cools
the air immediately above the surface. This causes a
temperature inversion to form, the temperature increasing
with height. If the air is cooled to its dew point, fog forms.
Often, cooler and more dense air drains down surrounding
slopes to heighten the effect. Radiation fog is often quite
shallow, and is usually densest at the surface. After sunrise
the fog may “lift” and gradually dissipate, usually being
entirely gone by noon. At sea the temperature of the water
undergoes little change between day and night, and so
radiation fog is seldom encountered more than 10 miles
from shore.
Advection fog forms when warm, moist air blows
over a colder surface and is cooled below its dew point. It
is most commonly encountered at sea, may be quite dense,
and often persists over relatively long periods. Advection
fog is common over cold ocean currents. If the wind is
strong enough to thoroughly mix the air, condensation may
take place at some distance above the surface of the Earth,
forming low stratus clouds rather than fog.
Off the coast of California, seasonal winds create an
offshore current which displaces the warm surface water,
causing an upwelling of colder water. Moist Pacific air is
transported along the coast in the same wind system and is
cooled by the relatively cold water. Advection fog results.
In the coastal valleys, fog is sometimes formed when moist
air blown inland during the afternoon is cooled by radiation
during the night.
When very cold air moves over warmer water, wisps of
visible water vapor may rise from the surface as the water
“steams.” In extreme cases this frost smoke, or Arctic sea
smoke, may rise to a height of several hundred feet, the
portion near the surface constituting a dense fog which
obscures the horizon and surface objects, but usually leaves
the sky relatively clear.
Haze consists of fine dust or salt particles in the air too
small to be individually apparent, but in sufficient number
might reduce horizontal visibility and cast a bluish or
yellowish veil over the landscape, subduing its colors and
making objects appear indistinct. This is sometimes called
dry haze to distinguish it from damp haze, which consists of
small water droplets or moist particles in the air, smaller and
more scattered than light fog. In international meteorological
practice, the term “haze” is used to refer to a condition of
atmospheric obscurity caused by dust and smoke.
Mist is synonymous with drizzle in the United States but
is often considered as intermediate between haze and fog in its
properties. Heavy mist can reduce visibility to a mile or less.
A mixture of smoke and fog is called smog.
Normally it is not a problem in navigation except in severe
cases accompanied by an offshore wind from the source,
when it may reduce visibility to 2-4 miles.
ATMOSPHERIC EFFECTS ON LIGHT RAYS
3818. Mirage
Light is refracted as it passes through the atmosphere.
When refraction is normal, objects appear slightly elevated,
and the visible horizon is farther from the observer than it
otherwise would be. Since the effects are uniformly progres-
sive, they are not apparent to the observer. When refraction
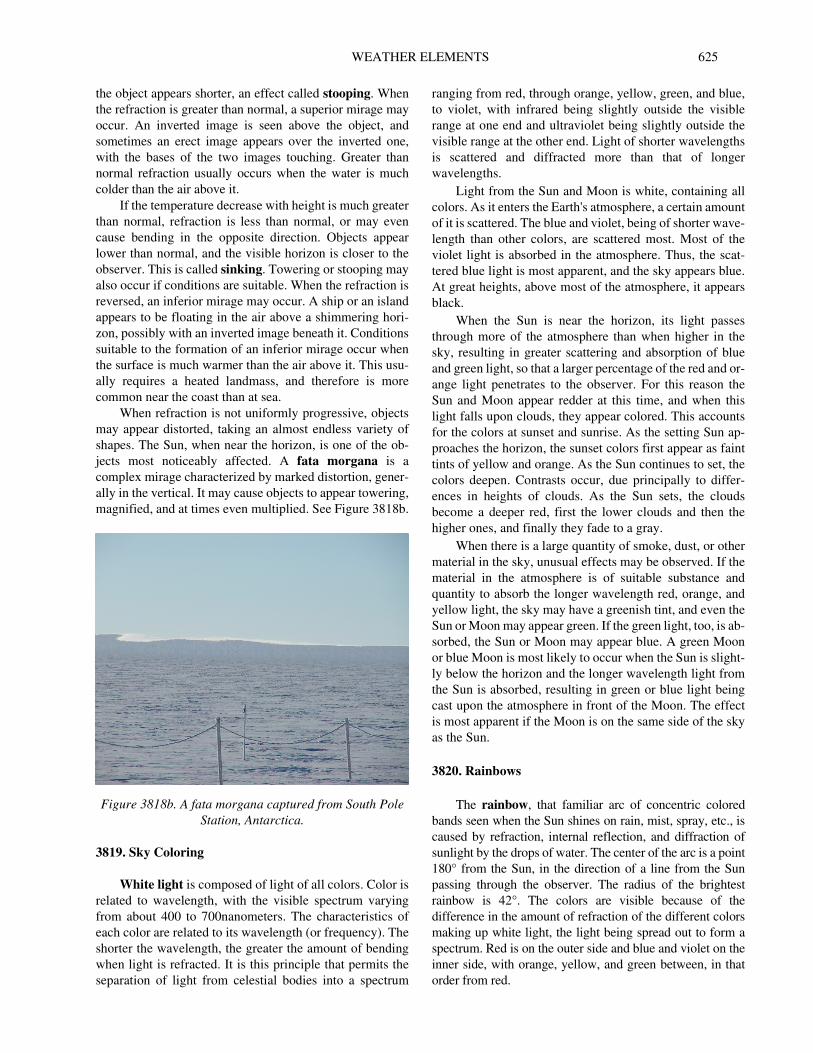
is not normal, some form of mirage may occur. A mirage is
an optical phenomenon in which objects appear distorted,
displaced (raised or lowered), magnified, multiplied, or in-
verted due to varying atmospheric refraction which occurs
when a layer of air near the Earth's surface differs greatly in
density from surrounding air. This may occur when there is a
rapid and sometimes irregular change of temperature or hu-
midity with height. See Figure 3818a.
If there is a temperature inversion (increase of
temperature with height), particularly if accompanied by a
rapid decrease in humidity, the refraction is greater than
normal. Objects appear elevated, and the visible horizon is
farther away. Objects which are normally below the horizon
become visible. This is called looming. If the upper portion
of an object is raised much more than the bottom part, the
object appears taller than usual, an effect called towering. If
the lower part of an object is raised more than the upper part,
Figure 3818a. Distorted image of the moon rising.
WEATHER ELEMENTS 625
the object appears shorter, an effect called stooping. When
the refraction is greater than normal, a superior mirage may
occur. An inverted image is seen above the object, and
sometimes an erect image appears over the inverted one,
with the bases of the two images touching. Greater than
normal refraction usually occurs when the water is much
colder than the air above it.
If the temperature decrease with height is much greater
than normal, refraction is less than normal, or may even
cause bending in the opposite direction. Objects appear
lower than normal, and the visible horizon is closer to the
observer. This is called sinking. Towering or stooping may
also occur if conditions are suitable. When the refraction is
reversed, an inferior mirage may occur. A ship or an island
appears to be floating in the air above a shimmering hori-
zon, possibly with an inverted image beneath it. Conditions
suitable to the formation of an inferior mirage occur when
the surface is much warmer than the air above it. This usu-
ally requires a heated landmass, and therefore is more
common near the coast than at sea.
When refraction is not uniformly progressive, objects
may appear distorted, taking an almost endless variety of
shapes. The Sun, when near the horizon, is one of the ob-
jects most noticeably affected. A fata morgana is a
complex mirage characterized by marked distortion, gener-
ally in the vertical. It may cause objects to appear towering,
magnified, and at times even multiplied. See Figure 3818b.
3819. Sky Coloring
White light is composed of light of all colors. Color is
related to wavelength, with the visible spectrum varying
from about 400 to 700nanometers. The characteristics of
each color are related to its wavelength (or frequency). The
shorter the wavelength, the greater the amount of bending
when light is refracted. It is this principle that permits the
separation of light from celestial bodies into a spectrum
ranging from red, through orange, yellow, green, and blue,
to violet, with infrared being slightly outside the visible
range at one end and ultraviolet being slightly outside the
visible range at the other end. Light of shorter wavelengths
is scattered and diffracted more than that of longer
wavelengths.
Light from the Sun and Moon is white, containing all
colors. As it enters the Earth's atmosphere, a certain amount
of it is scattered. The blue and violet, being of shorter wave-
length than other colors, are scattered most. Most of the
violet light is absorbed in the atmosphere. Thus, the scat-
tered blue light is most apparent, and the sky appears blue.
At great heights, above most of the atmosphere, it appears
black.
When the Sun is near the horizon, its light passes
through more of the atmosphere than when higher in the
sky, resulting in greater scattering and absorption of blue
and green light, so that a larger percentage of the red and or-
ange light penetrates to the observer. For this reason the
Sun and Moon appear redder at this time, and when this
light falls upon clouds, they appear colored. This accounts
for the colors at sunset and sunrise. As the setting Sun ap-
proaches the horizon, the sunset colors first appear as faint
tints of yellow and orange. As the Sun continues to set, the
colors deepen. Contrasts occur, due principally to differ-
ences in heights of clouds. As the Sun sets, the clouds
become a deeper red, first the lower clouds and then the
higher ones, and finally they fade to a gray.
When there is a large quantity of smoke, dust, or other
material in the sky, unusual effects may be observed. If the
material in the atmosphere is of suitable substance and
quantity to absorb the longer wavelength red, orange, and
yellow light, the sky may have a greenish tint, and even the
Sun or Moon may appear green. If the green light, too, is ab-
sorbed, the Sun or Moon may appear blue. A green Moon
or blue Moon is most likely to occur when the Sun is slight-
ly below the horizon and the longer wavelength light from
the Sun is absorbed, resulting in green or blue light being
cast upon the atmosphere in front of the Moon. The effect
is most apparent if the Moon is on the same side of the sky
as the Sun.
3820. Rainbows
The rainbow, that familiar arc of concentric colored
bands seen when the Sun shines on rain, mist, spray, etc., is
caused by refraction, internal reflection, and diffraction of
sunlight by the drops of water. The center of the arc is a point
180° from the Sun, in the direction of a line from the Sun
passing through the observer. The radius of the brightest
rainbow is 42°. The colors are visible because of the
difference in the amount of refraction of the different colors
making up white light, the light being spread out to form a
spectrum. Red is on the outer side and blue and violet on the
inner side, with orange, yellow, and green between, in that
order from red.
Figure 3818b. A fata morgana captured from South Pole
Station, Antarctica.
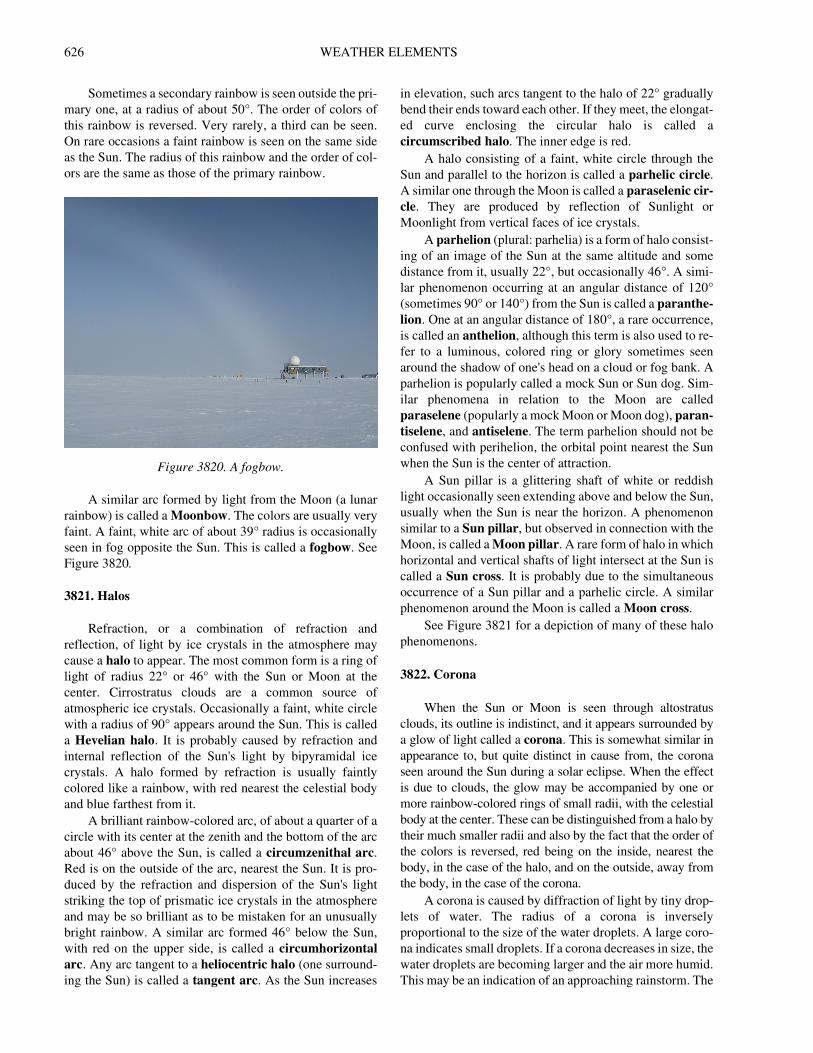
626 WEATHER ELEMENTS
Sometimes a secondary rainbow is seen outside the pri-
mary one, at a radius of about 50°. The order of colors of
this rainbow is reversed. Very rarely, a third can be seen.
On rare occasions a faint rainbow is seen on the same side
as the Sun. The radius of this rainbow and the order of col-
ors are the same as those of the primary rainbow.
A similar arc formed by light from the Moon (a lunar
rainbow) is called a Moonbow. The colors are usually very
faint. A faint, white arc of about 39° radius is occasionally
seen in fog opposite the Sun. This is called a fogbow. See
Figure 3820.
3821. Halos
Refraction, or a combination of refraction and
reflection, of light by ice crystals in the atmosphere may
cause a halo to appear. The most common form is a ring of
light of radius 22° or 46° with the Sun or Moon at the
center. Cirrostratus clouds are a common source of
atmospheric ice crystals. Occasionally a faint, white circle
with a radius of 90° appears around the Sun. This is called
a Hevelian halo. It is probably caused by refraction and
internal reflection of the Sun's light by bipyramidal ice
crystals. A halo formed by refraction is usually faintly
colored like a rainbow, with red nearest the celestial body
and blue farthest from it.
A brilliant rainbow-colored arc, of about a quarter of a
circle with its center at the zenith and the bottom of the arc
about 46° above the Sun, is called a circumzenithal arc.
Red is on the outside of the arc, nearest the Sun. It is pro-
duced by the refraction and dispersion of the Sun's light
striking the top of prismatic ice crystals in the atmosphere
and may be so brilliant as to be mistaken for an unusually
bright rainbow. A similar arc formed 46° below the Sun,
with red on the upper side, is called a circumhorizontal
arc. Any arc tangent to a heliocentric halo (one surround-
ing the Sun) is called a tangent arc. As the Sun increases
in elevation, such arcs tangent to the halo of 22° gradually
bend their ends toward each other. If they meet, the elongat-
ed curve enclosing the circular halo is called a
circumscribed halo. The inner edge is red.
A halo consisting of a faint, white circle through the
Sun and parallel to the horizon is called a parhelic circle.
A similar one through the Moon is called a paraselenic cir-
cle. They are produced by reflection of Sunlight or
Moonlight from vertical faces of ice crystals.
A parhelion (plural: parhelia) is a form of halo consist-
ing of an image of the Sun at the same altitude and some
distance from it, usually 22°, but occasionally 46°. A simi-
lar phenomenon occurring at an angular distance of 120°
(sometimes 90° or 140°) from the Sun is called a paranthe-
lion. One at an angular distance of 180°, a rare occurrence,
is called an anthelion, although this term is also used to re-
fer to a luminous, colored ring or glory sometimes seen
around the shadow of one's head on a cloud or fog bank. A
parhelion is popularly called a mock Sun or Sun dog. Sim-
ilar phenomena in relation to the Moon are called
paraselene (popularly a mock Moon or Moon dog), paran-
tiselene, and antiselene. The term parhelion should not be
confused with perihelion, the orbital point nearest the Sun
when the Sun is the center of attraction.
A Sun pillar is a glittering shaft of white or reddish
light occasionally seen extending above and below the Sun,
usually when the Sun is near the horizon. A phenomenon
similar to a Sun pillar, but observed in connection with the
Moon, is called a Moon pillar. A rare form of halo in which
horizontal and vertical shafts of light intersect at the Sun is
called a Sun cross. It is probably due to the simultaneous
occurrence of a Sun pillar and a parhelic circle. A similar
phenomenon around the Moon is called a Moon cross.
See Figure 3821 for a depiction of many of these halo
phenomenons.
3822. Corona
When the Sun or Moon is seen through altostratus
clouds, its outline is indistinct, and it appears surrounded by
a glow of light called a corona. This is somewhat similar in
appearance to, but quite distinct in cause from, the corona
seen around the Sun during a solar eclipse. When the effect
is due to clouds, the glow may be accompanied by one or
more rainbow-colored rings of small radii, with the celestial
body at the center. These can be distinguished from a halo by
their much smaller radii and also by the fact that the order of
the colors is reversed, red being on the inside, nearest the
body, in the case of the halo, and on the outside, away from
the body, in the case of the corona.
A corona is caused by diffraction of light by tiny drop-
lets of water. The radius of a corona is inversely
proportional to the size of the water droplets. A large coro-
na indicates small droplets. If a corona decreases in size, the
water droplets are becoming larger and the air more humid.
This may be an indication of an approaching rainstorm. The
Figure 3820. A fogbow.
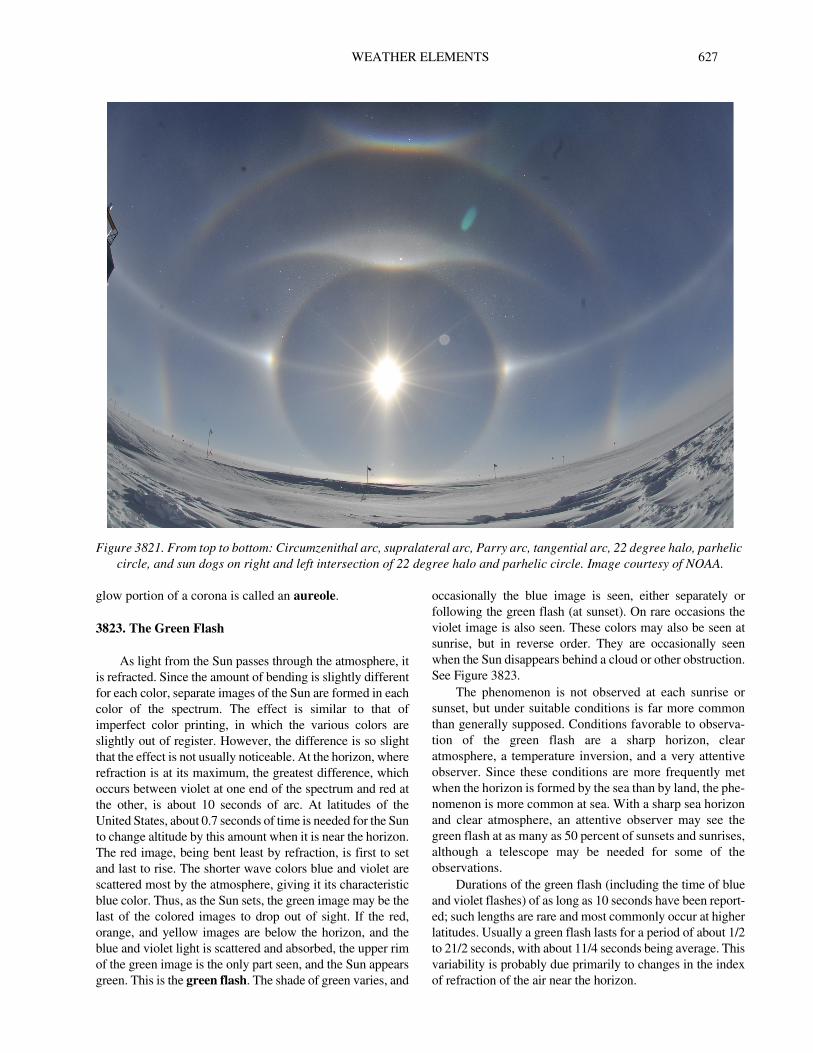
WEATHER ELEMENTS 627
glow portion of a corona is called an aureole.
3823. The Green Flash
As light from the Sun passes through the atmosphere, it
is refracted. Since the amount of bending is slightly different
for each color, separate images of the Sun are formed in each
color of the spectrum. The effect is similar to that of
imperfect color printing, in which the various colors are
slightly out of register. However, the difference is so slight
that the effect is not usually noticeable. At the horizon, where
refraction is at its maximum, the greatest difference, which
occurs between violet at one end of the spectrum and red at
the other, is about 10 seconds of arc. At latitudes of the
United States, about 0.7 seconds of time is needed for the Sun
to change altitude by this amount when it is near the horizon.
The red image, being bent least by refraction, is first to set
and last to rise. The shorter wave colors blue and violet are
scattered most by the atmosphere, giving it its characteristic
blue color. Thus, as the Sun sets, the green image may be the
last of the colored images to drop out of sight. If the red,
orange, and yellow images are below the horizon, and the
blue and violet light is scattered and absorbed, the upper rim
of the green image is the only part seen, and the Sun appears
green. This is the green flash. The shade of green varies, and
occasionally the blue image is seen, either separately or
following the green flash (at sunset). On rare occasions the
violet image is also seen. These colors may also be seen at
sunrise, but in reverse order. They are occasionally seen
when the Sun disappears behind a cloud or other obstruction.
See Figure 3823.
The phenomenon is not observed at each sunrise or
sunset, but under suitable conditions is far more common
than generally supposed. Conditions favorable to observa-
tion of the green flash are a sharp horizon, clear
atmosphere, a temperature inversion, and a very attentive
observer. Since these conditions are more frequently met
when the horizon is formed by the sea than by land, the phe-
nomenon is more common at sea. With a sharp sea horizon
and clear atmosphere, an attentive observer may see the
green flash at as many as 50 percent of sunsets and sunrises,
although a telescope may be needed for some of the
observations.
Durations of the green flash (including the time of blue
and violet flashes) of as long as 10 seconds have been report-
ed; such lengths are rare and most commonly occur at higher
latitudes. Usually a green flash lasts for a period of about 1/2
to 21/2 seconds, with about 11/4 seconds being average. This
variability is probably due primarily to changes in the index
of refraction of the air near the horizon.
Figure 3821. From top to bottom: Circumzenithal arc, supralateral arc, Parry arc, tangential arc, 22 degree halo, parhelic
circle, and sun dogs on right and left intersection of 22 degree halo and parhelic circle. Image courtesy of NOAA.
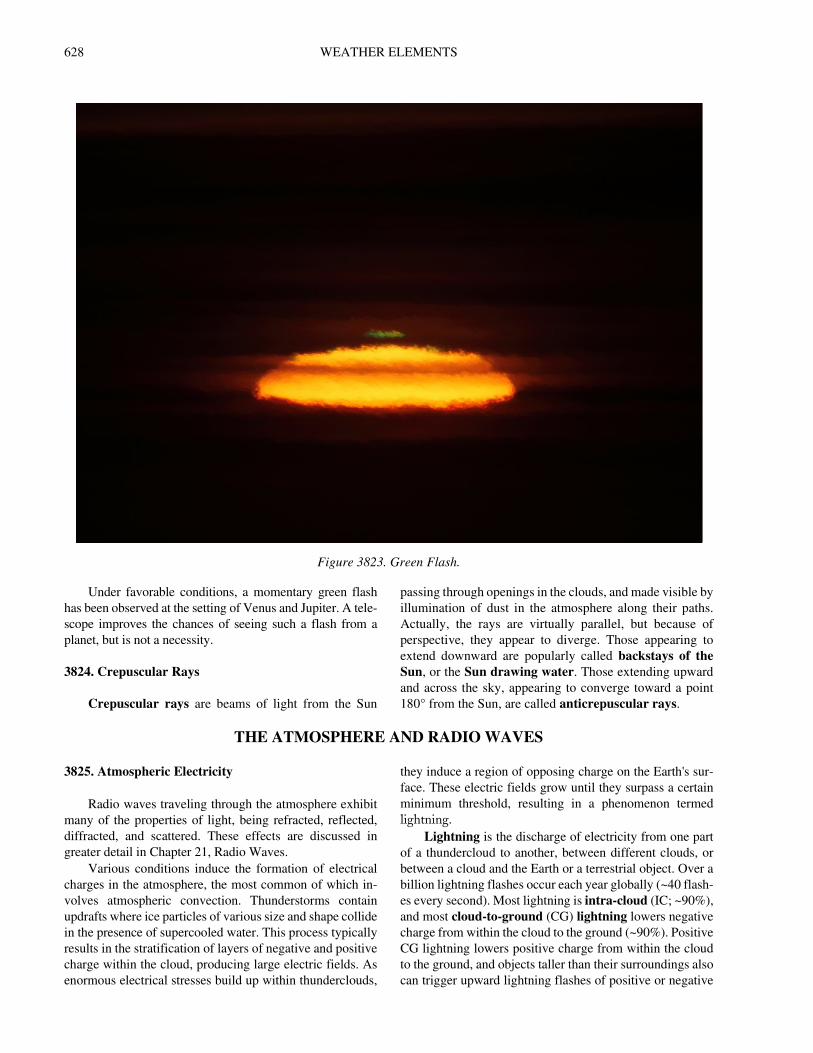
628 WEATHER ELEMENTS
Under favorable conditions, a momentary green flash
has been observed at the setting of Venus and Jupiter. A tele-
scope improves the chances of seeing such a flash from a
planet, but is not a necessity.
3824. Crepuscular Rays
Crepuscular rays are beams of light from the Sun
passing through openings in the clouds, and made visible by
illumination of dust in the atmosphere along their paths.
Actually, the rays are virtually parallel, but because of
perspective, they appear to diverge. Those appearing to
extend downward are popularly called backstays of the
Sun, or the Sun drawing water. Those extending upward
and across the sky, appearing to converge toward a point
180° from the Sun, are called anticrepuscular rays.
THE ATMOSPHERE AND RADIO WAVES
3825. Atmospheric Electricity
Radio waves traveling through the atmosphere exhibit
many of the properties of light, being refracted, reflected,
diffracted, and scattered. These effects are discussed in
greater detail in Chapter 21, Radio Waves.
Various conditions induce the formation of electrical
charges in the atmosphere, the most common of which in-
volves atmospheric convection. Thunderstorms contain
updrafts where ice particles of various size and shape collide
in the presence of supercooled water. This process typically
results in the stratification of layers of negative and positive
charge within the cloud, producing large electric fields. As
enormous electrical stresses build up within thunderclouds,
they induce a region of opposing charge on the Earth's sur-
face. These electric fields grow until they surpass a certain
minimum threshold, resulting in a phenomenon termed
lightning.
Lightning is the discharge of electricity from one part
of a thundercloud to another, between different clouds, or
between a cloud and the Earth or a terrestrial object. Over a
billion lightning flashes occur each year globally (~40 flash-
es every second). Most lightning is intra-cloud (IC; ~90%),
and most cloud-to-ground (CG) lightning lowers negative
charge from within the cloud to the ground (~90%). Positive
CG lightning lowers positive charge from within the cloud
to the ground, and objects taller than their surroundings also
can trigger upward lightning flashes of positive or negative
Figure 3823. Green Flash.
WEATHER ELEMENTS 629
polarity.
Lightning generates electromagnetic pulses that prop-
agate as radio waves in all directions. CG lightning
generally exhibits strong current in long vertical channels,
emitting most efficiently in the low-frequency (LF) to very-
low frequency (VLF) range. IC lightning channels typically
are more horizontal with weaker current, emitting most ef-
ficiently in the high-frequency (HF) to very-high frequency
(VHF) range. Ground-based lightning detection networks
geolocate lightning using the signal arrival angle and/or ar-
rival times at multiple sensors. Satellite sensors also detect
lightning, but they observe the optical lightning emissions
at cloud top.
Strong VLF signals propagate long distances (1000's
of km), so long-range VLF networks (3-30 kHz) can detect
high-current lightning globally with fewer than 100 sensors
(mostly CG detection). Alternatively, local VHF networks
(50-200 MHz) detect emissions associated with electrical
breakdown during lightning channel formation and re-illu-
mination. The VHF networks provide detailed 3-D
lightning mapping, but are spatially limited by the line-of-
site propagation of VHF radio waves. Some networks em-
ploy a blended approach (e.g., 1 Hz to 12 MHz) to provide
a degree of global CG lightning detection with better per-
formance (i.e., IC detection) in regions with more sensors.
Since higher frequency signals attenuate more quickly than
lower frequency signals, regardless of the technology, IC
lightning observations are limited in regions lacking sen-
sors (e.g., the deep ocean).
Thunder, the noise that accompanies lightning, is
caused by the heating, ionizing, and rapid expansion of the
air by lightning, sending out a compression wave along the
lightning channel. Thunder audibility is influenced by the
temperature, humidity, wind velocity, wind shear, tempera-
ture inversions, terrain features, and clouds. When thunder
is heard, lightning is present, whether or not visible to the
observer. Thunder is seldom heard beyond 10 miles (16
km), so if thunder is audible, lightning is close enough to
strike.
The sound of distant thunder has a characteristic low-
pitched rumbling sound. Pitch, the degree of highness or
lowness of a sound, is due to strong absorption and scatter-
ing of high-frequency components of the original sound
waves. The rumbling results from the fact that sound waves
are emitted from different locations along the lightning
channel, which lie at varying distances from the observer.
The longer the lightning channels, the longer the thunder.
The elapsed time between the lightning and thunder is due
to the difference in travel time of light and sound. Since the
former is comparatively instantaneous, and the speed of
sound is about 1,117 feet per second, the approximate dis-
tance in nautical miles is equal to the elapsed time in
seconds, divided by 5.5.
Lightning occurs in fairly well-documented regions
and seasons, so knowledge of local weather patterns can
help mitigate its threat to humans. Nearly 70 percent of all
lightning occurs in the tropical latitude band between 35° N
and 35° S. Globally, 85 to 90 percent of lightning occurs
over land because solar radiation heats land quicker, caus-
ing convection (thunderstorms) to be taller and stronger.
The signs of lightning almost always are present before it
strikes, whether it is as direct as thunder or as obscure as a
growing cumulus cloud on the horizon. Lightning trends
are indicative of thunderstorm intensity, so rapidly updat-
ing lightning observations provides valuable insights into
thunderstorm evolution. IC lightning better indicates thun-
derstorm intensity since it relates more closely to updraft
evolution than does CG lightning. Other manifestations of
atmospheric electricity also are known to occur. For exam-
ple, St. Elmo's fire is a luminous discharge of electricity
from pointed objects such as the masts and antennas of
ships, lightning rods, steeples, mountain tops, blades of
grass, , etc., when there is a considerable difference in the
electrical charge between the object and the air. It appears
most frequently during thunderstorms. An object from
which St. Elmo's fire emanates is in danger of being struck
by lightning because this discharge may be the initial phase
of a CG lightning flash. Throughout history those who have
not understood St. Elmo's fire have regarded it with super-
stitious awe, considering it a supernatural manifestation.
This view is reflected in the name corposant (from “corpo
santo,” meaning “body of a saint”) sometimes given this
phenomenon.
See Figure 3825a for a depiction of flash density across
the planet over an 18 year period of time.
The Aurora (Northern Lights) and Aurora Australis
(Southern Lights) are the result of electrically charged par-
ticles colliding with the upper reaches of Earth's
atmosphere. Electrons, primarily responsible for the visible
aurora, are energized through acceleration processes in the
magnetosphere. They follow the magnetic field of Earth
down to the Polar Regions where they collide with oxygen
and nitrogen atoms and molecules in Earth's upper atmo-
sphere. In these collisions, the electrons transfer their
energy to the atmosphere thus exciting the atoms and mol-
ecules to higher energy states. When they relax down to
lower energy states, they release their energy in the form of
light. This is similar to how a neon light works. The aurora
typically forms 80 to 500 km above Earth's surface.
Earth's magnetic field guides the electrons such that the
aurora forms two ovals approximately centered at the mag-
netic poles. During major geomagnetic storms these ovals
expand away from the poles such that aurora can be seen
over much of the northern United States. Often the auroral
forms consist of tall rays that look much like a curtain or
folds of cloth. During the evening, these rays can form arcs
that stretch from horizon to horizon. Late in the evening,
near midnight, the arcs often begin to twist and sway, just
as if a wind were blowing on the curtains of light. At some
point, the arcs may expand to fill the whole sky, moving
rapidly and becoming very bright. Then in the early morn-
ing the auroral forms can take on a more cloud-like
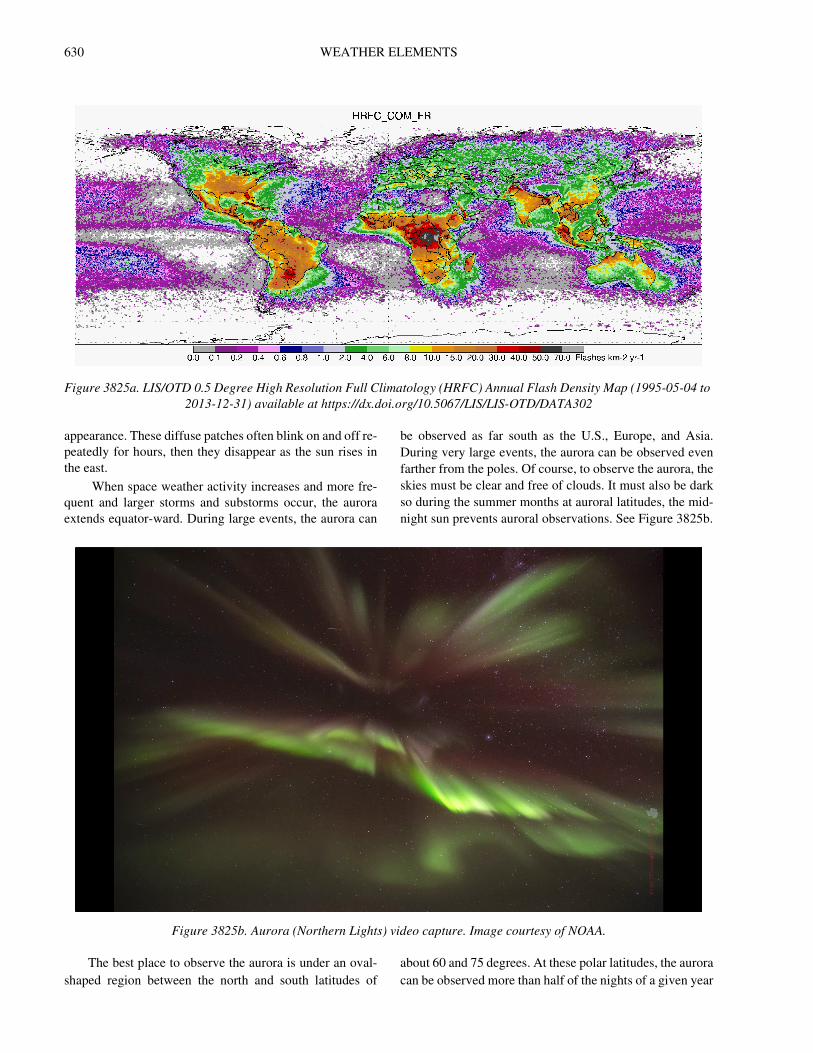
630 WEATHER ELEMENTS
appearance. These diffuse patches often blink on and off re-
peatedly for hours, then they disappear as the sun rises in
the east.
When space weather activity increases and more fre-
quent and larger storms and substorms occur, the aurora
extends equator-ward. During large events, the aurora can
be observed as far south as the U.S., Europe, and Asia.
During very large events, the aurora can be observed even
farther from the poles. Of course, to observe the aurora, the
skies must be clear and free of clouds. It must also be dark
so during the summer months at auroral latitudes, the mid-
night sun prevents auroral observations. See Figure 3825b.
The best place to observe the aurora is under an oval-
shaped region between the north and south latitudes of
about 60 and 75 degrees. At these polar latitudes, the aurora
can be observed more than half of the nights of a given year
Figure 3825a. LIS/OTD 0.5 Degree High Resolution Full Climatology (HRFC) Annual Flash Density Map (1995-05-04 to
2013-12-31) available at https://dx.doi.org/10.5067/LIS/LIS-OTD/DATA302
Figure 3825b. Aurora (Northern Lights) video capture. Image courtesy of NOAA.
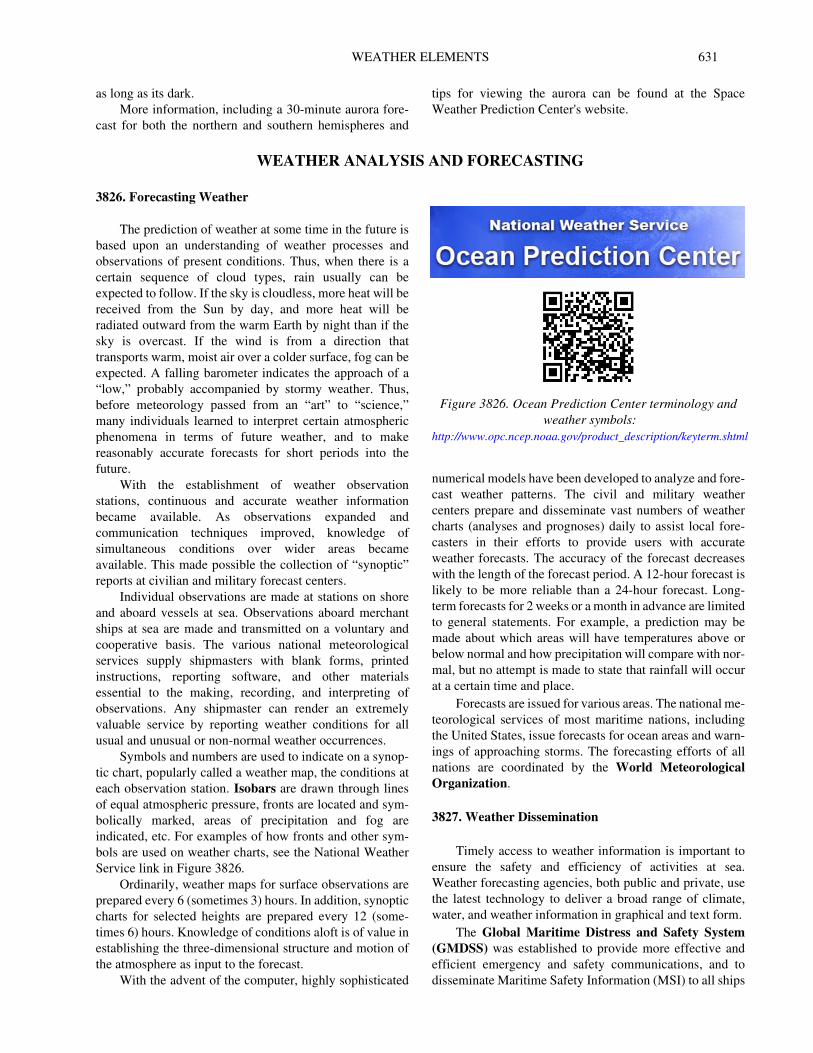
WEATHER ELEMENTS 631
as long as its dark.
More information, including a 30-minute aurora fore-
cast for both the northern and southern hemispheres and
tips for viewing the aurora can be found at the Space
Weather Prediction Center's website.
WEATHER ANALYSIS AND FORECASTING
3826. Forecasting Weather
The prediction of weather at some time in the future is
based upon an understanding of weather processes and
observations of present conditions. Thus, when there is a
certain sequence of cloud types, rain usually can be
expected to follow. If the sky is cloudless, more heat will be
received from the Sun by day, and more heat will be
radiated outward from the warm Earth by night than if the
sky is overcast. If the wind is from a direction that
transports warm, moist air over a colder surface, fog can be
expected. A falling barometer indicates the approach of a
“low,” probably accompanied by stormy weather. Thus,
before meteorology passed from an “art” to “science,”
many individuals learned to interpret certain atmospheric
phenomena in terms of future weather, and to make
reasonably accurate forecasts for short periods into the
future.
With the establishment of weather observation
stations, continuous and accurate weather information
became available. As observations expanded and
communication techniques improved, knowledge of
simultaneous conditions over wider areas became
available. This made possible the collection of “synoptic”
reports at civilian and military forecast centers.
Individual observations are made at stations on shore
and aboard vessels at sea. Observations aboard merchant
ships at sea are made and transmitted on a voluntary and
cooperative basis. The various national meteorological
services supply shipmasters with blank forms, printed
instructions, reporting software, and other materials
essential to the making, recording, and interpreting of
observations. Any shipmaster can render an extremely
valuable service by reporting weather conditions for all
usual and unusual or non-normal weather occurrences.
Symbols and numbers are used to indicate on a synop-
tic chart, popularly called a weather map, the conditions at
each observation station. Isobars are drawn through lines
of equal atmospheric pressure, fronts are located and sym-
bolically marked, areas of precipitation and fog are
indicated, etc. For examples of how fronts and other sym-
bols are used on weather charts, see the National Weather
Service link in Figure 3826.
Ordinarily, weather maps for surface observations are
prepared every 6 (sometimes 3) hours. In addition, synoptic
charts for selected heights are prepared every 12 (some-
times 6) hours. Knowledge of conditions aloft is of value in
establishing the three-dimensional structure and motion of
the atmosphere as input to the forecast.
With the advent of the computer, highly sophisticated
numerical models have been developed to analyze and fore-
cast weather patterns. The civil and military weather
centers prepare and disseminate vast numbers of weather
charts (analyses and prognoses) daily to assist local fore-
casters in their efforts to provide users with accurate
weather forecasts. The accuracy of the forecast decreases
with the length of the forecast period. A 12-hour forecast is
likely to be more reliable than a 24-hour forecast. Long-
term forecasts for 2 weeks or a month in advance are limited
to general statements. For example, a prediction may be
made about which areas will have temperatures above or
below normal and how precipitation will compare with nor-
mal, but no attempt is made to state that rainfall will occur
at a certain time and place.
Forecasts are issued for various areas. The national me-
teorological services of most maritime nations, including
the United States, issue forecasts for ocean areas and warn-
ings of approaching storms. The forecasting efforts of all
nations are coordinated by the World Meteorological
Organization.
3827. Weather Dissemination
Timely access to weather information is important to
ensure the safety and efficiency of activities at sea.
Weather forecasting agencies, both public and private, use
the latest technology to deliver a broad range of climate,
water, and weather information in graphical and text form.
The Global Maritime Distress and Safety System
(GMDSS) was established to provide more effective and
efficient emergency and safety communications, and to
disseminate Maritime Safety Information (MSI) to all ships
Figure 3826. Ocean Prediction Center terminology and
weather symbols:
http://www.opc.ncep.noaa.gov/product_description/keyterm.shtml
632 WEATHER ELEMENTS
on the world's oceans regardless of location or atmospheric
conditions. MSI includes navigational warnings, meteoro-
logical warnings and forecasts, and other urgent safety-
related information. GMDSS goals are defined in the
International Convention for the Safety Of Life At Sea
(SOLAS), and affect vessels over 300 gross tons and
passenger vessels of any size. The U.S. National Weather
Service participates directly in the GMDSS by preparing
meteorological forecasts and warnings for broadcast via
NAVTEX and SafetyNET.
Disseminating weather information is carried out in a
number of ways; some are part of GMDSS and others are
not. Weather forecasts and warnings are available by vari-
ous means including TV, radio (AM/FM and specifically
FM 162.400MHz to 164.550MHz), and satellite broadcasts
(SBN/NOAAPORT, NWWS and EMWIN), telephone
(Weather Apps or call-in to local Weather Forecast Offic-
es), and the Internet (Figure 3827a and other commercial
weather providers and software programs).
Visual storm warnings are displayed in various ports,
and storm warnings are broadcast by radio. Worldwide ma-
rine meteorological and oceanographic forecasting and
dissemination responsibilities via Inmarsat-C SafetyNET
have been divided into MetAreas by the World Meteorolog-
ical Organization (WMO)- Intergovernmental
Oceanographic Commission (IOC) Joint Technical Com-
mission for Oceanography and Marine Meteorology
(JCOMM). The forecasting responsibilities for each Me-
tArea are handled by the National Meteorological Services
appointed as Issuing Services within the framework of the
WMO Marine Broadcast System for the GMDSS. More
information about which forecasting agency has forecast-
ing responsibilities for each Metarea can be found in Figure
3827b.
NAVTEX Broadcasts
NAVTEX is an international automated medium fre-
quency (518 kHz) direct-printing service for delivery of
navigational and meteorological warnings and forecasts, as
well as urgent marine safety information to ships. It was de-
veloped as an automated means of receiving this
information aboard ships at sea within approximately 200
nautical miles of shore. NAVTEX stations in the U.S. are
operated by the U.S. Coast Guard. There are no user fees as-
sociated with receiving NAVTEX broadcasts. Information
about marine weather forecasts broadcast through NAV-
TEX can be found at the link provided in Figure 3827c.
Additional information is also available on individual Met
Area webpages.
Inmarsat Broadcasts
Inmarsat-C SafetyNET is an internationally adopted,
automated satellite system for promulgating weather fore-
casts and warnings, marine navigational warnings, and
other safety-related information to all types of vessels.
There are no user fees associated with receiving SafetyNET
broadcasts. The National Weather Service prepares high-
seas forecasts and warnings for broadcast via SafetyNET
for each of the three ocean areas they are responsible for
covering four times daily. Information about marine weath-
er forecasts broadcast through Inmarsat-C SafetyNET can
be found at the link in Figure 3827d.
Radiofax Broadcasts
Radiofax, also known as HF FAX, radiofacsimile or
weatherfax, is a means of broadcasting graphic weather
maps and other graphic images via HF radio. HF radiofax
Figure 3827a. National Weather Service website:
http://www.weather.gov
Figure 3827b. WMO Marine broadcast system for GMDSS
website: http://weather.gmdss.org/metareas.html
Figure 3827c. National Weather Service NAVTEX marine
weather forecast broadcasts:
http://www.nws.noaa.gov/om/marine/navtex.htm
WEATHER ELEMENTS 633
is also known as WEFAX, although this term is generally
used to refer to the reception of weather charts and imagery
via satellite. Maps are received using a dedicated radiofax
receiver or a single sideband shortwave receiver connected
to an external facsimile recorder or PC equipped with a ra-
diofax interface and application software.
The earliest broadcasts of weather maps via radiofac-
simile appear to have been made in 1926 by American
inventor Charles Francis Jenkins in a demonstration to the
Navy. The U.S. Weather Bureau conducted further tests of
its applicability in 1930. While radiofacsimile has been
used for everything from transmitting newspapers to want-
ed posters in the past, the broadcasting of marine charts is
today the primary application.
The National Weather Service radiofax program pre-
pares high seas weather maps for broadcast via four U.S.
Coast Guard stations (Boston, New Orleans, Pt. Reyes, and
Kodia) and one Department of Defense transmitter site
(Honolulu). These broadcasts are prepared by the Ocean
Prediction Center, National Hurricane Center, Honolu-
lu Forecast Office, and Anchorage Forecast Office.
Limited satellite imagery, sea surface temperature maps,
and text forecasts are also available at their individual
websites.
All National Weather Service radiofax products are
available via the Internet (HTTP, FTP or Email). Although
available, internet access is not feasible for most vessels.
Broadcasts of graphic marine forecasts via HF radiofax re-
mains among the most valued of NWS marine services. An
example of radiofax surface analysis chart is shown in Fig-
ure 3827e.
More information about marine weather radiofax
broadcasts can be found at the link in Figure 3427f.
Weather Products via the Internet
With the advent of wireless technologies, information
updates are almost seamless to keep mariners current on
changing environmental conditions. These technologies in-
clude the dissemination and receipt of nautical charts,
Figure 3827d. Inmarsat marine weather forecast
broadcasts:
http://www.nws.noaa.gov/om/marine/inmarsat.htm
Figure 3827e. National Weather Service radiofax surface analysis example.
634 WEATHER ELEMENTS
ocean and weather information using satellite telephones,
the Internet and various computer or commercial applica-
tions. The reduction in the price for satellite-based internet
access have enabled vessels to access large graphic files
produced by various weather forecasting agencies, includ-
ing the National Weather Service, online. Additional
websites to the ones already presented in this chapter that a
mariner may find useful are listed below.
Information on dissemination of marine weather infor-
mation may be found in NGA Pub. 117, Radio Navigational
Aids and the International Maritime Organization publica-
tion, Master Plan of Shore Based Facilities for the GMDSS;
Information on day and night visual storm warnings is
given in the various volumes of Sailing Directions, both
En-routes and Planning Guides.
Then National Weather Service - Worldwide Marine
Radiofacsimile Broadcast Schedule (dated September 9,
2016) can be accessed via the link in Figure 3827g.
Meteorological and oceanographic information, in-
cluding weather forecasts produced by the United States
can be found in the links contained in Figure 3827h, Figure 3827i and Figure 3827j.
For additional port-area tides and currents information
see the link in Figure 3827k.
For additional meteorological information derived
from data buoy collectors see Figure 3827l.
Figure 3827f. Information on marine weather radiofax
broadcasts:
http://www.nws.noaa.gov/om/marine/radiofax.htm
Figure 3827g. Worldwide Marine Radiofacsimile
Broadcast Schedule:
http://www.nws.noaa.gov/os/marine/rfax.pdf
Figure 3827h. Information on weather forecasts produced
by the United States:
http://www.nws.noaa.gov/om/marine/home.htm
Figure 3827i. Coastal and Great Lakes forecast:
http://www.nws.noaa.gov/om/marine/zone/usamz.htm
Figure 3827j. Fleet Numerical Meteorology and
Oceanography Center:
http://www.usno.navy.mil/FNMOC
WEATHER ELEMENTS 635
3828. Interpreting Weather
The factors which determine weather are numerous
and varied. Ever-increasing knowledge regarding them
makes possible a continually improving weather service.
However, the ability to forecast is acquired through
study and long practice, and therefore the services of a
trained meteorologist should be utilized whenever
available.
The value of a forecast is increased if one has access to
the information upon which it is based, and understands the
principles and processes involved. It is sometimes as
important to know the various types of weather which may
be experienced as it is to know which of several
possibilities is most likely to occur.
At sea, reporting stations are unevenly distributed,
sometimes leaving relatively large areas with incomplete
reports, or none at all. Under these conditions, the loca-
tions of highs, lows, fronts, etc., are imperfectly known,
and their very existence may even be in doubt. At such
times mariners who can interpret the observations made
from their own vessel may be able to predict weather for
the next several hours more reliably than a trained meteo-
rologist ashore.
3829. References
© Figures 3808, 3810a, 3814a & 3814b are provided
courtesy of University Corporation for Atmospheric
Research (UCAR), COMINT Program, Boulder, CO
80301.
Figure 3827k. NOAA port information:
https://tidesandcurrents.noaa.gov/ports.html
Figure 3827l. National Data Buoy Center:
http://www.ndbc.noaa.gov/

637
CHAPTER 39
TROPICAL CYCLONES
DESCRIPTION AND CAUSES
3900. Introduction
Tropical cyclone is a general term for a cyclone originating over the tropical oceans, although technical definitions differ across the globe. Over the North Atlantic, and eastern North Pacific Oceans, for example, a tropical cyclone is defined by the National Hurricane Center (NHC) as “a warm-core non-frontal synoptic-scale cyclone, originating over tropical or subtropical waters, with organized deep convection and a closed surface wind circulation about a well-defined center.” Similar definitions are in use by the various global operational forecast centers.
For access to the Glossary of NHC Terms see the link provided in Figure 3900.
Once formed, a tropical cyclone is maintained by the extraction of heat energy from the ocean at high tempera-ture and heat export at the low temperatures of the upper atmosphere. In this they differ from the extratropical cy-clones of higher latitudes, which derive their energy from horizontal temperature contrasts in the atmosphere. As a re-sult of their different energy sources, tropical cyclones tend to be more circularly symmetric than extratropical cy-clones, tend to be smaller, and have their fiercest winds and rains located closer to the area of lowest pressure. Tropical cyclones are infrequent in comparison with middle- and high-latitude storms, but they have a record of destruction far exceeding that of any other type of storm. Because of their fury, and because they are predominantly oceanic, they merit special attention by mariners. The rapidity with which the weather can deteriorate with approach of the storm, and the violence of the fully developed tropical cy-clone are difficult to imagine if they have not been experienced.
On his second voyage to the New World, Columbus
encountered a tropical storm. Although his vessels suffered no damage, this experience proved valuable during his fourth voyage when his ships were threatened by a fully developed hurricane. Columbus read the signs of an approaching storm from the appearance of a southeasterly swell, the direction of the high cirrus clouds, and the hazy appearance of the atmosphere. He directed his vessels to shelter. The commander of another group, who did not heed the signs, lost most of his ships and more than 500 men perished.
3901. Definitions
Tropical cyclones are classified by the intensity of their highest associated winds, usually measured by a 1-minute or a 10-minute average. The following terms apply in the North Atlantic and eastern North Pacific Oceans:
(1) Tropical depression - a tropical cyclone in which the maximum sustained (1-minute mean) surface wind speed is 33 kts or less.
(2) Tropical storm - a tropical cyclone in which the maximum sustained (1-minute mean) surface wind speed ranges from 34 to 63 kts.
(3) Hurricane - a tropical cyclone in which the maximum sustained (1-minute mean) surface wind is 64 kts or more.
(4) Major hurricane - a tropical cyclone in which the maximum sustained (1-minute mean) surface wind is 96 kts or more.
When cyclones no longer possess sufficient tropical characteristics to be considered a tropical cyclone, they may be referred to as “post tropical.” These cyclones may continue to produce heavy rains, high winds, and large seas. A remnant low is a post-tropical cyclone that no longer pos-sesses the convective organization required of a tropical cyclone and has maximum sustained winds of less than 34 knots.
Other terms are used globally. In the western North Pa-cific, typhoon is synonymous with the Atlantic term hurricane, while super typhoon refers to a tropical cy-clone with maximum sustained winds of 130 kts or more. In the Philippines, a typhoon is also known as a bagyo. In the North Indian Ocean, a tropical cyclone with winds of 34
Figure 3900. Link to the Glossary of NHC Terms. http://www.nhc.noaa.gov/aboutgloss.shtml
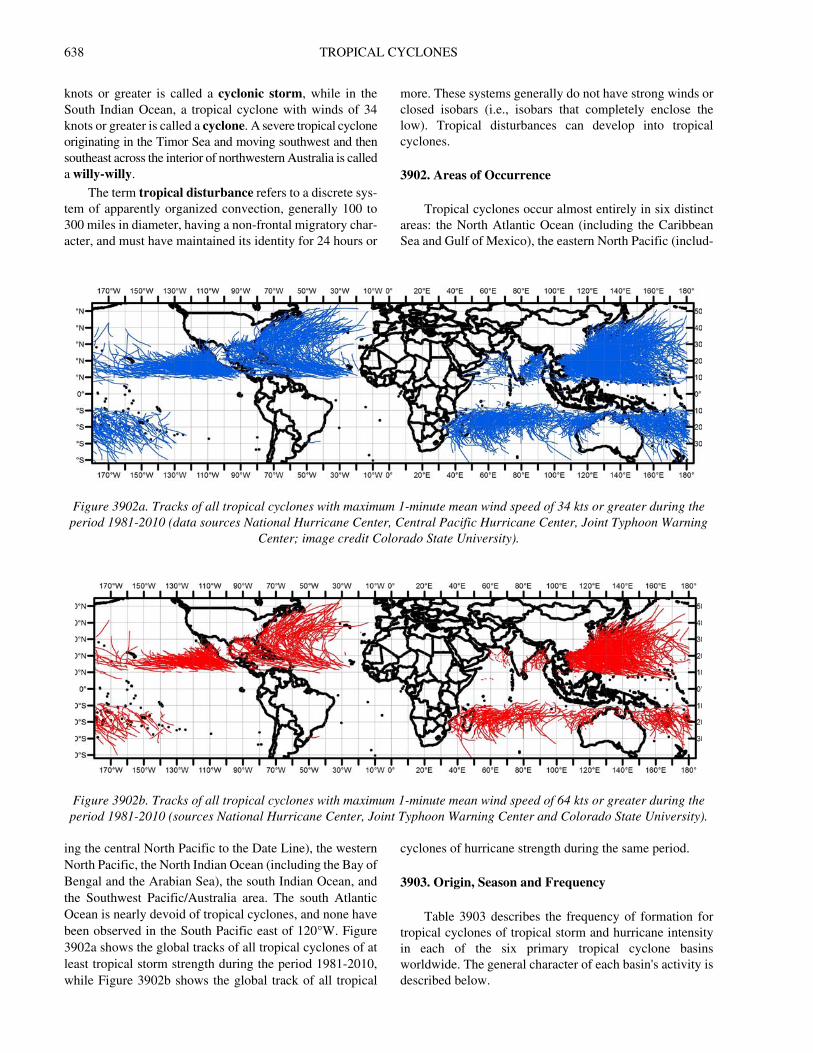
638 TROPICAL CYCLONES
knots or greater is called a cyclonic storm, while in the South Indian Ocean, a tropical cyclone with winds of 34 knots or greater is called a cyclone. A severe tropical cyclone originating in the Timor Sea and moving southwest and then southeast across the interior of northwestern Australia is called a willy-willy.
The term tropical disturbance refers to a discrete sys-tem of apparently organized convection, generally 100 to 300 miles in diameter, having a non-frontal migratory char-acter, and must have maintained its identity for 24 hours or
more. These systems generally do not have strong winds or closed isobars (i.e., isobars that completely enclose the low). Tropical disturbances can develop into tropical cyclones.
3902. Areas of Occurrence
Tropical cyclones occur almost entirely in six distinct areas: the North Atlantic Ocean (including the Caribbean Sea and Gulf of Mexico), the eastern North Pacific (includ-
ing the central North Pacific to the Date Line), the western North Pacific, the North Indian Ocean (including the Bay of Bengal and the Arabian Sea), the south Indian Ocean, and the Southwest Pacific/Australia area. The south Atlantic Ocean is nearly devoid of tropical cyclones, and none have been observed in the South Pacific east of 120°W. Figure 3902a shows the global tracks of all tropical cyclones of at least tropical storm strength during the period 1981-2010, while Figure 3902b shows the global track of all tropical
cyclones of hurricane strength during the same period.
3903. Origin, Season and Frequency
Table 3903 describes the frequency of formation for tropical cyclones of tropical storm and hurricane intensity in each of the six primary tropical cyclone basins worldwide. The general character of each basin's activity is described below.
Figure 3902a. Tracks of all tropical cyclones with maximum 1-minute mean wind speed of 34 kts or greater during the period 1981-2010 (data sources National Hurricane Center, Central Pacific Hurricane Center, Joint Typhoon Warning
Center; image credit Colorado State University).
Figure 3902b. Tracks of all tropical cyclones with maximum 1-minute mean wind speed of 64 kts or greater during the period 1981-2010 (sources National Hurricane Center, Joint Typhoon Warning Center and Colorado State University).
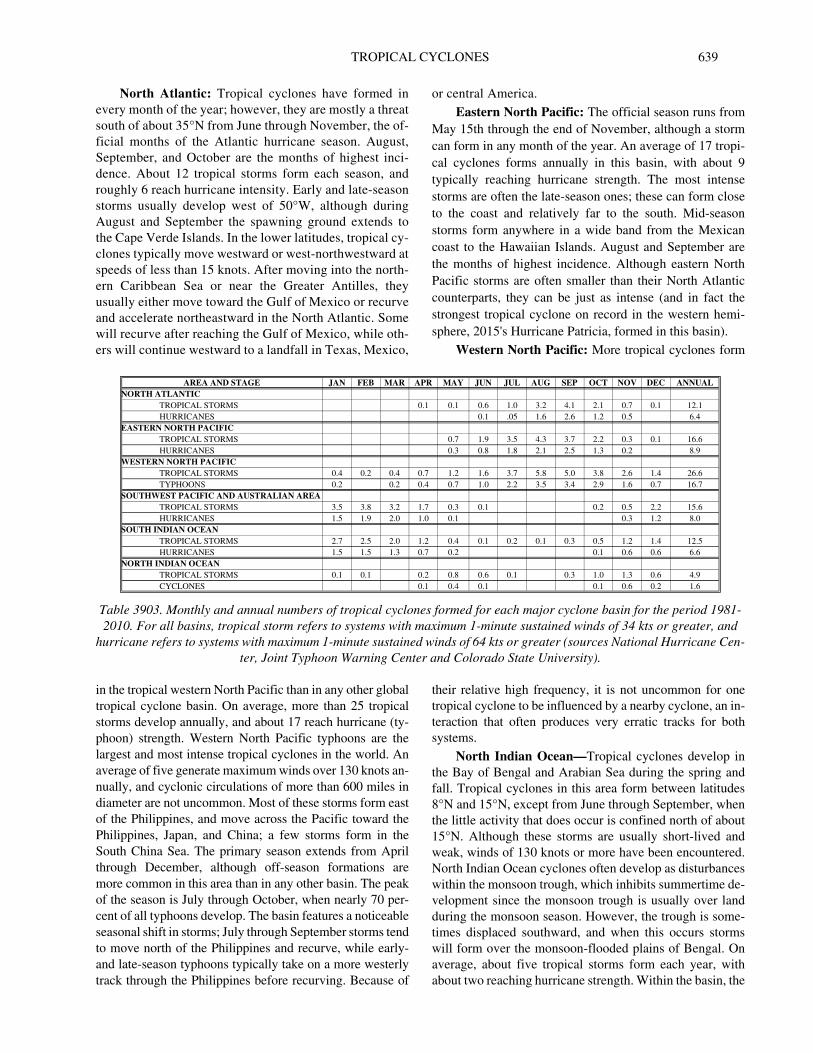
TROPICAL CYCLONES 639
North Atlantic: Tropical cyclones have formed in every month of the year; however, they are mostly a threat south of about 35°N from June through November, the of-ficial months of the Atlantic hurricane season. August, September, and October are the months of highest inci-dence. About 12 tropical storms form each season, and roughly 6 reach hurricane intensity. Early and late-season storms usually develop west of 50°W, although during August and September the spawning ground extends to the Cape Verde Islands. In the lower latitudes, tropical cy-clones typically move westward or west-northwestward at speeds of less than 15 knots. After moving into the north-ern Caribbean Sea or near the Greater Antilles, they usually either move toward the Gulf of Mexico or recurve and accelerate northeastward in the North Atlantic. Some will recurve after reaching the Gulf of Mexico, while oth-ers will continue westward to a landfall in Texas, Mexico,
or central America.
Eastern North Pacific: The official season runs from May 15th through the end of November, although a storm can form in any month of the year. An average of 17 tropi-cal cyclones forms annually in this basin, with about 9 typically reaching hurricane strength. The most intense storms are often the late-season ones; these can form close to the coast and relatively far to the south. Mid-season storms form anywhere in a wide band from the Mexican coast to the Hawaiian Islands. August and September are the months of highest incidence. Although eastern North Pacific storms are often smaller than their North Atlantic counterparts, they can be just as intense (and in fact the strongest tropical cyclone on record in the western hemi-sphere, 2015's Hurricane Patricia, formed in this basin).
Western North Pacific: More tropical cyclones form
in the tropical western North Pacific than in any other global tropical cyclone basin. On average, more than 25 tropical storms develop annually, and about 17 reach hurricane (ty-phoon) strength. Western North Pacific typhoons are the largest and most intense tropical cyclones in the world. An average of five generate maximum winds over 130 knots an-nually, and cyclonic circulations of more than 600 miles in diameter are not uncommon. Most of these storms form east of the Philippines, and move across the Pacific toward the Philippines, Japan, and China; a few storms form in the South China Sea. The primary season extends from April through December, although off-season formations are more common in this area than in any other basin. The peak of the season is July through October, when nearly 70 per-cent of all typhoons develop. The basin features a noticeable seasonal shift in storms; July through September storms tend to move north of the Philippines and recurve, while early- and late-season typhoons typically take on a more westerly track through the Philippines before recurving. Because of
their relative high frequency, it is not uncommon for one tropical cyclone to be influenced by a nearby cyclone, an in-teraction that often produces very erratic tracks for both systems.
North Indian Ocean—Tropical cyclones develop in the Bay of Bengal and Arabian Sea during the spring and fall. Tropical cyclones in this area form between latitudes 8°N and 15°N, except from June through September, when the little activity that does occur is confined north of about 15°N. Although these storms are usually short-lived and weak, winds of 130 knots or more have been encountered. North Indian Ocean cyclones often develop as disturbances within the monsoon trough, which inhibits summertime de-velopment since the monsoon trough is usually over land during the monsoon season. However, the trough is some-times displaced southward, and when this occurs storms will form over the monsoon-flooded plains of Bengal. On average, about five tropical storms form each year, with about two reaching hurricane strength. Within the basin, the
AREA AND STAGE JAN FEB MAR APR MAY JUN JUL AUG SEP OCT NOV DEC ANNUALNORTH ATLANTIC
TROPICAL STORMS 0.1 0.1 0.6 1.0 3.2 4.1 2.1 0.7 0.1 12.1HURRICANES 0.1 .05 1.6 2.6 1.2 0.5 6.4
EASTERN NORTH PACIFICTROPICAL STORMS 0.7 1.9 3.5 4.3 3.7 2.2 0.3 0.1 16.6HURRICANES 0.3 0.8 1.8 2.1 2.5 1.3 0.2 8.9
WESTERN NORTH PACIFICTROPICAL STORMS 0.4 0.2 0.4 0.7 1.2 1.6 3.7 5.8 5.0 3.8 2.6 1.4 26.6TYPHOONS 0.2 0.2 0.4 0.7 1.0 2.2 3.5 3.4 2.9 1.6 0.7 16.7
SOUTHWEST PACIFIC AND AUSTRALIAN AREATROPICAL STORMS 3.5 3.8 3.2 1.7 0.3 0.1 0.2 0.5 2.2 15.6HURRICANES 1.5 1.9 2.0 1.0 0.1 0.3 1.2 8.0
SOUTH INDIAN OCEANTROPICAL STORMS 2.7 2.5 2.0 1.2 0.4 0.1 0.2 0.1 0.3 0.5 1.2 1.4 12.5HURRICANES 1.5 1.5 1.3 0.7 0.2 0.1 0.6 0.6 6.6
NORTH INDIAN OCEANTROPICAL STORMS 0.1 0.1 0.2 0.8 0.6 0.1 0.3 1.0 1.3 0.6 4.9CYCLONES 0.1 0.4 0.1 0.1 0.6 0.2 1.6
Table 3903. Monthly and annual numbers of tropical cyclones formed for each major cyclone basin for the period 1981-2010. For all basins, tropical storm refers to systems with maximum 1-minute sustained winds of 34 kts or greater, and
hurricane refers to systems with maximum 1-minute sustained winds of 64 kts or greater (sources National Hurricane Cen-ter, Joint Typhoon Warning Center and Colorado State University).
640 TROPICAL CYCLONES
Bay of Bengal is the area of highest incidence. It is not un-usual for a storm to move across southern India and re-intensify in the Arabian Sea, and this is particularly true during October and November, the months of highest inci-dence. It is also during this period that torrential rains from these storms, dumped over already rain-soaked areas, are most likely to cause disastrous floods.
South Indian Ocean—Over the waters west of 100°E to the east African coast, an average of 11 tropical storms form each season, with about 4 reaching hurricane intensity. The season is from December through March, although it is possible for a storm to form in any month. Tropical cyclones in this region usually form south of 10°S. The latitude of re-curvature usually migrates from about 20°S in January to around 15°S in April. After crossing 30°S, these storms sometimes become intense extratropical lows.
Southwest Pacific and Australian Area—These
tropical waters spawn an annual average of 15 tropical storms, of which 4 reach hurricane intensity. The main season extends from about December through April, although storms can form in any month. Activity is widespread in January and February, and it is in these months that tropical cyclones are most likely to affect Fiji, Samoa, and the other eastern islands. Tropical cyclones usually form in the waters from 105°E to 160°W, between 5° and 20°S. Storms affecting northern and western Australia often develop in the Timor or Arafura Sea, while those that affect the east coast form in the Coral Sea. These storms are often small, but can develop winds in excess of 130 knots. New Zealand is sometimes reached by decaying Coral Sea storms, and occasionally by an intense hurricane. In general, tropical cyclones in this region move southwestward and then recurve southeastward.
TROPICAL CYCLONE BASICS
3904. Formation
Tropical cyclones form from pre-existing disturbances that are typically convective cloud clusters associated with a low-level cyclonic vorticity maximum, such as a tropical wave (although tropical cyclones can also form from non-tropical precursor disturbances, such as old frontal boundaries or upper-level lows). Low-level vorticity maxima are also areas of low pressure at the surface, and due to the pressure gradient force, air will flow inward toward the low pressure area. As a result of the Coriolis force, the inward-flowing air is deflected to the right (left in the Southern Hemisphere) and this creates a counter-clockwise (clockwise in the Southern Hemisphere) circulation. The inflow of air produces low-level convergence that in turn results in rising motion and deep convection (showers and thunderstorms) near the area of lowest pressure. The tropical cyclone is essentially a heat engine, with the heat source being the underlying ocean. Water vapor from the ocean condenses in rising columns of air, releasing the latent heat of condensation. In these near-saturated air columns, which ultimately become the eyewall and rain bands of the cyclone, the latent heating is offset by adiabatic cooling. Unsaturated air sinks in the eye, and adiabatic warming of the subsiding air results, through hydrostatic balance, in a fall in central pressure and an intensification of the cyclonic circulation
The development and intensification of a tropical cy-clone requires an unstable air mass and a deep layer of moist air extending through the middle troposphere. Atmo-spheric instability is required to produce deep convection, which produces the latent heating. Although it had been previously thought that sea surface temperatures of at least 79-80 degrees Fahrenheit were a necessary condition, trop-ical cyclone formation has been observed over waters in the
low 70s. This implies that the vertical lapse rate, i.e., the change of temperature with height, can be large enough to provide the needed instability even over cooler waters. A deep layer of humid air is needed to prevent the develop-ment of cold downdrafts, which would result in low-level divergence that would disrupt the development process. An additional requirement is that the vertical wind shear, i.e., the change of the wind with height, be sufficiently low, say less than 15 to 20 kts from the surface to the upper tropo-sphere. Strong shear would significantly tilt the developing vortex from the vertical and this loss of vertical coherence of the circulation prevents intensification. The environmen-tal factors needed for tropical cyclone formation are met over much of the tropical oceanic regions, including the At-lantic, Caribbean Sea, Gulf of Mexico, the Northern Hemispheric Pacific, the waters around Australia, and both the Northern and Southern Hemispheric Indian Ocean
3905. Structure
Figure 3904 shows an idealized cross-section through a mature hurricane. The overall cyclonic circulation in the lower troposphere can vary greatly in expanse, but is typically a few hundred miles in diameter. The extent of hurricane-force winds outward from the center can also vary greatly, with diameters ranging from no more than 20 miles to 200 miles or more. The cyclonic spiral is marked by heavy cloud bands from which torrential rains fall, separated by areas of light rain or no rain at all. These spiral bands ascend in decks of cumulus and cumulonimbus clouds to the convective limit of cloud formation, where condensing water vapor is swept off as ice-crystal wisps of cirrus clouds.
In the lower few thousand feet, the cyclonic flow has a net component toward the center, which drives ascent with-
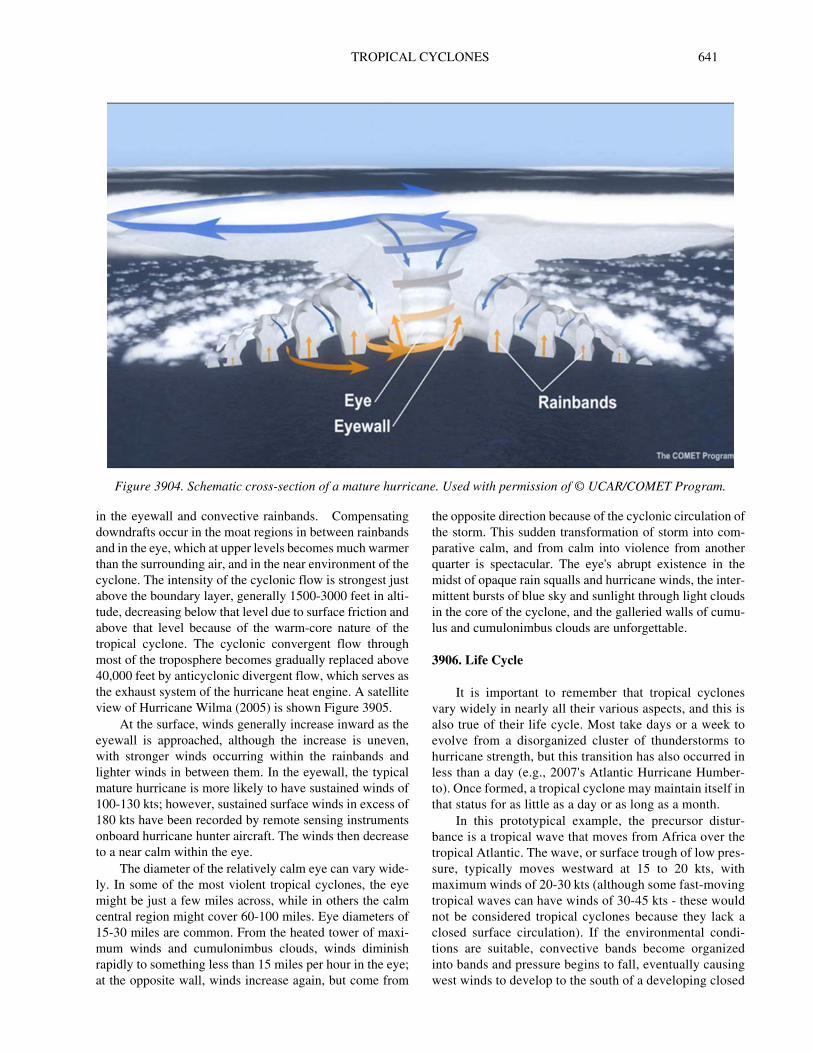
TROPICAL CYCLONES 641
in the eyewall and convective rainbands. Compensating downdrafts occur in the moat regions in between rainbands and in the eye, which at upper levels becomes much warmer than the surrounding air, and in the near environment of the cyclone. The intensity of the cyclonic flow is strongest just above the boundary layer, generally 1500-3000 feet in alti-tude, decreasing below that level due to surface friction and above that level because of the warm-core nature of the tropical cyclone. The cyclonic convergent flow through most of the troposphere becomes gradually replaced above 40,000 feet by anticyclonic divergent flow, which serves as the exhaust system of the hurricane heat engine. A satellite view of Hurricane Wilma (2005) is shown Figure 3905.
At the surface, winds generally increase inward as the eyewall is approached, although the increase is uneven, with stronger winds occurring within the rainbands and lighter winds in between them. In the eyewall, the typical mature hurricane is more likely to have sustained winds of 100-130 kts; however, sustained surface winds in excess of 180 kts have been recorded by remote sensing instruments onboard hurricane hunter aircraft. The winds then decrease to a near calm within the eye.
The diameter of the relatively calm eye can vary wide-ly. In some of the most violent tropical cyclones, the eye might be just a few miles across, while in others the calm central region might cover 60-100 miles. Eye diameters of 15-30 miles are common. From the heated tower of maxi-mum winds and cumulonimbus clouds, winds diminish rapidly to something less than 15 miles per hour in the eye; at the opposite wall, winds increase again, but come from
the opposite direction because of the cyclonic circulation of the storm. This sudden transformation of storm into com-parative calm, and from calm into violence from another quarter is spectacular. The eye's abrupt existence in the midst of opaque rain squalls and hurricane winds, the inter-mittent bursts of blue sky and sunlight through light clouds in the core of the cyclone, and the galleried walls of cumu-lus and cumulonimbus clouds are unforgettable.
3906. Life Cycle
It is important to remember that tropical cyclones vary widely in nearly all their various aspects, and this is also true of their life cycle. Most take days or a week to evolve from a disorganized cluster of thunderstorms to hurricane strength, but this transition has also occurred in less than a day (e.g., 2007's Atlantic Hurricane Humber-to). Once formed, a tropical cyclone may maintain itself in that status for as little as a day or as long as a month.
In this prototypical example, the precursor distur-bance is a tropical wave that moves from Africa over the tropical Atlantic. The wave, or surface trough of low pres-sure, typically moves westward at 15 to 20 kts, with maximum winds of 20-30 kts (although some fast-moving tropical waves can have winds of 30-45 kts - these would not be considered tropical cyclones because they lack a closed surface circulation). If the environmental condi-tions are suitable, convective bands become organized into bands and pressure begins to fall, eventually causing west winds to develop to the south of a developing closed
Figure 3904. Schematic cross-section of a mature hurricane. Used with permission of © UCAR/COMET Program.
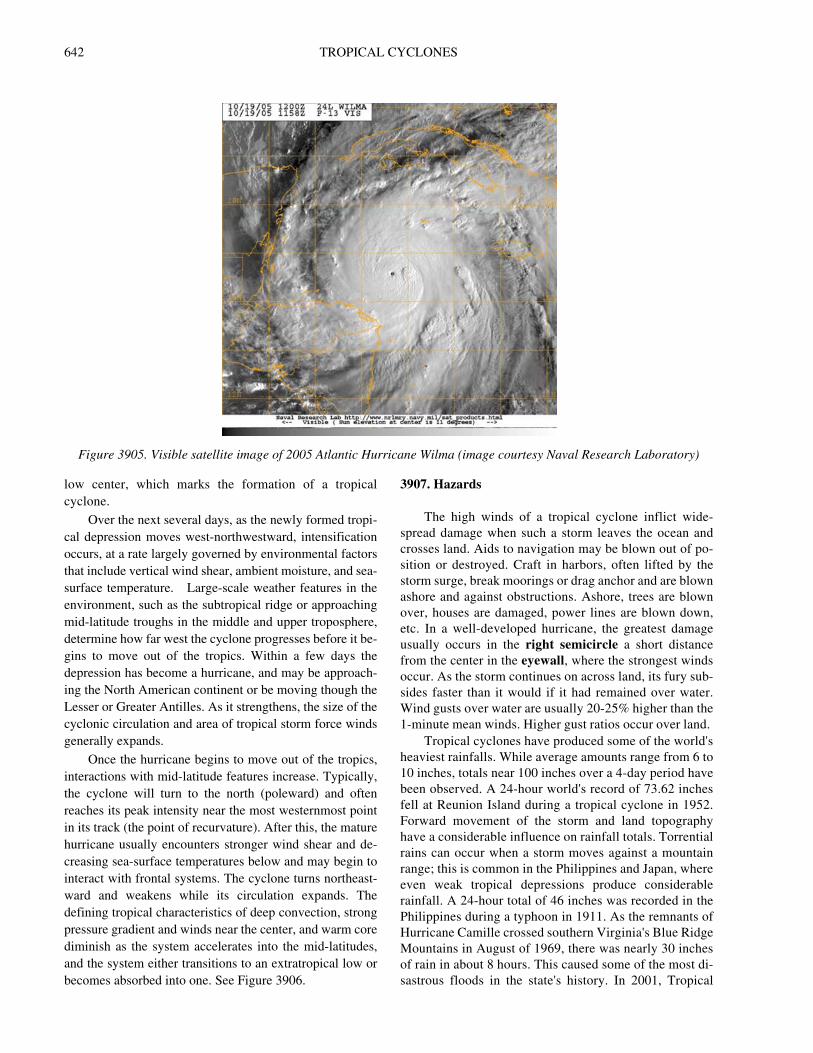
642 TROPICAL CYCLONES
low center, which marks the formation of a tropical cyclone.
Over the next several days, as the newly formed tropi-cal depression moves west-northwestward, intensification occurs, at a rate largely governed by environmental factors that include vertical wind shear, ambient moisture, and sea-surface temperature. Large-scale weather features in the environment, such as the subtropical ridge or approaching mid-latitude troughs in the middle and upper troposphere, determine how far west the cyclone progresses before it be-gins to move out of the tropics. Within a few days the depression has become a hurricane, and may be approach-ing the North American continent or be moving though the Lesser or Greater Antilles. As it strengthens, the size of the cyclonic circulation and area of tropical storm force winds generally expands.
Once the hurricane begins to move out of the tropics, interactions with mid-latitude features increase. Typically, the cyclone will turn to the north (poleward) and often reaches its peak intensity near the most westernmost point in its track (the point of recurvature). After this, the mature hurricane usually encounters stronger wind shear and de-creasing sea-surface temperatures below and may begin tointeract with frontal systems. The cyclone turns northeast-ward and weakens while its circulation expands. The defining tropical characteristics of deep convection, strong pressure gradient and winds near the center, and warm core diminish as the system accelerates into the mid-latitudes, and the system either transitions to an extratropical low or becomes absorbed into one. See Figure 3906.
3907. Hazards
The high winds of a tropical cyclone inflict wide-spread damage when such a storm leaves the ocean and crosses land. Aids to navigation may be blown out of po-sition or destroyed. Craft in harbors, often lifted by the storm surge, break moorings or drag anchor and are blown ashore and against obstructions. Ashore, trees are blown over, houses are damaged, power lines are blown down, etc. In a well-developed hurricane, the greatest damage usually occurs in the right semicircle a short distance from the center in the eyewall, where the strongest winds occur. As the storm continues on across land, its fury sub-sides faster than it would if it had remained over water. Wind gusts over water are usually 20-25% higher than the 1-minute mean winds. Higher gust ratios occur over land.
Tropical cyclones have produced some of the world's heaviest rainfalls. While average amounts range from 6 to 10 inches, totals near 100 inches over a 4-day period have been observed. A 24-hour world's record of 73.62 inches fell at Reunion Island during a tropical cyclone in 1952. Forward movement of the storm and land topography have a considerable influence on rainfall totals. Torrential rains can occur when a storm moves against a mountain range; this is common in the Philippines and Japan, where even weak tropical depressions produce considerable rainfall. A 24-hour total of 46 inches was recorded in the Philippines during a typhoon in 1911. As the remnants of Hurricane Camille crossed southern Virginia's Blue Ridge Mountains in August of 1969, there was nearly 30 inches of rain in about 8 hours. This caused some of the most di-sastrous floods in the state's history. In 2001, Tropical
Figure 3905. Visible satellite image of 2005 Atlantic Hurricane Wilma (image courtesy Naval Research Laboratory)
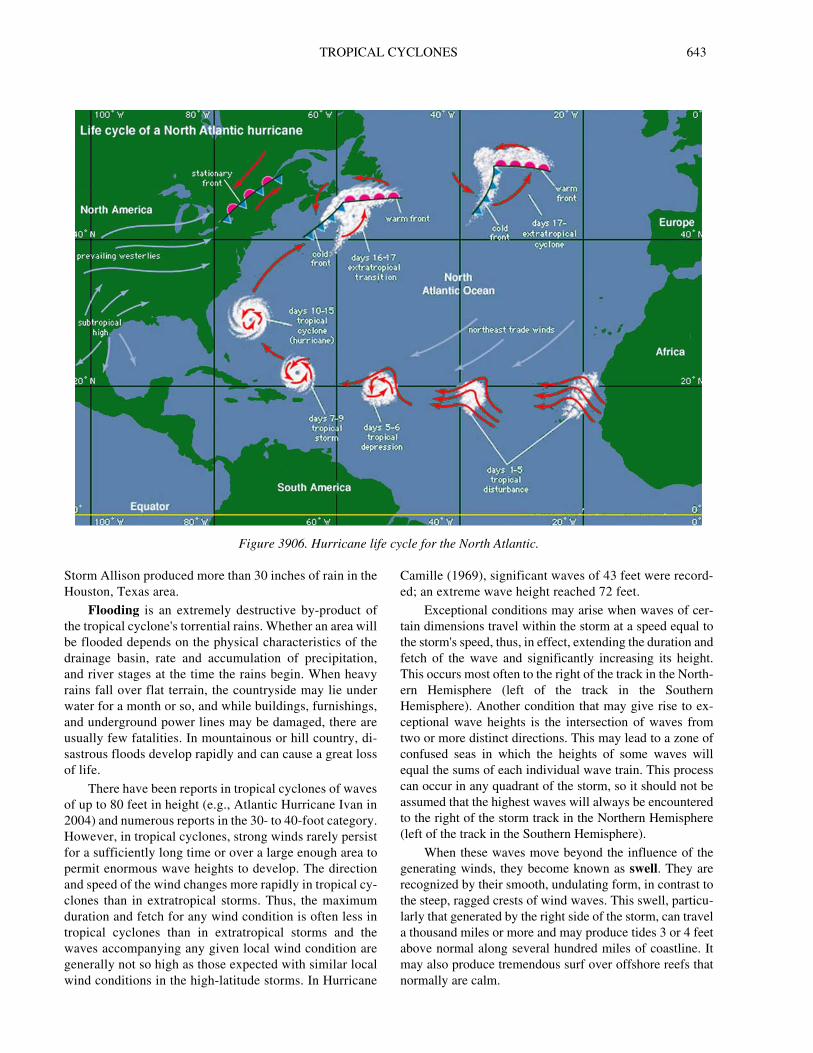
643TROPICAL CYCLONES
Storm Allison produced more than 30 inches of rain in the Houston, Texas area.
Flooding is an extremely destructive by-product of the tropical cyclone's torrential rains. Whether an area will be flooded depends on the physical characteristics of the drainage basin, rate and accumulation of precipitation, and river stages at the time the rains begin. When heavy rains fall over flat terrain, the countryside may lie under water for a month or so, and while buildings, furnishings, and underground power lines may be damaged, there are usually few fatalities. In mountainous or hill country, di-sastrous floods develop rapidly and can cause a great loss of life.
There have been reports in tropical cyclones of waves of up to 80 feet in height (e.g., Atlantic Hurricane Ivan in 2004) and numerous reports in the 30- to 40-foot category. However, in tropical cyclones, strong winds rarely persist for a sufficiently long time or over a large enough area to permit enormous wave heights to develop. The direction and speed of the wind changes more rapidly in tropical cy-clones than in extratropical storms. Thus, the maximum duration and fetch for any wind condition is often less in tropical cyclones than in extratropical storms and the waves accompanying any given local wind condition are generally not so high as those expected with similar local wind conditions in the high-latitude storms. In Hurricane
Camille (1969), significant waves of 43 feet were record-ed; an extreme wave height reached 72 feet.
Exceptional conditions may arise when waves of cer-tain dimensions travel within the storm at a speed equal to the storm's speed, thus, in effect, extending the duration and fetch of the wave and significantly increasing its height. This occurs most often to the right of the track in the North-ern Hemisphere (left of the track in the Southern Hemisphere). Another condition that may give rise to ex-ceptional wave heights is the intersection of waves from two or more distinct directions. This may lead to a zone of confused seas in which the heights of some waves will equal the sums of each individual wave train. This process can occur in any quadrant of the storm, so it should not be assumed that the highest waves will always be encountered to the right of the storm track in the Northern Hemisphere (left of the track in the Southern Hemisphere).
When these waves move beyond the influence of the generating winds, they become known as swell. They are recognized by their smooth, undulating form, in contrast to the steep, ragged crests of wind waves. This swell, particu-larly that generated by the right side of the storm, can travel a thousand miles or more and may produce tides 3 or 4 feet above normal along several hundred miles of coastline. It may also produce tremendous surf over offshore reefs that normally are calm.
Figure 3906. Hurricane life cycle for the North Atlantic.
644 TROPICAL CYCLONES
When a tropical cyclone moves close to a coast, wind often causes a rise in water level along the coast known as storm surge. This surge is usually confined to the right of the track in the Northern Hemisphere (left of the track in the Southern Hemisphere) or to areas with prolonged periods of onshore flow. It most often occurs with the approach of the storm, but in some cases, where a surge moves into a long channel, the effect may be delayed. Occasionally, the great-est rise in water is observed on the opposite side of the track, when northerly winds funnel into a partially land-locked harbor. The surge could be 3 feet or less, or it could be 20 feet or more, depending on the combination of factors involved. Factors that determine the amount of storm surge include the local bathymetry and topography, the intensity of the cyclone, the size of the wind field, and the forward speed and direction of motion of the cyclone. The highest storm surges are caused by a slow-moving tropical cyclone of large diameter because both of these effects result in greater duration of wind in the same direction. The effect is greatest in a partly enclosed body of water, such as the Gulf of Mexico, where the concave coastline does not readily permit the escape of water. It is least on small islands, which present little obstruction to the flow of water.
A hurricane's storm surge has occasionally been de-scribed as a wall of water that moves rapidly toward the coastline. Authenticated cases of such a rapid rise are rare, but regardless, some of the world's greatest natural disasters have occurred as a result of storm surge. In India, such a di-saster occurred in 1876, between Calcutta and Chittagong, and drowned more than 100,000 persons.
There have been many instances of tornadoes occur-ring within the circulation of tropical cyclones. Most of
these have been associated with tropical cyclones of the North Atlantic Ocean and have occurred in the West Indies and along the gulf and Atlantic coasts of the United States. They are usually observed in the forward semicircle or along the advancing periphery of the storm. These torna-does are usually short-lived and less intense than those that occur in the Midwestern United States. In 2004, Hurricane Ivan was associated with 117 tornadoes.
When proceeding along a shore recently visited by a tropical cyclone, a navigator should remember that time is required to restore aids to navigation which have been blown out of position or destroyed. In some instances, the aid may remain but its light, sound apparatus, or radio bea-con may be inoperative. Landmarks may have been damaged or destroyed and in some instances the coastline and hydrography may be changed.
3908. Saffir-Simpson Hurricane Wind Scale
The Saffir-Simpson Hurricane Wind Scale is a 1 to 5 rating based on a hurricane’s sustained winds (see Table 3908). This scale estimates potential shore side property damage and is provided here in Bowditch as a reference for mariners.
Hurricanes reaching Category 3 and higher are consid-ered major hurricanes because of their potential for significant loss of life and property damage. Category 1 and 2 storms are still dangerous and require preventative mea-sures. In the Western Pacific, the term “super typhoon” is used for tropical cyclones with sustained winds exceeding 150 mph.
Category Sustained Winds Description
1 74-95 mph
Very dangerous winds will produce some damage: Well-constructed frame homes could have damage to roof, shingles, vinyl siding and gutters. Large branches of trees will snap and shallowly rooted trees may be toppled. Extensive damage to power lines and poles likely will result in power outages that could last a few to several days.
2 96-110 mph
Extremely dangerous winds will cause extensive damage: Well-constructed frame homes could sustain major roof, shingles, and siding damage. Many shallowly rooted trees will be snapped or uprooted and block numerous roads. Near-total power loss is expected with outages that could last from several days to weeks.
3 111-129 mph
Devastating damage will occur: Well-built framed homes may incur major damage or removal or roof, decking and gable ends. Many trees will be snapped or uprooted, blocking numerous roads. Electricity and water will be unavailable for several days to weeks after the storm passes.
Table 3908. Saffir-Simpson Hurricane Wind Scale.
645TROPICAL CYCLONES
3909. A Tropical Cyclone Encounter from the Mariner’s Perspective
An early indication of the approach of a tropical cy-clone is the presence of a long swell. In the absence of a tropical cyclone, the crests of swell in the deep waters of the Atlantic pass at the rate of perhaps eight per minute. Swell generated by a hurricane is about twice as long, the crests passing at the rate of perhaps four per minute. Swell may be observed several days before arrival of the storm.
When the storm center is 500 to 1,000 miles away, the barometer usually rises a little, and the skies are relatively clear. Cumulus clouds, if present at all, are few in number and their vertical development appears suppressed. The ba-rometer usually appears restless, pumping up and down a few hundredths of an inch.
As the tropical cyclone comes nearer, a cloud sequence begins (Figure 3909) that resembles what is typically asso-ciated with the approach of a warm front in middle latitudes. Snow-white, fibrous “mare's tails” (cirrus) ap-pear when the storm is about 300 to 600 miles away. Usually these seem to converge, more or less, in the direc-tion from which the storm is approaching. This convergence is particularly apparent at about the time of sunrise and sunset.
Shortly after the cirrus appears, but sometimes before, the barometer starts a long, slow fall. At first the fall is so gradual that it only appears to alter somewhat the normal daily cycle (two maxima and two minima in the Tropics). As the rate of fall increases, the daily pattern is completely lost in the more or less steady fall.
The cirrus becomes more confused and tangled, and then gradually gives way to a continuous veil of cirrostra-tus. Below this veil, altostratus forms, and then stratocumulus. These clouds gradually become more dense, and as they do so, the weather becomes unsettled. A fine, mist-like rain begins to fall, interrupted from time to time by rain showers. The barometer has fallen perhaps a tenth of an inch.
As the fall becomes more rapid, the wind increases in
gustiness and its speed becomes greater, reaching perhaps 22 to 40 knots (Beaufort 6-8). On the horizon appears a dark wall of heavy cumulonimbus, called the bar of the storm. This is the heavy bank of clouds comprising the main mass of the cyclone. Portions of this heavy cloud be-come detached from time to time, and drift across the sky, accompanied by rain squalls and wind of increasing speed. Between squalls, the cirrostratus can be seen through breaks in the stratocumulus.
As the bar approaches, the barometer falls more rapidly and wind speed increases. The seas, which have been grad-ually mounting, become tempestuous. Squall lines, one after the other, sweep past in ever increasing number and intensity.
With the arrival of the bar, the day becomes very dark, squalls become virtually continuous, and the barometer falls precipitously, with a rapid increase in wind speed. The center may still be 100 to 200 miles away in a fully devel-oped tropical cyclone. As the center of the storm comes closer, the ever-stronger wind shrieks through the rigging and about the superstructure of the vessel. As the center ap-proaches, rain falls in torrents. The wind fury increases. The seas become mountainous. The tops of huge waves are blown off to mingle with the rain and fill the air with water. Visibility is virtually zero in blinding rain and spray. Even the largest and most seaworthy vessels become virtually un-manageable and may sustain heavy damage. Less sturdy vessels may not survive. Navigation virtually stops as safe-ty of the vessel becomes the only consideration. The awesome fury of this condition can only be experienced. Words are inadequate to describe it.
If the eye of the storm passes over the vessel, the winds suddenly drop to a breeze as the wall of the eye pass-es. The rain stops, and the skies clear sufficiently to permit the sun or stars to shine through holes in the comparatively thin cloud cover. Visibility improves. Mountainous seas ap-proach from all sides in complete confusion. The barometer reaches its lowest point, which may be 1.5 or 2 inches be-low normal in fully developed tropical cyclones. As the wall on the opposite side of the eye arrives, the full fury of
4 130-156 mph
Catastrophic damage will occur: Well-built framed homes can sustain severe damage with loss of most of the roof structure and/or some exterior walls. Most trees will be snapped or uprooted and power poles downed. Fallen trees and power poles will isolate residential areas. Power outages will last weeks to possibly months. Most of the area will be uninhabitable for weeks or months.
5 157 mph or higher
Catastrophic damage will occur: A high percentage of framed houses will be destroyed, with total roof failure and wall collapse. Fallen trees and power poles will isolate residential areas. Power outages will fast for weeks to possibly months. Most of the area will be uninhabitable for weeks or months.
Category Sustained Winds Description
Table 3908. Saffir-Simpson Hurricane Wind Scale.
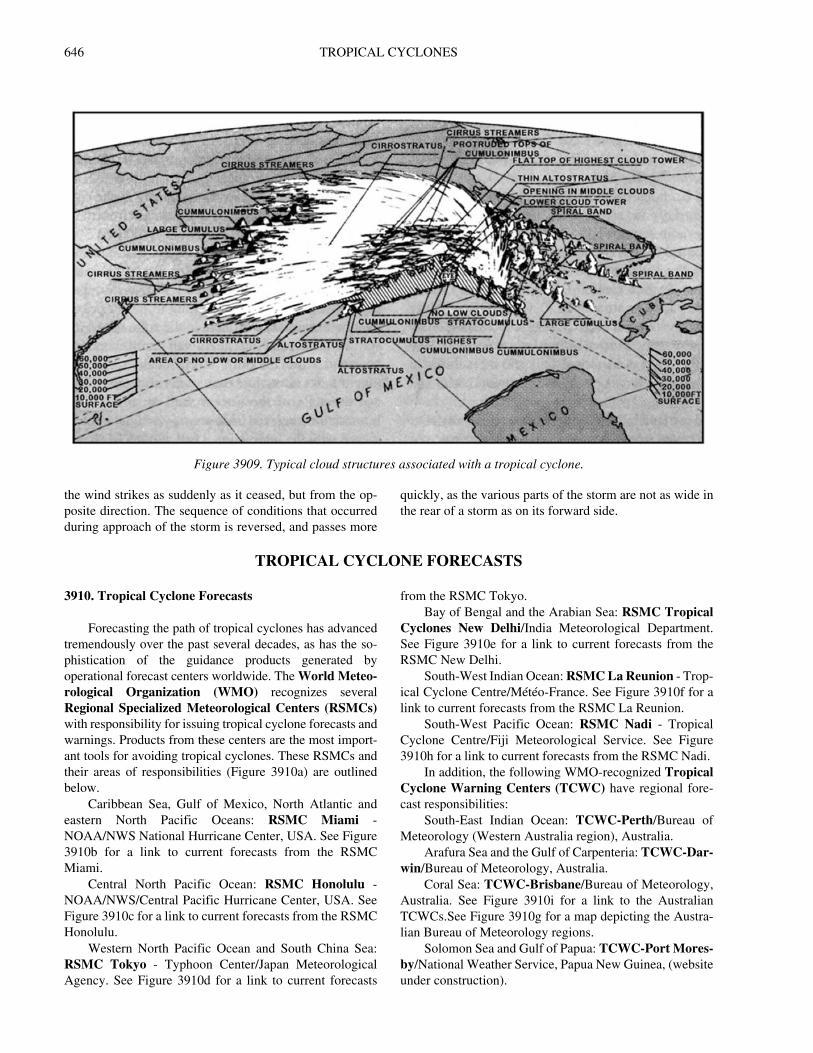
646 TROPICAL CYCLONES
the wind strikes as suddenly as it ceased, but from the op-posite direction. The sequence of conditions that occurred during approach of the storm is reversed, and passes more
quickly, as the various parts of the storm are not as wide in the rear of a storm as on its forward side.
TROPICAL CYCLONE FORECASTS
3910. Tropical Cyclone Forecasts
Forecasting the path of tropical cyclones has advanced tremendously over the past several decades, as has the so-phistication of the guidance products generated by operational forecast centers worldwide. The World Meteo-rological Organization (WMO) recognizes several Regional Specialized Meteorological Centers (RSMCs)with responsibility for issuing tropical cyclone forecasts and warnings. Products from these centers are the most import-ant tools for avoiding tropical cyclones. These RSMCs and their areas of responsibilities (Figure 3910a) are outlined below.
Caribbean Sea, Gulf of Mexico, North Atlantic and eastern North Pacific Oceans: RSMC Miami - NOAA/NWS National Hurricane Center, USA. See Figure 3910b for a link to current forecasts from the RSMC Miami.
Central North Pacific Ocean: RSMC Honolulu - NOAA/NWS/Central Pacific Hurricane Center, USA. See Figure 3910c for a link to current forecasts from the RSMC Honolulu.
Western North Pacific Ocean and South China Sea: RSMC Tokyo - Typhoon Center/Japan Meteorological Agency. See Figure 3910d for a link to current forecasts
from the RSMC Tokyo. Bay of Bengal and the Arabian Sea: RSMC Tropical
Cyclones New Delhi/India Meteorological Department. See Figure 3910e for a link to current forecasts from the RSMC New Delhi.
South-West Indian Ocean: RSMC La Reunion - Trop-ical Cyclone Centre/Météo-France. See Figure 3910f for a link to current forecasts from the RSMC La Reunion.
South-West Pacific Ocean: RSMC Nadi - Tropical Cyclone Centre/Fiji Meteorological Service. See Figure 3910h for a link to current forecasts from the RSMC Nadi.
In addition, the following WMO-recognized Tropical Cyclone Warning Centers (TCWC) have regional fore-cast responsibilities:
South-East Indian Ocean: TCWC-Perth/Bureau of Meteorology (Western Australia region), Australia.
Arafura Sea and the Gulf of Carpenteria: TCWC-Dar-win/Bureau of Meteorology, Australia.
Coral Sea: TCWC-Brisbane/Bureau of Meteorology, Australia. See Figure 3910i for a link to the Australian TCWCs.See Figure 3910g for a map depicting the Austra-lian Bureau of Meteorology regions.
Solomon Sea and Gulf of Papua: TCWC-Port Mores-by/National Weather Service, Papua New Guinea, (website under construction).
Figure 3909. Typical cloud structures associated with a tropical cyclone.
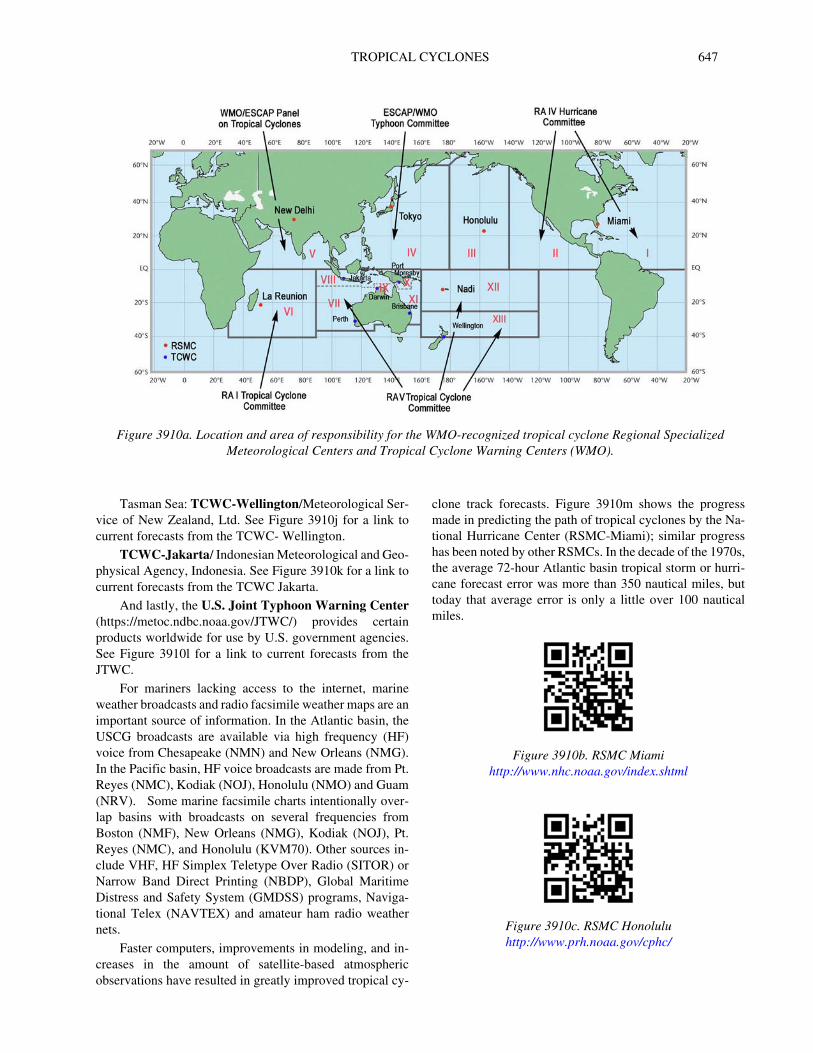
TROPICAL CYCLONES 647
Tasman Sea: TCWC-Wellington/Meteorological Ser-vice of New Zealand, Ltd. See Figure 3910j for a link to current forecasts from the TCWC- Wellington.
TCWC-Jakarta/ Indonesian Meteorological and Geo-physical Agency, Indonesia. See Figure 3910k for a link to current forecasts from the TCWC Jakarta.
And lastly, the U.S. Joint Typhoon Warning Center(https://metoc.ndbc.noaa.gov/JTWC/) provides certain products worldwide for use by U.S. government agencies. See Figure 3910l for a link to current forecasts from the JTWC.
For mariners lacking access to the internet, marine weather broadcasts and radio facsimile weather maps are an important source of information. In the Atlantic basin, the USCG broadcasts are available via high frequency (HF) voice from Chesapeake (NMN) and New Orleans (NMG). In the Pacific basin, HF voice broadcasts are made from Pt. Reyes (NMC), Kodiak (NOJ), Honolulu (NMO) and Guam (NRV). Some marine facsimile charts intentionally over-lap basins with broadcasts on several frequencies from Boston (NMF), New Orleans (NMG), Kodiak (NOJ), Pt. Reyes (NMC), and Honolulu (KVM70). Other sources in-clude VHF, HF Simplex Teletype Over Radio (SITOR) or Narrow Band Direct Printing (NBDP), Global Maritime Distress and Safety System (GMDSS) programs, Naviga-tional Telex (NAVTEX) and amateur ham radio weather nets.
Faster computers, improvements in modeling, and in-creases in the amount of satellite-based atmospheric observations have resulted in greatly improved tropical cy-
clone track forecasts. Figure 3910m shows the progress made in predicting the path of tropical cyclones by the Na-tional Hurricane Center (RSMC-Miami); similar progress has been noted by other RSMCs. In the decade of the 1970s, the average 72-hour Atlantic basin tropical storm or hurri-cane forecast error was more than 350 nautical miles, but today that average error is only a little over 100 nautical miles.
Figure 3910a. Location and area of responsibility for the WMO-recognized tropical cyclone Regional Specialized Meteorological Centers and Tropical Cyclone Warning Centers (WMO).
Figure 3910b. RSMC Miami http://www.nhc.noaa.gov/index.shtml
Figure 3910c. RSMC Honolulu http://www.prh.noaa.gov/cphc/
648 TROPICAL CYCLONES
Figure 3910d. RSMC Tokyo http://www.jma.go.jp/en/typh/
Figure 3910e. RSMC Tropical Cyclones New Delhi/India http://www.imd.gov.in/
Figure 3910f. RSMC La Reunion http://www.meteofrance.re/cyclone/activite-cyclonique-en-
cours
Figure 3910g. Australian Bureau of Meteorology regions.
Figure 3910h. RSMC Nadi http://www.met.gov.fj/current_warnings.php
Figure 3910i. TCWC Australia Bureau of Meteorology http://www.bom.gov.au/weather/cyclone/?ref=ftr
Figure 3910j. TCWC Wellington http://www.metservice.co.nz/forecasts/severe_weather.asp
Figure 3910k. TCWC Jakarta http://www.bmkg.go.id/
Figure 3910l. U.S. Joint Typhoon Warning Center. https://metoc.ndbc.noaa.gov/JTWC/
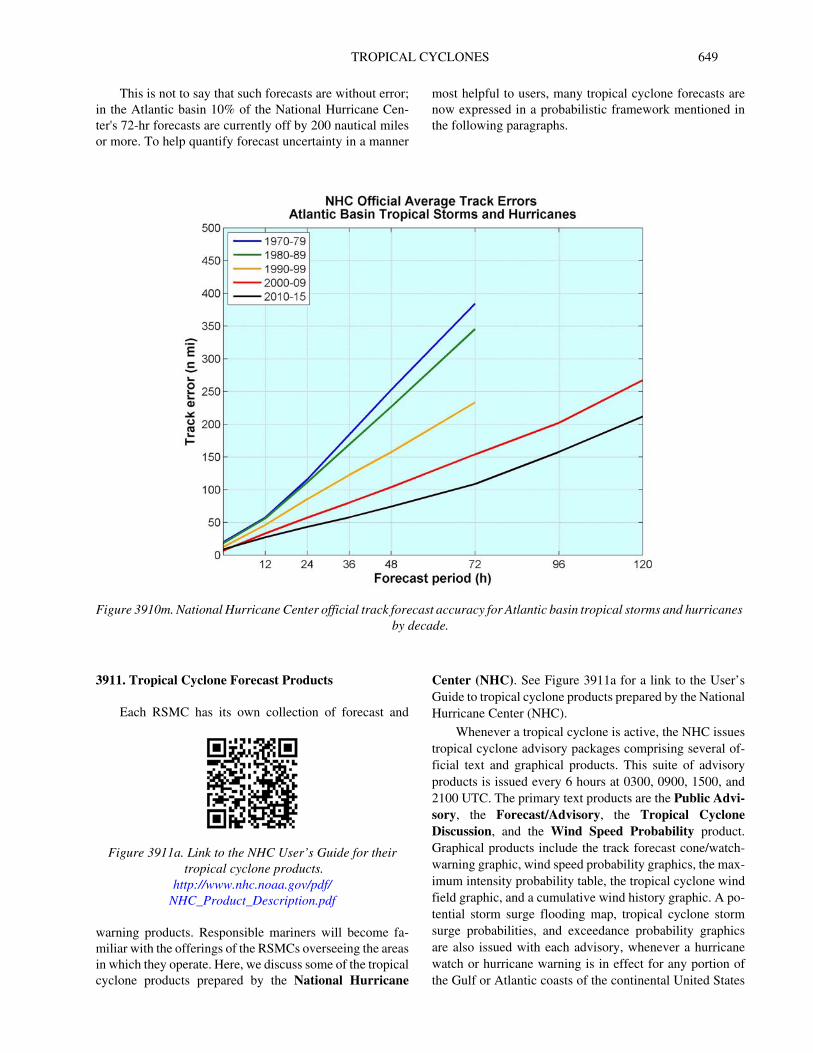
TROPICAL CYCLONES 649
This is not to say that such forecasts are without error; in the Atlantic basin 10% of the National Hurricane Cen-ter's 72-hr forecasts are currently off by 200 nautical miles or more. To help quantify forecast uncertainty in a manner
most helpful to users, many tropical cyclone forecasts are now expressed in a probabilistic framework mentioned in the following paragraphs.
3911. Tropical Cyclone Forecast Products
Each RSMC has its own collection of forecast and
warning products. Responsible mariners will become fa-miliar with the offerings of the RSMCs overseeing the areas in which they operate. Here, we discuss some of the tropical cyclone products prepared by the National Hurricane
Center (NHC). See Figure 3911a for a link to the User’s Guide to tropical cyclone products prepared by the National Hurricane Center (NHC).
Whenever a tropical cyclone is active, the NHC issues tropical cyclone advisory packages comprising several of-ficial text and graphical products. This suite of advisory products is issued every 6 hours at 0300, 0900, 1500, and 2100 UTC. The primary text products are the Public Advi-sory, the Forecast/Advisory, the Tropical Cyclone Discussion, and the Wind Speed Probability product. Graphical products include the track forecast cone/watch-warning graphic, wind speed probability graphics, the max-imum intensity probability table, the tropical cyclone wind field graphic, and a cumulative wind history graphic. A po-tential storm surge flooding map, tropical cyclone storm surge probabilities, and exceedance probability graphics are also issued with each advisory, whenever a hurricane watch or hurricane warning is in effect for any portion of the Gulf or Atlantic coasts of the continental United States
Figure 3910m. National Hurricane Center official track forecast accuracy for Atlantic basin tropical storms and hurricanes by decade.
Figure 3911a. Link to the NHC User’s Guide for their tropical cyclone products.
http://www.nhc.noaa.gov/pdf/NHC_Product_Description.pdf
650 TROPICAL CYCLONES
and on a case by case basis for tropical storm watches and warnings. When a tropical cyclone dissipates, advisories are discontinued. If a tropical cyclone becomes a post-trop-ical cyclone, NHC may continue issuing advisories if necessary to protect life and property.
The Tropical Weather Outlook discusses significant areas of disturbed weather and their potential for develop-ment into a tropical cyclone during the next 5 days, including a categorical forecast of the probability of tropi-cal cyclone formation during the first 48 hours and during the entire 5-day forecast period. The 48 hour and 5-day probabilities of formation for each disturbance are given to the nearest 10% and expressed in terms of one of the fol-lowing categories: low probability of development (0-30%), medium probability (40-60%), and high probability of development (70-100%). The Outlook also includes a general description of locations of any active cyclones during the first 24 hours of their existence. Tropical Weath-er Outlooks are issued every six hours from 1 June - 30 November for the Atlantic basin and from 15 May-30 No-vember for the eastern North Pacific basin at 0000, 0600, 1200, and 1800 UTC.
The Tropical Cyclone Public Advisory is the primary tropical cyclone information product intended for a general audience. It provides critical tropical cyclone watch, warn-ing, and forecast information for the protection of life and property. The Public Advisory has five sections:
1) This section contains the cyclone position in latitude and longitude coordinates, its distance from a well-known reference point, the maximum sustained winds, the cy-clone's current direction and speed of motion, and the estimated or measured minimum central pressure.
2) A summary of all current coastal watches and warn-ings for the cyclone with recent changes to the watches and warnings highlighted at the top.
3) A discussion of the cyclone's current characteristics, including location, motion, intensity, and pressure and a general description of the predicted track and intensity of the cyclone over the next 24 to 48 hours. Any pertinent weather observations will also be included in this section.
4) A section that includes information on hazards to land such as storm surge/tide, wind, rainfall, tornadoes, and rip currents associated with the cyclone.
5) A section that states the time of the next advisory issuance.
Public Advisories are part of the suite of products is-sued for active cyclones every six hours at 0300, 0900, 1500, and 2100 UTC. When coastal watches or warnings are in effect, Intermediate Public Advisories are issued at 3-hour intervals between the regular Public Advisories. Spe-cial Public Advisories may be issued at any time to advise of an unexpected significant change in the cyclone or when watches or warnings for the United States are to be issued.
The Tropical Cyclone Forecast/Advisory (formerly known as the Marine Advisory) contains current and fore-casted storm information. It contains a list of all current
coastal watches and warnings, cyclone position, intensity, and direction and speed of motion. It also includes the cur-rent maximum radial extent of 12-ft seas, as well as the maximum radial extent of winds of 34, 50, and 64 kt in each of four quadrants around the storm. The Forecast/Advisorycontains quantitative forecast information on the track and intensity of the cyclone valid 12, 24, 36, 48, 72, 96, and 120 hours from the forecast's nominal initial time, with size in-formation forecast out to 72 hours.
The Forecast/Advisory also contains the predicted sta-tus of the cyclone for each forecast time. This status may include any of the following: inland, dissipating, dissipated, or post tropical advisories. An extratropical cyclone is a cyclone of any intensity for which the primary energy source results from the temperature contrast between warm and cold air masses. Forecast/Advisories are issued for ac-tive cyclones every six hours at 0300, 0900, 1500, and 2100 UTC. Special Forecast/Advisories may be issued at any time to advise of an unexpected significant change in the cyclone or when coastal watches or warnings are to be issued.
The Tropical Cyclone Discussion describes the ratio-nale for the forecaster's analysis and forecast of a tropical cyclone. It will typically discuss the observations justifying the analyzed intensity of the cyclone, a description of the environmental factors expected to influence the cyclone's future track and intensity, and a description of the numeri-cal guidance models. It may also describe the forecaster's degree of confidence in the official forecast, discuss possi-ble alternate scenarios, and highlight unusual hazards. The product also includes a table of forecast positions and inten-sities in knots and miles per hour out to 120 hours. This table also indicates the forecast status of the cyclone. Trop-ical Cyclone Discussions are issued for active cyclones every six hours at 0300, 0900, 1500, and 2100 UTC. Spe-cial Discussions may be issued at any time to advise of an unexpected significant change in the cyclone or when coastal watches or warnings are to be issued.
The Tropical Cyclone Surface Wind Speed Probabilityproduct provides the likelihood (expressed as a percentage) of sustained (1-min average) winds meeting or exceeding specific thresholds at particular locations. This product is available in text and graphical formats (example shown in Figure 3911b). These probabilities are based on the track, intensity, and wind structure (size) forecasts from the Na-tional Hurricane Center and their historical error characteristics. In addition, they consider the amount of agreement or disagreement among the primary tropical cy-clone track models.
Location-specific information is given in the form of probabilities of sustained winds occurring at or above the thresholds of 34, 50 and 64 kts over specific periods of time as discussed below. These probabilities are provided for coastal and inland cities as well as for offshore locations (e.g., buoys). These probabilities are based on the track, in-tensity, and wind structure (size) forecasts from the
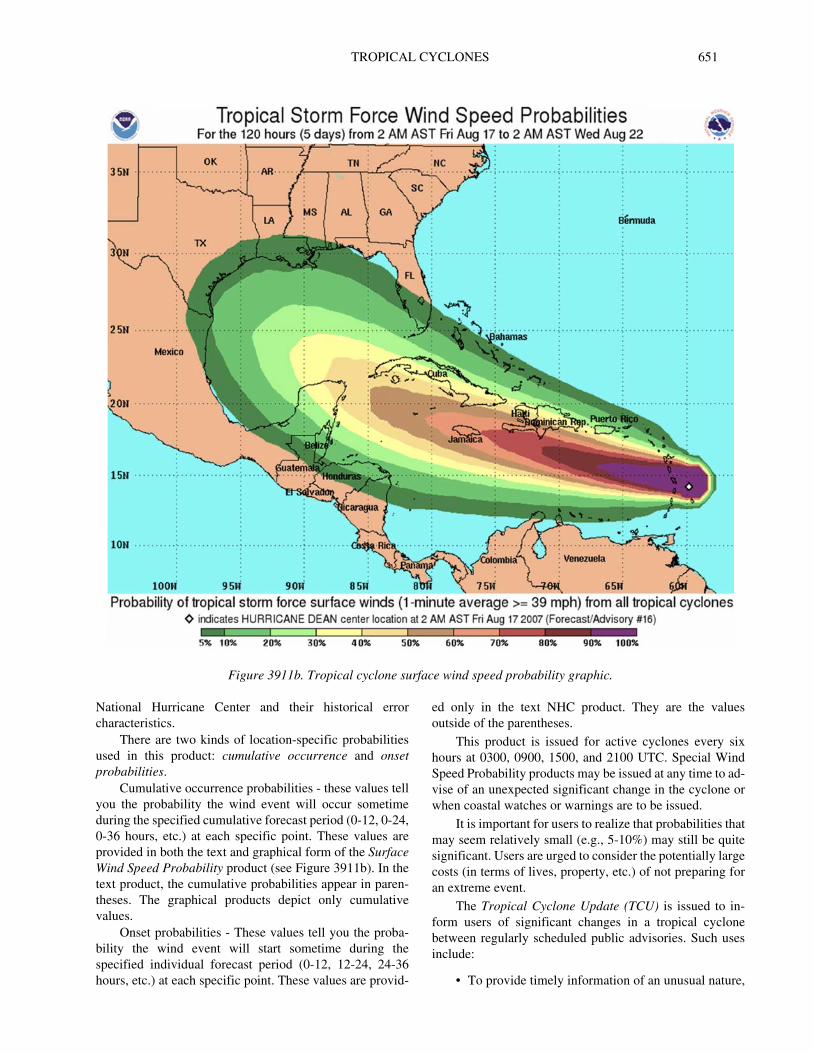
TROPICAL CYCLONES 651
National Hurricane Center and their historical error characteristics.
There are two kinds of location-specific probabilities used in this product: cumulative occurrence and onset probabilities.
Cumulative occurrence probabilities - these values tell you the probability the wind event will occur sometime during the specified cumulative forecast period (0-12, 0-24, 0-36 hours, etc.) at each specific point. These values are provided in both the text and graphical form of the Surface Wind Speed Probability product (see Figure 3911b). In the text product, the cumulative probabilities appear in paren-theses. The graphical products depict only cumulative values.
Onset probabilities - These values tell you the proba-bility the wind event will start sometime during the specified individual forecast period (0-12, 12-24, 24-36 hours, etc.) at each specific point. These values are provid-
ed only in the text NHC product. They are the values outside of the parentheses.
This product is issued for active cyclones every six hours at 0300, 0900, 1500, and 2100 UTC. Special Wind Speed Probability products may be issued at any time to ad-vise of an unexpected significant change in the cyclone or when coastal watches or warnings are to be issued.
It is important for users to realize that probabilities that may seem relatively small (e.g., 5-10%) may still be quite significant. Users are urged to consider the potentially large costs (in terms of lives, property, etc.) of not preparing for an extreme event.
The Tropical Cyclone Update (TCU) is issued to in-form users of significant changes in a tropical cyclone between regularly scheduled public advisories. Such uses include:
• To provide timely information of an unusual nature,
Figure 3911b. Tropical cyclone surface wind speed probability graphic.
652 TROPICAL CYCLONES
such as the time and location of landfall, or to an-nounce an expected change in intensity that results in an upgrade or downgrade of status (e.g., from a trop-ical storm to a hurricane).
• To provide a continuous flow of informationregarding the center location of a tropical cyclonewhen watches or warnings are in effect and thecenter can be easily tracked with land-based radar.
• To provide advance notice that significant changesto storm information will be conveyed shortly, eitherthrough a subsequent TCU or through a SpecialAdvisory.
• To announce changes to international watches orwarnings made by other countries, or to cancel U.S.watches or warnings.
• To issue a U.S. watch or warning, but only if theTCU precedes a special advisory that will containthe same watch/warning information, and indicatesthe special advisory will be issued shortly.
When a TCU is issued and any storm summary infor-mation has changed from the previous Public Advisory(e.g., upgrade from tropical storm to hurricane), a storm summary section identical in format to that found in the Public Advisory will also be included. TCUs issued to pro-vide updated center position information when watches/warnings are in effect are issued in between sched-uled TCUs near the beginning of each hour. All other TCUs are issued on an event-driven basis.
In addition to the text products described above, the National Hurricane Center website (see Figure 3911c for link) also contains a number of tropical cyclone graphical products. The most important of these are described below.
The Tropical Cyclone Track Forecast Cone and Watch/Warning Graphic (Figure 3911d) depicts the most recent NHC track forecast of the center of a tropical cyclone along with an approximate representation of associated coastal areas under a hurricane warning (red), hurricane watch (pink), tropical storm warning (blue) and tropical storm watch (yellow). The orange circle indicates the cur-rent position of the center of the tropical cyclone. The black dots show the NHC forecast position of the center at the times indicated. The letter inside the dot indicates the fore-cast strength of the cyclone category: (D)epression,
(S)torm, (H)urricane, (M)ajor hurricane, or remnant (L)ow. Systems forecast to be post-tropical are indicated by white dots with black letters indicating intensity using the thresh-olds given above. For example, a post-tropical system forecast to have winds of 65 kts would be depicted by a black H inside a white dot, even though it is not a hurricane.
The cone represents the probable track of the center of a tropical cyclone, and is formed by enclosing the area swept out by a set of circles (not shown) along the forecast track (at 12, 24, 36 hours, etc.). The size of each circle is set so that two-thirds of historical official forecast errors over a 5-year sample fall within the circle.
The 5-day Graphical Tropical Weather Outlook (Fig-ure 3911e) provides formation potential for individual disturbances during the next 5-day period. The areas en-closed on the graph represent the potential formation area during the forecast period. The areas are color-coded based on the potential for tropical cyclone formation during the next 5-days. Areas in yellow indicate a low probability of development (0-30%), orange indicates medium likelihood (40-60%), and red indicates a high likelihood of develop-ment (70-100%). The location of existing disturbances is indicated by an X. If the formation potential of an existing disturbance does not include the area in which the distur-bance is currently located, an arrow will connect the current location of the disturbance to its area of potential formation. Areas without an X or connected by an arrow to an X indi-cate that the disturbance does not currently exist, but is expected to develop during the 5-day period. On the NHC website the graphic is interactive; users can mouse over dis-turbances in the graphic and pop-up windows will appear with the text Outlook discussion for that disturbance. Click-ing on a disturbance will take the user to a graphic that shows only that disturbance. Active tropical cyclones are not depicted on this graphic. Graphical Tropical Weather Outlooks are issued every six hours from 1 June-30 No-vember for the Atlantic basin and from 15 May-30 November for the eastern North Pacific basin, at 0000, 0600, 1200, and 1800 UTC. The Graphical Tropical Weath-er Outlook is also updated whenever a Special Tropical Weather Outlook is issued.
3912. Marine Forecast Products
The Tropical Cyclone Danger Graphic is an NHC product traditionally based on the “Mariner's 1-2-3 rule”. The graphics (one for the North Atlantic and one for the eastern North Pacific) depict the danger area associated with tropical cyclones within the area from the equator to 60°N between 0° and 100°W, including the Pacific east of 100°W, and from the equator to 40°N between 80°W and 175°W, including the Gulf of Mexico and Western Caribbean. These graphics are posted on the NHC webpage, and are also transmitted by radio fax via Boston, New Orleans, and Pt. Reyes transmitters.
The tropical cyclone danger graphic is intended to de-
Figure 3911c. National Hurricane Center (NHC) website. http://www.nhc.noaa.gov
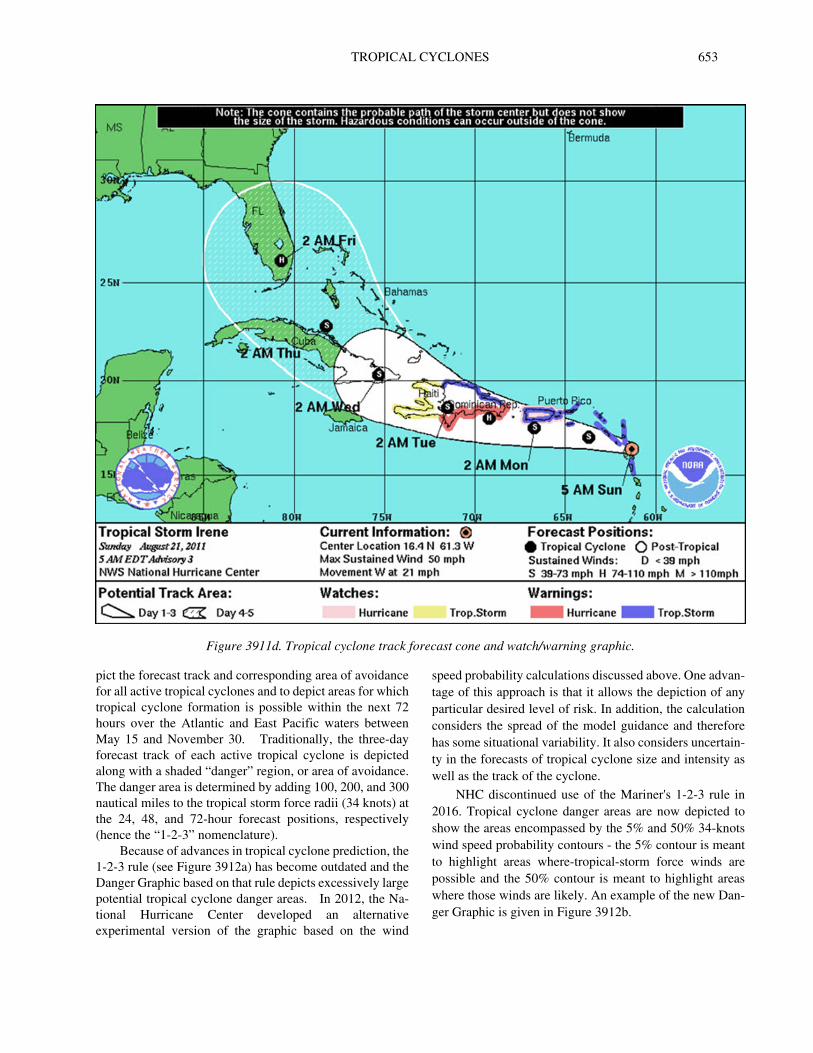
TROPICAL CYCLONES 653
pict the forecast track and corresponding area of avoidance for all active tropical cyclones and to depict areas for which tropical cyclone formation is possible within the next 72 hours over the Atlantic and East Pacific waters between May 15 and November 30. Traditionally, the three-day forecast track of each active tropical cyclone is depicted along with a shaded “danger” region, or area of avoidance. The danger area is determined by adding 100, 200, and 300 nautical miles to the tropical storm force radii (34 knots) at the 24, 48, and 72-hour forecast positions, respectively (hence the “1-2-3” nomenclature).
Because of advances in tropical cyclone prediction, the 1-2-3 rule (see Figure 3912a) has become outdated and the Danger Graphic based on that rule depicts excessively large potential tropical cyclone danger areas. In 2012, the Na-tional Hurricane Center developed an alternative experimental version of the graphic based on the wind
speed probability calculations discussed above. One advan-tage of this approach is that it allows the depiction of any particular desired level of risk. In addition, the calculation considers the spread of the model guidance and therefore has some situational variability. It also considers uncertain-ty in the forecasts of tropical cyclone size and intensity as well as the track of the cyclone.
NHC discontinued use of the Mariner's 1-2-3 rule in 2016. Tropical cyclone danger areas are now depicted to show the areas encompassed by the 5% and 50% 34-knots wind speed probability contours - the 5% contour is meant to highlight areas where-tropical-storm force winds are possible and the 50% contour is meant to highlight areas where those winds are likely. An example of the new Dan-ger Graphic is given in Figure 3912b.
Figure 3911d. Tropical cyclone track forecast cone and watch/warning graphic.
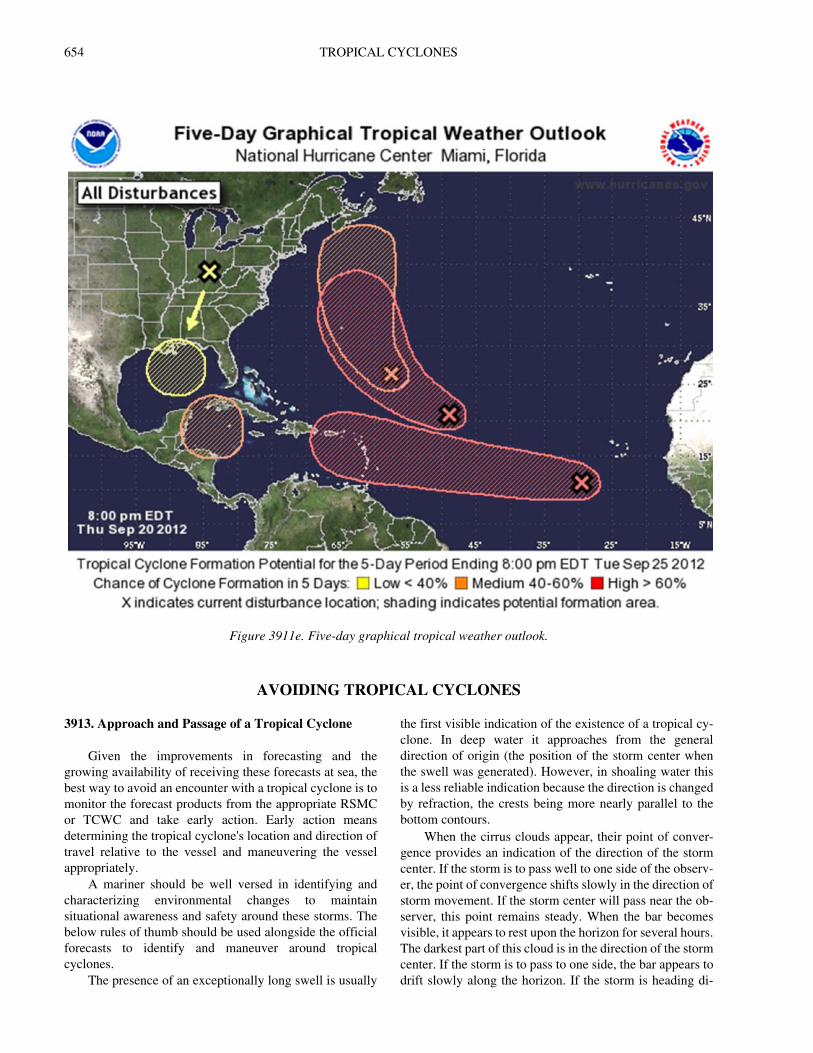
654 TROPICAL CYCLONES
AVOIDING TROPICAL CYCLONES
3913. Approach and Passage of a Tropical Cyclone
Given the improvements in forecasting and the growing availability of receiving these forecasts at sea, the best way to avoid an encounter with a tropical cyclone is to monitor the forecast products from the appropriate RSMC or TCWC and take early action. Early action means determining the tropical cyclone's location and direction of travel relative to the vessel and maneuvering the vessel appropriately.
A mariner should be well versed in identifying and characterizing environmental changes to maintain situational awareness and safety around these storms. The below rules of thumb should be used alongside the official forecasts to identify and maneuver around tropical cyclones.
The presence of an exceptionally long swell is usually
the first visible indication of the existence of a tropical cy-clone. In deep water it approaches from the general direction of origin (the position of the storm center when the swell was generated). However, in shoaling water this is a less reliable indication because the direction is changed by refraction, the crests being more nearly parallel to the bottom contours.
When the cirrus clouds appear, their point of conver-gence provides an indication of the direction of the storm center. If the storm is to pass well to one side of the observ-er, the point of convergence shifts slowly in the direction of storm movement. If the storm center will pass near the ob-server, this point remains steady. When the bar becomes visible, it appears to rest upon the horizon for several hours. The darkest part of this cloud is in the direction of the storm center. If the storm is to pass to one side, the bar appears to drift slowly along the horizon. If the storm is heading di-
Figure 3911e. Five-day graphical tropical weather outlook.
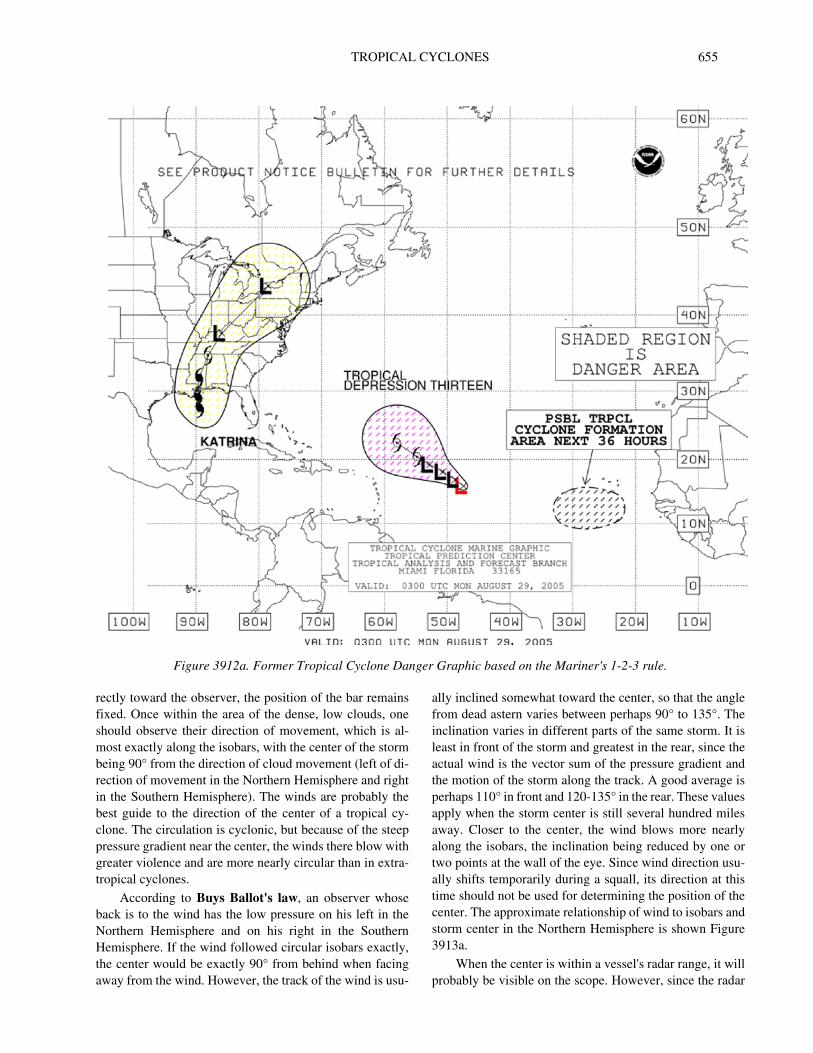
TROPICAL CYCLONES 655
rectly toward the observer, the position of the bar remains fixed. Once within the area of the dense, low clouds, one should observe their direction of movement, which is al-most exactly along the isobars, with the center of the storm being 90° from the direction of cloud movement (left of di-rection of movement in the Northern Hemisphere and right in the Southern Hemisphere). The winds are probably the best guide to the direction of the center of a tropical cy-clone. The circulation is cyclonic, but because of the steep pressure gradient near the center, the winds there blow with greater violence and are more nearly circular than in extra-tropical cyclones.
According to Buys Ballot's law, an observer whose back is to the wind has the low pressure on his left in the Northern Hemisphere and on his right in the Southern Hemisphere. If the wind followed circular isobars exactly, the center would be exactly 90° from behind when facing away from the wind. However, the track of the wind is usu-
ally inclined somewhat toward the center, so that the angle from dead astern varies between perhaps 90° to 135°. The inclination varies in different parts of the same storm. It is least in front of the storm and greatest in the rear, since the actual wind is the vector sum of the pressure gradient and the motion of the storm along the track. A good average is perhaps 110° in front and 120-135° in the rear. These values apply when the storm center is still several hundred miles away. Closer to the center, the wind blows more nearly along the isobars, the inclination being reduced by one or two points at the wall of the eye. Since wind direction usu-ally shifts temporarily during a squall, its direction at this time should not be used for determining the position of the center. The approximate relationship of wind to isobars and storm center in the Northern Hemisphere is shown Figure 3913a.
When the center is within a vessel's radar range, it will probably be visible on the scope. However, since the radar
Figure 3912a. Former Tropical Cyclone Danger Graphic based on the Mariner's 1-2-3 rule.
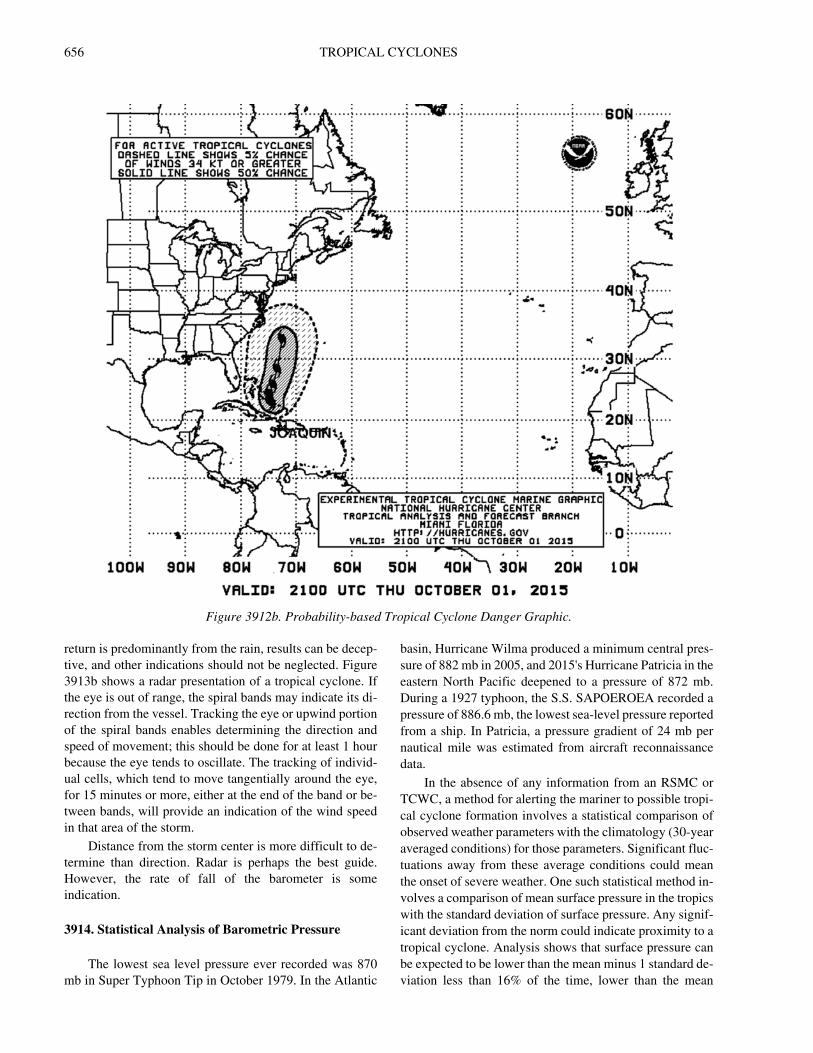
656 TROPICAL CYCLONES
return is predominantly from the rain, results can be decep-tive, and other indications should not be neglected. Figure 3913b shows a radar presentation of a tropical cyclone. If the eye is out of range, the spiral bands may indicate its di-rection from the vessel. Tracking the eye or upwind portion of the spiral bands enables determining the direction and speed of movement; this should be done for at least 1 hour because the eye tends to oscillate. The tracking of individ-ual cells, which tend to move tangentially around the eye, for 15 minutes or more, either at the end of the band or be-tween bands, will provide an indication of the wind speed in that area of the storm.
Distance from the storm center is more difficult to de-termine than direction. Radar is perhaps the best guide. However, the rate of fall of the barometer is some indication.
3914. Statistical Analysis of Barometric Pressure
The lowest sea level pressure ever recorded was 870 mb in Super Typhoon Tip in October 1979. In the Atlantic
basin, Hurricane Wilma produced a minimum central pres-sure of 882 mb in 2005, and 2015's Hurricane Patricia in the eastern North Pacific deepened to a pressure of 872 mb. During a 1927 typhoon, the S.S. SAPOEROEA recorded a pressure of 886.6 mb, the lowest sea-level pressure reported from a ship. In Patricia, a pressure gradient of 24 mb per nautical mile was estimated from aircraft reconnaissance data.
In the absence of any information from an RSMC or TCWC, a method for alerting the mariner to possible tropi-cal cyclone formation involves a statistical comparison of observed weather parameters with the climatology (30-year averaged conditions) for those parameters. Significant fluc-tuations away from these average conditions could mean the onset of severe weather. One such statistical method in-volves a comparison of mean surface pressure in the tropics with the standard deviation of surface pressure. Any signif-icant deviation from the norm could indicate proximity to a tropical cyclone. Analysis shows that surface pressure can be expected to be lower than the mean minus 1 standard de-viation less than 16% of the time, lower than the mean
Figure 3912b. Probability-based Tropical Cyclone Danger Graphic.
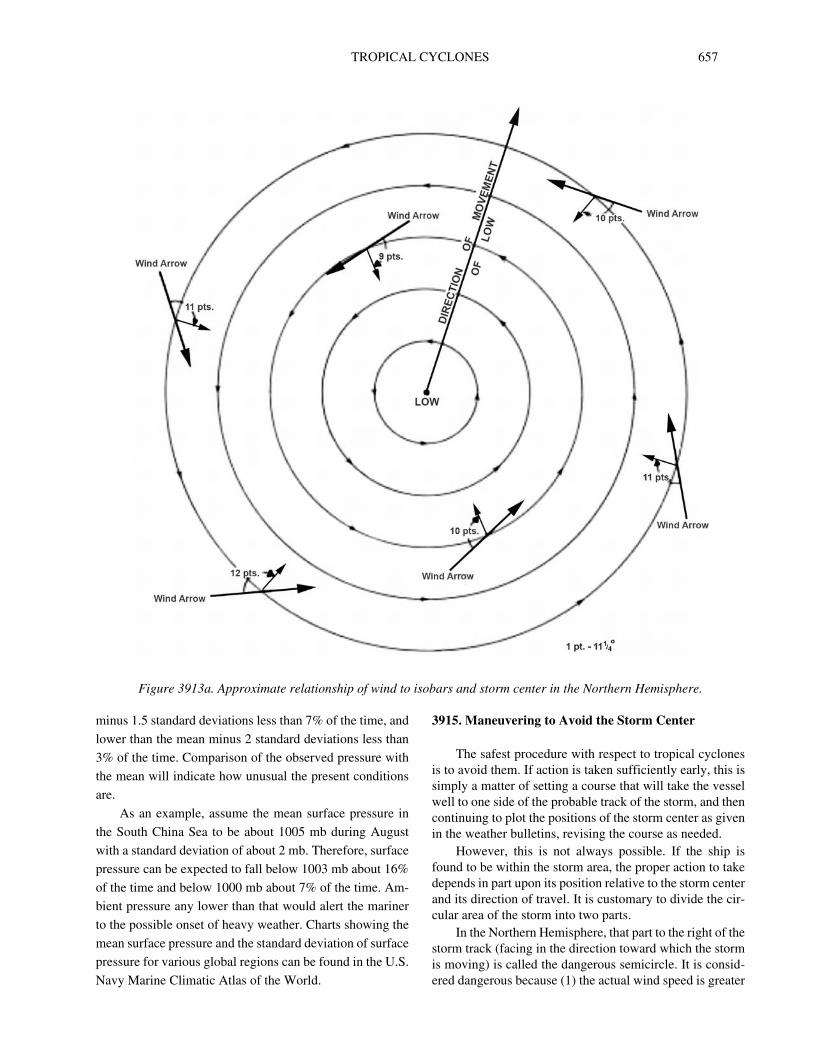
TROPICAL CYCLONES 657
minus 1.5 standard deviations less than 7% of the time, and
lower than the mean minus 2 standard deviations less than
3% of the time. Comparison of the observed pressure with
the mean will indicate how unusual the present conditions
are.
As an example, assume the mean surface pressure in
the South China Sea to be about 1005 mb during August
with a standard deviation of about 2 mb. Therefore, surface
pressure can be expected to fall below 1003 mb about 16%
of the time and below 1000 mb about 7% of the time. Am-
bient pressure any lower than that would alert the mariner
to the possible onset of heavy weather. Charts showing the
mean surface pressure and the standard deviation of surface
pressure for various global regions can be found in the U.S.
Navy Marine Climatic Atlas of the World.
3915. Maneuvering to Avoid the Storm Center
The safest procedure with respect to tropical cyclones is to avoid them. If action is taken sufficiently early, this is simply a matter of setting a course that will take the vessel well to one side of the probable track of the storm, and then continuing to plot the positions of the storm center as given in the weather bulletins, revising the course as needed.
However, this is not always possible. If the ship is found to be within the storm area, the proper action to take depends in part upon its position relative to the storm center and its direction of travel. It is customary to divide the cir-cular area of the storm into two parts.
In the Northern Hemisphere, that part to the right of the storm track (facing in the direction toward which the storm is moving) is called the dangerous semicircle. It is consid-ered dangerous because (1) the actual wind speed is greater
Figure 3913a. Approximate relationship of wind to isobars and storm center in the Northern Hemisphere.
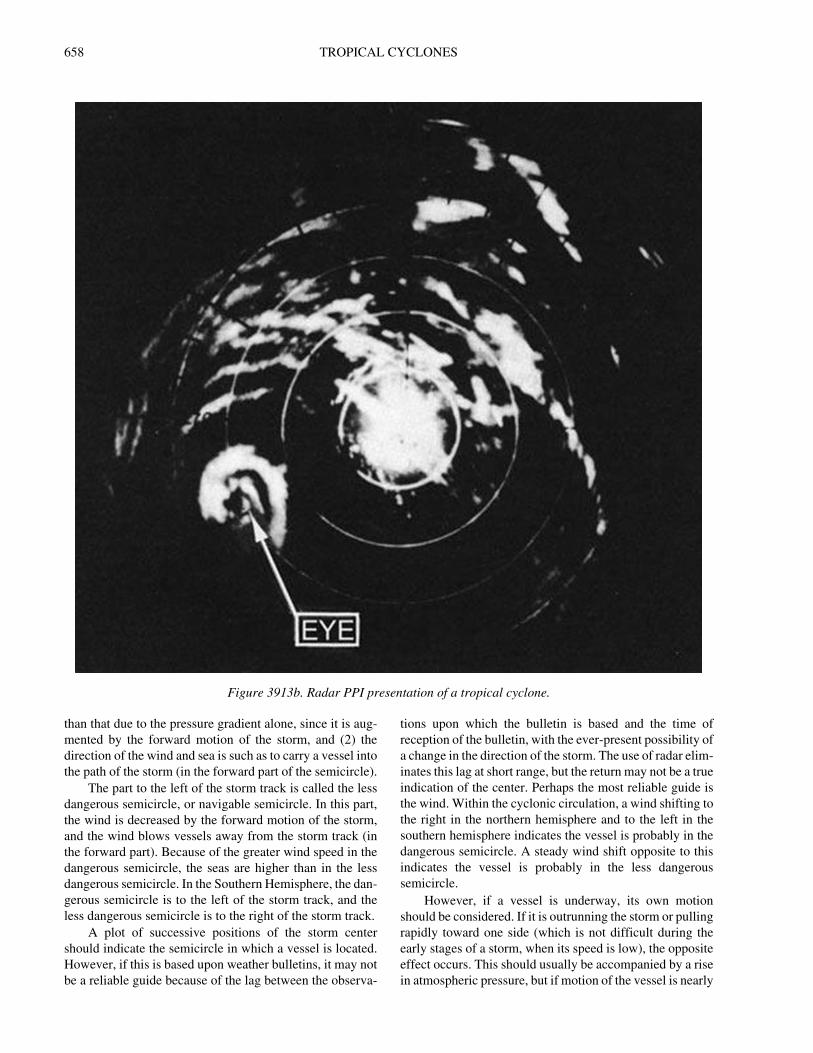
658 TROPICAL CYCLONES
than that due to the pressure gradient alone, since it is aug-mented by the forward motion of the storm, and (2) the direction of the wind and sea is such as to carry a vessel into the path of the storm (in the forward part of the semicircle).
The part to the left of the storm track is called the less dangerous semicircle, or navigable semicircle. In this part, the wind is decreased by the forward motion of the storm, and the wind blows vessels away from the storm track (in the forward part). Because of the greater wind speed in the dangerous semicircle, the seas are higher than in the less dangerous semicircle. In the Southern Hemisphere, the dan-gerous semicircle is to the left of the storm track, and the less dangerous semicircle is to the right of the storm track.
A plot of successive positions of the storm center should indicate the semicircle in which a vessel is located. However, if this is based upon weather bulletins, it may not be a reliable guide because of the lag between the observa-
tions upon which the bulletin is based and the time of reception of the bulletin, with the ever-present possibility of a change in the direction of the storm. The use of radar elim-inates this lag at short range, but the return may not be a true indication of the center. Perhaps the most reliable guide is the wind. Within the cyclonic circulation, a wind shifting to the right in the northern hemisphere and to the left in the southern hemisphere indicates the vessel is probably in the dangerous semicircle. A steady wind shift opposite to this indicates the vessel is probably in the less dangerous semicircle.
However, if a vessel is underway, its own motion should be considered. If it is outrunning the storm or pulling rapidly toward one side (which is not difficult during the early stages of a storm, when its speed is low), the opposite effect occurs. This should usually be accompanied by a rise in atmospheric pressure, but if motion of the vessel is nearly
Figure 3913b. Radar PPI presentation of a tropical cyclone.
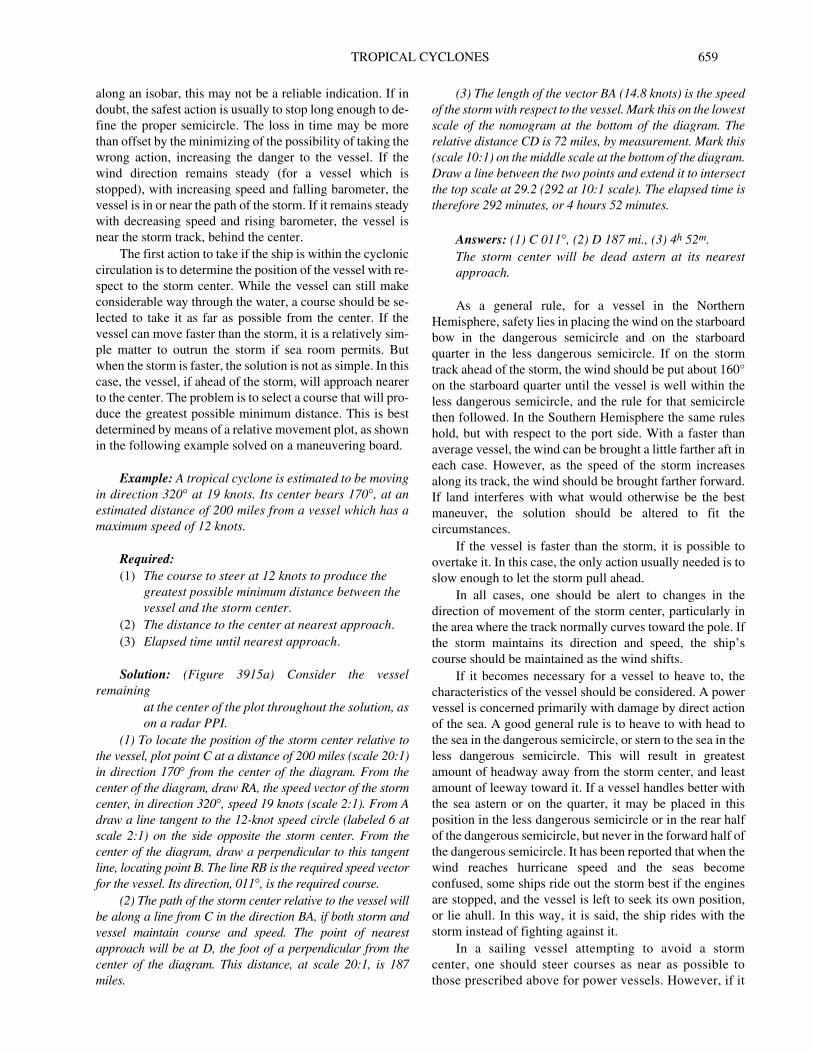
TROPICAL CYCLONES 659
along an isobar, this may not be a reliable indication. If in doubt, the safest action is usually to stop long enough to de-fine the proper semicircle. The loss in time may be more than offset by the minimizing of the possibility of taking the wrong action, increasing the danger to the vessel. If the wind direction remains steady (for a vessel which is stopped), with increasing speed and falling barometer, the vessel is in or near the path of the storm. If it remains steady with decreasing speed and rising barometer, the vessel is near the storm track, behind the center.
The first action to take if the ship is within the cyclonic circulation is to determine the position of the vessel with re-spect to the storm center. While the vessel can still make considerable way through the water, a course should be se-lected to take it as far as possible from the center. If the vessel can move faster than the storm, it is a relatively sim-ple matter to outrun the storm if sea room permits. But when the storm is faster, the solution is not as simple. In this case, the vessel, if ahead of the storm, will approach nearer to the center. The problem is to select a course that will pro-duce the greatest possible minimum distance. This is best determined by means of a relative movement plot, as shown in the following example solved on a maneuvering board.
Example: A tropical cyclone is estimated to be moving in direction 320° at 19 knots. Its center bears 170°, at anestimated distance of 200 miles from a vessel which has a maximum speed of 12 knots.
Required: (1) The course to steer at 12 knots to produce the
greatest possible minimum distance between the vessel and the storm center.
(2) The distance to the center at nearest approach.(3) Elapsed time until nearest approach.
Solution: (Figure 3915a) Consider the vessel remaining
at the center of the plot throughout the solution, as on a radar PPI.
(1) To locate the position of the storm center relative to the vessel, plot point C at a distance of 200 miles (scale 20:1) in direction 170° from the center of the diagram. From the center of the diagram, draw RA, the speed vector of the storm center, in direction 320°, speed 19 knots (scale 2:1). From A draw a line tangent to the 12-knot speed circle (labeled 6 at scale 2:1) on the side opposite the storm center. From the center of the diagram, draw a perpendicular to this tangent line, locating point B. The line RB is the required speed vector for the vessel. Its direction, 011°, is the required course.
(2) The path of the storm center relative to the vessel will be along a line from C in the direction BA, if both storm and vessel maintain course and speed. The point of nearest approach will be at D, the foot of a perpendicular from the center of the diagram. This distance, at scale 20:1, is 187 miles.
(3) The length of the vector BA (14.8 knots) is the speed of the storm with respect to the vessel. Mark this on the lowest scale of the nomogram at the bottom of the diagram. The relative distance CD is 72 miles, by measurement. Mark this (scale 10:1) on the middle scale at the bottom of the diagram. Draw a line between the two points and extend it to intersect the top scale at 29.2 (292 at 10:1 scale). The elapsed time is therefore 292 minutes, or 4 hours 52 minutes.
Answers: (1) C 011°, (2) D 187 mi., (3) 4h 52m.The storm center will be dead astern at its nearest approach.
As a general rule, for a vessel in the Northern Hemisphere, safety lies in placing the wind on the starboard bow in the dangerous semicircle and on the starboard quarter in the less dangerous semicircle. If on the storm track ahead of the storm, the wind should be put about 160° on the starboard quarter until the vessel is well within the less dangerous semicircle, and the rule for that semicircle then followed. In the Southern Hemisphere the same rules hold, but with respect to the port side. With a faster than average vessel, the wind can be brought a little farther aft in each case. However, as the speed of the storm increases along its track, the wind should be brought farther forward. If land interferes with what would otherwise be the best maneuver, the solution should be altered to fit the circumstances.
If the vessel is faster than the storm, it is possible to overtake it. In this case, the only action usually needed is to slow enough to let the storm pull ahead.
In all cases, one should be alert to changes in the direction of movement of the storm center, particularly in the area where the track normally curves toward the pole. If the storm maintains its direction and speed, the ship’s course should be maintained as the wind shifts.
If it becomes necessary for a vessel to heave to, the characteristics of the vessel should be considered. A power vessel is concerned primarily with damage by direct action of the sea. A good general rule is to heave to with head to the sea in the dangerous semicircle, or stern to the sea in the less dangerous semicircle. This will result in greatest amount of headway away from the storm center, and least amount of leeway toward it. If a vessel handles better with the sea astern or on the quarter, it may be placed in this position in the less dangerous semicircle or in the rear half of the dangerous semicircle, but never in the forward half of the dangerous semicircle. It has been reported that when the wind reaches hurricane speed and the seas become confused, some ships ride out the storm best if the engines are stopped, and the vessel is left to seek its own position, or lie ahull. In this way, it is said, the ship rides with the storm instead of fighting against it.
In a sailing vessel attempting to avoid a storm center, one should steer courses as near as possible to those prescribed above for power vessels. However, if it
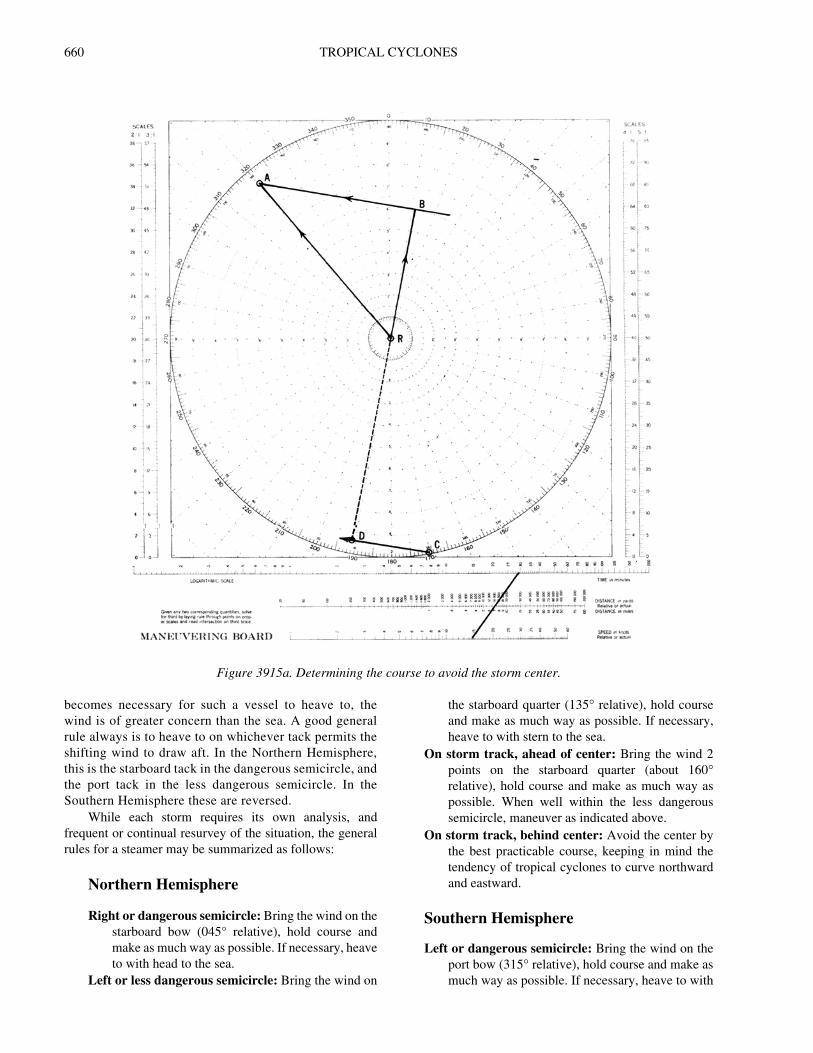
660 TROPICAL CYCLONES
becomes necessary for such a vessel to heave to, the wind is of greater concern than the sea. A good general rule always is to heave to on whichever tack permits the shifting wind to draw aft. In the Northern Hemisphere, this is the starboard tack in the dangerous semicircle, and the port tack in the less dangerous semicircle. In the Southern Hemisphere these are reversed.
While each storm requires its own analysis, and frequent or continual resurvey of the situation, the general rules for a steamer may be summarized as follows:
Northern Hemisphere
Right or dangerous semicircle: Bring the wind on the starboard bow (045° relative), hold course and make as much way as possible. If necessary, heave to with head to the sea.
Left or less dangerous semicircle: Bring the wind on
the starboard quarter (135° relative), hold course and make as much way as possible. If necessary, heave to with stern to the sea.
On storm track, ahead of center: Bring the wind 2 points on the starboard quarter (about 160°relative), hold course and make as much way as possible. When well within the less dangerous semicircle, maneuver as indicated above.
On storm track, behind center: Avoid the center by the best practicable course, keeping in mind the tendency of tropical cyclones to curve northward and eastward.
Southern Hemisphere
Left or dangerous semicircle: Bring the wind on the port bow (315° relative), hold course and make as much way as possible. If necessary, heave to with
Figure 3915a. Determining the course to avoid the storm center.
TROPICAL CYCLONES 661
head to the sea.Right or less dangerous semicircle: Bring the wind
on the port quarter (225° relative), hold course and make as much way as possible. If necessary, heave to with stern to the sea.
On storm track, ahead of center: Bring the wind about 200° relative, hold course and make as much way as possible. When well within the less dangerous semicircle, maneuver as indicated above.
On storm track, behind center: Avoid the center by the best practicable course, keeping in mind the tendency of tropical cyclones to curve southward and eastward.
It is possible, particularly in temperate latitudes after the storm has recurved, that the dangerous semicircle is the left one in the Northern Hemisphere (right one in the Southern Hemisphere). This can occur if a large high lies north of the storm and causes a tightening of the pressure gradient in the region.
The Typhoon Havens Handbook for the Western Pa-cific and Indian Oceans is published by the Naval Oceanographic and Atmospheric Research Lab
(NOARL) Monterey, California, as an aid to captains and commanding officers of ships in evaluating a ty-phoon situation, and to assist them in deciding whether to sortie, to evade, to remain in port, or to head for the shelter of a specific harbor. See Figure 3915b for a link to this handbook.
3916. References
© Figure 3904 provided courtesy of University Corporation for Atmospheric Research (UCAR), COMINT Program, Boulder, CO 80301.
Figure 3915b. Typhoon Havens Handbook. http://www.nrlmry.navy.mil/port_studies/thh-nc/0start.htm

663
CHAPTER 40
WEATHER OBSERVATIONS
BASIC WEATHER OBSERVATIONS
4000. Introduction
Weather forecasts are based upon information acquired by observations made at a large number of stations. Ashore, these stations are located so as to provide adequate coverage of the area of interest. Observations at sea are made by mariners, buoys, and satellites. Since the number of observations at sea is small compared to the number ashore, marine observations are of great importance. Data recorded by designated vessels are sent by radio or satellite to national meteorological centers ashore, where they are calculated into computer forecast models for the development of synoptic charts. These models are then used to prepare local and global forecasts. The complete set of weather data gathered at sea is then sent to the appropriate meteorological services for use in the preparation of weather atlases and in marine climatological studies.
Weather observations are normally taken on the major synoptic hours (0000, 0600, 1200, and 1800 UTC). Howev-er, three-hourly intermediate observations are necessary on the Great Lakes, within 200 nautical miles from the United States or Canadian coastline, or within 300 nautical miles of a named tropical cyclone. Even with satellite imagery, ac-tual reports are needed to confirm developing patterns and provide accurate temperature, pressure, and other measure-ments. Forecasts can be no better than the data received.
4001. Atmospheric Pressure
The sea of air surrounding the Earth exerts a pressure of about 14.7 pounds per square inch on the surface of the Earth. This atmospheric pressure, sometimes calledbarometric pressure, varies from place to place, and at the same place it varies over time.
Atmospheric pressure is one of the most basic elements of a meteorological observation. When the pressure at each station is plotted on a synoptic chart, lines of equal atmospheric pressure, called isobars, indicate the areas of high and low pressure. These are useful in making weather predictions because certain types of weather are characteristic of each type of area, and wind patterns over large areas can be deduced from the isobars.
Atmospheric pressure is measured with a barometer. The earliest known barometer was the mercurial
barometer, invented by Evangelista Torricelli in 1643. In its simplest form, it consists of a glass tube a little more than 30 inches in length and of uniform internal diameter. With one end closed, the tube is filled with mercury, and inverted into a cup of mercury. The mercury in the tube falls until the column is just supported by the pressure of the atmosphere on the open cup, leaving a vacuum at the upper end of the tube. The height of the column indicates atmospheric pressure, with greater pressures supporting higher columns of mercury.
The aneroid barometer has a partly evacuated, thin metal cell which is compressed by atmospheric pressure. Slight changes in air pressure cause the cell to expand or contract, while a system of levers magnifies and converts this motion to a reading on a gauge or recorder.
Early mercurial barometers were calibrated to indicate the height, usually in inches or millimeters, of the column of mercury needed to balance the column of air above the point of measurement. While units of inches and millime-ters are still widely used, many modern barometers are calibrated to indicate the centimeter-gram-second unit of pressure, the hectopascal (hPa), formerly known as the millibar. The hectopascal is equal to 1,000 dynes per square centimeter. A dyne is the force required to accelerate a mass of one gram at the rate of one centimeter per second per second. 1,000 hPa = 100,000 Pascal = 14.50 pounds per square inch = 750.0 mm Hg = 0.9869 atmosphere. A read-ing in any of the three units of measurement can be converted to the equivalent reading in any of the other units by using the Conversion Table for hecto-Pascals (milli-bars), Inches of Mercury, and Millimeters of Mercury (Table 34) or the conversion factors. However, the pressure reading should always be reported in hPa.
4002. The Aneroid Barometer
The aneroid barometer (Figure 4002a) measures the force exerted by atmospheric pressure on a partly evacuat-ed, thin metal element called a sylphon cell or aneroid capsule. A small spring is used, either internally or exter-nally, to partly counteract the tendency of the atmospheric pressure to crush the cell. Atmospheric pressure is indicated directly by a scale and a pointer connected to the cell by a combination of levers. The linkage provides considerable magnification of the slight motion of the cell, to permit
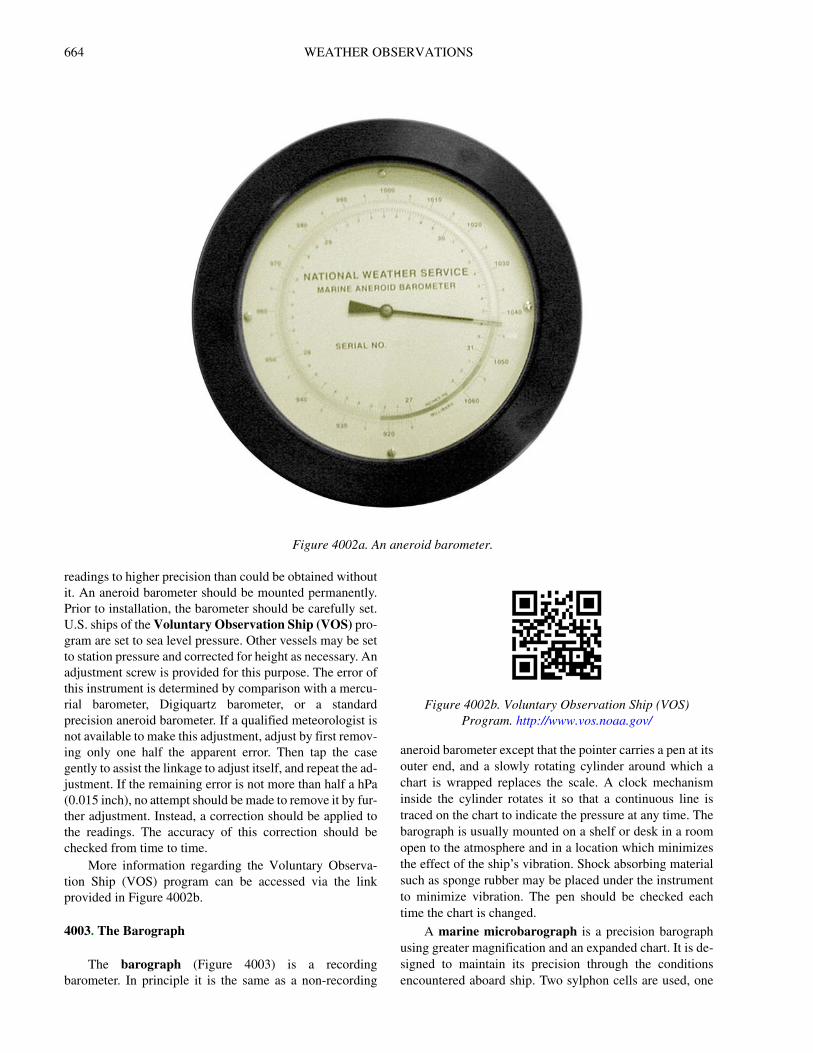
664 WEATHER OBSERVATIONS
readings to higher precision than could be obtained without it. An aneroid barometer should be mounted permanently. Prior to installation, the barometer should be carefully set. U.S. ships of the Voluntary Observation Ship (VOS) pro-gram are set to sea level pressure. Other vessels may be set to station pressure and corrected for height as necessary. An adjustment screw is provided for this purpose. The error of this instrument is determined by comparison with a mercu-rial barometer, Digiquartz barometer, or a standard precision aneroid barometer. If a qualified meteorologist is not available to make this adjustment, adjust by first remov-ing only one half the apparent error. Then tap the case gently to assist the linkage to adjust itself, and repeat the ad-justment. If the remaining error is not more than half a hPa (0.015 inch), no attempt should be made to remove it by fur-ther adjustment. Instead, a correction should be applied to the readings. The accuracy of this correction should be checked from time to time.
More information regarding the Voluntary Observa-tion Ship (VOS) program can be accessed via the link provided in Figure 4002b.
4003. The Barograph
The barograph (Figure 4003) is a recording barometer. In principle it is the same as a non-recording
aneroid barometer except that the pointer carries a pen at its outer end, and a slowly rotating cylinder around which a chart is wrapped replaces the scale. A clock mechanism inside the cylinder rotates it so that a continuous line is traced on the chart to indicate the pressure at any time. The barograph is usually mounted on a shelf or desk in a room open to the atmosphere and in a location which minimizes the effect of the ship’s vibration. Shock absorbing material such as sponge rubber may be placed under the instrument to minimize vibration. The pen should be checked each time the chart is changed.
A marine microbarograph is a precision barograph using greater magnification and an expanded chart. It is de-signed to maintain its precision through the conditions encountered aboard ship. Two sylphon cells are used, one
Figure 4002a. An aneroid barometer.
Figure 4002b. Voluntary Observation Ship (VOS) Program. http://www.vos.noaa.gov/

WEATHER OBSERVATIONS 665
mounted over the other, in tandem. Minor fluctuations due to shocks or vibrations are eliminated by damping. Since oil filled dashpots are used for this purpose, the instrument should never be inverted. The dashpots of the marine micro-barograph should be kept filled with dashpot oil to within three-eighths inch of the top. The marine microbarograph is fitted with a valve so it can be vented to the outside for more accurate pressure readings.
Ship motions are compensated by damping and spring loading which make it possible for the microbarograph to be tilted up to 22° without varying more than 0.3 hPa from the true reading. Microbarographs have been almost entire-ly replaced by standard barographs.
Both instruments require checking from time to time to insure correct indication of pressure. The position of the pen is adjusted by a small knob provided for this purpose. The adjustment should be made in stages, eliminating half the apparent error, tapping the case to insure linkage adjust-ment to the new setting, and then repeating the process.
4004. Adjusting Barometer Readings
Atmospheric pressure as indicated by a barometer or barograph may be subject to several errors.
Instrument error: Inaccuracy due to imperfection or incorrect adjustment can be determined by comparison with a standard precision instrument. The National Weather Ser-vice provides a comparison service. In major U.S. ports, a Port Meteorological Officer (PMO) carries a portable
precision aneroid barometer or a digital barometer for ba-rometer comparisons on board ships which participate in the VOS program. The portable barometer is compared with station barometers before and after a ship visit. If a ba-rometer is taken to a National Weather Service shore station, the comparison can be made there. The correct sea level pressure can also be obtained by telephone. The ship-board barometer should be corrected for height, as explained below, before comparison with this value. If there is reason to believe that the barometer is in error, it should be compared with a standard, and if an error is found, the barometer should be adjusted to the correct read-ing, or a correction applied to all readings. More information regarding PMOs is available via the link pro-vided in Figure 4004.
Height error: The atmospheric pressure reading at the height of the barometer is called the station pressure and is subject to a height correction in order to correct it to sea
Figure 4003. A marine barograph.
Figure 4004. Link to Port Meteorological Officers website. http://www.vos.noaa.gov/met_officers.shtml
666 WEATHER OBSERVATIONS
level. Isobars adequately reflect wind conditions and geo-graphic distribution of pressure only when they are drawn for pressure at constant height (or the varying height at which a constant pressure exists). On synoptic charts it is customary to show the equivalent pressure at sea level, called sea level pressure. This is found by applying a cor-rection to station pressure. The correction depends upon the height of the barometer and the average temperature of the air between this height and the surface. The outside air tem-perature taken aboard ship is sufficiently accurate for this purpose and is an important correction that should be ap-plied to all readings of any type of barometer. See theCorrection of Barometer Reading for Height Above Sea Level table (Table 31) for this correction. Of special note on the Great Lakes, each Lake is at a different height above sea level, so an additional correction is needed.
Temperature error: Barometers are calibrated at a standard temperature of 32°F. Modern aneroid barometers compensate for temperature changes by using different met-als having unequal coefficients of linear expansion.
4005. Temperature
Temperature is a measure of heat energy, measured in degrees. Several different temperature scales are in use.
On the Fahrenheit (F) scale, pure water freezes at 32°and boils at 212°.
On the Celsius (C) scale, commonly used with the metric system, the freezing point of pure water is 0° and the boiling point is 100°. This scale has been known by various names in different countries. In the United States it was formerly called the centigrade scale. The Ninth General Conference of Weights and Measures, held in France in 1948, adopted the name Celsius to be consistent with the naming of other temperature scales after their inventors, and to avoid the use of different names in different countries. On the original Celsius scale, invented in 1742 by a Swedish astronomer named Anders Celsius, numbering was the reverse of the modern scale, 0°representing the boiling point of water, and 100° its freezing point.
Temperature of one scale can be easily converted to another because of the linear mathematical relationship between them. Note that the sequence of calculation is slightly different; algebraic rules must be followed.
A temperature of –40° is the same by either the Celsius or Fahrenheit scale. Similar formulas can be made for
conversion of other temperature scale readings. The Conversion Table for Thermometer Scales (Table 29) gives the equivalent values of Fahrenheit, Celsius, and Kelvin temperatures.
The intensity or degree of heat (temperature) should not be confused with the amount of heat. If the temperature of air or some other substance is to be increased by a given number of degrees, the amount of heat that must be added depends on the mass of the substance. Also, because of differences in their specific heat, equal amounts of different substances require the addition of unequal amounts of heat to raise their temperatures by equal amounts. The units used for measurement of heat are the British thermal unit (BTU), the amount of heat needed to raise the temperature of 1 pound of water 1° Fahrenheit, and the calorie, the amount of heat needed to raise the temperature of 1 gram of water 1° Celsius.
4006. Temperature Measurement
Temperature is measured with a thermometer. Most thermometers are based upon the principle that materials ex-pand with an increase of temperature, and contract as temperature decreases. In its most common form, a ther-mometer consists of a bulb filled with mercury or a glycol based fluid, which is connected to a tube of very small cross sectional area. The fluid only partly fills the tube. In the re-mainder is a vacuum. Air is driven out by boiling the fluid, and the top of the tube is then sealed. As the fluid expands or contracts with changing temperature, the length of thefluid column in the tube changes.
Sea surface temperature observations are used in the forecasting of fog and furnish important information about the development and movement of tropical cyclones. Com-mercial fishermen are interested in the sea surface temperature as an aid in locating certain species of fish. There are several methods of determining seawater tem-perature. These include engine room intake readings, condenser intake readings, thermistor probes attached to the hull, and readings from buckets recovered from over the side. Although the condenser intake method is not a true measure of surface water temperature, the error is generally small.
If the surface temperature is desired, a sample should be obtained by bucket, preferably made of canvas, from a forward position well clear of any discharge lines. The sam-ple should be taken immediately to a place where it is sheltered from wind and Sun. The water should then be stirred with the thermometer, keeping the bulb submerged, until a constant reading is obtained.
A considerable variation in sea surface temperature can be experienced in a relatively short distance of travel. This is especially true when crossing major ocean currents such as the Gulf Stream and the Kuroshio Current. Significant variations also occur where large quantities of fresh water are discharged from rivers or bays. A clever navigator will note these changes as an indication of when to allow for set
C59--- F 32–( ), or= C
F 32–1.8
---------------=
F95---C 32 or,+= F 1.8C 32+=
K (Kelvin) C 273.15+=
R (Rankine) F 459.69+=
WEATHER OBSERVATIONS 667
and drift in dead reckoning.
4007. Humidity
Humidity is a measure of the atmosphere’s water vapor content. Relative humidity is the ratio, stated as a percentage, of the pressure of water vapor present in the atmosphere to the saturation vapor pressure at the same temperature.
As air temperature decreases, the relative humidity increases, as long as the wet-bulb temperature remains the same or decreases at a slower rate than air temperature. At some point, saturation takes place, and any further cooling results in condensation of some of the moisture. The temperature at which this occurs is called the dew point, and the moisture deposited upon objects is called dew if it forms in the liquid state, or frost if it forms as ice crystals.
The same process causes moisture to form on the outside of a container of cold liquid, the liquid cooling the air in the immediate vicinity of the container until it reaches the dew point. When moisture is deposited on man-made objects, it is sometimes called sweat. It occurs whenever the temperature of a surface is lower than the dew point of air in contact with it. It is of particular concern to the mariner because of its effect upon instruments, and possible damage to ship or cargo. Lenses of optical instruments may sweat, usually with such small droplets that the surface has a “frosted” appearance. When this occurs, the instrument is said to “fog” or “fog up,” and is useless until the moisture is removed. Damage is often caused by corrosion or direct water damage when pipes or inner shell plates of a vessel sweat and drip. Cargo may also sweat if it is cooler than the dew point of the air.
Clouds and fog form from the condensation of water on minute particles of dust, salt, and other material in the air. Each particle forms a nucleus around which a droplet of water forms. If air is completely free from solid particles on which water vapor may condense, the extra moisture remains vaporized, and the air is said to be supersaturated.
Relative humidity and dew point are measured with ahygrometer. The most common type, called apsychrometer, consists of two thermometers mounted together on a single strip of material. One of the thermometers is mounted a little lower than the other, and has its bulb covered with muslin. When the muslin covering is thoroughly moistened and the thermometer well ventilated, evaporation cools the bulb of the thermometer, causing it to indicate a lower reading than the other. A sling psychrometer is ventilated by whirling the thermometers. The difference between the dry-bulb and wet-bulb temperatures is used to enter psychrometric tables (Relative Humidity and Dew Point Tables) (Table 35 and Table 36) to find the relative humidity and dew point. If the wet-bulb temperature is above freezing, reasonably accurate results can be obtained by a psychrometer consisting of dry- and wet-bulb thermometers mounted so that air can circulate freely around them without
special ventilation. This type of installation is common aboard ship.
Example: The dry-bulb temperature is 65°F, and the wet-bulb temperature is 61°F.
Required: (1) Relative humidity, (2) dew point.Solution: The difference between readings is 4°.
Entering the Relative Humidity Table (Table 35) with this value, and a dry-bulb temperature of 65°, the relative humidity is found to be 80%. From the Dew Point Table (Table 36) the dew point is 58°.
Answers: (1) Relative humidity 80 percent, (2) dew point 58°.
Also in use aboard many ships is the electric psychrometer. This is a hand held, battery operated instrument with two mercury thermometers for obtaining dry- and wet-bulb temperature readings. It consists of a plastic housing that holds the thermometers, batteries, motor, and fan.
4008. Wind Measurement
Wind measurement consists of determination of the direction and speed of the wind. Direction is measured by a wind vane, and speed by an anemometer. Several types of wind speed and direction sensors are available, using vanes to indicate wind direction (where the wind is coming from) and rotating cups or propellers for speed sensing. Many ships have reliable wind instruments installed, and inexpensive wind instruments are available for even the smallest yacht. If no anemometer is available, wind speed can be estimated by its effect upon the sea and nearby objects. The direction can be computed accurately, even on a fast moving vessel, by maneuvering board or using the Direction and Speed of True Wind in Units of Ship’s Speed Table (Table 30).
4009. True and Apparent Wind
An observer aboard a vessel proceeding through still air experiences an apparent wind which is from dead ahead and has an apparent speed equal to the speed of the vessel. Thus, if the actual or true wind is zero and the speed of the vessel is 10 knots, the apparent wind is from dead ahead at 10 knots. If the true wind is from dead ahead at 15 knots, and the speed of the vessel is 10 knots, the apparent wind is 15 + 10 = 25 knots from dead ahead. If the vessel reverses course, the apparent wind is 15 – 10 = 5 knots, from dead astern.
The apparent wind is the vector sum of the true wind and the reciprocal of the vessel’s course and speed vector. Since wind vanes and anemometers measure ap-parent wind, the usual problem aboard a vessel equipped with an anemometer is to convert apparent wind to true wind. There are several ways of doing this. Perhaps the simplest is by the graphical solution illustrated in the fol-
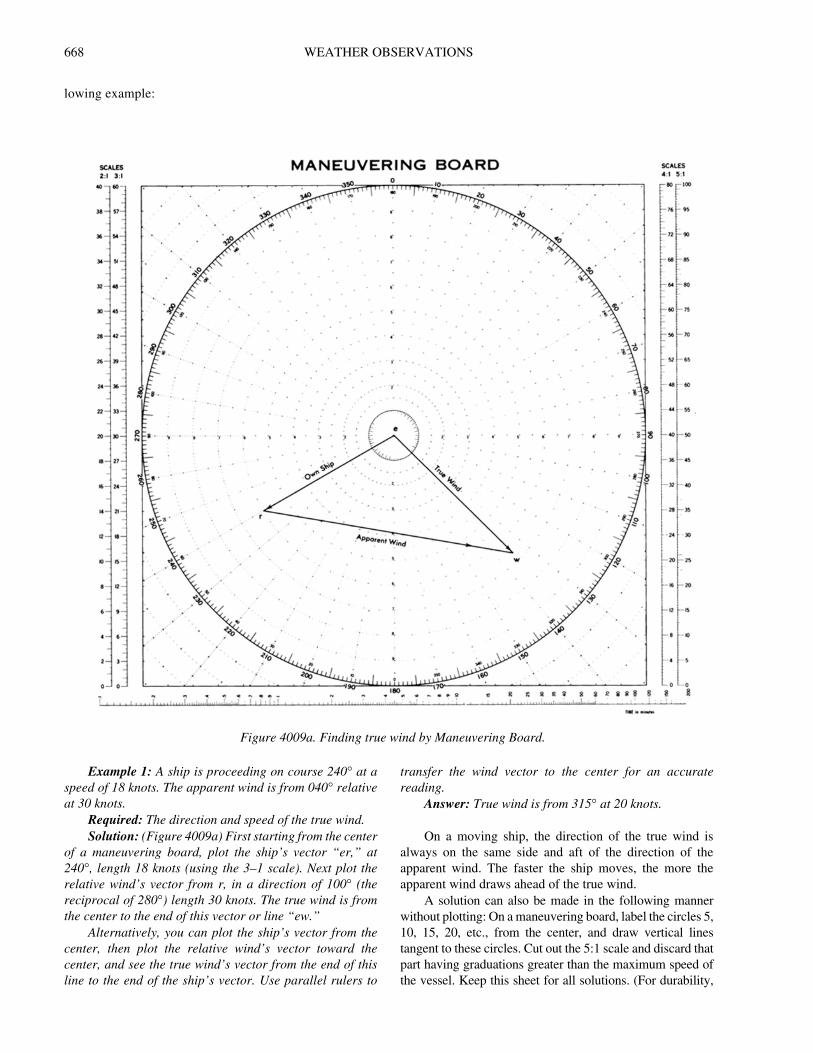
668 WEATHER OBSERVATIONS
lowing example:
Example 1: A ship is proceeding on course 240° at a speed of 18 knots. The apparent wind is from 040° relative at 30 knots.
Required: The direction and speed of the true wind.Solution: (Figure 4009a) First starting from the center
of a maneuvering board, plot the ship’s vector “er,” at 240°, length 18 knots (using the 3–1 scale). Next plot the relative wind’s vector from r, in a direction of 100° (the reciprocal of 280°) length 30 knots. The true wind is from the center to the end of this vector or line “ew.”
Alternatively, you can plot the ship’s vector from the center, then plot the relative wind’s vector toward the center, and see the true wind’s vector from the end of this line to the end of the ship’s vector. Use parallel rulers to
transfer the wind vector to the center for an accurate reading.
Answer: True wind is from 315° at 20 knots.
On a moving ship, the direction of the true wind is always on the same side and aft of the direction of the apparent wind. The faster the ship moves, the more the apparent wind draws ahead of the true wind.
A solution can also be made in the following manner without plotting: On a maneuvering board, label the circles 5, 10, 15, 20, etc., from the center, and draw vertical lines tangent to these circles. Cut out the 5:1 scale and discard that part having graduations greater than the maximum speed of the vessel. Keep this sheet for all solutions. (For durability,
Figure 4009a. Finding true wind by Maneuvering Board.
WEATHER OBSERVATIONS 669
the two parts can be mounted on cardboard or other suitable material.) To find true wind, spot in point 1 by eye. Place the zero of the 5:1 scale on this point and align the scale (inverted) using the vertical lines. Locate point 2 at the speed of the vessel as indicated on the 5:1 scale. It is always vertically below point 1. Read the relative direction and the speed of the true wind, using eye interpolation if needed.
A tabular solution can be made using the Direction and Speed of True Wind in Units of Ship’s Speed table (Table 30). The entering values for this table are the apparent wind speed in units of ship’s speed, and the difference between the heading and the apparent wind direction. The values taken from the table are the relative direction (right or left) of the true wind, and the speed of the true wind in units ofship’s speed. If a vessel is proceeding at 12 knots, 6 knots constitutes one-half (0.5) unit, 12 knots one unit, 18 knots 1.5 units, 24 knots two units, etc.
Example 2: A ship is proceeding on course 270° at a speed of 10 knots. The apparent wind is from 10° off the port bow, speed 30 knots.
Required: The relative direction, true direction, and speed of the true wind by table.
Solution: The apparent wind speed is
Enter the Direction and Speed of True Wind in Units of Ship’s Speed table (Table 30) with 3.0 and 10° and find the relative direction of the true wind to be 15° off the port bow (345° relative), and the speed to be 2.02 times the ship’s speed,
or 20 knots, approximately. The true direction is 345° + 270° (-360) = 255°.
Answers: True wind from 345° relative = 255° true, at 20 knots.
One can also find apparent wind from the true wind, course or speed required to produce an apparent wind from a given direction or speed, or course and speed to produce an apparent wind of a given speed from a given direction. Such problems often arise in aircraft carrier operations and in some rescue situations. Printable maneuvering board files are available through the link provided in Figure 4009b.
When wind speed and direction are determined by the appearance of the sea, the result is true speed and direction. Waves move in the same direction as the generating wind, and are not deflected by Earth’s rotation. If a wind vane is used, the direction of the apparent wind thus determined can be used with the speed of the true wind to determine the direction of the true wind by vector diagram.
WIND AND WAVES
4010. Effects of Wind on the Sea
There is a direct relationship between the speed of the wind and the state of the sea. This is useful in predicting the sea conditions to be anticipated when future wind speed forecasts are available. It can also be used to estimate the speed of the wind, which may be necessary when an anemometer is not available.
Wind speeds are usually grouped in accordance with the Beaufort Scale of Wind Force, devised in 1806 by English Admiral Sir Francis Beaufort (1774-1857). As adopted in 1838, Beaufort numbers ranged from 0 (calm) to 12 (hurricane). The Beaufort wind scale and sea state photographs at the end of this chapter can be used to estimate wind speed (also see Table 4012). With the exception of Force 12, contributed by John Thomson of Ponteland, Northumberland, England, these pictures (courtesy of the Meteorological Service of Canada) represent the results of a project carried out on board the Canadian Ocean Weather Ships VANCOUVER and
QUADRA at Ocean Weather Station PAPA (50°N, 145°W), between April 1976 and May 1981. The aim of the project was to collect color photographs of the sea surface as it appears under the influence of the various ranges of wind speed, as defined by The Beaufort Scale. The photographs represent as closely as possible steady state sea conditions over many hours for each Beaufort wind force. They were taken from heights ranging from 12-17 meters above the sea surface; anemometer height was 28 meters.
4011. Estimating the Wind at Sea
When there is not a functioning anemometer, observers on board ships will usually determine the speed of the wind by estimating Beaufort force. Through experience, ships’ officers have developed various methods of estimating this force. The effect of the wind on the observer, the ship’s rig-ging, flags, etc., is used as a guide, but estimates based on these indications give the relative wind which must be cor-rected for the motion of the ship before an estimate of the
3010------ 3.0 ships speed units=
Figure 4009b. Link to Pub 1310, The Radar Navigation and Maneuvering Board Manual.
https://msi.nga.mil/NGAPortal/MSI.portal?_nfpb=true&_st=&_pageLabel=msi_portal_page_62&pubCode=0008
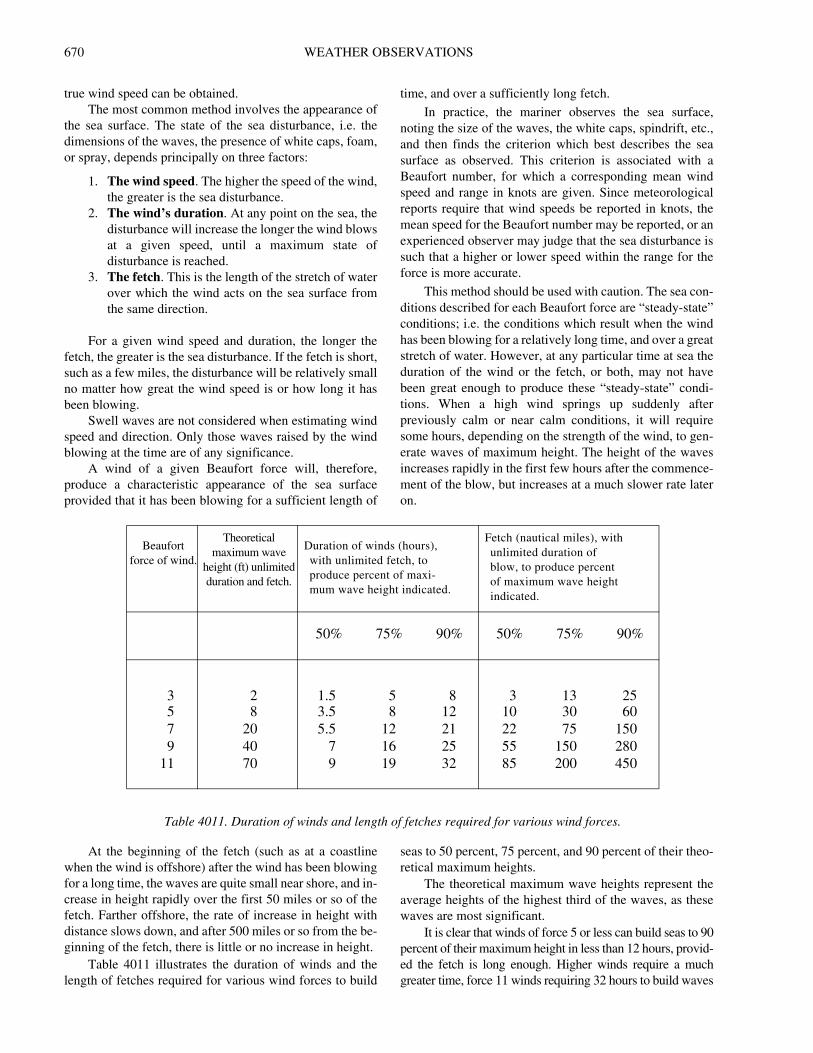
670 WEATHER OBSERVATIONS
true wind speed can be obtained.The most common method involves the appearance of
the sea surface. The state of the sea disturbance, i.e. the dimensions of the waves, the presence of white caps, foam, or spray, depends principally on three factors:
1. The wind speed. The higher the speed of the wind, the greater is the sea disturbance.
2. The wind’s duration. At any point on the sea, the disturbance will increase the longer the wind blows at a given speed, until a maximum state of disturbance is reached.
3. The fetch. This is the length of the stretch of water over which the wind acts on the sea surface from the same direction.
For a given wind speed and duration, the longer the fetch, the greater is the sea disturbance. If the fetch is short, such as a few miles, the disturbance will be relatively small no matter how great the wind speed is or how long it has been blowing.
Swell waves are not considered when estimating wind speed and direction. Only those waves raised by the wind blowing at the time are of any significance.
A wind of a given Beaufort force will, therefore, produce a characteristic appearance of the sea surface provided that it has been blowing for a sufficient length of
time, and over a sufficiently long fetch.
In practice, the mariner observes the sea surface, noting the size of the waves, the white caps, spindrift, etc., and then finds the criterion which best describes the sea surface as observed. This criterion is associated with a Beaufort number, for which a corresponding mean wind speed and range in knots are given. Since meteorological reports require that wind speeds be reported in knots, the mean speed for the Beaufort number may be reported, or an experienced observer may judge that the sea disturbance is such that a higher or lower speed within the range for the force is more accurate.
This method should be used with caution. The sea con-ditions described for each Beaufort force are “steady-state” conditions; i.e. the conditions which result when the wind has been blowing for a relatively long time, and over a great stretch of water. However, at any particular time at sea the duration of the wind or the fetch, or both, may not have been great enough to produce these “steady-state” condi-tions. When a high wind springs up suddenly after previously calm or near calm conditions, it will require some hours, depending on the strength of the wind, to gen-erate waves of maximum height. The height of the waves increases rapidly in the first few hours after the commence-ment of the blow, but increases at a much slower rate later on.
At the beginning of the fetch (such as at a coastline when the wind is offshore) after the wind has been blowing for a long time, the waves are quite small near shore, and in-crease in height rapidly over the first 50 miles or so of the fetch. Farther offshore, the rate of increase in height with distance slows down, and after 500 miles or so from the be-ginning of the fetch, there is little or no increase in height.
Table 4011 illustrates the duration of winds and the length of fetches required for various wind forces to build
seas to 50 percent, 75 percent, and 90 percent of their theo-retical maximum heights.
The theoretical maximum wave heights represent the average heights of the highest third of the waves, as these waves are most significant.
It is clear that winds of force 5 or less can build seas to 90 percent of their maximum height in less than 12 hours, provid-ed the fetch is long enough. Higher winds require a much greater time, force 11 winds requiring 32 hours to build waves
Beaufort force of wind.
Theoretical maximum wave
height (ft) unlimited duration and fetch.
Duration of winds (hours), with unlimited fetch, to produce percent of maxi- mum wave height indicated.
Fetch (nautical miles), with unlimited duration of blow, to produce percent of maximum wave height indicated.
50% 75% 90% 50% 75% 90%
3 2 1.5 5 8 3 13 255 8 3.5 8 12 10 30 607 20 5.5 12 21 22 75 1509 40 7 16 25 55 150 280
11 70 9 19 32 85 200 450
Table 4011. Duration of winds and length of fetches required for various wind forces.
WEATHER OBSERVATIONS 671
to 90 percent of their maximum height. The times given in Ta-ble 4011 represent those required to build waves starting from initially calm sea conditions. If waves are already present at the onset of the blow, the times would be somewhat less, depend-ing on the initial wave heights and their direction relative to the direction of the wind which has sprung up.
The first consideration when using the sea criterion to estimate wind speed, therefore, is to decide whether the wind has been blowing long enough from the same direc-tion to produce a steady state sea condition. If not, then it is possible that the wind speed may be underestimated.
Experience has shown that the appearance of white-caps, foam, spindrift, etc. reaches a steady state condition before the height of the waves attain their maximum value. It is a safe assumption that the appearance of the sea (such as white-caps, etc.) will reach a steady state in the time re-quired to build the waves to 50-75 percent of their maximum height. Thus, from Table 4011 it is seen that a force 5 wind could require 8 hours at most to produce a characteristic appearance of the sea surface.
A second consideration when using the sea criteria is the amount of the fetch over which the wind has been blowing to produce the present state of the sea. On the open sea, unless the mariner has the latest synoptic weather map available, the length of the fetch will not be known. It will be seen from Table 4011 though, that only relatively short fetches are required for the lower wind forces to generate their charac-teristic seas. On the open sea, the fetches associated with most storms and other weather systems are usually long enough so that even winds up to force 9 can build seas up to 90 percent or more of their maximum height, providing the wind blows from the same direction long enough.
When navigating close to a coast or in restricted waters, however, it may be necessary to make allowances for the shorter stretches of water over which the wind blows. For example, referring to Table 4011, if the ship is 22 miles from a coast, and an offshore wind with an actual speed of force 7 is blowing, the waves at the ship will never attain more than 50 percent of their maximum height for this speed no matter how long the wind blows. Hence, if the sea criteria were used under these conditions without consideration of the short fetch, the wind speed would be underestimated. With an offshore wind, the sea criteria may be used with confidence if the distance to the coast is greater than the values given in the extreme right-hand column of Table 4011, provided that the wind has been blowing offshore for a sufficient length of time.
4012. Wind Speed Calculating Factors
Tidal and Other Currents: A wind blowing against the tide or a strong non-tidal current causes higher, steeper waves having a shorter period than normal, which may result in an overestimate of the wind speed if the estimation is made by wave height alone. On the other hand, a wind blowing in the same direction as a tide or strong current causes less sea
disturbance than normal, with longer period waves, which may result in underestimating the wind speed.
Shallow Water: Waves running from deep water into shallow water increase in steepness, hence their tendency to break. Therefore, with an onshore wind there will naturally be more whitecaps over shallow waters than over the deeper water farther offshore. It is only over relatively deep water that the sea criteria can be used with confidence.
Swell: Swell is the name given to waves, generally of considerable length, which were raised in some distant area and which have moved into the vicinity of the ship, or to waves raised nearby that continue after the wind has abated or changed direction. The direction of swell waves is usually different from the direction of the wind and the sea waves. Swell waves are not considered when estimating wind speed and direction. Only those waves raised by the wind blowing at the time are used for estimation. The wind-driven waves show a greater tendency to break when superimposed on the crests of swell, and hence, more whitecaps may be formed than if the swell were absent. Under these conditions, the use of the sea criteria may result in a slight overestimate of the wind speed.
Precipitation: Heavy rain has a damping or smoothing effect on the sea surface that is mechanical in character. Since the sea surface will therefore appear less disturbed than would be the case without the rain, the wind speed may be underestimated unless the smoothing effect is taken into account.
Ice: Even small concentrations of ice floating on the sea surface will dampen waves considerably, and concen-trations averaging greater than about seven-tenths will eliminate waves altogether. Young sea ice, which in the early stages of formation has a thick soupy consistency and later takes on a rubbery appearance, is very effective in dampening waves. Consequently, the sea criteria cannot be used with any degree of confidence when sea ice is present. In higher latitudes, the presence of an ice field some distance to windward of the ship may be suspected if, when the ship is not close to any coast, the wind is relatively strong but the seas abnormally underdeveloped. The edge of the ice field acts like a coastline, and the short fetch between the ice and the ship is not sufficient for the wind to fully develop the seas.
Wind Shifts: Following a rapid change in the direction of the wind, as occurs at the passage of a cold front, the new wind will flatten out to a great extent the waves which were present before the wind shift. This happens because the direction of the wind after the shift may differ by 90° or more from the direction of the waves, which does not change. Hence, the wind may oppose the progress of the waves and quickly dampen them out. At the same time, the new wind begins to generate its own waves on top of this dissipating swell, and it is not long before the cross pattern of waves gives the sea a “choppy” or confused appearance. It is during the first few hours following the wind shift that the
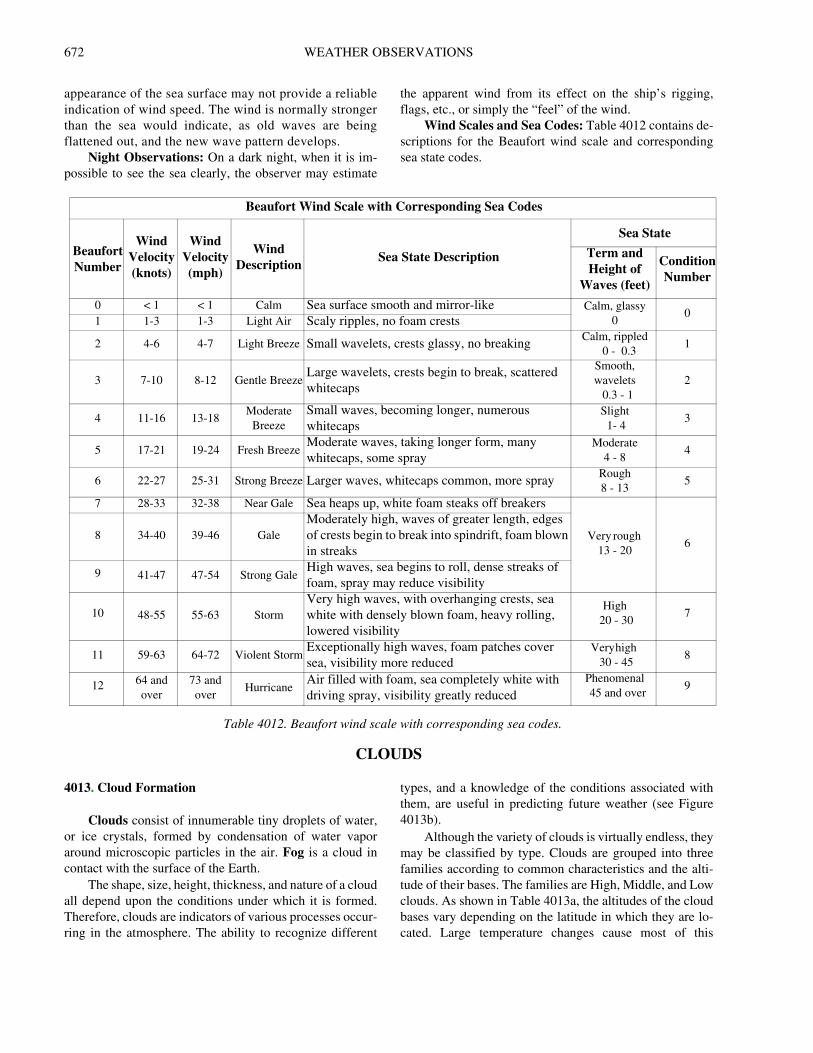
672 WEATHER OBSERVATIONS
appearance of the sea surface may not provide a reliable indication of wind speed. The wind is normally stronger than the sea would indicate, as old waves are being flattened out, and the new wave pattern develops.
Night Observations: On a dark night, when it is im-possible to see the sea clearly, the observer may estimate
the apparent wind from its effect on the ship’s rigging, flags, etc., or simply the “feel” of the wind.
Wind Scales and Sea Codes: Table 4012 contains de-scriptions for the Beaufort wind scale and corresponding sea state codes.
CLOUDS
4013. Cloud Formation
Clouds consist of innumerable tiny droplets of water, or ice crystals, formed by condensation of water vapor around microscopic particles in the air. Fog is a cloud in contact with the surface of the Earth.
The shape, size, height, thickness, and nature of a cloud all depend upon the conditions under which it is formed. Therefore, clouds are indicators of various processes occur-ring in the atmosphere. The ability to recognize different
types, and a knowledge of the conditions associated with them, are useful in predicting future weather (see Figure 4013b).
Although the variety of clouds is virtually endless, they may be classified by type. Clouds are grouped into three families according to common characteristics and the alti-tude of their bases. The families are High, Middle, and Low clouds. As shown in Table 4013a, the altitudes of the cloud bases vary depending on the latitude in which they are lo-cated. Large temperature changes cause most of this
Beaufort Wind Scale with Corresponding Sea Codes
Beaufort Number
Wind Velocity (knots)
Wind Velocity (mph)
Wind Description
Sea State Description
Sea State
Term and Height of
Waves (feet)
Condition Number
0 < 1 < 1 Calm Sea surface smooth and mirror-like Calm, glassy 0
01 1-3 1-3 Light Air Scaly ripples, no foam crests
2 4-6 4-7 Light Breeze Small wavelets, crests glassy, no breakingCalm, rippled
0 - 0.31
3 7-10 8-12 Gentle BreezeLarge wavelets, crests begin to break, scattered whitecaps
Smooth, wavelets 0.3 - 1
2
4 11-16 13-18Moderate
BreezeSmall waves, becoming longer, numerous whitecaps
Slight 1- 4
3
5 17-21 19-24 Fresh BreezeModerate waves, taking longer form, many whitecaps, some spray
Moderate 4 - 8
4
6 22-27 25-31 Strong Breeze Larger waves, whitecaps common, more sprayRough 8 - 13
5
7 28-33 32-38 Near Gale Sea heaps up, white foam steaks off breakers
Very rough 13 - 20
68 34-40 39-46 Gale
Moderately high, waves of greater length, edges of crests begin to break into spindrift, foam blown in streaks
9 41-47 47-54 Strong GaleHigh waves, sea begins to roll, dense streaks of foam, spray may reduce visibility
10 48-55 55-63 StormVery high waves, with overhanging crests, sea white with densely blown foam, heavy rolling, lowered visibility
High 20 - 30
7
11 59-63 64-72 Violent StormExceptionally high waves, foam patches cover sea, visibility more reduced
Very high 30 - 45
8
12 64 and over
73 and over
HurricaneAir filled with foam, sea completely white with driving spray, visibility greatly reduced
Phenomenal 45 and over
9
Table 4012. Beaufort wind scale with corresponding sea codes.
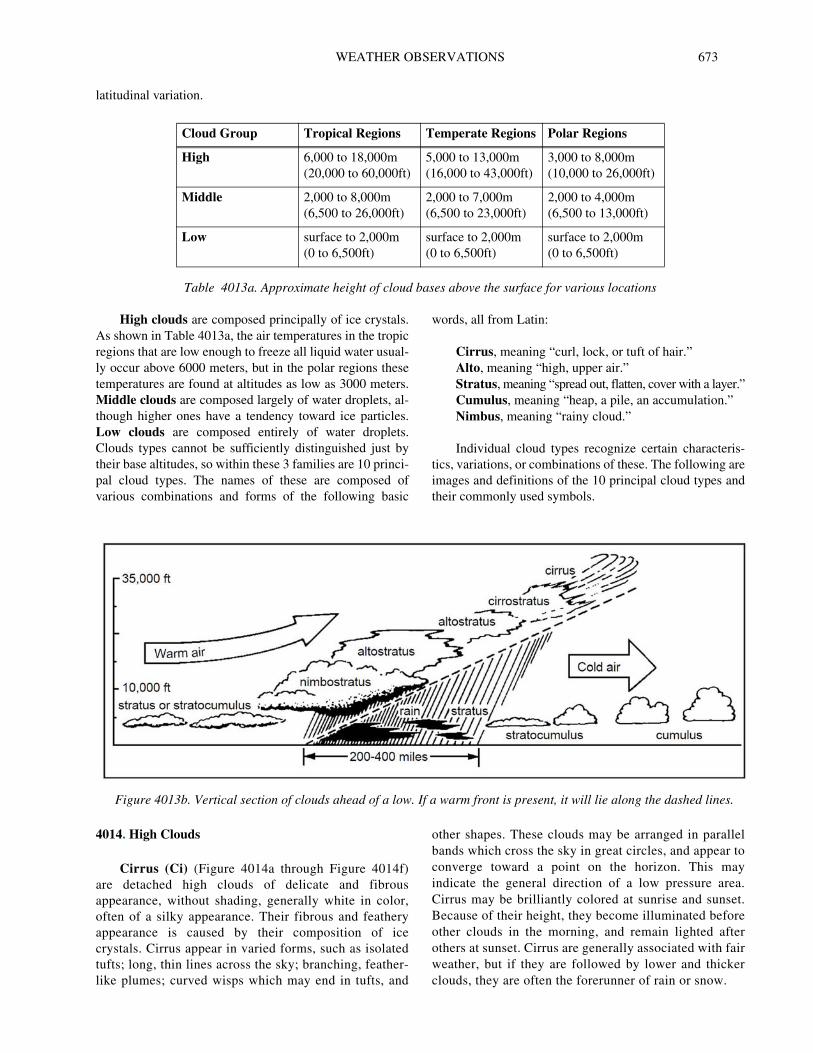
WEATHER OBSERVATIONS 673
latitudinal variation.
High clouds are composed principally of ice crystals. As shown in Table 4013a, the air temperatures in the tropic regions that are low enough to freeze all liquid water usual-ly occur above 6000 meters, but in the polar regions these temperatures are found at altitudes as low as 3000 meters. Middle clouds are composed largely of water droplets, al-though higher ones have a tendency toward ice particles. Low clouds are composed entirely of water droplets. Clouds types cannot be sufficiently distinguished just by their base altitudes, so within these 3 families are 10 princi-pal cloud types. The names of these are composed of various combinations and forms of the following basic
words, all from Latin:
Cirrus, meaning “curl, lock, or tuft of hair.”Alto, meaning “high, upper air.”Stratus, meaning “spread out, flatten, cover with a layer.”Cumulus, meaning “heap, a pile, an accumulation.”Nimbus, meaning “rainy cloud.”
Individual cloud types recognize certain characteris-tics, variations, or combinations of these. The following are images and definitions of the 10 principal cloud types and their commonly used symbols.
4014. High Clouds
Cirrus (Ci) (Figure 4014a through Figure 4014f) are detached high clouds of delicate and fibrous appearance, without shading, generally white in color, often of a silky appearance. Their fibrous and feathery appearance is caused by their composition of ice crystals. Cirrus appear in varied forms, such as isolated tufts; long, thin lines across the sky; branching, feather-like plumes; curved wisps which may end in tufts, and
other shapes. These clouds may be arranged in parallel bands which cross the sky in great circles, and appear to converge toward a point on the horizon. This may indicate the general direction of a low pressure area. Cirrus may be brilliantly colored at sunrise and sunset. Because of their height, they become illuminated before other clouds in the morning, and remain lighted after others at sunset. Cirrus are generally associated with fair weather, but if they are followed by lower and thicker clouds, they are often the forerunner of rain or snow.
Cloud Group Tropical Regions Temperate Regions Polar Regions
High 6,000 to 18,000m (20,000 to 60,000ft)
5,000 to 13,000m (16,000 to 43,000ft)
3,000 to 8,000m (10,000 to 26,000ft)
Middle 2,000 to 8,000m (6,500 to 26,000ft)
2,000 to 7,000m (6,500 to 23,000ft)
2,000 to 4,000m (6,500 to 13,000ft)
Low surface to 2,000m (0 to 6,500ft)
surface to 2,000m (0 to 6,500ft)
surface to 2,000m (0 to 6,500ft)
Table 4013a. Approximate height of cloud bases above the surface for various locations
Figure 4013b. Vertical section of clouds ahead of a low. If a warm front is present, it will lie along the dashed lines.
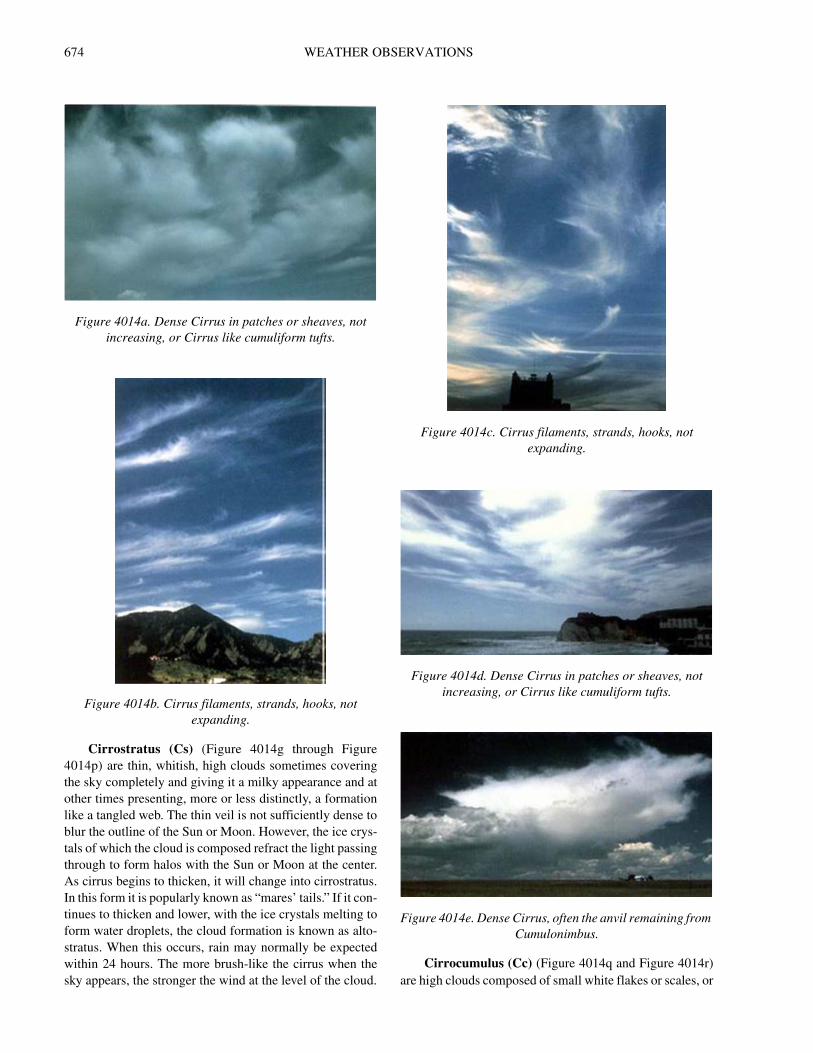
674 WEATHER OBSERVATIONS
Cirrostratus (Cs) (Figure 4014g through Figure 4014p) are thin, whitish, high clouds sometimes covering the sky completely and giving it a milky appearance and at other times presenting, more or less distinctly, a formation like a tangled web. The thin veil is not sufficiently dense to blur the outline of the Sun or Moon. However, the ice crys-tals of which the cloud is composed refract the light passing through to form halos with the Sun or Moon at the center. As cirrus begins to thicken, it will change into cirrostratus. In this form it is popularly known as “mares’ tails.” If it con-tinues to thicken and lower, with the ice crystals melting to form water droplets, the cloud formation is known as alto-stratus. When this occurs, rain may normally be expected within 24 hours. The more brush-like the cirrus when the sky appears, the stronger the wind at the level of the cloud.
Cirrocumulus (Cc) (Figure 4014q and Figure 4014r) are high clouds composed of small white flakes or scales, or
Figure 4014a. Dense Cirrus in patches or sheaves, not increasing, or Cirrus like cumuliform tufts.
Figure 4014b. Cirrus filaments, strands, hooks, not expanding.
Figure 4014c. Cirrus filaments, strands, hooks, not expanding.
Figure 4014d. Dense Cirrus in patches or sheaves, not increasing, or Cirrus like cumuliform tufts.
Figure 4014e. Dense Cirrus, often the anvil remaining from Cumulonimbus.
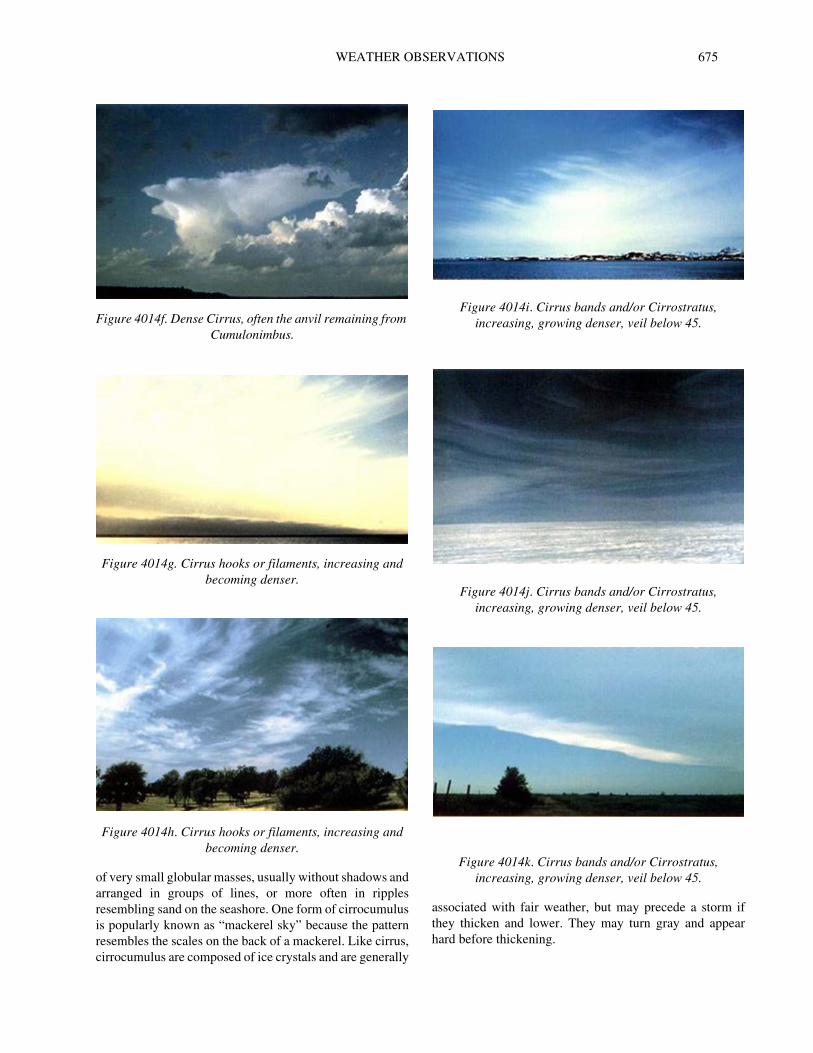
WEATHER OBSERVATIONS 675
of very small globular masses, usually without shadows and arranged in groups of lines, or more often in ripples resembling sand on the seashore. One form of cirrocumulus is popularly known as “mackerel sky” because the patternresembles the scales on the back of a mackerel. Like cirrus, cirrocumulus are composed of ice crystals and are generally
associated with fair weather, but may precede a storm if they thicken and lower. They may turn gray and appear hard before thickening.
Figure 4014f. Dense Cirrus, often the anvil remaining fromCumulonimbus.
Figure 4014g. Cirrus hooks or filaments, increasing and becoming denser.
Figure 4014h. Cirrus hooks or filaments, increasing and becoming denser.
Figure 4014i. Cirrus bands and/or Cirrostratus, increasing, growing denser, veil below 45.
Figure 4014j. Cirrus bands and/or Cirrostratus, increasing, growing denser, veil below 45.
Figure 4014k. Cirrus bands and/or Cirrostratus, increasing, growing denser, veil below 45.
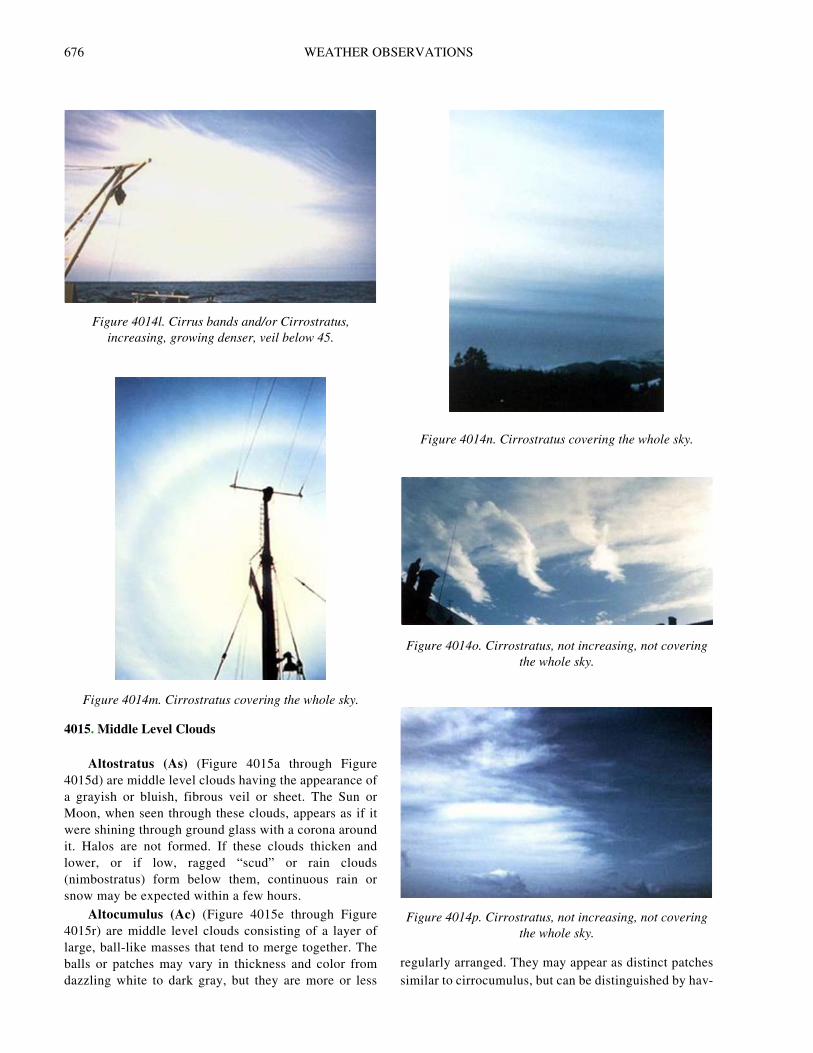
676 WEATHER OBSERVATIONS
4015. Middle Level Clouds
Altostratus (As) (Figure 4015a through Figure 4015d) are middle level clouds having the appearance of a grayish or bluish, fibrous veil or sheet. The Sun orMoon, when seen through these clouds, appears as if it were shining through ground glass with a corona around it. Halos are not formed. If these clouds thicken and lower, or if low, ragged “scud” or rain clouds (nimbostratus) form below them, continuous rain or snow may be expected within a few hours.
Altocumulus (Ac) (Figure 4015e through Figure 4015r) are middle level clouds consisting of a layer of large, ball-like masses that tend to merge together. Theballs or patches may vary in thickness and color from dazzling white to dark gray, but they are more or less
regularly arranged. They may appear as distinct patches similar to cirrocumulus, but can be distinguished by hav-
Figure 4014l. Cirrus bands and/or Cirrostratus, increasing, growing denser, veil below 45.
Figure 4014m. Cirrostratus covering the whole sky.
Figure 4014n. Cirrostratus covering the whole sky.
Figure 4014o. Cirrostratus, not increasing, not covering the whole sky.
Figure 4014p. Cirrostratus, not increasing, not covering the whole sky.
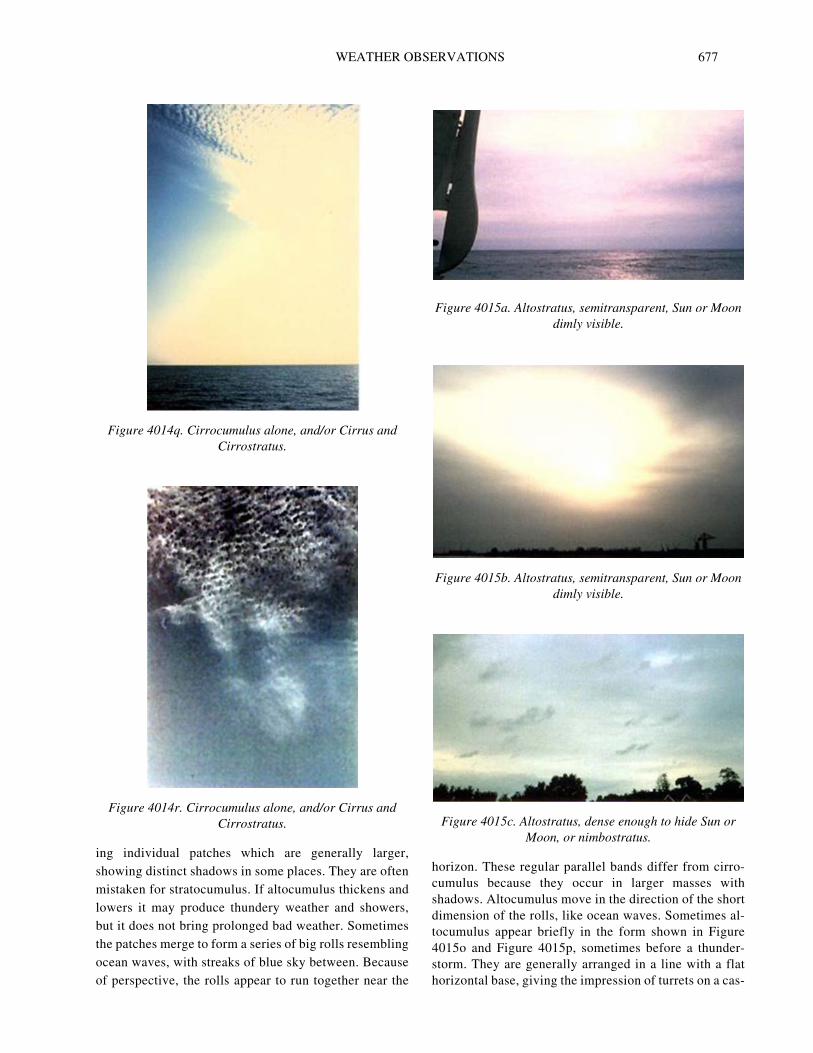
WEATHER OBSERVATIONS 677
ing individual patches which are generally larger, showing distinct shadows in some places. They are often mistaken for stratocumulus. If altocumulus thickens and lowers it may produce thundery weather and showers, but it does not bring prolonged bad weather. Sometimes the patches merge to form a series of big rolls resembling ocean waves, with streaks of blue sky between. Because of perspective, the rolls appear to run together near the
horizon. These regular parallel bands differ from cirro-cumulus because they occur in larger masses with shadows. Altocumulus move in the direction of the short dimension of the rolls, like ocean waves. Sometimes al-tocumulus appear briefly in the form shown in Figure 4015o and Figure 4015p, sometimes before a thunder-storm. They are generally arranged in a line with a flat horizontal base, giving the impression of turrets on a cas-
Figure 4014q. Cirrocumulus alone, and/or Cirrus and Cirrostratus.
Figure 4014r. Cirrocumulus alone, and/or Cirrus and Cirrostratus.
Figure 4015a. Altostratus, semitransparent, Sun or Moon dimly visible.
Figure 4015b. Altostratus, semitransparent, Sun or Moon dimly visible.
Figure 4015c. Altostratus, dense enough to hide Sun or Moon, or nimbostratus.
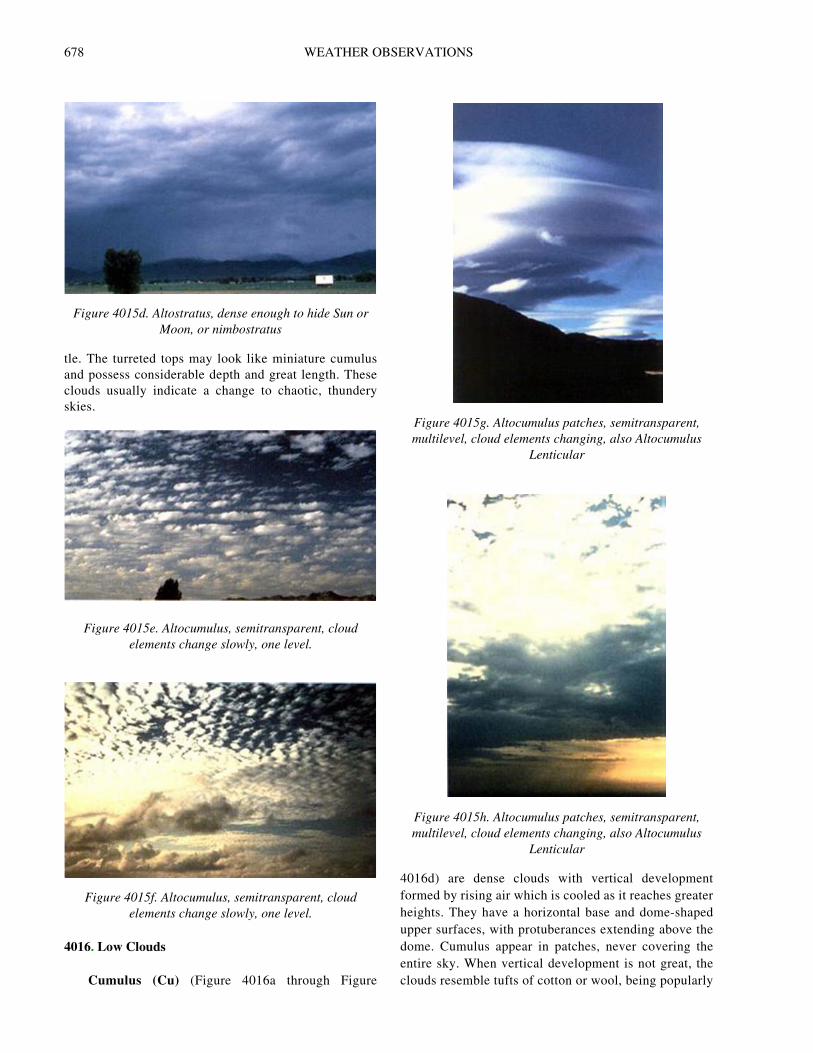
678 WEATHER OBSERVATIONS
tle. The turreted tops may look like miniature cumulus and possess considerable depth and great length. These clouds usually indicate a change to chaotic, thundery skies.
4016. Low Clouds
Cumulus (Cu) (Figure 4016a through Figure
4016d) are dense clouds with vertical development formed by rising air which is cooled as it reaches greater heights. They have a horizontal base and dome-shaped upper surfaces, with protuberances extending above the dome. Cumulus appear in patches, never covering the entire sky. When vertical development is not great, the clouds resemble tufts of cotton or wool, being popularly
Figure 4015d. Altostratus, dense enough to hide Sun or Moon, or nimbostratus
Figure 4015e. Altocumulus, semitransparent, cloud elements change slowly, one level.
Figure 4015f. Altocumulus, semitransparent, cloud elements change slowly, one level.
Figure 4015g. Altocumulus patches, semitransparent, multilevel, cloud elements changing, also Altocumulus
Lenticular
Figure 4015h. Altocumulus patches, semitransparent, multilevel, cloud elements changing, also Altocumulus
Lenticular
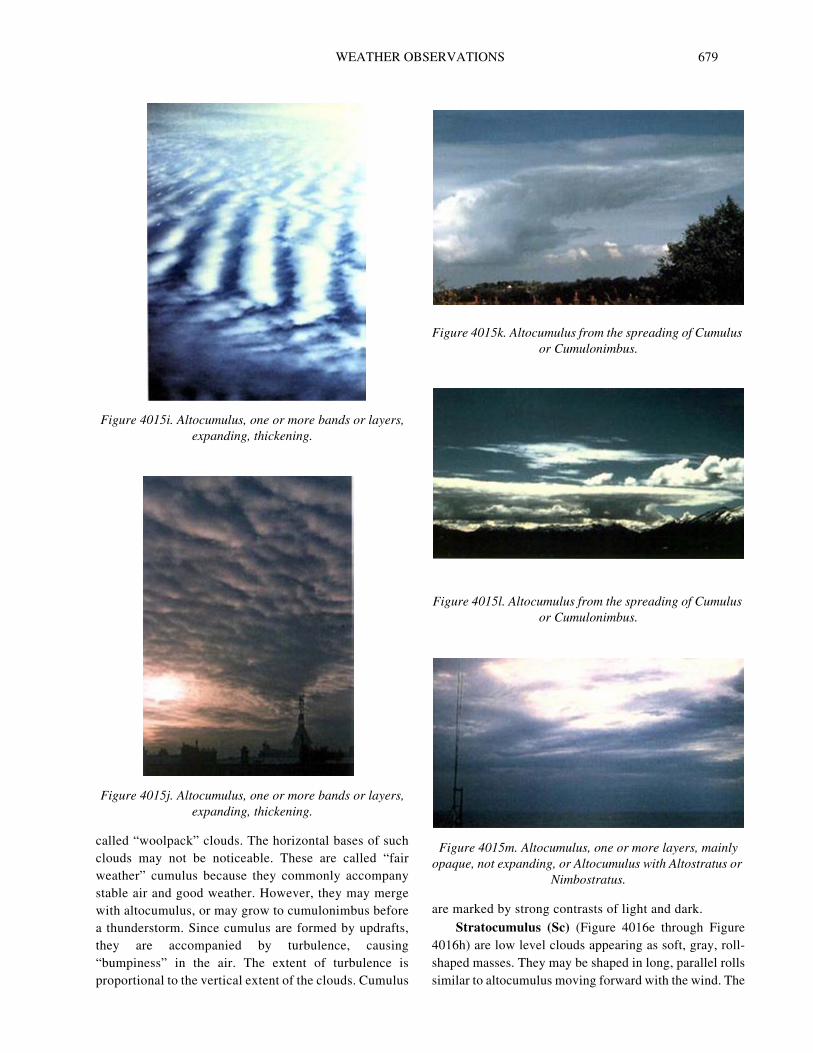
WEATHER OBSERVATIONS 679
called “woolpack” clouds. The horizontal bases of such clouds may not be noticeable. These are called “fair weather” cumulus because they commonly accompany stable air and good weather. However, they may merge with altocumulus, or may grow to cumulonimbus before a thunderstorm. Since cumulus are formed by updrafts,they are accompanied by turbulence, causing “bumpiness” in the air. The extent of turbulence is proportional to the vertical extent of the clouds. Cumulus
are marked by strong contrasts of light and dark.
Stratocumulus (Sc) (Figure 4016e through Figure 4016h) are low level clouds appearing as soft, gray, roll-shaped masses. They may be shaped in long, parallel rolls similar to altocumulus moving forward with the wind. The
Figure 4015i. Altocumulus, one or more bands or layers, expanding, thickening.
Figure 4015j. Altocumulus, one or more bands or layers, expanding, thickening.
Figure 4015k. Altocumulus from the spreading of Cumulus or Cumulonimbus.
Figure 4015l. Altocumulus from the spreading of Cumulus or Cumulonimbus.
Figure 4015m. Altocumulus, one or more layers, mainly opaque, not expanding, or Altocumulus with Altostratus or
Nimbostratus.
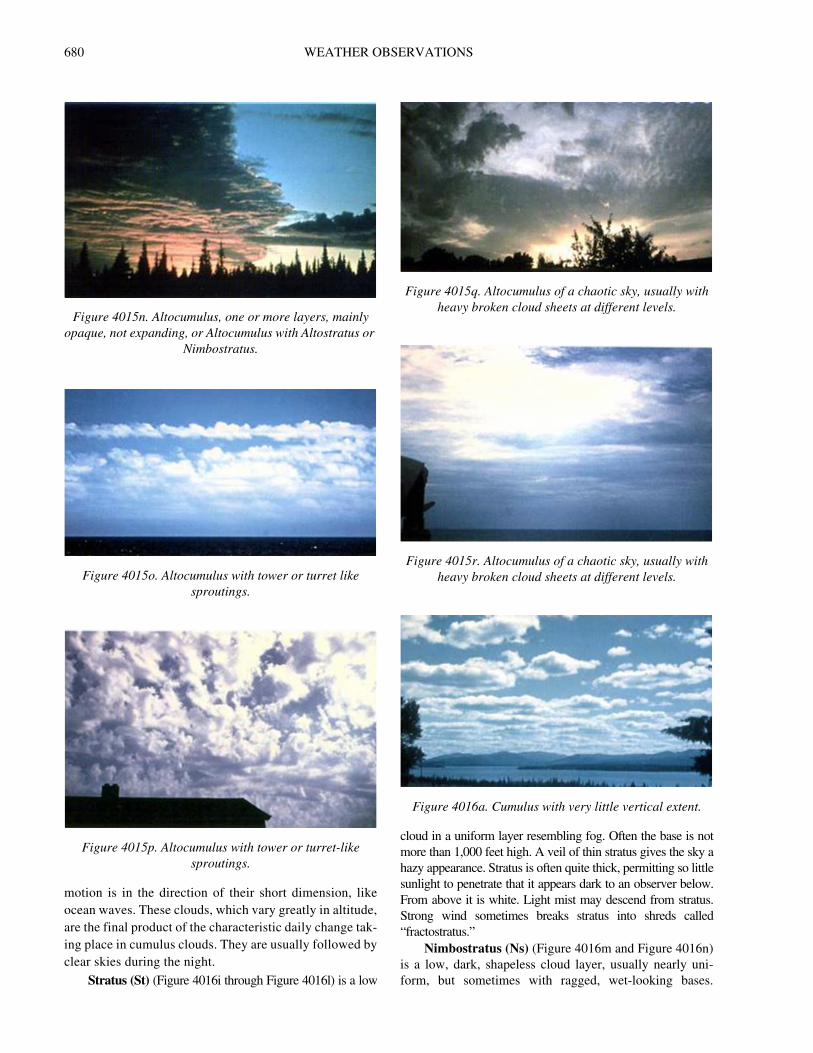
680 WEATHER OBSERVATIONS
motion is in the direction of their short dimension, like ocean waves. These clouds, which vary greatly in altitude, are the final product of the characteristic daily change tak-ing place in cumulus clouds. They are usually followed by clear skies during the night.
Stratus (St) (Figure 4016i through Figure 4016l) is a low
cloud in a uniform layer resembling fog. Often the base is not more than 1,000 feet high. A veil of thin stratus gives the sky a hazy appearance. Stratus is often quite thick, permitting so little sunlight to penetrate that it appears dark to an observer below. From above it is white. Light mist may descend from stratus. Strong wind sometimes breaks stratus into shreds called “fractostratus.”
Nimbostratus (Ns) (Figure 4016m and Figure 4016n) is a low, dark, shapeless cloud layer, usually nearly uni-form, but sometimes with ragged, wet-looking bases.
Figure 4015n. Altocumulus, one or more layers, mainly opaque, not expanding, or Altocumulus with Altostratus or
Nimbostratus.
Figure 4015o. Altocumulus with tower or turret like sproutings.
Figure 4015p. Altocumulus with tower or turret-like sproutings.
Figure 4015q. Altocumulus of a chaotic sky, usually with heavy broken cloud sheets at different levels.
Figure 4015r. Altocumulus of a chaotic sky, usually with heavy broken cloud sheets at different levels.
Figure 4016a. Cumulus with very little vertical extent.
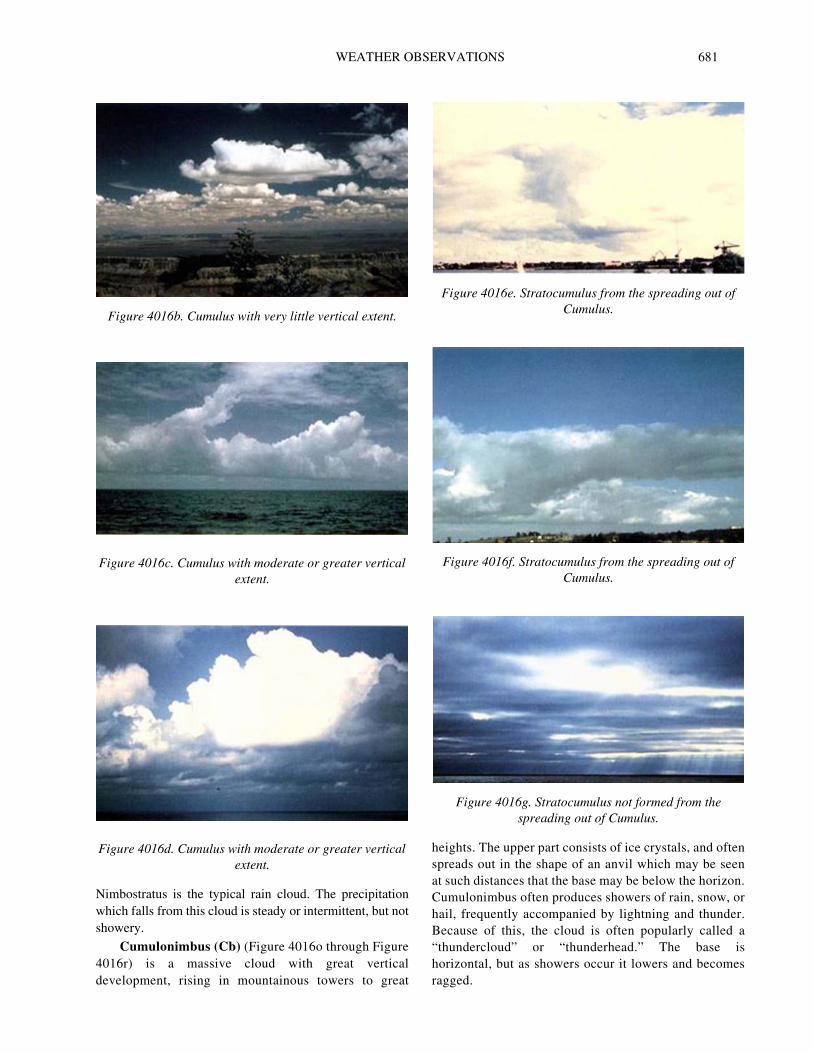
WEATHER OBSERVATIONS 681
Nimbostratus is the typical rain cloud. The precipitation which falls from this cloud is steady or intermittent, but not showery.
Cumulonimbus (Cb) (Figure 4016o through Figure 4016r) is a massive cloud with great verticaldevelopment, rising in mountainous towers to great
heights. The upper part consists of ice crystals, and often spreads out in the shape of an anvil which may be seen at such distances that the base may be below the horizon. Cumulonimbus often produces showers of rain, snow, or hail, frequently accompanied by lightning and thunder. Because of this, the cloud is often popularly called a “thundercloud” or “thunderhead.” The base is horizontal, but as showers occur it lowers and becomes ragged.
Figure 4016b. Cumulus with very little vertical extent.
Figure 4016c. Cumulus with moderate or greater vertical extent.
Figure 4016d. Cumulus with moderate or greater vertical extent.
Figure 4016e. Stratocumulus from the spreading out of Cumulus.
Figure 4016f. Stratocumulus from the spreading out of Cumulus.
Figure 4016g. Stratocumulus not formed from the spreading out of Cumulus.
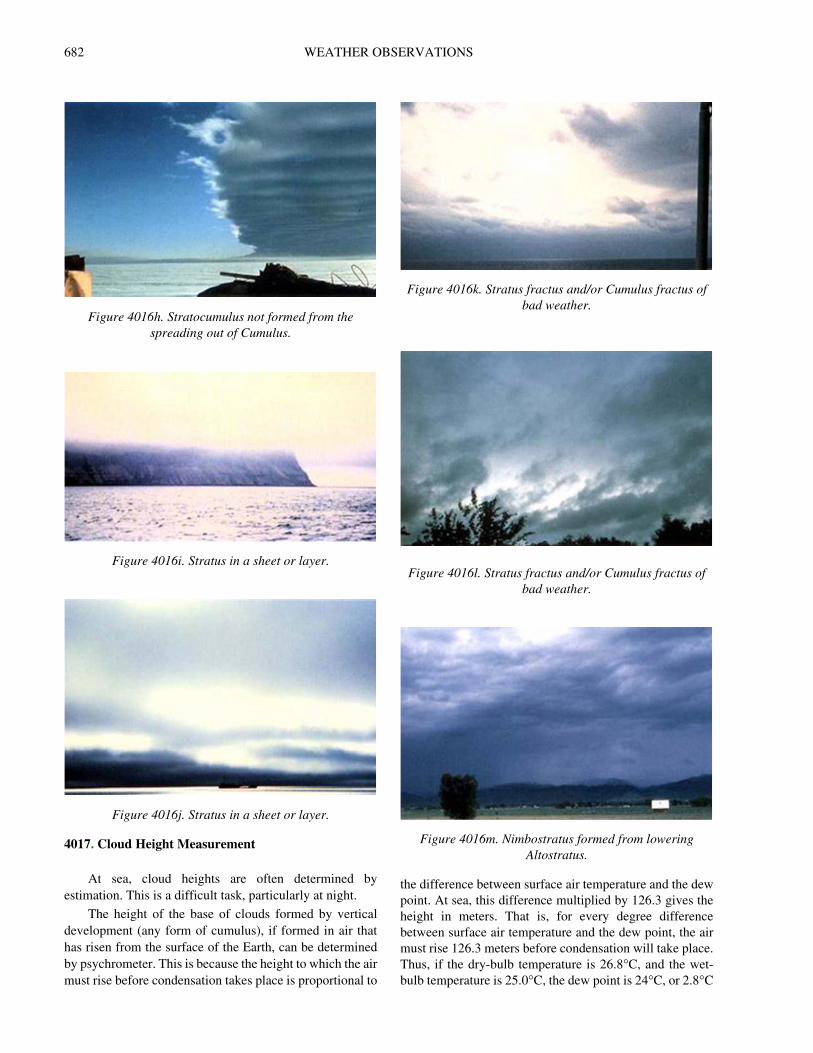
682 WEATHER OBSERVATIONS
4017. Cloud Height Measurement
At sea, cloud heights are often determined by estimation. This is a difficult task, particularly at night.
The height of the base of clouds formed by vertical development (any form of cumulus), if formed in air that has risen from the surface of the Earth, can be determined by psychrometer. This is because the height to which the air must rise before condensation takes place is proportional to
the difference between surface air temperature and the dew point. At sea, this difference multiplied by 126.3 gives the height in meters. That is, for every degree difference between surface air temperature and the dew point, the air must rise 126.3 meters before condensation will take place. Thus, if the dry-bulb temperature is 26.8°C, and the wet-bulb temperature is 25.0°C, the dew point is 24°C, or 2.8°C
Figure 4016h. Stratocumulus not formed from the spreading out of Cumulus.
Figure 4016i. Stratus in a sheet or layer.
Figure 4016j. Stratus in a sheet or layer.
Figure 4016k. Stratus fractus and/or Cumulus fractus of bad weather.
Figure 4016l. Stratus fractus and/or Cumulus fractus of bad weather.
Figure 4016m. Nimbostratus formed from lowering Altostratus.
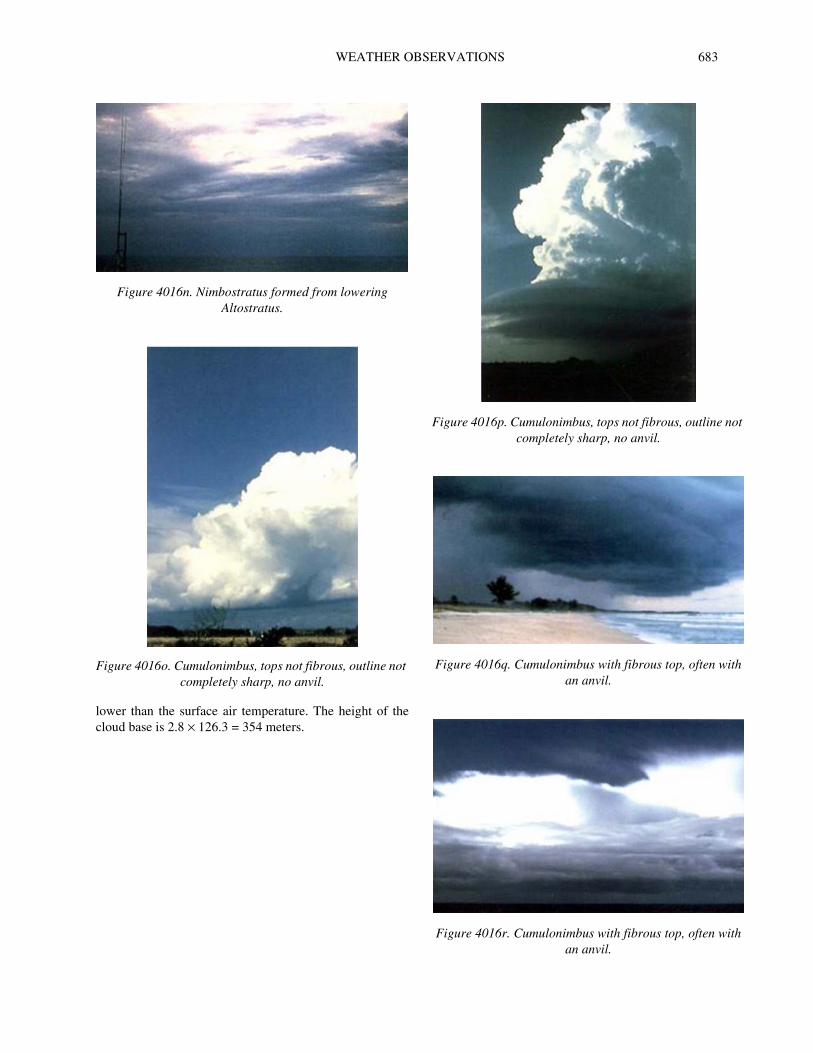
WEATHER OBSERVATIONS 683
lower than the surface air temperature. The height of the cloud base is 2.8 × 126.3 = 354 meters.
Figure 4016n. Nimbostratus formed from lowering Altostratus.
Figure 4016o. Cumulonimbus, tops not fibrous, outline notcompletely sharp, no anvil.
Figure 4016p. Cumulonimbus, tops not fibrous, outline not completely sharp, no anvil.
Figure 4016q. Cumulonimbus with fibrous top, often with an anvil.
Figure 4016r. Cumulonimbus with fibrous top, often with an anvil.
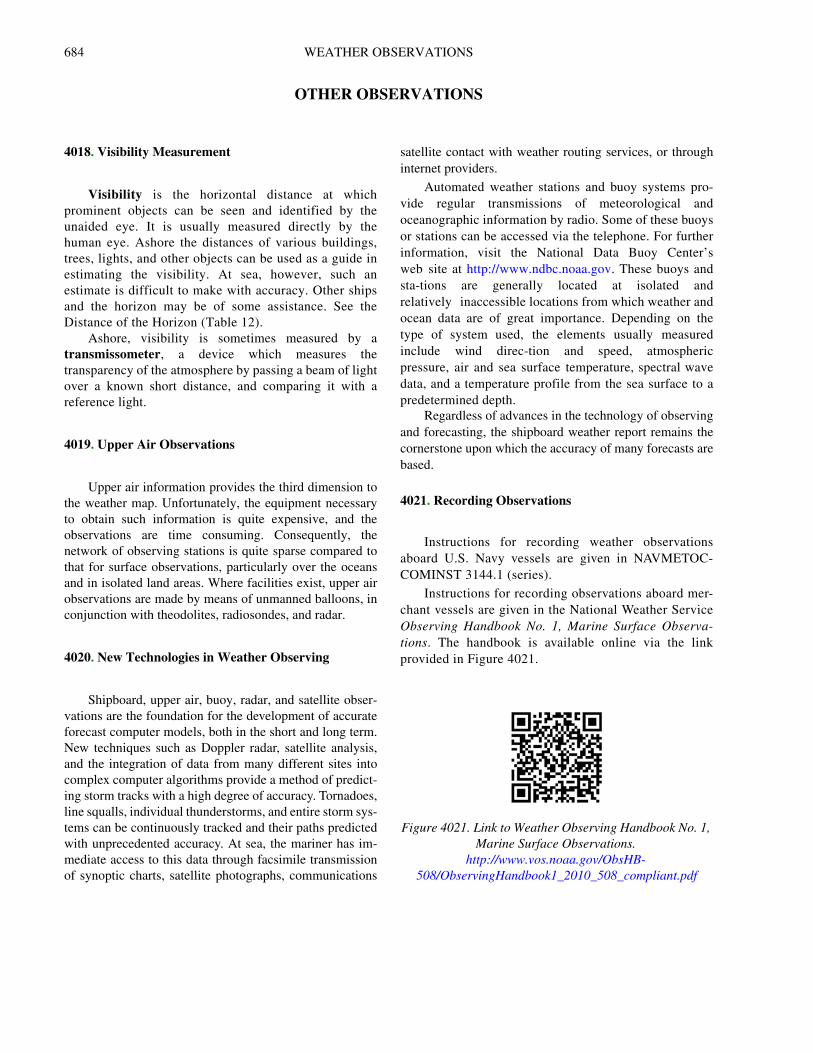
684 WEATHER OBSERVATIONS
OTHER OBSERVATIONS
4018. Visibility Measurement
Visibility is the horizontal distance at which prominent objects can be seen and identified by the unaided eye. It is usually measured directly by the human eye. Ashore the distances of various buildings, trees, lights, and other objects can be used as a guide in estimating the visibility. At sea, however, such an estimate is difficult to make with accuracy. Other ships and the horizon may be of some assistance. See the Distance of the Horizon (Table 12).
Ashore, visibility is sometimes measured by atransmissometer, a device which measures the transparency of the atmosphere by passing a beam of light over a known short distance, and comparing it with a reference light.
4019. Upper Air Observations
Upper air information provides the third dimension to the weather map. Unfortunately, the equipment necessary to obtain such information is quite expensive, and the observations are time consuming. Consequently, the network of observing stations is quite sparse compared to that for surface observations, particularly over the oceans and in isolated land areas. Where facilities exist, upper air observations are made by means of unmanned balloons, in conjunction with theodolites, radiosondes, and radar.
4020. New Technologies in Weather Observing
Shipboard, upper air, buoy, radar, and satellite obser-vations are the foundation for the development of accurate forecast computer models, both in the short and long term. New techniques such as Doppler radar, satellite analysis, and the integration of data from many different sites into complex computer algorithms provide a method of predict-ing storm tracks with a high degree of accuracy. Tornadoes, line squalls, individual thunderstorms, and entire storm sys-tems can be continuously tracked and their paths predicted with unprecedented accuracy. At sea, the mariner has im-mediate access to this data through facsimile transmission of synoptic charts, satellite photographs, communications
satellite contact with weather routing services, or through internet providers.
Automated weather stations and buoy systems pro-vide regular transmissions of meteorological and oceanographic information by radio. Some of these buoys or stations can be accessed via the telephone. For further information, visit the National Data Buoy Center’s web site at http://www.ndbc.noaa.gov. These buoys and sta-tions are generally located at isolated and relatively inaccessible locations from which weather and ocean data are of great importance. Depending on the type of system used, the elements usually measured include wind direc-tion and speed, atmospheric pressure, air and sea surface temperature, spectral wave data, and a temperature profile from the sea surface to a predetermined depth.
Regardless of advances in the technology of observing and forecasting, the shipboard weather report remains the cornerstone upon which the accuracy of many forecasts are based.
4021. Recording Observations
Instructions for recording weather observations aboard U.S. Navy vessels are given in NAVMETOC-COMINST 3144.1 (series).
Instructions for recording observations aboard mer-chant vessels are given in the National Weather Service Observing Handbook No. 1, Marine Surface Observa-tions. The handbook is available online via the link provided in Figure 4021.
Figure 4021. Link to Weather Observing Handbook No. 1, Marine Surface Observations.
http://www.vos.noaa.gov/ObsHB-508/ObservingHandbook1_2010_508_compliant.pdf
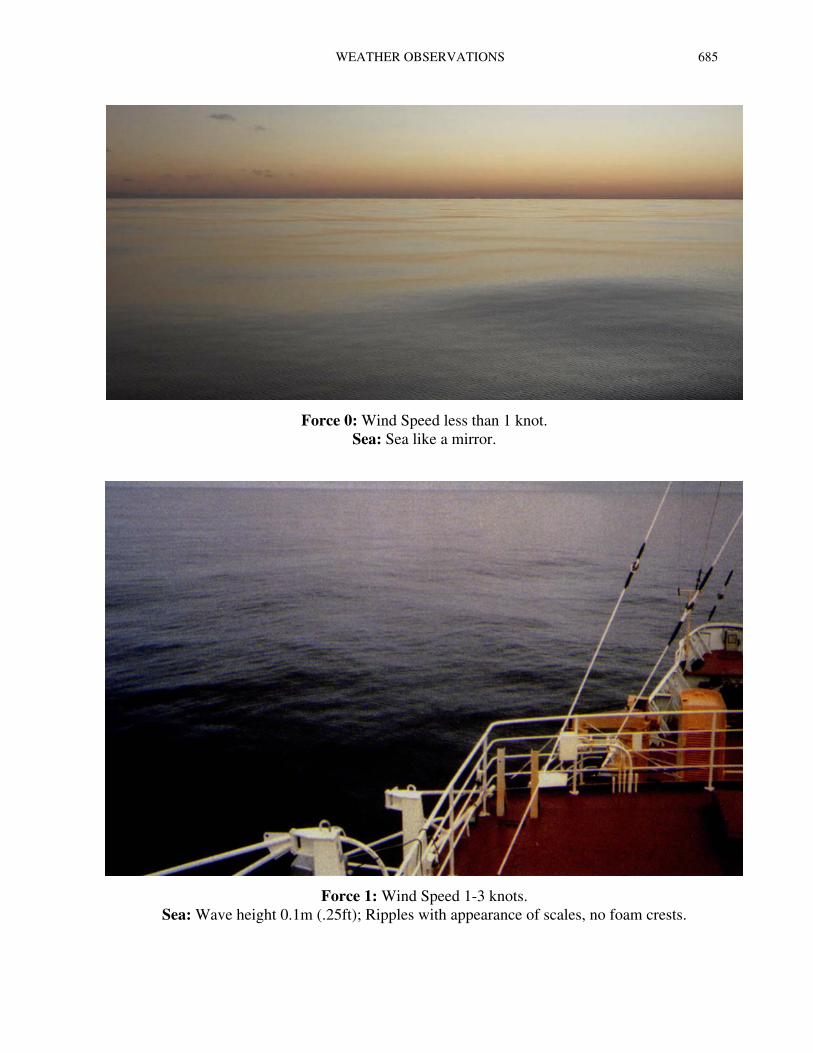
WEATHER OBSERVATIONS 685
Force 0: Wind Speed less than 1 knot.Sea: Sea like a mirror.
Force 1: Wind Speed 1-3 knots.Sea: Wave height 0.1m (.25ft); Ripples with appearance of scales, no foam crests.
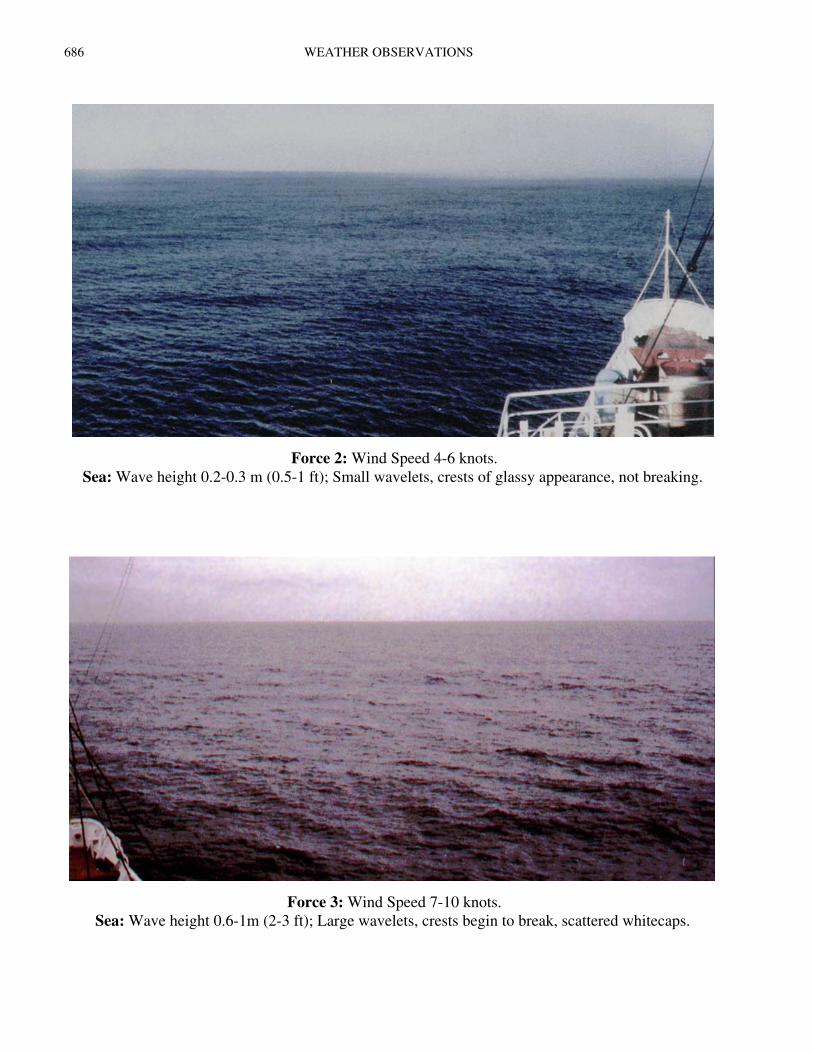
686 WEATHER OBSERVATIONS
Force 2: Wind Speed 4-6 knots. Sea: Wave height 0.2-0.3 m (0.5-1 ft); Small wavelets, crests of glassy appearance, not breaking.
Force 3: Wind Speed 7-10 knots. Sea: Wave height 0.6-1m (2-3 ft); Large wavelets, crests begin to break, scattered whitecaps.
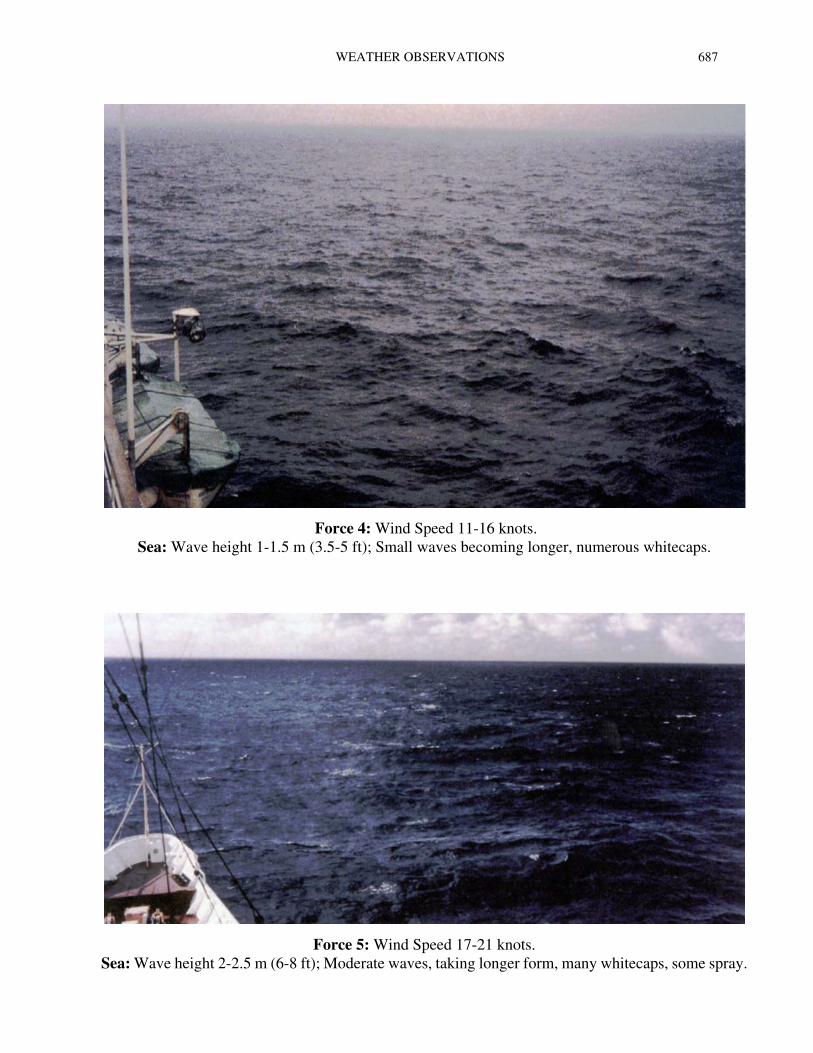
WEATHER OBSERVATIONS 687
Force 4: Wind Speed 11-16 knots. Sea: Wave height 1-1.5 m (3.5-5 ft); Small waves becoming longer, numerous whitecaps.
Force 5: Wind Speed 17-21 knots. Sea: Wave height 2-2.5 m (6-8 ft); Moderate waves, taking longer form, many whitecaps, some spray.
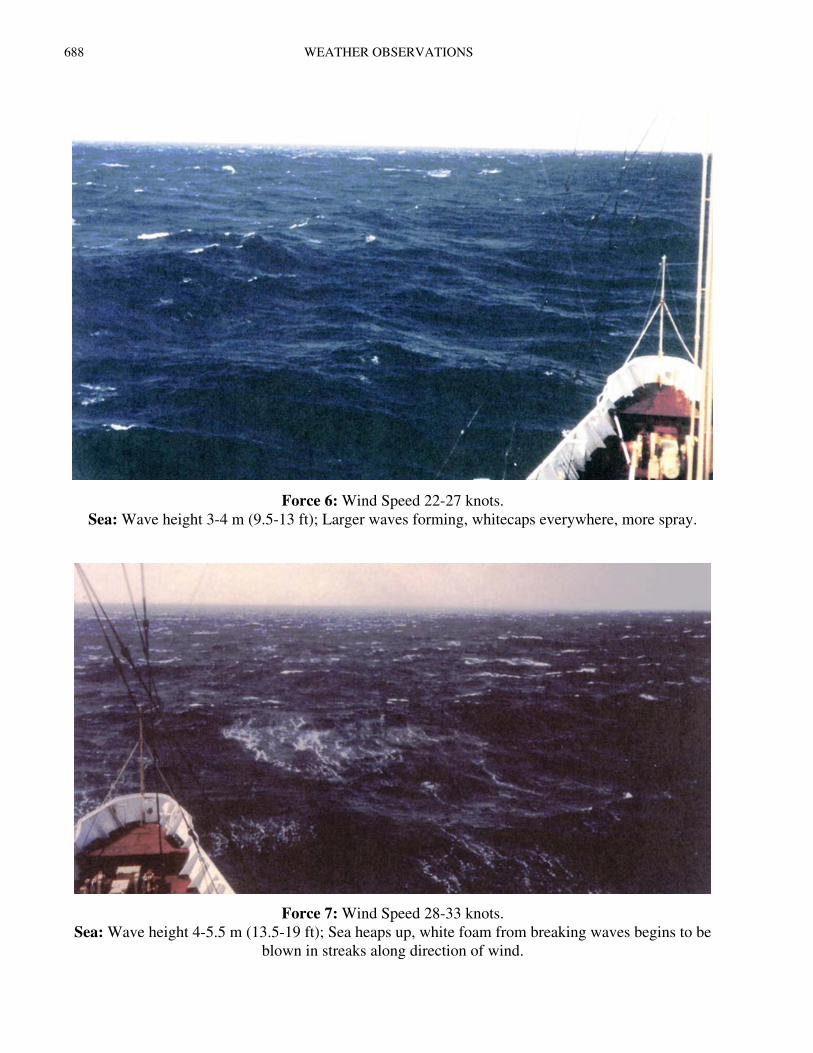
688 WEATHER OBSERVATIONS
Force 6: Wind Speed 22-27 knots. Sea: Wave height 3-4 m (9.5-13 ft); Larger waves forming, whitecaps everywhere, more spray.
Force 7: Wind Speed 28-33 knots. Sea: Wave height 4-5.5 m (13.5-19 ft); Sea heaps up, white foam from breaking waves begins to be
blown in streaks along direction of wind.
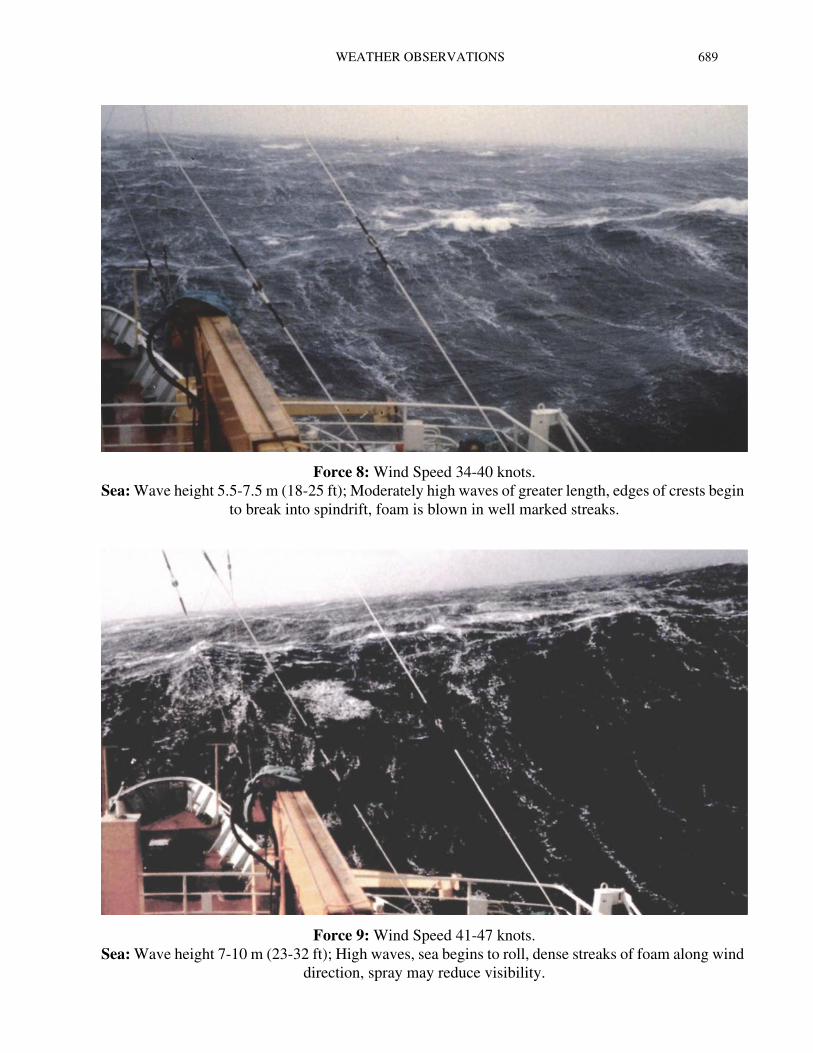
WEATHER OBSERVATIONS 689
Force 8: Wind Speed 34-40 knots. Sea: Wave height 5.5-7.5 m (18-25 ft); Moderately high waves of greater length, edges of crests begin
to break into spindrift, foam is blown in well marked streaks.
Force 9: Wind Speed 41-47 knots.Sea: Wave height 7-10 m (23-32 ft); High waves, sea begins to roll, dense streaks of foam along wind
direction, spray may reduce visibility.
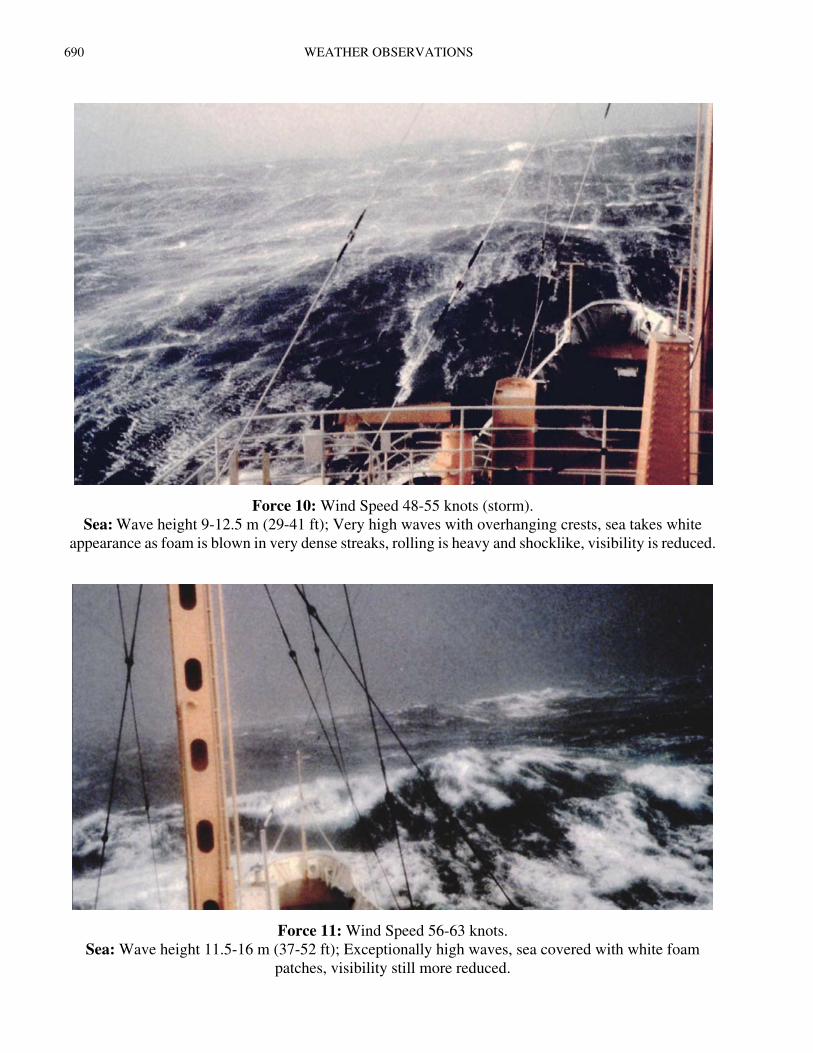
690 WEATHER OBSERVATIONS
Force 10: Wind Speed 48-55 knots (storm). Sea: Wave height 9-12.5 m (29-41 ft); Very high waves with overhanging crests, sea takes white
appearance as foam is blown in very dense streaks, rolling is heavy and shocklike, visibility is reduced.
Force 11: Wind Speed 56-63 knots. Sea: Wave height 11.5-16 m (37-52 ft); Exceptionally high waves, sea covered with white foam
patches, visibility still more reduced.
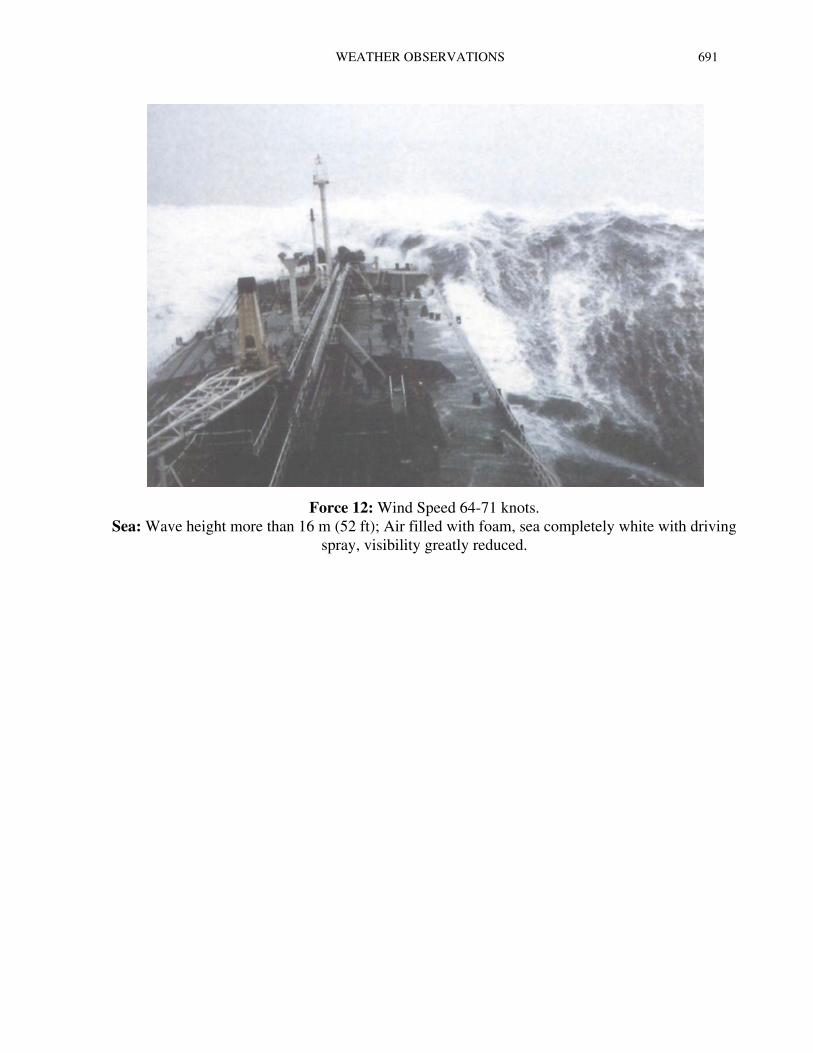
WEATHER OBSERVATIONS 691
Force 12: Wind Speed 64-71 knots. Sea: Wave height more than 16 m (52 ft); Air filled with foam, sea completely white with driving
spray, visibility greatly reduced.

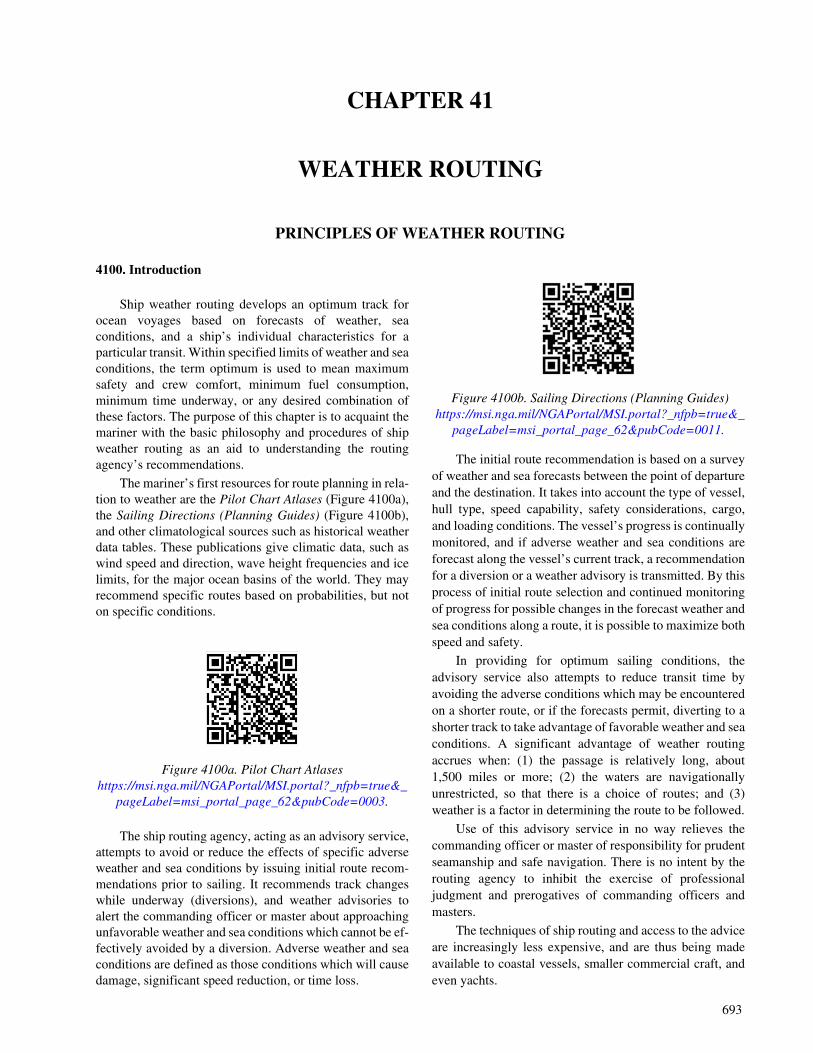
693
CHAPTER 41
WEATHER ROUTING
PRINCIPLES OF WEATHER ROUTING
4100. Introduction
Ship weather routing develops an optimum track for ocean voyages based on forecasts of weather, sea conditions, and a ship’s individual characteristics for a particular transit. Within specified limits of weather and sea conditions, the term optimum is used to mean maximum safety and crew comfort, minimum fuel consumption, minimum time underway, or any desired combination of these factors. The purpose of this chapter is to acquaint the mariner with the basic philosophy and procedures of ship weather routing as an aid to understanding the routing agency’s recommendations.
The mariner’s first resources for route planning in rela-tion to weather are the Pilot Chart Atlases (Figure 4100a), the Sailing Directions (Planning Guides) (Figure 4100b), and other climatological sources such as historical weather data tables. These publications give climatic data, such as wind speed and direction, wave height frequencies and ice limits, for the major ocean basins of the world. They may recommend specific routes based on probabilities, but not on specific conditions.
The ship routing agency, acting as an advisory service, attempts to avoid or reduce the effects of specific adverse weather and sea conditions by issuing initial route recom-mendations prior to sailing. It recommends track changes while underway (diversions), and weather advisories to alert the commanding officer or master about approaching unfavorable weather and sea conditions which cannot be ef-fectively avoided by a diversion. Adverse weather and sea conditions are defined as those conditions which will cause damage, significant speed reduction, or time loss.
The initial route recommendation is based on a survey of weather and sea forecasts between the point of departure and the destination. It takes into account the type of vessel, hull type, speed capability, safety considerations, cargo, and loading conditions. The vessel’s progress is continually monitored, and if adverse weather and sea conditions are forecast along the vessel’s current track, a recommendation for a diversion or a weather advisory is transmitted. By this process of initial route selection and continued monitoring of progress for possible changes in the forecast weather and sea conditions along a route, it is possible to maximize both speed and safety.
In providing for optimum sailing conditions, the advisory service also attempts to reduce transit time by avoiding the adverse conditions which may be encountered on a shorter route, or if the forecasts permit, diverting to a shorter track to take advantage of favorable weather and sea conditions. A significant advantage of weather routing accrues when: (1) the passage is relatively long, about 1,500 miles or more; (2) the waters are navigationally unrestricted, so that there is a choice of routes; and (3) weather is a factor in determining the route to be followed.
Use of this advisory service in no way relieves the commanding officer or master of responsibility for prudent seamanship and safe navigation. There is no intent by the routing agency to inhibit the exercise of professional judgment and prerogatives of commanding officers and masters.
The techniques of ship routing and access to the advice are increasingly less expensive, and are thus being made available to coastal vessels, smaller commercial craft, and even yachts.
Figure 4100a. Pilot Chart Atlases https://msi.nga.mil/NGAPortal/MSI.portal?_nfpb=true&_
pageLabel=msi_portal_page_62&pubCode=0003.
Figure 4100b. Sailing Directions (Planning Guides) https://msi.nga.mil/NGAPortal/MSI.portal?_nfpb=true&_
pageLabel=msi_portal_page_62&pubCode=0011.
694 WEATHER ROUTING
4101. Historical Perspective
The advent of extended range forecasting and the development of selective climatology, along with powerful computer modeling techniques, have made ship routing systems possible. The ability to effectively advise ships to take advantage of favorable weather was hampered previously by forecast limitations and the lack of an effective communications system.
Development work in the area of data accumulation and climatology has a long history. Benjamin Franklin, as deputy postmaster general of the British Colonies in North America, produced a chart of the Gulf Stream from information supplied by masters of New England whaling ships. This first mapping of the Gulf Stream helped improve the mail packet service between the British Colonies and England. In some passages the sailing time was reduced by as much as 14 days over routes previously sailed.
In the mid-19th century, Matthew Fontaine Maury compiled large amounts of atmospheric and oceanographic data from ships’ log books. For the first time, a climatology of ocean weather and currents of the world was available to the mariner. This information was used by Maury to develop seasonally recommended routes for sailing ships and early steam powered vessels in the latter half of the 19th century. In many cases, Maury’s charts were proved correct by the savings in transit time. Average transit time on the New York to California via Cape Horn route was reduced from 183 days to 139 days with the use of his recommended seasonal routes.
In the 1950’s the concept of ship weather routing was put into operation by several private meteorological groups and by the U.S. Navy. By applying the available surface and upper air forecasts to transoceanic shipping, it was possible to effectively avoid much heavy weather while generally sailing shorter routes than previously. The development of computers, the Internet and communications technology has made weather routing available to nearly everyone afloat.
4102. System Types
Optimum Track Ship Routing (OTSR), the ship rout-ing service of the U.S. Navy, utilizes short to medium range forecasting techniques in route selection and surveillance procedures. The short to medium range dynamic forecasts of 3 to 10 days are derived from meteorological equations processed by high-speed super computers. These forecasts are computed at least twice daily from a data base of global surface and upper air observations, and include surface pressure, upper air constant pressure heights and spectral wave values. A significant increase in data acquisition, par-ticularly from satellite imagery over oceans and data sparse areas have extended the time period for which these fore-casts are useful.
Selective climatology has been effective in predicting average conditions months in advance during such events as the El Nino Southern Oscillation (ENSO) which encom-passes both the El Nino and La Nina. Such predictions do
not represent forecasting, but can indicate the likelihood of certain atmospheric weather patterns appearing or prevailing.
For extended range forecasting, generally beyond ten days, computer models use a combination of analogs, cli-matology and ensemble techniques to find the logical sequence of events following the dynamic forecasts of 3 to 10 days. Beyond ten days, climatology is used to determine the optimum track.
Aviation was first in applying the principle of mini-mum time tracks (MTT) to a changing wind field. But the problem of finding an MTT for a specific flight is much simpler than for a transoceanic ship passage because an air-craft's transit time is much shorter than a ship's. Thus, marine minimum time tracks require significantly longer range forecasts to develop an optimum route.
Automation has enabled ship routing agencies to de-velop realistic minimum time tracks. Computation of minimum time tracks makes use of:
1. A navigation system to compute route distance, time enroute, estimated times of arrival (ETA’s), and to provide 6 hourly DR synoptic positions for the range of the dynamic forecasts for the ship’s current track.
2. A surveillance system to survey wind, seas, fog, and ocean currents obtained from the dynamic and climatological fields.
3. An environmental constraint system imposed as part of the route selection and surveillance process. Constraints are the upper limits of wind and seas desired for the transit. They are determined by the ship’s loading, speed capability, and vulnerability. The constraint system is an important part of the route selection process and acts as a warning system when the weather and sea forecast along the present track exceeds predetermined limits.
4. Ship speed characteristics used to approximate ship’s speed of advance (SOA) while transiting the forecast sea states.
Criteria for route selection reflect a balance between the captain’s desired levels of speed, safety, comfort, and consideration of operations such as fleet maneuvers, fish-ing, towing, etc.
Ship weather routing services are being offered by many nations. These include Japan, United Kingdom, Rus-sia, Netherlands, Germany, and the United States. Also, several private firms provide routing services to shipping industry clients. Several personal computer-based software applications have become available, making weather rout-ing available to virtually everyone at sea.
There are two general types of routing services avail-able. The first uses techniques similar to the Navy’s Optimum Track Ship Routing (OTSR) system to forecast conditions and compute routing recommendations, which are then broadcast to the vessel. Because this service is per-
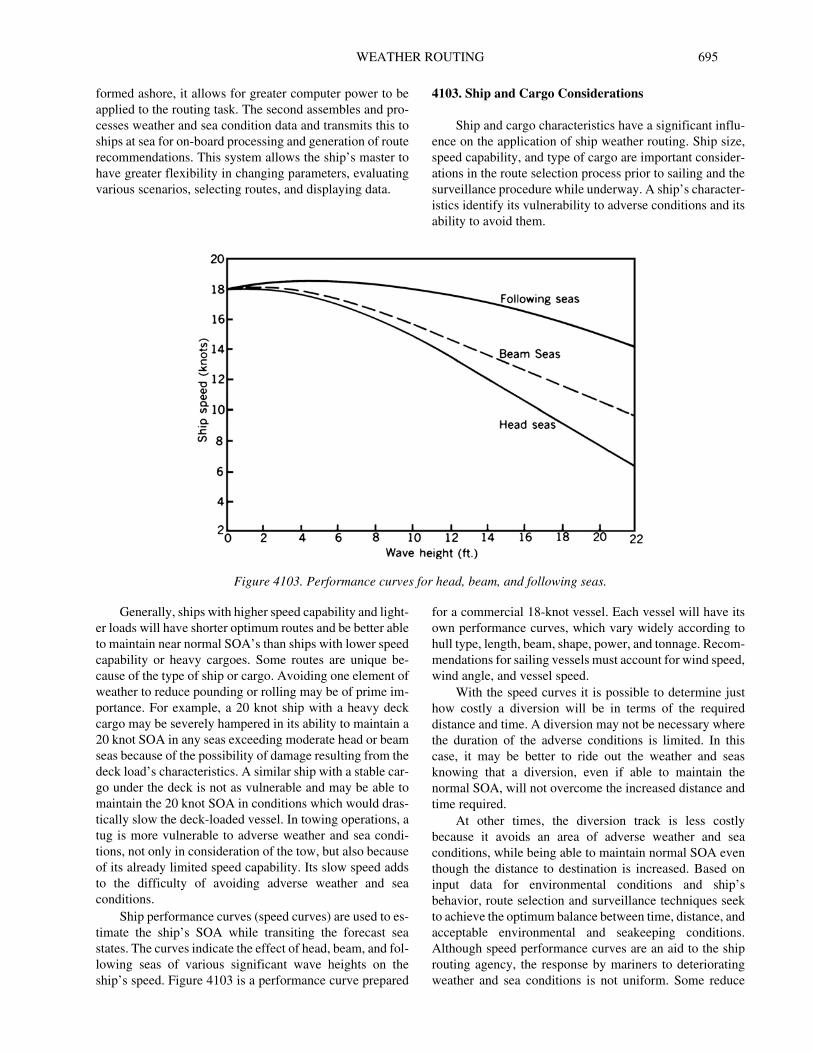
WEATHER ROUTING 695
formed ashore, it allows for greater computer power to be applied to the routing task. The second assembles and pro-cesses weather and sea condition data and transmits this to ships at sea for on-board processing and generation of route recommendations. This system allows the ship’s master to have greater flexibility in changing parameters, evaluating various scenarios, selecting routes, and displaying data.
4103. Ship and Cargo Considerations
Ship and cargo characteristics have a significant influ-ence on the application of ship weather routing. Ship size, speed capability, and type of cargo are important consider-ations in the route selection process prior to sailing and the surveillance procedure while underway. A ship’s character-istics identify its vulnerability to adverse conditions and its ability to avoid them.
Generally, ships with higher speed capability and light-er loads will have shorter optimum routes and be better able to maintain near normal SOA’s than ships with lower speed capability or heavy cargoes. Some routes are unique be-cause of the type of ship or cargo. Avoiding one element of weather to reduce pounding or rolling may be of prime im-portance. For example, a 20 knot ship with a heavy deck cargo may be severely hampered in its ability to maintain a 20 knot SOA in any seas exceeding moderate head or beam seas because of the possibility of damage resulting from the deck load’s characteristics. A similar ship with a stable car-go under the deck is not as vulnerable and may be able to maintain the 20 knot SOA in conditions which would dras-tically slow the deck-loaded vessel. In towing operations, a tug is more vulnerable to adverse weather and sea condi-tions, not only in consideration of the tow, but also because of its already limited speed capability. Its slow speed adds to the difficulty of avoiding adverse weather and sea conditions.
Ship performance curves (speed curves) are used to es-timate the ship’s SOA while transiting the forecast sea states. The curves indicate the effect of head, beam, and fol-lowing seas of various significant wave heights on the ship’s speed. Figure 4103 is a performance curve prepared
for a commercial 18-knot vessel. Each vessel will have its own performance curves, which vary widely according to hull type, length, beam, shape, power, and tonnage. Recom-mendations for sailing vessels must account for wind speed, wind angle, and vessel speed.
With the speed curves it is possible to determine just how costly a diversion will be in terms of the required distance and time. A diversion may not be necessary where the duration of the adverse conditions is limited. In this case, it may be better to ride out the weather and seas knowing that a diversion, even if able to maintain the normal SOA, will not overcome the increased distance and time required.
At other times, the diversion track is less costly because it avoids an area of adverse weather and sea conditions, while being able to maintain normal SOA even though the distance to destination is increased. Based on input data for environmental conditions and ship’s behavior, route selection and surveillance techniques seek to achieve the optimum balance between time, distance, and acceptable environmental and seakeeping conditions. Although speed performance curves are an aid to the ship routing agency, the response by mariners to deteriorating weather and sea conditions is not uniform. Some reduce
Figure 4103. Performance curves for head, beam, and following seas.
696 WEATHER ROUTING
speed voluntarily or change heading sooner than others when unfavorable conditions are encountered. Certain waves with characteristics such that the ship’s bow and stern are in successive crests and troughs present special problems for the mariner. Being nearly equal to the ship’s length, such wavelengths may induce very dangerous stresses. The degree of hogging and sagging and the associated danger may be more apparent to the mariner than to the ship routing agency. Therefore, adjustment in course and speed for a more favorable ride must be initiated by the commanding officer or master when this situation is encountered.
4104. Environmental Factors
Environmental factors of importance to ship weather routing are those elements of the atmosphere and ocean that may produce a change in the status of a ship transit. In ship routing, consideration is given to wind, seas, fog, ice, and ocean currents. While all of the environmental factors are important for route selection and surveillance, optimum routing is normally considered attained if the effects of wind and seas can be optimized.
Wind: The effect of wind speed on ship performance is difficult to determine. In light winds (less than 20-knots), ships lose speed in headwinds and gain speed slightly in fol-lowing winds. For higher wind speeds, ship speed is reduced in both head and following winds. This is due to the increased wave action, which even in following seas results in increased drag from steering corrections, and indicates the importance of sea conditions in determining ship perfor-mance. In dealing with wind, it is also necessary to know the ship's sail area. High winds will have a greater adverse effect on a large, fully loaded container ship or car carrier than a fully loaded tanker of similar length. This effect is most noticeable when docking or when navigating in re-stricted waters, but the effect of beam winds over several days at sea can also be considerable. For sailing vessels, the wind is critical and accurate forecasts are vital to a success-ful voyage.
Wave Height: Wave height is the major factor affecting ship performance. Wave action is responsible for ship motions which reduce propeller thrust and cause increased drag from steering corrections. The relationship of ship speed to wave direction and height is similar to that of wind. Head seas reduce ship speed, while following seas increase ship speed slightly to a certain point, beyond which they retard it. In heavy seas, exact performance may be difficult to predict because of the adjustments to course and speed for shiphandling and comfort. Although the effect of sea and swell is much greater for large commercial vessels than is wind speed and direction, it is difficult to separate the two in ship routing.
In an effort to provide a more detailed description of the actual and forecast sea state, several countries and pri-vate companies have developed global and regional wave
forecasting computer programs. These wave forecasts are based on the analyzed and forecast planetary boundary wind fields and are produced for both the Northern and Southern Hemispheres out to 144 hours or more. Most of these forecasts produce values for significant wave height, primary wave height and secondary wave height, as well as direction and period of these waves.
Fog: Fog, while not directly affecting ship perfor-mance, should be avoided as much as feasible, in order to maintain normal speed in safe conditions. Extensive areas of fog during summertime can be avoided by selecting a lower latitude route than one based solely upon wind and seas. Although the route may be longer, transit time may be less due to not having to reduce speed in reduced visi-bility. In addition, crew fatigue due to increased watchkeeping vigilance can be reduced.
North Wall Effect: During the Northern Hemisphere fall and winter, the waters to the north of the Gulf Stream in the North Atlantic are at their coldest, while the Gulf Stream itself remains at a constant relatively warm tem-perature. After passage of a strong cold front or behind a developing coastal low pressure system, Arctic air is sometimes drawn off the Mid-Atlantic coast of the United States and out over the warm waters of the Gulf Stream by northerly winds. This cold air is warmed as it passes over the Gulf Stream, resulting in rapid and intense deepening of the low pressure system and higher than normal surface winds. Higher waves and confused seas result from these winds. When these winds oppose the northeast set of the current, the result is increased wave heights and a shorten-ing of the wave period. If the opposing current is sufficiently strong, the waves will break. These phenome-na are collectively called the “North Wall Effect,” referring to the region of most dramatic temperature change between the cold water to the north and the warm Gulf Stream water to the south. The most dangerous as-pect of this phenomenon is that the strong winds and extremely high, steep waves occur in a limited area and may develop without warning. Thus, a ship that is labor-ing in near-gale force northerly winds and rough seas, proceeding on a northerly course, can suddenly encounter storm force winds and dangerously high breaking seas. Numerous ships have foundered off the North American coast in the approximate position of the Gulf Stream’s North Wall. A similar phenomenon occurs in the North Pacific near the Kuroshio Current and off the Southeast African coast near the Agulhas Current.
Ocean Currents: Ocean currents do not present a significant routing problem, but they can be a determining factor in route selection and diversion. This is especially true when the points of departure and destination are at relatively low latitudes. The important considerations to be evaluated are the difference in distance between a great-circle route and a route selected for optimum cur-rent, with the expected increase in SOA from the following current, and the decreased probability of a di-
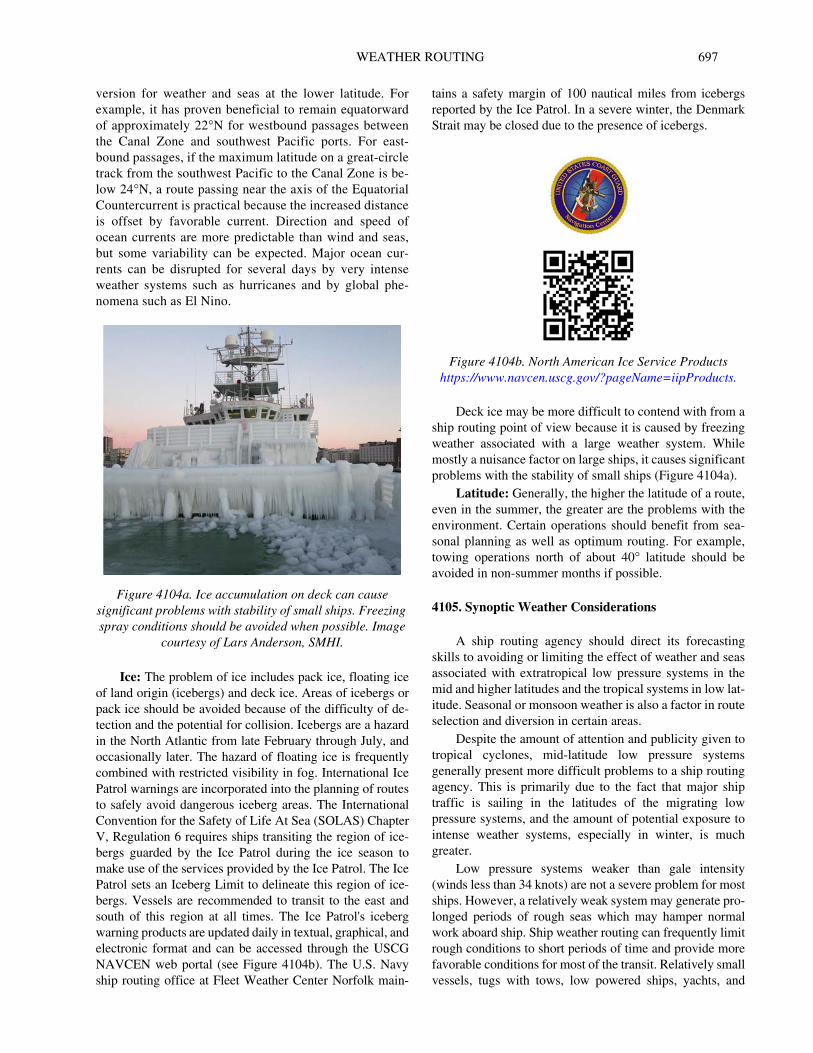
WEATHER ROUTING 697
version for weather and seas at the lower latitude. For example, it has proven beneficial to remain equatorward of approximately 22°N for westbound passages between the Canal Zone and southwest Pacific ports. For east-bound passages, if the maximum latitude on a great-circle track from the southwest Pacific to the Canal Zone is be-low 24°N, a route passing near the axis of the Equatorial Countercurrent is practical because the increased distance is offset by favorable current. Direction and speed of ocean currents are more predictable than wind and seas, but some variability can be expected. Major ocean cur-rents can be disrupted for several days by very intense weather systems such as hurricanes and by global phe-nomena such as El Nino.
Ice: The problem of ice includes pack ice, floating ice of land origin (icebergs) and deck ice. Areas of icebergs or pack ice should be avoided because of the difficulty of de-tection and the potential for collision. Icebergs are a hazard in the North Atlantic from late February through July, and occasionally later. The hazard of floating ice is frequently combined with restricted visibility in fog. International Ice Patrol warnings are incorporated into the planning of routes to safely avoid dangerous iceberg areas. The International Convention for the Safety of Life At Sea (SOLAS) Chapter V, Regulation 6 requires ships transiting the region of ice-bergs guarded by the Ice Patrol during the ice season to make use of the services provided by the Ice Patrol. The Ice Patrol sets an Iceberg Limit to delineate this region of ice-bergs. Vessels are recommended to transit to the east and south of this region at all times. The Ice Patrol's iceberg warning products are updated daily in textual, graphical, and electronic format and can be accessed through the USCG NAVCEN web portal (see Figure 4104b). The U.S. Navy ship routing office at Fleet Weather Center Norfolk main-
tains a safety margin of 100 nautical miles from icebergs reported by the Ice Patrol. In a severe winter, the Denmark Strait may be closed due to the presence of icebergs.
Deck ice may be more difficult to contend with from a ship routing point of view because it is caused by freezing weather associated with a large weather system. While mostly a nuisance factor on large ships, it causes significant problems with the stability of small ships (Figure 4104a).
Latitude: Generally, the higher the latitude of a route, even in the summer, the greater are the problems with the environment. Certain operations should benefit from sea-sonal planning as well as optimum routing. For example, towing operations north of about 40° latitude should be avoided in non-summer months if possible.
4105. Synoptic Weather Considerations
A ship routing agency should direct its forecasting skills to avoiding or limiting the effect of weather and seas associated with extratropical low pressure systems in the mid and higher latitudes and the tropical systems in low lat-itude. Seasonal or monsoon weather is also a factor in route selection and diversion in certain areas.
Despite the amount of attention and publicity given to tropical cyclones, mid-latitude low pressure systems generally present more difficult problems to a ship routing agency. This is primarily due to the fact that major ship traffic is sailing in the latitudes of the migrating low pressure systems, and the amount of potential exposure to intense weather systems, especially in winter, is much greater.
Low pressure systems weaker than gale intensity (winds less than 34 knots) are not a severe problem for most ships. However, a relatively weak system may generate pro-longed periods of rough seas which may hamper normal work aboard ship. Ship weather routing can frequently limit rough conditions to short periods of time and provide more favorable conditions for most of the transit. Relatively small vessels, tugs with tows, low powered ships, yachts, and
Figure 4104a. Ice accumulation on deck can cause significant problems with stability of small ships. Freezing spray conditions should be avoided when possible. Image
courtesy of Lars Anderson, SMHI.
Figure 4104b. North American Ice Service Products https://www.navcen.uscg.gov/?pageName=iipProducts.
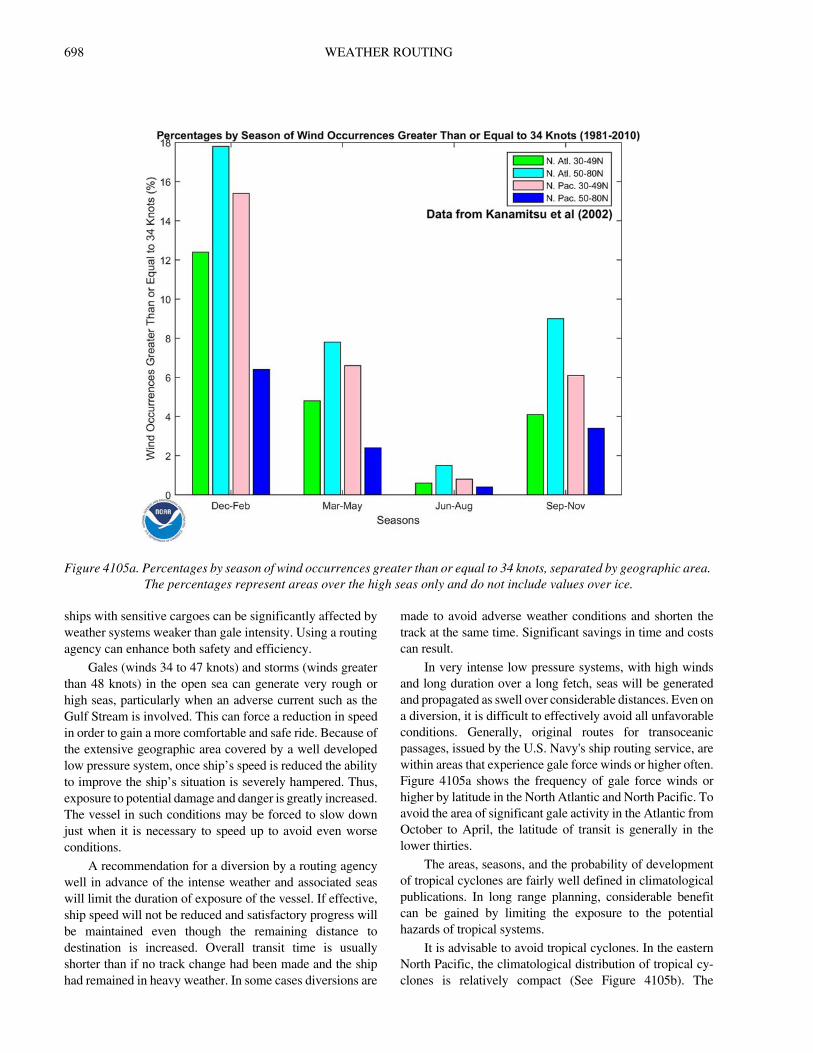
698 WEATHER ROUTING
ships with sensitive cargoes can be significantly affected by weather systems weaker than gale intensity. Using a routing agency can enhance both safety and efficiency.
Gales (winds 34 to 47 knots) and storms (winds greater than 48 knots) in the open sea can generate very rough or high seas, particularly when an adverse current such as the Gulf Stream is involved. This can force a reduction in speed in order to gain a more comfortable and safe ride. Because of the extensive geographic area covered by a well developed low pressure system, once ship’s speed is reduced the ability to improve the ship’s situation is severely hampered. Thus, exposure to potential damage and danger is greatly increased. The vessel in such conditions may be forced to slow down just when it is necessary to speed up to avoid even worse conditions.
A recommendation for a diversion by a routing agency well in advance of the intense weather and associated seas will limit the duration of exposure of the vessel. If effective, ship speed will not be reduced and satisfactory progress will be maintained even though the remaining distance to destination is increased. Overall transit time is usually shorter than if no track change had been made and the ship had remained in heavy weather. In some cases diversions are
made to avoid adverse weather conditions and shorten the track at the same time. Significant savings in time and costs can result.
In very intense low pressure systems, with high winds and long duration over a long fetch, seas will be generated and propagated as swell over considerable distances. Even on a diversion, it is difficult to effectively avoid all unfavorable conditions. Generally, original routes for transoceanic passages, issued by the U.S. Navy's ship routing service, are within areas that experience gale force winds or higher often. Figure 4105a shows the frequency of gale force winds or higher by latitude in the North Atlantic and North Pacific. To avoid the area of significant gale activity in the Atlantic from October to April, the latitude of transit is generally in the lower thirties.
The areas, seasons, and the probability of development of tropical cyclones are fairly well defined in climatological publications. In long range planning, considerable benefit can be gained by limiting the exposure to the potential hazards of tropical systems.
It is advisable to avoid tropical cyclones. In the eastern North Pacific, the climatological distribution of tropical cy-clones is relatively compact (See Figure 4105b). The
Figure 4105a. Percentages by season of wind occurrences greater than or equal to 34 knots, separated by geographic area. The percentages represent areas over the high seas only and do not include values over ice.
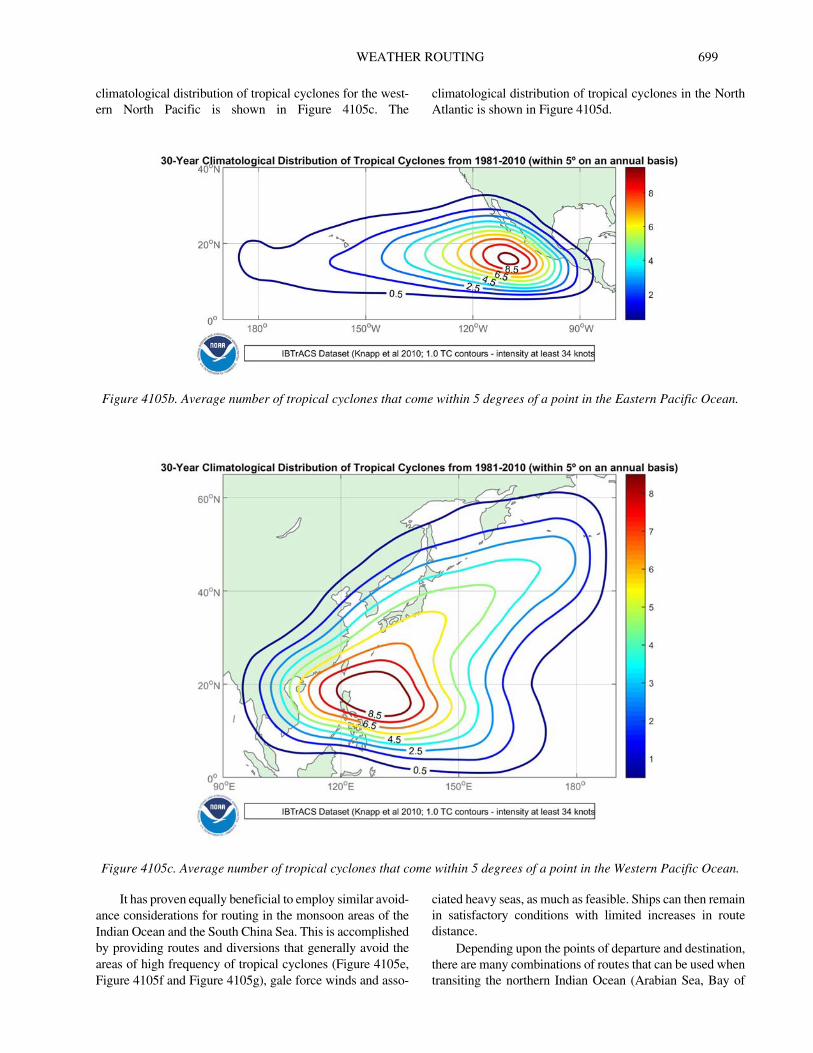
WEATHER ROUTING 699
climatological distribution of tropical cyclones for the west-ern North Pacific is shown in Figure 4105c. The
climatological distribution of tropical cyclones in the North Atlantic is shown in Figure 4105d.
It has proven equally beneficial to employ similar avoid-ance considerations for routing in the monsoon areas of the Indian Ocean and the South China Sea. This is accomplished by providing routes and diversions that generally avoid the areas of high frequency of tropical cyclones (Figure 4105e, Figure 4105f and Figure 4105g), gale force winds and asso-
ciated heavy seas, as much as feasible. Ships can then remain in satisfactory conditions with limited increases in route distance.
Depending upon the points of departure and destination, there are many combinations of routes that can be used when transiting the northern Indian Ocean (Arabian Sea, Bay of
Figure 4105b. Average number of tropical cyclones that come within 5 degrees of a point in the Eastern Pacific Ocean.
Figure 4105c. Average number of tropical cyclones that come within 5 degrees of a point in the Western Pacific Ocean.
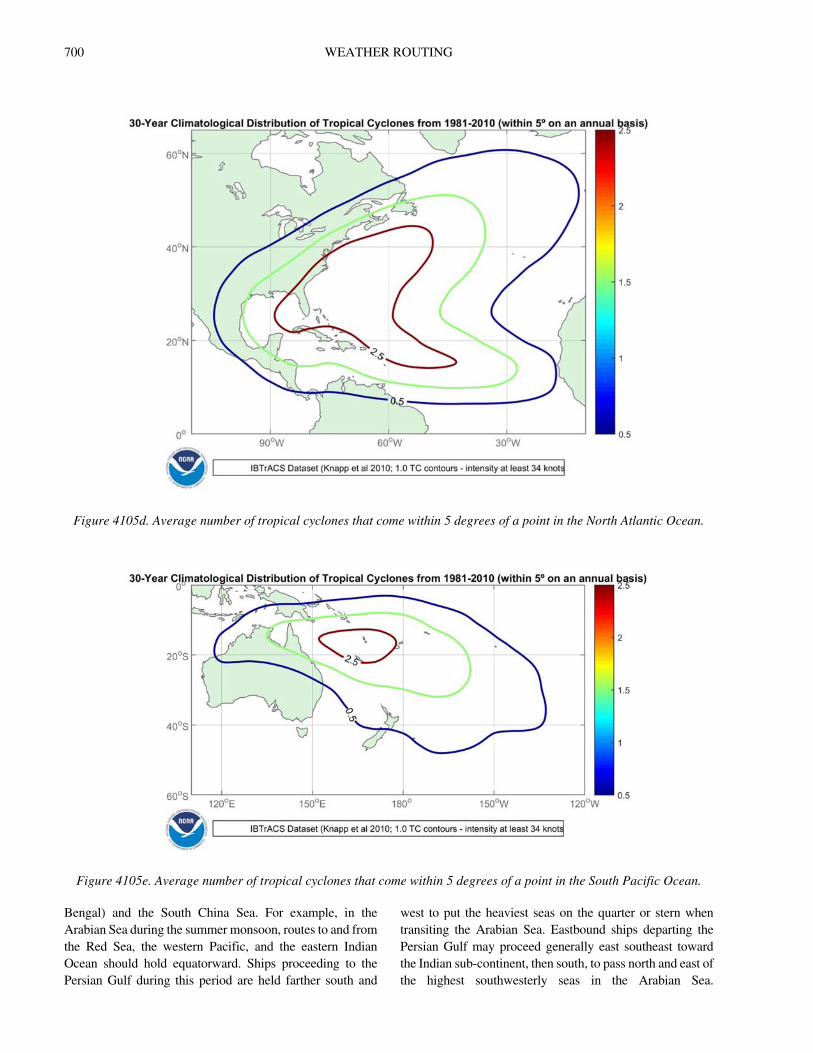
700 WEATHER ROUTING
Bengal) and the South China Sea. For example, in the Arabian Sea during the summer monsoon, routes to and from the Red Sea, the western Pacific, and the eastern Indian Ocean should hold equatorward. Ships proceeding to the Persian Gulf during this period are held farther south and
west to put the heaviest seas on the quarter or stern when transiting the Arabian Sea. Eastbound ships departing the Persian Gulf may proceed generally east southeast toward the Indian sub-continent, then south, to pass north and east of the highest southwesterly seas in the Arabian Sea.
Figure 4105d. Average number of tropical cyclones that come within 5 degrees of a point in the North Atlantic Ocean.
Figure 4105e. Average number of tropical cyclones that come within 5 degrees of a point in the South Pacific Ocean.
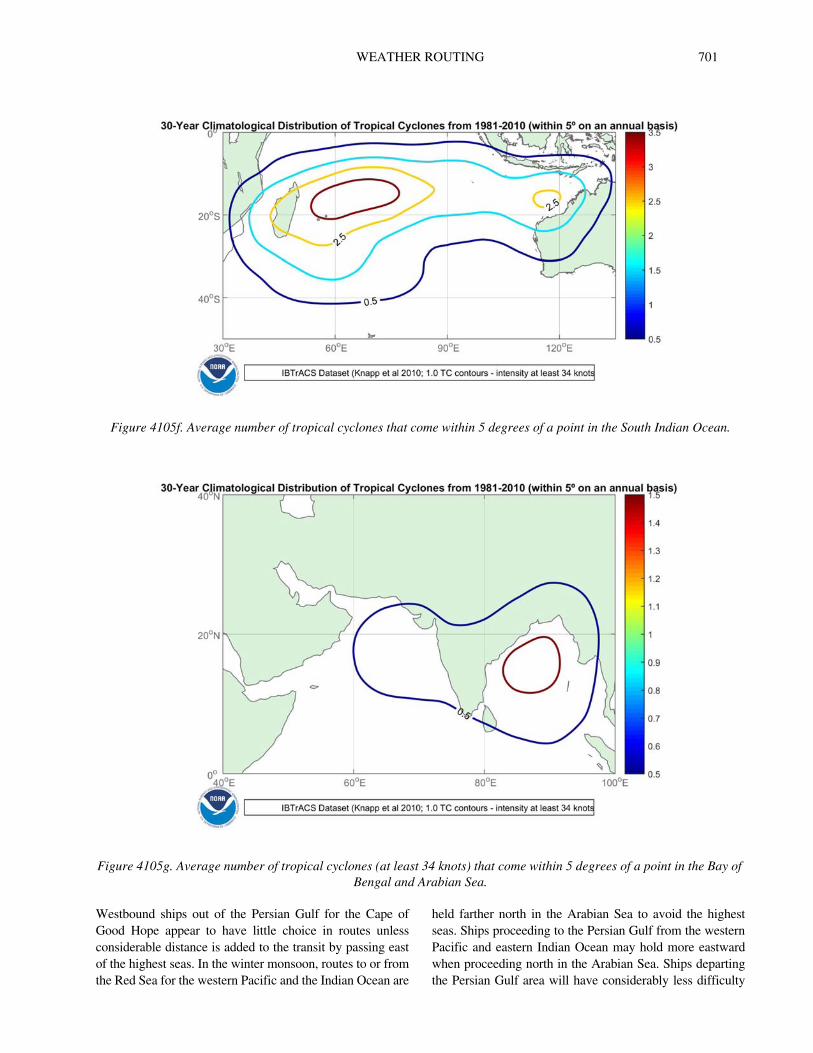
WEATHER ROUTING 701
Westbound ships out of the Persian Gulf for the Cape of Good Hope appear to have little choice in routes unless considerable distance is added to the transit by passing east of the highest seas. In the winter monsoon, routes to or from the Red Sea for the western Pacific and the Indian Ocean are
held farther north in the Arabian Sea to avoid the highest seas. Ships proceeding to the Persian Gulf from the western Pacific and eastern Indian Ocean may hold more eastward when proceeding north in the Arabian Sea. Ships departing the Persian Gulf area will have considerably less difficulty
Figure 4105f. Average number of tropical cyclones that come within 5 degrees of a point in the South Indian Ocean.
Figure 4105g. Average number of tropical cyclones (at least 34 knots) that come within 5 degrees of a point in the Bay of Bengal and Arabian Sea.
702 WEATHER ROUTING
than during the summer monsoon. Similar considerations can be given when routing ships proceeding to and from the Bay of Bengal.
In the South China Sea, transits via the Palawan Passage are recommended when strong, opposing wind and seas are forecast. This is especially true during the winter monsoon. During periods when the major monsoon flow is slack, ships can use the shortest track as conditions permit.
4106. Special Weather and Environmental Consider-ations
In addition to the synoptic weather considerations in ship weather routing, there are special environmental problems that can be avoided by following recommen-dations and advisories of ship routing agencies. These problems generally cover a smaller geographic area and are seasonal in nature, but are still important to ship routing.
In the North Atlantic, because of heavy shipping traffic, frequent poor visibility in rain or fog, and restricted navigation, particularly east of Dover Strait, some mariners prefer to transit to or from the North Sea via Pentland Firth, passing north of the British Isles rather than via the English Channel.
Weather routed ships generally avoid the area of dense fog with low visibility in the vicinity of the Grand Banks off Newfoundland and the area east of Japan north of 35°N. Fishing vessels in these two areas provide an added hazard to safe navigation. This condition exists primarily from May through September. During summer, Arctic-bound shipping, transiting between the U.S. East Coast and the Davis Strait-Baffin Bay area, frequently use the Cabot Strait and the Strait of Belle Isle, where navigation aids are available and icebergs are typically present in large numbers following the melt of pack ice along the Labrador Coast in the spring.
In the northern hemisphere winter, a strong high pressure system moving southeast out of the Rocky Mountains brings cold air down across Central America and the western Gulf of Mexico producing gale force winds in the Gulf of Tehuantepec. This fall wind is similar to the pampero, mistral, and bora of other areas of the world. An adjustment to ship’s track can successfully avoid the highest seas associated with the “Tehuantepecer.” For transits between the Canal Zone and northwest Pacific ports, little additional distance is required to avoid this area (in winter) by remaining south of at least 12°N when crossing 97°W. While avoiding the highest seas, some unfavorable swell conditions may be encountered south of this line. Ships transiting between the Panama Canal and North American west coast ports can stay close along the coast of the Gulf of Tehuantepec to avoid heavy seas during gale conditions, but may still encounter high offshore winds.
In the summer, the semi-permanent high pressure systems over the world’s oceans produce strong equatorward flow along the west coasts of continents. This feature is most pronounced off the coast of California and Portugal in the
Northern Hemisphere and along Chile, western Australia, and southwest Africa in the Southern Hemisphere. Very rough seas are generated and are considered a definite factor in route selection or diversion when transiting these areas.
4107. Types of Recommendations and Advisories
A preliminary route recommendation is issued to a ship more than ten days prior to sailing, then updated two days prior to sailing based on short to medium range dy-namic forecasts. Preliminary route recommendations are a composite representation of experience, climatology, weather and sea state forecasts, the vessel's mission and op-erational concerns, and the vessel's seagoing characteristics. The U.S. Navy normally requires its units to provide a transit proposal 30 to 45 days prior to sailing, which is vetted through the OTSR program. These transit proposals are based on smart climatology, ship type, mis-sion and environmental limits. All long range planning routes are based more on seasonal and climatological ex-pectations than the current weather situation. Surveillance is a continuous process and these routes are subject to revi-sion prior to sailing if weather and sea conditions dictate
Adjustment of departure time is a recommendation for delay in departure, or early departure if feasible, and is in-tended to avoid or significantly reduce the adverse weather and seas forecast on the first portion of the route, if sailing on the original EDD. The initial route is not revised, only the timing of the ship's transit through an area with currently un-favorable weather conditions. Adjusting the departure time is an effective method of avoiding a potentially hazardous situ-ation where there is no optimum route for sailing at the originally scheduled time. A go/no go recommendation may be made to vessels engaged in special missions such as speed record attempts or heavy-lift voyages.
A diversion is an underway adjustment in track and is intended to avoid or limit the effect of adverse weather conditions forecast to be encountered along the ship's current track, or to take advantage of favorable conditions along another route. Ship's speed is expected to be reduced by the encounter with the heavy weather. In most cases the distance to destination is increased in attempting to avoid the adverse weather, but this is partially overcome by being able to maintain a nearly normal SOA.
Adjustment of SOA is a recommendation for slowing or increasing the ship's speed as much as practicable, in an attempt to avoid an adverse weather situation by adjusting the timing of the encounter. This is also an effective means of maintaining maximum ship operating efficiency, while not diverting from the present ship's track. By adjusting the SOA, a major weather system can sometimes be avoided with no increase in distance. The development of fast ships (SOA greater than 30 knots) gives the ship routing agency the potential to “make the ship's weather” by adjusting the ship's speed and track for encounter with favorable weather conditions..
WEATHER ROUTING 703
Evasion is a recommendation to the vessel to take independent action to avoid, as much as possible, a potentially dangerous weather system. The ship routing meteorologist may recommend a general direction for safe evasion but does not specify an exact track. The recommen-dation for evasion is an indication that the weather and sea conditions have deteriorated to a point where shiphandling and safety are the primary considerations and progress toward destination has been temporarily suspended, or is at least of secondary consideration.
A weather advisory is a transmission sent to the ship advising the commanding officer or master of expected ad-verse conditions, their duration, and geographic extent. It is initiated by the ship routing agency as a service and an aid to the ship. The best example of a situation for which a fore-cast is helpful is when the ship is currently in good weather but adverse weather is expected within 48 hours for which a diversion has not been recommended, or a diversion where adverse weather conditions are still expected. This type of advisory may include a synoptic weather discussion and a wind, seas or fog forecast.
The ability of the routing agency to achieve optimum condi-tions for the ship is aided by the commanding officer or master adjusting course and speed where necessary for an efficient and safe ride. At times, the local sea conditions may dictate that the commanding officer or master take independent action.
4108. Southern Hemisphere Routing
Available data on which to base analyses and forecasts is generally very limited in the Southern Hemisphere, although this situation is improving with the increasing availability of remotely sensed data. Weather and other environmental information obtained from satellites is contributing greatly to an improvement in southern hemisphere forecast products.
Passages south of the Cape of Good Hope and Cape Horn should be timed to avoid heavy weather as much as possible, since intense and frequent low pressure systems are common in these areas. In particular, near the southeast coasts of Africa and South America, intense low pressure systems form in the lee of relatively high terrain near the coasts of both continents. Winter transits south of Cape Horn are difficult, since the time required for transit is longer than the typical interval between storms. Remaining equatorward of about 35°S as much as practicable will limit exposure to adverse conditions. If the frequency of lows passing these areas is once every three or four days, the probability of encountering heavy weather is high.
Tropical cyclones in the Southern Hemisphere present a significant problem because of the sparse surface and upper air observations from which forecasts can be made. Satellites provide the most reliable means by which to obtain accurate positions of tropical systems, and also give the first indication of tropical cyclone formation.
In the Southern Hemisphere, OTSR and other ship
weather routing services are available, but are hampered by sparse data reports from which reliable short and extended range forecasts can be produced. Strong climatological consideration is usually given to any proposed southern hemisphere transit, but satellite data is increasingly available to enhance short and extended range forecasts. OTSR procedures for the Northern Hemisphere can be instituted in the Southern Hemisphere whenever justified by basic data input and available forecast models.
4109. Communications
A vital part of a ship routing service is communication between the ship and the routing agency. Reports from the ship show the progress and ability to proceed in existing conditions. Weather reports from the ship enrich the basic data on which analyses are based and forecasts derived, assisting both the reporting ship and others in the vicinity.
Despite all efforts to achieve the best forecasts possible, the quality of forecasts does not always warrant maintaining the route selected. In the U.S. Navy’s ship routing program, experience shows that one-third of the ships using OTSR receive some operational or weather-dependent change while underway.
The routing agency needs reports of the ship’s position and the ability to transmit recommendations for track change or weather advisories to the ship. The ship needs both send and receive capability for the required information. Information on seakeeping changes initiated by the ship is desirable in a coordinated effort to provide optimum transit conditions. New satellite communications services are making possible the transmission of larger amounts of data than possible through traditional radio messages, a development which supports systems using on-board analysis to generate routes.
4110. Benefits
The benefits of ship weather routing services are primarily in time and cost reductions and increased safety. The savings in operating costs are derived from reductions in transit time, heavy weather encounters, fuel consumption, cargo and hull damage, and more efficient scheduling of dockside activities. The savings are further increased by fewer emergency repairs, more efficient use of personnel, improved topside working conditions, lower insurance rates because of reduced risks under weather routing, and ultimately, extended ship operating life.
An effective routing service maximizes safety by greatly reducing the probability of severe or catastrophic damage to the ship, and injury of crew members. The efficiency and health of the crew is also enhanced by avoiding heavy weather. This is especially important on modern, automated ships with reduced crews and smaller craft such as fishing vessels and yachts.
704 WEATHER ROUTING
4111. Conclusion
The success of ship weather routing depends upon the validity of forecasts and the routing agency’s ability to make appropriate route recommendations and diversions. Anticipated improvements in a routing agency’s recommendations will come from advancements in meteorology, technology, and the application of ocean wave forecast models. Advancements in mathematical meteorology, coupled with the continued application of forecast computer models, will extend the time range and accuracy of the dynamic and statistical forecasts. Additionally, a better understanding of the problems encountered by the mariner and their implications while offshore will assist the routing agency in making appropriate recommendations.
Technological advancements in the areas of satellite and automated communications and onboard ship response systems will increase the amount and type of information to and from the ship with fewer delays. Mariners will have a better quality of meteorological information, and the meteorologists will have a better understanding of the problems, constraints, and priorities of the vessel’s masters. Ship response and performance data included with the ship’s weather report will provide the routing agency with real-time information with which to ascertain the actual state of the ship. Being able to predict a ship’s response in most weather and sea conditions will result in improved routing procedures.
Shipboard and anchored wave measuring devices contribute to the development of ocean wave analysis and
forecast models. Shipboard seakeeping instrumentation, with input of measured wave conditions and predetermined ship response data for the particular hull, enables a master or commanding officer to adjust course and speed for actual conditions.
Modern ship designs, exotic cargoes, and sophisticated transport methods require individual attention to each ship’s areas of vulnerability. Any improvement in the description of sea conditions by ocean wave models will improve the output from ship routing and seakeeping systems.
Advanced planning of a proposed transit, combined with the study of expected weather conditions, both before and during the voyage, as is done by ship routing agencies, and careful on board attention to seakeeping (with instru-mentation if available) provide the greatest opportunity to achieve the goal of optimum environmental conditions for ocean transit.
4112. References
Kanamitsu, M., Ebisuzaki, W., Woollen, J., Yang, S. K., Hnilo, J. J., Fiorino, M. and Potter, G. L. (2002). NCEP-DOE AMIP-II Reanalysis (R-2), Bull. Amer. Meteor. Soc., 83, 1631-1643.
Knapp, K. R., Kruk, M. C., Levinson, D. H., Diamond, H. J. and Neumann, C. J. (2010). The International Best Track Archive for Climate Stewardship (IBTrACS): Unifying Tropical Cyclone Best Track Data. Bull. Amer. Meteor. Soc., 91, 363-376. doi:10.1175/2009BAMS2755.1


