Embed Size (px)
Citation preview

11. SITE 6791
Shipboard Scientific Party2
HOLE 679A
Date occupied: 1015 hr L, 31 October 1986 Date departed: 1950 hr L, 31 October 1986 Time on hole: 9 hr 35 min Position: 11°03.52'S, 78°15.92'W
Water depth (sea level; corrected m, echo-sounding): 439.5 Water depth (rig floor; corrected m, echo-sounding): 450 Bottom felt (m, drill pipe): 434.2 Penetration (m): 7.0 Number of cores: 1 Total length of cored section (m): 7.0 Total core recovered (m): 7.0 Core recovery (%): 100 Oldest sediment cored
Depth (mbsf): 7.0 Nature: foraminifer and nannofossil mud Age: Quaternary
1 Suess, E., von Huene, R., et al., 1988. Proc. ODP, Init. Repts., 112: College Station, TX (Ocean Drilling Program).
2 Erwin Suess (Co-Chief Scientist), Oregon State University, College of Oceanography, Corvallis, OR 97331; Roland von Huene (Co-Chief Scientist), U.S. Geological Survey, Branch of Pacific Marine Geology, 345 Middlefield Rd. M/S 999, Menlo Park, CA 94025; Kay-Christian Emeis (ODP Staff Scientist), Ocean Drilling Program, Texas A&M University, College Station, TX 77843; Jacques Bour-gois, Departement de Geotectonique, Universite Pierre et Marie Curie, 4 Place Jussieu, 75230 Paris Cedex 05, France; Jose del C. Cruzado Castaneda, Petroleos del Peru S. A., Paseo de la Republica 3361, San Isidro, Lima, Peru; Patrick De Wever, CNRS, Laboratoire de Stratigraphic Universite Pierre et Marie Curie, 4 Place Jussieu, 75230 Paris Cedex 05, France; Geoffrey Eglinton, University of Bristol, School of Chemistry, Cantock's Close, Bristol BS8 ITS, England; Robert Garrison, University of California, Earth Sciences, Applied Sciences Building, Santa Cruz, CA 95064; Matt Greenberg, Lamont-Doherty Geological Observatory, Columbia University, Palisades, NY 10964; Elard Herrera Paz, Petroleos del Peru, S. A., Paseo de la Republica 3361, San Isidro, Lima, Peru; Phillip Hill, Atlantic Geoscience Centre, Bedford Institute of Oceanography, Box 1006, Dartmouth, Nova Scotia B2Y 4A2, Canada; Masako Ibaraki, Geoscience Institute, Faculty of Science, Shizuoka University, Shizuoka 422, Japan; Miriam Kastner, Scripps Institution of Oceanography, SVH, A-102, La Jolla, CA 92093; Alan E. S. Kemp, Department of Oceanography, The University, Southampton S09 5NH, England; Keith Kvenvolden, U.S. Geological Survey, Branch of Pacific Marine Geology, 345 Middlefield Rd., M/S 999, Menlo Park, CA 94025; Robert Lan-gridge, Department of Geological Sciences, Queen's University at Kingston, Ontario K7L 3A2, Canada; Nancy Lindsley-Griffin, University of Nebraska, Department of Geology, 214 Bessey Hall, Lincoln, NE 68588-0340; Janice Marsters, Department of Oceanography, Dalhousie University, Halifax, Nova Scotia B3H 4J1, Canada; Erlend Martini, Geologisch-Palaontologisches Institut der Universiteit Frankfurt, Senckenberg-Anlage 32-34, D-6000, Frankfurt/Main, Federal Republic of Germany; Robert McCabe, Department of Geophysics, Texas A&M University, College Station, TX 77843; Leonidas Ocola, Laboratorio Central, Insti-tuto Geofisico del Peru, Lima, Peru; Johanna Resig, Department of Geology and Geophysics, University of Hawaii, Honolulu, HI 96822; Agapito Wilfredo Sanchez Fernandez, Instituto Geologico Minero y Metalurgico, Pablo Bermudez 211, Lima, Peru; Hans-Joachim Schrader, College of Oceanography, Oregon State University, Corvallis, OR 97331 (currently at Department of Geology, University of Bergen, N-5000 Bergen, Norway); Todd Thornburg, College of Oceanography, Oregon State University, Corvallis, OR 97331; Gerold Wefer, Universitat Bremen, Fachbereich Geowissenschaften, Postfach 330 440, D-2800 Bremen 33, Federal Republic of Germany; Makoto Yamano, Earthquake Research Institute, University of Tokyo, Bunkyo-ku, Tokyo 113, Japan.
HOLE 679B
Date occupied: 2030 hr L, 31 October 1986 Date departed: 0700 hr L, 1 November 1986
Time on hole: 10 hr 30 min Position: 11°03.80'S, 78°16.34'W Water depth (sea level; corrected m, echo-sounding): 450.5 Water depth (rig floor; corrected m, echo-sounding): 461 Bottom felt (m, drill pipe): 458
Penetration (m): 107.2 Number of cores: 13 Total length of cored section (m): 107.2 Total core recovered (m): 103.01 Core recovery (%): 96.1 Oldest sediment cored
Depth (mbsf): 107.2 Nature: diatomaceous mud Age: Pliocene Measured velocity (km/s): 1.5
HOLE 679C
Date occupied: 0700 hr L, 1 November 1986 Date departed: 1245 hr L, 1 November 1986
Time on hole: 5 hr 45 min Position: 11°03.81'S, 78°16.33'W Water depth (sea level; corrected m, echo-sounding): 450.5 Water depth (rig floor; corrected m, echo-sounding): 461 Bottom felt (m, drill pipe): 458
Penetration (m): 75.5 Number of cores: 8 Total length of cored section (m): 75.5 Total core recovered (m): 69.78 Core recovery (%): 92.4 Oldest sediment cored
Depth (mbsf): 75.5 Nature: diatomaceous mud Age: Pliocene Measured velocity (km/s): 1.5
HOLE 679D
Date occupied: 1245 hr L, 1 November 1986 Date departed: 1315 hr L, 2 November 1986
Time on hole: 24 hr 30 min Position: 11°03.83'S, 78° 16.33'W Water depth (sea level; corrected m, echo-sounding): 439.5 Water depth (rig floor; corrected m, echo-sounding): 450
Bottom felt (m, drill pipe): 461.7
159

SITE 679
Penetration (m): 245.4 Number of cores: 27 Total length of cored section (m): 245.4 Total core recovered (m): 116.8 Core recovery (°7o): 47.6 Oldest sediment cored
Depth (mbsf): 245 Nature: sandy mud Age: late Miocene Measured velocity (km/s): 1.6
HOLE 679E
Date occupied: 1315 hr L, 2 November 1986 Date departed: 0400 hr L, 5 November 1986 Time on hole: 62 hr 45 min Position: 11°03.78'S, 78°16.34'W Water depth (sea level; corrected m, echo-sounding): 450.8 Water depth (rig floor; corrected m, echo-sounding): 461.3 Bottom felt (m, drill pipe): 461.7 Penetration (m): 359.3 Number of cores: 13 Total length of cored section (m): 114.0 Total core recovered (m): 36.3 Core recovery (%): 31.8 Oldest sediment cored
Depth (mbsf): 356.3 Nature: black fissile shale Age: middle Miocene Measured velocity (km/s): 2.04
Principal results: Site 679 is located at the seaward edge of an outer shelf mud lens that formed under the influence of the Peru coastal upwelling system. Sediments beneath this facies extend seaward across the upper-slope forearc basins to the outer continental margin. Coring at Site 679 sampled records of coastal upwelling and of the vertical tectonic motion of the continental shelf associated with Andean orogeny.
Five holes were drilled at Site 679. Hole 679A, an operational test necessitated by the shallow water depth, consisted of one core containing olive-green diatomaceous mud with abundant calcareous and phosphoritic interbeds. Hole 679B penetrated Quaternary, olive-gray, diatom-foraminifer mud between 0 and 45 mbsf and Pliocene, olive to black, diatomaceous mud between 45 and 107 mbsf. Hole 679C, with 95% recovery, was devoted to whole-round sampling. In Hole 679D, the same stratigraphic sequence was drilled a third time, with a similar high rate of recovery. Below 107 mbsf, however, recovery declined within an upper Miocene unit of the same overall lithology of olive-gray to dark gray diatomaceous mud, silt, and fine sand that contained phosphorite, opal-CT, and dolomite layers. Induration and cementation eventually caused the APC core barrel to stick during our one attempt to improve recovery at 245 mbsf. Although low recovery continued, an upper Miocene series of light- to dark-gray mudstones and siltstones having calcite cementation was recovered.
At 225 mbsf a change in lithology marks a major unconformity between the upper and middle Miocene, below which sonic velocities are higher, especially in the calcite-cemented section near the top. At 338 mbsf the lithology changed to a very dark gray shale. At the bottom of the hole this unit contained low concentrations of thermo-genic hydrocarbons (C3 to Cg+ and methane) within a thin silt layer and in traces disseminated throughout a dark gray shale. Thus, drilling stopped about 100 m above the basement target. An excellent suite of logs gave no indication of unusual lithologies in unrecovered intervals and confirmed depths to major unconformities. However, by suspending drilling at this hole, we failed to answer questions concerning the origin of this unconformity and the age of the trans-gressive sequence above it.
At Site 679 the compressed stratigraphic section contains a record of late Neogene and Quaternary coastal upwelling. The sparse clastic influx, relative to the rate at which the organic-rich upwelling facies accumulates, produces a chemical environment conducive to the rapid formation of dolomites, phosphates, and sulfides during early stages of diagenesis. The absence of bioturbation, resulting from oxygen-deficient bottom water, beautifully preserves primary sedimentary structures characteristic of the hemipelagic environment. Also preserved are subsequently formed fluid-escape structures and microfaults related to the extensional and shear deformation from the downslope movement of gravity.
Underlying the upwelling facies is a facies dominated by turbi-dites with terrigenous and near shore characteristics. This section contains pore fluids significantly diluted by fresh water that may have migrated or been buried there. The two facies are separated by an unconformity between the upper and middle Miocene that appears as a prominent marker zone at the base of the strata covering the midslope of this margin. The late Neogene age of these slope strata, being much younger than previously inferred, indicates a more rapid rate of vertical tectonism across the Peruvian margin than has been assumed.
BACKGROUND A N D SCIENTIFIC OBJECTIVES The transect of holes across the Peruvian margin at 11°S lat
itude was designed to address the full scope of tectonic and paleoceanographic objectives of Leg 112 in the southern area, which will be compared with results along a northern transect at about 9°S latitude. Site 679 was located so as to provide the major reference section between the Salaverry Basin on the upper slope and the Lima Basin on the midslope (Hussong et al., 1985; Kulm et al., 1981) (Figs. 1 and 2). Three APC holes were cored at this site to provide enough samples for high-resolution studies of the Quaternary sediment sequence in the area of strongest Holocene coastal upwelling (Suess and Thiede, 1983; Suess et al., 1987); the last of these holes was extended by XCB drilling to crystalline basement and was expected to provide a sample record from Quaternary to Paleozoic time. The other holes were targeted to penetrate between 100 and 200 mbsf. Seismic data across the site indicated basement at about 600 m, whereas the section in the midslope area was 1200 m thick. The section in this area is greatly compressed.
A major tectonic objective at Site 679 was to establish (at the most landward part of the traverse) a history of vertical motion associated with the Andean orogeny. The sedimentary section here is generally flat and undeformed, except by small normal faults in seismic records. The adjacent coastline shows evidence of uplift, whereas seaward the continental slope shows evidence of subsidence, indicated by possible subareal erosion in pronounced angular unconformities. Thus, the site appears to be in a pivotal position with regard to vertical tectonism (Kulm et al., 1981; von Huene et al., 1985). Other tectonic and sedimentological questions have to do with the origin of high-amplitude reflections in seismic records that may mark significant geological events. A reflection at about 200 m (0.2 s) at the site corresponds to the base of a unit that thickens dramatically in the midslope area. Environmental conditions in this area, which produced sedimentary strata rising from almost 1 km deep to the seafloor, may reflect an unusual current regime in the past. Another reflection at about 500 m (0.45 s) defines the top of a profound angular unconformity beneath the midslope area. The strong reflection (presumed to be from the top of the crystalline basement) can be followed downslope to the vicinity of the trench axis. Thus, this first penetration of the stratigraphy (which produced a fascinating reflective sequence) by also providing the corresponding biostratigraphy and lithostratigraphy should reveal details of the geology of the front of the Andean margin (von Huene et al., 1985).
Site 679 is located at the seaward edge of a pronounced upper-slope mud facies, which underlies one of the persistent coastal upwelling centers of the Peru margin. The position of
160

SITE 679
8°S
SfcChimbote
PERU
14c
81°W
Figure 1. Bathymetry of Peru Continental Margin and sediment thickness along upper slope; depths are in intervals of 1000 m, beginning at a water depth of 200 m; sediment isopachs are in increments of 0.5 km, beginning at 0.1 km; The proposed drill sites for Leg 112 were (1) Transect 9°S: 9A, 10, 14, and 17A; (2) Transect ITS: 1, 3, 3A, 5, 7A, 8; and (3) Transect 13°S: 2, 2A, 2C, 2D, 4A, 4B, 4C, 4D. Estimated sediment thickness from Couch et al., 1985.
this lithologic unit at upper-slope water depths is now controlled by the poleward-flowing undercurrent, the on- and offshore Ek-man flow, and the upper-slope and shelf morphologies (Kulm et al., 1984; Suess et al., 1987). The upwelling record at the depo-sitional center of this lithologic unit was cored at Sites 680 and 681 later. Our objectives for sampling at Site 679 along the edge of this unit were (1) to provide data for reconstructing the current and upwelling regimes during times of different sea-level stands and (2) to provide a link to the depositional history as recorded in the midslope basin. We assumed that the depositional center of past upwelling facies was situated beneath or farther downslope of Site 679 during lowered sea levels. During higher sea-level stands, the sediments deposited here should be similar
to a midslope environment, and the upwelling facies would be found farther upslope.
The organic-rich mud facies deposited at Site 679 undergoes diagenesis in chemically reducing environments (Baker and Burns, 1985; Baker and Kastner, 1981). Depending upon the rate of sediment accumulation and the burial rate of organic matter, this environment should be dominated by either micro-bial sulfate reduction or methanogenesis. During each of these conditions, "organic" dolomites that have characteristic stable-isotope signatures and mineral chemistries form (Garrison et al., 1984; Irwin et al., 1977; Suess et al., 1987). Site 679 should provide information from interstitial-water and gas compositions about the prevailing chemical environment during early
161

SITE 679
10°S
Figure 2. Bathymetry and sediment isopachs along Peru Continental Margin at 11°S; Site 679 is located seaward of the thick (>2.5 km) Salaverry Basin sediments.
diagenesis and thus define in more detail the conditions of formation of organic dolomites (Claypool and Kaplan, 1974).
OPERATIONS After testing our new steering gear at about 2200 hr (local
time), the JOIDES Resolution left the Callao area on a northerly course for a position about 12 nmi east of our site survey. The transit and turn to the site were accomplished using satellite navigation because our global positioning system (GPS) did not receive satellite fixes. We turned and reduced speed to 6 kt at 0645 hr, 31 October 1986, and began our survey. The seismic system, which could not record anything readable at 10 kt, began to show about 0.6 s of sediment, enough to reach basement depth. Only one 80-in.3 water gun was deployed. The 3.5-kHz transducer displayed reflections to a depth of about 40 m in the CESP mode. Enough geophysical data were displayed in real time to pinpoint the desired mud lens and to avoid faults at levels that met our depth objectives. These data were used to locate the site instead of the position suggested by pre-cruise site data because the precision of those data sets was only about 1 mi (Fig. 3). A spar-buoy was deployed at 0831 hr in a water depth of 441 m on the precision depth recorder (PDR); the ship continued on course and recorded geophysical data until 0850 hr. At this time we retrieved our seismic gear; the ship then came about on a reciprocal course to deploy a beacon on a wire at the spar-buoy position. This beacon was in place at 1015 hr, and the first core came on board at about 1540 hr. Mud-line depth was established at 452.2 m. However, owing to a bent core barrel and a shredded liner, we checked our depth and the ship's position. We established that the ship had moved about 0.9 nmi in a southeasterly direction since the deployment of the beacon and that the depth had shoaled by about 7 m. Once our beacon position was stabilized, we tried another piston core, which resulted only in our recovering phosphate nodules and a broken core-liner. Because the beacon's position was probably off the seismic record and we encountered unfavorable coring conditions, we decided to pick up the beacon and drill pipe and move to the nearest point on the plotted seismic line. Hole 679B was spudded at a water depth of 434 m and was drilled to 107 m
mbsf. At that depth the piston core barrel became stuck and could no longer be retrieved. This ended any further drilling. The ship then moved 50 ft shoreward, where Hole 679C was piston-cored to a refusal depth of 75 m. The ship moved another 50 ft shoreward, where Hole 679D was drilled (Table 1).
After 12 piston cores, we continued drilling using the extended-core barrel (XCB) because of multiple hard layers that made piston-coring and deployment of in-situ sampling devices impossible. Once we penetrated this hard material, we tried to piston-core at 245 m, which resulted in a stuck core barrel; we then abandoned the hole. In hindsight, our logs showed a major unconformity at this depth with some unrecovered materials having a high sonic velocity. After moving another 50 ft, Hole 679E was spudded and washed to 245 m, the total depth of the previous hole. Coring continued to 356 m with improved recovery until high concentrations of methane and thermogenic hydrocarbon species contained in a black fissile shale forced us to stop drilling for reasons of safety. We prepared the hole for logging, made three successful logging runs, and then cemented the hole for safety reasons. Just before 0400 hr on 5 November 1986, the ship departed for the next site after shooting a short seismic line across Site 679D.
LITHOSTRATIGRAPHY A N D SEDIMENTOLOGY
Introduction The sediments recovered at Site 679 are divided into five lith-
ologic units, based on visual core descriptions and smear-slide analyses (Fig. 4 and Table 2). Each of these units is described in detail.
Unit I Core 112-679A-1H-1; depth, 0-7 mbsf; age, Holocene-Pleistocene. Cores 112-679B-1H-1 through 112-679B-5H, CC; depth, 0-44.5 mbsf;
age, Holocene-Pleistocene. Cores 112-679D-1H-1 through 112-679D-5H, CC; depth, 0-45.9
mbsf; age, Holocene-Pleistocene.
Unit I consists mainly of diatomaceous-foraminifer mud that is olive, olive gray, dark olive, dark gray, or black. The upper
162

SITE 679
11°00'
11°05'
11°10'
I
HIG 0 7 0 0 ^ ^
^ ^ I
I I 1
x<3°' ^ * 0 7 3 0 Drop buoy, 0831 hr 0 ^ s '
441 m s ' 78°15.5'W, 11°04.0'S .>*0800
\ ^ ^ 0 8 1 5
HIG ^ ^ 0600^^^0845
. ^ ^ P l o t t e d position ^ r Site 679 (PER-3)
^ ^ 11°05.3'N, 78°18.0'W
I 1 1
1
Begin site survey 10°59.5'N, 78°07.5'W c/s to 6 kt.
t
1 Transit
I
78°20'
Figure 3. Track chart showing location of Site 679. 78°10' 78°00'
few tens of centimeters of Unit I are soupy down to the top of a prominent ash layer that occurs from 62 to 73 cm in Core 112-679A-1H, from 37 to 42 cm in Core 112-679B-1H, and from 57 to 67 cm in Core 112-679D-1H; below this marker ash layer, the sediment is mostly firm. Three components dominate this sedimentary unit: clay (20%-80%), diatoms (20%-95%), and foraminifers (0%-55%). The carbonate content of this unit varies from 2°7o to 76.4% (Fig. 5). The sediment varies in character from massive to laminated. The laminations are of two main types. The most prominent are thin (0.5-1.0 cm), light yellow layers having concentrations of diatoms ranging up to 95% and sparse nannofossils. More common are thin (1-4 cm), graded layers having sharp, erosional basal contacts. Concentrations of foraminifer tests make up the base of these layers that grade upward into a clay-rich upper part. Both types apparently resulted from periodic winnowing events. No large burrows were noted in Unit I.
Gray vitric-ash layers 2 to 10 cm thick occur sporadically in Unit I. Dolomite occurs as disseminated rhombs as well as thin layers and small nodules. Phosphate occurs throughout the unit in two forms: (1) as friable cream-colored layers and small nodules (Fig. 6) and (2) as hard, dark nodules and peloids. Phosphate nodules are particularly common in Cores 112-679B-1H through 112-679B-4H and in Core 112-679D-4H. A 3-cm-thick layer of amber-colored opal-CT chert occurs in Sample 112-679D-3H-2, 93-96 cm (19.8 mbsf).
Benthic-foraminifer assemblages indicate that deposition of Unit I occurred at middle to upper bathyal depths in an oxygen-minimum environment (see "Biostratigraphy" section, this chapter).
Unit II Cores 112-679B-6H-1 through 112-679A-12H, CC; depth, 44.5-106.8
mbsf; age, Pleistocene-Pliocene. Cores 112-679D-6H-1 through 112-679D-11H-6, 45 cm; depth, 45.9-
101.3 mbsf; age, Pleistocene-Pliocene.
Diatomaceous mud is the dominant lithology of lithologic Unit II. The major components are clays (40°7o-10°7o) and dia
tom frustules (25%-50%); silt-sized quartz, feldspar, and authigenic pyrite are minor but common components. Color ranges from olive to dark gray to black. Carbonate contents are generally less than 5% (Fig. 5). As in Unit I, this sediment varies from massive to thinly bedded to laminated, with thin, diatom-rich, yellow laminae and thin, graded layers that record periodic winnowing by bottom currents. Dewatering veins and micro-faults occur throughout the unit (see the discussion). We observed no burrows in Unit II.
Minor lithologies of Unit II are similar to those in Unit I. Gray ash layers, 3 to 25 cm thick, occur throughout the unit; these are particularly common in Cores 112-679B-10H and 112-679D-10H, which may be correlative. Dolomite occurs as sparse, thin layers and small nodules (Fig. 7). Phosphate nodules are more abundant. These are distributed regularly throughout the unit, occurring as small, friable, light-colored nodules and as hard, dark nodules. The latter appear to be reworked; this is particularly evident in Core 112-679D-11H, where such nodules are concentrated in lag deposits above sharp erosional contacts in three thin beds.
Analysis of benthic-foraminifer assemblages suggests that deposition of Unit II was at upper bathyal depths in a low-oxygen environment. These assemblages also contain elements resed-imented from shallower water (see "Biostratigraphy" section, this chapter).
Unit III Core 112-679B-13H; depth, 106.8-107.2 mbsf; age, early Pliocene-
late Miocene. Samples 112-679D-11H-6, 45 cm, through 112-679D-26X, CC; depth,
101.3-235.9 mbsf; age, early Pliocene-late Miocene.
Substantial amounts of fine clastic sediment characterize lithologic Unit III, which consists of interbedded thin layers of diatomaceous mud, silt, and fine sand. A coarse conglomeratic layer (or layers) apparently occurs near the top of the unit; drilling breccias at the top of Cores 112-679B-13H and 112-679B-12H contain fragments of dolomite, phosphorite, volcanic rock, and chert that are apparently derived from this layer. Prominent
163

SITE 679
Table 1. Coring summary for Site 679, Leg 112.
Length Length Date Time Depth cored recovered Recovery
Core
Hole 679A
1H
Hole 679B
1H 2H 3H 4H 5H 6H 7H 8H 9H 10H U H 12H 13H
Hole 679C
1H 2H 3H 4H 5H 6H 7H 8H
Hole 679D
1H 2H 3H 4H 5H 6H 7H 8H 9H 10H UH 12H 13X 14X 15X 16X 17X 18X 19X 20X 21X 22X 23X 24X 25X 26X 27X
Hole 679E
IX 2X 3X 4X 5X 6X 7X 8X 9X 10X 1IX 12X 13X
(1986)
31 October
31 October 31 October 31 October 31 October 31 October 31 October 1 November 1 November 1 November 1 November 1 November 1 November 1 November
1 November 1 November 1 November 1 November 1 November 1 November 1 November 1 November
1 November 1 November 1 November 1 November 1 November 1 November 1 November 1 November 1 November 1 November 1 November 1 November 1 November 2 November 2 November 2 November 2 November 2 November 2 November 2 November 2 November 2 November 2 November 2 November 2 November 2 November 2 November
3 November 3 November 3 November 3 November 3 November 3 November 3 November 3 November 3 November 3 November 3 November 4 November 4 November
(L)
1735
2135 2210 2230 2255 2315 2340 0005 0215 0305 0325 0350 0450 0540
0835 0855 0938 1000 1023 1053 1118 1136
1410 1430 1450 1535 1730 1815 1900 1945 2020 2050 2135 2205 2345 0030 0115 0153 0230 0320 0410 0458 0600 0717 0800 0900 0945 1030 1150
0228 0348 0445 0620 0735 0850 1050 1250 1630 1918 2200 0010 0150
(mbsf)
0
0 6.5
16.0 25.5 35.0 44.5 54.0 63.5 73.0 82.5 92.0
101.5 106.8
0 9.0
18.5 28.0 37.5 47.0 56.5 66.0
0 7.9
17.4 26.9 36.4 45.9 55.4 64.9 74.4 83.9 93.4
102.9 104.4 113.9 123.4 132.9 142.4 151.9 161.4 170.9 180.4 188.4 197.9 207.4 216.9 226.4 235.9
245.3 251.8 261.3 270.8 280.3 289.8 299.3 308.8 318.3 327.8 337.3 346.8 356.3
7.0
6.5 16.0 25.5 35.0 44.5 54.0 63.5 73.0 82.5 92.0
101.5 106.8 107.2
9.0 18.5 28.0 37.5 47.0 56.5 66.0 75.5
7.9 17.4 26.9 36.4 45.9 55.4 64.9 74.4 83.9 93.4
102.9 104.4 113.9 123.4 132.9 142.4 151.9 161.4 170.9 180.4 188.4 197.9 207.4 216.7 226.4 235.9 245.4
251.8 261.3 270.8 280.3 289.8 299.3 308.8 318.3 327.8 337.3 346.8 356.3 359.3
(m)
7.0
6.5 9.5 9.5 9.5 9.5 9.5 9.5 9.5 9.5 9.5 9.5 5.3 0.4
9.0 9.5 9.5 9.5 9.5 9.5 9.5 9.5
7.9 9.5 9.5 9.5 9.5 9.5 9.5 9.5 9.5 9.5 9.5 1.5 9.5 9.5 9.5 9.5 9.5 9.5 9.5 9.5 8.0 9.5 9.5 9.3 9.5 9.5 9.5
6.5 9.5 9.5 9.5 9.5 9.5 9.5 9.5 9.5 9.5 9.5 9.5 3.0
(m)
7.00
6.50 9.97 9.81 9.95 9.86 9.92 9.89 9.77 9.88 9.70 2.01 5.33 0.40
9.00 9.50 9.50 9.60 5.88 7.71 9.16 9.43
7.85 9.43 9.59 9.37 6.57 7.63 9.56 9.22 8.73 5.91 8.88 1.53 2.12 3.02 1.80 0.24 2.38 4.27 3.57 2.04 0.21 0.19 0.25 0.44 0.30 0.93 0
0.15 1.30 1.83 5.09 6.74 4.62 2.27 2.39 1.44 4.23 3.42 2.44 0.38
(%)
100.0
100.0 105.0 103.0 105.0 104.0 104.0 104.0 103.0 104.0 102.0 21.1
100.0 100.0
100.0 100.0 100.0 101.0 61.9 81.1 96.4 99.2
99.3 99.2
101.0 98.6 69.1 80.3
100.0 97.0 91.9 62.2 93.5
102.0 22.3 31.8 18.9 2.5
25.0 44.9 37.6 21.5
2.6 2.0 2.6 4.7 3.2 9.8 0
2.3 13.7 19.2 53.6 70.9 48.6 23.9 25.1 15.1 44.5 36.0 25.7 12.6
H = hydraulic piston; X = extended-core barrel.
positive inflections on the resistivity, sonic, and gamma-ray logs between 104 and 107 mbsf may record this layer (uranium-bearing phosphorite layers could be responsible for the gamma-ray spike; see "Logging" section, this chapter).
Although the diatomaceous muds of Unit III resemble those of the overlying units, they differ by having higher proportions of silt- and sand-sized grains. These muds are dark olive to dark gray to black and are massive to laminated. Silt and fine sand, containing abundant quartz, feldspar, and diatoms, occur in thin layers that are laminated to cross-laminated. These structures are particularly well developed in Core 112-679D-19X, where (as in the described following) they resemble hummocky cross-stratification and suggest reworking by wind-forced currents. Some silt and sand layers are cemented by calcite. A prominent positive inflection of the sonic log between 186.5 and 188.5 mbsf is interpreted to reflect such cementation. Core 112-679D-22X recovered 10 cm of hard, calcite-cemented sandstone (and little else) at a depth of 188.4 mbsf.
Dolomite and phosphate nodules are less abundant compared with the previous lithologic units. Most phosphate occurs as hard, dark nodules and peloids in conglomeratic, sandy layers; light-colored phosphate nodules in diatomaceous mud are rare. As detailed in the "Logging" section (this chapter), a series of prominent positive inflections on the gamma-ray log appears to record at least five cycles between 104 and 162 mbsf in Unit III. Core recovery from this interval was poor, but cycle 1 appears to correlate with dark phosphate nodules recovered in Cores 112-679B-11H and 112-679B-12H and in Cores 112-679D-12H through 112-679D-14X; cycle 2 correlates with phosphate nodules in the lower part of Core 112-679D-14X and in Core 112-679D-15X; cycle 4 correlates with phosphate nodules in Cores 112-679D-17X and the upper part of 112-679D-18X; and the upper part of cycle 5 correlates with Core 112-679D-18X-3 (cycle 3 does not appear to have been recovered). Although correlation is imperfect (perhaps partly because of incomplete core recovery), this tentative correlation suggests that the gamma-ray spikes may indicate the positions of reworked phosphate nodules. Moreover, we speculate that these phosphatic conglomerates record hiatuses, current reworking, or other changes in the sedimentary regime. These possibilities indicate the potential of gamma-ray logging for stratigraphic and paleoceanographic work.
As in Units I and II, we noted no obvious evidence of burrowing by large animals. As detailed in the "Biostratigraphy" section (this chapter), the foraminifer assemblages in Unit III are dominated by forms transported into the depositional environment from shallow water.
Unit IV Cores 112-679E-1X through 112-679E-11X-1, 30 cm; depth, 245.3-
337.6 mbsf; age, middle to late Miocene(?).
Unit IV consists of interlayered organic-rich gray to dark gray mud, mudstone, and siltstone in which microfossils are absent to exceedingly rare. Some siltstone layers are cemented by calcite; this may account for the prominent inflections on the resistivity, sonic, and gamma-ray logs between 252 and 256 mbsf corresponding to the top of lithologic Unit IV.
Smear-slide analyses revealed that many of the mud layers consist largely of clay minerals (70%-80%) having only small amounts of detrital silt and no microfossils. Composition of these siltstone layers is dominated by quartz, rock fragments, and feldspar (mostly Plagioclase). A few small, light brown, friable phosphate nodules occur in this unit.
Although recovery from this unit was poor, a few cores contain bedding sequences and structures. Cross-lamination and thin (3-7 cm), graded turbidite beds are present in Cores 112-679E-4X, 112-679E-5X, 112-679E-6X, and 112-679E-11X, along with minor small burrows and micro faults.
Unit V Cores 112-679E-11X-1, 30 cm, through 112-679E-13X, CC; depth,
337.6-359.3 mbsf; age, middle Miocene.
164

SITE 679
Hole 679A Hole 679B Hole 679D Hole 679E
9- "I0-1
o> is S is -fc < - J DC - 1 CO
J I | ^ ^ ^ P h
f i 1 S i -
-
-' 5 0 -■
-
-
100-
ary
c
=3 O
ocen
e Pl
i we
r
O
I _
_
~
II "
-
I J
^ s s , - ^
^■T^HH
v x -_r-_r-_r-_r - - j i : r ^-\ j^?£r£ l" **~*~*7V"i -0-- -L-_" -J
^ ■ ' ♦ • t
- > - -ihr^r^rir r r r-_n
"run T ^ " - ~~ "- ~ "T»i •**.**' Li ^ " l i _ £ _ £ - ^
-*>• T^V
^ | C ^ 4
Ph
Ph
Ph Ph
Ph
= Ph
0 // f Ph
// VA Ph
// / ii
50 H
100
Lithologies l&-&al Sand, sandstone
PiJHi:?! Silt, siltstone
E HHEj Mud, mudstone
Y-r ~^\ Siliceous ooze
h*~_i_~H Calcareous ooze
l»**.Vi Volcanic ash
Y~_^\ Dolomite
[■■••"•■-•""! Glauconite sand
|=»o>Q'j Phosphorite sand/gravel
Structures
ft | Dewatering veins
150-
200H
Total depth 245.2 m
Figure 4. Lithologic units at Site 679.
Unit V is composed of finely laminated, fissile black shale, which in places contains abundant foraminifers; thin laminae of fine sand; and small, scattered, light-colored phosphate nodules. Weak to strong ultraviolet fluorescence in Cores 112-679E-12X and 112-679E-13X suggests the presence of hydrocarbons. Benthic foraminifer assemblages suggest deposition at upper bathyal depths. The presence of genera such as Bolivina and Bolimi-nella may indicate a low-oxygen environment (see "Biostratigra-phy" section, this chapter).
Clastic Lithologies The sand and sandstone stratigraphy of Site 679 is not well
defined because recovery was poor in unconsolidated sections;
much of the sediment was flushed by drilling circulation. Consequently, sedimentary structures were obliterated and bedding disrupted.
A thick, terrigenous sand bed within the laminated diatoma-ceous muds of Unit II was encountered at Samples 112-679B-5H-6, 28 cm, and 112-679D-5H-4, 118 cm, providing an obvious correlative lithology between the two holes. This bed is estimated to be between 1 to 5 m thick; it moves upward abruptly into well-laminated diatomaceous muds (typical of Unit II) but is underlain by several meters of massive to faintly laminated muds. A sand bed more than 60 cm thick was encountered in Core 112-679D-12H-1. This bed is succeeded by more than 100 cm of sandy mud—homogeneous, gray, and micaceous—
165

SITE 679
Table 2. Lithologic units at Site 679.
Unit Lithology Range
Approximate depth (mbsf)
I Diatomaceous-foraminifer mud, olive to dark gray
II Diatomaceous mud, olive to black
III Interlayered dark olive gray silty diatomaceous mud and dark olive to very dark gray silt and fine sand
IV Mudstone and siltstone, gray to dark gray, in thin graded beds with sporadic calcite cementation
V Shale, very dark gray, laminated, fissile
112-679B-1H through -5H 0-45 112-679D-1H through -5H
112-679B-6H through -12H 45-101 112-679D-6H through 112-679D-11H, 45 cm
112-679B-13H 101-245 112-679D-11H-6, 45 cm through 112-679D-26X
112-679E-1X through 245-338 112-679E-11X-1, 30 cm
112-679E-11X-1, 30 cm 338-359 through 112-679E-13X, CC
followed by an additional 25 cm of sand, which signifies an interval of intensified terrigenous input within the laminated diatomaceous unit.
At Hole 679E, a thick turbidite sequence extends about 65 m from Cores 112-679E-4X through 112-679E-10X. In the seismic section, these strata are folded and possibly reverse-faulted, but we observed negligible deformation in the cores at this scale. The turbidite strata were broken into coherent drill biscuits during the coring process; however, complete depositional events can be reconstructed across the biscuits in many instances. The beds range from 2 to 30 cm thick and display basal scouring, grading, and the low-energy parts of Bouma sequences—primarily Tacde, Tbcde, Tcde, and Tde—corresponding to Facies D of Mutti and Ricci-Lucchi (1972). Without more regional control of samples we cannot define the environment of deposition more precisely. Fine-grained, low-energy turbidites are not restricted to distal environments; they may occur reasonably close to a sediment source if (1) laterally removed to interchannel basins,
100
200
300
No recovery
A Hole 679B
- # Hole 679D
- ■ Hole 679E
20 40 Carbonate (%)
60 10
1 1 . 1 I
A \ P. h
^ " x ^ ^ -A \. / \
A ~ - - - >
— ■- i r ~ ~ ~ ~ ~ ~ - = A
- - V >s^ — — " " wr
A -l
+ -l ,<' A Hole 6 7 9 B
" . ' " • Hole 6 7 9 D
•'' t-I 1 1
1 , 1 ,
—
_
—
_
—
-
6 —
20 40 Carbonate (%)
60
Figure 5. Carbonate contents of sediments at Site 679 (see Table 3). A) Plot of data for Holes 679B, 679D, and 679E. B) Carbonate contents in the upper 10 m of Unit I.
166

SITE 679
cm
105
110
115
cm _
Figure 6. Layer of light-colored, friable phosphate nodules in Unit I (112-679B-2H-5).
(2) elevated on topographic highs, or (3) isolated by structural barriers. Coarser-grained intervals also may have been preferentially washed out by drilling, thereby biasing the recovery record.
Invariably, the sands encountered in all holes and facies at Site 679 are both compositionally and texturally immature. Argillaceous content (silt and clay) ranges continuously from 20% through sandy and silty mud lithologies; individual grains are angular with fresh cleavage and fracture surfaces. The light components typically contain about 50% volcanic lithic grains that indicate microlitic and pumiceous flow textures and about 50% quartz and feldspar in equal amounts. The heavy mineral components include biotite, hornblende, pyroxenes, opaques, and epidote. Source rocks were clearly dominated by thick volcanic and volcaniclastic sequences that accumulated during Mesozoic and Cenozoic time in the High Andean Cordillera and its western foothills. Although Site 679 is situated directly above the offshore projection of the Peruvian Coast Range, the pre-An-dean crystalline basement rocks of this structure have apparently contributed little detritus to this site during the time represented by the cored intervals, which might have occurred if structural blocks were locally exposed along the strike.
Sandy lithologies are locally cemented by fine-grained carbonate at several zones in the section (e.g., Samples 112-679D-12H-1, 40-44 cm, and 112-679D-22X, CC [10-25 cm]; 112-679E-3X, CC
25
30
35
Figure 7. Light-colored dolomite nodule in diatom-foraminifer mud, Unit II (112-679B-8H-3).
[20-33 cm], 112-679E-5X-1, 112-115 cm, and 112-679E-12X, CC [27-33 cm]). The size of the cement crystals ranges from a few to 15 m. In addition, unconsolidated sands occasionally contain as much as 40% silt-sized, carbonate rhombs (e.g., Samples 112-679D-10H, CC [20 cm] and 112-679E-2X-1, 87-98 cm). These observations suggest that permeable clastic lithologies influenced the migration pathways of cementing pore fluids.
Carbonate Measurements We determined the amount of carbonate using samples from
all lithologic units recovered from Site 679. To characterize car-
167

SITE 679
bonate minerals further and to estimate relative proportions, we tentatively determined the ratios of calcite to dolomite, based on reflection intensities in bulk X-ray diffraction analyses of samples from Hole 679B. Methods are detailed in the "Explanatory Notes" chapter (this volume). Results of carbonate determinations in all holes drilled agree reasonably well and underscore the validity of hole-to-hole correlations, even though sedimentary structures indicate frequent slumping, debris flow, and winnowing.
Values of carbonate (given as CaC03 in Table 3) range from 76.4% in Unit I (Sample 112-679D-3H-3, 71-73 cm, 18.11 mbsf), a foraminifer-rich laminated mud overlying a slump fold, to 0% in Unit II (Sample 112-679B-10H-4, 67-70 cm, 87.7 mbsf), a volcanic-ash-bearing diatomaceous mud. Based on the carbonate contents, the sediment sequence at Site 679 may be divided into three parts: (1) an upper carbonate-rich part (Unit I), (2) a middle carbonate-poor part (Units II and III), and (3) a lower carbonate-bearing part (Unit IV).
Unit I, the diatom-foraminifer mud of about 45 m thick, is characterized by relatively high CaC03 contents, with a mean of about 15% to 20%. Closely spaced sampling of Cores 112-679A-1H and 112-679B-1H, however, show that the olive diatomaceous muds of Sections 112-679A-1H-1, 112-679A-1H-2, 112-679B-1H-1, and 112-679B-1H-2 are generally low in carbonate content (Fig. 5). Carbonate concentrations appear to be determined primarily by the presence or absence of calcareous plankton in discrete layers, not by disseminated diagenetic carbonate cement.
CaC03 concentrations decrease dramatically to fairly consistent values at about 0.5% in the olive to black diatomaceous mud of sedimentary Units II and III (top at about 45 m; Fig. 5). These samples are characterized by low calcite/dolomite ratios, which might indicate carbonate dissolution and/or dolomite formation. In smear slides of sediments from Unit II at Site 679, dolomite occurs as idiomorphic rhombs disseminated in a siliceous matrix or as micritic aggregates.
Carbonate contents increase in Unit IV; values are about 5%. Because calcareous microfossils are absent to rare in this unit, carbonate may be in the form of calcite cements, which were observed in smear slides.
Diagenesis
Phosphates As noted previously, phosphate occurs in two forms. Light-
colored, friable nodules (Fig. 6) appear to have formed in situ during replacement of the host diatom mud; we define these as F-phosphates (friable phosphates). They are well developed in Units I and II (e.g., Cores 112-679A-1H, 112-679B-1H, and 112-679D-2H) and occur sporadically in Units III through V. Hard, dense phosphate nodules (defined here as D-phosphates) having a dark outer rind occur in conglomeratic beds, commonly with a basal-scoured contact, and appear to be products of repeated winnowing and reworking, thus marking hiatuses or condensed zones. These phosphates are similar to what European stratigraphers refer to as "hiatus concentrations." They occur in Unit I and are especially prominent in Unit II (e.g., Core 112-679D-1H). D-phosphates appear less abundant in Unit III, although poor recovery from this unit makes this uncertain. As mentioned in the general description of Unit III at the beginning of this section, phosphatic conglomerates appear to occur in cyclic sequences in the upper part of Unit III.
Authigenic Carbonates Dolomite is most abundant in Units I and II and occurs as
(1) disseminated small rhombs in unlithified sediments, (2) as
Table 3. Carbonate content in sediments of Site 679, Leg 112.
Sample Depth CaC0 3 (cm) (mbsf) (%)
Hole 679A
1H-1, 1H-1, 1H-1, 1H-1, 1H-1, 1H-2, 1H-2, 1H-2, 1H-3, 1H-3, 1H-3, 1H-3, 1H-3, 1H-4, 1H-4, 1H-4, 1H-5, 1H-5,
50-52 57-59 67-67 107-109 115-117 46-47 77-79 134-136 50-52 51-53 66-68 100-102 148-150 50-52 100-102 148-150 50-52 100-102
0.50 0.57 0.65 1.07 1.15 1.96 2.27 2.84 3.50 3.51 3.66 4.00 4.48 5.00 5.50 5.98 6.50 7.00
12.58 8.33 2.67
39.57 1.17 2.17
57.48 1.33 5.33
44.23 12.08 3.33
23.57 32.74 35.99 34.32 44.73 34.90
Hole 679B
1H-3, 1H-3, 1H-4, 1H-4, 1H-5, 2H-1, 2H-3, 2H-5, 2H-6, 3H-3, 3H-4, 3H-4, 3H-4, 3H-5, 3H-6, 3H-7, 4H-1, 4H-2, 4H-3, 4H-4, 4H-5, 4H-6, 4H-7, 5H-1, 5H-2, 5H-5, 5H-6, 5H-6, 6H-6, 6H-6, 7H-2, 7H-6, 8H-2, 8H-4, 8H-4, 8H-6, 9H-2, 9H-6, 10H-2 10H-4 10H-7 11H-1 12H-2 12H-2 12H-3 12H-4
34-36 126-128 55-57 94-96 5-7 99-101 29-31 117-119 103-105 121-123 34-36 49-51 100-102 118-120 118-121 20-23 45-47 45-47 45-47 37-40 45-47 45-47 45-47 109-111 109-111 109-111 25-26 52-55 54-57 114-116 51-52 67-70 69-72 75-78 124-126 87-90 58-61 59-62 , 85-87 , 67-70 , 57-61 , 38-41 , 63-66 , 96-98 , 60-63 , 7-9
3.34 4.26 5.05 5.44 6.05 7.49 9.79
13.67 15.03 20.21 20.84 20.99 21.59 23.18 24.68 25.20 25.95 27.45 28.95 30.37 31.95 33.45 34.95 36.09 37.59 42.09 42.75 43.02 52.54 53.14 56.01 62.17 65.69 68.75 69.24 71.87 75.08 81.09 84.85 87.67 92.07 92.38
103.63 103.96 105.10 106.70
1.42 42.98
5.66 3.58
53.73 1.42 0.33 1.50 7.00
13.41 22.99 9.16 4.58 6.66 8.00
14.58 8.25
18.08 3.83 7.25 3.83 6.08 5.25 5.41 4.50 9.08 6.00
10.41 0.10 0.17 0.90 0.92 2.33 0.25 0.25 4.75 0.67 0.50 1.08 0.00 0.92 1.33 1.83 1.08 0.24 2.17
small hard nodules (Fig. 7), and (3) as thin lithified beds (Fig. 8). Dolomite rhombs first appear in sediments as shallow as 96 cm below the seafloor (Section 112-679A-1H-1). The shallowest occurrence of lithified dolomite is at 20 mbsf (Sample 112-679B-3H-3, 98-99 cm).
168

SITE 679
Table 3 (continued). cm,
Sample Depth CaC0 3 (cm) (mbsf) (%)
Hole 679D
1H-3, 1H-4, 1H-5, 2H-1, 2H-2, 2H-3, 2H-5, 3H-1, 3H-1, 3H-2, 3H-2, 3H-3, 3H-3, 3H-3, 3H-4, 3H-5, 3H-6, 3H-2, 5H-1, 5H-3, 5H-3, 5H-4, 6H-1, 6H-2, 6H-3, 6H-3, 6H-5, 7H-2, 7H-4, 8H-2, 8H-4, 8H-6, 9H-3, 10H-2 11H-1 11H-3 11H-5 11H-5 17X-1 20X-1
45-47 145-150 62-65 92-95 68-70 130-133 70-72 63-65 71-74 43-45 65-68 71-73 91-93 140-150 69-71 130-132 68-71 70-73 59-61 75-78 88-90 70-73 112-115 57-60 65-68 140-150 68-69 77-80 64-67 66-69 81-84 83-86 140-150 , 85-88 , 56-59 , 53-56 , 15-17 , 103-106 , 140-150 , 115-125
3.45 5.95 6.62 8.82
10.08 12.20 14.60 18.03 18.11 19.33 19.55 21.11 21.31 21.80 22.59 24.70 25.58 29.10 36.99 40.15 40.28 41.60 47.02 47.97 49.55 50.30 52.58 57.67 60.54 67.06 70.21 73.23 78.80 86.25 93.96 96.93 99.55
100.43 143.80 172.05
2.08 1.83
36.03 0.92 0.25 5.42
33.90 18.91 27.66 13.08 22.82 76.39 9.16
13.66 6.58
14.66 10.08
1.83 7.16
14.16 22.91
7.49 0.33 0.42 0.33 0.25 2.17 0.17 0.17 1.25 4.50 1.00 2.33 0.33 2.33 1.33 1.17 1.58 3.58 2.67
Hole 679E
4X-3, 140-150 6X-2, 140-150 7X-1, 104-105 7X-1, 135-136 7X-1, 140-141 7X-1, 147-148 7X-2, 15-19 7X-CC, 3-4 8X-1, 56-57 9X-1, 43-44 9X-1, 89-90 9X-1, 89-93 9X-CC, 15-18 10X-1, 11-13 10X-1, 64-65 10X-2, 42-43 10X-3, 68-69 10X-CC, 23-24 11X-1, 108-109 11X-CC, 11-12 12X-1, 140-150
275.20 292.70 300.34 300.65 300.70 300.77 300.95 308.75 309.36 318.73 319.19 319.21 327.75 327.91 328.44 329.72 331.48 337.25 338.38 346.75 348.20
6.51 5.92 4.50 3.17 7.59 8.92 3.58 8.26
10.43 27.74
5.08 5.00 9.17 8.33 1.67 2.08 1.17 7.41 3.58 3.17 4.34
H = hydraulic piston; X = extended-core barrel.
Authigenic Silica The only silica diagenesis we noted was a 3-cm-thick layer
of amber-colored opal-CT chert at 19.8 mbsf (Sample 112-679D-3H-2, 93-96 cm). This layer occurs within a phosphatic band. Textural evidence that we observed in a thin section indicates that the phosphate replaced a dolomite-bearing foraminifer sand, which in turn was replaced in part by opal-CT.
Figure 8. En-echelon tension gash arrays and dewatering veins, Unit II. Light-colored layer is dolomite (112-679B-10H-5, 83-93 cm).
Sedimentary Structures and Processes, Unit III A distinctive sequence of sand and sandy silt beds occurs in
the lower part of Unit III. Core 112-679D-19X displays this sequence especially well; Figure 9 is a graphic log of sections 1 and 2 of this core. Although drilling biscuits are pervasive throughout this core, individual biscuits are large enough so that one can distinguish real sedimentary structures from the drilling disturbance. Beds that are thicker than drill-biscuit size can also be identified, but contacts are often obscured by the intrusion of drilling slurry between drill biscuits.
A 3-m upward-fining sequence (recognized in this core; Fig. 9) that moves from moderately to thickly bedded, very fine sand at the base of Core 112-679D-19X-2 to predominantly silt or sandy silt in Core 112-679D-19X-1 can be recognized. The sand beds in Core 112-679D-19X-2 have a sharp base (where seen) and individually grade upward into thin intervals of sandy silt. Parallel and cross-laminations can be distinguished in some beds. The sandier beds are composed of predominantly terrigenous material (approximately 45% quartz, feldspar, and volcanic glass) as well as a significant proportion of diatoms (35%). The siltier beds in section 1 are both parallel and cross-laminated. These beds are commonly separated by thin (less than 1 cm), very fine sand beds. The silts have a similar terrigenous composition, but contain an even higher proportion of diatoms.
The cross-laminations in both silt and sand beds have a distinctive character (Figs. 10 and 11). Sets of silt and sand laminae display both upward and downward divergence or "splaying." Sets of laminae are separated by irregular, often concave, scour surfaces; the thickness of each bed set is on the scale of several centimeters. Sedimentary laminae mantle or conform to the basal erosional surface and are truncated by the overlying scour surface in a manner similar to that of hummocky cross-stratification. Hummocky cross-stratification (HCS), as identi-
169

SITE 679
Section 112-679D-19X-1 O-i
Section 112-679D-19X-2
150
Silt Sand
[ . .. " j Sand
Ripple
"Splayed" laminations
Parallel laminations
Figure 9. Graphic representation of Sections 112-679D-19X-1 and 112-679D-19X-2 (Unit III).
fied in the field, generally has wavelengths on the order of 1 to 1.5m. Identification of HCS in cores is more difficult, but similar structures have been described using the lamination scale that Walker (1984) attributes to HCS. These examples are characterized by concave and convex upward curvatures of lamination and "subtle low angle changes in dips of laminae" (Walker, 1984).
Horizontal, planar laminae
Scour surface Almost massive with very subtle laminae Laminae splaying to right
21—-
Splaying laminae indicating convex-up surface to original bedform
^l^--!':!.v-,''..^:t---:-:---'-:^'A^
Siltier
Scour surface Sandier
Siltier
Sandier
Figure 10. Sketches of cross-laminated intervals in Unit III (A, B, and C, and sketches from Section 112-679D-19X-1): A) Cross-laminated fine sand layer within laminated silt interval (76-78 cm); B) Details of laminations in sandy silt showing splaying (16-21 cm); C) Hummocky bedform, splayed laminae, and scoured surface (31-34 cm).
The sands and silts of Core 112-679D-19X clearly show the action of currents. The presence of HCS suggests reworking by wind-forced currents in shelf or uppermost-slope water depths (Walker, 1984).
Depositional Environments We interpret Units I and II to be products of hemipelagic de
position at middle to upper bathyal depths in an area of highly productive surface waters and low-oxygen bottom waters. These conditions produced laminated diatomaceous muds, as well as diagenetic dolomites and friable phosphates. Unit I has more calcareous microfossils than Unit II for reasons that are not clear; possibly paleoceanographic conditions were different or diagenesis destroyed more calcareous microfossils in Unit II, or both of these factors were in effect. Modification of the sediments in Units I and II occurred during winnowing and/or scouring events, the more severe of which generated the phosphatic conglomerates. These events perhaps resulted from a combination of wind-driven currents and periodic vigorous thermoha-line currents; the latter could have included poleward-flowing bottom currents.
Unit III contains evidence of hemipelagic, high-productivity deposition, periodically interrupted by wind-driven currents (large storms?) that transported and deposited detrital sand and silt in hummocky bed forms, along with shallow-water benthic
170

SITE 679
Figure 11. Photograph of small-scale structures of Unit III (112-679D-19X-2). Note hummocky layer at top of photo, cross-lamination in the middle and lower parts, and a hummocky surface at the base of the photo.
foraminifers. This in turn suggests that deposition at Unit III occurred at shallower depths than at Units I and II, with substantial influxes of terrigenous sediment. Unit IV is a turbidite unit having an uncertain depositional environment; the lack of microfossils could result from deposition in a nonmarine environment or from their dissolution during diagenesis. Unit V represents marine deposition in a low-energy, low-oxygen environment, possibly of upper bathyal depth.
Because the section at Site 679 appears to be partly condensed, we again present the evidence for erosion and winnowing of sediments in Units I, II, and III. Major features that suggest these processes are as follows:
1. Thin, graded, sandy silts and muds with scoured basal contacts (Units 1 and 2).
2. Reworked, dark phosphate nodules (Units I, II, and III). 3. Small ripples, cross-lamination, and hummocky cross-lam
ination (Unit V).
Structure
Drilling-Induced Structures Numerous structures attributable to drilling disturbance oc
cur in cores from Site 679. One must be careful to distinguish such features from real structures. Most common are symmetrical and asymmetrically bowed beds that are concave downward,
formed by drag along the edges of the core (Fig. 6). These beds are most pronounced in thinner bedded units. Drilling breccias typically occur near the tops or bottoms of cores, but may occur anywhere and can be recognized by disruption around individual fragments (whereas sedimentary breccias exhibit no disruption at clast contacts) (Fig. 7). At the tops of cores these breccias commonly include exotic material from higher levels of the hole.
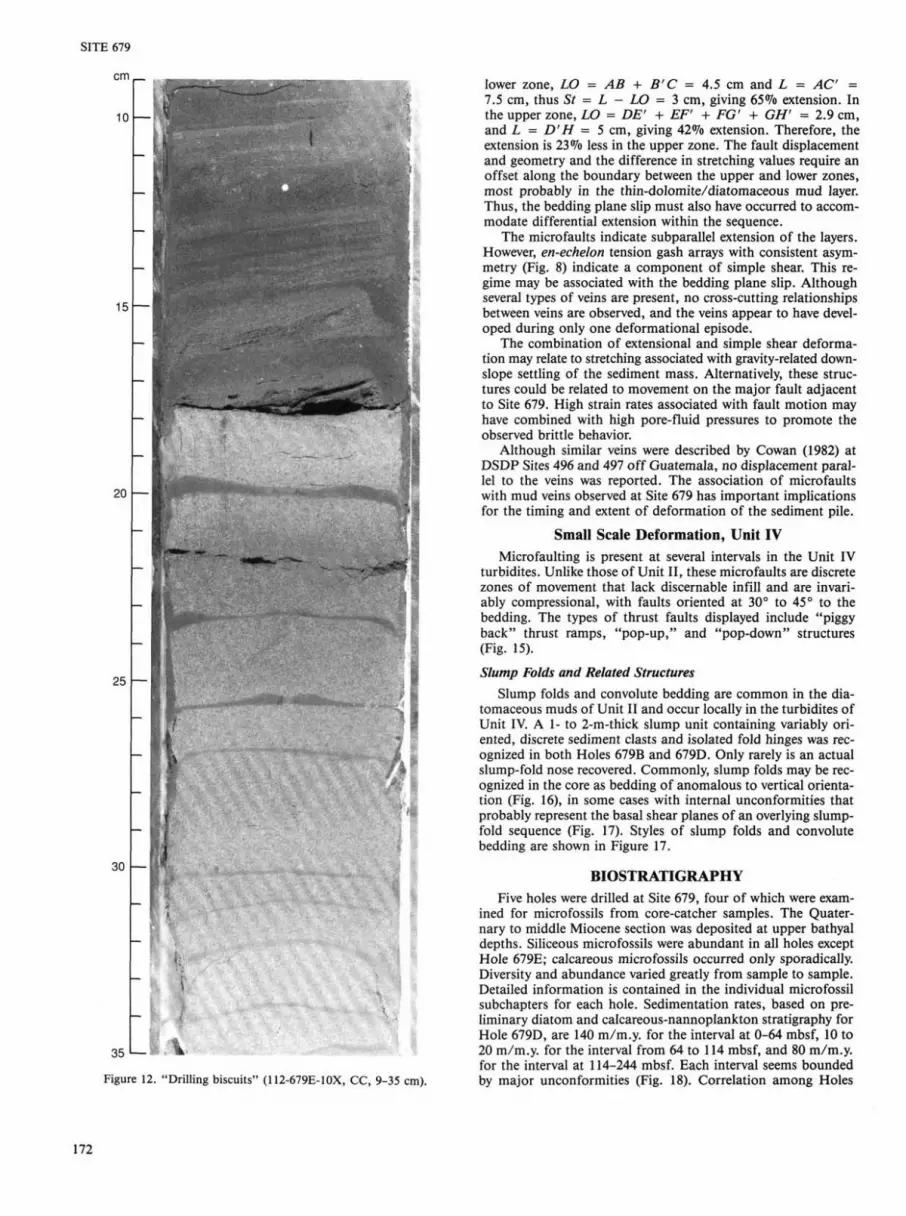
At deeper stratigraphic intervals, especially within the turbi-dites, drill biscuits are pervasive. These biscuits can be recognized by (1) their smooth upper and lower boundaries, (2) the abrupt termination of internal structures such as laminae, and (3) the homogeneous nature of the slurry surrounding them (Fig. 12).
Deformational Structures
Veins and Dewatering Structures, Unit II We observed numerous veins related to sediment dewatering
in the diatomaceous mud unit (Unit II). These features first appear at depths of 57 mbsf in Hole 679B and 56 mbsf in Hole 679D and are common at depths of 60 to 68 mbsf. These veins are better developed (or better preserved) in some intervals than in others and were not observed below 103 mbsf (Hole 679D). We saw no veins in Units III through V.
The veins do occur as three types of infill: (1) extensional mi-crofaults (Figs. 13A and 13B), (2) en-echelon tension gash arrays (Fig. 8), and (3) wider discrete gashes. They are typically 2 to 5 mm thick but can reach a maximum thickness of 5 to 6 mm. These veins most commonly are oriented at a high angle to bedding (70° to 85°), although where veining is intense, small subhorizontal vein arrays occur between larger, highly angled veins. Individual veins can be traced up to 1 m vertically within core sections. At relatively shallow burial depths, the veins occur as isolated or widely spaced, mud-filled fractures, although as the depth increases they are more closely spaced and commonly form anastomosing networks of thin en-echelon gashes that are spaced only a few millimeters apart.
Dewatering veins are recognized by a change in color, being generally darker than the surrounding sediment (Figs. 8, 13A, and 14). Microscopic examination of vein material indicates that it is a concentration of the fine fraction of the surrounding sediment; however, this material also includes a higher proportion of authigenic carbonate, which suggests that carbonate-rich pore fluids migrated to the veins. When coarser layers of fine sand are present, veins do not penetrate but appear to die out as grain size (and hence permeability) increases (Fig. 14). However, diatom-rich layers show jagged edges at vein margins, which suggests brittle failure.
Mass transfer of material within the veins is illustrated by paler mud associated with dolomitic layers (Fig. 8). Movement of up to 15 mm both above and below the dolomite layer suggests segregation of fluidized material into tensional openings within the sediment, rather than the simple upward escaping of fluid.
Extensional microfaults are important loci of vein formation. Subvertical veins typically fill in small normal faults (Figs. 13A and 14), thus offsetting thin beds and laminae of silt and mud. Extension was tentatively measured across Sample 112-679D-7H-4, 17-25 cm. At this location (Fig. 13B), a thin diatom-rich layer (3 mm) overlying a dolomite lamination (1 mm) separates upper and lower zones of extensional faulting with an opposing fault dip. In the upper zone, the fault dip is 70° to 75° in relation to the core axis, and in the lower zone, 150° to 155° to the core axis. Stretching was evaluated by comparing the length between two points before and after faulting, using the crossing points between bed and fault as reference (Fig. 13B). In the
171
SITE 679
lower zone, LO = AB + B'C = 4.5 cm and L = AC = 7.5 cm, thus St - L - LO = 3 cm, giving 65% extension. In the upper zone, LO = DE' + EF' + FG' + GH' = 2.9 cm, and L = D'H = 5 cm, giving 42% extension. Therefore, the extension is 23% less in the upper zone. The fault displacement and geometry and the difference in stretching values require an offset along the boundary between the upper and lower zones, most probably in the thin-dolomite/diatomaceous mud layer. Thus, the bedding plane slip must also have occurred to accommodate differential extension within the sequence.
The micro faults indicate subparallel extension of the layers. However, en-echelon tension gash arrays with consistent asymmetry (Fig. 8) indicate a component of simple shear. This regime may be associated with the bedding plane slip. Although several types of veins are present, no cross-cutting relationships between veins are observed, and the veins appear to have developed during only one deformational episode.
The combination of extensional and simple shear deformation may relate to stretching associated with gravity-related down-slope settling of the sediment mass. Alternatively, these structures could be related to movement on the major fault adjacent to Site 679. High strain rates associated with fault motion may have combined with high pore-fluid pressures to promote the observed brittle behavior.
Although similar veins were described by Cowan (1982) at DSDP Sites 496 and 497 off Guatemala, no displacement parallel to the veins was reported. The association of micro faults with mud veins observed at Site 679 has important implications for the timing and extent of deformation of the sediment pile.
Small Scale Deformation, Unit IV Microfaulting is present at several intervals in the Unit IV
turbidites. Unlike those of Unit II, these micro faults are discrete zones of movement that lack discernable infill and are invariably compressional, with faults oriented at 30° to 45° to the bedding. The types of thrust faults displayed include "piggy back" thrust ramps, "pop-up," and "pop-down" structures (Fig. 15).
Slump folds and convolute bedding are common in the dia-tomaceous muds of Unit II and occur locally in the turbidites of Unit IV. A 1- to 2-m-thick slump unit containing variably oriented, discrete sediment clasts and isolated fold hinges was recognized in both Holes 679B and 679D. Only rarely is an actual slump-fold nose recovered. Commonly, slump folds may be recognized in the core as bedding of anomalous to vertical orientation (Fig. 16), in some cases with internal unconformities that probably represent the basal shear planes of an overlying slump-fold sequence (Fig. 17). Styles of slump folds and convolute bedding are shown in Figure 17.
BIOSTRATIGRAPHY Five holes were drilled at Site 679, four of which were exam
ined for micro fossils from core-catcher samples. The Quaternary to middle Miocene section was deposited at upper bathyal depths. Siliceous micro fossils were abundant in all holes except Hole 679E; calcareous microfossils occurred only sporadically. Diversity and abundance varied greatly from sample to sample. Detailed information is contained in the individual microfossil subchapters for each hole. Sedimentation rates, based on preliminary diatom and calcareous-nannoplankton stratigraphy for Hole 679D, are 140 m/m.y. for the interval at 0-64 mbsf, 10 to 20 m/m.y. for the interval from 64 to 114 mbsf, and 80 m/m.y. for the interval at 114-244 mbsf. Each interval seems bounded by major unconformities (Fig. 18). Correlation among Holes
20
25
30 —
' '■■ JMTI^LJ
35 '— v V
Figure 12. "Drilling biscuits" (112-679E-10X, CC, 9-35 cm).
Slump Folds and Related Structures

A
SITE 679
cm
10
15
D' D E ' E F F G ' G H ' H
Diatom-rich
Dolomite
2 5 A B Inferred
Figure 13. A) Extensional microfaults, Unit II (112-679D-7H-7, 1-18 cm). B) Sketch of extensional microfaults, Unit II (112-679D-7H-4, 15-25 cm).Letters A to H' denote originally adjacent points on planar surfaces that were disrupted by faulting; their geometric relationship can be used for calculating amount of extension.
679B, 679C, and 679D is presented in Figure 19, based on last abundance datum (LAD) and first abundance datum (FAD) of selected diatom and nannoplankton species.
Diatoms
Hole 679B Diversity and abundance are generally high, and assemblages
are well preserved in the samples taken routinely from core catchers. Silicoflagellates were rare and occasionally sponge spicules were found.
Typical upwelling floras having Delphineis, Chaetoceros bristles and spores, Thalassionema nitzschioides, and Thalassio-thrix species formed the major constituents. Occasionally, floras were enriched in neritic, large, heavily silicified frustules of Actinocyclus ehrenbergii and Actinoptychus undulatus a.o.
Sections 112-679B-1H, CC through 112-679B-6H, CC are of Quaternary age. Actinocyclus oculatus is abundant in Section 112-679B-7H, CC and places this sample in the Actinocyclus oculatus zone of Akiba (1985) with an age of 1.7-0.9 Ma. Sections 112-679B-7H, CC through 112-679B-8H, CC contained no age-diagnostic diatoms. Section 112-679B-9H, CC had Rossi-
ella tatsunokuchiensis and large Goniothecium, which also occurred in the following samples down to Section 112-679B-12H, CC. A tentative age of lower Pliocene is assigned to this interval. Section 112-679B-13H, CC was an ash bed(?) and was barren of diatoms and silicoflagellates.
Hole 679C Core-catcher samples were studied for opaline planktonic mi
cro fossils. All samples contained a diversified and well-preserved diatom floral assemblage of cold-water species. Occasionally, floods of isolated girdle bands and other undentified small Tha-lassiosira and Melosira species were encountered (Sections 112-679C-3H, CC and 112-679C-4H, CC). Synedra indica was common and was associated with other "upwelling" species, such as Delphineis, Thalassiosira spp., Thalassionema nitzschioides, and Chaetoceros.
Actinocyclus oculatus was found in Sections 112-679C-5H, CC and 112-679C-7H, CC, placing this interval in the Actinocyclus oculatus Zone (0.9-1.7 Ma) of Akiba (1985); Nitzschia fos-silis occurred in trace amounts in Section 112-679C-7H, CC. Because the range of this species is not well defined and because no Pseudoeunotia doliolus was found, a tentative age of early
173

SITE 679
Figure 14. En-echelon tension gash arrays and dewatering veins, Unit II. Light-colored layer is a volcanic ash (112-679B-10H-4, 86-114 cm).
Pliocene is assigned for Section 112-679C-7H, CC because of the common occurrence of Rossiella tatsunokuchiensis and Goniothecium.
Hole 679D All core-catcher samples were studied; these contained abun
dant and well-preserved diatom assemblages. Because most of the biostratigraphically useful marker species were extremely rare and because their LAD or FAD could not be determined accurately, all ages presented are tentative. The zonations of Akiba (1985) and Barron (1985) could not be used. Ages were derived
'vR. - 1 ■■\ t "
Figure 15. Microfaults in thin turbidites, Unit IV (112-679E-8X-1, 10-15 cm).
from an unpublished compilation by Schrader (1987) of species that occur in marine Cenozoic sections on land and offshore Peru.
Samples below Section 112-679D-18X, CC consisted of sand with diatom admixtures. Floras were enriched by decanting heavy, large particles in some samples.
The section above 112-679D-4H, CC is of Quaternary age; the Actinocyclus oculatus Zone of 0.9-1.7 Ma was found in Sections 112-679D-5H, CC through 112-679D-7H, CC. Rossiella tatsunokuchiensis, (LAD, 2.5 Ma), was found in Section 112-679D-9H, CC in association with Goniothecium. Denticu-lopsis hustedtii (LAD, 4.2 Ma) was found in Section 112-679D-11H, CC. Forms that resembled Thalassiosira praeoestrupii were abundant in Section 112-679D-10H, CC, placing this sample close to the Pliocene/Miocene boundary. Thalassiosira jacksonii was seen last in Section 112-679D-19X, CC; the FAD of this species is reported as 6.8 Ma. Nitzschia ported, (LAD, 6.8 Ma) occurred last in Section 112-679D-25H, CC. The lowest sample contained abundant Nitzschia porteri, Rouxia californica, and minor admixtures of a new Rouxia species, Actinocyclus ingens (flat form); a tentative late Miocene age was assigned to this sample.
Reworked older diatoms occurred in the following samples: 112-679D-25H, CC with Rossiella tatsunokuchiensis, 112-679D-24X, CC with Thalassiosira convexa, 112-679D-18X, CC with Denticulopsis punctata and Denticulopsis kanayae, 112-679D-16X, CC with Oligocene Pyxilla, and 112-679D-15X, CC with D. punctata.
Hole 679E Except for some phosphorite chips recovered from the core-
catcher sample of Core 112-679E-1X, all other samples were barren of diatoms. As only the core catcher was recovered in Core 112-679E-1X, it is likely that some or all of the recovered material is drilling detritus. One should not rely on the late Miocene-Pliocene age of floras encountered here. A detailed search for diatoms in the turbidite section was unsuccessful.
Silicoflagellates Silicoflagellates occurred in Holes 679B, 679C, and 679D at
various levels and were associated with abundant diatoms and rare sponge spicules. These were not studied in detail, but include representatives of the Dictyocha messanensis and Diste-phanus speculum groups. Mesocena species were not found during our smear-slide studies. Note the occurrence of Distephanus speculum speculum var. pseudofibula in Section 112-679C-6H,
174

SITE 679
112-679B-1H-2, 125-135 cm Slump fold over decollement
1 2 5 - 2
130 —
135—■
112-679B-5H-2, 30-105 cm Large scale slump-fold zone
30 —
112-679B-3H-3, 125-135 cm Probable interior of slump fold
125
130 —
3 5 -
40 —
4 5 -
50 —
55 —|
60
If § 6 5 ^
70 H
135
112-679D-2H-3, 85-100 cm Slump fold overlain by unconformity
85—u
90 —
9 5 -
100 —
75 — :
8 0 -
8 5 -
9 0 -
9 5 -
100 — !
105—'
^
I vi
Figure 17. Styles of slump folds and convoluted bedding observed at Site 679.
CC; according to the diatoms this points to an early Pliocene age.
In Hole 679E a similar silicoflagellate assemblage containing Distephanus speculum speculum var. pseudofibula was found in phosphate nodules recovered in Section 112-679E-1X, CC, but we considered this to be downhole contamination from a higher stratigraphic level.
Calcareous Nannoplankton Based on core-catcher investigations of the upper part of
Site 679, three main nannoplankton assemblages can be differentiated that have preservation varying from good to moderate. These are (1) Gephyrocapsa spp./Helicosphaera carteri assemblage, (2) Coccolithus pelagicus assemblage, and (3) Reticulofe-nestra pseudoumbilica/Coccolithus pelagicus assemblage.
175

SITE 679
100 —
200 —
300 —
400
-
—
A
•
1 2 m/m.y. '
250 m/m.y.
^ o \ 1 1 m/m .y.
VA 5 5 m/m.y.
JA*&?
\ V / / A 22 m/m.y.
Nannoplankton v A LAD or FAD diatoms ^ \
I 16
Age (Ma)
Figure 18. Sedimentation rates, based on diatom and nannoplankton stratigraphy, Hole 679D.
The youngest sediments seem to be present in Sections 112-679C-1H, CC and 112-67D-1H, CC, where the Gephyrocapsa spp./Helicosphaera carteri assemblage also contains Emiliania huxleyi, indicating the Holocene calcareous nannoplankton Zone NN21 {Emiliania huxleyi Zone), which is younger than 0.275 Ma.
The Gephyrocapsa spp./Helicosphaera carteri assemblage was found in Sections 112-679A-1H, CC, 112-679B-1H, CC through 112-679B-3H, CC, and Sections 112-679D-2H, CC and 112-679D-3H, CC. As we could not find E. huxleyi, these samples were placed in the late Pleistocene nannoplankton Zone NN20 {Gephyrocapsa oceanica Zone) above the last occurrence of Pseu-doemiliania lacunosa (0.47 Ma).
The Coccolithus pelagicus assemblage, indicating cold-water conditions, occurs in Sections 112-679B-4H, CC, 112-679C-2H, CC, 112-679C-4H, CC, 112-679C-5H, CC, and 112-679D-4H, CC. A few Gephyrocapsa and Cyclococcolithus leptoporus specimens also occur in some of these samples. Since index species are missing in this particular assemblage, we could not assign an age.
The Reticulofenestra pseudoumbilica/Coccolithus pelagicus assemblage was observed in Sections 112-679B-8H, CC, 112-679B-9H, CC, 112-679B-12H, CC, 112-679B-13H, CC, 679C-7H, CC, 112-679C-8H, CC, and 112-679D-8H, CC, which is not younger than 3.5 Ma because the last occurrence of R. pseudoumbilica marks the top of calcareous nannoplankton Zone NN15 {Reticulofenestra pseudoumbilica Zone). These samples were tentatively placed in the early Pliocene nannoplankton Zone NN15, although owing to the low diversity these may be somewhat older and may indicate a possible hiatus just above this level. In Section 112-679D-19H, CC, a sudden occurrence of well-preserved Reticulofenestra pseudoumbilica together with Sphenolithus abies, Cyclococcolithus leptoporus, and Cocco-
100
200 —
300
A 1 1 1 NN20 otal depth
7.0m
B 1
3
5
7
9
1 1
NN20
-cp
AO^.-
Total depth 107.2m
C 1
3
5
7
Ao
~-~^
Total aeprn 75.5m ? - ~ -
? —_
TC
D 1
3
5
7
9
1 1 13
1 5
17
19
'J\
23
25
27 tal dep 245 .4rr
Cp
A0
Rp Rt
— Dh
Tj
Np
th
Total depth 359 .3m
Figure 19. Diatom (dashed lines) and calcareous nannoplankton (solid lines) correlation of holes; based on first abundance datum (FAD) and last abundance datum (LAD).
176

SITE 679
lithus pelagicus was noted in an otherwise barren sequence between Sections 112-679D-12H, CC and 112-679D-27H, CC.
Several samples between the Coccolithus pelagicus assemblage and the Reticulofenestra pseudoumbilica/Coccolithus pelagicus assemblage were barren. These included Sections 112-679B-5H, CC, 112-679B-6H, CC, and 112-679B-7H, CC as well as Sections 112-679C-3H, CC and 112-679C-6H, CC. In addition, Section 679B-11H, CC in the Reticulofenestra pseudoumbilica/Coccolithus pelagicus assemblage was barren.
Samples from Hole 679E (245.3-359.3 mbsf) have no calcareous nannoplankton, with the exception of some levels within Cores 112-679E-11X and 112-679E-12X. The meager assemblage contains some discoasters besides Reticulofenestra pseudoumbilica, Coccolithus pelagicus, and Helicosphaera carteri. Species include Discoaster variabilis and Discoaster exilis. In Section 112-679E-12X, CC Cyclococcolithus cf'. floridanus was observed; the assemblage was tentatively placed in the middle Miocene calcareous nannoplankton Zone NN6 {Discoaster exilis Zone).
Radiolarians Hole 679B
Core-catcher samples from Hole 679B were studied for radiolarians; these are rare in most samples and are diluted by diatoms. Although preservation is generally good, we could not assign ages.
Quaternary radiolarians are common in Section 112-679B-1H, CC and include Cycladophora davisiana, Euchitonia spp., Lamprocyclas junonis, L. maritalis, Octopyle stenosa, Tetrapyle octacantha, Theocalyptra bicornis, and Theoconus minithorax. Section 112-679B-2H, CC contained rare occurrences of Theocalyptra bicornis, Polyspira octopyle, Euchotonia sp., Litho-strobus botrycyrtis, Spongocore puella, Echinomma cf. lepto-dermum. Abundance varied between rare to absent in Sections 112-679B-3H, CC through 112-679B-12H, CC. In Section 112-679B-10H, CC, these are more abundant. Estimated from counts, radiolarian abundance relative to diatoms represents 0.07% of the siliceous microfossils.
Hole 679E Core-catcher samples from Hole 679E were studied for radi
olarians. These samples are barren from Sections 112-679E-1X, CC through 112-679E-13X, CC.
Planktonic Foraminifers
Hole 679B Thirteen core-catcher samples were examined for planktonic
foraminifers. Planktonic foraminifer species were found in Sections 112-679B-1H, CC, 112-679B-4H, CC, and 112-679B-8H, CC. Foraminifers were abundant and well preserved in Section 112-679B-1H, CC and were rare and well preserved in Sections 112-679B-4H, CC and 112-679B-8H, CC.
Globigerina bulloides, G. quinqueloba, Orbulina suturalis, O. universa, Globigerinita glutinata, G. uvula, Neogloboquad-rina blowi, N. dutertrei, and N. pachyderma were commonly found in Section 112-679B-1H, CC and co-occurred with Globigerina falconensis, Globigerinoides ruber, G. sacculifer, Globo-rotalia menardii, G. tumida tumida, Globigerinella siphonifera, and Pulleniatina primalis. A total of 16 different species were encountered. All of the common species are of Holocene age and are known from the temperate coastal upwelling regions. However, Globigerinoides sacculifer, Globorotalia tumida tumida, and Pulleniatina primalis are known to occur in tropical regions. Cool-water faunas predominated in this sample.
Age-diagnostic species are Pulleniatina primalis and Neoglo-boquadrina dutertrei. The range of Pulleniatina primalis is from
Zones N17B to N21 (as determined at DSDP Site 208, Kennett, 1973), and Neogloboquadrina dutertrei (Bolli and Premoli-Silva, 1973) is from Zone N21 to the Holocene. Based on planktonic foraminifers, this sample falls in Zone N21 and is of Pliocene to Quaternary age.
Hole 679C Eight core-catcher samples were examined for planktonic fora
minifers. Planktonic foraminifers occurred in Sections 112-679C-1H, CC and 112-679C-5H, CC. These were abundant in Section 112-679C-1H, CC and rare in Section 112-679C-5H, CC.
Globigerina bulloides, G. quinqueloba, Neogloboquadrina pachyderma, and N. incompta were commonly found in Section 112-679C-1H, CC; these species occur primarily in cool-water environments. Other species recognized included Globigerina falconensis, G.rubescens, G. calida, Globigerinoides ruber, Globigerinita glutinata, Orbulina universa, O. suturalis, Globorotalia menardii, G. crassaformis, G. scitula, Globorotaloides hexagona, and Sphaeroidinella dehiscens. Of these, Globigerina calida, Globigerinoides ruber, Orbulina suturalis, O. universa, Globorotalia menardii, and Sphaeroidinella dehiscens are known from warm-water regions. Globigerina bulloides, Neogloboquadrina dutertrei, and Globigerina quinqueloba are indicative of the temperate Peruvian upwelling regime (Kuhn et al., 1981; Thiede, 1983). The general aspect of the benthic and planktonic groups is similar to the faunal content of the Albacora Formation (synonym of the Mai Pelo Formation) in the Progreso Basin of northwestern Peru, which is of Pliocene/Pleistocene age. All the mentioned species range well through the Quaternary.
Hole 679D All core-catcher samples except Section 112-679D-24X, CC
were examined for planktonic foraminifers. Planktonic foraminifers occurred only in Section 112-679D-1H, CC.
Globigerina bulloides, G. quinqueloba, and Neogloboquadrina incompta are common, and they are known to occur in cool-water regions. Other species recognized were Globigerina falconensis, G. rubescens, G. calida, Orbulina universa, O. suturalis, Globorotalia crassula, Globorotaloides hexagona, Neogloboquadrina humerosa, and N. pachyderma. Some of them {Globigerina calida, Orbulina universa, and O. suturalis) are known from warm-water regions.
All species range into the Holocene except Globorotalia crassula. Stratigraphic distribution of Globorotalia crassula is from Zone NI8 to N22 (latest Miocene to Pleistocene at DSDP Site 284, Kennett and Vella, 1974). As a result, this sample falls in Zone N22 and is of Pleistocene age.
Hole 679E Planktonic foraminifers were examined from 13 core-catcher
samples. Planktonic-foraminifer species were found in Sections 112-679E-1X, CC, and 112-679E-11X, CC. These specimens were rare and preservation was poor.
Globigerina bulloides, G. falconensis, Neogloboquadrina dutertrei, and TV. pachyderma were found in Section 112-679E-1X, CC; these species occur in temperate upwelling environments. All of the species mentioned previously are of Holocene age. We assigned a Quaternary age to this sample.
Globigerina praebulloides, Globigerinoides triloba, Globo-quadrina altispira altispira, G. venezuelana, Globorotalia obesa, and G. lenguaensis were found in Section 112-679E-11X, CC.
The stratigraphic distribution of Globigerina praebulloides is from Oligocene to late Miocene, Zone P16 to Zone NI6 (Blow, 1969; Srinivasan et al., 1981). Globorotalia lenguaensis occurs in middle Miocene (Blow, 1969; Bronnimann et al., 1971). We placed this sample in the middle Miocene, based on planktonic foraminifers.
177

SITE 679
Benthic Foraminifers
Hole 679B Benthic foraminifers in samples from Hole 679B occur in
three apparently in-situ assemblages and two transported assemblages. These assemblages generally proceed down the section as follows.
Cancris inflatus-Trifarina carinata. Foraminifers are abundant and well-preserved in this assemblage, which occurs in Section 112-679B-1H, CC (6.3 mbsf). Cancris carmenensis and Bo-livina costata are abundant; Bolivina plicata, B. spissa, Bulimi-nella subfusiformis, and Cassidulina delicata are common. A few Cancris inflatus, Trifarina carinata, and Gyroidina roth-welli also characterize the assemblage. This assemblage indicates an upper-bathyal environment. The small species Bolivina costata characterizes outer-shelf depths in this area (Resig, 1981) and may have been transported to the site.
Bolivina n. sp. Assemblage. Foraminifers are abundant and well preserved in this assemblage, which occurs in Sections 112-679B-2H, CC through 112-679B-4H, CC (16.3-35.3 mbsf). In addition to the nominal species, Bolivina floridana and Bulimi-nella subfusiformis are common, and "Ellipsoglandulina" frag-Ms specimens are few. These species represent an upper-bathyal, oxygen-minimum environment.
Bulimina uvigerinaformis-Valvulineria californica Assemblage. Foraminifers are abundant and well preserved in this assemblage, which occurs in Section 112-679B-8H, CC (73.2 mbsf). In addition to the nominal species, Bolivina sinuata, B. seminuda humilis, B. cf. vaughani, and Buliminella subfusiformis are common to abundant. This assemblage characterizes an upper-bathyal, low-oxygen environment (Ingle, 1980).
Bulimina uvigerinaformis-Valvulineria californica Assemblage (transported). In Sections 112-679B-7H, CC, 112-679B-9H, CC, and 112-679B-11H, CC few to rare specimens of foraminifers (among which the nominate species occur) apparently represent transported tests. They are well preserved in Section 112-679B-7H, CC, but preservation is poor in Sections 112-679B-9H, CC and 112-679B-11H, CC. Bolivina sinuata also occurs in these samples.
Buliminella elegantissima-Bolivina cf. vaughani Assemblage (transported). Foraminifers of this association are common and well preserved in Section 112-679B-12H, CC and few and well preserved in Section 112-679B-13H, CC. These species are small and probably represent tests transported from the inner-shelf environment and deposited at the distal end of a turbidite.
Hole 679D Benthic foraminifers of Hole 679D occur in two apparently
in-situ assemblages and two transported assemblages and occur downsection, as discussed next.
Cancris inflatus-Trifarina carinata Assemblage. Foraminifers are abundant and well preserved in this assemblage, which occurs in Section 112-679D-1H, CC (7.7 mbsf). The relative frequencies of various species differ from those in Section 112-679B-1H, CC. In addition to the nominate species, other common forms are Bolivina interjuncta, B. plicata, B. spissa, Cassidulina auka, Epistominella cf. subperuviana, and Uvigerina striata. These species indicate upper to upper-middle bathyal environments.
Bolivina n. sp. Assemblage. Foraminifers are abundant in this assemblage, occurring in Sections 112-679D-2H, CC through 112-679D-4H, CC (17.1-36.1 mbsf). Preservation is moderate to good in Section 112-679D-2H, CC and moderate to poor in Sections 112-679D-3H, CC through 112-679D-4H, CC because these specimens show signs of recrystallization. The species representation is similar to that in Sections 112-679B-2H, CC through 112-679B-4H, CC. These species represent an upper-bathyal, oxygen-minimum environment.
Bulimina uvigerinaformis-Valvulineria californica Assemblage (transported). Foraminifers are common to rare in this assemblage, which occurs in situ in Hole 679B but often with an admixture of shallow-water foraminifers. This assemblage begins in Sections 112-679D-7H, CC through 112-679D-9H, CC and was found sporadically in Sections 112-679D-18X, CC and 112-679D-23X, CC. Preservation is moderate owing to broken specimens and abrasion. In addition to the nominate species, Bolivina sinuata is common; these are upper-bathyal species.
Buliminella elegantissima-Bolivina cf. vaughani Assemblage (transported). The nominate species are common to rare and are accompanied by Nonionella in some samples and by Ammoba-culites in Sections 112-679D-17X, CC through 112-679D-18X, CC. The species are small and presumably were transported from shallow water and deposited at the distal end of a turbidite. These transported deposits dominate from Sections 112-679D-10H, CC through 112-679D-23X, CC, below which foraminifers do not occur.
Hole 679E Benthic foraminifers are few to rare and have moderate to
poor preservation in Sections 112-679E-1X, CC, 112-679E-2X, CC, 112-679E-8X, CC, 112-679E-9X, CC, and 112-679E-11X, CC. These species are abundant in Sections 112-679E-12X, CC and 112-679E-13X, CC, but have poor preservation and cannot be separated from the rock matrix. Sections 112-679E-3X, CC through 112-679E-7X, CC are barren of foraminifers. The few foraminifers above Section 112-679E-10X, CC include Epistominella subperuviana, Bolivina plicata, B. costata, and Bolivi-nita minuta; however, these probably represent drilling detritus. Section 112-679E-10X, CC contains only rare specimens of Buliminella elegantissima, which probably was transported from depths shallower than 50 m. Section 112-679E-11X, CC contains the two species Valvulineria cf. araucana and Robulus sp. These species have resistant tests and appear to be residual. Bolivina and Buliminella are among the abundant foraminifers in Sections 112-679E-12X, CC and 112-679E-13X, CC. This assemblage probably was deposited at upper to upper-middle bathyal depths; further identification is impossible.
ORGANIC GEOCHEMISTRY At Site 679 the following organic-geochemical programs were
undertaken:
1. Monitoring of hydrocarbon gases using two methods. 2. Measurement of organic-carbon, carbonate-carbon, and
Rock-Eval pyrolysis characteristics at regular intervals, usually 30 m apart.
3. Comparison of Rock-Eval parameters with the results obtained using the Source Hound, a portable device designed by British Petroleum for evaluating source rocks.
4. Collecting samples for detailed geomicrobiological studies. 5. Measurement of hydrocarbon shows, which led to aban
donment of Site 679.
The methods and instruments used for these studies are described in detail in the "Explanatory Notes" chapter (this volume).
Hydrocarbon Gases Two different procedures were used to extract hydrocarbon
gases, mainly methane (Q), ethane (C2), and propane (C3), from sediment samples. In the first procedure, called the can procedure, an approximately 50-cm-long section of full-round core (about 170 cm3) and degassed water was placed in a closed container having a volume of 100 cm3 and then filled with helium. The container was shaken, and gases were extracted into this volume. Part of this gas mixture was analyzed by gas chromatography on a Hach-Carle AGC Series 100/Model 211 (HC)
178

SITE 679
and on a Hewlett-Packard Model 5890A coupled with the Natural Gas Analyzer (HP). In the second procedure, the headspace procedure, an approximately 10-cm3 sample of sediment was placed in a 22-cm3 vial. The vial was heated to 70°C in a Head-space Sampler, and the gases in the headspace were transferred, either automatically or manually, to the HP. The headspace gases also were analyzed using the HC gas chromatograph. The HC instrument measures C l9 C2, and C3, whereas the HP instrument measures hydrocarbon gases to C6. Tables 4 and 5 show the results for Cx and C2 from both can and headspace procedures, respectively. Canned samples were usually collected at every sixth core, whereas headspace samples were commonly obtained at every third core. Concentrations are reported as mi-croliter of gaseous component per liter of wet sediment (/iL/L).
The gas concentrations measured by the two procedures show similar trends with depth, except that the headspace procedure provides more detail because of closer spacing of samples. Cx is present in highest concentrations followed by C2. C3 was often noted in gases measured on the HP chromatograph by the head-space procedure, but in most cases could not be confirmed on the HC chromatograph because of differences in integration sensitivities.
Table 4 shows the concentrations of C{ and C2 obtained from the can procedure and measured on the HC and HP chromato-graphs. Results from the the two instruments agree well. Any divergence probably results from differences in calibration routines. C, and C2 concentrations increase with depth to about 144 mbsf, where Q concentrations increase by two orders of magnitude (Fig. 20). This change in Q concentrations occurs at the same depth where sulfate values approach zero (see "Inorganic Geochemistry" section, this chapter). This interval signals the transition between the overlying zone of microbial sulfate reduction, where Q concentrations are low because of inhibition
of methanogenic processes, and the zone of microbial Q generation, where biogenic Cx is produced in large amounts (Clay-pool and Kaplan, 1974).
Table 5 lists the results for Q and C2 from the headspace procedure. Here, as in Table 5, the results from the two gas chromatographs are generally comparable and most differences relate to calibration problems. Q and C2 concentrations show the same trend of increase with depth to 144 mbsf; below this depth the amounts of Q increase about three orders of magnitude (Fig. 20). However, with increasing depth, the amounts of C, and C2 decrease significantly at 320 and 330 mbsf and then increase at greater depths. Evidence of this decrease in concentration was suggested from the results of the can procedure (Fig. 20). Unfortunately, the spacing for the canned samples was too large to provide additional analyses of apparently low gas concentrations within this sediment interval. The deepest sample contains anomalous concentrations of C2 and higher molecular weight gases (Fig. 21) that were not seen in the canned gases (Table 4). This sudden appearance of significant amounts of C2 and higher carbon number hydrocarbons, suggesting possible products of advanced thermogenic processes, was a factor in the decision to stop drilling Hole 679E at 359 mbsf.
Carbon Organic-carbon, carbonate-carbon, and Rock-Eval pyrolysis
characteristics of the organic matter were determined at intervals of about 30 m at Holes 679D and 679E. Total carbon was determined by using the Coulometrics 5020 Total Carbon Apparatus coupled with the 5010 C 0 2 Coulometer; carbonate carbon was measured using the Coulometrics 5030 Carbonate Apparatus, which was also connected to a 5010 Coulometer; organic carbon was determined by difference between total carbon and carbonate carbon (Table 6). This table also shows values for to-
Table 4. Methane (C}) and ethane (C2) in canned-gas samples, Site 679.
Core/section interval (cm)
112-679D-1H-4, 140-145 679C-2H-2, 138-143 679D-3H-3, 135-140 679C-6H-3, 145-150 679D-9H-3, 135-140 679D-17X-1, 135-140 679E-6X-2, 135-140 679E-10X-1, 145-150 679E-13X, CC
Depth (mbsf)
6.0 11.9 21.8 51.5 78.8
143.8 292.7 329.3 359.3
C^HC) 0*L/L)
16 27 50 81 85
210 32,000 29,000 37,000
C,(HP) (ML/L)
16 22 41 63 65
140 19,000 25,000 31,000
C2(HC) (jiL/L)
0.8 1.8 2.1 2.9 3.7 4.4 8.8 6.3
11.0
C2(HP) 0*L/L)
1.9 2.6 3.2 3.7 4.6 4.8 8.5 8.5
12.0
<VC2 (HC)
20 15 24 28 23 48
3600 4600 3700
c,/c2 (HP)
8 9
13 17 14 28
2200 2900 2700
HC = Hach-Carle Gas Chromatograph; HP = Hewlett-Packard Gas Chromatograph.
Table 5. Methane (Cj) and ethane (C2) in headspace-gas samples, Site 679.
Core/section interval (cm)
112-679D-4H-4, 139-140 679C-2H-2, 142-143 679D-3H-3, 134-135 679C-6H-4, 0-1 679D-9H-4, 0-1 679D-17X-1, 134-135 679D-20X-1, 114-115 679E-5X-3, 149-150 679E-6X-2, 134-135 679E-9X-1, 116-117 679E-10X-1, 144-145 679E-12X-1, 140-141 679E-13X, CC
Depth (mbsf)
6.0 11.9 21.5 51.5 78.9
143.8 172.1 284.8 292.7 319.5 329.3 348.2 359.3
C!(HP) (/*L/L)
25 46 46 65 75
130 18,000 76,000 76,000
580 130
34,000 8400
C^HC) (fih/L)
30 51 53
80 140
56,000 97,000 95,000
1100 660
34,000 7400
C2(HP) (/iL/L)
7.8 18
9.2 8.9
22 140 130 12 3.5
19 470
C2(HC) (jiL/L)
7.8 9.2
4.1 1.9
12 99 71 21 13 12
350
C , /C 2
(HP)
a 3
8 15
816 534 570 49 37
1700 18
c,/c2 (HC)
4 6
20 78
4600 970
1300 51 50
3000 21
HP = Hewlett-Packard Gas Chromatograph; HC = Hach-Carle Gas Chromatograph. a —, no data available.
179

SITE 679
200 —
400 1000
Methane (juL/L 1000
Methane (/uL/L) 100 .000
Figure 20. Concentrations of methane with depth at Site 679 as determined in Holes 679C, 679D, and 679E. Left: Methane from the canned-gas procedure. Right: Methane from the headspace procedure.
100.00
81 .42 —
§ 62.84 o
< 44.26 —
25.68 —
7.1 1
—
i
N
i
+ <o o
1 1
ane
Q .
CL
01 c to
N-bu
an
e
^ n
ISO
U I
1 '
CD CD
CO CD
C C <U O) Q . Q .
O 2 cn
1
ane
c CD 5
>
1
i
—
ane
n UJ
hene
UJ
1
jy
* ■
i
i
Table 6. Organic carbon and carbonate carbon at Site 679.
4 .00 8 .00 12.01 Retention t ime (min)
16.01
Figure 21. Gas chromatogram of the hydrocarbon gases obtained by the headspace procedure on a sediment sample from Core 112-679E-12X, CC. Except for the unusual occurrence of ethane (which could possibly result from the pyrolysis of organic matter during drilling), the mixture of gases is similar to that commonly attributed to thermogenic sources.
tal organic carbon (TOC,) as determined by Rock-Eval pyrolysis. There is good agreement between organic carbon and TOC (Fig. 22). The sediments are rich in organic carbon from the surface to about 75 mbsf. Below this depth, the sediments are lean, except for the sample from about 350 mbsf, which has 2% to 3% organic carbon.
Core/section interval (cm)
112-679D-1H-4, 145-150 3H-3, 140-150 6H-3, 140-150 9H-3, 140-150 17X-1, 140-150 20X-1, 115-125
112-679E-4X-3, 140-150 6X-2, 140-150 9X, CC 12X-1, 140-150
Depth (mbsf)
6.0 21.8 50.3 78.8
143.8 172.2 275.2 292.7 327.8 348.3
Total carbon (%)
10.60 8.64 3.88 5.84 1.07 1.17 1.11 1.22 1.68 3.14
Inorganic carbon (%) 0.22 1.60 0.03 0.28 0.43 0.32 0.78 0.71 1.10 0.52
Organic carbon (%)
10.38 7.00 3.85 5.56 0.64 0.85 0.33 0.51 0.58 2.62
TOC (%) 9.36 7.32 3.90 5.26 0.54 0.59 0.23 0.42 0.41 2.20
TOC = Total organic carbon from Rock-Eval pyrolysis.
Rock-Eval pyrolysis involves a microprocessor-controlled temperature program that releases volatile hydrocarbons, recorded as Sj, and the thermal cracking of the kerogen matrix, producing S2. During pyrolysis of the sediment, C0 2 (produced from organic matter) is indicated as S3 and is trapped only between the initial starting temperature and 390°C; this temperature range avoids other sources of C0 2 , such as carbonates. Values of Sj and S2 are in milligrams of hydrocarbon per gram of sediment; S3 is in milligrams of C0 2 per gram of sediment. A fourth parameter, Tmax, is the pyrolysis temperature at which S2 reaches a maximum. Finally, TOC is measured. These parameters are used to calculate Production Index (PI) = S2/(Sj + S2); Petroleum Potential or Pyrolyzed Carbon (PC) = 0.08 (S, + S2); Hydrogen Index (HI) = 100(S2)/TOC, and Oxygen Index (OI) = 100(S3)/TOC. Table 7 lists these Rock-Eval parameters for sediment samples recovered from Holes 679D and 679E. Results indicate that the organic matter in all samples is immature, based on the low Tmax values. The organic matter in the upper 75 m of sediment is present in moderate to high concentrations and is hydrogen-rich and oxygen-poor, indicating that the organic matter is Type II from a dominantly marine source, which with increasing maturation could form an excellent source rock for hydrocarbons. The same interpretation applies to the sample taken at 350 mbsf. Below 75 mbsf, the sediments are less rich in organic-matter content and have low source-rock potential. From about 270 to 320 mbsf, organic matter occurs in low amounts; it
180

SITE 679
200 —J
400
Organic carbon [%)
Figure 22. Profiles of organic carbon with depth at Site 679 as determined at Holes 679D and 679E. Left: Organic carbon determined by difference between total carbon and carbonate carbon as measured by the Coulometric Analyzers. Right: Total organic carbon (TOC) determined by Rock-Eval pyrolysis.
Table 7. Summary of Rock-Eval pyrolysis analysis, Site 679, Holes 679D and 679E.
Core/section interval (cm)
112-679D-1H-4, 145-150 3H-3, 140-150 6H-3, 140-150 9H-3, 140-150 17X-1, 140-150 20X-1, 115-125
112-679E-4X-3, 140-150 6X-2, 140-150 9X, CC 12X-1, 140-150
Depth (mbsf)
6.0 21.8 40.8 78.8
134.3 172.2 275.2 292.7 327.8 348.3
Temp. ( ° Q
391 384 386 381 393 391 412 329 351 403
Si
7.76 7.09 3.65 5.97 0.14 0.28 0.04 0.02 0.05 0.64
S2
46.84 32.36 16.49 26.48
0.93 1.75 0.04 0.02 0.18 9.41
s3 6.86 3.83 1.41 2.30 0.73 0.95 0.47 0.36 1.45 1.00
PI
0.14 0.18 0.18 0.18 0.13 0.14 0.50 0.50 0.23 0.06
PC
4.55 3.28 1.67 2.70 0.08 0.16 0.01 0.00 0.01 0.83
TOC
(%) 9.36 7.32 3.90 5.26 0.54 0.59 0.23 0.42 0.41 2.20
HI
500 442 422 503 172 296
17 4
43 427
OI
73 52 36 43
135 161 204
85 353 45
Note: PI = production index. PC = pyrolyzed carbon. TOC = total organic carbon. HI = hydrogen index. OI = oxygen index.
is probably type III and terrestrial in origin because of the low HI and high OI values.
"Source Hound" Rock-Eval parameters were compared with the results ob
tained from "Source Hound," a portable device supplied as a prototype by British Petroleum for semiquantitative evaluation of potential sources of oil in rock samples in the field. Rock-Eval pyrolysis requires about 100 mg of dried powdered sample and takes about 40 min per sample for complete analysis. The Source Hound, using a chip of rock or a pellet of compressed sediment (about 30 mg) gives a signal in units that can be interpreted in terms of oil potential (kg/ton) in about 2 min. The Source Hound was used to examine samples from Site 679, including those samples we felt concerned our immediate safety from the bottom of Hole 679E. Data for seven samples of immature sediments from Hole 679D (Fig. 23) show a parallel trend with Rock-Eval data.
Termination of Site 679 When cutting Core 112-679E-12X (about 350 mbsf), we no
ticed a peculiar odor in the organic-rich (2% organic carbon) black shale from the core catcher. A 1-cm-wide silt stringer at 347.5 mbsf displayed dull yellow fluorescence under ultraviolet light. A solvent extract of a sample from this interval was yellowish brown and fluoresced light yellow. We immediately suspended drilling Core 112-679E-13X. Another recovered core had the same peculiar odor; extracts of samples from this core
also fluoresced. Pyrolysis results using the Source Hound indicated the presence of pyrolyzable organic matter above background (equivalent to about 5 kg hydrocarbon/ton of rock). A preliminary gas chromatographic analysis of the headspace gas from Section 112-679E-12X, CC (Fig. 21) showed an abrupt increase in gas components heavier than methane, including an unusual occurrence of ethane (C2:1). These gases differed significantly from the methane-dominated gas mixtures observed in previous cores. The methane/ethane ratio decreased from 3000 in Core 112-679E-12X to 20 in Core 112-679E-13X, mainly because of the increase in concentrations of ethane from 5.7 to 225 ppm (Table 5). The organic-geochemical information from Cores 112-679E-12X and 112-679E-13X was sufficiently anomalous and confusing to suggest that abandonment of this hole was prudent.
Subsequently, we again encountered the same peculiar odor that was detected in earlier cores in Core 112-682A-46X during the drilling of Hole 682A (see "Organic Geochemistry" section, Site 682 chapter). The odor in the former was associated only with the exterior portions of the core and not the interior. We did not detect the odor in the core that followed (Core 112-682A-47X). Gas chromatography of the gas associated with Core 112-682A-46X produced chromatograms similar to those of Core 112-679E-13X, showing hydrocarbons to C6 and anomalously large amounts of C2:1. The generation of this peculiar odor, the sudden presence of small amounts of hydrocarbons larger than C3, and the anomalous amounts of C2:1 led us to deduce that an artifact of the drilling process occurred in some
181

SITE 679
100 —
200 50
Response
Figure 23. Comparison of pyrolysis yields for parts of the same samples at Hole 679D with depth. Left: Arbitrary response of Source Hound. Right: Rock-Eval TOC (%).
types of sediment when drilling rates were slow (see "Organic Geochemistry" section, Site 682 chapter).
These observations led us to examine more samples from Hole 679E. A fresh part of a stringer in Core 112-679E-12X, which had been examined previously, was again sampled and analyzed; results differed from those observed earlier. The stringer fluoresced a dull orange color that seemed to disappear when exposed to air for any length of time. The solvent extract did not fluoresce under ultraviolet light, but solid pieces of the extracted sample still showed surface fluorescence; that is, the fluorescent material did not extract into the solvent (methylene chloride). A 0.29-g sample of the stringer was extracted with 1 mL of methylene chloride using sonication. The extract was dried, dissolved in 30 /*L of hexane, and 7 /xL of the extract was examined by high-resolution gas chromatography (see "Explanatory Notes," this volume, for details about instruments).
Figure 24 shows the gas chromatogram of this extract compared with a standard mixture of n-alkanes. In addition to low, broad, unresolved regions indicating complex mixtures, the chromatogram exhibits n-alkanes ranging from about n-C17 to n-C36 in low concentrations. The chromatogram is much less complex than those obtained earlier. The distribution of n-alkanes is similar to that of high molecular-weight hydrocarbon waxes. Although there are small amounts of hydrocarbons present in the extract of the fluorescent stringer, this fluorescence is not due to the hydrocarbons because the only hydrocarbons identified were n-alkanes, which do not fluoresce. X-ray diffraction (Fig. 25) of the fluorescent material failed to identify the source of the fluorescence, which may be caused by a mineral or by high molecular-weight organic material that does not show in the chromatograph.
These results, along with those at Site 682, illustrate the difficulties in assessing the validity of evidence of petroleum. These problems are compounded both by the variability which we encountered in the organic content of even closely spaced sedimentary zones and by sporadic organic contamination at all stages of recovering and handling samples, that is, drilling, core recovery, core processing, and analysis. We frequently found it difficult to reach a completely unambiguous conclusion.
INORGANIC GEOCHEMISTRY
Introduction Three of the four holes drilled at Site 679 were sampled for
inorganic chemical analysis of interstitial water. Only whole-
round (5 to 10 cm long) samples were analyzed in Holes 679C and 679E. In the first six cores from Hole 679C, a combination of whole-round (5 to 10 cm) and 50-cm3 samples from split cores were analyzed; below these cores, only whole-round samples were taken. The split sections were sampled between 0.5 and 1 hr after the whole-round sections.
The samples from Hole 679E are composed of hard, indurated sediment pieces sandwiched between gray mud. In two of these samples, the indurated sediment and the matrix mud were squeezed separately. The salinity, chlorinity, S 0 4
2 _ , and NH4+
are similar in both. In the indurated fraction, alkalinity, Ca2 + , Mg2 + , and silica concentrations are, however, somewhat lower than in the matrix mud.
Major decreases in salinity and chlorinity to 20.1 g/kg and 360.80 mmol/L, respectively, were observed in Hole 679E; this was in the mudstone-siltstone turbidite zone below about
19.86
16.48
13.1 1 80 .00
66 .27
52 .55 - -
38 .83
25.1 1
-*■ ^iJlHwdkfcAi *^U .1 .J IJLJL
1 r
Sample
JU IU—-
1 1 .38
1 1 1" Standard
12 22 32 42 Retention time (min)
52
Figure 24. Gas chromatograms of extract of Sample 112-679-12X-1 (72-73 cm) in hexane and of a standard mixture of alkanes in hexane.
182

SITE 679
10 20 30 40 Degrees 20(Cu-Ka)
50 60 70
Figure 25. X-ray diffraction pattern of minerals in Sample 112-679-12X-1 (72-73 cm).
260 mbsf. Such a major decrease in salinity indicates dilution by freshwater. This may relate to flow of either ancient or recent freshwater from an aquifer in the Andes or the presence of a fossil freshwater lens. The latter case indicates subsidence on the order of several hundred meters since late Miocene time. We excluded dilution by dissociation of gas hydrates on the basis of the low CH4 concentrations measured by shipboard organic geochemists (see "Organic Geochemistry" section, this chapter). Every other chemical component measured within this depth interval is also strongly diluted within this freshwater lens (see Figs. 26 through 31 and Table 8).
Diagenetic francolite most probably controls the constant phosphate concentration of 3 to 4.5 jmiol/L to 180 mbsf. Dolomite formation may cause a slight downhole increase in Ca2+
concentrations from dissolution of calcite and a much steeper downhole decrease in Mg2+ concentrations at a burial depth of between 1.5 and 170 m. We observed stronger negative Mg2+
profiles at greater depths, suggesting an increased rate of dolomite formation and continuation below the depth at Site 679.
Sulfate reduction continues unexpectedly to a depth of between 140 and 170 mbsf; at > 170 mbsf sulfate concentrations are < 1 mmol/L. Perhaps sedimentation rates on the order of 5 cm/k.y. allow this sulfate diffusion to keep up with sulfate consumption.
Methods of Analysis Interstitial waters were obtained by routine shipboard squeez
ing of sediment samples (Manheim and Sayles, 1974) almost immediately after retrieval of the cores. These samples were squeezed at room temperature. No in-situ samples were taken at this site. The analytical program includes salinity, chloride, pH, alkalinity, calcium, magnesium, silica, ammonia, phosphate, and sulfate.
The following methods were used for our analyses:
Component
Salinity Chloride pH Alkalinity Calcium Magnesium Silica Ammonia Phosphate Sulfate
Method
Refractometer Titration
Titration Titration Titration Colorimetric Colorimetric Colorimetric Ion chromatography
Reference
Manheim and Sayles, 1974 Gieskes, 1974 Gieskes, 1974 Gieskes, 1974 Gieskes and Lawrence, 1976 Gieskes and Lawrence, 1976 Mann and Gieskes, 1975 Gieskes, 1974 Gieskes, 1974 Gieskes and Peretsman, 1986
Results of Analyses
Chloride and Salinity (Fig. 26 and Table 8) Both chloride concentrations and salinity are constant in the
uppermost 140 m. As shown in Figure 26, chloride concentrations in the uppermost 172 m are close to the standard seawater (IAPSO) value of 559 mmol/L (19.367 g/kg), except for a maximum of 562 to 564 mmol/L between 29 and 40 mbsf. Salinity, however, decreases slightly between 140 and 172 mbsf from approximately 34.1 to 31.8 g/kg just before the chloride values decrease. This slight decrease in salinity may indicate the proximity of the upper boundary of the freshwater lens in the coarser-grained mudstones and siltstones of lithologic Unit IV below. At 348 mbsf, small but significant increases in both salinity and chloride are observed that may indicate the proximity of the lower boundary of the freshwater lens. Thus, the minimum thickness of the freshwater lens is about 100 m. However, slight contamination by drilling water cannot be excluded.
183

SITE 679
u
100
v»-w a e w
§"200 Q
300
-
~—
' | i | m
O Hole 679C i j
A Hole 679D c
• Hole 679E
i ,
k y y
y y
y y
y y
y y
y y
y y
y
\ i , i
-
—
—
300 400 500 Chloride (mmol/L)
600
Figure 26. Concentrations of Cl at Site 679.
Alkalinity and Sulfate (Fig. 27) Between 1.4 and 172 m, the alkalinity profile is almost a mir
ror image of the sulfate profile. Sulfate rapidly decreases in the uppermost 10 m, from 28 to 24 mmol/L (4 mmol/L/10 cm). Between 10 to 145 mbsf, sulfate decreases at a slower rate (at an average rate of about 1.3 mmol/L/10 m). At a depth between 145 to 170 mbsf, sulfate reduction is complete. Steep increases in methane concentrations occur in this same depth interval, as observed by the organic geochemists ("Organic Geochemistry" section, this chapter). Sulfate concentrations then remain below 1 mmol/L. At 345 mbsf, however, the 2 mmol/L S0 4
2 _ that was measured results from slight contamination of seawater in the hole. Alkalinity continues to increase even in the freshwater lens, suggesting continued extensive bacterial activity.
Ammonia (Fig. 28) Ammonia concentrations increase continuously with depth
between 1.4 and 172 mbsf at an average rate of 30 /imol/L/ 10 m. Unlike alkalinity, which continues to increase with depth, ammonia reaches a maximum concentration of 5.08 mmol/L at 172 m. We observed a small decrease to a minimum of 4.07 mmol/L in the center of this freshwater lens.
Phosphate (Fig. 29) Phosphate concentrations do not increase with depth; from
1.4 to 172 mbsf all phosphate values are similar (i.e., between 3.5 and 5 /xmol/L. In all previous sites drilled by DSDP phosphate concentrations increase rapidly with depth to 200-300 iimol/L in organic-rich sediments (for example, DSDP Legs 64, 67, and 87). At Site 679, francolite (carbonate-F-apatite) solubility, the most common authigenic phosphate mineral, may control the phosphate concentration of the interstitial waters. Phosphate concentrations decrease significantly in the freshwater lens.
Silica (Fig. 29) Silica concentrations are sensitive indicators of lithological
changes and fluid flow. In these diatom-rich sediments, silica
concentrations increase rapidly. We measured high silica values of 650 to 750 ixmol/L at only 1 to 3 mbsf. Between 20 to 172 mbsf, silica concentrations in excess of 1100 iimol/L are in equilibrium with opal-A. Silica concentrations are highly diluted in the freshwater lens, accordingly these were undersatu-rated with respect to opal-A. This may be the reason for the complete absence of diatoms in the mudstone-siltstone sediments of lithologic Unit IV. Diatoms that are bathed in a solution of approximately 300 /imol/L of silica dissolve rapidly.
Calcium and Magnesium (Figs. 30 and 31) Small differences in Ca2+ (and to a lesser extent in Mg2+)
concentrations between Holes 679C and 679D were observed from 1.4 to approximately 40 m. Ca2+ concentrations were generally somewhat higher in Hole 679C. On the basis of smear-slide observations, Hole 679C sediments are more calcareous than those of Hole 679D at this depth interval. Below 40 m, Ca2+ and Mg2+ concentrations in interstitial water from both holes remain the same (Figs. 30 and 31; Tkble 8). Below 40 mbsf, Ca2+ concentrations in interstitial water increase with depth, and Mg2+ concentrations decrease with depth. The Ca2+ profile is considerably less steep than the Mg2+ profile. Some dolomite was observed in this depth interval (see "Lithostratigraphy" section, this chapter).
The calcium and magnesium distributions may be explained by one of the following three dolomitization reactions or any combinations thereof:
Ca2+ + Mg2+ + 4HC03_ ^ CaMg(C03)2 + 2C02 + 2H20,(l)
2CaC03 + Mg2+ ^ CaMg(C03)2 + Ca2 + , (2)
CaC03 + Mg2+ + 2HC03_ <± CaMg(C03)2 + C 0 2 + H20.(3)
Reaction 1 requires decreases in both Ca2+ and Mg2 + , which was not observed. If Reaction 2 were the only dolomitization reaction, Ca2+ and Mg2+ concentration profiles would exhibit opposite gradients but would have similar slopes, which we did not observe either. If Reaction 3 were dominating the system, Ca2+
concentrations would not increase. However, Ca2+ increases are seen in Figure 30. Therefore, we concluded that a combination of dolomitization reactions occurs in these sediments.
In the freshwater lens, both Ca2+ and Mg2+ concentrations decrease because of dilution. Note that the Ca2+ profile is topologically almost identical to that of silica. Indeed, carbonate microfossils are absent, as are diatoms, in lithological Unit IV and may be preferentially dissolved from this Lithology.
Influenced by freshwater, Mg2+ concentrations decrease in the zone. However, unlike all other interstitial-water profiles, including Ca2+ (which increases in concentration below 310 mbsf), Mg2+ continues to decrease between 320 to 345 mbsf. We suggest that at greater depths, extensive dolomitization continues to be the major sink for dissolved magnesium.
PALEOMAGNETICS
Introduction A shipboard paleomagnetic study was conducted to obtain a
detailed magnetostratigraphy of the sedimentary cores. The upper 30 m of each core possessed a strong magnetic signal that was easy to measure with the on-board spinner magnetometer. The shipboard cryogenic magnetometer was unavailable for use during this leg. The deeper sediment sections were characterized by weak magnetic moments (<0.05 mA/m). These samples could not be measured on board ship. Shore-based studies conducted after the cruise will use a cryogenic magnetometer. We hope that during these studies we will be able to measure the weak remanence of these samples successfully.
184

SITE 679
Sulfate (mmol/U 20
100
200
300
O • Hole 679C A A Hole 679D □ ■ Hole 679E
M
^_ 8 10
Alkal inity (mmol/L) 1 2 14 16
Figure 27. Concentrations and alkalinities of SO4 at Site 679. Arrows denote the concentrations in standard seawater (Int. Assoc. Phys. Sci. Ocean, IAPSO).
Results
Although the demagnetization steps used here were crude, the rapid accumulation of cores for this site (about 1 core every 30 min) did not allow for more detailed demagnetization between 0 and 150 Oe. Vector plots of the samples show that beginning the demagnetization at 150 Oe did not destroy the characteristic signal. In fact, most useful samples showed unidirectional decay of their magnetic behavior between 150 to 300 Oe (Fig. 32). The magnetic character of these sediments formed three distinct subsets. These subsets are described as follows:
1. Samples that showed unidirectional decay of magnetization during demagnetization. This was the common behavior of the samples in the upper 30 m of the section (Fig. 32A).
2. Samples having an NRM too weak to be measured with the Molspin. This behavior was observed for most of the samples collected from below 30 mbsf.
3. Samples having magnetization carried by a phase with a
high coercive force. We could not unblock this phase with alternating-field demagnetization. This behavior was characteristic of all samples taken from gray sand zones (Fig. 32B).
Figures 33, 34, and 35 show inclination values vs. depth from samples that fit into subset 1. The value selected and reported in the plots is the 150 Oe demagnetization value, which was selected based on the vector plots. The ages assigned to the reversal time scale are based on discussions with the paleontologists on board the ship.
Hole 679A Samples collected from the only core showed normal polar
ity and are believed to belong to the Brunhes Chron (Fig. 33).
Hole 679B This hole started with reversed polarity (Fig. 34), suggesting
that a significant interval representing all or part of the Brunhes Chron is missing. Paleontological correlations, however, suggest
185

SITE 679
100 —
200 —
300 —
-
—
I I
I
-I
1 1 ' O Hole 679C
A Hole 679D -
• Hole 679E
(•) JL _
1 \ , 0 2 4
Ammonia (mmol/L)
Figure 28. Concentrations of NH4 at Site 670.
100 —
200
300 —
1 1 ' O Hole 679C
_ A Hole 679D
• Hole 679E
—
__^^-» •rrSf"""
■ I N .
• y
\ ' ' '
\ i \ \ \ \ \ \ A ^
~*~A s s s
s s s s s
s s s
. I . I . 10 12
Calcium (mmol/L) 14 16
Figure 30. Concentrations of Ca2+ at Site 679.
100 —
35" 200 o
300
O A
400 800 1200 Si l icate (fimol/L)
0 4 8 Phosphate (/xmol/L)
Figure 29. Concentrations of silica and POl at Site 679.
that this hole represents sediments deposited during the Brunhes Chron. The upper part of this hole may represent rocks deposited during one of the numerous reversed events proposed as occurring during the late Cenozoic. The lack of detailed paleonto-logical age controls for this hole does not allow us to correlate this reversed polarity period.
O Hole 679C A Hole 679D • Hole 679E
100
200
300
400 10 50 20 30 40
Magnesium (mmol/L)
Figure 31. Concentrations of Mg2+ at Site 679.
Hole 679D Our best polarity data for Site 679 comes from this hole (Fig.
35). The Brunhes/Matuyama boundary was found near 7.5 mbsf. Nannofossil data (see "Biostratigraphy" section, this
186

Table 8. Geochemical data for interstitial water at Site 679.
SITE 679
Sample (cm)
112-679C-1H-1, 140-150 679D-1H-2, 148-150 679C-1H-4, 140-150 679D-1H-4, 145-150 679C-2H-2, 128-138 679D-2H-3, 109-120 679C-3H-1, 140-150 679D-3H-3, 140-150 679C-4H-1, 140-150 679D-3H-5, 81-93 679C-4H-5, 140-150
5H-3, 60-72 679D-6H-3, 140-150 679C-6H-3, 135-145
8H-5, 140-150 679D-9H-3, 140-150
17x-l, 140-150 20X-1, 115-125
679E-4X-3, 140-150 6X-2, 140-150 6X-2, 140-150 9X, CC 9X, CC 12X-1, 140-150
Depth (mbsf)
1.4 3.0 5.9 5.9
11.8 12.0 19.9 21.8 29.4 33.7 35.4 40.0 50.3 51.3 73.4 78.8
143.8 172.0 275.2
a292.7 b292.7 a319.7 b319.7 348.2
pH
7.6 7.4 7.7 7.5 7.3 7.4 7.3 7.6 7.5 7.5 7.7 7.6 7.6 7.7 7.6 7.7 7.8 7.6 7.6 7.6 7.6
7.6
Salinity (g/kg)
34.8 34.4 34.9 34.2 33.9 34.0 34.2 34.4 34.0 34.1 34.2 34.1 34.0 34.0 34.0 33.8 33.0 31.8 22.2 20.2 20.1 20.2 20.2 20.8
er (mmol/L)
555.15 558.04 556.11 558.04
(554.19) —
559.96 558.047 562.85 562.85 564.85 562.85 558.04 561.89 558.04 558.04 559.96 560.92 387.74 362.72 360.80
— 344.44 360.80
Alkalinity (mmol/L)
4.81 5.06 6.56 6.17
(6.10) 5.98 7.41 7.43 7.64 6.21 7.83 7.04 8.16 8.18 8.38 9.08
11.64 9.56
15.37 15.28 16.56
16.61 —
sc3" (mmol/L)
26.49 25.74 25.15 22.45 23.95 24.05 23.33 23.3
22.74 21.3
22.21 21.89 20.52 20.49 17.37 16.99 7.31 1.07 1.07 0.54 0.03 — 0.75 1.88
N H 4+
(mmol/L)
0.17 0.38 0.44 0.49
(0.60) 0.64 0.80 0.88 0.96 0.71 1.06 1.20 1.45 1.45 1.99 2.01 3.73 5.08 4.66 4.66 4.07 —
4.20 4.33
PO^-(/imol/L)
4.31 ± 0.15
3.91 ± 0.15 (2.99 ± 0.14)
3.91 ± 0.14
3.19 ± 0.14
3.91 ± 0.14 4.93 ± 0.16 2.58 ± 0.14
3.50 ± 0.14 3.19 ± 0.14 7.68 ± 0.17 3.09 ± 0.14
_ —
0.54 ± 0.13 —
1.25 ± 0.13
Ca2 +
(mmol/L)
10.83 10.41 10.86 10.32
(10.29) 10.49 10.91 10.80 11.04 10.91 11.11 10.89 11.05 11.01 11.00 11.20 11.36 15.29 8.91 6.49 7.23 — 7.63 9.14
Mg2 +
(mmol/L)
50.37 51.58 51.96 52.00
(50.56) —
51.01 49.90 50.15 49.61 49.75 48.82 47.03 47.48 44.78 45.17 39.44 30.60 14.73 9.87
10.76 — 9.79 9.18
Si0 2 (/imol/L)
636.2 755.1 695.7 777.1
(845.3) —
1016.9 1241.4 1223.8 1093.9 1102.8 1093.9 1098.4 1166.6 1237.0 1093.9 1173.2 1309.6 691.3 301.7 513.0 —
574.6 781.5
a Indurated sediment pieces. Matrix gray mud.
chapter) suggest that the upper part of the Matuyama Chron and the Jaramillo event are missing from the section. The next eight sections (down to 25 mbsf) have reversed polarity and may be identified as the Matuyama Chron. The Olduvai event was found at 25 mbsf. Below 30 mbsf, the intensities in these samples fell below the measuring threshold of the magnetometer.
We observed two interesting phenomena while measuring samples. First, all samples from the upper three cores were characterized as relatively strong (>1 mA/m) with stable magnetizations. The low coercivity components from these samples were easily removed, yielding higher coercive force components that showed a unidirectional decay in magnetization at higher levels of demagnetization. Samples collected from similar lithol-ogies for deeper cores (>Core 112-679D-3H) showed strong deterioration of the magnetic signal. We did not measure these deeper samples. As we observed this phenomenon in samples from two separate holes, it may be related to a depth-dependent diagenetic effect that replaces the magnetic phase (believed to be magnetite) with pyrite.
Second, we observed that the coarser-grained samples were characterized by either unstable magnetizations or by a magnetic phase (or phases) with a high coercive force (hematite?). These rocks did not respond to alternating-field demagnetization.
Magnetic Susceptibility Magnetic susceptibilities were measured in cores from Holes
679A through 679E. The Bartington M.S.I magnetic-susceptibility meter was used to measure sections of whole core at 3-cm intervals. Measurements were initiated and terminated 6 cm from the ends of a given section to avoid edge effects. It was impossible to obtain measurements over the entire length of all cores in the time available, so we surveyed only one section in each core (typically Section 3). Holes 679B and 679C were the most extensively measured, as at least one section in each of the first seven cores was measured. Results are unclear and suggest that because the cores were not allowed to reach ambient temperature, some drift from instruments occurred from thermal effects. In addition, the percentage of saltwater in these whole cores may account for some strongly negative susceptibility values. These cores will be measured further at shore-based laboratories.
PHYSICAL PROPERTIES
Introduction Whole-round cores from Hole 679C were reserved for shore-
based study, although GRAPE and velocity measurements with the flow-through P-wave logger (PWL) were conducted on selected samples from this hole. Samples were obtained from good quality APC and XCB cores. Physical-properties measurements were limited in the lower sections of the holes, particularly between 150 and 250 mbsf owing to poor core recovery and drilling disturbance in these intervals. Within the XCB zone, shear strength was not measured because of sample disturbance. Index properties and velocity measurements were measured over these intervals on coherent sediment blocks or "biscuits."
Index Properties The index properties measured at Site 679 include bulk den
sity, porosity, water content (reported as a percentage of dry sample weight), and grain density (Table 9). The methods used to measure the index properties at Site 679 were the same as those specified in the "Explanatory Notes" (this volume) Samples for index properties were generally taken at 3- to 5 -m intervals (two or three per core), if time allowed. We also measured densities using the GRAPE on at least one section per core, with more sections included if time allowed.
Figure 36 shows GRAPE data and the index-property measurements for these samples. Figure 37 illustrates the downhole variations of water content, porosity, and bulk density for Holes 679B, 679D, and 679E. The upper 100 m of the site is characterized by high water content, with values greater than 100%, and porosities generally greater than 80%. Units I and II can be distinguished on the basis of index properties. Water contents in Unit I range from 150% to nearly 400% in one sample, while Unit II shows lower water contents of between 100% and 200%. The unit boundary is characterized by a steplike change in the index properties. This is particularly obvious in the marked increase in bulk density across the boundary from values of less than 1.4 g/cm3 to values between 1.4 and 1.7 g/cm3. Low bulk densities correspond to the high water contents and porosities.
187

SITE 679
A up. w
1
i .2"3 Ai4.
4 5
B
Down, E
Up, W
3 « " - 4 2 ^ 0 * *
"V- •A©
• Horizontal
A Vert ical
Down, E
Figure 32. A) Typical vector plot showing samples that were acceptable for this study. Note that the samples show a unidirectional decay of the magnetization during demagnetization. B) Vector plot showing typical behavior of samples that were rejected during this study. The demagnetization is clearly not affecting the magnetic components of these samples.
Below 100 mbsf the number of measurements decreased, but the boundary between Units II and III appears to be marked by a significant downward decrease in water content and porosity and a corresponding increase in bulk density. Water content (70%-100%) and porosity (50%-75%) increase again below the unit boundary, whereas bulk density (1.4-1.8 g/cm3) increases. The change appears to be associated with the boundary interval itself, rather than a contrast between the two units.
The Unit IV boundary is not well constrained by the index properties as sampling was sparse. Unit IV shows low values of water content (less than 30%) and porosity (less than 50%), and bulk densities greater than 2 g/cm3.
Compressional-Wave Velocity The PWL operated in conjunction with the GRAPE. Veloci
ties were also measured with the Hamilton Frame using the
method outlined in the "Explanatory Notes" (this volume). In most cases, velocities were measured in both horizontal and vertical directions. We examined computer printouts of the PWL data to discard values obtained from low-amplitude returns. In such cases, the signal return probably cannot be distinguished from system noise, resulting in our measuring anomalous velocity values. This was the case for many sections of APC cores (where voids occurred) and for almost all XCB cores.
Velocities in Units I and II are relatively constant, near 1500 m/s down to 100 m. These low values (near the the velocity of water) undoubtedly reflect the high water content of the sediments in Units I and II. No useful data were obtained below Unit II at Site 679. We did obtain more reliable velocity measurements for the lower parts of Hole 679E using geophysical logging (see "Logging" section, this chapter).
Vane Shear Strength We measured undrained vane shear strengths using the appa
ratus and plotter described in the "Explanatory Notes" (this volume; Table 10). However, the flat stress-strain curves obtained using this equipment led us to believe that it was not operating correctly. A few measurements were performed using the Wykham-Farrance vane apparatus. Values obtained from the two methods did not compare favorably. Thus, the data obtained from the vane/plotter apparatus are not reported here.
Thermal Conductivity We measured thermal conductivity using the needle-probe
method on samples recovered at Hole 679D down to 171.6 mbsf. Below this depth, samples were too disturbed or too hard to measure. The values obtained are listed in Table 11 and plotted vs. depth in Figure 38. Thermal conductivity is generally about 0.7 W/m • K in lithologic Units I and IL Several high values observed in Unit I seem to be related to the existence of nodules or sandy layers. The thermal conductivity in Unit III is about 0.85 W/m • K. The increase near the boundary between Units II and III probably corresponds to the decrease in the water content, since the thermal conductivity of ocean sediment is determined mainly by its water content (Ratcliffe, 1960).
Discussion The physical properties at Site 679 indicate a close relation
ship with the top two lithologic units and with the boundary between Units II and III. Differences in lithology have a major impact on index properties and particularly the vane shear strength as measured with a vane shear device. For example, increases in silt and sand content are known to have an obvious effect on water content, porosity, and bulk density. The high water content and porosity of these diatomaceous muds indicate that the sediments have an open framework similar to silts and sands. Keller (1983) interpreted the high water contents of Peru slope sediments to be related to high organic-carbon contents. It seems more likely that diatom skeletons provide the open-pore structure required to maintain high water contents. Further work on the microscopic fabric of these sediments will be required to confirm this hypothesis.
Nevertheless, changes in physical properties at the Unit 11/ Unit III boundary are difficult to explain. The lithologic boundary is marked by poor core recovery and gravelly phosphatic beds. The sequences on both sides of the boundary commonly contain well-developed dewatering structures. Synthesis of the site data with a detailed analysis of the effects of lithological variation may provide a further explanation of the physical-property behavior at this boundary.
The unconformable boundary between Units III and IV is not well documented by physical properties, although velocities and bulk densities are substantially higher in lithologic Unit IV than in the overlying units.
188

SITE 679
10' 90 180 270
Declination (degrees) 360 -90 -45 0 45
Inclination (degrees) 90
Figure 33. Magnetostratigraphy for Hole 679A for samples demagnetized in a 150-Oe alternating field. The entire core is believed to have been deposited in the Brunhes Chron.
~ iol—
20 r—
30
. | . ' | ' • •
— • -
1
-
—
-
~~"
1
1 '
••••
•
1 .
*• 1 ' • •
• —
•
•
• • •
• • •
1 1 1
m
90 180 270 Declination (degrees)
360 -90 -45 0 45 Inclination (degrees)
90
Figure 34. Magnetostratigraphy for Hole 679B from samples demagnetized in a 150-Oe alternating field. The Brunhes Chron is not represented in this core, inferring that the upper part of the section was eroded. The core is believed to represent the Matuyama Chron and Jaramillo event.
GEOPHYSICS
Seismic Records Site 679 was located on seismic record Peru-14, a 24-channel
line surveyed by the Hawaii Institute of Geophysics during the JOIDES-funded site survey (Fig. 39). Since both the Leg 112 pa-leoceanographic and tectonic objectives were addressed at this site, the upper reflections obscured by the long outgoing signal on the multichannel record were projected from a single-channel record, YALOC-740320. Thus, the seismic data to locate the optimum structure for our paleoceanographic objectives had not been well established before the Resolution arrived in the area of the site. Those objectives required that only the thin distal edge of a mud lens be present at the site, whereas those for the tectonic objectives required shallow basement and an absence of faults. Site 679 was selected as the ship ran a single-channel seismic record along the track of Peru-14 just shoreward of a large normal fault and just beyond where the mud lens was visible in the 3.5-kHz record (Fig. 40).
The single-channel record run from the Resolution was made with a single 80-in.3 water gun (Fig. 41). The width of the out
going signal appears to be about 50 ms at the strong seafloor reflection, whereas the outgoing signal in the multichannel record is about 100 ms long. In the multichannel record the subhori-zontal reflections appear to contain unconformities that are more apparent farther downslope where the section has expanded almost twice. An unconformity at 320 ms below the seafloor is visible in both the single- and multichannel records. Applying the velocities from the PWL and sonic velocity log (see "Physical Properties" and "Logging" sections, this chapter), the unconformity at a depth of 255 m corresponds to a major lithostratigraphic and biostratigraphic break that was observed in cored material. A second major unconformity occurs on the basement surface. That surface was not drilled at this site. Its projected depth, using a velocity of 2 km/s, is about 100 m below the bottom of the maximum depth penetrated, or 460 m.
Although the seismic records appear to indicate few defor-mational features other than numerous normal faults, the upper unconformity represents a major tectonic break. Several small folds occur below the unconformity in the upper-slope area. In the midslope area this unconformity cuts a highly deformed sequence of strata immediately overlying the crystalline basement.
189

SITE 679
V
10
20
30
A n
1
—
-
1
1
•
1
1 •
•
•
• •
• • •
i
1
•
• •
•
i
1 '
—
-
—
i
•
1 . 90 180 270
Declination (degrees) 360 -90 -45 0 45
Inclination (degrees) 90
Figure 35. Magnetostratigraphy for Hole 679D from samples demagnetized in 150-Oe alternating field. The Brunhes-Matuyama Chron is observed at around 8 mbsf. Paleontological studies suggest that the lower normal polarity event at around 27 mbsf represents the Olduvai event, suggesting that a hiatus occurs in the upper part of the Matuyama Chron.
This unconformity and the basement were targets at the site proposed for the midslope area, where it occurs at about three times the depth and thus was not within reach on the lowest part of the slope.
Heat Flow
Temperature Measurements Using A PC Tools Two APC tools were run in Hole 679D during the recovery of
Cores 112-679D-6H and 112-679D-7H. In both cases, the preset recording time was too short, so that the tools stopped recording temperature before a valid reading could be obtained. We could not measure temperature with the APC tools and the T-probe because of hard sediments.
Temperature Data From Wireline Logging Two temperature logs were run with the Schlumberger tool in
Hole 679E (see "Logging" section, this chapter). The temperature in the hole was disturbed by fluid circulation during drilling. Following the method described in the "Explanatory Notes" (this volume), the undisturbed formation temperatures were calculated from 90 to 285 mbsf and plotted with the logged temperatures in Figure 42. Because the equilibrium temperatures were estimated from these temperature data at only two different times, separated by a short time interval, the errors in the equilibrium temperatures might be too large.
Several deflections can be observed in the temperature vs. depth profile. The deflection at about 250 mbsf obviously is valid because we also can observe it in the original logs. Other deflectors may result from errors in extrapolation.
Thermal Conductivity From Logging Thermal conductivity was estimated from wireline-logging
data for the depth range of 80 to 290 mbsf using the procedure
described in the "Explanatory Notes" (this volume). The results are presented in Table 12 and in Figure 43 (indicated by pluses).
The thermal conductivity generally increases with depth in lithologic Unit III. A decrease in thermal conductivity occurs at 240-250 mbsf, which may correspond to the unconformity between Units III and IV. Thermal conductivity values measured by the needle-probe method (see "Physical Properties" section, this chapter) were corrected to in-situ temperature and pressure conditions and are plotted in Figure 43 (indicated by circles). Thermal conductivities estimated from logging data seem slightly higher than those found using the needle-probe method.
Heat Flow Estimation The change in temperature gradient at about 250 mbsf is too
large to be explained by the variation of thermal conductivity. This change suggests that the vertical conductive heat flux is not continuous at this depth. One possible explanation is that some fluid flow carries heat advectively. The logging data show that resistivity, velocity, and density increase significantly at 255 mbsf (the boundary between logging Units C and D), which corresponds to the unconformity between lithologic Units III and IV. Possibly a water flow occurs along this boundary, causing a large deflection in the temperature profile near 250 mbsf. The salinity data obtained by logging and interstitial-water analyses for our samples indicate the existence of upward-flowing water below 255 mbsf (see "Inorganic Geochemistry" and "Logging" sections, this chapter). Such fluid movement also can result in a nonlinear temperature profile.
The mechanism of heat transfer is probably conductive from 90 to 240 mbsf. Thermal resistances of sediment layers for this depth range were calculated from the thermal conductivity values measured by both the needle-probe method and logging data. We assumed the thermal conductivity measured by the needle probe was constant (1.0 W/m • K) below 172 mbsf be-
190

SITE 679
Table 9. Summary of index properties for Site 679, Leg 112.
Bulk Water Grain Core/ Interval density Porosity contents density section (cm) (g/cm3) (%) (%) (g/cm3)
Hole 679B
3H-4 4H-4 5H-2 5H-4 5H-6 6H-3 6H-6 7H-2 7H-4 7H-6 8H-2 8H-4 8H-6 9H-2 9H-4 9H-6 10H-2 10H-4 10H-7 11H-1 12H-2 12H-3
32 37 52 74 23 51 54 52 76 67 67 74 87 58 76 60 85 67 57 38 63 60
1.24 1.26 1.24 1.33 1.99 1.34 1.38 1.41 1.56 1.35 1.29 1.45 1.30 1.34 1.44 1.30 1.34 1.43 1.31 1.45 1.46 1.76
87.32 86.78 86.65 79.83 43.51 79.47 76.90 76.88 64.57 77.89 79.52 72.36 80.12 80.81 69.98 82.01 79.81 74.74 80.45 74.53 71.15 53.25
250.3 240.06 250.25 160.81 28.79
153.20 133.30 126.38 73.76
145.61 169.61 104.53 172.55 163.13 98.72
182.69 155.11 115.46 168.36 111.67 99.21 45.08
_ 2.25 2.18 2.29 2.63 2.17 2.26 2.23 2.31 2.18 2.10 2.33 2.03 2.19 2.12 2.04 2.28 2.29 2.22 2.27 2.30 2.39
Hole 679D
1H-2 1H-5 2H-1 2H-2 2H-3 3H-1 3H-2 3H-3 3H-4 3H-6 4H-2 4H-6 5H-3 5H-4 6H-1 6H-3 6H-5 7H-2 7H-4 7H-6 8H-2 8H-4 8H-6 9H-2 9H-4 9H-5 10H-4 11H-1 11H-3 12H-1 13X-1 14X-2 15X-1 17X-1 19X-1 20X-1
61 62 92 70
130 71 65 71 69 68 70 70 75 70
112 65 68 77 64 76 66 81 83 92 62 82 63 56 53 25 39 45 72 82
112 90
1.26 1.30 1.36 1.31 1.24 1.33 1.24 1.20 1.21 1.31 1.35 1.19 1.48 1.36 1.34 1.40 1.34 1.28 1.33 1.32 1.28 1.26 1.32 1.32 1.34 1.29 1.38 1.64 1.40 1.81 1.47 1.59 1.48 1.43 1.43 1.58
82.64 89.84 77.20 80.42 85.71 78.10 86.36 88.47 85.98 80.42 80.52 92.40 71.17 79.72 78.02 76.64 80.86 81.70 76.79 81.42 82.43 83.11 77.91 81.52 80.81 80.48 76.69 66.46 77.68 53.66 72.58 68.11 74.60 75.02 74.31 68.13
207.32 169.23 138.52 168.38 245.80 150.56 246.86 311.20 270.00 168.50 158.35 391.24
96.81 151.07 146.66 127.63 162.36 188.47 144.70 169.57 192.56 210.54 153.84 173.62 160.55 175.51 131.77 71.21
131.18 43.78
102.27 77.80
107.28 116.13 114.24 79.16
2.04 2.21 2.25 2.24 1.95 2.25 2.12 2.03 1.98 2.06 2.35 2.20 2.45 2.34 2.13 2.34 2.24 2.15 2.12 2.12 2.06 1.99 2.15 2.19 2.09 2.23 2.23 2.63 2.46 2.31 2.36 2.52 2.49 2.49 2.33 2.55
Hole 679E
87 27 66 89 90
2.13 2.03 2.02 1.95 2.03
35.07 46.33 44.59 43.09 43.35
20.18 30.53 29.22 29.19 28.08
2.73 2.70 2.62 2.58 2.63
H = hydraulic piston; X = extended core barrel.
cause no data were available. We estimated the heat flow from 90 to 240 mbsf was 27 and 29 mW/m2 for the needle-probe and logging thermal conductivities, respectively.
The bottom-water temperature determined from logging is 11.1°C (see "Logging" section, this chapter). Thus, the temperature difference between the seafloor and 90 mbsf is 3.OK. Combined with the thermal resistance calculated from needle-
probe thermal conductivities, the heat flow from 0 to 90 mbsf is 24 mW/m2. However, this may not be a reliable value because the bottom-water temperature is not stable in a shallow shelf area such as Site 679.
These heat-flow values are lower than the values measured by conventional surface heat-flow probes on the landward slope of the Peru Trench (Yamano, 1986) and those obtained at Sites 686 and 687, which are also located on the shelf of the Peru margin (see "Geophysics" sections, Sites 686 and 687 chapters). The heat-flow pattern might be affected by a possible advective water flux in the deeper part of Site 679 below 250 mbsf.
LOGGING Hole 679E was logged continuously from 73 to 341 mbsf on
4 November 1986. Logging data were obtained from the Long Spaced Sonic (LSS), Caliper, Dual Induction (DIT), Gamma Ray (GR), Gamma Spectrometry (GST), Aluminum Clay (ACT), Natural Gamma Spectrometry (NGT), Temperature (AMS), Litho-density (LDT), and Compensated Neutron (CNL). All these logging tools were provided by Schlumberger Well Services.
Operations Logging conditions for Hole 679E were excellent. All tools
were run through drill pipe to a depth of 73 mbsf, below which depth the hole was open. We did not condition the hole before logging; therefore, it was filled with seawater. The first logging run, LSS/DIT/GR, reached 341 m; the fill was 18.3 m in 5 hr. The second run, GST/ACT/NGT, reached 329 m; the fill between runs was 12 m in 6.5 hr. During the final logging run, LDT/CNL/NGT, a bridge was encountered at 307 mbsf.
A bottomhole borehole temperature of 18.4°C was measured at 1716 hr, during the second run (11 hr, 16 min after circulation stopped). A second bottom-hole temperature measurement of 18.6°C was recorded during Run 3, after an additional 4 hr and 3 min had elapsed. At the end of Run 3, the temperature inside the drill pipe at the mud line was 11.1 °C. This last measurement was 16 hr after fluid circulation was stopped. We consider it to represent equilibrium ocean bottomwater temperature for Site 679.
Logging Measurements The Schlumberger logging tools we used are described thor
oughly in the literature (Serra, 1984; Anderson and Pezard, 1986) and will not be reviewed here. The log data, referenced to zero depth at the seafloor, are presented in Figures 44 through 47. The water depth at Site 679 was 453.1 m below sea level (as measured by the driller) and 452.1 m below sea level (as determined by the NGT log). The delta-rho measurement, presented with bulk density in Figure 44, is a log quality curve that increases (above zero) as the borehole wall becomes more rugose and/or enlarged.
The log data are consistent with a normal compaction trend. Neutron porosity decreases with depth, while acoustic velocity, bulk density, and resistivity increase with depth. Total natural radioactivity (SGR) increases with depth; inspection of the contributing elements indicates that both thorium and potassium concentrations increase with depth.
The GST ratios (Fig. 47) are defined as follows:
PIR, Porosity Indicator Ratio = H/(Si + Ca) SIR, Salinity Indicator Ratio = Cl/H LIR, Lithology Indicator Ratio = Si/(Si + Ca) II*, Iron Indicator Ratio = Fe/(Si + Ca).
These ratios were not corrected for borehole effect, so that as borehole radius increases, PIR increases, while SIR approaches the value associated with the borehole fluid (seawater).
191

SITE 679
Hole 679B Holes 679C and 679E Hole 679D
100
200
300
400
■+1LL1J I I ' ' l *±±
. or + GRAPE data 0 d iscrete samples
0 ~
->/»•*.;
"'.«?.MkO
•0MM*a»V»*"
\\ .
I , I 1 .0 1 .4 1 .8 2 .2 1 .0 1 .4 1 .8 2.2 1 .0 1 .4 1 .8 2 .2
Bulk density (g/cm3) Bulk density (g/cm3) Bulk density (g/cm3)
Figure 36. GRAPE bulk-density profiles for Site 679. Data from discrete samples are also shown (open circles).
Although borehole radius varies, no trend of increasing or decreasing hole size with depth occurs, so the GST indicator ratios do not require further study. No obvious trend is apparent in the LIR measurement either, but the SIR does appear to decrease with depth (discussed next). The Caliper measurement was obtained by logging downhole because a tool failed during uphole logging; we consider this measurement to be qualitative at best.
We observed that the photoelectric effect (PEF) measured using the LDT (Fig. 44) increased with depth. Although nonlinear with respect to mineral volume proportions, PEF may be interpreted qualitatively based on the following ideal responses (from Serra, 1984):
Mineral PEF
Quartz Calcite Dolomite "Average shale" Carbon-fluorapatite
1.806 5.084 3.142 3.42 5.68
The PEF measurement is relatively unaffected by variations of formation porosity.
Lithologic Unit III, spanning the interval from 101 to 245 mbsf in Hole 679D, was found to have low carbonate content (see "Lithostratigraphy" section, this chapter). Core recovery in this interval averaged 25% (ranging from 102% to 0% recovery). This significant increase in PEF with depth suggests that the average carbonate content in Unit III may be greater than what we observed in the core; however, further analysis is required to correct PEF for clay and phosphate response.
Lithologic Units The logged interval may be divided into four distinct litho
logic units that correspond to Units II, III, and IV, described in the "Lithostratigraphy" section (this chapter). The logging units described next are listed starting from the shallowest depth where logging data was obtained. In parentheses, following the depth interval assigned to each log unit, is the associated lithologic unit and its assigned depth interval (see "Lithostratigraphy" section, this chapter).
Logging Unit A, 73-92 mbsf (Lithologic Unit II, 45-101 mbsf)
The top of this unit was not defined by the logs because the drill string was at 73 m. This unit is distinguished by consistent,
192
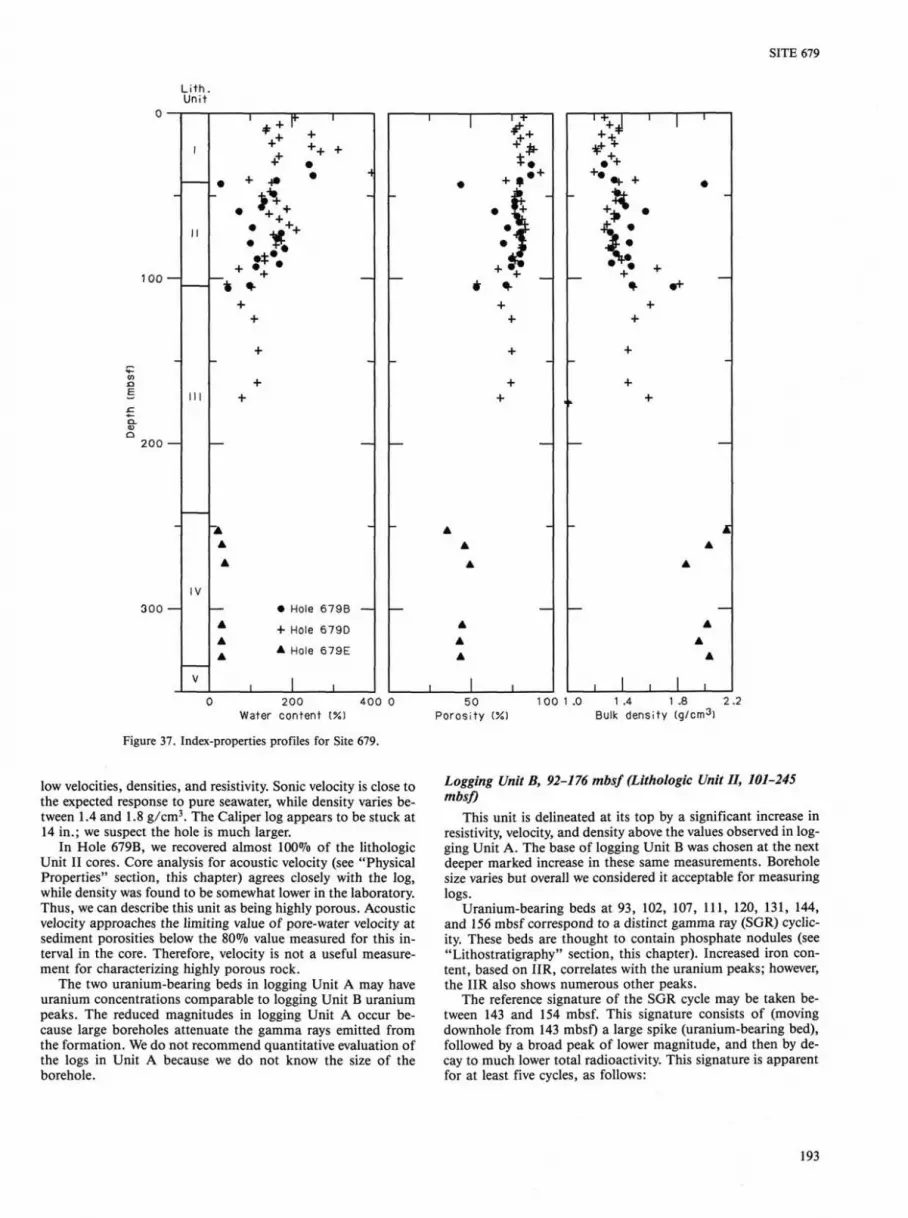
SITE 679
100 —
200 —
300 —
L i t h Unit
I
II
111
IV
V
•
~ *
-
—
"A A
A
A A A
* 4> •
+ + +
+ +
• Hole 679B
+ Hole 679D
A Hole 679E
I
4
—
-
—
0 200 400 0 50 Water content (%) Poros i ty (%)
Figure 37. Index-properties profiles for Site 679.
1 00 1 .0 1 .4 1 .8 2 .2 Bulk densi ty (g/cm3)
low velocities, densities, and resistivity. Sonic velocity is close to the expected response to pure seawater, while density varies between 1.4 and 1.8 g/cm3. The Caliper log appears to be stuck at 14 in.; we suspect the hole is much larger.
In Hole 679B, we recovered almost 100% of the lithologic Unit II cores. Core analysis for acoustic velocity (see "Physical Properties" section, this chapter) agrees closely with the log, while density was found to be somewhat lower in the laboratory. Thus, we can describe this unit as being highly porous. Acoustic velocity approaches the limiting value of pore-water velocity at sediment porosities below the 80% value measured for this interval in the core. Therefore, velocity is not a useful measurement for characterizing highly porous rock.
The two uranium-bearing beds in logging Unit A may have uranium concentrations comparable to logging Unit B uranium peaks. The reduced magnitudes in logging Unit A occur because large boreholes attenuate the gamma rays emitted from the formation. We do not recommend quantitative evaluation of the logs in Unit A because we do not know the size of the borehole.
Logging Unit B, 92-176 mbsf (Lithologic Unit II, 101-245 mbsf)
This unit is delineated at its top by a significant increase in resistivity, velocity, and density above the values observed in logging Unit A. The base of logging Unit B was chosen at the next deeper marked increase in these same measurements. Borehole size varies but overall we considered it acceptable for measuring logs.
Uranium-bearing beds at 93, 102, 107, 111, 120, 131, 144, and 156 mbsf correspond to a distinct gamma ray (SGR) cyclic-ity. These beds are thought to contain phosphate nodules (see "Lithostratigraphy" section, this chapter). Increased iron content, based on IIR, correlates with the uranium peaks; however, the IIR also shows numerous other peaks.
The reference signature of the SGR cycle may be taken between 143 and 154 mbsf. This signature consists of (moving downhole from 143 mbsf) a large spike (uranium-bearing bed), followed by a broad peak of lower magnitude, and then by decay to much lower total radioactivity. This signature is apparent for at least five cycles, as follows:
193

SITE 679
Interval (mbsf)
104-119 119-130 130-143 143-154 154-162
Thickness (m)
15 11 13 11 8
Table 11. Thermal-conductivity data for Hole 679D.
Core/section Interval
(cm) Depth (mbsf)
Thermal conductivity (W/m • K)
The compression of cycle thickness is consistent with compaction. The uranium peak at 102 mbsf probably represents a sixth cycle; we suggest that there is an unconformity at 104 mbsf that has erased the remainder of this cycle. As reported in the "Bio-stratigraphy" section (this chapter), an unconformity was detected at 114 mbsf based on the biostratigraphy of Hole 679D. The top of lithologic Unit III (see "Lithostratigraphy" section, this chapter) at 101 mbsf corresponds to a change in the diatom content of the sediment.
Table 10. Summary of vane shear strength data, Site 679, Leg 112.
Core/ section
Hole 679B
3H-4 4H-4 5H-2 5H-4 5H-6 6H-3 6H-6 7H-2 7H-4 7H-6 8H-2 8H-4 8H-6 9H-2 9H-4 9H-6 10H-2 10H-4 10H-4 10H-7 11H-1 12H-2 12H-3
Hole 679D
1H-2 1H-5 2H-1 2H-2 2H-2 2H-3 3H-1 3H-2 3H-3 3H-4 3H-6 4H-2 5H-3 5H-4 6H-1 6H-2 6H-3 6H-5 7H-2 7H-4 7H-6 8H-2 8H-4 8H-6 9H-2 9H-4 9H-5
Interval (cm)
39 43 58 78 22 57 60 59 74 60 65 40 86 63 75 58 91 48 66 62 36 74 66
70 70 99 45
114 60 67 58 84 94 93 66 82 46
117 62 71 71 76 69 74 71 79 82 93 66 89
Peak (kPa)
113.56 95.41 55.85 61.67 14.66
151.26 80.29
195.48 119.85 80.29 77.96 83.31
148.94 39.10
142.42 148.24 90.76 93.08 96.58
133.34 38.86 84.24
130.31
16.29 89.56 38.86 45.84 47.24 82.39 48.17 80.75 83.54
107.75 114.03 13.26
111.70 79.12 86.10 93.08 89.13
144.98 70.51
251.33 286.93 200.83 283.21 170.35 118.22 380.95 208.74
Residual (kPa)
44.22 30.25 24.43 31.88 4.65
65.16 37.23 93.08 51.20 37.23 39.56 46.54 89.59 15.82 86.10 86.10 44.22 44.22 47.71 74.00 12.80 32.58 44.22
6.98 17.45 20.48 23.27 17.45 36.07 15.13 31.88 30.95 61.67 58.18
8.84 44.22 31.88 30.25 33.51 36.54 72.14 23.27
147.77 188.50 103.56 178.49 93.08 50.50
237.37 74.93
112-679D-1H-1 1H-3 1H-4 2H-1 2H-4 2H-6 3H-4 3H-6 5H-1 5H-2 5H-4 6H-4 6H-5 8H-4 8H-5 8H-6 9H-1 9H-2 9H-3 9H-4 9H-5 10H-1 10H-2 10H-3 10H-4 11H-4 11H-5 11H-6 13X-1 13X-2 14X-1 14X-2 15X-1 18X-2 18X-3 19X-2 20X-1
70 70 70 80 70 70 70 70 70 70 70 70 70 70 70 70 70 70 70 70 70 70 70 70 70 70 70 70 70 21 70 70 70 70 70 70 70
0.70 3.70 5.20 8.70
13.10 16.10 22.60 25.60 37.10 38.60 41.60 51.10 52.60 70.10 71.60 73.10 75.10 76.60 78.10 79.60 81.10 84.60 86.10 87.60 89.10 98.60
100.10 101.60 105.10 106.11 114.60 116.10 124.10 154.10 155.60 163.60 171.60
0.765 1.018 0.734 0.884 0.673 0.669 0.708 0.791 0.856 0.741 0.834 0.708 0.691 0.713 0.712 0.755 0.730 0.704 0.719 0.693 0.701 0.695 0.822 0.850 0.848 0.780 0.883 0.914 0.870 0.864 0.831 0.812 0.895 0.842 0.858 0.823 1.039
L i th . unit
100
200
I r~^$n—7 r * — l
• • •
• • • •
0.6 0 .8 1 .0 Thermal conduc t iv i t y (W/m»K)
Figure 38. Thermal conductivity profiles for Hole 679D.
Sedimentation rates of 80 m/m.y. were reported in the "Biostratigraphy" section (this chapter) for the interval 114— 244 mbsf in Hole 679D. Based on this rate, the gamma-ray cy-clicity observed in Hole 679E has a period of less than 190,000
194

SITE 679
1 nmi
CDP 300 J
U2
Figure 39. Multichannel seismic record 14 showing the position of Site 679. U-l and U-2 show depths of two major unconformities, at 255 and about 460 m, respectively.
1300 UTC I
1310 1320 I
Beacon dropped 1331 UTC
1330 1340 I
1350 1400 I
JOIDES Resolution
Time: 1330 UTC Julian day: 304 Range: 0-750
Recorder: 3.5 kHz Date: 31 Oct. 86
Figure 40. A 3.5-kHz record made on board Resolution when approaching the site.
195

SITE 679
1245 UTC
Beacon dropped End survey
1331 1350
Direct " arrival m
Width of outgoing ~|~^
signal £
0 - «
*to^f#jfe^&NivMM*ft i j\*»«i*>M' .A*^V«»« <i>:
Site 679
cfl
P 5?
CO J»
1.0-5
5.5 km VE = 5.6
3 nmi
Figure 41. A single-channel record made on board Resolution when approaching the site.
yr (using the 15 m thickness of the top cycle as a maximum). Decompaction is required for a quantitative study of cyclicity, however.
Logging Unit C, 170-255 mbsf (Remainder of Lithologic Unit III, 101-245 mbsf)
The base of this unit is marked by a transition to a relatively dense rock. The interval corresponding to 253-257 mbsf in Hole 679D corresponds to total depth of Hole 679D. Logging measurements in Units C and D (as discussed below) show a decreased, lower neutron porosity. Iron content seems to be reduced with respect to silicon and calcium, when compared with the upper units. Thin, iron-bearing beds frequently are seen, however.
Both potassium and thorium concentrations increase to a significantly higher level at the Unit B/Unit C boundary, resulting in a higher average SGR below 170 mbsf. This probably results from a change of clay type, a conclusion that explains an increase in PEF without a corresponding increase in calcium or dolomite concentration. Interpreting PEF is complex and will require further analysis.
High velocity measurements at 188, 195, 197, and 205 mbsf correspond to slight density and resistivity changes, but otherwise do not correlate with the rest of the logs. Although density measurements are tentative because of a rugose hole (see delta-rho, Fig. 44), the velocity maximum at 205 mbsf corresponds to a slight decrease in density, while delta-rho indicates that the hole is in good condition there. As these high-velocity beds do not correspond to a lithologic variation (note also that PEF is unaffected), velocity must be increased because of improved grain-to-grain contact in the rock. Calcite cementation of silt and sand layers reported in the "Lithostratigraphy" section (this chapter) evidently is the cause as the volume of calcite present as cement could not be detected in the logs.
50
100
150
200 —
250
300
1 1 ' 1
It - A
A <* O A • 4 O* A O* A — 0» A o« ^ 0» A O* A 0« A O* A O* A O* A O* A — O * A O • A O • A
O • A O • A O • A O • A O • A O • — O • O • O • O • O • O • O • O •
■ 1 - 1
1
A A A
1
1
A A A A A A 1
—
—
—
—
—
1 4 20 22 Temperature (°C)
Figure 42. Logged temperature profiles (open circles and closed circles) and extrapolated formation temperature (triangles), Hole 679E.
Table 12. Thermal conductivity data from wireline logging, Site 679.
Depth (mbsf)
80 90 100 110 120 130 140 150 155 165 170 180 185 190 200 210 220 230 240 250 260 270 275 285 290
Thermal conductivity (W/m • K)
0.89 0.89 0.90 0.92 0.91 0.95 0.96 0.93 0.95 0.97 0.98 1.02 1.06 1.03 1.03 1.06 1.01 1.01 0.96 0.97 1.02 1.04 1.00 1.04 1.01
Unit D, 255-341 mbsf (Lithologic Unit IV, 245-338 mbsf) The base of this unit was not determined by the logs as fill
ing in the hole precluded reaching the total cored depth with logging tools. The boundary between logging Units C and D
196

SITE 679
Li th. unit
1
1
II
III
IV
• • • • •
• •
T • ♦ A
A
\ * — A —
A A A
A - • NP A -
A A Logging A
O .6 0 .8 1 .0 Thermal conductivi ty (W/m«K)
Figure 43. Thermal conductivity estimated from wireline logged data (triangles) and thermal conductivity found using the needle-probe (NP) method, corrected for in-situ temperature and pressure conditions (circles).
marks a change to material having significantly faster velocity, higher density, and lower porosity.
Pore-water salinity, as determined qualitatively from the SIR (Fig. 46), records a change to fresher pore water at the logging Unit C/Unit D contact. We also observed this change from analyses of interstitial water and inorganic chemicals (see "Inorganic Geochemistry" section, this chapter). Based on the SIR response, we observed that salinity increased between the two high-porosity peaks at 276 and 279 mbsf and increased down-hole until the porous interval at 297-200 mbsf was reached. Below 299 mbsf, the SIR returns to the magnitude observed above logging Unit D. We did not consider the statistical precision of the SIR measurement, which may be similar to the variation mentioned previously.
Several highly porous beds occur in logging Unit D. The most noteworthy beds occur at 257, 276, 279, 297, and 299 mbsf. These units are characterized by a reduced PEF, an increased LIR, and a reduced total SGR intensity. These log responses were consistent with a high-porosity sand having a low clay content. Separation of the deep, shallow resistivity measurements over these intervals indicates a relatively high permeability, and the direction of separation confirms that the formation fluid is less saline than the borehole fluid. Invasion of borehole fluid into permeable zones (where formation water salinity differs from the borehole) results in a salinity profile detected by the DIT.
An interpretation consistent with the salinity variation observed in our logs and reported in the "Inorganic Geochemistry" section (this chapter), is that these porous sand intervals provide permeability channels for an influx of freshwater. We observed that uranium, which is washed out by water, decreases to near zero, the lowest concentration observed at this site below 288 mbsf.
Our conclusion that fluid is diffusing uphole from permeable beds is supported by an accumulation of uranium at 255 mbsf, where the dense, calcareous (see PEF and LIR response) rock presents a permeability constriction. Fluid up welling is further supported by interstitial-water studies at Site 680 (see "Inorganic Geochemistry" section, Site 680 chapter).
Quantitative Analysis of Logging Data A synthetic seismogram (Fig. 48) was calculated from the
log-derived density and velocity data for comparison with the seismic section. Although there appears to be a good correlation, a detailed comparison requires that the velocity model used for seismic analysis be comparable to the measured velocities. The seismic section will be reinterpreted in light of the logging data.
SUMMARY A N D CONCLUSIONS The Site 679 position on the outer continental shelf of Peru
enabled us to sample the distal edge of the sediment lens beneath a modern upwelling plume. We continued drilling into the underlying section to sample ancient sediment presumably of a similar origin but at different stages of diagenesis. In addition, we wanted to sample the entire sediment column to the crystalline basement that extends offshore across the continental shelf and down the upper part of the landward slope of the Peru Trench. From that stratigraphic column, which at Site 679 is one-third the thickness of the same section downslope, the vertical tectonic motion of the shelf during the Andean orogeny was to be established. Site 679 is the landward point on a transect of sites targeted to investigate the vertical tectonic history of the continental margin.
The four holes drilled at this site were in a water depth of 459-461 m, and the deepest penetration was to 359.3 mbsf. Drilling in the hole stopped about 100 m above the crystalline basement for safety reasons. We recognized five lithostratigraphic units. We separated the first three units on the basis of diatom and carbonate contents. The last units were principally mud-stone and siltstone. Although we suspected many hiatuses, they were difficult to recognize, except where marked by conglomerates of phosphate nodules or by winnowed zones. Unit I (0-45 mbsf) consists of olive to dark-gray diatom-foraminifer mud. It may be separated by a hiatus from Unit II (45-101 mbsf) that is composed of olive to black diatomaceous mud having numerous micro faults and structures for escaping fluid. The first two units were deposited under hemipelagic conditions and were subject to winnowing by periodic bottom currents. Unit III (101-245 mbsf)> which had poor recovery, consists of olive gray to very dark gray diatomaceous mud, silt, and fine sand. A sequence of well-preserved primary structures shows evidence of clastic traction transport and possibly storm events. Unit IV (245-338 mbsf), separated from Unit III by an unconformity, consists of light gray to dark gray mudstone and siltstone having periodic calcite cementation and frequent thin turbidite structures. A hiatus separates Unit IV from Unit V (338-359 mbsf), which consists of very dark gray shale deposited in anoxic pelagic and hemipelagic environments.
Because of the dysaerobic environment in the lower water column, bioturbation did not obscure primary structures. Unit II contains spectacular veins and dewatering structures that first appear at 57 mbsf. We did not observe these veins below 103 mbsf. They may be related to extensional and simple shear deformation associated with gravity-related downslope settling or movement along the fault adjacent to the site. The unusual stiffness of the sediment at such a shallow depth could make the layers particularly prone to brittle failure. An increase in pore pressure also may have reduced the strength of the sediment. Microfaulting in Unit IV displays compressional geometries.
197

SITE 679
DRHO -0 .1
100
150
^ 200
250
300
6 I 3 1 Photoelectr ic ef fect Acoust ic veloci ty
2 3 Bulk density
RHOB (g/cm3)
Figure 44. Log measurements of Photoelectric Effect (PEF), Acoustic Velocity (VELI), Bulk Density (RHOB), and Delta-rho (DRHO). These are the LDT and LSS measurements.
The sediment section reveals considerable early diagenesis. In particular, we noted the early formation of carbonate-F-apa-tite (francolite), dolomite, pyrite, and, to a lesser extent, of opal-CT chert. These minerals form layers and nodules or are disseminated within the sediments as cement in sandstones and mudstones, or replace carbonates and opal-A. We conducted a preliminary examination of the distribution of carbonate, phosphate, and opal-A. We observed an obvious progression of do
lomite formation downhole. Dolomite occurrences range from disseminated rhombs, thin layers, and small nodules in the upper units to more massive beds and larger nodules in the deeper units. We first observed calcite cementation in Unit III. Phosphates occur in friable layers (believed to have formed in situ) and massive rounded pellets and nodules that have been concentrated by winnowing and reworking. A thin layer of opal-CT was noted at 19.8 mbsf. Frequent layers of pure diatom tests seem to
198

SITE 679
I •f-f
Depth
100
150
200
250
300
0.2 I L M 20
I L D 20
0.2 S F L U 20
r
j
i
SlIS*""
■
>
}
't
' V
J i j j
\
I
;
! ■
:
■
1 N P H I 0
-
I
I ! i I i
i
-=■> • 5L
X ■ ^
Figure 45. Log measurements of Resistivity (Deep-ILD, Medium-ILM, and Shallow-SFL), Caliper (CALI), and Neutron Porosity (NPHI). These are the DIT, Caliper, and CNL measurements.
enhance early diagenetic processes, perhaps by providing increased permeability and porosity for migration of chemical reactants. To distinguish the authigenic minerals formed in situ under the present chemical environment (from those formed earlier and subsequently concentrated by reworking) will require a more thorough investigation of this rich collection of early diagenetic products at shore-based laboratories.
Establishment of the biostratigraphy of this site was based on abundant siliceous microfossils and sporadic calcareous mi-crofossils. Sedimentation rates, based on the preliminary diatom and nannoplankton stratigraphy, are 140 m/m.y. in the first 64 mbsf, 10 to 20 m/m.y. from 64 to 114 mbsf, and 80 m/m.y. from 114 to 244 mbsf. Each of these intervals appears to be separated by a major hiatus. Planktonic foraminifers and diatom
199

CGR 0 200
SGR 0
% ■
V
1
—
—
T - J
^L "N *
_
< <
r i : -T
j r f
- j
?:' <
■<
^ S «■
j * ^ *"
^
s ; :
—
V . l ^ , s^ - 3
V
< • * —
£ _
^
i?ja
>
a
^ : f -^ £ ; f» i r l y * *. iS-s \
if r *T
> ^*-d
/ \?\
J fe-IT
!
wu Depth (m)
50
100
150
200
250
300
o.r P 0 T A o.i 0 THOR
10 U R A N 20
)
&
T
S
-1* I J
/
" .■ __
' 1 1
Li
> > i . — i —
'? i
^
H <ri
i ^
<
?J
<i <
4 |! <
_
!
—
«
|
^
^
k-p
2
^
■
I « -
<i
< t
c
1 4 i
J
—~
-~i
c. —g
* , C
r ^
^ \ s
c5
>
c ^
:
(
)
^
-f >
f I.
\ u
7-
»»
^ 5
_ "
"
=—
f
'—
'
-
-
f ( I
* T
/
" i
v
< %
.
< • •
. i
J
. *-.
?
•--
}
:C
>
V
J
»
V
.
5
■?
V V
■J < 1 ■-.
^_
t
k.
H z - . _
—
Figure 46. Log measurements of Total Gamma Ray (SGR), Gamma Ray with Uranium subtracted (CGR), Uranium (URAN), Thorium (THOR), and Potassium (POTA). These are the NGT measurements.

SITE 679
0.3 MR
SGR
1.3
200 Depth (m)
50
100
fe
150
200
250
■$5 300
"T Figure 47. Log measurements of Lithology Indicator (LIR), Porosity Indicator (PIR), Salinity Indicator (SIR), Iron Indicator (IIR), and Macroscopic Neutron Capture Cross-Section (CSIG). These are the GST measurements.
201

SITE 679
100 —
0.65
0.70
200 —
300
0 1 2 Relative impedance
Figure 48. Synthetic seismogram using a Ricker wavelet with a 35-Hz center frequency and assuming that the velocity between the seafloor and 73 mbsf is 1580 m/s. Analysis based on LSS and LDT log data.
assemblages indicate temperate surface-water temperatures similar to those found today along the Peruvian coastal upwelling areas. Benthic foraminifers occur in assemblages having both in-situ and transported characters. All in-situ assemblages lived in upper bathyal water depths and are most commonly found in the upper two units. Assemblages transported from shallower depths are most common in the lower units. No paleontological signs of significant vertical tectonic movement have occurred from about 12 Ma to the present.
We compared the headspace procedure with the can procedure during routine sampling of hydrocarbon gases at Site 679. The resulting measurements of gas concentration show similar trends with depth, except that the results from headspace procedure provide more detail because of closer sample spacing. Biogenic methane concentrations increase by two orders of magnitude between 144 and 172 mbsf, corresponding to the depletion of sulfate, which allows methanogenesis to proceed without inhibition. The headspace procedure indicated low concentrations of thermogenic hydrocarbons at the bottom of Hole 679E, where a petroliferous odor was detected. The ratio of methane/ethane changed from 3000 in the next-to-last core to 20 in the last one. This information, together with observed fluorescence under ultraviolet light, indicated that we should abandon the hole. Other organic-geochemical data included a comparison of Rock-Eval analysis with TOC analysis by combustion, and with a rapid pyrolysis technique using Source Hound, a portable device designed by British Petroleum for evaluating source rocks. These instruments gave highly correlated results when characterizing the organic-rich sediments sampled at Site 679.
The interstitial-water chemistry at Site 679 is dominated by bacterial degradation of organic matter, mainly in the sulfate reduction zone, and consequently by increased concentrations of hydrogen sulfide, phosphate, and ammonia and pronounced
higher alkalinity. These dissolved components control the diage-netic formation of francolite, dolomite, calcite, and pyrite. Superimposed on this distribution pattern of dissolved species is a freshwater incursion in Unit IV of late Miocene age. In this zone, chloride decreases from a seawater value of 558 mmol/L, the observed value in the top 172 m, to a minimum value of 345 mmol/L (63% of seawater). The freshwater incursion may be related to either ancient or recent flow from aquifers in the Andes or the presence of a fossil freshwater lens. Its discovery is yet another manifestation of the importance of fluid transport in deposits along tectonically active continental margins.
The index properties clearly reflect the major changes in li-thology, especially in the diatomaceous units encountered at shallow depths. The upper 100 m is characterized by high water content, and porosities are commonly greater than 80%. The boundary between lithologic Units I and II is a steplike shift in the plots of all index properties except sonic velocity. Sparse measurements below the depth of APC coring reflects the poor recovery during XCB coring. The peculiar properties of these sediments are low bulk density, high water content, and porosity. Such properties are characteristic of sediment with abundant unaltered remains of diatoms.
The geophysical records performed while approaching Site 679 show the distal edge of the mud lens, the underlying stratified section, and the unconformity between the upper and middle Miocene sequence. Sonic velocities applied to the time of interception confirmed the correlation between features in the seismic records and those in the cores. The unconformity at 255 m is not only a significant stratigraphic break but also coincides with a definite change in the sonic velocity profile and other logging traces. The site-survey multichannel record shows a three-fold expansion of the section above the unconformity downslope and a profound angular discordance below the unconformity. The termination of the hole at about 100 m above basement at this site leaves in question the origin of the unconformity surface and the age of the transgressive sediment sequence above it.
At Site 679, the compressed stratigraphic section contains a record of Pliocene and Quaternary coastal upwelling. The relatively sparse clastic influx compared with the rate at which the organic-rich upwelling products accumulate produces a chemical environment conducive to the rapid formation of dolomites, phosphates, and sulfides during the early stages of diagenesis. The anoxic bottom environment and the absence of bioturba-tion preserve the primary sedimentary structure characteristic of pelagic and hemipelagic environments. Also preserved are structures formed later by escaping fluids and microfaults related to the extensional and shear deformation associated with down-slope gravity movement. The facies in the deeper section is dominated by turbidites with terrigenous and near-shore affinities. This facies contains pore fluids significantly diluted by freshwater. The fluid most likely migrated from a more distant source and thereby diagenetically overprints the geochemistry of the continental margin deposits. The two facies are separated by an unconformity between the upper and middle Miocene that appears as a prominent marker zone at the base of the strata covering the midslope of this margin. The late Neogene age of these slope strata, which are much younger than previously inferred, requires a more rapid rate of tectonism across the Peruvian margin than has been assumed.
REFERENCES Akiba, E., 1985. Middle Miocene to Quaternary diatom biostratigraphy
in the Nankai Trough and Japan Trench and modified lower Miocene through Quaternary diatom zones for middle-to-high latitudes of the North Pacific. In Kagami, H., Karig, D. E., et al., Init. Repts., DSDP, 87: Washington (U.S. Govt. Printing Office), 393-481.
202

SITE 679
Anderson, R. N., and Pezard, P., in press. Nuclear logs. In Becker, K., Sakai, H., et al., Proc. ODP, Sci. Results, 111: College Station, TX (Ocean Drilling Program).
Baker, P. A., and Burns, S. J., 1985. Occurrence and formation of dolomite in organic-rich continental margin sediments. Am. Assoc. Petrol. Geol. Bull., 69:1917-1930.
Baker, P. A., and Kastner, M., 1981. Constraints on the formation of sedimentary dolomites. Science, 213:214-216.
Barron, J. A., 1985. Late Eocene to Holocene diatom biostratigraphy of the Equatorial Pacific Ocean. Deep Sea Drilling Project Leg 85. In Mayer, L., Thayer, E , Thomas, E., et al., Init. Repts. DSDP, 85: Washington (U.S. Govt. Printing Office), 413-456.
Blow, W. H., 1969. Late middle Eocene to Recent planktonic foraminif-eral biostratigraphy. In Bronnimann, P., and Renz, H. H. (Eds.), Proc. 1st Intl. Conf. Planktonic Microfossils, 1:199-421.
Bolli, H. M., and Premoli-Silva, I., 1973. Oligocene to Recent planktonic foraminifera and stratigraphy of the Leg 15 sites in the Caribbean Sea. In Edgar, N. T , Saunders, J. B., et al., Init. Repts. DSDP, 15: Washington (U.S. Govt. Printing Office), 475-497.
Bronniman, P., and Resig, J., 1971. A Neogene globigerinacean bio-chronologic time-scale of the southwestern Pacific. In Winterer, E. L., Riedel, W R., et al., Init. Repts. DSDP, 7(Pt. 2): Washington (U.S. Govt. Printing Office), 1235-1469.
Bullard, E. C , 1947. The time necessary for a borehole to attain temperature equilibrium. Mon. Not. Roy. Astr. Soc, Geophys. Suppl., 5:127-130.
Burch, T.K., and Langseth, M. G., 1981. Heat flow determination in the DSDP boreholes near the Japan trench. J. Geophys. Res., 86: 9411-9419.
Claypool, C. E., and Kaplan, I. R., 1974. The origin and distribution of methane in marine sediments. In Kaplan, I. R. (Ed.), Natural Gases in Marine Sediments: New York (Plenum Press), 99-140.
Couch, R. W , Shanahan, S., Troseth, S. C , and Peper, J., 1985. Estimated sediment thickness and regional gravity anomaly map. In Hussong, D., et al. (Eds.), Atlas of the Ocean Margin Drilling Program, Regional Atlas Series: Woods Hole (Marine Science International), 19.
Cowan, D. S., 1982. Origin of "vein structure" in slope sediments on the inner slope sediments of the Middle America Trench off Guatemala. In Aubouin, J., von Huene, R., et al., Init. Repts. DSDP, 67: Washington (U.S. Govt. Printing Office), 645-649.
Garrison, R. E., Kastner, M., and Zenger, D. H. (Eds.), 1984. Dolomites of the Monterey Formation and other organic-rich units. SEPM Pacific Section, 41.
Gieskes, J. M., 1974. Interstitial water studies, Leg 25. In Simpson, E.S.W., Schlich, R., et al., Init. Repts. DSDP, 25: Washington (U.S. Govt. Printing Office), 361-394.
Gieskes, J. M., and Lawrence, J. R., 1976. Interstitial water studies, Leg 35. In Hollister, C. D., Craddock, C , et al., Init. Repts. DSDP, 35: Washington (U.S. Govt. Printing Office), 407-423.
Gieskes, J. M., and Peretsman, G., 1986. Water chemistry procedures on the SEDCO 471-some comments. ODP Technical Note No. 5.
Horai, K., and Von Herzen, R. P., 1986. Measurement of heat flow on Leg 86 of the Deep Sea Drilling Project. In Heath, G. R., Burckle, L. H., et al., Init. Repts. DSDP, 86: Washington (U.S. Govt. Printing Office), 759-777.
Hussong, D. M., Dang, S. P., Kulm, L. D., Couch, R. W , and Hilde, T W C . (Eds.), 1985. Atlas of the Ocean Margin Drilling Program Regional Atlas Series, Atlas 9: Woods Hole (Marine Science International).
Ingle, J. C , Jr., 1980. Cenozoic paleobathymetry and depositional history of selected sequences within the southern California Continental Borderland. Cushman Found. Spec. Publ, 19:163-195.
Irwin, H., Curtis, C. D., and Coleman, M., 1977. Isotopic evidence for source of diagenetic carbonates formed during burial of organic-rich sediments. Nature, 269:209-213.
Keller, G. H., 1983. Coastal up welling, its influence on the geotechnical properties and stability characteristics of submarine deposits. In Thiede, J., and Suess, E. (Eds.), Coastal Upwelling: Its Sediment Record, Part B: New York (Plenum Press), 181-188.
Kennett, J. P., 1973. Middle and late Cenozoic planktonic foraminiferal biostratigraphy of the southwest Pacific, DSDP Leg 21. In Burns, R. E., Andrews, J. E., et al., Init. Repts. DSDP, 21: Washington (U.S. Govt. Printing Office), 575-640.
Kennett, J. P., and Vella, P., 1974. Late Cenozoic planktonic foraminifera and paleoceanography at DSDP Site 284 in the cool subtropical South Pacific, DSDP Leg 29. In Kennett, J. P., Houtz, R. E., et al., Init. Repts. DSDP, 29: Washington (U.S. Govt. Printing Office), 769-799.
Kleinpell, R. M., 1938. Miocene Stratigraphy of California: Tulsa (Am. Assoc. Petrol. Geologists).
Kulm, L. D., Dymond, J., Dasch, E. J., and Hussong, D. M. (Eds.), 1981. Nazca Plate: Crustal Formation and Andean Convergence. Geol. Soc. Am. Mem., 154.
Kulm, L. V., Schrader, H., Resig, J. M., et al., 1981. Late Cenozoic carbonates on the Peru continental margin: Lithostratigraphy, biostratigraphy, and tectonic history. Geol. Soc. Am. Mem., 154:469-508.
Kulm, L. D., Suess, E., and Thornburg, T M., 1984. Dolomites in organic-rich muds of the Peru forearc basins: analogue to the Monterey Formation. In Garrison, R. E., Kastner, M., and Zenger, D. H. (Eds.), Dolomites of the Monterey Formation and Other Organic-Rich Units. SEPM, Pacific Section, 41:29-47.
Manheim, F. T , and Sayles, F L . , 1974. Composition and origin of interstitial waters of marine sediments based on deep sea drill cores. In Goldberg, E. D. (Ed.), The Sea, Vol. 5: New York (Wiley), 527-568.
Mann, R., and Gieskes, J. M., 1975. Interstitial water studies, Leg 28. In Hayes, D. E., Frakes, L. A., et al., Init. Repts. DSDP, 28: Washington (U.S. Govt. Printing Office), 805-814.
Mutti, E., and Ricci Lucci, F , 1972. Turbidites of the Northern Ap-penines: Introduction to facies analysis. Translated by T. H. Nilsen in 1978, Intl. Geo. Rev., 20:125-166.
Ocola, L., 1985. Flujo calorico en el nor-oriente Peruano: Cuenca Maranon, Tema N° 20. Ill Simposio Sudamericano de COGEODATA, Lima, Peru, 26-29 Nov.
Ocola, L., 1986. Heat flow and geothermal investigations in Peru. Proc. Int. Meeting on Geothermics and Geothermal Energy, Guaruja, State of Sau Paulo, Brazil, 10-14 Aug.
Ratcliffe, E. H., 1960. The thermal conductivities of ocean sediments. J. Geophys. Res., 65:1535-1541.
Resig, J., 1981. Biogeography of benthic foraminifera of the northern Nazca Plate and adjacent continental margin. Geol. Soc. Am. Mem., 154:619-665.
Serra, O., 1984. Fundamentals of Well-Log Interpretation: Vol. 1, The Acquisition of Logging Data: Amsterdam (Elsevier).
Srinivasan, M. S., and Kennett, J. P., 1981. A review of Neogene planktonic foraminiferal biostratigraphy: equatorial to subantarctic, South Pacific. Mar. Micropaleontol., 6:499-534.
Suess, E., Kulm, L. D., and Killingley, J. S., 1987. Coastal upwelling and a history of organic-rich mudstone deposition off Peru. In Brooks, J., and Fleet, A. J. (Eds.), Marine Petroleum Source Rocks, Geol. Soc. Am. Sp. Publ., 24:181-197.
Suess, E., and Thiede, J. (Eds.), 1983. Coastal Upwelling: Its Sediment Record, Part A: New York (Plenum Press).
Thiede, J., 1983. Skeletal plankton and nekton in upwelling water masses off northwestern South America and northwest Africa. In Suess, E., and Thiede, J. (Eds.), Coastal Upwelling: Its Sediment Record: Part A: Responses of the sedimentary regime to present coastal upwelling: New York (Plenum Press), 183-207.
von Huene, R., Kulm, L. C , and Miller, J., 1985. Structure of the frontal part of the Andean convergent margin. J. Geophys. Res., 90(B7): 5429-5442.
Walker, R. G., 1984. Shelf and shallow marine sands. In Walker, R. G. (Ed.), Facies Models (2nd ed.), Geoscience Canada Reprint Series, 1: 141-170.
Yamano, M., 1986. Heat flow studies of the circum-Pacific subduction zones [Ph.D. dissert.]. Univ. of Tokyo.
Ms 112A-110
203

SITE 679
Summary logs for Site 679.
TRANSIT TIME ^ ~
204

SITE 679
Summary logs for Site 679 (continued).
o l <* I CALIPER CD I ho-
SHALLOW RESISTIVITY ohm-m 2 0 | T R A N S , T T I M E ° ~
j>EEJ^ RESISTIV'ITY ... I . L.QNG.JSPACJNG,. J m § in.
GAMMA RAY 20 I 02
0. < , £ w | 0 GAPI units 1501 0.2
ohm-m FOCUSED RESISTIVITY
20 1200 us/ft lOOl I d SHORT SPACING | Q- o
ohm-m 20 200 u»/ft 100 o cc
250
300
700
750
-800
205

SITE 679
Summary logs for Site 679 (continued).
II SPECTRAL GAMMA RAY
PHOTOELECTRIC EFFECT
} barns/e* I0
" £§ r-> x-» , u
UJ O ►-( T u a < O UJ UJUJ
,.<sSS!S3fIEP....l.....£fi8fi§!IX 1 .IbPRjyM GAPl'units *l*56TlC)6" %" ""6\b Ppm 20* TOTAL | BULK DENSITY | POTASSIUM
n -><r U J 0
<D 0
URANIUM
I0
13
14
15
16
17
18
19
20
21
22
23
24
25
100
150
2 0 0 -
6 0 0
650
206

SITE 679
Summary logs for Site 679 (continued).
>-er u > o o UJ er
II I - l ( - H -Q . < LUUJ o n
SPECTRAL GAMMA RAY
PHOTOELECTRIC EFFECT
0 boms/e- I0 .COMPUTED. I POROSITY THORIUM
6 " "GA~PI units"isoTib'o "%""" "~~6|6 "ppm" 20" TOTAL | BULK DENSITY I POTASSIUM
25
2 6
27
1
2
3
TJ
250-
300-
II Xu!
0 GAPI units 150 g/cm3 3 | 0 weight % I0 | 0 URANIUM
ppm To"
Z5
t .
- 7 0 0
-750
- 8 0 0
207

SITE 679
Summary logs for Site 679 (continued).
Id er o u
ERY
> o o LU er
* ? o-=--■er So I -J l -u . uS oco
CAPTURE U Htr cc £ o - ™ S § SECT^ON^I __C /^frC,UM Y I E L D J I R 0 N Y I E L D 1 C H L 0 R , N E Y I E L D I m§
0 6 ] ocr ALUMINUM YIELD 0 count rates 2000 I 0
SILICON YIELD 0 3 I-0.1
SULFUR YIELD 0.4 0.
HYDROGEN YIELD
I0
13
14
15
16
17
18
19
20
21
22
23
24
25
—
100-
150-
2 0 0 -
2
■550
-600
-650
208
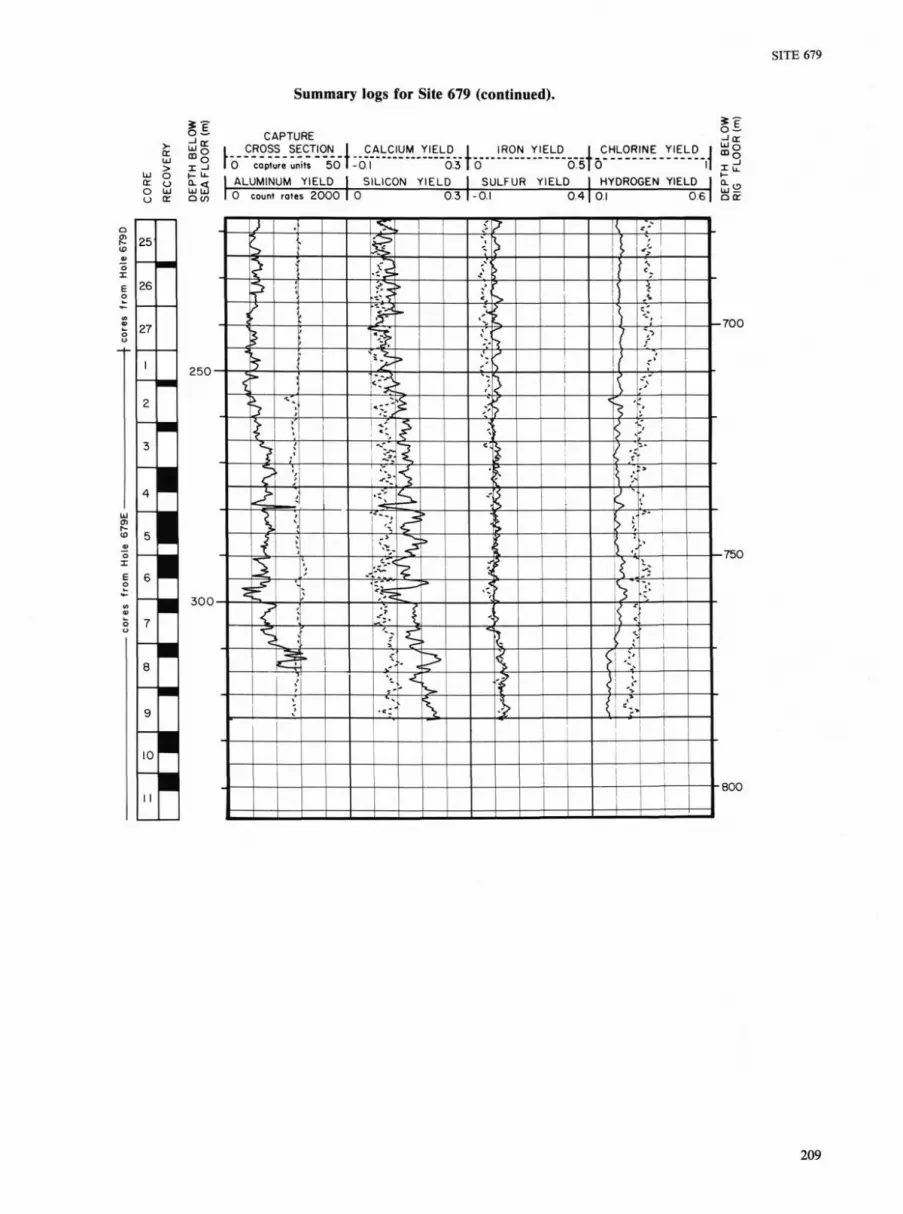
Summary logs for Site 679 (continued).
SITE 679
LU er o u
ERY
> o o UJ er
* ? O S - i er
I -1 t - li-LU 2 Q (O
CAPTURE CROSS SECTION CALCIUM YIELD IRON YIELD
0 copture units 50 ALUMINUM YIELD
-0. 0.3 0 0 5 0
II - i er
CHLORINE YIELD J m g
0 count rates 2000 | 0 SILICON YIELD I SULFUR YIELD I HYDROGEN YIELD I er,
03 1-01 0 4 01 0 6 ocr
250
3 0 0
209

SITE 679 HOLE CORE 1H CORED INTERVAL 4 3 9 . 5 - 4 4 6 . 5 mbsl; 0 . 0 - 7 . 0 mbsf
z
IE-
ROCK
>-rr < er LU i -
< n o
BIOSTRAT. ZONE/ FOSSIL CHARACTER
to
AM
INIF
ER
" ■
ene
Hol
oc
o
CM
*
t/>
NO
FOSS
IL
z
a z
o (N 2
*
IOLA
RIA
NI
11 I 2 Q
>-
tern
;
CO 7J
*
S
E0M
AGNE
1
*
£
S.
PRO
PE
11
s s
" «?
• to O) o
•
•
9
•
>3.e
• r-
•
s.o
•
r*
•
*
I •J U J w
1
2
3
4
5
^C
8 2
; 0 . 5 -
1 . 0 —
J
\
-
---_ --■
'_ ' :
j
: z.
-\ _-
--
GRAPHIC LITHOLOGY
" ^ y
•Z H Z 7 T ^ 7~
z — z - :_ ~
' 77 1_
~ ' rr Z U . 7"
_ + ^ :
_H_ = z - t - ~ —
""-+- —z V O I D
—t— T - : ;_
— ~ — —r— ~~ —
~-+-U-;_^ 7~
■ — ~
1_1 7~
_ '_^ — _~+~z: -J 4 - H I : -•-Hi: -+-H z
~ ^ z = ""-+- — ~ _ ~ i _
> | = - " ^ - Z
—i—|ZI f-— _
S o>
I 1
.LIN
G D
IS
. ST
RU
CTI
Q 01
: 7 : 7
-. 7 ■ -
-z\e - i o
•- 1 // : I © : © i
T 7 7 1 j e 7 ©
: © : © 7 j © -' © : ; © i; © i i © :; © 7 ' © - i © 7
7 - \
PLES
2
to
* * * * *
*
*
*
LITHOLOGIC DESCRIPTION
FORAMINIFER AND NANNOFOSSIL MUD and PYRITE-BEARING MUD
Major lithology: foraminifer and nannofossil mud and pyrite-bearing olive gray (5Y 4/2) to dark olive gray (5Y 3/2).
Minor lithologies: 1. phosphatic nodules, 1 - 2 cm in diameter. 2. pyrite-bearing diatomaceous mud (Section 1, 0 - 6 0 cm). 3. f ine-grained volcanic ash, gray (N 5.0/) (Section 2, 110—
SMEAR SLIDE SUMMARY (%):
1 ,30 1,59 1,96 1 ,103 D D D D
TEXTURE:
Sand 5 10 40 — Silt 25 20 25 5 Clay 70 70 35 95
COMPOSITION:
Mica Tr — — — Clay 70 45 35 80 Volcanic glass Tr — — — Calcite/dolomite — 10 20 5 Accessory minerals
Pyrite 10 15 5 10 Gypsum — — — 5
Foraminifers — 10 40 5 Nannofossils — — Tr — Diatoms 15 15 Tr — Radiolarians Tr Tr 5 5 Sponge spicules 5 5 — — Fish remains Tr — — 3
111 cm).
1, 134 D
25 15 60
50 Tr 5
10
— 25 10
Tr
■nud, generally
2 , 5 3 D
20 50 30
5
20 15
— Tr
— 50 10
—
2, 104 D
20 80
Tr
80
— 10
10
— — — —
Information on Core Description Forms, for A L L sites, represents field notes taken aboard ship. Some of this information has been refined in accord with post-cruise findings, but production schedules prohibit definit ive correlation of these forms with subsequent findings. Thus the reader should be alerted to the occasional ambiguity or discrepancy.
679A-1H

SITE 6 7 9 HOLE B CORE 1 H CORED INTERVAL 4 4 0 . 5 - 4 4 7 . 0 mbsl; 0 . 0 - 6 . 5 mbsf
-3
E- R
OCK
"" M
AR
Y
er LU
QU
AT
BIOSTRAT. ZONE/ FOSSIL CHARACTER
AM
INIF
ER
u
<D
(1) a o n X
o
*
NO
FOSS
IL
^ z
o
/. *
§
"
^ fe
tern
(U
_) *
p
>-is
tern
<n - i o *
to
o
"•
a
S.
PRO
PE
" ■
o
u
1
■
•
o
•
» • r
•
1 u>
1
2
J
4
5
CC
w
0 . 5 —
-1 . 0 —
-
-;
;
-----• I
--_ — -
-
GRAPHIC LITHOLOGY
_
"
"
'_ _
--
n ~i
i
i I
i
i
1 ,
" I ,
1 "1
1
1
lA
~ "1
1
" 1 ^
1 ,
1
i. . -_ -_ -_ -_ -
^
_-_-_-_-_"
:-:-:-:-:
-:-:-:-:-:
-_-_—_
:-:-:-:-:-
----------
i
tr
.LIN
G O
IS
u 0 u 1 1 • 1
• 1
i 1 • 1
• 1
1 • 1 1 1
t
s
. ST
RU
CT
"
@ @ @
PLES
" * *
* • ••
*
*
LITH0L0GIC DESCRIPTION
FORAMINIFER- AND NANNOFOSSIL-BEARING MUD and DIATOMACEOUS MUD
Major iithology: foraminifer- and nannofossil-bearing mud and diatomaceous mud, generally olive (5Y 4/3), dark olive gray (5Y 3/2), or very dark gray (5Y 3/1).
Minor lithologies: 1. phosphatic nodules, I -5 cm in diameter, in Section 3. 2. ash-rich diatomaceous mud in two thin turbidite layers, Section 2, 4 7 - 5 5 cm.
SMEAR SLIDE SUMMARY (%):
D D D D D
TEXTURE:
Sand 20 30 5 10 10 Silt 20 15 50 60 10 Clay 60 55 45 30 80
COMPOSITION:
Quartz — — — — 10 Feldspar — — — — Tr Clay 45 55 45 30 80 Volcanic glass — — 5 35 — Accessory minerals
Pyrite 10 5 10 — 5 Amphibole — Tr Tr — —
Foraminifers 15 30 — Tr 5 Nannofossils 20 10 — 35 — Diatoms 10 — 40 — Tr Silicoflagellates Tr — — — —
679B-1H

to SITE 679 HOLE B CORE 2H CORED INTERVAL 447.0-456.5 mbsh 6.5-16.0 mbsf
LITHOLOGIC DESCRIPTION
DIATOM- AND FORAMINIFER-BEARING MUD
Major lithology: diatom- and foraminifer- bearing mud, generally olive gray (5Y 4/2), dark olive gray (5Y 3/2), or black (5Y 2.5/2). Lower two thirds of core shows pronounced lamination, scattered phosphatic nodules, and a few thin (1-2 cm) layers of pale yellow (5Y 8/4) diatom ooze.
SMEAR SLIDE SUMMARY (%):
3, 35 4, 144 6, 85
COMPOSITION:
Quartz Feldspar Rock fragments Clay Volcanic glass Accessory minerals
Amphibole Pyroxene Pyrite
Foraminifers Diatoms Fish remains
5 — —
Tr — 5 —
— 10 —

SITE 679 HOLE B CORE 3H CORED INTERVAL 456.5-466.0 mbsl; 16.0-25.5 mbsf
t z O
IE-R
OC
I 2
>-< z er LU 1— < Z> o
BIOSTRAT. ZONE/ FOSSIL CHARACTER
w
AM
INIF
E
tr o u.
m *
CO
NO
FOSS
I
z
o CM
z z *
co
1
< 11
m *
1 Q
>
rna
a> TO =3 o *
y
3
1
W
£
S.
PRO
F
a
§ o
°
t
" • " •
*>. •
r«
i
q 00
• ■■*■
•
1 o LU CO
1
2
3
4
5
~
6
7
S 3
0 . 5 -
-1 . 0 —
-J
-j
; -I --■
--
; -
:
GRAPHIC LITHOLOGY
_ 1 _
-1-_ 1 _
- L .
_ l _
_ l _ - L . _L_
- U . _ i _
-1-_ l _
_L-_ 1 _
_ i _
_ l _
_ I _
_ l _
_ l _
_ l _
_ l _
-1-_ 1 _
_ 1 _
_ 1 _
_ l _ _J_
_ ] _
_ 1 _
_ 1 _
_ l _ _ 1 _
_ l _
_ 1 _
_ l _
^ x_r -v>"
"
- ~
- 1
-;
^.'. -~_
v j - ;
J;
-v_/-
~ -
i\
. — .
tn Z>
1 5
J j t
| 1 | ♦
to
1
. ST
RU
C
CO
V \ _
© © ^
® ^
© © © © © ©
5 i
< CO
*
*
*
L_
LITH0L0GIC DESCRIPTION
DIATOM- AND FORAMINIFER-BEARING MUD
Major lithology: diatom- and foraminifer-bearing mud, generally olive (5Y 4/3), gray (5Y 4/2), dark olive gray (5Y 3/2), or black (5Y 2.5/2).
Minor lithologies: 1. phosphatic nodules, 0.5-2 cm in diameter. 2. two beds of dolomite, Section 3, 98-99 and 122-123 cm. 3. few thin (0.2-2 cm) layers of pale yellow (5Y 8/4) diatom ooze.
SMEAR SLIDE SUMMARY (%):
1, 124 2, 106 3, 118 M D D
TEXTURE:
Sand 6 0 — 3 Silt 20 40 67 Clay 20 60 30
COMPOSITION:
Quartz 2 Tr — Clay 20 60 30 Volcanic glass 5 Tr 3 Calcite/dolomite — 5 — Foraminifers 5 5 — 5 Nannofossils Tr — Tr Diatoms 18 35 62
olive
I I
cc I

SITE 6 7 9 HOLE B CORE 4H CORED INTERVAL 4 6 6 . 0 - 4 7 5 . 5 mbsl: 2 5 . 5 - 3 5 . 0 mbsf
•-1 I
2
-
V cn
TER
NA
< O O
BIOSTRAT. ZONE/ FOSSIL CHARACTER
M
i
"•
LU Z LU
O _ l
o I o
— CM
*
0)
J 2
2
„_ c
o
c CP en C
*
I0 z
01
CD
*
1 f: 1 a
1-co
CD
|
£ ^ a
u
£
1 11
CO
< £ > ^
8
jj ^ °
CD
•
CO
•
CO
CO
•
•
CO
•
•
Cl
•
o
M
2
3
4
5
6
7
cc
CO
3
:J o-5-j
:j 1 .0—
-- J
-:J
- j
:j
~l. 1 --. -J
J j ■J n
. '-.
- j
: : M
11
11
11
11
11
-_
— -"
--
GR LITh
J~
J~
J"
S~
J~
J-
r ? ^ J~
J~
J-
7~ ^ 7
.s-
.J-
-J-
-^
. - r
L _v U ^ r -
^ L^
L ^ v
CD
3
PHIC 5 0L0GY a
° z —: z —: ~ r i _ : T T T ! _ : 7
i : " 7 :
7 " : _ ^ r
1_1 7"T I
— z •■ — _ _ 7
7-7 Z 7
7 T — 7
= z :
— Z "
Z 7T I ~ ~ _ _ 7 7 7 1 1 7
~ — *
^ 7 7 1
z —: — Z ;;
- i z :
Z H :
= z : 1
7-7 Z 7 1 7-7 i_ i 7 ~ 1 ; :
^ J . T T 1
— z - I E-iz 7-7 Z 7
= = : !
w
1 I CO
©
—
5 0-3E
< CO
*
* *
LITHOLOGIC DESCRIPTION
DIATOM- AND FORAMINIFER-BEARING MUD
Major lithology: diatom- and foraminifer-bearing mud, generally olive (5Y 4/3), olive gray (5Y 4/2), or dark olive gray (5Y 3/2). Upper part of the core has massive mud down to Section 4, 30 cm; lower part of the core shows pronounced lamination.
Minor lithologies: 1. pale yellow nodular dolomite (Section 2, 120 -125 cm). 2. volcanic ash layer (Section 3, 7 0 - 7 2 cm). 3. phosphatic nodule (Section 4, 3 2 - 3 5 cm).
SMEAR SLIDE SUMMARY (%):
3, 72 4, 28 4, 33 M D M
TEXTURE:
Sand — — 10 Silt 70 35 60 Clay 30 65 30
COMPOSITION:
Clay 30 65 30 Volcanic glass 67 5 45 Calcite/dolomite Tr Tr — Accessory minerals 3 5 Tr Foraminifers — — Tr Nannofossils — — Tr Diatoms — 25 25
679B-4H

SITE 6 7 9 HOLE B CORE 5H CORED INTERVAL 4 7 5 . 5 - 4 8 5 . 0 mbsl; 3 5 . 0 - 4 4 . 5 mbsf BI0STRAT. ZONE/ FOSSIL CHARACTER
LITHOLOGIC DESCRIPTION
J-*
w
DIATOMACEOUS MUD
Major lithology: diatomaceous mud, generally olive (5Y 4/3), olive gray (5Y 4/2), dark olive gray (5Y 3/2), or black (5Y 2.5/2). Sporadically well bedded to laminated. Disturbed bedding in Section 2 and top of Section 3. Contains intervals with beds a few centimeters thick, with sharp basal contacts, and basal concentrations of foraminifer shells which grade upward into clay-size sediment.
Minor lithologies: 1. dolomite nodules. 2. ash layers, 2-5-cm thick, gray (5Y 5/1). 3. volcaniclastic sand layers, 2-8-cm thick, dark olive gray (5Y 3/2).
SMEAR SLIDE SUMMARY (%):
2, 110 3, 22 5, 88 6, 17
COMPOSITION:
Quartz Feldspar Rock fragments Mica Clay Volcanic glass Calcite/dolomite Accessory minerals
Gypsum Opaques
Foraminifers Diatoms Sponge spicules Fish remains
— 20 —
— 15 — —
Tr — —

ON SITE 6 7 9 HOLE B CORE 6H CORED INTERVAL 4 8 5 . 0 - 4 9 4 . 5 mbsl; 4 4 . 5 - 5 4 . 0 mbsf
UTHOLOGIC DESCRIPTION
cc
©
e
DIATOMACEOUS MUD
Major lithology: diatomaceous mud, colors vary between dusky yellow green (5GY 5/2), olive gray (5Y 4/2), dark gray (5Y 4/1), olive (5Y 4/3), dark olive gray (5Y 3/2), very dark gray (5Y 3/1), and black (5Y 2.5/1). Small (1-2 cm) phosphate nodules occur in Sections 1, 3, 5, and 6.
SMEAR SLIDE SUMMARY (%):
2, 55 3, 80 5, 80 6, 62
Clay
COMPOSITION:
Quartz Clay Volcanic glass Calcite/dolomite Accessory minerals
Pyrite
Apatite Diatoms Pellets
679B-6H

SITE 679 HOLE B CORE 7H CORED INTERVAL 494.5-504.0 mbsl; 54.0-63.5 mbsf
LITHOLOGIC DESCRIPTION
®
DIATOMACEOUS MUD
Major lithology: diatomaceous mud, colors include olive gray (5Y 4/2, 5Y 5/2), dark olive gray (5Y 3/2), olive (5Y 5/4, 5Y 4/3), pale yellow (5Y 7/3), and black (5Y 2.5/2). Mud is thinly bedded to massive. Mud veins occur in Section 3.
Minor lithologies: 1. Dolomite nodules and thin layers. Colors are pale olive (5Y 6/3, 5Y 6/4) and white. 2. Ash layers, 4-10 cm thick. Colors are pale gray (5GY 4/1) and greenish gray (5BG
SMEAR SLIDE SUMMARY (%):
5, 25 M
TEXTURE:
Sand — Silt 60 Clay 40
COMPOSITION:
Mica Tr Clay 40 Volcanic glass 45 Calcite/dolomite — Accessory minerals 10 Diatoms 5
679B-7HI 1

SITE 6 7 9 HOLE B CORE 8H CORED INTERVAL 5 0 4 . 0 - 5 1 3 . 5 mbsl; 6 3 . 5 - 7 3 . 0 mbsf
LITHOLOGIC DESCRIPTION
<-€
^
S
DIATOMACEOUS MUD
Major lithology: diatomaceous mud. Colors include dark olive gray (5Y 3/2), very dark gray (5Y 3/1), and black (5Y 2.5/2). Mud is thinly bedded to massive. Thin beds are pale olive (5Y 6/4) and olive gray (5Y 4/2). Dewatering vein structure occurs in Sections 2 through 7.
Minor lithologies: 1. dolomite nodules. 2. phosphorite nodules. 3. volcanic ash layer, 2-cm thick, color i: 13-15 cm.
greenish gray (5BG 6/1); Section 6,
SMEAR SLIDE SUMMARY (%):
Clay
COMPOSITION:
Quartz Clay Volcanic glass Accessory minerals
Opaques Apatite
Diatoms
1,85 5,115 6,13
— 100 — 25 — 20

SITE 679 HOLE B CORE 9H CORED INTERVAL 513.5-523.0 mbSh 73.0-82.5 mbsf
LITHOLOGIC DESCRIPTION
CC
DIATOMACEOUS MUD
Major lithology: diatomaceous massive mud, colors include olive (5Y 4/4), dark olive gray (5Y 3/2), and black (5Y 2.5/1). Dewatering vein structure occurs in Sections 3 through 6.
Minor lithologies: dolomite layer, Section 5, 113-121 cm, and Section 6, 70-76 cm.
SMEAR SLIDE SUMMARY (%):
2, 76 5, 93
TEXTURE:
Silt Clay
COMPOSITION:
Quartz Clay Volcanic glass Calcite/dolomite Accessory minerals
Micrite Foraminifers Nannofossils Diatoms Silicoflagellates
M

O SITE 6 7 9 HOLE B CORE 1 OH CORED INTERVAL 5 2 3 . 0 - 5 3 2 . 5 mbsl; 8 2 . 5 - 9 2 . 0 mbsf
LITHOLOGIC DESCRIPTION
//
3,125 4,68 4,95 4,110 5,85 6,130
DIATOMACEOUS MUD
Major lithology: diatomaceous mud, mainly massive; colors include olive (5Y 4/4), dark olive gray (5Y 3/2), and black (5Y 2.5/1). Silty sandy laminae and dewatering vein structures occur throughout. Tensional tectonic features are related to dewatering structures.
Minor lithologies: 1. dolomite layer, Section 1, 3-8 cm, and Section 5, 87-92 cm. 2. volcanic ash layers, 3-25-cm thick, color is greenish gray (5BG 6/1), in Section 2, 0-25 cm, Section 4, 90-115 cm, and Section 7, 29-31 and 82-84 cm.
SMEAR SLIDE SUMMARY (%):
2, 15
TEXTURE:
Sand Silt Clay
COMPOSITION;
Quartz Clay Volcanic glass Calcite/dolomite Accessory minerals
Pyrite Nannofossils Diatoms Sponge spicules Pellets 5 — — —
679B-10H |

SITE
"-R
OC
K U
N
LU
LU O
_ l Q_
CH
5 o _ l
6 7 9 HOLE BIOSTRAT. ZONE/ FOSSIL CHARACTER
MIM
FER
S
* D0
OFO
SSIL
S n
t*
to o
u< CO c
3LA
RIA
NS
* ro o
o> CO c
1
* n N
m
urn
Q) C
Gonio
t
B
2
" ■
. PR
OPE
RT
ISTR
Y
u
CORE 10H
ON
" 8 cc
-
CORED INTERVAL
GRAPHIC LITHOLOGY
— — -U H :
CD
.ING
DI
STUF
o
STRU
CTUR
E
" 0
LES
5 2 3 . 0 - 5 3 2 . 5 mbsl; 8 2 . 5
LITHOLOGIC DESCRIPTION
- 9 2 . 0 mbsf
SITE 6 7 9 HOLE CORE 1 1H CORED INTERVAL 5 3 2 . 5 - 5 4 2 . 0 mbsl; 9 2 . 0 - 1 0 1 . 5 mbsf
TIM
E-R
OC
K
UN
IT
LOW
ER
P
LIO
CE
NE
BIOSTRAT. ZONE/ FOSSIL CHARACTER
FOR
AM
INIF
ERS
CO
*
NA
NN
OFO
SSIL
S
CD
*
RA
DIO
LAR
IAN
S *
ins
ign
ific
an
t D
IAT
OM
S
* T
. p
rae
oe
stru
pii
Zon
e
PALE
OM
AG
NET
ICS
PH
YS
. PR
OPE
RTI
ES
CH
EMIS
TRY/
CaC
Oj
• 1
.3
SEC
TIO
N
1
2
MET
ERS
0 . 5 -
1 . 0 -
GRAPHIC LITHOLOGY
i D
RIL
LIN
G
DIS
T
c c
SE
D.
STRU
CTUR
ES
UUUJ
//
SAM
PLES
*
*
LITHOLOGIC DESCRIPTION
DIATOMACEOUS MUD
Major lithology: diatomaceous mud, black (5Y 2.5/1). Dewatering vein structure occurs throughout.
Minor lithology: ashy mud in Section 2.
SMEAR SLIDE SUMMARY (%):
1 ,59 2 , 2 1 D D
TEXTURE:
Sand 25 — Silt 60 20 Clay 15 80
COMPOSITION:
Quartz 10 5 Rock fragments 10 — Clay 15 70 Volcanic glass 10 — Calcite/dolomite 5 5 Accessory minerals 5 — Diatoms 45 20
NJ
679B-10H 8 679B-11H
!5— ■ L (/""""iH
£, <3™*]^(
S O ^ %# %j fljl
45—' 5 0 -; l C(.
l «
T O - : ■' 7 5 -8 0 -
0 0 -9 5 -00—t 05-U0-1 1 D ~™t
2 0 -t D"™i
3 0 -3 5 J
4 0 -4 5 - .
, 5
20 25 30 35-40-
I 45* ■i v w *
55-BOBS-70-75-80-85-
: so-I 95-I 100-: 105-I no-I 115-I 120-
I L O "
; !3o-: 135-I 140-: 145-
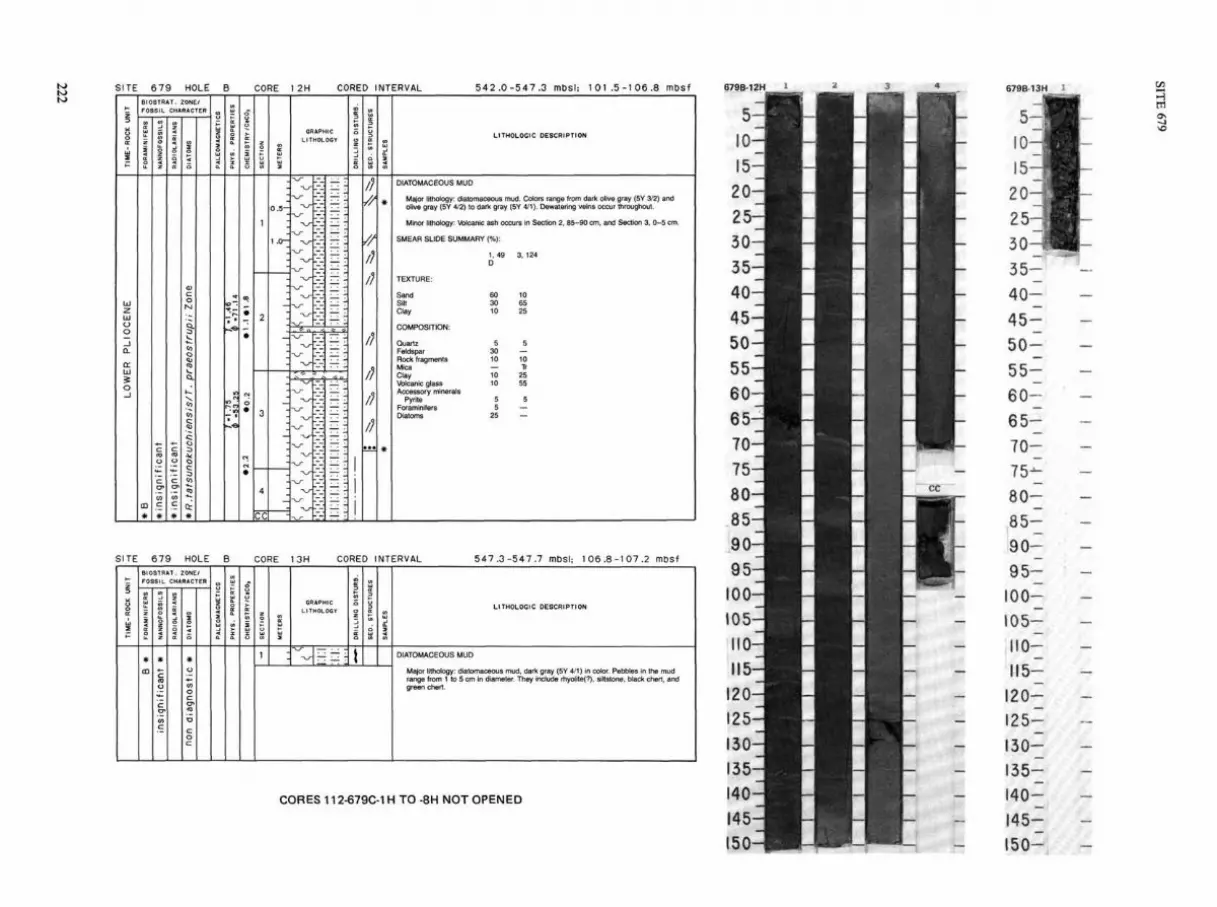
SITE 6 7 9 HOLE B CORE 1 2H CORED INTERVAL 5 4 2 . 0 - 5 4 7 . 3 mbsl: 1 0 1 . 5 - 1 0 6 . 8 mbsf
LITHOLOGIC DESCRIPTION
CO
DIATOMACEOUS MUD
Major lithology: diatomaceous mud. Colors range from dark olive gray (5Y 3/2) and olive gray (5Y 4/2) to dark gray (5Y 4/1). Dewatering veins occur throughout.
Minor lithology: Volcanic ash occurs in Section 2, 85-90 cm, and Section 3, 0-5 cm.
SMEAR SLIDE SUMMARY (%):
1,49 3,124 D
TEXTURE:
Sand Silt Clay
COMPOSITION:
Quartz Feldspar Rock fragments Mica Clay Volcanic glass Accessory minerals
Pyrite Foraminifers Diatoms
SITE 679 HOLE B CORE 1 3H CORED INTERVAL 5 4 7 . 3 - 5 4 7 . 7 mbsl; 1 0 6 . 8 - 1 0 7 . 2 mbsf
TIM
E-R
OC
K
UN
IT BI0STRAT. ZONE/
FOSSIL CHARACTER
FOR
AMIN
IFER
S
* CD
NAN
NO
FOSS
ILS
insi
gnifi
cant
*
RA
DIO
LAR
IAN
S
DIA
TOM
S no
n di
agno
stic
*
PA
LEO
MA
GN
ETI
CS
PH
YS
. PR
OPE
RTI
ES
CH
EM
ISTR
Y/C
aCO
j
SE
CTI
ON
1
ME
TER
S
GRAPHIC LITHOLOGY
^ H : ;
DR
ILLI
NG
D
ISTU
RB
.
1
SE
D.
STR
UC
TUR
ES
SA
MP
LES
LITHOLOGIC DESCRIPTION
DIATOMACEOUS MUD
Major lithology: diatomaceous mud, dark gray (5Y 4/1) in color. Pebbles in the mud range from 1 to 5 cm in diameter. They include rhyolite(?), siltstone, black chert, and green chert.
CORES 112-679C-1 H TO -8H NOT OPENED
679B-13H
5 20 25 30^ 35-40~ 45-50-55 :
60~ 65-70™ 75-80™ 85-BOSS-
100-105-110-115-
120-
130-135-140-145-

SITE 6 7 9 HOLE D CORE 1 H CORED INTERVAL 4 3 9 . 5 - 4 4 7 . 4 mbsl; 0 . 0 - 7 . 9 mbsf
LITHOLOGIC DESCRIPTION
DIATOM- AND FORAMINIFER-BEARING MUD
Major lithology: diatom- and foraminifer-bearing mud, generally olive (5Y 6/4), olive gray (5Y 5/2), dark olive gray (5Y 3/2), or black (5Y 2.5/1). Mainly massive to locally thinly bedded.
Minor lithologies: 1. phosphatic nodules, 1 -5 cm in diameter, in Section 1. 2. gypsum blades throughout.
SMEAR SLIDE SUMMARY (%):
1,21 1,101 2,5 2,21
Clay
COMPOSITION:
Quartz Clay Accessory minerals
Gypsum Pyrite
Foraminifers Nannofossils Diatoms Silicoflagellates Fish remains
t o
679D-1H

SITE 679 HOLE CORE 2H CORED INTERVAL 447.4-456.9 mbsl; 7.9-17.4 mbsf
N"
CC
©
©
©
LITHOLOGIC DESCRIPTION
DIATOM- AND FORAMINIFER-BEARING MUD
Major lithology: diatom- and foraminifer-bearing mud, generally massive to thinly bedded. Colors are gray (5Y 5/1) and dark olive gray (5Y 3/2) to black (5Y 2.5/1). Diatom ooze occurs in lenses.
Minor lithologies; 1. phosphatic nodules.
2. gypsum as fine-bladed crystals i
SMEAR SLIDE SUMMARY (%):
2, 70
Sections 4 and 6.
Sand SHI Clay
COMPOSITION:
Quartz Feldspar Rock fragments Clay Volcanic glass Calcite/dolomite Accessory minerals
Apatite Pyrite
Foraminifers Diatoms
3, 25 3, 58 3, 61
5 — —
40 — —
Tr — —

SITE 6 7 9 HOLE CORE 3H CORED INTERVAL 4 5 6 . 9 - 4 6 6 . 4 mbsl; 1 7 . 4 - 2 6 . 9 mbsf
IE-R
OC
K
UN
IT
2
>-er < er UJ t -< 3 O
BIOSTRAT. ZONE/ FOSSIL CHARACTER
AM
INIF
ER
S
o: o l i -
0 0
IK
NO
FOSS
ILS
z
z
N20
2
#
lOLA
RIA
NS
a
roM
s
-o
>• v -n> c L-
uate
a *
EOM
AGNE
TICS
1
S.
PRO
PERT
IES
X a
o o —
<">.«> 1 ■
H 6
CO
■1 .
24
•66.
3
r * *
r^
. - C O
^
r^ — O)
°^tf) — 00
"
(N
° Hco
!-*
2
X
O)
~ • • r^ r-
-. C5
i 22
.8 <
* t o
• o o e c ^ r -
o o - o •
<q
•
r*
» •
o
•
TIO
N
*
1
2
3
4
5
6
7
CC
ERS
2
: _ -0.5—
1 . 0 -
-:
I -"
: : -
; -
GRAPHIC LITHOLOGY
^ _Vy" \J~
" W
-v-■ V
-v_/~
" v y
-v^-
" V
- \ - r
" V
"/~ "\„r
V
V
V "
; . ' ■ . • "
• ■ ■ : ,
■ : • . • :
; : ■ : • ■
' : • :■:■
■
r ' ■ ;
■ :
■ •
ft : ■ ■ : •
• ■ ; > .
ft ; : ■ : :■
ft ; : ■ : >
:■■..■
. - . - . ■
ft ft
v ■\J-
V ■ v
v V v
k3" - w
"<-r
V
V
V
- "
ft. % ,
K 1 ft'
ft:
: •:•:•: ;'.••:>: :••./ v.':
ft ■:.■'.
. ft ft. .■■■
..'. ft ■
■ "
K J J _
.LIN
G D
ISTU
RB
Q
J
. ST
RU
CTU
RES
(0
~n-
e ©
8 ©
©
PLES
2
CO
*
*
IW K V E
LITH0L0GIC DESCRIPTION
DIATOM- AND FORAMINIFER-BEARING MUD
Major lithology: diatom- and foraminifer-bearing mud. Colors range from olive (5Y 4/3) to dark olive gray (5Y 3/2). Mud is thinly bedded to laminated.
Minor lithologles: 1 . phosphatic nodules, Sections 4 - 7 . 2. thin bed of foraminifer sand, Section 3, 4 - 5 cm.
SMEAR SLIDE SUMMARY (%):
1, 47 1, 81 M M
TEXTURE:
Sand 10 70 Silt 40 15 Clay 50 15
COMPOSITION:
Clay 50 10 Volcanic glass — Tr Calcite/dolomite 10 20 Foraminifers — 70 Diatoms 40 —
679D-3H

to ON
S I T E 6 7 9 HOLE CORE 4 H CORED I N T E R V A L 4 6 6 . 4 - 4 7 5 . 9 m b s l ; 2 6 . 9 - 3 6 . 4 m b s f
LITHOLOGIC DESCRIPTION
8
VOID |-^ 111-
©
DIATOM- AND FORAMINIFER-BEARING MUD
Major lithology: diatom- and foraminifer-bearing mud, generally dark olive gray (5Y 3/2), very dark gray (5Y 3/1), or black (5Y 2.5/2).
Minor lithologies: 1. phosphatic nodules in Sections 2-7. 2. few thin (0.2-2 cm) layers of pate yellow (5Y 8/4) diatom ooze.
SMEAR SLIDE SUMMARY (%):
1,20 2,90 6,100
Sand Silt Clay
COMPOSITION:
Quartz Feldspar Rock fragments Clay Volcanic glass Calcite/dolomite Accessory minerals
Pyrite Gypsum
Foraminifers Diatoms

SITE 6 7 9 HOLE CORE 5H CORED INTERVAL 4 7 5 . 9 - 4 8 5 . 4 mbsl; 3 6 . 4 - 4 5 . 9 mbsf
LITHOLOGIC DESCRIPTION
DIATOMACEOUS MUD and SAND
Major lithologies: diatomaceous mud, generally olive (5Y 4/3) to olive gray (5Y 4/2). Gray (5Y 4/1) sand.
Minor lithologies: 1. phosphatic nodules; Section 1, 50-60 cm. 2. foraminiferal sandy silt, olive (5Y 5/3); Section 1, 64-73 cm. 3. volcanic ash layer, olive gray (5Y 4/2); Section 3, 87-92 cm.
1,55 1,70 1,110 3,90
SMEAR SLIDE SUMMARY (%):
TEXTURE;
Sand Silt Clay
COMPOSITION:
Quartz Rock fragments Clay Volcanic glass Calcite/dolomite Accessory minerals Foraminifers Nannofossils Diatoms Silicoflagellates
1, 40 D
_ 35 65
Tr
— 65
— Tr Tr
— Tr 35
—
50 — —
679D-5H

oo SITE 6 7 9 HOLE D CORE 6H CORED INTERVAL 4 8 5 . 4 - 4 9 4 . 9 mbsl; 4 5 . 9 - 5 5 . 4 mDSf
LITHOLOGIC DESCRIPTION
CC
//
®
DIATOMACEOUS MUD
Major lithology: diatomaceous mud, generally olive (5Y 4/4, 5Y 5/4) and dark olive gray (5Y 3/2); mostly massive with thin yellow (5Y 8/8) layers in Sections 1, 3, and 4.
Minor lithologies: 1. ash layer, greenish gray (5BG 5/1); Section 1, 63-65 cm. 2. phosphate nodules, 0.5-10-cm diameter. 3. dolomite layers, 1 -7-cm thick.
SMEAR SLIDE SUMMARY (%):
2, 55 4, 55
Clay
COMPOSITION:
Quartz Clay Calcite/dolomite Accessory minerals
Opaques Micrite
Nannofossils Diatoms
679D-6H

SITE 6 7 9 HOLE D CORE 7H CORED INTERVAL 4 9 4 . 9 - 5 0 4 . 4 mbSl; 5 5 . 4 - 6 4 . 9 mbsf
Joo
— 03
© © /j © © I // ll
// •i
/ /
//_
I I 7/ // il
cc
LITHOLOGIC DESCRIPTION
DIATOMACEOUS MUD AND OOZE
Major lithology: diatomaceous mud and ooze, colors are generally olive gray (5Y 4/2), olive (5Y 4/3), and very dark gray (5Y 3/1). Sections 5 and 6 contain alternating dark olive gray (5Y 3/2) and olive (5Y 5/4) layers. Dewatering veins and microfaults occur throughout the core.
Minor lithologies: 1. breccia consisting of phosphate nodules and angular clasts of dolomite in a black (5Y 2.5/1) matrix; Section 1, 0-40 cm. 2. thin (1-10 cm) dolomite layers in Sections 1, 2, and 5.
SMEAR SLIDE SUMMARY (%):
3, 59 3, 60 5, 70 CC, 9
Clay
COMPOSITION:
Quartz Clay Calcite/dolomite Accessory minerals
Phosphate Foraminifers Diatoms Sponge spicules Silicoflagellates
to

SITE 6 7 9 HOLE D CORE 8H CORED INTERVAL 5 0 4 . 4 - 5 1 3 . 9 mbsl: 6 4 . 9 - 7 4 . 4 mDSf
2 3
IE-R
OC
K
LLI 2 LLI O O _l Q. tr LU 5 o _i
BIOSTRAT. ZONE/ FOSSIL CHARACTER
m
AM
INIF
ER
""
*
".
I z
< *
lO T —
-z. ■z.
lO
z 1
w
j a
< IT
_
I -□
£ CO o c
f c o c
to
-
0.
r 1 s I CO >-X 0-
»» "s 7™ -*
,_
1 .2
5 B
3.1
* < 77 **
^ ^
i
°
CT
•
•» •
q
•
1 o U 0)
1
2
3
4
5
6
CC
K
2
-0 . 5 -
-1 . 0 -
"
"
"
\
':
-
GRAPHIC LITHOLOGY
^ r %: "v-/* 7 " * ■ ;
.: \j- -
~\. ~ -S"'-
"w"' L ~\_ L
" W ~ -\_ 7
- ^ 7
~Ky~ I 7 7
~ ^ 7 \J- -
- ^ 7 ~ W ■
■ v :
-V.7
~ ^ 7
-\_/- -- ^ 7
7
^ . 1
-r : ■ w -
-\~ 7
~ : ■ v . '
~*~: - ^ 7
7
"^-r 7
_^_7
v :
""\. 7
■ ^ :
r r _ ^ r LJ. 7
13 r ~ _ - - 7 1 _ 7
■ ; 7
7~7 -7~7 .1 _— I.
0-
—: I
— -— 7
~-_ n -— ■-
— ~~ — 7
-1 7
0" H I 7 T L
L-L 7 — 7
=7-1
— I
E" ~ i 7-f I ^ J . 7
rr I
H I
Or
1 1 5
1 -K Q
3< 1 1
!
2 3
IX
W
/;
© fm y y
//
7/
1 ©
// © /)
//
1 //
J 7/ I © l /;
7/ T //
i 3
< CO
*
*
LITH0L0GIC DESCRIPTION
DIATOMACEOUS MUD Major lilhology: diatomaceous mud, generally very dark gray (5Y 3/1) and black (5Y 2.5/1), with intervals of interlayered olive and dark olive gray (5Y 5/4, 5Y 3/2). Core is massive to thinly bedded to laminated; laminations are especially well developed In Sections 4 and 5. Some laminations are concentrations of foraminifer shells, others are pale yellow (5Y 8/4) diatom oozes. Well-developed dewatering veins and microfaults occur in Sections 1 -5 and in parts of Section 6.
Minor lithologies: 1. dolomite breccia: clasts of dolomite in matrix of very dark gray (5Y 3/1) diatomaceous mud, Section 1, 0-28 cm. Possibly a drilling breccia. 2. dolomite layers, 1-10-cm thick, commonly (drilling?) brecciated.
SMEAR SLIDE SUMMARY (%):
4, 20 4, 94 M D
TEXTURE:
Silt — 30 Clay 100 70
COMPOSITION:
Quartz — 5 Clay — 60 Calcite/dolomite — 5 Accessory minerals
Micrite 100 — Phosphate Tr —
Foraminifers Tr Tr Diatoms — 30 Silicoflagellates — Tr

SITE 6 7 9 HOLE CORE 9H CORED INTERVAL 5 1 3 . 9 - 5 2 3 . 4 mbsl; 7 4 . 4 - 8 3 . 9 mbsf
LITHOLOGIC DESCRIPTION
EC
VOID
I)
VA /J // \
/)
/J
© il
//
DIATOMACEOUS MUD AND OOZE
Major lithology: diatomaceous mud and ooze. Colors are black (5Y 2.5/1) and olive (5Y 4/2) with numerous thin laminae of pale yellow (5Y e/4) diatom ooze and laminae of concentrated foraminifers. Laminae and thin beds occur throughout the core, as do dewatering vein structures and microfaults.
Minor lithologies: 1. dolomite layers, 1-2 cm thick; Section 3, 79-80 cm, and Section 4, 130-132 cm. 2. ash layers, greenish gray (5BG 5/1); Section 4, 128-130 cm, and Section 6, 23-33 and 90 cm.
SMEAR SLIDE SUMMARY (%):
3, 4 5, 29 6, 30
Clay
COMPOSITION:
Quartz Feldspar Rock fragments Clay Volcanic glass Calcite/dolomite Accessory minerals Foraminifers Diatoms Sponge spicules
— Tr —
NJ
679D-9H 1

SITE 679 HOLE D CORE 10H CORED INTERVAL 523.4-532.9 mbsl; 83.9-93.4 mbSf
LITHOLOGIC DESCRIPTION
? * V « V //'<:"
//
DIATOMACEOUS MUD
Major lithology: diatomaceous mud, black (5Y 2.5/1); massive to well laminated, with interlaminations of lightly colored, diatom-rich mud or ooze. Dewatering veins (both vertical and horizontal) occur throughout the core, and microfractures are sporadically present. A subvertical fracture filled by volcanic ash occurs from 15 fo 32 cm in Section 4.
Minor lithologies: 1. phosphate nodules; Section 2, 30 cm, Section 3, 82 cm, and Section 4, 105-108 cm. 2. sand, greenish gray (5GY 4/1), in layers up to 10-cm thick; Section 3, 55-65 cm, Section 4, 110-120 cm, and CC; with abundant volcanic rock fragments. 3. volcanic ash, greenish gray (5BG 5/1), up to 20-cm thick; Section 1, 130-150 cm, and Section 3, 77-78 cm.
SMEAR SLIDE SUMMARY (%):
1,145 3,62 3,78 4,114 CC, 18
COMPOSITION:
Quartz Feldspar Rock fragments
(volcanic) Clay Volcanic glass Calcite/dolomite Accessory minerals
Opaques Foraminifers Diatoms
CC

SITE 679 HOLE D CORE 11H CORED INTERVAL 532 .9-542 .4 .mbsl; 93.4-102.9 mbsf
LITHOLOGIC DESCRIPTION
DIATOMACEOUS MUD
Major lithology: diatomacsous mud, dark olive gray (5Y 3/1, 5Y 3/2), olive (5Y 4/3, 5Y 5/3), dark gray (5Y 4/1), and olive gray (5Y 5/2) with thin diatom-rich laminae which are pale olive (5Y 6/4). Massive to laminated; some laminae have sharp lower contacts. Dewatering veins and microfractures are sporadically present in the core; they are particularly prominent in the lower part of Section 2 and in Sections 3 and 5.
i muddy matrix; Minor lithologies: 1. drilling breccia with phosphate nodules and pieces of dolomite i Section 1, 0-18 cm. 2. phosphatic breccias with coarse nodules above sharp, scoured contact; Section 2, 100-110 cm; Section 4, 20-30 cm, and 128-132 cm. 3. dispersed small phosphate nodules; Section 4, 132-150 cm. 4. sandy mud, very dark gray (5Y 3/1) in disturbed layer; Section 6, 45-69 cm.
SMEAR SLIDE SUMMARY (%):
1,25 4,59 6,44 CC, 15
Clay
COMPOSITION:
Quartz Feldspar Mica Clay Volcanic glass Calcite/dolomite Accessory minerals Foraminifers Diatoms Pellets
to
679D-11H

SITE 679 HOLE CORE 12H CORED INTERVAL 542.4-543.9 mbsl; 102.9-104.4 mbsf
TIM
E-R
OC
K
UN
IT
LOW
ER
P
LIO
CE
NE
/UP
PE
R M
IOC
EN
E
BIOSTRAT. ZONE/ FOSSIL CHARACTER
FOR
AM
INIF
ERS
m *
NA
NN
OFO
SSIL
S
CD *
RA
DIO
LAR
IAN
S
DIA
TOM
S *T
. pra
eoest
rupii
Zon
e
5
PH
YS
. PR
OPE
RTI
ES
cor
A*
1 1 1 SE
CTI
ON
1
2
££
MET
ERS
0.5-
1 .0-
\
GRAPHIC LITHOLOGY
VOID
-E
DR
ILLI
NG
DIS
TUR
B.
bo
oo
xx
SEO
. ST
RU
CTU
RES
SAM
PLES
LITHOLOGIC DESCRIPTION
DOLOMITE, PHOSPHORITE, VOLCANIC ROCK, SAND, SANDSTONE, and MUD
Major lithology: fragments of dolomite, phosphorite, and volcanic rocks in Section 1, 0-22 cm. Sand, gray (5Y 5/1), finely laminated at upper contact; lower part contains coarse sand and disseminated pebbles; in Section 1, 22-40 cm. Fine sandstone, very dark gray (5Y 3/1), hard, calcite-cemented, in Section 1, 40-44 cm. Sandy pebbly mud, dark olive gray (5Y 3/2), in Section 1, 44-80 cm. Extremely disturbed mud, with irregular blebs of olive gray (5Y 5/2) mud, gray mud (5Y 5/1), dark gray sand (5Y 4/1), and foraminifer-rich sand, in Section 2, 0-53 cm, to CC.
SITE 679 HOLE CORE 13X CORED INTERVAL 543.9-553.4 mbsl; 104.4-113.9 mbsf
LITHOLOGIC DESCRIPTION
CC
DIATOMACEOUS MUD
Major lithology: diatomaceous mud, dark olive (5Y 3/3), very dark gray (5Y 3/1), and olive gray (5Y 4/2). Silty to sandy, in places foraminifer-bearing with sparse, small dolomite nodules; massive, thinly bedded, or laminated.
SMEAR SLIDE SUMMARY (%):
1,14 1,22 1,42 1,51 1,136 2,16 CC, 21
TEXTURE:
Sand Silt Clay
COMPOSITION:
Quartz Feldspar Rock fragments Clay Volcanic glass Calcite/dolomite Dolomite Accessory minerals
Amphibole Gypsum Micrite
Foraminifers Nannofossils Diatoms Sponge spicules
Tr — — — 5 5 — — — — — 5
Tr — — — 50 40 40 50 — — — Tr
45
Tr Tr
Tr Tr
5
— 50 Tr
Tr Tr
Tr
10 Tr
40
-
— 10
— 40
-
— — — 60
Tr 5
Tr
15 Tr
35
-
5
— — 35
679D-12H 679D-13X

SITE 6 7 9 HOLE CORE 1 4X CORED INTERVAL 5 5 3 . 4 - 5 6 2 . 9 mbsl; 1 1 3 . 9 - 1 2 3 . 4 mbs
LITHOLOGIC DESCRIPTION
CC
6
@>
DIATOMACEOUS MUD
Major lithology: diatomaceous mud, dark olive gray (5Y 3/2), silty to sandy, foraminifer-bearing with thin laminae which are diatom-rich. Faintly bedded to massive. Phosphate nodules (Section 1, 61-62 cm and Section 2, 62-63 cm; latter also has small dolomite nodules). Some thin layers of sandy feldspathic silt.
SMEAR SLIDE SUMMARY (%):
1,29 2,44 2,117
Sand Silt Clay
COMPOSITION:
Quartz Feldspar Rock fragments Mica Clay Volcanic glass Calcite/dolomite Accessory minerals Foraminifers Diatoms Sponge spicules
SITE
TIM
E-R
OC
K
UN
IT
UP
PE
R
MIO
CE
NE
6 79 HOLE
B I 0 S T R A T . ZONE/ FOSSIL CHARACTER
FOR
AM
INIF
ERS
CD *
NANN
OFO
SSIL
S
CD *
RA
DIO
LAR
IAN
S
DIA
TOM
S
*D.
hu
ste
dtii
Zo
ne
PALE
OM
AG
NET
ICS
D
PH
YS
. PR
OPE
RTIE
S
O
00
2
CORE
SEC
TIO
N
1
CO
MET
ERS
0.5—
1 .0—
15X CORED INTERVAL 5 6 2 . 9 - 5 7 2 . 4 mbsl; 1 2 3 . 4 - 1 3 2 . 9 mbsf
GRAPHIC LITHOLOGY
^
DR
ILLI
NG
DIS
TUR
B.
XX
OO
O—
SE
D.
STRU
CTUR
ES
SAM
PLES
LITHOLOGIC DESCRIPTION
DIATOMACEOUS MUD
Major lithology: diatomaceous mud, olive gray (5Y 4/2), silty, foraminifer-bearing, with widely dispersed, small (2-4 mm) dolomitic and phosphatic nodules. Laminations occur in Section 1, 10-30 cm, and in CC, 5-10 cm.
f 679D-14X 679D-15X i

SITE 679 HOLE D CORE 16X CORED INTERVAL 572.4-581.9 mbsl; 132.9-142.4 mbsf
TIM
E-R
OC
K
UN
IT
UPPE
R M
IOC
ENE
B I O S T R A T . Z O N E /
F O S S I L C H A R A C T E R
FOR
AM
INIF
ERS
* CD
NA
NN
OFO
SSIL
S
* CD
RA
DIO
LAR
IAN
S C
osci
nodi
scus
plic
atus
Zo
ne
* D
IATO
MS
3
PH
YS
. PR
OPE
RTI
ES
CH
EMIS
TRY
/CaC
Oj
SEC
TIO
N
CC
MET
ERS
:
G R A P H I C
L I T H O L O G Y
DR
ILLI
NG
D
ISTU
RB
.
1 • 1
SE
D.
STR
UC
TUR
ES
SAM
PLES
*
L I T H O L O G I C D E S C R I P T I O N
DIATOMACEOUS FELDSPATHIC SILT
Major lithology: diatomaceous feldspathic silt, very dark gray (5Y 3/1).
SMEAR SLIDE SUMMARY (%):
CC, 18 D
TEXTURE:
Silt 60 Clay 40
COMPOSITION:
Quartz 20 Feldspar 40 Rock fragments 5 Volcanic glass 5 Calcite/dolomite 5 Accessory minerals
Glauconite 5 Pyrite 5
Diatoms 15
SITE 679 HOLE D CORE 17X CORED INTERVAL 5 8 1 . 9 - 5 9 1 . 4 mbsl; 1 4 2 . 4 - 1 5 1 . 9 mbsf
§ ?!
IE-
R0(
B I O S T R A T . Z O N E /
F O S S I L C H A R A C T E R
to
£
5
^
CD
*
<o
i 8
1 2
< 2
CD *
5
! Q
< et
roM
S
°
« u
EOM
AGI
" ■
£ 1
I0
>-X a.
£ 5* _ - r -
^
y
MIS
TR-i
r u
D ^ ■».«!
o o s
I U
1
1
2
CC
ERS
2
0.5—
1 .0—
-_
J
G R A P H I C
L I T H O L O G Y
v
->_/-
" Y - r
V
V/" __
= ™
l Q
\\ ■
l\ I |
1
;1
M
1 £ E
<n
e ©
PLES
2
HI
* O G
K V E
I W
*
L I T H O L O G I C D E S C R I P T I O N
DIATOMACEOUS MUD AND OOZE
Major lithology: diatomaceous mud and ooze, dark olive gray (5Y 3/2), silty and sandy; contains small (up to 3-cm diameter) black phosphate nodules and peloids in Section 1, 7-52 cm.
SMEAR SLIDE SUMMARY (%):
1, 110 2, 42 D D
TEXTURE:
Sand 10 10 Silt 50 50 Clay 40 40
COMPOSITION:
Quartz 10 5 Feldspar 30 15 Rock fragments 5 — Volcanic glass 5 Tr Calcite/dolomite 5 5 Accessory minerals
Glauconite 5 5 Pyrite Tr Tr Gypsum Tr Tr
Foraminifers — Tr Diatoms 40 70
679D-16X 679D-17X i
4 5 -5 0 -55—
mZ
7 0 -
< : ' V 4 * » V -~
85-
95™ 100™ 105-110-115-
)20~ 125-130-150"
140-
150-

SITE 6 7 9 HOLE CORE 18X CORED INTERVAL 5 9 1 . 4 - 6 0 6 . 9 mbsl; 1 5 1 . 9 - 1 6 1 . 4 mbsf
LITHOLOGIC DESCRIPTION
CC
©
DIATOMACEOUS MUD
Major lithology: diatomaceous mud, very dark gray (5Y 3/1), dark olive gray (5Y 3/2). Silty, with thin interlayers of diatomaceous silt and mainly massive. Thin bedding and laminations in the lower part of Section 3 and in CC. Scattered small dolomitef?) and phosphate nodules.
SMEAR SLIDE SUMMARY (%):
1, 53 1,126 2,38 3,48
TEXTURE:
Sand Silt Clay
COMPOSITION:
Quartz Feldspar Rock fragments Clay Dolomite rhombs. Dolomite Accessory minerals
Pyrite Amphibole Apatite
Foraminifers Diatoms Radiolarians Fish remains Pellets
— 15 — —
— — — 100
SITE 679 HOLE CORE 19X CORED INTERVAL 6 0 0 . 9 - 6 1 0 . 4 mbsl; 1 6 1 . 4 - 1 7 0 . 9 mbsf
LITHOLOGIC DESCRIPTION
DIATOMACEOUS MUD AND OOZE
Major lithology: diatomaceous mud and ooze, dark olive gray (5Y 3/2), silty and sandy. Mostly laminated to cross-laminated. Sparse, widely dispersed, small (1-3-mm diameter) dark brown (7.5 YR 4/4) to gray (5Y 6/1) phosphate nodules.
SMEAR SLIDE SUMMARY (%):
1,77 2,26 2,112
Clay
COMPOSITION:
Quartz Clay Volcanic glass Calcite/dolomite Accessory minerals
Gypsum Foraminifers Diatoms Sponge spicules
Tr — —
679D-18X: 1 2 3

SITE 6 7 9 HOLE D CORE 20X CORED INTERVAL 6 1 0 . 4 - 6 1 9 . 9 mbsl; 1 7 0 . 9 - 1 8 0 . 4 mbsf
UN
IT
IE-
RO
CK
2
LU 2 LU O O
i er
UPPE
BIOSTRAT. ZONE/ FOSSIL
0)
i o
"
GD
*
to
J z
« z
03
*
_
CHARACTER
lOLA
RIA
N!
a
< i
_
roM
s
< a
£ O (S1
._ c
1 s •1 *
_
s
EOM
AGNE
1
1
RTI
E!
S.
PRO
PE
a
cn CO" ■ft GO
7 " f *
o
MIS
TRY
/C
LI I O
s$ qcq o o *8
TIO
N
<o
1
2
C£
| c u 2
I
; 0.5—
" " 1 .0-;
--; .
GRAPHIC LITHOLOGY
^J-
■\. '•.'•V.:
_ ■v.
L-L :
r-. I 7"T 1
TT . ■ ■ 7
: _ : T
rr I
" - f i
TURB
.L
ING
DIS
a 5
<*> _L 4 V
i
JRES
.
STR
UC
TI
"
PLES
2 c/>
* OG IW
LITHOLOGIC DESCRIPTION
DIATOMACEOUS MUD and MUDDY TO SANDY SILT
Major lithology: diatomaceous mud, dark gray (5Y 4/1) and dark olive gray (5Y 3/2). Silty and sandy; contains dispersed, small, black to brown phosphate nodules. Muddy to sandy silt, dark olive gray (5Y 3/2), feldspathic.
SMEAR SLIDE SUMMARY (%):
1, 98 D
TEXTURE:
Sand 70 Silt 20 Clay 10
COMPOSITION:
Quartz 10 Feldspar 30 Rock fragments 35 Clay 10 volcanic glass Tr Calcite/dolomite 5 Accessory minerals
Pyroxene Tr Amphibole Tr
Foraminifers 5 Diatoms 5
SITE 6 7 9 HOLE D CORE 21X CORED INTERVAL 6 1 9 . 9 - 6 2 7 . 9 mbsl; 1 8 0 . 4 - 1 8 8 . 4 IDbSf
TIM
E-R
OC
K
UN
IT B IOSTRAT. ZONE/
FOSSIL CHARACTER
tr
|
* CD
NA
NN
OFO
SSIL
S
* CD
RA
DIO
LAR
IAN
S
DIA
TOM
S
z
2
PH
YS
. PR
OPE
RTI
ES
CH
EMIS
TRY/
CaC
Oa
SEC
TIO
N
CC
MET
ERS
GRAPHIC LITHOLOGY
v IU:-?:
DR
ILLI
NG
DIS
TUR
B.
¥
SED
. ST
RU
CTU
RES
SAM
PLES
LITHOLOGIC DESCRIPTION
SILTY DIATOMACEOUS MUD
Major l ithology: drilling breccia of fragments of silty diatomaceous mud, very dark gray (5Y 3/1).
679D-21X CC
5 I0 15 20
40--4 5 -5 0 -5 5 -6 0 -6 5 -7 0 -7 5 -8 0 -8 5 -9 0 -95™
100™ 105-110—-115-
125-, 3 0 Z 135-140-145-150-
s

SITE
UN
IT
I SS
679 HOLE BIOSTRAT. ZONE/ FOSSIL CHARACTER
m
AM
INIF
ER
* 03
m
NO
FOSS
IL
* CD
lOLA
RIA
N
roM
S
* o
CO o
._ c o c
"
3 o
a
D
RTI
E!
S.
PRO
PE 8
MIS
TRY
/C
u
CORE
TI O
N
u>
cc
ERS
22X CORED INTERVAL 6 2 7 . 9 - 6 3 7 . 4 mbSl; 1 8 8 . 4 - 1 9 7 . 9 mbsf
GRAPHIC LITHOLOGY
TURB
.L
ING
DIS
a
tr
. ST
RU
CT
" • v
PLES
UJ
*
LITHOLOGIC DESCRIPTION
SILTY SAND and SILTSTONE
Major lithology: silty fine sand, black (5Y 2.5/2); CC, 0-8.5 cm. Siltstone, hard, calcite-cemented, faintly laminated, black (5Y 2.5/2); CC, 8.5-19 cm.
SMEAR SLIDE SUMMARY (%):
CC, 6 D
TEXTURE:
Sand 80 Silt 10 Clay 10
COMPOSITION:
Quartz 30 Feldspar 20 Rock fragments 20 Clay 10 Volcanic glass 10 Foraminifers Tr Diatoms 10
SITE 679 HOLE CORE 23X CORED INTERVAL 627.9-637.4 mbsl; 188.4-197.9 mbsf
TIM
E-R
OC
K
UN
IT BIOSTRAT. ZONE/
FOSSIL CHARACTER
FOR
AM
INIF
ERS
* CO
NA
NN
OFO
SSIL
S
* CD
RA
DIO
LAR
IAN
S
DIA
TOM
S no
n di
agno
stic
*
2
PH
YS
. PR
OPE
RTI
ES
!
) SEC
TIO
N
CC
MET
ERS
GRAPHIC LITHOLOGY
v |H r4 I
DR
ILLI
NG
DIS
TUR
B.
8
SED.
ST
RU
CTU
RES
SAM
PLES
LITHOLOGIC DESCRIPTION
DIATOMACEOUS MUD
Major lithology: diatomaceous mud, black (5Y 2.5/2), silty. CC below 8 cm is soupy, below 15 cm brecciated; fragments of black (5Y 2.5/2), silty diatomaceous mud in CC, 15-25 cm.
679D-22X
5H : j r . . . )
[ to ; YQ-2 5 -3 0 -3 5 -4 0 -4 5 -5 0 -5 5 -6 0 -6 5 -7 0 -7 5 -8 0 -8 5 -9 0 -9 5 -
I 0 0 -I 0 5 -II0-! I5 -
I 2 0 -I 2 5 -130-I35— I40-I 4 5 -I 5 0 -
CC 679D-23X CC
1 - i 5 "3 I 1 0 ^ I- 15-
— C v~~~
~~ C O"**"
3 0 -—• - O Q ~~~
4 0 -4 5 -5 0 -5 5 -6 0 -6 5 -7 0 -7 5 -
~ 8 0 -8 5 -9 0 -9 5 -
I00--105— 110— 115—:
120-»■— l l . O " ™ ~
130-"*»— S '.J <>J""""""
140-145-150-

S I T E
*z z
g IE
- RC
*"
5 7 9 HOLE BIOSTRAT. ZONE/ FOSSIL CHARACTER
w
s i
u
* m
5
1 1 2
« Z
* CD
M S
I Q
< a
1 o
* S
tiC
o c:
ro ■ o
C
c
i !
i £
a
3
y j
£
& w
>-x a.
8 y
i
"
CORE
| M
1
£ 2
24X
GRAPHIC LITHOLOG
CORED I N T E R V A L 6 4 6 . 9 - 6 5 6 . 2 m b s l ; 2 0 7 . 4 - 2 1 6 . 7 m b s f
v n i n
. . .
Er
5 5
1 a a
T
en
1 u
£
I0
PLES
5 0)
*
LITHOLOGIC DESCRIPTION
DIATOMACEOUS MUD
Major lithology; diatomaceous mud, dark olive gray (5Y 3/2), silty, massive.
SMEAR SLIDE SUMMARY (%):
1 ,25 D
TEXTURE:
Sand 5 Silt 30 Clay 65
COMPOSITION:
Quartz 30 Feldspar 10 Rock fragments 15 Clay 20 Foraminifers Tr Diatoms 20 Sponge spicules 5
SITE 679 HOLE D CORE 25X CORED INTERVAL 6 5 6 . 2 - 6 6 5 . 7 mbsl; 2 1 6 . 9 - 2 2 6 . 4 mbsf
TIM
E-R
OC
K
UN
IT
UPPE
R M
IOC
ENE
BIOSTRAT. ZONE/ FOSSIL CHARACTER
FOR
AM
INIF
ERS
* CO
NA
NN
OFO
SSIL
S
* CO
RA
DIO
LAR
IAN
S
DIA
TOM
S T.
co
nvex
a/ N
. p
ort
eri
Z
on
e*
PALE
OM
AG
NET
ICS
PH
YS
. PR
OPE
RTI
ES
o
>■
5
SEC
TIO
N
CC
MET
ERS
LITHOLOGY
^j- V.: :.■:•:'.-. - _ — ■■ -
DR
ILLI
NG
DIS
TUR
B.
^
SE
D.
STR
UC
TUR
ES
*
SAM
PLES
LITHOLOGIC DESCRIPTION
SANDY SILT and DIATOMACEOUS MUD
Major lithology: sandy silt and diatomaceous mud, black (5Y 2.5/2), thinly bedded to laminated; CC, 0 - 1 5 cm. Diatomaceous mud, dark olive gray (5Y 3/2), silty; CC, 15 -21 cm.
SMEAR SLIDE SUMMARY (%):
CC, 7 D
TEXTURE:
Sand 20 Silt 60 Clay 20
COMPOSITION:
Quartz 40 Feldspar 20 Rock fragments 20 Volcanic glass 10 Foraminifers 5 Diatoms 5
679D-24X
65-70~ 75-80-85-90-95-
100-105-110-115-
120-1 L. 0"
130-f v y
140-145-180-
679D-25X CC
10 15
5QZ
35-4 0 -4 5Z 5 0 -5 5 -6 0 " I
70-75-80 -mZ 3 0 -9 5 I
100—
mz no-
" IIS— 1 2 0 -125-130™
IOO""""
150-

SITE 679 HOLE CORE 26X CORED INTERVAL 6 6 5 . 7 - 6 7 5 . 2 mbsl; 2 2 6 .4 - 2 3 5 .9 mbsf
TIM
E-R
OC
K
UN
IT
UPPE
R M
IOC
ENE
BIOSTRAT. ZONE/ FOSSIL CHARACTER
FOR
AM
INIF
ERS
* 00
i #
CD
RA
DIO
LAR
IAN
S
DIA
TOM
S A
. in
gens
(fl
at)
Zone
*
2 O
PH
YS
. PR
OPE
RTI
ES
CH
EM
ISTR
Y/C
aCO
,
SEC
TIO
N
1
CC
MET
ERS
0.5-
GRAPHIC LITHOLOGY
"
2
7T^_ - :
DR
ILLI
NG
DIS
TUR
B.
o
I I
SED
. ST
RU
CTU
RES
e
SAM
PLES
*
LITHOLOGIC DESCRIPTION
SILTY DIATOMACEOUS MUD and MUDDY SILT
Major lithology: silty diatomaceous mud and muddy silt, black (5Y 2.5/1), highly disturbed; scattered black phosphatic nodules may be part of a drilling breccia.
SMEAR SLIDE SUMMARY (%):
CC, 13 D
TEXTURE:
Sand 10 Silt 70 Clay 20
COMPOSITION:
Quartz 30 Feldspar 10 Rock fragments 30 Clay 10 Calcite/dolomite 5 Diatoms 10 Sponge spicules 5
K
679D-26X I
I05-
its-
1 %,:„. V ^
130-1%30*
140-145-150-

to SITE 679 HOLE E CORE 1X CORED INTERVAL 6 9 6 . 1 - 7 0 2 . 6 mbsl; 2 4 5 . 3 - 2 5 1 . 8 mbsf
TIM
E-R
OC
K
UN
IT B IOSTRAT. ZONE/
FOSSIL CHARACTER
FOR
AM
INIF
ER
S
N21
to
Hol
ocen
e*
NA
NN
OFO
SS
ILS
* CD
RA
DIO
LAR
IAN
S
* CD
DIA
TOM
S *
CD
PA
LEO
MA
GN
ETI
CS
PH
YS
. P
RO
PE
RTI
ES
CH
EM
ISTR
Y/C
aCO
,
SE
CTI
ON
££
MET
ERS
j
GRAPHIC LITHOLOGY
DR
ILLI
NG
DIS
TUR
B.
X
SED
. S
TRU
CTU
RE
S
SA
MP
LES
LITHOLOGIC DESCRIPTION
SILTSTONE
Major lithology: gray (N 5/) to dark gray (N 4/) siltstone.
SITE 679 HOLE CORE 2X CORED INTERVAL 7 0 2 . 6 - 7 1 2 . 1 mbsl; 2 5 1 . 8 - 2 6 1 . 3 mbsf
TIM
E-R
OC
K
UN
IT BIOSTRAT. ZONE/
FOSSIL CHARACTER
FOR
AM
INIF
ER
S
CD *
NA
NN
OFO
SS
ILS
*
RA
DIO
LAR
IAN
S
CD
*
DIA
TOM
S
CD *
3
PH
YS
. P
RO
PE
RTI
ES
CH
EMIS
TRY/
CaC
Og
SE
CTI
ON
1
cc
MET
ERS
0 . 5 —
GRAPHIC LITHOLOGY
DR
ILLI
NG
DIS
TU
RB
. X
X —
SED
. ST
RU
CTU
RES
SA
MP
LES
* *
*
LITHOLOGIC DESCRIPTION
MUDSTONE/SILTSTONE
Major lithology: gray (N 6/-N 5/) to dark gray (N Al) mudstone/siltstone, containing light gray (N 11) laminae.
Minor lithology: 1. bed of volcanic silt, Section 1, 50-51 cm.
SMEAR SLIDE SUMMARY (%):
1,15 1,50 1,92 D D M
TEXTURE:
Sand 15 40 — Silt 70 50 75 Clay 15 10 25
COMPOSITION:
Quartz 35 20 5 Feldspar 5 15 5 Rock fragments 35 50 20 Volcanic glass 15 10 25 Calcite/dolomite 5 Tr 45 Accessory minerals 5 5 —
679E-2X 1

SITE 679 HOLE CORE 3X CORED INTERVAL 712.1-721.6 mbsl; 261.3-270.8 mbSf
TIM
E-R
OC
K
UN
IT BIOSTRAT. ZONE/
FOSSIL CHARACTER
FOR
AM
INIF
ERS
m *
NA
NN
OFO
SSIL
S
00 *
RA
DIO
LAR
IAN
S
CD
*
DIA
TOM
S
CD
*
I
PH
YS
. P
RO
PE
RTI
ES
1
SEC
TIO
N
1
cc
MET
ERS
0.5-
1 .0-
-
GRAPHIC LITHOLOGY
1
• • ' • • " t ' ; : v i r > ' • • " • • t > : - . o : ^ • '■■•"k '- : : : ; ' : : : .~>:
• 1.
DR
ILLI
NG
DIS
TUR
B.
/ \ / \ / \ / * X
SEO
. ST
RU
CTU
RES
1
SAM
PLES
*
LITHOLOGIC DESCRIPTION
MUDSTONE/SILTSTONE
Major lithology: mudstone/siltstone, gray (N 6/-N 5/) to dark gray (N 4/), faintly laminated. Regular spaced lamination in Section 1, 90-150 cm. Highly disturbed by drilling.
SMEAR SLIDE SUMMARY (%):
1, 45 1, 140 D D
TEXTURE:
Sand 75 30 Silt 20 60 Clay 5 10
COMPOSITION:
Quartz 10 10 Feldspar 15 15 Rock fragments 60 60 Clay 5 10 Calcite/dolomite Tr Tr Accessory minerals 10 5
SITE 679 HOLE CORE 4X CORED INTERVAL 721.6-731.1 mbsl; 270.8-280.3 mbsf
LITHOLOGIC DESCRIPTION
CC
MUDSTONE, SANDY MUDSTONE, and SILTSTONE
Major lithology: mudstone to sandy mudstone or siltstone, gray (N 6/-N 5/) to dark gray (N 41). Cross lamination occurs frequently. Scoured contact, graded bedding (turbidite), and highly disturbed by drilling.
SMEAR SLIDE SUMMARY (%):
1,133 2,37 3,45
COMPOSITION:
Quartz Feldspar Rock fragments Mica Clay Dolomite Accessory minerals
Micrite Microcrystalline quartz Devitrified glass
679E-3X

SITE
t ? o
1 £ 3
—
679 HOLE BI0STRAT. ZONE/ FOSSIL CHARACTER
» § 2
" ■
m
*
5 m
I § z
< z
m
*
£ < ! 2 Q
< CC
DD
*
£ S
5
CD
*
S2
X o
1
E
s 1 J to
^ X Q.
I l 2
"
CORE 5X
g
! o IU to
1
2
3
4
5
CC
G LI
U
3
'.— ~ -— ~ 0.5 : ;_
: i_
-_: — i .0-2 r-
:E ^ ■ ~ —
:z = " — L-L
— ~ f-j
— E "~r ZZ " ~ :_: : - i ~ IU H
—■ m :-E --T n '2 ^ -~2 7T
--f n - Z TT
--E
I— •""■ - — '—L
~ 3 7T
CORED
RAPHIC HOLOSY
— " ] ! ' ■
7" " • • " 7" " . . " 7"
'—..".. r- . . ' . .
-~..".. = ::::::
— ".."• I'I
III-
— ..".. 7" ..
7" . . " . .
■ - • • " • •
2
7 - " "•• 1 ■ • ! ! • •
--Hi! ••!!
=
7" " • "
?••'••• E!!"!!
0 0 (A
5 =• 3
- <0
o w
E
/ \ / \ TL / \ / \ \ / \ \
/ \ / TL \ / \ / I \ / \ \ 2 X2Z
NTERVAL 7 3 1 . 1 - 7 4 0 . 6 mbsl; 2 8 0 . 3 - 2 8 9 . 8 mbsf
» 5 2
™
*
LITHOLOGIC DESCRIPTION
INTERLAMINATED MUDSTONE and SILTSTONE
Major lithology: interlaminated mudslone and siltstone, light gray (N 71), gray (N 6/-N 5/), and dark gray (N 4/). Graded bed, turbidite structures occur. Minor bioturbation occurs in pelitic and hemipelagic intervals. Carbonate cemented. Highly disturbed by drilling.
SMEAR SLIDE SUMMARY (%):
1, 77
TEXTURE:
Sand 30 Silt 30 Clay 40
COMPOSITION:
Quartz 30 Feldspar 5 Clay 50 Calcite/dolomite 10 Accessory minerals
Micrite 5
679E-5X

SITE
TIM
E-R
OC
K
UN
IT
6 7 9 HOLE
BIOSTRAT. ZONE/ FOSSIL CHARACTER
FOR
AM
INIF
ERS
DD *
NA
NN
OFO
SSIL
S
CO
*
RA
DIO
LAR
IAN
S
CD *
DIA
TOM
S
CD
*
PALE
OM
AG
NET
ICS
E
PH
YS
. PR
OPE
RTI
ES
CH
EMIS
TRY/
CaC
O,
1 •
CORE 6X CORED INTERVAL 7 4 0 . 6 - 7 5 0 . 1 mbsl ; 2 8 9 . 8 - 2 9 9 . 3 mbsf
SEC
TIO
N
1
2
3
CC
MET
ERS
0.5 :
i .c—2
j=
-
z±
-.-
GRAPHIC LITHOLOGY
= z
VOID "
Z = D
RIL
LIN
G D
ISTU
RB
.
/ \ .. / \ :: / ■ \
■ /
■ / :: \ /
■ \ . / \ : /
: \ / • \ / \ <
SED
. ST
RU
CTU
RES
II II 7 II II 1 1 1
TL
SAM
PLES
IW KVE
LITHOLOGIC DESCRIPTION
INTERLAMINATED MUDSTONE and SILTSTONE
Major lithology: interlaminated mudstone and siltstone, light gray (N 71), gray (N 6/-N 5/), and dark gray (N 41). Graded beds, turbidite structures occur. Minor bioturbation occurs in pelitic and hemipelagic intervals. Carbonate cemented. Highly disturbed by drilling.
SITE 6 7 9 HOLE CORE 7X CORED INTERVAL 7 5 0 . 1 - 7 5 9 . 6 mbsl; 2 9 9 . 3 - 3 0 8 . 8 mbsf
TIM
E-R
OC
K
UN
IT BIOSTRAT. ZONE/
FOSSIL CHARACTER
FOR
AM
INIF
ERS
CD *
NA
NN
OFO
SSIL
S
CO *
RA
DIO
LAR
IAN
S
CO
*
DIA
TOM
S
DO *
PALE
OM
AG
NET
ICS
PH
YS
. PR
OPE
RTI
ES
CH
EM
ISTR
Y/C
»CO
,
•
* • CD
•
SEC
TIO
N
1
2
CC
MET
ERS
0.5—
1 .0—
GRAPHIC LITHOLOGY
DR
ILLI
NG
DIS
TUR
B.
X X / \ o o / \ 0 o / \ / \
SE
D.
STR
UC
TUR
ES
SAM
PLES
*
* *
*
LITHOLOGIC DESCRIPTION
MUDSTONE and SILTSTONE
Major lithology: mudstone and siltstone, gray (N 5/) to dark gray (N 41). Turbidite Structures and microfaulting occur.
SMEAR SLIDE SUMMARY (%):
1, 40 1, 86 1, 125 CC, 26 D D D
TEXTURE:
Sand 5 5 10 25 Silt 60 60 80 65 Clay 35 35 10 10
COMPOSITION:
Quartz 10 15 15 5 Feldspar 35 45 5 30 Rock fragments 10 5 — 5 Clay ' 10 10 — 5 Volcanic glass 15 20 — 20 Calcite/dolomite 15 — 80 10 Accessory minerals
Pyrite 5 5 — — Micrite — — — 25
Nannofossils Tr — — —
679E-6X * 679E-7X

SITE 679 HOLE E CORE 8X CORED INTERVAL 7 5 9 . 6 - 7 6 9 . 1 mbsl; 3 0 8 . 8 - 3 1 8 . 3 mbsf
TIM
E-R
OC
K
UN
IT BIOSTRAT. ZONE/
FOSSIL CHARACTER
FOR
AM
INIF
ERS
*
NA
NN
OFO
SSIL
S
CD
*
RA
DIO
LAR
IAN
S
CD *
DIA
TOM
S
CD *
3 o
CL PH
YS
. PR
OPE
RTI
ES
0)
at
CH
EM
ISTR
Y/C
aCO
, •
10.4
SEC
TIO
N
1
2
CC
MET
ERS
0.5-
1 .0-
GRAPHIC LITH0L0G1
DR
ILLI
NG
DIS
TUR
B.
:: \ :: o .. O • / \
:: o .. o
• /
6 S
ED
. ST
RU
CTU
RES
IL
SAM
PLES
*
LITHOLOGIC DESCRIPTION
MUDSTONE and SILTSTONE
Major lithology: mudstone and siltstone, gray (N 5/) to dark gray (N 4/). Turbidite structure and microfaulting occur.
SMEAR SLIDE SUMMARY (%):
1.9 D
TEXTURE:
Silt 20 Clay 80
COMPOSITION:
Clay 15 Volcanic glass 10 Calcite/dolomite 75
SITE 679 HOLE CORE 9X CORED INTERVAL 7 6 9 . 1 - 7 7 8 . 6 mbsl; 3 1 8 . 3 - 3 2 7 . 8 mbsf
*-3
E-
RO
CI
*"
BIOSTRAT. ZONE/ FOSSIL CHARACTER
rfi
AM
INIF
E
"-
CD
*
w
NO
FOSS
I
*
CD
*
fn
lOLA
RIA
"-
CO
*
roM
s
CD
*
H
EOM
AGNE
" ■
E2
RT
S.
PRO
P
a.
m o
— ** A**
sj
MIS
TRY
/
"
5.1
•
9.2
—o O o —o
TIO
N
</)
1
CC
ERS
0.5—
1 .0—
.
GRAPHIC LITHOLOGY
. .
. - _ " _ - . ■
------ .
—
s 2
.LIN
G 0
c
X A
8
r •
■
■
oxx
,/. Si
. ST
RUC
0)
PLES
l»
* *
IW
LITHOLOGIC
CLAYSTONE and MUDSTONE
Major lithology: claystone and mudstone gray (N 4/). Siltstone occurs.
SMEAR SLIDE SUMMARY (%):
1, 54 1, 76 M D
TEXTURE:
Sand 15 5 Silt 65 25 Clay 20 70
COMPOSITION:
Quartz 30 Tr Feldspar 20 10 Rock fragments — 5 Clay ' 20 5 Volcanic glass 20 15 Calcite/dolomite 10 5 Accessory minerals
Micrite — 60
DESCRIPTION
light gray (N 71), gray (N 6/-N 5/)
1,81
15 85
80 10 10
and dark
679E-8X 1
15 20 25 30 35 40 45 50 55 60 65 TO 75 80 85 90 95
100 105 HO mz
120-125
135 140 145
679E-9XI
I—

SITE 679 HOLE E CORE 1 OX CORED INTERVAL 778.6-788.1 mbsl; 327.8-337.3 mbsf
E-RO
CK U
NIT
*"
BIOSTRAT. ZONE/ FOSSIL CHARACTER
AM
INIF
ER
S
*
NO
FOSS
ILS
*
OLA
RIA
NS
er
*
roMs
*
EOM
AG
NET
ICS
0.
S.
PR
OP
ER
TIE
!
a
0 C 3
O o
f*
J
• 00
•
2.1
n
• f
NO
H
"
1
2
.1
CC
L
1
.— : -_~ :.
0.5 r ; "-ZL:
**\i\ .—-; - 1
"it -~ -■ -
: r
-. — ■_
- " T I
.-: 1
:-±z ~ Z 7
GRAPHIC THOLOGY
— —,.".. ~ — ". " • — ".." - i _ . . " . .
— 7"' ' . .
T :_ j . — . * ' . .
— ^ • • . . ■ •
- • — !_..".. T ^_:.."..
• — ■■
1. J.
I : - ' ■ . . ■ ■
ir-'-::--- Z ' •
.LIN
G D
ISTU
RB
a
/ \ / \
/\ \
OOO
\ / \
X X
\ f \
. ST
RU
CTU
RES
"
(P)
77
!
# *
ICVE
OG
LITHOLOGIC DESCRIPTION
MUDSTONE and SILTSTONE
Major lithology: mudstone and siltstone, dark gray (N 4/) and thin bedded. Beds 5 - 1 5 - c m thick and grade upsection to dark gray (5Y 4/1) micritic clays.
SMEAR SLIDE SUMMARY (%):
1 ,20 1,69 1 ,75
TEXTURE:
Sand 5 5 40 Silt 35 75 50 Clay 60 20 10
COMPOSITION:
Quartz — 5 10 Feldspar — 10 40 Clay 35 10 10 Volcanic glass 5 5 — Calcite/dolomite 60 70 40
are
SITE 679 HOLE CORE 1 1X CORED INTERVAL 788.1-797.6 mbsl: 337.3-346.8 mbsf
LITHOLOGIC DESCRIPTION
o-s-E&gssss
' ^ S f i «
CC
rO-J-.--=-.s
MUDSTONE, SILTSTONE, and SHALE
Major lithology: Section 1, 0-20 cm: dark gray (N 4/) mudstone and siltstone are thinly bedded. Beds are 5-15 cm thick and grade upsection to dark gray (5Y 4/1) micritic clay. Section 1, 20-150 cm, Section 2, and CC: very dark gray (5Y 3/1) fissile shale, finely laminated and foraminifer-rich.
SMEAR SLIDE SUMMARY (%):
1,124 1,127 2,127 2,143 2,145
COMPOSITION:
Quartz Feldspar Rock fragments Clay Volcanic glass Calcite/dolomite Accessory minerals
Micrite Nannofossils
5 — 40 40 55 60
— — 10 5 — —
679E-10X 1 2 3

SITE 679 HOLE CORE 1 2X CORED INTERVAL
CC
797.6-807.1 mbsl; 346.8-356.3 mbsf
LITHOLOGIC DESCRIPTION
Major lithology: very dark gray (5Y 3/1) fissile shale, finely laminated and foraminifer-rich. Sand lamination with slight to moderate fluorescence under ultraviolet light.
SMEAR SLIDE SUMMARY (%):
Silt Clay
COMPOSITION:
Quartz Clay Calcite/dolomite Accessory minerals
SITE 679 HOLE E CORE 1 3X CORED INTERVAL 8 0 7 . 1 - 8 1 0 . 1 mbsl; 3 5 6 . 3 - 3 5 9 . 3 mbsf
TIM
E-R
OC
K
UN
IT
MIO
CE
NE
BIOSTRAT. ZONE/ FOSSIL CHARACTER
FOR
AM
INIF
ERS
*
NA
NN
OFO
SSIL
S in
sig
nif
ica
nt
*
RA
DIO
LAR
IAN
S in
sig
nif
ica
nt
*
DIA
TOM
S
* CD
3
_
PH
YS
. PR
OPE
RTI
ES
CH
EM
ISTR
Y/C
aCO
,
_
SEC
TIO
N
CC
MET
ERS
:
GRAPHIC LITHOLOGY
SKHJSaS?!
DR
ILLI
NG
D
ISTU
RB
.
5
SE
D.
STR
UC
TUR
ES
=
SAM
PLES
KVE
LITHOLOGIC DESCRIPTION
foraminifer-rich. Strong fluorescence under ultraviolet light.


![org [ODP] and Evaluation WikiFlow](https://img.pdfslide.net/doc/110x75/63317afa576b626f850cf590/-org-odp-and-evaluation-wikiflow.jpg)


