Embed Size (px)
Citation preview
SHIRE OF AUGUSTA MARGARET RIVER
ORDINARY COUNCIL MEETING 11 DECEMBER 2019
11.2 Sustainable Development
ITEM NO SUBJECT PAGE 11.2.1 SOLAR PV ANALYSIS OF SHIRE BUILDINGS 1 11.2.2 LIMESTONE CLIFF STABILITY ASSESSMENT 36 11.2.3 DRAFT CLIMATE ACTION PLAN 135 11.2.4 SUSTAINABILITY REFERENCE GROUP – AMENDMENT TO INSTRUMENT OF
APPOINTMENT AND DELEGATION 176 11.2.5 SCHEME AMENDMENT NO.58 AND RELATED STRUCTURE PLAN
– EXMOOR DRIVE – FOR FINAL ADOPTION 180 11.2.6 WALGA DECLARATION ON CLIMATE CHANGE 194
SHIRE OF AUGUSTA MARGARET RIVER ORDINARY COUNCIL MEETING 11 DECEMBER 2019
11.2 Sustainable Development 11.2.1 SOLAR PV ANALYSIS OF SHIRE BUILDINGS
Attachment 1 – Solar PV Business Case Attachment 2 – Solar PV Business Case – Battery Storage
1
Shire of Augusta
Margaret River
Solar PV Business Case – Additional
Investigation
PAE Job No: 19-118
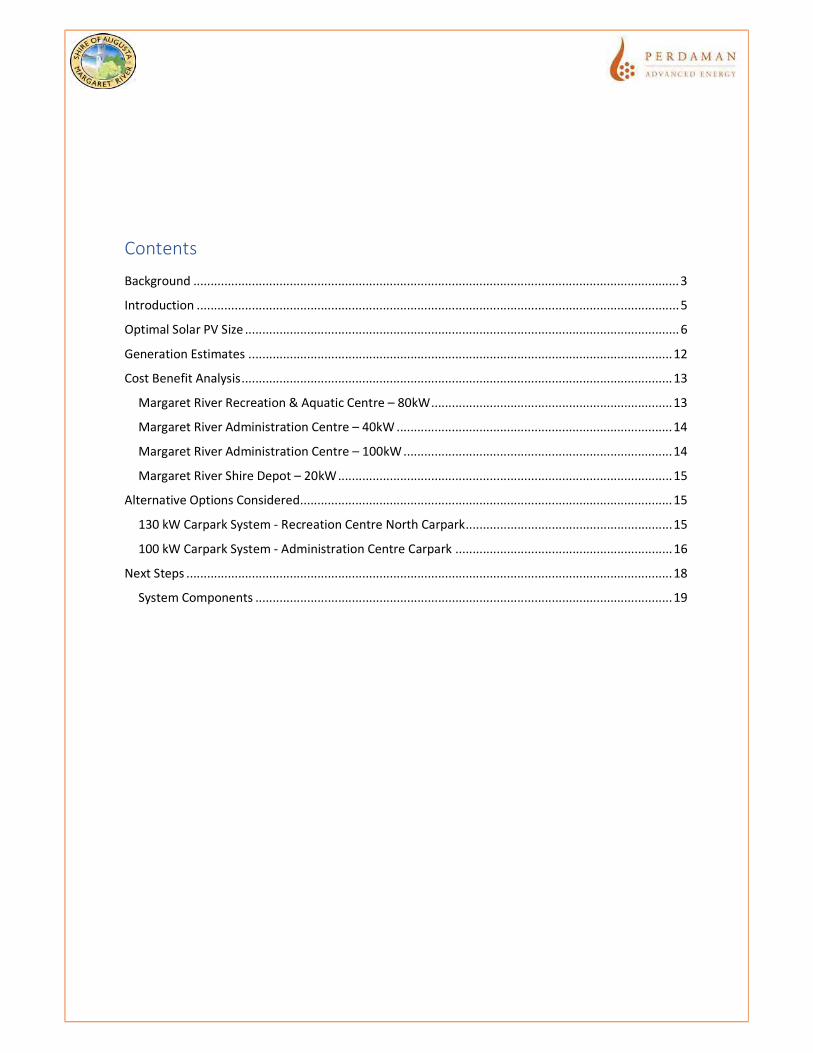
Contents
Background ............................................................................................................................................. 3
Introduction ............................................................................................................................................ 5
Optimal Solar PV Size .............................................................................................................................. 6
Generation Estimates ........................................................................................................................... 12
Cost Benefit Analysis ............................................................................................................................. 13
Margaret River Recreation & Aquatic Centre – 80kW ...................................................................... 13
Margaret River Administration Centre – 40kW ................................................................................ 14
Margaret River Administration Centre – 100kW .............................................................................. 14
Margaret River Shire Depot – 20kW ................................................................................................. 15
Alternative Options Considered ............................................................................................................ 15
130 kW Carpark System - Recreation Centre North Carpark ............................................................ 15
100 kW Carpark System - Administration Centre Carpark ............................................................... 16
Next Steps ............................................................................................................................................. 18
System Components ......................................................................................................................... 19
Response to Feedback
In reply to the feedback received from The Shire of Augusta Margaret River on 3/10/2019, PAE have
made edits to the sizing and financial figures of the proposed Administration Building, as well as the
below responses.
Comment: Both business cases refer to a proposed 40kW system on the roof of the admin building
and a 100kW system on the main roof. Does the diagram below reflect the actual number of solar
panels that could be installed on each roof? The diagram below shows approx. 120 panels on the
east facing roof and 200 panels on the main roof. The ratio of no. of solar panels vs proposed solar
PV size (40kW and 100kW) does not appear to be accurate, can you please provide comment?
Response: The 100kW system is a combination of a 40kW system on the East facing roof and a 60kW
system on the main roof.
East Facing Roof: 121 x 330W solar panels totaling 39.93kW, (~40kW)
Main roof: 182 x 330W panels totalling 60.06kW. (~60kW)
The combined PV capacity of both systems is 99.99kW (~100kW).
Comment: It has now been confirmed (by a local solar installer) that the main roof of the admin
building (where the 100kW system was proposed) is unsuitable for solar PV installation due to the
use of roof/ceiling materials and insufficient spacing to connect to. On this basis, our focus is now on
the east facing roof only. Can you please confirm the following: Can we fit more than 40kW on the
east facing roof of the admin building? If so, what is the maximum system size that could be installed
on this roof? (hence the importance of the diagram below being to scale)
Response:
If we were to choose a higher wattage panel than the 330W selected for the business cases,
as long as the new panel was of similar dimensions (2m long x 1m wide) and weight
(22.5kg/module) then a larger system size may be possible
PAE chose the 330W panels for the Business Case as it provided the best economic option
when compromising between cost of panel and wattage. Depending on the brand of panel
and time of installation it may be possible to find a supplier with a deal on a higher wattage
panel that would provide a similar ROI for the system.
Currently the maximum wattage panel available on the market by reputable brands is 400W
which could offer an additional 8.5kW

Comment: V3.0 refers to a proposed 80kW system on the roof of the Rec Centre. Installation of this
system would exceed the 100kW threshold. Please provide comment (in v3.0) about what it means
should the Shire exceed 100kW threshold at any of our sites.
Response: The 100kW threshold is in regard to claiming Small-scale Technology Certificate (systems
less than 100kW) instead of Large Scale Generation Certificates (Systems greater than 100kW).
Only 100kW of STC’s can be claimed at each connection point. In the initial business case, we
assumed that at least one of the existing submeters installed behind the Western Power meter at
the Recreation & Aquatic Centre site would be a commercial submeter suitable for connection of
the proposed 80kW system and therefore eligible to claim STC’s for the entire proposed 80kW
system. If this was not the case, STCs could only be claimed for 20kW of the proposed 80kW system.
Comment: Were the plans provided for each of the buildings reviewed? With the exception of the
main roof of the admin building and the Rec Centre, are these rooves suitable for solar PV to be
fixed on to i.e. is there sufficient spaces between purlins to fix railing system to etc.
Response: The structural plans for each building were assessed and based on the information
provided in these drawings, PAE see no obvious indications that suggest these rooves would not be
suitable for solar PV. However, prior to progressing with the installation of rooftop solar PV a
structural engineer’s assessment of the roof structural is strongly recommended in order to assess
the complete impact that solar PV would have on the existing structure.
Comment: What are the implications for us if we exceed 100kW on an individual sub-meter i.e.
risks, do we then become an energy generator etc.?
Response: The only implication of exceeding 100kW on an individual sub-meter is that there will be
no STC rebate for anything installed over 100kW.
Comment: The report refers to a 107,000kWh of PV energy consumed for both the Rec Centre and
the Admin building, however the Rec Centre has an $11,393 annual savings, and the Admin building
a $26,683 annual savings. Can you please explain this?
Response: This is due to the tariff structures incurred by the Shire. The Administration Centre has
the Network costs charged per kWh of usage, while the Recreation Centre has Network costs
charged depending of the peak instantaneous power value measured at the site (per kVA). This
increases the savings achieved by the proposed system at the Administration Centre.
Also, due to the existing PV systems installed at the Recreation Centre already reducing the day
time peak power value of the site, the proposed 80kW addition provides limited reduction in peak
power draw and there lower reductions in savings.
Background
As part of the Shire of Augusta Margaret River commitment to reducing greenhouse gas emissions
from its corporate operations, Perdaman Advanced Energy (PAE) was engaged in early 2019 to
provide options for the installation of solar PV systems at several Shire owned buildings. Further to
this initial investigation and solution design, the Shire requested PAE to conduct further investigation
surrounding the incorporation of battery storage into the proposed systems
In order to move closer to their carbon reduction target, the Shire of Augusta Margaret River (SAMR)
contracted Perdaman Advanced Energy (PAE) to investigate the feasibility of additional rooftop and
carpark solar PV systems at the following Shire owned locations:
1. Margaret River Administration Centre
2. Margaret River Recreation and Aquatic Centre
3. Margaret River Shire Depot
Introduction
PAE has completed an analysis of the identified SAMR buildings electricity meters interval data
provided by Western Power for the past 12 months as well as the electricity retailer invoices. *
Advanced analysis software (HOMER Pro and Helioscope) has been used to determine the optimal
system sizing based on the location of the array, its orientation, weather and temperature
conditions. By considering these factors, PAE is able to provide an energy generation guarantee
based on Tier 1 component specifications and Clean Energy Council approved installation
requirements.
Generation estimates contained in this analysis are based on the Clean Energy Council design
guidelines, Homer software, Bureau of Meteorology data and satellite imagery from Nearmaps.
*Interval data for the Shire Depot was unavailable as an interval meter is not currently installed at
the site. The load profile for this site was modelled based on PAE’s experience with similar sites and
information provided by the Shire of Augusta Margaret River.
Optimal Solar PV Size
Based on the available roof area and the 2018 Western Power interval data recorded for the
proposed sites, as well as the panel locations provided by SAMR in RFQ 031923 – Renewable Energy
Business Case for Shire Buildings, PAE has determined that the optimal system sizes are as follows:
Margaret River Administration Centre
o 40kW system utilizing roof area identified by the Shire only
o 100kW system utilizing additional roof areas
Margaret River Recreation & Aquatic Centre
o 80kW system in addition to the existing 21kW & 60kW systems, bringing the total
installed capacity to 161kW
Margaret River Shire Depot – 20 kW
Margaret River Recreation & Aquatic Centre
There is an existing 21kW rooftop PV system installed at the Margaret River Recreation & Aquatic
Centre, with an additional 60kW system completed in June 2019. Small-scale Technology Certificates
(STC’s) can only be generated for up to 100kW per commercial sub-meter. There are multiple
electrical submeters present behind the NMI meter which may enable up to 100kW to be connected
to each of these with STC eligibility, according to the Renewable Energy Regulations: Small-scale
Solar Eligibility 2019.
Due to the Recreation & Aquatic Centre having significant night-time load, the proposed size of the
solar PV system has been limited to an additional 80 kW system which will occupy only the area
identified by the Shire. To maximize early morning and late afternoon generation, this design
employs the Clean Energy Councils guideline allowing the DC capacity to oversize the AC capacity by
a factor of 1.33, resulting in a system configuration with an 80kW array and 60kVA inverter capacity.
The daytime electricity consumption of the Recreation Centre will be covered by the generation of
the existing 21kW and 60kW systems along with the additional 80kW system proposed in the
business case. Therefore, increasing the size of the proposed additional 80kW system would result in
the solar inverters not operating at maximum capacity, or if grid export is available, large amounts of
PV generated electricity being exported to the grid, which would result in a lower financial benefit.
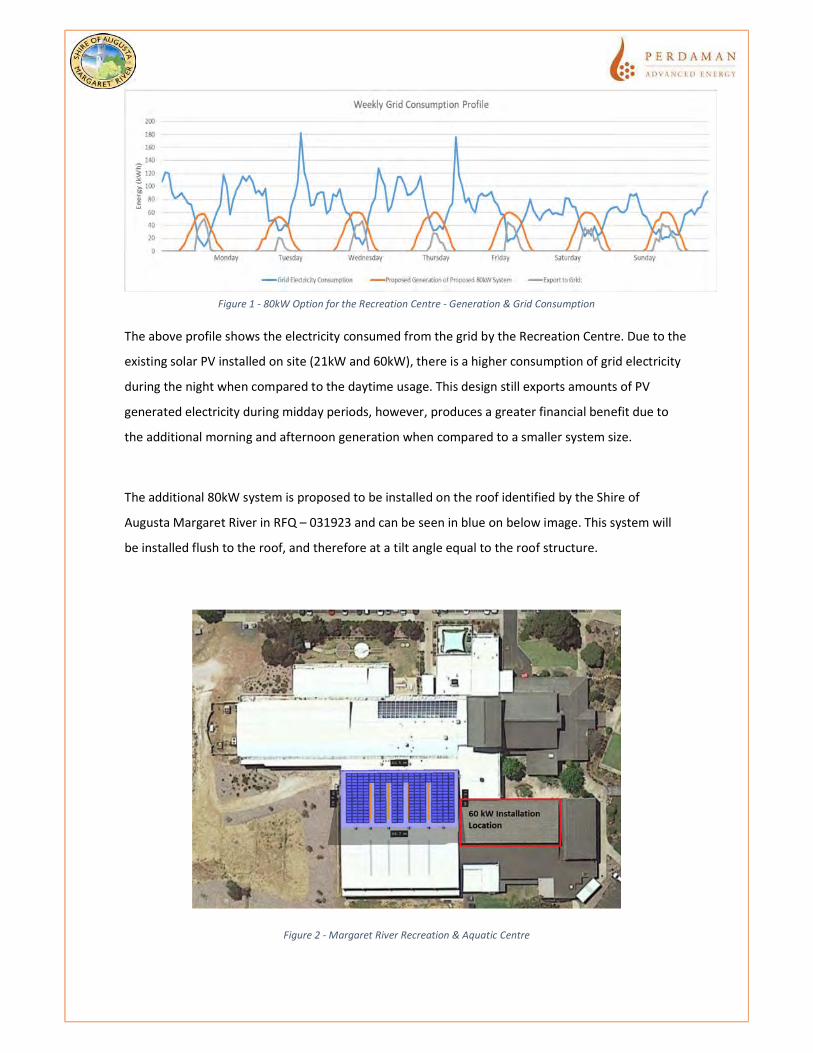
The above profile shows the electricity consumed from the grid by the Recreation Centre. Due to the
existing solar PV installed on site (21kW and 60kW), there is a higher consumption of grid electricity
during the night when compared to the daytime usage. This design still exports amounts of PV
generated electricity during midday periods, however, produces a greater financial benefit due to
the additional morning and afternoon generation when compared to a smaller system size.
The additional 80kW system is proposed to be installed on the roof identified by the Shire of
Augusta Margaret River in RFQ – 031923 and can be seen in blue on below image. This system will
be installed flush to the roof, and therefore at a tilt angle equal to the roof structure.
Figure 2 - Margaret River Recreation & Aquatic Centre
Figure 1 - 80kW Option for the Recreation Centre - Generation & Grid Consumption
The following alternative configurations of array and inverter sizing were also considered, however,
were determined to provide less optimal systems:
80kW array and 80kVA of inverters would result in higher amount of exported electricity
which would result in a lower financial benefit
60kW array and 60kVA would result in less generation during the morning and afternoon
periods, when the site load is not being covered by the existing PV systems.
Margaret River Administration Centre
The Margaret River Administration Centre consists of mainly South facing roof structures which
would require tilted solar PV installations for the system to achieve maximum generation. The
additional mounting equipment required for tilted systems, increases the CAPEX and maintenance
costs of the system and has been included in the financial analysis of this system.
As the Administration Centre was of concern to the Shire regarding structural integrity, PAE has
provided two options for this site:
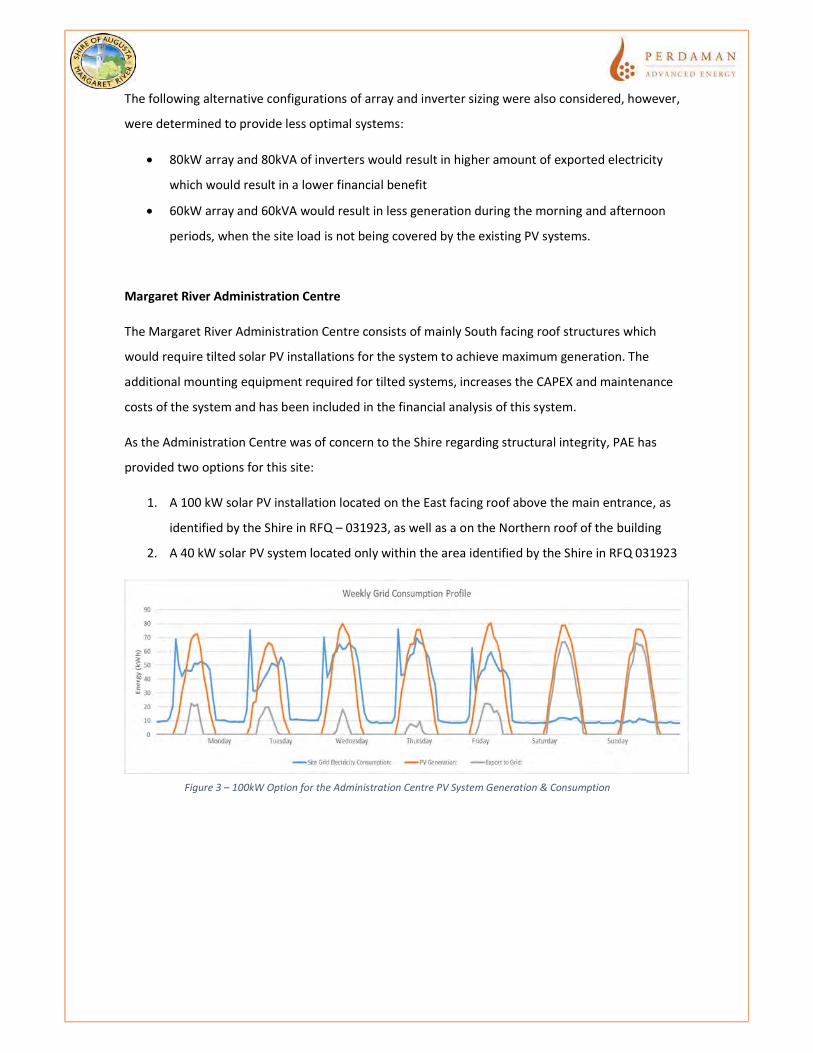
1. A 100 kW solar PV installation located on the East facing roof above the main entrance, as
identified by the Shire in RFQ – 031923, as well as a on the Northern roof of the building
2. A 40 kW solar PV system located only within the area identified by the Shire in RFQ 031923
Figure 3 – 100kW Option for the Administration Centre PV System Generation & Consumption
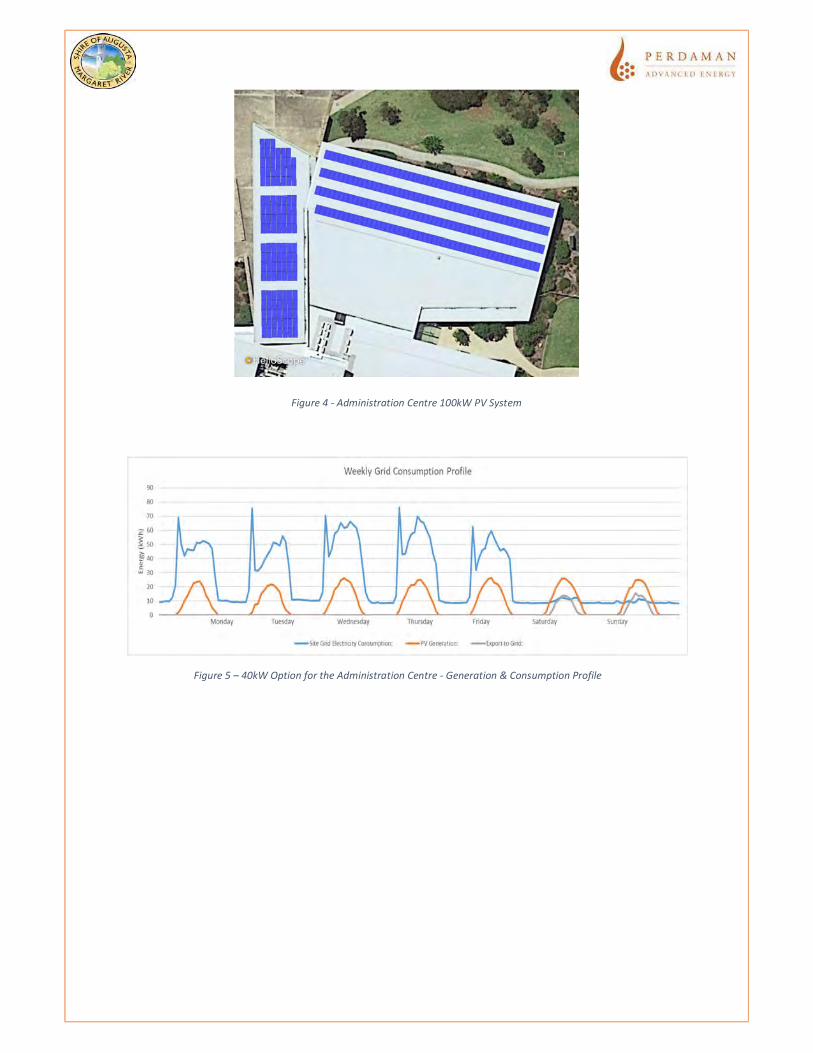
Figure 4 - Administration Centre 100kW PV System
Figure 5 – 40kW Option for the Administration Centre - Generation & Consumption Profile
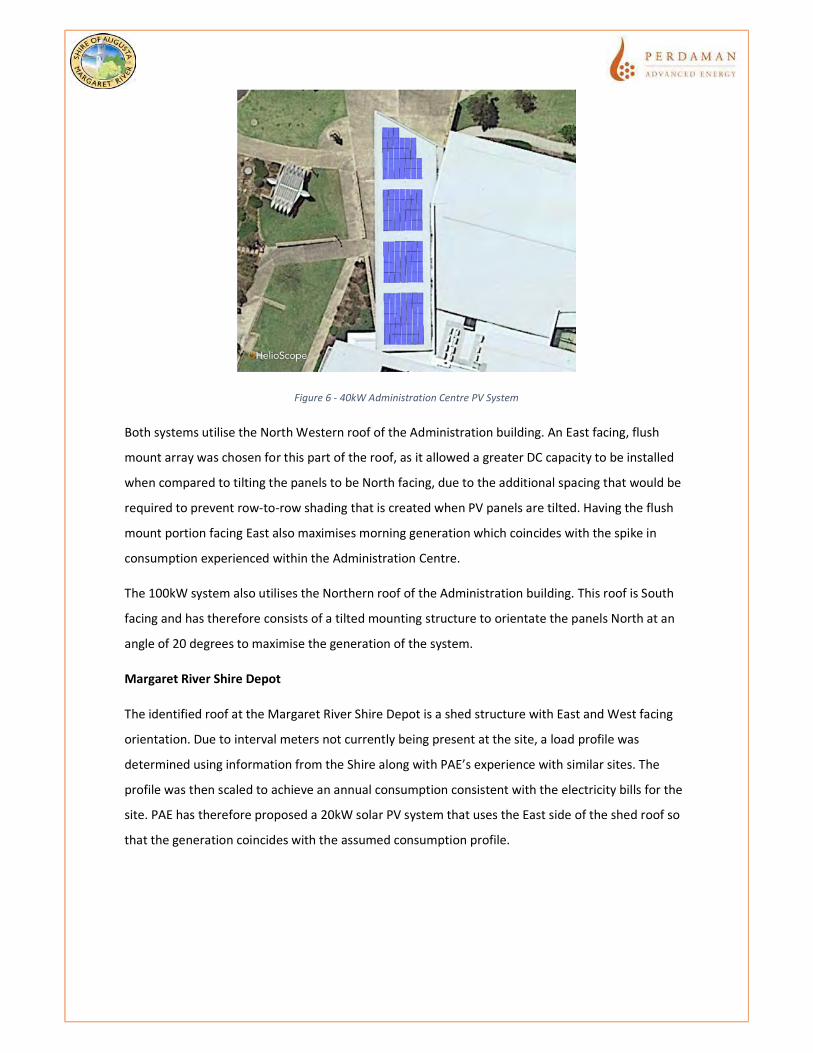
Figure 6 - 40kW Administration Centre PV System
Both systems utilise the North Western roof of the Administration building. An East facing, flush
mount array was chosen for this part of the roof, as it allowed a greater DC capacity to be installed
when compared to tilting the panels to be North facing, due to the additional spacing that would be
required to prevent row-to-row shading that is created when PV panels are tilted. Having the flush
mount portion facing East also maximises morning generation which coincides with the spike in
consumption experienced within the Administration Centre.
The 100kW system also utilises the Northern roof of the Administration building. This roof is South
facing and has therefore consists of a tilted mounting structure to orientate the panels North at an
angle of 20 degrees to maximise the generation of the system.
Margaret River Shire Depot
The identified roof at the Margaret River Shire Depot is a shed structure with East and West facing
orientation. Due to interval meters not currently being present at the site, a load profile was
determined using information from the Shire along with PAE’s experience with similar sites. The
profile was then scaled to achieve an annual consumption consistent with the electricity bills for the
site. PAE has therefore proposed a 20kW solar PV system that uses the East side of the shed roof so
that the generation coincides with the assumed consumption profile.
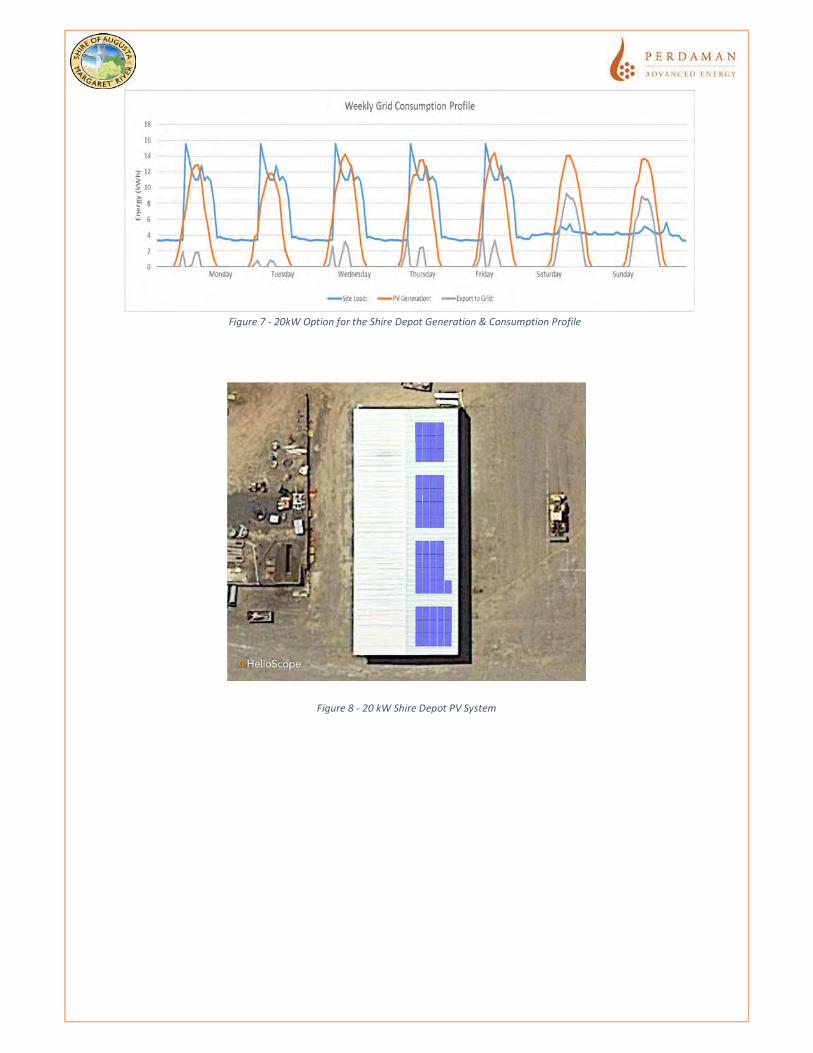
Figure 8 - 20 kW Shire Depot PV System
Figure 7 - 20kW Option for the Shire Depot Generation & Consumption Profile
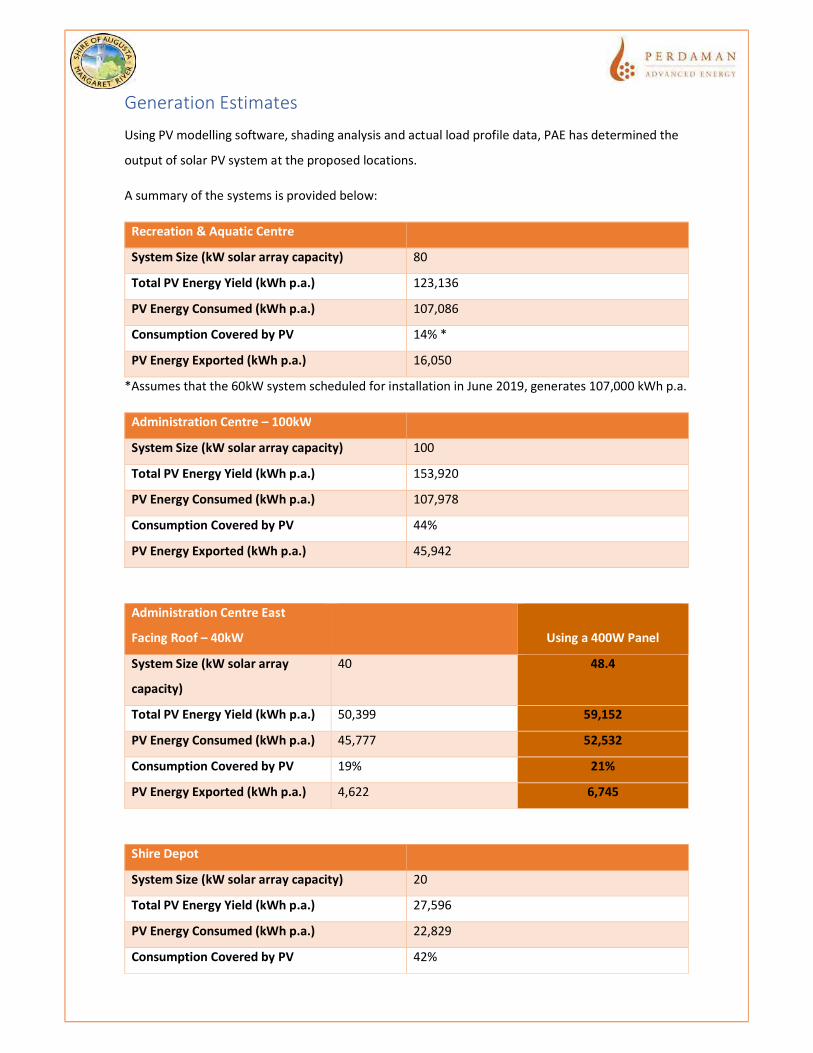
Generation Estimates
Using PV modelling software, shading analysis and actual load profile data, PAE has determined the
output of solar PV system at the proposed locations.
A summary of the systems is provided below:
Recreation & Aquatic Centre
System Size (kW solar array capacity) 80
Total PV Energy Yield (kWh p.a.) 123,136
PV Energy Consumed (kWh p.a.) 107,086
Consumption Covered by PV 14% *
PV Energy Exported (kWh p.a.) 16,050
*Assumes that the 60kW system scheduled for installation in June 2019, generates 107,000 kWh p.a.
Administration Centre – 100kW
System Size (kW solar array capacity) 100
Total PV Energy Yield (kWh p.a.) 153,920
PV Energy Consumed (kWh p.a.) 107,978
Consumption Covered by PV 44%
PV Energy Exported (kWh p.a.) 45,942
Administration Centre East
Facing Roof – 40kW Using a 400W Panel
System Size (kW solar array
capacity)
40 48.4
Total PV Energy Yield (kWh p.a.) 50,399 59,152
PV Energy Consumed (kWh p.a.) 45,777 52,532
Consumption Covered by PV 19% 21%
PV Energy Exported (kWh p.a.) 4,622 6,745
Shire Depot
System Size (kW solar array capacity) 20
Total PV Energy Yield (kWh p.a.) 27,596
PV Energy Consumed (kWh p.a.) 22,829
Consumption Covered by PV 42%
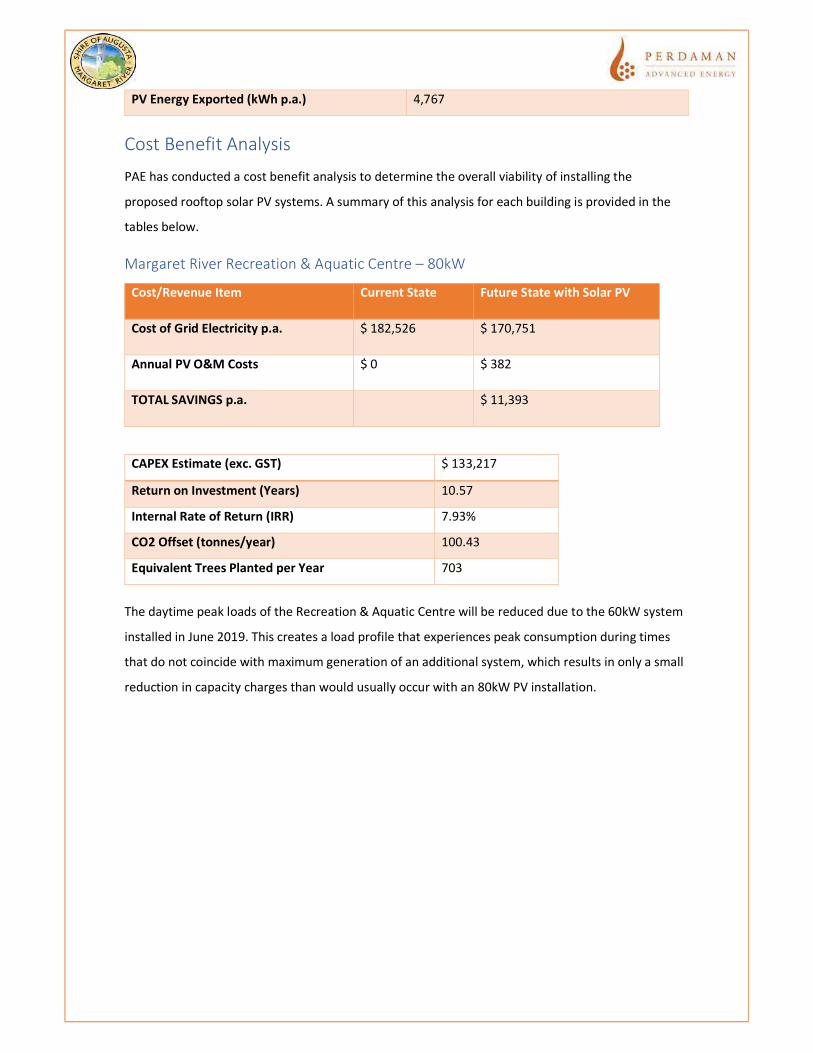
PV Energy Exported (kWh p.a.) 4,767
Cost Benefit Analysis
PAE has conducted a cost benefit analysis to determine the overall viability of installing the
proposed rooftop solar PV systems. A summary of this analysis for each building is provided in the
tables below.
Margaret River Recreation & Aquatic Centre – 80kW
Cost/Revenue Item Current State Future State with Solar PV
Cost of Grid Electricity p.a. $ 182,526 $ 170,751
Annual PV O&M Costs $ 0 $ 382
TOTAL SAVINGS p.a. $ 11,393
The daytime peak loads of the Recreation & Aquatic Centre will be reduced due to the 60kW system
installed in June 2019. This creates a load profile that experiences peak consumption during times
that do not coincide with maximum generation of an additional system, which results in only a small
reduction in capacity charges than would usually occur with an 80kW PV installation.
CAPEX Estimate (exc. GST) $ 133,217
Return on Investment (Years) 10.57
Internal Rate of Return (IRR) 7.93%
CO2 Offset (tonnes/year) 100.43
Equivalent Trees Planted per Year 703
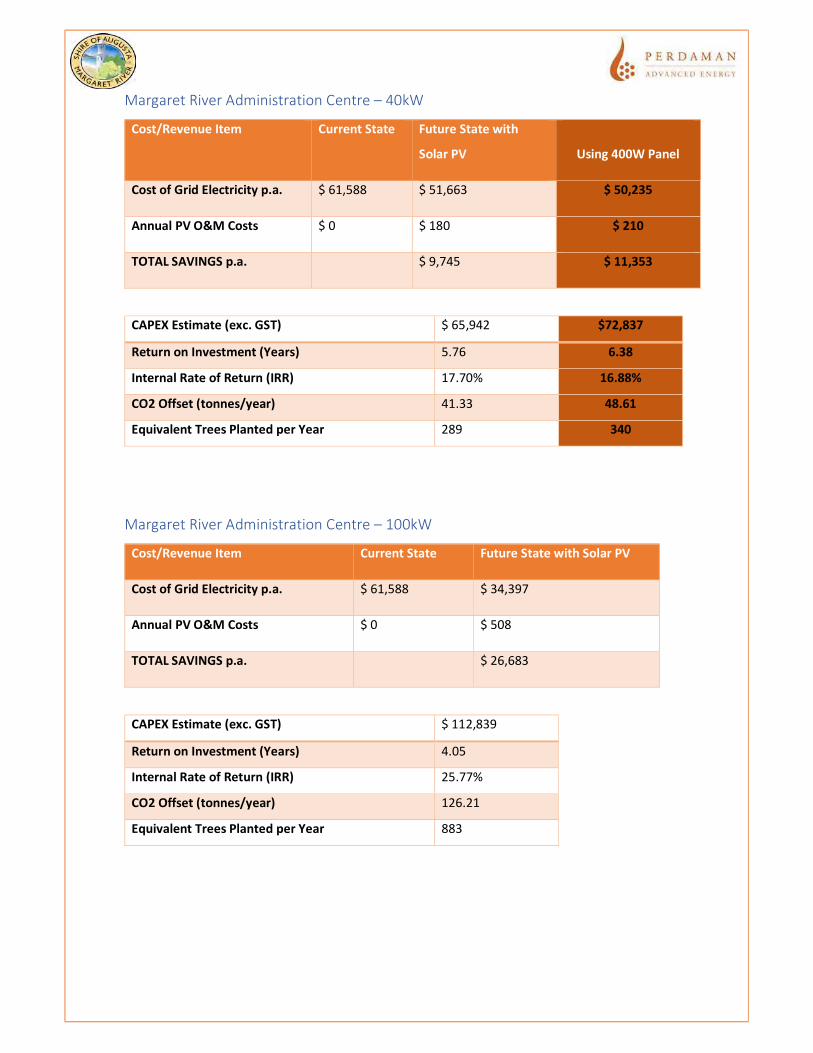
Margaret River Administration Centre – 40kW
Cost/Revenue Item Current State Future State with
Solar PV Using 400W Panel
Cost of Grid Electricity p.a. $ 61,588 $ 51,663 $ 50,235
Annual PV O&M Costs $ 0 $ 180 $ 210
TOTAL SAVINGS p.a. $ 9,745 $ 11,353
Margaret River Administration Centre – 100kW
Cost/Revenue Item Current State Future State with Solar PV
Cost of Grid Electricity p.a. $ 61,588 $ 34,397
Annual PV O&M Costs $ 0 $ 508
TOTAL SAVINGS p.a. $ 26,683
CAPEX Estimate (exc. GST) $ 65,942 $72,837
Return on Investment (Years) 5.76 6.38
Internal Rate of Return (IRR) 17.70% 16.88%
CO2 Offset (tonnes/year) 41.33 48.61
Equivalent Trees Planted per Year 289 340
CAPEX Estimate (exc. GST) $ 112,839
Return on Investment (Years) 4.05
Internal Rate of Return (IRR) 25.77%
CO2 Offset (tonnes/year) 126.21
Equivalent Trees Planted per Year 883
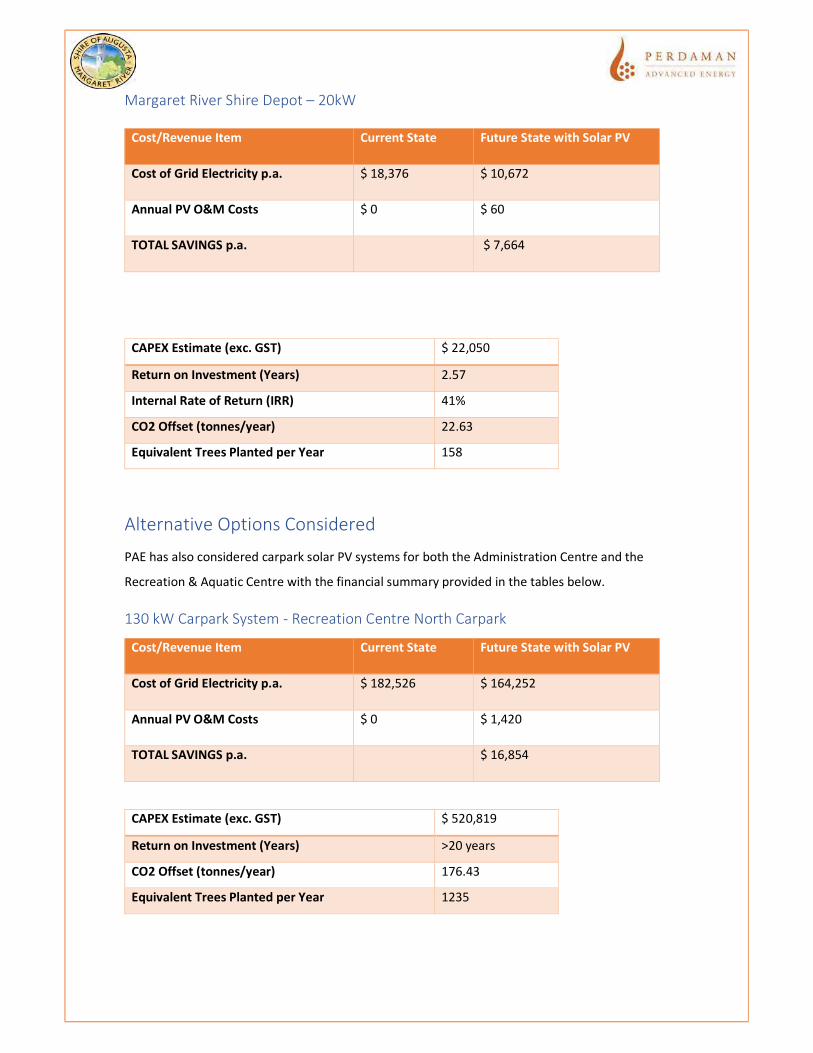
Margaret River Shire Depot – 20kW
Alternative Options Considered
PAE has also considered carpark solar PV systems for both the Administration Centre and the
Recreation & Aquatic Centre with the financial summary provided in the tables below.
130 kW Carpark System - Recreation Centre North Carpark
Cost/Revenue Item Current State Future State with Solar PV
Cost of Grid Electricity p.a. $ 182,526 $ 164,252
Annual PV O&M Costs $ 0 $ 1,420
TOTAL SAVINGS p.a. $ 16,854
Cost/Revenue Item Current State Future State with Solar PV
Cost of Grid Electricity p.a. $ 18,376 $ 10,672
Annual PV O&M Costs $ 0 $ 60
TOTAL SAVINGS p.a. $ 7,664
CAPEX Estimate (exc. GST) $ 22,050
Return on Investment (Years) 2.57
Internal Rate of Return (IRR) 41%
CO2 Offset (tonnes/year) 22.63
Equivalent Trees Planted per Year 158
CAPEX Estimate (exc. GST) $ 520,819
Return on Investment (Years) >20 years
CO2 Offset (tonnes/year) 176.43
Equivalent Trees Planted per Year 1235
This carpark system size was chosen as 130kW while again utilizing the Clean Energy Council
allowance for oversizing the DC capacity compared to the AC compacity by a factor of 1.33. This
creates a generation profile that maximizes morning and afternoon consumption as the June 2019
installation of 60kW will produce electricity to be used during the midday peaks.
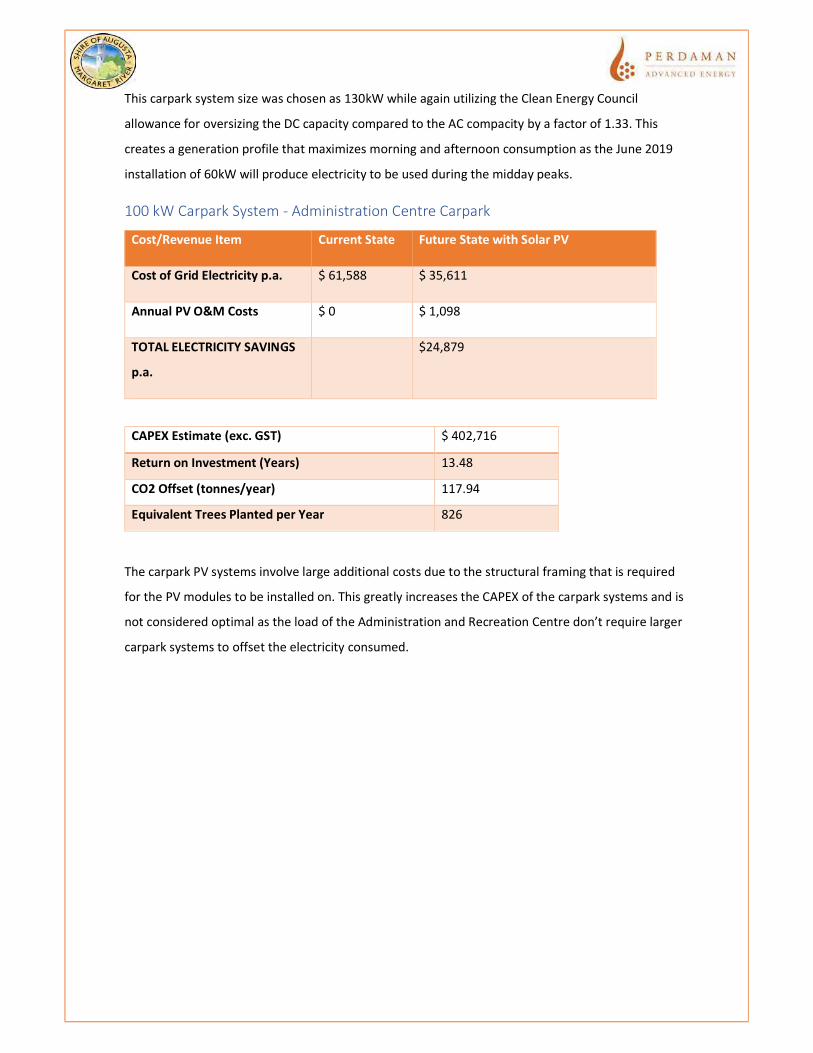
100 kW Carpark System - Administration Centre Carpark
Cost/Revenue Item Current State Future State with Solar PV
Cost of Grid Electricity p.a. $ 61,588 $ 35,611
Annual PV O&M Costs $ 0 $ 1,098
TOTAL ELECTRICITY SAVINGS
p.a.
$24,879
The carpark PV systems involve large additional costs due to the structural framing that is required
for the PV modules to be installed on. This greatly increases the CAPEX of the carpark systems and is
not considered optimal as the load of the Administration and Recreation Centre don’t require larger
carpark systems to offset the electricity consumed.
CAPEX Estimate (exc. GST) $ 402,716
Return on Investment (Years) 13.48
CO2 Offset (tonnes/year) 117.94
Equivalent Trees Planted per Year 826
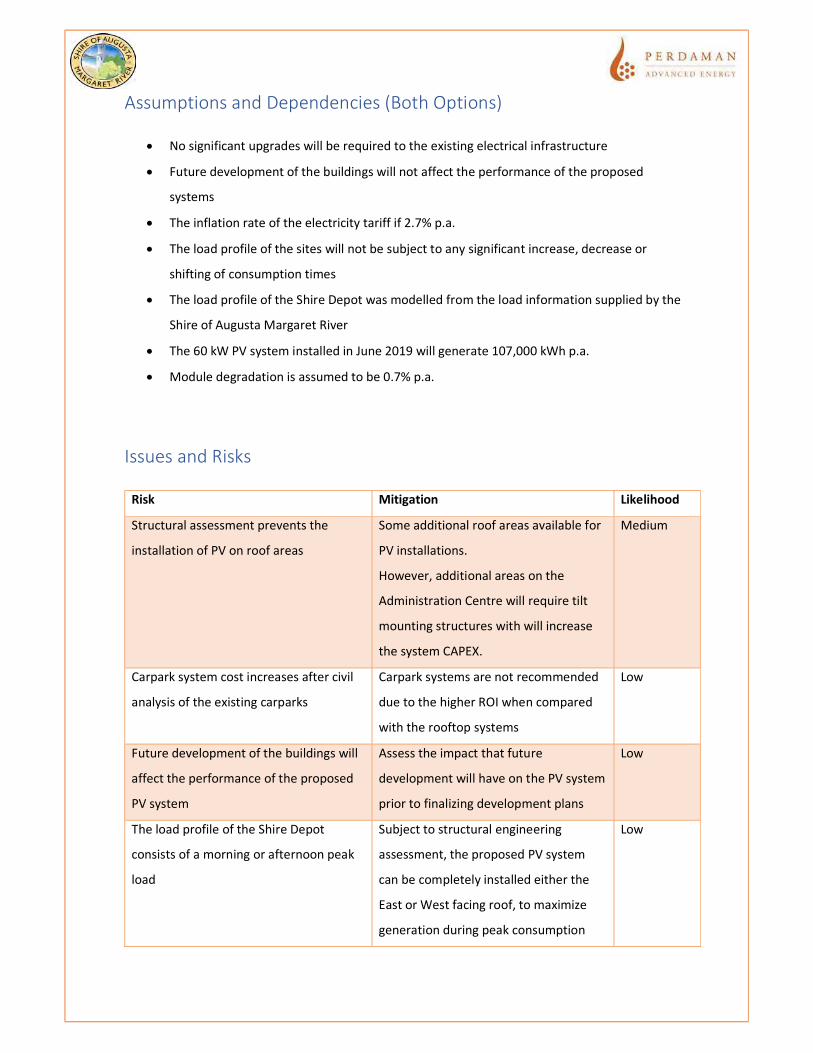
Assumptions and Dependencies (Both Options)
No significant upgrades will be required to the existing electrical infrastructure
Future development of the buildings will not affect the performance of the proposed
systems
The inflation rate of the electricity tariff if 2.7% p.a.
The load profile of the sites will not be subject to any significant increase, decrease or
shifting of consumption times
The load profile of the Shire Depot was modelled from the load information supplied by the
Shire of Augusta Margaret River
The 60 kW PV system installed in June 2019 will generate 107,000 kWh p.a.
Module degradation is assumed to be 0.7% p.a.
Issues and Risks
Risk Mitigation Likelihood
Structural assessment prevents the
installation of PV on roof areas
Some additional roof areas available for
PV installations.
However, additional areas on the
Administration Centre will require tilt
mounting structures with will increase
the system CAPEX.
Medium
Carpark system cost increases after civil
analysis of the existing carparks
Carpark systems are not recommended
due to the higher ROI when compared
with the rooftop systems
Low
Future development of the buildings will
affect the performance of the proposed
PV system
Assess the impact that future
development will have on the PV system
prior to finalizing development plans
Low
The load profile of the Shire Depot
consists of a morning or afternoon peak
load
Subject to structural engineering
assessment, the proposed PV system
can be completely installed either the
East or West facing roof, to maximize
generation during peak consumption
Low
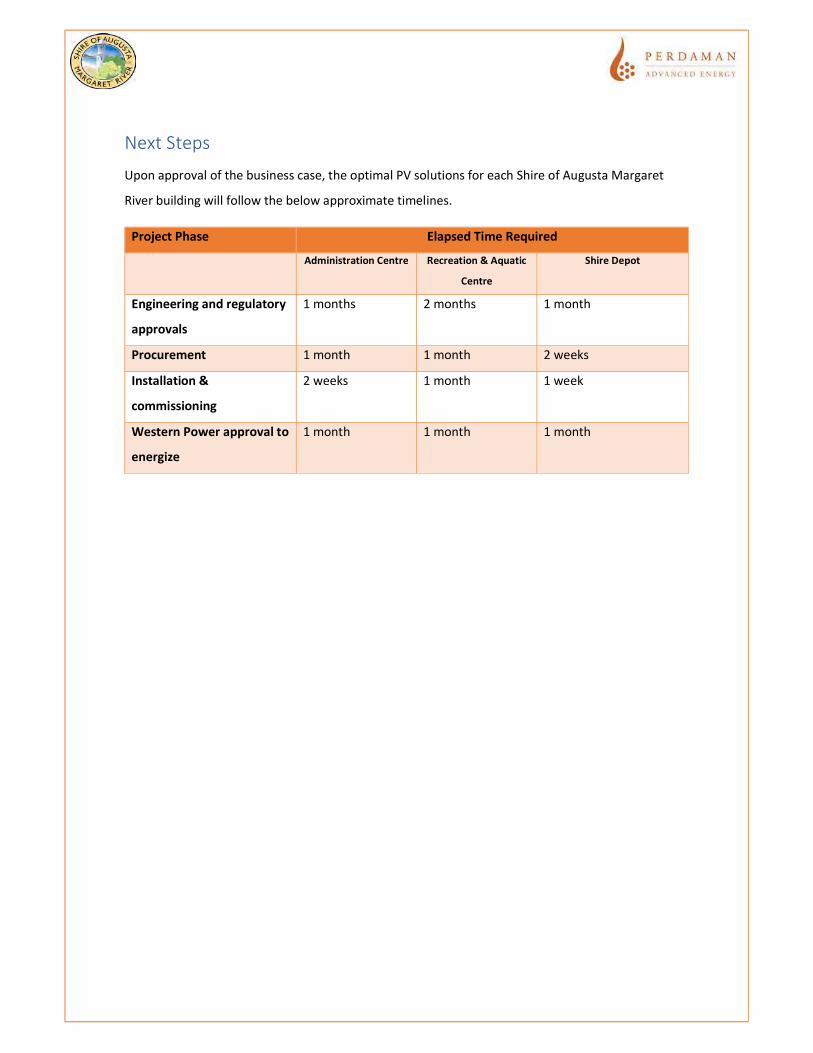
Next Steps
Upon approval of the business case, the optimal PV solutions for each Shire of Augusta Margaret
River building will follow the below approximate timelines.
Project Phase Elapsed Time Required
Administration Centre Recreation & Aquatic
Centre
Shire Depot
Engineering and regulatory
approvals
1 months 2 months 1 month
Procurement 1 month 1 month 2 weeks
Installation &
commissioning
2 weeks 1 month 1 week
Western Power approval to
energize
1 month 1 month 1 month
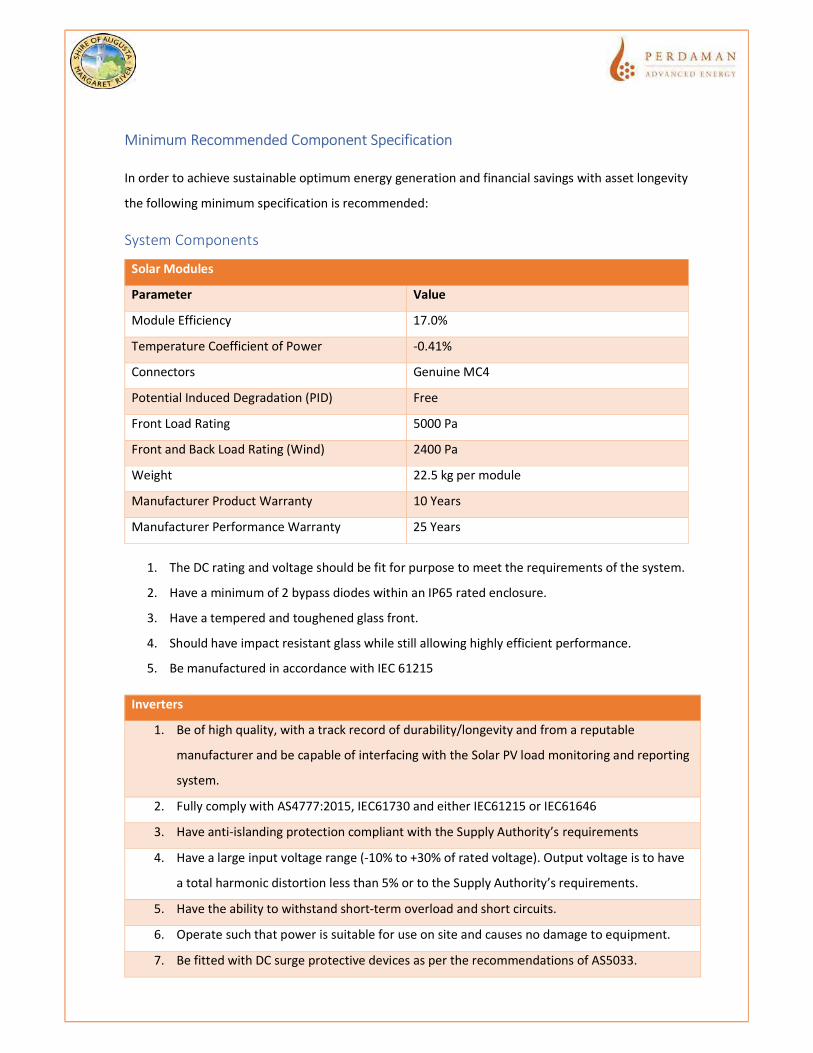
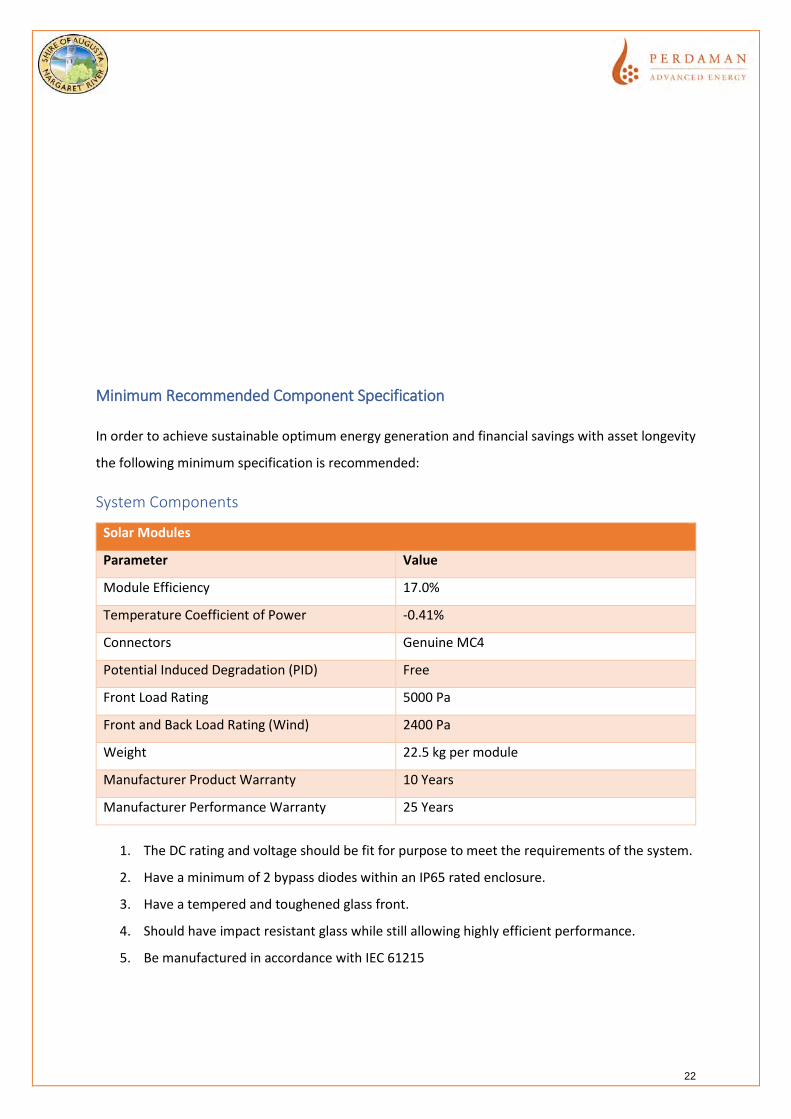
Minimum Recommended Component Specification
In order to achieve sustainable optimum energy generation and financial savings with asset longevity
the following minimum specification is recommended:
System Components
Solar Modules
Parameter Value
Module Efficiency 17.0%
Temperature Coefficient of Power -0.41%
Connectors Genuine MC4
Potential Induced Degradation (PID) Free
Front Load Rating 5000 Pa
Front and Back Load Rating (Wind) 2400 Pa
Weight 22.5 kg per module
Manufacturer Product Warranty 10 Years
Manufacturer Performance Warranty 25 Years
1. The DC rating and voltage should be fit for purpose to meet the requirements of the system.
2. Have a minimum of 2 bypass diodes within an IP65 rated enclosure.
3. Have a tempered and toughened glass front.
4. Should have impact resistant glass while still allowing highly efficient performance.
5. Be manufactured in accordance with IEC 61215
Inverters
1. Be of high quality, with a track record of durability/longevity and from a reputable
manufacturer and be capable of interfacing with the Solar PV load monitoring and reporting
system.
2. Fully comply with AS4777:2015, IEC61730 and either IEC61215 or IEC61646
3. Have anti-islanding protection compliant with the Supply Authority’s requirements
4. Have a large input voltage range (-10% to +30% of rated voltage). Output voltage is to have
a total harmonic distortion less than 5% or to the Supply Authority’s requirements.
5. Have the ability to withstand short-term overload and short circuits.
6. Operate such that power is suitable for use on site and causes no damage to equipment.
7. Be fitted with DC surge protective devices as per the recommendations of AS5033.
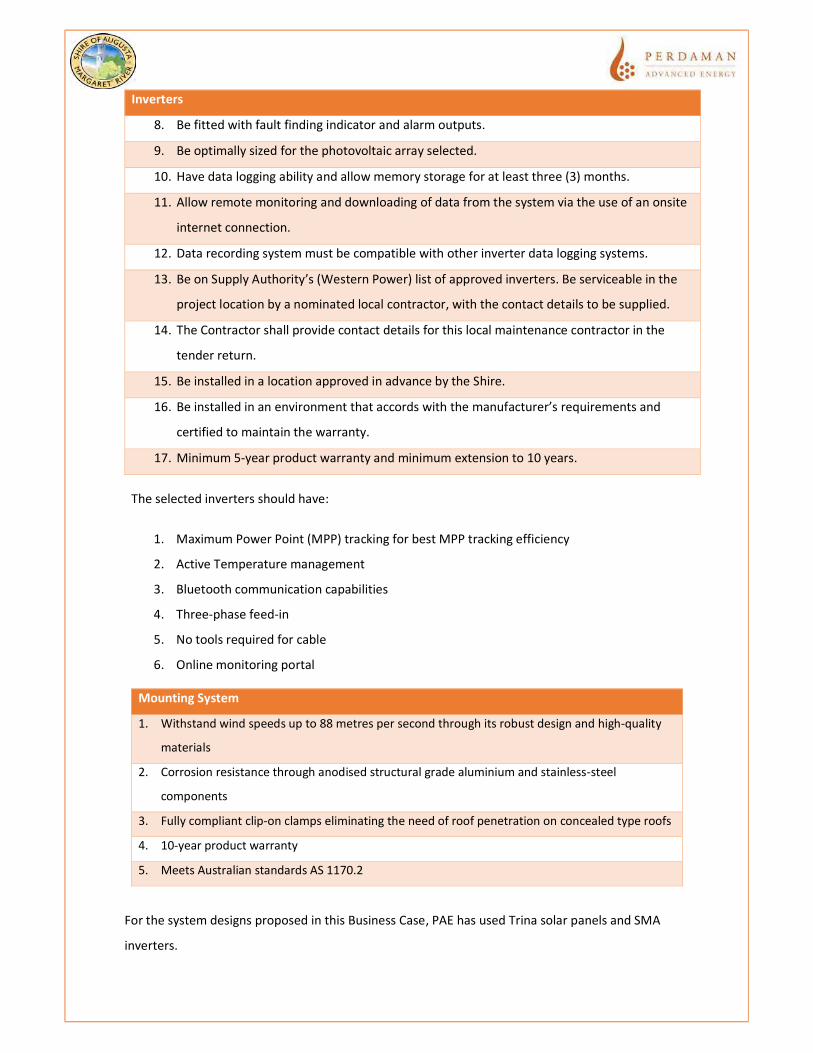
Inverters
8. Be fitted with fault finding indicator and alarm outputs.
9. Be optimally sized for the photovoltaic array selected.
10. Have data logging ability and allow memory storage for at least three (3) months.
11. Allow remote monitoring and downloading of data from the system via the use of an onsite
internet connection.
12. Data recording system must be compatible with other inverter data logging systems.
13. Be on Supply Authority’s (Western Power) list of approved inverters. Be serviceable in the
project location by a nominated local contractor, with the contact details to be supplied.
14. The Contractor shall provide contact details for this local maintenance contractor in the
tender return.
15. Be installed in a location approved in advance by the Shire.
16. Be installed in an environment that accords with the manufacturer’s requirements and
certified to maintain the warranty.
17. Minimum 5-year product warranty and minimum extension to 10 years.
The selected inverters should have:
1. Maximum Power Point (MPP) tracking for best MPP tracking efficiency
2. Active Temperature management
3. Bluetooth communication capabilities
4. Three-phase feed-in
5. No tools required for cable
6. Online monitoring portal
Mounting System
1. Withstand wind speeds up to 88 metres per second through its robust design and high-quality
materials
2. Corrosion resistance through anodised structural grade aluminium and stainless-steel
components
3. Fully compliant clip-on clamps eliminating the need of roof penetration on concealed type roofs
4. 10-year product warranty
5. Meets Australian standards AS 1170.2
For the system designs proposed in this Business Case, PAE has used Trina solar panels and SMA
inverters.
Minimum Recommended Component Specification
In order to achieve sustainable optimum energy generation and financial savings with asset longevity
the following minimum specification is recommended:
System Components
Solar Modules
Parameter Value
Module Efficiency 17.0%
Temperature Coefficient of Power -0.41%
Connectors Genuine MC4
Potential Induced Degradation (PID) Free
Front Load Rating 5000 Pa
Front and Back Load Rating (Wind) 2400 Pa
Weight 22.5 kg per module
Manufacturer Product Warranty 10 Years
Manufacturer Performance Warranty 25 Years
1. The DC rating and voltage should be fit for purpose to meet the requirements of the system.
2. Have a minimum of 2 bypass diodes within an IP65 rated enclosure.
3. Have a tempered and toughened glass front.
4. Should have impact resistant glass while still allowing highly efficient performance.
5. Be manufactured in accordance with IEC 61215
22

Inverters
1. Be of high quality, with a track record of durability/longevity and from a reputable
manufacturer and be capable of interfacing with the Solar PV load monitoring and reporting
system.
2. Fully comply with AS4777:2015, IEC61730 and either IEC61215 or IEC61646
3. Have anti-islanding protection compliant with the Supply Authority’s requirements
4. Have a large input voltage range (-10% to +30% of rated voltage). Output voltage is to have
a total harmonic distortion less than 5% or to the Supply Authority’s requirements.
5. Have the ability to withstand short-term overload and short circuits.
6. Operate such that power is suitable for use on site and causes no damage to equipment.
7. Be fitted with DC surge protective devices as per the recommendations of AS5033.
8. Be fitted with fault finding indicator and alarm outputs.
9. Be optimally sized for the photovoltaic array selected.
10. Have data logging ability and allow memory storage for at least three (3) months.
11. Allow remote monitoring and downloading of data from the system via the use of an onsite
internet connection.
12. Data recording system must be compatible with other inverter data logging systems.
13. Be on Supply Authority’s (Western Power) list of approved inverters. Be serviceable in the
project location by a nominated local contractor, with the contact details to be supplied.
14. The Contractor shall provide contact details for this local maintenance contractor in the
tender return.
15. Be installed in a location approved in advance by the Shire.
16. Be installed in an environment that accords with the manufacturer’s requirements and
certified to maintain the warranty.
17. Minimum 5-year product warranty and minimum extension to 10 years.
The selected inverters should have:
1. Maximum Power Point (MPP) tracking for best MPP tracking efficiency
2. Active Temperature management
3. Bluetooth communication capabilities
4. Three-phase feed-in
5. No tools required for cable
6. Online monitoring portal
Mounting System
23

1. Withstand wind speeds up to 88 metres per second through its robust design and high-quality
materials
2. Corrosion resistance through anodised structural grade aluminium and stainless-steel
components
3. Fully compliant clip-on clamps eliminating the need of roof penetration on concealed type roofs.
4. 10-year product warranty
5. Meets Australian standards AS 1170.2
For the system designs proposed in this Business Case, PAE has used Trina solar panels and SMA
inverters.
24
Shire of Augusta
Margaret River
Solar PV Business Case – Additional
Investigation
PAE Job No: 19-118
25
Contents
Background ............................................................................................................................................. 3
Battery Storage Options .......................................................................................................................... 3
Margaret River Administration Centre ............................................................................................... 3
Margaret River Recreation & Aquatic Centre ..................................................................................... 5
Cost Benefit Analysis ............................................................................................................................... 6
Margaret River Administration Centre – 100kW ................................................................................ 6
Margaret River Recreation & Aquatic Centre – 210kW Rooftop & Carpark System .......................... 7
Power Purchase Agreement (PPA) .......................................................................................................... 7
Financial Calculations .............................................................................................................................. 8
Next Steps ............................................................................................................................................. 10
APPENDIX A – Discounted Cash Flow Tables ........................................................................................ 11
26
Background
As part of the Shire of Augusta Margaret River commitment to reducing greenhouse gas emissions
from its corporate operations, Perdaman Advanced Energy (PAE) was engaged in early 2019 to
provide options for the installation of solar PV systems at several Shire owned buildings. Further to
this initial investigation and solution design, the Shire requested PAE to conduct further investigation
surrounding the incorporation of battery storage into the Administration Building and Recreation
Centre systems while also providing more detail into the financial analysis of the systems.
Battery Storage Options
Margaret River Administration Centre
In the previously proposed solar PV system, PAE sized the AC capacity of the solar inverters to be
less than the DC capacity of the solar arrays in order to maximize the morning and afternoon
generation while minimizing the excess energy exported back into the grid. For the proposed solar
plus battery system, additional excess electricity produced during the middle of the day is valuable
as it can be stored within the battery system for use at a time when the Administration Centre’s load
is not being covered by PV generation. Therefore, PAE has increased the AC capacity of the solar
system to take full advantage of the solar storage system.
Using this excess solar generated electricity and through the determination of a constant night time
load of approximately 10kW at the Administration Centre, PAE has proposed a 119kWh/30kVA
lithium ion battery system coupled with the previously proposed 100kW rooftop PV. This will allow
the Shire to store the excess energy generated by the rooftop solar during the day for use during the
evening and night time when the PV system is not generating, to produce a reduction in the amount
of grid electricity purchases required to meet the Administration Centre load.
The 119kWh capacity of the battery allows savings to be achieved while a battery charge controller
maintains the discharge cycles within the maximum depth of discharge parameters in order to
prolong battery life.
27
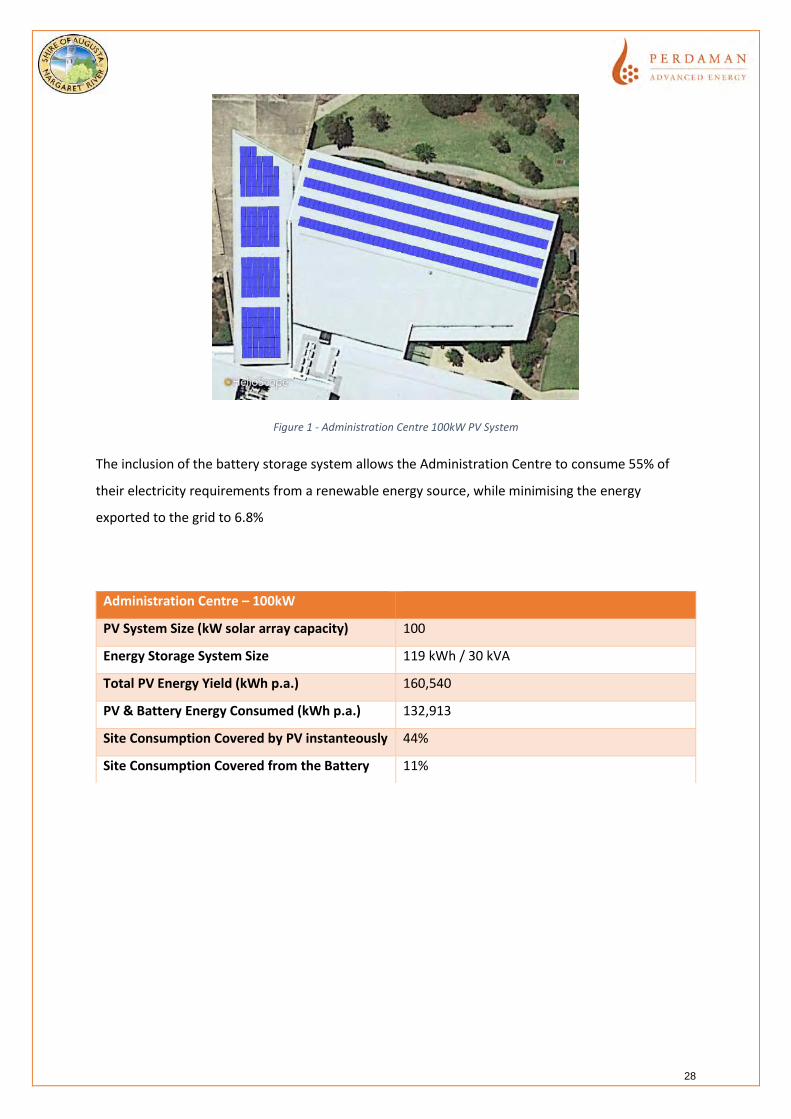
Figure 1 - Administration Centre 100kW PV System
The inclusion of the battery storage system allows the Administration Centre to consume 55% of
their electricity requirements from a renewable energy source, while minimising the energy
exported to the grid to 6.8%
Administration Centre – 100kW
PV System Size (kW solar array capacity) 100
Energy Storage System Size 119 kWh / 30 kVA
Total PV Energy Yield (kWh p.a.) 160,540
PV & Battery Energy Consumed (kWh p.a.) 132,913
Site Consumption Covered by PV instanteously 44%
Site Consumption Covered from the Battery 11%
28
Margaret River Recreation & Aquatic Centre
In the initial business case delivered in early 2019, PAE proposed an optimally sized 80 kW rooftop
solar PV system for the Recreation & Aquatic Centre to compliment to two existing 21kW & 60kW
rooftop systems installed previously. This allowed the Shire to generate almost all their daytime
peak (10am -2pm) electricity requirements from installed PV system, however due to outdoor sports
lighting requirements and the use of pool pumps, a significant portion of electricity was consumed
during the night time without being offset by PV generation.
Due to the large night time load requirements of the Recreation & Aquatic Centre combined with
the proposed additional 80kW PV system being optimally sized to minimize export to the grid, a
battery storage option with this system was not considered a feasible option. However, in order to
provide the Shire with an analysis of battery storage for the Recreation Centre, the option of a 130
kW solar carpark located to the North of the Recreation Centre, combined with the additional 80 kW
rooftop system (210 kW total) has been considered.
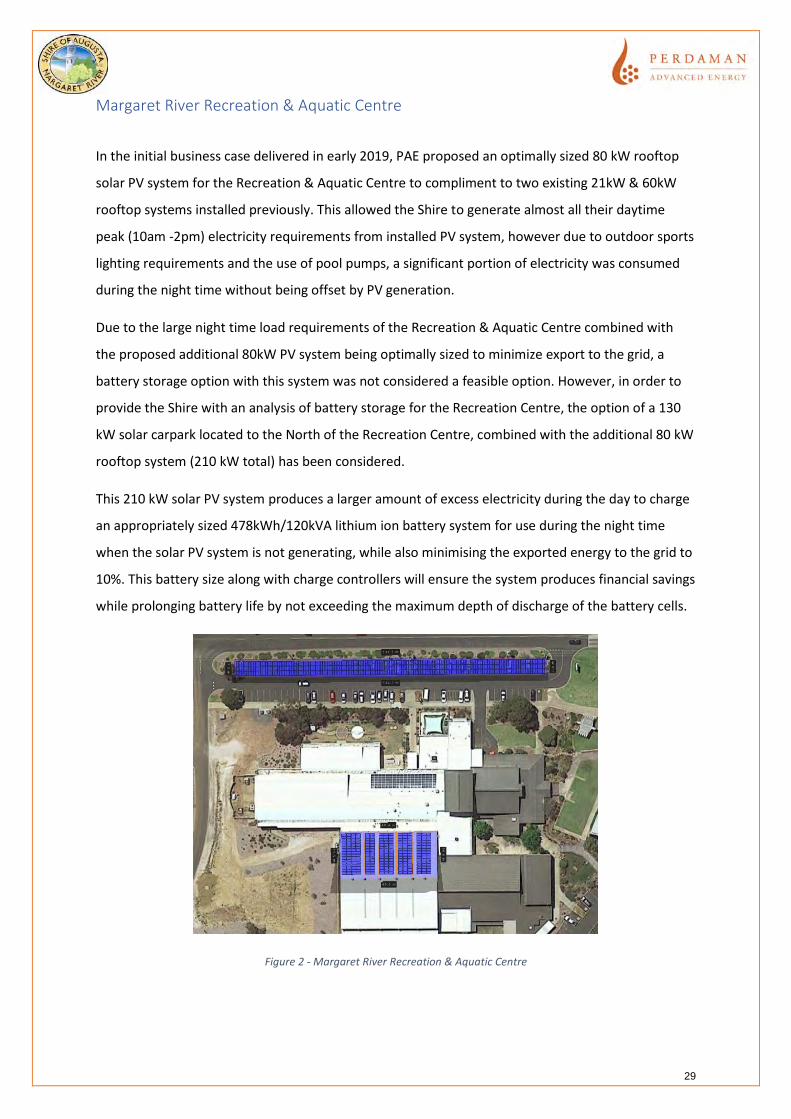
This 210 kW solar PV system produces a larger amount of excess electricity during the day to charge
an appropriately sized 478kWh/120kVA lithium ion battery system for use during the night time
when the solar PV system is not generating, while also minimising the exported energy to the grid to
10%. This battery size along with charge controllers will ensure the system produces financial savings
while prolonging battery life by not exceeding the maximum depth of discharge of the battery cells.
Figure 2 - Margaret River Recreation & Aquatic Centre
29
Recreation & Aquatic Centre
System Size (kW solar array capacity) 210
Energy Storage System Size 478 kWh / 120 kVA
Total PV Energy Yield (kWh p.a.) 347,562
PV & Battery Energy Consumed (kWh p.a.) 312,030
Site Consumption Covered by PV instanteously 28%
Site Consumption Covered by Battery 12%
*Assumes that the 60kW system scheduled for installation in June 2019, generates 107,000 kWh p.a.
Cost Benefit Analysis
The cost benefit analysis to determine the overall viability of installing the proposed solar and BESS
systems for each building is summarised in the tables below.
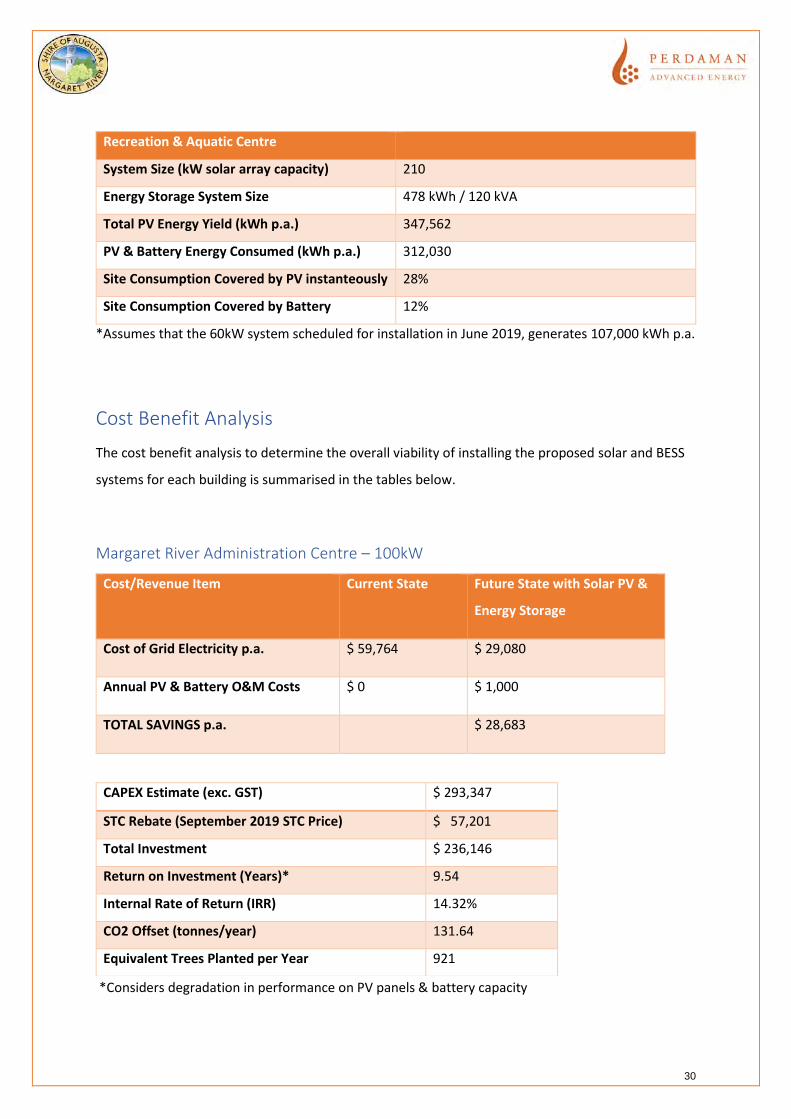
Margaret River Administration Centre – 100kW
Cost/Revenue Item Current State Future State with Solar PV &
Energy Storage
Cost of Grid Electricity p.a. $ 59,764 $ 29,080
Annual PV & Battery O&M Costs $ 0 $ 1,000
TOTAL SAVINGS p.a. $ 28,683
*Considers degradation in performance on PV panels & battery capacity
CAPEX Estimate (exc. GST) $ 293,347
STC Rebate (September 2019 STC Price) $ 57,201
Total Investment $ 236,146
Return on Investment (Years)* 9.54
Internal Rate of Return (IRR) 14.32%
CO2 Offset (tonnes/year) 131.64
Equivalent Trees Planted per Year 921
30
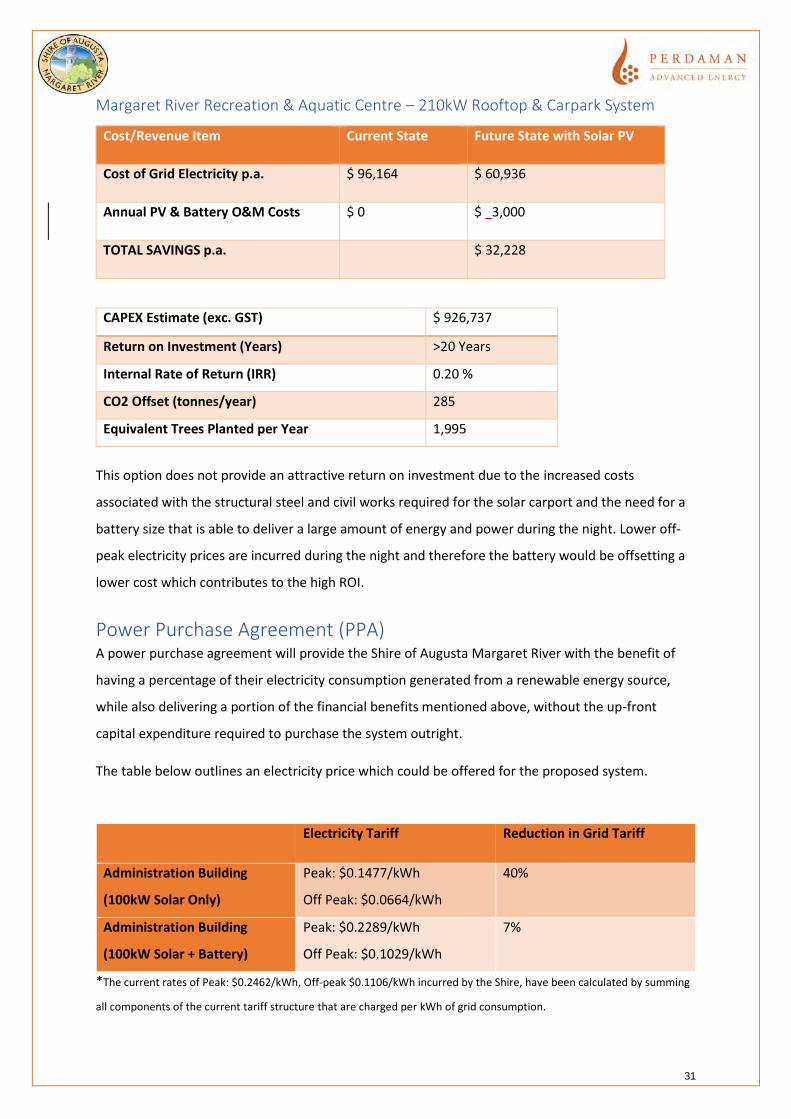
Margaret River Recreation & Aquatic Centre – 210kW Rooftop & Carpark System
Cost/Revenue Item Current State Future State with Solar PV
Cost of Grid Electricity p.a. $ 96,164 $ 60,936
Annual PV & Battery O&M Costs $ 0 $ 3,000
TOTAL SAVINGS p.a. $ 32,228
This option does not provide an attractive return on investment due to the increased costs
associated with the structural steel and civil works required for the solar carport and the need for a
battery size that is able to deliver a large amount of energy and power during the night. Lower off-
peak electricity prices are incurred during the night and therefore the battery would be offsetting a
lower cost which contributes to the high ROI.
Power Purchase Agreement (PPA) A power purchase agreement will provide the Shire of Augusta Margaret River with the benefit of
having a percentage of their electricity consumption generated from a renewable energy source,
while also delivering a portion of the financial benefits mentioned above, without the up-front
capital expenditure required to purchase the system outright.
The table below outlines an electricity price which could be offered for the proposed system.
Electricity Tariff Reduction in Grid Tariff
Administration Building
(100kW Solar Only)
Peak: $0.1477/kWh
Off Peak: $0.0664/kWh
40%
Administration Building
(100kW Solar + Battery)
Peak: $0.2289/kWh
Off Peak: $0.1029/kWh
7%
*The current rates of Peak: $0.2462/kWh, Off-peak $0.1106/kWh incurred by the Shire, have been calculated by summing
all components of the current tariff structure that are charged per kWh of grid consumption.
CAPEX Estimate (exc. GST) $ 926,737
Return on Investment (Years) >20 Years
Internal Rate of Return (IRR) 0.20 %
CO2 Offset (tonnes/year) 285
Equivalent Trees Planted per Year 1,995
31
Due to the unbundled tariff structure and low peak and off peak rates incurred at the Recreation and
Aquatic Centre, a power purchase agreement tariff will exceed the current electricity costs incurred
by the Shire. However, a bundled price from the grid combined with a PPA (solar and battery) may
provide a total lower cost (savings) for the Shire.
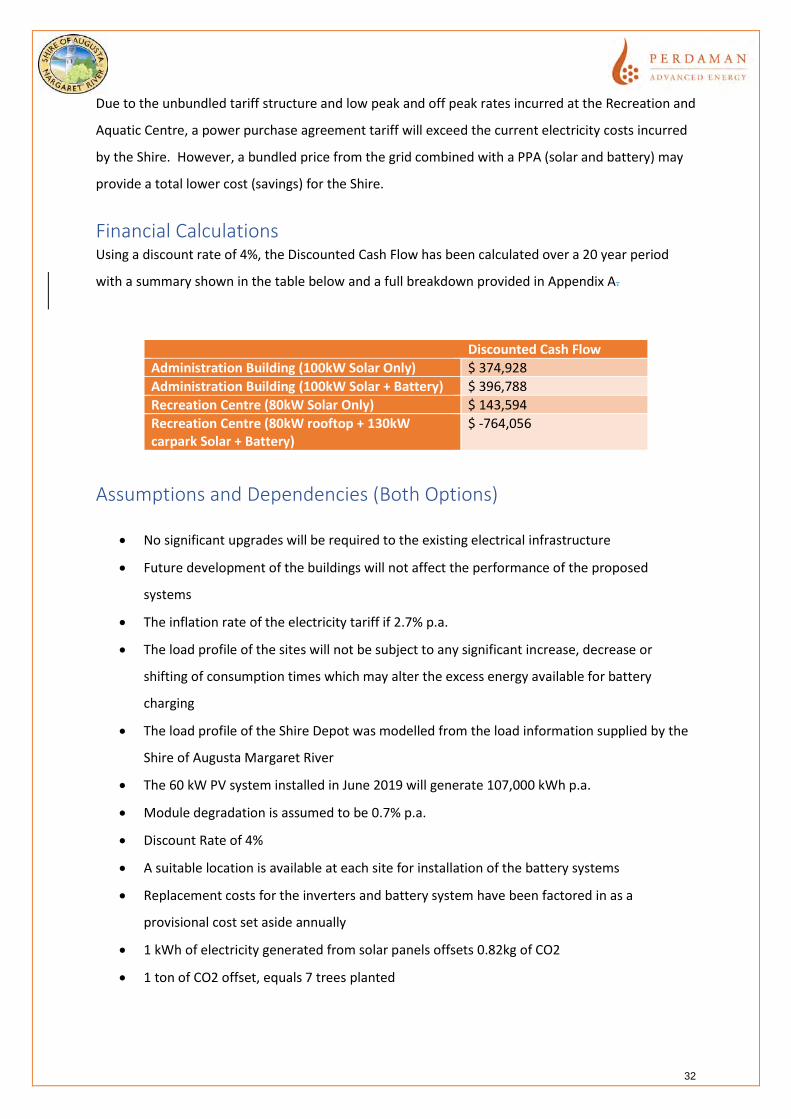
Financial Calculations Using a discount rate of 4%, the Discounted Cash Flow has been calculated over a 20 year period
with a summary shown in the table below and a full breakdown provided in Appendix A.
Discounted Cash Flow
Administration Building (100kW Solar Only) $ 374,928
Administration Building (100kW Solar + Battery) $ 396,788
Recreation Centre (80kW Solar Only) $ 143,594
Recreation Centre (80kW rooftop + 130kW carpark Solar + Battery)
$ -764,056
Assumptions and Dependencies (Both Options)
• No significant upgrades will be required to the existing electrical infrastructure
• Future development of the buildings will not affect the performance of the proposed
systems
• The inflation rate of the electricity tariff if 2.7% p.a.
• The load profile of the sites will not be subject to any significant increase, decrease or
shifting of consumption times which may alter the excess energy available for battery
charging
• The load profile of the Shire Depot was modelled from the load information supplied by the
Shire of Augusta Margaret River
• The 60 kW PV system installed in June 2019 will generate 107,000 kWh p.a.
• Module degradation is assumed to be 0.7% p.a.
• Discount Rate of 4%
• A suitable location is available at each site for installation of the battery systems
• Replacement costs for the inverters and battery system have been factored in as a
provisional cost set aside annually
• 1 kWh of electricity generated from solar panels offsets 0.82kg of CO2
• 1 ton of CO2 offset, equals 7 trees planted
32
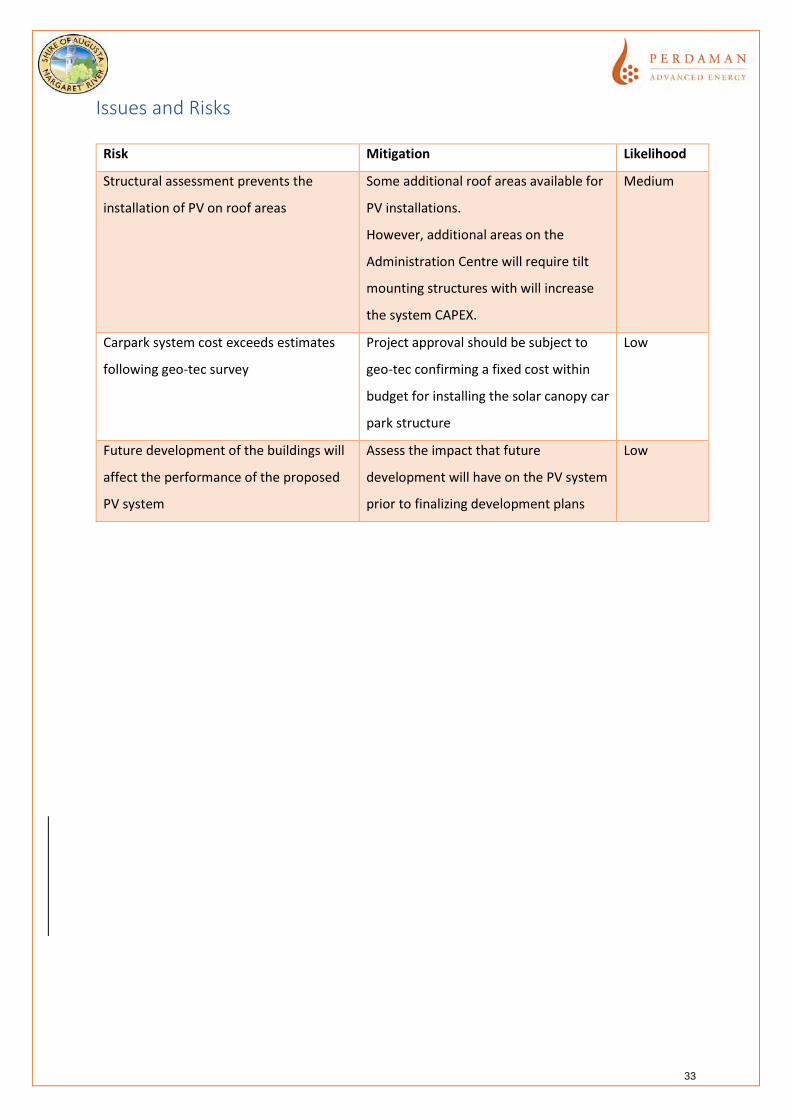
Issues and Risks
Risk Mitigation Likelihood
Structural assessment prevents the
installation of PV on roof areas
Some additional roof areas available for
PV installations.
However, additional areas on the
Administration Centre will require tilt
mounting structures with will increase
the system CAPEX.
Medium
Carpark system cost exceeds estimates
following geo-tec survey
Project approval should be subject to
geo-tec confirming a fixed cost within
budget for installing the solar canopy car
park structure
Low
Future development of the buildings will
affect the performance of the proposed
PV system
Assess the impact that future
development will have on the PV system
prior to finalizing development plans
Low
33

Next Steps
The following schedule is indicative of the timeframe required to implement the proposed PV and
battery energy storage system projects.
Project Phase
Administration Centre Recreation & Aquatic Centre
Engineering and regulatory
approvals
2 months 4 months
Procurement 6 weeks 2 months
Installation &
commissioning
6 weeks 3 months
Western Power approval to
energize
1 month 1 month
34
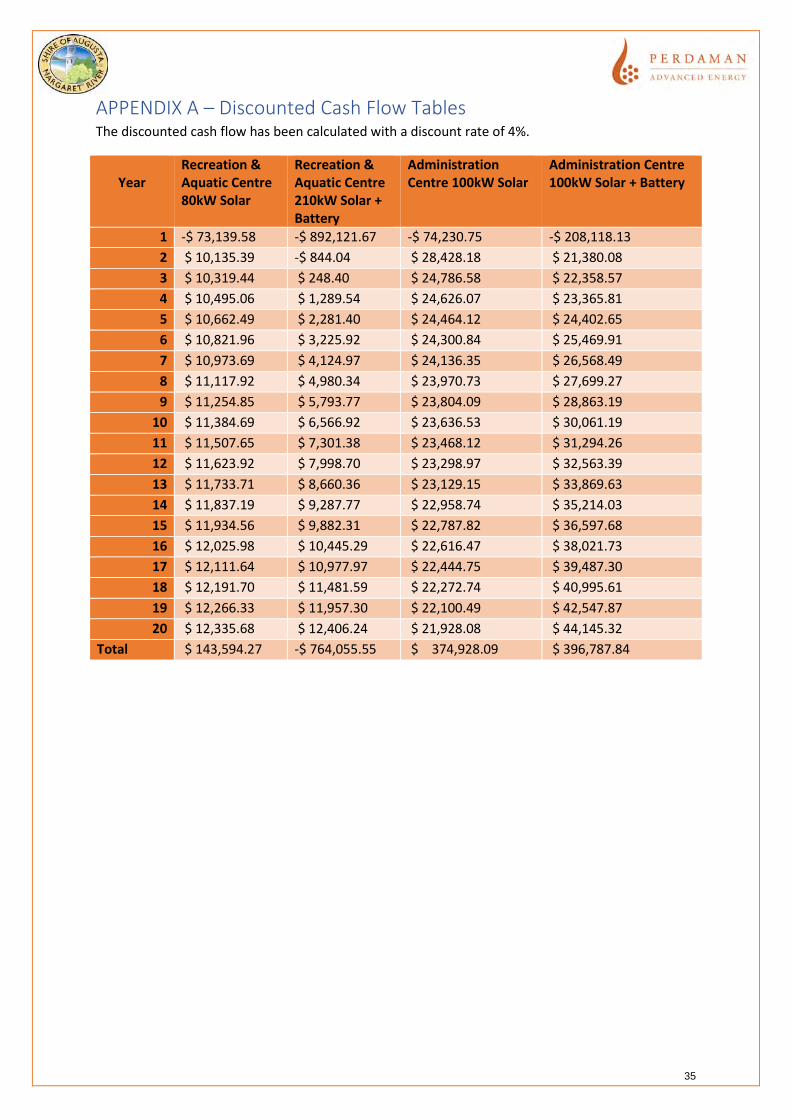
APPENDIX A – Discounted Cash Flow Tables The discounted cash flow has been calculated with a discount rate of 4%.
Year
Recreation & Aquatic Centre 80kW Solar
Recreation & Aquatic Centre 210kW Solar + Battery
Administration Centre 100kW Solar
Administration Centre 100kW Solar + Battery
1 -$ 73,139.58 -$ 892,121.67 -$ 74,230.75 -$ 208,118.13
2 $ 10,135.39 -$ 844.04 $ 28,428.18 $ 21,380.08
3 $ 10,319.44 $ 248.40 $ 24,786.58 $ 22,358.57
4 $ 10,495.06 $ 1,289.54 $ 24,626.07 $ 23,365.81
5 $ 10,662.49 $ 2,281.40 $ 24,464.12 $ 24,402.65
6 $ 10,821.96 $ 3,225.92 $ 24,300.84 $ 25,469.91
7 $ 10,973.69 $ 4,124.97 $ 24,136.35 $ 26,568.49
8 $ 11,117.92 $ 4,980.34 $ 23,970.73 $ 27,699.27
9 $ 11,254.85 $ 5,793.77 $ 23,804.09 $ 28,863.19
10 $ 11,384.69 $ 6,566.92 $ 23,636.53 $ 30,061.19
11 $ 11,507.65 $ 7,301.38 $ 23,468.12 $ 31,294.26
12 $ 11,623.92 $ 7,998.70 $ 23,298.97 $ 32,563.39
13 $ 11,733.71 $ 8,660.36 $ 23,129.15 $ 33,869.63
14 $ 11,837.19 $ 9,287.77 $ 22,958.74 $ 35,214.03
15 $ 11,934.56 $ 9,882.31 $ 22,787.82 $ 36,597.68
16 $ 12,025.98 $ 10,445.29 $ 22,616.47 $ 38,021.73
17 $ 12,111.64 $ 10,977.97 $ 22,444.75 $ 39,487.30
18 $ 12,191.70 $ 11,481.59 $ 22,272.74 $ 40,995.61
19 $ 12,266.33 $ 11,957.30 $ 22,100.49 $ 42,547.87
20 $ 12,335.68 $ 12,406.24 $ 21,928.08 $ 44,145.32
Total $ 143,594.27 -$ 764,055.55 $ 374,928.09 $ 396,787.84
35

SHIRE OF AUGUSTA MARGARET RIVER ORDINARY COUNCIL MEETING 11 DECEMBER 2019
11.2 Sustainable Development 11.2.2 LIMESTONE CLIFF STABILITY ASSESSMENT
Attachment 1 – Limestone Stability Assessment – Inspection, Risk Assessment and Remediation Design Report (2019)
36
www.cmwgeosciences.com
25 October 2019
LIMESTONE STABILTY ASSESSMENT
GRACETOWN, PREVELLY, GNARABUP, WESTERN
AUSTRALIA
INSPECTION, RISK ASSESSMENT AND
REMEDIATION DESIGN REPORT
Shire of Augusta Margaret River, Margaret River WA 6285
PER2019-0229AA Rev 1
37

MARGARET RIVER – LIMESTONE CLIFF STABILITY ASSESSMENT REPORT 25 OCTOBER 2019
CMW Geosciences Ref. PER2019-0229AA Rev 1 i
PER2019-0229AA Date Revision Comments 18 October 2019 A Draft Report 23 October 2019 0 Final including Monitoring Protocol as Appendix E 25 October 2019 1 Final incorporating comments from Shire of Augusta
Margaret River
38
MARGARET RIVER – LIMESTONE CLIFF STABILITY ASSESSMENT REPORT 25 OCTOBER 2019
CMW Geosciences Ref. PER2019-0229AA Rev 1 ii
Table of Contents 1 INTRODUCTION ....................................................................................................... 3
2 PROJECT BACKGROUND ........................................................................................... 3
3 PROVIDED INFORMATION ....................................................................................... 4
4 SITE INSPECTION AND RECOMMENDATIONS ............................................................ 4
4.1 Site ID: GC6 - 60 (Southpoint carpark) ................................................................................. 5 4.2 Site ID: GC6 - 15 (Gracetown – Southpoint lookout) ............................................................ 6 4.3 Site ID: GC5 - 75 (Gracetown – cliffs south of stairs) ........................................................... 6 4.4 Site ID: PR4 - 30 (Surfers Point) ........................................................................................... 8 4.5 Site ID: PR6 - 85 (Cliffs at Riflebutts Beach) ...................................................................... 10 4.6 Site ID: GN5 - 5 (Stairs leading to upper car park from White Elephant) ........................... 12
5 FUTURE MONITORING PROTOCOL ......................................................................... 14
6 REFERENCES .......................................................................................................... 14
7 CLOSURE ............................................................................................................... 15
Appendices
Appendix A – Scope of Work and Methodology
Appendix B – Site Observations and Photographs
Appendix C – Remedial Work Drawings (Draft) prepared by Civil and Structural Consulting Pty Ltd
Appendix D – Risk Assessment
Appendix E – Monitoring Protocol for Shire of Augusta Margaret River Staff
39
MARGARET RIVER – LIMESTONE CLIFF STABILITY ASSESSMENT REPORT 25 OCTOBER 2019
CMW Geosciences Ref. PER2019-0229AA Rev 1 3
1 INTRODUCTION
On 22 August 2019 CMW Geosciences Pty Ltd (CMW) was commissioned by Shire of Augusta Margaret River by way of a signed contract and Purchase Order 124298 to carry out Contract RFQ 051909. This was a Limestone cliff stability assessment and design of remedial/mitigation works to manage rockfall or ground instability risk to people and property.
Details of the scope of work and methodology are documented our response to the RFQ 051909 dated 2 August 2019 (the Proposal) and provided (without costing) in Appendix A.
In summary the commission requires the consultant (CMW Geosciences) to provide the Shire of Augusta Margaret River (SAMR) with additional advice and information surrounding a study and recommendation made by Golder Associates in 2017 in relation Limestone Cliff Stability and to undertake the design of remediation/risk mitigation works at four specific locations. This report contains the review, assessment of current conditions and design of remediation/risk mitigation works. A cost estimate for the works is provided under separate correspondence.
As per our Proposal, CMW engaged Civil/Structural Consulting Pty Ltd to undertake a joint inspection with us and to undertake the structural and civil design of remediation/risk mitigation works, prepare drawings and specifications and provide cost estimates for the remedial works.
The joint inspection was made by Matthew Tutton, Senior Principal Engineering Geologist from CMW and Tim Moore, director of Civil/Structural Consulting Pty Ltd on Monday 19 August 2019.
A site visit was made by four personnel from the Shire of Augusta Margaret River accompanied by Matthew Tutton of CMW to visit the Prevelly and Gnarabup sites followed by a risk and options workshop at the Shire offices on Tuesday 20 August 2019, as per the Proposal. Subsequent site visits were made on 2 September 2019 to survey undercuts at Prevelly and Gnarabup and on 11 October to set out reference points for future surveys.
2 PROJECT BACKGROUND
A few studies have been undertaken for the Shire of Augusta Margaret River to quantify geotechnical risk to people and assets from coastal cliff stability and rockfalls and to inform the SAMR on geotechnical constraints prior to undertaking redevelopment works.
One of the most recent studies undertaken for SAMR was by Golder Associates and reported upon in May 2017. The title of the report is “Limestone Cliff Stability Assessment”. This was a comprehensive study of limestone cliff geology and stability and had particular focus on risk to people and SAMR assets at Gracetown, Prevelly, Gnarabup Headland and Grunters Beach.
Part of the scope of work for the current study was to review this report (refer Appendix A), address certain recommendations and re-assess conditions at six locations discussed in the report.
The six locations together with the SAMR’s current requirements are listed below:
Site ID: GC5 - 75 (Gracetown – cliffs south of stairs)
Provide details/analysis on whether to stabilise blocks or remove overhanging rocks, detailed methodology and indicative costing for preferred approach.
Site ID: GC6 - 15 (Gracetown – Southpoint lookout)
The Shire has removed the lookout at Southpoint that sat over the overhang and received engineering drawings to anchor the viewing platform back to the carpark. The consultant shall determine whether stabilisation carried out to date is sufficient, or whether further stabilisation of the stairs is also required and provide details how to proceed.
Site ID: GC6 - 60 (Southpoint carpark)
40
MARGARET RIVER – LIMESTONE CLIFF STABILITY ASSESSMENT REPORT 25 OCTOBER 2019
CMW Geosciences Ref. PER2019-0229AA Rev 1 4
The consultant shall install monitoring equipment to the identified risk and prepare a monitoring protocol for Shire staff to monitor thereafter.
Site ID: PR4 - 30 (Surfers Point)
The Shire has removed the viewing platform in accordance with the recommendation. Provide an analysis as to the resultant risk of the overhang and response required (if any) and advise what is the best option to consider and details on how to proceed (i.e. removal of rock, reinforcement, a mix of these approaches, etc.) should the Shire wish to install the platform in the future.
Site ID: PR6 - 85 (Cliffs at Riflebutts Beach)
The limestone report refers to imminent rockfall risk in the next 1 – 10 years for this stretch of beach and recommends closing the beach by way of signage. Signage has been installed but people are still using the area. The consultant is required to:
Determine and detail a suitable method for removal of the identified hazard; Undertake and/or oversee removal of the hazard (provide indicative sub-contractor costings, if
required). Identify a permanent exclusion zone at the base of the cliffs to discourage people from entering
‘at risk’ areas and recommend a method for excluding people from the area i.e. fencing or otherwise.
Site ID: GN5 - 5 (Stairs leading to upper car park from White Elephant)
Overhang of up to 2.5 m developed beneath a caprock layer up to ~1 m thick. Stairs leading down to the White Elephant Café from the upper car park area are built directly on top of the overhang. The hazard at this location is largely associated with collapse of the overhang while recreational users are using the stairs. The consultant shall install monitoring equipment to the identified risk and prepare a monitoring protocol for the Shire to monitor thereafter.
Note the requirement at GN5-5 changed following the risk and options workshop undertaken with SAMR personnel on 20 August 2019. An outcome of the workshop was to proceed with underpinning. A provisional sum to undertake the design of the underpinning had been provided with the response to the RFQ.
3 PROVIDED INFORMATION
The following information was provided and has been relied upon in preparing this report.
Golder Associates 2017; Limestone Cliff Stability Assessment - prepared for the Shire of Augusta Margaret River
Baynes Geologic 2006; Surfers Point Redevelopment, Geotechnicval Constraints - prepared for the Shire of Augusta Margaret River
Gordon Geological Consultants 2002; Huzza Beach, Gracetown Memorial Site and Huzza Beach Gracetown Stability of Steps - prepared for the Shire of Augusta Margaret River
Gordon Geological Consultants 2005; Huzzas Cliff Inspection 2005 - prepared for the Shire of Augusta Margaret River
4 SITE INSPECTION AND RECOMMENDATIONS
The site inspection was undertaken on Monday 19 August 2019, jointly between Matthew Tutton of CMW and Tim Moore of Civil/Structural Engineering Pty Ltd.
Observation are described below and illustrated in Appendix B. Recommendations are also provided in this section of the report. Drawings of remedial/risk mitigation works are provided in Appendix C.
41
MARGARET RIVER – LIMESTONE CLIFF STABILITY ASSESSMENT REPORT 25 OCTOBER 2019
CMW Geosciences Ref. PER2019-0229AA Rev 1 5
A risk assessment has also been undertaken for all locations and the details of this risk assessment are detailed in Appendix D. The method of calculating risk is in accordance with the Landslide Risk Management Guidelines AGS 2007 and tries to mirror the approach taken by Golder 2017, however with changing conditions the inputs are different. Definitions of the various terminology are reproduced in Appendix D for convenience. Note criteria for acceptable and tolerable risk needs to be determined by SAMR however guidance in AGS 2007 suggest the following limits for tolerable risk.
Tolerable Risk for Loss of Life
Risk Tolerable Annual Probability
Individual Most at Risk 1.0 x10⁻⁴
Societal Risk 1.0 x 10⁻⁵
Cumulative Individual Risk No guidance provided
Cumulative Individual Risk is provided only for comparison purposes. All risk provided in Appendix D relate to the observed condition before any risk mitigation or remedial works are undertaken.
SAMR officers should review the assumptions presented in Appendix D used to calculate risk to see whether user numbers who may transit or use a beach, stairs etc., concur with their estimate of usage and exposure (time in the hazard area).
Columns coloured green in the risk assessment are those where remedial/risk mitigation works are recommended. Risks values highlighted in red exceed AGS 2007 values tabulated above and those highlighted in yellow are also considered high and require remedial/risk mitigation works.
4.1 Site ID: GC6 - 60 (Southpoint carpark)
Refer Slide 1 (Appendix B) for location details. Monitoring reference points as illustrated in Appendix E have been installed and a monitoring protocol prepared for the Shire.
It is noted that the embayment left by a former rockfall west of the GC6-60 has generally stabilised, with no retrogression noted since the Golder 2017 inspection and with a heathy growth of native vegetation. (refer Slide 2). Cracking noted by Golder in 2017 does not appear to have propagated further (refer Slide 3) indicating a period of relative stability.
The level of risk does not appear to have changed since 2017. A collapse of the block illustrated in Slide 4 would not immediately affect the car park. Debris would however likely reach the foreshore, as has been the case with previous rockfalls (refer Slide 4). Debris reaching the foreshore is the hazard that presents most risk to the public. However, this section of foreshore is not a beach but a wave-cut platform and does not need to be used to access the surf breaks. It is therefore sparsely used, and the signs erected on the beach recommended in the 2017 report further discourage people from traversing this part of the foreshore.
The probability of a collapse occurring whilst considered to be relatively high (once in ten years or 0.1 annualised probability) results in relatively small individual and societal risks (5.42 x10⁻⁷ and 1.08 x 10⁻⁷ respectively - refer Appendix D). This largely due to the assumed small number of users of the foreshore, transiting the rocky limestone foreshore and their relative short time in the at risk area. This is not a beach where people for instance would sunbath and be present for a longer exposure time. As a result, it is recommended that this location be monitored and no recommendations are a this stage for physical remedial works as risk are relatively small.
42
MARGARET RIVER – LIMESTONE CLIFF STABILITY ASSESSMENT REPORT 25 OCTOBER 2019
CMW Geosciences Ref. PER2019-0229AA Rev 1 6
4.2 Site ID: GC6 - 15 (Gracetown – Southpoint lookout)
Refer Slide 1 for location. The inspection reviewed the removal of the lookout at Southpoint, which was a recommendation of the 2017 Golder report. This has been undertaken. Whilst the hazard of an undercut block of limestone still exists (refer Slide 6) the risk to assets and people is substantially removed as the lookout is no longer present.
The current inspection focused on whether it was deemed probable that should the overhang collapse it would pull the stairs with it, thus putting people at risk. This risk was not assessed by Golder in 2017. Our August 2019 inspection did not identify a catastrophic risk of collapse from a single rockfall event. Instead it was considered the serviceability of the steps could be impacted. For instance twisting of the steps could occur, initiated by coastal erosion affecting individual supports without collapsing the structure. The potential for this to occur was particularly evident towards the bottom of the stairs (refer Slide7). This would not result in an immediate risk to people if the situation was monitored and corrective action taken to extend supporting stanchions affected by erosion or undercutting before or as soon as the issue is identified. Due to only loss of serviceability, we have assumed the risk to life would only be 1:50 should even quite a major twisting and warping of the stairs. This assumes a foundation collapse (resulting in the twisting and warping) occurs whilst people were on the structure. The resultant risk (refer Appendix D) is relatively small and no remedial works are recommended at present.
At this stage it is however recommended that the stairs be visually assessed by Shire personnel every 3 months or following storm events or any reports of erosion affecting Gracetown. If individual supporting stanchions get undercut by storm and wave activity or small-scale landsliding, the stairs should be immediately closed to the public until the undercut stanchions has been underpinned and the structure levelled, if subsidence occurred as a result of the loss of support.
4.3 Site ID: GC5 - 75 (Gracetown – cliffs south of stairs)
Refer Slide 1 for location. Two 5 m long sections of limestone outcrop approximately 10 m above the beach level are severely undercut. The limestone is part of the calcretised aeolianite (cemented dune sands) forming a weak caprock. Immediately underneath the caprock is a zone of roots where calcretised root casts are present (rhizocretions) and calcium carbonite has been leached from the surrounding limestone leaving a weakly cemented residual sand. This residual sand is the subject of wind erosion, which exposes the root casts and undercuts the caprock. This process is evident in Slide 8 and unusual overhanging shaped pieces of rock are left held only by the weak tensile strength of the rock. The projecting finger of rock approximately 1.5 m long seen in Slide 8 (left photograph) is an example. In the case of this finger of rock a crack is present, and collapse will occur in the near future.
The cracks observed in Slide 9 (left image) has not substantially changed much since the Golder 2017 inspection (right image) however this could change rapidly following a storm event.
The undercut, vuggy nature of the leached zone of roots and a rhizocretion forming a thin twisted column of limestone can be seen in Slide 10. The slope below the overhang is heavily vegetated and there is a chance of material hanging up on the slope once fallen from the overhang reducing the risk of debris impacting people exiting the Southpoint carpark stairs as they traverse the beach towards Huzza beach. Nonetheless some material could reach the beach.
Our risk assessment for people traversing the beach resulted in relatively small risks. However, because of the large number of people traversing this beach each year to access the popular surf breaks cumulative individual risks are relatively high (refer Appendix D) and risk mitigation works are recommended.
The option of building an elevated boardwalk to direct people away from the rockfall runout zone as they exit the Southpoint steps was considered. However, is also recognised that this is a popular
43
MARGARET RIVER – LIMESTONE CLIFF STABILITY ASSESSMENT REPORT 25 OCTOBER 2019
CMW Geosciences Ref. PER2019-0229AA Rev 1 7
beach and children occasionally explore around the overhangs and undercuts and the very action of scrambling around the overhangs and undercuts could be a trigger for a rockfall. If this was to occur, they would likely be in the line of fire and thus be at risk. As such, it is recommended that physical works are undertaken to stabilise or remove the hazard.
The following options were considered in forming our recommendation to remove the overhang.
1) Cover slope will rock mesh. This would either a) require removal of vegetation to allow the mesh to be laid on the ground or b) require placement directly over vegetation. Option a) is considered environmentally damaging and geotechnically would exacerbate the issues of erosion and likely result in the development of new hazards. Option b) would create a trampoline – creating a new hazard for children and a trap for litter and debris. It might also allow children to explore underneath and still access the outcrops/undercuts
2) Rock bolt and shotcrete undercut/outcrop. This would require removal of vegetation to access the outcrop with plant and equipment. Furthermore, the materials forming the outcrop are considered to friable to bolt and excessive volumes of shotcrete would be required to underpin the outcrop. It would not be safe to erect a shutter and place mass concrete to underpin the undercut.
3) Collapse/remove the undercut and overhanging rock pieces. Possible techniques include: a) use of excavator and rock breaker – discounted due to lack of vehicle access and amount of
destruction to natural vegetation b) use of drill and blast. Drilling would need to be by hand. However, blasting is not recommended
due to the small volumes involved and the friable nature of the cliff adjacent to this feature that could be disturbed and weakened by blasting
c) use of chemical blast using an expansion agent. Drilling would need to be by hand. However the extreme vuggy nature of the limestone is question may not be suitable for expansion agents as the expansion agent may flow out of the drill hole. Where stronger less vuggy limestone is encountered it could be used, or a thicker paste used to prevent loss.
d) Use of needle drilling and hand barring to remove rock on predetermined break lines. This would require a detailed safe working methodology but could be undertaken safety and with minimum vegetation disturbance by accessing the undercuts from above and working behind a predetermined safety demarcation line set-out immediately prior to the commencing the works.
Slide 11 and 12 illustrate the difficult access and native vegetation surrounding this outcrop. Considering the above options, option 3d is considered the most appropriate method of collapsing removing the undercuts.
There are two undercuts to be collapsed. Each approximately 5 m long and averaging about 1 m deep and 0.5 m thick.
The following methodology is anticipated:
a) Erect barrier and place spotter so public do not enter work area or rockfall runout areas b) Undertake pruning of vegetation between path and outcrop allow access (Slide 11) c) Establish safe anchor points to secure personnel to prevent fall from edge (Slide 12) d) Establish a survey line on the upper surface of outcrop showing extent of the undercut (Slides
11 and 12) e) Establish a safe working zone that would not be impacted when collapse occurs f) Establish key break lines to drill to predetermine the break point. Plan breakage to occur in
small pieces rather than large wholesale collapses g) Use pneumatic or large electric percussion drill to form break points. h) Use driven expansion wedges (or similar), or possible use of chemical expansion grout, to
prise open drill holes and promote cracking and subsequent collapse.
44
MARGARET RIVER – LIMESTONE CLIFF STABILITY ASSESSMENT REPORT 25 OCTOBER 2019
CMW Geosciences Ref. PER2019-0229AA Rev 1 8
i) Once the upslope hazard has been collapsed, inspect debris to ensure it is secure and not likely to roll or be dislodged and become another hazard. If necessary, hand bar debris to base of slope.
Following removal of the rock overhang it is recommended that the area be inspected by a vegetation specialist to advise on planting or erosion protection works to help establish vegetation in the area formerly occupied by the overhang/undercut and to re-establish vegetation impacted during the removal works.
4.4 Site ID: PR4 - 30 (Surfers Point)
The Golder 2017 recommended removing a viewing platform immediately in front of a large overhang/undercut outcrop. This has been undertaken as can be seen by comparing the September 2017 Nearmap image (Slide 13) which shows the viewing platform to be present and the most recent August 2019 Nearmap image that shows the viewing platform removed and the current configuration.
An assessment of the undercut did not display significant change since 2017 with the maximum undercut measured at 3.5 m in the latest survey and the Golder Report reporting undercut up to 4 m. Towards the back of the undercut slot the height of the slot is only a few millimetres and it is possible some infilling with sand has occurred since 2017, possibly blown in, or a different location was recorded.
Slide 14 (Appendix B) shows the approximate plan extent of the undercut. Dimensions have been taken and these are shown on the drawing 190802-S2 presented in Appendix C. The undercut is slot like and comprises the erosion of a sandy layer of leached limestone largely through the action of the wind creating a slot beneath an overlying 0.5 to 1.5 m thick caprock layer (refer Slides 15 to 18)
The fact the bench and lower viewing platform have been removed results in the main risk now coming from people sitting on top of the outcrop (refer Slide15) during surf carnivals or at other times. It is understood security is in place during carnivals to prevent this, but occasionally it still occurs. Should the undercut slab of caprock collapse people sitting on the flat slab of rock would fall with the rock a metre or so but are unlikely to get crushed. Thus, these people are more likely to sustain a minor to moderate injury rather than a fatal injury. Their vulnerability is assessed to be 0.1. I.e. one person in 10 could be killed.
The following is considered a plausible remaining risk scenario:
Likelihood total collapse every ten years P(H) = 0.1 Spatial probability P(SH) =1 (this because everyone on the overhang would be affected) Temporal probability 5 hours per year P(TS) = 5.7 x 10⁻⁴ (this assumes this rock platform will
rarely get used due to security at surf events etc.) Vulnerability V(DT) =0.1 (only 1 in 10 get killed in the event of a collapse) Number of visits each year by an individual N=2
It is also assumed that during a surf event 20 people could be present. The later results in a relatively high societal risk 1.14 x 10⁻⁴ (refer Appendix D for risk assessment). As such recommendation are made to remove the hazard or mitigate the risk.
The options are as follows:
1) Collapsing and remove the overhang 2) Support the overhang.
Option 1) would cause quite a lot of environmental damage and loss of amenity in the popular Surfers Point area and would but the existing lookout between the overhang and carpark at risk. The collapsed debris would need to be removed as it would present a hazard. Removal however would
45
MARGARET RIVER – LIMESTONE CLIFF STABILITY ASSESSMENT REPORT 25 OCTOBER 2019
CMW Geosciences Ref. PER2019-0229AA Rev 1 9
expose the leached sandy layer that created the overhang in the first place to renewed wind erosion and as such a new overhang could occur in the future.
There are two options to support the overhang:
a) Columns partially supporting the overhang and b) Full underpinning.
Option a) can only be executed by sending personnel under the overhang (which would require temporary support. This would be difficult due to restrict headroom and access. It would also not prevent ongoing wind erosion and further undercutting.
Option b) is the preferred option as most work can be done without having to work under the overhang and full underpinning not only supports the overhang from collapse but prevents future wind erosion.
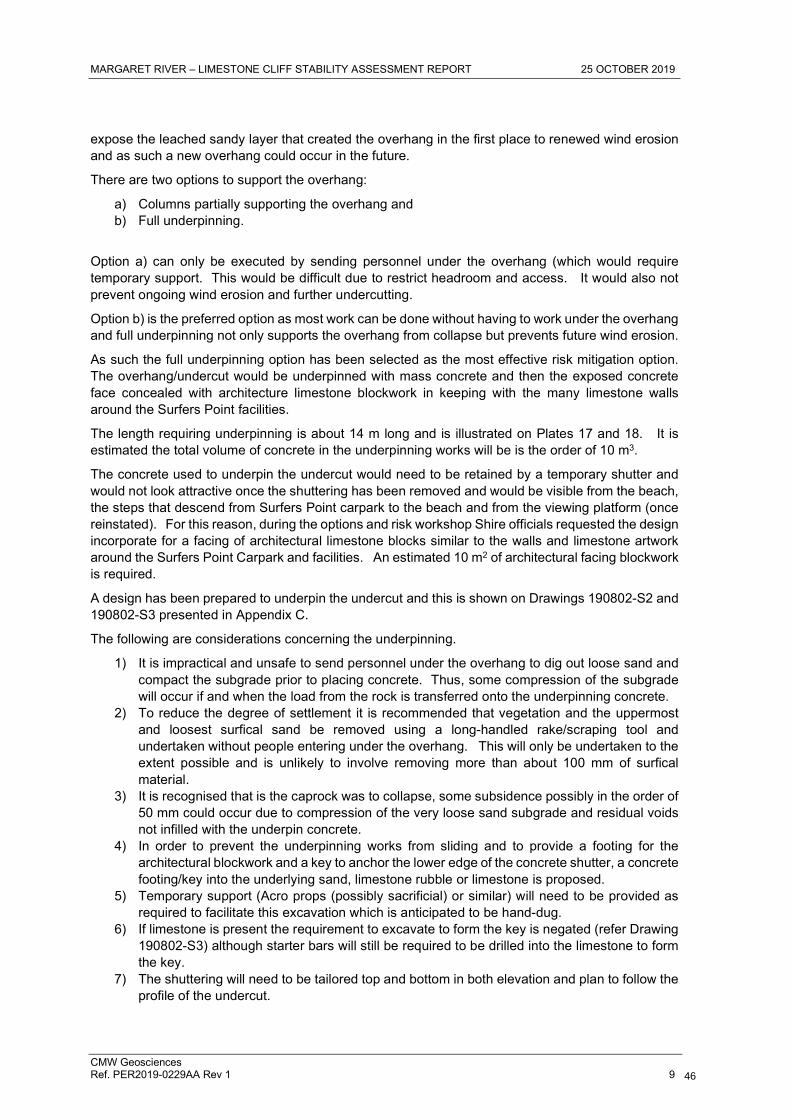
As such the full underpinning option has been selected as the most effective risk mitigation option. The overhang/undercut would be underpinned with mass concrete and then the exposed concrete face concealed with architecture limestone blockwork in keeping with the many limestone walls around the Surfers Point facilities.
The length requiring underpinning is about 14 m long and is illustrated on Plates 17 and 18. It is estimated the total volume of concrete in the underpinning works will be is the order of 10 m3.
The concrete used to underpin the undercut would need to be retained by a temporary shutter and would not look attractive once the shuttering has been removed and would be visible from the beach, the steps that descend from Surfers Point carpark to the beach and from the viewing platform (once reinstated). For this reason, during the options and risk workshop Shire officials requested the design incorporate for a facing of architectural limestone blocks similar to the walls and limestone artwork around the Surfers Point Carpark and facilities. An estimated 10 m2 of architectural facing blockwork is required.
A design has been prepared to underpin the undercut and this is shown on Drawings 190802-S2 and 190802-S3 presented in Appendix C.
The following are considerations concerning the underpinning.
1) It is impractical and unsafe to send personnel under the overhang to dig out loose sand and compact the subgrade prior to placing concrete. Thus, some compression of the subgrade will occur if and when the load from the rock is transferred onto the underpinning concrete.
2) To reduce the degree of settlement it is recommended that vegetation and the uppermost and loosest surfical sand be removed using a long-handled rake/scraping tool and undertaken without people entering under the overhang. This will only be undertaken to the extent possible and is unlikely to involve removing more than about 100 mm of surfical material.
3) It is recognised that is the caprock was to collapse, some subsidence possibly in the order of 50 mm could occur due to compression of the very loose sand subgrade and residual voids not infilled with the underpin concrete.
4) In order to prevent the underpinning works from sliding and to provide a footing for the architectural blockwork and a key to anchor the lower edge of the concrete shutter, a concrete footing/key into the underlying sand, limestone rubble or limestone is proposed.
5) Temporary support (Acro props (possibly sacrificial) or similar) will need to be provided as required to facilitate this excavation which is anticipated to be hand-dug.
6) If limestone is present the requirement to excavate to form the key is negated (refer Drawing 190802-S3) although starter bars will still be required to be drilled into the limestone to form the key.
7) The shuttering will need to be tailored top and bottom in both elevation and plan to follow the profile of the undercut.
46
MARGARET RIVER – LIMESTONE CLIFF STABILITY ASSESSMENT REPORT 25 OCTOBER 2019
CMW Geosciences Ref. PER2019-0229AA Rev 1 10
8) Cut-outs in the shuttering will be required to facilitate pumping of concrete in one continuous pour and to allow the use of a concrete compactor.
Following completion of the underpinning and the building of the architectural limestone blockwork, it is recommended a flora specialist is appointed to assess any requirements to reinstate vegetation removed and add new vegetation to improve the overall vegetation cover to minimise the impact of future wind erosion affecting adjacent natural features and restore or improve visual amenity
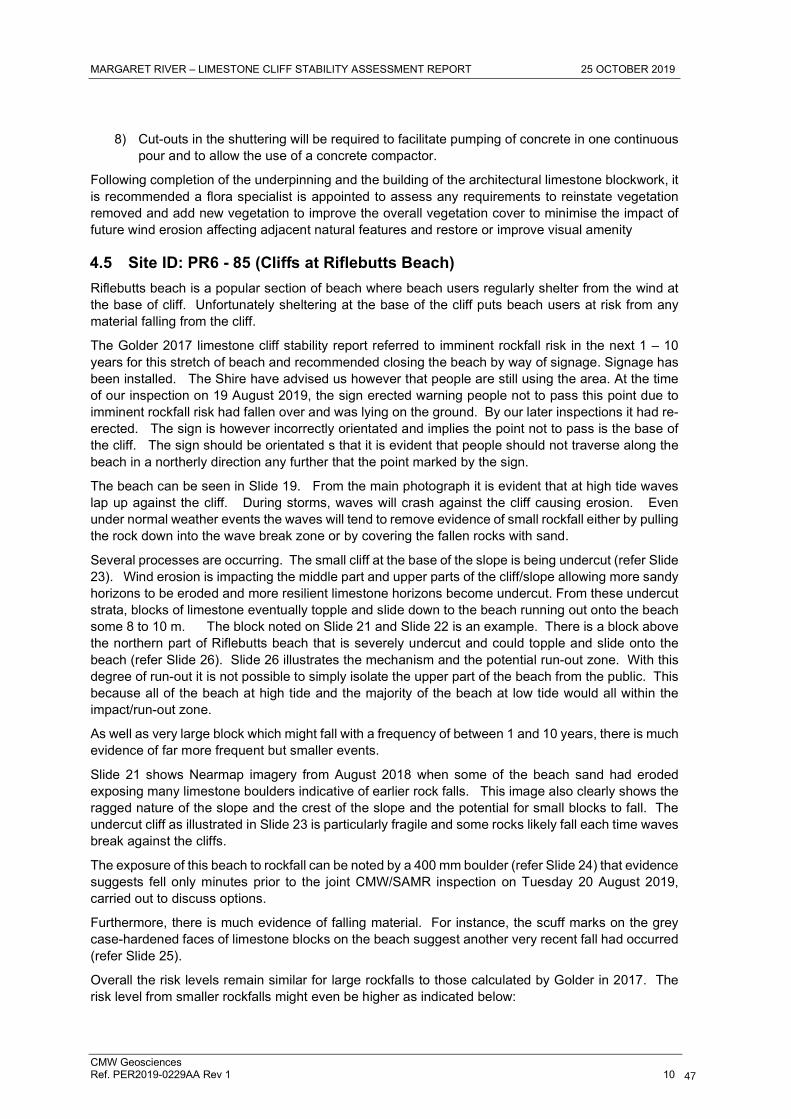
4.5 Site ID: PR6 - 85 (Cliffs at Riflebutts Beach)
Riflebutts beach is a popular section of beach where beach users regularly shelter from the wind at the base of cliff. Unfortunately sheltering at the base of the cliff puts beach users at risk from any material falling from the cliff.
The Golder 2017 limestone cliff stability report referred to imminent rockfall risk in the next 1 – 10 years for this stretch of beach and recommended closing the beach by way of signage. Signage has been installed. The Shire have advised us however that people are still using the area. At the time of our inspection on 19 August 2019, the sign erected warning people not to pass this point due to imminent rockfall risk had fallen over and was lying on the ground. By our later inspections it had re-erected. The sign is however incorrectly orientated and implies the point not to pass is the base of the cliff. The sign should be orientated s that it is evident that people should not traverse along the beach in a northerly direction any further that the point marked by the sign.
The beach can be seen in Slide 19. From the main photograph it is evident that at high tide waves lap up against the cliff. During storms, waves will crash against the cliff causing erosion. Even under normal weather events the waves will tend to remove evidence of small rockfall either by pulling the rock down into the wave break zone or by covering the fallen rocks with sand.
Several processes are occurring. The small cliff at the base of the slope is being undercut (refer Slide 23). Wind erosion is impacting the middle part and upper parts of the cliff/slope allowing more sandy horizons to be eroded and more resilient limestone horizons become undercut. From these undercut strata, blocks of limestone eventually topple and slide down to the beach running out onto the beach some 8 to 10 m. The block noted on Slide 21 and Slide 22 is an example. There is a block above the northern part of Riflebutts beach that is severely undercut and could topple and slide onto the beach (refer Slide 26). Slide 26 illustrates the mechanism and the potential run-out zone. With this degree of run-out it is not possible to simply isolate the upper part of the beach from the public. This because all of the beach at high tide and the majority of the beach at low tide would all within the impact/run-out zone.
As well as very large block which might fall with a frequency of between 1 and 10 years, there is much evidence of far more frequent but smaller events.
Slide 21 shows Nearmap imagery from August 2018 when some of the beach sand had eroded exposing many limestone boulders indicative of earlier rock falls. This image also clearly shows the ragged nature of the slope and the crest of the slope and the potential for small blocks to fall. The undercut cliff as illustrated in Slide 23 is particularly fragile and some rocks likely fall each time waves break against the cliffs.
The exposure of this beach to rockfall can be noted by a 400 mm boulder (refer Slide 24) that evidence suggests fell only minutes prior to the joint CMW/SAMR inspection on Tuesday 20 August 2019, carried out to discuss options.
Furthermore, there is much evidence of falling material. For instance, the scuff marks on the grey case-hardened faces of limestone blocks on the beach suggest another very recent fall had occurred (refer Slide 25).
Overall the risk levels remain similar for large rockfalls to those calculated by Golder in 2017. The risk level from smaller rockfalls might even be higher as indicated below:
47
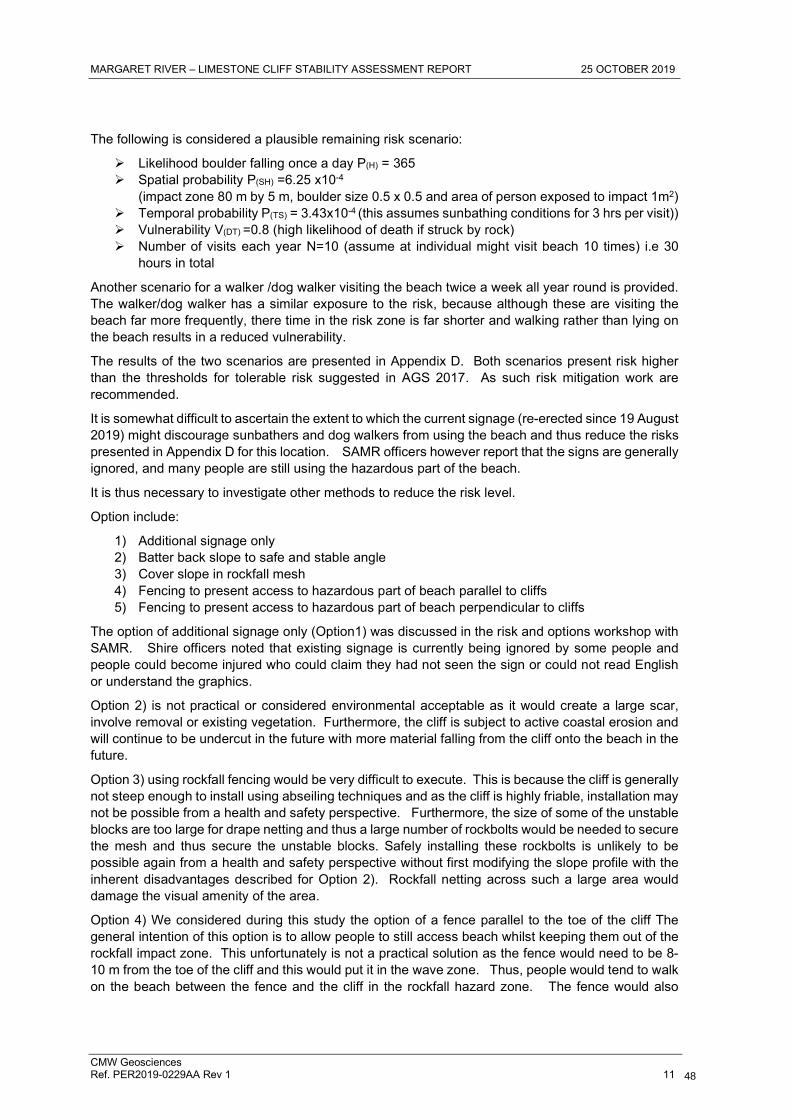
MARGARET RIVER – LIMESTONE CLIFF STABILITY ASSESSMENT REPORT 25 OCTOBER 2019
CMW Geosciences Ref. PER2019-0229AA Rev 1 11
The following is considered a plausible remaining risk scenario:
Likelihood boulder falling once a day P(H) = 365 Spatial probability P(SH) =6.25 x10⁻⁴
(impact zone 80 m by 5 m, boulder size 0.5 x 0.5 and area of person exposed to impact 1m2) Temporal probability P(TS) = 3.43x10⁻⁴ (this assumes sunbathing conditions for 3 hrs per visit)) Vulnerability V(DT) =0.8 (high likelihood of death if struck by rock) Number of visits each year N=10 (assume at individual might visit beach 10 times) i.e 30
hours in total
Another scenario for a walker /dog walker visiting the beach twice a week all year round is provided. The walker/dog walker has a similar exposure to the risk, because although these are visiting the beach far more frequently, there time in the risk zone is far shorter and walking rather than lying on the beach results in a reduced vulnerability.
The results of the two scenarios are presented in Appendix D. Both scenarios present risk higher than the thresholds for tolerable risk suggested in AGS 2017. As such risk mitigation work are recommended.
It is somewhat difficult to ascertain the extent to which the current signage (re-erected since 19 August 2019) might discourage sunbathers and dog walkers from using the beach and thus reduce the risks presented in Appendix D for this location. SAMR officers however report that the signs are generally ignored, and many people are still using the hazardous part of the beach.
It is thus necessary to investigate other methods to reduce the risk level.
Option include:
1) Additional signage only 2) Batter back slope to safe and stable angle 3) Cover slope in rockfall mesh 4) Fencing to present access to hazardous part of beach parallel to cliffs 5) Fencing to present access to hazardous part of beach perpendicular to cliffs
The option of additional signage only (Option1) was discussed in the risk and options workshop with SAMR. Shire officers noted that existing signage is currently being ignored by some people and people could become injured who could claim they had not seen the sign or could not read English or understand the graphics.
Option 2) is not practical or considered environmental acceptable as it would create a large scar, involve removal or existing vegetation. Furthermore, the cliff is subject to active coastal erosion and will continue to be undercut in the future with more material falling from the cliff onto the beach in the future.
Option 3) using rockfall fencing would be very difficult to execute. This is because the cliff is generally not steep enough to install using abseiling techniques and as the cliff is highly friable, installation may not be possible from a health and safety perspective. Furthermore, the size of some of the unstable blocks are too large for drape netting and thus a large number of rockbolts would be needed to secure the mesh and thus secure the unstable blocks. Safely installing these rockbolts is unlikely to be possible again from a health and safety perspective without first modifying the slope profile with the inherent disadvantages described for Option 2). Rockfall netting across such a large area would damage the visual amenity of the area.
Option 4) We considered during this study the option of a fence parallel to the toe of the cliff The general intention of this option is to allow people to still access beach whilst keeping them out of the rockfall impact zone. This unfortunately is not a practical solution as the fence would need to be 8-10 m from the toe of the cliff and this would put it in the wave zone. Thus, people would tend to walk on the beach between the fence and the cliff in the rockfall hazard zone. The fence would also
48
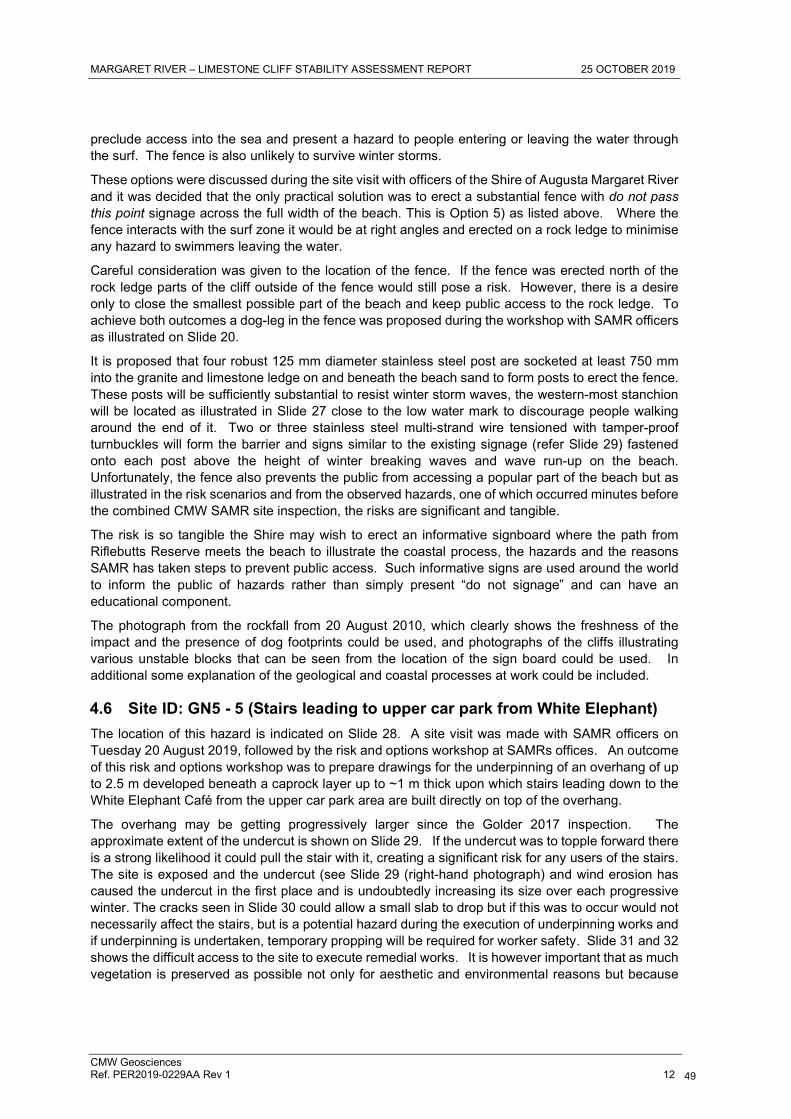
MARGARET RIVER – LIMESTONE CLIFF STABILITY ASSESSMENT REPORT 25 OCTOBER 2019
CMW Geosciences Ref. PER2019-0229AA Rev 1 12
preclude access into the sea and present a hazard to people entering or leaving the water through the surf. The fence is also unlikely to survive winter storms.
These options were discussed during the site visit with officers of the Shire of Augusta Margaret River and it was decided that the only practical solution was to erect a substantial fence with do not pass this point signage across the full width of the beach. This is Option 5) as listed above. Where the fence interacts with the surf zone it would be at right angles and erected on a rock ledge to minimise any hazard to swimmers leaving the water.
Careful consideration was given to the location of the fence. If the fence was erected north of the rock ledge parts of the cliff outside of the fence would still pose a risk. However, there is a desire only to close the smallest possible part of the beach and keep public access to the rock ledge. To achieve both outcomes a dog-leg in the fence was proposed during the workshop with SAMR officers as illustrated on Slide 20.
It is proposed that four robust 125 mm diameter stainless steel post are socketed at least 750 mm into the granite and limestone ledge on and beneath the beach sand to form posts to erect the fence. These posts will be sufficiently substantial to resist winter storm waves, the western-most stanchion will be located as illustrated in Slide 27 close to the low water mark to discourage people walking around the end of it. Two or three stainless steel multi-strand wire tensioned with tamper-proof turnbuckles will form the barrier and signs similar to the existing signage (refer Slide 29) fastened onto each post above the height of winter breaking waves and wave run-up on the beach. Unfortunately, the fence also prevents the public from accessing a popular part of the beach but as illustrated in the risk scenarios and from the observed hazards, one of which occurred minutes before the combined CMW SAMR site inspection, the risks are significant and tangible.
The risk is so tangible the Shire may wish to erect an informative signboard where the path from Riflebutts Reserve meets the beach to illustrate the coastal process, the hazards and the reasons SAMR has taken steps to prevent public access. Such informative signs are used around the world to inform the public of hazards rather than simply present “do not signage” and can have an educational component.
The photograph from the rockfall from 20 August 2010, which clearly shows the freshness of the impact and the presence of dog footprints could be used, and photographs of the cliffs illustrating various unstable blocks that can be seen from the location of the sign board could be used. In additional some explanation of the geological and coastal processes at work could be included.
4.6 Site ID: GN5 - 5 (Stairs leading to upper car park from White Elephant)
The location of this hazard is indicated on Slide 28. A site visit was made with SAMR officers on Tuesday 20 August 2019, followed by the risk and options workshop at SAMRs offices. An outcome of this risk and options workshop was to prepare drawings for the underpinning of an overhang of up to 2.5 m developed beneath a caprock layer up to ~1 m thick upon which stairs leading down to the White Elephant Café from the upper car park area are built directly on top of the overhang.
The overhang may be getting progressively larger since the Golder 2017 inspection. The approximate extent of the undercut is shown on Slide 29. If the undercut was to topple forward there is a strong likelihood it could pull the stair with it, creating a significant risk for any users of the stairs. The site is exposed and the undercut (see Slide 29 (right-hand photograph) and wind erosion has caused the undercut in the first place and is undoubtedly increasing its size over each progressive winter. The cracks seen in Slide 30 could allow a small slab to drop but if this was to occur would not necessarily affect the stairs, but is a potential hazard during the execution of underpinning works and if underpinning is undertaken, temporary propping will be required for worker safety. Slide 31 and 32 shows the difficult access to the site to execute remedial works. It is however important that as much vegetation is preserved as possible not only for aesthetic and environmental reasons but because
49
MARGARET RIVER – LIMESTONE CLIFF STABILITY ASSESSMENT REPORT 25 OCTOBER 2019
CMW Geosciences Ref. PER2019-0229AA Rev 1 13
the vegetation reduces the exposure to wind erosion which would rapidly become exacerbated once removed.
Individual and Societal risks using the assumptions illustrated in Appendix D yield results within the AGS suggested thresholds for tolerable risk. This is largely because of the relatively short transit time across the affected part of stairs and the relative low number of people who may be on the stairs at any one time. However, the stairs are well-frequented and this results in a relatively high Cumulative Individual Risk and as such remediation is recommended. Furthermore, the degree of undercutting will only increase with time. The undercut is exposed to wind erosion and thus the likelihood of a collapse will increase if no remedial works are undertaken and risk levels will thus increase. For this reason, remedial works have been considered.
The following options were considered:
Option 1) Collapse overhang
Option 2) Underpin overhang
Collapsing the overhang (Option 1) would result in the need to relocate and rebuild the stairs leading from the top car park to the White elephant café. It would also expose the leached limestone layer to further wind erosion and in time new undercutting would begin to occur.
Underpinning (Option 2) by contrast is considered a better option because it supports the stairs, repairs the hazard, prevents future wind erosion enlarging the existing overhang and can be executed with minimal environmental damage. It is also largely visually concealed by virtual of it being located below the path/stairs and shielded in the main by vegetation when viewed from the beach
Drawings showing the proposed underpinning works are provided in Appendix C (Drawings 190801-S1, 190802-S2 and 190802-S3). The extent of the underpinning is illustrated on Slide 34. It is 9 linear metres long. The average depth of underpinning will be 1.3 m, the mean thickness about 0.6 m with an estimated volume of 12 m3 and shuttered face area of about 8 m2. Unlike at Surfers Point, as long as vegetation is preserved, the concrete face will be largely screen by vegetation and for this reason we understand SAMR will not require the exposed concrete from the underpinning to be concealed behind architectural limestone blockwork.
The following are considerations concerning the underpinning.
1) It is impractical and unsafe to send personnel under the overhang to dig out loose sand and compact the subgrade prior to placing concrete. Thus, some compression of the subgrade will occur if the load from the rock is transferred onto the underpinning concrete.
2) To reduce the degree of settlement it is recommended that vegetation and the uppermost and loosest surficial sand be removed using a long-handled rake/scraping tool and undertaken without people entering under the overhang. This will only be undertaken to the extent possible and is unlikely to involve removing more than about 100 mm of surfical material.
3) It is recognised that if the caprock was to collapse, some subsidence possibly in the order of 50 mm could occur due to compression of the very loose sand subgrade and residual voids not infilled with the underpin concrete. Should this collapse occur this settlement may affect the serviceability of the stairs and repairs to level the affected part may be required. It is however unlikely that full collapse and compression of the sand will occur once underpinning has been undertaken since the mechanism of undercut enlargement will have been removed. and they would likely require re-building, however this
4) In order to prevent the underpinning works from sliding and to provide a footing for the architectural blockwork and a key to anchor the lower edge of the concrete shutter, a concrete footing/key into the underlying sand, limestone rubble or limestone is proposed.
5) Temporary support will need to be provided as required to facilitate this excavation which is anticipated to be hand dug. If limestone is present the requirement for an excavation is
50
MARGARET RIVER – LIMESTONE CLIFF STABILITY ASSESSMENT REPORT 25 OCTOBER 2019
CMW Geosciences Ref. PER2019-0229AA Rev 1 14
negated (refer Drawing 190802-S3) although starter bars will still be required to be drilled into the limestone to form a key.
6) The shuttering will need to be tailored top and bottom in both elevation and plan to follow the profile of the undercut.
7) Cut-outs in the shuttering will be required to facilitate pumping of concrete in one continuous pour and to allow the use of a concrete compactor.
5 FUTURE MONITORING PROTOCOL
Part of the commission included the provision of monitoring reference points at some of the locations described in this report. These reference points are documented in Appendix E.
It also included for a protocol by which officers of SAMR can undertake routine monitoring themselves, recognising when erosion and potential instability is developing and documenting a set of procedures to increase monitoring frequency, obtain external specialised geotechnical advice or to implement immediate or staged closure to mitigate risks in the short term whilst remediation or other risk mitigation works are undertaken.
This monitoring protocol is also provided in Appendix E.
6 REFERENCES
AGS (2007), Practice Note Guidelines for Landslide Risk Management 2007. Australian Geomechanics, Vol 42, No 1, March 2007
51
MARGARET RIVER – LIMESTONE CLIFF STABILITY ASSESSMENT REPORT 25 OCTOBER 2019
CMW Geosciences Ref. PER2019-0229AA Rev 1 15
7 CLOSURE
The findings contained within this report are the result of site observations, judgement of likelihood and impact of slope and cliff hazards and risk assessment conducted in accordance with normal practices and standards. To the best of our knowledge, they represent a reasonable interpretation of the general condition of the site. Conditions change with time and following severe weather events.
The information presented in this report therefore represents the condition observed and risk assessed at the time of the site inspection and from time to time additional surveys will be required to update observed conditions in accordance with the guidance provided in this report.
This report has been prepared for use by Shire of Augusta Margaret River in relation to managing coastal cliff stability risk at 6 discrete locations in accordance with generally accepted consulting practice. No other warranty, expressed or implied, is made as to the professional advice included in this report. Use of this report by parties other than Shire of Augusta Margaret River and their respective consultants and contractors is at their risk as it may not contain sufficient information for any other purposes.
For and on behalf of CMW Geosciences Pty Ltd
Prepared By: Reviewed By:
Matthew Tutton Craig Butterworth
Senior Principal Geotechnical Engineer Senior Principal Geotechnical Engineer
Distribution: 1 copy to Shire of Augusta Margaret River (electronic)
Original held by CMW Geosciences Pty Ltd
52

MARGARET RIVER – LIMESTONE CLIFF STABILITY ASSESSMENT REPORT 25 OCTOBER 2019
CMW Geosciences Ref. PER2019-0229AA Rev 1
Appendix A Scope of Work and Methodology
53

MARGARET RIVER – LIMESTONE CLIFF STABILITY ASSESSMENT REPORT 25 OCTOBER 2019
CMW Geosciences Ref. PER2019-0229AA Rev 1
Proposed investigation scope and methodology The Consultant will provide additional advice and information surrounding the original recommendations in the 2017 Cliff Stability Assessment provided with the RFQ and undertake design of remediation. To enable this we propose the following: SITE INSPECTION
Senior CMW and CSC representatives will jointly undertake an inspection at the three Gracetown sites and the three Prevelly/Gnarabup sites to geologically appraise the current conditions, review previous recommendations and to take relevant measurements to facilitate analyses and/or design of remediation. During the inspection discussion and formulation of potential and preferred stabilisation options will occur. A subsequent site visit will be made to install survey monuments and photograph reference points to facilitate ongoing monitoring by the Shire staff
FORMULATION OF OPTIONS / DESIGN AND INDICATIVE COSTING
Words in italics are scope of work in the RfQ document
Site ID: GC5 - 75 (Gracetown – cliffs south of stairs)
Provide details/analysis on whether to stabilise blocks or remove overhanging rocks, detailed methodology and indicative costing for preferred approach. If removal of the hazard is recommended, the consultant is required to undertake and/or oversee removal of the hazard, or prepare a procedure and details for Shire staff to undertake removal of the hazard.
We have costed for recommending and designing the preferred option including a procedure for the Shire to monitor in the future. We have not costed for undertaking the physical works as this will require an independent contractor. Similarly, the cost of overseeing is not included in our lump sum but we provide an expected indication based on time and expenses
Site ID: GC6 - 15 (Gracetown – Southpoint lookout)
The Shire has removed the lookout at Southpoint that sat over the overhang and received engineering drawings to anchor the viewing platform back to the carpark. The consultant shall determine whether stabilisation carried out to date is sufficient, or whether further stabilisation of the stairs is also required, and provide details how to proceed. A methodology and costing shall be provided for the proposed approach.
We will evaluate whether work done is sufficient, review the engineering drawings and if further stabilisation is required design and provide details and provide indicative costs for execution.
Site ID: GC6 - 60 (Southpoint carpark)
The consultant shall install monitoring equipment to the identified risk, and prepare a monitoring protocol for Shire staff to monitor thereafter.
54

MARGARET RIVER – LIMESTONE CLIFF STABILITY ASSESSMENT REPORT 25 OCTOBER 2019
CMW Geosciences Ref. PER2019-0229AA Rev 1
We shall inspect, update risk analysis if required, and install survey monuments or photo reference points to facilitate future monitoring by Shire Staff. We will prepare monitiroing protocol to be undertaken by Shire staff with an event tree to advise the Shire staff on when to increase monitoring period or actions to take in the event of significant change being noted or following adverse weather events.
Site ID: PR4 - 30 (Surfers Point)
The Shire has removed the viewing platform in accordance with the recommendation. Provide an analysis as to the resultant risk of the overhang and response required (if any) and advise what is the best option to consider and details on how to proceed (i.e. removal of rock, reinforcement, a mix of these approaches, etc.) should the Shire wish to install the platform in the future.
We will assess the current situation with respect to risk. We have priced for designing underpinning works assuming the Shire wants to reinstate the lookout. Even if the lookout is not reinstated underpinning would mitigate against collapse risk as we understand this undercut ledge is a well-used viewing platform during crowded surf events.
Site ID: PR6 - 85 (Cliffs at Riflebutts Beach)
The limestone report refers to imminent rockfall risk in the next 1 – 10 years for this stretch of beach and recommends closing the beach by way of signage. Signage has been installed but people are still using the area. The consultant is required to:
Determine and detail a suitable method for removal of the identified hazard; Undertake and/or oversee removal of the hazard (provide indicative sub-contractor costings, if
required). Identify a permanent exclusion zone at the base of the cliffs to discourage people from entering
‘at risk’ areas and recommend a method for excluding people from the area i.e. fencing or otherwise.
We are very familiar with this section of beach/cliff. Whilst we can design and cost remediation works, this is an area of active cliff erosion. Removal of high-risk blocks will be a short-term fix only and may result in environmental disturbance. We recommend and have costed for the following approach. We will assess the options (including rating options by cost, environmental and safety considerations (both in executing and to end users). We then present these options in a risk and options workshop with the Shire. We have costed for a 4-hour risk/options workshop with the Shire. During the workshop changes/improvement in risk will be discussed/documented alongside environmental and cost considerations.
Site ID: GN5 - 5 (Stairs leading to upper car park from White Elephant)
Overhang of up to 2.5 m developed beneath a caprock layer up to ~1 m thick. Stairs leading down to the White Elephant Café from the upper car park area are built directly on top of the overhang. The hazard at this location is largely associated with collapse of the overhang while recreational users are using the stairs. The consultant shall install monitoring equipment to the identified risk and prepare a monitoring protocol for the Shire to monitor thereafter.
55

MARGARET RIVER – LIMESTONE CLIFF STABILITY ASSESSMENT REPORT 25 OCTOBER 2019
CMW Geosciences Ref. PER2019-0229AA Rev 1
We will install monitoring equipment and undertake analysis of the block stability. We have also allowed for the design of underpinning to support this overhang.
NB: Note, undertaking and/or overseeing removal of hazards is preferred, but is an optional requirement for quotation purposes.
We have allowed for the supply and installation of simply survey reference points and photograph reference points to assist with future monitoring. We have not allowed for undertaking the actual works to remove the hazards or to support overhanging blocks etc as these will require engagement of specialist contractors.
General monitoring protocol
The report recommends additional and on-going monitoring for all sites (in addition to the above sites). The consultant is required to provide a monitoring protocol for each site that can be implemented as required by Shire staff
In addition to providing advice and remedial option/designs for the sites (where required) we will prepare a monitoring protocol that can be implemented by Shire officers. This protocol will document key features to note and monitor, provide advice on frequency (fixed interval and following storm events etc.) and providing a flow chart that will give guidance on when action is required.
We have allowed for installation of survey monuments (e.g surveyors nails or pins grouted into the rock against which measures can be made and a number of small photo targets that are fixed and can be seen in subsequent inspection photographs in order to reference photographs for change. These survey monuments and targets will only be affixed to the main hazards in the six locations described above. The monitoring protocol will however apply to all locations described in the 2017 report.
Deliverables
We will provide a geotechnical interpretive report describing the inspections, risk analyses and documenting the rationale for recommendations together with the proposed monitoring regime.
Designs for remediation will be provided separately together with indicative costing for execution.
56
MARGARET RIVER – LIMESTONE CLIFF STABILITY ASSESSMENT REPORT 25 OCTOBER 2019
CMW Geosciences Ref. PER2019-0229AA Rev 1
Appendix B Site Observations and Photographs
57
Appendix BSite Inspection 19 and 20 August 2019
58
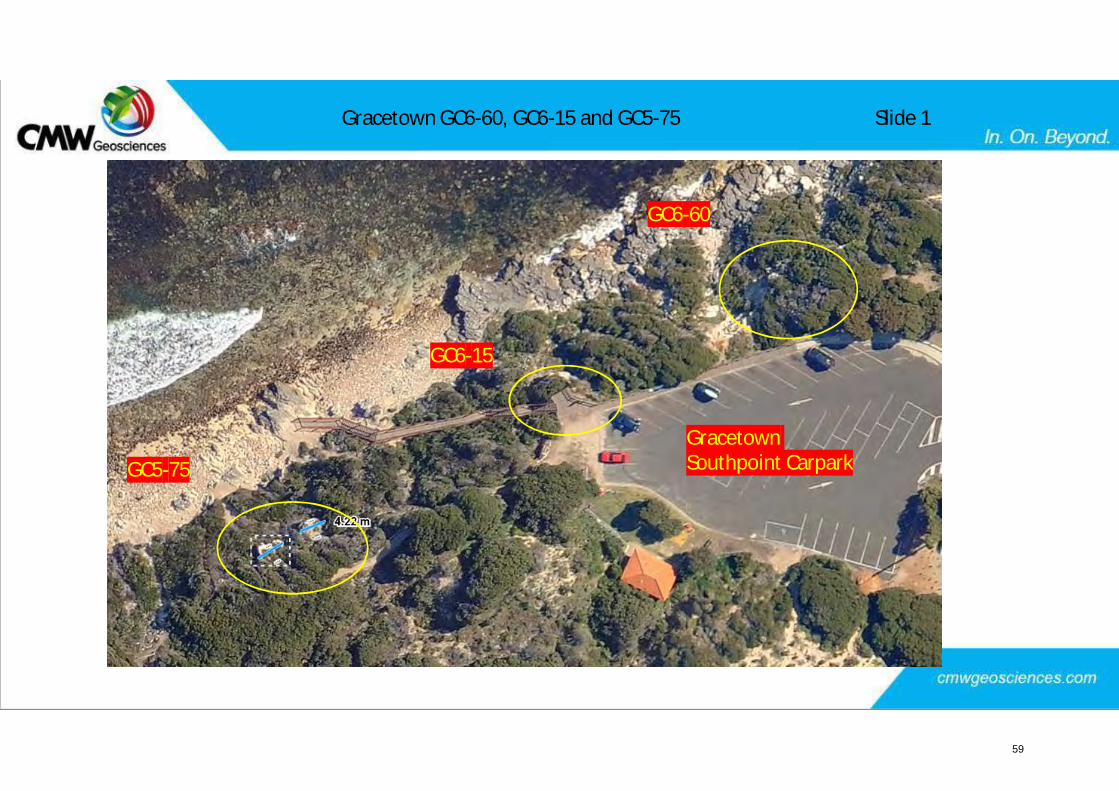
Gracetown GC6-60, GC6-15 and GC5-75
GC6-60
GC6-15
GC5-75GracetownSouthpoint Carpark
Slide 1
59
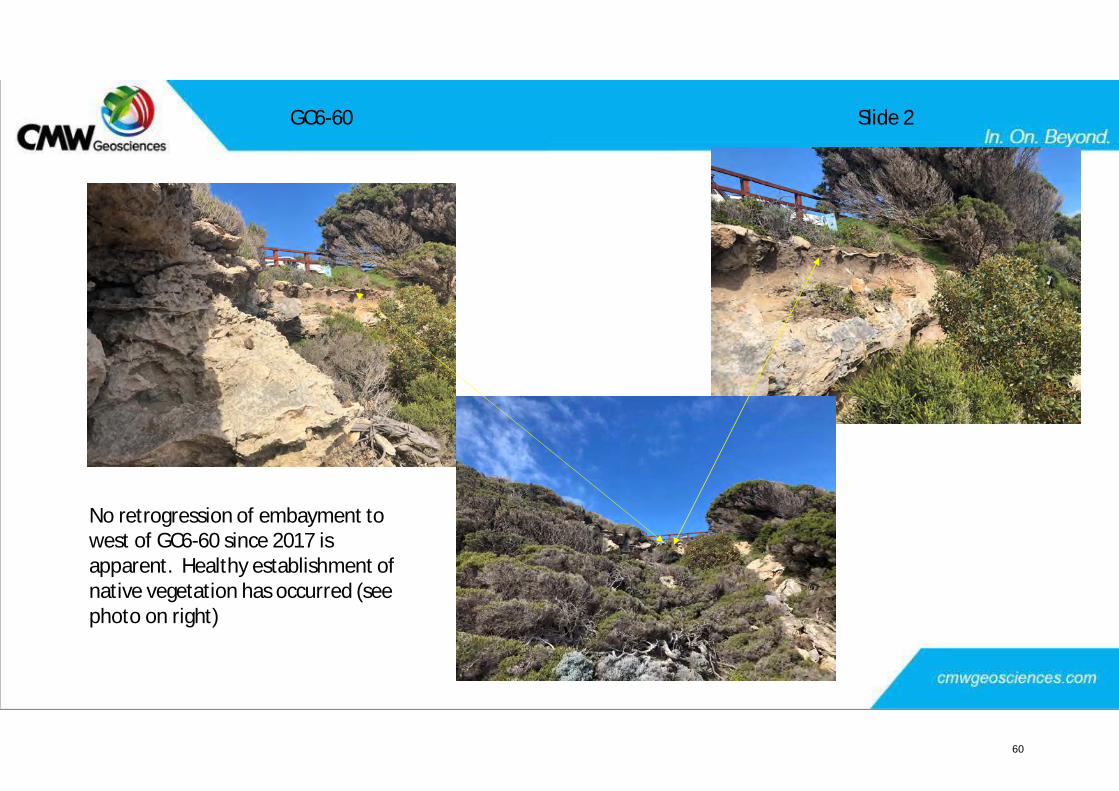
GC6-60
No retrogression of embayment towest of GC6-60 since 2017 isapparent. Healthy establishment ofnative vegetation has occurred (seephoto on right)
Slide 2
60
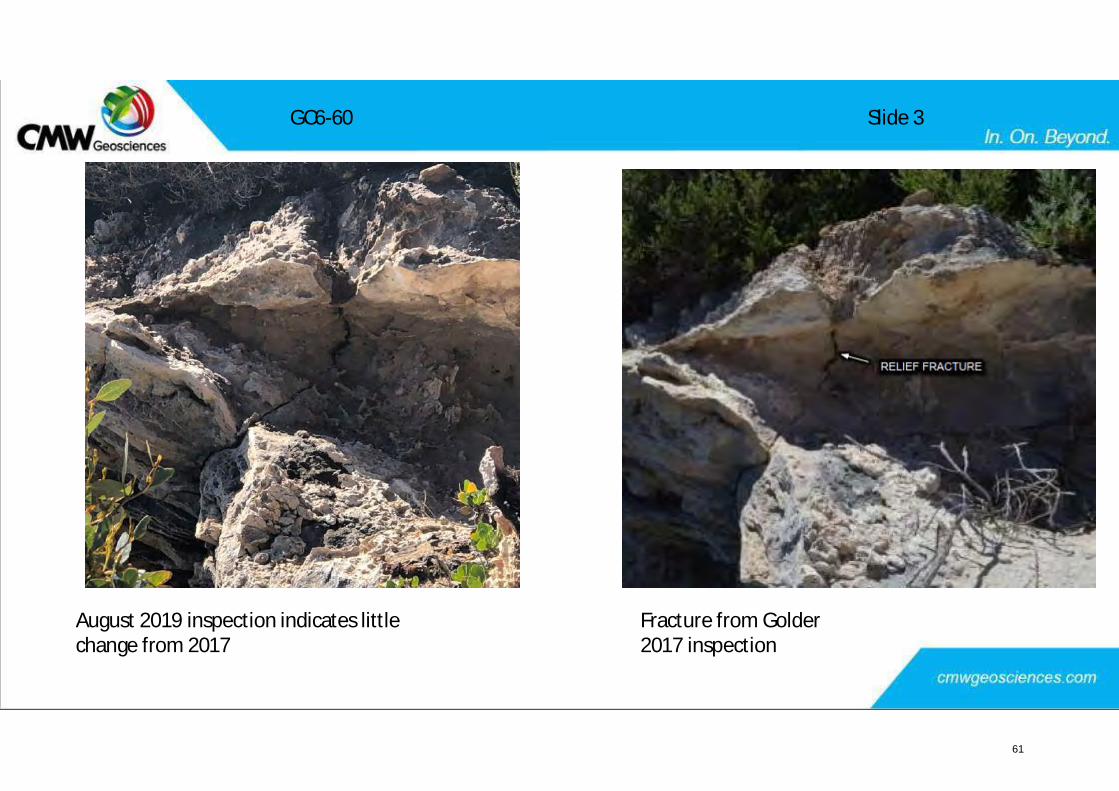
Fracture from Golder2017 inspection
August 2019 inspection indicates littlechange from 2017
GC6-60 Slide 3
61
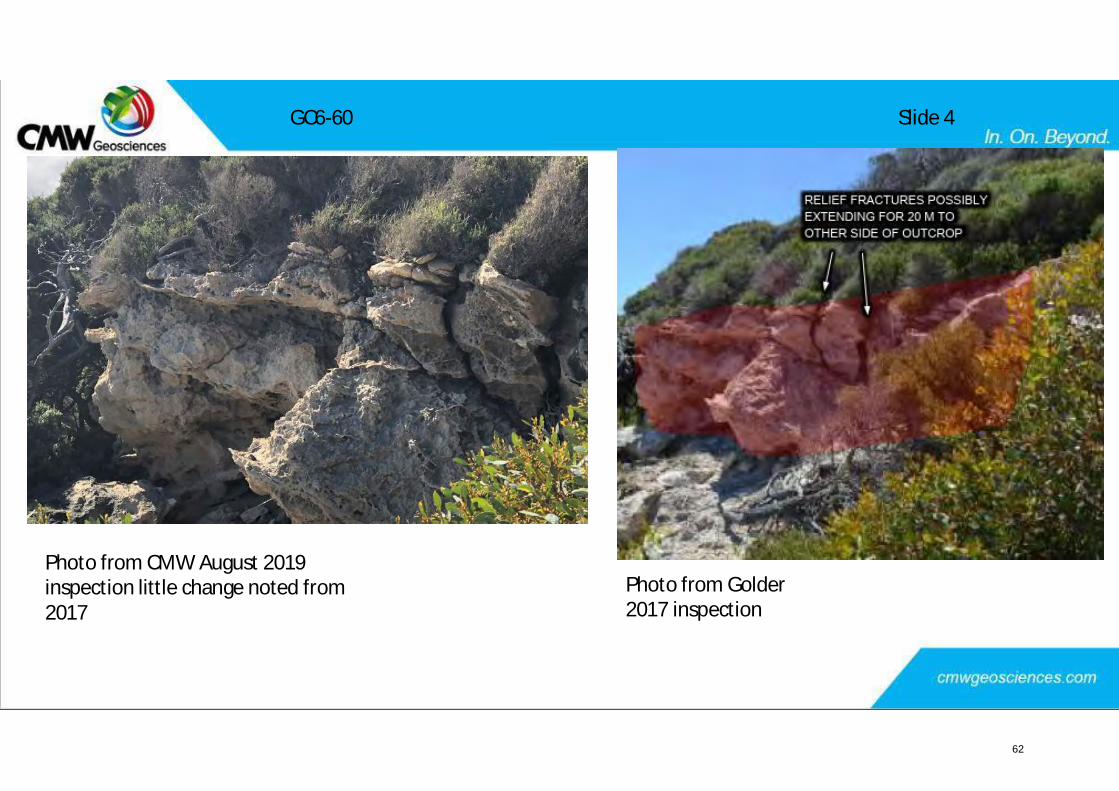
Photo from Golder2017 inspection
Photo from CMW August 2019inspection little change noted from2017
GC6-60 Slide 4
62
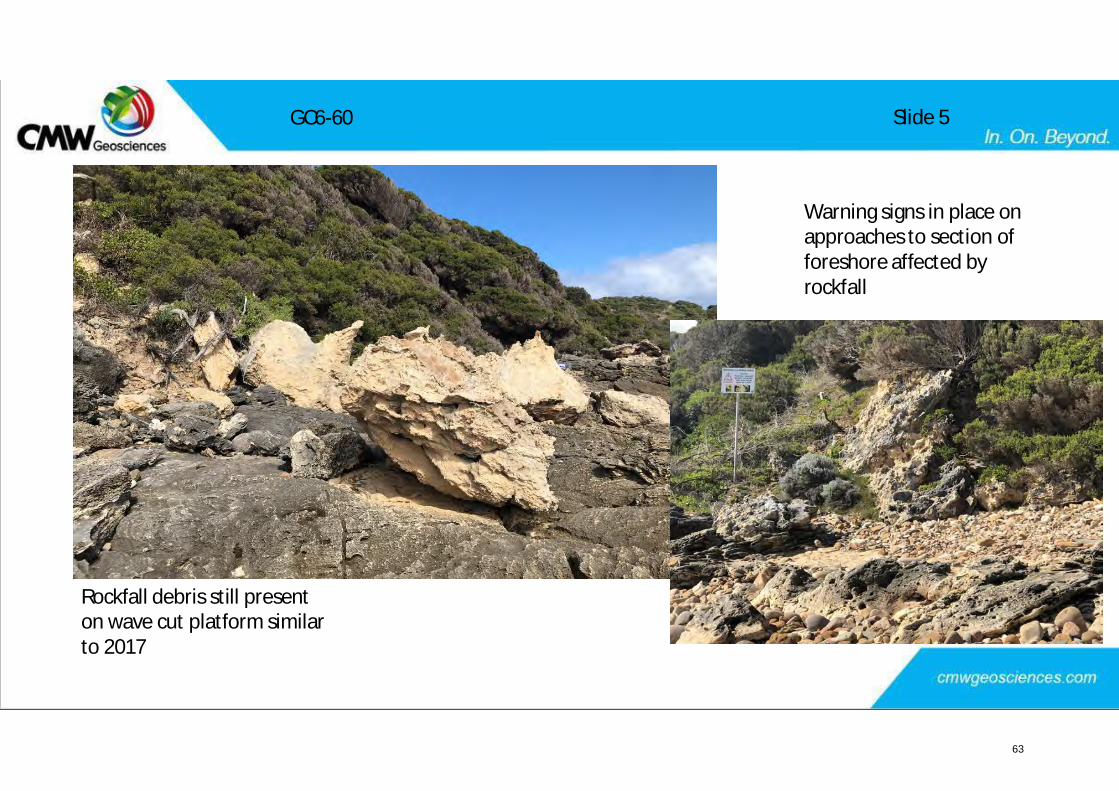
Rockfall debris still presenton wave cut platform similarto 2017
GC6-60
Warning signs in place onapproaches to section offoreshore affected byrockfall
Slide 5
63
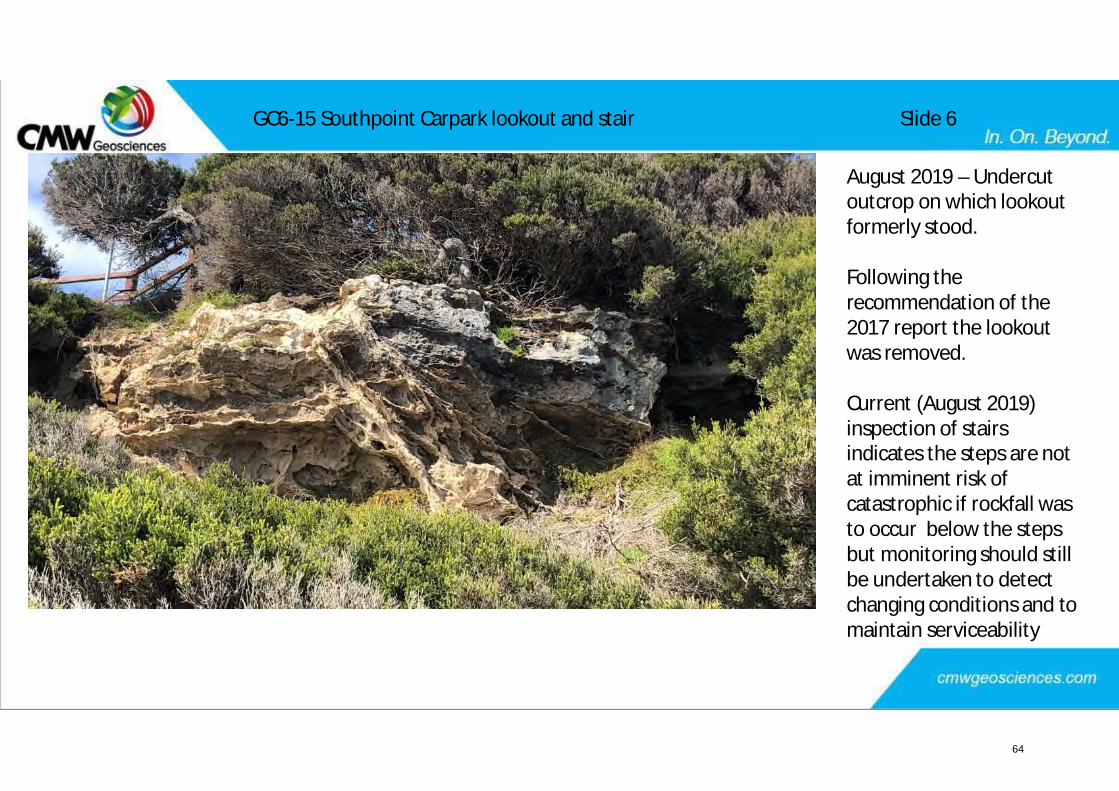
GC6-15 Southpoint Carpark lookout and stair
August 2019 – Undercutoutcrop on which lookoutformerly stood.
Following therecommendation of the2017 report the lookoutwas removed.
Current (August 2019)inspection of stairsindicates the steps are notat imminent risk ofcatastrophic if rockfall wasto occur below the stepsbut monitoring should stillbe undertaken to detectchanging conditions and tomaintain serviceability
Slide 6
64
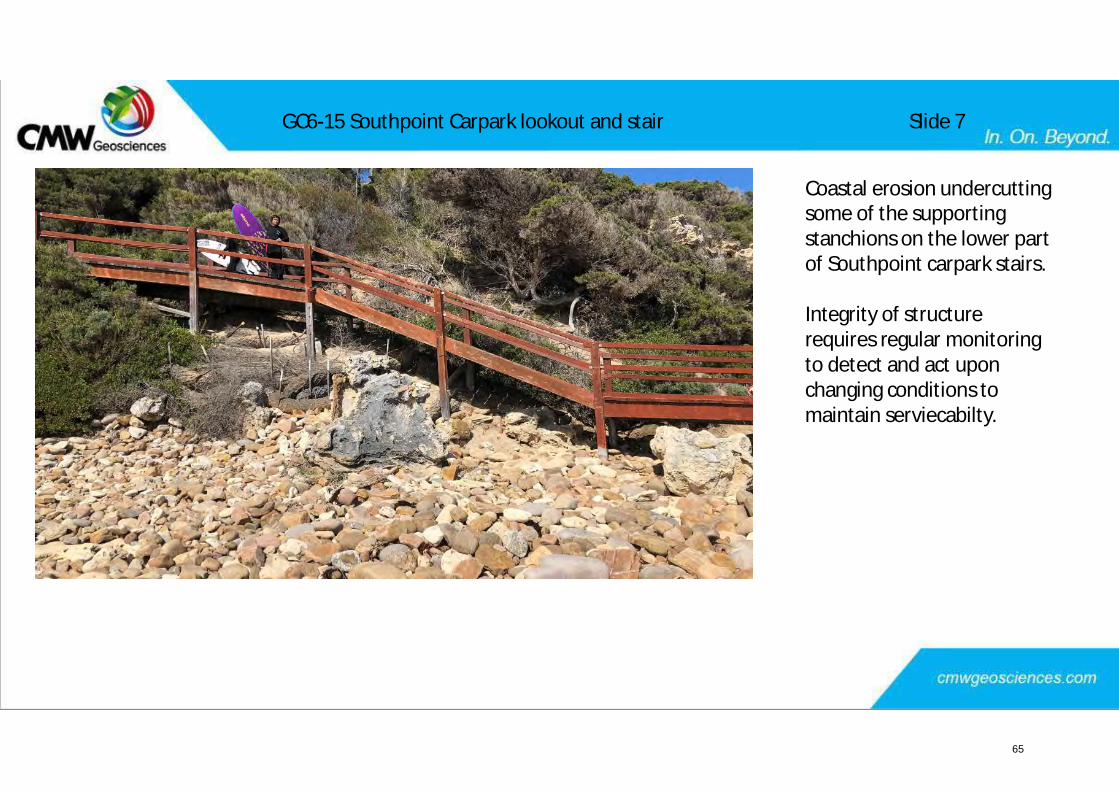
GC6-15 Southpoint Carpark lookout and stair
Coastal erosion undercuttingsome of the supportingstanchions on the lower partof Southpoint carpark stairs.
Integrity of structurerequires regular monitoringto detect and act uponchanging conditions tomaintain serviecabilty.
Slide 7
65
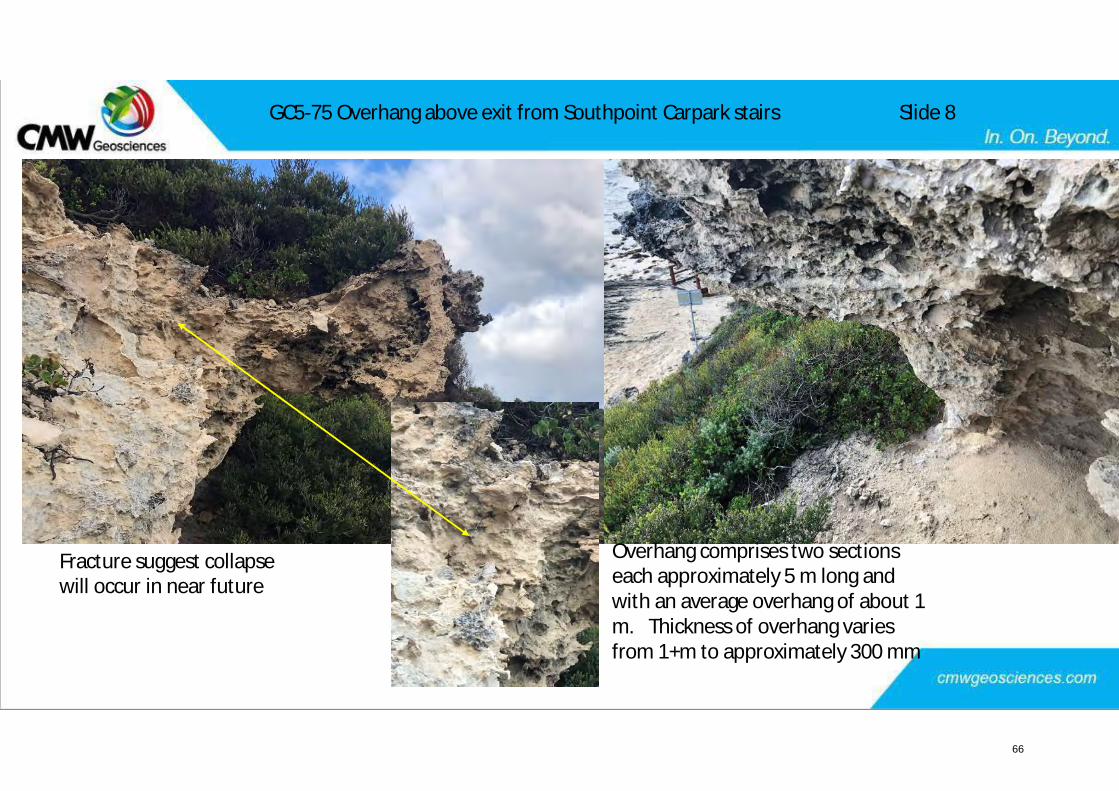
GC5-75 Overhang above exit from Southpoint Carpark stairs
Fracture suggest collapsewill occur in near future
Overhang comprises two sectionseach approximately 5 m long andwith an average overhang of about 1m. Thickness of overhang variesfrom 1+m to approximately 300 mm
Slide 8
66
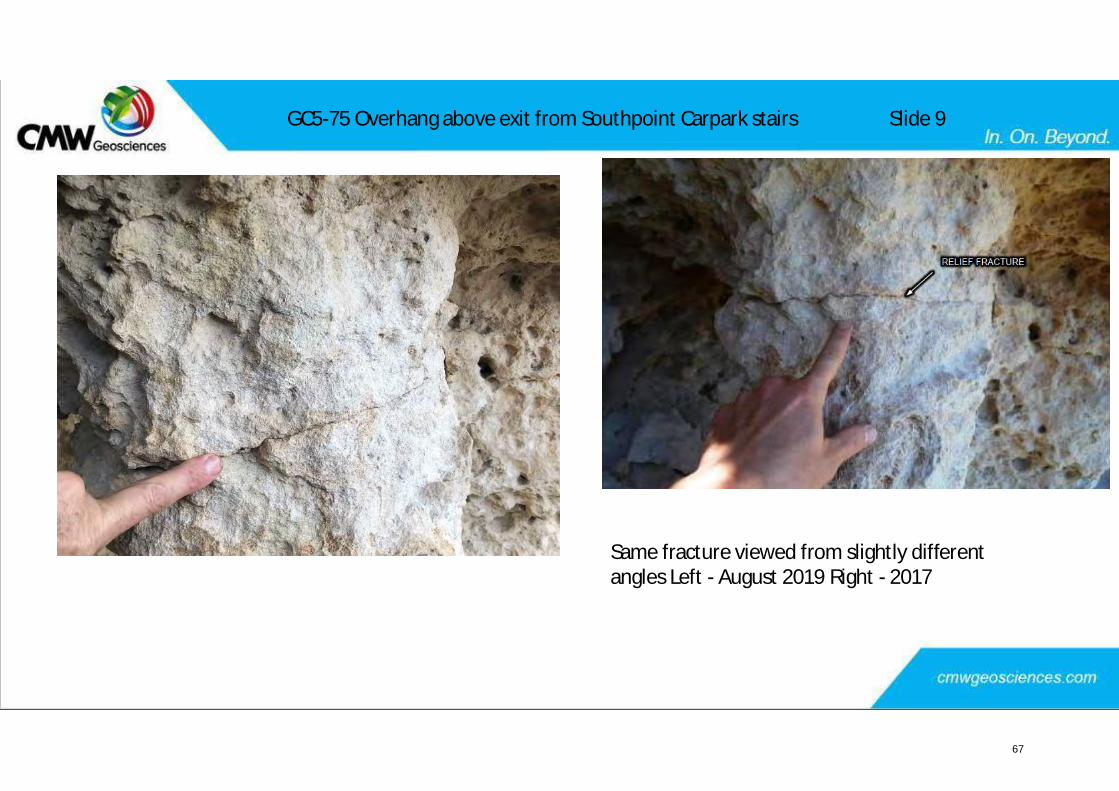
Same fracture viewed from slightly differentangles Left - August 2019 Right - 2017
GC5-75 Overhang above exit from Southpoint Carpark stairs Slide 9
67
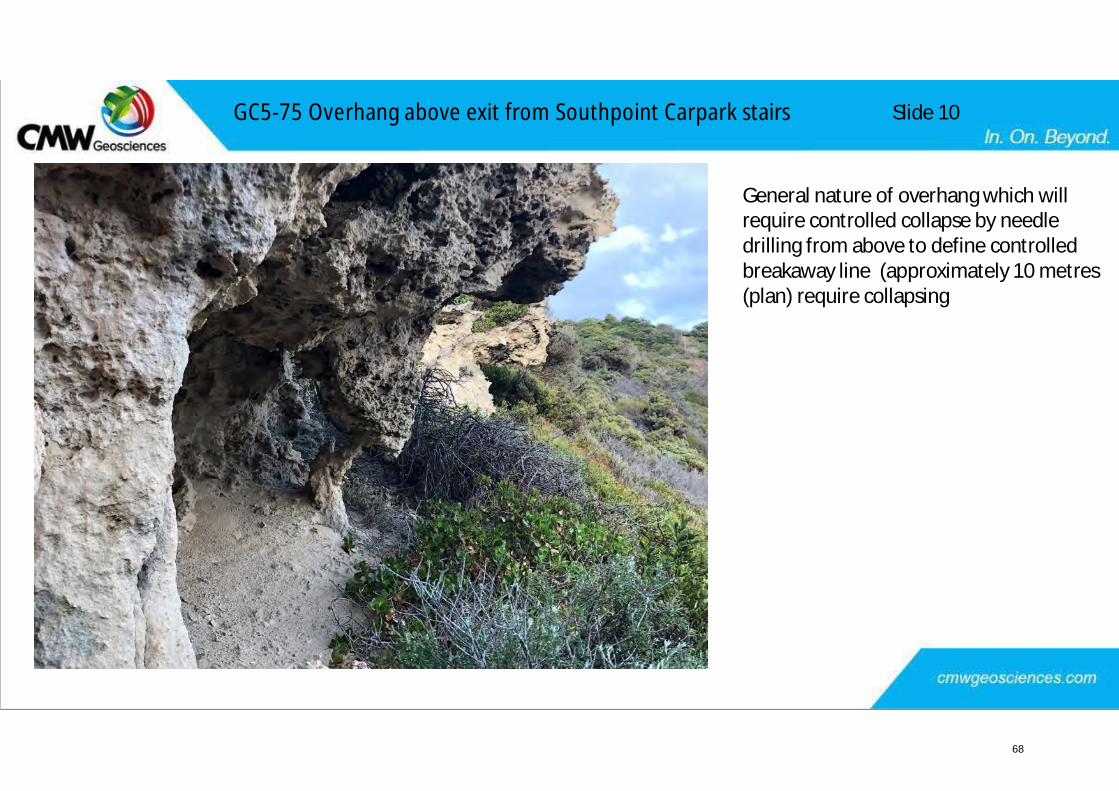
GC5-75 Overhang above exit from Southpoint Carpark stairs
General nature of overhang which willrequire controlled collapse by needledrilling from above to define controlledbreakaway line (approximately 10 metres(plan) require collapsing
Slide 10
68
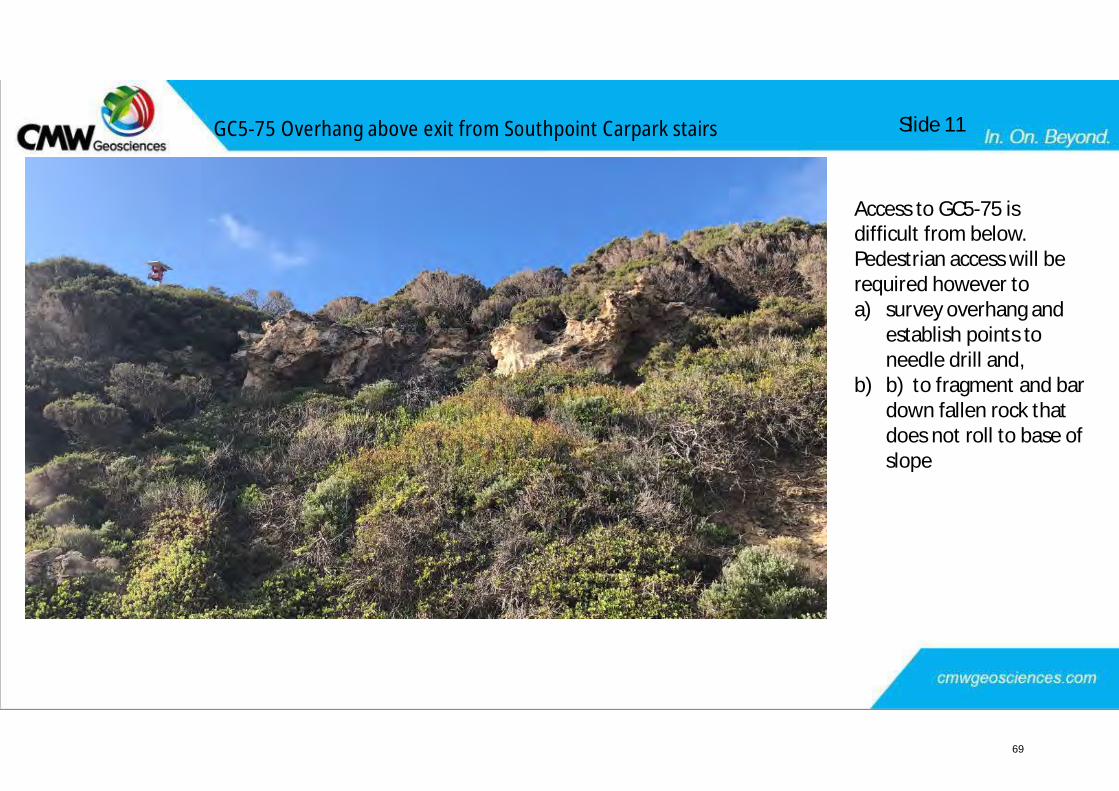
GC5-75 Overhang above exit from Southpoint Carpark stairs
Access to GC5-75 isdifficult from below.Pedestrian access will berequired however toa) survey overhang and
establish points toneedle drill and,
b) b) to fragment and bardown fallen rock thatdoes not roll to base ofslope
Slide 11
69
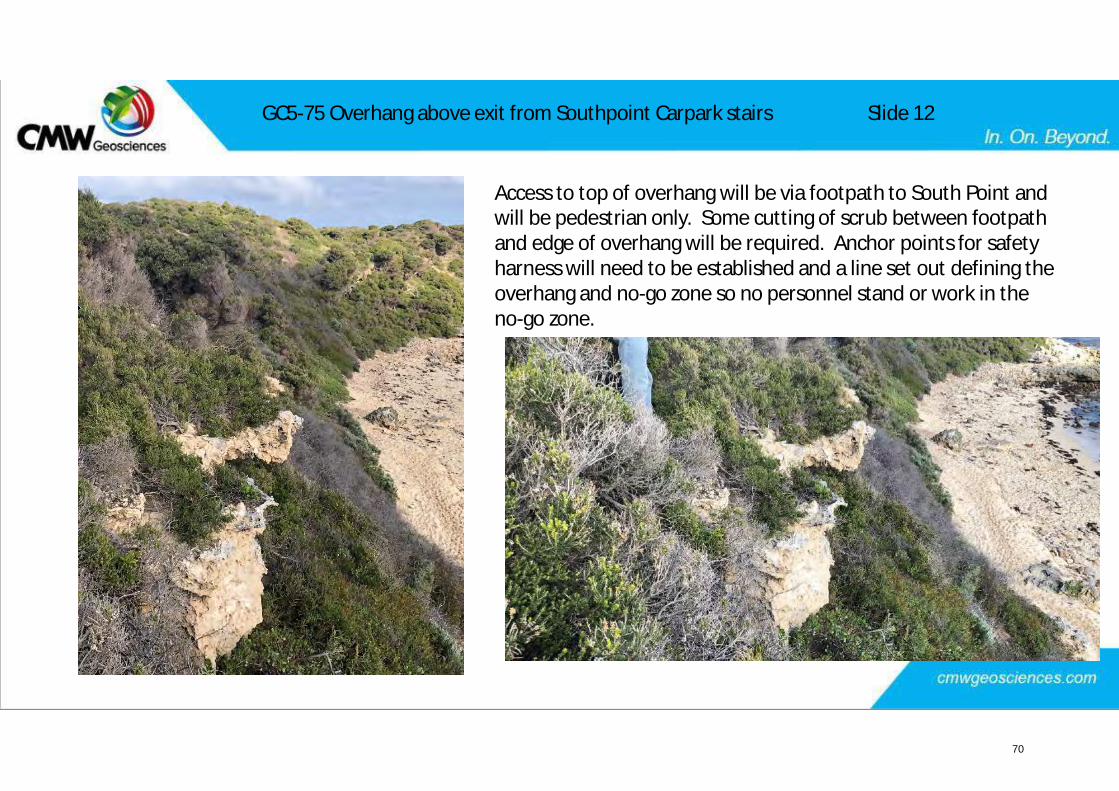
GC5-75 Overhang above exit from Southpoint Carpark stairs
Access to top of overhang will be via footpath to South Point andwill be pedestrian only. Some cutting of scrub between footpathand edge of overhang will be required. Anchor points for safetyharness will need to be established and a line set out defining theoverhang and no-go zone so no personnel stand or work in theno-go zone.
Slide 12
70
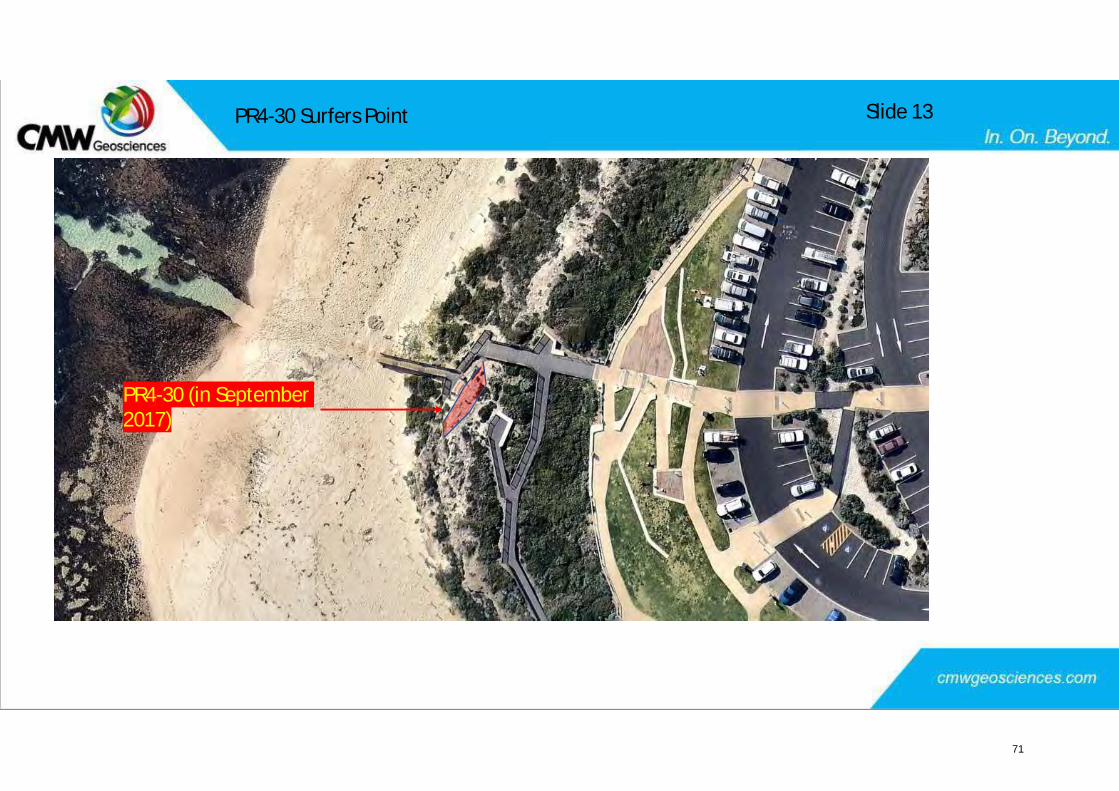
PR4-30 Surfers Point
PR4-30 (in September2017)
Slide 13
71
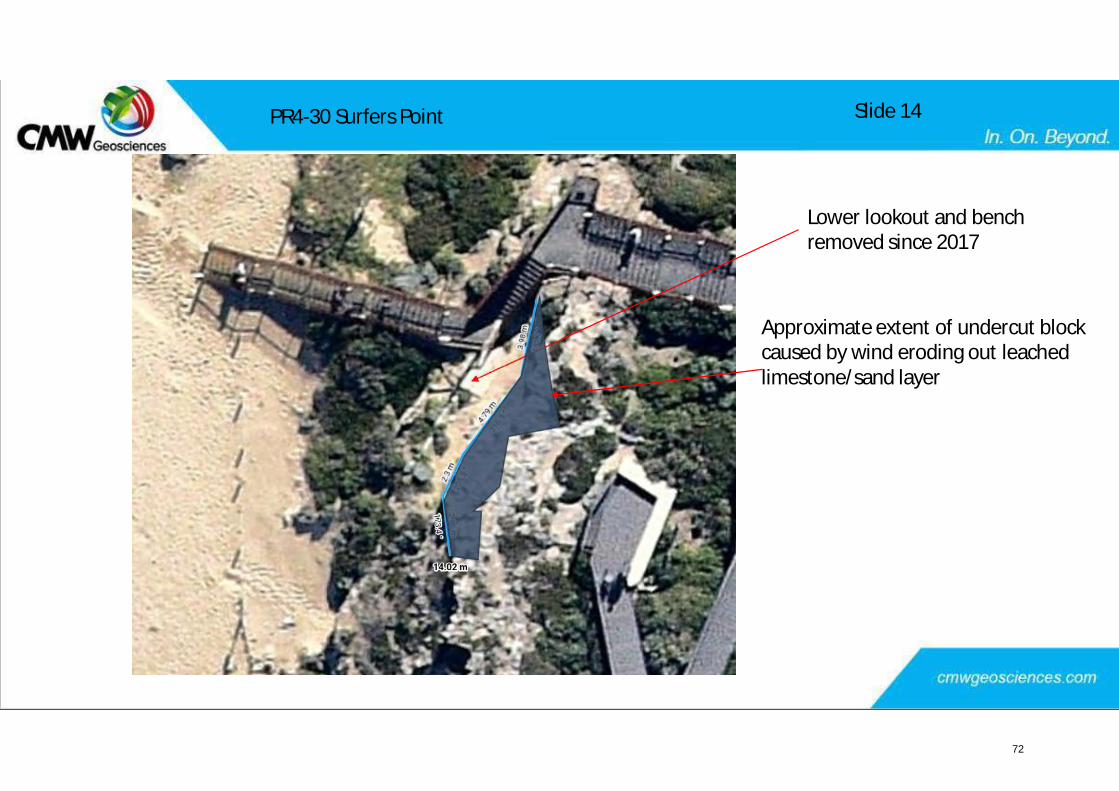
PR4-30 Surfers Point
Lower lookout and benchremoved since 2017
Approximate extent of undercut blockcaused by wind eroding out leachedlimestone/sand layer
Slide 14
72
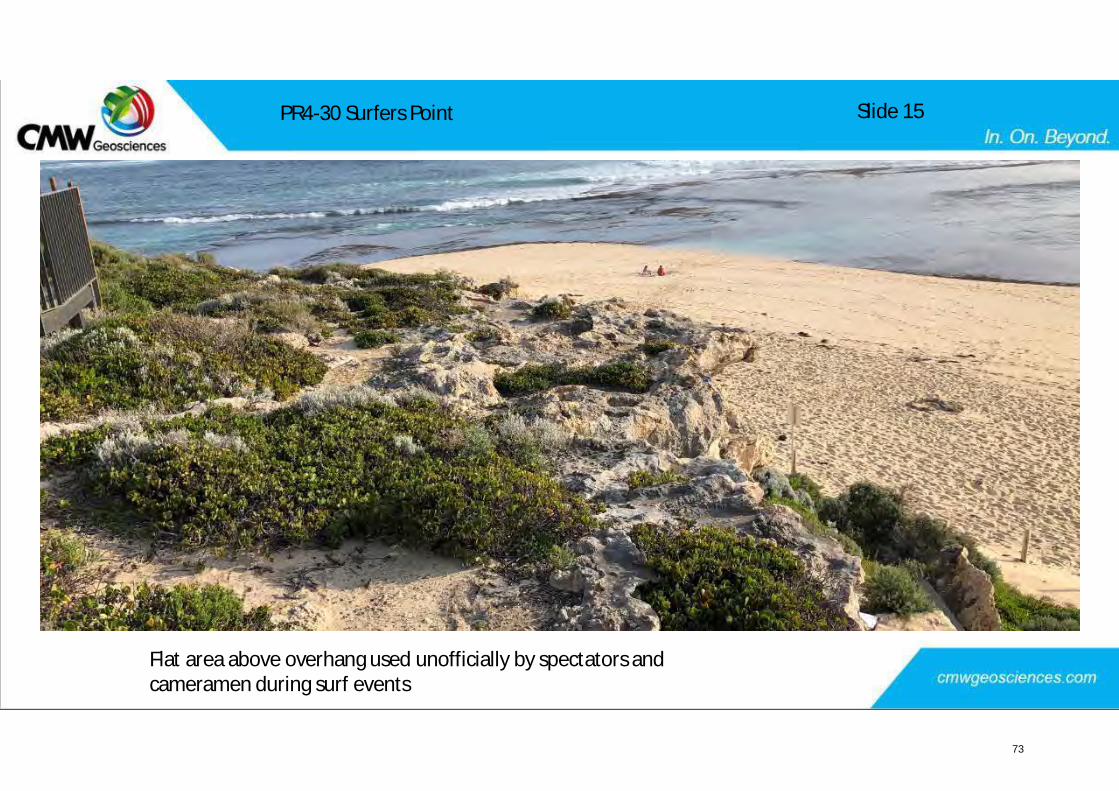
PR4-30 Surfers Point
Flat area above overhang used unofficially by spectators andcameramen during surf events
Slide 15
73
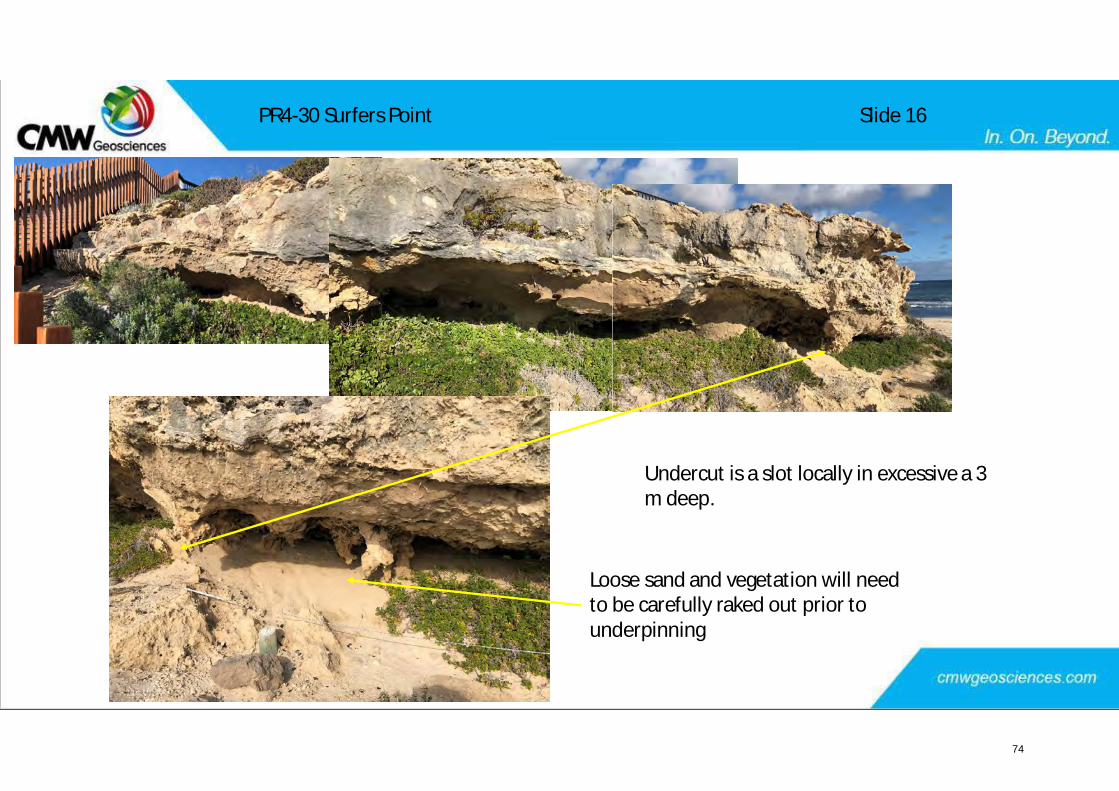
Undercut is a slot locally in excessive a 3m deep.
Loose sand and vegetation will needto be carefully raked out prior tounderpinning
PR4-30 Surfers Point Slide 16
74
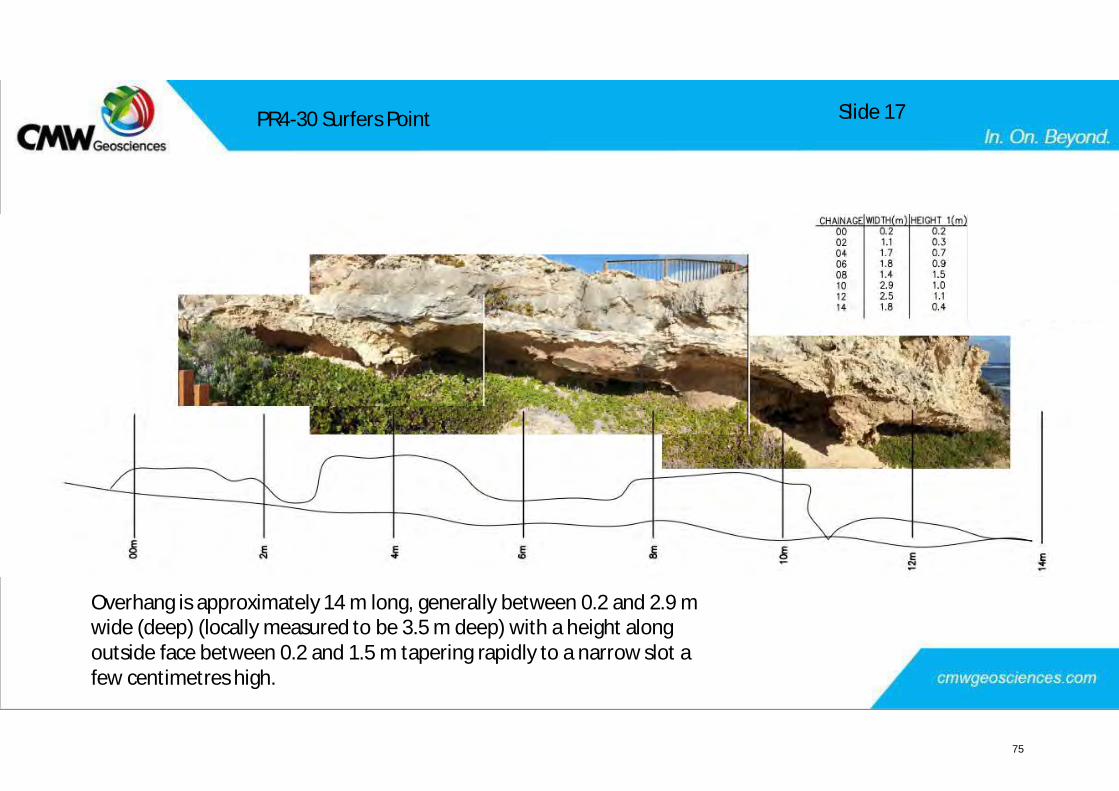
PR4-30 Surfers Point
Overhang is approximately 14 m long, generally between 0.2 and 2.9 mwide (deep) (locally measured to be 3.5 m deep) with a height alongoutside face between 0.2 and 1.5 m tapering rapidly to a narrow slot afew centimetres high.
Slide 17
75
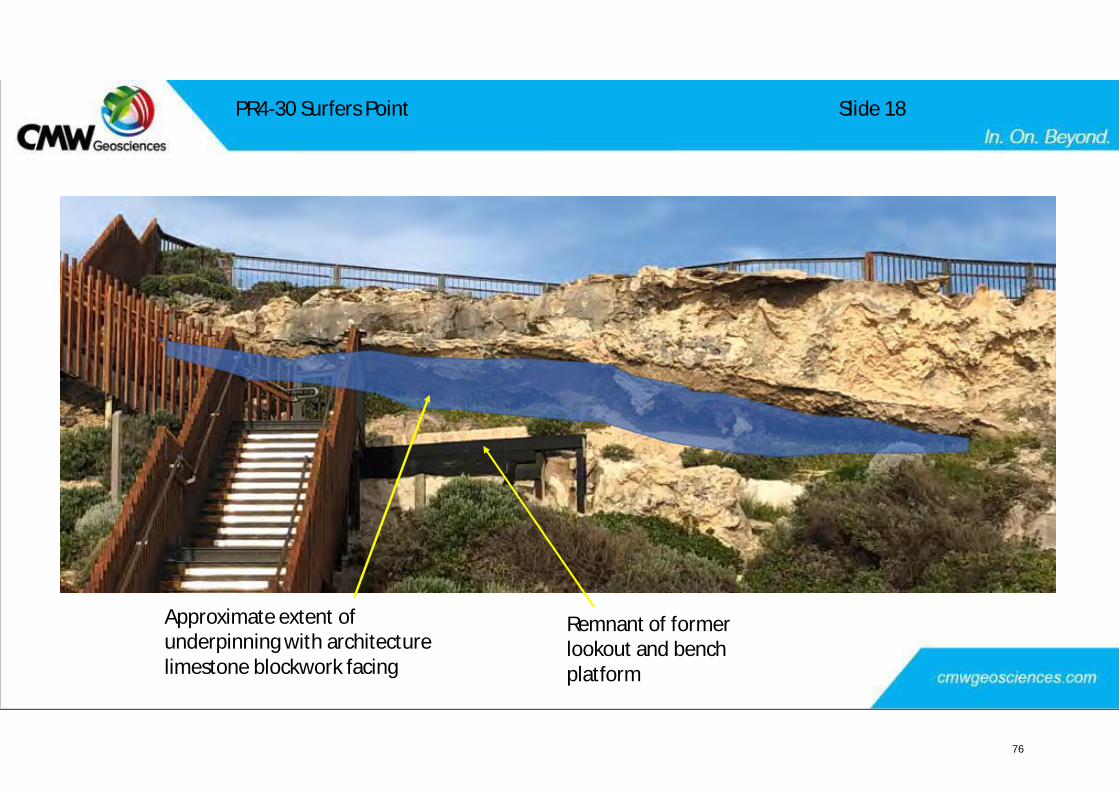
Approximate extent ofunderpinning with architecturelimestone blockwork facing
Remnant of formerlookout and benchplatform
Slide 18PR4-30 Surfers Point
76
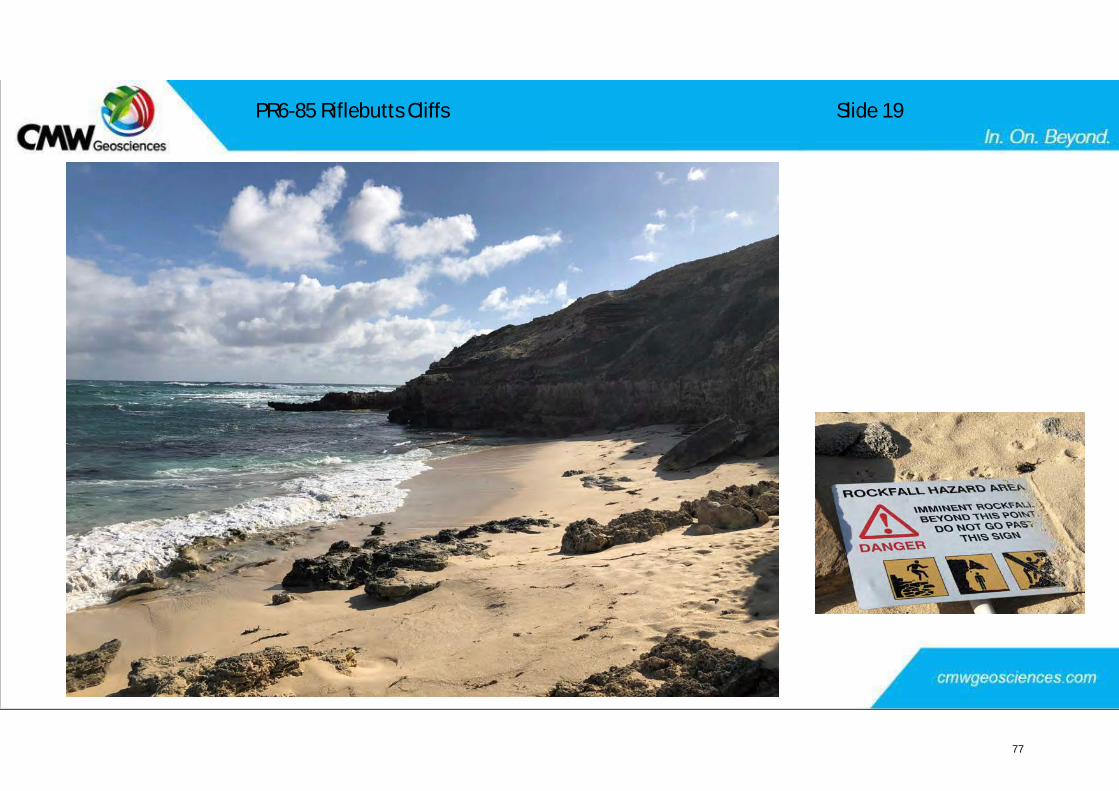
PR6-85 Riflebutts Cliffs Slide 19
77

PR6-85 Riflebutts Cliffs
August 2019 Nearmap Imagery – showingproposed position of fence to restrict access
Slide 20
78
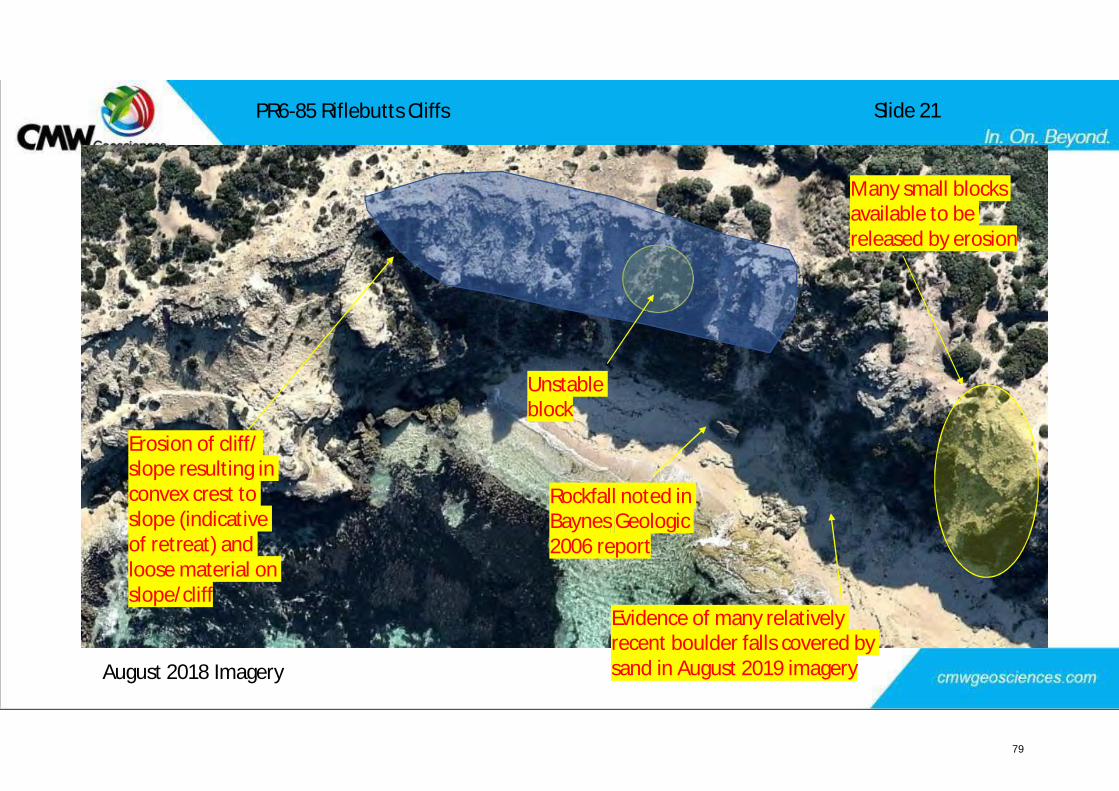
Rockfall noted inBaynes Geologic2006 report
Unstableblock
Evidence of many relativelyrecent boulder falls covered bysand in August 2019 imagery
Many small blocksavailable to bereleased by erosion
Erosion of cliff/slope resulting inconvex crest toslope (indicativeof retreat) andloose material onslope/cliff
PR6-85 Riflebutts Cliffs
August 2018 Imagery
Slide 21
79
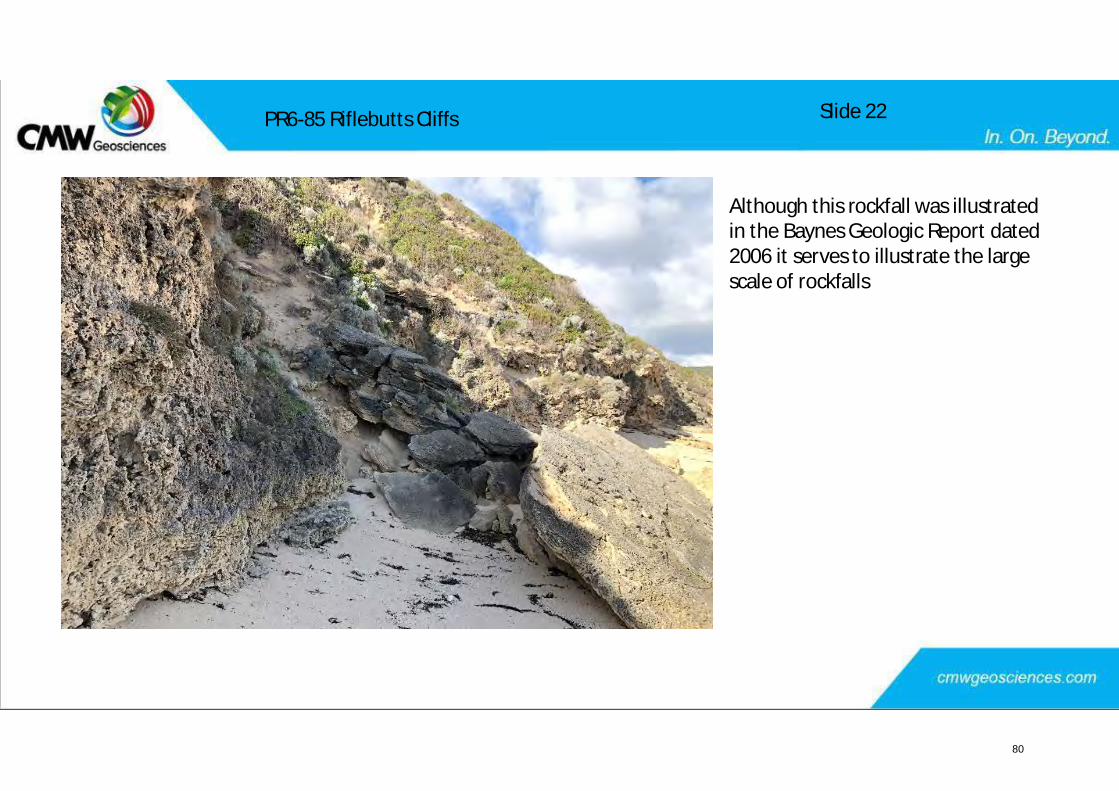
Although this rockfall was illustratedin the Baynes Geologic Report dated2006 it serves to illustrate the largescale of rockfalls
PR6-85 Riflebutts Cliffs Slide 22
80
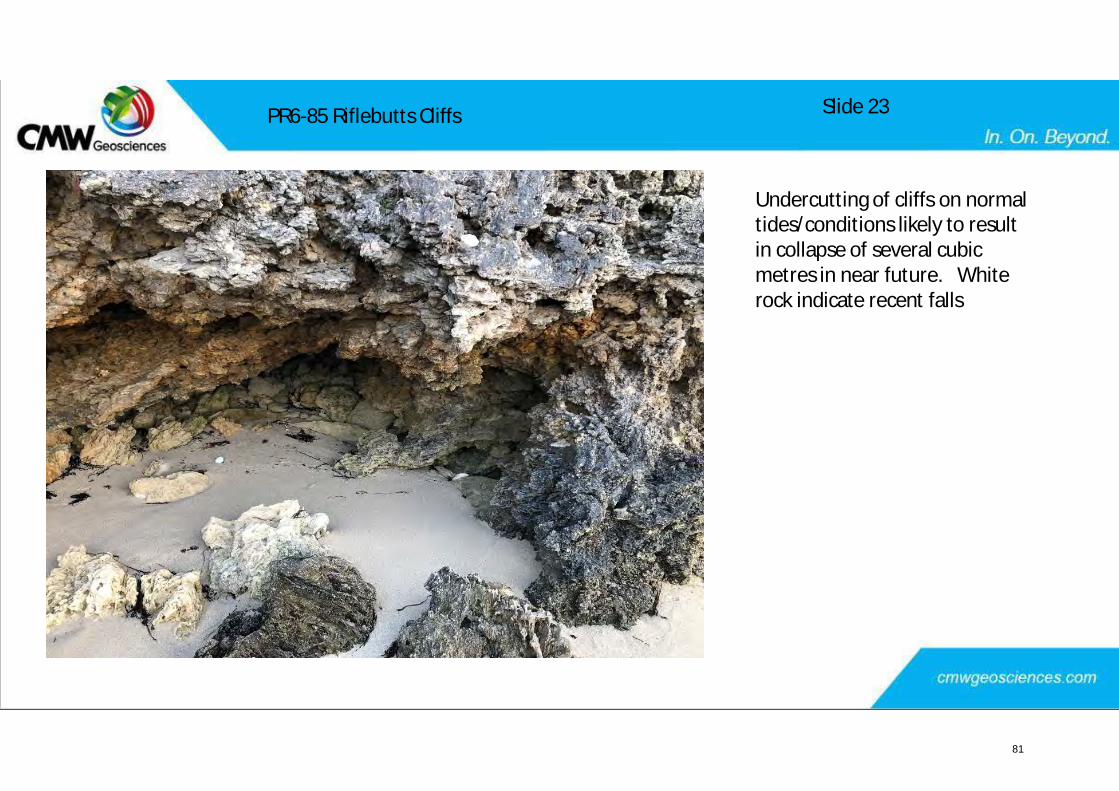
Undercutting of cliffs on normaltides/conditions likely to resultin collapse of several cubicmetres in near future. Whiterock indicate recent falls
PR6-85 Riflebutts Cliffs Slide 23
81
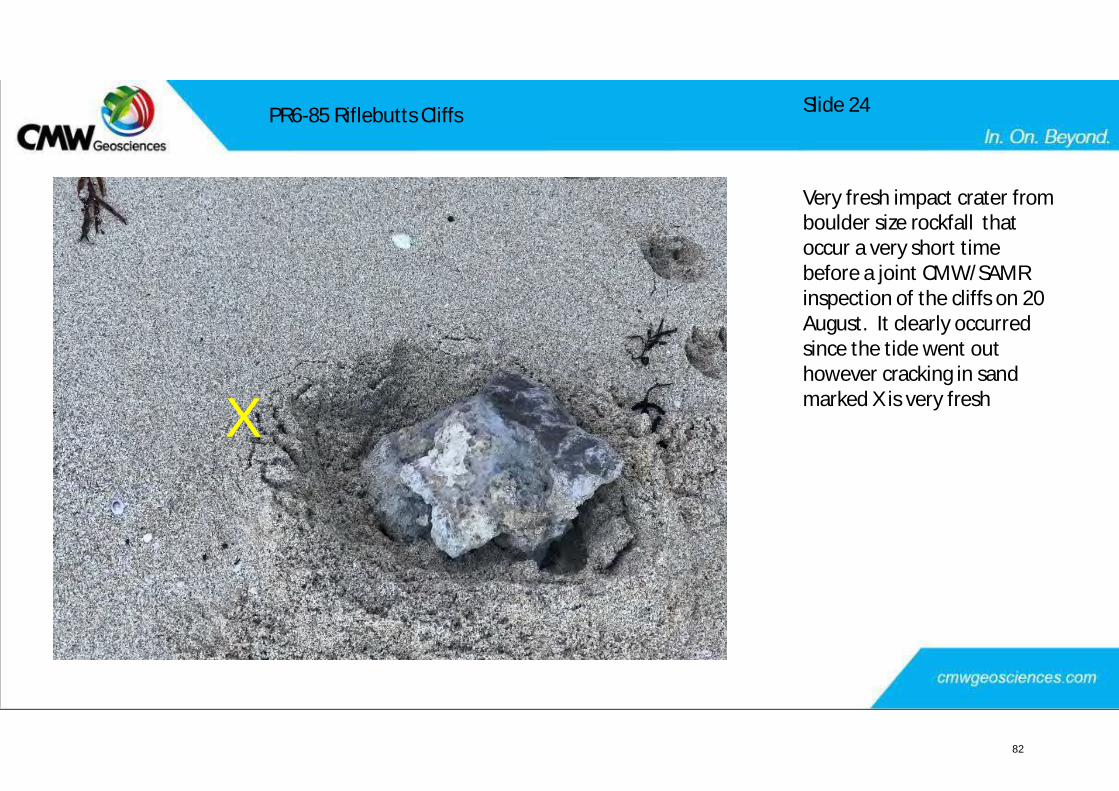
Very fresh impact crater fromboulder size rockfall thatoccur a very short timebefore a joint CMW/SAMRinspection of the cliffs on 20August. It clearly occurredsince the tide went outhowever cracking in sandmarked X is very freshX
PR6-85 Riflebutts Cliffs Slide 24
82
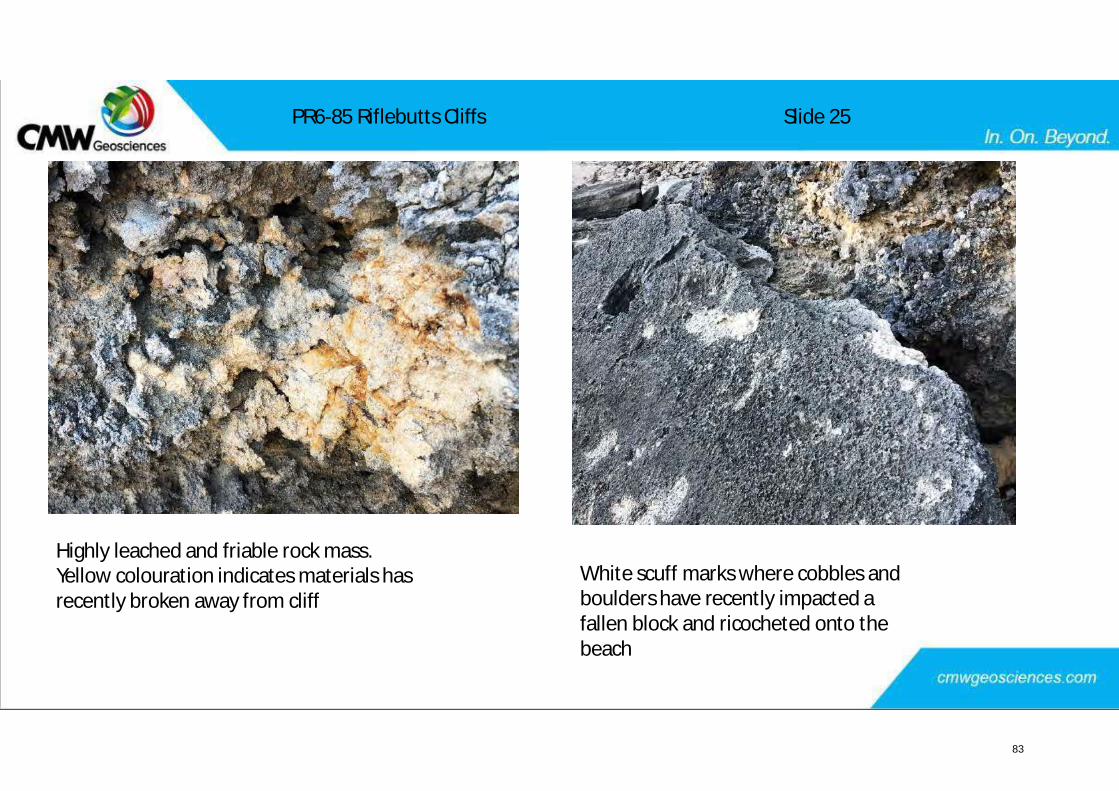
Highly leached and friable rock mass.Yellow colouration indicates materials hasrecently broken away from cliff
White scuff marks where cobbles andboulders have recently impacted afallen block and ricocheted onto thebeach
PR6-85 Riflebutts Cliffs Slide 25
83
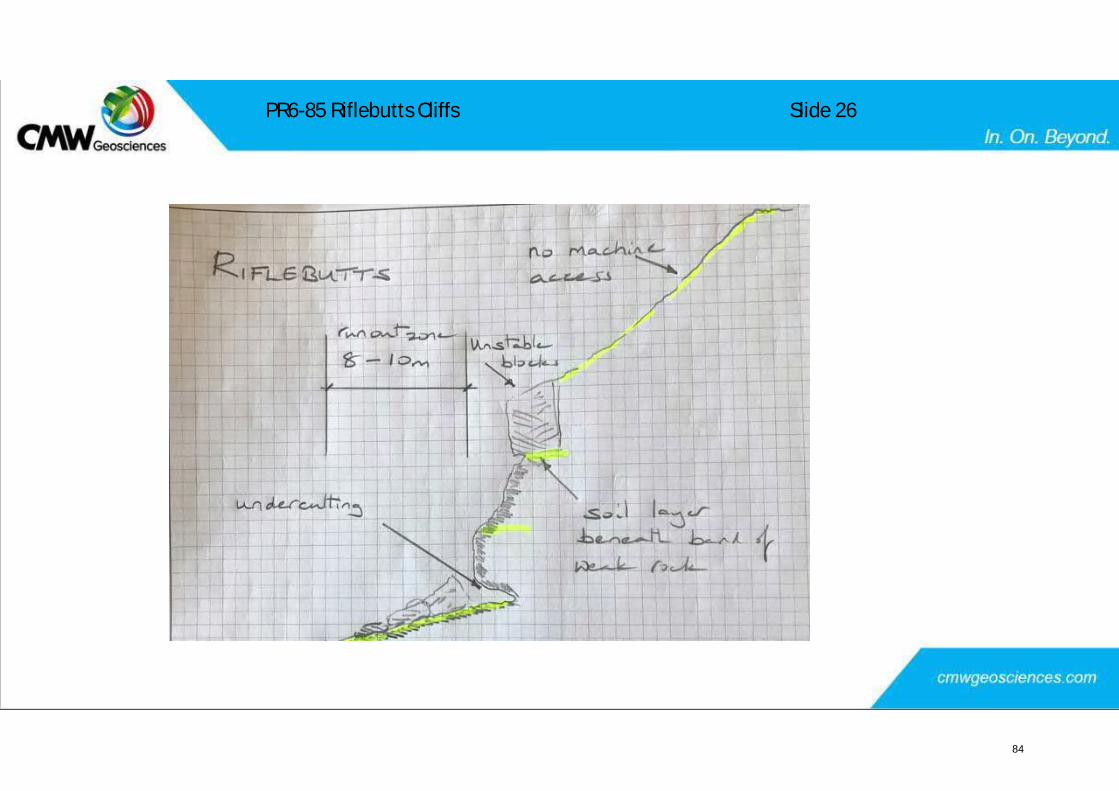
PR6-85 Riflebutts Cliffs Slide 26
84
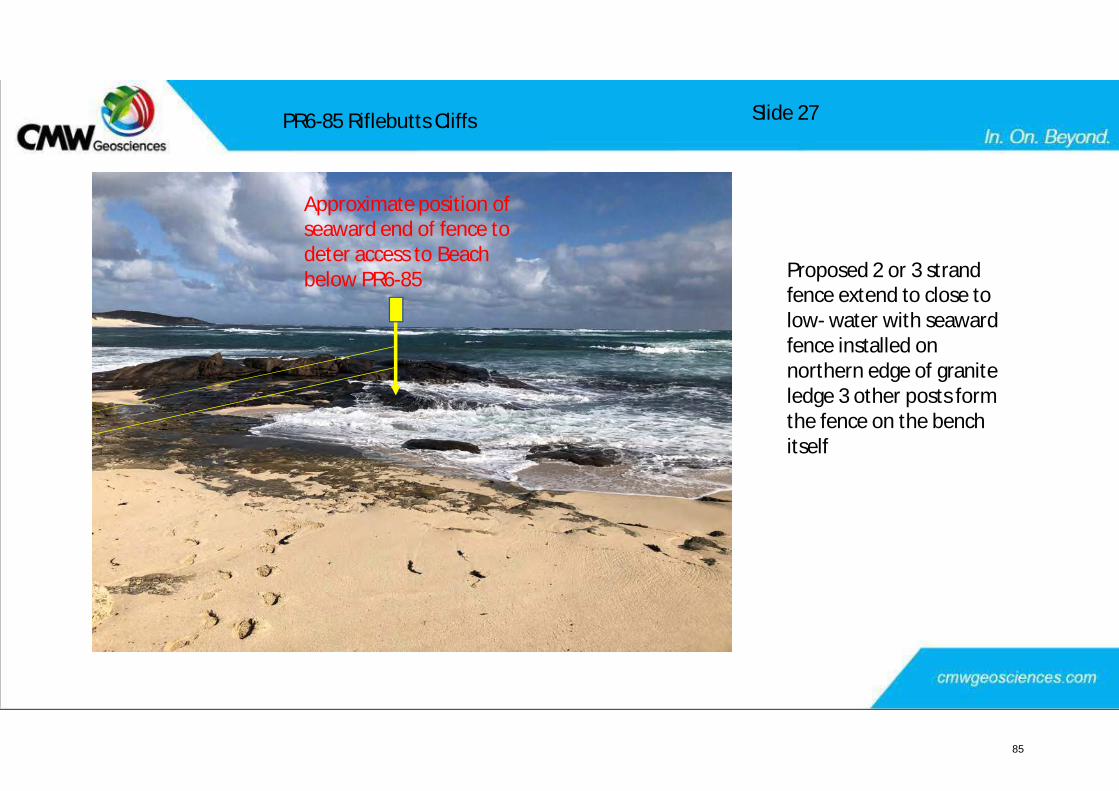
Approximate position ofseaward end of fence todeter access to Beachbelow PR6-85 Proposed 2 or 3 strand
fence extend to close tolow- water with seawardfence installed onnorthern edge of graniteledge 3 other posts formthe fence on the benchitself
PR6-85 Riflebutts Cliffs Slide 27
85
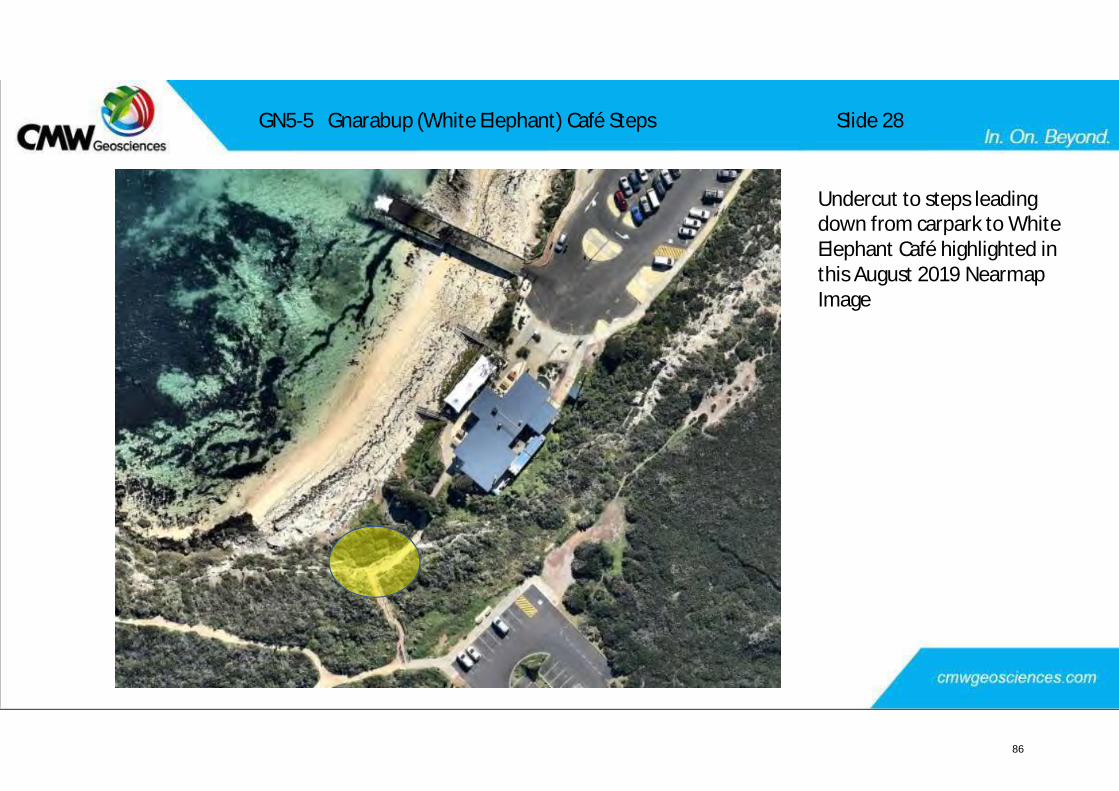
GN5-5 Gnarabup (White Elephant) Café Steps
Undercut to steps leadingdown from carpark to WhiteElephant Café highlighted inthis August 2019 NearmapImage
Slide 28
86
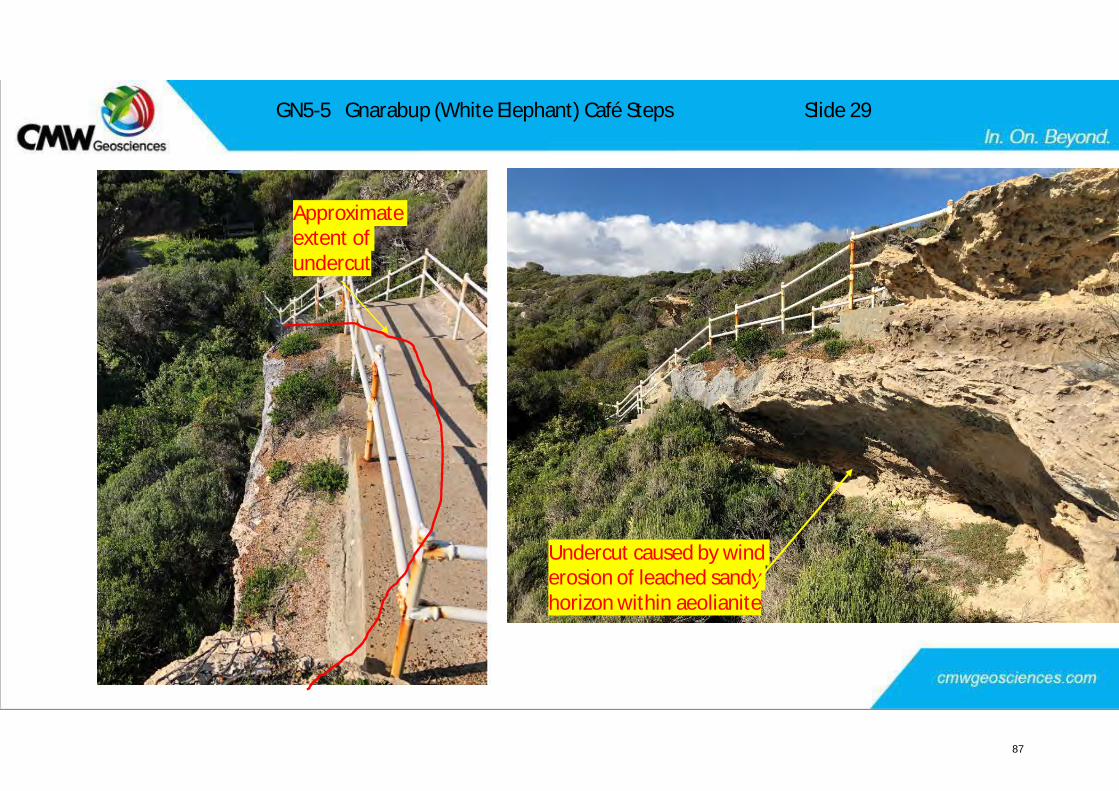
GN5-5 Gnarabup (White Elephant) Café Steps
Approximateextent ofundercut
Undercut caused by winderosion of leached sandyhorizon within aeolianite
Slide 29
87
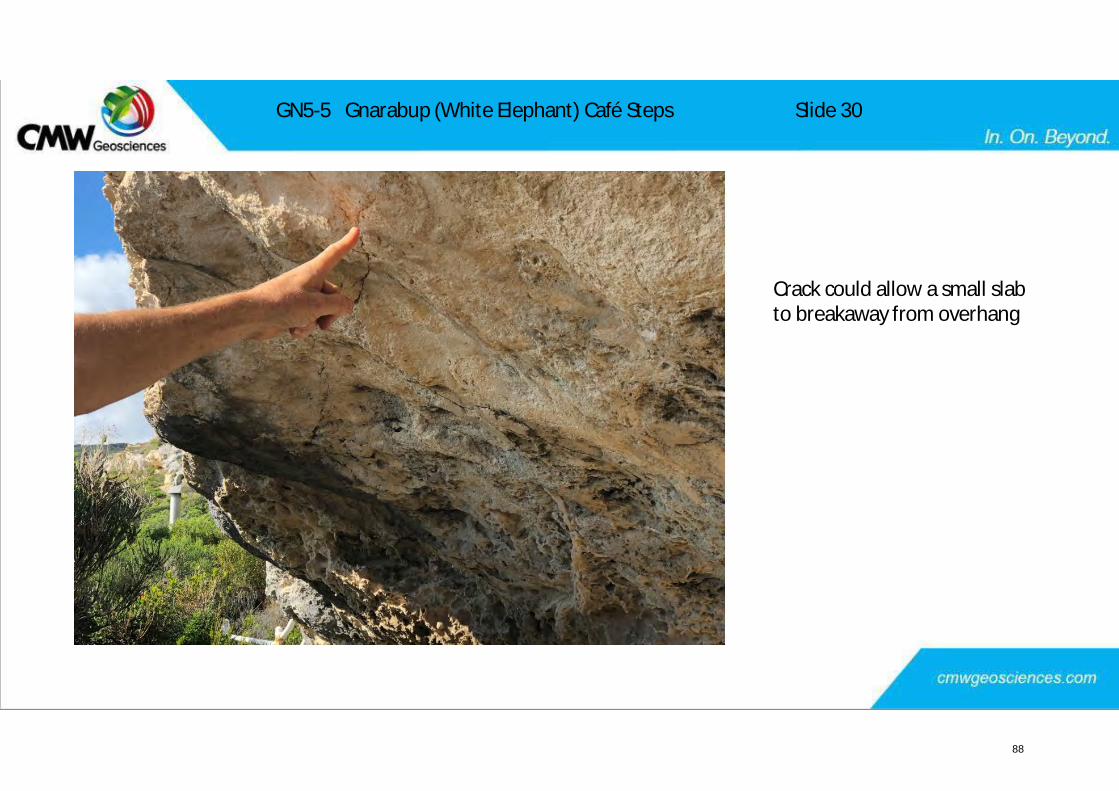
GN5-5 Gnarabup (White Elephant) Café Steps
Crack could allow a small slabto breakaway from overhang
Slide 30
88
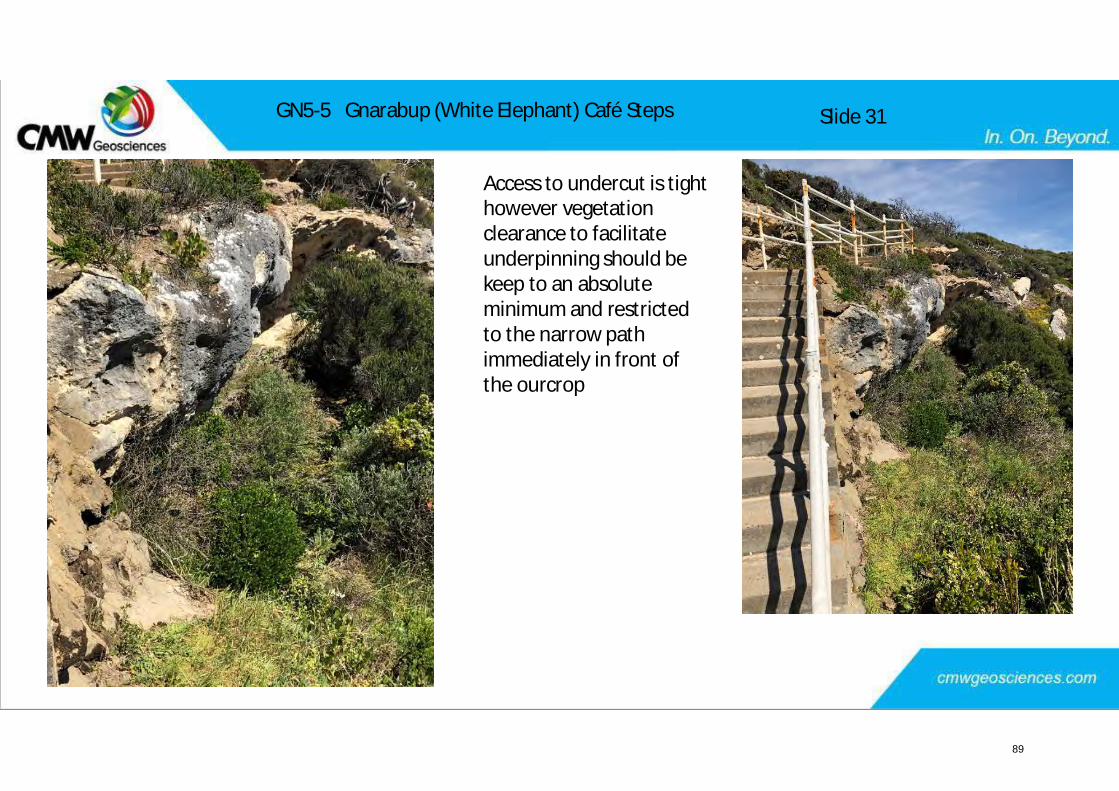
GN5-5 Gnarabup (White Elephant) Café Steps
Access to undercut is tighthowever vegetationclearance to facilitateunderpinning should bekeep to an absoluteminimum and restrictedto the narrow pathimmediately in front ofthe ourcrop
Slide 31
89
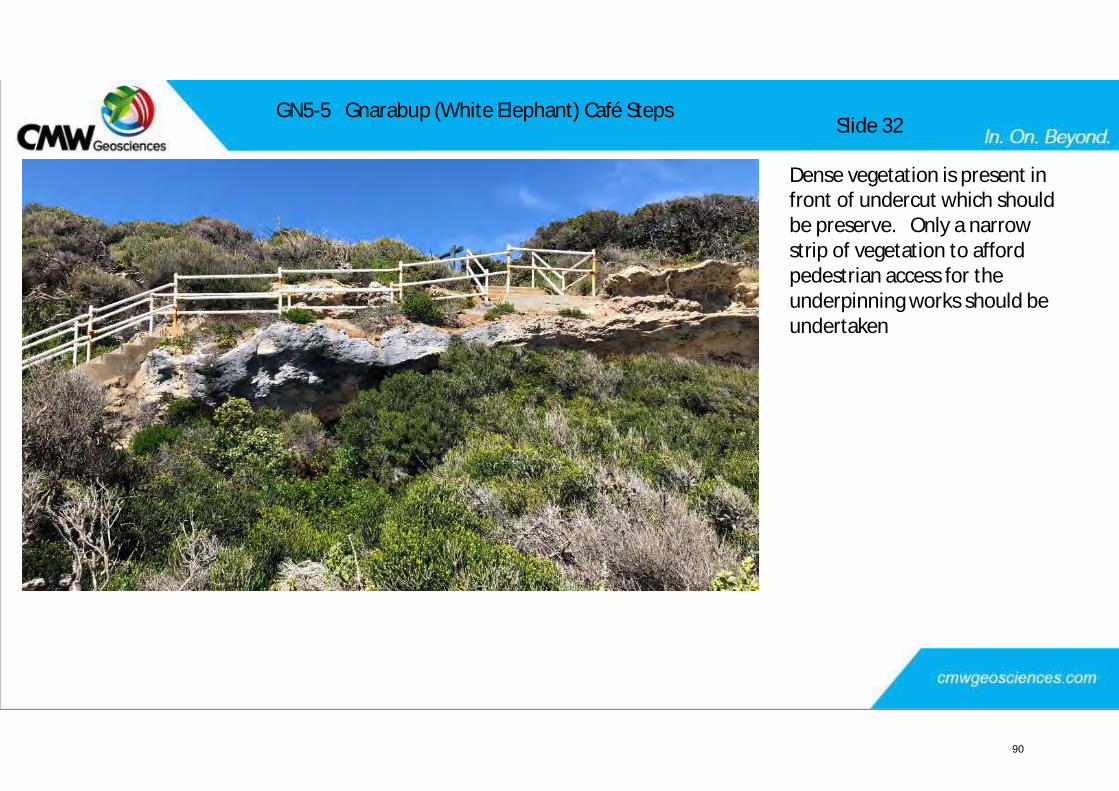
GN5-5 Gnarabup (White Elephant) Café Steps
Dense vegetation is present infront of undercut which shouldbe preserve. Only a narrowstrip of vegetation to affordpedestrian access for theunderpinning works should beundertaken
Slide 32
90
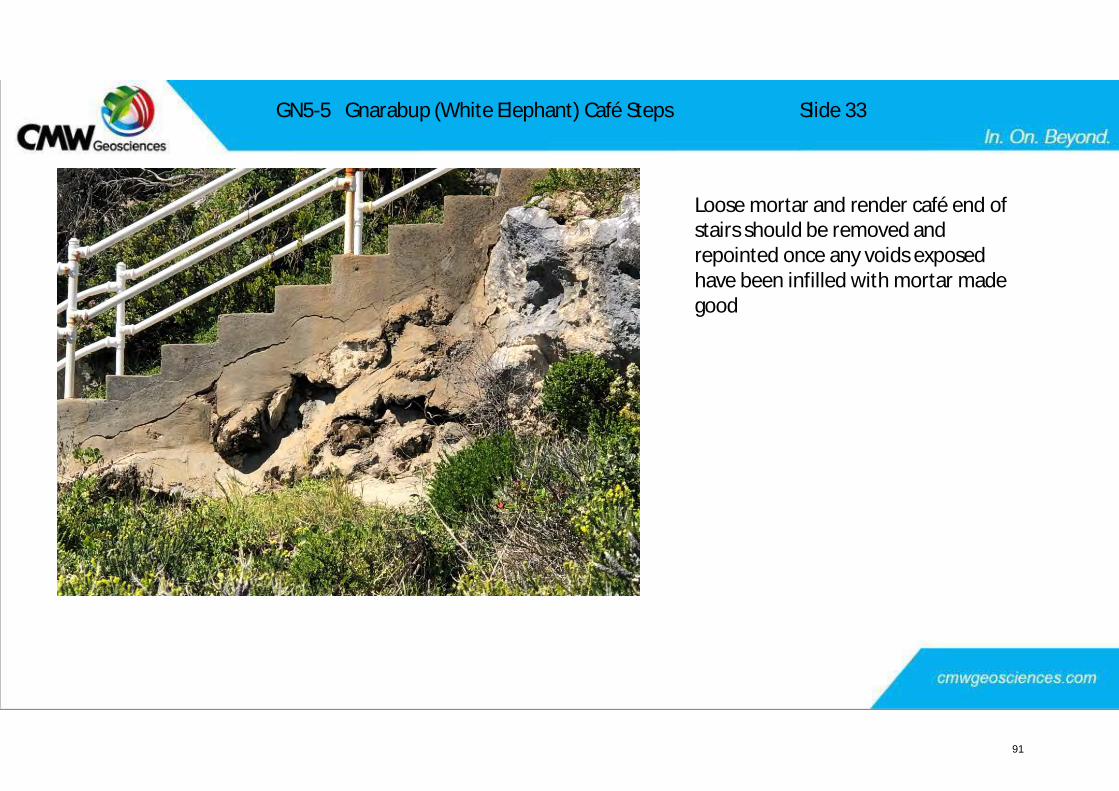
GN5-5 Gnarabup (White Elephant) Café Steps
Loose mortar and render café end ofstairs should be removed andrepointed once any voids exposedhave been infilled with mortar madegood
Slide 33
91
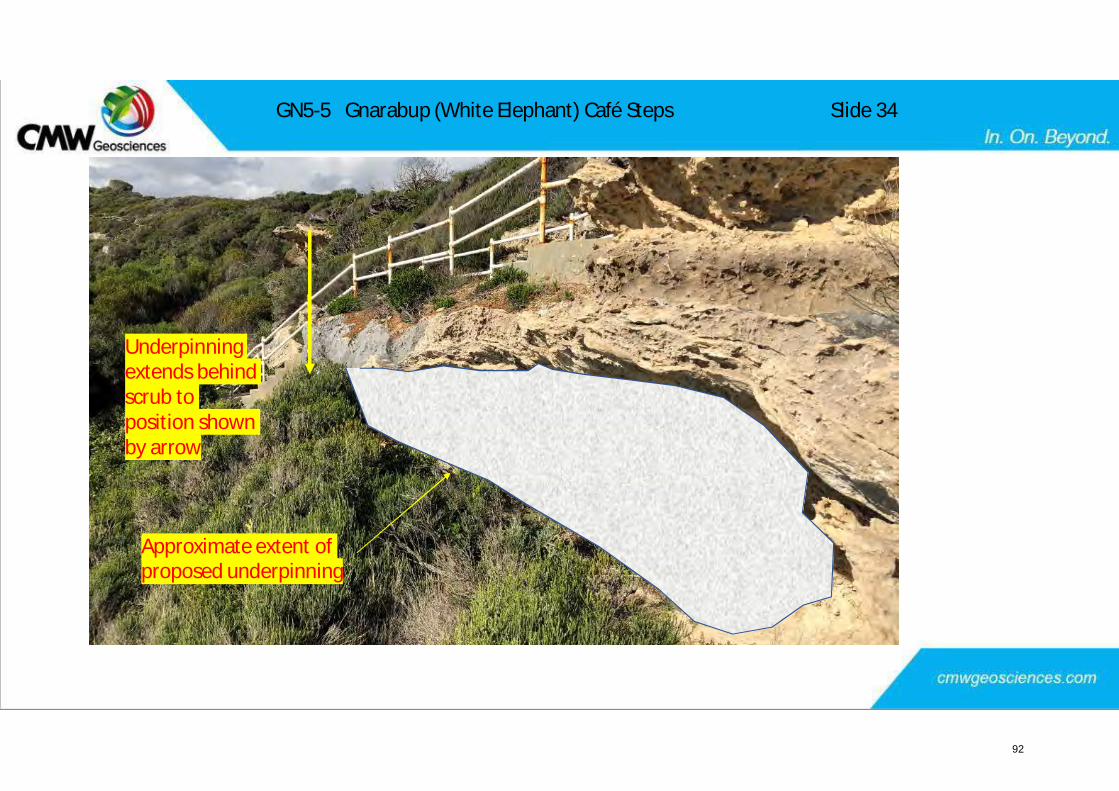
GN5-5 Gnarabup (White Elephant) Café Steps
Approximate extent ofproposed underpinning
Underpinningextends behindscrub toposition shownby arrow
Slide 34
92
MARGARET RIVER – LIMESTONE CLIFF STABILITY ASSESSMENT REPORT 25 OCTOBER 2019
CMW Geosciences Ref. PER2019-0229AA Rev 1
Appendix C Remedial Work Drawings (Draft) prepared by Civil/Structural Consulting Pty Ltd
93
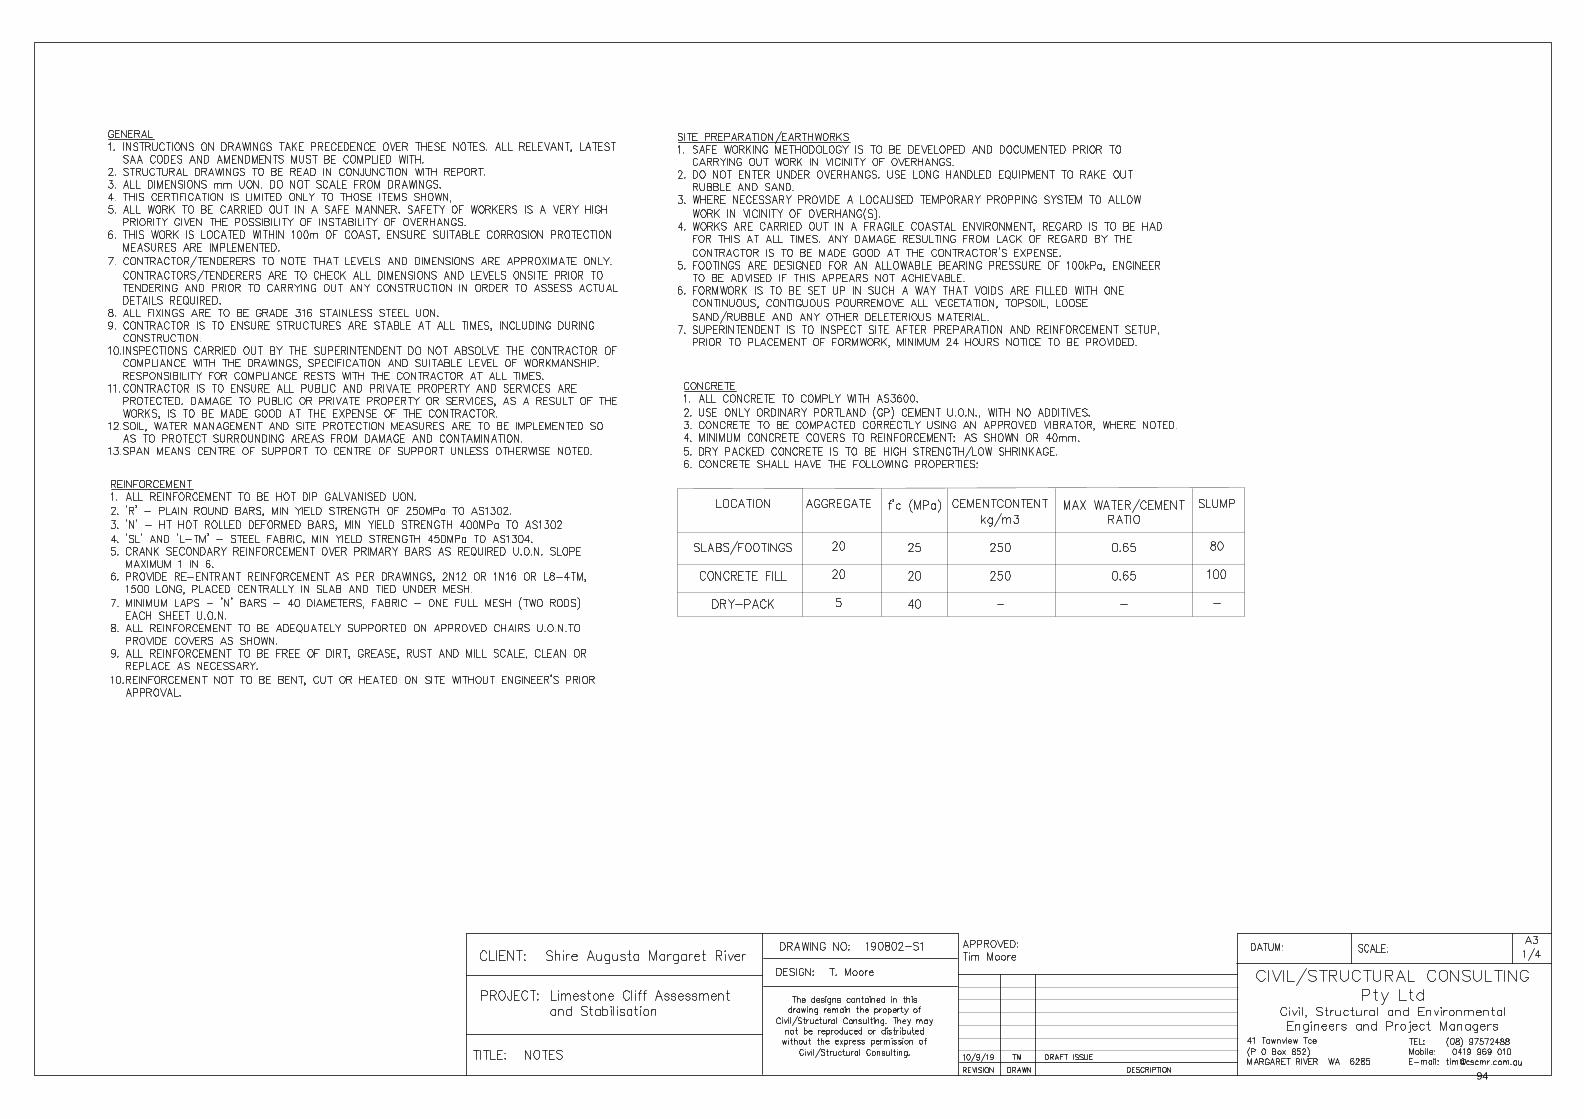
94
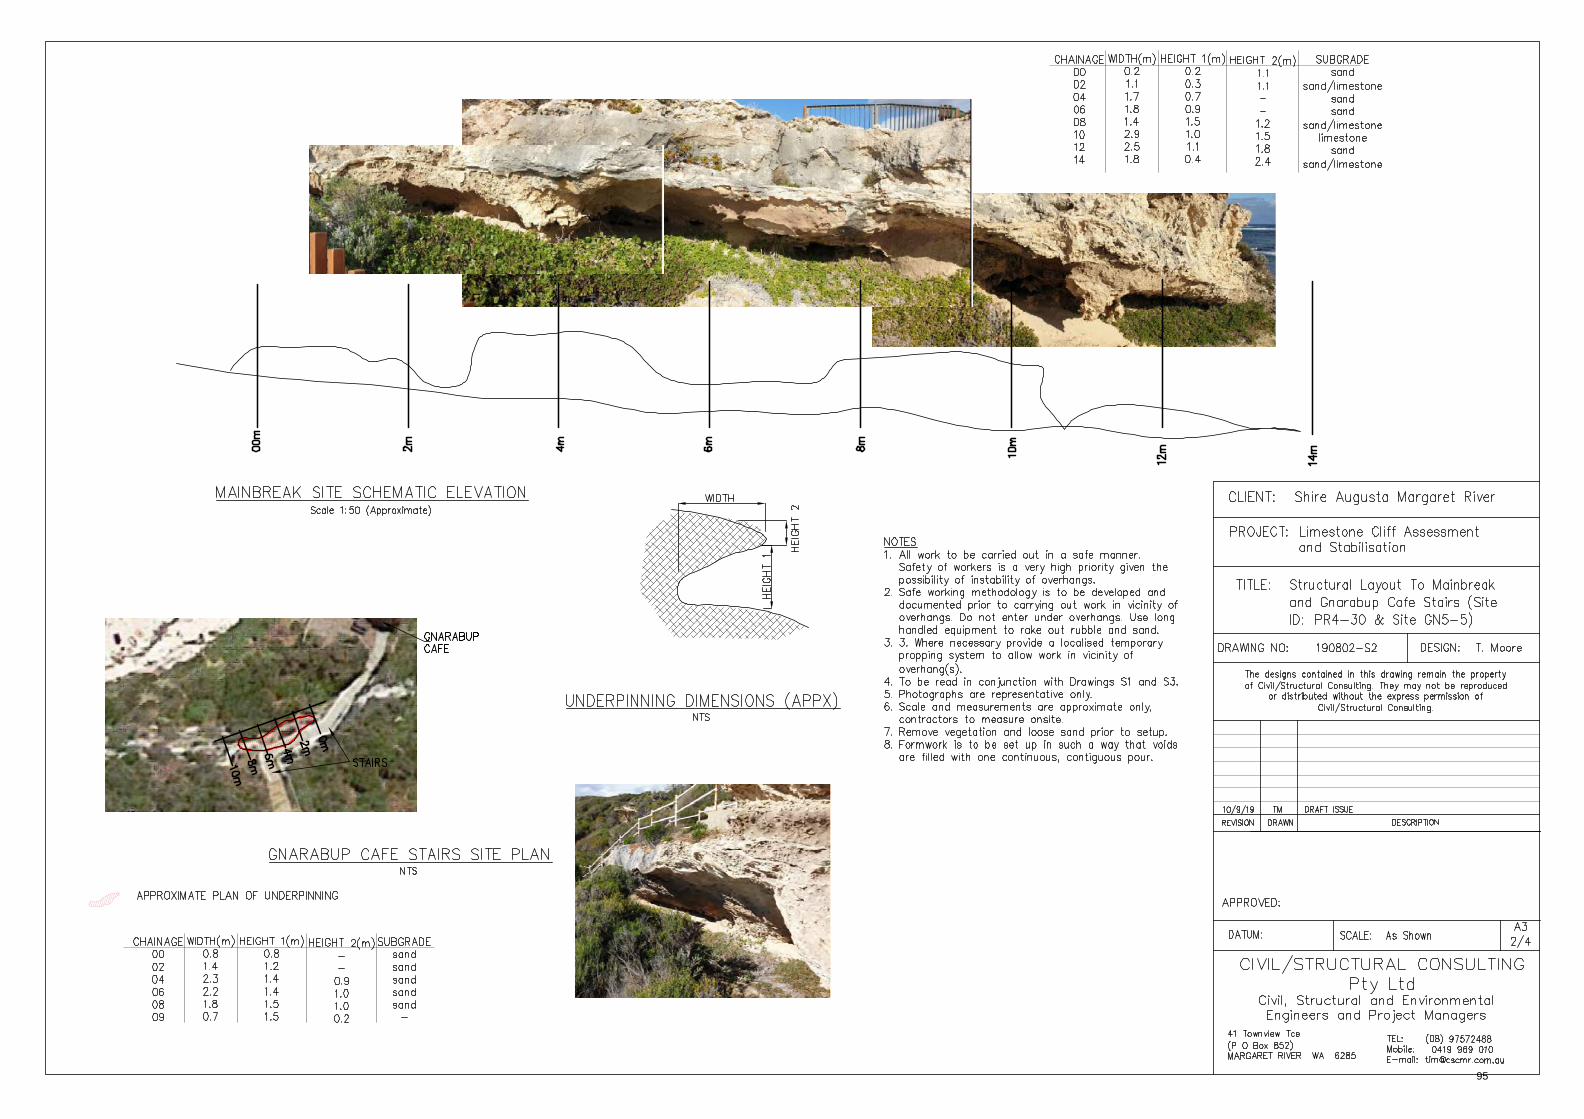
95
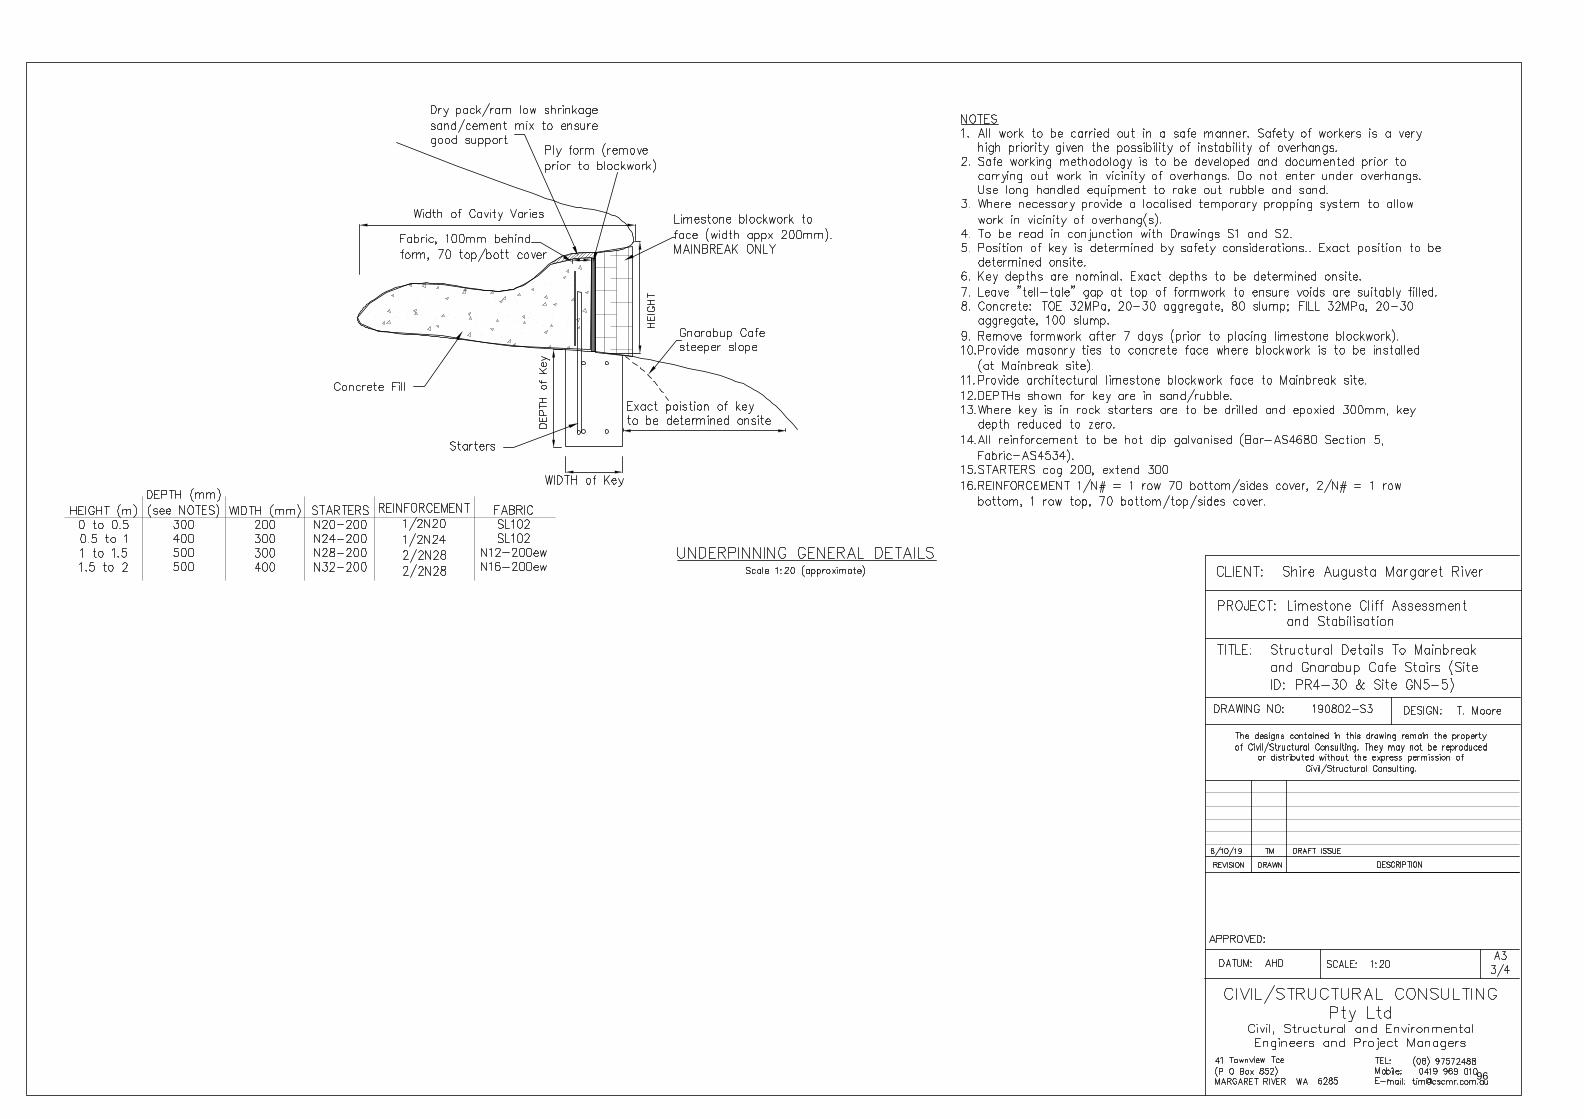
96
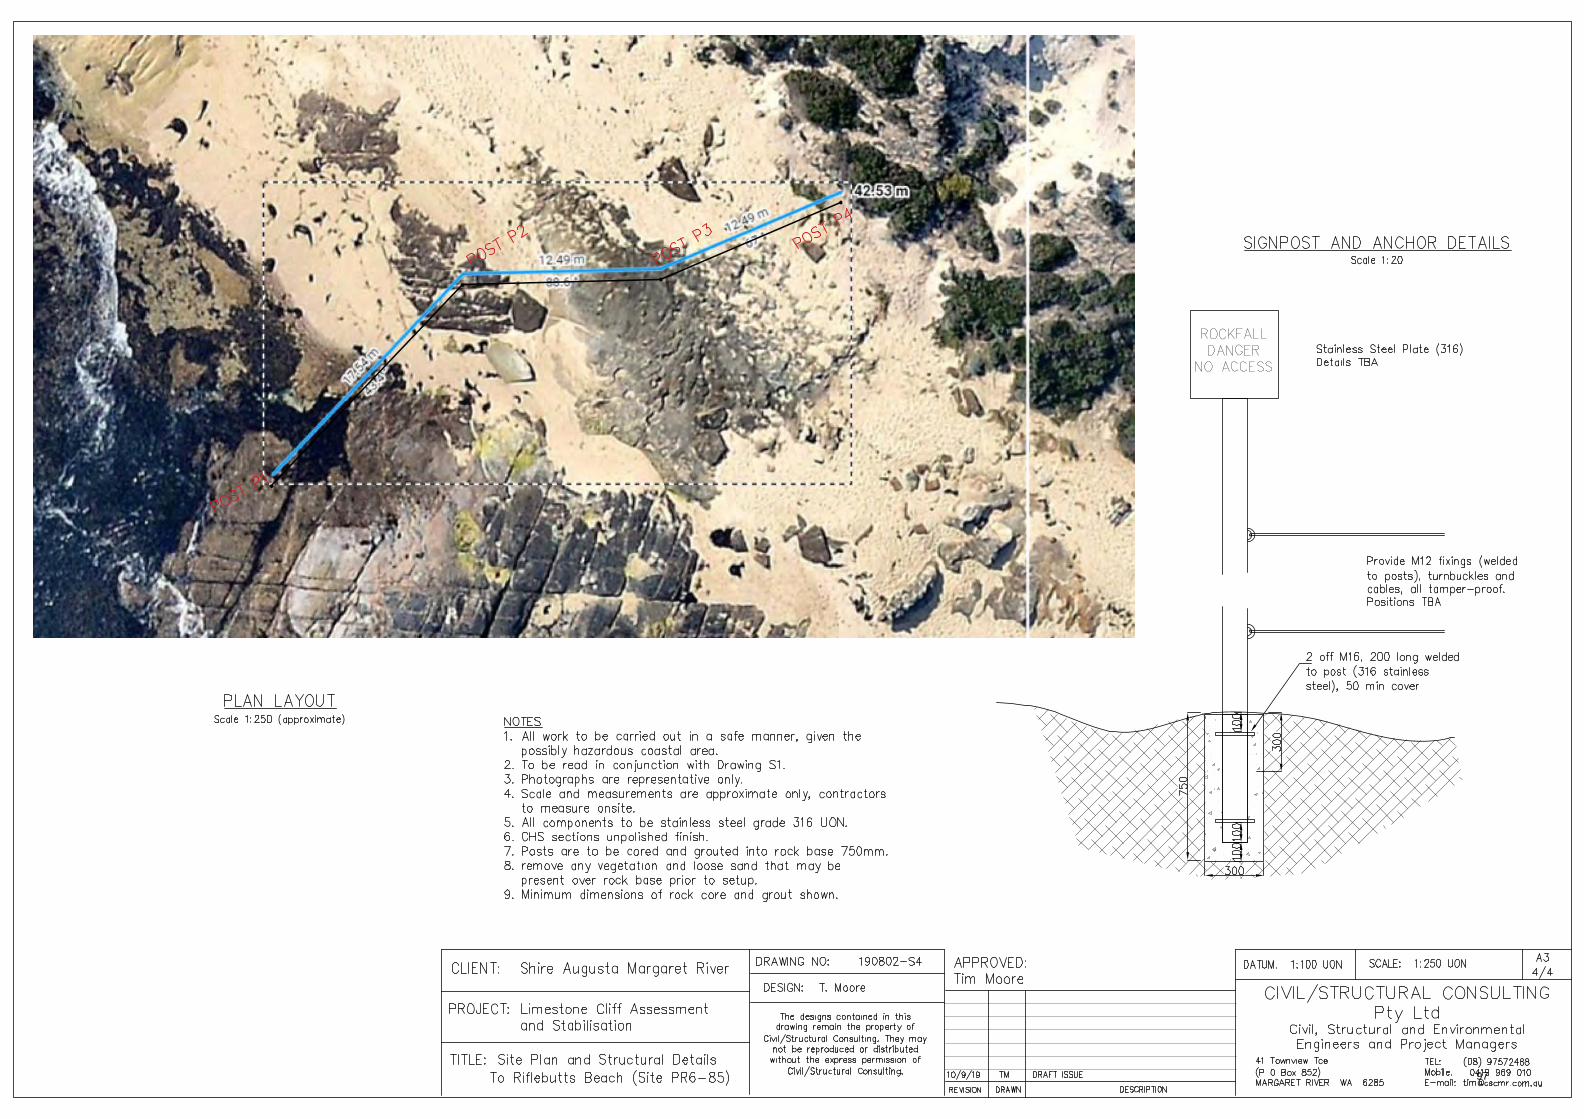
97
MARGARET RIVER – LIMESTONE CLIFF STABILITY ASSESSMENT REPORT 25 OCTOBER 2019
CMW Geosciences Ref. PER2019-0229AA Rev 1
Appendix D Risk Assessment
98
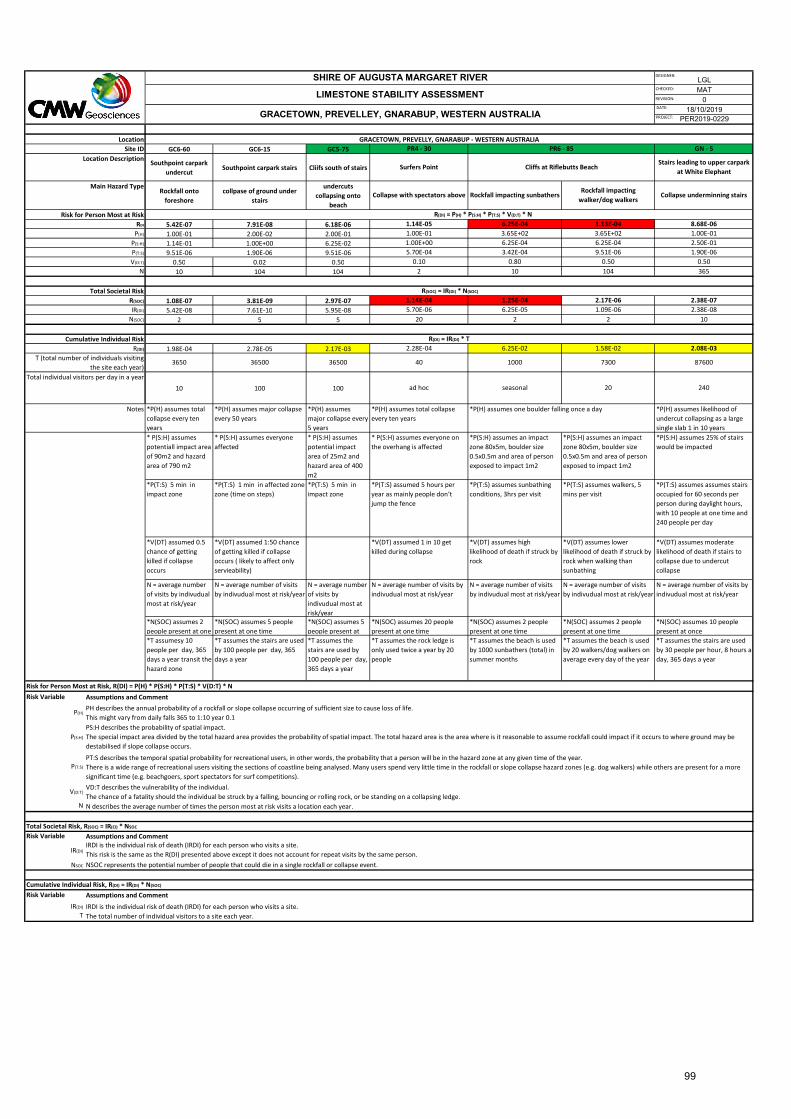
GC6-60 GC6-15 GC5-75
Southpoint carpark undercut
Southpoint carpark stairs Cliifs south of stairs
Rockfall onto foreshore
collpase of ground under stairs
undercuts collapsing onto
beach
5.42E-07 7.91E-08 6.18E-061.00E-01 2.00E-02 2.00E-011.14E-01 1.00E+00 6.25E-029.51E-06 1.90E-06 9.51E-06
0.50 0.02 0.5010 104 104
1.08E-07 3.81E-09 2.97E-075.42E-08 7.61E-10 5.95E-08
2 5 5
1.98E-04 2.78E-05 2.17E-03
10 100 100
*P(H) assumes total collapse every ten years
*P(H) assumes major collapse every 50 years
*P(H) assumes major collapse every 5 years
* P(S:H) assumes potentiall impact area of 90m2 and hazard area of 790 m2
* P(S:H) assumes everyone affected
* P(S:H) assumes potential impact area of 25m2 and hazard area of 400 m2
N = average number of visits by indivudual most at risk/year
N = average number of visits by indivudual most at risk/year
N = average number of visits by indivudual most at risk/year
*N(SOC) assumes 2 people present at one
*N(SOC) assumes 5 people present at one time
*N(SOC) assumes 5 people present at
Risk Variable
P(H)
P(S:H)
P(T:S)
V(D:T)
N
Risk Variable
IR(DI)
NSOC
Risk Variable
IR(DI)
T
Main Hazard Type
Site IDLocation Description
Surfers Point Cliffs at Riflebutts BeachStairs leading to upper carpark
at White Elephant
*T assumes the stairs are used by 30 people per hour, 8 hours a day, 365 days a year
*P(H) assumes total collapse every ten years
*P(H) assumes one boulder falling once a day
Collapse with spectators above Collapse underminning stairs
1.90E-060.50
1.00E+005.70E-04
0.102
6.25E-043.65E+026.25E-043.42E-04
Notes
18/10/2019PER2019-0229
Location
LGLMAT0
PR4 - 30 PR6 - 85 GN - 5
SHIRE OF AUGUSTA MARGARET RIVER
LIMESTONE STABILITY ASSESSMENT
GRACETOWN, PREVELLEY, GNARABUP, WESTERN AUSTRALIA
P(S:H)
1.25E-04
0.80
1.13E-041.14E-051.00E-01 3.65E+02
6.25E-049.51E-06
0.50104
P(H)
RDI
Assumptions and Comment
PH describes the annual probability of a rockfall or slope collapse occurring of sufficient size to cause loss of life. This might vary from daily falls 365 to 1:10 year 0.1
Rockfall impacting sunbathersRockfall impacting
walker/dog walkers
Risk for Person Most at Risk
Total Societal Risk
N(SOC) 20 10
Cumulative Individual Risk
365
1.14E-045.70E-06
2.38E-072.38E-08
10
8.68E-061.00E-012.50E-01
IR(DI)
R(SOC)
NV(D:T)
P(T:S)
Risk for Person Most at Risk, R(DI) = P(H) * P(S:H) * P(T:S) * V(D:T) * N
R(DI)
T (total number of individuals visiting the site each year)
Total individual visitors per day in a year
40
ad hoc
3650 36500 36500
*V(DT) assumed 0.5 chance of getting killed if collapse occurs
*V(DT) assumed 1:50 chance of getting killed if collapse occurs ( likely to affect only servieability)
*P(T:S) 5 min in impact zone
*P(T:S) 1 min in affected zone zone (time on steps)
2.08E-03
seasonal
2.17E-06
*P(T:S) assumes walkers, 5 mins per visit
20
*P(H) assumes likelihood of undercut collapsing as a large single slab 1 in 10 years*P(S:H) assumes 25% of stairs would be impacted
*T assumes the stairs are used by 100 people per day, 365 days a year
*P(S:H) assumes an impact zone 80x5m, boulder size 0.5x0.5m and area of person exposed to impact 1m2
*P(T:S) 5 min in impact zone
* P(S:H) assumes everyone on the overhang is affected
*P(S:H) assumes an impact zone 80x5m, boulder size 0.5x0.5m and area of person exposed to impact 1m2
N = average number of visits by indivudual most at risk/year
N = average number of visits by indivudual most at risk/year
*P(T:S) assumed 5 hours per year as mainly people don’t jump the fence
*V(DT) assumed 1 in 10 get killed during collapse
*V(DT) assumes high likelihood of death if struck by rock
1.09E-062
87600
240
2.28E-04
6.25E-052
GRACETOWN, PREVELLY, GNARABUP - WESTERN AUSTRALIA
Assumptions and Comment
R(DI) = P(H) * P(S:H) * P(T:S) * V(D:T) * N
*T assumesy 10 people per day, 365 days a year transit the hazard zone
*T assumes the stairs are used by 100 people per day, 365 days a year
*N(SOC) assumes 20 people present at one time*T assumes the rock ledge is only used twice a year by 20 people
*N(SOC) assumes 2 people present at one time*T assumes the beach is used by 1000 sunbathers (total) in summer months
*N(SOC) assumes 2 people present at one time
*N(SOC) assumes 10 people present at once
*T assumes the beach is used by 20 walkers/dog walkers on average every day of the year
*P(T:S) assumes sunbathing conditions, 3hrs per visit
*V(DT) assumes lower likelihood of death if struck by rock when walking than sunbathing
*P(T:S) assumes assumes stairs occupied for 60 seconds per person during daylight hours, with 10 people at one time and 240 people per day
*V(DT) assumes moderate likelihood of death if stairs to collapse due to undercut collapse
N = average number of visits by indivudual most at risk/year
N = average number of visits by indivudual most at risk/year
R(SOC) = IR(DI) * N(SOC)
R(DI) = IR(DI) * T6.25E-02 1.58E-02
1000 7300
IRDI is the individual risk of death (IRDI) for each person who visits a site.The total number of individual visitors to a site each year.
PS:H describes the probability of spatial impact. The special impact area divided by the total hazard area provides the probability of spatial impact. The total hazard area is the area where is it reasonable to assume rockfall could impact if it occurs to where ground may be destabilised if slope collapse occurs.
PT:S describes the temporal spatial probability for recreational users, in other words, the probability that a person will be in the hazard zone at any given time of the year.There is a wide range of recreational users visiting the sections of coastline being analysed. Many users spend very little time in the rockfall or slope collapse hazard zones (e.g. dog walkers) while others are present for a more significant time (e.g. beachgoers, sport spectators for surf competitions). VD:T describes the vulnerability of the individual.The chance of a fatality should the individual be struck by a falling, bouncing or rolling rock, or be standing on a collapsing ledge.N describes the average number of times the person most at risk visits a location each year.
Assumptions and CommentIRDI is the individual risk of death (IRDI) for each person who visits a site.This risk is the same as the R(DI) presented above except it does not account for repeat visits by the same person.NSOC represents the potential number of people that could die in a single rockfall or collapse event.
Total Societal Risk, R(SOC) = IR(CI) * NSOC
Cumulative Individual Risk, R(DI) = IR(DI) * N(SOC)
PROJECT:
DATE:
REVISION:
CHECKED:
DESIGNER:
99
MARGARET RIVER – LIMESTONE CLIFF STABILITY ASSESSMENT REPORT 25 OCTOBER 2019
CMW Geosciences Ref. PER2019-0229AA Rev 1
Appendix E Monitoring Protocol for Shire of Augusta Margaret River Staff
100
MARGARET RIVER – LIMESTONE CLIFF STABILITY ASSESSMENT REPORT 25 OCTOBER 2019
CMW Geosciences Ref. PER2019-0229AA Rev 1
1 INTRODUCTION
This appendix includes a monitoring protocol requested by SAMR to provide guidance for their officers to note changing conditions that could present a risk to public safety with respect to rockfall or coastal cliff/slope instability.
It is suggested that the May 2017 Limestone Cliff Stability Assessment by Golder Associates and the October 2019 Limestone Stability Assessment by CMW Geosciences become reference documents. Ongoing observations carried out by Shire officers should be compared against observations and the risks described in these documents to assess if slope form is changing and whether or not the prevailing risk to public safety is changing. E.g. loss of a fence or sign could result in an increased risk to public safety.
This appendix is not intended to provide training in geotechnical engineering but instead provide a simple framework by which a Shire officer can review changes and be provided with guidance as to actions to implement.
2 HEALTH AND SAFETY
Shire officers are not trained landslide risk professionals and as such will not necessarily be able to fully evaluate personal risk when approaching potentially unstable outcrops and overhangs. For this reason, it will not be possible for them get as close to individual coastal features requiring assessment as would be the case with a trained geotechnical professional who can assess personal risk, for instance prior to passing beneath an overhang.
For this reason, the Shire officers should NOT engage in any of the following when carrying out inspections:
1) Crawl or walk beneath overhangs
2) Stand on top of overhangs
3) Scramble or climb up cliff faces, or on slopes containing boulders or cobbles that could be dislodged
In addition, it is expected that a detailed Job Safety Analysis is undertaken, all work is carried out with a spotter, risks are continually assessed, and work stopped if conditions change.
Appropriate PPE should be worn, comprising steel capped boots with sole with good grip, long trousers, long sleeve shirt, high visibility clothing, safety glasses and leather work gloves and hard hat when in rockfall zones.
Locations at the top of the overhang at GS5-75 are considered high risk to be surveyed by anyone other than geotechnical professional. These locations have been included as reference points for comparison purposes as and when SAMR next appoint a geotechnical professional who can make their own risk assessment prior to accessing this location. In the meanwhile any inspection undertaken by SAMR of GC5-75 should be undertaken entirely from the beach.
3 REFERENCE POINTS AND PHOTOS
At four of the six sites, reference points have been established comprising of a surveyor’s nail with labelled tag (refer Appendix E Slide 3 for example). These are used either to indicate access points to a feature (as is the case for GC5-75) or mark the general locations where a reference photograph is to be taken. The nails are drilled into rock for permanency. It may however be necessary to move slightly away from the exact nail location for safety reasons, for instance to avoid being too close to a steep edge or so the observer is not standing on an uneven boulder.
101
MARGARET RIVER – LIMESTONE CLIFF STABILITY ASSESSMENT REPORT 25 OCTOBER 2019
CMW Geosciences Ref. PER2019-0229AA Rev 1
The following Slides are intended as a set of reference photographs to be reproduced as close as possible following each successive future inspection to review whether changes can be detected.
Nearmap imagery is updated frequently and use of past and latest Nearmap imagery is recommended to illustrate change, especially where wave erosion, for instance at Riflebutts beach has a significant influence.
4 MONITORING FREQUENCY
A future monitoring frequency of every 6 months except for stairs leading to the beach (end of winter /end of summer) documented for all locations in the 2017 report is recommended with a geotechnical inspection and risk assessment carried out by a geotechnical professional with experience in landslide and slope risk assessments every 2 years. These monitoring and inspection frequencies may change following certain observations as documented in the Action and Event Tree provided below.
It is recommended that the monitoring frequency for beach stairs is three monthly or following a major storm event. This because of the risk of erosion undercutting supporting stanchion or erosion the coastal slope on which the stairs are founded and causing instability.
Special inspections would also be required following exceptional storm events or if reports of erosion or damage have been lodged.
5 ROCKFALL/SLOPE STABILITY CHECKLIST
A rockfall /slope stability checklist is provided below. This should be completed for each site to be inspected. Depending on how the questions are answered certain actions may be triggered. E.g. if a sign is missing arrangement for replacement is triggered.
6 ACTION AND EVENT TREE
An action and event tree is provided below. This tree navigates the Shire officer through a series of questions that need to be answered during the inspection. Depending on events (e.g. observation of changes to cliff (for instance. increased undercutting)) an action is trigger. E.g. if the event results in imminent risk to public safety the action is implement ‘immediate measures to prevent public access’.
7 REPORTING
The following is envisaged as a reporting requirement following each inspection.
1) Photographs files by date and site location number.
2) A PowerPoint presentation (labelled with date of inspection) presenting the reference photograph or photograph from the last inspection against a photograph from the current inspection with any changes annotated.
3) A completed and dated rockfall checklist for each of the site inspected, including the name of the officer undertaking the inspection
4) A brief (generally single page) report for each location highlighting any actions required (informed by using the action and event tree).
102
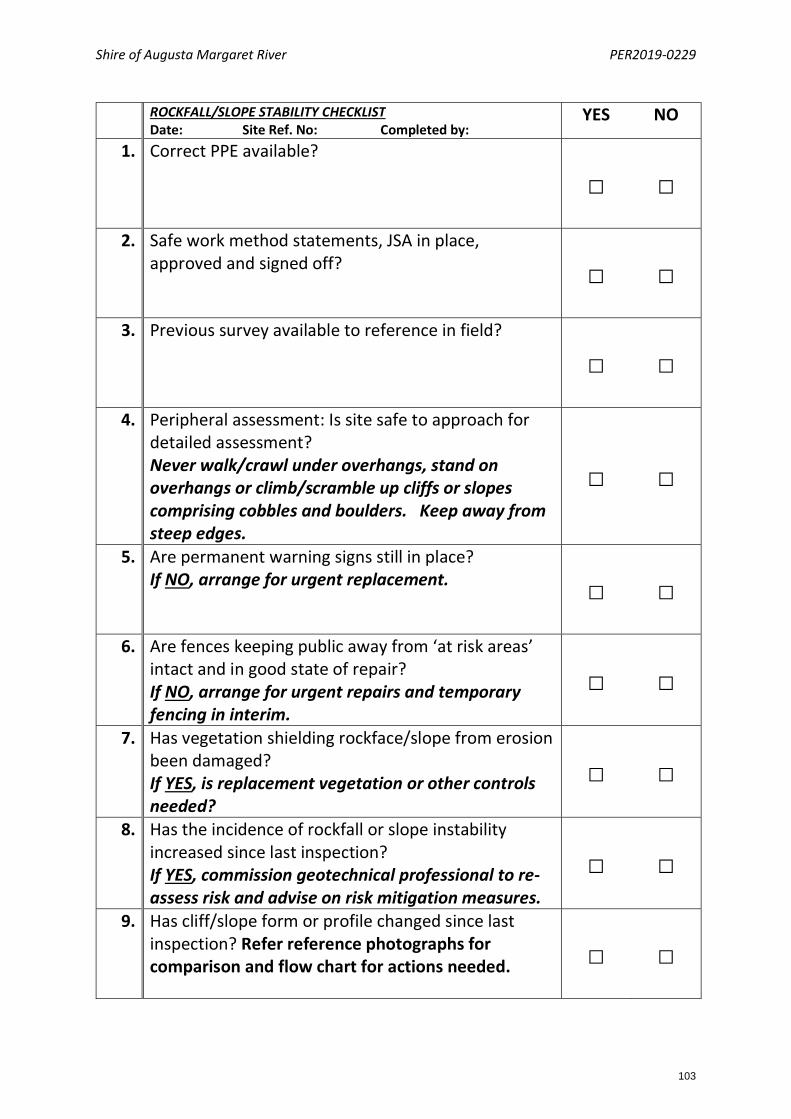
Shire of Augusta Margaret River PER2019-0229
ROCKFALL/SLOPE STABILITY CHECKLIST Date: Site Ref. No: Completed by:
YES NO
1. Correct PPE available?
□ □
2. Safe work method statements, JSA in place, approved and signed off? □ □
3. Previous survey available to reference in field?
□ □
4. Peripheral assessment: Is site safe to approach for detailed assessment? Never walk/crawl under overhangs, stand on overhangs or climb/scramble up cliffs or slopes comprising cobbles and boulders. Keep away from steep edges.
□ □
5. Are permanent warning signs still in place? If NO, arrange for urgent replacement. □ □
6. Are fences keeping public away from ‘at risk areas’ intact and in good state of repair? If NO, arrange for urgent repairs and temporary fencing in interim.
□ □
7. Has vegetation shielding rockface/slope from erosion been damaged? If YES, is replacement vegetation or other controls needed?
□ □
8. Has the incidence of rockfall or slope instability increased since last inspection? If YES, commission geotechnical professional to re-assess risk and advise on risk mitigation measures.
□ □
9. Has cliff/slope form or profile changed since last inspection? Refer reference photographs for comparison and flow chart for actions needed. □ □
103
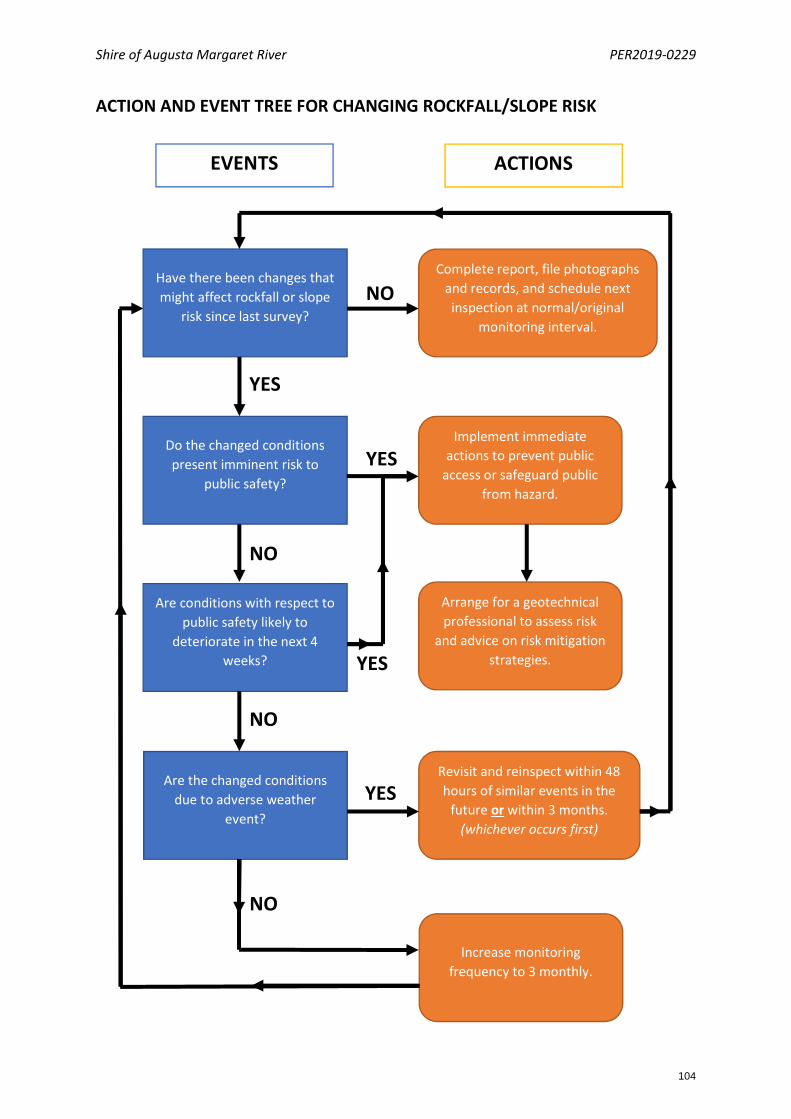
Shire of Augusta Margaret River PER2019-0229
ACTION AND EVENT TREE FOR CHANGING ROCKFALL/SLOPE RISK
Have there been changes that might affect rockfall or slope
risk since last survey?
Complete report, file photographs and records, and schedule next inspection at normal/original
monitoring interval.
Do the changed conditions present imminent risk to
public safety?
Are conditions with respect to public safety likely to
deteriorate in the next 4 weeks?
Are the changed conditions due to adverse weather
event?
Increase monitoring frequency to 3 monthly.
Implement immediate actions to prevent public
access or safeguard public from hazard.
Arrange for a geotechnical professional to assess risk
and advice on risk mitigation strategies.
Revisit and reinspect within 48 hours of similar events in the
future or within 3 months. (whichever occurs first)
NO
NO
NO
NO
YES
YES
YES
YES
EVENTS ACTIONS
104
Appendix EReference Photographs (11 October 2019)
105
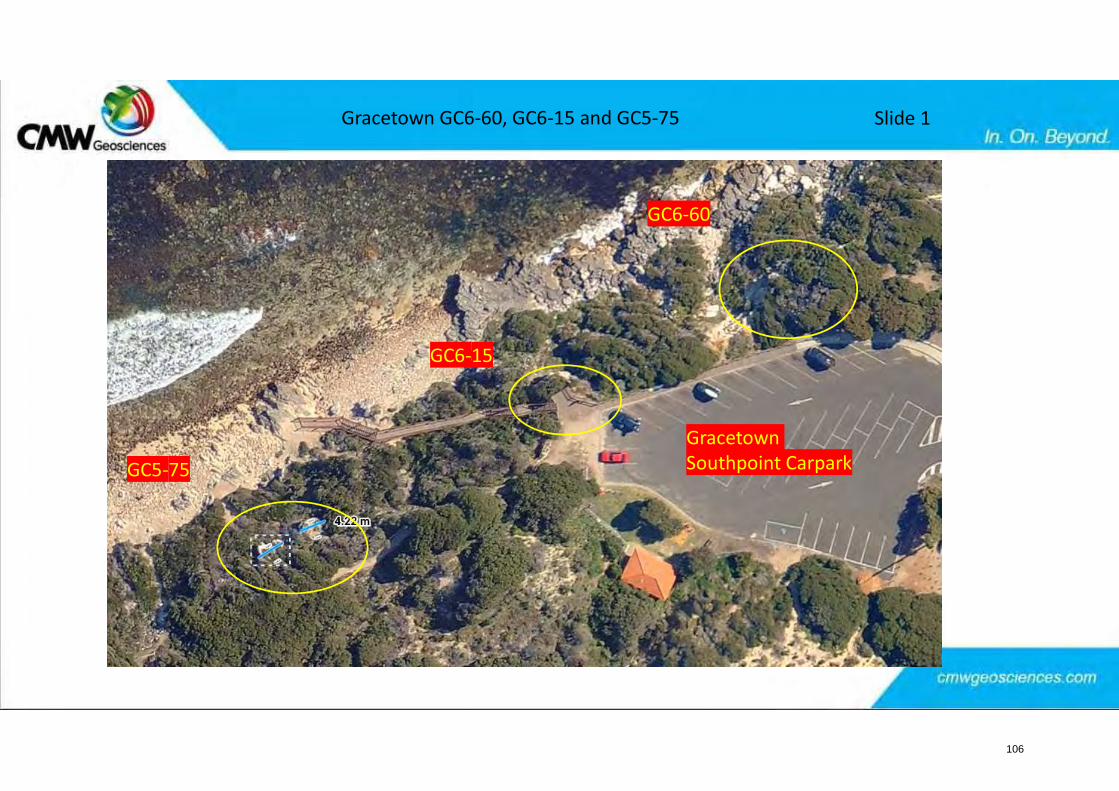
Gracetown GC6-60, GC6-15 and GC5-75
GC6-60
GC6-15
GC5-75Gracetown Southpoint Carpark
Slide 1
106
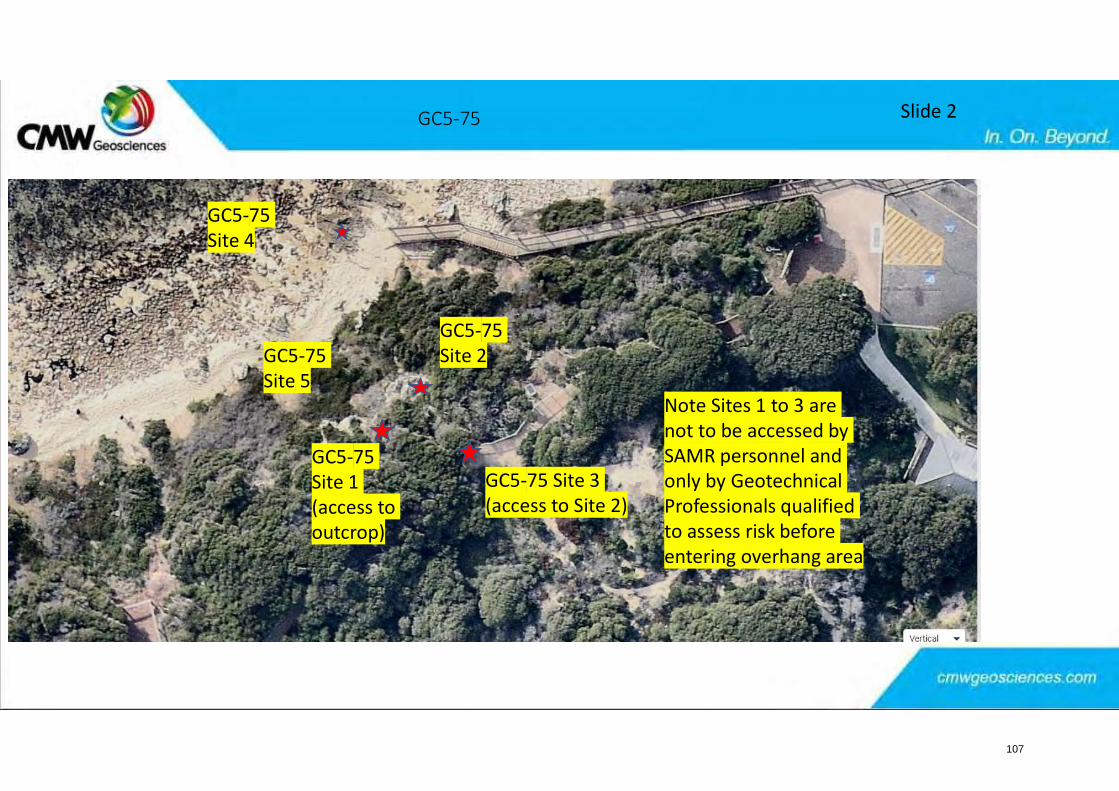
GC5-75
GC5-75 Site 3 (access to Site 2)
GC5-75 Site 4
GC5-75 Site 2GC5-75
Site 5
GC5-75 Site 1 (access to outcrop)
Slide 2
Note Sites 1 to 3 are not to be accessed by SAMR personnel and only by Geotechnical Professionals qualified to assess risk before entering overhang area
107
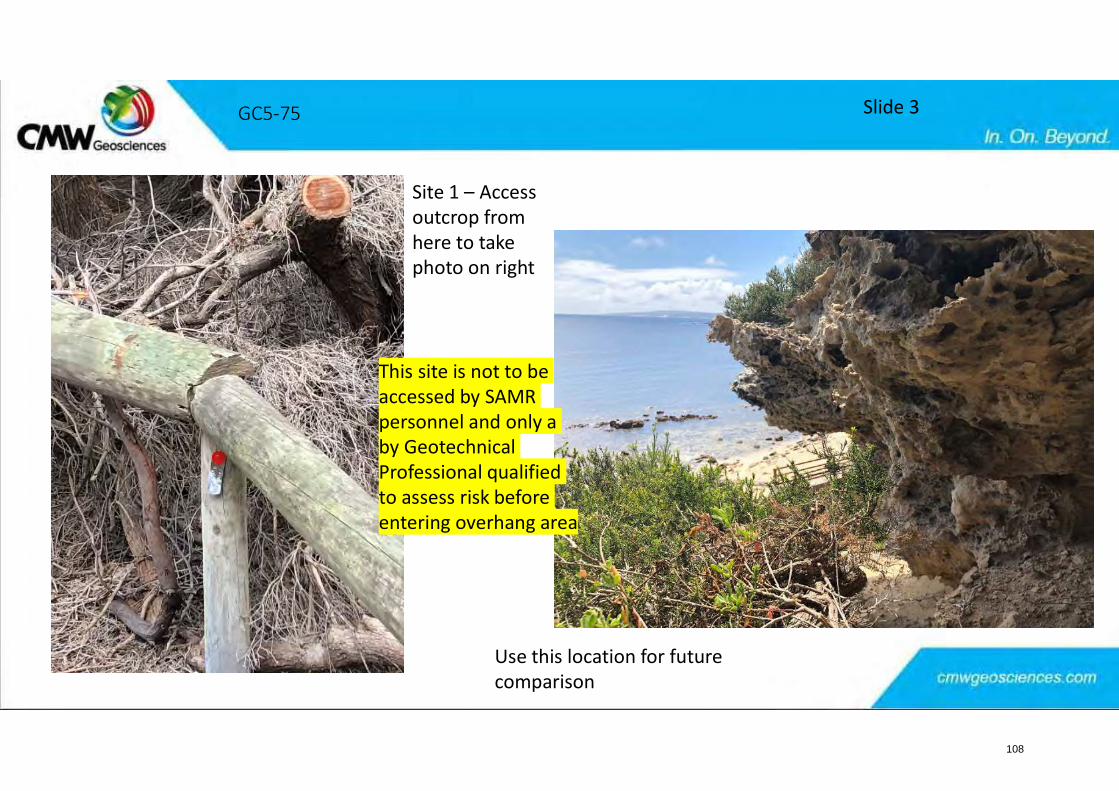
GC5-75
Site 1 – Access outcrop from here to take photo on right
Use this location for future comparison
Slide 3
This site is not to be accessed by SAMR personnel and only a by Geotechnical Professional qualified to assess risk before entering overhang area
108
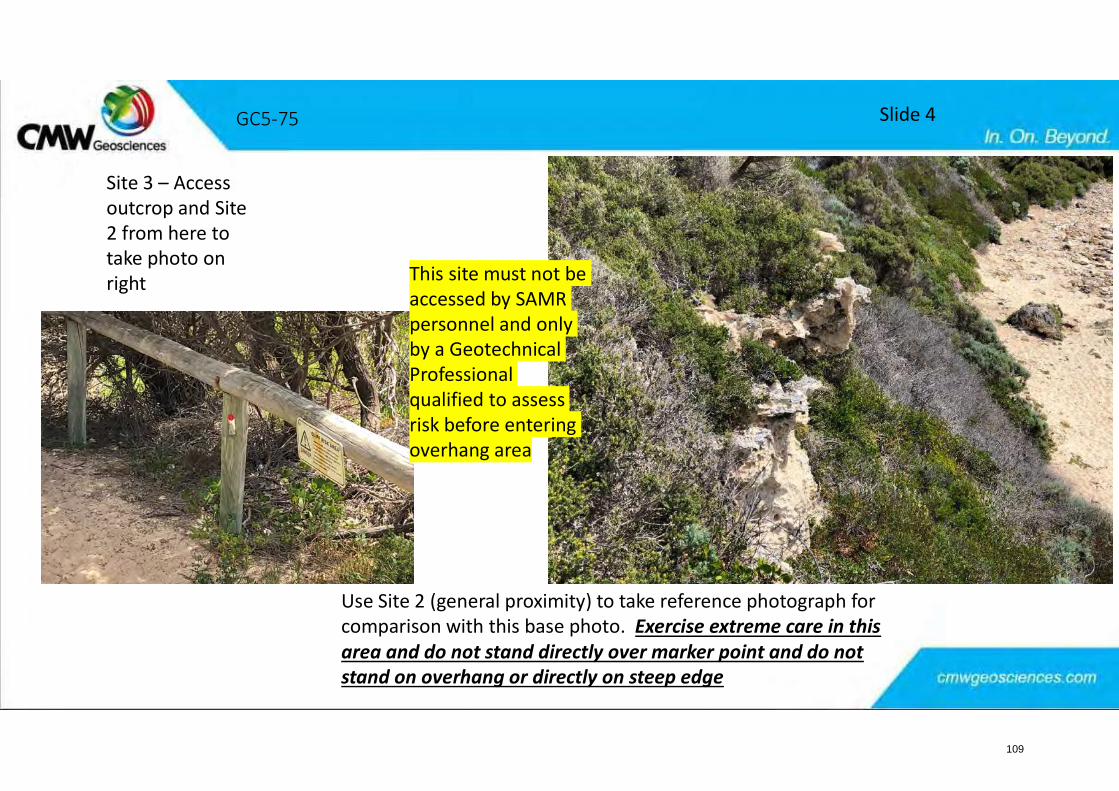
GC5-75
Site 3 – Access outcrop and Site 2 from here to take photo on right
Use Site 2 (general proximity) to take reference photograph for comparison with this base photo. Exercise extreme care in this area and do not stand directly over marker point and do not stand on overhang or directly on steep edge
Slide 4
This site must not be accessed by SAMR personnel and only by a Geotechnical Professional qualified to assess risk before entering overhang area
109
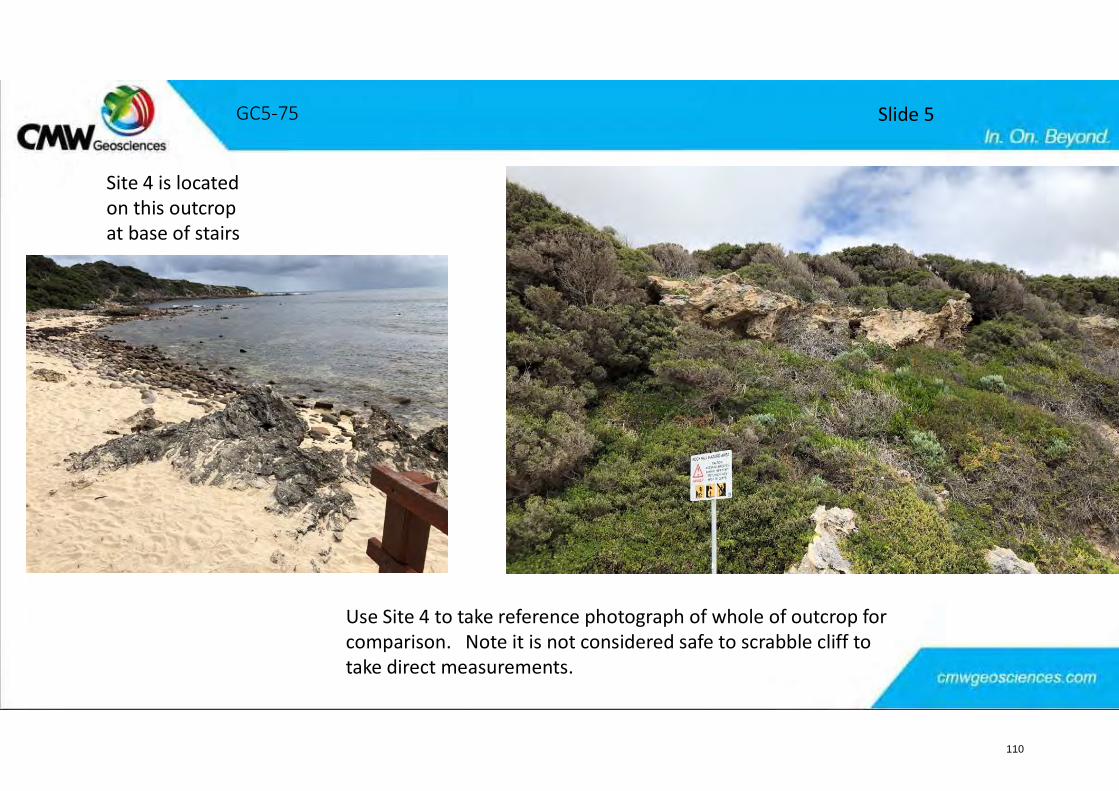
GC5-75
Site 4 is located on this outcrop at base of stairs
Use Site 4 to take reference photograph of whole of outcrop for comparison. Note it is not considered safe to scrabble cliff to take direct measurements.
Slide 5
110
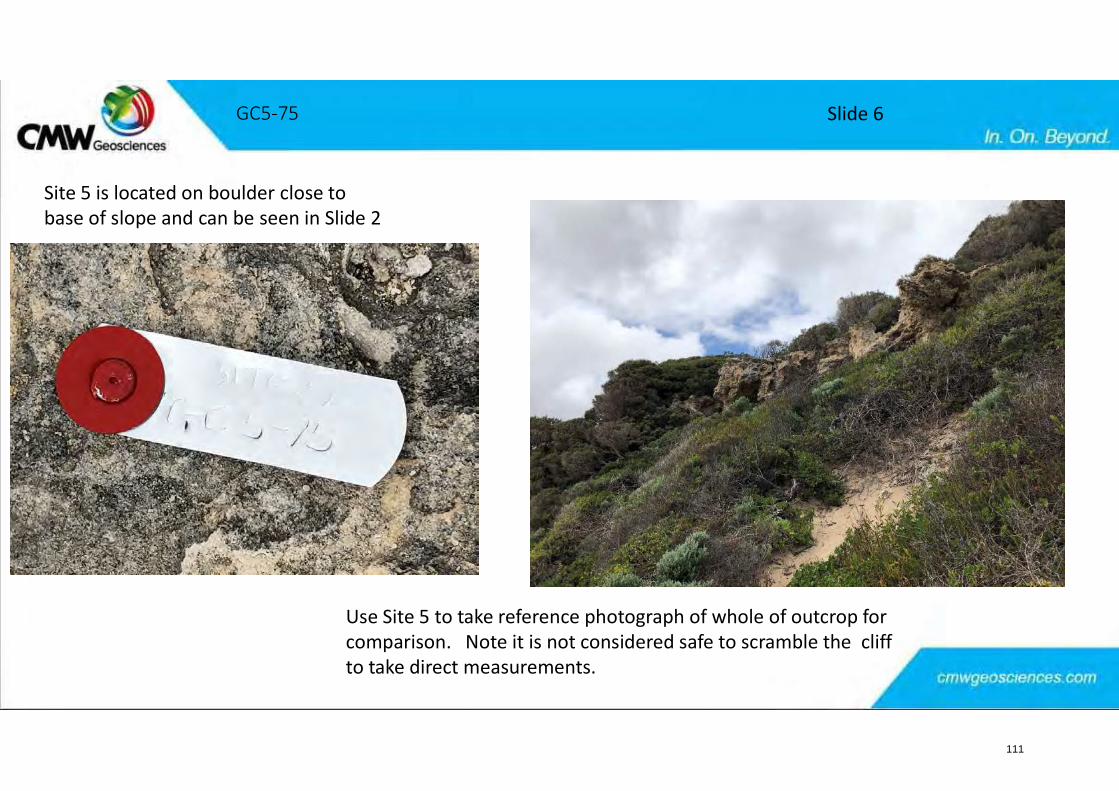
GC5-75
Site 5 is located on boulder close to base of slope and can be seen in Slide 2
Use Site 5 to take reference photograph of whole of outcrop for comparison. Note it is not considered safe to scramble the cliff to take direct measurements.
Slide 6
111
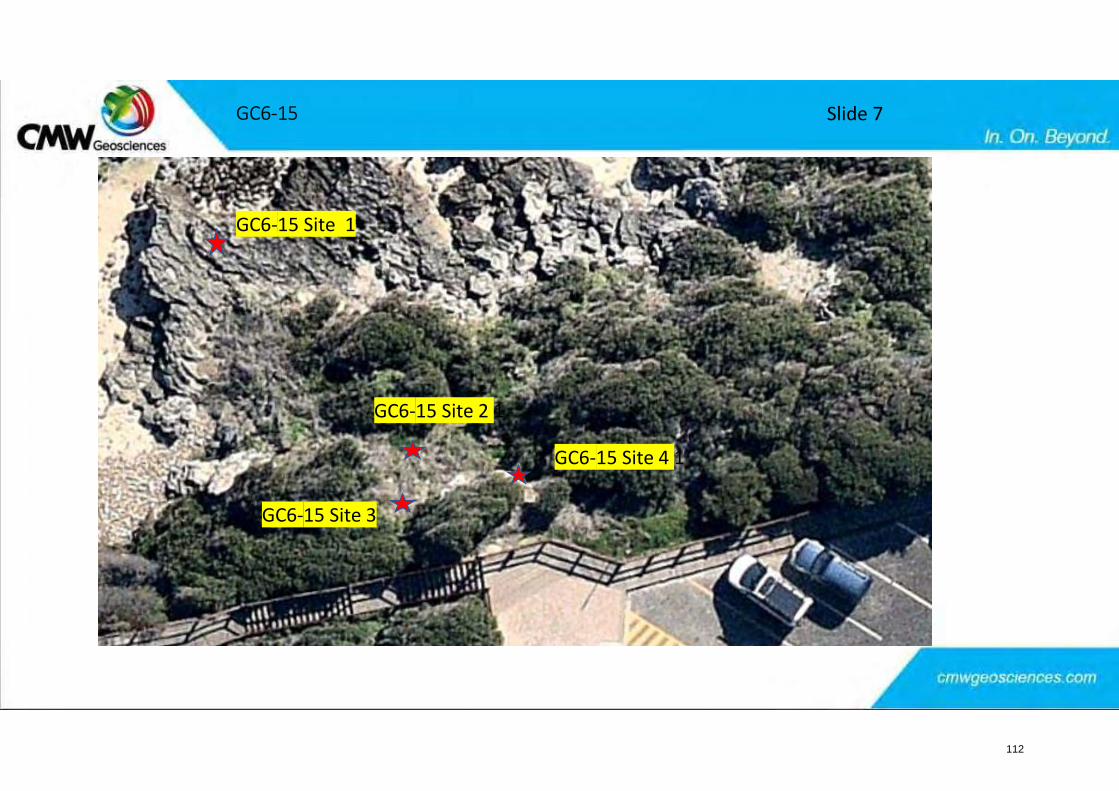
GC6-15 Slide 7
GC6-15 Site 1
GC6-15 Site 3
GC6-15 Site 2 1
GC6-15 Site 4 1
112
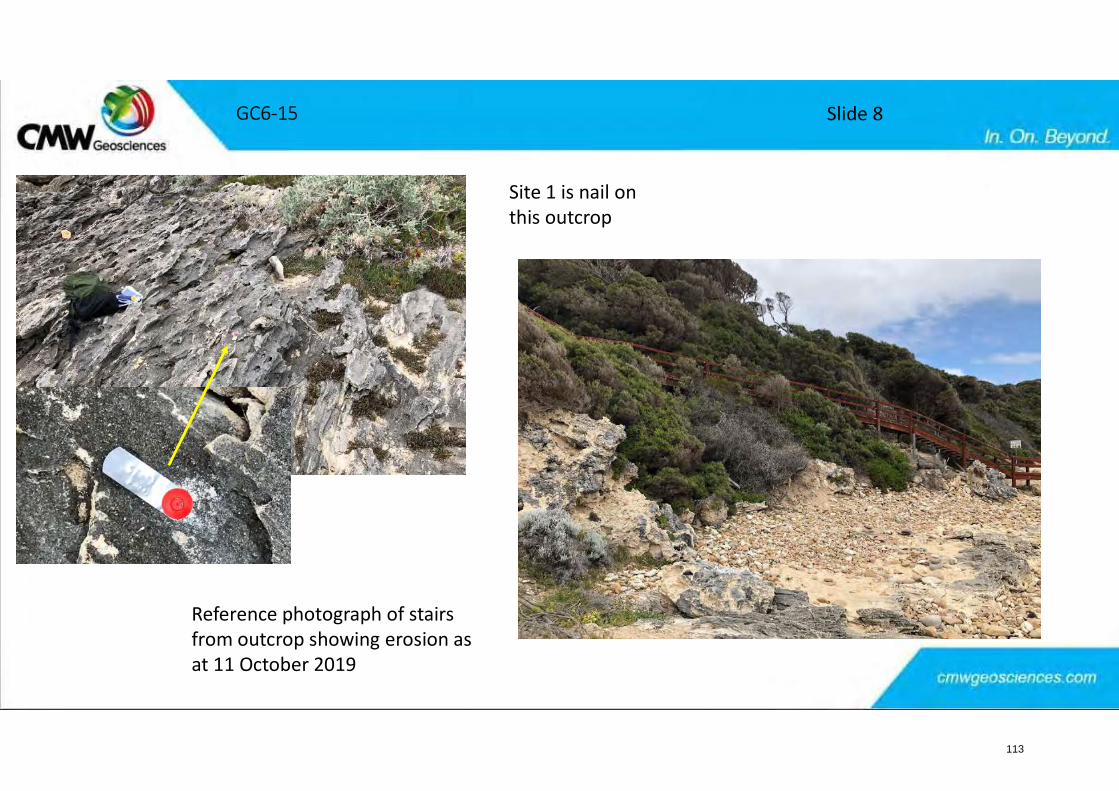
GC6-15 Slide 8
Site 1 is nail on this outcrop
Reference photograph of stairs from outcrop showing erosion as at 11 October 2019
113
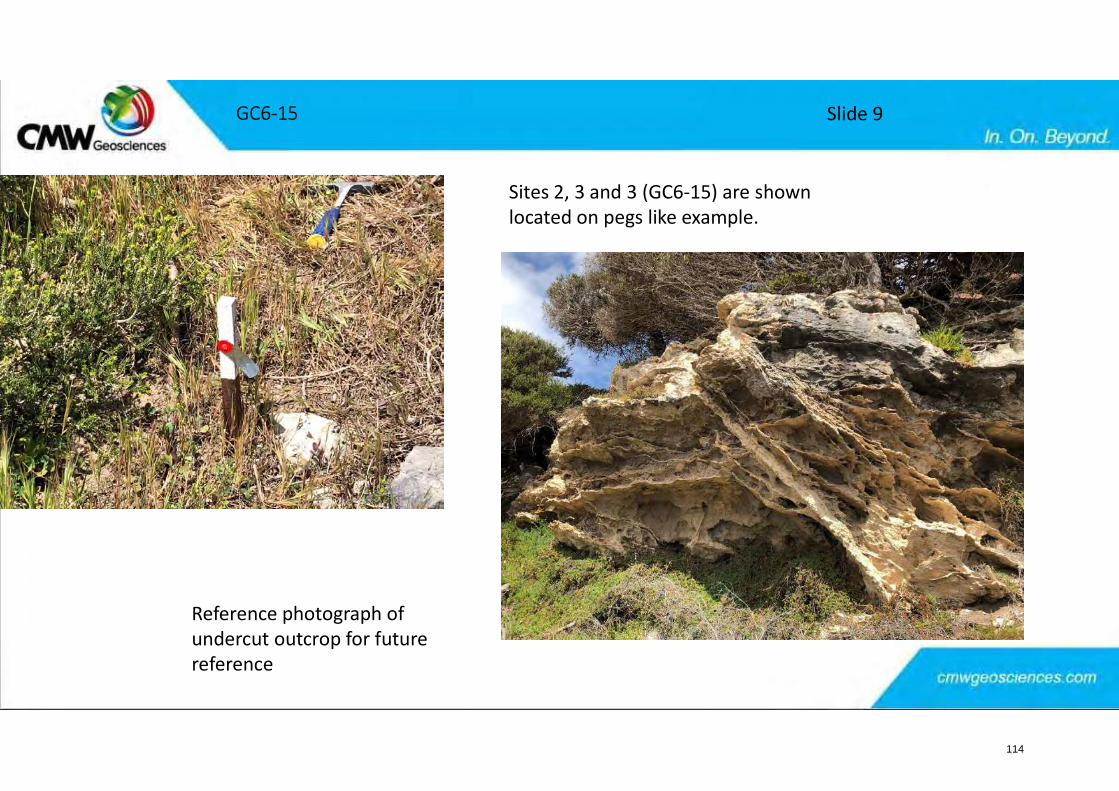
GC6-15 Slide 9
Sites 2, 3 and 3 (GC6-15) are shown located on pegs like example.
Reference photograph of undercut outcrop for future reference
114
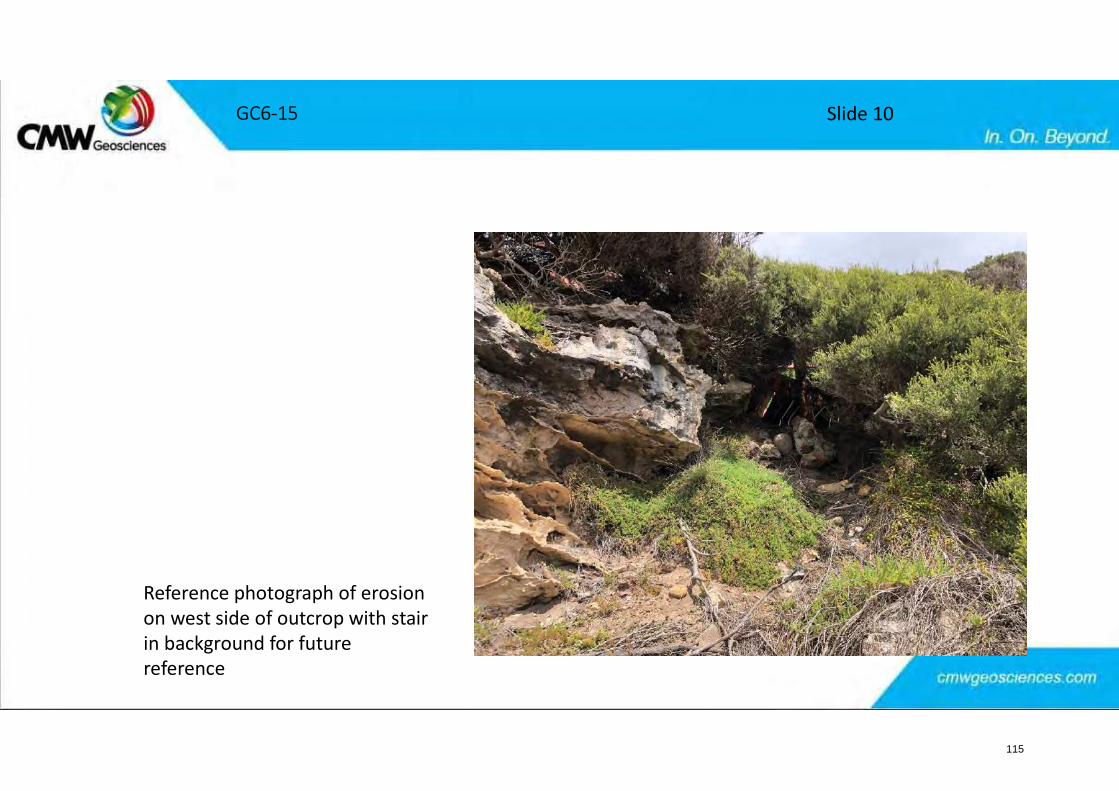
GC6-15 Slide 10
Reference photograph of erosion on west side of outcrop with stair in background for future reference
115
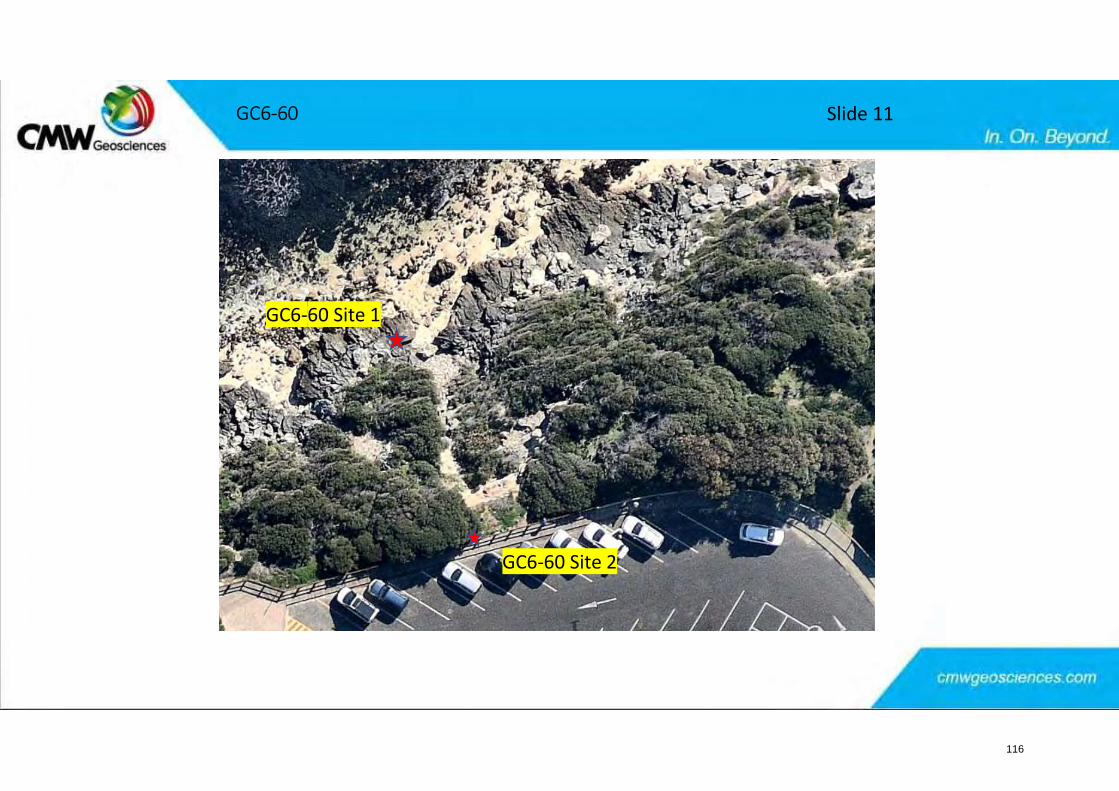
GC6-60 Slide 11
GC6-60 Site 1
GC6-60 Site 2
116
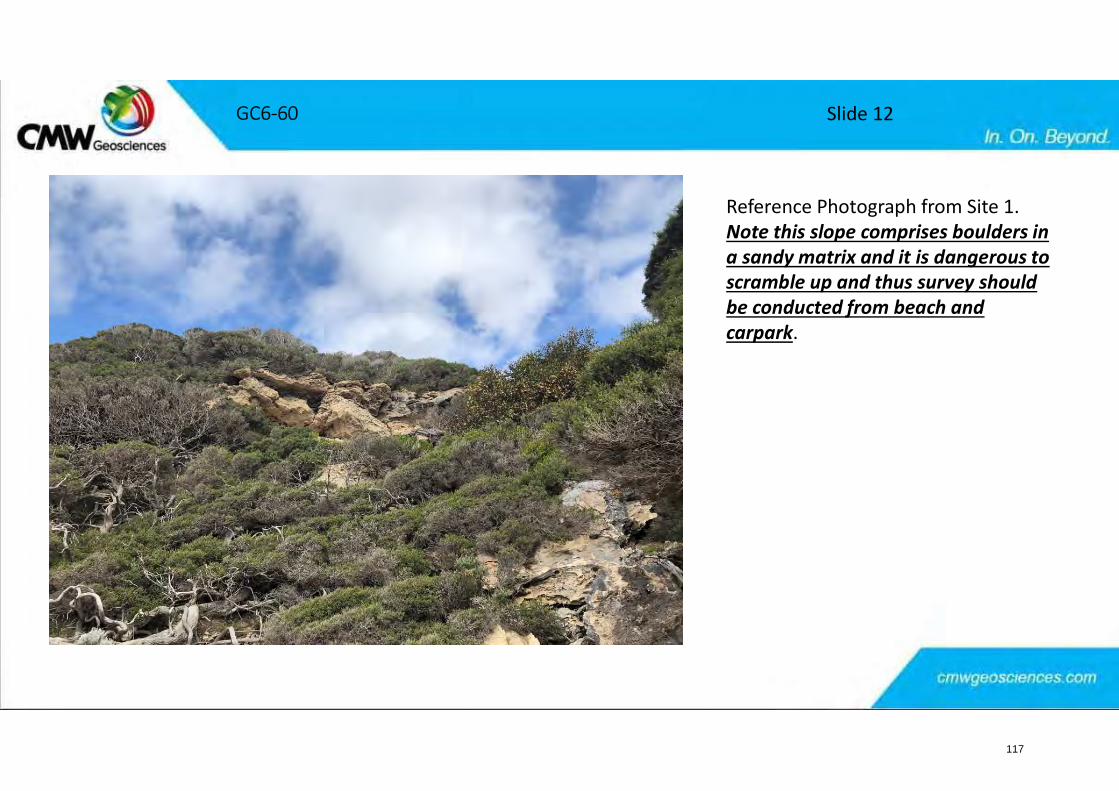
GC6-60 Slide 12
Reference Photograph from Site 1. Note this slope comprises boulders in a sandy matrix and it is dangerous to scramble up and thus survey should be conducted from beach and carpark.
117
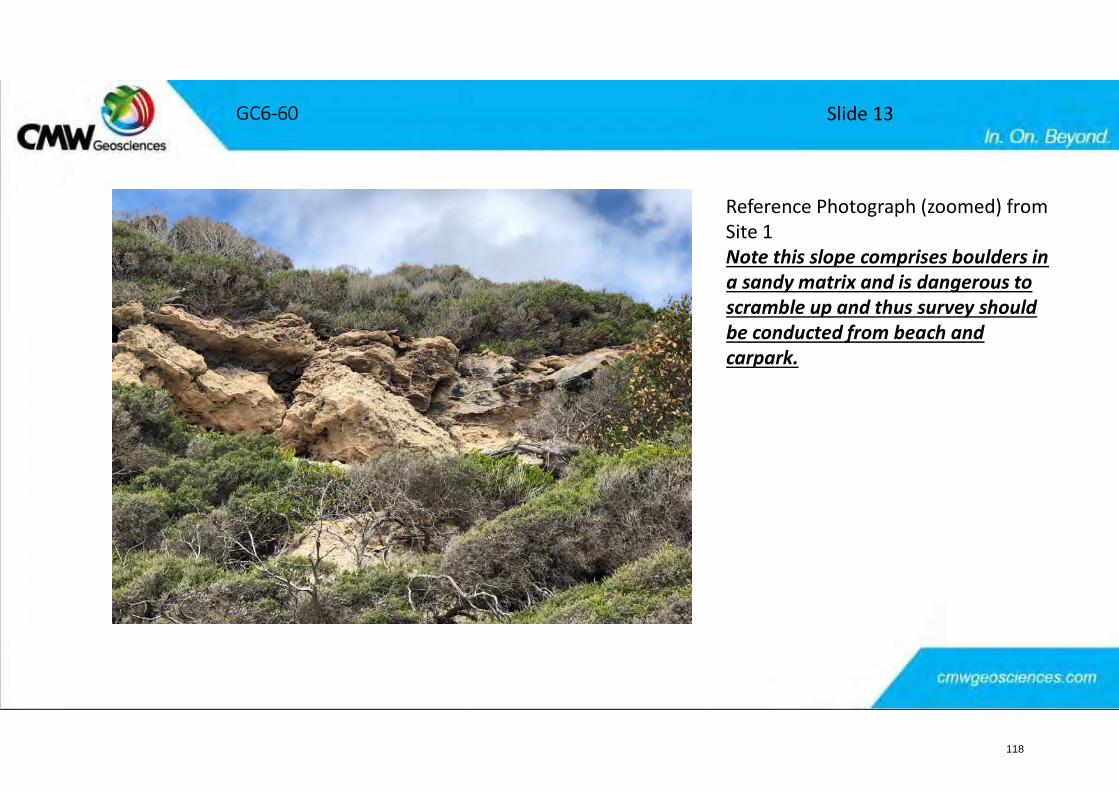
GC6-60 Slide 13
Reference Photograph (zoomed) from Site 1 Note this slope comprises boulders in a sandy matrix and is dangerous to scramble up and thus survey should be conducted from beach and carpark.
118
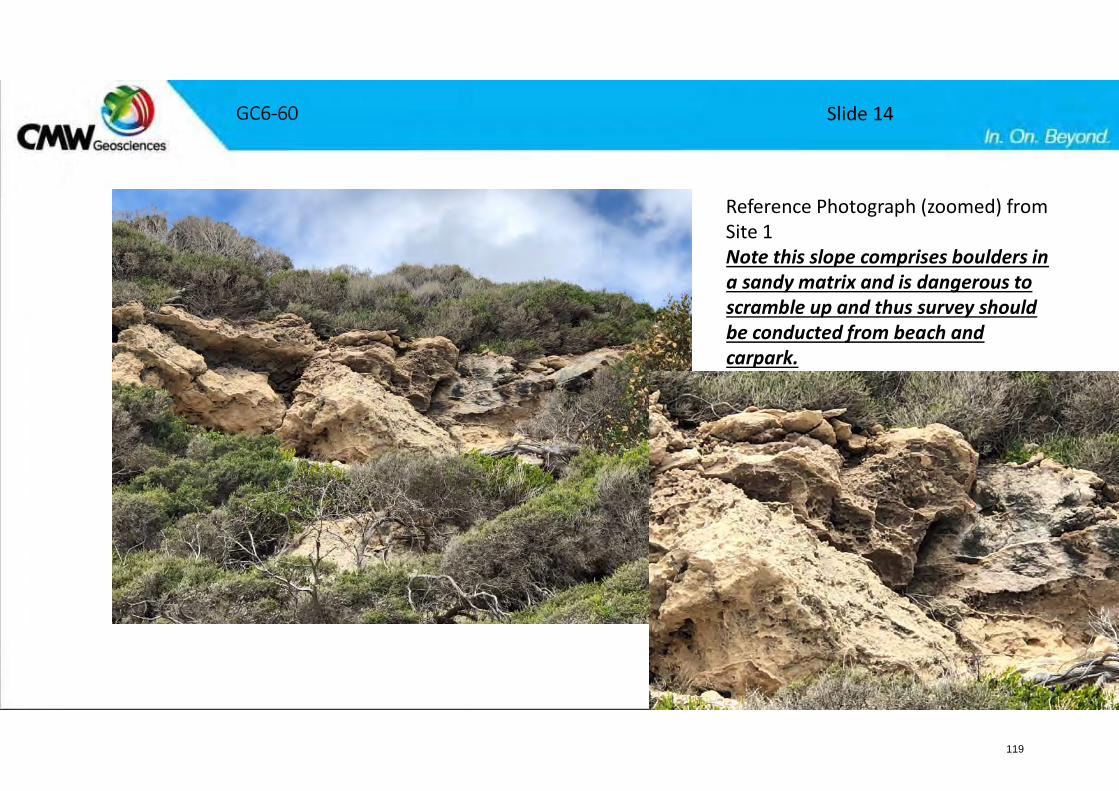
GC6-60 Slide 14
Reference Photograph (zoomed) from Site 1 Note this slope comprises boulders in a sandy matrix and is dangerous to scramble up and thus survey should be conducted from beach and carpark.
119
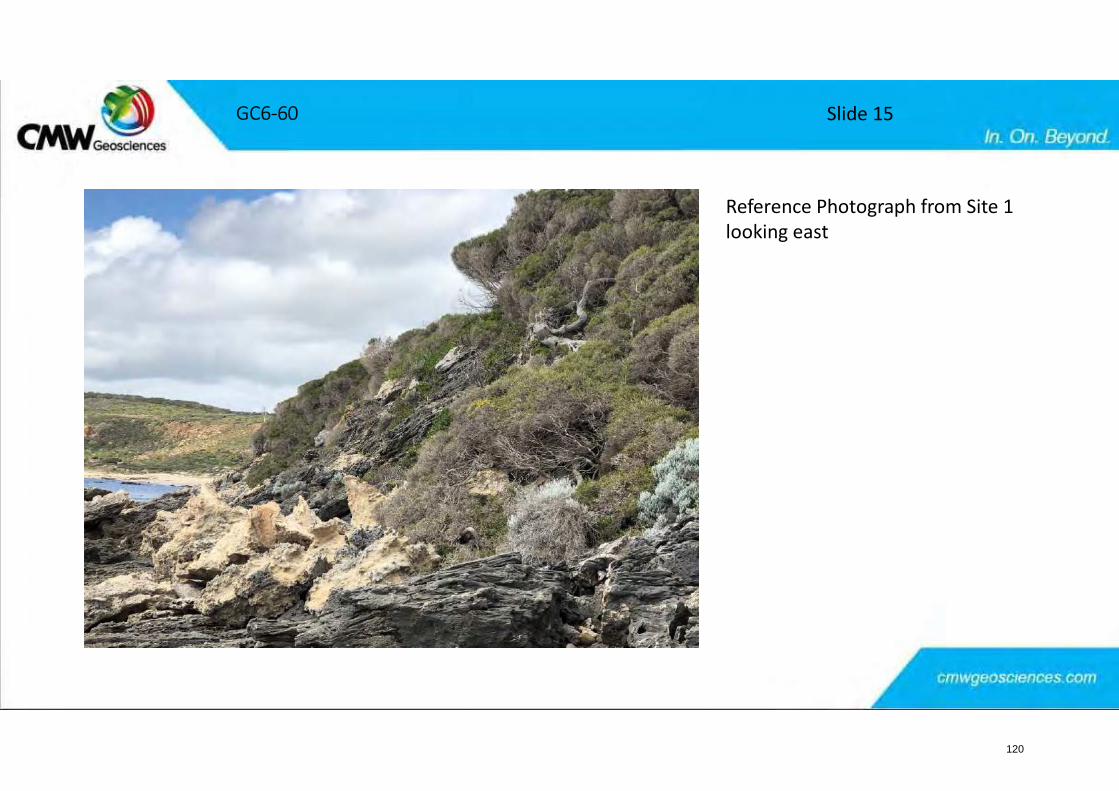
GC6-60 Slide 15
Reference Photograph from Site 1 looking east
120
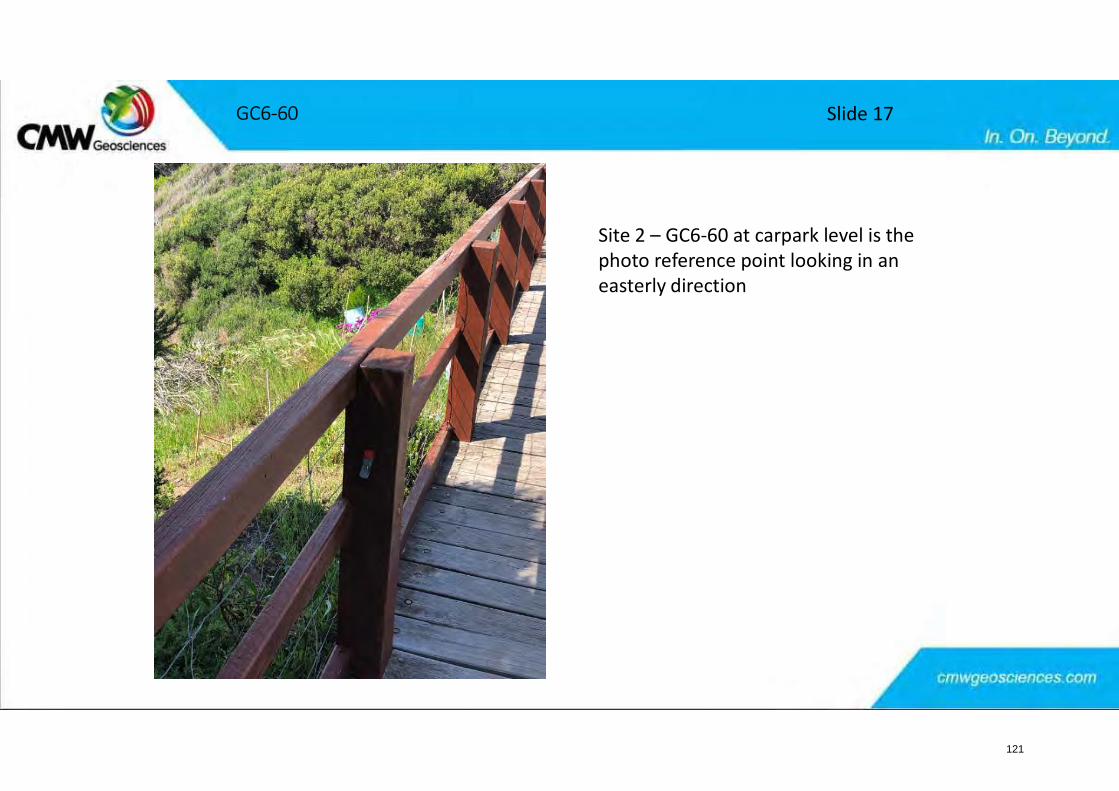
GC6-60 Slide 17
Site 2 – GC6-60 at carpark level is the photo reference point looking in an easterly direction
121
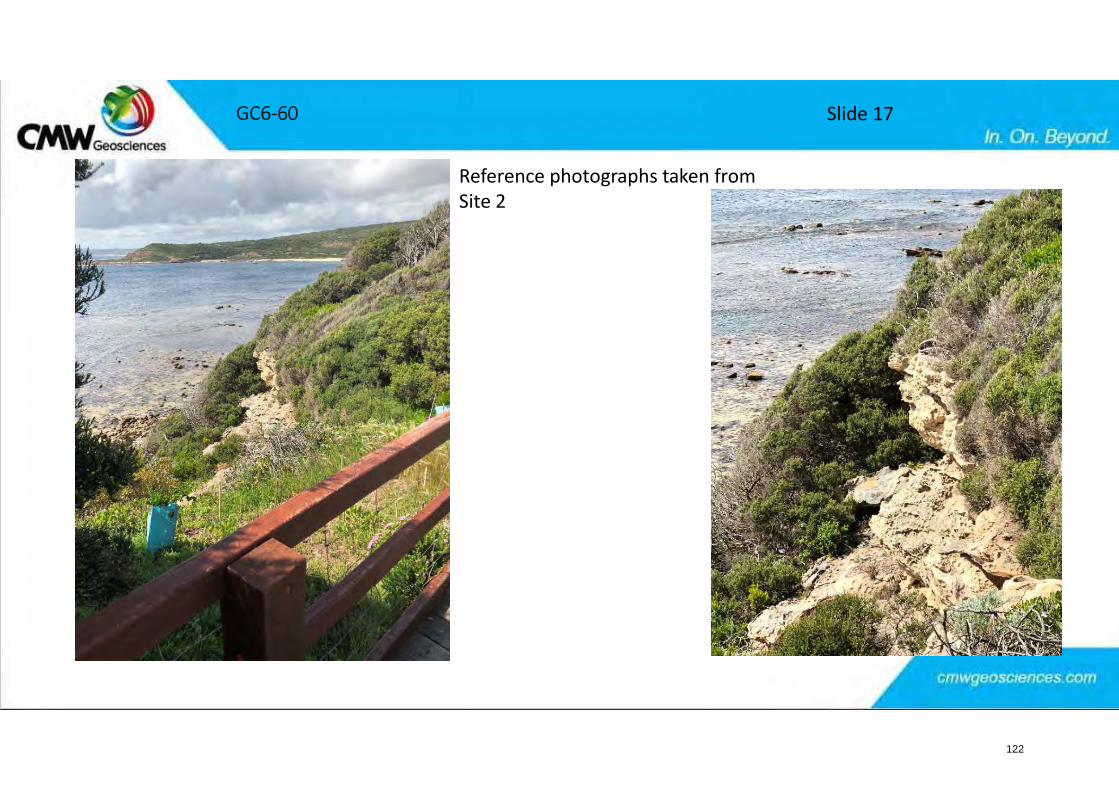
GC6-60 Slide 17
Reference photographs taken from Site 2
122
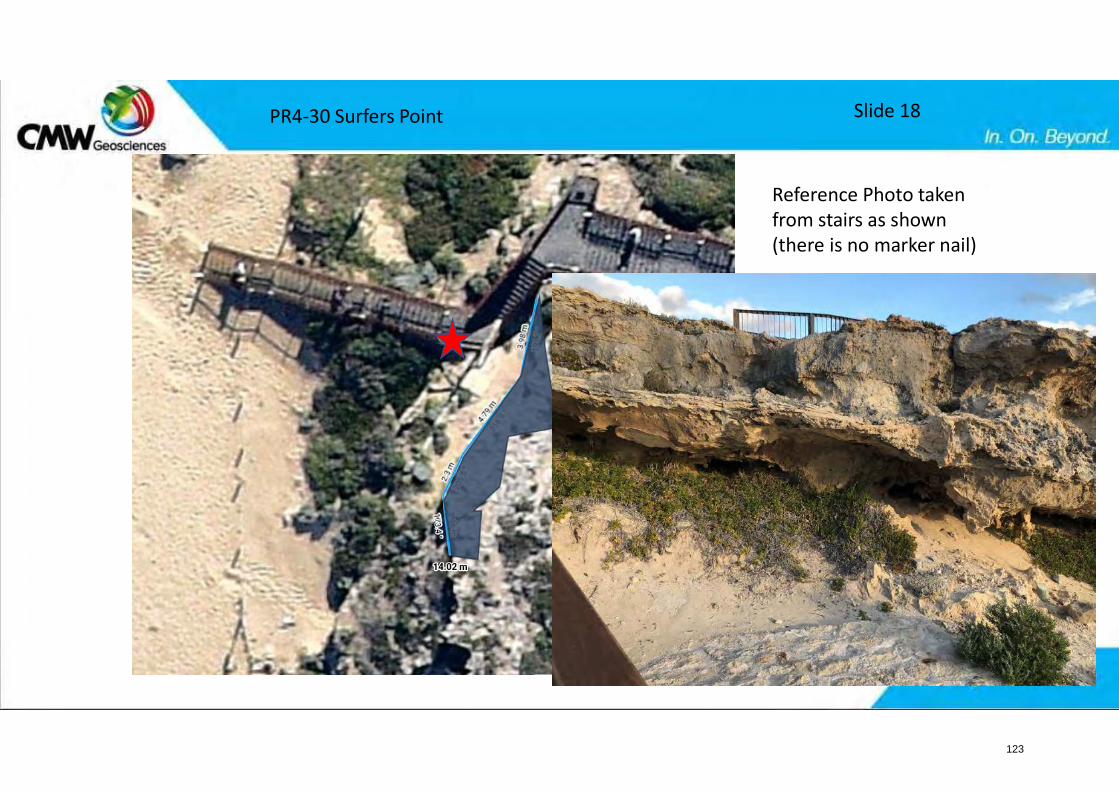
PR4-30 Surfers Point Slide 18
Reference Photo taken from stairs as shown (there is no marker nail)
123
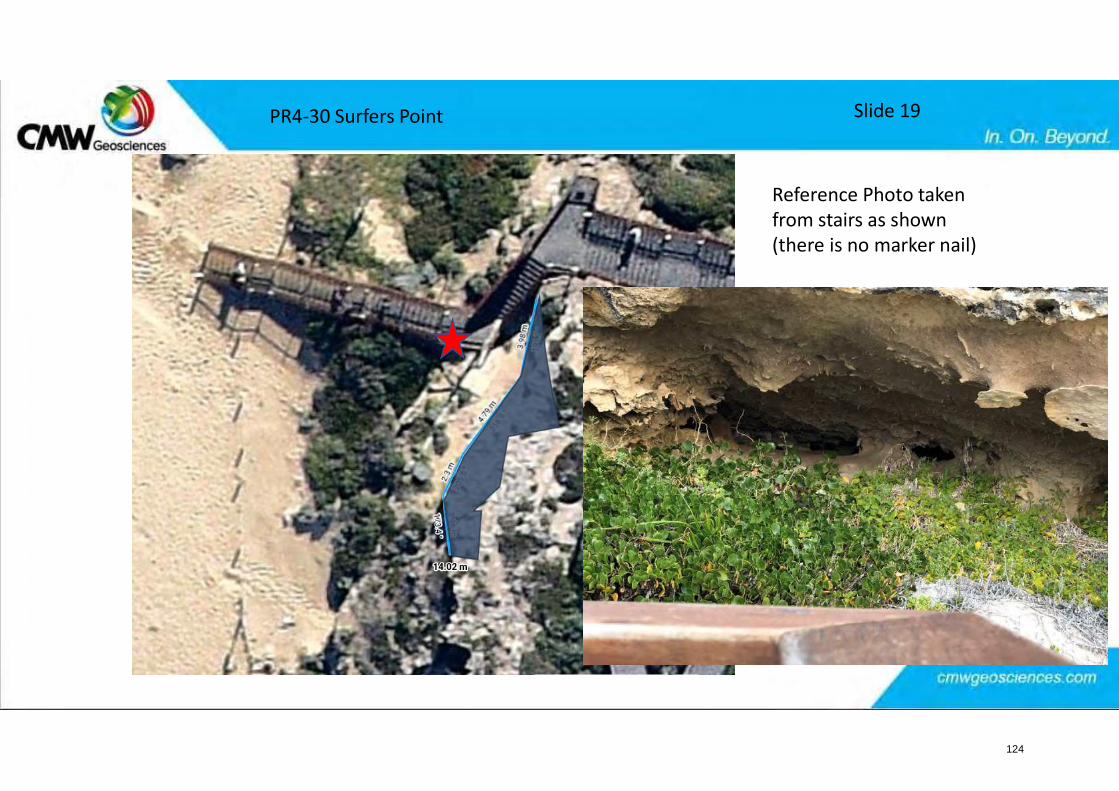
PR4-30 Surfers Point Slide 19
Reference Photo taken from stairs as shown(there is no marker nail)
124
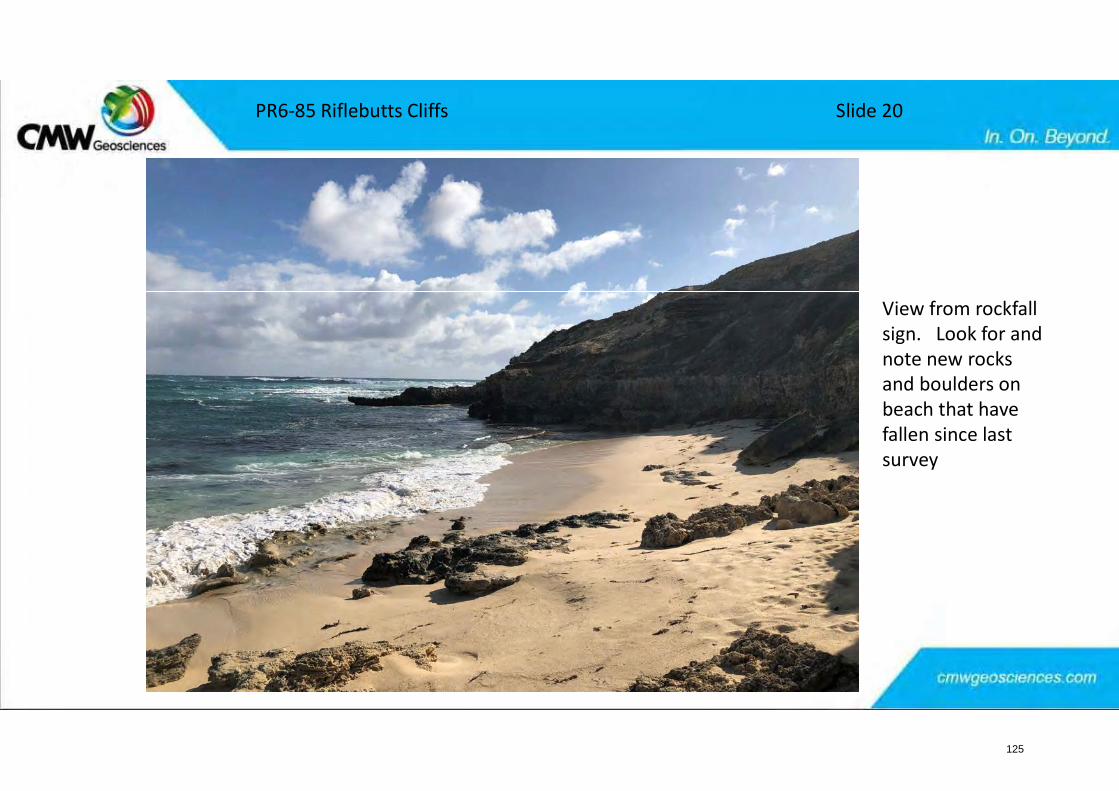
PR6-85 Riflebutts Cliffs Slide 20
View from rockfall sign. Look for and note new rocks and boulders on beach that have fallen since last survey
125
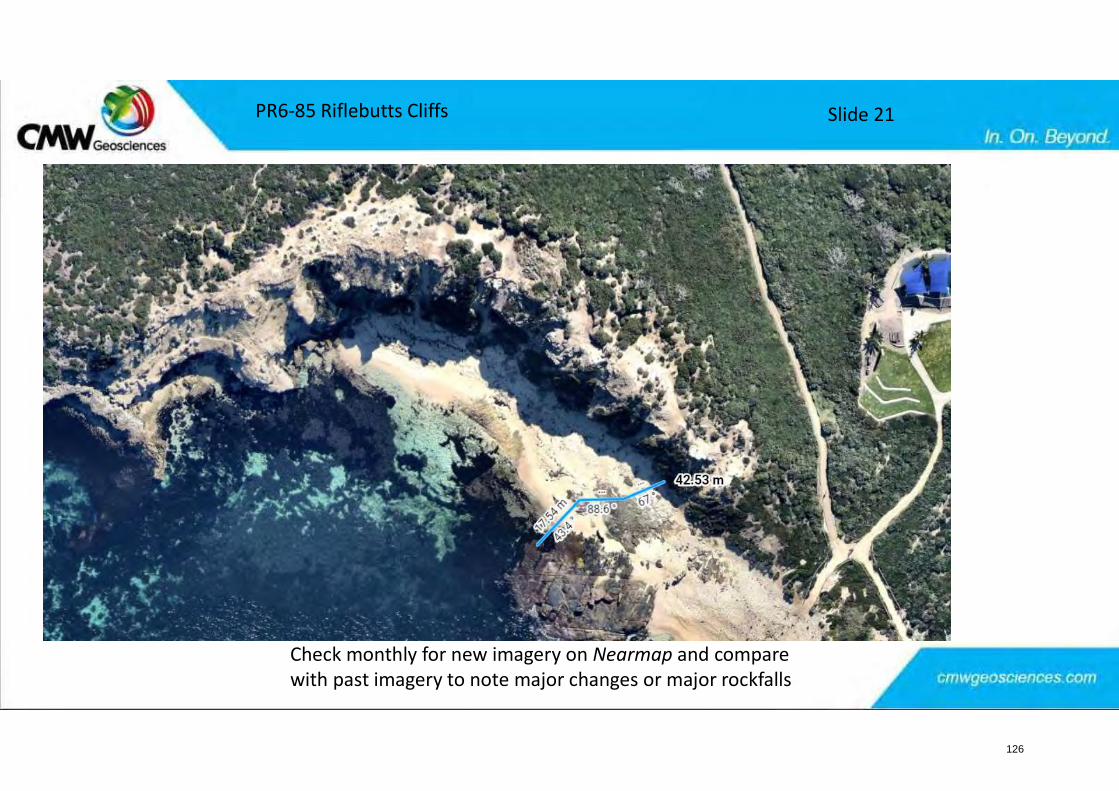
PR6-85 Riflebutts Cliffs
Check monthly for new imagery on Nearmap and compare with past imagery to note major changes or major rockfalls
Slide 21
126
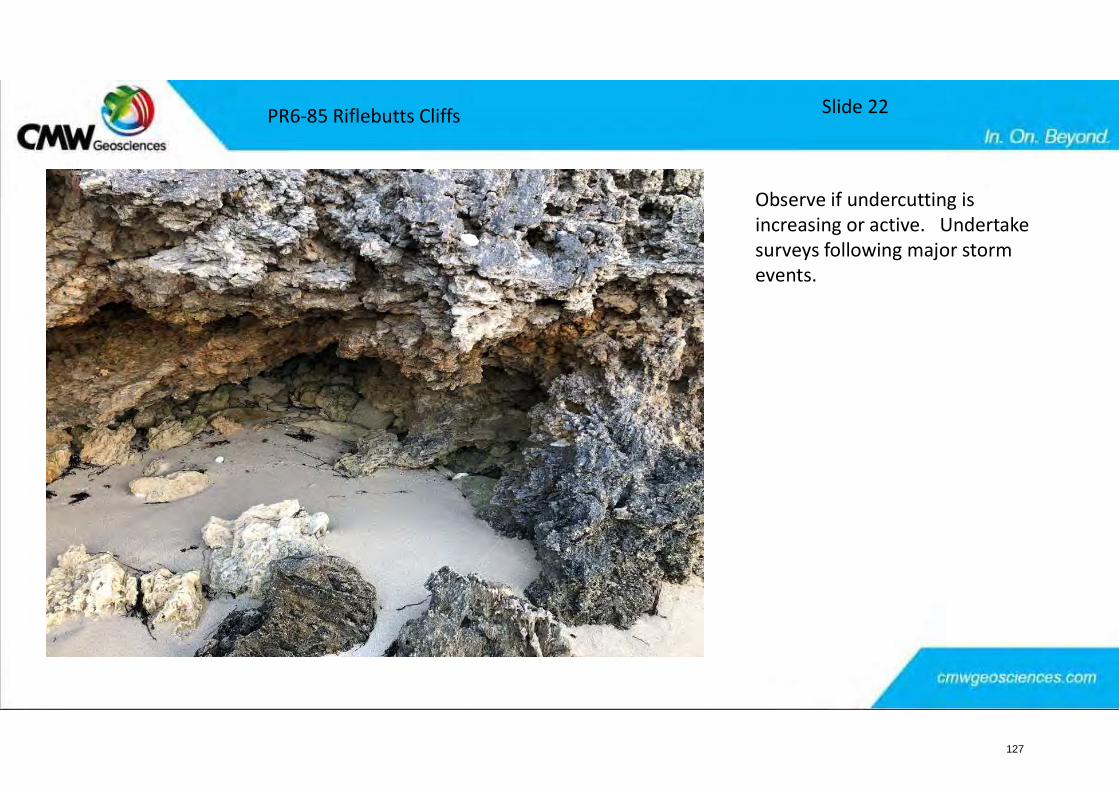
Observe if undercutting is increasing or active. Undertake surveys following major storm events.
PR6-85 Riflebutts Cliffs Slide 22
127
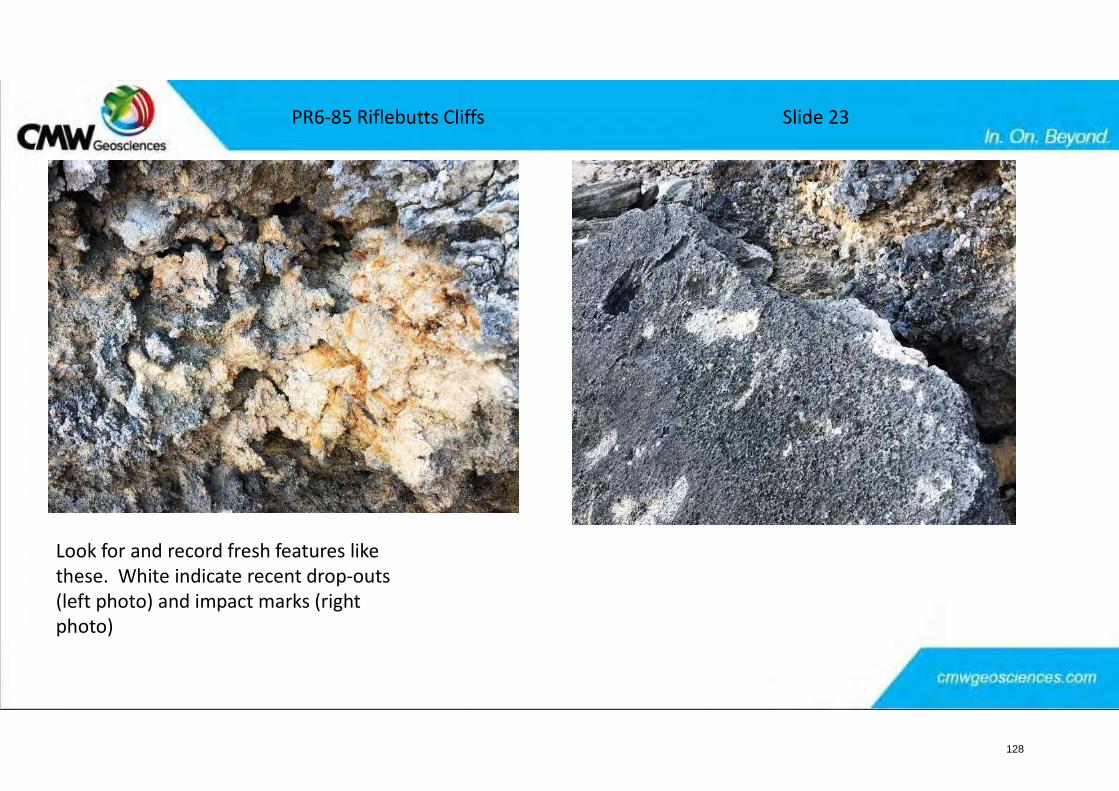
Look for and record fresh features like these. White indicate recent drop-outs (left photo) and impact marks (right photo)
PR6-85 Riflebutts Cliffs Slide 23
128
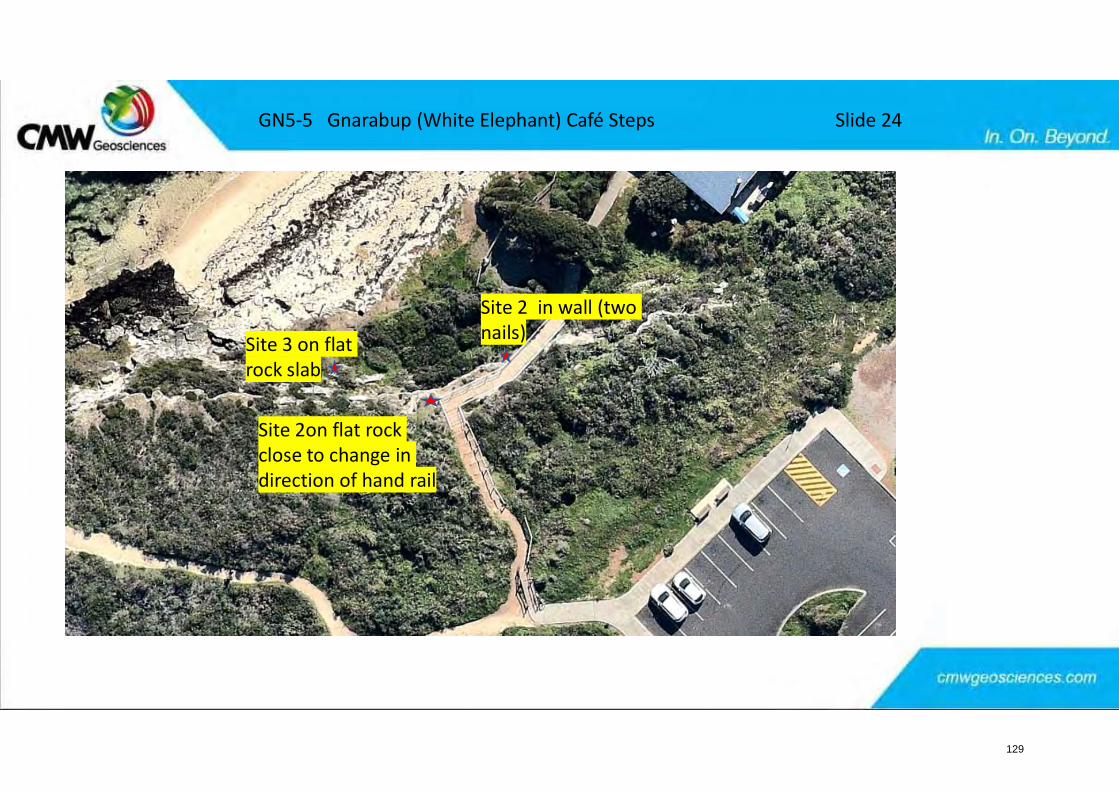
GN5-5 Gnarabup (White Elephant) Café Steps Slide 24
Site 2 in wall (two nails)
Site 2on flat rock close to change in direction of hand rail
Site 3 on flat rock slab
129
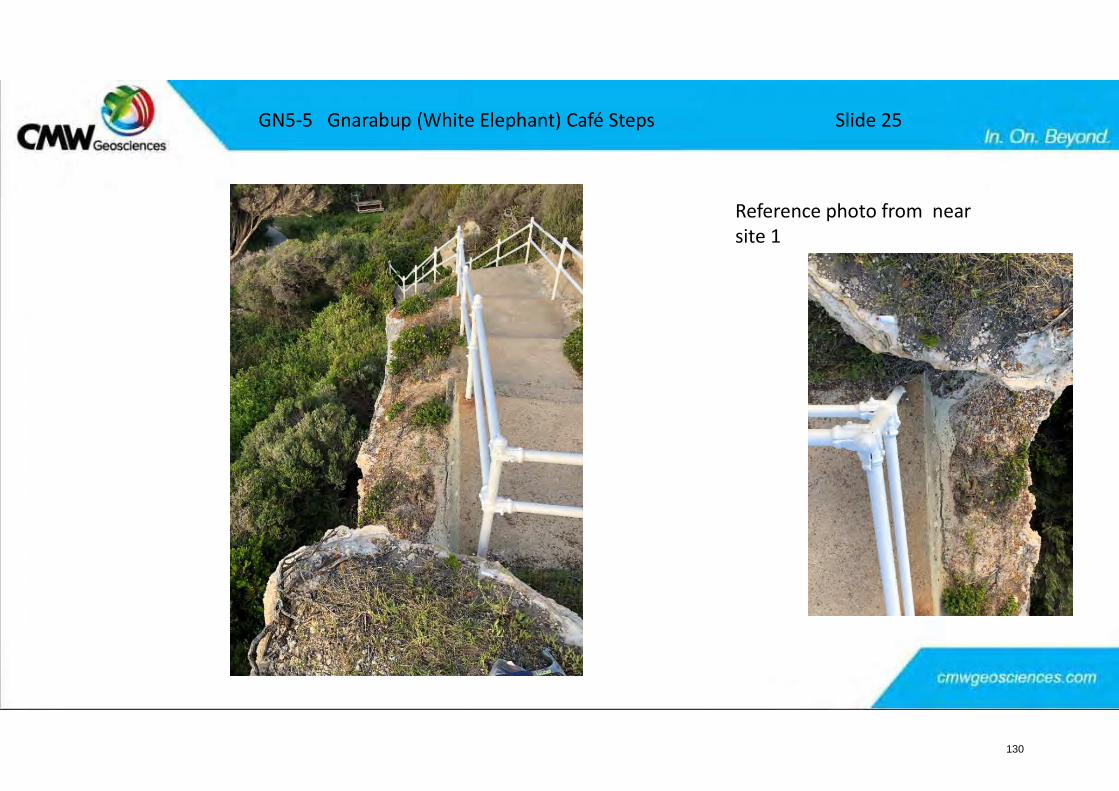
GN5-5 Gnarabup (White Elephant) Café Steps Slide 25
Reference photo from near site 1
130
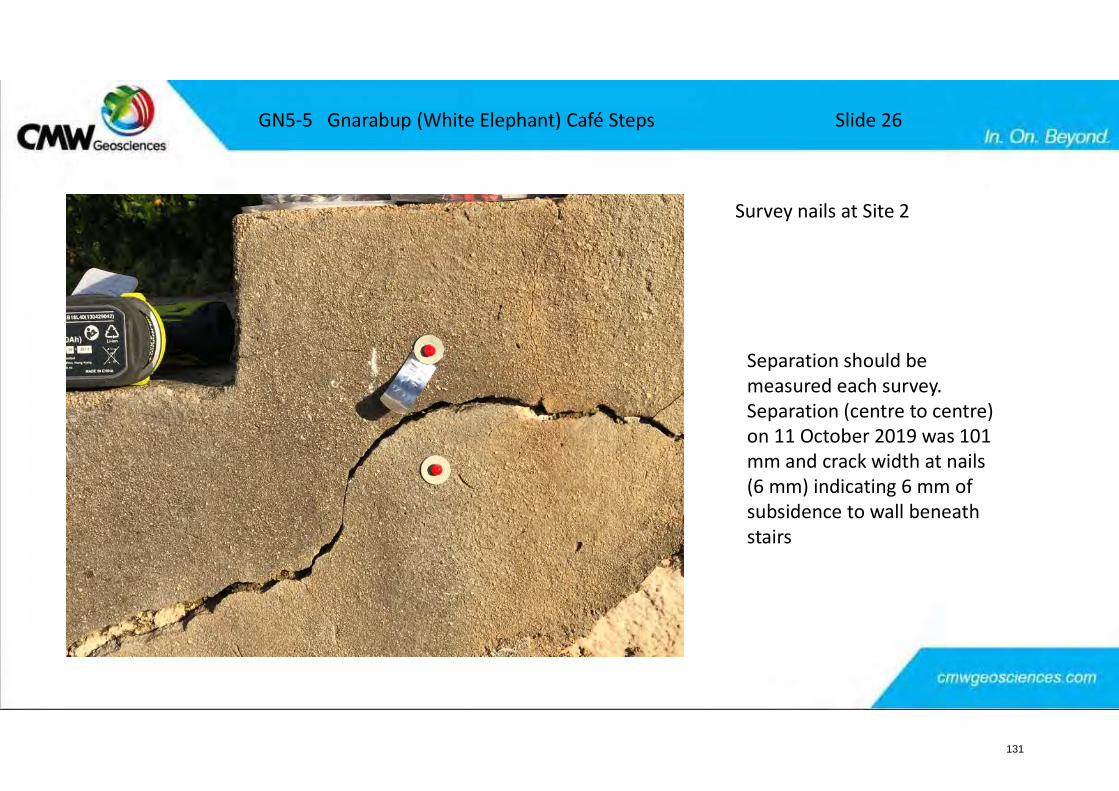
GN5-5 Gnarabup (White Elephant) Café Steps Slide 26
Survey nails at Site 2
Separation should be measured each survey. Separation (centre to centre) on 11 October 2019 was 101 mm and crack width at nails (6 mm) indicating 6 mm of subsidence to wall beneath stairs
131
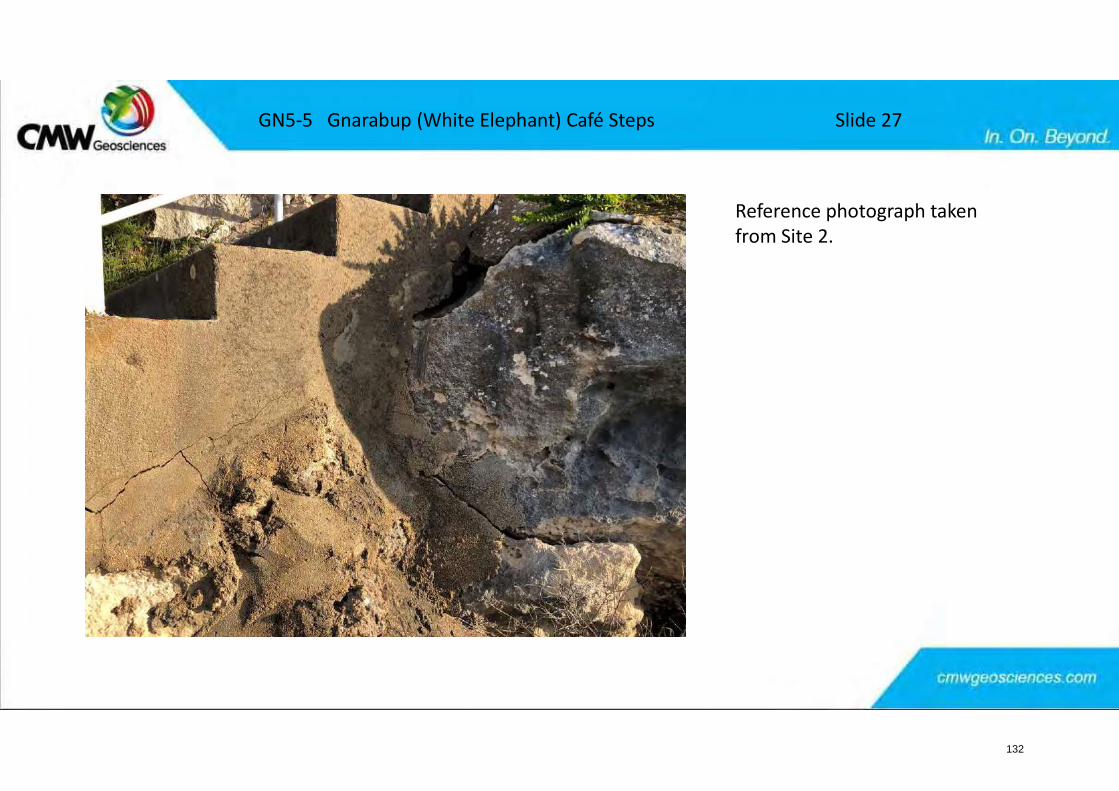
GN5-5 Gnarabup (White Elephant) Café Steps Slide 27
Reference photograph taken from Site 2.
132
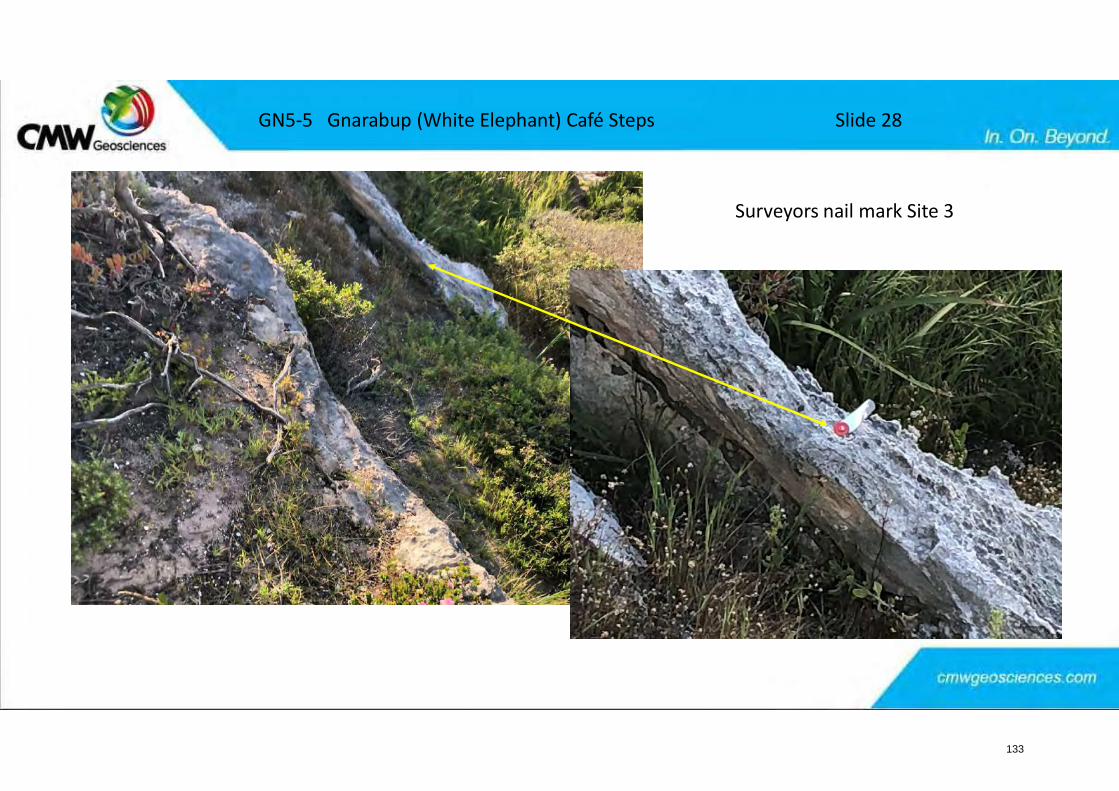
GN5-5 Gnarabup (White Elephant) Café Steps Slide 28
Surveyors nail mark Site 3
133
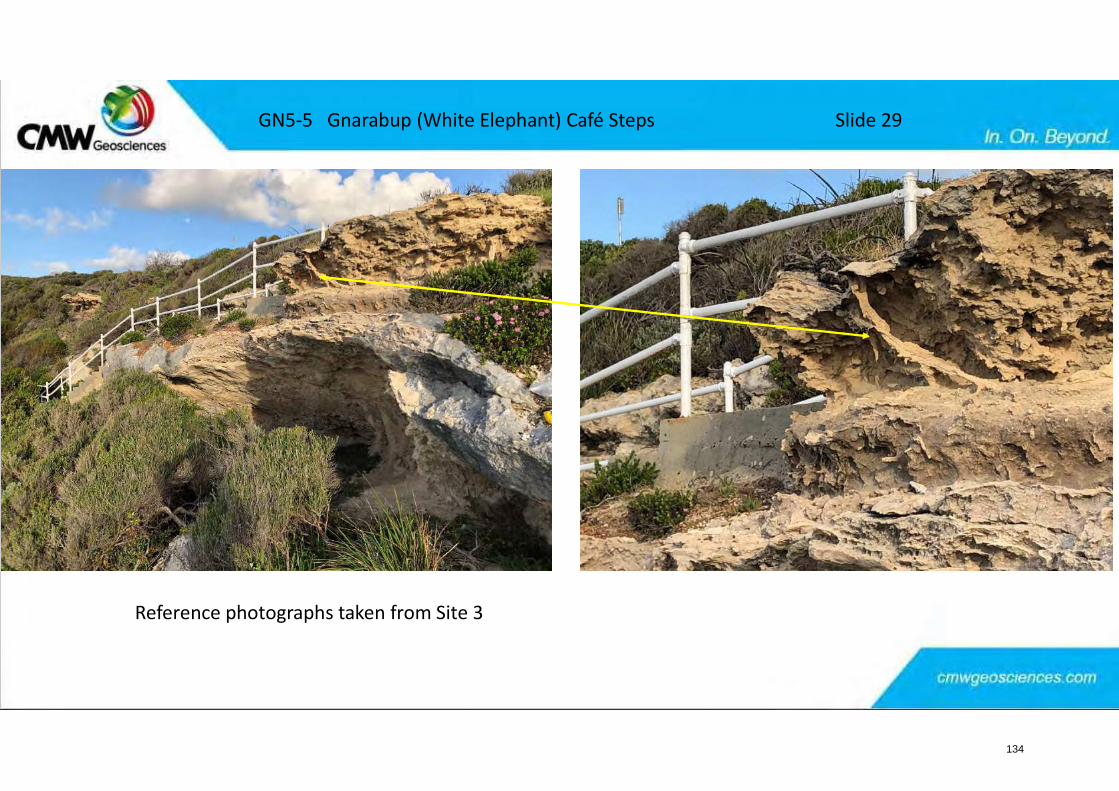
GN5-5 Gnarabup (White Elephant) Café Steps Slide 29
Reference photographs taken from Site 3
134

SHIRE OF AUGUSTA MARGARET RIVER ORDINARY COUNCIL MEETING 11 DECEMBER 2019
11.2 Sustainable Development 11.2.3 DRAFT CLIMATE ACTION PLAN
Attachment 1 – Draft Climate Action Plan
135
Climate Action Plan
136

NATURAL CONNECTED PROSPEROUS
Table of Contents
Foreword 2
Introduction 3
Climate Change Science 4
Intergovernmental Panel on Climate Change (IPCC) Projections 4
The Greenhouse Effect 4
Revised Emission Targets 5
Situation Analysis 8
Shire Organisation 8
Community 10
Renewable energy progress 11
Climate Action Summit 12
Methodology 12
Summit Outcomes 13
Proposed Actions 14
Policy and Education 17
Energy Conservation 18
Sustainable Transport 20
Waste Reduction 22
Implementation 24
Mainstreaming Climate Change within the Shire 24
Review and re-inventory 24
Appendix 1 25
137

NATURAL CONNECTED PROSPEROUS
Foreword The Shire of Augusta Margaret River is well placed through our legislative responsibilities and links within the community to influence the greenhouse gas emissions generated by our own activities. The Shire is also able to play a key role in supporting local households and businesses to mitigate the effects of climate change through initiatives in areas like energy use, waste disposal, land use change and transport. It has been suggested local governments have the capacity to influence activities that contribute up to 50% of our national greenhouse gas emissions. When combined, the efforts of local government and their communities can make a real difference. Reducing greenhouse gas emissions also has other benefits for local government and their communities, from improving local air quality and traffic congestion to reducing energy costs for residents and businesses, to generating new jobs, industries and incomes for local government. The Shire is also mindful of the financial benefits of initiatives such as well considered uptake of renewable energy. Through diligence in the preparation of actions and their implementation, the Council can achieve positive environmental and economic outcomes for the community.
Ian Earl Shire President The Shire of Augusta Margaret River is committed to reducing greenhouse gas emissions from its corporate operations and will play a lead role in reducing emissions from our community. Through implementing this Climate Action Plan (CAP), Council aims to improve energy conservation and promote renewable energy. The Shire completed an inventory of greenhouse gas emissions from our own activities (corporate) and those within the Shire as a whole (community) taken from base year 2007. This CAP identifies a wide range of actions to be undertaken by the Shire organisation, and also actions to assist the community to reduce emissions and achieve carbon reduction targets. The CAP has been prepared in partnership with the community and the Shire looks forward to working with the community to achieve broad, positive and proactive change. Such actions are likely to bring environmental, social and economic benefits for all residents of the Shire, now and in the future.
Stephanie Addison-Brown Chief Executive Officer
138
NATURAL CONNECTED PROSPEROUS
Introduction The Shire of Augusta Margaret River Council adopted a Local Energy Action Plan (LEAP) in 2010, with subsequent modifications to the document occurring in 2014 and 2018. The LEAP focused on reducing Shire emissions as an organisation and assisting the wider community to reduce their emissions, through supporting community sustainability initiatives. In November 2018, Council made a decision to host a Climate Action Summit in the first half of 2019. Community members, Shire, State and Federal Government representatives attended the summit with the intent of developing ambitious and well considered actions on climate change that can be undertaken by whole of community. Secondly, it seeks to inform development of a Climate Action Plan (CAP) to replace the previous LEAP.
On 28 May 2019, the Shire of Augusta Margaret River, allied with the community as represented by the ‘Climate Action Augusta Margaret River’ group, hosted a one day Climate Action Summit, in partnership with Surfing Western Australia and the World Surf League. The Summit’s focus was on ‘climate change mitigation’, with a second summit intended for 2020 to explore climate change adaptation. In response to climate change, there is a global movement to reduce carbon emissions to zero by 2050. The Shire, and the broader community, are committed to achieving this ambitious target locally, by building on its sustainability achievements to date and driving towards a carbon free and climate resilient future. Climate change forms one of the core principles of the Shire’s Community Strategic Plan 2036, acknowledging the pivotal role the Shire and community play in addressing climate change over the next 20 years.
The CAP is based on a 10 year period of 2020 – 2030, with a substantial review of the CAP occurring following at 2030, marking the date of the first major emission reduction target. The CAP is a two-part plan, with this document concentrating on Part 1 - Mitigation. Mitigation involves reducing the flow of heat-trapping greenhouse gases into the atmosphere, either by reducing sources of these gases (for example, the burning of fossil fuels for electricity, heat or transport) or enhancing the “sinks” that accumulate and store these gases (such as the oceans, forests and soil). This document proposes a number of actions targeted towards emission reduction to meet a 65% emission reduction target by 2030 and net zero emissions by 2050. The local government also plays a support role in encouraging the community to reduce their emissions. This CAP details both the Shire’s commitment to actions arising from the Summit and the Shire’s actions aimed at reducing emissions, as modified from the LEAP document.
A second component of the CAP ‘Part 2 – Adaptation’ will be developed in conjunction with a Climate Action Summit themed ‘adaptation’, scheduled for 2020. The goal of the adaptation phase will be to reduce the Shire organisation and community’s vulnerability to the harmful effects of climate change (including sea-level encroachment, more intense extreme weather events or food insecurity). The adaptation phase will involve conducting a risk assessment of the potential impacts of climate change, to both Council and community activities. Adaptation planning will involve embedding ‘planning for climate change’ into all Shire functions including bushfire planning, health and well-being, biodiversity, built form and infrastructure. Figure 1 below sets out the framework in which the CAP will be based. Some current adaptation measures undertaken by the Shire have been captured in this, initial CAP Part 1. The CAP signifies the Shire’s commitment to addressing climate change. Other sectors including residential and business, and environmental groups in the community are encouraged to develop their own versions of a Climate Action Plan.
139
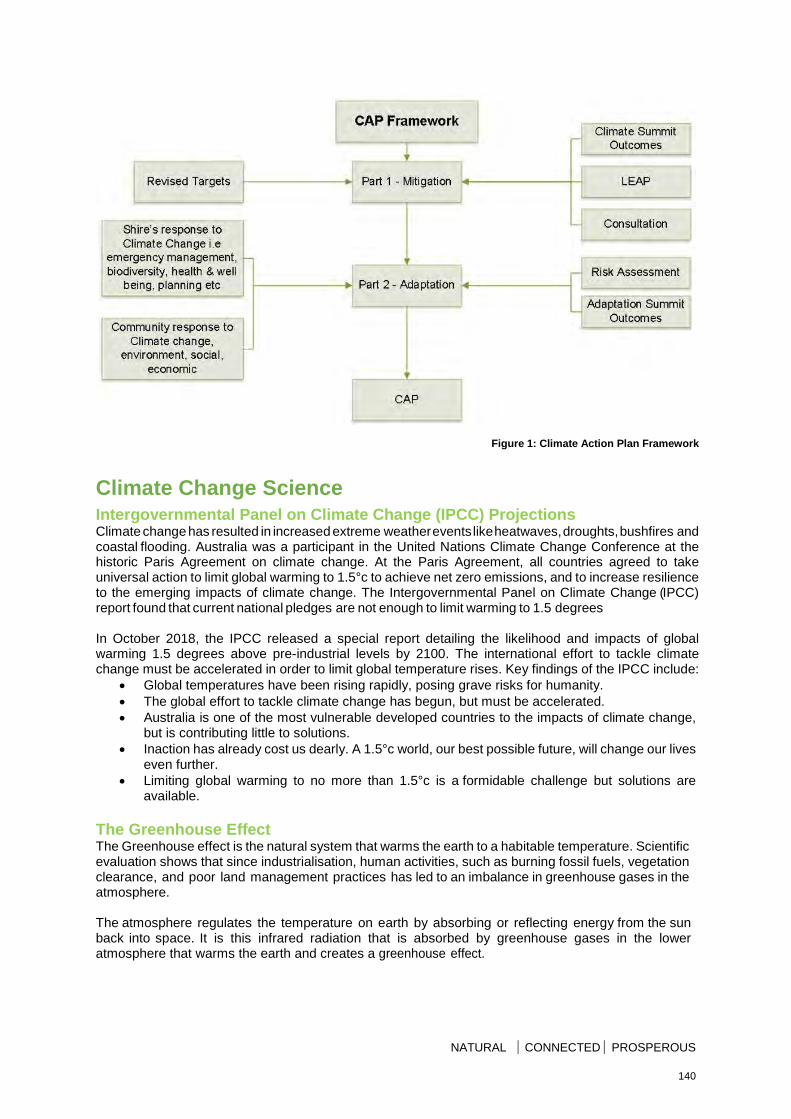
NATURAL CONNECTED PROSPEROUS
Figure 1: Climate Action Plan Framework
Climate Change Science Intergovernmental Panel on Climate Change (IPCC) Projections Climate change has resulted in increased extreme weather events like heatwaves, droughts, bushfires and coastal flooding. Australia was a participant in the United Nations Climate Change Conference at the historic Paris Agreement on climate change. At the Paris Agreement, all countries agreed to take universal action to limit global warming to 1.5°c to achieve net zero emissions, and to increase resilience to the emerging impacts of climate change. The Intergovernmental Panel on Climate Change (IPCC) report found that current national pledges are not enough to limit warming to 1.5 degrees In October 2018, the IPCC released a special report detailing the likelihood and impacts of global warming 1.5 degrees above pre-industrial levels by 2100. The international effort to tackle climate change must be accelerated in order to limit global temperature rises. Key findings of the IPCC include:
• Global temperatures have been rising rapidly, posing grave risks for humanity. • The global effort to tackle climate change has begun, but must be accelerated. • Australia is one of the most vulnerable developed countries to the impacts of climate change,
but is contributing little to solutions. • Inaction has already cost us dearly. A 1.5°c world, our best possible future, will change our lives
even further. • Limiting global warming to no more than 1.5°c is a formidable challenge but solutions are
available. The Greenhouse Effect The Greenhouse effect is the natural system that warms the earth to a habitable temperature. Scientific evaluation shows that since industrialisation, human activities, such as burning fossil fuels, vegetation clearance, and poor land management practices has led to an imbalance in greenhouse gases in the atmosphere. The atmosphere regulates the temperature on earth by absorbing or reflecting energy from the sun back into space. It is this infrared radiation that is absorbed by greenhouse gases in the lower atmosphere that warms the earth and creates a greenhouse effect.
140
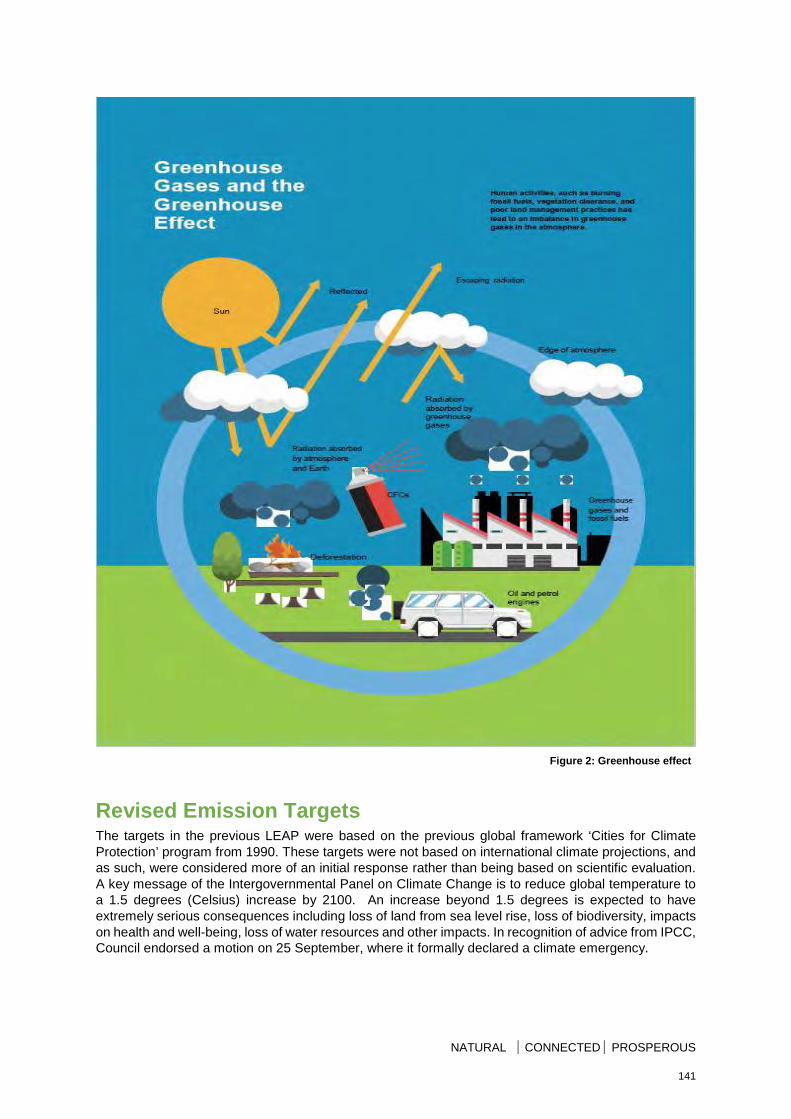
NATURAL CONNECTED PROSPEROUS
Figure 2: Greenhouse effect
Revised Emission Targets The targets in the previous LEAP were based on the previous global framework ‘Cities for Climate Protection’ program from 1990. These targets were not based on international climate projections, and as such, were considered more of an initial response rather than being based on scientific evaluation. A key message of the Intergovernmental Panel on Climate Change is to reduce global temperature to a 1.5 degrees (Celsius) increase by 2100. An increase beyond 1.5 degrees is expected to have extremely serious consequences including loss of land from sea level rise, loss of biodiversity, impacts on health and well-being, loss of water resources and other impacts. In recognition of advice from IPCC, Council endorsed a motion on 25 September, where it formally declared a climate emergency.
141

NATURAL CONNECTED PROSPEROUS
In October 2018, the IPCC prepared a special report on the impacts of global warming of 1.5°C above pre-industrial levels. The report outlines that global emissions of carbon dioxide (CO2) would need to fall by about 45 percent from 2010 levels by 2030, reaching ‘net zero’ around 2050. These targets are required to be met in order to curb temperature to a 1.5°C increase by 2100.
On 30 May 2019, 21 councils from across the state, hosted by the Climate Council’s Cities Power Partnership, identified the lack of a state-level renewable energy and emissions target as a major barrier to local work to tackle climate change, and have urged the state to step up its ambitions. Specifically, the councils want a 50% state-wide renewable energy target by 2030, a 65% state-wide emissions reduction target by 2030, and a 100% emissions reduction target by 2050. These targets are consistent with the IPCC targets with the exception of the proposed 65% 2030 target. The push for an increase to 65% target by 2030 (above 45%) is outlined in a report prepared by Climate Change Authority (CCA) as follows:
In 2015, the Climate Change Authority (CCA) recommended an economy-wide emissions reduction target of 45-65% below 2005 levels by 2030. This target was developed based on scientific evidence, Australia’s national interest, and action pledged by comparable countries. Since then, Australia’s emissions have continued to rise. In addition, the Paris Agreement ramped up international ambition by enshrining a goal of limiting temperature increase to 1.5°C. As a result, an economy wide emissions reduction of 65% by 2030 – t he upper end of the CCA’s recommended target – should now be the minimum target.
Nationally, emissions per person are three-and-a-half times the global average Western Australia’s emissions per person are just short of six times the global average. The graph below provided by Climate Council Australia highlights Western Australia’s emissions per capita (fourth highest in the world, fourth bar from the right) from 2016. This data highlights the need for a greater target leading up to 2030 to ensure Western Australia meets IPCC emissions reduction recommendations.
142
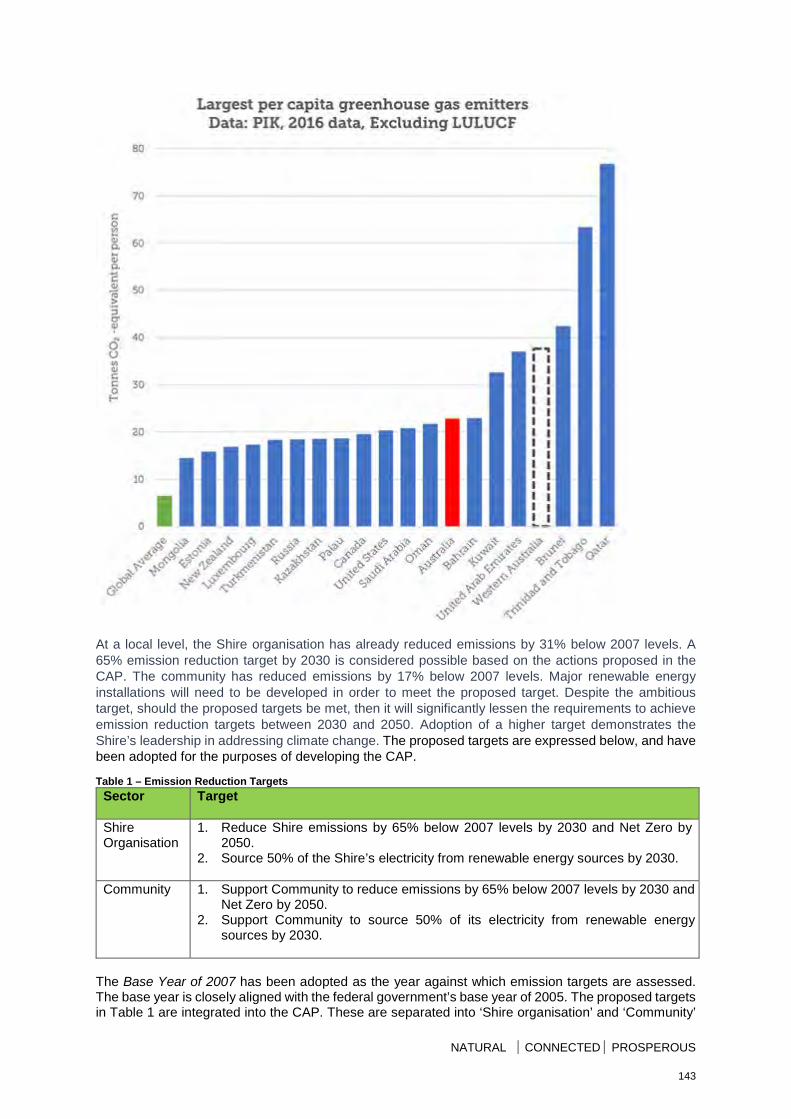
NATURAL CONNECTED PROSPEROUS
At a local level, the Shire organisation has already reduced emissions by 31% below 2007 levels. A 65% emission reduction target by 2030 is considered possible based on the actions proposed in the CAP. The community has reduced emissions by 17% below 2007 levels. Major renewable energy installations will need to be developed in order to meet the proposed target. Despite the ambitious target, should the proposed targets be met, then it will significantly lessen the requirements to achieve emission reduction targets between 2030 and 2050. Adoption of a higher target demonstrates the Shire’s leadership in addressing climate change. The proposed targets are expressed below, and have been adopted for the purposes of developing the CAP.
Table 1 – Emission Reduction Targets Sector Target
Shire Organisation
1. Reduce Shire emissions by 65% below 2007 levels by 2030 and Net Zero by 2050.
2. Source 50% of the Shire’s electricity from renewable energy sources by 2030.
Community 1. Support Community to reduce emissions by 65% below 2007 levels by 2030 and Net Zero by 2050.
2. Support Community to source 50% of its electricity from renewable energy sources by 2030.
The Base Year of 2007 has been adopted as the year against which emission targets are assessed. The base year is closely aligned with the federal government’s base year of 2005. The proposed targets in Table 1 are integrated into the CAP. These are separated into ‘Shire organisation’ and ‘Community’
143
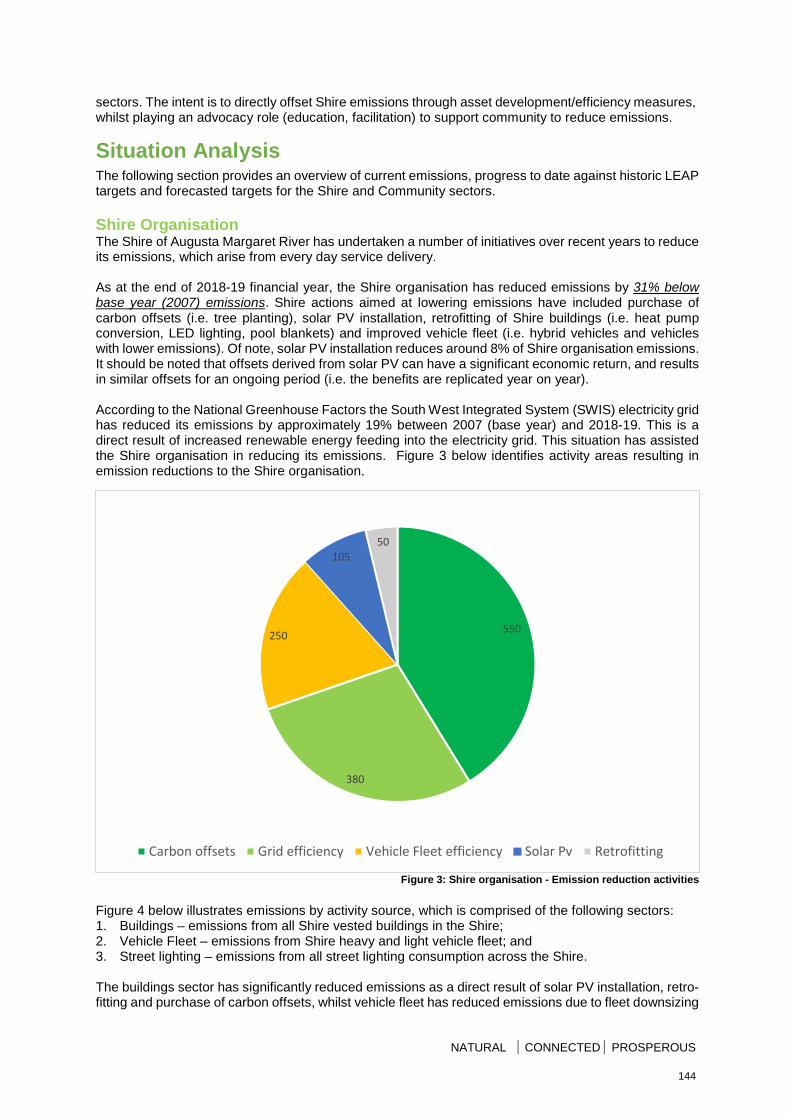
NATURAL CONNECTED PROSPEROUS
sectors. The intent is to directly offset Shire emissions through asset development/efficiency measures, whilst playing an advocacy role (education, facilitation) to support community to reduce emissions.
Situation Analysis The following section provides an overview of current emissions, progress to date against historic LEAP targets and forecasted targets for the Shire and Community sectors. Shire Organisation The Shire of Augusta Margaret River has undertaken a number of initiatives over recent years to reduce its emissions, which arise from every day service delivery. As at the end of 2018-19 financial year, the Shire organisation has reduced emissions by 31% below base year (2007) emissions. Shire actions aimed at lowering emissions have included purchase of carbon offsets (i.e. tree planting), solar PV installation, retrofitting of Shire buildings (i.e. heat pump conversion, LED lighting, pool blankets) and improved vehicle fleet (i.e. hybrid vehicles and vehicles with lower emissions). Of note, solar PV installation reduces around 8% of Shire organisation emissions. It should be noted that offsets derived from solar PV can have a significant economic return, and results in similar offsets for an ongoing period (i.e. the benefits are replicated year on year). According to the National Greenhouse Factors the South West Integrated System (SWIS) electricity grid has reduced its emissions by approximately 19% between 2007 (base year) and 2018-19. This is a direct result of increased renewable energy feeding into the electricity grid. This situation has assisted the Shire organisation in reducing its emissions. Figure 3 below identifies activity areas resulting in emission reductions to the Shire organisation.
Figure 3: Shire organisation - Emission reduction activities
Figure 4 below illustrates emissions by activity source, which is comprised of the following sectors: 1. Buildings – emissions from all Shire vested buildings in the Shire; 2. Vehicle Fleet – emissions from Shire heavy and light vehicle fleet; and 3. Street lighting – emissions from all street lighting consumption across the Shire. The buildings sector has significantly reduced emissions as a direct result of solar PV installation, retro-fitting and purchase of carbon offsets, whilst vehicle fleet has reduced emissions due to fleet downsizing
550
380
250
10550
Carbon offsets Grid efficiency Vehicle Fleet efficiency Solar Pv Retrofitting
144
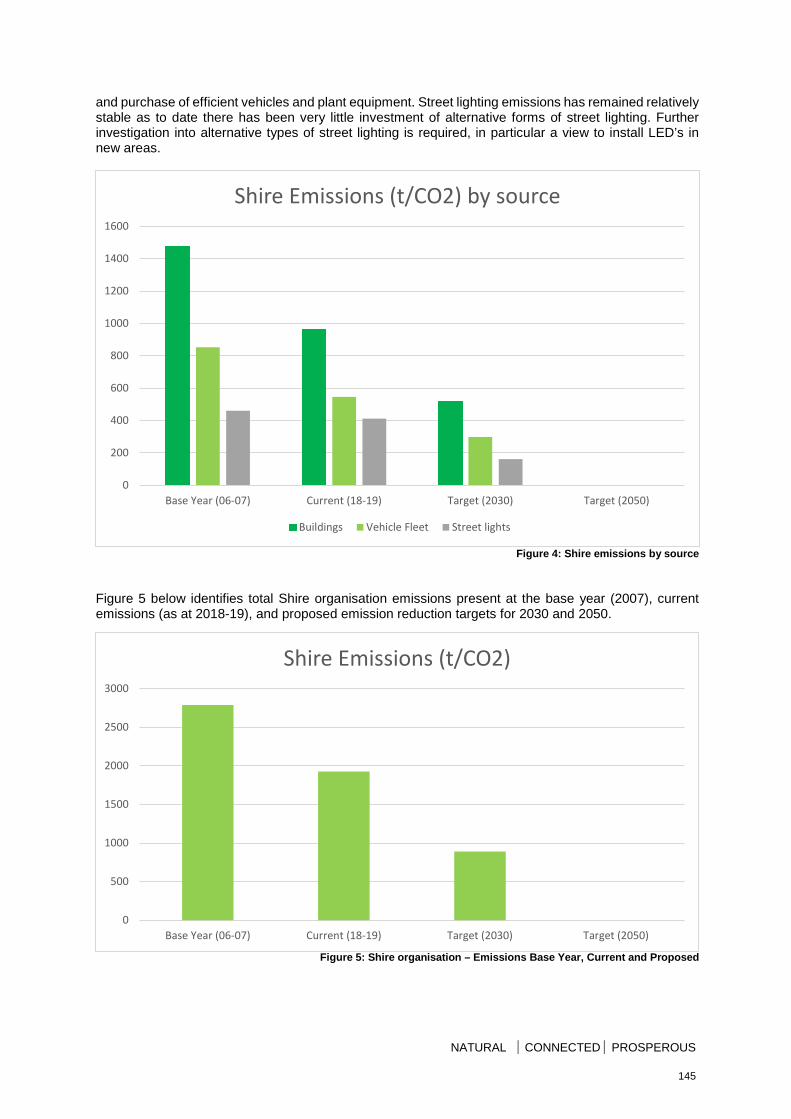
NATURAL CONNECTED PROSPEROUS
and purchase of efficient vehicles and plant equipment. Street lighting emissions has remained relatively stable as to date there has been very little investment of alternative forms of street lighting. Further investigation into alternative types of street lighting is required, in particular a view to install LED’s in new areas.
Figure 4: Shire emissions by source
Figure 5 below identifies total Shire organisation emissions present at the base year (2007), current emissions (as at 2018-19), and proposed emission reduction targets for 2030 and 2050.
Figure 5: Shire organisation – Emissions Base Year, Current and Proposed
0
200
400
600
800
1000
1200
1400
1600
Base Year (06-07) Current (18-19) Target (2030) Target (2050)
Shire Emissions (t/CO2) by source
Buildings Vehicle Fleet Street lights
0
500
1000
1500
2000
2500
3000
Base Year (06-07) Current (18-19) Target (2030) Target (2050)
Shire Emissions (t/CO2)
145
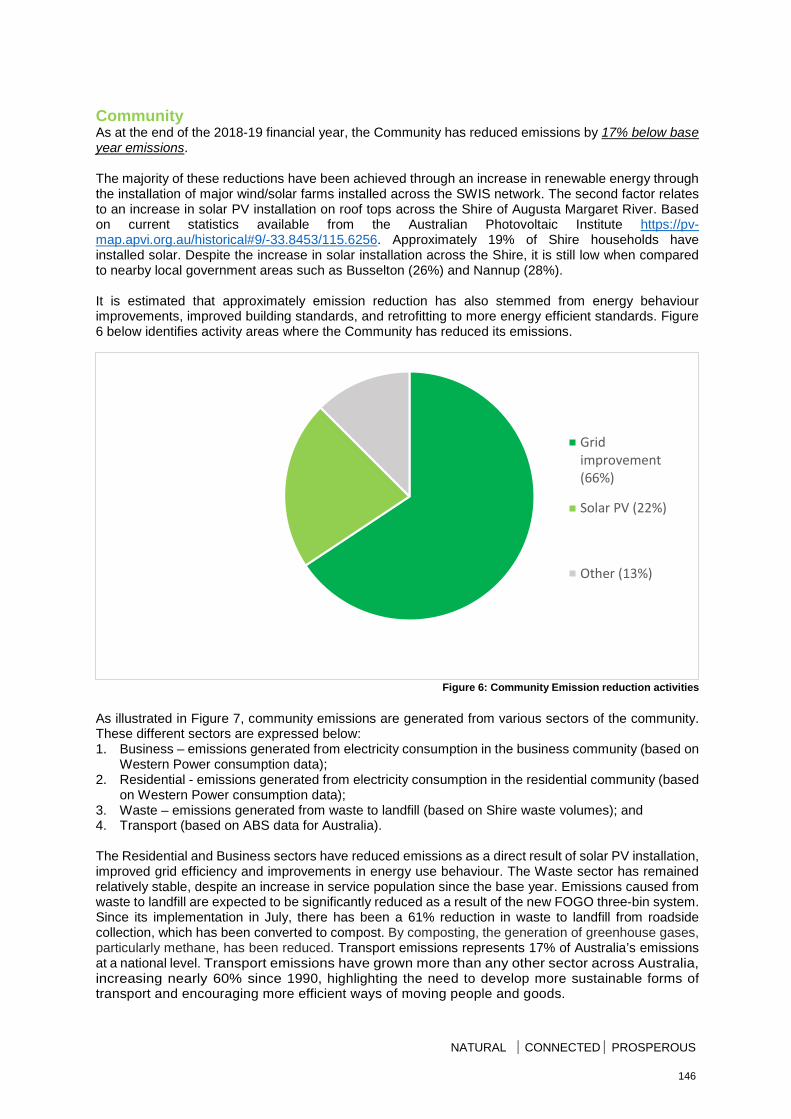
NATURAL CONNECTED PROSPEROUS
Community As at the end of the 2018-19 financial year, the Community has reduced emissions by 17% below base year emissions. The majority of these reductions have been achieved through an increase in renewable energy through the installation of major wind/solar farms installed across the SWIS network. The second factor relates to an increase in solar PV installation on roof tops across the Shire of Augusta Margaret River. Based on current statistics available from the Australian Photovoltaic Institute https://pv-map.apvi.org.au/historical#9/-33.8453/115.6256. Approximately 19% of Shire households have installed solar. Despite the increase in solar installation across the Shire, it is still low when compared to nearby local government areas such as Busselton (26%) and Nannup (28%). It is estimated that approximately emission reduction has also stemmed from energy behaviour improvements, improved building standards, and retrofitting to more energy efficient standards. Figure 6 below identifies activity areas where the Community has reduced its emissions.
Figure 6: Community Emission reduction activities As illustrated in Figure 7, community emissions are generated from various sectors of the community. These different sectors are expressed below: 1. Business – emissions generated from electricity consumption in the business community (based on
Western Power consumption data); 2. Residential - emissions generated from electricity consumption in the residential community (based
on Western Power consumption data); 3. Waste – emissions generated from waste to landfill (based on Shire waste volumes); and 4. Transport (based on ABS data for Australia). The Residential and Business sectors have reduced emissions as a direct result of solar PV installation, improved grid efficiency and improvements in energy use behaviour. The Waste sector has remained relatively stable, despite an increase in service population since the base year. Emissions caused from waste to landfill are expected to be significantly reduced as a result of the new FOGO three-bin system. Since its implementation in July, there has been a 61% reduction in waste to landfill from roadside collection, which has been converted to compost. By composting, the generation of greenhouse gases, particularly methane, has been reduced. Transport emissions represents 17% of Australia’s emissions at a national level. Transport emissions have grown more than any other sector across Australia, increasing nearly 60% since 1990, highlighting the need to develop more sustainable forms of transport and encouraging more efficient ways of moving people and goods.
Gridimprovement(66%)
Solar PV (22%)
Other (13%)
146
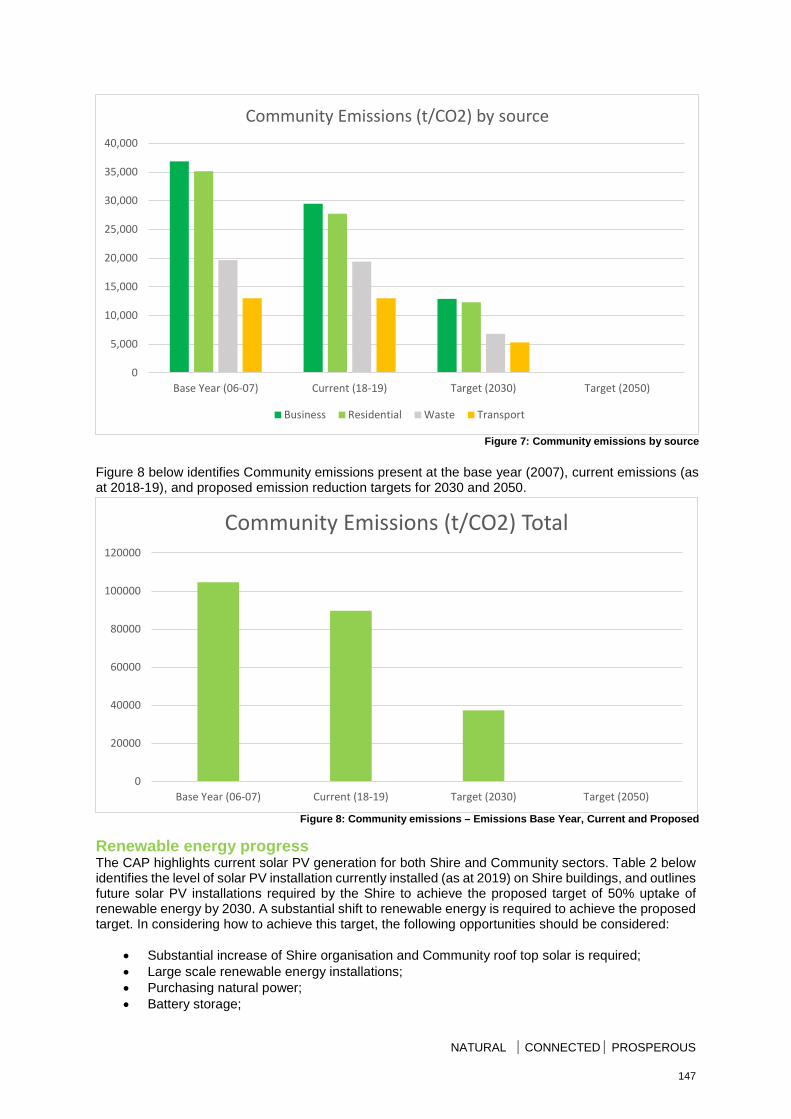
NATURAL CONNECTED PROSPEROUS
Figure 7: Community emissions by source
Figure 8 below identifies Community emissions present at the base year (2007), current emissions (as at 2018-19), and proposed emission reduction targets for 2030 and 2050.
Figure 8: Community emissions – Emissions Base Year, Current and Proposed
Renewable energy progress The CAP highlights current solar PV generation for both Shire and Community sectors. Table 2 below identifies the level of solar PV installation currently installed (as at 2019) on Shire buildings, and outlines future solar PV installations required by the Shire to achieve the proposed target of 50% uptake of renewable energy by 2030. A substantial shift to renewable energy is required to achieve the proposed target. In considering how to achieve this target, the following opportunities should be considered:
• Substantial increase of Shire organisation and Community roof top solar is required; • Large scale renewable energy installations; • Purchasing natural power; • Battery storage;
0
5,000
10,000
15,000
20,000
25,000
30,000
35,000
40,000
Base Year (06-07) Current (18-19) Target (2030) Target (2050)
Community Emissions (t/CO2) by source
Business Residential Waste Transport
0
20000
40000
60000
80000
100000
120000
Base Year (06-07) Current (18-19) Target (2030) Target (2050)
Community Emissions (t/CO2) Total
147
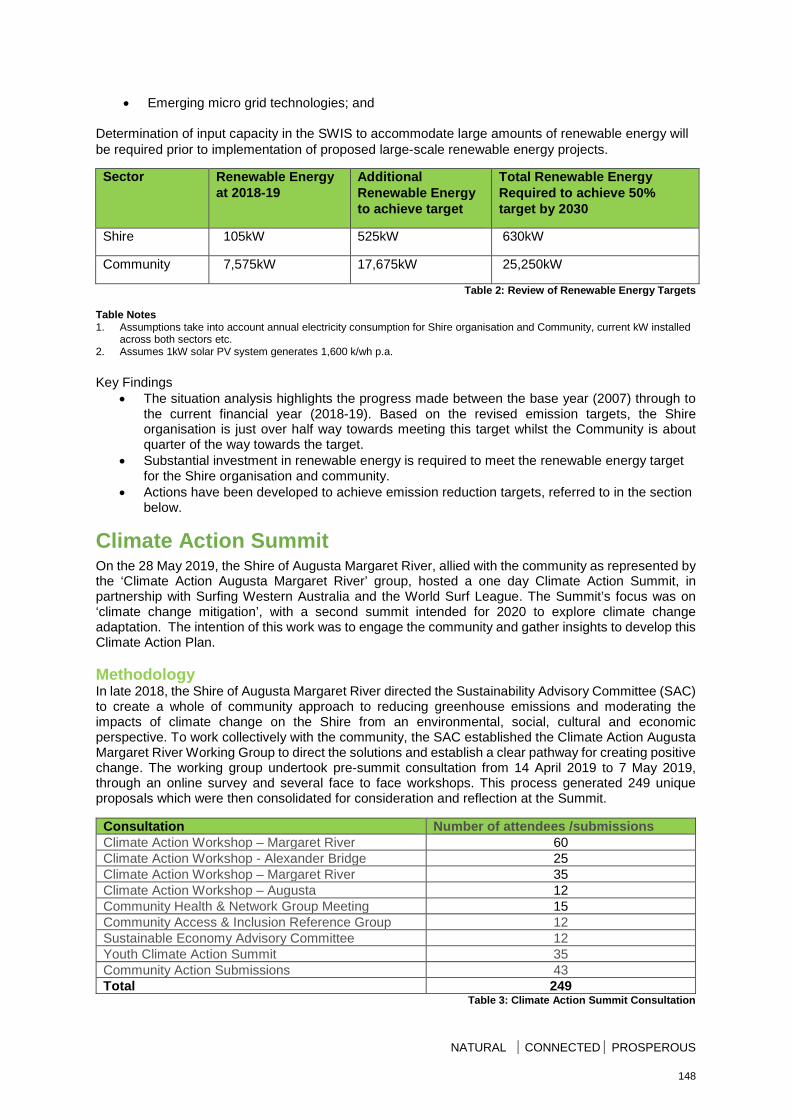
NATURAL CONNECTED PROSPEROUS
• Emerging micro grid technologies; and Determination of input capacity in the SWIS to accommodate large amounts of renewable energy will be required prior to implementation of proposed large-scale renewable energy projects.
Sector Renewable Energy at 2018-19
Additional Renewable Energy to achieve target
Total Renewable Energy Required to achieve 50% target by 2030
Shire 105kW 525kW 630kW
Community 7,575kW 17,675kW 25,250kW
Table 2: Review of Renewable Energy Targets Table Notes 1. Assumptions take into account annual electricity consumption for Shire organisation and Community, current kW installed
across both sectors etc. 2. Assumes 1kW solar PV system generates 1,600 k/wh p.a. Key Findings
• The situation analysis highlights the progress made between the base year (2007) through to the current financial year (2018-19). Based on the revised emission targets, the Shire organisation is just over half way towards meeting this target whilst the Community is about quarter of the way towards the target.
• Substantial investment in renewable energy is required to meet the renewable energy target for the Shire organisation and community.
• Actions have been developed to achieve emission reduction targets, referred to in the section below.
Climate Action Summit On the 28 May 2019, the Shire of Augusta Margaret River, allied with the community as represented by the ‘Climate Action Augusta Margaret River’ group, hosted a one day Climate Action Summit, in partnership with Surfing Western Australia and the World Surf League. The Summit’s focus was on ‘climate change mitigation’, with a second summit intended for 2020 to explore climate change adaptation. The intention of this work was to engage the community and gather insights to develop this Climate Action Plan. Methodology In late 2018, the Shire of Augusta Margaret River directed the Sustainability Advisory Committee (SAC) to create a whole of community approach to reducing greenhouse emissions and moderating the impacts of climate change on the Shire from an environmental, social, cultural and economic perspective. To work collectively with the community, the SAC established the Climate Action Augusta Margaret River Working Group to direct the solutions and establish a clear pathway for creating positive change. The working group undertook pre-summit consultation from 14 April 2019 to 7 May 2019, through an online survey and several face to face workshops. This process generated 249 unique proposals which were then consolidated for consideration and reflection at the Summit.
Consultation Number of attendees /submissions Climate Action Workshop – Margaret River 60 Climate Action Workshop - Alexander Bridge 25 Climate Action Workshop – Margaret River 35 Climate Action Workshop – Augusta 12 Community Health & Network Group Meeting 15 Community Access & Inclusion Reference Group 12 Sustainable Economy Advisory Committee 12 Youth Climate Action Summit 35 Community Action Submissions 43 Total 249
Table 3: Climate Action Summit Consultation
148
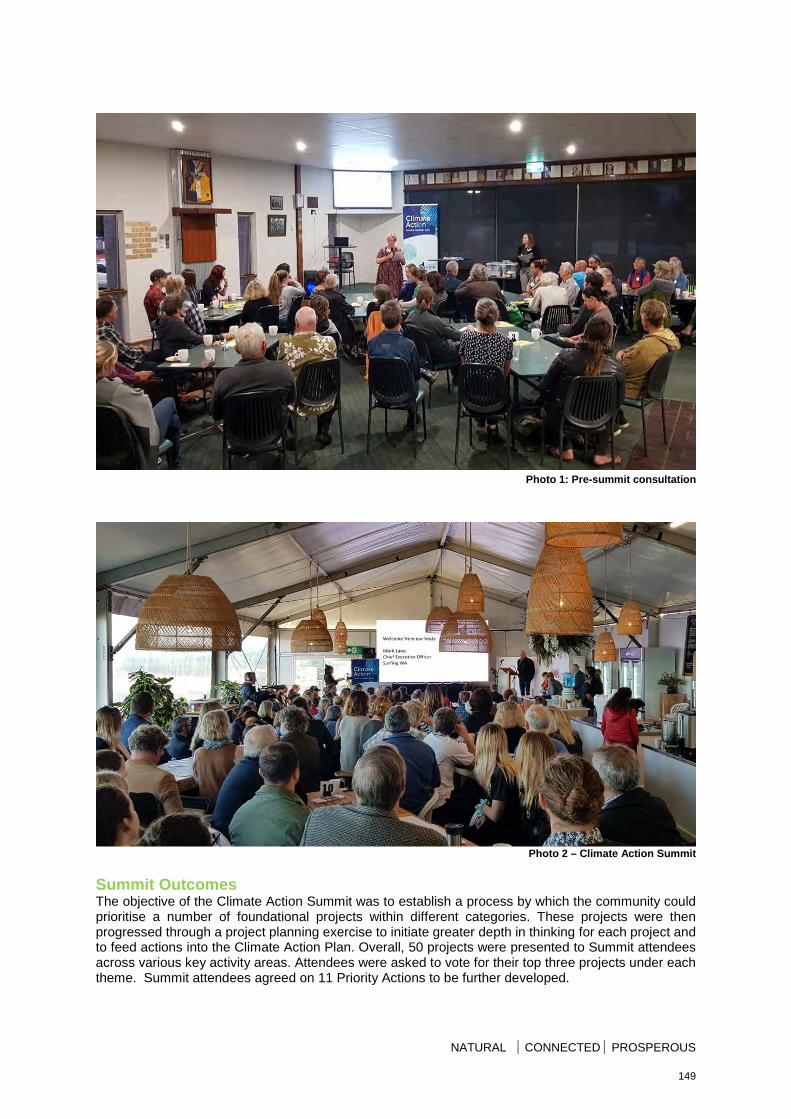
NATURAL CONNECTED PROSPEROUS
Photo 1: Pre-summit consultation
Photo 2 – Climate Action Summit
Summit Outcomes The objective of the Climate Action Summit was to establish a process by which the community could prioritise a number of foundational projects within different categories. These projects were then progressed through a project planning exercise to initiate greater depth in thinking for each project and to feed actions into the Climate Action Plan. Overall, 50 projects were presented to Summit attendees across various key activity areas. Attendees were asked to vote for their top three projects under each theme. Summit attendees agreed on 11 Priority Actions to be further developed.
149

NATURAL CONNECTED PROSPEROUS
Table 3 – Climate Summit Priority Actions
The outcomes of the Summit create the foundation for the Shire and community to confidently move forward with an initial 11 projects to input into the inaugural Climate Action Plan and further progress their implementation in partnership with the community. The nature of the projects requires a range of stakeholders to be involved in further project development including diligence and feasibility, as well as recognising that established businesses; community groups and the Shire are accountable for delivery, whilst concurrently paying an advocacy role in influencing support from State government. A Project Plan was developed for each priority action, and a lead stakeholder assigned to each action. The Shire is responsible for implementing and/or facilitating each one of these projects. The Shire’s role in each of these projects seeks to assist the Community to achieve their emission reduction targets set out in the CAP.
Proposed Actions The process for identifying actions in the CAP is expressed below, and in Figure 9, with the core focus of the next 10 years aimed towards achieving the 2030 emissions reduction target and renewable energy target.
Responding to Targets – Actions have been developed to respond to the proposed targets, specifically the 2030 emission reduction target and 50% uptake of renewables by 2030 for the Shire organisation and Community. The table below highlights the emission offsets and renewable energy requirements by 2030. It also highlights the anticipated offsets that may be achieved through implementation of actions in the key focus areas. Importantly, Table 4 illustrates that it is possible to achieve the proposed targets if the proposed actions are implemented (noting that some assumptions have been made for emission reductions that are not yet realised).
Item Priority Action Stakeholders
1 Assist Augusta Margaret River Clean Community Energy group to develop a major community renewable energy project.
Community/Shire
2 Develop a community renewable energy power sharing system Community/Shire
3 Revegetate riparian zones, buffers, shelter belts, corridors, catchments, parks
Community / Shire
4 Support agricultural transition to regenerative farming Business/Shire
5 Incorporate sustainability planning regulations into the Local Planning Scheme
Shire
6 Develop and promote programs to think local, buy local, swap, share and exchange
Business / Community/Shire
7 Support the development of new, sustainable and local industries Business / Community/Shire 8 Provide low carbon public, tourist and school
transport Support transition to electric vehicles Shire / State Government
9 Support transition to electric vehicles Shire/Business
10. Coordinate, champion and implement the AMR Climate Action Plan
Community
11. Lobby for change at the state and federal political level Community / Shire
150

NATURAL CONNECTED PROSPEROUS
Sector Additional emission reductions required by 2030(t/CO2)
New actions proposed Total emission reductions (t/CO2) by 2030
Renewables (t/CO2)
Energy efficiency (t/CO2)
Other (t/CO2)
Shire organisation
1,037 750
100 200 1,050
Community 52,303 28,300 12,000 12,000 52,300
Table 4: Summary of actions required to achieve 2030 emission reduction target Table Notes 1. 2030 emission target (t/CO2) - refers to tonnes of emissions required to be reduced to achieve this target. This is based on
emissions reductions as at 2018-19 below the 2007 base year, and further emission offset required to achieve 2030 target. 2. Renewable Energy target (t/CO2) – refers to total emissions required to be reduced to achieve 50% target. 3. Renewables (t/CO2) – refers to total emissions that will be reduced by implementing proposed renewable energy actions. 4. Energy efficiency (t/CO2) – total emissions that will be reduced by implementing proposed energy efficiency actions. 5. Renewables (t/CO2) - total emissions that will be reduced by implementing proposed carbon offset actions. 6. Total reductions (t/CO2) – identifies total emissions reduction from implementing all actions = 2030 target achieved. Sector Current RE
(2018-19) Additional RE requirements by 2030 (kW)
Proposed additional small scale RE (kW)
Proposed additional large scale RE (kW)
Total RE anticipated (kW)
Shire organisation
105 525 130 50 500 630
Community
7,575 17,675 11,400 12,000 30,975
Table 5: Summary of actions required to achieve 2030 renewable energy target Table Notes 1. Renewable energy (RE) requirements by 2030 (kW) - refers to the total size of renewable energy system (kW) required to
achieve 2030 target. This is based on 2030 requirements minus current renewable energy as at 2018-19 (see Table 2) 2. Small-scale renewables (kW) – refers to solar PV systems on either Shire buildings or residential/commercial businesses
proposed in the Energy Conservation section. 3. Large-scale renewables (kW) – refers to large-scale renewable energy systems proposed in the Energy Conservation
section. 4. Total Renewables (kW) – Renewable energy requirements by 2030. Reviewing Actions – through the following means:
• A review of LEAP actions • Incorporating the11 Priority Actions from the Climate Action Summit. Priority Actions stemming
from the Climate Action Summit have been developed into detailed Project Plans 1 -11, forming Appendix 1 of the CAP, and incorporated into each of the key focus areas.
• Internal consultation with staff and planned broader consultation with the community. Defining Actions – actions are addressed under four key focus areas as follows:
• Policy & Education • Energy Conservation • Sustainable Transport • Waste Reduction
Implementation of Actions – the proposed actions outline a timeframe and responsibility for implementation of the 2030 target. The proposed actions identify requirements to achieve the 2030 target. Further review of the document will focus on actions required to achieve the 2050 target. Achievement of target – An annual review of carbon emissions will be undertaken to track progress towards achieving adopted targets.
151
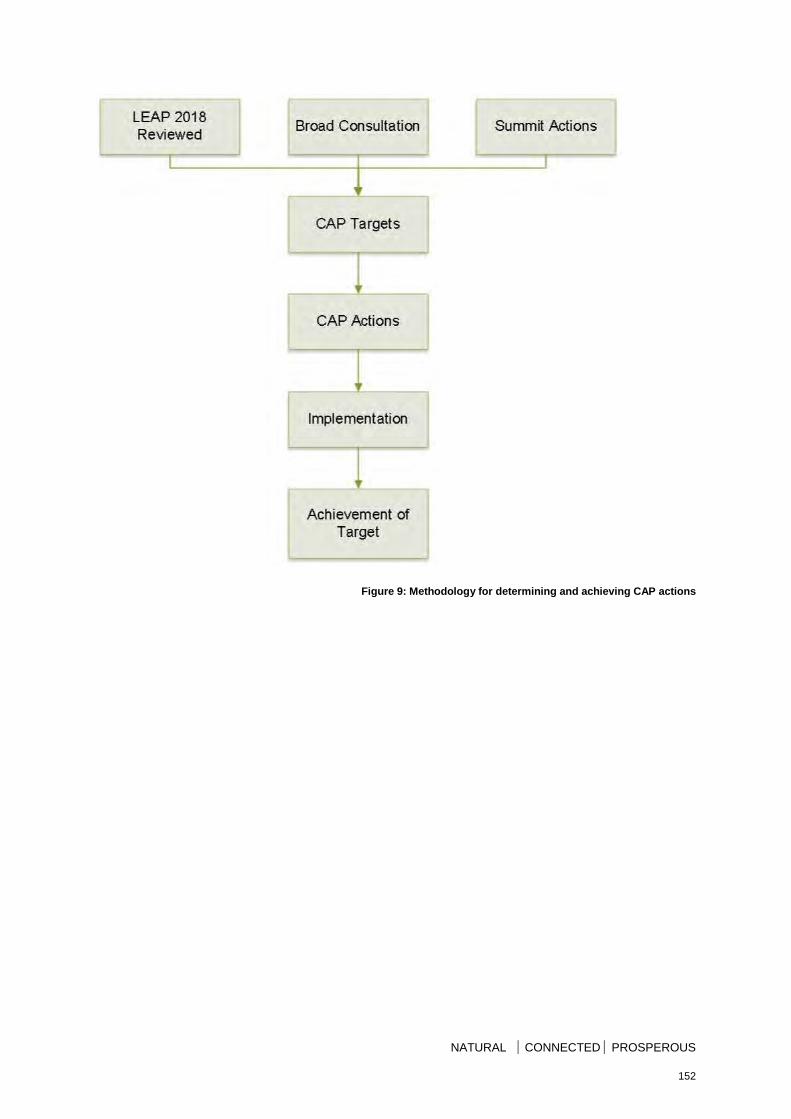
NATURAL CONNECTED PROSPEROUS
Figure 9: Methodology for determining and achieving CAP actions
152
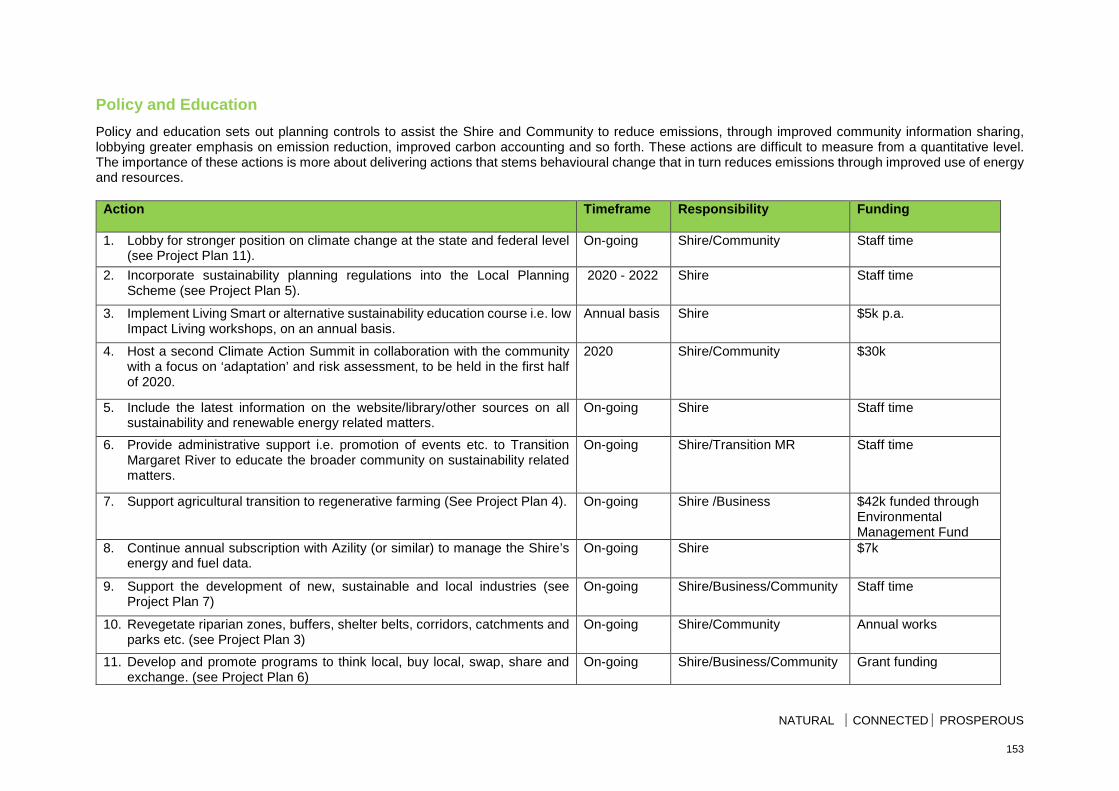
NATURAL CONNECTED PROSPEROUS
Policy and Education
Policy and education sets out planning controls to assist the Shire and Community to reduce emissions, through improved community information sharing, lobbying greater emphasis on emission reduction, improved carbon accounting and so forth. These actions are difficult to measure from a quantitative level. The importance of these actions is more about delivering actions that stems behavioural change that in turn reduces emissions through improved use of energy and resources.
Action
Timeframe Responsibility Funding
1. Lobby for stronger position on climate change at the state and federal level (see Project Plan 11).
On-going Shire/Community Staff time
2. Incorporate sustainability planning regulations into the Local Planning Scheme (see Project Plan 5).
2020 - 2022 Shire Staff time
3. Implement Living Smart or alternative sustainability education course i.e. low Impact Living workshops, on an annual basis.
Annual basis Shire $5k p.a.
4. Host a second Climate Action Summit in collaboration with the community with a focus on ‘adaptation’ and risk assessment, to be held in the first half of 2020.
2020 Shire/Community $30k
5. Include the latest information on the website/library/other sources on all sustainability and renewable energy related matters.
On-going Shire Staff time
6. Provide administrative support i.e. promotion of events etc. to Transition Margaret River to educate the broader community on sustainability related matters.
On-going Shire/Transition MR Staff time
7. Support agricultural transition to regenerative farming (See Project Plan 4). On-going Shire /Business $42k funded through Environmental Management Fund
8. Continue annual subscription with Azility (or similar) to manage the Shire’s energy and fuel data.
On-going Shire $7k
9. Support the development of new, sustainable and local industries (see Project Plan 7)
On-going Shire/Business/Community Staff time
10. Revegetate riparian zones, buffers, shelter belts, corridors, catchments and parks etc. (see Project Plan 3)
On-going Shire/Community Annual works
11. Develop and promote programs to think local, buy local, swap, share and exchange. (see Project Plan 6)
On-going Shire/Business/Community Grant funding
153
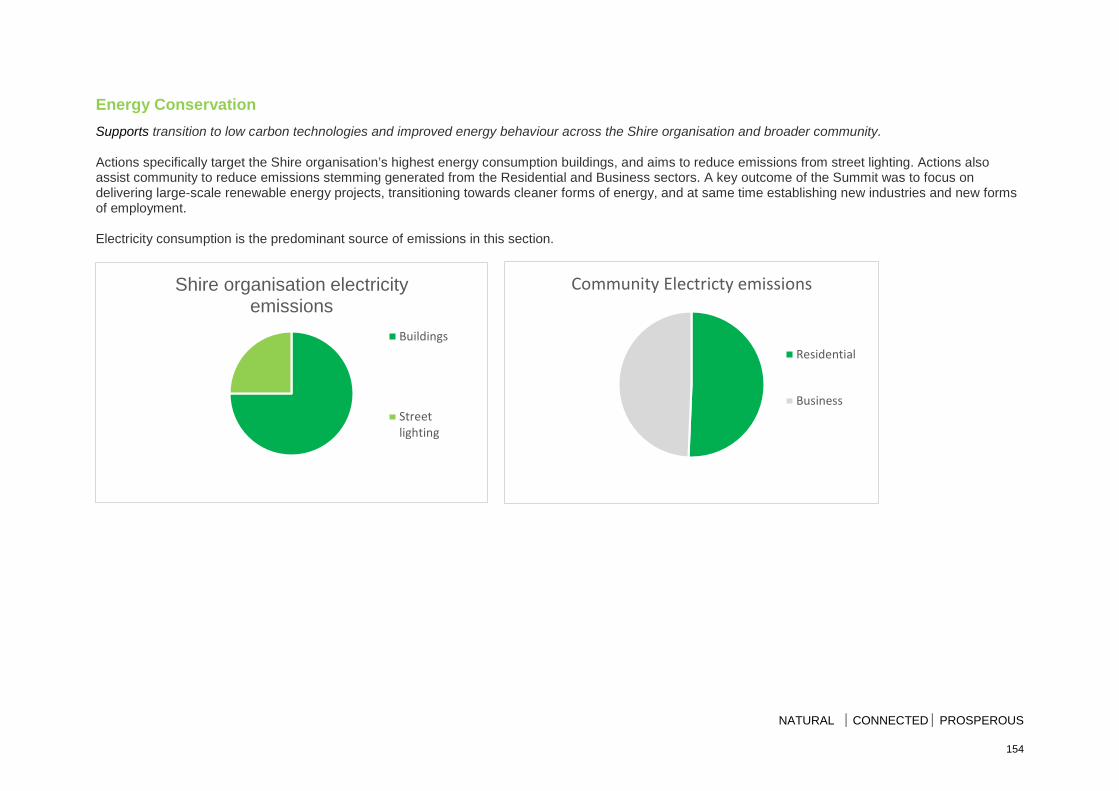
NATURAL CONNECTED PROSPEROUS
Energy Conservation Supports transition to low carbon technologies and improved energy behaviour across the Shire organisation and broader community. Actions specifically target the Shire organisation’s highest energy consumption buildings, and aims to reduce emissions from street lighting. Actions also assist community to reduce emissions stemming generated from the Residential and Business sectors. A key outcome of the Summit was to focus on delivering large-scale renewable energy projects, transitioning towards cleaner forms of energy, and at same time establishing new industries and new forms of employment. Electricity consumption is the predominant source of emissions in this section.
Shire organisation electricity emissions
Buildings
Streetlighting
Community Electricty emissions
Residential
Business
154
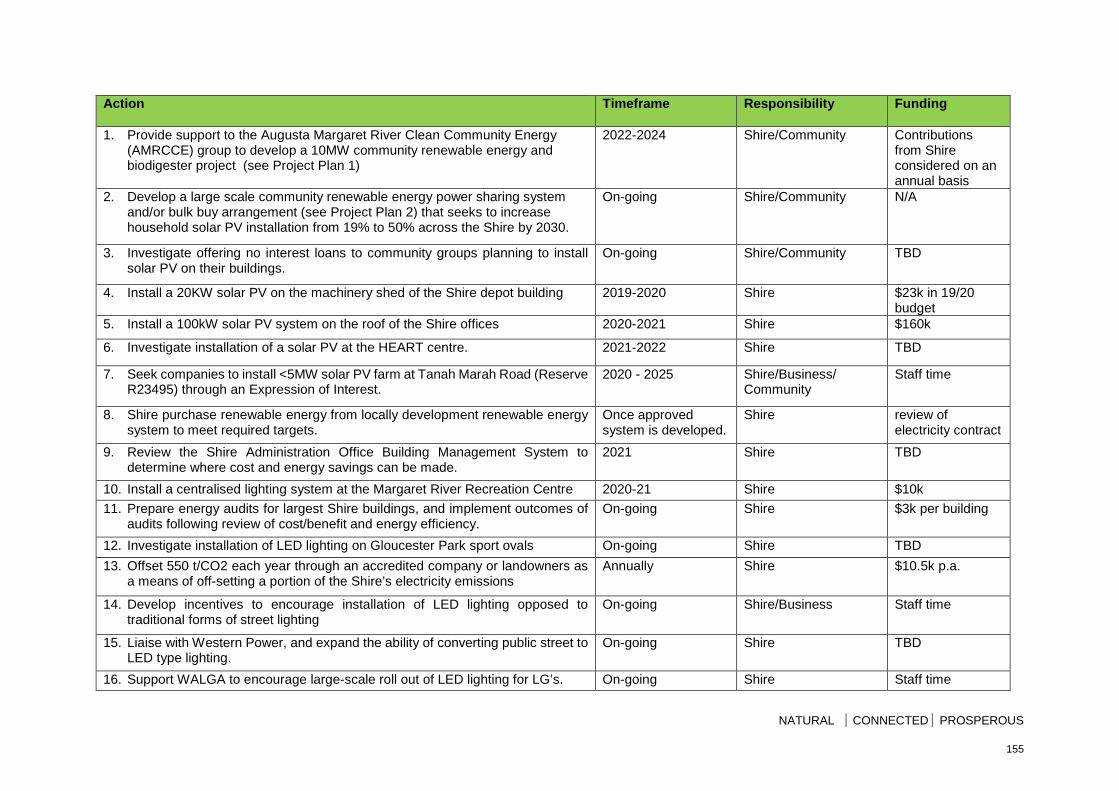
NATURAL CONNECTED PROSPEROUS
Action Timeframe Responsibility Funding
1. Provide support to the Augusta Margaret River Clean Community Energy (AMRCCE) group to develop a 10MW community renewable energy and biodigester project (see Project Plan 1)
2022-2024 Shire/Community Contributions from Shire considered on an annual basis
2. Develop a large scale community renewable energy power sharing system and/or bulk buy arrangement (see Project Plan 2) that seeks to increase household solar PV installation from 19% to 50% across the Shire by 2030.
On-going Shire/Community N/A
3. Investigate offering no interest loans to community groups planning to install solar PV on their buildings.
On-going Shire/Community TBD
4. Install a 20KW solar PV on the machinery shed of the Shire depot building 2019-2020 Shire $23k in 19/20 budget
5. Install a 100kW solar PV system on the roof of the Shire offices 2020-2021 Shire $160k
6. Investigate installation of a solar PV at the HEART centre. 2021-2022 Shire TBD
7. Seek companies to install <5MW solar PV farm at Tanah Marah Road (Reserve R23495) through an Expression of Interest.
2020 - 2025 Shire/Business/ Community
Staff time
8. Shire purchase renewable energy from locally development renewable energy system to meet required targets.
Once approved system is developed.
Shire review of electricity contract
9. Review the Shire Administration Office Building Management System to determine where cost and energy savings can be made.
2021 Shire TBD
10. Install a centralised lighting system at the Margaret River Recreation Centre 2020-21 Shire $10k 11. Prepare energy audits for largest Shire buildings, and implement outcomes of
audits following review of cost/benefit and energy efficiency. On-going Shire $3k per building
12. Investigate installation of LED lighting on Gloucester Park sport ovals On-going Shire TBD 13. Offset 550 t/CO2 each year through an accredited company or landowners as
a means of off-setting a portion of the Shire’s electricity emissions Annually Shire $10.5k p.a.
14. Develop incentives to encourage installation of LED lighting opposed to traditional forms of street lighting
On-going Shire/Business Staff time
15. Liaise with Western Power, and expand the ability of converting public street to LED type lighting.
On-going Shire TBD
16. Support WALGA to encourage large-scale roll out of LED lighting for LG’s. On-going Shire Staff time
155
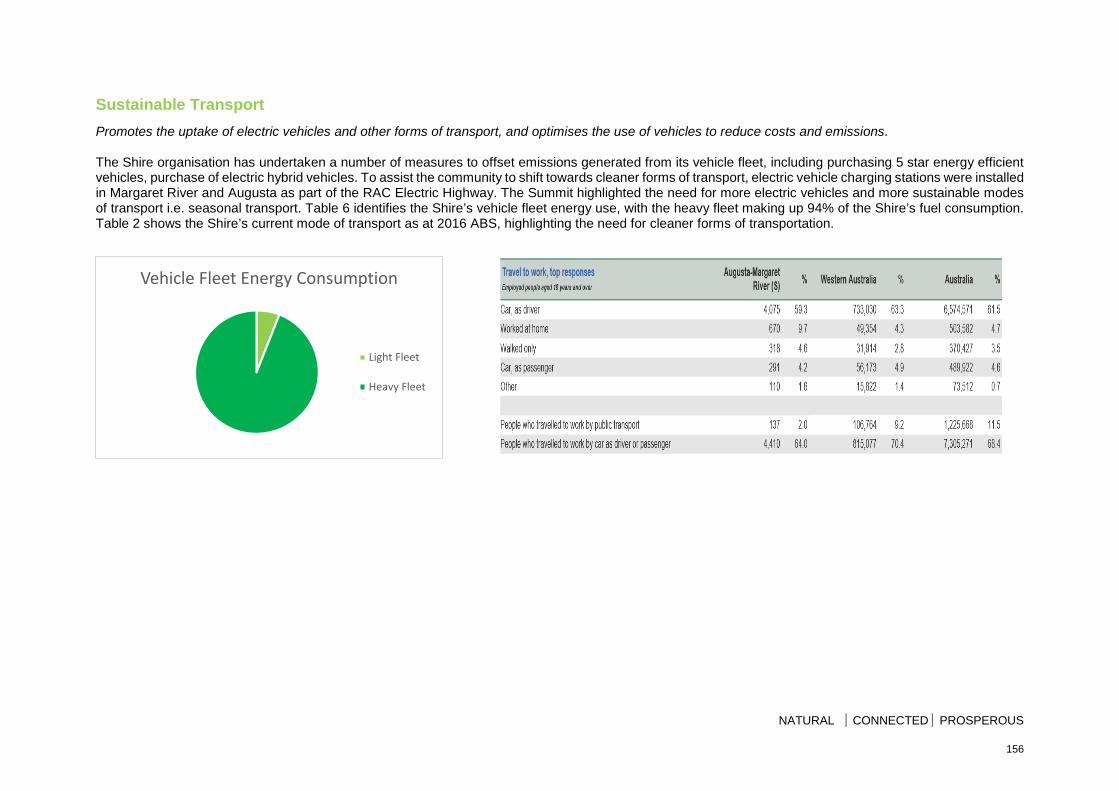
NATURAL CONNECTED PROSPEROUS
Sustainable Transport Promotes the uptake of electric vehicles and other forms of transport, and optimises the use of vehicles to reduce costs and emissions. The Shire organisation has undertaken a number of measures to offset emissions generated from its vehicle fleet, including purchasing 5 star energy efficient vehicles, purchase of electric hybrid vehicles. To assist the community to shift towards cleaner forms of transport, electric vehicle charging stations were installed in Margaret River and Augusta as part of the RAC Electric Highway. The Summit highlighted the need for more electric vehicles and more sustainable modes of transport i.e. seasonal transport. Table 6 identifies the Shire’s vehicle fleet energy use, with the heavy fleet making up 94% of the Shire’s fuel consumption. Table 2 shows the Shire’s current mode of transport as at 2016 ABS, highlighting the need for cleaner forms of transportation.
Vehicle Fleet Energy Consumption
Light Fleet
Heavy Fleet
156
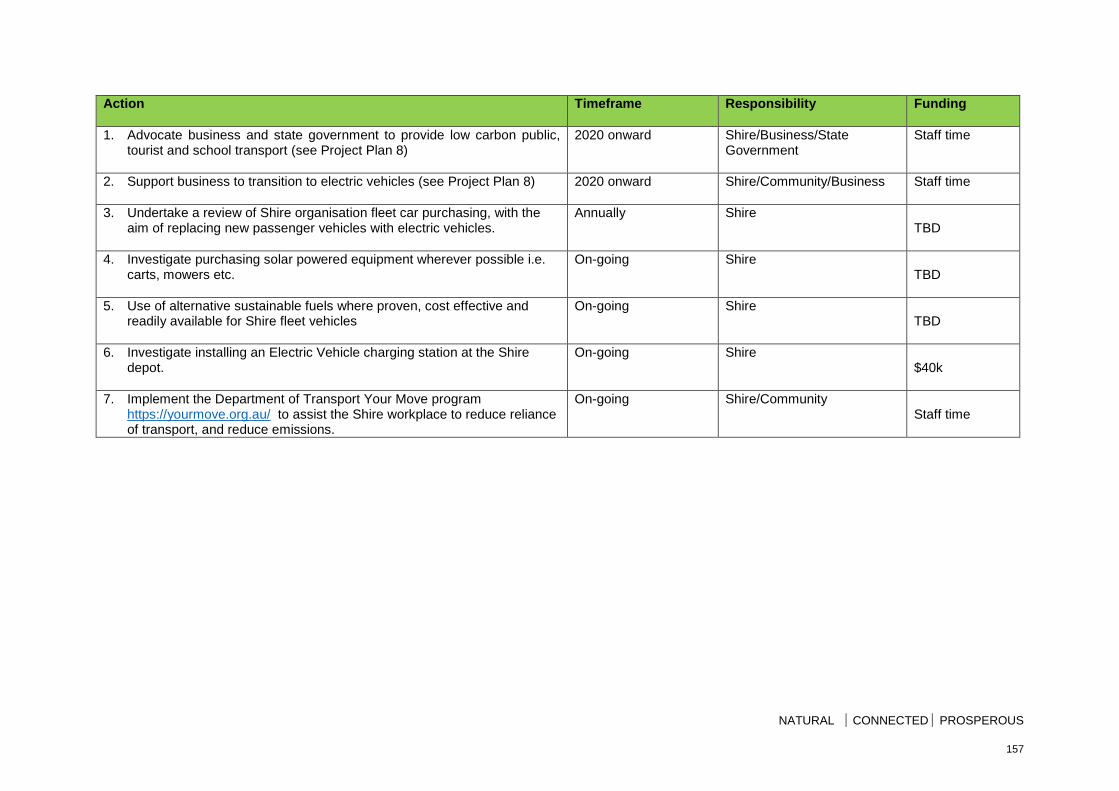
NATURAL CONNECTED PROSPEROUS
Action Timeframe Responsibility Funding
1. Advocate business and state government to provide low carbon public, tourist and school transport (see Project Plan 8)
2020 onward Shire/Business/State Government
Staff time
2. Support business to transition to electric vehicles (see Project Plan 8)
2020 onward Shire/Community/Business Staff time
3. Undertake a review of Shire organisation fleet car purchasing, with the aim of replacing new passenger vehicles with electric vehicles.
Annually Shire TBD
4. Investigate purchasing solar powered equipment wherever possible i.e. carts, mowers etc.
On-going Shire TBD
5. Use of alternative sustainable fuels where proven, cost effective and readily available for Shire fleet vehicles
On-going Shire TBD
6. Investigate installing an Electric Vehicle charging station at the Shire depot.
On-going Shire $40k
7. Implement the Department of Transport Your Move program https://yourmove.org.au/ to assist the Shire workplace to reduce reliance of transport, and reduce emissions.
On-going Shire/Community Staff time
157
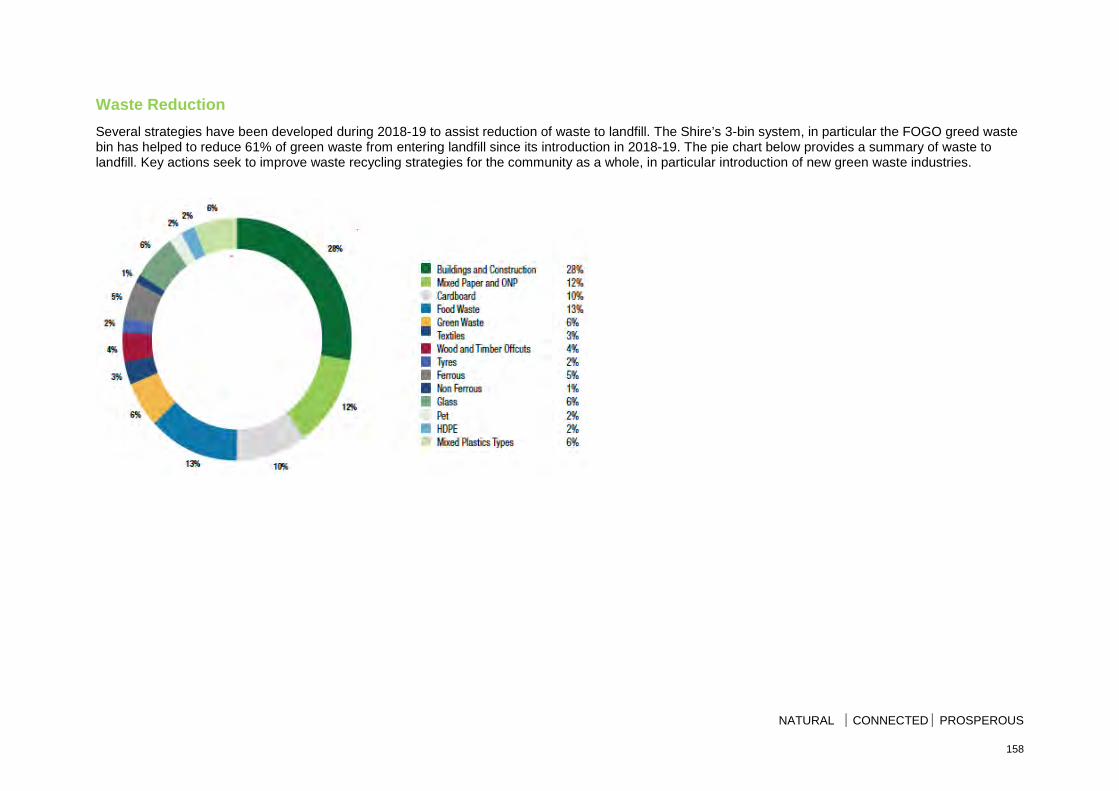
NATURAL CONNECTED PROSPEROUS
Waste Reduction Several strategies have been developed during 2018-19 to assist reduction of waste to landfill. The Shire’s 3-bin system, in particular the FOGO greed waste bin has helped to reduce 61% of green waste from entering landfill since its introduction in 2018-19. The pie chart below provides a summary of waste to landfill. Key actions seek to improve waste recycling strategies for the community as a whole, in particular introduction of new green waste industries.
158
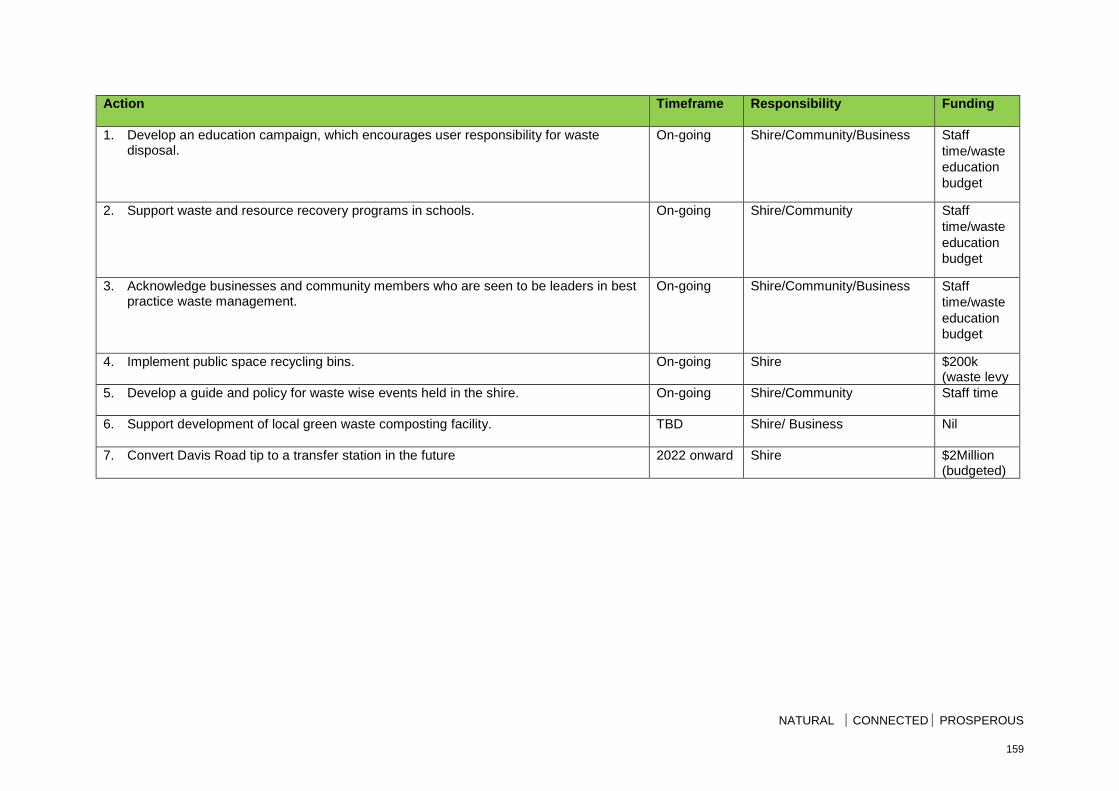
NATURAL CONNECTED PROSPEROUS
Action Timeframe Responsibility Funding
1. Develop an education campaign, which encourages user responsibility for waste disposal.
On-going Shire/Community/Business Staff time/waste education budget
2. Support waste and resource recovery programs in schools.
On-going Shire/Community Staff time/waste education budget
3. Acknowledge businesses and community members who are seen to be leaders in best practice waste management.
On-going Shire/Community/Business Staff time/waste education budget
4. Implement public space recycling bins.
On-going Shire $200k (waste levy
5. Develop a guide and policy for waste wise events held in the shire.
On-going Shire/Community Staff time
6. Support development of local green waste composting facility.
TBD Shire/ Business Nil
7. Convert Davis Road tip to a transfer station in the future
2022 onward Shire $2Million (budgeted)
159
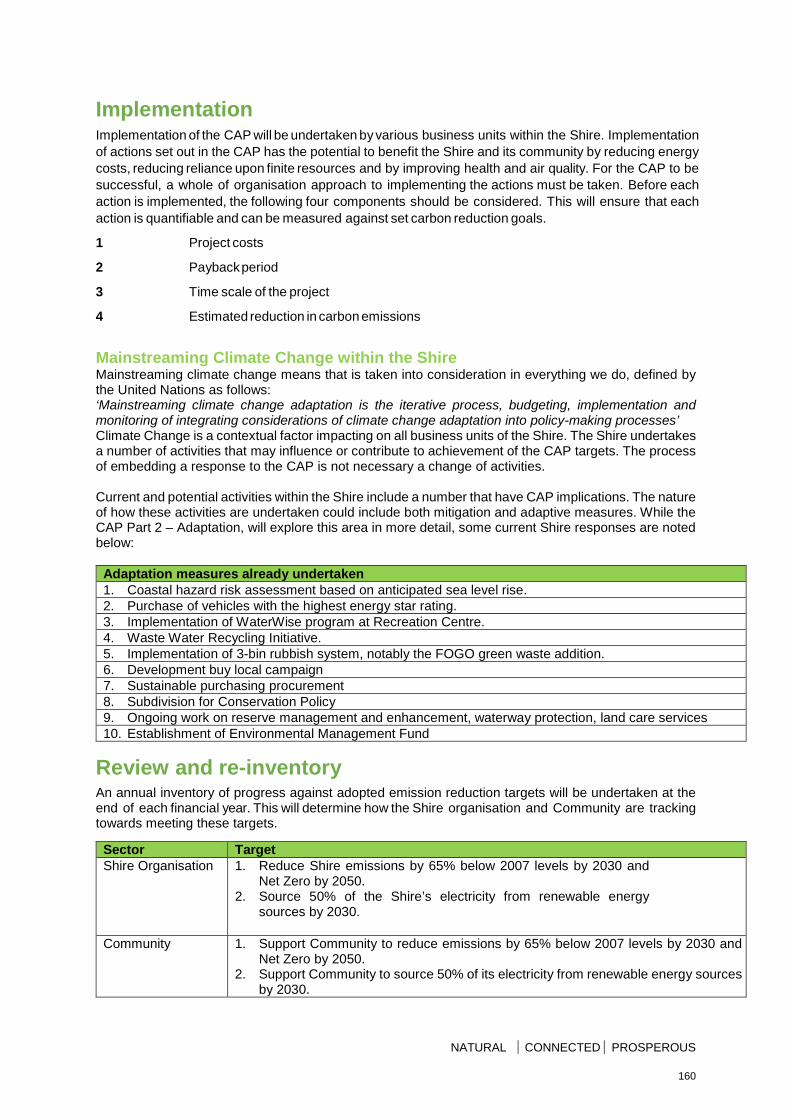
NATURAL CONNECTED PROSPEROUS
Implementation Implementation of the CAP will be undertaken by various business units within the Shire. Implementation of actions set out in the CAP has the potential to benefit the Shire and its community by reducing energy costs, reducing reliance upon finite resources and by improving health and air quality. For the CAP to be successful, a whole of organisation approach to implementing the actions must be taken. Before each action is implemented, the following four components should be considered. This will ensure that each action is quantifiable and can be measured against set carbon reduction goals.
1 Project costs
2 Payback period
3 Time scale of the project
4 Estimated reduction in carbon emissions
Mainstreaming Climate Change within the Shire Mainstreaming climate change means that is taken into consideration in everything we do, defined by the United Nations as follows: ‘Mainstreaming climate change adaptation is the iterative process, budgeting, implementation and monitoring of integrating considerations of climate change adaptation into policy-making processes’ Climate Change is a contextual factor impacting on all business units of the Shire. The Shire undertakes a number of activities that may influence or contribute to achievement of the CAP targets. The process of embedding a response to the CAP is not necessary a change of activities. Current and potential activities within the Shire include a number that have CAP implications. The nature of how these activities are undertaken could include both mitigation and adaptive measures. While the CAP Part 2 – Adaptation, will explore this area in more detail, some current Shire responses are noted below:
Adaptation measures already undertaken 1. Coastal hazard risk assessment based on anticipated sea level rise. 2. Purchase of vehicles with the highest energy star rating. 3. Implementation of WaterWise program at Recreation Centre. 4. Waste Water Recycling Initiative. 5. Implementation of 3-bin rubbish system, notably the FOGO green waste addition. 6. Development buy local campaign 7. Sustainable purchasing procurement 8. Subdivision for Conservation Policy 9. Ongoing work on reserve management and enhancement, waterway protection, land care services 10. Establishment of Environmental Management Fund
Review and re-inventory An annual inventory of progress against adopted emission reduction targets will be undertaken at the end of each financial year. This will determine how the Shire organisation and Community are tracking towards meeting these targets.
Sector Target Shire Organisation 1. Reduce Shire emissions by 65% below 2007 levels by 2030 and
Net Zero by 2050. 2. Source 50% of the Shire’s electricity from renewable energy
sources by 2030.
Community 1. Support Community to reduce emissions by 65% below 2007 levels by 2030 and Net Zero by 2050.
2. Support Community to source 50% of its electricity from renewable energy sources by 2030.
160

NATURAL CONNECTED PROSPEROUS
Appendix 1
Project Plans 1 - 11 from Climate Action Summit
161
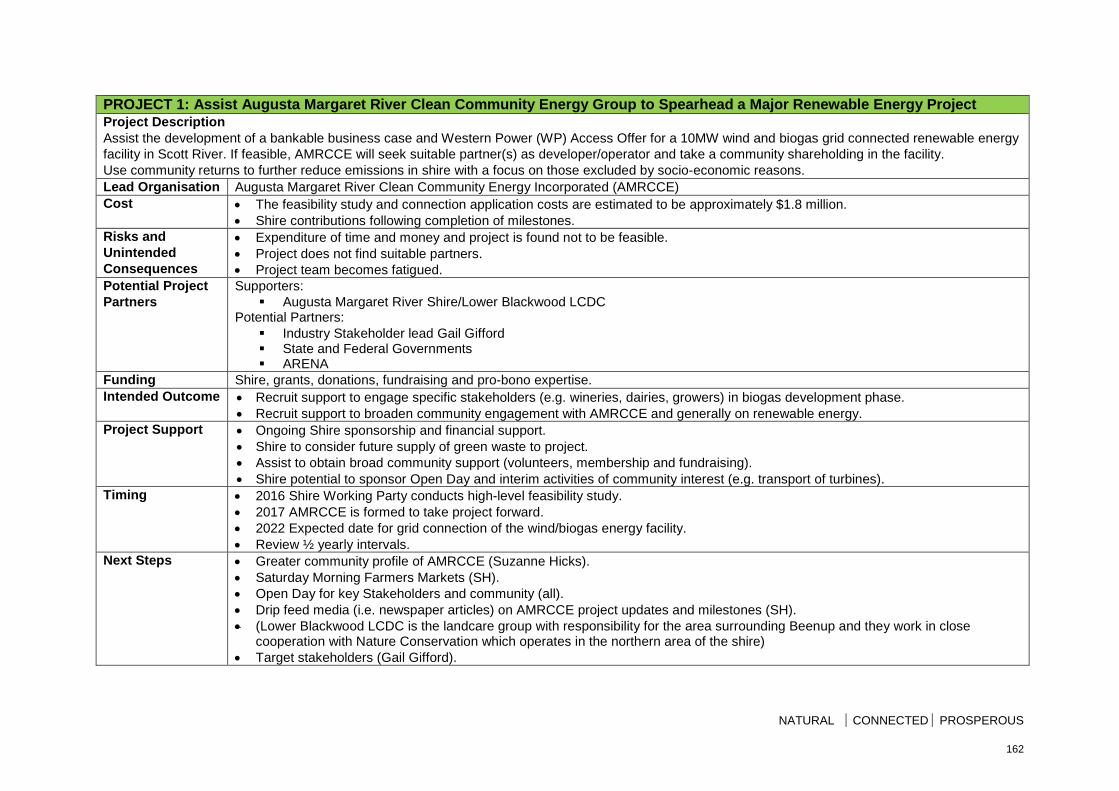
NATURAL CONNECTED PROSPEROUS
PROJECT 1: Assist Augusta Margaret River Clean Community Energy Group to Spearhead a Major Renewable Energy Project Project Description Assist the development of a bankable business case and Western Power (WP) Access Offer for a 10MW wind and biogas grid connected renewable energy facility in Scott River. If feasible, AMRCCE will seek suitable partner(s) as developer/operator and take a community shareholding in the facility. Use community returns to further reduce emissions in shire with a focus on those excluded by socio-economic reasons. Lead Organisation Augusta Margaret River Clean Community Energy Incorporated (AMRCCE) Cost • The feasibility study and connection application costs are estimated to be approximately $1.8 million.
• Shire contributions following completion of milestones. Risks and Unintended Consequences
• Expenditure of time and money and project is found not to be feasible. • Project does not find suitable partners. • Project team becomes fatigued.
Potential Project Partners
Supporters: Augusta Margaret River Shire/Lower Blackwood LCDC
Potential Partners: Industry Stakeholder lead Gail Gifford State and Federal Governments ARENA
Funding Shire, grants, donations, fundraising and pro-bono expertise. Intended Outcome • Recruit support to engage specific stakeholders (e.g. wineries, dairies, growers) in biogas development phase.
• Recruit support to broaden community engagement with AMRCCE and generally on renewable energy. Project Support • Ongoing Shire sponsorship and financial support.
• Shire to consider future supply of green waste to project. • Assist to obtain broad community support (volunteers, membership and fundraising). • Shire potential to sponsor Open Day and interim activities of community interest (e.g. transport of turbines).
Timing • 2016 Shire Working Party conducts high-level feasibility study. • 2017 AMRCCE is formed to take project forward. • 2022 Expected date for grid connection of the wind/biogas energy facility. • Review ½ yearly intervals.
Next Steps • Greater community profile of AMRCCE (Suzanne Hicks). • Saturday Morning Farmers Markets (SH). • Open Day for key Stakeholders and community (all). • Drip feed media (i.e. newspaper articles) on AMRCCE project updates and milestones (SH). • (Lower Blackwood LCDC is the landcare group with responsibility for the area surrounding Beenup and they work in close
cooperation with Nature Conservation which operates in the northern area of the shire) • Target stakeholders (Gail Gifford).
162
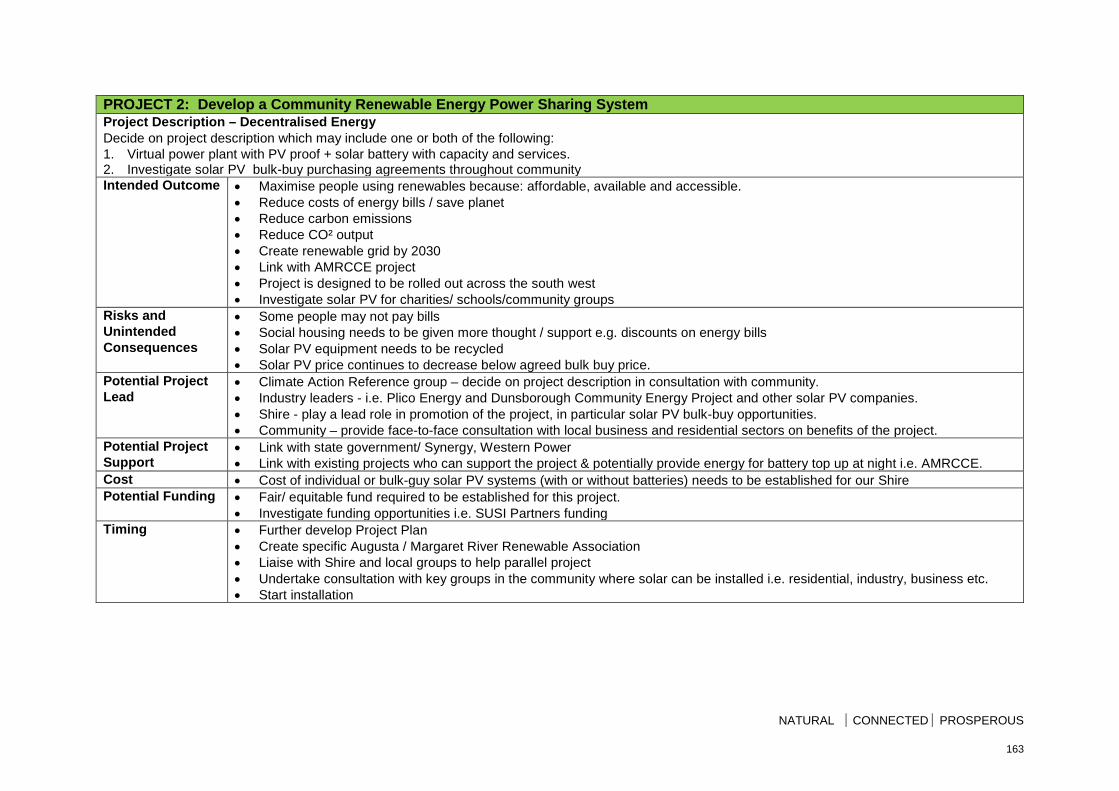
NATURAL CONNECTED PROSPEROUS
PROJECT 2: Develop a Community Renewable Energy Power Sharing System Project Description – Decentralised Energy Decide on project description which may include one or both of the following: 1. Virtual power plant with PV proof + solar battery with capacity and services. 2. Investigate solar PV bulk-buy purchasing agreements throughout community Intended Outcome • Maximise people using renewables because: affordable, available and accessible.
• Reduce costs of energy bills / save planet • Reduce carbon emissions • Reduce CO² output • Create renewable grid by 2030 • Link with AMRCCE project • Project is designed to be rolled out across the south west • Investigate solar PV for charities/ schools/community groups
Risks and Unintended Consequences
• Some people may not pay bills • Social housing needs to be given more thought / support e.g. discounts on energy bills • Solar PV equipment needs to be recycled • Solar PV price continues to decrease below agreed bulk buy price.
Potential Project Lead
• Climate Action Reference group – decide on project description in consultation with community. • Industry leaders - i.e. Plico Energy and Dunsborough Community Energy Project and other solar PV companies. • Shire - play a lead role in promotion of the project, in particular solar PV bulk-buy opportunities. • Community – provide face-to-face consultation with local business and residential sectors on benefits of the project.
Potential Project Support
• Link with state government/ Synergy, Western Power • Link with existing projects who can support the project & potentially provide energy for battery top up at night i.e. AMRCCE.
Cost • Cost of individual or bulk-guy solar PV systems (with or without batteries) needs to be established for our Shire Potential Funding • Fair/ equitable fund required to be established for this project.
• Investigate funding opportunities i.e. SUSI Partners funding Timing • Further develop Project Plan
• Create specific Augusta / Margaret River Renewable Association • Liaise with Shire and local groups to help parallel project • Undertake consultation with key groups in the community where solar can be installed i.e. residential, industry, business etc. • Start installation
163
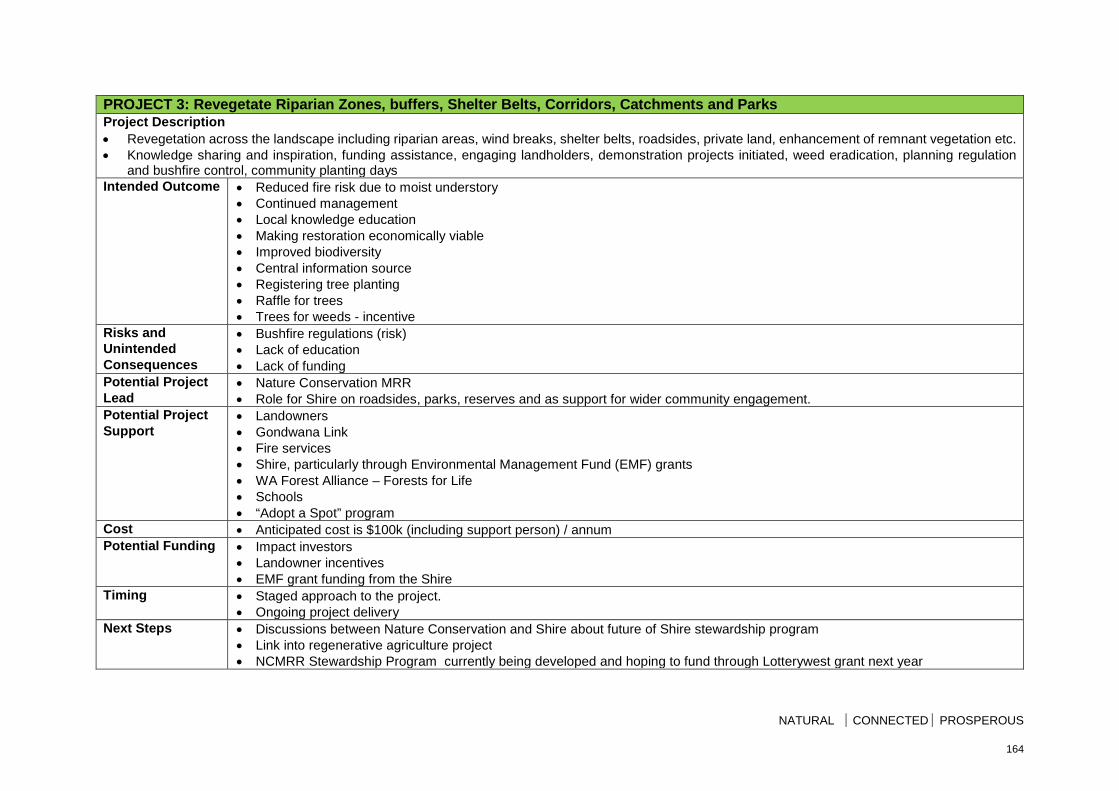
NATURAL CONNECTED PROSPEROUS
PROJECT 3: Revegetate Riparian Zones, buffers, Shelter Belts, Corridors, Catchments and Parks Project Description • Revegetation across the landscape including riparian areas, wind breaks, shelter belts, roadsides, private land, enhancement of remnant vegetation etc. • Knowledge sharing and inspiration, funding assistance, engaging landholders, demonstration projects initiated, weed eradication, planning regulation
and bushfire control, community planting days Intended Outcome • Reduced fire risk due to moist understory
• Continued management • Local knowledge education • Making restoration economically viable • Improved biodiversity • Central information source • Registering tree planting • Raffle for trees • Trees for weeds - incentive
Risks and Unintended Consequences
• Bushfire regulations (risk) • Lack of education • Lack of funding
Potential Project Lead
• Nature Conservation MRR • Role for Shire on roadsides, parks, reserves and as support for wider community engagement.
Potential Project Support
• Landowners • Gondwana Link • Fire services • Shire, particularly through Environmental Management Fund (EMF) grants • WA Forest Alliance – Forests for Life • Schools • “Adopt a Spot” program
Cost • Anticipated cost is $100k (including support person) / annum Potential Funding • Impact investors
• Landowner incentives • EMF grant funding from the Shire
Timing • Staged approach to the project. • Ongoing project delivery
Next Steps • Discussions between Nature Conservation and Shire about future of Shire stewardship program • Link into regenerative agriculture project • NCMRR Stewardship Program currently being developed and hoping to fund through Lotterywest grant next year
164
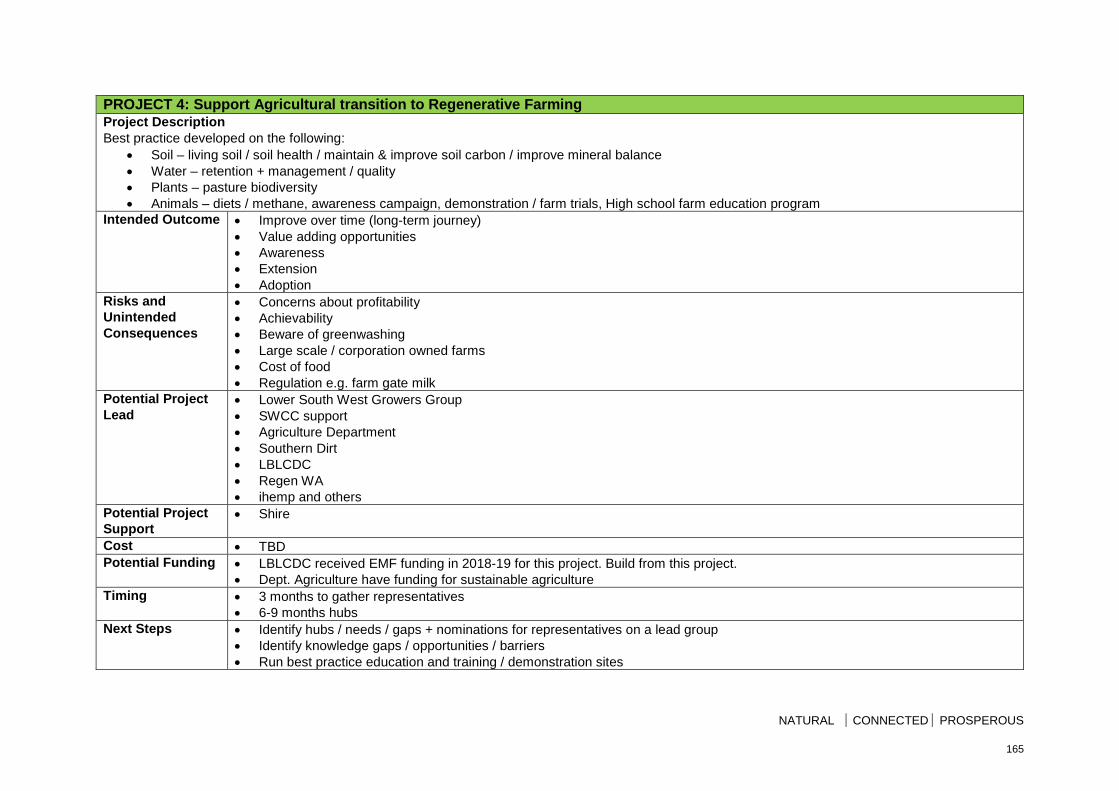
NATURAL CONNECTED PROSPEROUS
PROJECT 4: Support Agricultural transition to Regenerative Farming Project Description Best practice developed on the following:
• Soil – living soil / soil health / maintain & improve soil carbon / improve mineral balance • Water – retention + management / quality • Plants – pasture biodiversity • Animals – diets / methane, awareness campaign, demonstration / farm trials, High school farm education program
Intended Outcome • Improve over time (long-term journey) • Value adding opportunities • Awareness • Extension • Adoption
Risks and Unintended Consequences
• Concerns about profitability • Achievability • Beware of greenwashing • Large scale / corporation owned farms • Cost of food • Regulation e.g. farm gate milk
Potential Project Lead
• Lower South West Growers Group • SWCC support • Agriculture Department • Southern Dirt • LBLCDC • Regen WA • ihemp and others
Potential Project Support
• Shire
Cost • TBD Potential Funding • LBLCDC received EMF funding in 2018-19 for this project. Build from this project.
• Dept. Agriculture have funding for sustainable agriculture Timing • 3 months to gather representatives
• 6-9 months hubs Next Steps • Identify hubs / needs / gaps + nominations for representatives on a lead group
• Identify knowledge gaps / opportunities / barriers • Run best practice education and training / demonstration sites
165
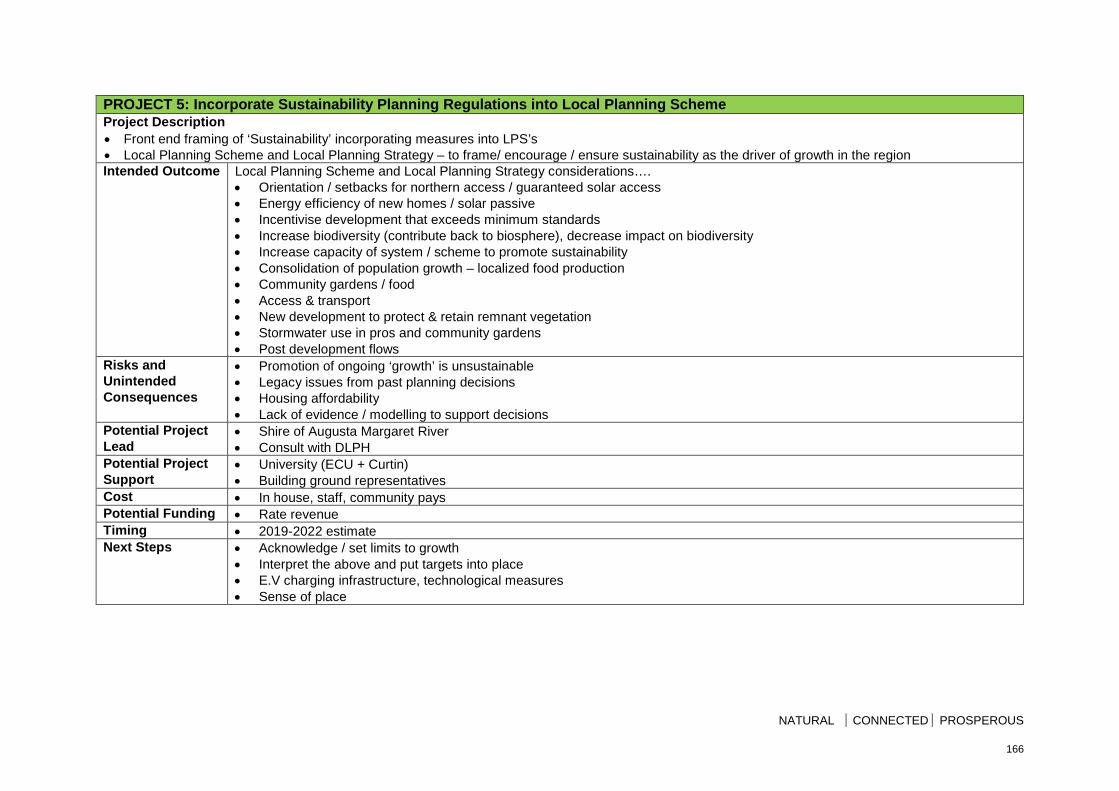
NATURAL CONNECTED PROSPEROUS
PROJECT 5: Incorporate Sustainability Planning Regulations into Local Planning Scheme Project Description • Front end framing of ‘Sustainability’ incorporating measures into LPS’s • Local Planning Scheme and Local Planning Strategy – to frame/ encourage / ensure sustainability as the driver of growth in the region Intended Outcome Local Planning Scheme and Local Planning Strategy considerations….
• Orientation / setbacks for northern access / guaranteed solar access • Energy efficiency of new homes / solar passive • Incentivise development that exceeds minimum standards • Increase biodiversity (contribute back to biosphere), decrease impact on biodiversity • Increase capacity of system / scheme to promote sustainability • Consolidation of population growth – localized food production • Community gardens / food • Access & transport • New development to protect & retain remnant vegetation • Stormwater use in pros and community gardens • Post development flows
Risks and Unintended Consequences
• Promotion of ongoing ‘growth’ is unsustainable • Legacy issues from past planning decisions • Housing affordability • Lack of evidence / modelling to support decisions
Potential Project Lead
• Shire of Augusta Margaret River • Consult with DLPH
Potential Project Support
• University (ECU + Curtin) • Building ground representatives
Cost • In house, staff, community pays Potential Funding • Rate revenue Timing • 2019-2022 estimate Next Steps • Acknowledge / set limits to growth
• Interpret the above and put targets into place • E.V charging infrastructure, technological measures • Sense of place
166
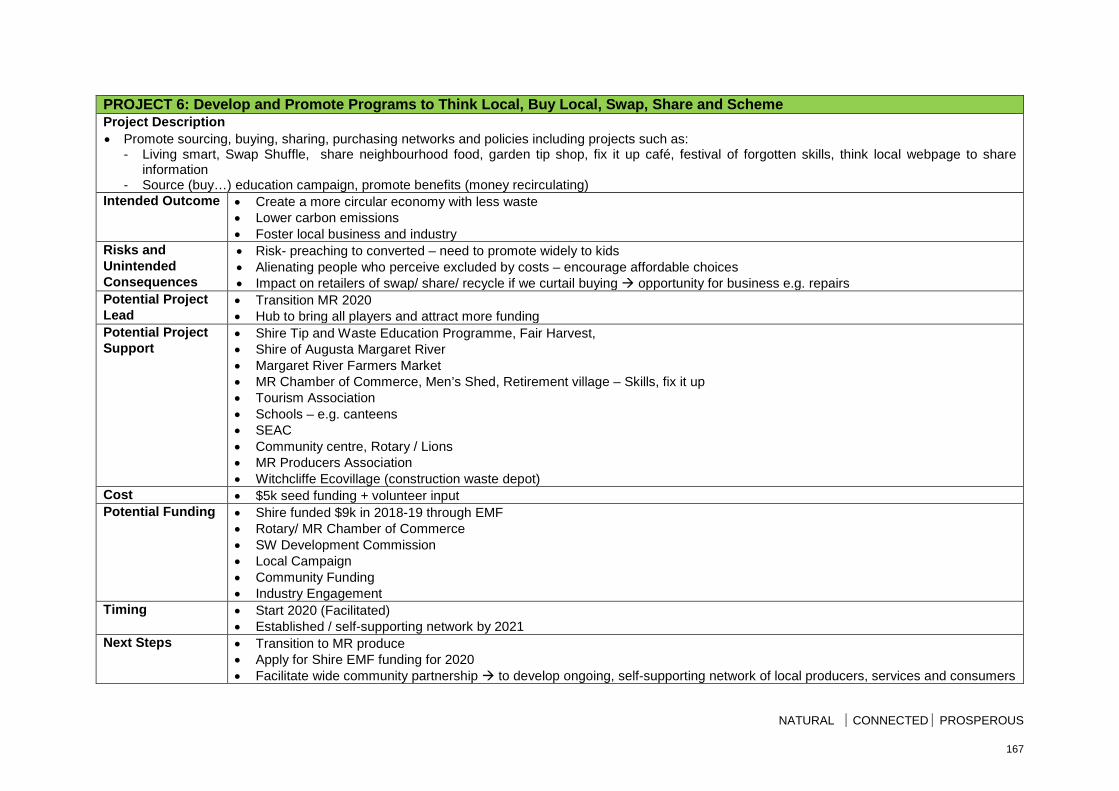
NATURAL CONNECTED PROSPEROUS
PROJECT 6: Develop and Promote Programs to Think Local, Buy Local, Swap, Share and Scheme Project Description • Promote sourcing, buying, sharing, purchasing networks and policies including projects such as:
- Living smart, Swap Shuffle, share neighbourhood food, garden tip shop, fix it up café, festival of forgotten skills, think local webpage to share information
- Source (buy…) education campaign, promote benefits (money recirculating) Intended Outcome • Create a more circular economy with less waste
• Lower carbon emissions • Foster local business and industry
Risks and Unintended Consequences
• Risk- preaching to converted – need to promote widely to kids • Alienating people who perceive excluded by costs – encourage affordable choices • Impact on retailers of swap/ share/ recycle if we curtail buying opportunity for business e.g. repairs
Potential Project Lead
• Transition MR 2020 • Hub to bring all players and attract more funding
Potential Project Support
• Shire Tip and Waste Education Programme, Fair Harvest, • Shire of Augusta Margaret River • Margaret River Farmers Market • MR Chamber of Commerce, Men’s Shed, Retirement village – Skills, fix it up • Tourism Association • Schools – e.g. canteens • SEAC • Community centre, Rotary / Lions • MR Producers Association • Witchcliffe Ecovillage (construction waste depot)
Cost • $5k seed funding + volunteer input Potential Funding • Shire funded $9k in 2018-19 through EMF
• Rotary/ MR Chamber of Commerce • SW Development Commission • Local Campaign • Community Funding • Industry Engagement
Timing • Start 2020 (Facilitated) • Established / self-supporting network by 2021
Next Steps • Transition to MR produce • Apply for Shire EMF funding for 2020 • Facilitate wide community partnership to develop ongoing, self-supporting network of local producers, services and consumers
167
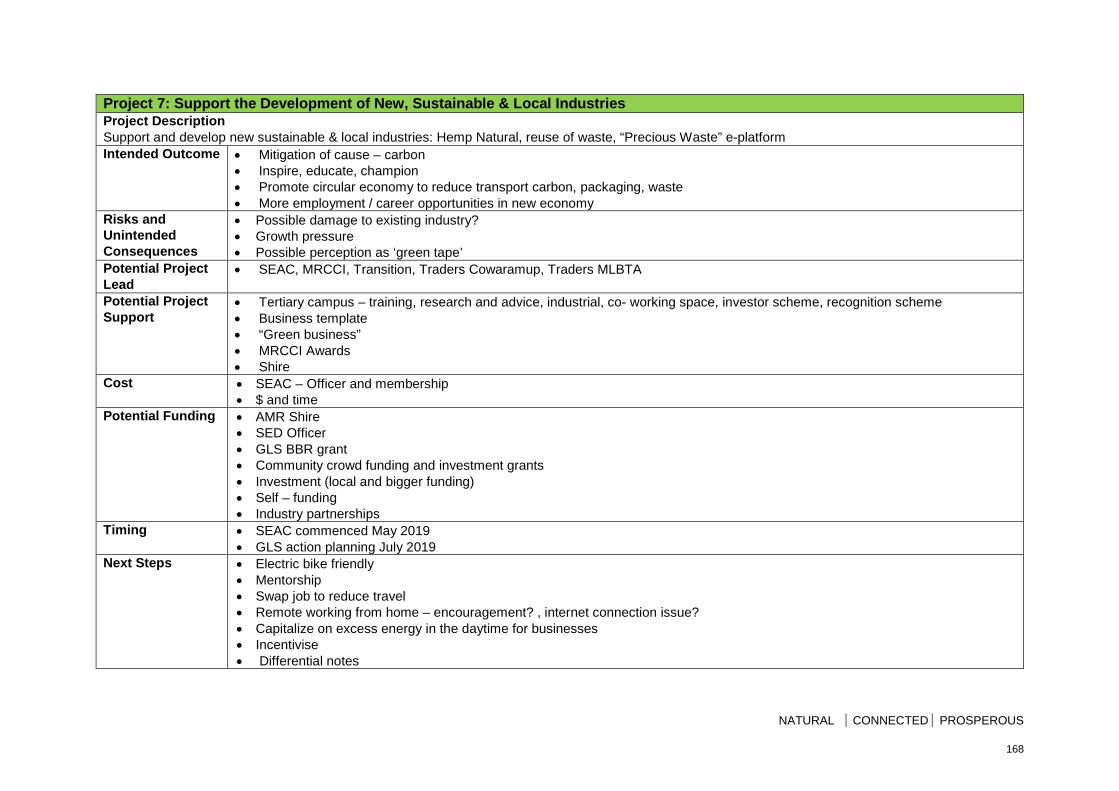
NATURAL CONNECTED PROSPEROUS
Project 7: Support the Development of New, Sustainable & Local Industries Project Description Support and develop new sustainable & local industries: Hemp Natural, reuse of waste, “Precious Waste” e-platform Intended Outcome • Mitigation of cause – carbon
• Inspire, educate, champion • Promote circular economy to reduce transport carbon, packaging, waste • More employment / career opportunities in new economy
Risks and Unintended Consequences
• Possible damage to existing industry? • Growth pressure • Possible perception as ‘green tape’
Potential Project Lead
• SEAC, MRCCI, Transition, Traders Cowaramup, Traders MLBTA
Potential Project Support
• Tertiary campus – training, research and advice, industrial, co- working space, investor scheme, recognition scheme • Business template • “Green business” • MRCCI Awards • Shire
Cost • SEAC – Officer and membership • $ and time
Potential Funding • AMR Shire • SED Officer • GLS BBR grant • Community crowd funding and investment grants • Investment (local and bigger funding) • Self – funding • Industry partnerships
Timing • SEAC commenced May 2019 • GLS action planning July 2019
Next Steps • Electric bike friendly • Mentorship • Swap job to reduce travel • Remote working from home – encouragement? , internet connection issue? • Capitalize on excess energy in the daytime for businesses • Incentivise • Differential notes
168
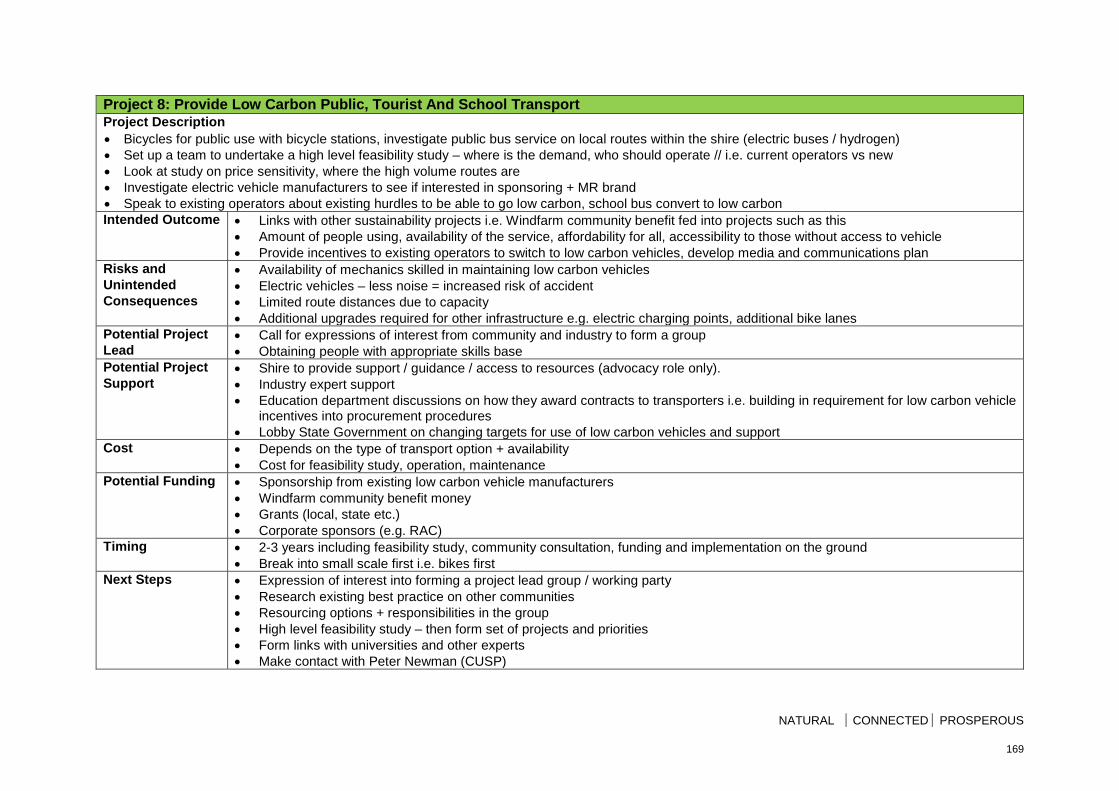
NATURAL CONNECTED PROSPEROUS
Project 8: Provide Low Carbon Public, Tourist And School Transport Project Description • Bicycles for public use with bicycle stations, investigate public bus service on local routes within the shire (electric buses / hydrogen) • Set up a team to undertake a high level feasibility study – where is the demand, who should operate // i.e. current operators vs new • Look at study on price sensitivity, where the high volume routes are • Investigate electric vehicle manufacturers to see if interested in sponsoring + MR brand • Speak to existing operators about existing hurdles to be able to go low carbon, school bus convert to low carbon Intended Outcome • Links with other sustainability projects i.e. Windfarm community benefit fed into projects such as this
• Amount of people using, availability of the service, affordability for all, accessibility to those without access to vehicle • Provide incentives to existing operators to switch to low carbon vehicles, develop media and communications plan
Risks and Unintended Consequences
• Availability of mechanics skilled in maintaining low carbon vehicles • Electric vehicles – less noise = increased risk of accident • Limited route distances due to capacity • Additional upgrades required for other infrastructure e.g. electric charging points, additional bike lanes
Potential Project Lead
• Call for expressions of interest from community and industry to form a group • Obtaining people with appropriate skills base
Potential Project Support
• Shire to provide support / guidance / access to resources (advocacy role only). • Industry expert support • Education department discussions on how they award contracts to transporters i.e. building in requirement for low carbon vehicle
incentives into procurement procedures • Lobby State Government on changing targets for use of low carbon vehicles and support
Cost • Depends on the type of transport option + availability • Cost for feasibility study, operation, maintenance
Potential Funding • Sponsorship from existing low carbon vehicle manufacturers • Windfarm community benefit money • Grants (local, state etc.) • Corporate sponsors (e.g. RAC)
Timing • 2-3 years including feasibility study, community consultation, funding and implementation on the ground • Break into small scale first i.e. bikes first
Next Steps • Expression of interest into forming a project lead group / working party • Research existing best practice on other communities • Resourcing options + responsibilities in the group • High level feasibility study – then form set of projects and priorities • Form links with universities and other experts • Make contact with Peter Newman (CUSP)
169
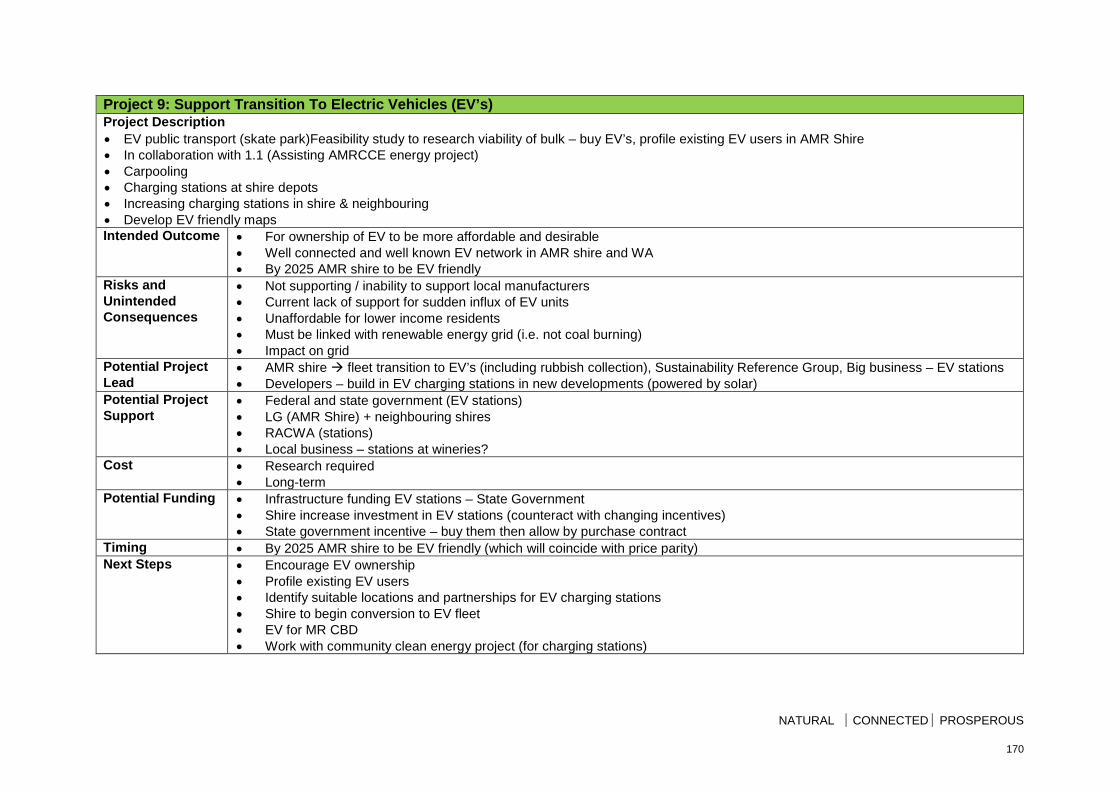
NATURAL CONNECTED PROSPEROUS
Project 9: Support Transition To Electric Vehicles (EV’s) Project Description • EV public transport (skate park)Feasibility study to research viability of bulk – buy EV’s, profile existing EV users in AMR Shire • In collaboration with 1.1 (Assisting AMRCCE energy project) • Carpooling • Charging stations at shire depots • Increasing charging stations in shire & neighbouring • Develop EV friendly maps Intended Outcome • For ownership of EV to be more affordable and desirable
• Well connected and well known EV network in AMR shire and WA • By 2025 AMR shire to be EV friendly
Risks and Unintended Consequences
• Not supporting / inability to support local manufacturers • Current lack of support for sudden influx of EV units • Unaffordable for lower income residents • Must be linked with renewable energy grid (i.e. not coal burning) • Impact on grid
Potential Project Lead
• AMR shire fleet transition to EV’s (including rubbish collection), Sustainability Reference Group, Big business – EV stations • Developers – build in EV charging stations in new developments (powered by solar)
Potential Project Support
• Federal and state government (EV stations) • LG (AMR Shire) + neighbouring shires • RACWA (stations) • Local business – stations at wineries?
Cost • Research required • Long-term
Potential Funding • Infrastructure funding EV stations – State Government • Shire increase investment in EV stations (counteract with changing incentives) • State government incentive – buy them then allow by purchase contract
Timing • By 2025 AMR shire to be EV friendly (which will coincide with price parity) Next Steps • Encourage EV ownership
• Profile existing EV users • Identify suitable locations and partnerships for EV charging stations • Shire to begin conversion to EV fleet • EV for MR CBD • Work with community clean energy project (for charging stations)
170
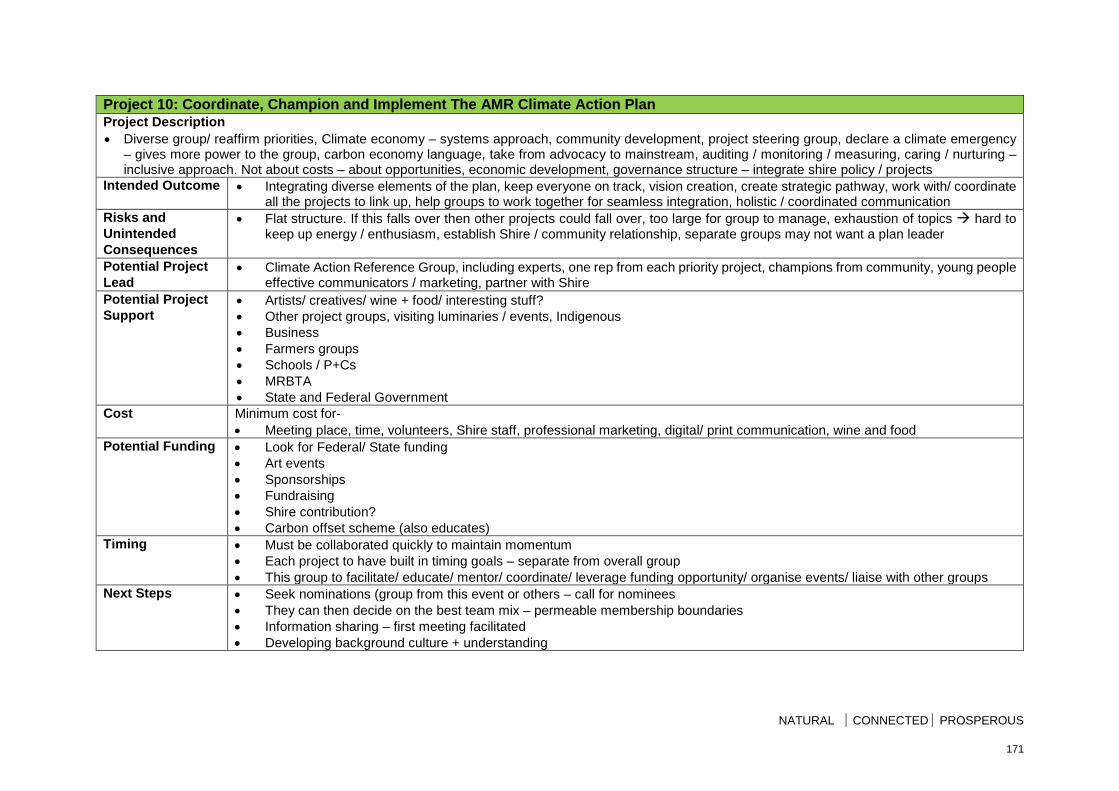
NATURAL CONNECTED PROSPEROUS
Project 10: Coordinate, Champion and Implement The AMR Climate Action Plan Project Description • Diverse group/ reaffirm priorities, Climate economy – systems approach, community development, project steering group, declare a climate emergency
– gives more power to the group, carbon economy language, take from advocacy to mainstream, auditing / monitoring / measuring, caring / nurturing – inclusive approach. Not about costs – about opportunities, economic development, governance structure – integrate shire policy / projects
Intended Outcome • Integrating diverse elements of the plan, keep everyone on track, vision creation, create strategic pathway, work with/ coordinate all the projects to link up, help groups to work together for seamless integration, holistic / coordinated communication
Risks and Unintended Consequences
• Flat structure. If this falls over then other projects could fall over, too large for group to manage, exhaustion of topics hard to keep up energy / enthusiasm, establish Shire / community relationship, separate groups may not want a plan leader
Potential Project Lead
• Climate Action Reference Group, including experts, one rep from each priority project, champions from community, young people effective communicators / marketing, partner with Shire
Potential Project Support
• Artists/ creatives/ wine + food/ interesting stuff? • Other project groups, visiting luminaries / events, Indigenous • Business • Farmers groups • Schools / P+Cs • MRBTA • State and Federal Government
Cost Minimum cost for- • Meeting place, time, volunteers, Shire staff, professional marketing, digital/ print communication, wine and food
Potential Funding • Look for Federal/ State funding • Art events • Sponsorships • Fundraising • Shire contribution? • Carbon offset scheme (also educates)
Timing • Must be collaborated quickly to maintain momentum • Each project to have built in timing goals – separate from overall group • This group to facilitate/ educate/ mentor/ coordinate/ leverage funding opportunity/ organise events/ liaise with other groups
Next Steps • Seek nominations (group from this event or others – call for nominees • They can then decide on the best team mix – permeable membership boundaries • Information sharing – first meeting facilitated • Developing background culture + understanding
171
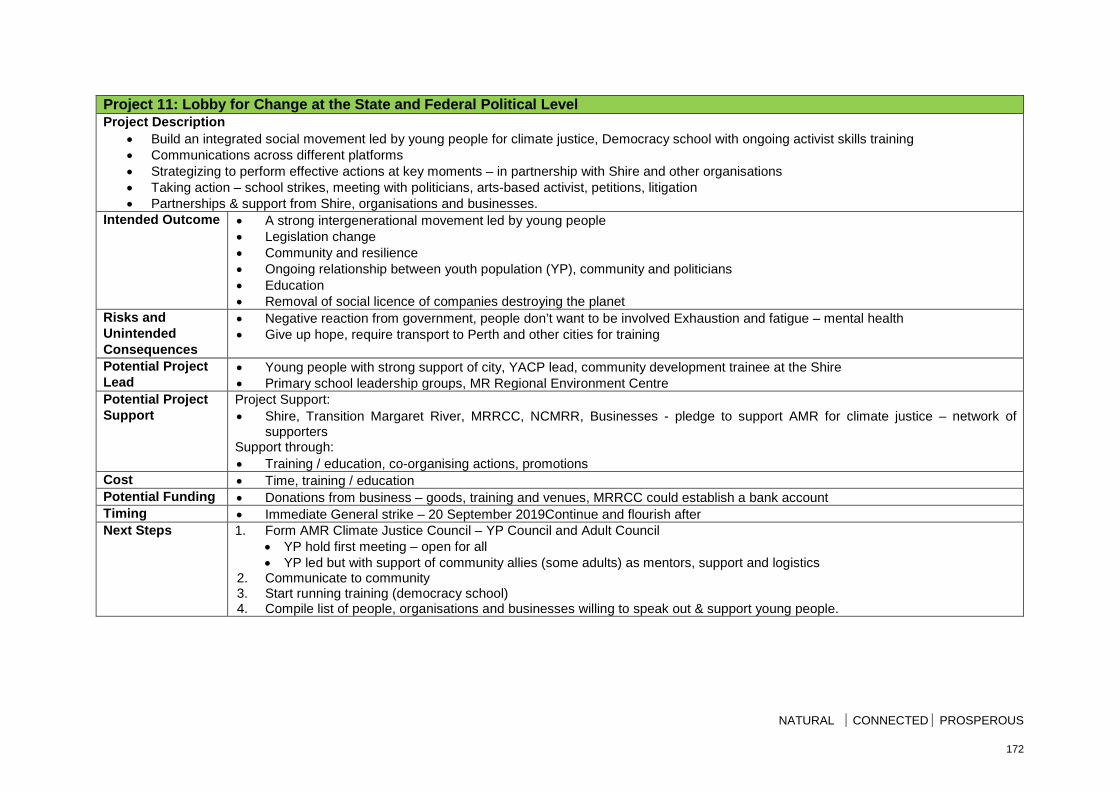
NATURAL CONNECTED PROSPEROUS
Project 11: Lobby for Change at the State and Federal Political Level Project Description
• Build an integrated social movement led by young people for climate justice, Democracy school with ongoing activist skills training • Communications across different platforms • Strategizing to perform effective actions at key moments – in partnership with Shire and other organisations • Taking action – school strikes, meeting with politicians, arts-based activist, petitions, litigation • Partnerships & support from Shire, organisations and businesses.
Intended Outcome • A strong intergenerational movement led by young people • Legislation change • Community and resilience • Ongoing relationship between youth population (YP), community and politicians • Education • Removal of social licence of companies destroying the planet
Risks and Unintended Consequences
• Negative reaction from government, people don’t want to be involved Exhaustion and fatigue – mental health • Give up hope, require transport to Perth and other cities for training
Potential Project Lead
• Young people with strong support of city, YACP lead, community development trainee at the Shire • Primary school leadership groups, MR Regional Environment Centre
Potential Project Support
Project Support: • Shire, Transition Margaret River, MRRCC, NCMRR, Businesses - pledge to support AMR for climate justice – network of
supporters Support through: • Training / education, co-organising actions, promotions
Cost • Time, training / education Potential Funding • Donations from business – goods, training and venues, MRRCC could establish a bank account Timing • Immediate General strike – 20 September 2019Continue and flourish after Next Steps 1. Form AMR Climate Justice Council – YP Council and Adult Council
• YP hold first meeting – open for all • YP led but with support of community allies (some adults) as mentors, support and logistics
2. Communicate to community 3. Start running training (democracy school) 4. Compile list of people, organisations and businesses willing to speak out & support young people.
172
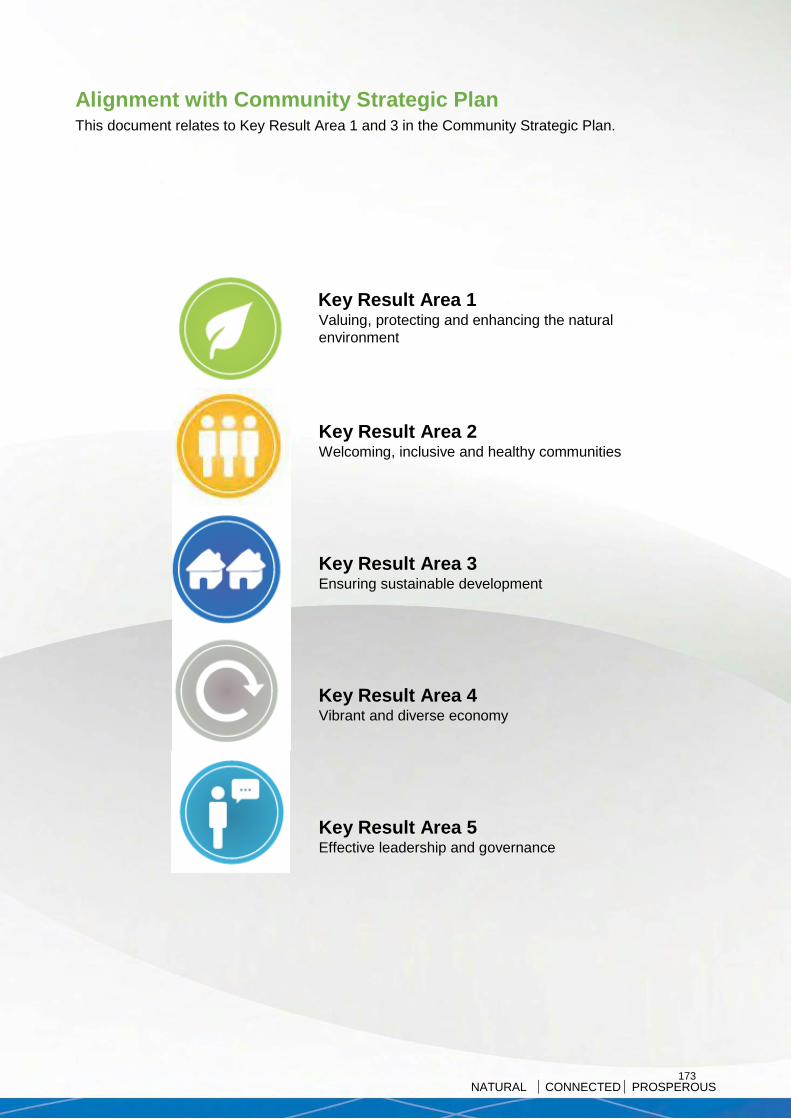
NATURAL CONNECTED PROSPEROUS
Alignment with Community Strategic Plan This document relates to Key Result Area 1 and 3 in the Community Strategic Plan.
Key Result Area 1 Valuing, protecting and enhancing the natural environment
Key Result Area 2 Welcoming, inclusive and healthy communities
Key Result Area 3 Ensuring sustainable development
Key Result Area 4 Vibrant and diverse economy
Key Result Area 5 Effective leadership and governance
173

Version Control table
Related Documents Environmental Elements of Sustainability Strategy
Corporate Plan 2019-23
Responsible Directorate Sustainable Development
Prepared by Sustainability Planning Officer
Approved by ELT
Last Reviewed
Date of this Review 11 December 2019
Next Revision Date
174

www.amrshire.wa.gov.au
Margaret River
41 Wallcliffe Road (PO Box 61)
Margaret River 6285
T (08) 9780 5255 | F (08) 9757 2512
Office Hours
Mon to Fri, 9am – 4pm
Phone enquiries 8am – 4.30pm
Augusta
66 Allnutt Terrace
Augusta 6290
T 08 9780 5660 | F (08) 9758 0033
Office Hours
Mon to Fri, 9am – 4pm (closes for lunch 12pm – 1pm)
Phone enquiries 8am – 4.30pm
If you are deaf, or have a hearing impairment or speech impairment, contact us through the National Relay Service:
• TTY users phone 133 677 then ask for 08 9780 5255
• Speak and Listen users phone 1300 555 727
then ask for 08 9780 5255
• Internet relay users connect to the NRS www.relayservice.com.au then ask for 08 9780 5255
175

SHIRE OF AUGUSTA MARGARET RIVER ORDINARY COUNCIL MEETING 11 DECEMBER 2019
11.2 Sustainable Development 11.2.4 SUSTAINABILITY REFERENCE GROUP – INSTRUMENT
OF APPOINTMENT AND DELEGATION
Attachment 1 – SRG Instrument of Appointment and delegation with tracked change
176
SUSTAINABILITY REFERENCE GROUP
Shire of Augusta Margaret River 41 Wallcliffe Road, Margaret River 6285 | T (08) 9780 5255 | F (08) 9757 2512 | amrshire.wa.gov.au
Sustainability Reference Group
Instrument of Appointment and Delegation September 2019
NAME The Reference Group shall be known as the Sustainability Reference Group (SRG).
ROLE OF THE REFERENCE GROUP To promote sustainable environmental practices within the Shire of Augusta Margaret River and across the community and to provide a forum for community representatives, Councillors and Shire officers to focus on sustainability issues.
OBJECTIVES OF THE REFERENCE GROUP a) Strive to increase community engagement on sustainability and environment related
initiatives. b) To provide technical expertise on environmental issues including:
• Climate Change; • Transport and air quality; • Biodiversity; • The built environment; • Community information and engagement to increase sustainable practices; • Land and waterway degradation; • Water quality and conservation; • Waste management; and • Power generation and conservation.
c) Identify opportunities to increase real and sustainable behaviour change in residents,
businesses and other members of the community (including tourists) to improve sustainability outcomes.
d) To provide guidance on Shire initiatives and projects with the objective of achieving
outcomes which are: 1) Environmentally responsible; 2) Socially and culturally sound; and 3) Economically viable.
MEMBERSHIP The Council appoints to the Reference Group those categories of membership outlined below. Membership of the Reference Group shall, unless otherwise specified, be for a term ceasing at the date of the Local Government election in the year the Shire’s Local Government elections are held, after which time the Council may appoint members for a further term.
177

SUSTAINABILITY REFERENCE GROUP
Shire of Augusta Margaret River 41 Wallcliffe Road, Margaret River 6285 | T (08) 9780 5255 | F (08) 9757 2512 | amrshire.wa.gov.au
Membership of the Reference Group shall be: a) The Shire President, if desirous in participating and one Councillor of the Shire of
Augusta Margaret River; OR Two Councillors of the Shire of Augusta Margaret River; (one Councillor shall be Chairperson, one shall be Deputy Chairperson);
b) A deputy in the absence of the President or other appointed delegate; and c) Up to eleven 12 community members with interest and expertise in environmental
matters, appointed by the Council. The Shire’s Sustainable Development Directorate will provide advice and administrative support to the Reference Group. The Shire shall ensure ensure that minutes of the proceedings are kept and that business is conducted in accordance with the Instrument of Appointment and Delegation and the following general administrative framework:
i. The role of a Reference Group is to provide the Shire’s Administration with its views and/or proposals relevant to the Objectives for which the group was established.
ii. A Reference Group has no decision making powers and does not have any authority to act on behalf of the Shire. In operation, the group cannot direct employees, call tenders, award contracts, expend monies, direct volunteers or do anything which is the responsibility of the Shire.
iii. Reference Group meetings will be conducted in an informal manner, providing opportunities for ideas to be raised and general discussion. The view and proposals of a Reference Group are to be recorded on the Minutes and retained in the Shire’s record keeping systems.
iv. Reference Group members either collectively or individually are not authorised to speak on behalf of the Shire or provide comment to the media or other persons, in respect of any item under consideration, unless authorised by the Chief Executive Officer.
ROLE OF THE CHAIRPERSON The Chairperson and Deputy Chairperson shall be Councillor representatives and will be decided by Council.
The Chairperson will preside at all meetings. The Chairperson shall ensure that the Reference Group operates in accordance with the Instrument of Appointment and Delegation at all times. CONDUCT OF MEETINGS Meetings a) At the first meeting after convening, the Reference Group shall determine a Schedule of
Meeting dates for the reminder of the year. b) Additional meetings may be convened at the discretion of the Chair. Agendas and Minutes a) The Director Sustainable Development will determine the Agenda for each meeting.
Members may submit items for consideration and listing on the agenda. b) All meetings shall be confined to items listed on the agenda. c) The Director Sustainable Development will be responsible for ensuring preparation and
accuracy of the minutes. d) Items considered at the meeting will not be voted upon. The minutes will record consensus
agreement on actions and any points of agreement / disagreement. They will not reflect verbatim discussion on issues or matters discussed during debate.
e) Minutes of the meeting will be prepared by the Responsible Officer and distributed to members within five (5) working days after the meeting.
178

SUSTAINABILITY REFERENCE GROUP
Shire of Augusta Margaret River 41 Wallcliffe Road, Margaret River 6285 | T (08) 9780 5255 | F (08) 9757 2512 | amrshire.wa.gov.au
CONFLICT OF INTEREST Whilst the financial, proximity and impartiality interest provisions of the Local Government Act 1995 do not apply to the Shire’s Reference Groups (as it is not a Council appointed committee approved under section 5.8 of the Local Government Act 1995 and does not have any legal status), all members need to be aware that any conflict of interest needs to be disclosed to ensure probity is maintained at all times. DELEGATED POWERS The Reference Group has no delegated powers. The meeting minutes, views and proposals of reference group meetings are to be presented to Council by Shire staff for noting bi-annually.
Document and version control table
Strategic outcome Key Result Area 5:Effective governance and corporate leadership.
Responsible Directorate Governance
Authority of original issue Council
Date of original issue 13 September 2017
Contact officer Governance Officer / Council Support
Date of next review September 2021
Document No. N139482
Version Date issued Brief description
1.0 13/9/2017 Initial Issue
1.1 8/11/2017 Amendment to membership wording (OM2017/260)
1.2 11/09/2019 Review and major amendments in line with reestablishment as a reference group
179

SHIRE OF AUGUSTA MARGARET RIVER ORDINARY COUNCIL MEETING 11 DECEMBER 2019
11.2 Sustainable Development 11.2.5 SCHEME AMENDMENT NO.58 AND RELATED
STRUCTURE PLAN- EXMOOR DRIVE – FOR FINAL ADOPTION
Attachment 1 – Proposed Structure Plan Attachment 2 – Schedule of Submissions Attachment 3 – Responses to DFES Advice Attachment 4 – Recommendation Boundary Changes
180
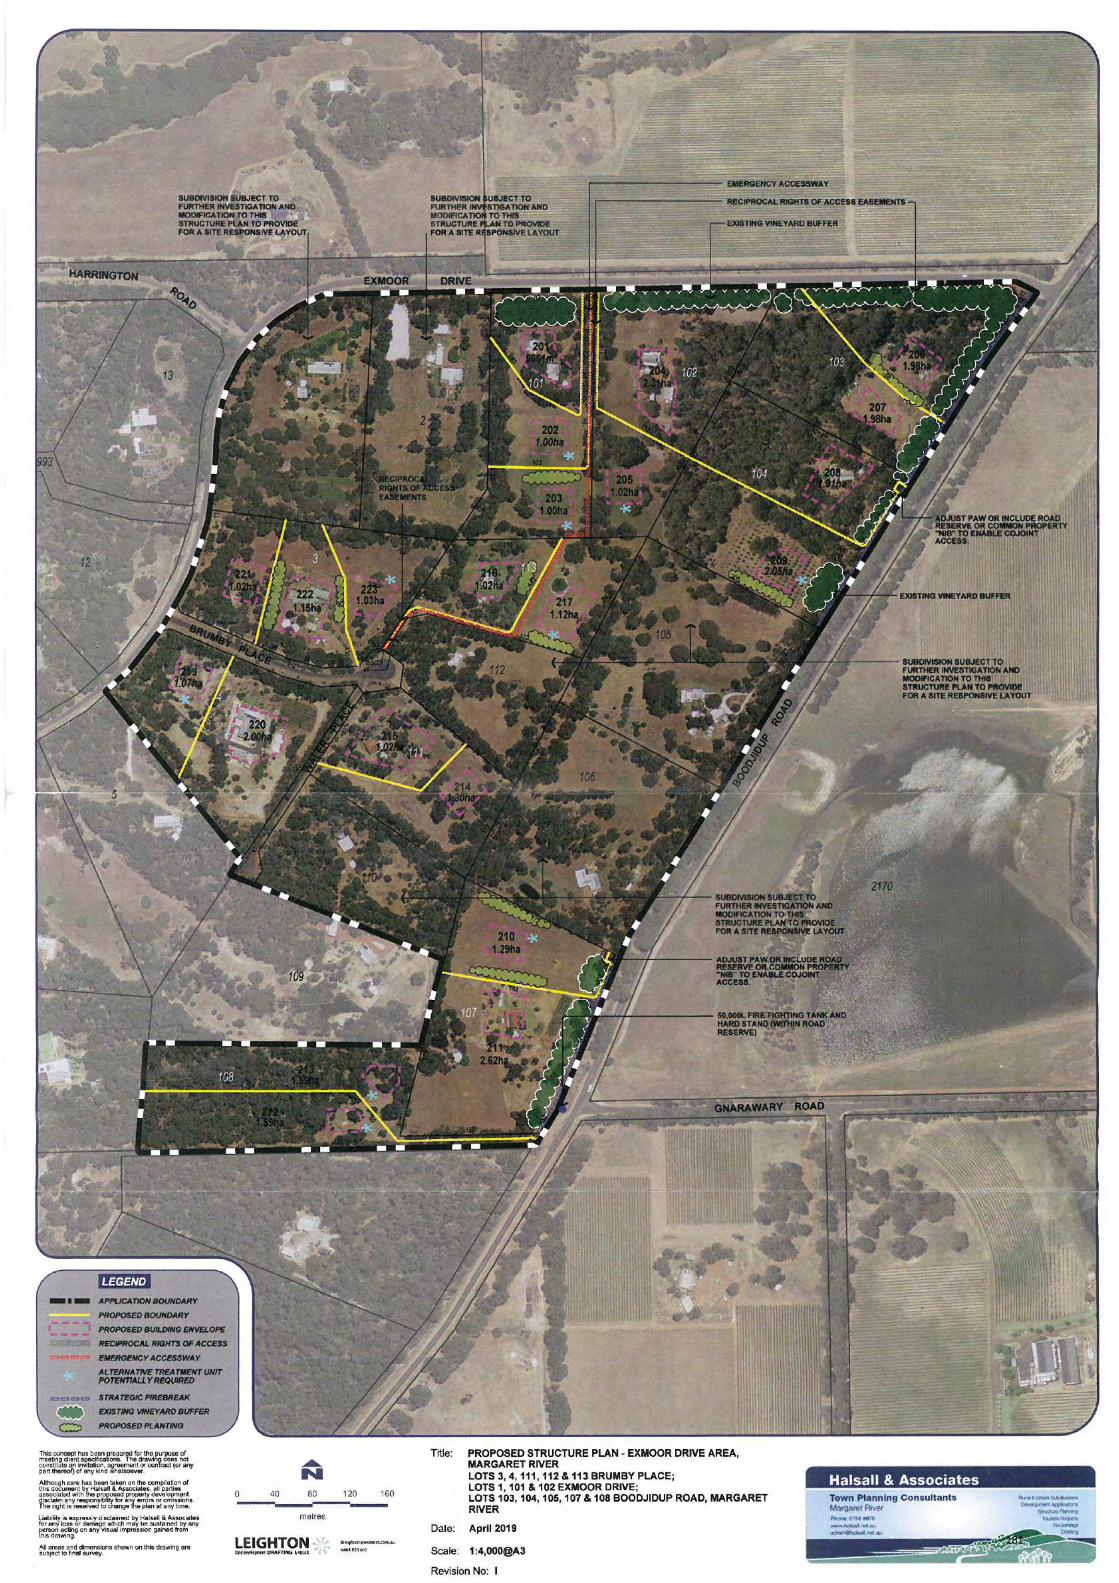
181
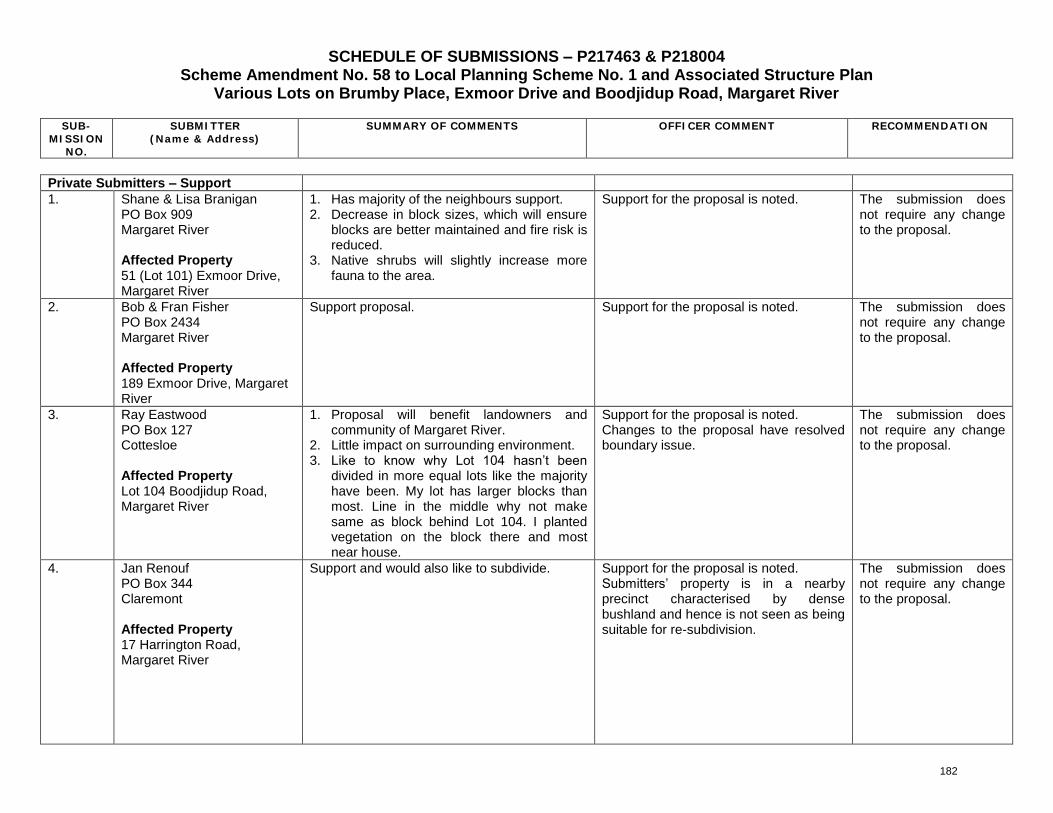
SCHEDULE OF SUBMISSIONS – P217463 & P218004 Scheme Amendment No. 58 to Local Planning Scheme No. 1 and Associated Structure Plan
Various Lots on Brumby Place, Exmoor Drive and Boodjidup Road, Margaret River
SUB-MISSION
NO.
SUBMITTER (Name & Address)
SUMMARY OF COMMENTS OFFICER COMMENT RECOMMENDATION
Private Submitters – Support 1. Shane & Lisa Branigan
PO Box 909 Margaret River Affected Property 51 (Lot 101) Exmoor Drive, Margaret River
1. Has majority of the neighbours support. 2. Decrease in block sizes, which will ensure
blocks are better maintained and fire risk is reduced.
3. Native shrubs will slightly increase more fauna to the area.
Support for the proposal is noted. The submission does not require any change to the proposal.
2. Bob & Fran Fisher PO Box 2434 Margaret River Affected Property 189 Exmoor Drive, Margaret River
Support proposal. Support for the proposal is noted. The submission does not require any change to the proposal.
3. Ray Eastwood PO Box 127 Cottesloe Affected Property Lot 104 Boodjidup Road, Margaret River
1. Proposal will benefit landowners and community of Margaret River.
2. Little impact on surrounding environment. 3. Like to know why Lot 104 hasn’t been
divided in more equal lots like the majority have been. My lot has larger blocks than most. Line in the middle why not make same as block behind Lot 104. I planted vegetation on the block there and most near house.
Support for the proposal is noted. Changes to the proposal have resolved boundary issue.
The submission does not require any change to the proposal.
4. Jan Renouf PO Box 344 Claremont Affected Property 17 Harrington Road, Margaret River
Support and would also like to subdivide. Support for the proposal is noted. Submitters’ property is in a nearby precinct characterised by dense bushland and hence is not seen as being suitable for re-subdivision.
The submission does not require any change to the proposal.
182
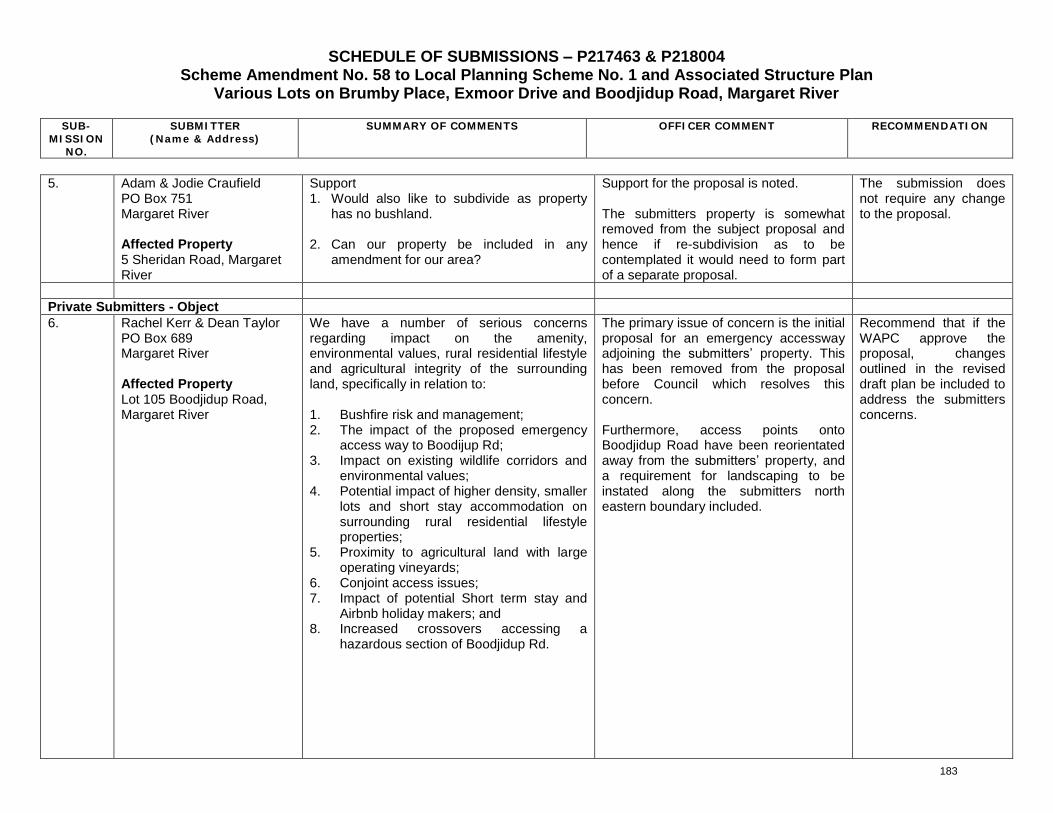
SCHEDULE OF SUBMISSIONS – P217463 & P218004 Scheme Amendment No. 58 to Local Planning Scheme No. 1 and Associated Structure Plan
Various Lots on Brumby Place, Exmoor Drive and Boodjidup Road, Margaret River
SUB-MISSION
NO.
SUBMITTER (Name & Address)
SUMMARY OF COMMENTS OFFICER COMMENT RECOMMENDATION
5. Adam & Jodie Craufield
PO Box 751 Margaret River Affected Property 5 Sheridan Road, Margaret River
Support 1. Would also like to subdivide as property
has no bushland.
2. Can our property be included in any amendment for our area?
Support for the proposal is noted. The submitters property is somewhat removed from the subject proposal and hence if re-subdivision as to be contemplated it would need to form part of a separate proposal.
The submission does not require any change to the proposal.
Private Submitters - Object 6. Rachel Kerr & Dean Taylor
PO Box 689 Margaret River Affected Property Lot 105 Boodjidup Road, Margaret River
We have a number of serious concerns regarding impact on the amenity, environmental values, rural residential lifestyle and agricultural integrity of the surrounding land, specifically in relation to: 1. Bushfire risk and management; 2. The impact of the proposed emergency
access way to Boodijup Rd; 3. Impact on existing wildlife corridors and
environmental values; 4. Potential impact of higher density, smaller
lots and short stay accommodation on surrounding rural residential lifestyle properties;
5. Proximity to agricultural land with large operating vineyards;
6. Conjoint access issues; 7. Impact of potential Short term stay and
Airbnb holiday makers; and 8. Increased crossovers accessing a
hazardous section of Boodjidup Rd.
The primary issue of concern is the initial proposal for an emergency accessway adjoining the submitters’ property. This has been removed from the proposal before Council which resolves this concern. Furthermore, access points onto Boodjidup Road have been reorientated away from the submitters’ property, and a requirement for landscaping to be instated along the submitters north eastern boundary included.
Recommend that if the WAPC approve the proposal, changes outlined in the revised draft plan be included to address the submitters concerns.
183
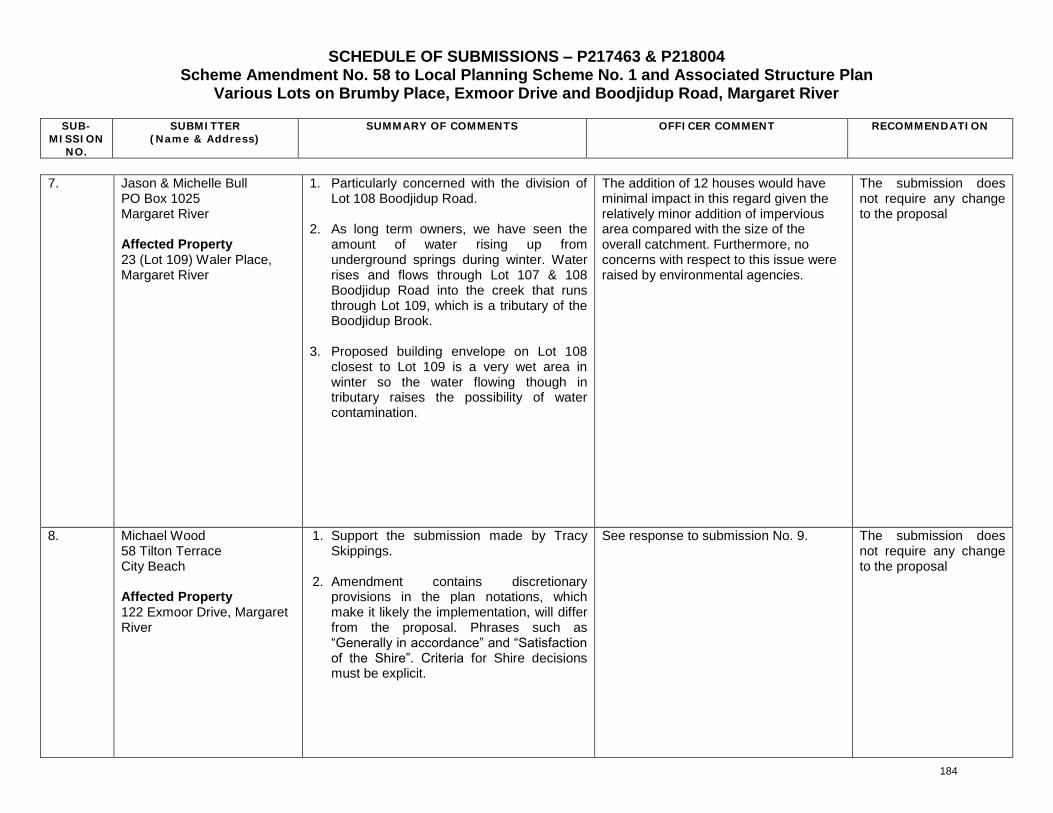
SCHEDULE OF SUBMISSIONS – P217463 & P218004 Scheme Amendment No. 58 to Local Planning Scheme No. 1 and Associated Structure Plan
Various Lots on Brumby Place, Exmoor Drive and Boodjidup Road, Margaret River
SUB-MISSION
NO.
SUBMITTER (Name & Address)
SUMMARY OF COMMENTS OFFICER COMMENT RECOMMENDATION
7. Jason & Michelle Bull
PO Box 1025 Margaret River Affected Property 23 (Lot 109) Waler Place, Margaret River
1. Particularly concerned with the division of Lot 108 Boodjidup Road.
2. As long term owners, we have seen the amount of water rising up from underground springs during winter. Water rises and flows through Lot 107 & 108 Boodjidup Road into the creek that runs through Lot 109, which is a tributary of the Boodjidup Brook.
3. Proposed building envelope on Lot 108 closest to Lot 109 is a very wet area in winter so the water flowing though in tributary raises the possibility of water contamination.
The addition of 12 houses would have minimal impact in this regard given the relatively minor addition of impervious area compared with the size of the overall catchment. Furthermore, no concerns with respect to this issue were raised by environmental agencies.
The submission does not require any change to the proposal
8. Michael Wood 58 Tilton Terrace City Beach Affected Property 122 Exmoor Drive, Margaret River
1. Support the submission made by Tracy Skippings.
2. Amendment contains discretionary provisions in the plan notations, which make it likely the implementation, will differ from the proposal. Phrases such as “Generally in accordance” and “Satisfaction of the Shire”. Criteria for Shire decisions must be explicit.
See response to submission No. 9. The submission does not require any change to the proposal
184
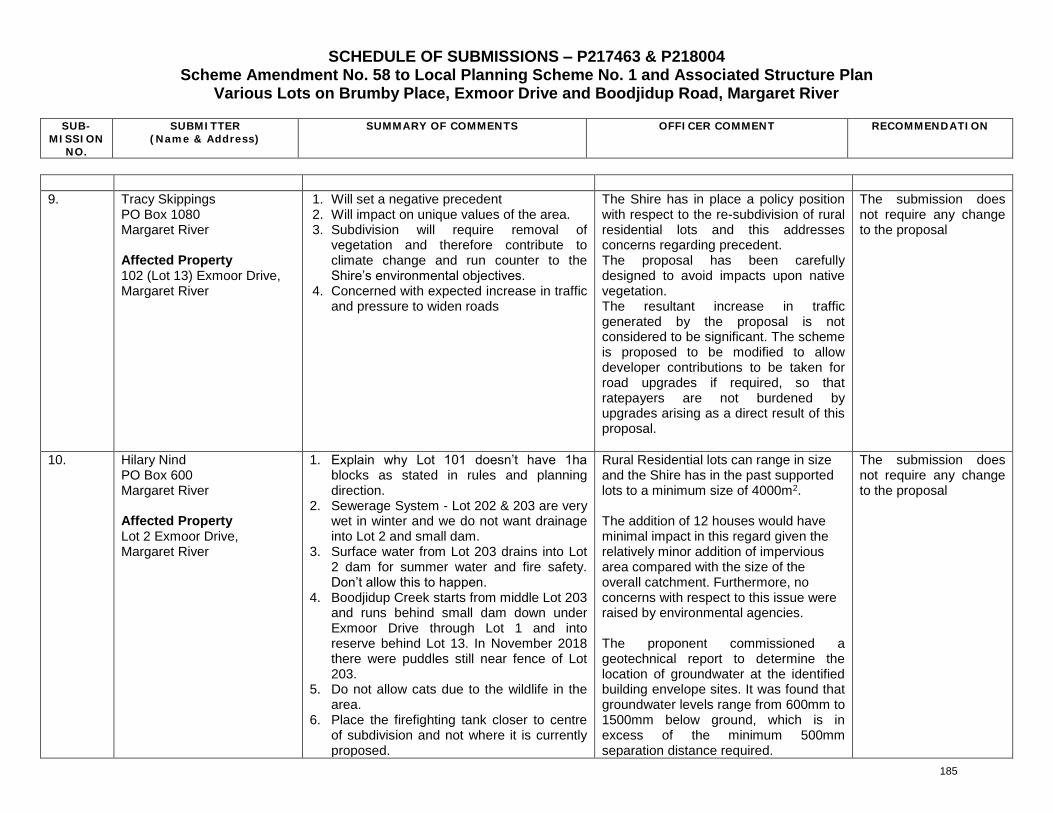
SCHEDULE OF SUBMISSIONS – P217463 & P218004 Scheme Amendment No. 58 to Local Planning Scheme No. 1 and Associated Structure Plan
Various Lots on Brumby Place, Exmoor Drive and Boodjidup Road, Margaret River
SUB-MISSION
NO.
SUBMITTER (Name & Address)
SUMMARY OF COMMENTS OFFICER COMMENT RECOMMENDATION
9. Tracy Skippings PO Box 1080 Margaret River Affected Property 102 (Lot 13) Exmoor Drive, Margaret River
1. Will set a negative precedent 2. Will impact on unique values of the area. 3. Subdivision will require removal of
vegetation and therefore contribute to climate change and run counter to the Shire’s environmental objectives.
4. Concerned with expected increase in traffic and pressure to widen roads
The Shire has in place a policy position with respect to the re-subdivision of rural residential lots and this addresses concerns regarding precedent. The proposal has been carefully designed to avoid impacts upon native vegetation. The resultant increase in traffic generated by the proposal is not considered to be significant. The scheme is proposed to be modified to allow developer contributions to be taken for road upgrades if required, so that ratepayers are not burdened by upgrades arising as a direct result of this proposal.
The submission does not require any change to the proposal
10. Hilary Nind PO Box 600 Margaret River Affected Property Lot 2 Exmoor Drive, Margaret River
1. Explain why Lot 101 doesn’t have 1ha blocks as stated in rules and planning direction.
2. Sewerage System - Lot 202 & 203 are very wet in winter and we do not want drainage into Lot 2 and small dam.
3. Surface water from Lot 203 drains into Lot 2 dam for summer water and fire safety. Don’t allow this to happen.
4. Boodjidup Creek starts from middle Lot 203 and runs behind small dam down under Exmoor Drive through Lot 1 and into reserve behind Lot 13. In November 2018 there were puddles still near fence of Lot 203.
5. Do not allow cats due to the wildlife in the area.
6. Place the firefighting tank closer to centre of subdivision and not where it is currently proposed.
Rural Residential lots can range in size and the Shire has in the past supported lots to a minimum size of 4000m2. The addition of 12 houses would have minimal impact in this regard given the relatively minor addition of impervious area compared with the size of the overall catchment. Furthermore, no concerns with respect to this issue were raised by environmental agencies. The proponent commissioned a geotechnical report to determine the location of groundwater at the identified building envelope sites. It was found that groundwater levels range from 600mm to 1500mm below ground, which is in excess of the minimum 500mm separation distance required.
The submission does not require any change to the proposal
185
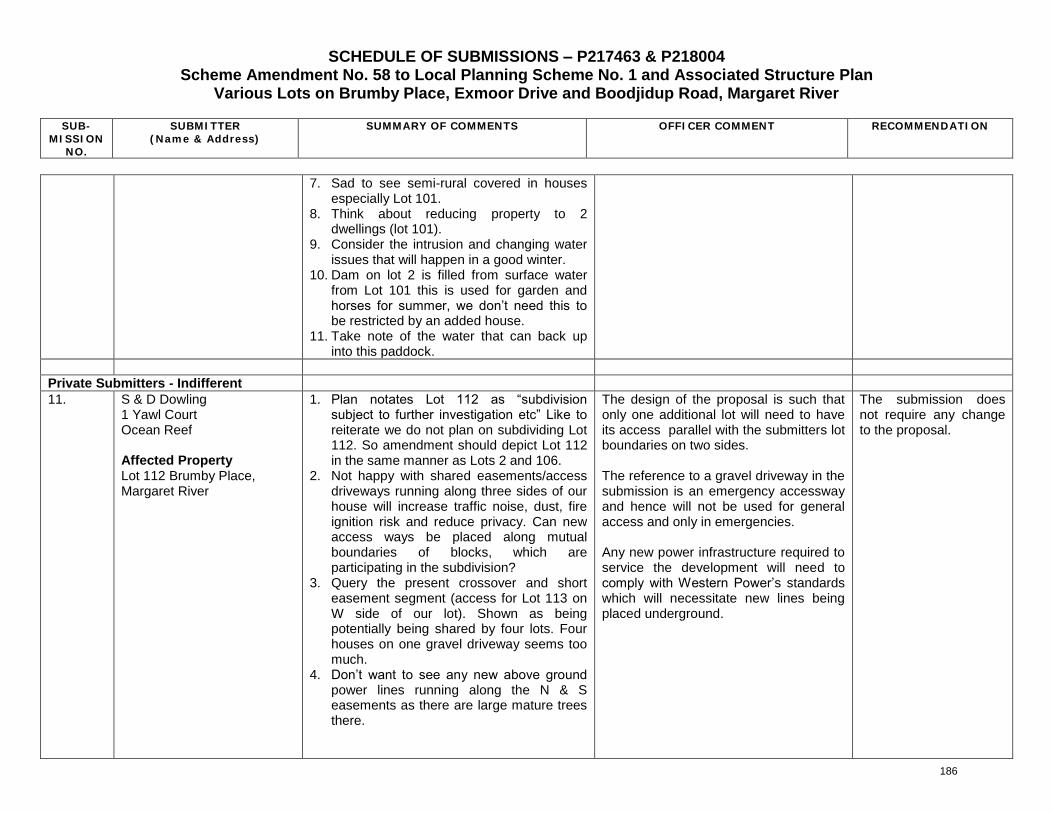
SCHEDULE OF SUBMISSIONS – P217463 & P218004 Scheme Amendment No. 58 to Local Planning Scheme No. 1 and Associated Structure Plan
Various Lots on Brumby Place, Exmoor Drive and Boodjidup Road, Margaret River
SUB-MISSION
NO.
SUBMITTER (Name & Address)
SUMMARY OF COMMENTS OFFICER COMMENT RECOMMENDATION
7. Sad to see semi-rural covered in houses
especially Lot 101. 8. Think about reducing property to 2
dwellings (lot 101). 9. Consider the intrusion and changing water
issues that will happen in a good winter. 10. Dam on lot 2 is filled from surface water
from Lot 101 this is used for garden and horses for summer, we don’t need this to be restricted by an added house.
11. Take note of the water that can back up into this paddock.
Private Submitters - Indifferent 11. S & D Dowling
1 Yawl Court Ocean Reef Affected Property Lot 112 Brumby Place, Margaret River
1. Plan notates Lot 112 as “subdivision subject to further investigation etc” Like to reiterate we do not plan on subdividing Lot 112. So amendment should depict Lot 112 in the same manner as Lots 2 and 106.
2. Not happy with shared easements/access driveways running along three sides of our house will increase traffic noise, dust, fire ignition risk and reduce privacy. Can new access ways be placed along mutual boundaries of blocks, which are participating in the subdivision?
3. Query the present crossover and short easement segment (access for Lot 113 on W side of our lot). Shown as being potentially being shared by four lots. Four houses on one gravel driveway seems too much.
4. Don’t want to see any new above ground power lines running along the N & S easements as there are large mature trees there.
The design of the proposal is such that only one additional lot will need to have its access parallel with the submitters lot boundaries on two sides. The reference to a gravel driveway in the submission is an emergency accessway and hence will not be used for general access and only in emergencies. Any new power infrastructure required to service the development will need to comply with Western Power’s standards which will necessitate new lines being placed underground.
The submission does not require any change to the proposal.
186
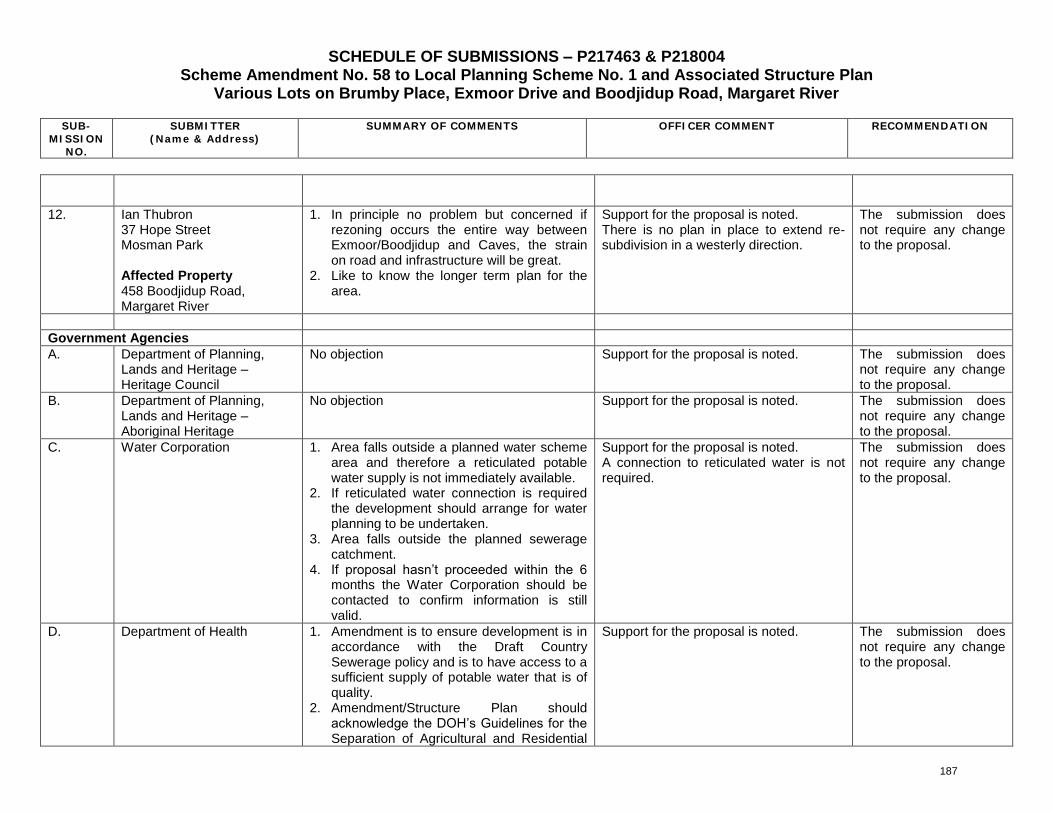
SCHEDULE OF SUBMISSIONS – P217463 & P218004 Scheme Amendment No. 58 to Local Planning Scheme No. 1 and Associated Structure Plan
Various Lots on Brumby Place, Exmoor Drive and Boodjidup Road, Margaret River
SUB-MISSION
NO.
SUBMITTER (Name & Address)
SUMMARY OF COMMENTS OFFICER COMMENT RECOMMENDATION
12. Ian Thubron 37 Hope Street Mosman Park Affected Property 458 Boodjidup Road, Margaret River
1. In principle no problem but concerned if rezoning occurs the entire way between Exmoor/Boodjidup and Caves, the strain on road and infrastructure will be great.
2. Like to know the longer term plan for the area.
Support for the proposal is noted. There is no plan in place to extend re-subdivision in a westerly direction.
The submission does not require any change to the proposal.
Government Agencies A. Department of Planning,
Lands and Heritage – Heritage Council
No objection Support for the proposal is noted. The submission does not require any change to the proposal.
B. Department of Planning, Lands and Heritage – Aboriginal Heritage
No objection Support for the proposal is noted. The submission does not require any change to the proposal.
C. Water Corporation 1. Area falls outside a planned water scheme area and therefore a reticulated potable water supply is not immediately available.
2. If reticulated water connection is required the development should arrange for water planning to be undertaken.
3. Area falls outside the planned sewerage catchment.
4. If proposal hasn’t proceeded within the 6 months the Water Corporation should be contacted to confirm information is still valid.
Support for the proposal is noted. A connection to reticulated water is not required.
The submission does not require any change to the proposal.
D. Department of Health 1. Amendment is to ensure development is in accordance with the Draft Country Sewerage policy and is to have access to a sufficient supply of potable water that is of quality.
2. Amendment/Structure Plan should acknowledge the DOH’s Guidelines for the Separation of Agricultural and Residential
Support for the proposal is noted. The submission does not require any change to the proposal.
187
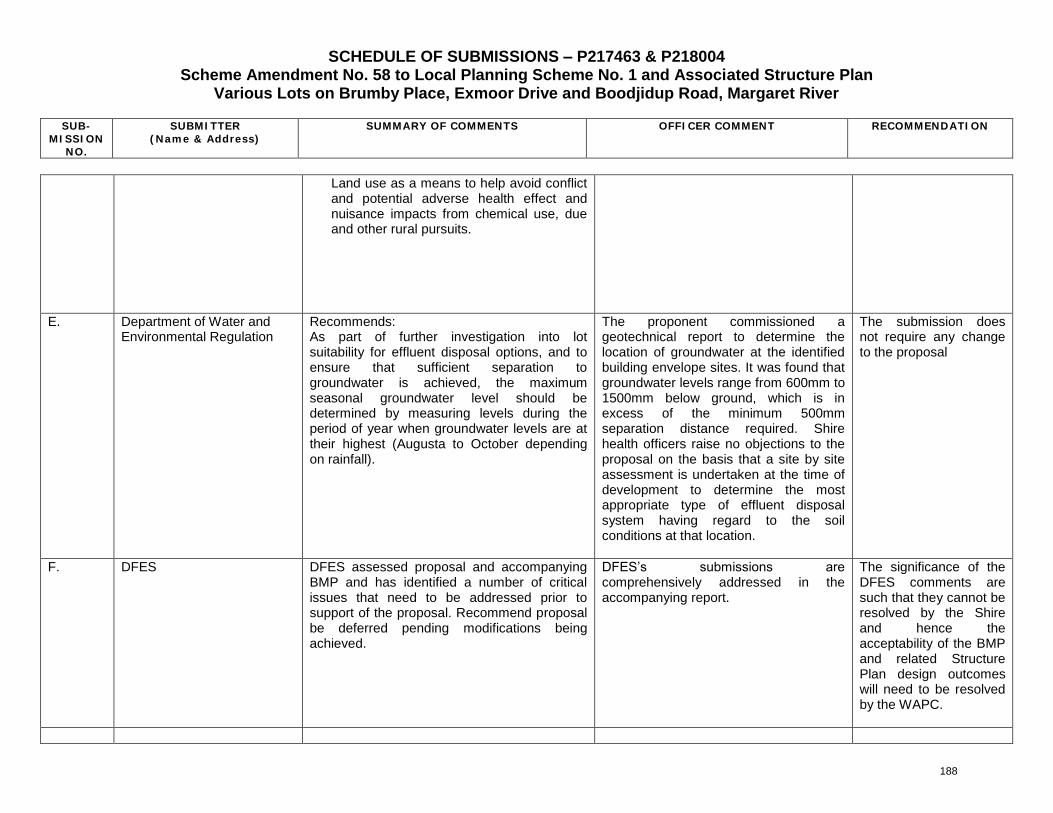
SCHEDULE OF SUBMISSIONS – P217463 & P218004 Scheme Amendment No. 58 to Local Planning Scheme No. 1 and Associated Structure Plan
Various Lots on Brumby Place, Exmoor Drive and Boodjidup Road, Margaret River
SUB-MISSION
NO.
SUBMITTER (Name & Address)
SUMMARY OF COMMENTS OFFICER COMMENT RECOMMENDATION
Land use as a means to help avoid conflict and potential adverse health effect and nuisance impacts from chemical use, due and other rural pursuits.
E. Department of Water and Environmental Regulation
Recommends: As part of further investigation into lot suitability for effluent disposal options, and to ensure that sufficient separation to groundwater is achieved, the maximum seasonal groundwater level should be determined by measuring levels during the period of year when groundwater levels are at their highest (Augusta to October depending on rainfall).
The proponent commissioned a geotechnical report to determine the location of groundwater at the identified building envelope sites. It was found that groundwater levels range from 600mm to 1500mm below ground, which is in excess of the minimum 500mm separation distance required. Shire health officers raise no objections to the proposal on the basis that a site by site assessment is undertaken at the time of development to determine the most appropriate type of effluent disposal system having regard to the soil conditions at that location.
The submission does not require any change to the proposal
F. DFES DFES assessed proposal and accompanying BMP and has identified a number of critical issues that need to be addressed prior to support of the proposal. Recommend proposal be deferred pending modifications being achieved.
DFES’s submissions are comprehensively addressed in the accompanying report.
The significance of the DFES comments are such that they cannot be resolved by the Shire and hence the acceptability of the BMP and related Structure Plan design outcomes will need to be resolved by the WAPC.
188
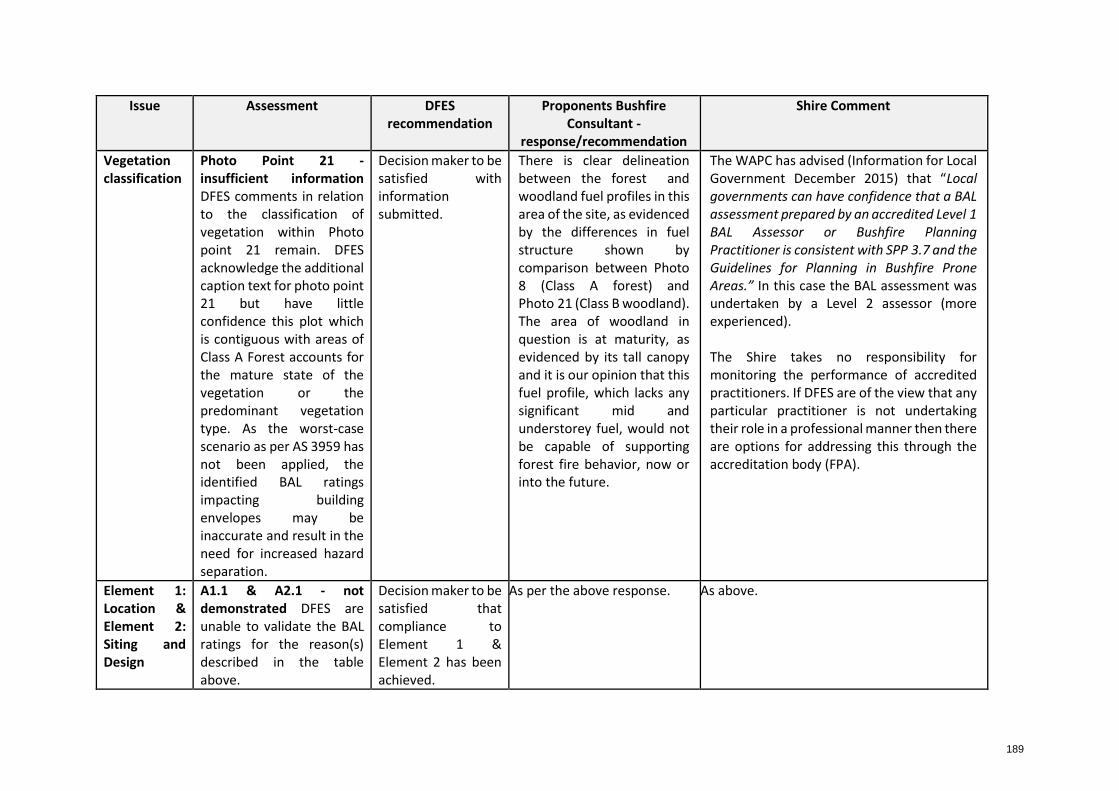
Issue Assessment DFES recommendation
Proponents Bushfire Consultant -
response/recommendation
Shire Comment
Vegetation classification
Photo Point 21 - insufficient information DFES comments in relation to the classification of vegetation within Photo point 21 remain. DFES acknowledge the additional caption text for photo point 21 but have little confidence this plot which is contiguous with areas of Class A Forest accounts for the mature state of the vegetation or the predominant vegetation type. As the worst-case scenario as per AS 3959 has not been applied, the identified BAL ratings impacting building envelopes may be inaccurate and result in the need for increased hazard separation.
Decision maker to be satisfied with information submitted.
There is clear delineation between the forest and woodland fuel profiles in this area of the site, as evidenced by the differences in fuel structure shown by comparison between Photo 8 (Class A forest) and Photo 21 (Class B woodland). The area of woodland in question is at maturity, as evidenced by its tall canopy and it is our opinion that this fuel profile, which lacks any significant mid and understorey fuel, would not be capable of supporting forest fire behavior, now or into the future.
The WAPC has advised (Information for Local Government December 2015) that “Local governments can have confidence that a BAL assessment prepared by an accredited Level 1 BAL Assessor or Bushfire Planning Practitioner is consistent with SPP 3.7 and the Guidelines for Planning in Bushfire Prone Areas.” In this case the BAL assessment was undertaken by a Level 2 assessor (more experienced). The Shire takes no responsibility for monitoring the performance of accredited practitioners. If DFES are of the view that any particular practitioner is not undertaking their role in a professional manner then there are options for addressing this through the accreditation body (FPA).
Element 1: Location & Element 2: Siting and Design
A1.1 & A2.1 - not demonstrated DFES are unable to validate the BAL ratings for the reason(s) described in the table above.
Decision maker to be satisfied that compliance to Element 1 & Element 2 has been achieved.
As per the above response.
As above.
189
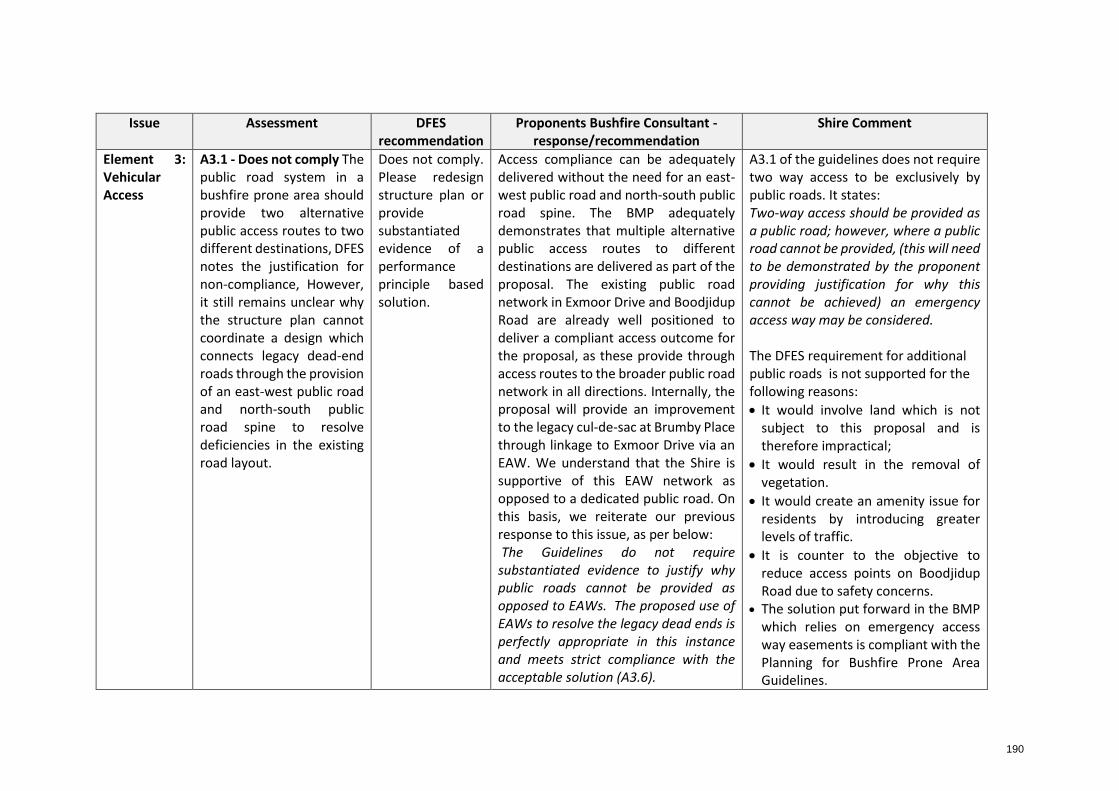
Issue Assessment DFES recommendation
Proponents Bushfire Consultant - response/recommendation
Shire Comment
Element 3: Vehicular Access
A3.1 - Does not comply The public road system in a bushfire prone area should provide two alternative public access routes to two different destinations, DFES notes the justification for non-compliance, However, it still remains unclear why the structure plan cannot coordinate a design which connects legacy dead-end roads through the provision of an east-west public road and north-south public road spine to resolve deficiencies in the existing road layout.
Does not comply. Please redesign structure plan or provide substantiated evidence of a performance principle based solution.
Access compliance can be adequately delivered without the need for an east-west public road and north-south public road spine. The BMP adequately demonstrates that multiple alternative public access routes to different destinations are delivered as part of the proposal. The existing public road network in Exmoor Drive and Boodjidup Road are already well positioned to deliver a compliant access outcome for the proposal, as these provide through access routes to the broader public road network in all directions. Internally, the proposal will provide an improvement to the legacy cul-de-sac at Brumby Place through linkage to Exmoor Drive via an EAW. We understand that the Shire is supportive of this EAW network as opposed to a dedicated public road. On this basis, we reiterate our previous response to this issue, as per below: The Guidelines do not require substantiated evidence to justify why public roads cannot be provided as opposed to EAWs. The proposed use of EAWs to resolve the legacy dead ends is perfectly appropriate in this instance and meets strict compliance with the acceptable solution (A3.6).
A3.1 of the guidelines does not require two way access to be exclusively by public roads. It states: Two-way access should be provided as a public road; however, where a public road cannot be provided, (this will need to be demonstrated by the proponent providing justification for why this cannot be achieved) an emergency access way may be considered. The DFES requirement for additional public roads is not supported for the following reasons:
It would involve land which is not subject to this proposal and is therefore impractical;
It would result in the removal of vegetation.
It would create an amenity issue for residents by introducing greater levels of traffic.
It is counter to the objective to reduce access points on Boodjidup Road due to safety concerns.
The solution put forward in the BMP which relies on emergency access way easements is compliant with the Planning for Bushfire Prone Area Guidelines.
190
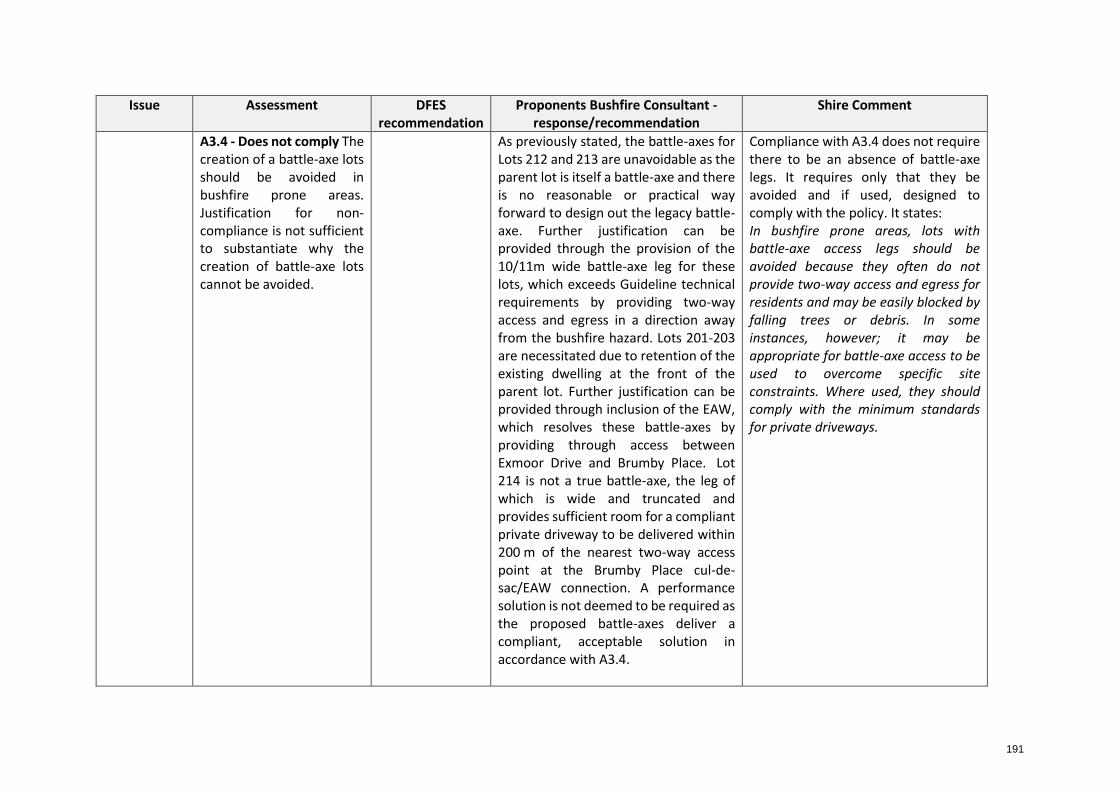
Issue Assessment DFES recommendation
Proponents Bushfire Consultant - response/recommendation
Shire Comment
A3.4 - Does not comply The creation of a battle-axe lots should be avoided in bushfire prone areas. Justification for non-compliance is not sufficient to substantiate why the creation of battle-axe lots cannot be avoided.
As previously stated, the battle-axes for Lots 212 and 213 are unavoidable as the parent lot is itself a battle-axe and there is no reasonable or practical way forward to design out the legacy battle-axe. Further justification can be provided through the provision of the 10/11m wide battle-axe leg for these lots, which exceeds Guideline technical requirements by providing two-way access and egress in a direction away from the bushfire hazard. Lots 201-203 are necessitated due to retention of the existing dwelling at the front of the parent lot. Further justification can be provided through inclusion of the EAW, which resolves these battle-axes by providing through access between Exmoor Drive and Brumby Place. Lot 214 is not a true battle-axe, the leg of which is wide and truncated and provides sufficient room for a compliant private driveway to be delivered within 200 m of the nearest two-way access point at the Brumby Place cul-de-sac/EAW connection. A performance solution is not deemed to be required as the proposed battle-axes deliver a compliant, acceptable solution in accordance with A3.4.
Compliance with A3.4 does not require there to be an absence of battle-axe legs. It requires only that they be avoided and if used, designed to comply with the policy. It states: In bushfire prone areas, lots with battle-axe access legs should be avoided because they often do not provide two-way access and egress for residents and may be easily blocked by falling trees or debris. In some instances, however; it may be appropriate for battle-axe access to be used to overcome specific site constraints. Where used, they should comply with the minimum standards for private driveways.
191
Issue Assessment DFES recommendation
Proponents Bushfire Consultant - response/recommendation
Shire Comment
A3.6 - Does not comply The EAW length and design does not meet the technical requirements in Table 6 of the Guidelines, DFES suggest review of the structure plan design and scope for the creation of a through public road, thereby avoiding the creation of battle-axes, whilst also facilitating infill development, with improved bushfire management outcomes for legacy development.
The length of the proposed EAW situated between Exmoor Drive and Brumby Place is approximately 570m, which is within compliant thresholds of acceptable solution A3.6 (i.e. within 600 m). The BMP adequately demonstrates that all technical requirements for the EAW, as per Guideline provisions of acceptable solution A3.6, will be complied with. As previously stated, it may also be argued that inclusion of the EAW provides a net benefit for the community, including lots outside of the Structure Plan area, by providing alternative access options for residents of Waler Place and Brumby Place, notwithstanding Lot 113, which is an existing battle-axe lot with only one access option at present. While a public road would also serve this purpose, our previous response to A3.1 above provides adequate justification for the suitability of the EAW as opposed to a public road. We do not consider that a performance solution is required as the proposed EAW is fully compliant with acceptable solution A3.6.
The technical requirements of A3.6 do not require the use of public roads. The length of the EAW meets with the technical requirements of the Guidelines.
192
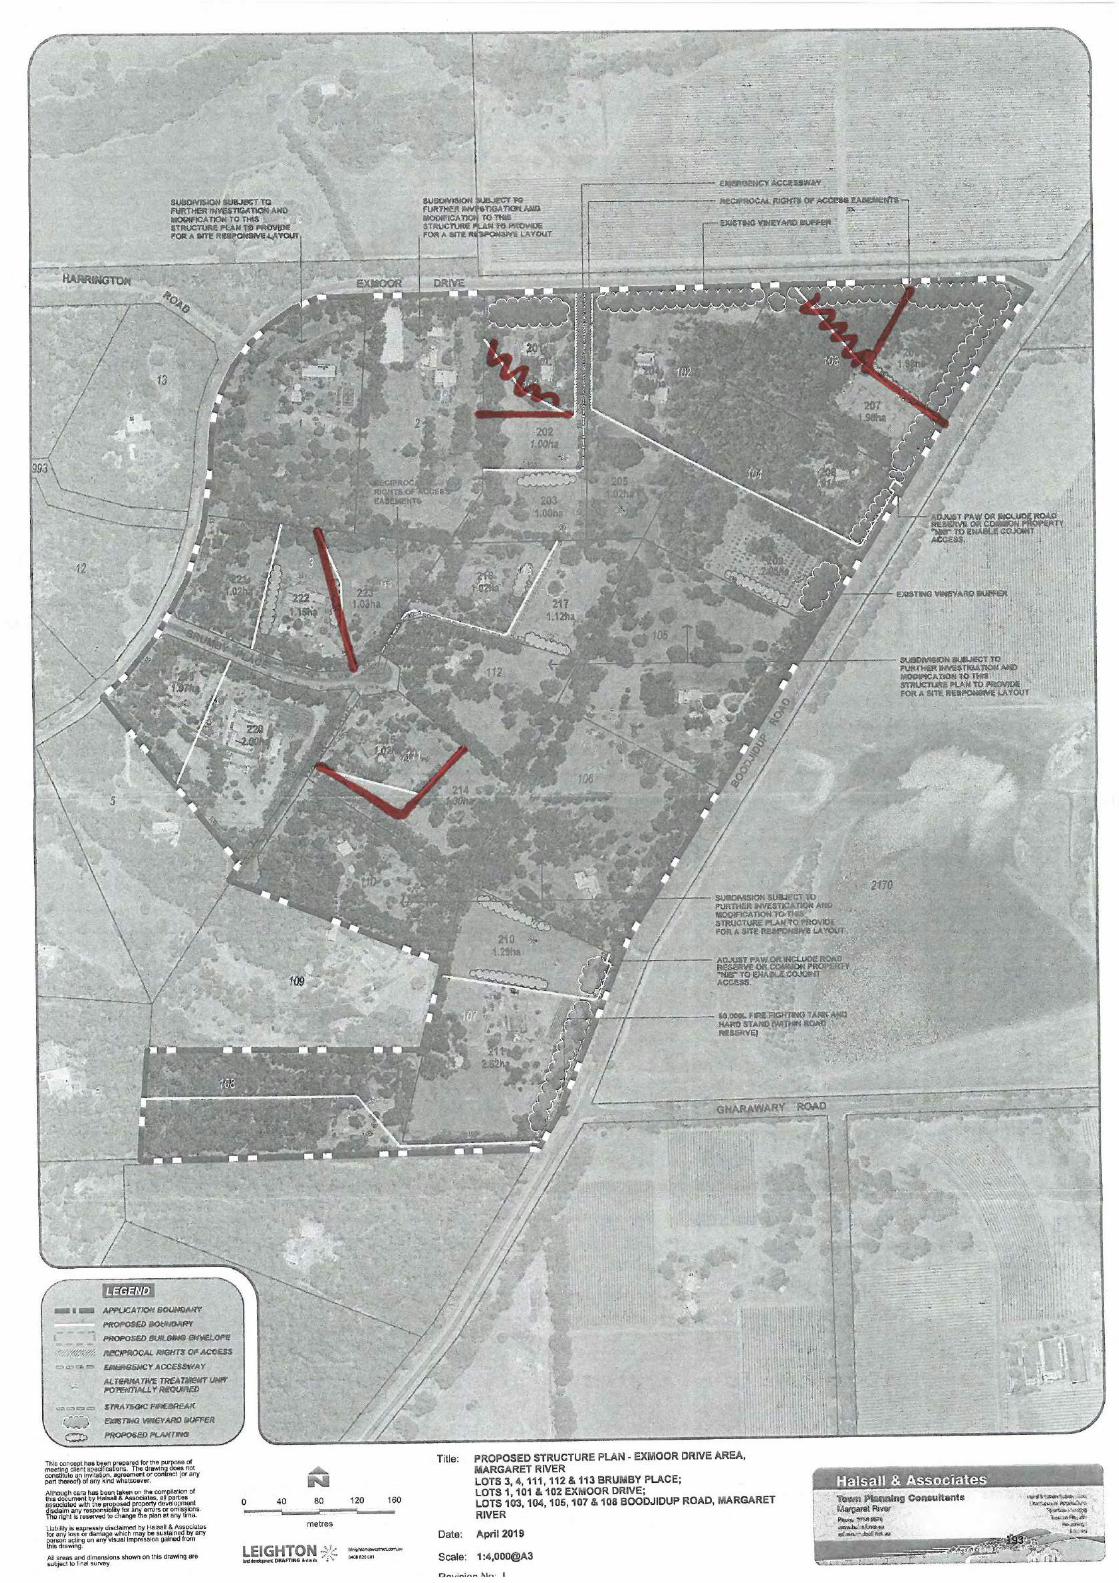
193

SHIRE OF AUGUSTA MARGARET RIVER ORDINARY COUNCIL MEETING 11 DECEMBER 2019
11.2 Sustainable Development 11.2.6 WALGA DECLARATION ON CLIMATE CHANGE
Attachment 1 – WALGA Climate Change Declaration
194

The Shire of Augusta Margaret River acknowledges that:
Evidence shows that climate change is occurring.
Climate change will continue to have significant effects on the Western Australian
environment, society and economy, and the Local Government sector.
Human behaviours, pollution and consumption patterns have both immediate and future
impacts on the climate and environment.
The Shire of Augusta Margaret River supports the:
Environmental, social and economic benefits of addressing climate change
immediately.
Opportunity for Local Government to demonstrate leadership in climate change
management at a community level.
Development of equitable and implementable State and Commonwealth strategies for
climate change management.
The Shire of Augusta Margaret River commits from date of signing to:
Set an appropriate, individual Local Government emissions reduction target and work
toward its achievement.
Work with State and Federal Government to ensure achievement of greenhouse gas
emissions reduction targets as set out in key National and International agreements.
Work with State and Federal Government to implement key actions and activities for
climate change management at a local level.
The Western Australian
Local Government Declaration
on Climate Change
195

Assess the regionally specific risks associated with climate change and implications for
Local Government services, and identify areas where appropriate mitigation and/or
adaptation strategies should be applied.
Develop an internal Climate Change Action Plan (CCAP) for climate change actions
across all Local Government functions, with a focus on the two, five and ten year future.
Ensure that, at appropriate review intervals, the strategic plan and policies for the Local
Government are reviewed and amended to reflect climate change management
priorities and emissions reduction targets.
Encourage and empower the local community and local businesses to adapt to the
impacts of climate change and to reduce their greenhouse gas emissions.
Monitor the progress of climate change initiatives and ensure full communication of
achievements for Council and Community.
Signed:
President - Shire of Augusta Margaret River
President - Western Australian Local Government Association
Signed:
Date:
Date:
196


