Embed Size (px)
Citation preview

18 | ANIMALREPRODUCTION ANDDEVELOPMENT
Figure 18.1 Female seahorses produce eggs that are then fertilized by the male. Unlike with almost all other animals,the young then develop in a pouch of the male seahorse until birth. (credit: "cliff1066"/Flickr)
Chapter Outline18.1: How Animals Reproduce
18.2: Development and Organogenesis
18.3: Human Reproduction
IntroductionIn the animal kingdom, each species has its unique adaptations for reproduction. Asexual reproduction produces geneticallyidentical offspring (clones), whereas in sexual reproduction, the genetic material of two individuals combines to produceoffspring that are genetically different from their parents. During sexual reproduction the male gamete (sperm) may beplaced inside the female’s body for internal fertilization, the sperm may be left in the environment for the female to pickup and place in her body, or both sperm and eggs may be released into the environment for external fertilization. Seahorsesprovide an example of the latter, but with a twist (Figure 18.1). Following a mating dance, the female releases eggs intothe male seahorse’s abdominal brood pouch and the male releases sperm into the water, which then find their way into thebrood pouch to fertilize the eggs. The fertilized eggs develop in the pouch for several weeks.
Chapter 18 | Animal Reproduction and Development 477

18.1 | How Animals Reproduce
By the end of this section, you will be able to:
• Describe advantages and disadvantages of asexual and sexual reproduction
• Discuss asexual reproduction methods
• Discuss sexual reproduction methods
• Discuss internal and external methods of fertilization
Some animals produce offspring through asexual reproduction while other animals produce offspring through sexualreproduction. Both methods have advantages and disadvantages. Asexual reproduction produces offspring that aregenetically identical to the parent because the offspring are all clones of the original parent. A single individual canproduce offspring asexually and large numbers of offspring can be produced quickly; these are two advantages thatasexually reproducing organisms have over sexually reproducing organisms. In a stable or predictable environment, asexualreproduction is an effective means of reproduction because all the offspring will be adapted to that environment. In anunstable or unpredictable environment, species that reproduce asexually may be at a disadvantage because all the offspringare genetically identical and may not be adapted to different conditions.
During sexual reproduction, the genetic material of two individuals is combined to produce genetically diverse offspringthat differ from their parents. The genetic diversity of sexually produced offspring is thought to give sexually reproducingindividuals greater fitness because more of their offspring may survive and reproduce in an unpredictable or changingenvironment. Species that reproduce sexually (and have separate sexes) must maintain two different types of individuals,males and females. Only half the population (females) can produce the offspring, so fewer offspring will be produced whencompared to asexual reproduction. This is a disadvantage of sexual reproduction compared to asexual reproduction.
Asexual ReproductionAsexual reproduction occurs in prokaryotic microorganisms (bacteria and archaea) and in many eukaryotic, single-celledand multi-celled organisms. There are several ways that animals reproduce asexually, the details of which vary amongindividual species.
Fission
Fission, also called binary fission, occurs in some invertebrate, multi-celled organisms. It is in some ways analogous tothe process of binary fission of single-celled prokaryotic organisms. The term fission is applied to instances in which anorganism appears to split itself into two parts and, if necessary, regenerate the missing parts of each new organism. Forexample, species of turbellarian flatworms commonly called the planarians, such as Dugesia dorotocephala, are able toseparate their bodies into head and tail regions and then regenerate the missing half in each of the two new organisms. Seaanemones (Cnidaria), such as species of the genus Anthopleura (Figure 18.2), will divide along the oral-aboral axis, and seacucumbers (Echinodermata) of the genus Holothuria, will divide into two halves across the oral-aboral axis and regeneratethe other half in each of the resulting individuals.
478 Chapter 18 | Animal Reproduction and Development
This OpenStax book is available for free at http://cnx.org/content/col11487/1.9

Figure 18.2 The Anthopleura artemisia sea anemone can reproduce through fission.
Budding
Budding is a form of asexual reproduction that results from the outgrowth of a part of the body leading to a separationof the “bud” from the original organism and the formation of two individuals, one smaller than the other. Budding occurscommonly in some invertebrate animals such as hydras and corals. In hydras, a bud forms that develops into an adult andbreaks away from the main body (Figure 18.3).
Figure 18.3 (a) Hydra reproduce asexually through budding: a bud forms on the tubular body of an adult hydra,develops a mouth and tentacles, and then detaches from its parent. The new hydra is fully developed and will findits own location for attachment. (b) Some coral, such as the Lophelia pertusa shown here, can reproduce throughbudding. (credit b: modification of work by Ed Bowlby, NOAA/Olympic Coast NMS; NOAA/OAR/Office of OceanExploration)
View this video (http://openstaxcollege.org/l/budding_hydra2) to see a hydra budding.
Fragmentation
Fragmentation is the breaking of an individual into parts followed by regeneration. If the animal is capable offragmentation, and the parts are big enough, a separate individual will regrow from each part. Fragmentation mayoccur through accidental damage, damage from predators, or as a natural form of reproduction. Reproduction through
Chapter 18 | Animal Reproduction and Development 479

fragmentation is observed in sponges, some cnidarians, turbellarians, echinoderms, and annelids. In some sea stars, a newindividual can be regenerated from a broken arm and a piece of the central disc. This sea star (Figure 18.4) is in the processof growing a complete sea star from an arm that has been cut off. Fisheries workers have been known to try to kill the seastars eating their clam or oyster beds by cutting them in half and throwing them back into the ocean. Unfortunately for theworkers, the two parts can each regenerate a new half, resulting in twice as many sea stars to prey upon the oysters andclams.
Figure 18.4 (a) Linckia multifora is a species of sea star that can reproduce asexually via fragmentation. In thisprocess, (b) an arm that has been shed grows into a new sea star. (credit a: modifiction of work by Dwayne Meadows,NOAA/NMFS/OPR)
Parthenogenesis
Parthenogenesis is a form of asexual reproduction in which an egg develops into an individual without being fertilized.The resulting offspring can be either haploid or diploid, depending on the process in the species. Parthenogenesis occursin invertebrates such as water fleas, rotifers, aphids, stick insects, and ants, wasps, and bees. Ants, bees, and wasps useparthenogenesis to produce haploid males (drones). The diploid females (workers and queens) are the result of a fertilizedegg.
Some vertebrate animals—such as certain reptiles, amphibians, and fish—also reproduce through parthenogenesis.Parthenogenesis has been observed in species in which the sexes were separated in terrestrial or marine zoos. Two femaleKomodo dragons, a hammerhead shark, and a blacktop shark have produced parthenogenic young when the femaleshave been isolated from males. It is possible that the asexual reproduction observed occurred in response to unusualcircumstances and would normally not occur.
Sexual ReproductionSexual reproduction is the combination of reproductive cells from two individuals to form genetically unique offspring. Thenature of the individuals that produce the two kinds of gametes can vary, having for example separate sexes or both sexesin each individual. Sex determination, the mechanism that determines which sex an individual develops into, also can vary.
Hermaphroditism
Hermaphroditism occurs in animals in which one individual has both male and female reproductive systems. Invertebratessuch as earthworms, slugs, tapeworms, and snails (Figure 18.5) are often hermaphroditic. Hermaphrodites may self-fertilize, but typically they will mate with another of their species, fertilizing each other and both producing offspring. Self-fertilization is more common in animals that have limited mobility or are not motile, such as barnacles and clams. Manyspecies have specific mechanisms in place to prevent self-fertilization, because it is an extreme form of inbreeding andusually produces less fit offspring.
480 Chapter 18 | Animal Reproduction and Development
This OpenStax book is available for free at http://cnx.org/content/col11487/1.9

Figure 18.5 Many (a) snails are hermaphrodites. When two individuals (b) mate, they can produce up to 100 eggseach. (credit a: modification of work by Assaf Shtilman; credit b: modification of work by "Schristia"/Flickr)
Sex DeterminationMammalian sex is determined genetically by the combination of X and Y chromosomes. Individuals homozygous for X(XX) are female and heterozygous individuals (XY) are male. In mammals, the presence of a Y chromosome causes thedevelopment of male characteristics and its absence results in female characteristics. The XY system is also found in someinsects and plants.
Bird sex determination is dependent on the combination of Z and W chromosomes. Homozygous for Z (ZZ) results in amale and heterozygous (ZW) results in a female. Notice that this system is the opposite of the mammalian system becausein birds the female is the sex with the different sex chromosomes. The W appears to be essential in determining the sex ofthe individual, similar to the Y chromosome in mammals. Some fish, crustaceans, insects (such as butterflies and moths),and reptiles use the ZW system.
More complicated chromosomal sex determining systems also exist. For example, some swordtail fish have three sexchromosomes in a population.
The sex of some other species is not determined by chromosomes, but by some aspect of the environment. Sexdetermination in alligators, some turtles, and tuataras, for example, is dependent on the temperature during the middle thirdof egg development. This is referred to as environmental sex determination, or more specifically, as temperature-dependentsex determination. In many turtles, cooler temperatures during egg incubation produce males and warm temperaturesproduce females, while in many other species of turtles, the reverse is true. In some crocodiles and some turtles, moderatetemperatures produce males and both warm and cool temperatures produce females.
Individuals of some species change their sex during their lives, switching from one to the other. If the individual is femalefirst, it is termed protogyny or “first female,” if it is male first, it is termed protandry or “first male.” Oysters are born male,grow in size, and become female and lay eggs. The wrasses, a family of reef fishes, are all sequential hermaphrodites. Someof these species live in closely coordinated schools with a dominant male and a large number of smaller females. If the maledies, a female increases in size, changes sex, and becomes the new dominant male.
FertilizationThe fusion of a sperm and an egg is a process called fertilization. This can occur either inside ( internal fertilization)or outside ( external fertilization) the body of the female. Humans provide an example of the former, whereas frogreproduction is an example of the latter.
External FertilizationExternal fertilization usually occurs in aquatic environments where both eggs and sperm are released into the water. Afterthe sperm reaches the egg, fertilization takes place. Most external fertilization happens during the process of spawningwhere one or several females release their eggs and the male(s) release sperm in the same area, at the same time. Thespawning may be triggered by environmental signals, such as water temperature or the length of daylight. Nearly all fishspawn, as do crustaceans (such as crabs and shrimp), mollusks (such as oysters), squid, and echinoderms (such as seaurchins and sea cucumbers). Frogs, corals, molluscs, and sea cucumbers also spawn (Figure 18.6).
Chapter 18 | Animal Reproduction and Development 481

Figure 18.6 During sexual reproduction in toads, the male grasps the female from behind and externally fertilizes theeggs as they are deposited. (credit: Bernie Kohl)
Internal Fertilization
Internal fertilization occurs most often in terrestrial animals, although some aquatic animals also use this method. Internalfertilization may occur by the male directly depositing sperm in the female during mating. It may also occur by the maledepositing sperm in the environment, usually in a protective structure, which a female picks up to deposit the sperm in herreproductive tract. There are three ways that offspring are produced following internal fertilization. In oviparity, fertilizedeggs are laid outside the female’s body and develop there, receiving nourishment from the yolk that is a part of the egg(Figure 18.7a). This occurs in some bony fish, some reptiles, a few cartilaginous fish, some amphibians, a few mammals,and all birds. Most non-avian reptiles and insects produce leathery eggs, while birds and some turtles produce eggs withhigh concentrations of calcium carbonate in the shell, making them hard. Chicken eggs are an example of a hard shell. Theeggs of the egg-laying mammals such as the platypus and echidna are leathery.
In ovoviparity, fertilized eggs are retained in the female, and the embryo obtains its nourishment from the egg’s yolk. Theeggs are retained in the female’s body until they hatch inside of her, or she lays the eggs right before they hatch. Thisprocess helps protect the eggs until hatching. This occurs in some bony fish (like the platyfish Xiphophorus maculatus,Figure 18.7b), some sharks, lizards, some snakes (garter snake Thamnophis sirtalis), some vipers, and some invertebrateanimals (Madagascar hissing cockroach Gromphadorhina portentosa).
In viviparity the young are born alive. They obtain their nourishment from the female and are born in varying states ofmaturity. This occurs in most mammals (Figure 18.7c), some cartilaginous fish, and a few reptiles.
Figure 18.7 In (a) oviparity, young develop in eggs outside the female body, as with these Harmonia axydridisbeetles hatching. Some aquatic animals, like this (b) pregnant Xiphophorus maculatus are ovoviparous, with the eggdeveloping inside the female and nutrition supplied primarily from the yolk. In mammals, nutrition is supported by theplacenta, as was the case with this (c) newborn squirrel. (credit b: modification of work by Gourami Watcher; credit c:modification of work by "audreyjm529"/Flickr)
18.2 | Development and Organogenesis
By the end of this section, you will be able to:
• Explain how the embryo forms from the zygote
• Discuss the role of cleavage and gastrulation in animal development
• Describe organogenesis
482 Chapter 18 | Animal Reproduction and Development
This OpenStax book is available for free at http://cnx.org/content/col11487/1.9

The process by which an organism develops from a single-celled zygote to a multi-cellular organism is complex and wellregulated. The regulation occurs through signaling between cells and tissues and responses in the form of differential geneexpression.
Early Embryonic DevelopmentFertilization is the process in which gametes (an egg and sperm) fuse to form a zygote (Figure 18.8). To ensure that theoffspring has only one complete diploid set of chromosomes, only one sperm must fuse with one egg. In mammals, a layercalled the zona pellucida protects the egg. At the tip of the head of a sperm cell is a structure like a lysosome called theacrosome, which contains enzymes. When a sperm binds to the zona pellucida, a series of events, called the acrosomalreactions, take place. These reactions, involving enzymes from the acrosome, allow the sperm plasma membrane to fusewith the egg plasma membrane and permit the sperm nucleus to transfer into the ovum. The nuclear membranes of the eggand sperm break down and the two haploid nuclei fuse to form a diploid nucleus or genome.
Figure 18.8 Fertilization is the process in which sperm and egg fuse to form a zygote. (credit: scale-bar data from MattRussell)
To ensure that no more than one sperm fertilizes the egg, once the acrosomal reactions take place at one location of the eggmembrane, the egg releases proteins in other locations to prevent other sperm from fusing with the egg.
The development of multi-cellular organisms begins from this single-celled zygote, which undergoes rapid cell division,called cleavage (Figure 18.9a), to form a hollow ball of cells called a blastula (Figure 18.9b).
Figure 18.9 (a) During cleavage, the zygote rapidly divides into multiple cells. (b) The cells rearrange themselves toform a hollow ball called the blastula. (credit a: modification of work by Gray's Anatomy; credit b: modification of workby Pearson Scott Foresman; donated to the Wikimedia Foundation)
In mammals, the blastula forms the blastocyst in the next stage of development. Here the cells in the blastula arrangethemselves in two layers: the inner cell mass, and an outer layer called the trophoblast. The inner cell mass will go on toform the embryo. The trophoblast secretes enzymes that allow implantation of the blastocyst into the endometrium of theuterus. The trophoblast will contribute to the placenta and nourish the embryo.
Chapter 18 | Animal Reproduction and Development 483

Visit the Virtual Human Embryo project (http://openstaxcollege.org/l/human_embryo2) at the Endowment forHuman Development site to click through an interactive of the stages of embryo development, including micrographs androtating 3-D images.
The cells in the blastula then rearrange themselves spatially to form three layers of cells. This process is called gastrulation.During gastrulation, the blastula folds in on itself and cells migrate to form the three layers of cells (Figure 18.10) in astructure, the gastrula, with a hollow space that will become the digestive tract. Each of the layers of cells is called a germlayer and will differentiate into different organ systems.
Figure 18.10 Gastrulation is the process wherein the cells in the blastula rearrange themselves to form the germlayers. (credit: modification of work by Abigail Pyne)
The three germ layers are the endoderm, the ectoderm, and the mesoderm. Cells in each germ layer differentiate intotissues and embryonic organs. The ectoderm gives rise to the nervous system and the epidermis, among other tissues. Themesoderm gives rise to the muscle cells and connective tissue in the body. The endoderm gives rise to the gut and manyinternal organs.
Organogenesis
Gastrulation leads to the formation of the three germ layers that give rise during further development to the different organsin the animal body. This process is called organogenesis.
Organs develop from the germ layers through the process of differentiation. During differentiation, the embryonic stemcells express specific sets of genes that will determine their ultimate cell type. For example, some cells in the ectoderm willexpress the genes specific to skin cells. As a result, these cells will take on the shape and characteristics of epidermal cells.The process of differentiation is regulated by location-specific chemical signals from the cell’s embryonic environment thatsets in play a cascade of events that regulates gene expression.
18.3 | Human Reproduction
By the end of this section, you will be able to:
• Describe human male and female reproductive anatomies
• Describe spermatogenesis and oogenesis and discuss their differences and similarities
• Describe the role of hormones in human reproduction
• Describe the roles of male and female reproductive hormones
As in all animals, the adaptations for reproduction in humans are complex. They involve specialized and different anatomiesin the two sexes, a hormone regulation system, and specialized behaviors regulated by the brain and endocrine system.
484 Chapter 18 | Animal Reproduction and Development
This OpenStax book is available for free at http://cnx.org/content/col11487/1.9

Human Reproductive AnatomyThe reproductive tissues of male and female humans develop similarly in utero until about the seventh week of gestationwhen a low level of the hormone testosterone is released from the gonads of the developing male. Testosterone causes theprimitive gonads to differentiate into male sexual organs. When testosterone is absent, the primitive gonads develop intoovaries. Tissues that produce a penis in males produce a clitoris in females. The tissue that will become the scrotum in amale becomes the labia in a female. Thus the male and female anatomies arise from a divergence in the development ofwhat were once common embryonic structures.
Male Reproductive Anatomy
Sperm are immobile at body temperature; therefore, the testes are external to the body so that a correct temperature ismaintained for motility. In land mammals, including humans, the pair of testes must be suspended outside the body so theenvironment of the sperm is about 2 °C lower than body temperature to produce viable sperm. If the testes do not descendthrough the abdominal cavity during fetal development, the individual has reduced fertility.
The scrotum houses the testicles or testes (singular: testis), and provides passage for blood vessels, nerves, and musclesrelated to testicular function. The testes are a pair of male gonads that produce sperm and reproductive hormones. Eachtestis is approximately 2.5 by 3.8 cm (1.5 by 1 inch) in size and divided into wedge-shaped lobes by septa. Coiled in eachwedge are seminiferous tubules that produce sperm.
The penis drains urine from the urinary bladder and is a copulatory organ during intercourse (Figure 18.12; Table 18.1).The penis contains three tubes of erectile tissue that become engorged with blood, making the penis erect, in preparation forintercourse. The organ is inserted into the vagina culminating with an ejaculation. During orgasm, the accessory organs andglands connected to the testes contract and empty the semen (containing sperm) into the urethra and the fluid is expelledfrom the body by muscular contractions causing ejaculation. After intercourse, the blood drains from the erectile tissue andthe penis becomes flaccid.
Semen is a mixture of sperm (about five percent of the total) and fluids from accessory glands that contribute most ofthe semen’s volume. Sperm are haploid cells, consisting of a flagellum for motility, a neck that contains the cell’s energy-producing mitochondria, and a head that contains the genetic material (Figure 18.11). An acrosome (acrosomal vesicle)is found at the top of the head of the sperm. This structure contains enzymes that can digest the protective coverings thatsurround the egg and allow the sperm to fuse with the egg. An ejaculate will contain from two to five milliliters of fluid andfrom 50–120 million sperm per milliliter.
Figure 18.11 As seen in this scanning electron micrograph, human sperm has a flagellum, neck, and head. (credit:scale-bar data from Matt Russell)
Sperm form in the walls of seminiferous tubules that are coiled inside the testes (Figure 18.12; Table 18.1). The wallsof the seminiferous tubules are made up of the developing sperm cells, with the least developed sperm at the periphery ofthe tubule and the fully developed sperm next to the lumen. The sperm cells are associated with Sertoli cells that nourishand promote the development of the sperm. Other cells present between the walls of the tubules are the interstitial cells ofLeydig, which produce testosterone once the male reaches adolescence.
When the sperm have developed flagella they leave the seminiferous tubules and enter the epididymis (Figure 18.12; Table18.1). This structure lies along the top and posterior of the testes and is the site of sperm maturation. The sperm leave theepididymis and enter the vas deferens, which carries the sperm behind the bladder, and forms the ejaculatory duct with the
Chapter 18 | Animal Reproduction and Development 485

duct from the seminal vesicles. During a vasectomy, a section of the vas deferens is removed, preventing sperm (but not thesecretions of the accessory glands) from being passed out of the body during ejaculation and preventing fertilization.
The bulk of the semen comes from the accessory glands associated with the male reproductive system. These are theseminal vesicles, the prostate gland, and the bulbourethral gland (Figure 18.12; Table 18.1). The secretions from theaccessory glands provide important compounds for the sperm including nutrients, electrolytes, and pH buffering. There arealso coagulation factors that affect sperm delivery and motility.
Figure 18.12 The reproductive structures of the human male are shown.
Which of the following statements about the male reproductive system is false?
a. The vas deferens carries sperm from the testes to the seminal vesicles.
b. The ejaculatory duct joins the urethra.
c. Both the prostate and the bulbourethral glands produce components of the semen.
d. The prostate gland is located in the testes.
Male Reproductive AnatomyOrgan Location Function
Scrotum External Supports testes and regulates their temperature
Penis External Delivers urine, copulating organ
Testes Internal Produce sperm and male hormones
Seminal Vesicles Internal Contribute to semen production
Prostate Gland Internal Contributes to semen production
Bulbourethtral Glands Internal Neutralize urine in urethra
Table 18.1
486 Chapter 18 | Animal Reproduction and Development
This OpenStax book is available for free at http://cnx.org/content/col11487/1.9

Female Reproductive Anatomy
A number of female reproductive structures are exterior to the body. These include the breasts and the vulva, which consistsof the mons pubis, clitoris, labia majora, labia minora, and the vestibular glands (Figure 18.13; Table 18.2).
Figure 18.13 The reproductive structures of the human female are shown. (credit a: modification of work by Gray'sAnatomy; credit b: modification of work by CDC)
The breasts consist of mammary glands and fat. Each gland consists of 15 to 25 lobes that have ducts that empty at thenipple and that supply the nursing child with nutrient- and antibody-rich milk to aid development and protect the child.
Internal female reproductive structures include ovaries, oviducts, the uterus, and the vagina (Figure 18.13; Table 18.2). Thepair of ovaries is held in place in the abdominal cavity by a system of ligaments. The outermost layer of the ovary is madeup of follicles, each consisting of one or more follicular cells that surround, nourish, and protect a single egg. During themenstrual period, a batch of follicular cells develops and prepares their eggs for release. At ovulation, one follicle rupturesand one egg is released. Following ovulation, the follicular tissue that surrounded the ovulated egg stays within the ovaryand grows to form a solid mass called the corpus luteum. The corpus luteum secretes additional estrogen and the hormoneprogesterone that helps maintain the uterine lining during pregnancy. The ovaries also produce hormones, such as estrogen.
The oviducts, or fallopian tubes, extend from the uterus in the lower abdominal cavity to the ovaries, but they are not incontact with the ovaries. The lateral ends of the oviducts flare out into a trumpet-like structure and have a fringe of finger-like projections called fimbrae. When an egg is released at ovulation, the fimbrae help the nonmotile egg enter into the tube.The walls of the oviducts have a ciliated epithelium over smooth muscle. The cilia beat, and the smooth muscle contracts,moving the egg toward the uterus. Fertilization usually takes place within the oviduct and the developing embryo is movedtoward the uterus. It usually takes the egg or embryo a week to travel through the oviduct.
Sterilization in women is called a tubal ligation; it is analogous to a vasectomy in males in that the oviducts are severed andsealed, preventing sperm from reaching the egg.
The uterus is a structure about the size of a woman’s fist. The uterus has a thick muscular wall and is lined with anendometrium rich in blood vessels and mucus glands that develop and thicken during the female cycle. Thickening of theendometrium prepares the uterus to receive the fertilized egg or zygote, which will then implant itself in the endometrium.The uterus supports the developing embryo and fetus during gestation. Contractions of the smooth muscle in the uterusaid in forcing the baby through the vagina during labor. If fertilization does not occur, a portion of the lining of the uterussloughs off during each menstrual period. The endometrium builds up again in preparation for implantation. Part of theuterus, called the cervix, protrudes into the top of the vagina.
The vagina is a muscular tube that serves several purposes. It allows menstrual flow to leave the body. It is the receptaclefor the penis during intercourse and the pathway for the delivery of offspring.
Chapter 18 | Animal Reproduction and Development 487

Female Reproductive AnatomyOrgan Location Function
Clitoris External Sensory organ
Mons pubis External Fatty area overlying pubic bone
Labia majora External Covers labia minora; contains sweat and sebaceous glands
Labia minora External Covers vestibule
Greater vestibular glands External Secrete mucus; lubricate vagina
Breast External Produces and delivers milk
Ovaries Internal Produce and develop eggs
Oviducts Internal Transport egg to uterus; site of fertilization
Uterus Internal Supports developing embryo
Vagina Internal Common tube for intercourse, birth canal, passing menstrual flow
Table 18.2
Gametogenesis (Spermatogenesis and Oogenesis)Gametogenesis, the production of sperm and eggs, involves the process of meiosis. During meiosis, two nuclear divisionsseparate the paired chromosomes in the nucleus and then separate the chromatids that were made during an earlier stage ofthe cell’s life cycle. Meiosis and its associated cell divisions produces haploid cells with half of each pair of chromosomesnormally found in diploid cells. The production of sperm is called spermatogenesis and the production of eggs is calledoogenesis.
Spermatogenesis
Spermatogenesis occurs in the wall of the seminiferous tubules, with the most primitive cells at the periphery of the tubeand the most mature sperm at the lumen of the tube (Figure 18.14). Immediately under the capsule of the tubule are diploid,undifferentiated cells. These stem cells, each called a spermatogonium (pl. spermatogonia), go through mitosis to produceone cell that remains as a stem cell and a second cell called a primary spermatocyte that will undergo meiosis to producesperm.
The diploid primary spermatocyte goes through meiosis I to produce two haploid cells called secondary spermatocytes.Each secondary spermatocyte divides after meiosis II to produce two cells called spermatids. The spermatids eventuallyreach the lumen of the tubule and grow a flagellum, becoming sperm cells. Four sperm result from each primaryspermatocyte that goes through meiosis.
488 Chapter 18 | Animal Reproduction and Development
This OpenStax book is available for free at http://cnx.org/content/col11487/1.9

Figure 18.14 During spermatogenesis, four sperm result from each primary spermatocyte. The process also mapsonto the physical structure of the wall of the seminiferous tubule, with the spermatogonia on the outer side of thetubule, and the sperm with their developing tails extended into the lumen of the tubule.
Visit this site (http://openstaxcollege.org/l/spermatogenes2) to see the process of spermatogenesis.
Oogenesis
Oogenesis occurs in the outermost layers of the ovaries. As with sperm production, oogenesis starts with a germ cell. Inoogenesis, this germ cell is called an oogonium and forms during the embryological development of the individual. Theoogonium undergoes mitosis to produce about one to two million oocytes by the time of birth.
Chapter 18 | Animal Reproduction and Development 489

Figure 18.15 The process of oogenesis occurs in the ovary’s outermost layer.
The primary oocytes begin meiosis before birth (Figure 18.15). However, the meiotic division is arrested in its progress inthe first prophase stage. At the time of birth, all future eggs are in prophase I. This situation is in contrast with the malereproductive system in which sperm are produced continuously throughout the life of the individual. Starting at adolescence,anterior pituitary hormones cause the development of a few follicles in an ovary each month. This results in a primaryoocyte finishing the first meiotic division. The cell divides unequally, with most of the cytoplasm and organelles goingto one cell, called a secondary oocyte, and only one set of chromosomes and a small amount of cytoplasm going to theother cell. This second cell is called a polar body and usually dies. Cell division is again arrested, this time at metaphase II.At ovulation, this secondary oocyte is released and travels toward the uterus through the oviduct. If the secondary oocyteis fertilized, the cell continues through meiosis II, producing a second polar body and haploid egg, which fuses with thehaploid sperm to form a fertilized egg (zygote) containing all 46 chromosomes.
Hormonal Control of ReproductionThe human male and female reproductive cycles are controlled by the interaction of hormones from the hypothalamus andanterior pituitary with hormones from reproductive tissues and organs. In both sexes, the hypothalamus monitors and causesthe release of hormones from the anterior pituitary gland. When the reproductive hormone is required, the hypothalamussends a gonadotropin-releasing hormone (GnRH) to the anterior pituitary. This causes the release of follicle stimulatinghormone (FSH) and luteinizing hormone (LH) from the anterior pituitary into the blood. Although these hormones arenamed after their functions in female reproduction, they are produced in both sexes and play important roles in controllingreproduction. Other hormones have specific functions in the male and female reproductive systems.
Male Hormones
At the onset of puberty, the hypothalamus causes the release of FSH and LH into the male system for the first time.FSH enters the testes and stimulates the Sertoli cells located in the walls of the seminiferous tubules to begin promotingspermatogenesis (Figure 18.16). LH also enters the testes and stimulates the interstitial cells of Leydig, located in betweenthe walls of the seminiferous tubules, to make and release testosterone into the testes and the blood.
Testosterone stimulates spermatogenesis. This hormone is also responsible for the secondary sexual characteristics thatdevelop in the male during adolescence. The secondary sex characteristics in males include a deepening of the voice, thegrowth of facial, axillary, and pubic hair, an increase in muscle bulk, and the beginnings of the sex drive.
490 Chapter 18 | Animal Reproduction and Development
This OpenStax book is available for free at http://cnx.org/content/col11487/1.9

Figure 18.16 Hormones control sperm production in a negative feedback system.
A negative feedback system occurs in the male with rising levels of testosterone acting on the hypothalamus and anteriorpituitary to inhibit the release of GnRH, FSH, and LH. In addition, the Sertoli cells produce the hormone inhibin, whichis released into the blood when the sperm count is too high. This inhibits the release of GnRH and FSH, which will causespermatogenesis to slow down. If the sperm count reaches a low of 20 million/mL, the Sertoli cells cease the release ofinhibin, and the sperm count increases.
Female HormonesThe control of reproduction in females is more complex. The female reproductive cycle is divided into the ovarian cycleand the menstrual cycle. The ovarian cycle governs the preparation of endocrine tissues and release of eggs, while themenstrual cycle governs the preparation and maintenance of the uterine lining (Figure 18.17). These cycles are coordinatedover a 22–32 day cycle, with an average length of 28 days.
As with the male, the GnRH from the hypothalamus causes the release of the hormones FSH and LH from the anteriorpituitary. In addition, estrogen and progesterone are released from the developing follicles. As with testosterone in males,estrogen is responsible for the secondary sexual characteristics of females. These include breast development, flaring of thehips, and a shorter period for bone growth.
The Ovarian Cycle and the Menstrual Cycle
The ovarian and menstrual cycles are regulated by hormones of the hypothalamus, pituitary, and ovaries (Figure 18.17).The ebb and flow of the hormones causes the ovarian and menstrual cycles to advance. The ovarian and menstrual cyclesoccur concurrently. The first half of the ovarian cycle is the follicular phase. Slowly rising levels of FSH cause the growth offollicles on the surface of the ovary. This process prepares the egg for ovulation. As the follicles grow, they begin releasingestrogen. The first few days of this cycle coincide with menstruation or the sloughing off of the functional layer of theendometrium in the uterus. After about five days, estrogen levels rise and the menstrual cycle enters the proliferative phase.The endometrium begins to regrow, replacing the blood vessels and glands that deteriorated during the end of the last cycle.
Chapter 18 | Animal Reproduction and Development 491

Figure 18.17 The ovarian and menstrual cycles of female reproduction are regulated by hormones produced bythe hypothalamus, pituitary, and ovaries.
Which of the following statements about hormone regulation of the female reproductive cycle is false?
a. LH and FSH are produced in the pituitary, and estrogen and progesterone are produced in the ovaries.
b. Estradiol and progesterone secreted from the corpus luteum cause the endometrium to thicken.
c. Both progesterone and estrogen are produced by the follicles.
d. Secretion of GnRH by the hypothalamus is inhibited by low levels of estrogen but stimulated by highlevels of estrogen.
Just prior to the middle of the cycle (approximately day 14), the high level of estrogen causes FSH and especially LH torise rapidly then fall. The spike in LH causes the most mature follicle to rupture and release its egg. This is ovulation. Thefollicles that did not rupture degenerate and their eggs are lost. The level of estrogen decreases when the extra folliclesdegenerate.
Following ovulation, the ovarian cycle enters its luteal phase and the menstrual cycle enters its secretory phase, both ofwhich run from about day 15 to 28. The luteal and secretory phases refer to changes in the ruptured follicle. The cells inthe follicle undergo physical changes and produce a structure called a corpus luteum. The corpus luteum produces estrogen
492 Chapter 18 | Animal Reproduction and Development
This OpenStax book is available for free at http://cnx.org/content/col11487/1.9

and progesterone. The progesterone facilitates the regrowth of the uterine lining and inhibits the release of further FSH andLH. The uterus is being prepared to accept a fertilized egg, should it occur during this cycle. The inhibition of FSH and LHprevents any further eggs and follicles from developing, while the progesterone is elevated. The level of estrogen producedby the corpus luteum increases to a steady level for the next few days.
If no fertilized egg is implanted into the uterus, the corpus luteum degenerates and the levels of estrogen and progesteronedecrease. The endometrium begins to degenerate as the progesterone levels drop, initiating the next menstrual cycle. Thedecrease in progesterone also allows the hypothalamus to send GnRH to the anterior pituitary, releasing FSH and LH andstarting the cycles again.
Reproductive EndocrinologistA reproductive endocrinologist is a physician who treats a variety of hormonal disorders related toreproduction and infertility in both men and women. The disorders include menstrual problems, infertility,pregnancy loss, sexual dysfunction, and menopause. Doctors may use fertility drugs, surgery, or assistedreproductive techniques (ART) in their therapy. ART involves the use of procedures to manipulate the eggor sperm to facilitate reproduction, such as in vitro fertilization.
Reproductive endocrinologists undergo extensive medical training, first in a four-year residency in obstetricsand gynecology, then in a three-year fellowship in reproductive endocrinology. To be board certified in thisarea, the physician must pass written and oral exams in both areas.
GestationPregnancy begins with the fertilization of an egg and continues through to the birth of the individual. The length of time ofgestation, or the gestation period, in humans is 266 days and is similar in other great apes.
Within 24 hours of fertilization, the egg nucleus has finished meiosis and the egg and sperm nuclei fuse. With fusion, thecell is known as a zygote. The zygote initiates cleavage and the developing embryo travels through the oviduct to the uterus.The developing embryo must implant into the wall of the uterus within seven days, or it will deteriorate and die. The outerlayers of the developing embryo or blastocyst grow into the endometrium by digesting the endometrial cells, and healingof the endometrium closes up the blastocyst into the tissue. Another layer of the blastocyst, the chorion, begins releasinga hormone called human beta chorionic gonadotropin (β-HCG), which makes its way to the corpus luteum and keepsthat structure active. This ensures adequate levels of progesterone that will maintain the endometrium of the uterus forthe support of the developing embryo. Pregnancy tests determine the level of β-HCG in urine or serum. If the hormone ispresent, the test is positive.
The gestation period is divided into three equal periods or trimesters. During the first two-to-four weeks of the first trimester,nutrition and waste are handled by the endometrial lining through diffusion. As the trimester progresses, the outer layer ofthe embryo begins to merge with the endometrium, and the placenta forms. The placenta takes over the nutrient and wasterequirements of the embryo and fetus, with the mother’s blood passing nutrients to the placenta and removing waste fromit. Chemicals from the fetus, such as bilirubin, are processed by the mother’s liver for elimination. Some of the mother’simmunoglobulins will pass through the placenta, providing passive immunity against some potential infections.
Internal organs and body structures begin to develop during the first trimester. By five weeks, limb buds, eyes, the heart,and liver have been basically formed. By eight weeks, the term fetus applies, and the body is essentially formed (Figure18.18a). The individual is about five centimeters (two inches) in length and many of the organs, such as the lungs andliver, are not yet functioning. Exposure to any toxins is especially dangerous during the first trimester, as all of the body’sorgans and structures are going through initial development. Anything that interferes with chemical signaling during thatdevelopment can have a severe effect on the fetus’ survival.
Chapter 18 | Animal Reproduction and Development 493

Figure 18.18 (a) Fetal development is shown at nine weeks gestation. (b) This fetus is just entering the secondtrimester, when the placenta takes over more of the functions performed as the baby develops. (c) There is rapid fetalgrowth during the third trimester. (credit a: modification of work by Ed Uthman; credit b: modification of work by NationalMuseum of Health and Medicine; credit c: modification of work by Gray’s Anatomy)
During the second trimester, the fetus grows to about 30 cm (about 12 inches) (Figure 18.18b). It becomes active and themother usually feels the first movements. All organs and structures continue to develop. The placenta has taken over thefunctions of nutrition and waste elimination and the production of estrogen and progesterone from the corpus luteum, whichhas degenerated. The placenta will continue functioning up through the delivery of the baby. During the third trimester, thefetus grows to 3 to 4 kg (6.5–8.5 lbs.) and about 50 cm (19–20 inches) long (Figure 18.18c). This is the period of the mostrapid growth during the pregnancy as all organ systems continue to grow and develop.
Visit this website (http://openstaxcollege.org/l/embryo_fetus2) to see the stages of human fetal development.
Labor is the muscular contractions to expel the fetus and placenta from the uterus. Toward the end of the third trimester,estrogen causes receptors on the uterine wall to develop and bind the hormone oxytocin. At this time, the baby reorients,facing forward and down with the back or crown of the head engaging the cervix (uterine opening). This causes the cervix tostretch and nerve impulses are sent to the hypothalamus, which signals the release of oxytocin from the posterior pituitary.Oxytocin causes smooth muscle in the uterine wall to contract. At the same time, the placenta releases prostaglandins intothe uterus, increasing the contractions. A positive feedback relay occurs between the uterus, hypothalamus, and the posteriorpituitary to assure an adequate supply of oxytocin. As more smooth muscle cells are recruited, the contractions increase inintensity and force.
There are three stages to labor. During stage one, the cervix thins and dilates. This is necessary for the baby and placenta tobe expelled during birth. The cervix will eventually dilate to about 10 cm. During stage two, the baby is expelled from theuterus. The uterus contracts and the mother pushes as she compresses her abdominal muscles to aid the delivery. The laststage is the passage of the placenta after the baby has been born and the organ has completely disengaged from the uterinewall. If labor should stop before stage two is reached, synthetic oxytocin, known as Pitocin, can be administered to restartand maintain labor.
494 Chapter 18 | Animal Reproduction and Development
This OpenStax book is available for free at http://cnx.org/content/col11487/1.9
asexual reproduction
blastocyst
budding
bulbourethral gland
clitoris
corpus luteum
estrogen
external fertilization
fission
follicle stimulating hormone (FSH)
fragmentation
gastrulation
gestation
gestation period
gonadotropin-releasing hormone (GnRH)
hermaphroditism
human beta chorionic gonadotropin (β-HCG)
inhibin
inner cell mass
internal fertilization
interstitial cell of Leydig
labia majora
labia minora
luteinizing hormone (LH)
menstrual cycle
oogenesis
KEY TERMSa mechanism that produces offspring that are genetically identical to the parent
the structure formed when cells in the mammalian blastula separate into an inner and outer layer
a form of asexual reproduction that results from the outgrowth of a part of an organism leading to a separationfrom the original animal into two individuals
the paired glands in the human male that produce a secretion that cleanses the urethra prior toejaculation
a sensory and erectile structure in female mammals, homologous to the male penis, stimulated during sexualarousal
the endocrine tissue that develops from an ovarian follicle after ovulation; secretes progesterone andestrogen during pregnancy
a reproductive hormone in females that assists in endometrial regrowth, ovulation, and calcium absorption
the fertilization of eggs by sperm outside an animal’s body, often during spawning
(also, binary fission) a form of asexual reproduction in which an organism splits into two separate organisms ortwo parts that regenerate the missing portions of the body
a reproductive hormone that causes sperm production in men and follicledevelopment in women
the breaking of an organism into parts and the growth of a separate individual from each part
the process in which the blastula folds over itself to form the three germ layers
the development before birth of a viviparous animal
the length of time of development, from conception to birth, of the young of a viviparous animal
a hormone from the hypothalamus that causes the release of FSH and LHfrom the anterior pituitary
the state of having both male and female reproductive structures within the same individual
a hormone produced by the chorion of the zygote that helps tomaintain the corpus luteum and elevated levels of progesterone
a hormone made by Sertoli cells, provides negative feedback to hypothalamus in control of FSH and GnRH release
the inner layer of cells in the blastocyst, which becomes the embryo
the fertilization of eggs by sperm inside the body of the female
a cell type found next to the seminiferous tubules that makes testosterone
the large folds of tissue covering inguinal area
the smaller folds of tissue within labia majora
a reproductive hormone in both men and women, causes testosterone production in men andovulation and lactation in women
the cycle of the degradation and re-growth of the endometrium
the process of producing haploid eggs
Chapter 18 | Animal Reproduction and Development 495

organogenesis
ovarian cycle
oviduct
oviparity
ovoviparity
ovulation
parthenogenesis
penis
placenta
progesterone
prostate gland
scrotum
semen
seminal vesicle
seminiferous tubule
Sertoli cell
sex determination
sexual reproduction
spermatogenesis
testes
testosterone
trophoblast
uterus
vagina
viviparity
zona pellucida
the process of organ formation during development
the cycle of preparation of egg for ovulation and the conversion of the follicle to the corpus luteum
(also, fallopian tube) the muscular tube connecting uterus with ovary area
a process by which fertilized eggs are laid outside the female’s body and develop there, receiving nourishmentfrom the yolk that is a part of the egg
a process by which fertilized eggs are retained within the female; the embryo obtains its nourishment from theegg’s yolk, and the young are fully developed when they are hatched
the release of an oocyte from a mature follicle in the ovary of a vertebrate
a form of asexual reproduction in which an egg develops into a complete individual without beingfertilized
the male reproductive structure for urine elimination and copulation
the organ that supports the transport of nutrients and waste between the mothers and fetus’ blood in eutherianmammals
a reproductive hormone in women; assists in endometrial regrowth and inhibition of FSH and LH release
a structure that is a mixture of smooth muscle and glandular material and that contributes to semen
a sac containing testes, exterior to body
a fluid mixture of sperm and supporting materials
a secretory accessory gland in male; contributes to semen
the structures within which sperm production occurs in the testes
a cell in the walls of the seminiferous tubules that assists developing sperm and secretes inhibin
the mechanism by which the sex of individuals in sexually reproducing organisms is initiallyestablished
a form of reproduction in which cells containing genetic material from two individuals combines toproduce genetically unique offspring
the process of producing haploid sperm
a pair of male reproductive organs
a reproductive hormone in men that assists in sperm production and promoting secondary sexualcharacteristics
the outer layer of cells in the blastocyst, which gives rise to the embryo’s contribution to the placenta
a female reproductive structure in which an embryo develops
a muscular tube for the passage of menstrual flow, copulation, and birth of offspring
a process in which the young develop within the female and are born in a nonembryonic state
the protective layer around the mammalian egg
CHAPTER SUMMARY
496 Chapter 18 | Animal Reproduction and Development
This OpenStax book is available for free at http://cnx.org/content/col11487/1.9

18.1 How Animals Reproduce
Reproduction may be asexual when one individual produces genetically identical offspring, or sexual when the geneticmaterial from two individuals is combined to produce genetically diverse offspring. Asexual reproduction in animalsoccurs through fission, budding, fragmentation, and parthenogenesis. Sexual reproduction may involve fertilization insidethe body or in the external environment. A species may have separate sexes or combined sexes; when the sexes arecombined they may be expressed at different times in the life cycle. The sex of an individual may be determined byvarious chromosomal systems or environmental factors such as temperature.
Sexual reproduction starts with the combination of a sperm and an egg in a process called fertilization. This can occureither outside the bodies or inside the female. The method of fertilization varies among animals. Some species release theegg and sperm into the environment, some species retain the egg and receive the sperm into the female body and thenexpel the developing embryo covered with shell, while still other species retain the developing offspring throughout thegestation period.
18.2 Development and Organogenesis
The early stages of embryonic development begin with fertilization. The process of fertilization is tightly controlled toensure that only one sperm fuses with one egg. After fertilization, the zygote undergoes cleavage to form the blastula. Theblastula, which in some species is a hollow ball of cells, undergoes a process called gastrulation, during which the threegerm layers form. The ectoderm gives rise to the nervous system and the epidermal skin cells, the mesoderm gives rise tothe muscle cells and connective tissue in the body, and the endoderm gives rise to the digestive system and other internalorgans. Organogenesis is the formation of organs from the germ layers. Each germ layer gives rise to specific tissue types.
18.3 Human Reproduction
The reproductive structures that evolved in land animals allow males and females to mate, fertilize internally, and supportthe growth and development of offspring. Gametogenesis, the production of sperm (spermatogenesis) and eggs(oogenesis), takes place through the process of meiosis.
The male and female reproductive cycles are controlled by hormones released from the hypothalamus and anteriorpituitary and hormones from reproductive tissues and organs. The hypothalamus monitors the need for FSH and LHproduction and release from the anterior pituitary. FSH and LH affect reproductive structures to cause the formation ofsperm and the preparation of eggs for release and possible fertilization. In the male, FSH and LH stimulate Sertoli cellsand interstitial cells of Leydig in the testes to facilitate sperm production. The Leydig cells produce testosterone, whichalso is responsible for the secondary sexual characteristics of males. In females, FSH and LH cause estrogen andprogesterone to be produced. They regulate the female reproductive cycle, which is divided into the ovarian cycle and themenstrual cycle.
Human pregnancy begins with fertilization of an egg and proceeds through the three trimesters of gestation. The firsttrimester lays down the basic structures of the body, including the limb buds, heart, eyes, and the liver. The secondtrimester continues the development of all of the organs and systems. The third trimester exhibits the greatest growth ofthe fetus and culminates in labor and delivery. The labor process has three stages (contractions, delivery of the fetus, andexpulsion of the placenta), each propelled by hormones.
ART CONNECTION QUESTIONS1. Figure 18.12 Which of the following statements aboutthe male reproductive system is false?
a. The vas deferens carries sperm from the testes tothe seminal vesicles.
b. The ejaculatory duct joins the urethra.c. Both the prostate and the bulbourethral glands
produce components of the semen.d. The prostate gland is located in the testes.
2. Figure 18.17 Which of the following statements abouthormone regulation of the female reproductive cycle isfalse?
a. LH and FSH are produced in the pituitary, andestrogen and progesterone are produced in theovaries.
b. Estradiol and progesterone secreted from thecorpus luteum cause the endometrium tothicken.
c. Both progesterone and estrogen are produced bythe follicles.
d. Secretion of GnRH by the hypothalamus isinhibited by low levels of estrogen butstimulated by high levels of estrogen.
Chapter 18 | Animal Reproduction and Development 497

REVIEW QUESTIONS3. In which group is parthenogenesis a normal event?
a. chickensb. beesc. rabbitsd. sea stars
4. Genetically unique individuals are produced through________.
a. sexual reproductionb. parthenogenesisc. buddingd. fragmentation
5. External fertilization occurs in which type ofenvironment?
a. aquaticb. forestedc. savannad. steppe
6. The process of gastrulation forms the _______.
a. blastulab. zygotec. organsd. germ layers
7. Which of the following gives rise to the skin cells?
a. ectodermb. endodermc. mesodermd. none of the above
8. Sperm are produced in the ________.a. scrotumb. seminal vesiclesc. seminiferous tubulesd. prostate gland
9. Which female organ has an endometrial lining that willsupport a developing baby?
a. labia minorab. breastc. ovariesd. uterus
10. Which hormone causes FSH and LH to be released?
a. testosteroneb. estrogenc. GnRHd. progesterone
11. Nutrient and waste requirements for the developingfetus are handled during the first few weeks by ________.
a. the placentab. diffusion through the endometriumc. the choriond. the blastocyst
12. Which hormone is primarily responsible for thecontractions during labor?
a. oxytocinb. estrogenc. β-HCGd. progesterone
CRITICAL THINKING QUESTIONS13. What might be a disadvantage to temperature-dependent sex determination?
14. Compared to separate sexes and assuming self-fertilizing is not possible, what might be one advantageand one disadvantage to hermaphroditism?
15. What do you think would happen if multiple spermfused with one egg?
16. Compare spermatogenesis and oogenesis as to timingof the processes, and the number and type of cells finallyproduced.
17. Describe the events in the ovarian cycle leading up toovulation.
18. Describe the stages of labor.
498 Chapter 18 | Animal Reproduction and Development
This OpenStax book is available for free at http://cnx.org/content/col11487/1.9

19 | POPULATION ANDCOMMUNITY ECOLOGY
Figure 19.1 Asian carp jump out of the water in response to electrofishing. The Asian carp in the inset photograph wereharvested from the Little Calumet River in Illinois in May, 2010, using rotenone, a toxin often used as an insecticide, inan effort to learn more about the population of the species. (credit main image: modification of work by USGS; creditinset: modification of work by Lt. David French, USCG)
Chapter Outline19.1: Population Demographics and Dynamics
19.2: Population Growth and Regulation
19.3: The Human Population
19.4: Community Ecology
IntroductionImagine sailing down a river in a small motorboat on a weekend afternoon; the water is smooth, and you are enjoying thesunshine and cool breeze when suddenly you are hit in the head by a 20-pound silver carp. This is a risk now on many riversand canal systems in Illinois and Missouri because of the presence of Asian carp.
This fish—actually a group of species including the silver, black, grass, and big head carp—has been farmed and eaten inChina for over 1,000 years. It is one of the most important aquaculture food resources worldwide. In the United States,however, Asian carp is considered a dangerous invasive species that disrupts ecological community structure to the point ofthreatening native species.
The effects of invasive species (such as the Asian carp, kudzu vine, predatory snakehead fish, and zebra mussel) are justone aspect of what ecologists study to understand how populations interact within ecological communities, and what impactnatural and human-induced disturbances have on the characteristics of communities.
Chapter 19 | Population and Community Ecology 499

19.1 | Population Demographics and Dynamics
By the end of this section, you will be able to:
• Describe how ecologists measure population size and density
• Describe three different patterns of population distribution
• Use life tables to calculate mortality rates
• Describe the three types of survivorship curves and relate them to specific populations
Populations are dynamic entities. Their size and composition fluctuate in response to numerous factors, including seasonaland yearly changes in the environment, natural disasters such as forest fires and volcanic eruptions, and competition forresources between and within species. The statistical study of populations is called demography: a set of mathematicaltools designed to describe populations and investigate how they change. Many of these tools were actually designed tostudy human populations. For example, life tables, which detail the life expectancy of individuals within a population, wereinitially developed by life insurance companies to set insurance rates. In fact, while the term “demographics” is sometimesassumed to mean a study of human populations, all living populations can be studied using this approach.
Population Size and DensityPopulations are characterized by their population size (total number of individuals) and their population density (numberof individuals per unit area). A population may have a large number of individuals that are distributed densely, or sparsely.There are also populations with small numbers of individuals that may be dense or very sparsely distributed in a localarea. Population size can affect potential for adaptation because it affects the amount of genetic variation present in thepopulation. Density can have effects on interactions within a population such as competition for food and the ability ofindividuals to find a mate. Smaller organisms tend to be more densely distributed than larger organisms (Figure 19.2).
Figure 19.2 Australian mammals show a typical inverse relationship between population density and body size.
As this graph shows, population density typically decreases with increasing body size. Why do you thinkthis is the case?
Estimating Population Size
The most accurate way to determine population size is to count all of the individuals within the area. However, thismethod is usually not logistically or economically feasible, especially when studying large areas. Thus, scientists usually
500 Chapter 19 | Population and Community Ecology
This OpenStax book is available for free at http://cnx.org/content/col11487/1.9

study populations by sampling a representative portion of each habitat and use this sample to make inferences about thepopulation as a whole. The methods used to sample populations to determine their size and density are typically tailored tothe characteristics of the organism being studied. For immobile organisms such as plants, or for very small and slow-movingorganisms, a quadrat may be used. A quadrat is a wood, plastic, or metal square that is randomly located on the ground andused to count the number of individuals that lie within its boundaries. To obtain an accurate count using this method, thesquare must be placed at random locations within the habitat enough times to produce an accurate estimate. This countingmethod will provide an estimate of both population size and density. The number and size of quadrat samples depends onthe type of organisms and the nature of their distribution.
For smaller mobile organisms, such as mammals, a technique called mark and recapture is often used. This methodinvolves marking a sample of captured animals in some way and releasing them back into the environment to mix with therest of the population; then, a new sample is captured and scientists determine how many of the marked animals are in thenew sample. This method assumes that the larger the population, the lower the percentage of marked organisms that will berecaptured since they will have mixed with more unmarked individuals. For example, if 80 field mice are captured, marked,and released into the forest, then a second trapping 100 field mice are captured and 20 of them are marked, the populationsize (N) can be determined using the following equation:
number marked first catch × total number second catchnumber marked second catch = N
Using our example, the population size would be 400.
80 × 10020 = 400
These results give us an estimate of 400 total individuals in the original population. The true number usually will be a bitdifferent from this because of chance errors and possible bias caused by the sampling methods.
Species DistributionIn addition to measuring density, further information about a population can be obtained by looking at the distribution ofthe individuals throughout their range. A species distribution pattern is the distribution of individuals within a habitat at aparticular point in time—broad categories of patterns are used to describe them.
Individuals within a population can be distributed at random, in groups, or equally spaced apart (more or less). These areknown as random, clumped, and uniform distribution patterns, respectively (Figure 19.3). Different distributions reflectimportant aspects of the biology of the species; they also affect the mathematical methods required to estimate populationsizes. An example of random distribution occurs with dandelion and other plants that have wind-dispersed seeds thatgerminate wherever they happen to fall in favorable environments. A clumped distribution, may be seen in plants thatdrop their seeds straight to the ground, such as oak trees; it can also be seen in animals that live in social groups (schoolsof fish or herds of elephants). Uniform distribution is observed in plants that secrete substances inhibiting the growth ofnearby individuals (such as the release of toxic chemicals by sage plants). It is also seen in territorial animal species, suchas penguins that maintain a defined territory for nesting. The territorial defensive behaviors of each individual create aregular pattern of distribution of similar-sized territories and individuals within those territories. Thus, the distribution ofthe individuals within a population provides more information about how they interact with each other than does a simpledensity measurement. Just as lower density species might have more difficulty finding a mate, solitary species with arandom distribution might have a similar difficulty when compared to social species clumped together in groups.
Chapter 19 | Population and Community Ecology 501

Figure 19.3 Species may have a random, clumped, or uniform distribution. Plants such as (a) dandelions with wind-dispersed seeds tend to be randomly distributed. Animals such as (b) elephants that travel in groups exhibit a clumpeddistribution. Territorial birds such as (c) penguins tend to have a uniform distribution. (credit a: modification of work byRosendahl; credit b: modification of work by Rebecca Wood; credit c: modification of work by Ben Tubby)
DemographyWhile population size and density describe a population at one particular point in time, scientists must use demography tostudy the dynamics of a population. Demography is the statistical study of population changes over time: birth rates, deathrates, and life expectancies. These population characteristics are often displayed in a life table.
Life Tables
Life tables provide important information about the life history of an organism and the life expectancy of individuals at eachage. They are modeled after actuarial tables used by the insurance industry for estimating human life expectancy. Life tablesmay include the probability of each age group dying before their next birthday, the percentage of surviving individualsdying at a particular age interval (their mortality rate, and their life expectancy at each interval. An example of a lifetable is shown in Table 19.1 from a study of Dall mountain sheep, a species native to northwestern North America. Noticethat the population is divided into age intervals (column A). The mortality rate (per 1000) shown in column D is based onthe number of individuals dying during the age interval (column B), divided by the number of individuals surviving at thebeginning of the interval (Column C) multiplied by 1000.
mortality rate = number of individuals dyingnumber of individuals surviving × 1000
For example, between ages three and four, 12 individuals die out of the 776 that were remaining from the original 1000sheep. This number is then multiplied by 1000 to give the mortality rate per thousand.
mortality rate = 12776 × 1000 ≈ 15.5
As can be seen from the mortality rate data (column D), a high death rate occurred when the sheep were between six monthsand a year old, and then increased even more from 8 to 12 years old, after which there were few survivors. The data indicatethat if a sheep in this population were to survive to age one, it could be expected to live another 7.7 years on average, asshown by the life-expectancy numbers in column E.
502 Chapter 19 | Population and Community Ecology
This OpenStax book is available for free at http://cnx.org/content/col11487/1.9

Life Table of Dall Mountain Sheep[1]
A B C D E
Ageinterval(years)
Numberdying in ageinterval out
of 1000 born
Number survivingat beginning of
age interval out of1000 born
Mortality rateper 1000 alive
at beginning ofage interval
Life expectancy ormean lifetime
remaining to thoseattaining age interval
0–0.5 54 1000 54.0 7.06
0.5–1 145 946 153.3 —
1–2 12 801 15.0 7.7
2–3 13 789 16.5 6.8
3–4 12 776 15.5 5.9
4–5 30 764 39.3 5.0
5–6 46 734 62.7 4.2
6–7 48 688 69.8 3.4
7–8 69 640 107.8 2.6
8–9 132 571 231.2 1.9
9–10 187 439 426.0 1.3
10–11 156 252 619.0 0.9
11–12 90 96 937.5 0.6
12–13 3 6 500.0 1.2
13–14 3 3 1000 0.7
Table 19.1 This life table of Ovis dalli shows the number of deaths, number of survivors, mortality rate,and life expectancy at each age interval for Dall mountain sheep.
Survivorship Curves
Another tool used by population ecologists is a survivorship curve, which is a graph of the number of individuals survivingat each age interval versus time. These curves allow us to compare the life histories of different populations (Figure 19.4).There are three types of survivorship curves. In a type I curve, mortality is low in the early and middle years and occursmostly in older individuals. Organisms exhibiting a type I survivorship typically produce few offspring and provide goodcare to the offspring increasing the likelihood of their survival. Humans and most mammals exhibit a type I survivorshipcurve. In type II curves, mortality is relatively constant throughout the entire life span, and mortality is equally likely tooccur at any point in the life span. Many bird populations provide examples of an intermediate or type II survivorship curve.In type III survivorship curves, early ages experience the highest mortality with much lower mortality rates for organismsthat make it to advanced years. Type III organisms typically produce large numbers of offspring, but provide very little orno care for them. Trees and marine invertebrates exhibit a type III survivorship curve because very few of these organismssurvive their younger years, but those that do make it to an old age are more likely to survive for a relatively long period oftime.
1. Data Adapted from Edward S. Deevey, Jr., “Life Tables for Natural Populations of Animals,” The Quarterly Review of Biology 22, no. 4 (December1947): 283-314.
Chapter 19 | Population and Community Ecology 503

Figure 19.4 Survivorship curves show the distribution of individuals in a population according to age. Humans andmost mammals have a Type I survivorship curve, because death primarily occurs in the older years. Birds have a TypeII survivorship curve, as death at any age is equally probable. Trees have a Type III survivorship curve because veryfew survive the younger years, but after a certain age, individuals are much more likely to survive.
19.2 | Population Growth and Regulation
By the end of this section, you will be able to:
• Explain the characteristics of and differences between exponential and logistic growth patterns
• Give examples of exponential and logistic growth in natural populations
• Give examples of how the carrying capacity of a habitat may change
• Compare and contrast density-dependent growth regulation and density-independent growth regulation givingexamples
Population ecologists make use of a variety of methods to model population dynamics. An accurate model should be ableto describe the changes occurring in a population and predict future changes.
Population GrowthThe two simplest models of population growth use deterministic equations (equations that do not account for randomevents) to describe the rate of change in the size of a population over time. The first of these models, exponential growth,describes theoretical populations that increase in numbers without any limits to their growth. The second model, logisticgrowth, introduces limits to reproductive growth that become more intense as the population size increases. Neither modeladequately describes natural populations, but they provide points of comparison.
Exponential Growth
Charles Darwin, in developing his theory of natural selection, was influenced by the English clergyman Thomas Malthus.Malthus published his book in 1798 stating that populations with abundant natural resources grow very rapidly; however,they limit further growth by depleting their resources. The early pattern of accelerating population size is called exponentialgrowth.
The best example of exponential growth in organisms is seen in bacteria. Bacteria are prokaryotes that reproduce largelyby binary fission. This division takes about an hour for many bacterial species. If 1000 bacteria are placed in a large flaskwith an abundant supply of nutrients (so the nutrients will not become quickly depleted), the number of bacteria will havedoubled from 1000 to 2000 after just an hour. In another hour, each of the 2000 bacteria will divide, producing 4000bacteria. After the third hour, there should be 8000 bacteria in the flask. The important concept of exponential growthis that the growth rate—the number of organisms added in each reproductive generation—is itself increasing; that is, the
504 Chapter 19 | Population and Community Ecology
This OpenStax book is available for free at http://cnx.org/content/col11487/1.9

population size is increasing at a greater and greater rate. After 24 of these cycles, the population would have increasedfrom 1000 to more than 16 billion bacteria. When the population size, N, is plotted over time, a J-shaped growth curve isproduced (Figure 19.5a).
The bacteria-in-a-flask example is not truly representative of the real world where resources are usually limited. However,when a species is introduced into a new habitat that it finds suitable, it may show exponential growth for a while. In thecase of the bacteria in the flask, some bacteria will die during the experiment and thus not reproduce; therefore, the growthrate is lowered from a maximal rate in which there is no mortality. The growth rate of a population is largely determined bysubtracting the death rate, D, (number organisms that die during an interval) from the birth rate, B, (number organismsthat are born during an interval). The growth rate can be expressed in a simple equation that combines the birth and deathrates into a single factor: r. This is shown in the following formula:
Population growth = rN
The value of r can be positive, meaning the population is increasing in size (the rate of change is positive); or negative,meaning the population is decreasing in size; or zero, in which case the population size is unchanging, a condition knownas zero population growth.
Logistic GrowthExtended exponential growth is possible only when infinite natural resources are available; this is not the case in the realworld. Charles Darwin recognized this fact in his description of the “struggle for existence,” which states that individualswill compete (with members of their own or other species) for limited resources. The successful ones are more likely tosurvive and pass on the traits that made them successful to the next generation at a greater rate (natural selection). To modelthe reality of limited resources, population ecologists developed the logistic growth model.
Carrying Capacity and the Logistic Model
In the real world, with its limited resources, exponential growth cannot continue indefinitely. Exponential growth may occurin environments where there are few individuals and plentiful resources, but when the number of individuals gets largeenough, resources will be depleted and the growth rate will slow down. Eventually, the growth rate will plateau or level off(Figure 19.5b). This population size, which is determined by the maximum population size that a particular environmentcan sustain, is called the carrying capacity, or K. In real populations, a growing population often overshoots its carryingcapacity, and the death rate increases beyond the birth rate causing the population size to decline back to the carryingcapacity or below it. Most populations usually fluctuate around the carrying capacity in an undulating fashion rather thanexisting right at it.
The formula used to calculate logistic growth adds the carrying capacity as a moderating force in the growth rate. Theexpression “K – N” is equal to the number of individuals that may be added to a population at a given time, and “K – N”divided by “K” is the fraction of the carrying capacity available for further growth. Thus, the exponential growth model isrestricted by this factor to generate the logistic growth equation:
Population growth = rN ⎡⎣K − N
K⎤⎦
Notice that when N is almost zero the quantity in brackets is almost equal to 1 (or K/K) and growth is close to exponential.When the population size is equal to the carrying capacity, or N = K, the quantity in brackets is equal to zero and growthis equal to zero. A graph of this equation (logistic growth) yields the S-shaped curve (Figure 19.5b). It is a more realisticmodel of population growth than exponential growth. There are three different sections to an S-shaped curve. Initially,growth is exponential because there are few individuals and ample resources available. Then, as resources begin to becomelimited, the growth rate decreases. Finally, the growth rate levels off at the carrying capacity of the environment, with littlechange in population number over time.
Chapter 19 | Population and Community Ecology 505

Figure 19.5 When resources are unlimited, populations exhibit (a) exponential growth, shown in a J-shaped curve.When resources are limited, populations exhibit (b) logistic growth. In logistic growth, population expansion decreasesas resources become scarce, and it levels off when the carrying capacity of the environment is reached. The logisticgrowth curve is S-shaped.
Role of Intraspecific Competition
The logistic model assumes that every individual within a population will have equal access to resources and, thus, an equalchance for survival. For plants, the amount of water, sunlight, nutrients, and space to grow are the important resources,whereas in animals, important resources include food, water, shelter, nesting space, and mates.
In the real world, phenotypic variation among individuals within a population means that some individuals will be betteradapted to their environment than others. The resulting competition for resources among population members of the samespecies is termed intraspecific competition. Intraspecific competition may not affect populations that are well below theircarrying capacity, as resources are plentiful and all individuals can obtain what they need. However, as population sizeincreases, this competition intensifies. In addition, the accumulation of waste products can reduce carrying capacity in anenvironment.
Examples of Logistic Growth
Yeast, a microscopic fungus used to make bread and alcoholic beverages, exhibits the classical S-shaped curve when grownin a test tube (Figure 19.6a). Its growth levels off as the population depletes the nutrients that are necessary for its growth. Inthe real world, however, there are variations to this idealized curve. Examples in wild populations include sheep and harborseals (Figure 19.6b). In both examples, the population size exceeds the carrying capacity for short periods of time andthen falls below the carrying capacity afterwards. This fluctuation in population size continues to occur as the populationoscillates around its carrying capacity. Still, even with this oscillation, the logistic model is confirmed.
506 Chapter 19 | Population and Community Ecology
This OpenStax book is available for free at http://cnx.org/content/col11487/1.9

Figure 19.6 (a) Yeast grown in ideal conditions in a test tube shows a classical S-shaped logistic growth curve,whereas (b) a natural population of seals shows real-world fluctuation. The yeast is visualized using differentialinterference contrast light micrography. (credit a: scale-bar data from Matt Russell)
If the major food source of seals declines due to pollution or overfishing, which of the following would likelyoccur?
a. The carrying capacity of seals would decrease, as would the seal population.
b. The carrying capacity of seals would decrease, but the seal population would remain the same.
c. The number of seal deaths would increase, but the number of births would also increase, so thepopulation size would remain the same.
d. The carrying capacity of seals would remain the same, but the population of seals would decrease.
Population Dynamics and RegulationThe logistic model of population growth, while valid in many natural populations and a useful model, is a simplificationof real-world population dynamics. Implicit in the model is that the carrying capacity of the environment does not change,which is not the case. The carrying capacity varies annually. For example, some summers are hot and dry whereas othersare cold and wet; in many areas, the carrying capacity during the winter is much lower than it is during the summer.Also, natural events such as earthquakes, volcanoes, and fires can alter an environment and hence its carrying capacity.
Chapter 19 | Population and Community Ecology 507

Additionally, populations do not usually exist in isolation. They share the environment with other species, competing withthem for the same resources (interspecific competition). These factors are also important to understanding how a specificpopulation will grow.
Population growth is regulated in a variety of ways. These are grouped into density-dependent factors, in which the densityof the population affects growth rate and mortality, and density-independent factors, which cause mortality in a populationregardless of population density. Wildlife biologists, in particular, want to understand both types because this helps themmanage populations and prevent extinction or overpopulation.
Density-dependent RegulationMost density-dependent factors are biological in nature and include predation, inter- and intraspecific competition, andparasites. Usually, the denser a population is, the greater its mortality rate. For example, during intra- and interspecificcompetition, the reproductive rates of the species will usually be lower, reducing their populations’ rate of growth. Inaddition, low prey density increases the mortality of its predator because it has more difficulty locating its food source.Also, when the population is denser, diseases spread more rapidly among the members of the population, which affect themortality rate.
Density dependent regulation was studied in a natural experiment with wild donkey populations on two sites in Australia.[2]
On one site the population was reduced by a population control program; the population on the other site received nointerference. The high-density plot was twice as dense as the low-density plot. From 1986 to 1987 the high-density plot sawno change in donkey density, while the low-density plot saw an increase in donkey density. The difference in the growthrates of the two populations was caused by mortality, not by a difference in birth rates. The researchers found that numbersof offspring birthed by each mother was unaffected by density. Growth rates in the two populations were different mostlybecause of juvenile mortality caused by the mother’s malnutrition due to scarce high-quality food in the dense population.Figure 19.7 shows the difference in age-specific mortalities in the two populations.
Figure 19.7 This graph shows the age-specific mortality rates for wild donkeys from high- and low-density populations.The juvenile mortality is much higher in the high-density population because of maternal malnutrition caused by ashortage of high-quality food.
Density-independent Regulation and Interaction with Density-dependent FactorsMany factors that are typically physical in nature cause mortality of a population regardless of its density. These factorsinclude weather, natural disasters, and pollution. An individual deer will be killed in a forest fire regardless of how manydeer happen to be in that area. Its chances of survival are the same whether the population density is high or low. The sameholds true for cold winter weather.
In real-life situations, population regulation is very complicated and density-dependent and independent factors can interact.A dense population that suffers mortality from a density-independent cause will be able to recover differently than a sparsepopulation. For example, a population of deer affected by a harsh winter will recover faster if there are more deer remainingto reproduce.
2. David Choquenot, “Density-Dependent Growth, Body Condition, and Demography in Feral Donkeys: Testing the Food Hypothesis,” Ecology 72, no. 3(June 1991):805–813.
508 Chapter 19 | Population and Community Ecology
This OpenStax book is available for free at http://cnx.org/content/col11487/1.9

Why Did the Woolly Mammoth Go Extinct?
Figure 19.8 The three images include: (a) 1916 mural of a mammoth herd from the American Museum of NaturalHistory, (b) the only stuffed mammoth in the world is in the Museum of Zoology located in St. Petersburg, Russia,and (c) a one-month-old baby mammoth, named Lyuba, discovered in Siberia in 2007. (credit a: modification ofwork by Charles R. Knight; credit b: modification of work by “Tanapon”/Flickr; credit c: modification of work by MattHowry)
Woolly mammoths began to go extinct about 10,000 years ago, soon after paleontologists believe humansable to hunt them began to colonize North America and northern Eurasia (Figure 19.8). A mammothpopulation survived on Wrangel Island, in the East Siberian Sea, and was isolated from human contact untilas recently as 1700 BC. We know a lot about these animals from carcasses found frozen in the ice of Siberiaand other northern regions.
It is commonly thought that climate change and human hunting led to their extinction. A 2008 studyestimated that climate change reduced the mammoth’s range from 3,000,000 square miles 42,000 yearsago to 310,000 square miles 6,000 years ago.
[3]Through archaeological evidence of kill sites, it is also
well documented that humans hunted these animals. A 2012 study concluded that no single factor wasexclusively responsible for the extinction of these magnificent creatures.
[4]In addition to climate change and
reduction of habitat, scientists demonstrated another important factor in the mammoth’s extinction was themigration of human hunters across the Bering Strait to North America during the last ice age 20,000 yearsago.
The maintenance of stable populations was and is very complex, with many interacting factors determiningthe outcome. It is important to remember that humans are also part of nature. Once we contributed to aspecies’ decline using primitive hunting technology only.
3. David Nogués-Bravo et al., “Climate Change, Humans, and the Extinction of the Woolly Mammoth.” PLoS Biol 6 (April 2008): e79, doi:10.1371/journal.pbio.0060079.4. G.M. MacDonald et al., “Pattern of Extinction of the Woolly Mammoth in Beringia.” Nature Communications 3, no. 893 (June 2012), doi:10.1038/ncomms1881.
Chapter 19 | Population and Community Ecology 509

Demographic-Based Population ModelsPopulation ecologists have hypothesized that suites of characteristics may evolve in species that lead to particularadaptations to their environments. These adaptations impact the kind of population growth their species experience. Lifehistory characteristics such as birth rates, age at first reproduction, the numbers of offspring, and even death rates evolvejust like anatomy or behavior, leading to adaptations that affect population growth. Population ecologists have described acontinuum of life-history “strategies” with K-selected species on one end and r-selected species on the other. K-selectedspecies are adapted to stable, predictable environments. Populations of K-selected species tend to exist close to theircarrying capacity. These species tend to have larger, but fewer, offspring and contribute large amounts of resources toeach offspring. Elephants would be an example of a K-selected species. r-selected species are adapted to unstable andunpredictable environments. They have large numbers of small offspring. Animals that are r-selected do not provide a lot ofresources or parental care to offspring, and the offspring are relatively self-sufficient at birth. Examples of r-selected speciesare marine invertebrates such as jellyfish and plants such as the dandelion. The two extreme strategies are at two ends of acontinuum on which real species life histories will exist. In addition, life history strategies do not need to evolve as suites,but can evolve independently of each other, so each species may have some characteristics that trend toward one extremeor the other.
19.3 | The Human Population
By the end of this section, you will be able to:
• Discuss how human population growth can be exponential
• Explain how humans have expanded the carrying capacity of their habitat
• Relate population growth and age structure to the level of economic development in different countries
• Discuss the long-term implications of unchecked human population growth
Concepts of animal population dynamics can be applied to human population growth. Humans are not unique in their abilityto alter their environment. For example, beaver dams alter the stream environment where they are built. Humans, however,have the ability to alter their environment to increase its carrying capacity, sometimes to the detriment of other species.Earth’s human population and their use of resources are growing rapidly, to the extent that some worry about the abilityof Earth’s environment to sustain its human population. Long-term exponential growth carries with it the potential risks offamine, disease, and large-scale death, as well as social consequences of crowding such as increased crime.
Human technology and particularly our harnessing of the energy contained in fossil fuels have caused unprecedentedchanges to Earth’s environment, altering ecosystems to the point where some may be in danger of collapse. Changes on aglobal scale including depletion of the ozone layer, desertification and topsoil loss, and global climate change are caused byhuman activities.
The world’s human population is presently growing exponentially (Figure 19.9).
510 Chapter 19 | Population and Community Ecology
This OpenStax book is available for free at http://cnx.org/content/col11487/1.9
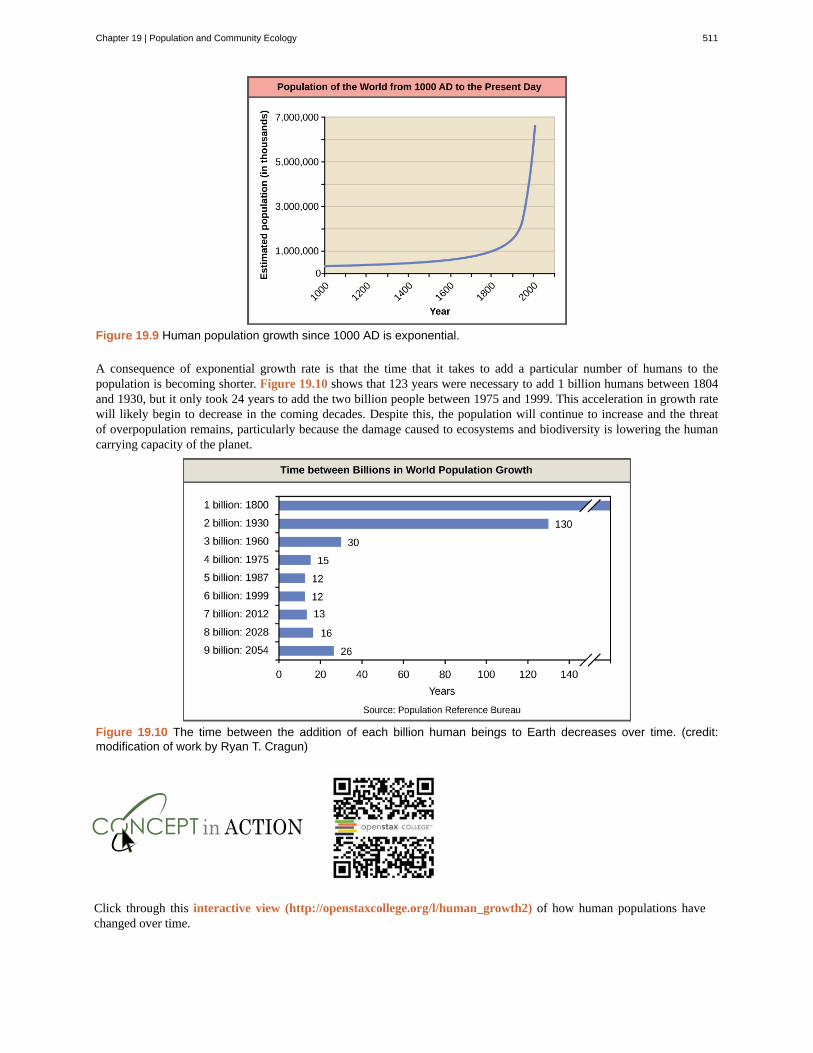
Figure 19.9 Human population growth since 1000 AD is exponential.
A consequence of exponential growth rate is that the time that it takes to add a particular number of humans to thepopulation is becoming shorter. Figure 19.10 shows that 123 years were necessary to add 1 billion humans between 1804and 1930, but it only took 24 years to add the two billion people between 1975 and 1999. This acceleration in growth ratewill likely begin to decrease in the coming decades. Despite this, the population will continue to increase and the threatof overpopulation remains, particularly because the damage caused to ecosystems and biodiversity is lowering the humancarrying capacity of the planet.
Figure 19.10 The time between the addition of each billion human beings to Earth decreases over time. (credit:modification of work by Ryan T. Cragun)
Click through this interactive view (http://openstaxcollege.org/l/human_growth2) of how human populations havechanged over time.
Chapter 19 | Population and Community Ecology 511

Overcoming Density-Dependent RegulationHumans are unique in their ability to alter their environment in myriad ways. This ability is responsible for humanpopulation growth because it resets the carrying capacity and overcomes density-dependent growth regulation. Much ofthis ability is related to human intelligence, society, and communication. Humans construct shelters to protect themselvesfrom the elements and have developed agriculture and domesticated animals to increase their food supplies. In addition,humans use language to communicate this technology to new generations, allowing them to improve upon previousaccomplishments.
Other factors in human population growth are migration and public health. Humans originated in Africa, but we have sincemigrated to nearly all inhabitable land on Earth, thus, increasing the area that we have colonized. Public health, sanitation,and the use of antibiotics and vaccines have decreased the ability of infectious disease to limit human population growthin developed countries. In the past, diseases such as the bubonic plaque of the fourteenth century killed between 30 and60 percent of Europe’s population and reduced the overall world population by as many as one hundred million people.Infectious disease continues to have an impact on human population growth. For example, life expectancy in sub-SaharanAfrica, which was increasing from 1950 to 1990, began to decline after 1985 largely as a result of HIV/AIDS mortality. Thereduction in life expectancy caused by HIV/AIDS was estimated to be 7 years for 2005.
[5]
Declining life expectancy is an indicator of higher mortality rates and leads to lower birth rates.
The fundamental cause of the acceleration of growth rate for humans in the past 200 years has been the reduced death ratedue to a development of the technological advances of the industrial age, urbanization that supported those technologies, andespecially the exploitation of the energy in fossil fuels. Fossil fuels are responsible for dramatically increasing the resourcesavailable for human population growth through agriculture (mechanization, pesticides, and fertilizers) and harvesting wildpopulations.
Age Structure, Population Growth, and Economic DevelopmentThe age structure of a population is an important factor in population dynamics. Age structure is the proportion of apopulation in different age classes. Models that incorporate age structure allow better prediction of population growth, plusthe ability to associate this growth with the level of economic development in a region. Countries with rapid growth havea pyramidal shape in their age structure diagrams, showing a preponderance of younger individuals, many of whom are ofreproductive age (Figure 19.11). This pattern is most often observed in underdeveloped countries where individuals do notlive to old age because of less-than-optimal living conditions, and there is a high birth rate. Age structures of areas withslow growth, including developed countries such as the United States, still have a pyramidal structure, but with many feweryoung and reproductive-aged individuals and a greater proportion of older individuals. Other developed countries, such asItaly, have zero population growth. The age structure of these populations is more conical, with an even greater percentageof middle-aged and older individuals. The actual growth rates in different countries are shown in Figure 19.12, with thehighest rates tending to be in the less economically developed countries of Africa and Asia.
5. Danny Dorling, Mary Shaw, and George Davey Smith, “Global Inequality of Life Expectancy due to AIDS,” BMJ 332, no. 7542 (March 2006):662-664, doi: 10.1136/bmj.332.7542.662.
512 Chapter 19 | Population and Community Ecology
This OpenStax book is available for free at http://cnx.org/content/col11487/1.9

Figure 19.11 Typical age structure diagrams are shown. The rapid growth diagram narrows to a point, indicatingthat the number of individuals decreases rapidly with age. In the slow growth model, the number of individualsdecreases steadily with age. Stable population diagrams are rounded on the top, showing that the number ofindividuals per age group decreases gradually, and then increases for the older part of the population.
Age structure diagrams for rapidly growing, slow growing, and stable populations are shown in stages 1through 3. What type of population change do you think stage 4 represents?
Figure 19.12 The percent growth rate of population in different countries is shown. Notice that the highest growth isoccurring in less economically developed countries in Africa and Asia.
Long-Term Consequences of Exponential Human Population GrowthMany dire predictions have been made about the world’s population leading to a major crisis called the “populationexplosion.” In the 1968 book The Population Bomb, biologist Dr. Paul R. Ehrlich wrote, “The battle to feed all of humanityis over. In the 1970s hundreds of millions of people will starve to death in spite of any crash programs embarked upon now.At this late date nothing can prevent a substantial increase in the world death rate.”
[6]While many critics view this statement
as an exaggeration, the laws of exponential population growth are still in effect, and unchecked human population growthcannot continue indefinitely.
Efforts to moderate population control led to the one-child policy in China, which imposes fines on urban couples who havemore than one child. Due to the fact that some couples wish to have a male heir, many Chinese couples continue to havemore than one child. The effectiveness of the policy in limiting overall population growth is controversial, as is the policyitself. Moreover, there are stories of female infanticide having occurred in some of the more rural areas of the country.Family planning education programs in other countries have had highly positive effects on limiting population growth ratesand increasing standards of living. In spite of population control policies, the human population continues to grow. Becauseof the subsequent need to produce more and more food to feed our population, inequalities in access to food and otherresources will continue to widen. The United Nations estimates the future world population size could vary from 6 billion (a
6. Paul R. Erlich, prologue to The Population Bomb, (1968; repr., New York: Ballantine, 1970).
Chapter 19 | Population and Community Ecology 513

decrease) to 16 billion people by the year 2100. There is no way to know whether human population growth will moderateto the point where the crisis described by Dr. Ehrlich will be averted.
Another consequence of population growth is the change and degradation of the natural environment. Many countries haveattempted to reduce the human impact on climate change by limiting their emission of greenhouse gases. However, a globalclimate change treaty remains elusive, and many underdeveloped countries trying to improve their economic conditionmay be less likely to agree with such provisions without compensation if it means slowing their economic development.Furthermore, the role of human activity in causing climate change has become a hotly debated socio-political issue in somedeveloped countries, including the United States. Thus, we enter the future with considerable uncertainty about our abilityto curb human population growth and protect our environment to maintain the carrying capacity for the human species.
Visit this website (http://openstaxcollege.org/l/populations2) and select “Launch the movie” for an animationdiscussing the global impacts of human population growth.
19.4 | Community Ecology
By the end of this section, you will be able to:
• Discuss the predator-prey cycle
• Give examples of defenses against predation and herbivory
• Describe the competitive exclusion principle
• Give examples of symbiotic relationships between species
• Describe community structure and succession
In general, populations of one species never live in isolation from populations of other species. The interacting populationsoccupying a given habitat form an ecological community. The number of species occupying the same habitat and theirrelative abundance is known as the diversity of the community. Areas with low species diversity, such as the glaciers ofAntarctica, still contain a wide variety of living organisms, whereas the diversity of tropical rainforests is so great that itcannot be accurately assessed. Scientists study ecology at the community level to understand how species interact with eachother and compete for the same resources.
Predation and HerbivoryPerhaps the classical example of species interaction is the predator-prey relationship. The narrowest definition of thepredator-prey interaction describes individuals of one population that kill and then consume the individuals of anotherpopulation. Population sizes of predators and prey in a community are not constant over time, and they may vary in cyclesthat appear to be related. The most often cited example of predator-prey population dynamics is seen in the cycling of thelynx (predator) and the snowshoe hare (prey), using 100 years of trapping data from North America (Figure 19.13). Thiscycling of predator and prey population sizes has a period of approximately ten years, with the predator population laggingone to two years behind the prey population. An apparent explanation for this pattern is that as the hare numbers increase,there is more food available for the lynx, allowing the lynx population to increase as well. When the lynx population growsto a threshold level, however, they kill so many hares that hare numbers begin to decline, followed by a decline in the lynxpopulation because of scarcity of food. When the lynx population is low, the hare population size begins to increase due, inpart, to low predation pressure, starting the cycle anew.
514 Chapter 19 | Population and Community Ecology
This OpenStax book is available for free at http://cnx.org/content/col11487/1.9

Figure 19.13 The cycling of snowshoe hare and lynx populations in Northern Ontario is an example of predator-preydynamics.
Defense Mechanisms against Predation and Herbivory
Predation and predator avoidance are strong selective agents. Any heritable character that allows an individual of a preypopulation to better evade its predators will be represented in greater numbers in later generations. Likewise, traits thatallow a predator to more efficiently locate and capture its prey will lead to a greater number of offspring and an increasein the commonness of the trait within the population. Such ecological relationships between specific populations lead toadaptations that are driven by reciprocal evolutionary responses in those populations. Species have evolved numerousmechanisms to escape predation and herbivory (the consumption of plants for food). Defenses may be mechanical,chemical, physical, or behavioral.
Mechanical defenses, such as the presence of armor in animals or thorns in plants, discourage predation and herbivory bydiscouraging physical contact (Figure 19.14a). Many animals produce or obtain chemical defenses from plants and storethem to prevent predation. Many plant species produce secondary plant compounds that serve no function for the plantexcept that they are toxic to animals and discourage consumption. For example, the foxglove produces several compounds,including digitalis, that are extremely toxic when eaten (Figure 19.14b). (Biomedical scientists have purposed the chemicalproduced by foxglove as a heart medication, which has saved lives for many decades.)
Figure 19.14 The (a) honey locust tree uses thorns, a mechanical defense, against herbivores, while the (b) foxgloveuses a chemical defense: toxins produces by the plant can cause nausea, vomiting, hallucinations, convulsions,or death when consumed. (credit a: modification of work by Huw Williams; credit b: modification of work by PhilipJägenstedt)
Many species use their body shape and coloration to avoid being detected by predators. The tropical walking stick isan insect with the coloration and body shape of a twig, which makes it very hard to see when it is stationary against abackground of real twigs (Figure 19.15a). In another example, the chameleon can change its color to match its surroundings(Figure 19.15b).
Chapter 19 | Population and Community Ecology 515
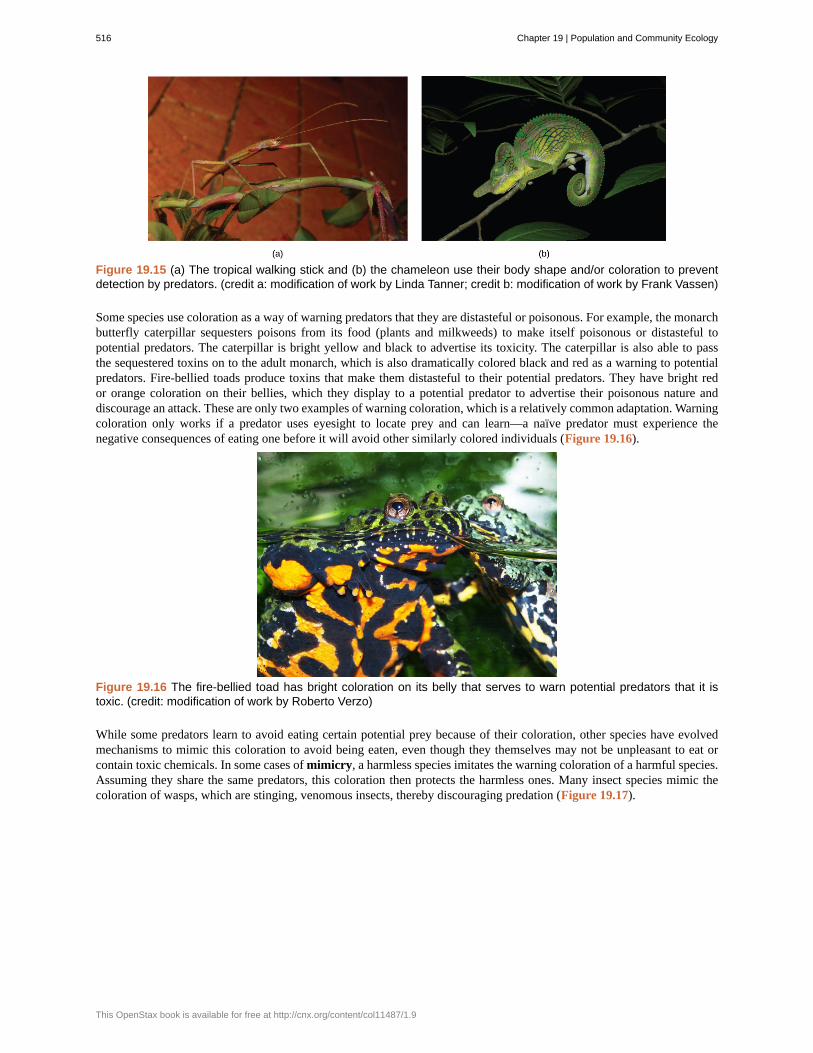
Figure 19.15 (a) The tropical walking stick and (b) the chameleon use their body shape and/or coloration to preventdetection by predators. (credit a: modification of work by Linda Tanner; credit b: modification of work by Frank Vassen)
Some species use coloration as a way of warning predators that they are distasteful or poisonous. For example, the monarchbutterfly caterpillar sequesters poisons from its food (plants and milkweeds) to make itself poisonous or distasteful topotential predators. The caterpillar is bright yellow and black to advertise its toxicity. The caterpillar is also able to passthe sequestered toxins on to the adult monarch, which is also dramatically colored black and red as a warning to potentialpredators. Fire-bellied toads produce toxins that make them distasteful to their potential predators. They have bright redor orange coloration on their bellies, which they display to a potential predator to advertise their poisonous nature anddiscourage an attack. These are only two examples of warning coloration, which is a relatively common adaptation. Warningcoloration only works if a predator uses eyesight to locate prey and can learn—a naïve predator must experience thenegative consequences of eating one before it will avoid other similarly colored individuals (Figure 19.16).
Figure 19.16 The fire-bellied toad has bright coloration on its belly that serves to warn potential predators that it istoxic. (credit: modification of work by Roberto Verzo)
While some predators learn to avoid eating certain potential prey because of their coloration, other species have evolvedmechanisms to mimic this coloration to avoid being eaten, even though they themselves may not be unpleasant to eat orcontain toxic chemicals. In some cases of mimicry, a harmless species imitates the warning coloration of a harmful species.Assuming they share the same predators, this coloration then protects the harmless ones. Many insect species mimic thecoloration of wasps, which are stinging, venomous insects, thereby discouraging predation (Figure 19.17).
516 Chapter 19 | Population and Community Ecology
This OpenStax book is available for free at http://cnx.org/content/col11487/1.9

Figure 19.17 One form of mimicry is when a harmless species mimics the coloration of a harmful species, as is seenwith the (a) wasp (Polistes sp.) and the (b) hoverfly (Syrphus sp.). (credit: modification of work by Tom Ings)
In other cases of mimicry, multiple species share the same warning coloration, but all of them actually have defenses. Thecommonness of the signal improves the compliance of all the potential predators. Figure 19.18 shows a variety of foul-tasting butterflies with similar coloration.
Figure 19.18 Several unpleasant-tasting Heliconius butterfly species share a similar color pattern with better-tastingvarieties, an example of mimicry. (credit: Joron M, Papa R, Beltrán M, Chamberlain N, Mavárez J, et al.)
Go to this website (http://openstaxcollege.org/l/find_the_mimic2) to view stunning examples of mimicry.
Chapter 19 | Population and Community Ecology 517

Competitive Exclusion PrincipleResources are often limited within a habitat and multiple species may compete to obtain them. Ecologists have come tounderstand that all species have an ecological niche. A niche is the unique set of resources used by a species, which includesits interactions with other species. The competitive exclusion principle states that two species cannot occupy the sameniche in a habitat: in other words, different species cannot coexist in a community if they are competing for all the sameresources. This principle works because if there is an overlap in resource use and therefore competition between two species,then traits that lessen reliance on the shared resource will be selected for leading to evolution that reduces the overlap. Ifeither species is unable to evolve to reduce competition, then the species that most efficiently exploits the resource will drivethe other species to extinction. An experimental example of this principle is shown in Figure 19.19 with two protozoanspecies: Paramecium aurelia and Paramecium caudatum. When grown individually in the laboratory, they both thrive. Butwhen they are placed together in the same test tube (habitat), P. aurelia outcompetes P. caudatum for food, leading to thelatter’s eventual extinction.
Figure 19.19 Paramecium aurelia and Paramecium caudatum grow well individually, but when they compete for thesame resources, the P. aurelia outcompetes the P. caudatum.
SymbiosisSymbiotic relationships are close, long-term interactions between individuals of different species. Symbioses may becommensal, in which one species benefits while the other is neither harmed nor benefited; mutualistic, in which both speciesbenefit; or parasitic, in which the interaction harms one species and benefits the other.
Commensalism
A commensal relationship occurs when one species benefits from a close prolonged interaction, while the other neitherbenefits nor is harmed. Birds nesting in trees provide an example of a commensal relationship (Figure 19.20). The tree isnot harmed by the presence of the nest among its branches. The nests are light and produce little strain on the structuralintegrity of the branch, and most of the leaves, which the tree uses to get energy by photosynthesis, are above the nest sothey are unaffected. The bird, on the other hand, benefits greatly. If the bird had to nest in the open, its eggs and youngwould be vulnerable to predators. Many potential commensal relationships are difficult to identify because it is difficult toprove that one partner does not derive some benefit from the presence of the other.
518 Chapter 19 | Population and Community Ecology
This OpenStax book is available for free at http://cnx.org/content/col11487/1.9

Figure 19.20 The southern masked-weaver is starting to make a nest in a tree in Zambezi Valley, Zambia. This isan example of a commensal relationship, in which one species (the bird) benefits, while the other (the tree) neitherbenefits nor is harmed. (credit: “Hanay”/Wikimedia Commons)
Mutualism
A second type of symbiotic relationship is called mutualism, in which two species benefit from their interaction. Forexample, termites have a mutualistic relationship with protists that live in the insect’s gut (Figure 19.21a). The termitebenefits from the ability of the protists to digest cellulose. However, the protists are able to digest cellulose only becauseof the presence of symbiotic bacteria within their cells that produce the cellulase enzyme. The termite itself cannot dothis: without the protozoa, it would not be able to obtain energy from its food (cellulose from the wood it chews andeats). The protozoa benefit by having a protective environment and a constant supply of food from the wood chewingactions of the termite. In turn, the protists benefit from the enzymes provided by their bacterial endosymbionts, whilethe bacteria benefit from a doubly protective environment and a constant source of nutrients from two hosts. Lichenare a mutualistic relationship between a fungus and photosynthetic algae or cyanobacteria (Figure 19.21b). The glucoseproduced by the algae provides nourishment for both organisms, whereas the physical structure of the lichen protects thealgae from the elements and makes certain nutrients in the atmosphere more available to the algae. The algae of lichens canlive independently given the right environment, but many of the fungal partners are unable to live on their own.
Figure 19.21 (a) Termites form a mutualistic relationship with symbiotic protozoa in their guts, which allow bothorganisms to obtain energy from the cellulose the termite consumes. (b) Lichen is a fungus that has symbioticphotosynthetic algae living in close association. (credit a: modification of work by Scott Bauer, USDA; credit b:modification of work by Cory Zanker)
Parasitism
A parasite is an organism that feeds off another without immediately killing the organism it is feeding on. In thisrelationship, the parasite benefits, but the organism being fed upon, the host, is harmed. The host is usually weakened bythe parasite as it siphons resources the host would normally use to maintain itself. Parasites may kill their hosts, but there
Chapter 19 | Population and Community Ecology 519

is usually selection to slow down this process to allow the parasite time to complete its reproductive cycle before it or itsoffspring are able to spread to another host.
The reproductive cycles of parasites are often very complex, sometimes requiring more than one host species. A tapewormcauses disease in humans when contaminated, undercooked meat such as pork, fish, or beef is consumed (Figure 19.22).The tapeworm can live inside the intestine of the host for several years, benefiting from the host’s food, and it may growto be over 50 feet long by adding segments. The parasite moves from one host species to a second host species in order tocomplete its life cycle. Plasmodium falciparum is another parasite: the protists that cause malaria, a significant disease inmany parts of the world. Living inside human liver and red blood cells, the organism reproduces asexually in the humanhost and then sexually in the gut of blood-feeding mosquitoes to complete its life cycle. Thus malaria is spread from humanto mosquito and back to human, one of many arthropod-borne infectious diseases of humans.
Figure 19.22 This diagram shows the life cycle of the tapeworm, a human worm parasite. (credit: modification of workby CDC)
To learn more about “Symbiosis in the Sea,” watch this webisode (http://openstaxcollege.org/l/symbiosis) of JonathanBird’s Blue World.
Characteristics of CommunitiesCommunities are complex systems that can be characterized by their structure (the number and size of populations and theirinteractions) and dynamics (how the members and their interactions change over time). Understanding community structureand dynamics allows us to minimize impacts on ecosystems and manage ecological communities we benefit from.
Biodiversity
Ecologists have extensively studied one of the fundamental characteristics of communities: biodiversity. One measure ofbiodiversity used by ecologists is the number of different species in a particular area and their relative abundance. The areain question could be a habitat, a biome, or the entire biosphere. Species richness is the term used to describe the number of
520 Chapter 19 | Population and Community Ecology
This OpenStax book is available for free at http://cnx.org/content/col11487/1.9

species living in a habitat or other unit. Species richness varies across the globe (Figure 19.23). Ecologists have struggledto understand the determinants of biodiversity. Species richness is related to latitude: the greatest species richness occursnear the equator and the lowest richness occurs near the poles. Other factors influence species richness as well. Islandbiogeography attempts to explain the great species richness found in isolated islands, and has found relationships betweenspecies richness, island size, and distance from the mainland.
Relative species abundance is the number individuals in a species relative to the total number of individuals in all specieswithin a system. Foundation species, described below, often have the highest relative abundance of species.
Figure 19.23 The greatest species richness for mammals in North America is associated in the equatorial latitudes.(credit: modification of work by NASA, CIESIN, Columbia University)
Foundation Species
Foundation species are considered the “base” or “bedrock” of a community, having the greatest influence on its overallstructure. They are often primary producers, and they are typically an abundant organism. For example, kelp, a species ofbrown algae, is a foundation species that forms the basis of the kelp forests off the coast of California.
Foundation species may physically modify the environment to produce and maintain habitats that benefit the otherorganisms that use them. Examples include the kelp described above or tree species found in a forest. The photosyntheticcorals of the coral reef also provide structure by physically modifying the environment (Figure 19.24). The exoskeletons ofliving and dead coral make up most of the reef structure, which protects many other species from waves and ocean currents.
Figure 19.24 Coral is the foundation species of coral reef ecosystems. (credit: Jim E. Maragos, USFWS)
Chapter 19 | Population and Community Ecology 521

Keystone Species
A keystone species is one whose presence has inordinate influence in maintaining the prevalence of various species inan ecosystem, the ecological community’s structure, and sometimes its biodiversity. Pisaster ochraceus, the intertidal seastar, is a keystone species in the northwestern portion of the United States (Figure 19.25). Studies have shown that whenthis organism is removed from communities, mussel populations (their natural prey) increase, which completely alters thespecies composition and reduces biodiversity. Another keystone species is the banded tetra, a fish in tropical streams, whichsupplies nearly all of the phosphorus, a necessary inorganic nutrient, to the rest of the community. The banded tetra feedslargely on insects from the terrestrial ecosystem and then excretes phosphorus into the aquatic ecosystem. The relationshipsbetween populations in the community, and possibly the biodiversity, would change dramatically if these fish were tobecome extinct.
Figure 19.25 The Pisaster ochraceus sea star is a keystone species. (credit: Jerry Kirkhart)
522 Chapter 19 | Population and Community Ecology
This OpenStax book is available for free at http://cnx.org/content/col11487/1.9

Invasive SpeciesInvasive species are non-native organisms that, when introduced to an area out of its native range, alter thecommunity they invade. In the United States, invasive species like the purple loosestrife (Lythrum salicaria)and the zebra mussel (Dreissena polymorpha) have altered aquatic ecosystems, and some forests arethreatened by the spread of common buckthorn (Rhamnus cathartica) and garlic mustard (Alliaria petiolata).Some well-known invasive animals include the emerald ash borer (Agrilus planipennis) and the Europeanstarling (Sturnus vulgaris). Whether enjoying a forest hike, taking a summer boat trip, or simply walkingdown an urban street, you have likely encountered an invasive species.
One of the many recent proliferations of an invasive species concerns the Asian carp in the United States.Asian carp were introduced to the United States in the 1970s by fisheries (commercial catfish ponds) andby sewage treatment facilities that used the fish’s excellent filter feeding abilities to clean their ponds ofexcess plankton. Some of the fish escaped, and by the 1980s they had colonized many waterways of theMississippi River basin, including the Illinois and Missouri Rivers.
Voracious feeders and rapid reproducers, Asian carp may outcompete native species for food and couldlead to their extinction. One species, the grass carp, feeds on phytoplankton and aquatic plants. It competeswith native species for these resources and alters nursery habitats for other fish by removing aquatic plants.Another species, the silver carp, competes with native fish that feed on zooplankton. In some parts of theIllinois River, Asian carp constitute 95 percent of the community's biomass. Although edible, the fish is bonyand not desired in the United States. Moreover, their presence now threatens the native fish and fisheriesof the Great Lakes, which are important to local economies and recreational anglers. Asian carp have eveninjured humans. The fish, frightened by the sound of approaching motorboats, thrust themselves into theair, often landing in the boat or directly hitting boaters.
The Great Lakes and their prized salmon and lake trout fisheries are being threatened by Asian carp. Thecarp are not yet present in the Great Lakes, and attempts are being made to prevent its access to the lakesthrough the Chicago Ship and Sanitary Canal, which is the only connection between the Mississippi Riverand Great Lakes basins. To prevent the Asian carp from leaving the canal, a series of electric barriers havebeen used to discourage their migration; however, the threat is significant enough that several states andCanada have sued to have the Chicago channel permanently cut off from Lake Michigan. Local and nationalpoliticians have weighed in on how to solve the problem. In general, governments have been ineffective inpreventing or slowing the introduction of invasive species.
The issues associated with Asian carp show how population and community ecology, fisheriesmanagement, and politics intersect on issues of vital importance to the human food supply and economy.Socio-political issues like the Asian carp make extensive use of the sciences of population ecology, thestudy of members of a particular species occupying a habitat; and community ecology, the study of theinteraction of all species within a habitat.
Community DynamicsCommunity dynamics are the changes in community structure and composition over time, often following environmentaldisturbances such as volcanoes, earthquakes, storms, fires, and climate change. Communities with a relatively constantnumber of species are said to be at equilibrium. The equilibrium is dynamic with species identities and relationshipschanging over time, but maintaining relatively constant numbers. Following a disturbance, the community may or may notreturn to the equilibrium state.
Succession describes the sequential appearance and disappearance of species in a community over time after a severedisturbance. In primary succession, newly exposed or newly formed rock is colonized by living organisms; in secondarysuccession, a part of an ecosystem is disturbed and remnants of the previous community remain. In both cases, there is asequential change in species until a more or less permanent community develops.
Primary Succession and Pioneer Species
Primary succession occurs when new land is formed, for example, following the eruption of volcanoes, such as those on theBig Island of Hawaii. As lava flows into the ocean, new land is continually being formed. On the Big Island, approximately32 acres of land is added to it its size each year. Weathering and other natural forces break down the rock enough for the
Chapter 19 | Population and Community Ecology 523

establishment of hearty species such as lichens and some plants, known as pioneer species (Figure 19.26). These specieshelp to further break down the mineral-rich lava into soil where other, less hardy but more competitive species, such asgrasses, shrubs, and trees, will grow and eventually replace the pioneer species. Over time the area will reach an equilibriumstate, with a set of organisms quite different from the pioneer species.
Figure 19.26 During primary succession in lava on Maui, Hawaii, succulent plants are the pioneer species. (credit:Forest and Kim Starr)
Secondary succession
A classic example of secondary succession occurs in oak and hickory forests cleared by wildfire (Figure 19.27). Wildfireswill burn most vegetation, and unless the animals can flee the area, they are killed. Their nutrients, however, are returned tothe ground in the form of ash. Thus, although the community has been dramatically altered, there is a soil ecosystem presentthat provides a foundation for rapid recolonization.
Before the fire, the vegetation was dominated by tall trees with access to the major plant energy resource: sunlight. Theirheight gave them access to sunlight while also shading the ground and other low-lying species. After the fire, though, thesetrees are no longer dominant. Thus, the first plants to grow back are usually annual plants followed within a few yearsby quickly growing and spreading grasses and other pioneer species. Due, at least in part, to changes in the environmentbrought on by the growth of grasses and forbs, over many years, shrubs emerge along with small pine, oak, and hickorytrees. These organisms are called intermediate species. Eventually, over 150 years, the forest will reach its equilibriumpoint and resemble the community before the fire. This equilibrium state is referred to as the climax community, whichwill remain until the next disturbance. The climax community is typically characteristic of a given climate and geology.Although the community in equilibrium looks the same once it is attained, the equilibrium is a dynamic one with constantchanges in abundance and sometimes species identities. The return of a natural ecosystem after agricultural activities is alsoa well-documented secondary succession process.
Figure 19.27 Secondary succession is seen in an oak and hickory forest after a forest fire. A sequence of thecommunity present at three successive times at the same location is depicted.
524 Chapter 19 | Population and Community Ecology
This OpenStax book is available for free at http://cnx.org/content/col11487/1.9

age structure
birth rate
carrying capacity
climax community
competitive exclusion principle
death rate
demography
density-dependent regulation
density-independent regulation
environmental disturbance
exponential growth
foundation species
host
intraspecific competition
island biogeography
J-shaped growth curve
K-selected species
keystone species
life table
logistic growth
mark and recapture
mimicry
mortality rate
mutualism
one-child policy
parasite
KEY TERMSthe distribution of the proportion of population members in each age class
the number of births within a population at a specific point in time
the maximum number of individuals of a population that can be supported by the limited resources ofa habitat
the final stage of succession, where a stable community is formed by a characteristic assortment ofplant and animal species
no two species within a habitat can coexist indefinitely when they compete for thesame resources at the same time and place
the number of deaths within a population at a specific point in time
the statistical study of changes in populations over time
the regulation of population in which birth and death rates are dependent on populationsize
the regulation of population in which the death rate is independent of the populationsize
a change in the environment caused by natural disasters or human activities
an accelerating growth pattern seen in populations where resources are not limiting
a species which often forms the major structural portion of the habitat
an organism a parasite lives on
the competition among members of the same species
the study of life on island chains and how their geography interacts with the diversity of speciesfound there
the shape of an exponential growth curve
a species suited to stable environments that produce a few, relatively large offspring and provideparental care
a species whose presence is key to maintaining biodiversity in an ecosystem and to upholding anecological community’s structure
a table showing the life expectancy of a population member based on its age
the leveling off of exponential growth due to limiting resources
a method used to determine population size in mobile organisms
an adaptation in which an organism looks like another organism that is dangerous, toxic, or distasteful to itspredators
the proportion of population surviving to the beginning of an age interval that dies during that age interval
a symbiotic relationship between two species where both species benefit
a policy in China to limit population growth by limiting urban couples to have only one child or face apenalty of a fine
an organism that uses resources from another species: the host
Chapter 19 | Population and Community Ecology 525

pioneer species
population density
population size
primary succession
quadrat
r-selected species
relative species abundance
S-shaped growth curve
secondary succession
species distribution pattern
species richness
survivorship curve
zero population growth
the first species to appear in primary and secondary succession
the number of population members divided by the area being measured
the number of individuals in a population
the succession on land that previously has had no life
a square within which a count of individuals is made that is combined with other such counts to determinepopulation size and density in slow moving or stationary organisms
a species suited to changing environments that produce many offspring and provide little or noparental care
the absolute population size of a particular species relative to the population size of otherspecies within the community
the shape of a logistic growth curve
the succession in response to environmental disturbances that move a community away from itsequilibrium
the distribution of individuals within a habitat at a given point in time
the number of different species in a community
a graph of the number of surviving population members versus the relative age of the member
the steady population size where birth rates and death rates are equal
CHAPTER SUMMARY19.1 Population Demographics and Dynamics
Populations are individuals of a species that live in a particular habitat. Ecologists measure characteristics of populations:size, density, and distribution pattern. Life tables are useful to calculate life expectancies of individual populationmembers. Survivorship curves show the number of individuals surviving at each age interval plotted versus time.
19.2 Population Growth and Regulation
Populations with unlimited resources grow exponentially—with an accelerating growth rate. When resources becomelimiting, populations follow a logistic growth curve in which population size will level off at the carrying capacity.
Populations are regulated by a variety of density-dependent and density-independent factors. Life-history characteristics,such as age at first reproduction or numbers of offspring, are characteristics that evolve in populations just as anatomy orbehavior can evolve over time. The model of r- and K-selection suggests that characters, and possibly suites of characters,may evolve adaptations to population stability near the carrying capacity (K-selection) or rapid population growth andcollapse (r-selection). Species will exhibit adaptations somewhere on a continuum between these two extremes.
19.3 The Human Population
Earth’s human population is growing exponentially. Humans have increased their carrying capacity through technology,urbanization, and harnessing the energy of fossil fuels. The age structure of a population allows us to predict populationgrowth. Unchecked human population growth could have dire long-term effects on human welfare and Earth’s ecosystems.
19.4 Community Ecology
Communities include all the different species living in a given area. The variety of these species is referred to asbiodiversity. Many organisms have developed defenses against predation and herbivory, including mechanical defenses,warning coloration, and mimicry. Two species cannot exist indefinitely in the same habitat competing directly for the sameresources. Species may form symbiotic relationships such as commensalism, mutualism, or parasitism. Community
526 Chapter 19 | Population and Community Ecology
This OpenStax book is available for free at http://cnx.org/content/col11487/1.9

structure is described by its foundation and keystone species. Communities respond to environmental disturbances bysuccession: the predictable appearance of different types of plant species, until a stable community structure is established.
ART CONNECTION QUESTIONS1. Figure 19.2 As this graph shows, population densitytypically decreases with increasing body size. Why do youthink this is the case?
2. Figure 19.6 If the major food source of seals declinesdue to pollution or overfishing, which of the followingwould likely occur?
a. The carrying capacity of seals would decrease,as would the seal population.
b. The carrying capacity of seals would decrease,but the seal population would remain the same.
c. The number of seal deaths would increase, butthe number of births would also increase, so thepopulation size would remain the same.
d. The carrying capacity of seals would remain thesame, but the population of seals woulddecrease.
3. Figure 19.11 Age structure diagrams for rapidlygrowing, slow growing, and stable populations are shownin stages 1 through 3. What type of population change doyou think stage 4 represents?
REVIEW QUESTIONS4. Which of the following methods will provideinformation to an ecologist about both the size and densityof a population?
a. mark and recaptureb. mark and releasec. quadratd. life table
5. Which of the following is best at showing the lifeexpectancy of an individual within a population?
a. quadratb. mark and recapturec. survivorship curved. life table
6. Human populations have which type of survivorshipcurve?
a. Type Ib. Type IIc. Type IIId. Type IV
7. Species with limited resources usually exhibit a(n)________ growth curve.
a. logisticb. logicalc. experimentald. exponential
8. The maximum growth rate characteristic of a species iscalled its ________.
a. limitb. carrying capacityc. biotic potentiald. exponential growth pattern
9. The population size of a species capable of beingsupported by the environment is called its ________.
a. limitb. carrying capacity
c. biotic potentiald. logistic growth pattern
10. Species that have many offspring at one time areusually:
a. r-selectedb. K-selectedc. both r- and K-selectedd. not selected
11. A forest fire is an example of ________ regulation.
a. density-dependentb. density-independentc. r-selectedd. K-selected
12. A country with zero population growth is likely to be________.
a. in Africab. in Asiac. economically developedd. economically underdeveloped
13. Which type of country has the greatest proportion ofyoung individuals?
a. economically developedb. economically underdevelopedc. countries with zero population growthd. countries in Europe
14. Which of the following is not a way that humans haveincreased the carrying capacity of the environment?
a. agricultureb. using large amounts of natural resourcesc. domestication of animalsd. use of language
15. The first species to live on new land, such as thatformed from volcanic lava, are called________.
a. climax communityb. keystone species
Chapter 19 | Population and Community Ecology 527

c. foundation speciesd. pioneer species
16. A symbiotic relationship where both of the co-existingspecies benefit from the interaction is called ________.
a. commensalismb. parasitismc. mutualism
d. communism
17. When an invasive species alters the communitystructure it is introduced to, what can the consequence be?
a. extinction of economically important speciesb. reduced predation on some native speciesc. increased predation on some native speciesd. all of the above
CRITICAL THINKING QUESTIONS18. Describe how a researcher would determine the size ofa penguin population in Antarctica using the mark andrelease method.
19. Describe the growth at various parts of the S-shapedcurve of logistic growth.
20. Give an example of how density-dependent anddensity-independent factors might interact.
21. Describe the age structures in rapidly growingcountries, slowly growing countries, and countries withzero population growth.
22. Describe the competitive exclusion principle and itseffects on competing species.
23. Describe the potential effects when a keystone speciesis removed from a community.
528 Chapter 19 | Population and Community Ecology
This OpenStax book is available for free at http://cnx.org/content/col11487/1.9