Embed Size (px)
Citation preview
Cecil H. & Ida M. Green Institute of Geophysics & Planetary PhysicsSCRIPPS INSTITUTION OF OCEANOGR APHY, UNI VERSIT Y OF CALIFORNI A, S AN DIEGO
2012
2012
Image: A windy day on the Whillans Ice Stream, West Antarctica—courtesy of Matthew Siegfried.
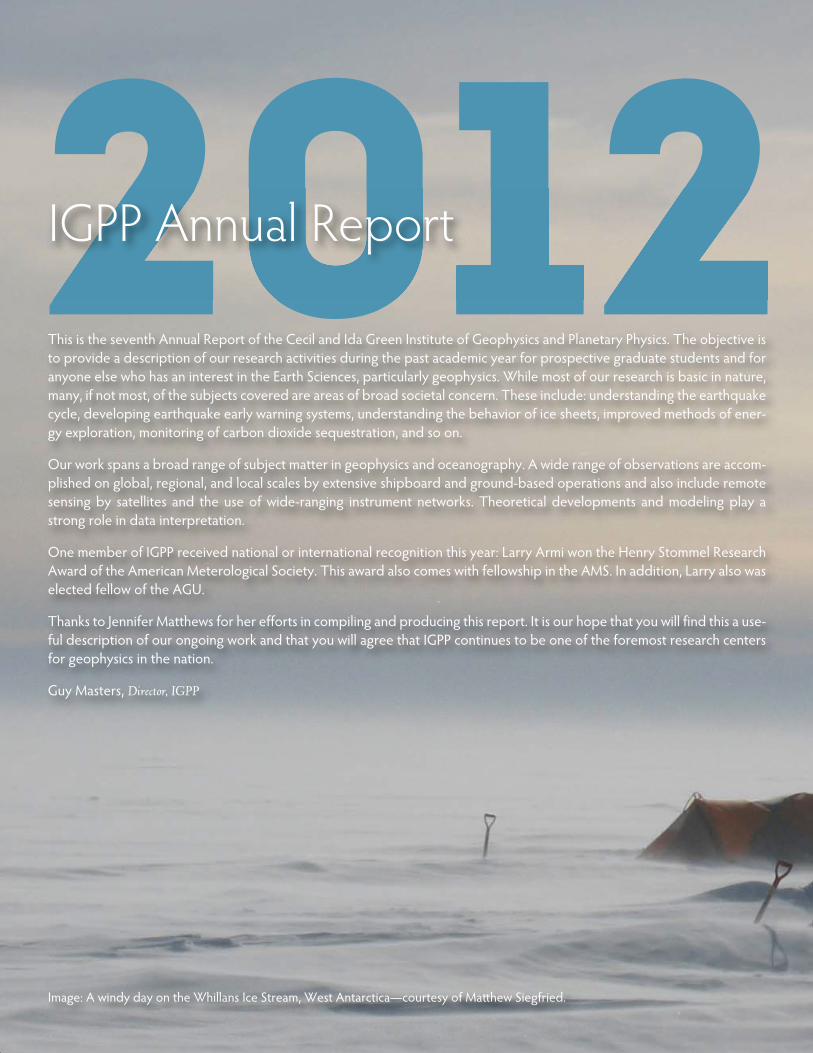
This is the seventh Annual Report of the Cecil and Ida Green Institute of Geophysics and Planetary Physics. The objective isto provide a description of our research activities during the past academic year for prospective graduate students and foranyone else who has an interest in the Earth Sciences, particularly geophysics. While most of our research is basic in nature,many, if not most, of the subjects covered are areas of broad societal concern. These include: understanding the earthquakecycle, developing earthquake early warning systems, understanding the behavior of ice sheets, improved methods of ener-gy exploration, monitoring of carbon dioxide sequestration, and so on.
Our work spans a broad range of subject matter in geophysics and oceanography. A wide range of observations are accom-plished on global, regional, and local scales by extensive shipboard and ground-based operations and also include remotesensing by satellites and the use of wide-ranging instrument networks. Theoretical developments and modeling play astrong role in data interpretation.
One member of IGPP received national or international recognition this year: Larry Armi won the Henry Stommel ResearchAward of the American Meterological Society. This award also comes with fellowship in the AMS. In addition, Larry also waselected fellow of the AGU.
Thanks to Jennifer Matthews for her efforts in compiling and producing this report. It is our hope that you will find this a use-ful description of our ongoing work and that you will agree that IGPP continues to be one of the foremost research centersfor geophysics in the nation.
Guy Masters, Director, IGPP
IGPP Annual Report
ACOUSTIC THERMOMETRY, Dzieciuch,Worcester
ACOUSTICS, Blackman, Dzieciuch, Hedlin
ANTARCTIC ICE SHEETS, Fricker
COMPLEXITY, Werner
CRUSTAL DEFORMATION, Agnew, Bock,Fialko, Sandwell
CRUSTAL SEISMOLOGY, Fialko, Kilb, Shearer,Vernon
CYBERINFRASTRAUCTURE, Bock,Constable, C., Orcutt, Staudigel
EARTH’S DEEP INTERIOR, Constable, S.,Masters
EARTHQUAKE MECHANISMS, de Groot-Hedlin, Fialko, Kilb, Minster, Shearer, Vernon
ELECTRICAL PROPERTIES, Constable, S.
ELECTROMAGNETIC INDUCTION, Constable, C., Constable S., Parker
GEODESY, Agnew, Bock, Fialko
GEODYNAMICS, Laske, Ogden, Sandwell,Stegman
GEOMAGNETISM, Ierley, Constable, C., Parker
GEOPHYSICAL INSTRUMENTATION, Agnew,Bock, Berger, Constable, S., Davis, Vernon,Zumberge
GLOBAL SEISMOLOGY, Davis, Laske, Masters,Shearer
GPS, Agnew, Bock, Fialko, Minster
INFORMATION TECHNOLOGY, Bock,Orcutt, Vernon
INFRASOUND, de Groot-Hedlin, Hedlin
INVERSE THEORY, Key, Parker
LANDSCAPE SYSTEMS, Werner
MARINE ELECTROMAGNETIC INDUCTION,Constable, S., Key
MARINE GEOLOGY, Blackman, Harding, Laske,Staudigel
MARINE SEISMOLOGY, Harding, Laske, Orcutt
MID-OCEAN RIDGES, Constable, S., Blackman,Harding
NORMAL MODES, Davis, Masters, Laske
NUMERICAL METHODS, Constable, S.,Dzieciuch, de Groot-Hedlin, Parker
OBSERVATIONAL NETWORKS, Bock, Davis,Orcutt, Vernon
OCEAN ACOUSTICS, de Groot-Hedlin,Dzieciuch, Munk, Worcester
OCEANOGRAPHY, Munk, Worcester
OCEAN BATHYMETRY, Sandwell
PALEOMAGNETISM, Constable, C.
PLANETARY PHYSICS, Stegman
RADAR TECHNIQUES, Fialko, Fricker, Minster,Sandwell
REFLECTION SEISMOLOGY, Harding
SATELLITE LASER ALTIMETRY, Fricker
SEAMOUNTS, Staudigel
SEISMIC ANISOTROPY, Blackman
SEISMIC HAZARDS, Bock, Kent
SEISMOMETERS, Berger, Zumberge
SPECTRAL ANALYSIS, Dzieciuch, Parker,Shearer, Vernon
STRAINMETERS, Agnew, Zumberge
TIDES, Davis, Agnew
VOLCANOS, Fialko, Hedlin, Ogden, Staudigel
Duncan Carr Agnew Frank K. WyattProfessor of Geophysics PrincipalDevelopment EngineerEmail: [email protected] Email:[email protected]: x42590 Phone: x42411
Research Interests: Crustal deformation measurement and interpretation, Earth tides, SouthernCalifornia earthquakes.
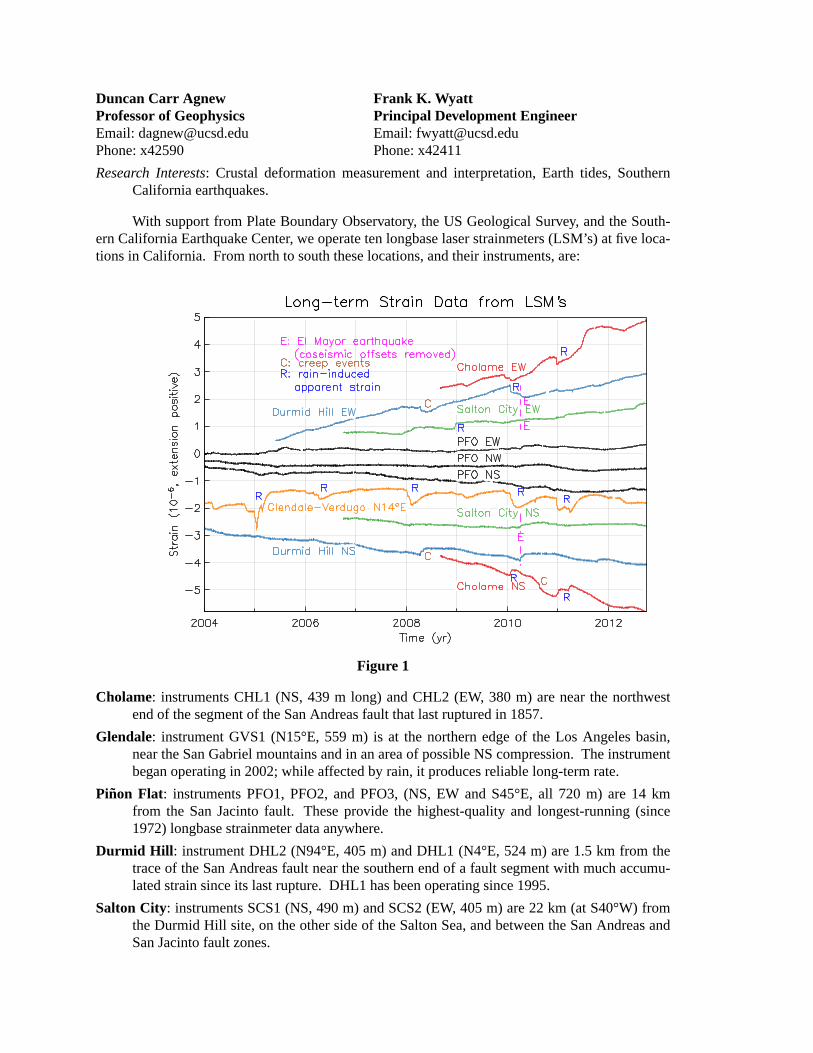
With support from Plate Boundary Observatory, the US Geological Survey, and the South-ern California Earthquake Center, we operate ten longbase laser strainmeters (LSM’s) at five loca-tions in California. From north to south these locations, and their instruments, are:
Figure 1
Cholame: instruments CHL1 (NS, 439 m long) and CHL2 (EW, 380 m) are near the northwestend of the segment of the San Andreas fault that last ruptured in 1857.
Glendale: instrument GVS1 (N15°E, 559 m) is at the northern edge of the Los Angeles basin,near the San Gabriel mountains and in an area of possible NS compression. The instrumentbegan operating in 2002; while affected by rain, it produces reliable long-term rate.
Pinon Flat: instruments PFO1, PFO2, and PFO3, (NS, EW and S45°E, all 720 m) are 14 kmfrom the San Jacinto fault. Theseprovide the highest-quality and longest-running (since1972) longbase strainmeter data anywhere.
Durmid Hill : instrument DHL2 (N94°E, 405 m) and DHL1 (N4°E, 524 m) are 1.5 km from thetrace of the San Andreas fault near the southern end of a fault segment with much accumu-lated strain since its last rupture. DHL1 has been operating since 1995.
Salton City: instruments SCS1 (NS, 490 m) and SCS2 (EW, 405 m) are 22 km (at S40°W) fromthe Durmid Hill site, on the other side of the Salton Sea, and between the San Andreas andSan Jacinto fault zones.
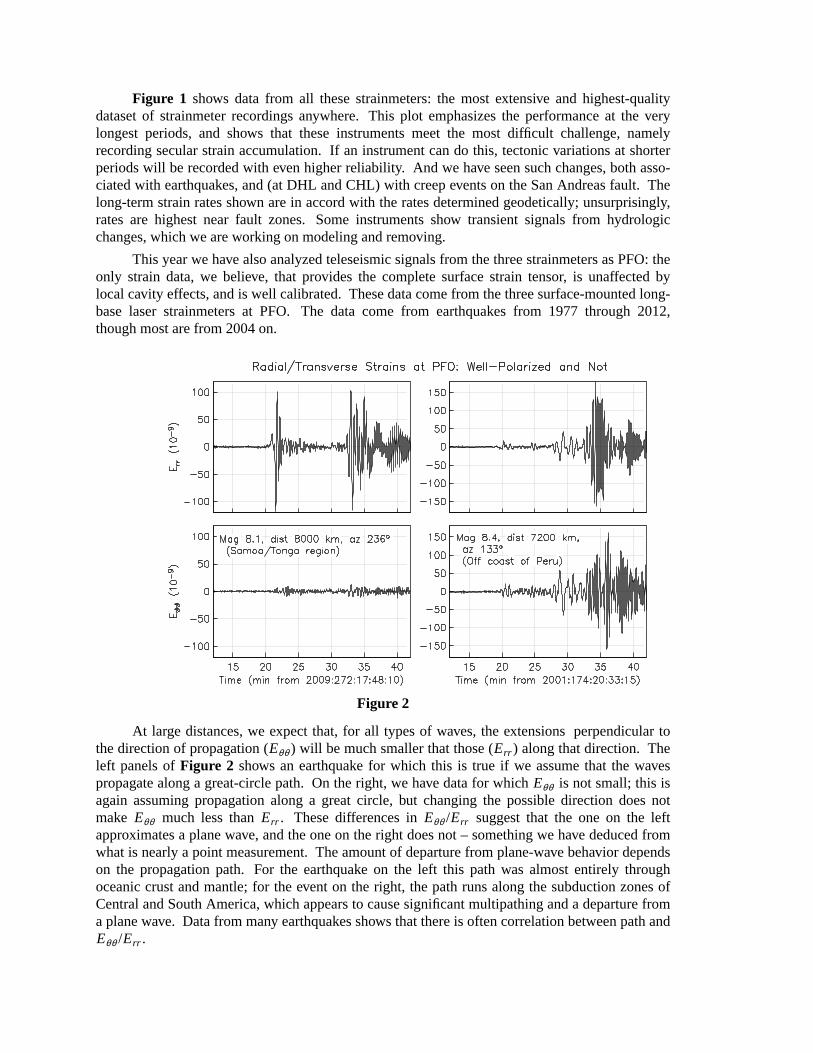
Figure 1 shows data from all these strainmeters: the most extensive and highest-qualitydataset of strainmeter recordings anywhere. Thisplot emphasizes the performance at the verylongest periods, and shows that these instruments meet the most difficult challenge, namelyrecording secular strain accumulation. If an instrument can do this, tectonic variations at shorterperiods will be recorded with even higher reliability. And we have seen such changes, both asso-ciated with earthquakes, and (at DHL and CHL) with creep events on the San Andreas fault. Thelong-term strain rates shown are in accord with the rates determined geodetically; unsurprisingly,rates are highest near fault zones. Some instruments show transient signals from hydrologicchanges, which we are working on modeling and removing.
This year we have also analyzed teleseismic signals from the three strainmeters as PFO: theonly strain data, we believe, that provides the complete surface strain tensor, is unaffected bylocal cavity effects, and is well calibrated. These data come from the three surface-mounted long-base laser strainmeters at PFO. The data come from earthquakes from 1977 through 2012,though most are from 2004 on.
Figure 2
At large distances, we expect that, for all types of wav es, the extensions perpendiculartothe direction of propagation (Eθθ ) will be much smaller that those (Err ) along that direction.Theleft panels ofFigure 2 shows an earthquake for which this is true if we assume that the wav espropagate along a great-circle path.On the right, we have data for whichEθθ is not small; this isagain assuming propagation along a great circle, but changing the possible direction does notmake Eθθ much less thanErr . These differences inEθθ /Err suggest that the one on the leftapproximates a plane wav e, and the one on the right does not – something we have deduced fromwhat is nearly a point measurement. The amount of departure from plane-wav ebehavior dependson the propagation path. For the earthquake on the left this path was almost entirely throughoceanic crust and mantle; for the event on the right, the path runs along the subduction zones ofCentral and South America, which appears to cause significant multipathing and a departure froma plane wav e. Data from many earthquakes shows that there is often correlation between path andEθθ /Err .
Luciana Astiz Associate Director of IGPP Real Time Data Array Network Facility (ANF)
Email address: [email protected]
Phone extension: 22976
Research Interests: Seismotectonics of continental and subduction zone regions, in particular in the United States and Middle America. Seismic Network operations with emphasis on data quality control. Discrimination between earthquakes and man-made seismic events.
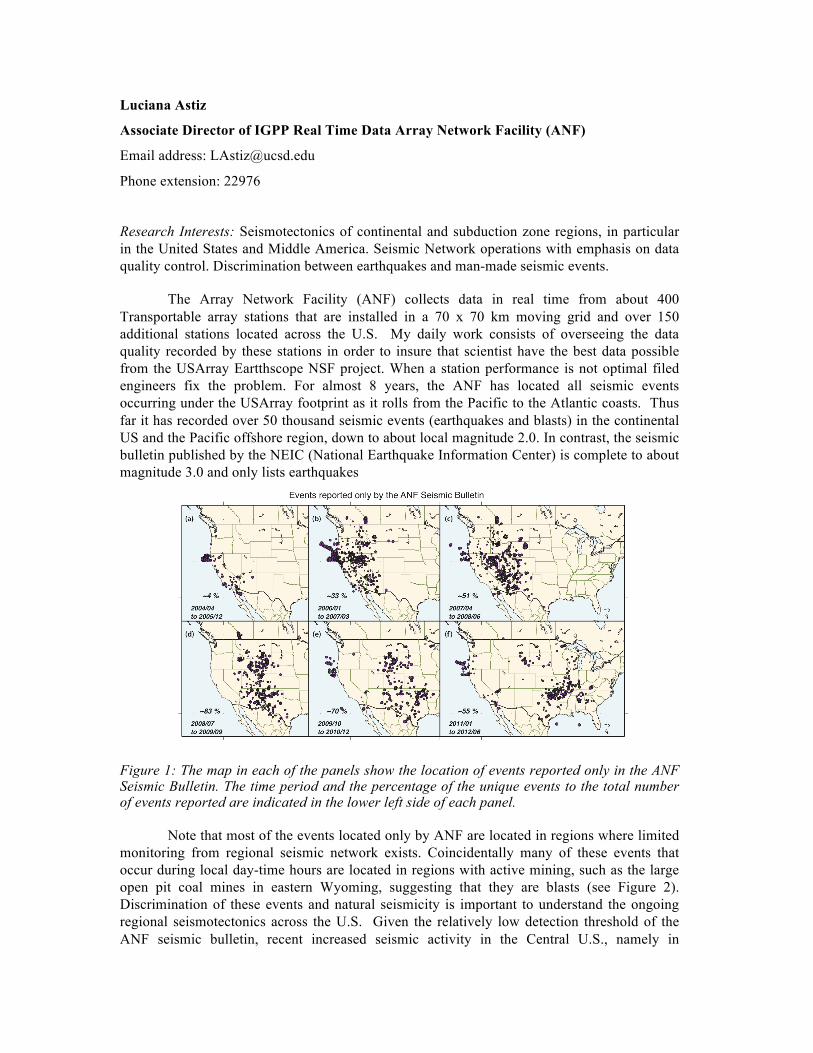
The Array Network Facility (ANF) collects data in real time from about 400 Transportable array stations that are installed in a 70 x 70 km moving grid and over 150 additional stations located across the U.S. My daily work consists of overseeing the data quality recorded by these stations in order to insure that scientist have the best data possible from the USArray Eartthscope NSF project. When a station performance is not optimal filed engineers fix the problem. For almost 8 years, the ANF has located all seismic events occurring under the USArray footprint as it rolls from the Pacific to the Atlantic coasts. Thus far it has recorded over 50 thousand seismic events (earthquakes and blasts) in the continental US and the Pacific offshore region, down to about local magnitude 2.0. In contrast, the seismic bulletin published by the NEIC (National Earthquake Information Center) is complete to about magnitude 3.0 and only lists earthquakes
Figure 1: The map in each of the panels show the location of events reported only in the ANF Seismic Bulletin. The time period and the percentage of the unique events to the total number of events reported are indicated in the lower left side of each panel.
Note that most of the events located only by ANF are located in regions where limited monitoring from regional seismic network exists. Coincidentally many of these events that occur during local day-time hours are located in regions with active mining, such as the large open pit coal mines in eastern Wyoming, suggesting that they are blasts (see Figure 2). Discrimination of these events and natural seismicity is important to understand the ongoing regional seismotectonics across the U.S. Given the relatively low detection threshold of the ANF seismic bulletin, recent increased seismic activity in the Central U.S., namely in
Oklahoma and Arkansas, probably related to gas recovery through “fracking” in those regions has been monitored first by the USArray.
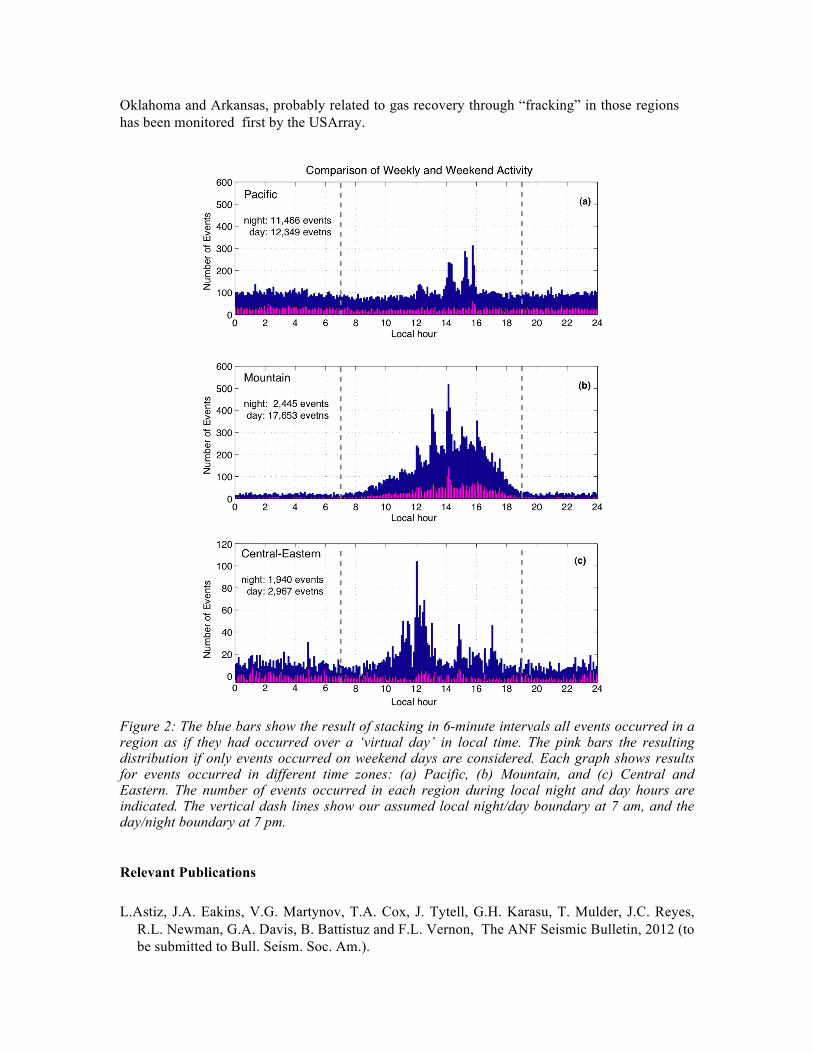
Figure 2: The blue bars show the result of stacking in 6-minute intervals all events occurred in a region as if they had occurred over a ‘virtual day’ in local time. The pink bars the resulting distribution if only events occurred on weekend days are considered. Each graph shows results for events occurred in different time zones: (a) Pacific, (b) Mountain, and (c) Central and Eastern. The number of events occurred in each region during local night and day hours are indicated. The vertical dash lines show our assumed local night/day boundary at 7 am, and the day/night boundary at 7 pm. Relevant Publications L.Astiz, J.A. Eakins, V.G. Martynov, T.A. Cox, J. Tytell, G.H. Karasu, T. Mulder, J.C. Reyes,
R.L. Newman, G.A. Davis, B. Battistuz and F.L. Vernon, The ANF Seismic Bulletin, 2012 (to be submitted to Bull. Seism. Soc. Am.).
Jonathan Berger Research Geophysicist Email: [email protected] Phone: 42889
Research Interests: Global seismological observations, geophysical instrumentation, deep ocean observing platforms, global communications systems.
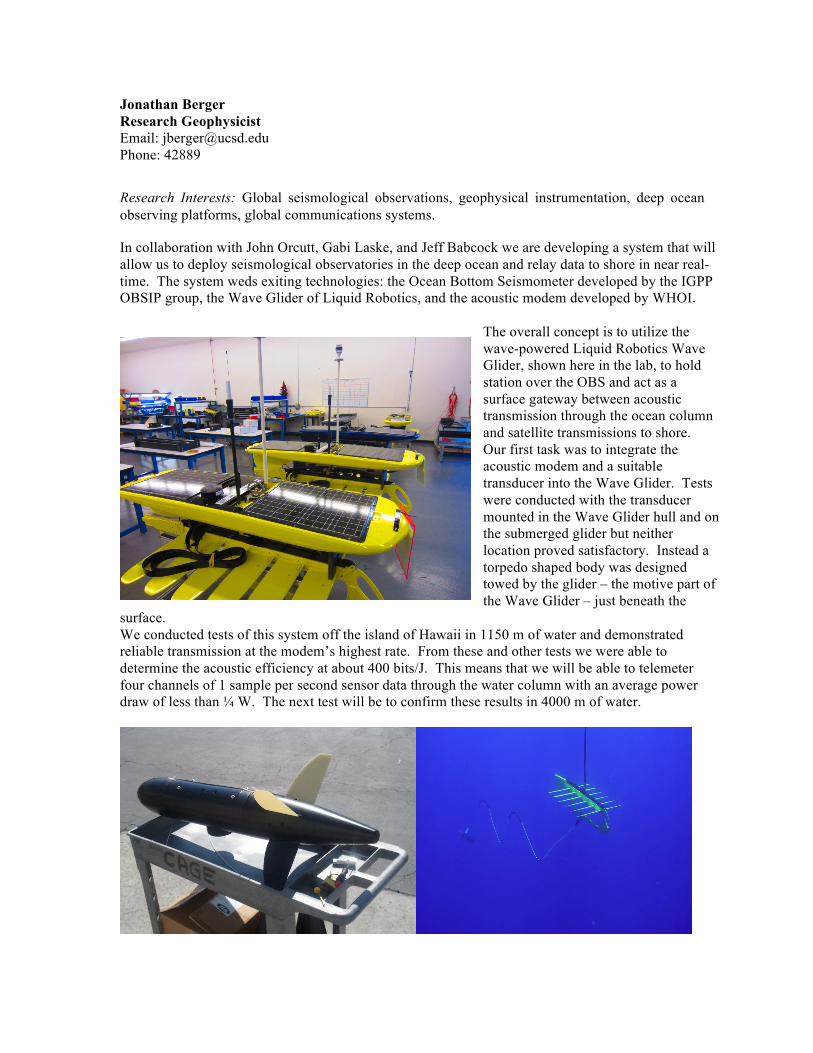
In collaboration with John Orcutt, Gabi Laske, and Jeff Babcock we are developing a system that will allow us to deploy seismological observatories in the deep ocean and relay data to shore in near real-time. The system weds exiting technologies: the Ocean Bottom Seismometer developed by the IGPP OBSIP group, the Wave Glider of Liquid Robotics, and the acoustic modem developed by WHOI.
The overall concept is to utilize the wave-powered Liquid Robotics Wave Glider, shown here in the lab, to hold station over the OBS and act as a surface gateway between acoustic transmission through the ocean column and satellite transmissions to shore. Our first task was to integrate the acoustic modem and a suitable transducer into the Wave Glider. Tests were conducted with the transducer mounted in the Wave Glider hull and on the submerged glider but neither location proved satisfactory. Instead a torpedo shaped body was designed towed by the glider – the motive part of the Wave Glider – just beneath the
surface. We conducted tests of this system off the island of Hawaii in 1150 m of water and demonstrated reliable transmission at the modem’s highest rate. From these and other tests we were able to determine the acoustic efficiency at about 400 bits/J. This means that we will be able to telemeter four channels of 1 sample per second sensor data through the water column with an average power draw of less than ¼ W. The next test will be to confirm these results in 4000 m of water.
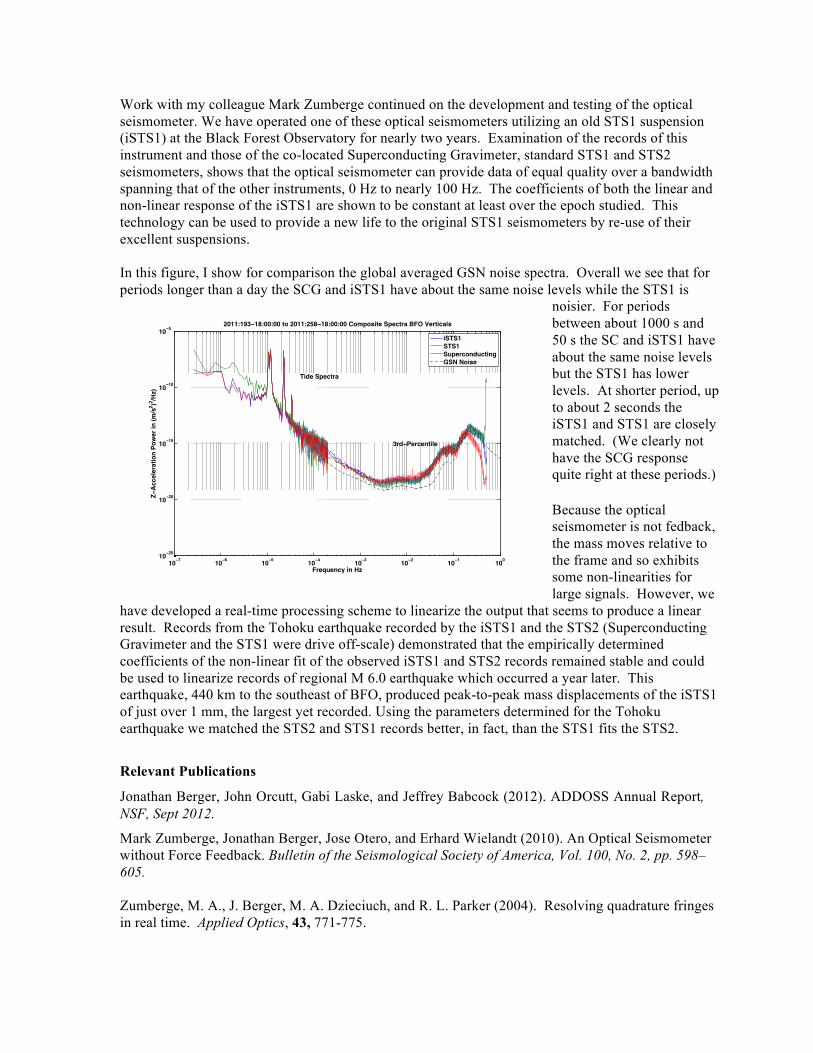
Work with my colleague Mark Zumberge continued on the development and testing of the optical seismometer. We have operated one of these optical seismometers utilizing an old STS1 suspension (iSTS1) at the Black Forest Observatory for nearly two years. Examination of the records of this instrument and those of the co-located Superconducting Gravimeter, standard STS1 and STS2 seismometers, shows that the optical seismometer can provide data of equal quality over a bandwidth spanning that of the other instruments, 0 Hz to nearly 100 Hz. The coefficients of both the linear and non-linear response of the iSTS1 are shown to be constant at least over the epoch studied. This technology can be used to provide a new life to the original STS1 seismometers by re-use of their excellent suspensions. In this figure, I show for comparison the global averaged GSN noise spectra. Overall we see that for periods longer than a day the SCG and iSTS1 have about the same noise levels while the STS1 is
noisier. For periods between about 1000 s and 50 s the SC and iSTS1 have about the same noise levels but the STS1 has lower levels. At shorter period, up to about 2 seconds the iSTS1 and STS1 are closely matched. (We clearly not have the SCG response quite right at these periods.) Because the optical seismometer is not fedback, the mass moves relative to the frame and so exhibits some non-linearities for large signals. However, we
have developed a real-time processing scheme to linearize the output that seems to produce a linear result. Records from the Tohoku earthquake recorded by the iSTS1 and the STS2 (Superconducting Gravimeter and the STS1 were drive off-scale) demonstrated that the empirically determined coefficients of the non-linear fit of the observed iSTS1 and STS2 records remained stable and could be used to linearize records of regional M 6.0 earthquake which occurred a year later. This earthquake, 440 km to the southeast of BFO, produced peak-to-peak mass displacements of the iSTS1 of just over 1 mm, the largest yet recorded. Using the parameters determined for the Tohoku earthquake we matched the STS2 and STS1 records better, in fact, than the STS1 fits the STS2.
Relevant Publications
Jonathan Berger, John Orcutt, Gabi Laske, and Jeffrey Babcock (2012). ADDOSS Annual Report, NSF, Sept 2012.
Mark Zumberge, Jonathan Berger, Jose Otero, and Erhard Wielandt (2010). An Optical Seismometer without Force Feedback. Bulletin of the Seismological Society of America, Vol. 100, No. 2, pp. 598–605. Zumberge, M. A., J. Berger, M. A. Dzieciuch, and R. L. Parker (2004). Resolving quadrature fringes in real time. Applied Optics, 43, 771-775.
Donna Blackman
Research Geophysicist
Email address: [email protected]
Phone extension: 48813
Research Interests: tectonic and magmatic processes that occur along plate boundaries, with emphasis on oceanic spreading centers; deformation of minerals and the development of seismic anisotropy during upper mantle flow.
Geophysical investigations of oceanic spreading center processes remain a main focus of my research. In 2011/2012 I made progress on three projects, each addressing a different aspect. First, Gabi Laske and I began work with colleagues at Cornell University and CNRS Paris to look at how flow-induced mineral alignment might affect the rheology and associated seismic anisotropy of the mantle. Second, Alistair Harding and I obtained several ‘ground truth’ measurements by logging in a deep borehole in the domal core of Atlantis Massif. We worked with postdoc Adrien Arnulf to integrate these constraints with regional waveform inversion efforts. Third, a return to the Chile Triple Junction allowed completion of a set of nested studies targeted at hydrothermal venting in this unique margin-spreading center setting.
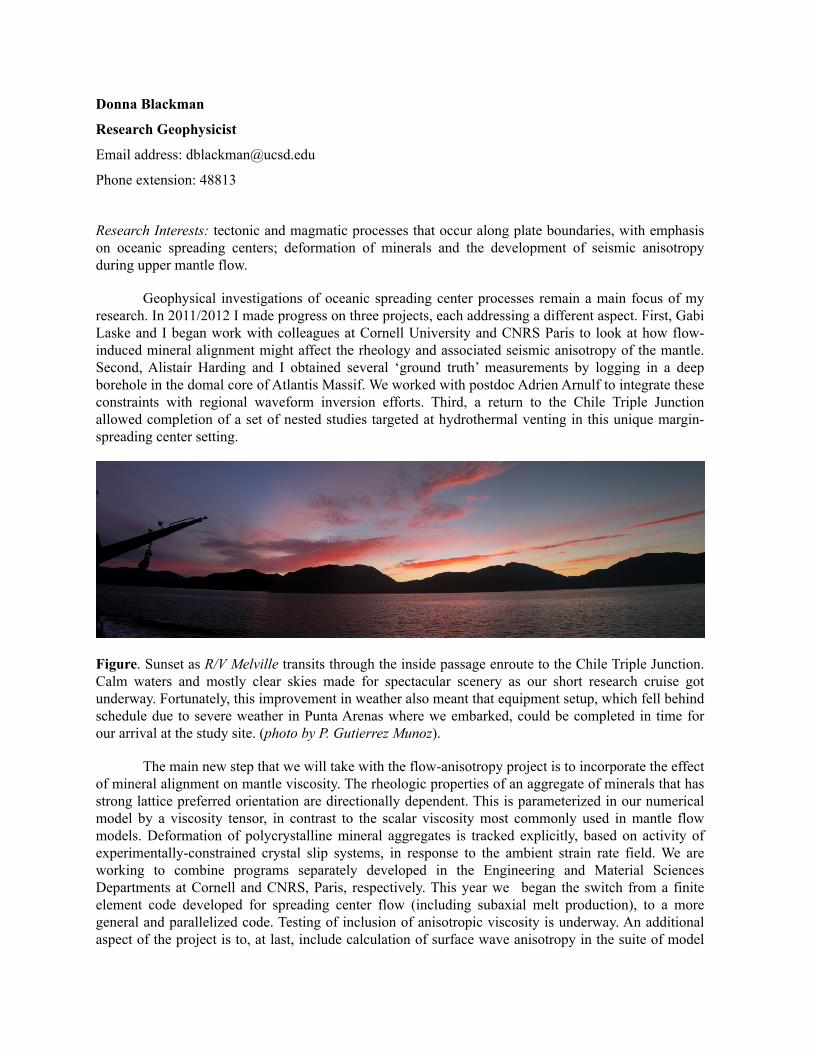
Figure. Sunset as R/V Melville transits through the inside passage enroute to the Chile Triple Junction. Calm waters and mostly clear skies made for spectacular scenery as our short research cruise got underway. Fortunately, this improvement in weather also meant that equipment setup, which fell behind schedule due to severe weather in Punta Arenas where we embarked, could be completed in time for our arrival at the study site. (photo by P. Gutierrez Munoz).
The main new step that we will take with the flow-anisotropy project is to incorporate the effect of mineral alignment on mantle viscosity. The rheologic properties of an aggregate of minerals that has strong lattice preferred orientation are directionally dependent. This is parameterized in our numerical model by a viscosity tensor, in contrast to the scalar viscosity most commonly used in mantle flow models. Deformation of polycrystalline mineral aggregates is tracked explicitly, based on activity of experimentally-constrained crystal slip systems, in response to the ambient strain rate field. We are working to combine programs separately developed in the Engineering and Material Sciences Departments at Cornell and CNRS, Paris, respectively. This year we began the switch from a finite element code developed for spreading center flow (including subaxial melt production), to a more general and parallelized code. Testing of inclusion of anisotropic viscosity is underway. An additional aspect of the project is to, at last, include calculation of surface wave anisotropy in the suite of model
predictions. This is where Gabi comes in- she is starting with elastic constants determined for seismically anisotropic mantle beneath aging oceanic crust that were determined for a case with constant (scalar) viscosity. Before we delve into more complicated cases, we want to understand the influence of averaging bin size (vertical & horizontal) on calculated surface wave anisotropy.
The new borehole logging at the Atlantis Massif, an oceanic core complex formed by detachment faulting as young gabbroic lithosphere was unroofed on the western axial flank of the Mid-Atlantic Ridge, was accomplished during an intensive few days at the site of prior deep drilling by the Integrated Ocean Drilling Program. During this IODP Expedition 340T, seismic, resistivity, and temperature logs were obtained throughout the geologic section. Alistair and I are working with the other two shipboard scientists to analyze the the full dataset within the framework of the prior geologic results from the drill core and regional mapping. Narrow fault zones and olivine-rich troctolite intervals correlate with several important physical boundaries in the borehole, likely tracing past and, in some cases present, subseafloor seawater circulation paths. Adrien has picked up where grad student Ashlee Henig left off, using her tomographic results, and the tie point provided by the 340T logging data as his starting point for waveform inversions on the grid of multi-channel seismic lines that cover the massif. Sharpening of the seismic velocity anomalies with this method really increases the sense of actual geologic structure that underlies the classic core complex morphology at this site.
Intensive as the few days on site at Atlantis Massif were, it was just a ‘warm up’ for a similarly short experiment at the Chile Triple Junction. A confluence of autonomous vehicle Sentry availability and an ideal transit route for R/V Melville around the tip of Chile provided an unusual, last minute opportunity to complete water column plume and seafloor video mapping that might reveal the location of hydrothermal venting. Water chemistry data obtained in 2010 indicated that at least a component of spreading axis venting was occurring, perhaps mixed with slope methane seepage. Several of the SIO grad students that designed the 2010 cruise were able to join us. Rachel Marcuson had a chance to sail for her first time and Ashlee helped by training a group of Chilean students for watchstanding. Using a combination of Sentry, a towed video system ‘TowCam’, a sediment corer, and CTD transects, we confirmed the plume anomaly and improved our understanding of its distribution. However, we also found that local currents strongly influence the measured signal. Systematic sidescan and video mapping now provide complete coverage of an axis-bounding scarp that may control subsurface fluid circulation, but we did not turn up a ‘smoking gun’ that could pinpoint a vent source. Fortunately, the new data still contain worthwhile information on the small scale structure at the triple junction, so I plan to take a closer look at that in the coming year.
At the end of June 2012, I began a rotation at the National Science Foundation, serving as Program Direction for Marine Geology & Geophysics. This is an interesting opportunity to understand the ‘other side’ of the NSF funding system, and to get to know some new parts of the OCE/GEO community. My research continues, but at a reduced pace during this rotation.
Blackman, D.K., B. Appelgate, C.R. German, A.R. Thurber, A.S. Henig, Axial morphology along the southern Chile Rise, Marine Geology, doi:10.1016/j.margeo.2012.06.001.
Expedition 340T Scientists, 2012. Atlantis Massif Oceanic Core Complex: velocity, porosity, and impedance contrasts within the domal core of Atlantis Massif: faults and hydration of lithosphere during core complex evolution. IODP Prel. Rept., 340T. doi:10.2204/iodp.pr.340T.2012.
Henig, A.S., D.K. Blackman, A.J. Harding, J-P. Canales, G.M. Kent, Downward continued multi-channel seismic refraction analysis of Atlantis Massif oceanic core complex, 30°N Mid-Atlantic Ridge, Geochemistry, Geophysics, Geosystems 13, Q0AG07, doi:10.1029/2012GC004059, 2012.
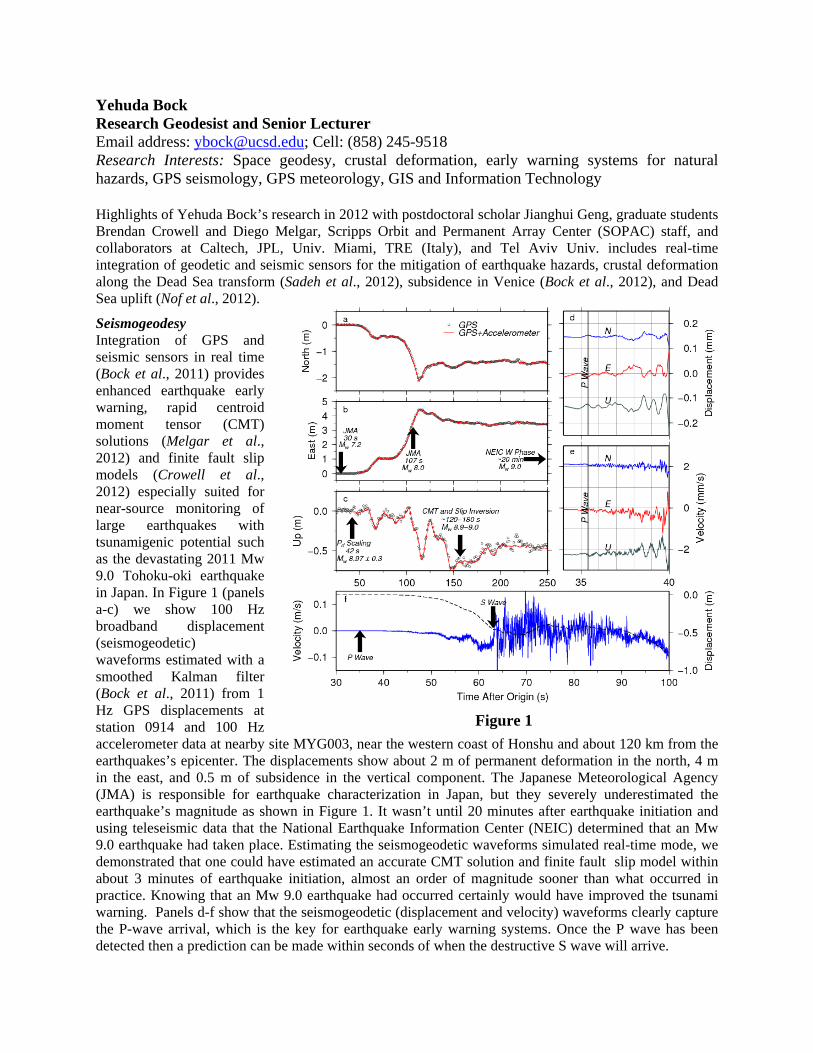
Figure 1
Yehuda Bock Research Geodesist and Senior Lecturer Email address: [email protected]; Cell: (858) 245-9518 Research Interests: Space geodesy, crustal deformation, early warning systems for natural hazards, GPS seismology, GPS meteorology, GIS and Information Technology Highlights of Yehuda Bock’s research in 2012 with postdoctoral scholar Jianghui Geng, graduate students Brendan Crowell and Diego Melgar, Scripps Orbit and Permanent Array Center (SOPAC) staff, and collaborators at Caltech, JPL, Univ. Miami, TRE (Italy), and Tel Aviv Univ. includes real-time integration of geodetic and seismic sensors for the mitigation of earthquake hazards, crustal deformation along the Dead Sea transform (Sadeh et al., 2012), subsidence in Venice (Bock et al., 2012), and Dead Sea uplift (Nof et al., 2012).
Seismogeodesy Integration of GPS and seismic sensors in real time (Bock et al., 2011) provides enhanced earthquake early warning, rapid centroid moment tensor (CMT) solutions (Melgar et al., 2012) and finite fault slip models (Crowell et al., 2012) especially suited for near-source monitoring of large earthquakes with tsunamigenic potential such as the devastating 2011 Mw 9.0 Tohoku-oki earthquake in Japan. In Figure 1 (panels a-c) we show 100 Hz broadband displacement (seismogeodetic) waveforms estimated with a smoothed Kalman filter (Bock et al., 2011) from 1 Hz GPS displacements at station 0914 and 100 Hz accelerometer data at nearby site MYG003, near the western coast of Honshu and about 120 km from the earthquakes’s epicenter. The displacements show about 2 m of permanent deformation in the north, 4 m in the east, and 0.5 m of subsidence in the vertical component. The Japanese Meteorological Agency (JMA) is responsible for earthquake characterization in Japan, but they severely underestimated the earthquake’s magnitude as shown in Figure 1. It wasn’t until 20 minutes after earthquake initiation and using teleseismic data that the National Earthquake Information Center (NEIC) determined that an Mw 9.0 earthquake had taken place. Estimating the seismogeodetic waveforms simulated real-time mode, we demonstrated that one could have estimated an accurate CMT solution and finite fault slip model within about 3 minutes of earthquake initiation, almost an order of magnitude sooner than what occurred in practice. Knowing that an Mw 9.0 earthquake had occurred certainly would have improved the tsunami warning. Panels d-f show that the seismogeodetic (displacement and velocity) waveforms clearly capture the P-wave arrival, which is the key for earthquake early warning systems. Once the P wave has been detected then a prediction can be made within seconds of when the destructive S wave will arrive.
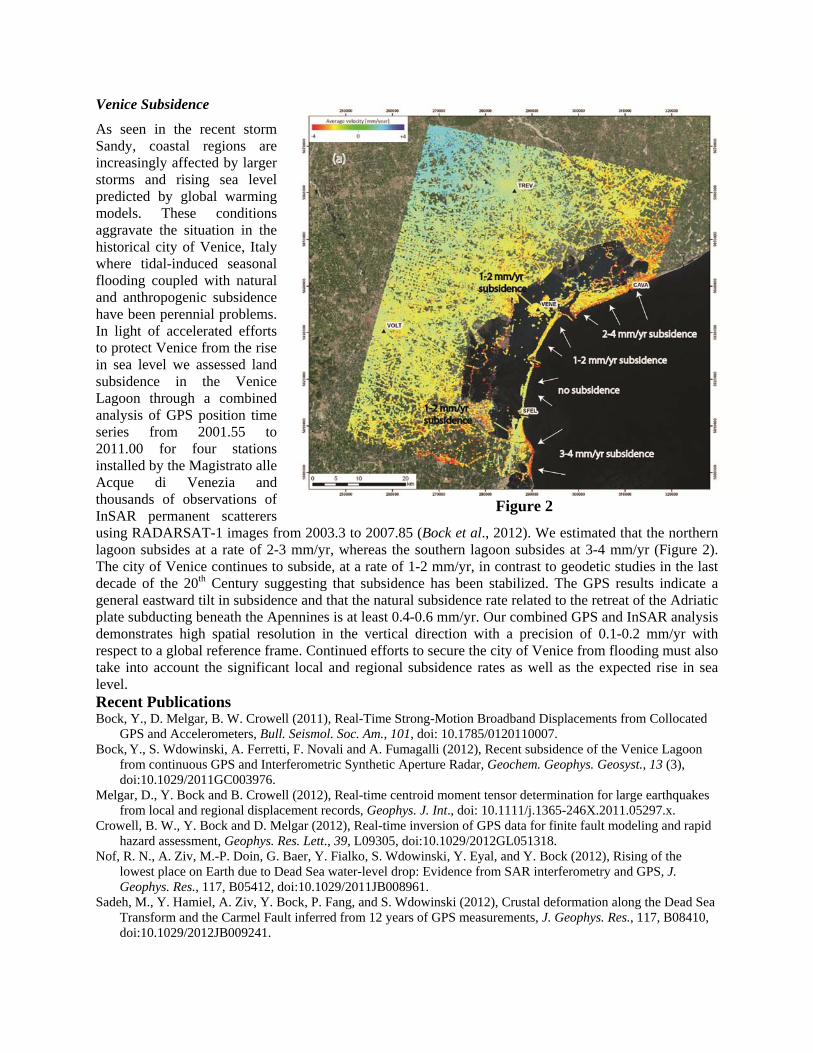
Figure 2
Venice Subsidence
As seen in the recent storm Sandy, coastal regions are increasingly affected by larger storms and rising sea level predicted by global warming models. These conditions aggravate the situation in the historical city of Venice, Italy where tidal-induced seasonal flooding coupled with natural and anthropogenic subsidence have been perennial problems. In light of accelerated efforts to protect Venice from the rise in sea level we assessed land subsidence in the Venice Lagoon through a combined analysis of GPS position time series from 2001.55 to 2011.00 for four stations installed by the Magistrato alle Acque di Venezia and thousands of observations of InSAR permanent scatterers using RADARSAT-1 images from 2003.3 to 2007.85 (Bock et al., 2012). We estimated that the northern lagoon subsides at a rate of 2-3 mm/yr, whereas the southern lagoon subsides at 3-4 mm/yr (Figure 2). The city of Venice continues to subside, at a rate of 1-2 mm/yr, in contrast to geodetic studies in the last decade of the 20th Century suggesting that subsidence has been stabilized. The GPS results indicate a general eastward tilt in subsidence and that the natural subsidence rate related to the retreat of the Adriatic plate subducting beneath the Apennines is at least 0.4-0.6 mm/yr. Our combined GPS and InSAR analysis demonstrates high spatial resolution in the vertical direction with a precision of 0.1-0.2 mm/yr with respect to a global reference frame. Continued efforts to secure the city of Venice from flooding must also take into account the significant local and regional subsidence rates as well as the expected rise in sea level. Recent Publications Bock, Y., D. Melgar, B. W. Crowell (2011), Real-Time Strong-Motion Broadband Displacements from Collocated
GPS and Accelerometers, Bull. Seismol. Soc. Am., 101, doi: 10.1785/0120110007. Bock, Y., S. Wdowinski, A. Ferretti, F. Novali and A. Fumagalli (2012), Recent subsidence of the Venice Lagoon
from continuous GPS and Interferometric Synthetic Aperture Radar, Geochem. Geophys. Geosyst., 13 (3), doi:10.1029/2011GC003976.
Melgar, D., Y. Bock and B. Crowell (2012), Real-time centroid moment tensor determination for large earthquakes from local and regional displacement records, Geophys. J. Int., doi: 10.1111/j.1365-246X.2011.05297.x.
Crowell, B. W., Y. Bock and D. Melgar (2012), Real-time inversion of GPS data for finite fault modeling and rapid hazard assessment, Geophys. Res. Lett., 39, L09305, doi:10.1029/2012GL051318.
Nof, R. N., A. Ziv, M.-P. Doin, G. Baer, Y. Fialko, S. Wdowinski, Y. Eyal, and Y. Bock (2012), Rising of the lowest place on Earth due to Dead Sea water-level drop: Evidence from SAR interferometry and GPS, J. Geophys. Res., 117, B05412, doi:10.1029/2011JB008961.
Sadeh, M., Y. Hamiel, A. Ziv, Y. Bock, P. Fang, and S. Wdowinski (2012), Crustal deformation along the Dead Sea Transform and the Carmel Fault inferred from 12 years of GPS measurements, J. Geophys. Res., 117, B08410, doi:10.1029/2012JB009241.
Adrian Borsa
Assistant Research Geophysicist
Email address: [email protected]
Phone extension: 4-6845
Research Interests: Airborne and space-based lidar imaging and system calibration/validation. Differential lidar techniques applied to problems in geomorphology and tectonic geodesy. Kinematic GPS for positioning, mapping, and recording transient deformation due to earthquakes, fault creep and short-period crustal loading. GPS multipath and other noise sources. Dry lake geomorphology.
My recent research in the area of tectonic geodesy has been directed toward the development of efficient algorithms to perform differential lidar analysis of pre- and post-earthquake airborne lidar datasets, with specific application to the 2009 M7.2 El Mayor-Cucapah rupture zone. In the case of the El Mayor event, airborne lidar differencing provided a map of surface deformation in the near-field of the rupture, which complemented the information provided by field mapping of visible surface rupture and the far-field deformation provided by InSAR and other imaging techniques.
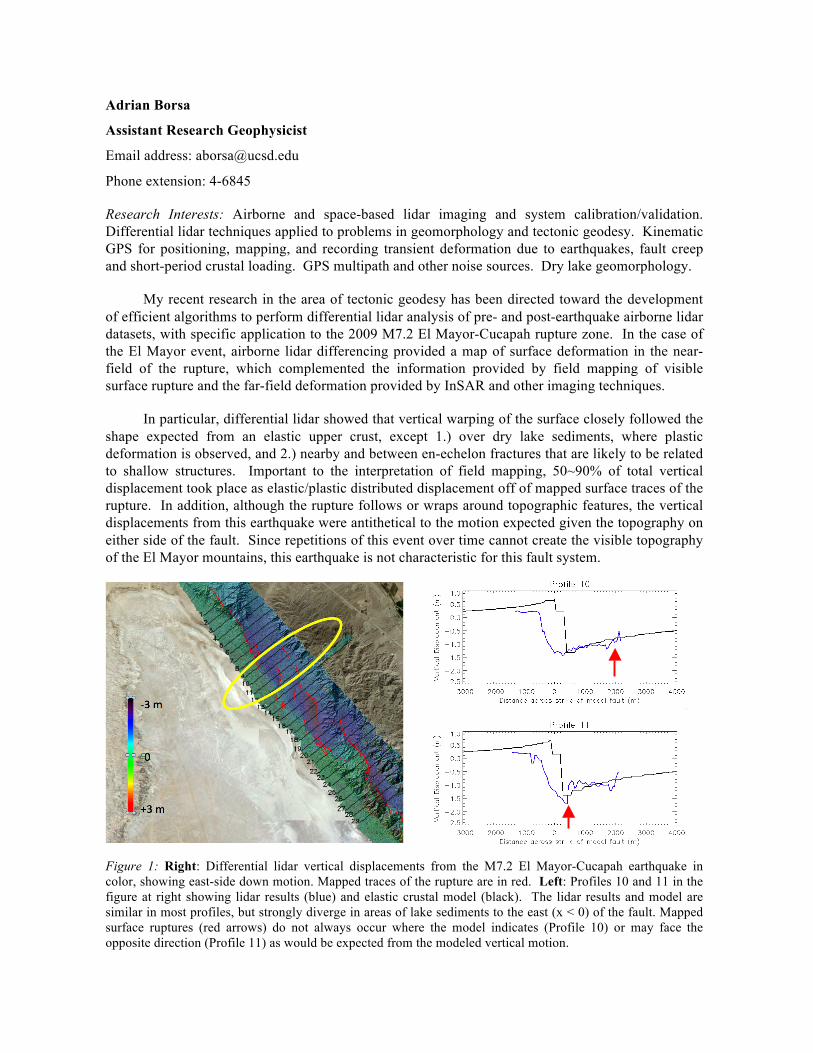
In particular, differential lidar showed that vertical warping of the surface closely followed the shape expected from an elastic upper crust, except 1.) over dry lake sediments, where plastic deformation is observed, and 2.) nearby and between en-echelon fractures that are likely to be related to shallow structures. Important to the interpretation of field mapping, 50~90% of total vertical displacement took place as elastic/plastic distributed displacement off of mapped surface traces of the rupture. In addition, although the rupture follows or wraps around topographic features, the vertical displacements from this earthquake were antithetical to the motion expected given the topography on either side of the fault. Since repetitions of this event over time cannot create the visible topography of the El Mayor mountains, this earthquake is not characteristic for this fault system.
Figure 1: Right: Differential lidar vertical displacements from the M7.2 El Mayor-Cucapah earthquake in color, showing east-side down motion. Mapped traces of the rupture are in red. Left: Profiles 10 and 11 in the figure at right showing lidar results (blue) and elastic crustal model (black). The lidar results and model are similar in most profiles, but strongly diverge in areas of lake sediments to the east (x < 0) of the fault. Mapped surface ruptures (red arrows) do not always occur where the model indicates (Profile 10) or may face the opposite direction (Profile 11) as would be expected from the modeled vertical motion.
My other main area of current research has been the ongoing characterization of the salar de
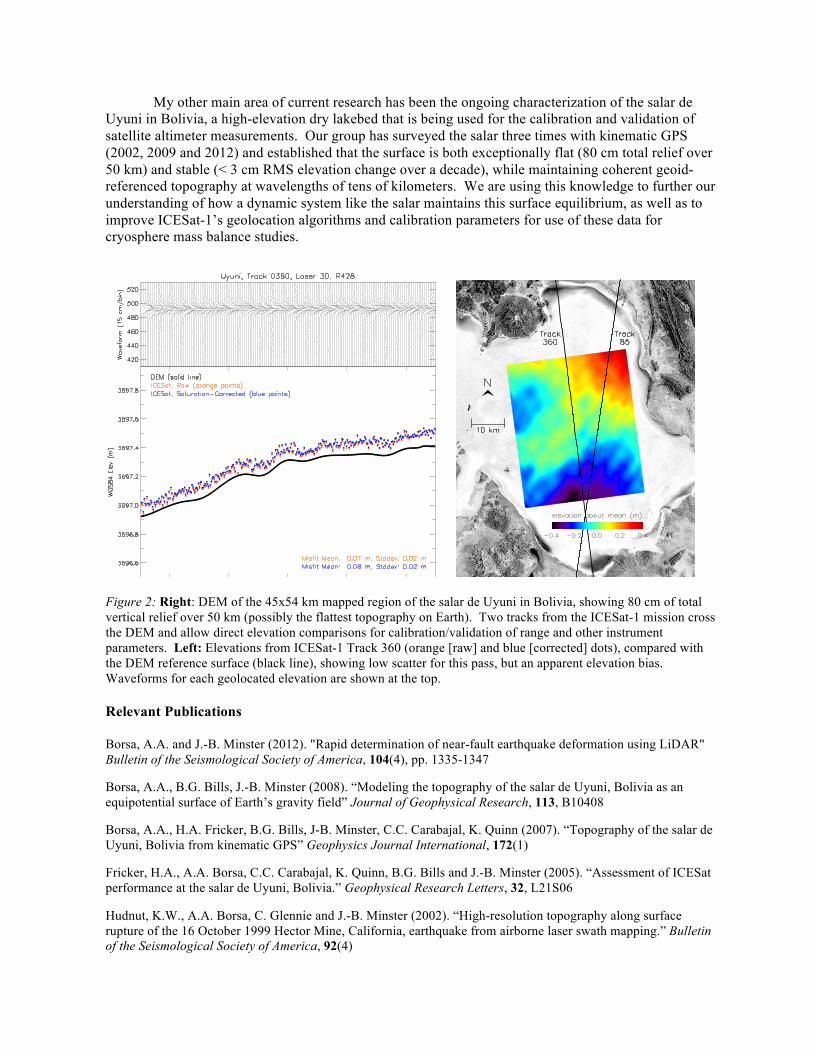
Uyuni in Bolivia, a high-elevation dry lakebed that is being used for the calibration and validation of satellite altimeter measurements. Our group has surveyed the salar three times with kinematic GPS (2002, 2009 and 2012) and established that the surface is both exceptionally flat (80 cm total relief over 50 km) and stable (< 3 cm RMS elevation change over a decade), while maintaining coherent geoid-referenced topography at wavelengths of tens of kilometers. We are using this knowledge to further our understanding of how a dynamic system like the salar maintains this surface equilibrium, as well as to improve ICESat-1’s geolocation algorithms and calibration parameters for use of these data for cryosphere mass balance studies.
Figure 2: Right: DEM of the 45x54 km mapped region of the salar de Uyuni in Bolivia, showing 80 cm of total vertical relief over 50 km (possibly the flattest topography on Earth). Two tracks from the ICESat-1 mission cross the DEM and allow direct elevation comparisons for calibration/validation of range and other instrument parameters. Left: Elevations from ICESat-1 Track 360 (orange [raw] and blue [corrected] dots), compared with the DEM reference surface (black line), showing low scatter for this pass, but an apparent elevation bias. Waveforms for each geolocated elevation are shown at the top. Relevant Publications Borsa, A.A. and J.-B. Minster (2012). "Rapid determination of near-fault earthquake deformation using LiDAR" Bulletin of the Seismological Society of America, 104(4), pp. 1335-1347 Borsa, A.A., B.G. Bills, J.-B. Minster (2008). “Modeling the topography of the salar de Uyuni, Bolivia as an equipotential surface of Earth’s gravity field” Journal of Geophysical Research, 113, B10408 Borsa, A.A., H.A. Fricker, B.G. Bills, J-B. Minster, C.C. Carabajal, K. Quinn (2007). “Topography of the salar de Uyuni, Bolivia from kinematic GPS” Geophysics Journal International, 172(1) Fricker, H.A., A.A. Borsa, C.C. Carabajal, K. Quinn, B.G. Bills and J.-B. Minster (2005). “Assessment of ICESat performance at the salar de Uyuni, Bolivia.” Geophysical Research Letters, 32, L21S06 Hudnut, K.W., A.A. Borsa, C. Glennie and J.-B. Minster (2002). “High-resolution topography along surface rupture of the 16 October 1999 Hector Mine, California, earthquake from airborne laser swath mapping.” Bulletin of the Seismological Society of America, 92(4)
Kevin M. Brown Professor of Geology (and Geophysics) Email address: [email protected] Phone extension: 24077 Current Research Interests: Structure and dynamics of fault zones, rock mechanics, and the physics of earth materials. Earthquake processes and dynamic weakening mechanisms at low and seismic slip speeds. Previous interests include ocean equipment development, fluid/fault interactions, and marine hydrogeology, and gas hydrate interactions.
My recent research has focused on the physics of earthquake nucleation and rupture propagation. In particular the micro dynamics of fault weakening and healing during the initial fault breakdown (nucleation) and runaway phases as well as the subsequent interseismic periods. The work involves both experimental rock mechanics and modeling aspects. We are currently focusing on the effects that temperature has on the physics of brittle rupture. Two recently published studies include:
1) ‘Melt welt’ mechanism of extreme weakening of gabbro at seismic slip rates K.M. Brown and Y. Fialko, Nature, 2012.
Several mechanisms have been proposed to explain the pre-melting weakening, including flash melting, lubrication by hydrous films coating the gouge particles, silica gel formation, nano-powder lubrication, thermal decomposition and degassing. Of the proposed mechanisms, only the first two could potentially explain extreme weakening in crystalline mafic rocks. To investigate the nature of extreme dynamic weakening before the onset of wholesale melting, we performed a series of medium- to high-speed friction experiments on diabase (fine-grained gabbro). The tests were conducted using a rotary shear. The laboratory studies have revealed a complex evolution of the dynamic shear strength, with at least two phases of weakening separated by strengthening at the onset of wholesale melting. The second post-melting weakening phase is governed by viscous properties of the melt layer and is reasonably well understood. The initial phase of extreme weakening, however, remains a subject of much debate. Here we show that the initial weakening of gabbro is associated with the formation of hotspots and macroscopic streaks of melt (‘melt welts’), which partially unload the rest of the slip interface. Melt welts begin to form when the average rate of frictional heating exceeds 0.1–0.4 MW m−2, while the average temperature of the shear zone is well below the solidus (250–450 °C). Similar heterogeneities in stress and temperature are likely to occur on natural fault surfaces during rapid slip, and to be important for earthquake rupture dynamics.
2) Temperature dependence of frictional healing of 1Westerly granite: experimental observations and numerical simulations, E. K. Mitchell, Y. Fialko, and K. M. Brown G3, GEOCHEMISTRY, GEOPHYSICS, GEOSYSTEMS, 2012.
We investigated frictional healing in a series of slide-hold-slide experiments on Westerly granite using a direct shear apparatus at ambient temperatures between 20-550 °C. Coefficient of friction increases in proportion to the logarithm of hold time at a rate of about 0.02 per decade, similar to findings of previous studies conducted at room
temperature. For a given hold time, the coefficient of friction also linearly increases with1 temperature at about 0.02 per 140°C. We found that temperature has little effect on the rate of change in static friction with hold time. We interpret these results using a numerical model that incorporates visco-elasto-plastic rheology and a fractal geometry of contact surfaces. Changes in contact area between the surfaces with respect to an initial contact area, are compared to changes in static friction coefficient, with respect to its initial value. We explored viscous rheologies including a power-law, an exponential law, a hyperbolic sine law and the Goetze law that have been proposed for steady state creep of rocks at high stresses and temperatures. None of these laws could fit our data given material properties reported in the bulk creep experiments. For the power-law rheology to provide a reasonable fit to the data, the stress exponent needs to be greater than 40. In this case, significant (up to 500 degrees) changes in contact temperature have little effect on the rate of increase in contact area, as observed in our experiments.
Classes Taught:
1) Structural Geology: SIO162: Structural Geology, K. M. Brown
2) Hydrogeology, SIO 106: D.R. Hilton and K.M. Brown
Other significant activities over the last two years:
1) Member of the EPA BP Gulf Oil Spill Strategy Review panel. Team leader for technology review section.
2) Congressional Visits Day delegate on behalf of AGU, 2010
Selected Relevant Publications: LaBonte, A.L. Brown, K.M. Fialko Y., Hydrologic detection and finite-element modeling of a slow-slip event in the Costa Rica prism toe, J Geophys. RESEARCH, VOL. 114, B00A02, doi:10.1029/2008JB005806, 2009.
• Brown K. M, Michael D. Tryon, Heather R. DeShon, LeRoy M. Dorman, and Susan Y. Schwartz, Correlated Transient Fluid Pulsing and Seismic Tremor in the Costa Rica Subduction Zone, Earth and planetary Science Letters, 589-603, 2005.
• Fitts, T. G. and K. M. Brown, 1999. Stress-induced smectitie dehydration:ramifications for patterns of freshening and fluid expulsion in the N. Barbados accretionary wedge. Earth and Planetary Sci. Letters 172: 179-197.
• Brown, K. M., D. M. Saffer and B. A. Bekins, 2001. Smectite diagenesis, pore water freshening, and fluid flow at the toe of the Nankai wedge.Earth and Planetary Sci. Ltrs. 194: 97-109
• Brown, K.M., Kopf, A., Underwood, M.B., Weinberger, J.L., Compositional and fluid pressure controls on the state of stress on the Nankai subduction thrust: A weak plate boundary, Earth and Planetary Science Letters, 214, 589-603, 2003.
• Brown, K.M. and Y. Fialko ; `Melt Welt'' Mechanism of Extreme Weakening of Gabbro at Seismic Slip Rates, accepted: Nature 2012.
• Mitchell, E. K. , Y. Fialko, K.M. Brown; Temperature dependance of Frictional healing: Experimental observations and numerical simulations, G -Cubed accept
Catherine ConstableProfessor of GeophysicsEmail: [email protected]: 858 534 3183
Research interests: Paleomagnetism and geomagnetism, applied to study of long and short termvariations of the geomagnetic field; linking paleomagnetic observations to numerical dynamosimulations; inverse problems; statistical techniques; electrical conductivity of the mantle; paleoand rock magnetic databases.
Continuing research interests over the past year have been (i) the behavior of the geomagneticfield behavior on millennial timescales during the Holocene time period (in collaboration withMonika Korte of GeoForschungs Zentrum, Helmholtz Center, Potsdam, and most recently withpostdoc Sanja Panovska who has joined us from ETH, Zurich); (ii) the magnetic field on millionyear time scales (Catherine Johnson, University of British Columbia, Lisa Tauxe); (iii) developmentof modeling and data processing tools for global electromagnetic induction studies using magneticfield observations from low-Earth-orbiting satellites (PhD student, Lindsay Smith-Boughner); (iv)the development with Anthony Koppers (Oregon State University) and Lisa Tauxe of flexible digitaldata archives for magnetic observations of various kinds under the MagIC (Magnetics InformationConsortium) database project. (v) work with postdoctoral researcher Christopher Davies (now atLeeds University, U.K.) and research associate David Gubbins on the compatibility of numericalgeodynamo simulations with paleomagnetic results. PhD student Margaret Avery also recentlystarted on work related to this project.
(c) VGPsd about geographic pole from CALS10k.1b
2468101214161820
(c) 1990AD-1590AD VGPsd about geographic pole from GUFM
(a) B sd for CALS10k.1b
0200040006000800010000120001400016000
(a) B sd for GUFM1
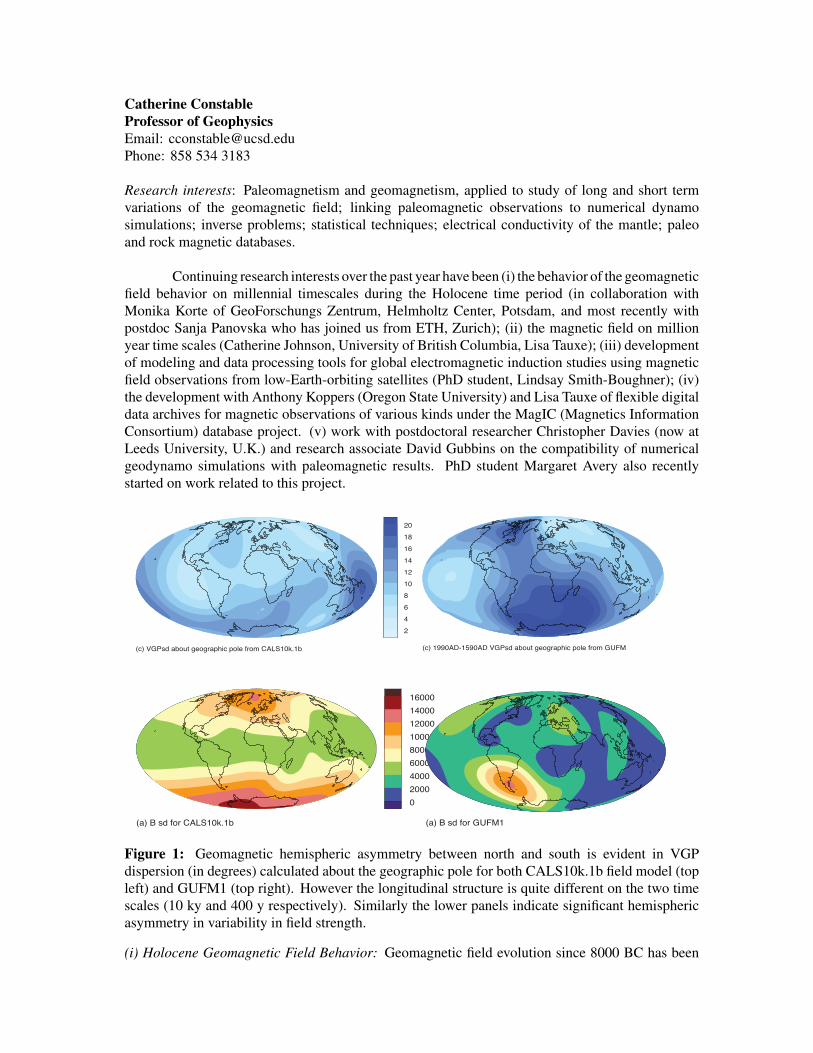
Figure 1: Geomagnetic hemispheric asymmetry between north and south is evident in VGPdispersion (in degrees) calculated about the geographic pole for both CALS10k.1b field model (topleft) and GUFM1 (top right). However the longitudinal structure is quite different on the two timescales (10 ky and 400 y respectively). Similarly the lower panels indicate significant hemisphericasymmetry in variability in field strength.
(i) Holocene Geomagnetic Field Behavior: Geomagnetic field evolution since 8000 BC has been
reconstructed in the CALS10k.1b time varying field model and is mainly based on information aboutmagnetic field strength and directions obtained from sediment records, but including archeologicalartifacts and lavas wherever possible. The model was initially tailored for study of the evolutionof magnetic field at the core-mantle boundary, but also provides a low-resolution description oflarge-scale geomagnetic field change at and above Earth’s surface. We have used CALS10k.1b tostudy geographic variability in secular variation, and compare our results with the 400 year recordprovided by the GUFM1 model for 1590-1990 AD. Results are presented in Figure 1which showsthe geographic variation in standard deviation in VGPs (Virtual Geomagnetic Pole Positions) aboutthe geographic pole (top), and also in the local field strength (bottom panels).
Both GUFM1 and CALS10k.1b clearly exhibit greater average variability in the southernhemisphere than in the north. However, the longitudinal variability is quite different over the longer10ky interval. For our earlier work on the Holocene field we posed several questions, including,How long has the S. Atlantic magnetic anomaly existed? How has it evolved with time? and Isthe magnetic field and its secular variation persistently lower in the Pacific than in the Atlantichemisphere? In GUFM1 activity is significantly focussed in the S. Atlantic region and absent fromthe Pacific. The pictures from CALS10k.1b verify that this is a temporary phenomenon.
In CALS10k.1b the southern hemisphere is more active than the north, and there is signifi-cantly enhanced directional variability in the western equatorial Pacific and the Southern Ocean. Itis worth noting that VGP dispersion is large overall in GUFM1 than in CALS10k.1b because it ismeasured relative to the geographic pole. The local field strength in Figure 1 is measured relative tothe mean for each time interval, and the longer time span shows greater variations overall becauseof significant changes in field strength that cannot be captured by the VGPs’ purely directionalrecord. Further studies of the persistence of these asymmetrical structures are under way, includingcomparisons with numerical dynamo simulations that can help in an assessment of their long termsignficance.
Relevant Publications
Korte, M., C.G. Constable, F. Donadini, & R. Holme, Reconstructing the Holocene GeomagneticField, Earth Planet. Sci. Lett., 312, 497-505, doi:10.1016/j.epsl.2011.10.031, 2011.
Ribaudo, J, C.G. Constable, & R.L. Parker, Scripted finite element tools for electromagneticinduction studies, Geophysical Journal International, 188, 435—446, doi: 10.1111/j.1365-246X.2011.05255.x, 2012.
Smith-Boughner, L.T., & C.G. Constable, Spectral estimation for geophysical time series withinconvenient gaps, Geophysical Journal International, 190, 1404–1422, doi: 10.1111/j.1365-246X.2012.05594.x, 2012.
Steven ConstableProfessorEmail: [email protected]: 4-2409
Research interests: Marine EM methods, electrical conductivity of rocks.
Steven Constable directs the SIO Marine EM Laboratory at IGPP, and along with Kerry Key overseesthe Seafloor Electromagnetic Methods Consortium, an industry funding umbrella which helps support the 5PhD students, a postdoc, and a research associate working in the group. The two main field techniques weuse are controlled-source EM (CSEM), in which a deep-towed EM transmitter broadcasts energy to seafloorEM recorders, and magnetotelluric (MT) sounding, in which these same receivers record natural variations inEarth’s magnetic field.
Last year Kerry Key and I presented CSEM results from the SERPENT experiment, a study of thegeology of the Nicaraguan subduction zone using marine EM techniques. This year we started to get someexciting models from the MT data, showing evidence of melting at the lithosphere-asthenosphere boundarythat seems to be sheared and aligned with plate motion. See Kerry’s annual report submission for more onthis.
HiP TOC15-04 Assembly (2” ID, 3” OD, 4” IL)
Kemlon K-15Electrical Feedthrough
Sample
Silver FoilElectrodes
D-Limonene Temperature Bath
CustomManifold
To LCR meter
to Methane Supply
AF-4 Port
HF-4 Port
28 gaugeTeflon Wire
Teflon Sleeve
Teflon Spacers
-5.0
-4.5
-4.0
-3.5
-3.0
-2.5
3.4 3.5 3.6 3.7 3.8 3.9 4.0 103/T (K -1)
0°C -10°C -20°C 10°C 0°C -10°C -20°C 10°C
Log(
σ (S
/m))
50:50
10:90
90:10
70:30
50:50
100:0
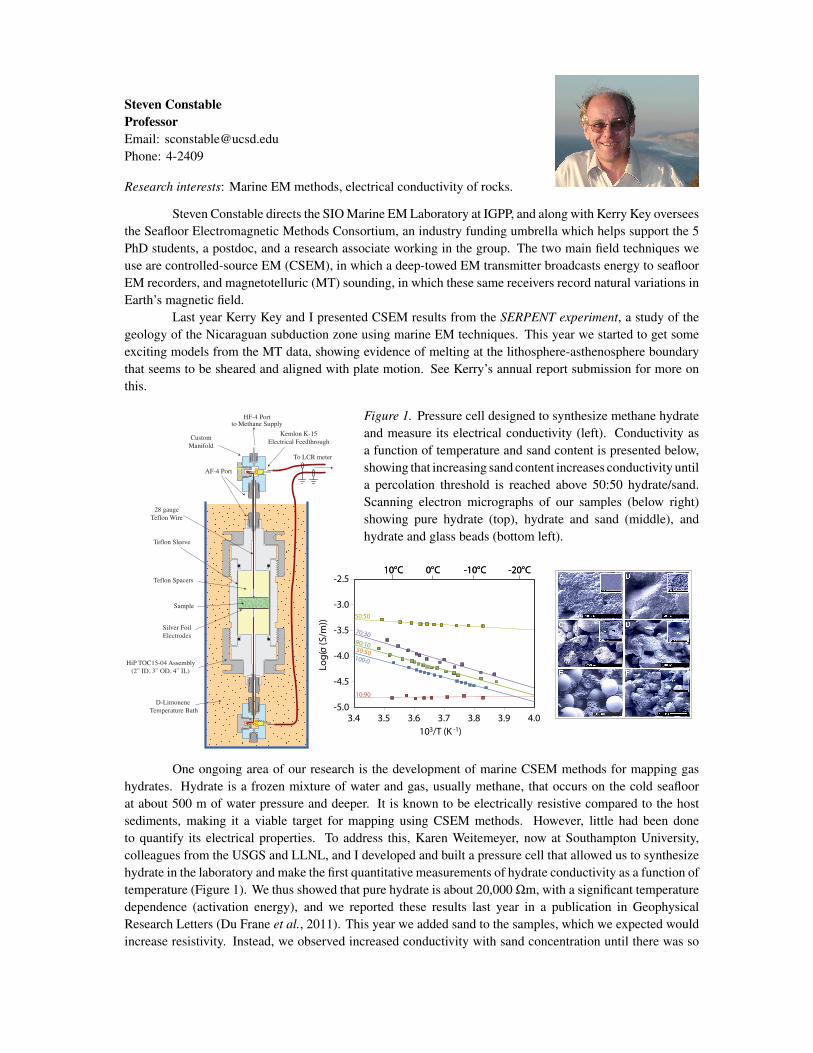
Figure 1. Pressure cell designed to synthesize methane hydrateand measure its electrical conductivity (left). Conductivity asa function of temperature and sand content is presented below,showing that increasing sand content increases conductivity untila percolation threshold is reached above 50:50 hydrate/sand.Scanning electron micrographs of our samples (below right)showing pure hydrate (top), hydrate and sand (middle), andhydrate and glass beads (bottom left).
One ongoing area of our research is the development of marine CSEM methods for mapping gashydrates. Hydrate is a frozen mixture of water and gas, usually methane, that occurs on the cold seafloorat about 500 m of water pressure and deeper. It is known to be electrically resistive compared to the hostsediments, making it a viable target for mapping using CSEM methods. However, little had been doneto quantify its electrical properties. To address this, Karen Weitemeyer, now at Southampton University,colleagues from the USGS and LLNL, and I developed and built a pressure cell that allowed us to synthesizehydrate in the laboratory and make the first quantitative measurements of hydrate conductivity as a function oftemperature (Figure 1). We thus showed that pure hydrate is about 20,000 Ωm, with a significant temperaturedependence (activation energy), and we reported these results last year in a publication in GeophysicalResearch Letters (Du Frane et al., 2011). This year we added sand to the samples, which we expected wouldincrease resistivity. Instead, we observed increased conductivity with sand concentration until there was so
much sand that continuity of the hydrate phase was broken (called a percolation threshold). This may havebeen because the surface of the hydrate grains is more conductive than the grain interiors, but when sandwas replaced by glass beads the effect was greatly reduced. This suggests that contaminants from the sandare reducing the bulk hydrate conductivity. These results show that simple geometrical mixing laws, whichwould have predicted that the highly resistive sand would have decreased the sample conductivity, cannotalways be trusted.
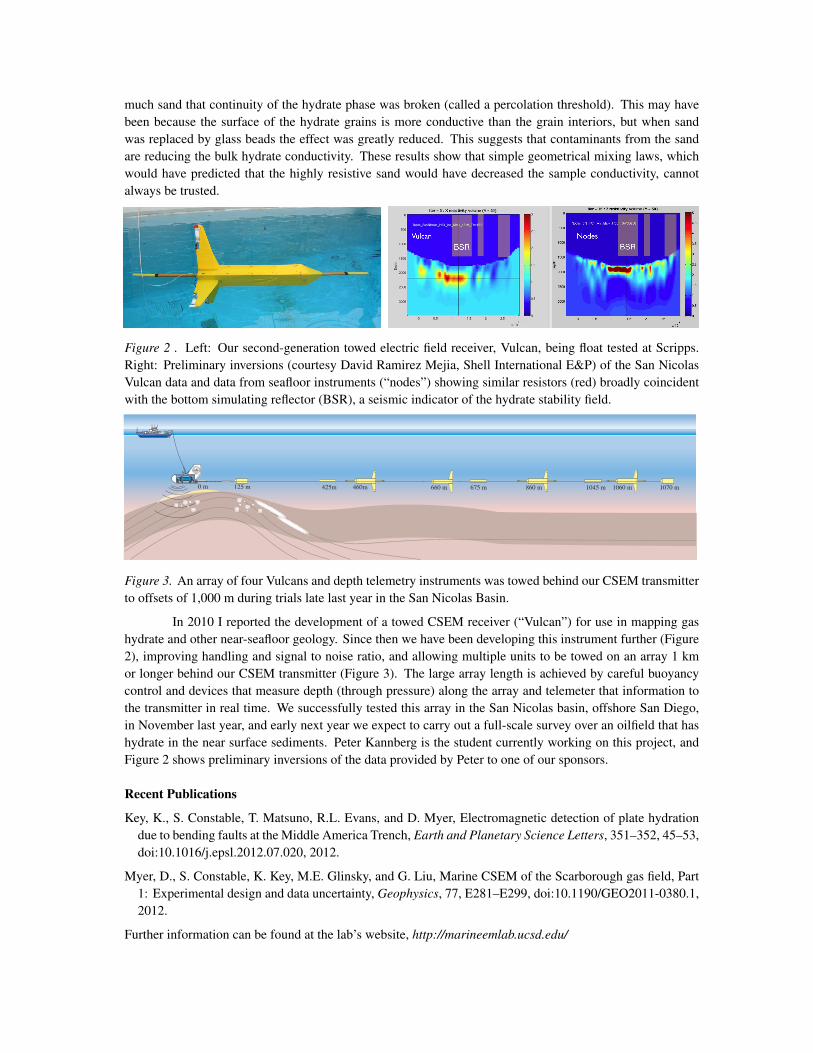
Figure 2 . Left: Our second-generation towed electric field receiver, Vulcan, being float tested at Scripps.Right: Preliminary inversions (courtesy David Ramirez Mejia, Shell International E&P) of the San NicolasVulcan data and data from seafloor instruments (“nodes”) showing similar resistors (red) broadly coincidentwith the bottom simulating reflector (BSR), a seismic indicator of the hydrate stability field.
CRI P
PS I N
ST
ITUTION OF OCE ANOGRA
PHY
UCSD
0 m 460m425m 675 m125 m 660 m 860 m 1045 m 1060 m 1070 m
Figure 3. An array of four Vulcans and depth telemetry instruments was towed behind our CSEM transmitterto offsets of 1,000 m during trials late last year in the San Nicolas Basin.
In 2010 I reported the development of a towed CSEM receiver (“Vulcan”) for use in mapping gashydrate and other near-seafloor geology. Since then we have been developing this instrument further (Figure2), improving handling and signal to noise ratio, and allowing multiple units to be towed on an array 1 kmor longer behind our CSEM transmitter (Figure 3). The large array length is achieved by careful buoyancycontrol and devices that measure depth (through pressure) along the array and telemeter that information tothe transmitter in real time. We successfully tested this array in the San Nicolas basin, offshore San Diego,in November last year, and early next year we expect to carry out a full-scale survey over an oilfield that hashydrate in the near surface sediments. Peter Kannberg is the student currently working on this project, andFigure 2 shows preliminary inversions of the data provided by Peter to one of our sponsors.
Recent Publications
Key, K., S. Constable, T. Matsuno, R.L. Evans, and D. Myer, Electromagnetic detection of plate hydrationdue to bending faults at the Middle America Trench, Earth and Planetary Science Letters, 351–352, 45–53,doi:10.1016/j.epsl.2012.07.020, 2012.
Myer, D., S. Constable, K. Key, M.E. Glinsky, and G. Liu, Marine CSEM of the Scarborough gas field, Part1: Experimental design and data uncertainty, Geophysics, 77, E281–E299, doi:10.1190/GEO2011-0380.1,2012.
Further information can be found at the lab’s website, http://marineemlab.ucsd.edu/
J. Peter Davis
Specialist
Email: [email protected]
Phone: 4-2839
Research Interests: seismology, time series analysis, geophysical data acquisition
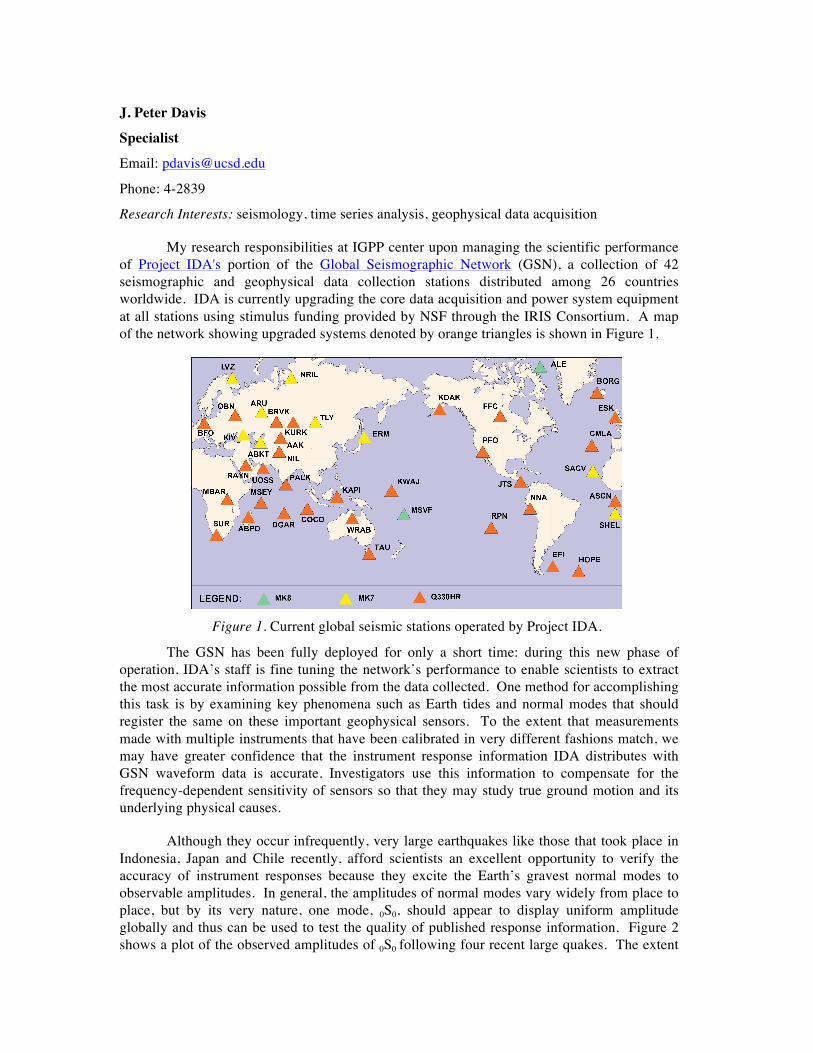
My research responsibilities at IGPP center upon managing the scientific performance of Project IDA's portion of the Global Seismographic Network (GSN), a collection of 42 seismographic and geophysical data collection stations distributed among 26 countries worldwide. IDA is currently upgrading the core data acquisition and power system equipment at all stations using stimulus funding provided by NSF through the IRIS Consortium. A map of the network showing upgraded systems denoted by orange triangles is shown in Figure 1.
Figure 1. Current global seismic stations operated by Project IDA.
The GSN has been fully deployed for only a short time: during this new phase of operation, IDA’s staff is fine tuning the network’s performance to enable scientists to extract the most accurate information possible from the data collected. One method for accomplishing this task is by examining key phenomena such as Earth tides and normal modes that should register the same on these important geophysical sensors. To the extent that measurements made with multiple instruments that have been calibrated in very different fashions match, we may have greater confidence that the instrument response information IDA distributes with GSN waveform data is accurate. Investigators use this information to compensate for the frequency-dependent sensitivity of sensors so that they may study true ground motion and its underlying physical causes.
Although they occur infrequently, very large earthquakes like those that took place in Indonesia, Japan and Chile recently, afford scientists an excellent opportunity to verify the accuracy of instrument responses because they excite the Earth’s gravest normal modes to observable amplitudes. In general, the amplitudes of normal modes vary widely from place to place, but by its very nature, one mode, 0S0, should appear to display uniform amplitude globally and thus can be used to test the quality of published response information. Figure 2 shows a plot of the observed amplitudes of 0S0 following four recent large quakes. The extent
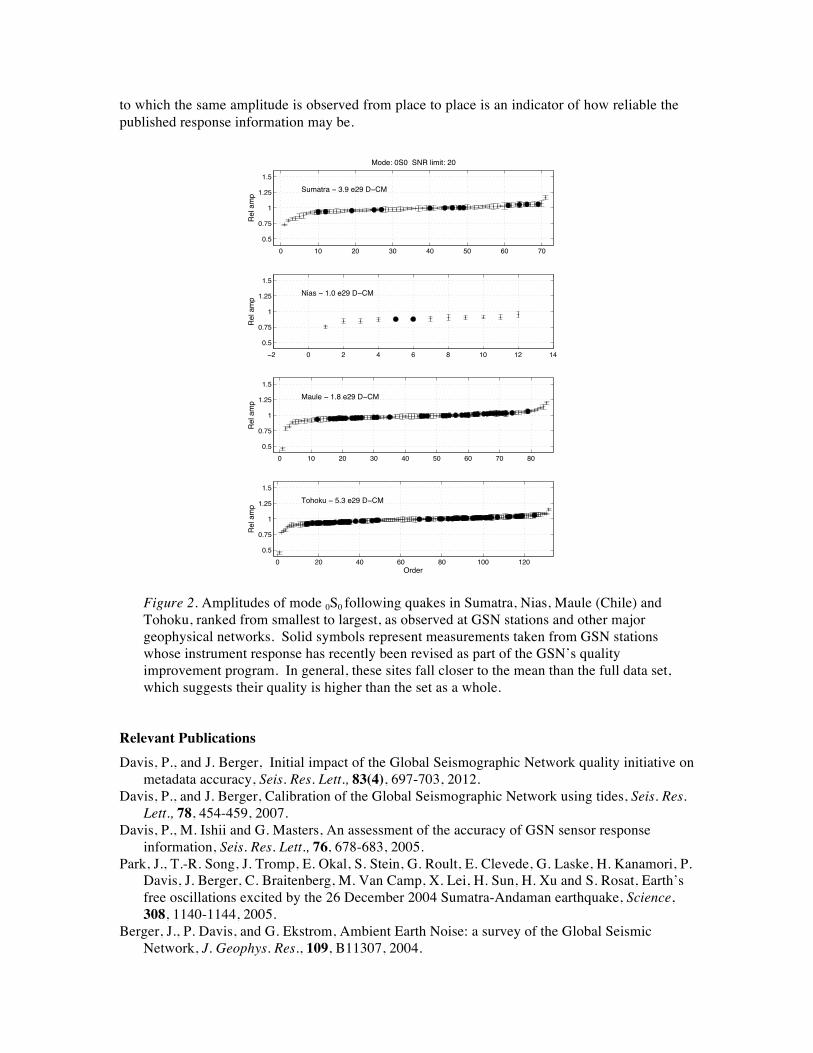
to which the same amplitude is observed from place to place is an indicator of how reliable the published response information may be.
Figure 2. Amplitudes of mode 0S0 following quakes in Sumatra, Nias, Maule (Chile) and Tohoku, ranked from smallest to largest, as observed at GSN stations and other major geophysical networks. Solid symbols represent measurements taken from GSN stations whose instrument response has recently been revised as part of the GSN’s quality improvement program. In general, these sites fall closer to the mean than the full data set, which suggests their quality is higher than the set as a whole.
Relevant Publications Davis, P., and J. Berger, Initial impact of the Global Seismographic Network quality initiative on
metadata accuracy, Seis. Res. Lett., 83(4), 697-703, 2012. Davis, P., and J. Berger, Calibration of the Global Seismographic Network using tides, Seis. Res.
Lett., 78, 454-459, 2007. Davis, P., M. Ishii and G. Masters, An assessment of the accuracy of GSN sensor response
information, Seis. Res. Lett., 76, 678-683, 2005. Park, J., T.-R. Song, J. Tromp, E. Okal, S. Stein, G. Roult, E. Clevede, G. Laske, H. Kanamori, P.
Davis, J. Berger, C. Braitenberg, M. Van Camp, X. Lei, H. Sun, H. Xu and S. Rosat, Earth’s free oscillations excited by the 26 December 2004 Sumatra-Andaman earthquake, Science, 308, 1140-1144, 2005.
Berger, J., P. Davis, and G. Ekstrom, Ambient Earth Noise: a survey of the Global Seismic Network, J. Geophys. Res., 109, B11307, 2004.
0 10 20 30 40 50 60 700.5
0.75
1
1.25
1.5
Rel
am
p
Sumatra − 3.9 e29 D−CM
Mode: 0S0 SNR limit: 20
−2 0 2 4 6 8 10 12 140.5
0.75
1
1.25
1.5
Rel
am
p
Nias − 1.0 e29 D−CM
0 10 20 30 40 50 60 70 800.5
0.75
1
1.25
1.5
Rel
am
p
Maule − 1.8 e29 D−CM
0 20 40 60 80 100 1200.5
0.75
1
1.25
1.5
Rel
am
p
Tohoku − 5.3 e29 D−CM
Order
Catherine de Groot-Hedlin Research Scientist Email address: [email protected] Phone extension: X42313 Research Interests: Acoustic propagation modeling; nuclear test-ban verification; analysis of infrasound and gravity waves at dense seismic networks.
Catherine de Groot-Hedlin’s research makes use of seismic and infrasound data to study large-scale atmospheric phenomena. This involves the development of new analytic approaches to detect gravity wave signals at dense regional seismic and infrasound networks, and also involves the development of nonlinear numerical modeling techniques to understand the propagation of high amplitude pressure signals through the upper atmosphere.
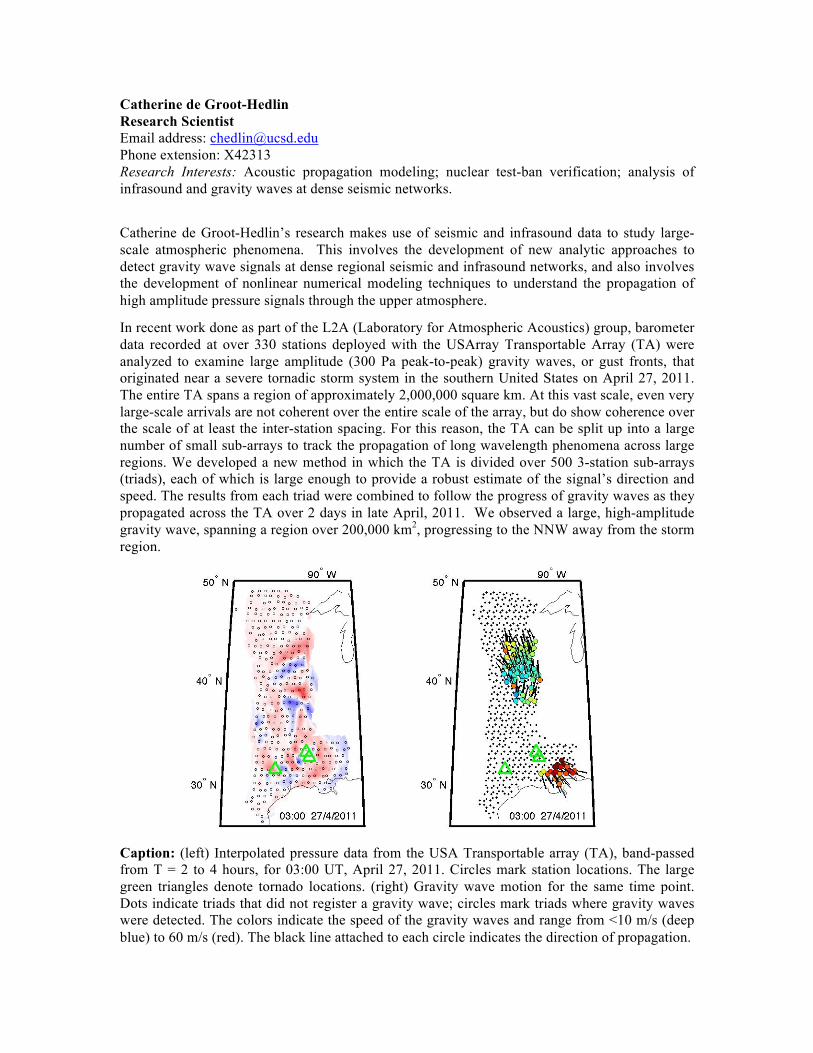
In recent work done as part of the L2A (Laboratory for Atmospheric Acoustics) group, barometer data recorded at over 330 stations deployed with the USArray Transportable Array (TA) were analyzed to examine large amplitude (300 Pa peak-to-peak) gravity waves, or gust fronts, that originated near a severe tornadic storm system in the southern United States on April 27, 2011. The entire TA spans a region of approximately 2,000,000 square km. At this vast scale, even very large-scale arrivals are not coherent over the entire scale of the array, but do show coherence over the scale of at least the inter-station spacing. For this reason, the TA can be split up into a large number of small sub-arrays to track the propagation of long wavelength phenomena across large regions. We developed a new method in which the TA is divided over 500 3-station sub-arrays (triads), each of which is large enough to provide a robust estimate of the signal’s direction and speed. The results from each triad were combined to follow the progress of gravity waves as they propagated across the TA over 2 days in late April, 2011. We observed a large, high-amplitude gravity wave, spanning a region over 200,000 km2, progressing to the NNW away from the storm region.
Caption: (left) Interpolated pressure data from the USA Transportable array (TA), band-passed from T = 2 to 4 hours, for 03:00 UT, April 27, 2011. Circles mark station locations. The large green triangles denote tornado locations. (right) Gravity wave motion for the same time point. Dots indicate triads that did not register a gravity wave; circles mark triads where gravity waves were detected. The colors indicate the speed of the gravity waves and range from <10 m/s (deep blue) to 60 m/s (red). The black line attached to each circle indicates the direction of propagation.
Another research topic has involved the development of an accurate and efficient method to predict the nonlinear propagation of infrasound from large explosions in the atmosphere. This method is needed in order to predict infrasound propagation for diverse source types, including bolides, volcanic eruptions, and nuclear and chemical explosions. The solution also allows for the computation of other disturbances generated by explosions, including gravity waves (de Groot-Hedlin, 2012).
Relevant Publications de Groot-Hedlin, C.D., Hedlin, M.A.H. and Walker, K.T., 2012, Detection of gravity waves
across the USArray: A case study, Earth and Planetary Sciences Letters, in review. Hedlin, M.A.H., de Groot-Hedlin, C.D. and Drob, D., A study of infrasound propagation using
dense seismic network recordings of surface explosions, Bull. Seismol. Soc. Am., v102, pp 1927-1937, doi: 10.1785/0120110300.
de Groot-Hedlin, C., 2012, Nonlinear synthesis of infrasound propagation through an inhomegeneous, absorbing atmosphere”, J. Acoust. Soc. Am., v132, p646-656.
Hedlin, M.A.H., K. Walker, D. P. Drob and C. de Groot-Hedlin, Infrasound: Connecting the Solid Earth, Oceans and Atmosphere, Annual Review of Earth and Planetary Sciences, 40, 327-354, 10.1146/annurev-earth-042711-105508.
Walker, K.T., Shelby, R., Hedlin, M., de Groot-Hedlin, C., and Vernon, F., 2011, Illuminating infrasonic hotspots in the western U.S. with the USArray, J. Geophys. Res., 116, B12305, doi:10.1029/2011JB008579.
de Groot-Hedlin, C., M. Hedlin, K. Walker, 2010, “Finite difference synthesis of infrasound propagation through a windy, viscous atmosphere: Application to a bolide explosion detected by seismic networks”, Geophys. J. Int., doi: 10.1111/j.1365-246X.2010. 04925.x
Walker, K, M. Hedlin, C de Groot-Hedlin, J. Vergoz, A. Le Pichon, D. Drob, 2010, The Source location of the 19 February 2008 Oregon Bolide using Seismic Networks and Infrasound Arrays, J. Geophys. Res., 115, B12329, doi:10.1029/2010JB007863
Hedlin, M.A.H., D. Drob, K. Walker, C. de Groot-Hedlin, 2010, “A study of acoustic propagation from a large bolide in the atmosphere with a dense seismic network”, Journal of Geophysical Research (Solid Earth), 115, B11312, doi:10.1029/2010JB007669
Matoza, R.S., M.A. Garces, B.A. Chouet, L., D’Auria, M.A.H. Hedlin, C. de Groot-Hedlin, and G.P. Waite, 2009, “The source of infrasound associated with long-period events at Mount St. Helens”, accepted by Journal of Geophysical Research (Solid Earth), 114, B04305, doi:10.1029/2008JB006128.
de Groot-Hedlin, C.D., D.K. Blackman, and C.S. Jenkins, 2009, “Effects of variability associated with the Antarctic Circumpolar Current on sound propagation in the ocean”, Geop. J. Int., 176, 478-490 (2009)
de Groot-Hedlin, C.D., M.A.H. Hedlin, K.T. Walker, D. D. Drob, and M.A. Zumberge, Evaluation of infrasound signals from the shuttle Atlantis using a large seismic network, J. Acoust. Soc. Am., 124, 1442-1451, (2008a)
de Groot-Hedlin, C.D., Finite-difference synthesis of infrasound propagation through an absorbing atmosphere, J. Acoust. Soc. Am., 124, 1430-1441, (2008b)
Matthew DzieciuchProject ScientistEmail: [email protected]: 4-7986
Research interests: acoustical oceanography, ocean acoustic tomography, signal process-ing
Scattered arrivals
Ocean acoustic tomography uses underwater sound to deduce properties of the oceanon a basin-scale. The round-trip travel time depends on the temperature of the interveningwater and the difference of one-way travel-times depends on the current. Thus the basicmeasurement of the travel-time of a transmitted signal is critical to infer a meaningfulinterpretation of the data.
Although a known signal is transmitted, it quickly becomes random as it propa-gates through the ocean. The randomness occurs in a very specific way that decreases thecoherence time and coherent bandwidth as range and signal frequency increase.
A receiver can ignore the random properties of the signal and proceed as if the signalwere known except for the travel-time. This case is known as a matched filter and has beenthe standard operating procedure for ocean acoustic tomography. This leads to multiple,unstable peaks for each arrival. Choosing the correct peak can become problematic.
Or a receiver can account for the randomness in an optimal way. This type ofreceiver is known as an estimator-correlator, (EC). The EC operates by factoring the signalcovariance matrix into its ranked eigenvectors and then building a matched filter for each.The multiple matched filter outputs are then incoherently combined. The EC output hasless resolution but lower variance ( or increased SNR) compared to the standard matchedfilter.
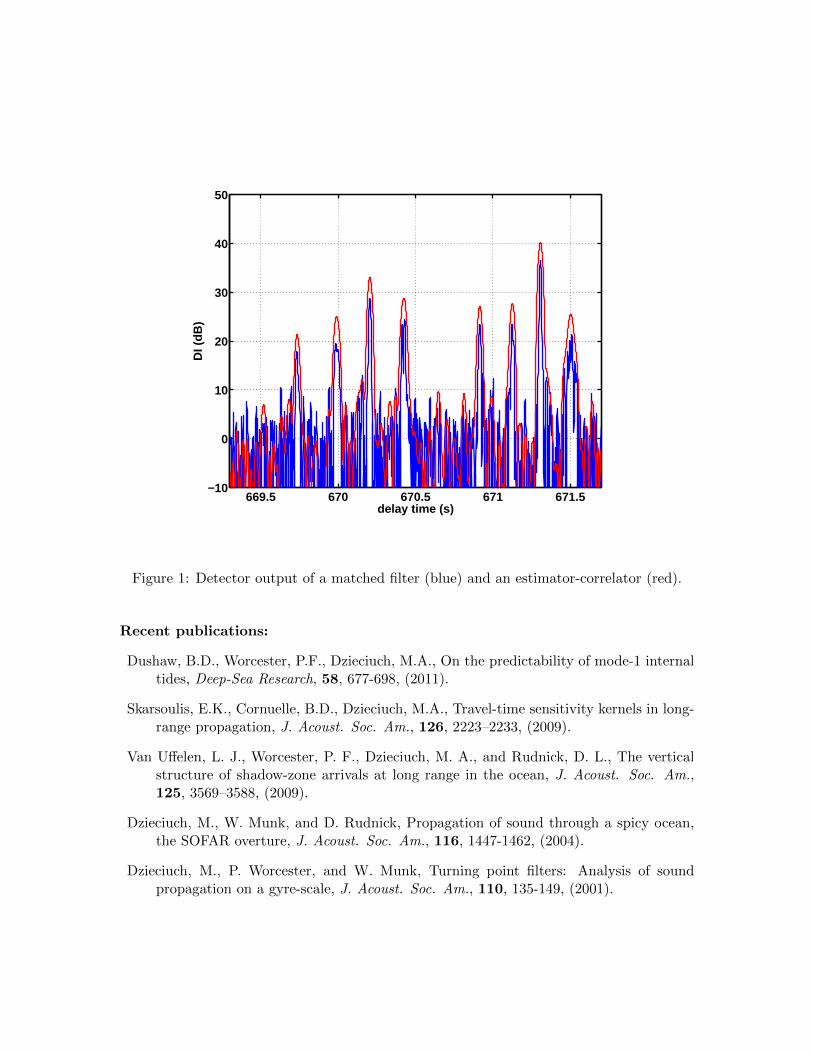
An example is shown in Fig. 1. The data is an actual signal from an ocean acousticexperiment known as SPICEX. The blue curve shows the detector output of a 250 Hz, Q=3,135s long signal at 1000 km range. The red curve is the EC output after assuming that thesignal has a time coherence of 30 seconds and a coherent bandwidth of 15 Hz. There is animprovement of 3.63 dB in the detection index. Note that the EC output is broader as wellhas higher. This is the decrease in resolution that accompanies the increase in SNR. Thisis a good thing because the receiver is not over resolving the acoustic channel and is onlyproducing one peak per expected ray arrival.
Another nice feature of the EC is that it can be tuned to give the maximum output,searching for the best SNR over a variety of assumed signal coherences. The maximumSNR occurs when the assumed signal covariance matches the actual covariance. As thesignal coherence changes, the number of important eigenvectors in the signal covariancematrix changes. In a typical application, only the eigenvectors accounting for 90% of thevariance are used in the EC. As the signal covariance matrix changes from being completelyknown with one important eigenvector, to completely random with a full complement ofeigenvectors, the EC changes in a natural and smooth way from a matched filter to anenergy detector.
669.5 670 670.5 671 671.5−10
0
10
20
30
40
50
delay time (s)
DI (
dB)
Figure 1: Detector output of a matched filter (blue) and an estimator-correlator (red).
Recent publications:
Dushaw, B.D., Worcester, P.F., Dzieciuch, M.A., On the predictability of mode-1 internaltides, Deep-Sea Research, 58, 677-698, (2011).
Skarsoulis, E.K., Cornuelle, B.D., Dzieciuch, M.A., Travel-time sensitivity kernels in long-range propagation, J. Acoust. Soc. Am., 126, 2223–2233, (2009).
Van Uffelen, L. J., Worcester, P. F., Dzieciuch, M. A., and Rudnick, D. L., The verticalstructure of shadow-zone arrivals at long range in the ocean, J. Acoust. Soc. Am.,125, 3569–3588, (2009).
Dzieciuch, M., W. Munk, and D. Rudnick, Propagation of sound through a spicy ocean,the SOFAR overture, J. Acoust. Soc. Am., 116, 1447-1462, (2004).
Dzieciuch, M., P. Worcester, and W. Munk, Turning point filters: Analysis of soundpropagation on a gyre-scale, J. Acoust. Soc. Am., 110, 135-149, (2001).
Yuri Fialko
Professor
Email: [email protected]: 2-5028
Research interests: earthquake physics, crustal deformation, space geodesy, volcanology
Yuri Fialko’s research is focused on understanding the mechanics of seismogenicfaults and magma migration in the Earth’s crust, through application of principles of con-tinuum and fracture mechanics to earthquakes and volcanic phenomena. Prof. Fialko isusing observations from space-borne radar satellites, including the ERS and ENVISATsatellites of the European Space Agency, and the ALOS satellite of the Japanese SpaceAgency, as well as the Global Positioning System, to investigate the response of the Earth’scrust to seismic and magmatic loading.
A particular area of Prof. Fialko interests is development and operation of maturestrike-slip faults such as the San Andreas Fault in California. In a recent study, Prof. Fialkoand graduate student Chris Takeuchi developed numerical models of earthquake cycles ona strike-slip fault that incorporate laboratory-derived power-law rheologies with Arrheniustemperature dependence, viscous dissipation, conductive heat transfer, and far-field loadingdue to relative plate motion. These models were used to explore the evolution of stress,strain, and thermal regime on “geologic” time scales (∼ 106 − 107 years), as well as on timescales of the order of the earthquake recurrence (∼ 102 years). Strain localization in theviscoelastic medium results from thermomechanical coupling and power law dependence ofstrain rate on stress. For conditions corresponding to the San Andreas Fault, the predictedwidth of the shear zone in the lower crust is ∼3-5 km; this shear zone accommodatesmore than 50% of the far-field plate motion. Coupled thermomechanical models predict asingle-layer lithosphere in case of “dry” composition of the lower crust and upper mantle,and a “jelly sandwich” lithosphere in case of “wet” composition. Deviatoric stress in thelithosphere in these models is relatively insensitive to the water content, the far-field loadingrate, and the fault strength, and is of the order of 102 MPa. Thermomechanical couplinggives rise to an inverse correlation between the fault slip rate and the ductile strength ofthe lithosphere. The model predictions are broadly consistent with geodetic and heat flowconstrains from the San Andreas Fault in northern California. Models suggest that theregionally elevated heat flow around the San Andreas Fault may be at least in part due toviscous dissipation in the ductile part of the lithosphere.
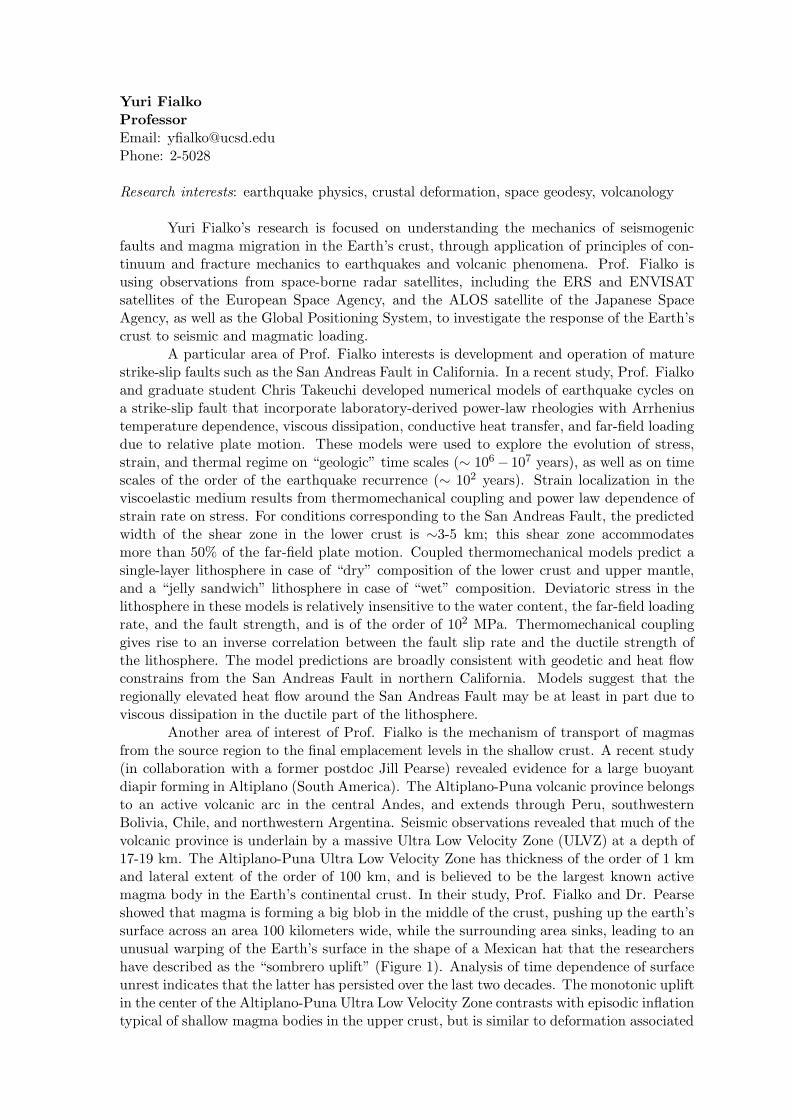
Another area of interest of Prof. Fialko is the mechanism of transport of magmasfrom the source region to the final emplacement levels in the shallow crust. A recent study(in collaboration with a former postdoc Jill Pearse) revealed evidence for a large buoyantdiapir forming in Altiplano (South America). The Altiplano-Puna volcanic province belongsto an active volcanic arc in the central Andes, and extends through Peru, southwesternBolivia, Chile, and northwestern Argentina. Seismic observations revealed that much of thevolcanic province is underlain by a massive Ultra Low Velocity Zone (ULVZ) at a depth of17-19 km. The Altiplano-Puna Ultra Low Velocity Zone has thickness of the order of 1 kmand lateral extent of the order of 100 km, and is believed to be the largest known activemagma body in the Earth’s continental crust. In their study, Prof. Fialko and Dr. Pearseshowed that magma is forming a big blob in the middle of the crust, pushing up the earth’ssurface across an area 100 kilometers wide, while the surrounding area sinks, leading to anunusual warping of the Earth’s surface in the shape of a Mexican hat that the researchershave described as the “sombrero uplift” (Figure 1). Analysis of time dependence of surfaceunrest indicates that the latter has persisted over the last two decades. The monotonic upliftin the center of the Altiplano-Puna Ultra Low Velocity Zone contrasts with episodic inflationtypical of shallow magma bodies in the upper crust, but is similar to deformation associated
−68˚30' −68˚00' −67˚30' −67˚00' −66˚30'−24˚00'
−23˚30'
−23˚00'
−22˚30'
−22˚00'
−21˚30'
−21˚00'
T282
T010
mm/yr
Argentina
Bolivia
APULVZ
−20246
Figure 1: Mosaic of LOS velocities obtained from stacking of ERS-1/2 and EnviSAT data fromthe descending tracks 282 and 10. Motion toward the satellite is taken to be positive. The LOSvelocity is constrained to have a zero mean value in the far field, away from the imaged deformationanomaly. Note a ring of subsidence surrounding the central uplift. Red line denotes the extent ofthe seismically imaged ultra-low velocity zone in the middle crust.
with another large mid-crustal magma body in the Rio Grande Rift (New Mexico), thesecond largest magma body in the Earth’s continental crust. Surface velocities shown inFigure 1 are the first evidence of active magmatic diapirism occurring at the present time.Similar space geodetic surveys in other neovolcanic areas can provide critical constraints onthe occurrence, timescales and dynamics of large-scale crustal magmatism.
Recent publications:
Fialko, Y. and J. Pearse (2012), Sombrero uplift above the Altiplano-Puna Magma Body:Evidence of a ballooning mid-crustal diapir, Science, 338, 250-252.
Brown, K. and Y. Fialko (2012), “Melt welt” mechanism of extreme weakening of gabbroat seismic slip rates, Nature, 488, 638-641.
Takeuchi, C. and Y. Fialko (2012), Dynamic models of interseismic deformation and stresstransfer from plate motion to continental transform faults, J. Geophys. Res., 117,B05403.
Nof, R., A. Ziv, M.-P. Doin, G. Baer, Y. Fialko, S. Wdowinski, Y. Eyal, and Y. Bock (2012),Rising of the lowest place on Earth due to Dead Sea water-level drop: Evidence fromSAR interferometry and GPS, J. Geophys. Res., 117, B05412.
Helen Amanda Fricker, Associate Professor
Email address: [email protected] Phone extension: 46145
Research Interests: cryosphere, Antarctic ice sheet, subglacial lakes, ice shelves, remote sensing
My research focuses on the Earth's cryosphere, in particular the Antarctic ice sheet. I lead the Scripps Glaciology Group, which currently has three postdocs (Sasha Carter, Geir Moholdt and David Heeszel) and two graduate students (Fernando Paolo and Matthew Siegfried). One of the primary research questions in Antarctica is whether its mass is changing due to climate change. Due to its vast size, and the long time periods over which it can change, satellite data are crucial for routine monitoring of Antarctica, in particular data from radar and laser altimetry, and also imagery. For much of my recent work I have used laser altimetry data from NASA’s Ice, Cloud & land Elevation Satellite (ICESat). ICESat operated between January 2003 and December 2009, and provided accurate elevation data along repeated ground-‐tracks for ice sheet surface change detection (dh/dt). I was a member of the ICESat Science Team and I am a member of ICESat-‐2 Science Definition Team. As well as analyzing ICESat data for various scientific purposes mentioned below, my group is also involved in the validation of the ICESat elevation data, using “ground-‐truth” from our repeated GPS surveys of the salar de Uyuni in Bolivia (in 2002, 2009 and 2012), led by IGPP Researcher Adrian Borsa. Our main science projects are as follows:
i) Antarctic subglacial water: In 2006 I discovered active subglacial water systems under the fast-‐flowing ice streams of Antarctica using ICESat data. This was inferred from observations of large elevation change signals in repeat-‐track ICESat data (up to 10m in some places), which corresponded to draining and filling of subglacial lakes beneath 1-‐2 km of ice. Changing the basal conditions of an ice sheet, particularly beneath fast flowing ice streams and outlet glaciers, is one possible mechanism to increase its contribution to sea level rise, through increased ice flow speeds in the ice streams. With the current interest in Antarctic ice sheet mass balance and its potential impact on sea-‐level rise, it is important to understand the subglacial water process so that it can become incorporated into models; IGPP postdoc Sasha Carter works with me on this aspect of the problem4. My team and our collaborators continue to monitor active lakes, and we have found 124 in total throughout Antarctica. To better understand the role of these types of lakes in the Antarctic system, I am a PI on the Whillans Ice Stream Subglacial Access Research Drilling (WISSARD) project, a large, interdisciplinary NSF project to drill into one of the subglacial lakes that I discovered – Subglacial Lake Whillans (SLW) on Whillans Ice Stream. SIO professor Jeff Severinghaus is also a PI on this project. IGPP postdoc David Heeszel and IGPP student Matt Siegfried took part in the surface geophysics fieldwork in 2010-‐2011 and 2011-‐2012/2012-‐2013 respectively. SLW will be drilled during the 2012-‐2013 field season.
ii) Ice shelf grounding zones: We use ICESat data to map the grounding zones (GZs) of the ice shelves -‐ the transition zones between grounded and floating ice. ICESat can detect the tide-‐forced flexure zone in the GZ because repeated tracks are sampled at different phases of the ocean tide; this has provided accurate GZ location and width information for each track. As part of the WISSARD project, we also acquired GPS data across the GZ in two different geometries, which is helping us understand how the local topography influences the ice shelf flexure and properties. IGPP student Matt Siegfried is currently working on this.
iii) Ice shelf stability and change: We analyze elevation changes on Antarctic ice shelves observed by satellite radar and laser altimetry1,4,5. In one recent study, we incorporated Seasat, ERS-‐1, ERS-‐2 and Envisat data (1978-‐2008) on the Antarctic Peninsula (AP) ice shelves4 (see Figure 1). This was the first use of Seasat radar altimetry (RA) from 1978 to estimate ice shelf elevation trends prior to start of modern ESA RA era that began in 1992. IGPP student Fernando Paolo is improving on this
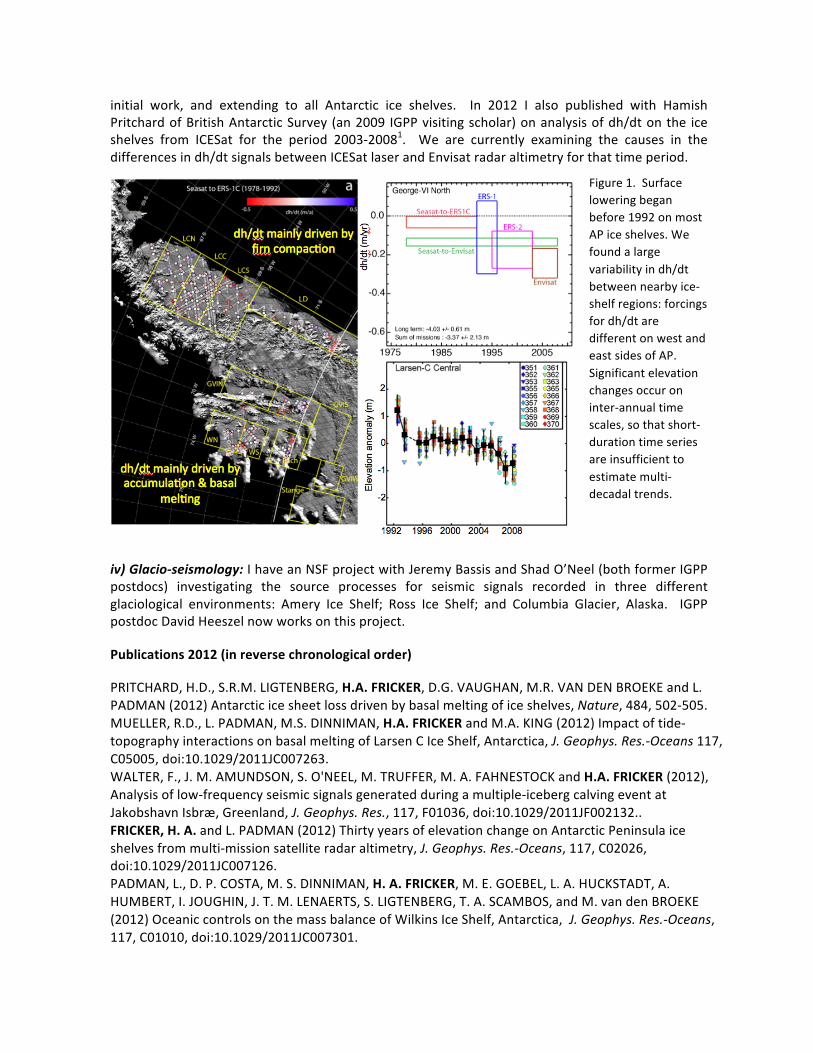
initial work, and extending to all Antarctic ice shelves. In 2012 I also published with Hamish Pritchard of British Antarctic Survey (an 2009 IGPP visiting scholar) on analysis of dh/dt on the ice shelves from ICESat for the period 2003-‐20081. We are currently examining the causes in the differences in dh/dt signals between ICESat laser and Envisat radar altimetry for that time period.
Figure 1. Surface lowering began before 1992 on most AP ice shelves. We found a large variability in dh/dt between nearby ice-‐shelf regions: forcings for dh/dt are different on west and east sides of AP. Significant elevation changes occur on inter-‐annual time scales, so that short-‐duration time series are insufficient to estimate multi-‐decadal trends.
iv) Glacio-‐seismology: I have an NSF project with Jeremy Bassis and Shad O’Neel (both former IGPP postdocs) investigating the source processes for seismic signals recorded in three different glaciological environments: Amery Ice Shelf; Ross Ice Shelf; and Columbia Glacier, Alaska. IGPP postdoc David Heeszel now works on this project.
Publications 2012 (in reverse chronological order)
PRITCHARD, H.D., S.R.M. LIGTENBERG, H.A. FRICKER, D.G. VAUGHAN, M.R. VAN DEN BROEKE and L. PADMAN (2012) Antarctic ice sheet loss driven by basal melting of ice shelves, Nature, 484, 502-‐505. MUELLER, R.D., L. PADMAN, M.S. DINNIMAN, H.A. FRICKER and M.A. KING (2012) Impact of tide-‐topography interactions on basal melting of Larsen C Ice Shelf, Antarctica, J. Geophys. Res.-‐Oceans 117, C05005, doi:10.1029/2011JC007263. WALTER, F., J. M. AMUNDSON, S. O'NEEL, M. TRUFFER, M. A. FAHNESTOCK and H.A. FRICKER (2012), Analysis of low-‐frequency seismic signals generated during a multiple-‐iceberg calving event at Jakobshavn Isbræ, Greenland, J. Geophys. Res., 117, F01036, doi:10.1029/2011JF002132.. FRICKER, H. A. and L. PADMAN (2012) Thirty years of elevation change on Antarctic Peninsula ice shelves from multi-‐mission satellite radar altimetry, J. Geophys. Res.-‐Oceans, 117, C02026, doi:10.1029/2011JC007126. PADMAN, L., D. P. COSTA, M. S. DINNIMAN, H. A. FRICKER, M. E. GOEBEL, L. A. HUCKSTADT, A. HUMBERT, I. JOUGHIN, J. T. M. LENAERTS, S. LIGTENBERG, T. A. SCAMBOS, and M. van den BROEKE (2012) Oceanic controls on the mass balance of Wilkins Ice Shelf, Antarctica, J. Geophys. Res.-‐Oceans, 117, C01010, doi:10.1029/2011JC007301.
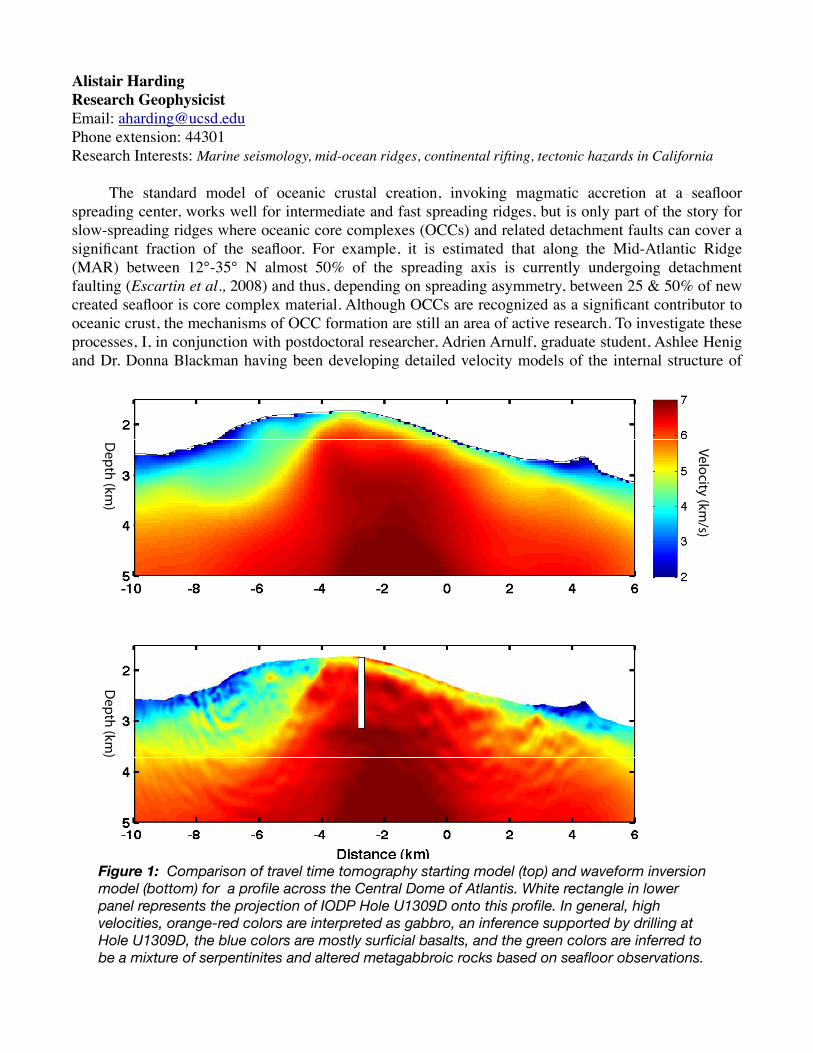
Alistair HardingResearch GeophysicistEmail: [email protected] extension: 44301Research Interests: Marine seismology, mid-ocean ridges, continental rifting, tectonic hazards in California
The standard model of oceanic crustal creation, invoking magmatic accretion at a seafloor spreading center, works well for intermediate and fast spreading ridges, but is only part of the story for slow-spreading ridges where oceanic core complexes (OCCs) and related detachment faults can cover a significant fraction of the seafloor. For example, it is estimated that along the Mid-Atlantic Ridge (MAR) between 12°-35° N almost 50% of the spreading axis is currently undergoing detachment faulting (Escartin et al., 2008) and thus, depending on spreading asymmetry, between 25 & 50% of new created seafloor is core complex material. Although OCCs are recognized as a significant contributor to oceanic crust, the mechanisms of OCC formation are still an area of active research. To investigate these processes, I, in conjunction with postdoctoral researcher, Adrien Arnulf, graduate student, Ashlee Henig and Dr. Donna Blackman having been developing detailed velocity models of the internal structure of
Depth (km
)D
epth (km)
Velocity (km/s)
Figure 1: Comparison of travel time tomography starting model (top) and waveform inversion model (bottom) for a profile across the Central Dome of Atlantis. White rectangle in lower panel represents the projection of IODP Hole U1309D onto this profile. In general, high velocities, orange-red colors are interpreted as gabbro, an inference supported by drilling at Hole U1309D, the blue colors are mostly surficial basalts, and the green colors are inferred to be a mixture of serpentinites and altered metagabbroic rocks based on seafloor observations.
Atlantis Massif, an OCC that is located on the spreading axis of the MAR at 30° N at its intersection with the Atlantis Transform. The current generation of models have been developed from the existing multichannel seismic (MCS) data through a series of processing steps: downward continuation, first-arrival travel time tomography and full waveform inversion. The advantage of using refraction arrivals recorded in MCS data for travel-time tomography is that the ray coverage of the upper oceanic crust is much denser and complete than experiments using a limited number of ocean bottom instruments. Downward continuation simplifies the use of travel times and allows the use of otherwise hidden ray paths that turn within the shallowest portion of the oceanic crust (Arnulf et al., 2011, Henig et al., 2012). The resulting tomography models can themselves be interpreted in terms of geologic structure but can also be used as the starting model for full waveform inversion. Waveform inversion is based upon a linearization of a highly nonlinear inversion problem and thus it is important that the starting model is, as far as is possible, within the global minimum of the problem. The value of the tomography model is that it usually predicts waveforms that are aligned to within half a cycle of the data, greatly improving the chances of successful convergence. The effect of waveform inversion is to markedly improve the resolution of velocity gradients within the model, resulting in a visually sharper model (Arnulf et al.,2012). The waveform inversion model resolves the transition from gabbros within the core of the Massif and lower velocity rocks into a sharp contact on the western (left) side of the Massif, Figure 1. This sharp contact can be recognized as both a sharp change in seafloor reflection amplitude as well as a small nick in the bathymetry profile. Connecting the subsurface structure directly to seafloor bathymetry allows the contact to traced through most of the OCC from existing bathymetry coverage.
Relevant PublicationsArnulf, A. F., Harding, A. J., Singh, S. C., Kent, G. M., and Crawford, W., 2012, Fine-scale velocity
structure of upper oceanic crust from downward continued seismic reflection data at Lucky Strike Volcano, Mid-Atlantic Ridge, Geophys. Res. Lett., 39, L08303, doi:10.1029/2012GL051064.
Arnulf, A. F., Singh, S. C, Harding, A. J., Kent, G. M., and Crawford, W., 2011, Strong seismic heterogeneity in layer 2A near hydrothermal vents at the Mid-Atlantic Ridge, Geophys. Res. Lett., 38, L13320, doi:10.1029/ 2011GL047753.
Henig, A. S, Blackman, D. K., Harding, A. J, Canales, J. P. and Kent, G. M., 2012, Downward continued multichannel seismic refraction analysis of Atlantis Massif oceanic core complex, 30° N, Mid-Atlantic Ridge, Geochim. Geophys. Geosyst., 13, Q0AG07, doi:10.1029/2012GC004059.
Michael A.H. Hedlin
Research Geophysicist
Email address: [email protected]
Phone extension: 48773
Research Interests: Study of large atmospheric phenomena, study of long-range propagation of subaudible sound through the atmosphere, seismo-acoustics, nuclear test-ban verification.
Infrasound: The study of subaudible sound, or infrasound, has emerged as a new frontier in geophysics and acoustics. We have known of infrasound since 1883 with the eruption of Krakatoa, as signals from that event registered on barometers around the globe. Initially a scientific curiosity, the field briefly rose to prominence during the 1950’s and 1960’s during the age of atmospheric nuclear testing. With the recent Comprehensive Test-Ban Treaty, which bans nuclear tests of all yields in all environments, we have seen renewed interest in infrasound. A worldwide network of infrasound arrays, being constructed for nuclear monitoring, is fueling basic research into man-made and natural sources of infrasound, how sound propagates through our dynamic atmosphere and how best to detect infrasonic signals amid noise due to atmospheric circulation.
Research at L2A: The Laboratory for Atmospheric Acoustics (L2A) is the home of research in this field at IGPP. Several faculty, post-docs and PhD students work full or part time in L2A, supported by engineers and technicians in the lab and the field. More information about this lab can be found at l2a.ucsd.edu. Presently we study a broad suite of problems related to both natural and man-made sources.
Seismic network study of atmospheric events and infrasound propagation: The global infrasound network is unprecedented in scale however it is still very sparse, with ~ 100 stations operating worldwide. To increase the density of sampling of the infrasonic wavefield we have used acoustic–to-seismic coupled signals recorded by dense seismic networks, such as the 400-station USArray Transportable Array (TA) and various PASSCAL deployments. We have used the TA network to create a catalog of atmospheric events in the United States similar to commonly used seismic event catalogs. The acoustic catalog is used in part to find sources of interest for further study and to study the statistics of atmospheric activity. Large atmospheric events generate acoustic branches that are akin to seismic branches. The branches, which can only be studied in detail using dense network data, provide constraints on the large-scale structure of the atmosphere at altitudes that are not well constrained by instruments deployed on the ground or in space. Instantaneous sources commonly give rise to signals that last 10’s to 100’s of seconds. Recent research indicates that the infrasound wavefield is dispersed in time due to interaction with small-scale structure largely due to gravity waves. Dense seismic network data are now offering us an unprecedented opportunity to test statistical models of gravity waves.
Seismo-acoustic network studies: Our group was recently funded to upgrade the TA with infrasound microphones and barometers. Our sensor package is sensitive to air pressure variations from D.C. to 20 Hz, at the lower end of the audible range. The entire USArray TA has been retrofitted with these new sensors to create the first-ever semi-continental-scale seismo-acoustic network. The network spans ~ 2,000,000 square km in the eastern United States and will eventually be redeployed in Alaska. We are currently using the upgraded TA to study the generation and long-range propagation of gravity waves. We are using the
broadband seismic and barometric recordings to study the interaction of the atmosphere and Earth’s crust.
Field operations: Our group has built two permanent infrasound arrays in the US and one in Africa. In recent years we have deployed infrasound arrays across the southwestern US to record signals from high-altitude explosions and natural phenomena. We currently operate research arrays located near San Diego. A typical temporary array comprises 4 to 8 aneroid microbarometers or fiber-optic sensors spanning an area 100 to 300 meters across, with data recorded using 24-bit Reftek digitizers and telemetered in realtime to our lab in La Jolla. We use Sun workstations and a suite of Macintosh G5 computers. All data from the field is archived on a multi-TB RAID. All computers, and supporting peripherals such as printers, are linked via a broadband communications network.
Relevant Publications Arrowsmith, S. & Hedlin, M.A.H., 2005, Observations of infrasound from surf in Southern California, Geophysical Research Letters, 32, No. 9, L09810,doi:10.1029/2005GL022761. Arrowsmith, S.J., Johnson, J.B., Drob, D. and Hedlin, M.A.H., 2010, The seismo-acoustic wavefield: A new paradigm in studying geophysical phenomena, Reviews of Geophysics, doi:10.1029/2010RG000335. Bass, H., Bhattacharyya, J., Garces, M., Hedlin, M.A.H., Olson, J. and Woodward, R., 2006, Infrasound, Acoustics Today, 2, 9-19. de Groot-Hedlin, C.D., Hedlin, M.A.H., Walker, K., Drob., D., and Zumberge, M., 2008, Study of propagation from the shuttle Atlantis using a large seismic network, J. Acoust. Soc. Am., 124, 1442-1451. de Groot-Hedlin, C.D., Hedlin, M.A.H., and Drob, D., 2010, Atmospheric variability and infrasound monitoring, Global Continuous Infrasound Monitoring for Atmospheric Studies, Springer Geosciences, p475-507. de Groot-Hedlin, C.D., Hedlin, M.A.H. and Walker, K., 2011, Finite difference synthesis of infrasound propagation through a windy, viscous atmopshere: application to a bolide explosion detected by seismic networks, Geophysical Journal International, doi: 10.1111/j.1365-246X.2010.04925.x. Hedlin, M.A.H. and Alcoverro, B., 2005, The use of impedance matching capillaries for reducing resonance in rosette spatial filters, J. Acoust. Soc. Am, 117, 1880-1888. Hedlin, M.A.H., Drob, D., Walker, K. and de Groot-Hedlin, C., 2010, A study of acoustic propagation from a large bolide in the atmosphere with a dense seismic network, J. Geophys. Res., 115, B11312, doi:10.1029/2010JB007669. Hedlin, M.A.H., Walker, K., Drob, D. and de Groot-Hedlin, C.D., 2011, Infrasound: Connecting the Solid Earth, Oceans and Atmosphere, Annual Review of Earth and Planetary Sciences, 40, 327-354 Hedlin, M.A.H., de Groot-Hedlin, C.D. and Drob, D., 2012, A study of infrasound propagation using dense seismic network recordings of surface explosions, Bulletin of the Seismological Society of America, 102, 1927-1937, doi: 10.1785/0120110300 Hedlin, M.A.H. and Walker, K., 2012, A study of infrasonic anisotropy and multipathing in the atmosphere using seismic networks, Philosophical Transactions of the Royal Society - A, in press. Matoza, R.S., Hedlin, M.A.H., Garces, M.A., 2006, An infrasound array study of Mount St Helens, Journal of Volcanology and Geothermal Research. v160, issues 3-4, p249-262. Matoza, R.S., Garces, M.A., Chouet, B.A., D’Auria, L., Hedlin, M.A.H., de Grooth-Hedlin, C.D., Waite, G.P., 2008, The source of infrasound associated with long period events at Mount St. Helens, in review with J. Geophys. Res., 114, B04305, doi:10.1029/2008JB006128. Matoza, R.S., Fee, D., Garces, M.A., Seiner, J.M., Ramon, P.A. and Hedlin, M.A.H, 2009, Infrasonic jet Walker, K., Hedlin, M.A.H., de Groot-Hedlin, C.D., Vergoz, J., Le Pichon, A., Drob, D., 2010, Source location of the 19 February 2008 Oregon Bolide Using Seismic Networks and Infrasound Arrays, Journal of Geophysical Research, DOI:10.1029/2010JB007863 noise from volcanic eruptions, Geophysical Research Letters, v 36, doi:10.1029/2008GL036486. Walker, K., Walker, K. and Hedlin, M.A.H., 2010, A review of infrasound wind noise reduction technologies, Global Continuous Infrasound Monitoring for Atmospheric Studies, Springer Geosciences, p141-182. Walker KT, Shelby R, Hedlin MAH, de Groot-Hedlin CD, Vernon FL. 2011. Western U.S. Infrasonic Catalog: illuminating infrasonic hotspots with the USArray. J. Geophys. Res. doi:10.1029/2011JB008579. Zumberge, M., Hedlin, M.A.H., and Shearer, P., .., 2007, Methodologies for determining infrasound phase velocity direction with an array of directional acoustic sensors, J. Acoust. Soc. Am. 124, 2090-2099.
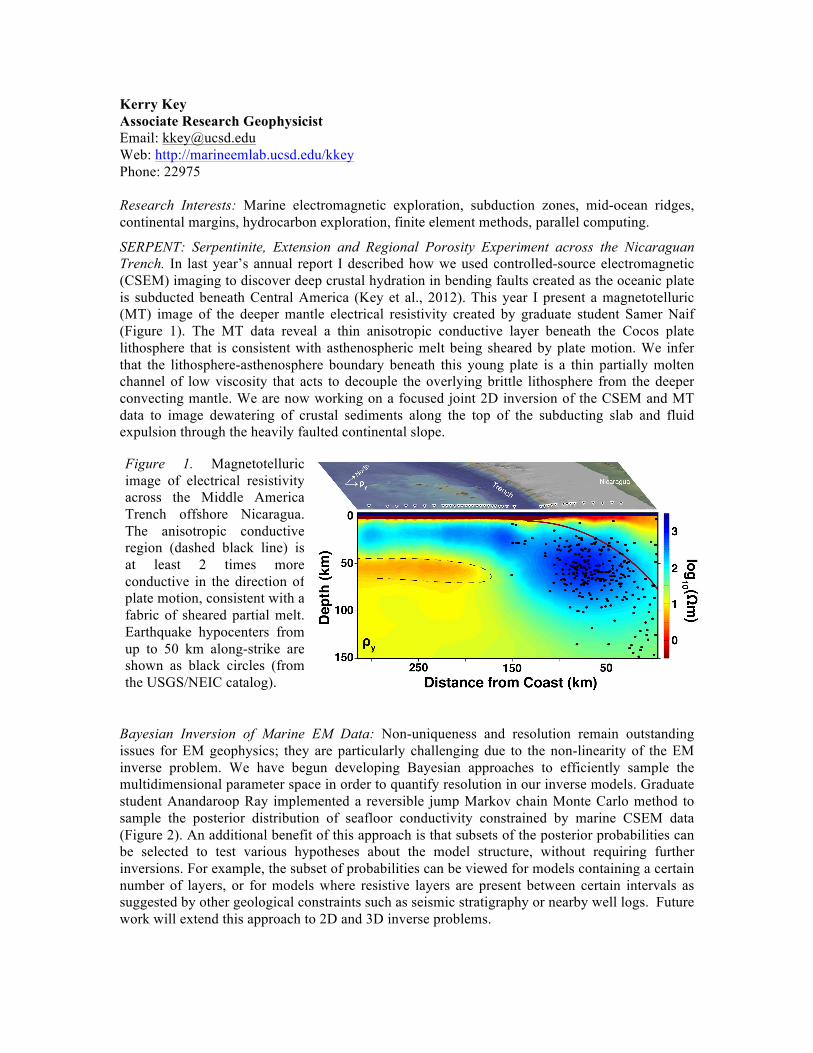
Kerry Key Associate Research Geophysicist Email: [email protected] Web: http://marineemlab.ucsd.edu/kkey Phone: 22975 Research Interests: Marine electromagnetic exploration, subduction zones, mid-ocean ridges, continental margins, hydrocarbon exploration, finite element methods, parallel computing.
SERPENT: Serpentinite, Extension and Regional Porosity Experiment across the Nicaraguan Trench. In last year’s annual report I described how we used controlled-source electromagnetic (CSEM) imaging to discover deep crustal hydration in bending faults created as the oceanic plate is subducted beneath Central America (Key et al., 2012). This year I present a magnetotelluric (MT) image of the deeper mantle electrical resistivity created by graduate student Samer Naif (Figure 1). The MT data reveal a thin anisotropic conductive layer beneath the Cocos plate lithosphere that is consistent with asthenospheric melt being sheared by plate motion. We infer that the lithosphere-asthenosphere boundary beneath this young plate is a thin partially molten channel of low viscosity that acts to decouple the overlying brittle lithosphere from the deeper convecting mantle. We are now working on a focused joint 2D inversion of the CSEM and MT data to image dewatering of crustal sediments along the top of the subducting slab and fluid expulsion through the heavily faulted continental slope.
Bayesian Inversion of Marine EM Data: Non-uniqueness and resolution remain outstanding issues for EM geophysics; they are particularly challenging due to the non-linearity of the EM inverse problem. We have begun developing Bayesian approaches to efficiently sample the multidimensional parameter space in order to quantify resolution in our inverse models. Graduate student Anandaroop Ray implemented a reversible jump Markov chain Monte Carlo method to sample the posterior distribution of seafloor conductivity constrained by marine CSEM data (Figure 2). An additional benefit of this approach is that subsets of the posterior probabilities can be selected to test various hypotheses about the model structure, without requiring further inversions. For example, the subset of probabilities can be viewed for models containing a certain number of layers, or for models where resistive layers are present between certain intervals as suggested by other geological constraints such as seismic stratigraphy or nearby well logs. Future work will extend this approach to 2D and 3D inverse problems.
Figure 1. Magnetotelluric image of electrical resistivity across the Middle America Trench offshore Nicaragua. The anisotropic conductive region (dashed black line) is at least 2 times more conductive in the direction of plate motion, consistent with a fabric of sheared partial melt. Earthquake hypocenters from up to 50 km along-strike are shown as black circles (from the USGS/NEIC catalog).
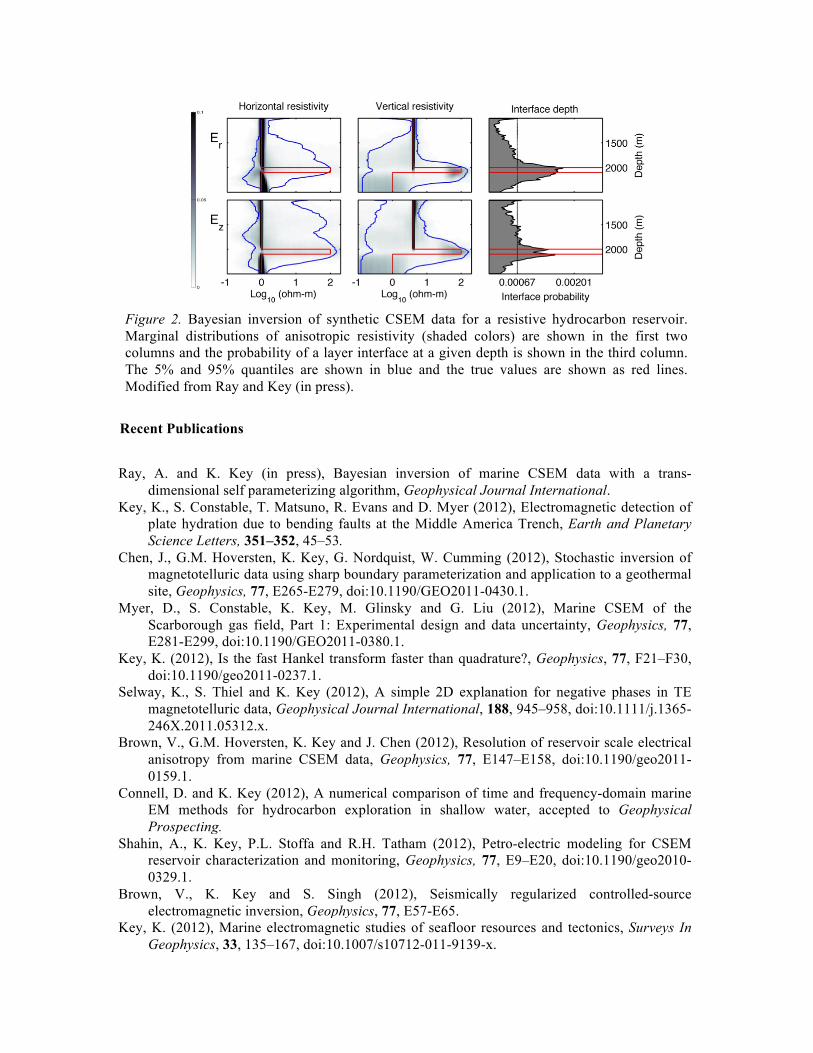
Recent Publications
Ray, A. and K. Key (in press), Bayesian inversion of marine CSEM data with a trans-
dimensional self parameterizing algorithm, Geophysical Journal International. Key, K., S. Constable, T. Matsuno, R. Evans and D. Myer (2012), Electromagnetic detection of
plate hydration due to bending faults at the Middle America Trench, Earth and Planetary Science Letters, 351–352, 45–53.
Chen, J., G.M. Hoversten, K. Key, G. Nordquist, W. Cumming (2012), Stochastic inversion of magnetotelluric data using sharp boundary parameterization and application to a geothermal site, Geophysics, 77, E265-E279, doi:10.1190/GEO2011-0430.1.
Myer, D., S. Constable, K. Key, M. Glinsky and G. Liu (2012), Marine CSEM of the Scarborough gas field, Part 1: Experimental design and data uncertainty, Geophysics, 77, E281-E299, doi:10.1190/GEO2011-0380.1.
Key, K. (2012), Is the fast Hankel transform faster than quadrature?, Geophysics, 77, F21–F30, doi:10.1190/geo2011-0237.1.
Selway, K., S. Thiel and K. Key (2012), A simple 2D explanation for negative phases in TE magnetotelluric data, Geophysical Journal International, 188, 945–958, doi:10.1111/j.1365-246X.2011.05312.x.
Brown, V., G.M. Hoversten, K. Key and J. Chen (2012), Resolution of reservoir scale electrical anisotropy from marine CSEM data, Geophysics, 77, E147–E158, doi:10.1190/geo2011-0159.1.
Connell, D. and K. Key (2012), A numerical comparison of time and frequency-domain marine EM methods for hydrocarbon exploration in shallow water, accepted to Geophysical Prospecting.
Shahin, A., K. Key, P.L. Stoffa and R.H. Tatham (2012), Petro-electric modeling for CSEM reservoir characterization and monitoring, Geophysics, 77, E9–E20, doi:10.1190/geo2010-0329.1.
Brown, V., K. Key and S. Singh (2012), Seismically regularized controlled-source electromagnetic inversion, Geophysics, 77, E57-E65.
Key, K. (2012), Marine electromagnetic studies of seafloor resources and tectonics, Surveys In Geophysics, 33, 135–167, doi:10.1007/s10712-011-9139-x.
Figure 2. Bayesian inversion of synthetic CSEM data for a resistive hydrocarbon reservoir. Marginal distributions of anisotropic resistivity (shaded colors) are shown in the first two columns and the probability of a layer interface at a given depth is shown in the third column. The 5% and 95% quantiles are shown in blue and the true values are shown as red lines. Modified from Ray and Key (in press).
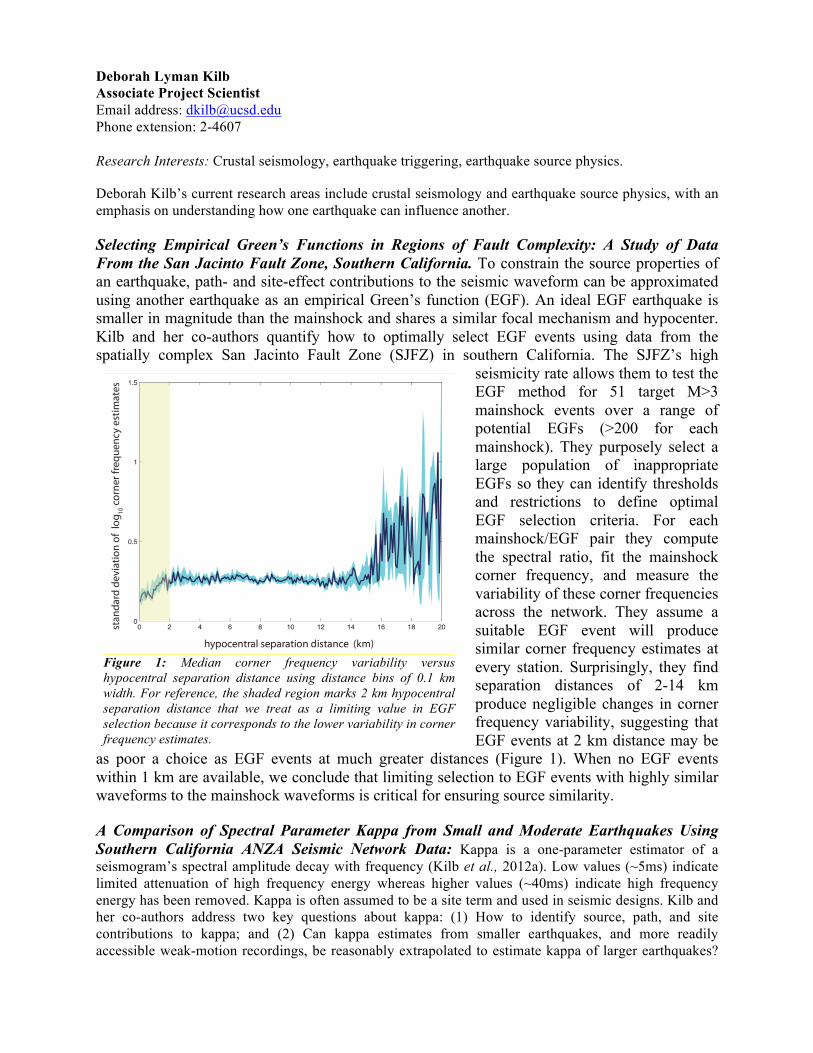
Deborah Lyman Kilb Associate Project Scientist Email address: [email protected] Phone extension: 2-4607 Research Interests: Crustal seismology, earthquake triggering, earthquake source physics.
Deborah Kilb’s current research areas include crustal seismology and earthquake source physics, with an emphasis on understanding how one earthquake can influence another. Selecting Empirical Green’s Functions in Regions of Fault Complexity: A Study of Data From the San Jacinto Fault Zone, Southern California. To constrain the source properties of an earthquake, path- and site-effect contributions to the seismic waveform can be approximated using another earthquake as an empirical Green’s function (EGF). An ideal EGF earthquake is smaller in magnitude than the mainshock and shares a similar focal mechanism and hypocenter. Kilb and her co-authors quantify how to optimally select EGF events using data from the spatially complex San Jacinto Fault Zone (SJFZ) in southern California. The SJFZ’s high
seismicity rate allows them to test the EGF method for 51 target M>3 mainshock events over a range of potential EGFs (>200 for each mainshock). They purposely select a large population of inappropriate EGFs so they can identify thresholds and restrictions to define optimal EGF selection criteria. For each mainshock/EGF pair they compute the spectral ratio, fit the mainshock corner frequency, and measure the variability of these corner frequencies across the network. They assume a suitable EGF event will produce similar corner frequency estimates at every station. Surprisingly, they find separation distances of 2-14 km produce negligible changes in corner frequency variability, suggesting that EGF events at 2 km distance may be
as poor a choice as EGF events at much greater distances (Figure 1). When no EGF events within 1 km are available, we conclude that limiting selection to EGF events with highly similar waveforms to the mainshock waveforms is critical for ensuring source similarity. A Comparison of Spectral Parameter Kappa from Small and Moderate Earthquakes Using Southern California ANZA Seismic Network Data: Kappa is a one-parameter estimator of a seismogram’s spectral amplitude decay with frequency (Kilb et al., 2012a). Low values (~5ms) indicate limited attenuation of high frequency energy whereas higher values (~40ms) indicate high frequency energy has been removed. Kappa is often assumed to be a site term and used in seismic designs. Kilb and her co-authors address two key questions about kappa: (1) How to identify source, path, and site contributions to kappa; and (2) Can kappa estimates from smaller earthquakes, and more readily accessible weak-motion recordings, be reasonably extrapolated to estimate kappa of larger earthquakes?
Figure 1: Median corner frequency variability versus hypocentral separation distance using distance bins of 0.1 km width. For reference, the shaded region marks 2 km hypocentral separation distance that we treat as a limiting value in EGF selection because it corresponds to the lower variability in corner frequency estimates.
The use of small earthquakes (magnitudes < 1) presents many challenges and requires new approaches. Kilb and her team developed estimates of kappa for seismograms from 1,137 small earthquakes recorded by the ANZA seismic network in southern California, and they compare these to results from the stronger recorded shaking generated by 43 earthquakes of magnitude 3.5 or greater inside the network. They found kappa from small earthquakes predicts the relative values of kappa for larger earthquakes (e.g., measurements at stations PFO and KNW are small compared with those at stations TRO and SND). For SND and TRO data, however, kappa values from small earthquakes over-predict those from moderate and large earthquakes. Although site effects are most important to kappa estimates, the scatter within kappa measurements at a given station is likely caused by a significant contribution from near the source, perhaps related to near source scattering. Because of this source-side variability, care is recommended in using individual small events as Green’s functions to study source-time effects of moderate and large events. Potential triggers for large ruptures along the southern San Andreas Fault: Kilb and her co-authors explore why the southern San Andreas Fault (SSAF) in California has not had a large earthquake in approximately 300 years, yet the average recurrence for the previous five ruptures is about 180 years. Key in this work is the observation that a 60 km section of the SSAF has periodically been submerged during high lake levels in the past, and emerging evidence indicates coincident timing between lake flooding and fault displacement. As a large SSAF earthquake appears imminent, it is important to understand how crustal stress perturbations can promote or inhibit fault failure(s) in this region. The team assesses the potential for prehistoric flooding of Lake Cahuilla (which encompassed an area significantly larger than the present day Salton Sea) to act as a catalyst in triggering a sequence of large earthquakes. They find calculated static stress perturbations from lake flooding and/or rupture of secondary faults beneath the lake are sufficient (i.e., reaching levels above an assumed triggering threshold of 0.1 MPa) to potentially trigger large earthquakes on the SSAF. Since the current lake level is relatively stable, any future interaction between the faults under today’s Salton Sea and the SSAF will depend solely on tectonic loading, without any perturbing stresses from lake level changes. These results highlight the importance of including lake loading and secondary fault ruptures in seismic hazard assessments (Brothers et al., 2011). Listen, Watch, Learn: Tapping into the new audio/video approach of information exchange, Kilb and her co-workers created a seismic data audio/video repository (http://www.iris.edu/dms/products/seissound/data/). These data products include both the auditory counterparts and visual imagery (seismograms and associated spectragrams) of seismograms (Kilb et al., 2012b; Peng et al., 2012), which are presented in a movie format that indicates how the seismic data evolves with time. These videos can help in identifying aftershock rates and recognizing site effects including reverberation in basins, and are useful in discriminating complicated seismic signals from multiple sources, such as aftershocks within the coda of large earthquakes, and remote triggering of earthquakes and tremor. See http://eqinfo.ucsd.edu/~dkilb/current.html for an expanded description of these projects. Recent Publications Brothers, D., D. Kilb, K. Luttrell, N. Driscoll and G. Kent, ‘Loading of the San Andreas fault by flood-
induced rupture of faults beneath the Salton Sea’, Nature Geoscience, 4, pp: 486-492 DOI: 10.1038/NGEO1184, 2011.
Kilb, D., G. Biasi, J. Anderson, J. Brune, Z. Peng, and F. L. Vernon, ‘A Comparison of Spectral Parameter Kappa from Small and Moderate Earthquakes Using Southern California ANZA Seismic Network Data’, Bull. Seism. Soc. Am., p. 284-300; DOI: 10.1785/ 0120100309, 2012a.
Kilb, D., Z. Peng, D. Simpson, A. Michael, M. Fisher and D. Rohrlick, ‘Listen, Watch, Learn: SeisSound Video products’, Seis. Res. Lett., p. 281-286, DOI: 10.1785/ gssrl.83.2.281, 2012b.
Peng, Z., C. Aiken, D. Kilb, D. R. Shelly, and B. Enescu, ‘Listening to the 2011 magnitude 9.0 Tohoku-Oki, Japan earthquake’, Seis. Res. Lett., p. 287-293, doi:10.1785/gssrl.83.2.287 2012.
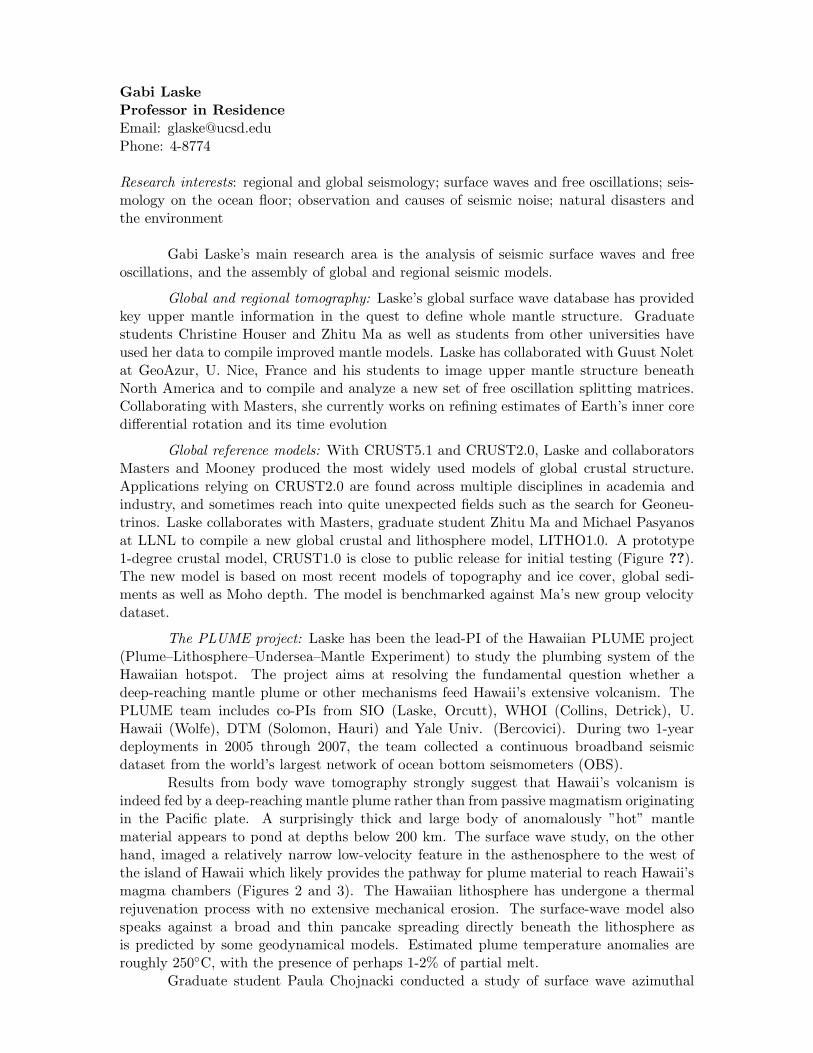
Gabi Laske
Professor in Residence
Email: [email protected]: 4-8774
Research interests: regional and global seismology; surface waves and free oscillations; seis-mology on the ocean floor; observation and causes of seismic noise; natural disasters andthe environment
Gabi Laske’s main research area is the analysis of seismic surface waves and freeoscillations, and the assembly of global and regional seismic models.
Global and regional tomography: Laske’s global surface wave database has providedkey upper mantle information in the quest to define whole mantle structure. Graduatestudents Christine Houser and Zhitu Ma as well as students from other universities haveused her data to compile improved mantle models. Laske has collaborated with Guust Noletat GeoAzur, U. Nice, France and his students to image upper mantle structure beneathNorth America and to compile and analyze a new set of free oscillation splitting matrices.Collaborating with Masters, she currently works on refining estimates of Earth’s inner coredifferential rotation and its time evolution
Global reference models: With CRUST5.1 and CRUST2.0, Laske and collaboratorsMasters and Mooney produced the most widely used models of global crustal structure.Applications relying on CRUST2.0 are found across multiple disciplines in academia andindustry, and sometimes reach into quite unexpected fields such as the search for Geoneu-trinos. Laske collaborates with Masters, graduate student Zhitu Ma and Michael Pasyanosat LLNL to compile a new global crustal and lithosphere model, LITHO1.0. A prototype1-degree crustal model, CRUST1.0 is close to public release for initial testing (Figure ??).The new model is based on most recent models of topography and ice cover, global sedi-ments as well as Moho depth. The model is benchmarked against Ma’s new group velocitydataset.
The PLUME project: Laske has been the lead-PI of the Hawaiian PLUME project(Plume–Lithosphere–Undersea–Mantle Experiment) to study the plumbing system of theHawaiian hotspot. The project aims at resolving the fundamental question whether adeep-reaching mantle plume or other mechanisms feed Hawaii’s extensive volcanism. ThePLUME team includes co-PIs from SIO (Laske, Orcutt), WHOI (Collins, Detrick), U.Hawaii (Wolfe), DTM (Solomon, Hauri) and Yale Univ. (Bercovici). During two 1-yeardeployments in 2005 through 2007, the team collected a continuous broadband seismicdataset from the world’s largest network of ocean bottom seismometers (OBS).
Results from body wave tomography strongly suggest that Hawaii’s volcanism isindeed fed by a deep-reaching mantle plume rather than from passive magmatism originatingin the Pacific plate. A surprisingly thick and large body of anomalously ”hot” mantlematerial appears to pond at depths below 200 km. The surface wave study, on the otherhand, imaged a relatively narrow low-velocity feature in the asthenosphere to the west ofthe island of Hawaii which likely provides the pathway for plume material to reach Hawaii’smagma chambers (Figures 2 and 3). The Hawaiian lithosphere has undergone a thermalrejuvenation process with no extensive mechanical erosion. The surface-wave model alsospeaks against a broad and thin pancake spreading directly beneath the lithosphere asis predicted by some geodynamical models. Estimated plume temperature anomalies areroughly 250C, with the presence of perhaps 1-2% of partial melt.
Graduate student Paula Chojnacki conducted a study of surface wave azimuthal
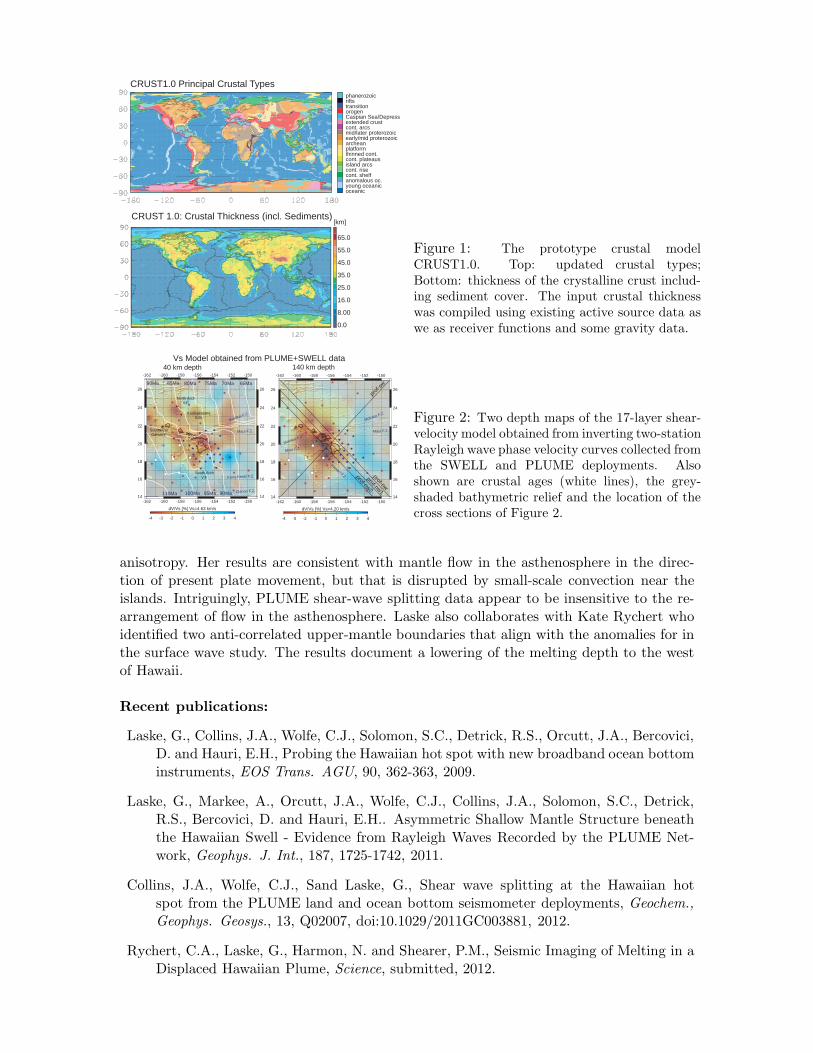
oceanicyoung oceanicanomalous oc.cont. shelfcont. riseisland arcscont. plateausthinned cont.platformarcheanearly/mid proterozoicmid/later proterozoiccont. arcsextended crustCaspian Sea/Depressorogentransitionriftsphanerozoic
CRUST1.0 Principal Crustal Types
0.0
8.00
16.0
25.0
35.0
45.0
55.0
65.0
[km]CRUST 1.0: Crustal Thickness (incl. Sediments)
Figure 1: The prototype crustal modelCRUST1.0. Top: updated crustal types;Bottom: thickness of the crystalline crust includ-ing sediment cover. The input crustal thicknesswas compiled using existing active source data aswe as receiver functions and some gravity data.
-162
-162
-160
-160
-158
-158
-156
-156
-154
-154
-152
-152
-150
-150
14 14
16 16
18 18
20 20
22 22
24 24
26 26
-4 -3 -2 -1 0 1 2 3 4
dV/Vs [%] Vs=4.20 km/s
-162
-162
-160
-160
-158
-158
-156
-156
-154
-154
-152
-152
-150
-150
14 14
16 16
18 18
20 20
22 22
24 24
26 26
-4 -3 -2 -1 0 1 2 3 4
dV/Vs [%] Vs=4.63 km/s
Molokai F.Z.
Maui F.Z.
Hawai'i F.Z.
Molokai F.Z.
40 km depth 140 km depth
prof-nw
prof-nw1
prof-nw2
prof-
sw
Maui F.Z.
Vs Model obtained from PLUME+SWELL data
KauluakalanaS.M.
North ArchV.F.
Kana Keoki F.Z.
Clarion F.Z.
Maui F.Z.
South ArchV.F.
Molokai F.Z.
Southwest OahuV.F.
75Ma 70Ma
100Ma 95Ma
80Ma 65Ma85Ma
90Ma110Ma
90Ma
Figure 2: Two depth maps of the 17-layer shear-velocity model obtained from inverting two-stationRayleigh wave phase velocity curves collected fromthe SWELL and PLUME deployments. Alsoshown are crustal ages (white lines), the grey-shaded bathymetric relief and the location of thecross sections of Figure 2.
anisotropy. Her results are consistent with mantle flow in the asthenosphere in the direc-tion of present plate movement, but that is disrupted by small-scale convection near theislands. Intriguingly, PLUME shear-wave splitting data appear to be insensitive to the re-arrangement of flow in the asthenosphere. Laske also collaborates with Kate Rychert whoidentified two anti-correlated upper-mantle boundaries that align with the anomalies for inthe surface wave study. The results document a lowering of the melting depth to the westof Hawaii.
Recent publications:
Laske, G., Collins, J.A., Wolfe, C.J., Solomon, S.C., Detrick, R.S., Orcutt, J.A., Bercovici,D. and Hauri, E.H., Probing the Hawaiian hot spot with new broadband ocean bottominstruments, EOS Trans. AGU, 90, 362-363, 2009.
Laske, G., Markee, A., Orcutt, J.A., Wolfe, C.J., Collins, J.A., Solomon, S.C., Detrick,R.S., Bercovici, D. and Hauri, E.H.. Asymmetric Shallow Mantle Structure beneaththe Hawaiian Swell - Evidence from Rayleigh Waves Recorded by the PLUME Net-work, Geophys. J. Int., 187, 1725-1742, 2011.
Collins, J.A., Wolfe, C.J., Sand Laske, G., Shear wave splitting at the Hawaiian hotspot from the PLUME land and ocean bottom seismometer deployments, Geochem.,
Geophys. Geosys., 13, Q02007, doi:10.1029/2011GC003881, 2012.
Rychert, C.A., Laske, G., Harmon, N. and Shearer, P.M., Seismic Imaging of Melting in aDisplaced Hawaiian Plume, Science, submitted, 2012.
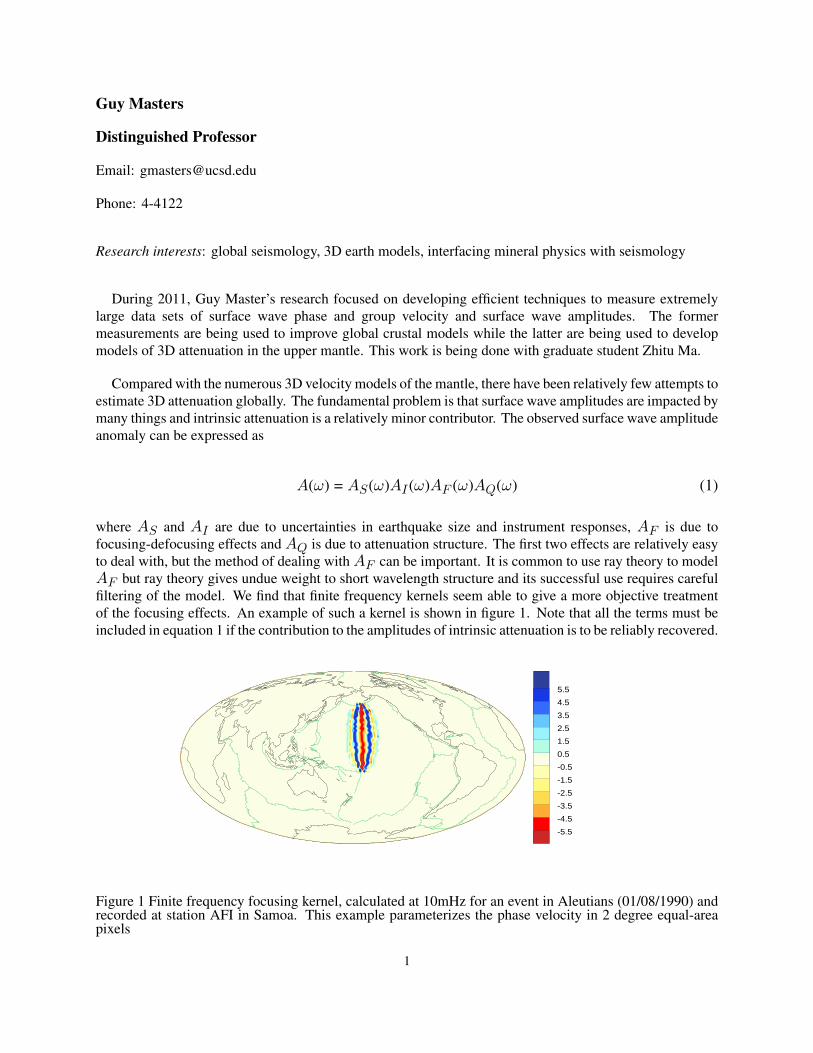
Guy Masters
Distinguished Professor
Email: [email protected]
Phone: 4-4122
Research interests: global seismology, 3D earth models, interfacing mineral physics with seismology
During 2011, Guy Master’s research focused on developing efficient techniques to measure extremelylarge data sets of surface wave phase and group velocity and surface wave amplitudes. The formermeasurements are being used to improve global crustal models while the latter are being used to developmodels of 3D attenuation in the upper mantle. This work is being done with graduate student Zhitu Ma.
Compared with the numerous 3D velocity models of the mantle, there have been relatively few attempts toestimate 3D attenuation globally. The fundamental problem is that surface wave amplitudes are impacted bymany things and intrinsic attenuation is a relatively minor contributor. The observed surface wave amplitudeanomaly can be expressed as
A(ω) = AS(ω)AI (ω)AF (ω)AQ(ω) (1)
where AS and AI are due to uncertainties in earthquake size and instrument responses, AF is due tofocusing-defocusing effects and AQ is due to attenuation structure. The first two effects are relatively easyto deal with, but the method of dealing with AF can be important. It is common to use ray theory to modelAF but ray theory gives undue weight to short wavelength structure and its successful use requires carefulfiltering of the model. We find that finite frequency kernels seem able to give a more objective treatmentof the focusing effects. An example of such a kernel is shown in figure 1. Note that all the terms must beincluded in equation 1 if the contribution to the amplitudes of intrinsic attenuation is to be reliably recovered.
5.5
4.5
3.5
2.5
1.5
0.5
-0.5
-1.5
-2.5
-3.5
-4.5
-5.5
5.5
4.5
3.5
2.5
1.5
0.5
-0.5
-1.5
-2.5
-3.5
-4.5
-5.5
Figure 1 Finite frequency focusing kernel, calculated at 10mHz for an event in Aleutians (01/08/1990) andrecorded at station AFI in Samoa. This example parameterizes the phase velocity in 2 degree equal-areapixels
1
Joint inversion of extremely large datasets of Rayleigh wave phase and amplitude data at a variety offrequencies give the preliminary results shown in figure 2 for the global distribution of phase velocity andattenuation. The attenuation maps make good physical sense with high attenuation regions associated withocean ridges and back arc basins while low attenuation regions tend to be associated with continental cratons.Because of the effects of physical dispersion, large changes in attenuation can lead to measurable changesin phase velocity so it is important to include attenuation effects when interpreting phase velocity data.
The ultimate goal of this work is to generate a global 3D model of attenuation in the upper mantle. Jointinterpretation with velocity models allows the discrimination between thermal and chemical anomalies.
5.54.53.52.51.50.5-0.5-1.5-2.5-3.5-4.5-5.5
5.54.53.52.51.50.5-0.5-1.5-2.5-3.5-4.5-5.5
5.54.53.52.51.50.5-0.5-1.5-2.5-3.5-4.5-5.5
1.10.90.70.50.30.1-0.1-0.3-0.5-0.7-0.9-1.1
1.10.90.70.50.30.1-0.1-0.3-0.5-0.7-0.9-1.1
1.10.90.70.50.30.1-0.1-0.3-0.5-0.7-0.9-1.1
Figure 2. Phase velocity perturbation and attenuation maps for 7mHz, 10mHz and 15mHz. Note that thephase velocity perturbation is in δc/c(%) and attenuation is in δQ−1/Q−1.
2
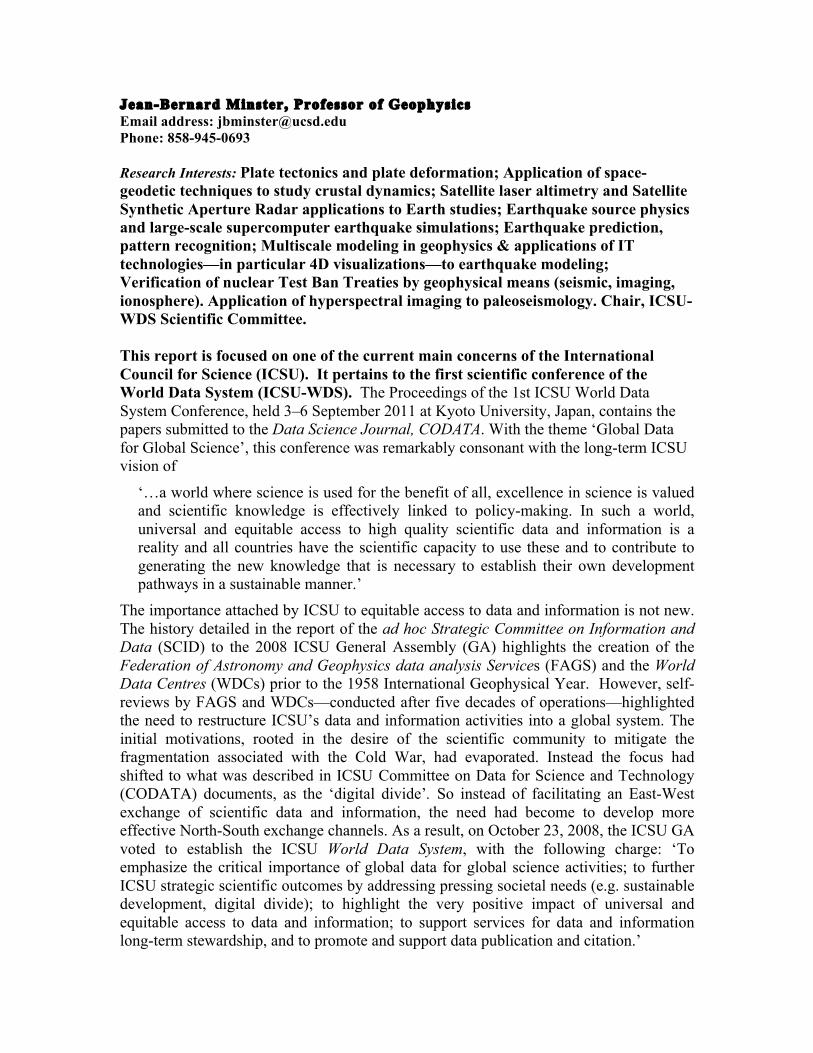
Jean-Bernard Minster, Professor of Geophysics Email address: [email protected] Phone: 858-945-0693 Research Interests: Plate tectonics and plate deformation; Application of space-geodetic techniques to study crustal dynamics; Satellite laser altimetry and Satellite Synthetic Aperture Radar applications to Earth studies; Earthquake source physics and large-scale supercomputer earthquake simulations; Earthquake prediction, pattern recognition; Multiscale modeling in geophysics & applications of IT technologies—in particular 4D visualizations—to earthquake modeling; Verification of nuclear Test Ban Treaties by geophysical means (seismic, imaging, ionosphere). Application of hyperspectral imaging to paleoseismology. Chair, ICSU-WDS Scientific Committee. This report is focused on one of the current main concerns of the International Council for Science (ICSU). It pertains to the first scientific conference of the World Data System (ICSU-WDS). The Proceedings of the 1st ICSU World Data System Conference, held 3–6 September 2011 at Kyoto University, Japan, contains the papers submitted to the Data Science Journal, CODATA. With the theme ‘Global Data for Global Science’, this conference was remarkably consonant with the long-term ICSU vision of
‘…a world where science is used for the benefit of all, excellence in science is valued and scientific knowledge is effectively linked to policy-making. In such a world, universal and equitable access to high quality scientific data and information is a reality and all countries have the scientific capacity to use these and to contribute to generating the new knowledge that is necessary to establish their own development pathways in a sustainable manner.’
The importance attached by ICSU to equitable access to data and information is not new. The history detailed in the report of the ad hoc Strategic Committee on Information and Data (SCID) to the 2008 ICSU General Assembly (GA) highlights the creation of the Federation of Astronomy and Geophysics data analysis Services (FAGS) and the World Data Centres (WDCs) prior to the 1958 International Geophysical Year. However, self-reviews by FAGS and WDCs—conducted after five decades of operations—highlighted the need to restructure ICSU’s data and information activities into a global system. The initial motivations, rooted in the desire of the scientific community to mitigate the fragmentation associated with the Cold War, had evaporated. Instead the focus had shifted to what was described in ICSU Committee on Data for Science and Technology (CODATA) documents, as the ‘digital divide’. So instead of facilitating an East-West exchange of scientific data and information, the need had become to develop more effective North-South exchange channels. As a result, on October 23, 2008, the ICSU GA voted to establish the ICSU World Data System, with the following charge: ‘To emphasize the critical importance of global data for global science activities; to further ICSU strategic scientific outcomes by addressing pressing societal needs (e.g. sustainable development, digital divide); to highlight the very positive impact of universal and equitable access to data and information; to support services for data and information long-term stewardship, and to promote and support data publication and citation.’
The The figure shows the various milestones met by the WDS-SC, which led to the ICSU 30th GA held in Rome approving a decision to ‘consolidate and expand the ICSU World Data System’ Since its inception, the WDS-SC agreed on an ambitious mission for WDS: to provide an International framework for (1) long-term stewardship of science-driven data and products; (2) access to, and dissemination of, quality-assessed data and information and quality-verified global data analysis services; (3) interdisciplinary integration of data (including human sciences); (4) harmonization and interoperability across disciplines, geography, and technology over time; and (5) implementation of a global community of excellence for the dissemination of data and information.
Relevant documents are all to be found on the ICSU-WDS website (www.icsu-wds.org) WDS includes data archive centres, data analysis centres, service providers, data producers and developers, observing systems and networks, and virtual observatories at scales ranging from regional, to national, to global. Recently, ICSU strongly urged WDS to expand their membership beyond the natural sciences, and to recruit members from other domains such as biodiversity and the health sciences. This confirms the long-held opinion of the WDS-SC that the architecture of WDS should evolve into a ‘scale-free system of data systems’. I chair the ICSU-WDS Scientific Committee Relevant Publications Proceedings of 1st ICSU-WDS Conference “Global Data for Global Science” Data Science Journal, Oct 2012
Walter Munk Research Professor Email address: [email protected] Phone extension: 42877 Research Interests: Physical Oceanography, Ocean Acoustics and Climate. PHYSICAL OCEANOGRAPHY. I have continued my work on sea surface roughness as related to wind drag. The relevant statistics are associated with mean square slope (not elevation). The principal contribution to slope variance is from waves shorter than 20 cm, a distinct part of the spectrum of waves shorter than the classical Phillips gravity wave spectrum. Given that so much of ocean dynamics is the result of a the variable wind drag, understanding the ultragravity (ug) waves is a first order problem in many ocean processes. Recent results are summarized in two papers: an analysis of the hydrophone measurements at the mid-Pacific H20 station on (rather surprisingly) the deep sea bottom (Farrell and Munk 2012) and a theoretical analysis (Young, Wolfe and Munk 2012), both in press. The overall situation is that there are still no good at sea direct measurements of the 2-D ug spectrum; laboratory measurements fall short regarding the surprisingly large crosswind slope components. We are left dependent on remote sensing from 500 km above and 5 km beneath the sea surface, with good enough statistics but unreliable interpretation. And we have as yet no theory for the ug wave generation. OCEAN ACOUSTICS. Measurements by P. Wadhams from an British submarine have indicated a more rapid thinning of the Arctic ice cover than previous estimates, leading possibly to an ice-free summer by 2016 (The Economist estimated by the end of the century, Special Report on the Arctic in the 16 June 2012 issue). Disappearance of the ice cover and the attendant drop in polar albedo has first order consequences that should be monitored during the transition decade. We will study various schemes of polar tomography, possibly involving a polar source and peripheral receivers, with the acoustic sources doing double duty for navigating gliders and AUV’s. The ongoing Philippine Sea experiment has led to developments that will be useful in the more difficult polar environment. An attractive feature is the continued collaboration with the Nansen Institute in Bergen. I have worked on the acoustic properties of the ocean wedge between the sea floor and a floating ice sheet, stretching from the continental grounding line to the ice front (for several hundred kilometers in the Ross Sea). These are the only ocean volumes not yet visited by men. Work is being done to lower instruments through holes drilled through the ice sheets, and by launching AUV’s from the ice edge into the interior cavern. Navigation is difficult; GPS is not available under the ice cover. I have been working on a scheme for augmenting these efforts with an application of ocean acoustic tomography to the ocean caverns. Acoustic transponder arrays would be deployed just seaward of the ice edge radiating into the cavern. It is a known (but not well known) property of wedge-like caverns that acoustic rays are refracted away from the wedge apex back to the wedge opening (just as they are refracted away from the deep waters of the polar ocean back towards the surface). The broad Ross Sea ice shelf has the ideal geometry for such an experiment. For logistic reasons it is more likely it would take place in the arctic, and required acoustic receivers lowered through the ice sheet near the grounding line.
CLIMATE. The principal cause of the global sea level rise is the melting of Antarctic and Greenland ice sheets floating on a relatively warm ocean; melting at the ice surface is a secondary consideration (This is a change from the accepted viewpoint of only a decade ago). Thermal expansion of the warming ocean is also a lesser factor. An acoustic under-the-ice experiment could led to an understanding the melting processes and hopefully the IPCC prediction for the rise in global sea level by the year 2100 is 0.3 to 2 meters. The error bars are so large as to make the prediction almost useless. A 1m rise would require the repopulation of more than 1 million people! Accordingly the global rise in sea level has been declared a national security issue. Relevant Publications Munk. W. (2009) An Inconvenient Sea-Truth: Spread, Steepness and Skewness of Surface
Slopes. Annual Review of Marine Science, 1: 377–415, 10.1146/annurev.marine.010908.163940.
von Storch, H. and K. Hasselman (2010) Seventy Years of Exploration in Oceanography: A
Prolonged Weekend Discussion. Heidelberg, Germany: Springer, 137 pp. Farrell, W. and W. Munk, (2010). Booms and Busts in the Deep. Journal of Physical
Oceanography, 40, 2159-2169. Worcester, P. F., W. H. Munk, B. D. Cornuelle, M. A. Dzieciuch, and K. E. Wage (2012),
Exploring an under-ice ocean cavity with sound, 2012 Ocean Sciences Meeting, Salt Lake City, Utah, 20–24 February 2012. (ORAL)
Munk, W. and C. Pendarvis (2012) Where the Swell Begins. Groundswell Publication Annual
Publication, 5, 242-257, in press. Farrell, W. and W. Munk (2012) Surface gravity waves and their acoustic signatures, 1-30 Hz,
on the mid-Pacific sea floor, JASA Special Issue, in press. Young, W.R., C.L. Wolfe, and W.H. Munk (2012) Generation of gravity-capillary waves by
instability of shear flow, J. Fluid Mech., submitted.
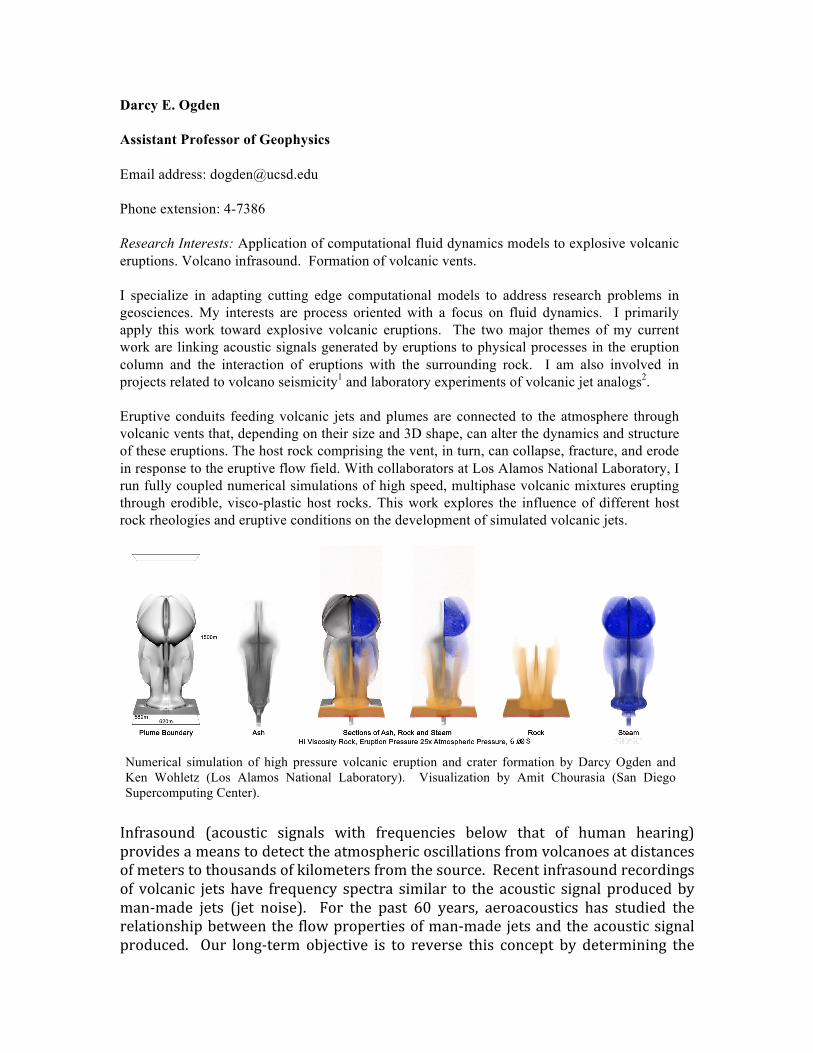
Darcy E. Ogden Assistant Professor of Geophysics Email address: [email protected] Phone extension: 4-7386 Research Interests: Application of computational fluid dynamics models to explosive volcanic eruptions. Volcano infrasound. Formation of volcanic vents. I specialize in adapting cutting edge computational models to address research problems in geosciences. My interests are process oriented with a focus on fluid dynamics. I primarily apply this work toward explosive volcanic eruptions. The two major themes of my current work are linking acoustic signals generated by eruptions to physical processes in the eruption column and the interaction of eruptions with the surrounding rock. I am also involved in projects related to volcano seismicity1 and laboratory experiments of volcanic jet analogs2. Eruptive conduits feeding volcanic jets and plumes are connected to the atmosphere through volcanic vents that, depending on their size and 3D shape, can alter the dynamics and structure of these eruptions. The host rock comprising the vent, in turn, can collapse, fracture, and erode in response to the eruptive flow field. With collaborators at Los Alamos National Laboratory, I run fully coupled numerical simulations of high speed, multiphase volcanic mixtures erupting through erodible, visco-plastic host rocks. This work explores the influence of different host rock rheologies and eruptive conditions on the development of simulated volcanic jets.
Infrasound (acoustic signals with frequencies below that of human hearing) provides a means to detect the atmospheric oscillations from volcanoes at distances of meters to thousands of kilometers from the source. Recent infrasound recordings of volcanic jets have frequency spectra similar to the acoustic signal produced by man-‐made jets (jet noise). For the past 60 years, aeroacoustics has studied the relationship between the flow properties of man-‐made jets and the acoustic signal produced. Our long-‐term objective is to reverse this concept by determining the
Numerical simulation of high pressure volcanic eruption and crater formation by Darcy Ogden and Ken Wohletz (Los Alamos National Laboratory). Visualization by Amit Chourasia (San Diego Supercomputing Center).
flow properties of volcanic jets based on the infrasound signal produced by the eruption. As a first step toward that goal, my research group is using a combination of analytical and computational models to adapt empirical man-‐made jet noise results from aeroacoustics to the more complex volcanic jet system. Relevant Publications 1. Dunham, E. M. & D. E. Ogden, 2012. Guided waves along fluid-filled cracks in elastic solids and instability at high flow rates, J. Applied Mechanics, 79(3), doi:10.1115/1.4005961. 2. Ogden, D.E. & N.H. Sleep, 2012. Explosive eruption of coal and basalt and the End Permian mass extinction. Proceedings of the National Academy of Sciences, 109, 59-62. 3. Ogden, D.E., 2011. Fluid dynamics in explosive volcanic vents and craters. Earth & Planetary Science Letters. 312, 401-410. 4. Saffaraval, F., Solovitz, S. A., Ogden, D. E., & Mastin, L. G., 2012. Impact of Reduced Near-Field Entrainment of Overpressured Volcanic Jets on Plume Development. J. Geophysical Research, 117, doi:10.1029/2011JB008862.
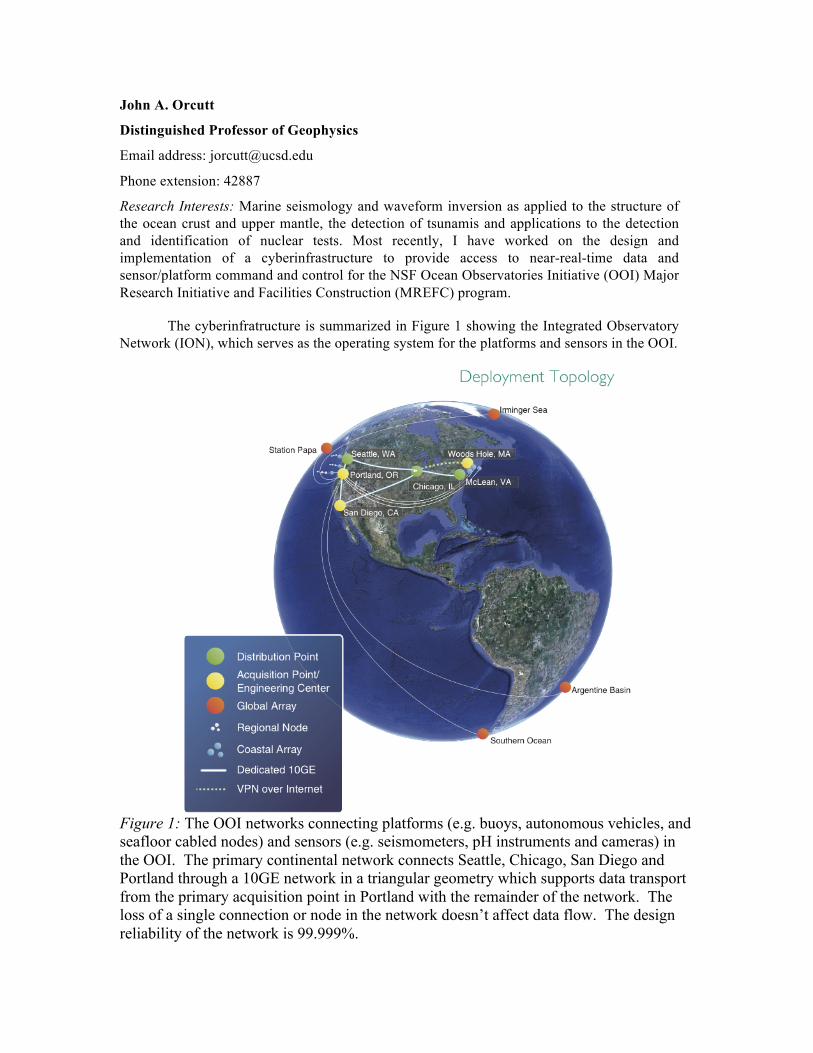
John A. Orcutt
Distinguished Professor of Geophysics
Email address: [email protected]
Phone extension: 42887
Research Interests: Marine seismology and waveform inversion as applied to the structure of the ocean crust and upper mantle, the detection of tsunamis and applications to the detection and identification of nuclear tests. Most recently, I have worked on the design and implementation of a cyberinfrastructure to provide access to near-real-time data and sensor/platform command and control for the NSF Ocean Observatories Initiative (OOI) Major Research Initiative and Facilities Construction (MREFC) program.
The cyberinfratructure is summarized in Figure 1 showing the Integrated Observatory Network (ION), which serves as the operating system for the platforms and sensors in the OOI.
Figure 1: The OOI networks connecting platforms (e.g. buoys, autonomous vehicles, and seafloor cabled nodes) and sensors (e.g. seismometers, pH instruments and cameras) in the OOI. The primary continental network connects Seattle, Chicago, San Diego and Portland through a 10GE network in a triangular geometry which supports data transport from the primary acquisition point in Portland with the remainder of the network. The loss of a single connection or node in the network doesn’t affect data flow. The design reliability of the network is 99.999%.
The ION provides direct connectivity between platforms and sensors on the network; in figure 1, the light connections rely upon satellite telemetry using the Iridium constellation. In the ION portion of the OOI, only Layers 1 (physical layer) and 2 (IP layer) are used eschewing the use of FTP or HTTP in Layer 3. Rather, communications to and from instruments and platforms rely upon message passing for communications using a protocol named Advanced Message Queuing Protocol (AMQP) to increase security, provide routing and speeding communications. Peering points at Seattle and Chicago connect the ION to the public Internet at high speeds. The data sensed by the OOI are openly available in near-real-time (latencies of 1s or more depending upon connectivity. Satellite communications can be delayed by minutes to hours. A scientist or science team can subscribe to data streams consistent with scientific interests and/or extract data from files, which are archived as is current practice. In addition, users can introduce data or models into the OOI to take advantage of OOI storage and distribution capabilities. Since connections to sensors and platforms are duplex, ION allows a user to control the system from a distance. For example, an autonomous vehicle can be directed to a new waypoint or a sample rate can be changed to collect higher bandwidth data in response to an event. In January 2013, the cyberinfrastructure program and approximately 40 of its employees will be moved into IGPP’s newest space in the Eckart Library’s first floor from the California Institute for Telecommunications and Information Technology (Calit2) on the general campus. Relevant Publications
Laske, G., J. P. Morgan, J. A. Orcutt (2007). “The Hawaiian SWELL pilot experiment—Evidence for lithosphere rejuvenation from ocean bottom surface wave data,” in Foulger, G. R. and D. M. Jurdy, eds., Plates, plumes, and planetary processes: Geol. Soc. of America Special Paper 430, 209-233. 10.1130/2007.2430(11).
Arrott, M., A. D. Chave, C. Farcas, E. Farcas, J. E. Kleinert, I. Krueger, M. Meisinger, J. A. Orcutt, C. Peach, O. Schofield, M. P. Singh, F. L. Vernon (2009). “Integrating marine observatories into a system-of-systems: Messaging in the US Ocean Observatories Initiative.” IEEE Oceans, Biloxi.
Chave, A. D., M. Arrott, C. Farcas, E. Farcas, I. Krueger, M. Meisinger, J. A. Orcutt, F. L. Vernon, C. Peach, O Schofield, J. E. Kleinert (2009). “Cyberinfrastructure for the US Ocean Observatories Initiative: Enabling interactive observation in the ocean,” IEEE Oceans, Hamburg.
Singh, S. C., Harding, A. J., Kent, G. M., Sinha, M. C., Combier, V., Bazin, S.,Tong, C. H., Pye, J. W., Barton, P. J., Hobbs, R. W., White, R. S., Orcutt, J. A.. (2006). “Seismic reflection images of the Moho underlying melt sills at the East Pacific Rise.” Nature 442: 287-290.
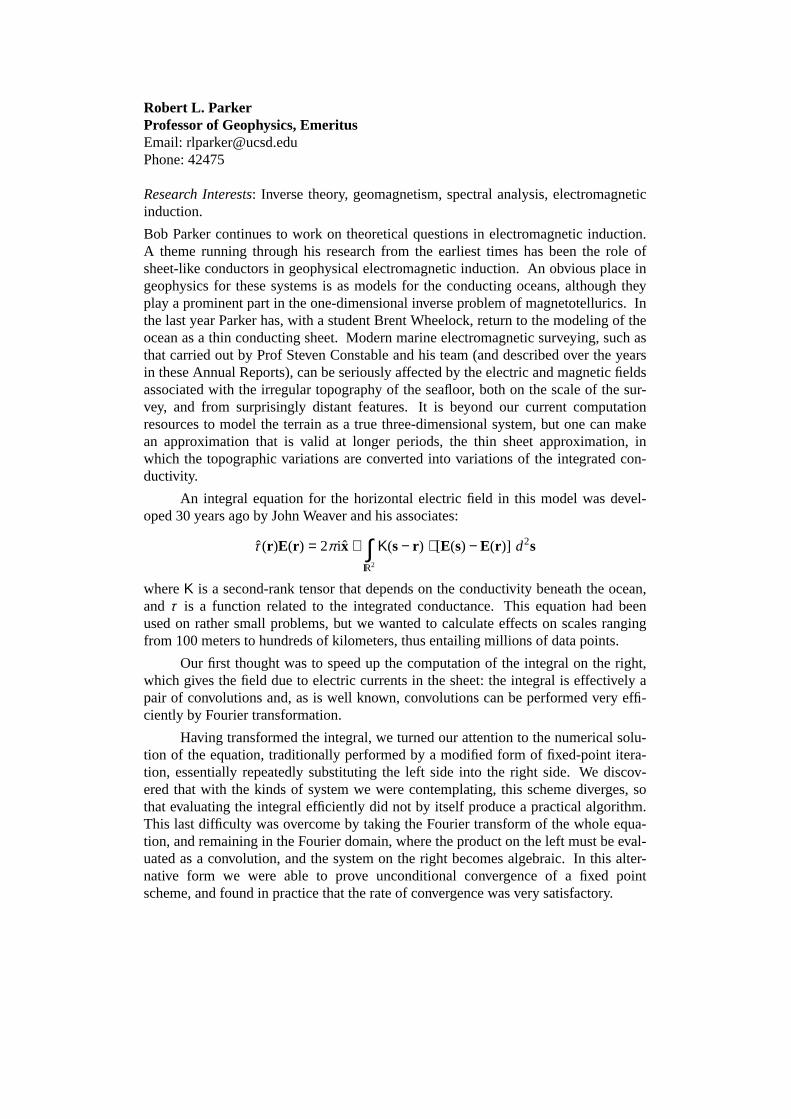
Robert L. ParkerProfessor of Geophysics, EmeritusEmail: [email protected]: 42475
Research Interests: Inv erse theory, geomagnetism, spectral analysis, electromagneticinduction.
Bob Parker continues to work on theoretical questions in electromagnetic induction.A theme running through his research from the earliest times has been the role ofsheet-like conductors in geophysical electromagnetic induction. An obvious place ingeophysics for these systems is as models for the conducting oceans, although theyplay a prominent part in the one-dimensional inverse problem of magnetotellurics.Inthe last year Parker has, with a student Brent Wheelock, return to the modeling of theocean as a thin conducting sheet.Modern marine electromagnetic surveying, such asthat carried out by Prof Steven Constable and his team (and described over the yearsin these Annual Reports), can be seriously affected by the electric and magnetic fieldsassociated with the irregular topography of the seafloor, both on the scale of the sur-vey, and from surprisingly distant features.It is beyond our current computationresources to model the terrain as a true three-dimensional system, but one can makean approximation that is valid at longer periods, the thin sheet approximation, inwhich the topographic variations are converted into variations of the integrated con-ductivity.
An integral equation for the horizontal electric field in this model was devel-oped 30 years ago by John Weaver and his associates:
τ (r)E(r) = 2π ix +IR2
∫ K(s − r) ⋅ [E(s) − E(r)] d2s
whereK is a second-rank tensor that depends on the conductivity beneath the ocean,and τ is a function related to the integrated conductance.This equation had beenused on rather small problems, but we wanted to calculate effects on scales rangingfrom 100 meters to hundreds of kilometers, thus entailing millions of data points.
Our first thought was to speed up the computation of the integral on the right,which gives the field due to electric currents in the sheet: the integral is effectively apair of convolutions and, as is well known, convolutions can be performed very effi-ciently by Fourier transformation.
Having transformed the integral, we turned our attention to the numerical solu-tion of the equation, traditionally performed by a modified form of fixed-point itera-tion, essentially repeatedly substituting the left side into the right side.We discov-ered that with the kinds of system we were contemplating, this scheme diverges, sothat evaluating the integral efficiently did not by itself produce a practical algorithm.This last difficulty was overcome by taking the Fourier transform of the whole equa-tion, and remaining in the Fourier domain, where the product on the left must be eval-uated as a convolution, and the system on the right becomes algebraic.In this alter-native form we were able to prove unconditional convergence of a fixed pointscheme, and found in practice that the rate of convergence was very satisfactory.
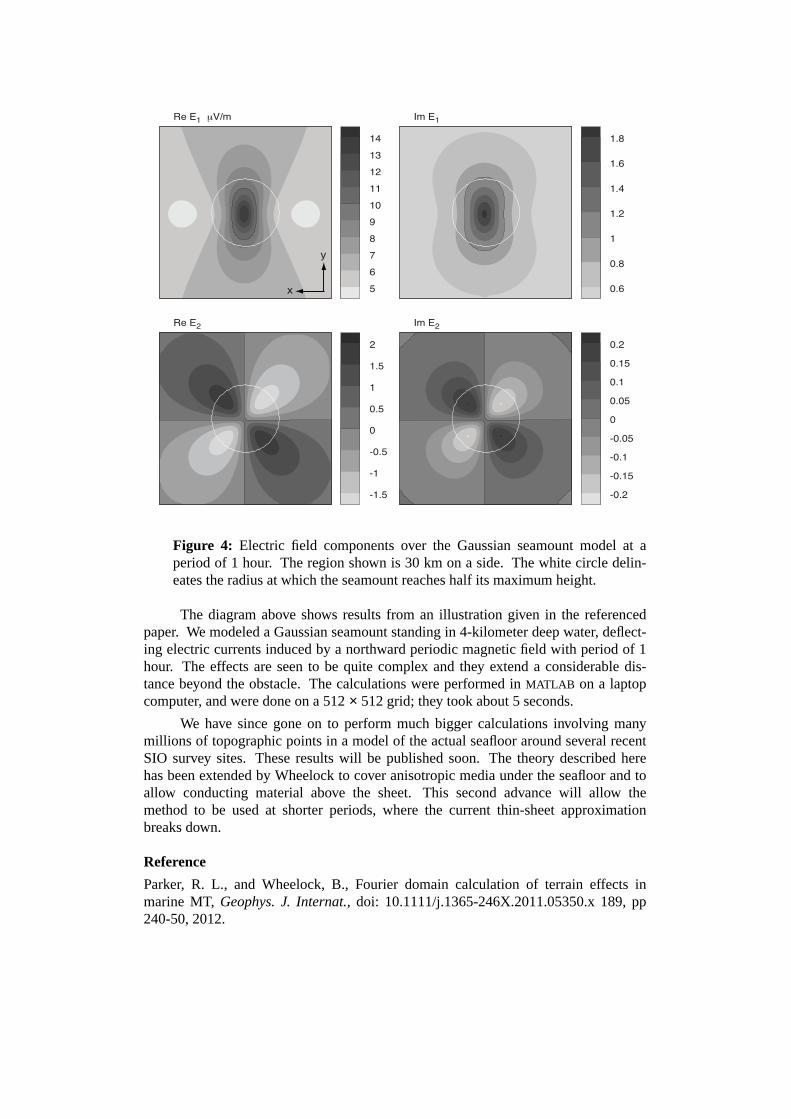
5
6
7
8
9
10
11
12
13
14
Re E1 μV/m
0.6
0.8
1
1.2
1.4
1.6
1.8
Im E1
-1.5
-1
-0.5
0
0.5
1
1.5
2
Re E2
-0.2
-0.15
-0.1
-0.05
0
0.05
0.1
0.15
0.2
Im E2
x
y
Figure 4: Electric field components over the Gaussian seamount model at aperiod of 1 hour. The region shown is 30 km on a side. The white circle delin-eates the radius at which the seamount reaches half its maximum height.
The diagram above shows results from an illustration given in the referencedpaper. We modeled a Gaussian seamount standing in 4-kilometer deep water, deflect-ing electric currents induced by a northward periodic magnetic field with period of 1hour. The effects are seen to be quite complex and they extend a considerable dis-tance beyond the obstacle. The calculations were performed inMATLAB on a laptopcomputer, and were done on a 512× 512 grid; they took about 5 seconds.
We hav esince gone on to perform much bigger calculations involving manymillions of topographic points in a model of the actual seafloor around several recentSIO survey sites. Theseresults will be published soon. The theory described herehas been extended by Wheelock to cover anisotropic media under the seafloor and toallow conducting material above the sheet. This second advance will allow themethod to be used at shorter periods, where the current thin-sheet approximationbreaks down.
Reference
Parker, R. L., and Wheelock, B., Fourier domain calculation of terrain effects inmarine MT, Geophys. J. Internat., doi: 10.1111/j.1365-246X.2011.05350.x 189, pp240-50, 2012.
David T. Sandwell Professor of Geophysics email: [email protected] http://topex.ucsd.edu Research Interests: Geodynamics, global bathymetry, crustal motion modeling
Students and Funding - Research for the 2012 academic year was focused on understanding the dynamics of the crust and lithosphere. Our group comprises four graduate students Karen Luttrell (now at USGS), Xiaopeng Tong, Soli Garcia, and Eric Xu. Our research on improvement in the marine gravity field from CryoSat, Envisat, and Jason-1 is co-funded by the National Science Foundation (NSF) and the Office of Naval Research. The NSF EarthScope Program funds our investigation of the strain rate and moment accumulation rate along the San Andreas Fault System from InSAR and GPS. In addition, we receive funding from the Southern California Earthquake Center for GPS field investigations along the Imperial and Cerro Prieto faults in Baja Mexico (Figure 1).
Global Gravity and Bathymetry – Three new satellite altimeters are currently measuring the global marine gravity field with superb accuracy and spatial coverage. Over the next few years we expect a factor of 2-4 improvement in the accuracy of the marine gravity field. This will reveal previously unknown tectonics in the deep oceans as well as thousands of uncharted seamounts.
Integration of Radar Interferometry and GPS - We are developing methods to
combine the high accuracy of point GPS measurements with the high spatial resolution from radar interferometry to measure interseismic velocity along the San Andreas Fault system (Tong et al., 2012). We analyzed InSAR observations, initially from ALOS ascending data, spanning from the middle of 2006 to the end of 2010, totaling more than 1100 interferograms. The final InSAR line-of-sight data match the point GPS observations with a mean absolute deviation of 1.3 mm/yr. These combined GPS/InSAR data are critical for understanding the along-strike variations in stress accumulation rate and associated earthquake hazard. The InSAR processing was performed with a new software called GMTSAR developed at SIO (http://topex.ucsd.edu/gmtsar).
Crustal Motion Modeling – Xiaopeng Tong and Bridget Konter-Smith (at the
University of Texas, El Paso) are refining a semi-analytic earthquake cycle model for the deformation of western North America using crustal velocity measurements from the growing array of continuous GPS stations and InSAR acquisitions (Tong et al., 2012). This model will be used to estimate the seismic moment accumulation rates along the fault system.
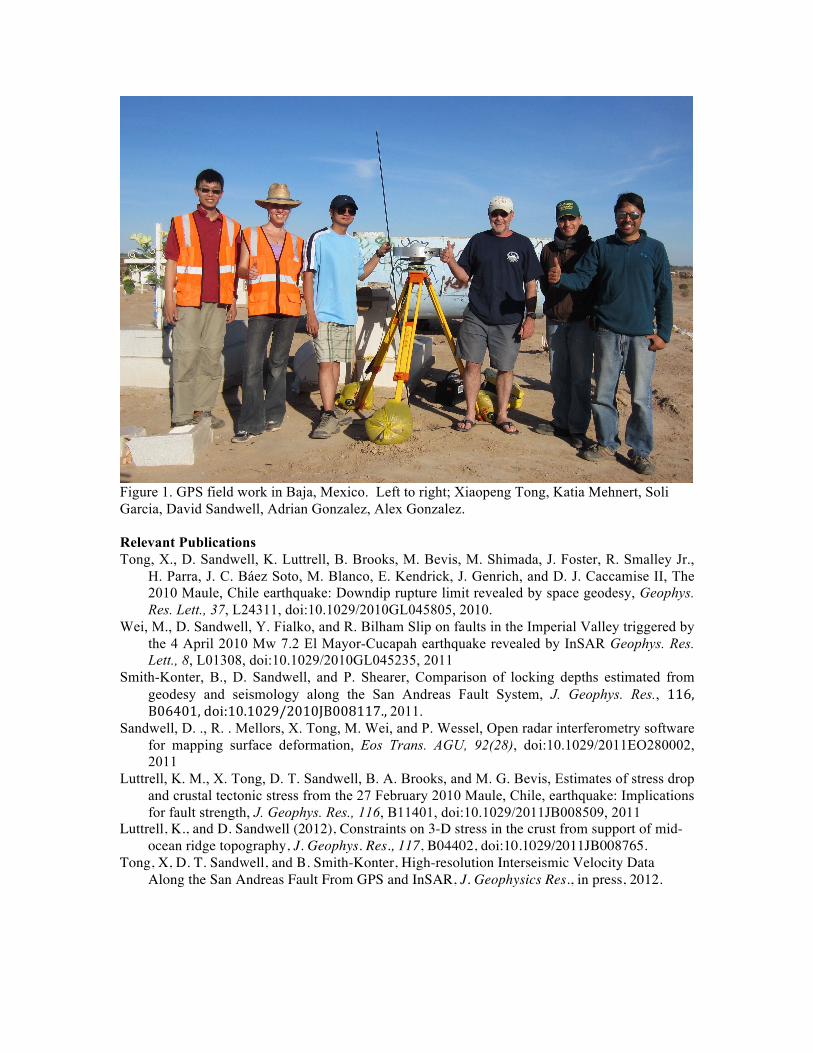
Figure 1. GPS field work in Baja, Mexico. Left to right; Xiaopeng Tong, Katia Mehnert, Soli Garcia, David Sandwell, Adrian Gonzalez, Alex Gonzalez. Relevant Publications Tong, X., D. Sandwell, K. Luttrell, B. Brooks, M. Bevis, M. Shimada, J. Foster, R. Smalley Jr.,
H. Parra, J. C. Báez Soto, M. Blanco, E. Kendrick, J. Genrich, and D. J. Caccamise II, The 2010 Maule, Chile earthquake: Downdip rupture limit revealed by space geodesy, Geophys. Res. Lett., 37, L24311, doi:10.1029/2010GL045805, 2010.
Wei, M., D. Sandwell, Y. Fialko, and R. Bilham Slip on faults in the Imperial Valley triggered by the 4 April 2010 Mw 7.2 El Mayor-Cucapah earthquake revealed by InSAR Geophys. Res. Lett., 8, L01308, doi:10.1029/2010GL045235, 2011
Smith-Konter, B., D. Sandwell, and P. Shearer, Comparison of locking depths estimated from geodesy and seismology along the San Andreas Fault System, J. Geophys. Res., 116, B06401, doi:10.1029/2010JB008117., 2011.
Sandwell, D. ., R. . Mellors, X. Tong, M. Wei, and P. Wessel, Open radar interferometry software for mapping surface deformation, Eos Trans. AGU, 92(28), doi:10.1029/2011EO280002, 2011
Luttrell, K. M., X. Tong, D. T. Sandwell, B. A. Brooks, and M. G. Bevis, Estimates of stress drop and crustal tectonic stress from the 27 February 2010 Maule, Chile, earthquake: Implications for fault strength, J. Geophys. Res., 116, B11401, doi:10.1029/2011JB008509, 2011
Luttrell, K., and D. Sandwell (2012), Constraints on 3-D stress in the crust from support of mid-ocean ridge topography, J. Geophys. Res., 117, B04402, doi:10.1029/2011JB008765.
Tong, X, D. T. Sandwell, and B. Smith-Konter, High-resolution Interseismic Velocity Data Along the San Andreas Fault From GPS and InSAR, J. Geophysics Res., in press, 2012.
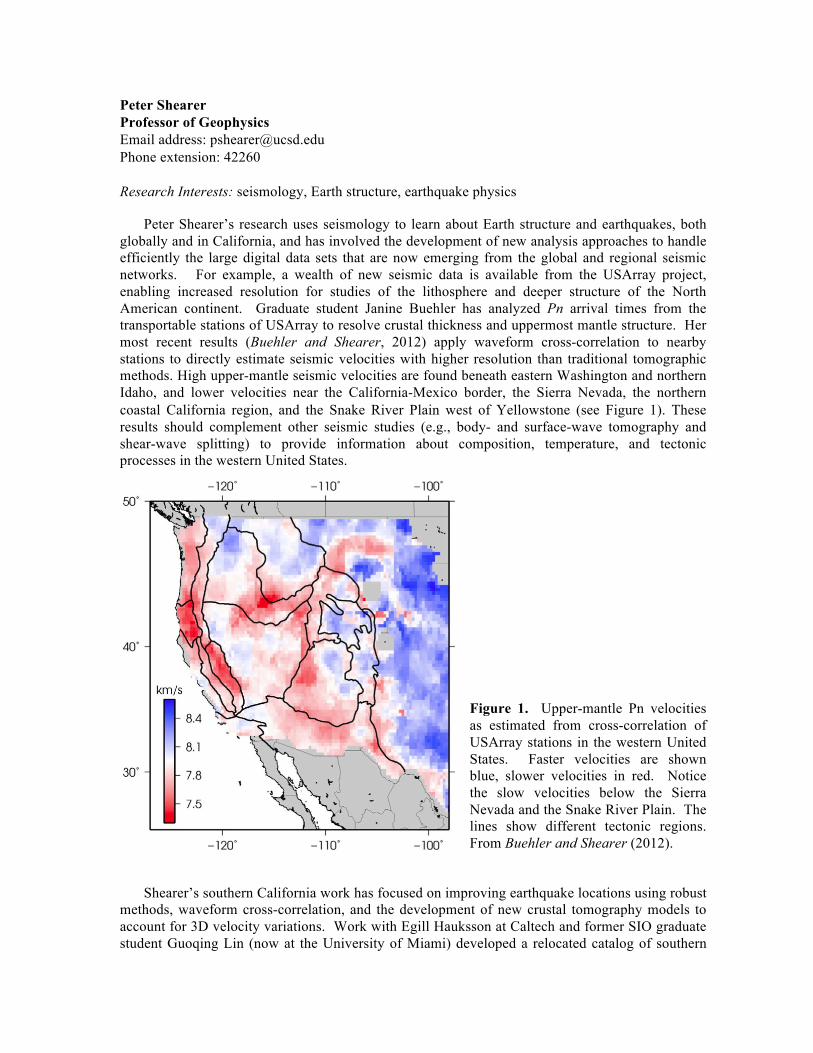
Peter Shearer Professor of Geophysics Email address: [email protected] Phone extension: 42260 Research Interests: seismology, Earth structure, earthquake physics
Peter Shearer’s research uses seismology to learn about Earth structure and earthquakes, both globally and in California, and has involved the development of new analysis approaches to handle efficiently the large digital data sets that are now emerging from the global and regional seismic networks. For example, a wealth of new seismic data is available from the USArray project, enabling increased resolution for studies of the lithosphere and deeper structure of the North American continent. Graduate student Janine Buehler has analyzed Pn arrival times from the transportable stations of USArray to resolve crustal thickness and uppermost mantle structure. Her most recent results (Buehler and Shearer, 2012) apply waveform cross-correlation to nearby stations to directly estimate seismic velocities with higher resolution than traditional tomographic methods. High upper-mantle seismic velocities are found beneath eastern Washington and northern Idaho, and lower velocities near the California‐Mexico border, the Sierra Nevada, the northern coastal California region, and the Snake River Plain west of Yellowstone (see Figure 1). These results should complement other seismic studies (e.g., body- and surface-wave tomography and shear-wave splitting) to provide information about composition, temperature, and tectonic processes in the western United States.
Figure 1. Upper-mantle Pn velocities as estimated from cross-correlation of USArray stations in the western United States. Faster velocities are shown blue, slower velocities in red. Notice the slow velocities below the Sierra Nevada and the Snake River Plain. The lines show different tectonic regions. From Buehler and Shearer (2012).
Shearer’s southern California work has focused on improving earthquake locations using robust methods, waveform cross-correlation, and the development of new crustal tomography models to account for 3D velocity variations. Work with Egill Hauksson at Caltech and former SIO graduate student Guoqing Lin (now at the University of Miami) developed a relocated catalog of southern
California seismicity from 1981 to 2005 (the LSH catalog) that is now widely used by other researchers. A newer version of the catalog that goes through mid 2011 is described in Hauksson et al. (2012). Graduate student Xiaowei Chen has used these precise locations to study earthquake swarms in southern California, and has identified spatial migration of seismicity consistent with fluid diffusion in the crust (Chen et al., 2012). Gradate student Laura Sumiejski studied similar event clusters in the catalog to constrain temporal variations in scattering properties of the crust (Sumiejski and Shearer, 2012). Shearer has also been exploring the statistics of earthquake clustering at all scales, finding that the recent global swarm of very large (M > 8) earthquakes is not statistically distinguishable from a random process (Shearer and Stark, 2012) and that the earthquake clustering seen at small scales in southern California cannot entirely be explained with standard aftershock triggering models (Shearer, 2012a,b), suggesting that underlying physical changes, such as fluid flow or slow slip, are triggering some earthquake sequences.
Shearer has also pioneered new approaches to imaging large earthquake ruptures, including the waveform back-projection method that is now widely applied by different groups following major earthquakes. Work with Peter Gerstoft and postdoc Huajian Yao used USArray stations to image the 2011 M 9 Tohoku earthquake in Japan and mapped a large and complicated rupture, with lower-frequency energy being radiated mostly from the shallow part of the fault near the trench and high-frequency energy more from the deeper part of the fault closer to the Japanese coast (Yao et al., 2011; Yao et al., 2012). Array processing methods were also used by postdoc Jian Zhang to resolve the frequency dependence of tremor observed in Cascadia, finding that, contrary to previous studies, its high-frequency falloff is similar to that seen for earthquakes (Zhang et al., 2011). Recent Publications
Zhang, J., P. Gerstoft, P. M. Shearer, H. Yao, J. E. Vidale, H. Houston, and A. Ghosh, Cascadia tremor spectra: low corner frequencies and earthquake-like high-frequency falloff, Geochem. Geophys. Geosys., 12, doi: 10.1029/2011GC003759, 2011.
Yao, H., P. Gerstoft, P. M. Shearer, and C. Mecklenbräuker, Compressive sensing of the Tohuku-Oki Mw 9.0 earthquake: Frequency-dependent rupture modes, Geophys. Res. Lett., 38, doi:10.1029/2011GL049223, 2011.
Earle, P. S., S. Rost, P. M. Shearer, and C. Thomas, Scattered P'P' waves observed at short distances, Bull. Seismol. Soc. Am., 101, 2843–2854, doi: 10.1785/0120110157, 2011.
Shearer, P. M., and P. B. Stark, Global risk of big earthquakes has not recently increased, Proc. Nat. Acad. Sci., 109, 717–721, www.pnas.org/cgi/doi/10.1073/pnas.1118525109, 2012.
Sumiejski, P. E., and P. M. Shearer, Temporal stability of coda Q-1 in southern California, Bull. Seismol. Soc. Am., 102, 873–877, doi: 10.1785/0120110181, 2012.
Chen, X., P. M. Shearer, and R. E. Abercrombie, Spatial migration of earthquakes within seismic clusters in Southern California: Evidence for fluid diffusion, J. Geophys. Res., 117, B04301, doi:10.1029/2011JB008973, 2012.
Shearer, P. M., Self-similar earthquake triggering, Båth’s law, and foreshock/aftershock magnitudes: Simulations, theory, and results for southern California, J. Geophys. Res., 117, B06310, doi: 10.1029/2011JB008957, 2012a.
Yao, H., P. M. Shearer and P. Gerstoft, Subevent location and rupture imaging using iterative backprojection for the 2011 Tohoku Mw 9.0 earthquake, Geophys. J. Int., 190, 1152–1168, doi: 10.1111/j.1365-246X.2012.05541.x, 2012.
Buehler, J. S. and P. M. Shearer, Localized imaging of the uppermost mantle with USArray Pn data, J. Geophys. Res., 117, B09305, doi: 10.1029/2012JB009433, 2012.
Hauksson, E., W. Yang and P. M. Shearer, Waveform relocated earthquake catalog for southern California (1981 to June 2011), Bull. Seismol. Soc. Am., 102, 2239–2244, doi: 10.1785/0120120010, 2012.
Shearer, P.M., Space-time clustering of seismicity in California and the distance dependence of earthquake triggering, J. Geophys. Res., 117, B10306, doi: 10.1029/2012JB009471, 2012b.
Hubert Staudigel
Research Geologist, Lecturer
Email address: [email protected]
Phone extension: 48764
Research Interests: Seamounts, Mid-ocean Ridges, Water-Rock Interaction, Low Temperature geochemical fluxes, Volcanology, Biogeoscience, Science Education (K-16)
My long-term scientific interests aim broadly at volcanoes, how they work, exploring their impact on the geochemistry of the hydrosphere, the lithosphere and biosphere. My most recent focus aims at the biogeosciences of volcanic systems in particular seamounts and in the extreme environments of McMurdo/Antarctica. My teaching includes a field class in volcanology and I run a NSF funded (GK-12) educational program that brings graduate students into in Middle and High School classrooms in the San Diego Unified School District. References to my broader research interests and other prior work can be found in the bibliography at my website (http://earthref.org/whoswho/ER/hstaudigel/index.html)
Seamounts: Most of my recent field work focused on Loihi Seamount and seamounts in the Samoan Chain including Vailulu’u seamount. Over the last three years I coordinated a Seamount Biogeoscience Network and co-edited and wrote papers in a special volume of Oceanography on of “Mountains in the Sea”. All articles in this volume are freely available from the website of The Oceanographic Society (http://www.tos.org/oceanography/archive/23-1.html ). My papers include in particular contributions regarding the geological history and structure of seamounts (Staudigel and Clague, 2010), their role in subduction systems (Staudigel et al., 2010) and the associated deep-sea metal deposits (Hein et al., 2010). Other recent papers on seamounts include the description of microbial consortia in their hydrothermal systems (Sudek et al., 2009) and the discovery that fungi are common in these submarine systems, not unlike in terrestrial soils (Connell et al., 2009).
Microbes in Volcanoes: I study the biogeosciences of volcanoes using geological and microbiological approaches. In the geological record we study trace fossils of microbes drilling into volcanic glass. This work demonstrated that microbes are active in any ocean crust section studied to date and that these fossils can be trace back in time to the time period of the origin of life on earth 3.5 Ga ago (e.g. Staudigel et al., 2008; McLoughlin et al., 2010). Our microbiological work continues at Vailulu’u and Loihi Seamounts with the characterization and isolation of microbes from these settings (Sudek et al, 2009; Bailey et al., 2009) as well as studies of how they colonize rock surfaces and how they may dissolve volcanic glass (Templeton et al, 2010). My work on microbe-basalt interaction now focuses on extreme environments of the McMurdo area in Antarctica, including volcanic terrains in the Royal Society Range, the Dry Valleys, and in particular on Mt Erebus on Ross Island. Details of this work can be found on in an on-line lecture I gave at the Birch Aquarium http://www.uctv.tv/search-details.aspx?showID=16074 and our Antarctica Expedition website (http://earthref.org/ERESE/projects/GOLF439/index.html).
Teaching: I am teaching SIO 239, an introduction to geological field methods for Geophysicists and, in collaboration with Cheryl Peach, I am also running a NSF educational program for graduate students to work with K-12 students (“GK-12”). This program, the “Scripps Classroom Connection” (“SCC”; http://earthref.org/SCC/ ) offers nine graduate
fellowships to Scripps graduate students each year to improve their communication skills by teaching in middle and high school classrooms. Fellows receive full support for an overall 1/3rd effort in SCC, including a four week Summer Institute and the teaching in classrooms during the school year. Fellows are chosen from all science sections at Scripps.
Recent Publications
Connell, L., A. Templeton, A. Barrett, and H. Staudigel (2009) Diverse fungal consortia associated with an active deep sea volcano: Vailulu’u Seamount, Samoa. Geomicrobiology Journal, Volume 26, 597-605.
Hein, J.R., T.A. Conrad, and H. Staudigel, 2010, Seamount Mineral Deposits: A Source of Rare Metals for High-Technology Industries Oceanography 23-1, 184-189,
Jackson, M. G., Hart, S. R., Konter, J. G., Koppers, A. A. P., Staudigel, H., Kurz, M. D., Blusztajn, J., and Sinton, J.M., 2010, Samoan hot spot track on a "hot spot highway": Implications for mantle plumes and a deep Samoan mantle source. Geochemistry Geophysics Geosystems, 11. Q12009, DOI; 12 10.1029/2010gc003232.
Koppers Anthony A. P., Russell, J. A., Roberts, J., Jackson, M. G., Konter, J. G., Wright, D. J., Staudigel, H., and Hart, S.R., 2011, Age systematics of two young en echelon Samoan volcanic trails. Geochemistry Geophysics Geosystems, Vol. 12, Q12009, DOI; 12 10.1029/2010gc003232.
McLoughlin, N., H. Staudigel, H. Furnes. B. Eickmann and M. Ivarsson (2010) Mechanisms of microtunneling in rock substrates: distinguishing endolithic biosignatures from abiotic microtunnels, Geobiology, 8, 245–255 DOI: 10.1111/j.1472-4669.2010.00243.x
Sudek, L.A. , Alexis S. Templeton, Bradley M. Tebo and Hubert Staudigel (2009) Microbial Ecology of Fe (hydr)oxide Mats and Basaltic Rock from Vailulu’u Seamount, American Samoa, Geomicrobiology Journal, Volume 26, 581-596
Staudigel H., and D.A. Clague, 2010, The Geological History of Deep-Sea Volcanoes: Biosphere, Hydrosphere, and Lithosphere Interactions., Oceanography 23-1, 58-71.
Staudigel, H., A.A.P. Koppers, J.W. Lavelle, T.J. Pitcher and T.M. Shank (eds. 2010). Mountains in the Sea. Oceanography 23(1): 16-227
Staudigel, H., A.A.P. Koppers, T.A. Plank, and B.B. Hanan, 2010, 176-181.Seamounts in the Subduction Factory Oceanography 23-1, 176-181
Templeton, A. S., E. J. Knowles, D. L. Eldridge, B. W. Arey, A. C. Dohnalkova, S. M. Webb, B. E. Bailey, B. M. Tebo and H. Staudigel, 2009, A seafloor microbial biome hosted within incipient ferromanganese crusts., Nature Geoscience, 2, 872-876.
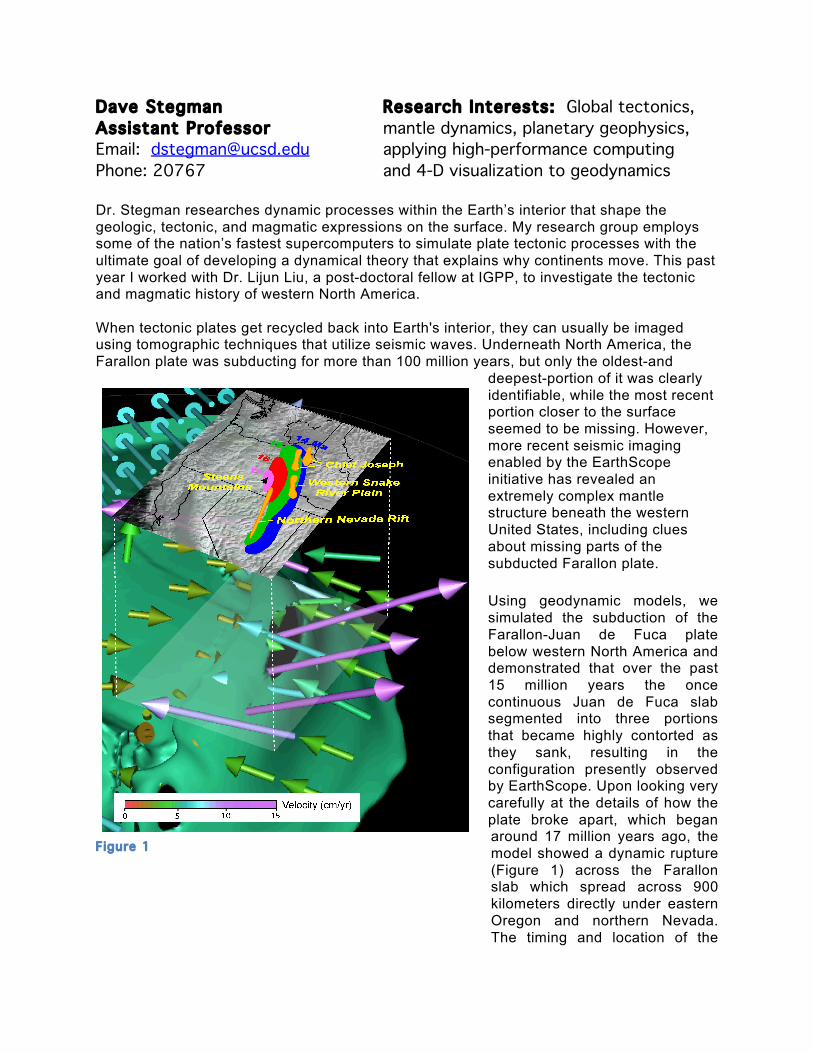
Dave Stegman Research Interests: Global tectonics, Assistant Professor mantle dynamics, planetary geophysics, Email: [email protected] applying high-performance computing Phone: 20767 and 4-D visualization to geodynamics Dr. Stegman researches dynamic processes within the Earth’s interior that shape the geologic, tectonic, and magmatic expressions on the surface. My research group employs some of the nation’s fastest supercomputers to simulate plate tectonic processes with the ultimate goal of developing a dynamical theory that explains why continents move. This past year I worked with Dr. Lijun Liu, a post-doctoral fellow at IGPP, to investigate the tectonic and magmatic history of western North America. When tectonic plates get recycled back into Earth's interior, they can usually be imaged using tomographic techniques that utilize seismic waves. Underneath North America, the Farallon plate was subducting for more than 100 million years, but only the oldest-and
deepest-portion of it was clearly identifiable, while the most recent portion closer to the surface seemed to be missing. However, more recent seismic imaging enabled by the EarthScope initiative has revealed an extremely complex mantle structure beneath the western United States, including clues about missing parts of the subducted Farallon plate. Using geodynamic models, we simulated the subduction of the Farallon-Juan de Fuca plate below western North America and demonstrated that over the past 15 million years the once continuous Juan de Fuca slab segmented into three portions that became highly contorted as they sank, resulting in the configuration presently observed by EarthScope. Upon looking very carefully at the details of how the plate broke apart, which began around 17 million years ago, the model showed a dynamic rupture (Figure 1) across the Farallon slab which spread across 900 kilometers directly under eastern Oregon and northern Nevada. The timing and location of the
Figure 1
rupture in the model are consistent with the sequences of volcanic activity recorded in Oregon's Columbia River flood basalt, which led us to propose an entirely new mechanism for how flood basalts can be produced. While this is an alternative to the mantle plume origin for the Columbia River Flood Basalt, mantle plumes are still favored as the likely mechanism for other flood basalts around the world, such as the Deccan Traps in India. In another study, I worked with Dr. Fabio Capitanio and others to produce computer simulations that showed how mountain ranges are built by plate tectonics. Existing theories of plate tectonics have failed to explain several features of how the Andes, the world's longest mountain chain stretches along the entire west coast of South America, were formed. For example, although subduction began 125 million years ago, the Andes only began to form 45 million years ago. The new model we developed not only explains the timing of the Andes formation, but also some unique features such as the curvature of the mountain chain and the development of the Eastern Cordillera and Altiplano-Puna Plateau (Figure 2).
Publications for 2011-2012 Liu, L. and D.R. Stegman. "Onset of Columbia River flood basalt controlled by propagating rupture of the Farallon slab”, Nature, 482, 7385, 386-389 doi:10.1038/nature10749, 2012. Liu, L. and D.R. Stegman. "Segmentation of the Farallon Slab" Earth and Planetary Science Letters, 311, 1-2, 1-10, 2011. Capitanio, F.A., C. Faccenna, S. Zlotnik, and D.R. Stegman. “Subduction dynamics and the origin of Andean orogeny and Bolivian Orocline”, Nature, 480, 7375, 10.1038/nature10596, 2011. Schellart, W.P., D.R. Stegman, R.J. Farrington, and L. Moresi. "Influence of lateral slab edge distance on plate velocity, trench velocity and subduction partitioning" J. Geophysical Research - Solid Earth , 116, B10408, doi:10.1029/2011JB008535, 2011.
Figure 2: Computer simulation of the Andes mountain range forming along the western margin of the South American continent. Arrows show velocity of the mantle flow and color- shaded contours depict the topography of the model as determined by the vertical stress. A high central peak is shown where the oldest oceanic plate is subducting under the thickest continental l ithosphere, which tapers to lower elevations to the north and south.
Frank VernonResearch ScientistEmail address: [email protected] extension: 45537
Research Interests: Real-Time Sensor Networks, Ocean Observing Systems Time Series Analysis, Earthquake Source Physics, Seismic Instrumentation
We operate the USArray Array Network Facility (http://anf.ucsd.edu), which is a key component for the NSF EarthScope MRE. This network currently has 434 Transportable Array (TA)seismic stations delivering real-time data to UCSD, which are redistributed to multiple sites. The ANF is responsible for real-time state-of-health monitoring for the network in addition to the real time data processing, archiving, and distribution. Data are acquired over multiple types of communication links including wireless, satellite, and wired networks. The large volumes of broad band waveform data from the transportable array element of
USArray offers a unique opportunity for seismic imaging. Constraining structures on a range of length scales and understanding their physical and chemical causes is a prerequisite for understanding the relationship between near surface and deeper mantle processes. With existing methods, we can produce 3-D models of P wavespeed variations in the mantle beneath North America using travel times from the USArray TA . This is just one example of the many scientific opportunities provided by this unique experiment.
Starting in 2010 we augmented the TA with real-time infrasound sensing elements. This continuously sampled infrasound array, at an unprecedented scale, provides opportunities for groundbreaking and interdisciplinary research in atmospheric acoustics, atmospheric science, and seismology. Such an array samples surface air pressure with nominal 70 km station spacing, with a dynamic range of about 7 orders of magnitude, and with a sampling frequency of up to 40 Hz.
The next major observing system is the NSF MRE Ocean Observatory Initiative which started in September 2009 with the objective of deploying long term observing platforms with sensors that observe the physical, chemical, and biological attributes of the oceans in near real-time. This program is the locus of the next generation oceanographic sensor network innovation (http://ci.oceanobservatories.org/)
In southern California, my group is partipating with San Diego State, University of Southern California, and Georgia Tech in a detailed imaging of the San Jacinto Fault using multiple seismic arrays to characterize the fault zone in the subsurface. Coupled with surface outcrop and mapping of the fault zone, Seismological Research Letters Volume 83, Number 1 January/February 2012 27
ACKNOWLEDGMENTS
The authors thank the National Science Foundation for contin-ued funding of the EarthScope program, the USArray team for their superb efforts in array installation and data quality con-trol, and the Incorporated Research Institutions for Seismology for continued excellence and leadership in data storage and dis-semination. The construction and dissemination of our model updates is supported by NSF grant EAR-0951901.
REFERENCES
Burdick, S., C. Li, V. Martynov, T. Cox, J. Eakins, T. Mulder, L. Astiz, F. L. Vernon, G. L. Pavlis, and R. D. van der Hilst (2008). Upper mantle heterogeneity beneath North America from travel time tomography with global and USArray Transportable Array data. Seismological Research Letters 79, 384–390.
Burdick, S., R. D. van der Hilst, F. L. Vernon, V. Martynov, T. Cox, J. Eakins, G. H. Karasu, J. Tylell, L. Astiz, and G. L. Pavlis (2010). Model update January 2010: Upper mantle heterogeneity
AA’
B
C’C
B’
A A’
B
C’C
B’
1000 km( ±1.0%)
Figure 5. Cross-sections through MITP_USA_2011MAR. Note that the eastern parts of the cross-sections remain poorly sampled by the current data. Notable in this model is (1) refinement of high velocity anomaly related to the continental root beneath the Great Plains and (2) better resolution between the root and fragments of the Farallon slab in the transition zone.Cross-sections through MITP_USA_2011MAR.
Note that the eastern parts of the cross-sections remain poorly sampled by the current data. Notable in this model is (1) refinement of high velocity anomaly related to the continental root beneath the Great Plains and (2) better reso-lution between the root and fragments of the Farallon slab in the transition zone.
paleoseismic analysis, GPS analysis of crustal deformation, and theoretical work on seismic propagation we are working to understand how factors such as fault damage, juxtaposition of different rock types, and segmentation affect the behavior of the fault zone. Starting in 2010 we deployed the first of five linear arrays across the surface trace of the San Jacinto Fault. An additional set of free field stations have been deployed. Data are being collected in real time, and active research is being conducted on ground motion estimation in the region, properties of the seismic source, and physical properties of the fault.
Another research specialization is in spectral analysis, which has undergone a revolution with the development of sophisticated techniques in which the data are multiplied in turn by a set of tapers that are designed to maximize resolution and minimize bias. In addition to minimizing the bias while maintaining a given resolution, the multi-taper approach allows an estimate of the statistical significance of features in the power spectrum. We are developing a quadratic inverse theory that utilizes not only the spectral estimators, but also the time and frequency derivatives of the spectrum, to generate much higher resolution spectra. We are extending the theory from a univariate to a generalized multivariate theory. While the specific applications researched here are seismic, it is clear that there are other geophysical, scientific, and engineering applications that will benefit from the proposed studies.
Another result based on multitapers is are some unanticipated effects of the normal modes of the sun on engineering and scientific systems. Our results, based on extensive time-series studies of diverse data sources from operational communication and other engineered systems as well as the natural environment, show that much of the phenomena observed in space physics, including geomagnetic and ionospheric phenomena, exhibit a multitude of discrete frequencies over a wide frequency range superimposed on a noise background. We have hypothesized that these discrete frequencies can be explained in terms of the normal modes of the sun (solar theory, confirmed by data from helioseismology instruments that resolve spatial structure on the sun, shows that there are several million solar modes). That is, the normal modes of the sun are a dominant driver of the discrete frequencies that are measured in natural phenomena and also of the “noise” in engineered systems.Relevant PublicationsGary L. Pavlis, Karin Sigloch, Scott Burdick, Matthew J. Fouch, Frank L. Vernon (2012). Unraveling the geometry of the Farallon plate: Synthesis of three-dimensional imaging results from USArray. Tectonophysics. Scott Burdick, Robert D. van der Hilst, Frank L. Vernon, Vladik Martynov, Trilby Cox, Jennifer Eakins, Gulsum H. Karasu, Jonathan Tytell, Luciana Astiz, and Gary L. Pavlis ( 2012). Model Update March 2011: Upper Mantle Heterogeneity beneath North America from Traveltime Tomography with Global and USArray Transportable Array Data. Seismological Research Letters, 83, 23-28, doi:10.1785/gssrl.83.1.23Deborah L. Kane, German A. Prieto, Frank L. Vernon, and Peter M. Shearer (2011). Quantifying Seismic Source Parameter Uncertainties. Bulletin of the Seismological Society of America, 101, 535-543, doi:10.1785/0120100166 Gary L. Pavlis, Frank L. Vernon (2010). Array processing of teleseismic body waves with the USArray. Computers & Geosciences. 36, 910–920. doi:10.1016/j.cageo.2009.10.008 Thomson, D. J., L. J. Lanzerotti, F. L. Vernon, III, M. R. Lessard, and L. T. P. Smith (2007). Solar Modal Structure of the Engineering Environment. Proc. IEEE, 95,1085-1132, Doi: 10.1109/JPROC.2007.894712
Kristoffer T. Walker
Assistant Project Scientist
Email address: [email protected]
Phone extension: 40126
Research Interests: Infrasound, seismology, tectonics, array processing, propagation modeling
I’ve been working on several projects in atmospheric infrasound. One of the completed projects is the creation of the Western U.S. Infrasonic Catalog, ver. 1 (WUSIC-1; Walker et al., 2011). The USArray is in an excellent position to discover sources of infrasound in the U.S. as well as investigate problems in infrasonic propagation and atmospheric dynamics using these events in the same way that seismologists use earthquakes to study problems in seismology and geodynamics. A key interest is in studying atmospheric phenomena with infrasound. But before this can be done well, one needs to validate recent advances in the creation of time-varying atmospheric sound speed models. Arguably the best approach for this is a statistical analysis of hundreds to thousands of events recorded over many months. Toward that goal, a research assistant, Rich Shelby, and I used reverse time migration of envelope functions of 1 to 5 Hz acoustic-to-seismic coupled signals recorded by USArray to detect and locate 901 infrasonic sources in the western U.S. Rich and I have conducted a similar study using five years of data recorded by the Southern California Seismic Network. I also worked with Michael Hedlin on a study of USArray seismic recordings of infrasonic signals (Walker and Hedlin, in press). Lastly, I’ve been awarded an NSF grant with Catherine de Groot-Hedlin and Michael Hedlin to continue this work as well as detect large-scale gravity waves using the newly installed USArray infrasonic sensors.
I’ve also completed a study of a year of microbarom signals generated in the North Pacific (Walker, in press). Microbaroms are hypothesized to be the acoustic equivalent of microseisms—pressure signals with frequencies of about 0.2 Hz generated from the interaction of anti-parallel ocean wave sets. However, there has yet to be a study combining observations and theoretical modeling that has definitively tested this hypothesis. In 2010 I led a team from IGPP to install an infrasonic array in Southern California (SMIAR) and Northern California (CHIAR). In 2012 I demobilized CHIAR, but SMIAR continues to operate streaming data to IGPP via the HPWREN. The recorded data quality are of good quality, and I developed a time-progressive, frequency domain beamforming method to analyze the microbaroms recorded by these and 10 other infrasonic arrays along the North Pacific rim. Common pelagic microbarom sources that move around the North Pacific are observed during the boreal winter. Summertime North Pacific sources are only observed by western Pacific arrays, presumably a result of weaker microbarom radiation and westward stratospheric winds. A well-defined source is resolved ~2000 km off the coast of California in January 2011 that moves closer to land over several days. I developed a 3-D acoustic ray trace modeling code to correct the microbarom back azimuths for deflection by horizontal winds. For this ray tracing, I used cutting-edge range-dependent atmospheric specifications provided by 4-D ground-to-space atmospheric models. The observed source locations do not correlate with anomalies in NOAA Wave Watch 3 (NWW3) model field data. However, application of the opposing-wave, microbarom source model of Waxler and Gilbert (2006) to the NWW3 directional wave height spectra output at buoy locations within 1100 km of the western North America coastline predicts microbarom radiation in locations that correlate with observed locations (Figure 1). These results suggest that pelagic North Pacific microbarom radiation detected by infrasonic arrays during the boreal winter could be routinely used to validate NWW3 results in regions with poor sensor coverage, thereby benefiting society. Furthermore, this work suggests that NWW3, in its current form, can predict both pelagic microbarom sources and coastal microbarom sources when the opposing waves are moving parallel to the coast, which implies that NWW3 is capable of identifying a limitless supply of “ground-truthed” infrasonic sources that can be used to evaluate International Monitoring System (IMS) nuclear-
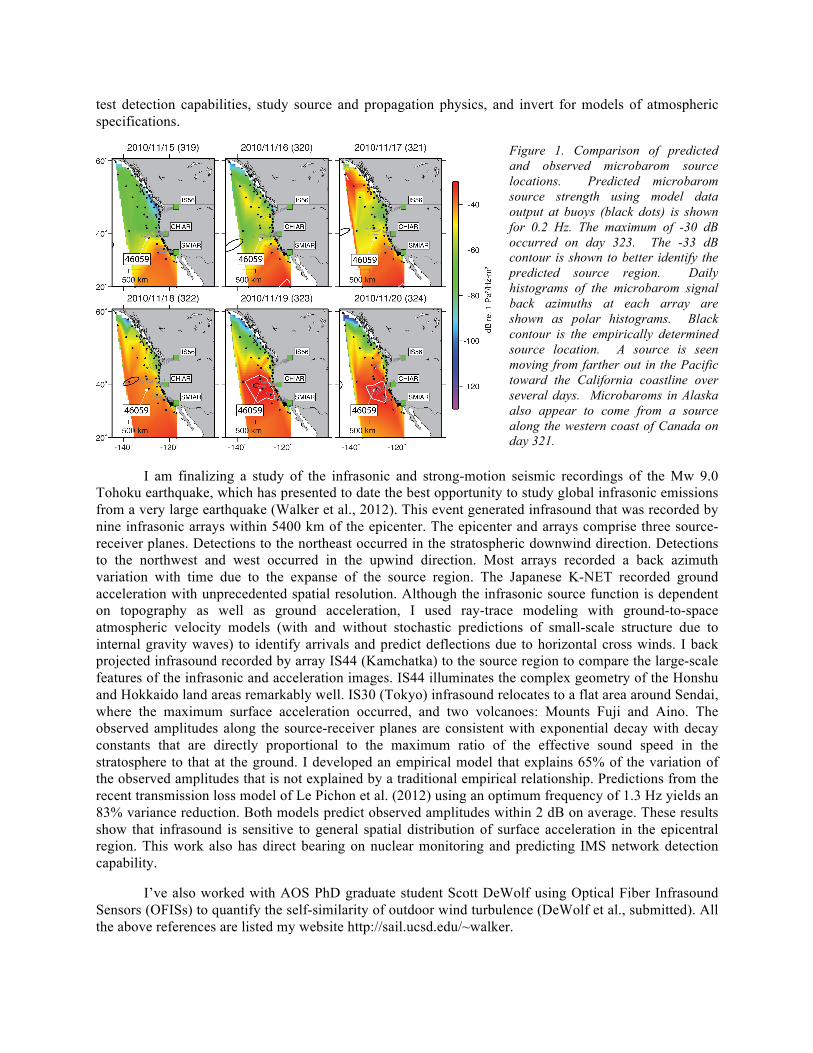
test detection capabilities, study source and propagation physics, and invert for models of atmospheric specifications.
Figure 1. Comparison of predicted and observed microbarom source locations. Predicted microbarom source strength using model data output at buoys (black dots) is shown for 0.2 Hz. The maximum of -30 dB occurred on day 323. The -33 dB contour is shown to better identify the predicted source region. Daily histograms of the microbarom signal back azimuths at each array are shown as polar histograms. Black contour is the empirically determined source location. A source is seen moving from farther out in the Pacific toward the California coastline over several days. Microbaroms in Alaska also appear to come from a source along the western coast of Canada on day 321.
I am finalizing a study of the infrasonic and strong-motion seismic recordings of the Mw 9.0 Tohoku earthquake, which has presented to date the best opportunity to study global infrasonic emissions from a very large earthquake (Walker et al., 2012). This event generated infrasound that was recorded by nine infrasonic arrays within 5400 km of the epicenter. The epicenter and arrays comprise three source-receiver planes. Detections to the northeast occurred in the stratospheric downwind direction. Detections to the northwest and west occurred in the upwind direction. Most arrays recorded a back azimuth variation with time due to the expanse of the source region. The Japanese K-NET recorded ground acceleration with unprecedented spatial resolution. Although the infrasonic source function is dependent on topography as well as ground acceleration, I used ray-trace modeling with ground-to-space atmospheric velocity models (with and without stochastic predictions of small-scale structure due to internal gravity waves) to identify arrivals and predict deflections due to horizontal cross winds. I back projected infrasound recorded by array IS44 (Kamchatka) to the source region to compare the large-scale features of the infrasonic and acceleration images. IS44 illuminates the complex geometry of the Honshu and Hokkaido land areas remarkably well. IS30 (Tokyo) infrasound relocates to a flat area around Sendai, where the maximum surface acceleration occurred, and two volcanoes: Mounts Fuji and Aino. The observed amplitudes along the source-receiver planes are consistent with exponential decay with decay constants that are directly proportional to the maximum ratio of the effective sound speed in the stratosphere to that at the ground. I developed an empirical model that explains 65% of the variation of the observed amplitudes that is not explained by a traditional empirical relationship. Predictions from the recent transmission loss model of Le Pichon et al. (2012) using an optimum frequency of 1.3 Hz yields an 83% variance reduction. Both models predict observed amplitudes within 2 dB on average. These results show that infrasound is sensitive to general spatial distribution of surface acceleration in the epicentral region. This work also has direct bearing on nuclear monitoring and predicting IMS network detection capability.
I’ve also worked with AOS PhD graduate student Scott DeWolf using Optical Fiber Infrasound Sensors (OFISs) to quantify the self-similarity of outdoor wind turbulence (DeWolf et al., submitted). All the above references are listed my website http://sail.ucsd.edu/~walker.
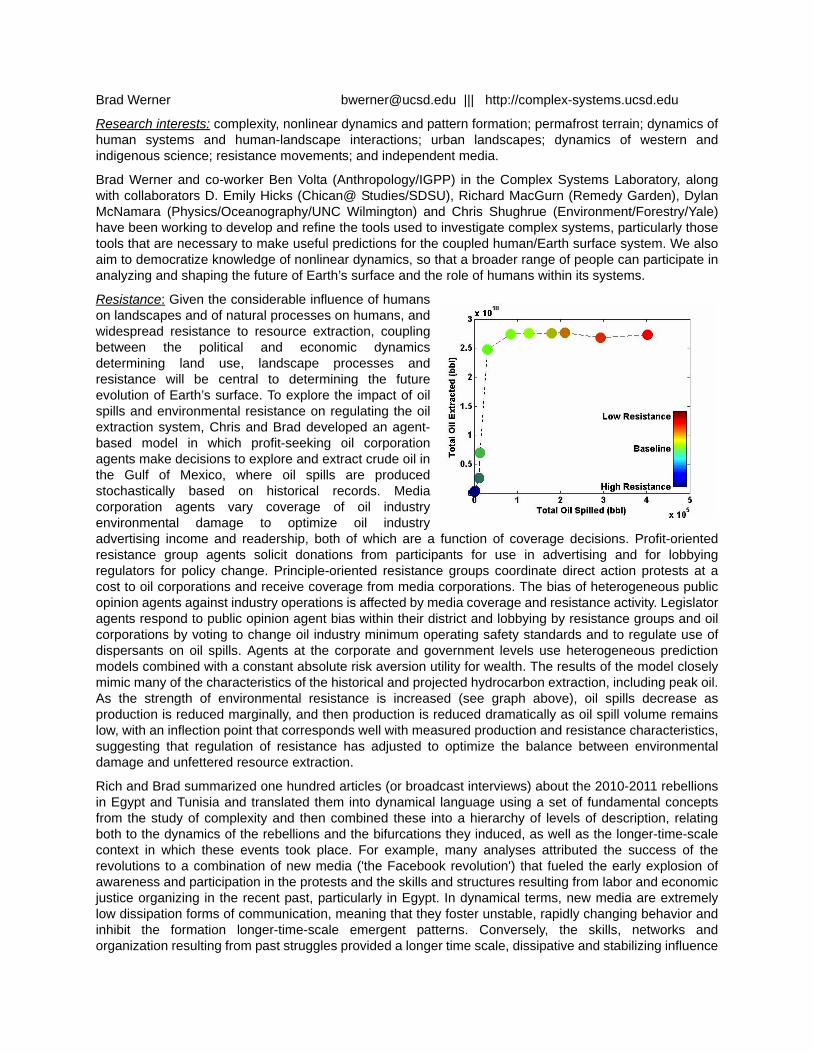
Brad Werner [email protected] ||| http://complex-systems.ucsd.edu
Research interests: complexity, nonlinear dynamics and pattern formation; permafrost terrain; dynamics ofhuman systems and human-landscape interactions; urban landscapes; dynamics of western andindigenous science; resistance movements; and independent media.
Brad Werner and co-worker Ben Volta (Anthropology/IGPP) in the Complex Systems Laboratory, alongwith collaborators D. Emily Hicks (Chican@ Studies/SDSU), Richard MacGurn (Remedy Garden), DylanMcNamara (Physics/Oceanography/UNC Wilmington) and Chris Shughrue (Environment/Forestry/Yale)have been working to develop and refine the tools used to investigate complex systems, particularly thosetools that are necessary to make useful predictions for the coupled human/Earth surface system. We alsoaim to democratize knowledge of nonlinear dynamics, so that a broader range of people can participate inanalyzing and shaping the future of Earth’s surface and the role of humans within its systems.
Resistance: Given the considerable influence of humanson landscapes and of natural processes on humans, andwidespread resistance to resource extraction, couplingbetween the political and economic dynamicsdetermining land use, landscape processes andresistance will be central to determining the futureevolution of Earth’s surface. To explore the impact of oilspills and environmental resistance on regulating the oilextraction system, Chris and Brad developed an agent-based model in which profit-seeking oil corporationagents make decisions to explore and extract crude oil inthe Gulf of Mexico, where oil spills are producedstochastically based on historical records. Mediacorporation agents vary coverage of oil industryenvironmental damage to optimize oil industryadvertising income and readership, both of which are a function of coverage decisions. Profit-orientedresistance group agents solicit donations from participants for use in advertising and for lobbyingregulators for policy change. Principle-oriented resistance groups coordinate direct action protests at acost to oil corporations and receive coverage from media corporations. The bias of heterogeneous publicopinion agents against industry operations is affected by media coverage and resistance activity. Legislatoragents respond to public opinion agent bias within their district and lobbying by resistance groups and oilcorporations by voting to change oil industry minimum operating safety standards and to regulate use ofdispersants on oil spills. Agents at the corporate and government levels use heterogeneous predictionmodels combined with a constant absolute risk aversion utility for wealth. The results of the model closelymimic many of the characteristics of the historical and projected hydrocarbon extraction, including peak oil.As the strength of environmental resistance is increased (see graph above), oil spills decrease asproduction is reduced marginally, and then production is reduced dramatically as oil spill volume remainslow, with an inflection point that corresponds well with measured production and resistance characteristics,suggesting that regulation of resistance has adjusted to optimize the balance between environmentaldamage and unfettered resource extraction.
Rich and Brad summarized one hundred articles (or broadcast interviews) about the 2010-2011 rebellionsin Egypt and Tunisia and translated them into dynamical language using a set of fundamental conceptsfrom the study of complexity and then combined these into a hierarchy of levels of description, relatingboth to the dynamics of the rebellions and the bifurcations they induced, as well as the longer-time-scalecontext in which these events took place. For example, many analyses attributed the success of therevolutions to a combination of new media ('the Facebook revolution') that fueled the early explosion ofawareness and participation in the protests and the skills and structures resulting from labor and economicjustice organizing in the recent past, particularly in Egypt. In dynamical terms, new media are extremelylow dissipation forms of communication, meaning that they foster unstable, rapidly changing behavior andinhibit the formation longer-time-scale emergent patterns. Conversely, the skills, networks andorganization resulting from past struggles provided a longer time scale, dissipative and stabilizing influence
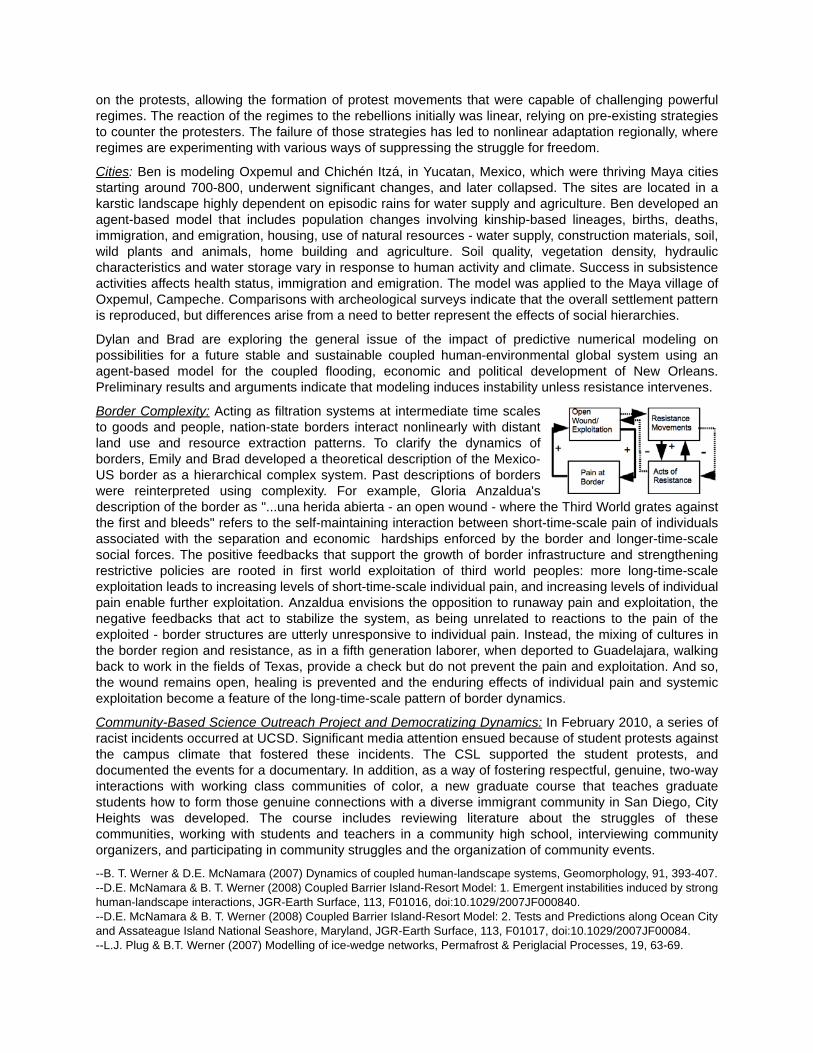
on the protests, allowing the formation of protest movements that were capable of challenging powerfulregimes. The reaction of the regimes to the rebellions initially was linear, relying on pre-existing strategiesto counter the protesters. The failure of those strategies has led to nonlinear adaptation regionally, whereregimes are experimenting with various ways of suppressing the struggle for freedom.
Cities: Ben is modeling Oxpemul and Chichén Itzá, in Yucatan, Mexico, which were thriving Maya citiesstarting around 700-800, underwent significant changes, and later collapsed. The sites are located in akarstic landscape highly dependent on episodic rains for water supply and agriculture. Ben developed anagent-based model that includes population changes involving kinship-based lineages, births, deaths,immigration, and emigration, housing, use of natural resources - water supply, construction materials, soil,wild plants and animals, home building and agriculture. Soil quality, vegetation density, hydrauliccharacteristics and water storage vary in response to human activity and climate. Success in subsistenceactivities affects health status, immigration and emigration. The model was applied to the Maya village ofOxpemul, Campeche. Comparisons with archeological surveys indicate that the overall settlement patternis reproduced, but differences arise from a need to better represent the effects of social hierarchies.
Dylan and Brad are exploring the general issue of the impact of predictive numerical modeling onpossibilities for a future stable and sustainable coupled human-environmental global system using anagent-based model for the coupled flooding, economic and political development of New Orleans.Preliminary results and arguments indicate that modeling induces instability unless resistance intervenes.
Border Complexity: Acting as filtration systems at intermediate time scalesto goods and people, nation-state borders interact nonlinearly with distantland use and resource extraction patterns. To clarify the dynamics ofborders, Emily and Brad developed a theoretical description of the Mexico-US border as a hierarchical complex system. Past descriptions of borderswere reinterpreted using complexity. For example, Gloria Anzaldua'sdescription of the border as "...una herida abierta - an open wound - where the Third World grates againstthe first and bleeds" refers to the self-maintaining interaction between short-time-scale pain of individualsassociated with the separation and economic hardships enforced by the border and longer-time-scalesocial forces. The positive feedbacks that support the growth of border infrastructure and strengtheningrestrictive policies are rooted in first world exploitation of third world peoples: more long-time-scaleexploitation leads to increasing levels of short-time-scale individual pain, and increasing levels of individualpain enable further exploitation. Anzaldua envisions the opposition to runaway pain and exploitation, thenegative feedbacks that act to stabilize the system, as being unrelated to reactions to the pain of theexploited - border structures are utterly unresponsive to individual pain. Instead, the mixing of cultures inthe border region and resistance, as in a fifth generation laborer, when deported to Guadelajara, walkingback to work in the fields of Texas, provide a check but do not prevent the pain and exploitation. And so,the wound remains open, healing is prevented and the enduring effects of individual pain and systemicexploitation become a feature of the long-time-scale pattern of border dynamics.
Community-Based Science Outreach Project and Democratizing Dynamics: In February 2010, a series ofracist incidents occurred at UCSD. Significant media attention ensued because of student protests againstthe campus climate that fostered these incidents. The CSL supported the student protests, anddocumented the events for a documentary. In addition, as a way of fostering respectful, genuine, two-wayinteractions with working class communities of color, a new graduate course that teaches graduatestudents how to form those genuine connections with a diverse immigrant community in San Diego, CityHeights was developed. The course includes reviewing literature about the struggles of thesecommunities, working with students and teachers in a community high school, interviewing communityorganizers, and participating in community struggles and the organization of community events.
--B. T. Werner & D.E. McNamara (2007) Dynamics of coupled human-landscape systems, Geomorphology, 91, 393-407.--D.E. McNamara & B. T. Werner (2008) Coupled Barrier Island-Resort Model: 1. Emergent instabilities induced by stronghuman-landscape interactions, JGR-Earth Surface, 113, F01016, doi:10.1029/2007JF000840.--D.E. McNamara & B. T. Werner (2008) Coupled Barrier Island-Resort Model: 2. Tests and Predictions along Ocean Cityand Assateague Island National Seashore, Maryland, JGR-Earth Surface, 113, F01017, doi:10.1029/2007JF00084.--L.J. Plug & B.T. Werner (2007) Modelling of ice-wedge networks, Permafrost & Periglacial Processes, 19, 63-69.
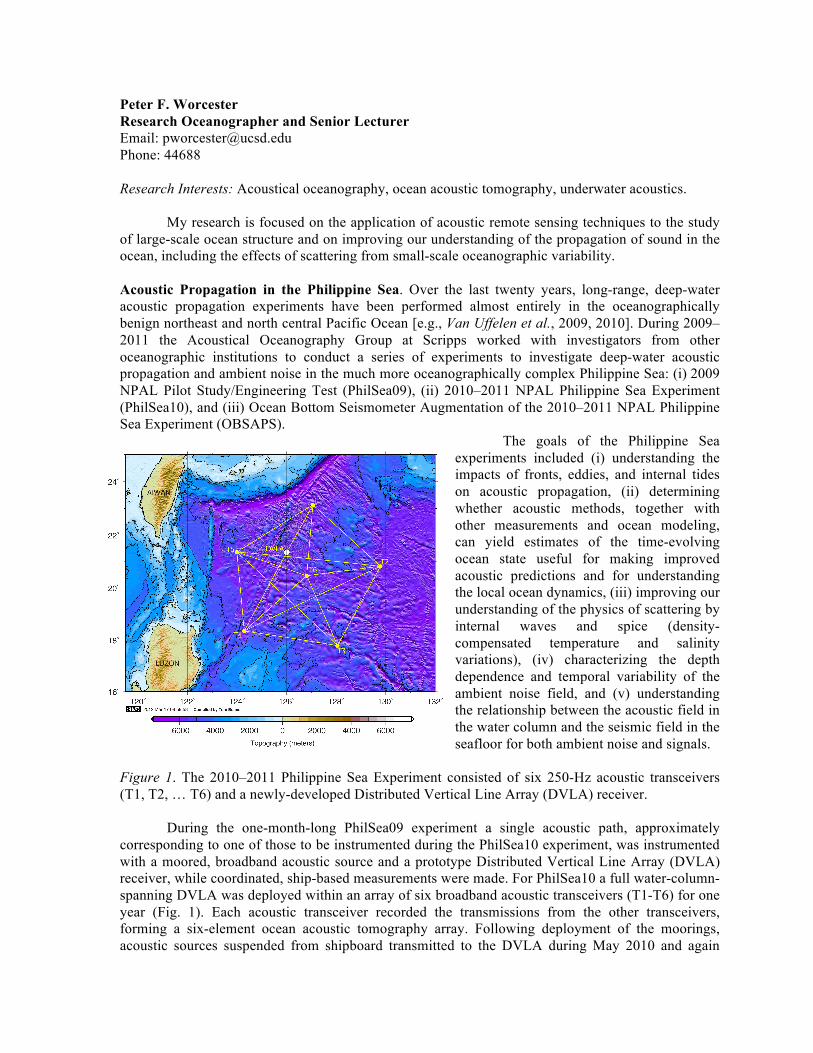
Peter F. Worcester Research Oceanographer and Senior Lecturer Email: [email protected] Phone: 44688 Research Interests: Acoustical oceanography, ocean acoustic tomography, underwater acoustics.
My research is focused on the application of acoustic remote sensing techniques to the study of large-scale ocean structure and on improving our understanding of the propagation of sound in the ocean, including the effects of scattering from small-scale oceanographic variability.
Acoustic Propagation in the Philippine Sea. Over the last twenty years, long-range, deep-water acoustic propagation experiments have been performed almost entirely in the oceanographically benign northeast and north central Pacific Ocean [e.g., Van Uffelen et al., 2009, 2010]. During 2009–2011 the Acoustical Oceanography Group at Scripps worked with investigators from other oceanographic institutions to conduct a series of experiments to investigate deep-water acoustic propagation and ambient noise in the much more oceanographically complex Philippine Sea: (i) 2009 NPAL Pilot Study/Engineering Test (PhilSea09), (ii) 2010–2011 NPAL Philippine Sea Experiment (PhilSea10), and (iii) Ocean Bottom Seismometer Augmentation of the 2010–2011 NPAL Philippine Sea Experiment (OBSAPS).
The goals of the Philippine Sea experiments included (i) understanding the impacts of fronts, eddies, and internal tides on acoustic propagation, (ii) determining whether acoustic methods, together with other measurements and ocean modeling, can yield estimates of the time-evolving ocean state useful for making improved acoustic predictions and for understanding the local ocean dynamics, (iii) improving our understanding of the physics of scattering by internal waves and spice (density-compensated temperature and salinity variations), (iv) characterizing the depth dependence and temporal variability of the ambient noise field, and (v) understanding the relationship between the acoustic field in the water column and the seismic field in the seafloor for both ambient noise and signals.
Figure 1. The 2010–2011 Philippine Sea Experiment consisted of six 250-Hz acoustic transceivers (T1, T2, … T6) and a newly-developed Distributed Vertical Line Array (DVLA) receiver.
During the one-month-long PhilSea09 experiment a single acoustic path, approximately
corresponding to one of those to be instrumented during the PhilSea10 experiment, was instrumented with a moored, broadband acoustic source and a prototype Distributed Vertical Line Array (DVLA) receiver, while coordinated, ship-based measurements were made. For PhilSea10 a full water-column-spanning DVLA was deployed within an array of six broadband acoustic transceivers (T1-T6) for one year (Fig. 1). Each acoustic transceiver recorded the transmissions from the other transceivers, forming a six-element ocean acoustic tomography array. Following deployment of the moorings, acoustic sources suspended from shipboard transmitted to the DVLA during May 2010 and again
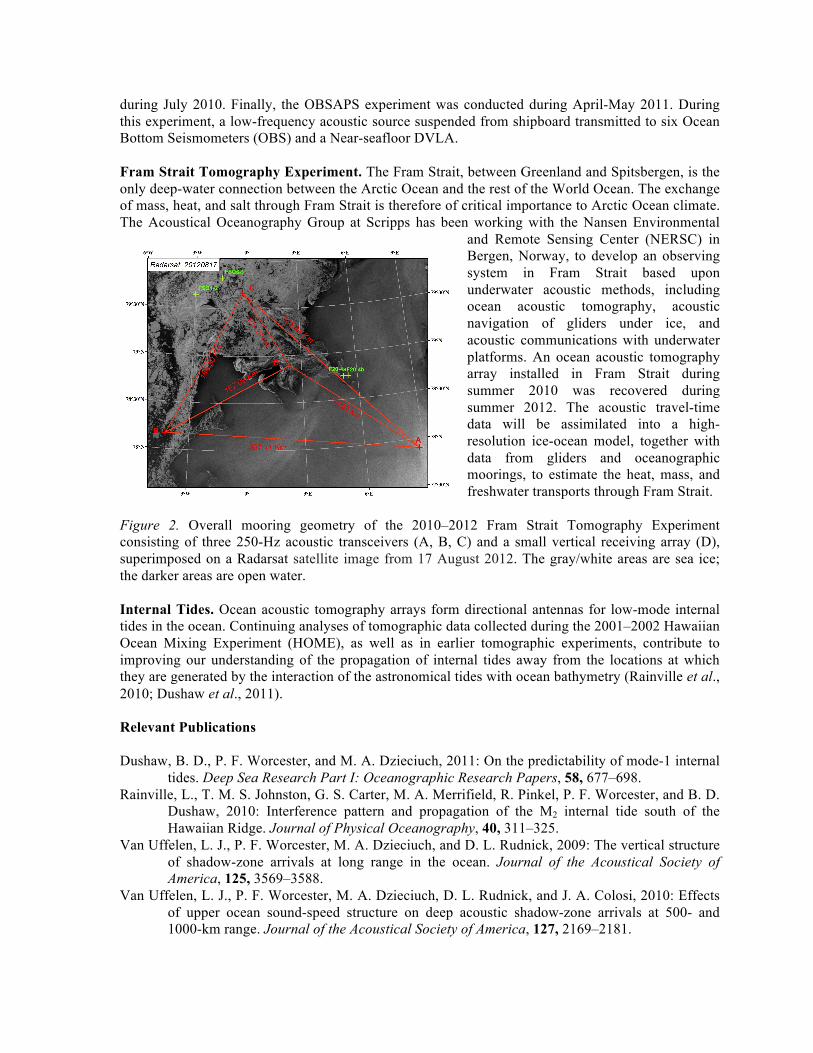
during July 2010. Finally, the OBSAPS experiment was conducted during April-May 2011. During this experiment, a low-frequency acoustic source suspended from shipboard transmitted to six Ocean Bottom Seismometers (OBS) and a Near-seafloor DVLA.
Fram Strait Tomography Experiment. The Fram Strait, between Greenland and Spitsbergen, is the only deep-water connection between the Arctic Ocean and the rest of the World Ocean. The exchange of mass, heat, and salt through Fram Strait is therefore of critical importance to Arctic Ocean climate. The Acoustical Oceanography Group at Scripps has been working with the Nansen Environmental
and Remote Sensing Center (NERSC) in Bergen, Norway, to develop an observing system in Fram Strait based upon underwater acoustic methods, including ocean acoustic tomography, acoustic navigation of gliders under ice, and acoustic communications with underwater platforms. An ocean acoustic tomography array installed in Fram Strait during summer 2010 was recovered during summer 2012. The acoustic travel-time data will be assimilated into a high-resolution ice-ocean model, together with data from gliders and oceanographic moorings, to estimate the heat, mass, and freshwater transports through Fram Strait.
Figure 2. Overall mooring geometry of the 2010–2012 Fram Strait Tomography Experiment consisting of three 250-Hz acoustic transceivers (A, B, C) and a small vertical receiving array (D), superimposed on a Radarsat satellite image from 17 August 2012. The gray/white areas are sea ice; the darker areas are open water. Internal Tides. Ocean acoustic tomography arrays form directional antennas for low-mode internal tides in the ocean. Continuing analyses of tomographic data collected during the 2001–2002 Hawaiian Ocean Mixing Experiment (HOME), as well as in earlier tomographic experiments, contribute to improving our understanding of the propagation of internal tides away from the locations at which they are generated by the interaction of the astronomical tides with ocean bathymetry (Rainville et al., 2010; Dushaw et al., 2011). Relevant Publications Dushaw, B. D., P. F. Worcester, and M. A. Dzieciuch, 2011: On the predictability of mode-1 internal
tides. Deep Sea Research Part I: Oceanographic Research Papers, 58, 677–698. Rainville, L., T. M. S. Johnston, G. S. Carter, M. A. Merrifield, R. Pinkel, P. F. Worcester, and B. D.
Dushaw, 2010: Interference pattern and propagation of the M2 internal tide south of the Hawaiian Ridge. Journal of Physical Oceanography, 40, 311–325.
Van Uffelen, L. J., P. F. Worcester, M. A. Dzieciuch, and D. L. Rudnick, 2009: The vertical structure of shadow-zone arrivals at long range in the ocean. Journal of the Acoustical Society of America, 125, 3569–3588.
Van Uffelen, L. J., P. F. Worcester, M. A. Dzieciuch, D. L. Rudnick, and J. A. Colosi, 2010: Effects of upper ocean sound-speed structure on deep acoustic shadow-zone arrivals at 500- and 1000-km range. Journal of the Acoustical Society of America, 127, 2169–2181.
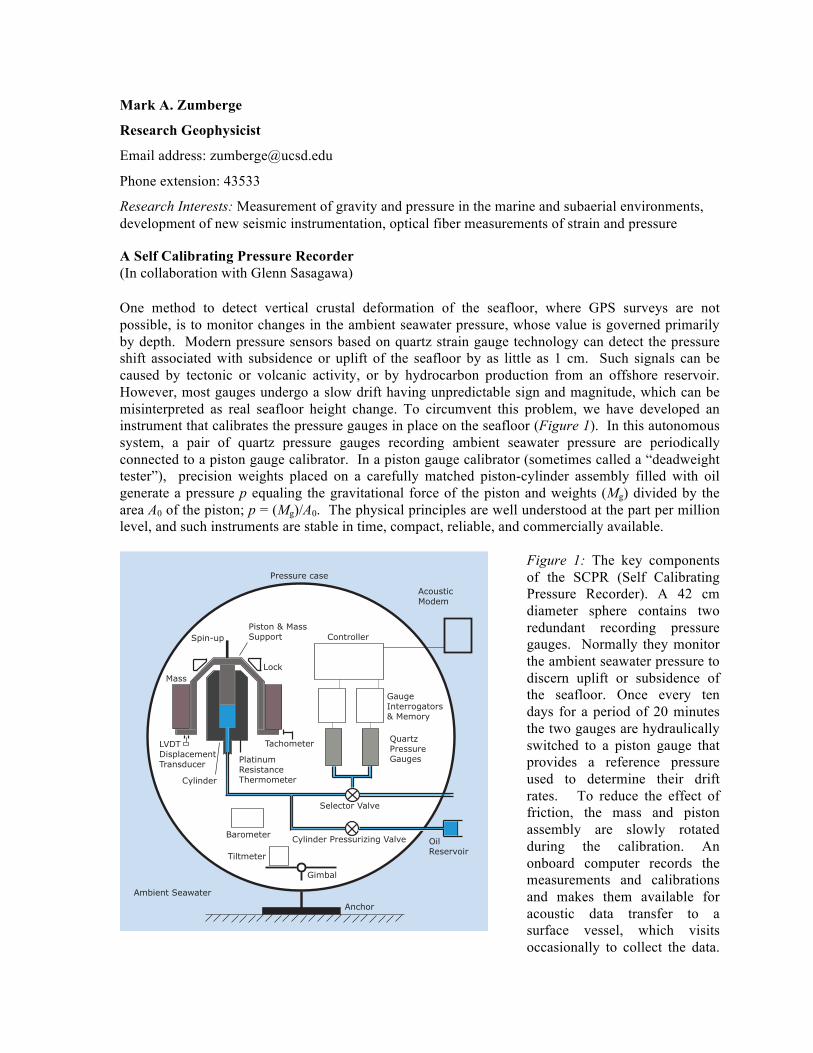
Mark A. Zumberge
Research Geophysicist
Email address: [email protected]
Phone extension: 43533
Research Interests: Measurement of gravity and pressure in the marine and subaerial environments, development of new seismic instrumentation, optical fiber measurements of strain and pressure
A Self Calibrating Pressure Recorder (In collaboration with Glenn Sasagawa) One method to detect vertical crustal deformation of the seafloor, where GPS surveys are not possible, is to monitor changes in the ambient seawater pressure, whose value is governed primarily by depth. Modern pressure sensors based on quartz strain gauge technology can detect the pressure shift associated with subsidence or uplift of the seafloor by as little as 1 cm. Such signals can be caused by tectonic or volcanic activity, or by hydrocarbon production from an offshore reservoir. However, most gauges undergo a slow drift having unpredictable sign and magnitude, which can be misinterpreted as real seafloor height change. To circumvent this problem, we have developed an instrument that calibrates the pressure gauges in place on the seafloor (Figure 1). In this autonomous system, a pair of quartz pressure gauges recording ambient seawater pressure are periodically connected to a piston gauge calibrator. In a piston gauge calibrator (sometimes called a “deadweight tester”), precision weights placed on a carefully matched piston-cylinder assembly filled with oil generate a pressure p equaling the gravitational force of the piston and weights (Mg) divided by the area A0 of the piston; p = (Mg)/A0. The physical principles are well understood at the part per million level, and such instruments are stable in time, compact, reliable, and commercially available.
Piston & MassSupport
Mass
Platinum ResistanceThermometer
LVDTDisplacementTransducer
Tachometer
Controller
GaugeInterrogators& Memory
QuartzPressureGauges
Selector Valve
Cylinder Pressurizing Valve OilReservoir
Cylinder
Barometer
AcousticModem
Pressure case
Ambient Seawater
Lock
Spin-up
Gimbal
Tiltmeter
Anchor
Figure 1: The key components of the SCPR (Self Calibrating Pressure Recorder). A 42 cm diameter sphere contains two redundant recording pressure gauges. Normally they monitor the ambient seawater pressure to discern uplift or subsidence of the seafloor. Once every ten days for a period of 20 minutes the two gauges are hydraulically switched to a piston gauge that provides a reference pressure used to determine their drift rates. To reduce the effect of friction, the mass and piston assembly are slowly rotated during the calibration. An onboard computer records the measurements and calibrations and makes them available for acoustic data transfer to a surface vessel, which visits occasionally to collect the data.
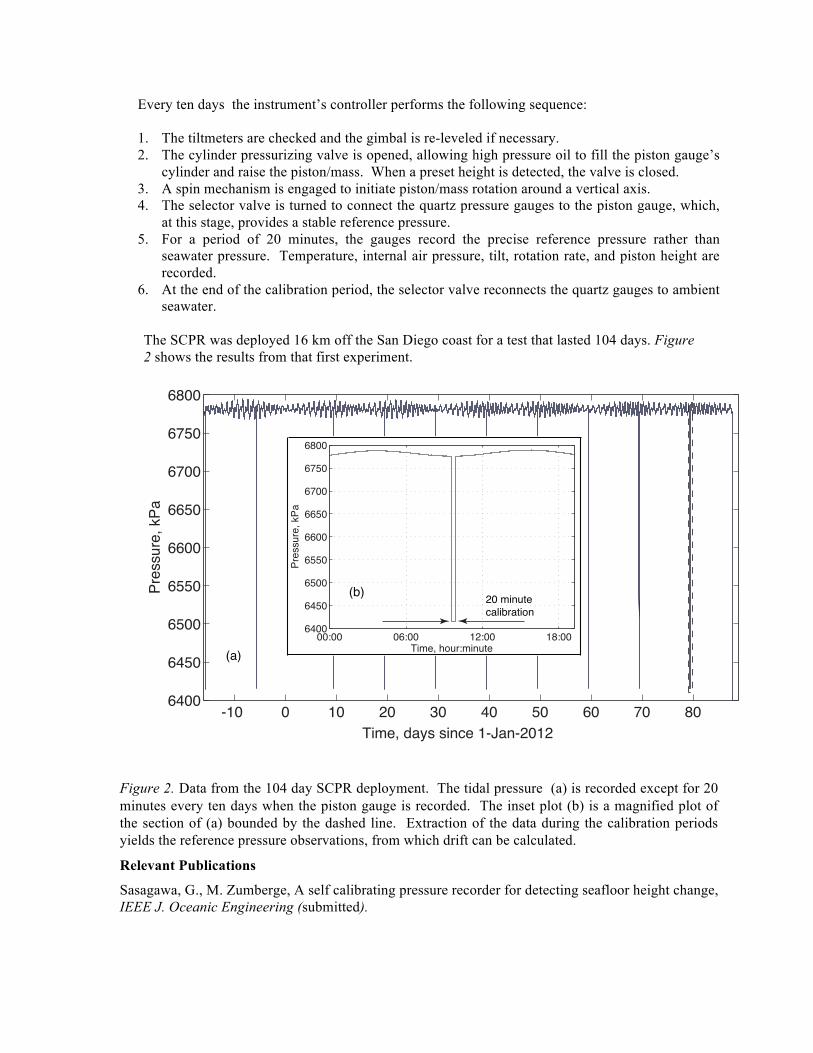
Every ten days the instrument’s controller performs the following sequence: 1. The tiltmeters are checked and the gimbal is re-leveled if necessary. 2. The cylinder pressurizing valve is opened, allowing high pressure oil to fill the piston gauge’s
cylinder and raise the piston/mass. When a preset height is detected, the valve is closed. 3. A spin mechanism is engaged to initiate piston/mass rotation around a vertical axis. 4. The selector valve is turned to connect the quartz pressure gauges to the piston gauge, which,
at this stage, provides a stable reference pressure. 5. For a period of 20 minutes, the gauges record the precise reference pressure rather than
seawater pressure. Temperature, internal air pressure, tilt, rotation rate, and piston height are recorded.
6. At the end of the calibration period, the selector valve reconnects the quartz gauges to ambient seawater.
The SCPR was deployed 16 km off the San Diego coast for a test that lasted 104 days. Figure 2 shows the results from that first experiment.
-10 0 10 20 30 40 50 60 70 806400
6450
6500
6550
6600
6650
6700
6750
6800
Time, days since 1-Jan-2012
Pres
sure
, kPa
00:00 06:00 12:00 18:006400
6450
6500
6550
6600
6650
6700
6750
6800
Time, hour:minute
Pres
sure
, kPa
(a)
(b) 20 minutecalibration
Figure 2. Data from the 104 day SCPR deployment. The tidal pressure (a) is recorded except for 20 minutes every ten days when the piston gauge is recorded. The inset plot (b) is a magnified plot of the section of (a) bounded by the dashed line. Extraction of the data during the calibration periods yields the reference pressure observations, from which drift can be calculated. Relevant Publications
Sasagawa, G., M. Zumberge, A self calibrating pressure recorder for detecting seafloor height change, IEEE J. Oceanic Engineering (submitted).

Cecil H. and Ida M. Green Institute of Geophysics and Planetary Physics, SIO/UCSD9500 Gilman Drive, La Jolla, CA 92093-0225, USA; Ph: +1.858.534.1927
www.igpp.ucsd.edu
Cover (clockwise from upper left corner): 1) David Sandwell and his group conducting GPS field work in Baja, Mexico; 2) Kinematic GPS survey of the salar de Uyuni in Bolivia—courtesy of Adrian Borsa; 3) Snapshot from a interactive visualiza-tion of the 26 August 2012 earthquake swarm near Brawley, California. Diamonds represent earthquakes in the swarm,color-coded by time and sized by magnitude. Small yellow dots represent past seismicity in the region—courtesy of DebiKilb; 4) SIO Pier at sunset captured by Kerry Key