Embed Size (px)
Citation preview

2016
TEN YEARS OF MEASURING PEACE

Quantifying Peace and its Benefits
The Institute for Economics and Peace (IEP) is an independent, non-partisan, non-profit think tank dedicated to shifting the world’s focus to peace as a positive, achievable, and tangible measure of human well-being and progress.
IEP achieves its goals by developing new conceptual frameworks to define peacefulness; providing metrics for measuring peace; and uncovering the relationships between business, peace and prosperity as well as promoting a better understanding of the cultural, economic and political factors that create peace.
IEP has offices in Sydney, New York, Brussels and Mexico City. It works with a wide range of partners internationally and collaborates with intergovernmental organizations on measuring and communicating the economic value of peace.
For more information visit www.economicsandpeace.org

EXECUTIVE SUMMARY 2
RESULTS & FINDINGS 5Highlights 6
2016 Global Peace Index rankings 8
Regional overview 10
Risers & fallers 16
GPI domain & indicator: Annual changes 20
TRENDS IN PEACE 23Highlights 25
Trends in peace since 2008 26
Indicator trends 29
Long-term trends 33
GLOBAL ECONOMIC VALUE OF PEACE 41Highlights 43
Methodology 44
Economic impact of violence: results 46
POSITIVE PEACE & SYSTEMS THINKING 51Introduction 54
Systems thinking: the nation state & peace 58
Resilience and positive peace 62
Building positive peace recommendations for catalysing systemic change 70
SUSTAINABLE DEVELOPMENT GOAL 16 73Measuring Goal 16 76
Goal 16: peace, justice and strong institutions 77
APPENDICES 94Appendix A: GPI methodology 95
Appendix B: GPI indicator sources, definitions and scoring criteria 99
Appendix C: Violence containment costs by country 108
Appendix D: 2016 GPI domain scores 110
END NOTES 113
REFERENCES 115
CONTENTS
1
2
3
5
4

deteriorated slightly, reflecting increases in the impact of terrorism due to the large terrorist attacks in Paris and Brussels as well as the escalation of violence and instability in Turkey and its deteriorating relations with its neighbours.
The largest regional improvement occurred in Central America and the Caribbean, recording an average improvement of one per cent. The South and North America regions made progress as well, while MENA experienced the largest deterioration, followed by sub-Saharan Africa, Europe and the Asia-Pacific.
The historic ten-year deterioration in peace has largely been driven by the intensifying conflicts in the MENA region. Terrorism is also at an all-time high, battle deaths from conflict are at a 25 year high, and the number of refugees and displaced people are at a level not seen in sixty years. Notably, the sources for these three dynamics are intertwined and driven by a small number of countries, demonstrating the global repercussions of breakdowns in peacefulness. Many countries are at record high levels of peacefulness, while the bottom 20 countries have progressively become much less peaceful, creating increased levels of inequality in global peace.
Over the past decade, the average country score deteriorated by 2.44 per cent with 77 countries improving while 85 countries deteriorated, highlighting the global complexities of peace and its uneven distribution.
The number of refugees and displaced persons increased dramatically over the decade, doubling from 2007 to 2015, to approximately 60 million people. There are nine countries with more than 10 per cent of their population classified as refugees or displaced persons with Somalia and South Sudan having more than 20 per cent of their population displaced and Syria with over 60 per cent displaced.
The stand-out improvement over the period is UN peacekeeping funding which improved by 12 per cent. The other indicator with the most improvement is external conflicts fought, however this has been offset by an increase in internal conflicts fought. The two other indicators to show improvement are armed service personnel and military expenditure, both improving by five per cent. The number of armed service personnel declined in 48 of the 51 countries classified as authoritarian, highlighting the shift to more technologically advanced militaries.
The economic impact of violence on the global economy in 2015 was $13.6 trillion in purchasing power parity (PPP) terms. This figure represents 13.3 per cent of the world’s economic activity (gross world product) or $1,876 for every person in the world. To put this in perspective, it is approximately 11 times the size of global foreign direct investment.
The economic analysis highlights how the economic losses from conflict dwarf the expenditures and investments in peacebuilding and peacekeeping. Peacebuilding and peacekeeping expenditures represent only two per cent of the global economic losses from conflict.
Further research on Positive Peace is presented in this report, which conceptualises systems thinking and its relationship to Positive Peace. Many of the challenges facing humanity are fundamentally global in nature, such as climate change, decreasing biodiversity, continued economic instability and increasing migration. All of these challenges are interconnected and multifaceted, requiring new ways of conceptualising the relations between countries and the larger systems upon which humanity depends. This report contains an analysis of systems thinking and how it applies to nation states, describing concepts of national intent, their encoded norms, national homeostasis, self-modification and mutual feedback loops to provide a new inter-dependent framework and more holistic approach to understanding peace and development.
The report also provides an analysis of countries’ resilience to shocks and how levels of Positive Peace affect the likelihood and impact of shocks and hazards. Countries with high Positive Peace are more likely to maintain their stability and adapt and recover from both internal and external shocks. Low Positive Peace systems are more likely to generate internal shocks, with 84 per cent of major political shocks occurring in these countries. Similarly, there are 13 times more lives lost from natural disasters in nations with low Positive Peace as opposed to those with high Positive Peace, a disproportionally high number when compared to the distribution of incidents.
The final section of the report provides an audit of the available data to measure Goal 16 of the Sustainable Development Goals (SDGs). For the first time, UN member states have formally recognised the critical nature of peacefulness in advancing global development. The 17 SDGs are a new set of goals to target poverty, inequality, injustice and climate change by 2030. Goal 16 relates to the promotion of peace, justice and strong institutions.
IEP’s audit of the existing data for Goal 16 finds that whilst its targets are only partly measurable, there is sufficient existing data to adequately track progress. However, while indicative progress can be gauged, there are still significant challenges to data availability, disaggregation, reliability, timeliness and objectivity. It will take significant time and investment for countries to develop the necessary capacities to measure Goal 16. Independent assessment will be critical in plugging data gaps and verifying the accuracy of national statistical data.
VIOLENCECOSTS13.3%
3GLOBAL PEACE INDEX 2016

GLOSSARY
The following terms used throughout the 2016 Global Peace Index Report are defined here for reference:
Correlation
The statistical relationship between two variables; how much one
variable changes in relation to another variable. IEP uses linear
correlations to compare the strength of the association between
different variables.
Correlation coefficient
A value between -1 and 1 that shows the strength of the correlation
between two variables, where -1 indicates a perfect indirect correlation,
0 indicates no correlation and 1 indicates a perfect direct correlation.
Direct cost of violence
Costs which are directly attributed to a specific form of violence. Direct
costs include the cost of violence to the victim, the perpetrator and the
government. These include direct expenditures, such as the cost of
policing.
Economic impact of violence
The expenditure and economic effect related to containing, preventing
and dealing with the consequences of violence. The estimates include
the direct and indirect cost of violence as well as an economic
multiplier.
Encoded norms
The values by which society self-organises.
External peace
A set of indicators that measures how peaceful a country is outside its
national borders.
Global Peace Index (GPI) domains
§ Ongoing domestic and international conflict
Indicators of the number and intensity of ongoing civil and
international wars.
§ Societal safety and security
Indicators of the levels of safety and security within a country, such
as the perception of criminality in society, the level of political
instability and the rate of homicides and violent crimes.
§ Militarisation
Indicators of a nation’s military capacity, both in terms of the
economic resources committed to the military and support for
multilateral operations.
Homeostasis
A persistent state of self-regulating and balanced stability.
Indirect cost of violence
Accounts for costs that accrue after the violent event and include indirect
economic losses, physical and physiological trauma to the victim and lost
productivity.
Internal peace
A set of indicators that measures how peaceful a country is inside its
national borders.
Multiplier
A scaling factor used to adjust the value of one variable based on another
variable. For example, the economic impact of violence is calculated using
a multiplier of two.
Negative Peace
The absence of violence or the fear of violence.
Positive Peace
The attitudes, institutions and structures that create and sustain peaceful
societies. These same factors also lead to many other positive outcomes
that support the optimum environment for human potential to flourish.
Resilience
The ability of a country to absorb and recover from shocks, for example
natural disasters or fluctuations in commodity prices.
Self-modification
A process by which society modifies itself to accommodate new situations
and challenges.
Shock
A sudden change from inside or outside a nation-state system that has
the potential to cause harm.
Significant
Of high importance or noteworthiness.
Significant, statistically
A result that is unlikely to be due to chance alone, as measured
statistically using probability. A standard definition is a p-score of less
than .05. This means that there is only a 5% chance that the results of an
analysis are due to chance.
Violence containment
Economic activity related to the consequences or prevention of violence
where the violence is directed against people or property.
4

RESULTS & FINDINGS

HIGHLIGHTS
z The world became slightly less peaceful in 2016, with the average GPI country score deteriorating by 0.53 per cent.
z Over the past year, 81 countries improved their peacefulness, while 79 countries deteriorated. The average deterioration was larger than the average improvement, accounting for the global drop in score.
z The societal safety and security and ongoing conflict domains both deteriorated, while militarisation recorded a slight improvement.
z The largest improvement was recorded in the UN peacekeeping funding and security officers and police indicators, while the largest deterioration occurred in terrorism impact and political instability.
z The international community’s requirement for and committment to UN peacekeeping funding reached record highs in early 2016.
z The security officers and police rate decreased in 44 countries and increased in 29, with the biggest reductions occurring in Kazakhstan, Moldova and France.
z Violent crime improved in 13 countries and deteriorated in only five. The largest absolute change occurred in Libya.
z The impact of terrorism deteriorated in 77 countries, while improving in 48. Only 37 of the 163 countries measured had no impact of terrorism. The largest deterioration in this indicator was in the Middle East and North Africa.
The 2016 Global Peace Index overall score deteriorated slightly compared with 2015, and at a faster rate than the previous year. Once again, the Middle East and North Africa (MENA) was the region that saw its levels of peace deteriorate the most. Four regions scored worse than the previous year, while three other regions improved and two remained the same.
The score for MENA — already the least peaceful region in the world — dropped further as numerous regional conflicts persisted or escalated and new ones emerged. Notably, the civil war in Syria broadened its international scope as a result of the Russian intervention that began in September 2015 on the side of the Syrian government. Meanwhile, Saudi Arabia intervened in Yemen’s ongoing civil war and the US-led coalition continued airstrikes against the so-called Islamic State in Iraq and the Levant (ISIL). The campaigns in both Syria and Iraq have intensified since the Paris terrorist attacks in November. In contrast, Europe maintained its position as the most peaceful region in the world, notwithstanding some deterioration in its score. Although the region remains largely devoid of internal conflict, the looming threat of terrorism continues to weigh on the region’s prospects for further advances in peace.
With regard to societal safety and security, there were mixed successes across the different regions. Only a small number of countries experienced a change in either perceptions of criminality or the level of violent crime and in both cases more countries improved than deteriorated. The scores for the number of jailed population per 100,000 people also roughly cancelled each other out between the countries that had higher
incarceration rates last year and those that had lower. Notably, only MENA and South America saw a rise in the level of violent crime, which improved or remained static in all other regions. South America and Central America and the Caribbean were frequently the worst performers in the indicators relating to societal safety and security, with the only exceptions being an excessive incarceration rate in the United States and MENA’s large numbers of internal security forces. The latter, however, improved in all regions in 2016 except South Asia and MENA.
Less favourable were the results for political instability, which worsened in 39 countries from 2015 to 2016. A striking case this year was Brazil, where the trigger was a major corruption scandal. This instability, however, has not yet translated into a higher likelihood of violent demonstrations except in South Asia, MENA, and sub-Saharan Africa, which were already at the bottom of the rankings. At the same time, political terror increased globally, with Europe recording the second biggest deterioration worldwide, after Asia-Pacific. Despite this, Europe is still the best placed region in the Political Terror Scale rankings. The number of refugees and internally displaced people also deteriorated across much of the world, with only a modest improvement in South America failing to make up for deteriorations in every other region. The most significant deteriorations in this indicator were seen in Central America and the Caribbean - mainly in the Golden Triangle countries of Honduras and Guatemala, as well as MENA, where the outbreak of war in Yemen has led to a humanitarian crisis.
8

The results for indicators related to ongoing domestic and international conflict also varied widely. The number of deaths from internal organised conflict lessened in three regions, including modestly in MENA, but increased in four other regions, particularly in Russia and Eurasia where the Ukraine conflict continued. Although the global score for the number of deaths from external organised conflict also deteriorated, the average was heavily skewed due to the results from MENA, and to a lesser extent South Asia; all other regions improved or stayed the same. The number and duration of internal conflicts improved in more countries than deteriorated, however, the global average score did deteriorate due to the intensification and persistence of war in Syria, Ukraine, the Central African Republic and Libya. A greater number of countries deteriorated for the number, duration and role in external conflicts, and almost all regions did worse than in 2015. The biggest slump came in North America, where the US remains mired in numerous Middle Eastern conflicts as well as in Afghanistan.
The possibility of a political settlement in Syria and Yemen would certainly boost the outlook for domestic and international conflict in the coming year, but the persistence of ISIL as a threat to the region suggests that outside powers will remain engaged in the Middle East for some time. In line with heightened external tensions, the average score for relations with neighbouring countries deteriorated globally and in three of nine regions. Perhaps most worrying from an international security perspective is that impact of terrorism was the indicator that deteriorated the most, even though three regions, Russia and Eurasia, Central American and the Caribbean, and South
Asia, recorded improvements. Aside from MENA, Europe was the region that suffered most from terrorism compared with last year, with Turkey, France and Belgium among the most affected. Belgium and France have struggled with home-grown Islamic terrorism, which was highlighted by the terrorist attacks in Paris in November 2015.
Finally, the indicators relating to militarisation recorded a slight improvement on average. Although military expenditure as a percentage of GDP continued to climb in over 70 countries along with the volume of imports of major conventional weapons, the number of armed services personnel per 100,000 people was down overall, with only a noticeable uptick in Russia and Eurasia and Central America and the Caribbean, which in the latter case mostly relates to domestic security concerns rather than the risk of external conflict. Nuclear and heavy weapons capabilities also eased. The region that remains at highest risk of further militarisation is MENA, where numerous countries are continuing to build up their conventional arsenals and import an increasing number of weapons. The escalation of existing conflicts in the Middle East, as well as the opening of new fronts such as Yemen, will continue to encourage military build-ups in neighbouring countries, particularly those that are directly involved in these conflicts.
(SINCE 2015)
MORE PEACEFUL
Countries
became
LESSPEACEFUL
81 79
9GLOBAL PEACE INDEX 2016 | Results & Findings

A SNAPSHOT OF THE GLOBAL STATE OF PEACE
2016 GLOBAL PEACE INDEX
Very high
High
Medium
Low
Very low
Not included
THE STATE OF PEACE
1 Iceland 1.192
2 Denmark 1.246
3 Austria 1.278
4 New Zealand 1.287
5 Portugal 1.356
6 Czech Republic 1.360
7 Switzerland 1.370
8 Canada 1.388
9 Japan 1.395
10 Slovenia 1.408
11 Finland 1.429
12 Ireland 1.433
13 Bhutan 1.445
14 Sweden 1.461
15 Australia 1.465
16 Germany 1.486
17 Norway 1.500
18 Belgium 1.528
19 Hungary 1.534
20 Singapore 1.535
21 Netherlands 1.541
22 Poland 1.557
23 Mauritius 1.559
24 Slovakia 1.603
25 Spain 1.604
26 Croatia 1.633
27 Chile 1.635
28 Botswana 1.639
29 Bulgaria 1.646
30 Malaysia 1.648
31 Romania 1.649
32 Latvia 1.680
33 Costa Rica 1.699
34 Qatar 1.716
35 Uruguay 1.726
36 Estonia 1.732
37 Lithuania 1.735
38 Madagascar 1.763
39 Italy 1.774
40 Zambia 1.783
79 Gabon 2.033
80 Paraguay 2.037
81 Bolivia 2.038
82 Greece 2.044
83 Bangladesh 2.045
84 Trinidad and Tobago 2.056
85 Georgia 2.057
85 Cuba 2.057
85 Peru 2.057
88 Burkina Faso 2.063
89 Haiti 2.066
90 Swaziland 2.074
91 Morocco 2.086
92 The Gambia 2.091
92 Jamaica 2.091
94 Macedonia (FYR) 2.092
95 Guyana 2.105
96 Jordan 2.127
97 Sri Lanka 2.133
98 Angola 2.140
99 Papua New Guinea 2.143
99 Dominican Republic 2.143
101 Uganda 2.148
101 Guinea 2.148
103 United States of America 2.154
104 Cambodia 2.161
105 Brazil 2.176
106 Belarus 2.202
106 Turkmenistan 2.202
108 Algeria 2.213
109 Uzbekistan 2.216
110 Armenia 2.218
111 Honduras 2.237
111 El Salvador 2.237
113 Niger 2.239
114 Republic of the Congo 2.249
115 Myanmar 2.256
116 Guinea-Bissau 2.264
117 Guatemala 2.270
118 Cote d’ Ivoire 2.279
119 Ethiopia 2.284
120 China 2.288
RANK COUNTRY SCORE
RANK COUNTRY SCORE
10

41 Taiwan 1.787
42 Indonesia 1.799
43 Sierra Leone 1.805
44 Ghana 1.809
45 Malawi 1.817
46 France 1.829
47 United Kingdom 1.830
48 Serbia 1.834
49 Panama 1.837
50 Mongolia 1.838
51 Kuwait 1.842
52 Laos 1.852
53 South Korea 1.858
54 Albania 1.867
55 Namibia 1.873
56 Timor-Leste 1.879
57 Montenegro 1.884
58 Tanzania 1.899
59 Vietnam 1.906
60 Bosnia and Herzegovina 1.915
61 United Arab Emirates1.931
62 Equatorial Guinea 1.940
63 Lesotho 1.941
64 Tunisia 1.949
65 Moldova 1.953
66 Togo 1.954
67 Argentina 1.957
68 Mozambique 1.963
69 Nicaragua 1.975
70 Senegal 1.978
71 Cyprus 1.994
72 Benin 1.998
72 Liberia 1.998
74 Oman 2.016
75 Kazakhstan 2.019
76 Ecuador 2.020
77 Kosovo 2.022
78 Nepal 2.026
121 Djibouti 2.292
122 Tajikistan 2.293
123 Mauritania 2.295
124 Kyrgyz Republic 2.297
125 Thailand 2.312
126 South Africa 2.316
127 Zimbabwe 2.322
128 Rwanda 2.323
129 Saudi Arabia 2.338
130 Cameroon 2.356
131 Kenya 2.379
132 Bahrain 2.398
133 Iran 2.411
134 Azerbaijan 2.450
135 Eritrea 2.460
136 Chad 2.464
137 Mali 2.489
138 Burundi 2.500
139 Philippines 2.511
140 Mexico 2.557
141 India 2.566
142 Egypt 2.574
143 Venezuela 2.651
144 Israel 2.656
145 Turkey 2.710
146 Lebanon 2.752
147 Colombia 2.764
148 Palestine 2.832
149 Nigeria 2.877
150 North Korea 2.944
151 Russia 3.079
152 Democratic Republic of the Congo 3.112
153 Pakistan 3.145
154 Libya 3.200
155 Sudan 3.269
156 Ukraine 3.287
157 Central African Republic 3.354
158 Yemen 3.399
159 Somalia 3.414
160 Afghanistan 3.538
161 Iraq 3.570
162 South Sudan 3.593
163 Syria 3.806
11GLOBAL PEACE INDEX 2016 | Results & Findings

REGIONAL OVERVIEW
Year-on-year changes in peacefulness at the regional level are highlighted in figure 1.1. The biggest improvement in peacefulness occurred in the Central America and Caribbean region, with an average improvement of two per cent. The other two regions in the Americas also recorded improvements in peacefulness, while all other regions either deteriorated or remained approximately the same.
The most significant deterioration by far occurred in MENA. The average GPI country score deteriorated by over six per cent, with the largest deteriorations occurring in Yemen (15.1 per cent), Bahrain (7.2 per cent) and Libya (6.5 per cent).
EUROPE
Europe is once again the most peaceful geographical region in the world according to the GPI. It now accounts for six of the top seven places in the global rankings. The highest-ranking countries in the world remain unchanged from 2015: Iceland, Denmark and Austria. The largest improvement in the region was recorded by Portugal, which built on gains last year to rise nine places to fifth globally. This reflects continuing improvements in the context of the country’s gradual return to political normality following its EU/
IMF economic and financial adjustment process. Notwithstanding the difficulties faced by the left-of-centre government elected in 2015, Portugal has recorded a second year of improvements across numerous dimensions, notably the likelihood of violent demonstrations, but also the Political Terror Scale and political instability. Among the other Eurozone countries to have exited similar bailout arrangements, there were only minor movements: Ireland roughly maintained its score while Spain and Cyprus saw slight deteriorations. Cyprus maintained its rank of 71st in the index. The one country that has yet to exit its bailout arrangement, Greece, slipped back in this year’s index, amid continuing difficulties with implementing the terms of the bailout, compounded by the emergence of new risks of social unrest associated with Europe’s migration crisis. Having jumped 22 places in 2015, Greece dropped four places globally to 82nd this year.
Source: IEP
FIGURE 1.1 GPI OVERALL SCORE CHANGE BY REGION, 2015 – 2016
The Middle East and North Africa continued to deteriorate in 2016, while Central America and the Caribbean recorded the largest improvement.
-0.03 -0.02 -0.01 0.00 0.01 0.02 0.03 0.04 0.05 0.06
Middle East and North Africa
Europe
Sub-Saharan Africa
Asia-Pacific
Russia and Eurasia
South Asia
North America
South America
Central America and the Caribbean
0.07
More peaceful Less peaceful
CHANGE IN GPI SCORE, 2015 TO 2016
Regionally, Greece lies in 34th place out of the 36 European countries, ahead of only the Former Yugoslav Republic of Macedonia (94th globally) and Turkey (145th). Macedonia dropped 15 places between 2015 and 2016—the biggest slide down the global rankings for a European country, followed by Kosovo. However, Turkey saw the largest deterioration in score for the region. Notwithstanding the November 2015 terrorist attacks in Paris, improvements related to violent demonstrations and levels of policing more than offset deteriorations in terrorism-related indicators for France. The country fell by one place in the ranking (to 46th). Belgium, another European country to be affected by high-profile terrorist attacks in recent months, dropped down the global rankings by three places (to
12

NORTH AMERICA
The North America region score remains almost as it was in 2015, as a very minor deterioration in the score for Canada was offset by a similar improvement in the US. North America remains the second most peaceful region in the 2016 GPI. The past year was a mildly encouraging one for the US. The country was instrumental in driving a multilateral deal to restrict Iran’s use of nuclear material to peaceful purposes and in the lifting of sanctions that followed. Further diplomatic progress was made with Cuba, another country historically considered an enemy by the US government. However, US involvement in the armed conflict against ISIL escalated, with thousands of airstrikes conducted in Islamic State-held territory. This situation is reflected in a deterioration in the score for number, duration and role in external conflicts. Relations between the US and Russia have also deteriorated further, with Russia’s support for the Syrian government led by President Bashar al-Assad putting the former Cold War enemies on opposite sides of that conflict. Closing the US detention facility in Guantanamo Bay in Cuba remains an objective of the president, Barack Obama, before he leaves office. Although Canada’s score deteriorated in this edition, driven by ongoing conflict and militarisation scores, the year actually saw developments that ought to enable a future improvement in its score. The election in October 2015 of a Liberal Party government will result in the acceptance of thousands of Syrian refugees, greater spending on humanitarian aid, and the withdrawal of combat troops from missions in Iraq and Syria. These decisions will all be beneficial for the country’s score.
TABLE 1.2 NORTH AMERICA RANKINGSCOUNTRY OVERALL
RANKOVERALL SCORE
CHANGE IN SCORE
REGIONAL RANK
Canada 8 1.388 0.014 1
United States of America
103 2.154 -0.012 2
REGIONAL AVERAGE 1.771
18th), driven by a deterioration on the impact of terrorism score and a sharp worsening of the level of perceived criminality in society. The scores of two of the largest European countries, France and the UK, are held down by very low rankings on external peace indicators, in line with their repeated military engagements in recent years.
TABLE 1.1 EUROPE RANKINGSCOUNTRY OVERALL
RANKOVERALL
SCORECHANGE IN
SCOREREGIONAL
RANK
Iceland 1 1.192 -0.006 1
Denmark 2 1.246 0.023 2
Austria 3 1.278 -0.005 3
Portugal 5 1.356 -0.064 4
Czech Republic 6 1.360 -0.058 5
Switzerland 7 1.370 -0.006 6
Slovenia 10 1.408 -0.018 7
Finland 11 1.429 0.020 8
Ireland 12 1.433 0.004 9
Sweden 14 1.461 0.011 10
Germany 16 1.486 -0.019 11
Norway 17 1.500 -0.018 12
Belgium 18 1.528 0.035 13
Hungary 19 1.534 -0.011 14
Netherlands 21 1.541 0.013 15
Poland 22 1.557 0.032 16
Slovakia 24 1.603 0.033 17
Spain 25 1.604 0.027 18
Croatia 26 1.633 0.002 19
Bulgaria 29 1.646 -0.023 20
Romania 31 1.649 0.010 21
Latvia 32 1.680 -0.017 22
Estonia 36 1.732 -0.018 23
Lithuania 37 1.735 0.006 24
Italy 39 1.774 0.004 25
France 46 1.829 0.014 26
United Kingdom 47 1.830 -0.016 27
Serbia 48 1.834 -0.013 28
Albania 54 1.867 -0.016 29
Montenegro 57 1.884 -0.007 30
Bosnia and Herzegovina
60 1.915 -0.004 31
Cyprus 71 1.994 0.016 32
Kosovo 77 2.022 0.035 33
Greece 82 2.044 0.019 34
Macedonia (FYR) 94 2.092 0.042 35
Turkey 145 2.710 0.090 36
REGIONAL AVERAGE 1.660
The largest improvement in the region was recorded by Portugal.
13GLOBAL PEACE INDEX 2016 | Results & Findings
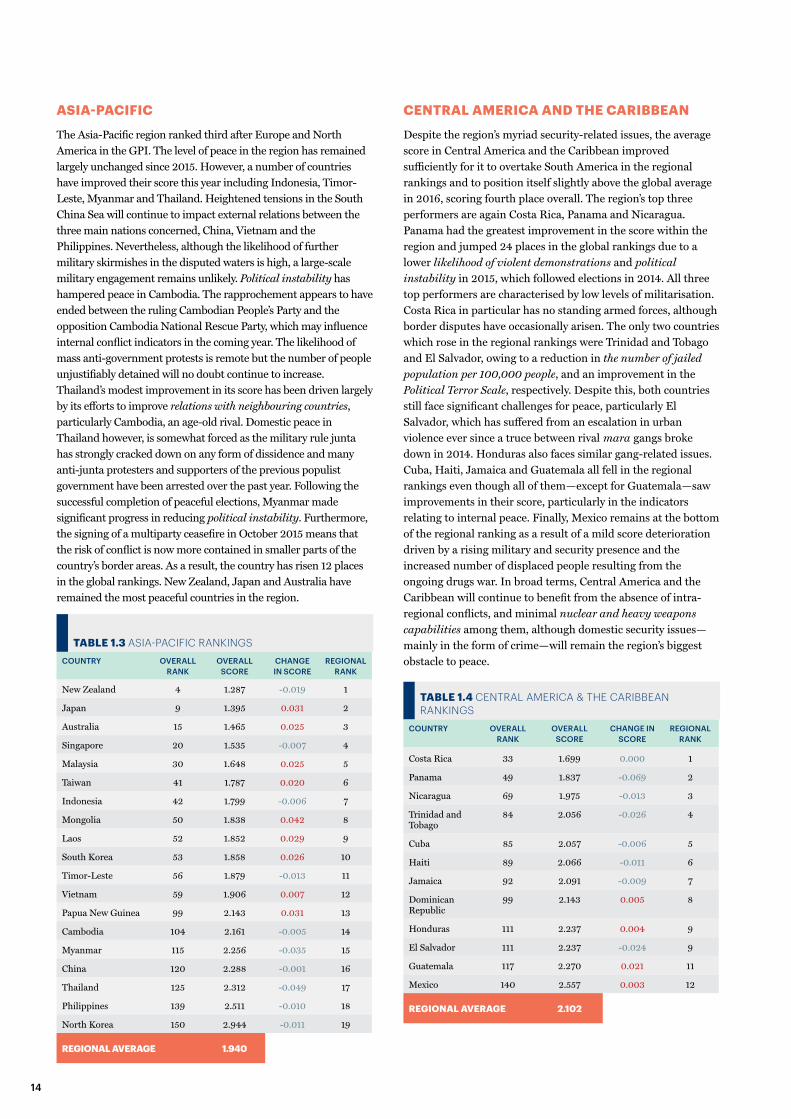
ASIA-PACIFIC
The Asia-Pacific region ranked third after Europe and North America in the GPI. The level of peace in the region has remained largely unchanged since 2015. However, a number of countries have improved their score this year including Indonesia, Timor-Leste, Myanmar and Thailand. Heightened tensions in the South China Sea will continue to impact external relations between the three main nations concerned, China, Vietnam and the Philippines. Nevertheless, although the likelihood of further military skirmishes in the disputed waters is high, a large-scale military engagement remains unlikely. Political instability has hampered peace in Cambodia. The rapprochement appears to have ended between the ruling Cambodian People’s Party and the opposition Cambodia National Rescue Party, which may influence internal conflict indicators in the coming year. The likelihood of mass anti-government protests is remote but the number of people unjustifiably detained will no doubt continue to increase. Thailand’s modest improvement in its score has been driven largely by its efforts to improve relations with neighbouring countries, particularly Cambodia, an age-old rival. Domestic peace in Thailand however, is somewhat forced as the military rule junta has strongly cracked down on any form of dissidence and many anti-junta protesters and supporters of the previous populist government have been arrested over the past year. Following the successful completion of peaceful elections, Myanmar made significant progress in reducing political instability. Furthermore, the signing of a multiparty ceasefire in October 2015 means that the risk of conflict is now more contained in smaller parts of the country’s border areas. As a result, the country has risen 12 places in the global rankings. New Zealand, Japan and Australia have remained the most peaceful countries in the region.
TABLE 1.3 ASIA-PACIFIC RANKINGSCOUNTRY OVERALL
RANKOVERALL
SCORECHANGE IN SCORE
REGIONAL RANK
New Zealand 4 1.287 -0.019 1
Japan 9 1.395 0.031 2
Australia 15 1.465 0.025 3
Singapore 20 1.535 -0.007 4
Malaysia 30 1.648 0.025 5
Taiwan 41 1.787 0.020 6
Indonesia 42 1.799 -0.006 7
Mongolia 50 1.838 0.042 8
Laos 52 1.852 0.029 9
South Korea 53 1.858 0.026 10
Timor-Leste 56 1.879 -0.013 11
Vietnam 59 1.906 0.007 12
Papua New Guinea 99 2.143 0.031 13
Cambodia 104 2.161 -0.005 14
Myanmar 115 2.256 -0.035 15
China 120 2.288 -0.001 16
Thailand 125 2.312 -0.049 17
Philippines 139 2.511 -0.010 18
North Korea 150 2.944 -0.011 19
REGIONAL AVERAGE 1.940
CENTRAL AMERICA AND THE CARIBBEAN
Despite the region’s myriad security-related issues, the average score in Central America and the Caribbean improved sufficiently for it to overtake South America in the regional rankings and to position itself slightly above the global average in 2016, scoring fourth place overall. The region’s top three performers are again Costa Rica, Panama and Nicaragua. Panama had the greatest improvement in the score within the region and jumped 24 places in the global rankings due to a lower likelihood of violent demonstrations and political instability in 2015, which followed elections in 2014. All three top performers are characterised by low levels of militarisation. Costa Rica in particular has no standing armed forces, although border disputes have occasionally arisen. The only two countries which rose in the regional rankings were Trinidad and Tobago and El Salvador, owing to a reduction in the number of jailed population per 100,000 people, and an improvement in the Political Terror Scale, respectively. Despite this, both countries still face significant challenges for peace, particularly El Salvador, which has suffered from an escalation in urban violence ever since a truce between rival mara gangs broke down in 2014. Honduras also faces similar gang-related issues. Cuba, Haiti, Jamaica and Guatemala all fell in the regional rankings even though all of them—except for Guatemala—saw improvements in their score, particularly in the indicators relating to internal peace. Finally, Mexico remains at the bottom of the regional ranking as a result of a mild score deterioration driven by a rising military and security presence and the increased number of displaced people resulting from the ongoing drugs war. In broad terms, Central America and the Caribbean will continue to benefit from the absence of intra-regional conflicts, and minimal nuclear and heavy weapons capabilities among them, although domestic security issues—mainly in the form of crime—will remain the region’s biggest obstacle to peace.
TABLE 1.4 CENTRAL AMERICA & THE CARIBBEAN RANKINGS
COUNTRY OVERALL RANK
OVERALL SCORE
CHANGE IN SCORE
REGIONAL RANK
Costa Rica 33 1.699 0.000 1
Panama 49 1.837 -0.069 2
Nicaragua 69 1.975 -0.013 3
Trinidad and Tobago
84 2.056 -0.026 4
Cuba 85 2.057 -0.006 5
Haiti 89 2.066 -0.011 6
Jamaica 92 2.091 -0.009 7
Dominican Republic
99 2.143 0.005 8
Honduras 111 2.237 0.004 9
El Salvador 111 2.237 -0.024 9
Guatemala 117 2.270 0.021 11
Mexico 140 2.557 0.003 12
REGIONAL AVERAGE 2.102
14

SOUTH AMERICA
Despite a slight improvement in the overall score since last year, South America as a region dropped one notch in the global rankings—now fifth out of nine regional groupings, overtaken by Central America and the Caribbean, albeit by a very narrow margin. In the past year, South America has continued to benefit from low levels of international conflict and militarisation, given the lack of any significant external conflicts affecting the region and relatively low spending on developing heavy weapons or financing large armies. Relations among neighbouring countries are mostly peaceful, despite the odd and periodical tension between Venezuela and neighbouring Colombia and Guyana. This year, Venezuela’s score for relations with neighbouring countries deteriorated as tension escalated. This situation reflects domestic political attempts to boost nationalism amid deep economic and political difficulties for the government of President Maduro, which is fighting for survival. There are also historical border tensions, channelled via the International Court of Justice, between Chile and Peru and Chile and Bolivia, regarding gaining sea access for the latter. In terms of internal peace, the region overall performs below the global average in spite of slight improvements in most countries. Argentina and Venezuela and, to a lesser extent, Guyana and Peru are the exceptions. There has been an increase in persecution of political dissidents in Argentina, under the government of Cristina Fernández de Kirchner, as well as in Venezuela. On 10 September 2015, Leopoldo López, a Venezuelan opposition leader, was sentenced to 13 years and nine months in prison for public incitement to violence. For both countries this situation is reflected by a weaker performance on the Political Terror Scale. Greater political instability in Venezuela has also contributed to this year’s score deterioration. Overall, the regional rankings continue to be led by Chile and Uruguay, which rank 27th and 35th, respectively, out of 163 analysed countries. Venezuela, in 143th position, and Colombia, in 147th, close the regional classification.
TABLE 1.5 SOUTH AMERICA RANKINGSCOUNTRY OVERALL
RANKOVERALL
SCORECHANGE IN
SCOREREGIONAL
RANK
Chile 27 1.635 -0.005 1
Uruguay 35 1.726 -0.031 2
Argentina 67 1.957 0.006 3
Ecuador 76 2.020 -0.011 4
Paraguay 80 2.037 -0.020 5
Bolivia 81 2.038 -0.015 6
Peru 85 2.057 -0.014 7
Guyana 95 2.105 0.003 8
Brazil 105 2.176 0.007 9
Venezuela 143 2.651 0.034 10
Colombia 147 2.764 -0.012 11
REGIONAL AVERAGE 2.106
SUB-SAHARAN AFRICA
Sub-Saharan Africa’s average score deteriorated slightly, although it continues to rank ahead of Russia and Eurasia, South Asia, and MENA. The deterioration of the average score masks sharp variations in country performance. For example, stronger relations with neighbouring countries—driven by efforts to bolster regional security co-operation—helped improve the score of countries such as Chad, Mauritania and Niger. Unfortunately though, the threat posed by Islamist terrorist groups has continued to weigh on the score of many countries in the Sahel and West African region. In other countries, the holding of elections has driven improvements in overall scores. Most notably, Nigeria experienced its first democratic transition following the presidential election, reflected in an improvement in its score on political instability. Guinea and the Central African Republic (CAR) also saw their scores improve as political stability strengthened following the holding of elections, although the CAR remains among the worst-performing countries in the region. South Africa was a top-five improver globally—though it still ranks a lowly 126th worldwide—driven by an improvement in the Political Terror Scale, as well as a reduction in arms trade and military spending. After falling 42 places in the 2015 GPI, Djibouti’s rank has fallen a further 19 places in the 2016 index as social unrest and resentment against the government’s authoritarian rule have continued to intensify in the run-up to the April 2016 presidential election. Burundi also performed poorly as the country slid towards civil war following the incumbent president’s controversial efforts to cling onto power by seeking a third term in office, which his opponents claimed was unconstitutional. Burkina Faso saw its score deteriorate too, as insecurity and crime levels deteriorated as a result of the turbulent political transition following the ousting of the country’s long-time president in late 2014. Côte d’Ivoire was one of the best performers in the 2015 GPI but fell back in the latest index as the fragile security situation in the sub-region was undermined by the March 2016 terrorist attack in Grand-Bassam on an Ivorian seaside resort.
South America has continued to benefit from low levels of international conflict and militarisation.
15GLOBAL PEACE INDEX 2016 | Results & Findings

TABLE 1.6 SUB-SAHARAN AFRICA RANKINGSCOUNTRY OVERALL
RANKOVERALL
SCORECHANGE IN
SCOREREGIONAL
RANK
Mauritius 23 1.559 0.023 1
Botswana 28 1.639 -0.018 2
Madagascar 38 1.763 -0.015 3
Zambia 40 1.783 -0.020 4
Sierra Leone 43 1.805 -0.012 5
Ghana 44 1.809 0.001 6
Malawi 45 1.817 0.056 7
Namibia 55 1.873 -0.002 8
Tanzania 58 1.899 0.001 9
Equatorial Guinea 62 1.940 -0.015 10
Lesotho 63 1.941 0.014 11
Togo 66 1.954 -0.004 12
Mozambique 68 1.963 0.002 13
Senegal 70 1.978 0.039 14
Benin 72 1.998 0.010 15
Liberia 72 1.998 0.023 15
Gabon 79 2.033 0.027 17
Burkina Faso 88 2.063 0.076 18
Swaziland 90 2.074 -0.017 19
The Gambia 92 2.091 -0.020 20
Angola 98 2.140 0.028 21
Uganda 101 2.148 -0.040 22
Guinea 101 2.148 -0.030 22
Niger 113 2.239 -0.032 24
Republic of the Congo
114 2.249 0.001 25
Guinea-Bissau 116 2.264 -0.003 26
Cote d’Ivoire 118 2.279 0.040 27
Ethiopia 119 2.284 0.002 28
Djibouti 121 2.292 0.054 29
Mauritania 123 2.295 -0.044 30
South Africa 126 2.316 -0.047 31
Zimbabwe 127 2.322 0.009 32
Rwanda 128 2.323 -0.009 33
Cameroon 130 2.356 0.011 34
Kenya 131 2.379 0.007 35
Eritrea 135 2.460 0.022 36
Chad 136 2.464 -0.025 37
Mali 137 2.489 0.011 38
Burundi 138 2.500 0.065 39
Nigeria 149 2.877 -0.022 40
Democratic Republic of the Congo
152 3.112 -0.001 41
Central African Republic
157 3.354 -0.024 42
Somalia 159 3.414 0.032 43
South Sudan 162 3.593 0.001 44
REGIONAL AVERAGE 2.234
RUSSIA AND EURASIA
Russia and Eurasia’s position in the global ranking remains unchanged in the 2016 GPI, with the third worst regional score. The biggest improvements in score within the region were registered by Belarus, Kazakhstan and Uzbekistan. The largest deteriorations in score were registered by Tajikistan and Ukraine. In Tajikistan this reflects the rise in the risk of internal conflict, driven by the increasingly authoritarian rule of the president, Emomali Rahmon, and a serious economic downturn. In September 2015, a major conflict within the elite led the government to accuse the deputy minister of defence, Abdulhalim Nazarzoda, of treason. A firefight between government troops and his supporters led to the death of at least 45 people. For some countries, the aggregate scores masked divergent trends on different metrics. In the case of Ukraine, for example, a second ceasefire agreement signed in February 2015 led to a significant reduction in fighting in the conflict in the east of the country. Nevertheless, its score was dragged down by a sharp rise in militarisation. In the case of Russia, while hostilities were dampened down in the Donbas region of Ukraine, in September their air force launched a major bombing campaign in Syria. The five-and-a-half-month campaign—ostensibly aimed at combating Islamic State, but largely serving to shore up the regime of President Bashar al-Assad—was the country’s first military engagement outside the post-Soviet space since the dissolution of the Soviet Union. The campaign led to a serious diplomatic standoff with Turkey in November, after the latter downed a Russian attack aircraft it claimed had violated Turkish airspace. In March 2016 President Vladimir Putin declared that Russia would withdraw the “main part” of its forces, as its principal military objectives had been met. However, with peace negotiations unlikely to yield a lasting settlement, lower-level Russian military involvement may continue.
TABLE 1.7 RUSSIA & EURASIA RANKINGSCOUNTRY OVERALL
RANKOVERALL
SCORECHANGE IN SCORE
REGIONAL RANK
Moldova 65 1.953 -0.002 1
Kazakhstan 75 2.019 -0.028 2
Georgia 85 2.057 -0.015 3
Belarus 106 2.202 -0.035 4
Turkmenistan 106 2.202 0.000 4
Uzbekistan 109 2.216 -0.028 6
Armenia 110 2.218 -0.014 7
Tajikistan 122 2.293 0.021 8
Kyrgyz Republic 124 2.297 -0.003 9
Azerbaijan 134 2.450 0.006 10
Russia 151 3.079 -0.007 11
Ukraine 156 3.287 0.078 12
REGIONAL AVERAGE 2.356
16

SOUTH ASIA
South Asia’s position remained unchanged at eighth out of the nine regions. Overall, the individual overall scores of Afghanistan, Nepal and India deteriorated, while for Bhutan, Sri Lanka and Pakistan, scores improved modestly. Internal security concerns were heightened in Bangladesh and Nepal owing to anti-government protests that have led to an increased number of detainees. In terms of regional rank, most countries have remained unchanged, with Bhutan remaining the most peaceful and Afghanistan the least. Following the withdrawal of most international forces from Afghanistan, the security situation has remained volatile. Domestic security forces have struggled to contain militant violence, which has posed threats beyond Afghan borders. This has caused its relations with neighbouring countries, particularly Pakistan, to deteriorate. Despite the Pakistani government’s crackdown on domestic terrorist activities by Islamist militant groups, the country has remained hostage to organised conflict, with rising numbers of casualties over the past year. The influence of the Taliban from Afghanistan has been particularly strong. As a result, Pakistan remains second from the bottom in South Asia. India’s scores for ongoing domestic and international conflict and militarisation have deteriorated slightly. The country remains vulnerable to acts of terror and security threats at its shared border with Pakistan. As such, the number of deaths caused by externally organised terror strikes has risen over the year. Sri Lanka saw the greatest upswing in its score in the region. The country successfully conducted two sets of elections in 2015—presidential in January and parliamentary in August which brought a reformist administration with a strong mandate. The country’s increased peacefulness is also due to better relations with neighbouring countries, particularly India.
TABLE 1.8 SOUTH ASIA RANKINGSCOUNTRY OVERALL
RANKOVERALL
SCORECHANGE IN SCORE
REGIONAL RANK
Bhutan 13 1.445 -0.033 1
Nepal 78 2.026 0.058 2
Bangladesh 83 2.045 0.003 3
Sri Lanka 97 2.133 -0.053 4
India 141 2.566 0.006 5
Pakistan 153 3.145 -0.001 6
Afghanistan 160 3.538 0.010 7
REGIONAL AVERAGE 2.414
MIDDLE EAST AND NORTH AFRICA
The Middle East and North Africa region, which was already ranked the lowest in the GPI, saw the biggest deterioration in its score in 2015, as the civil wars in Syria and Yemen deepened and led to increased external intervention. Yemen, whose long-standing political crisis exploded into outright civil war in early 2015, witnessed a large slump, driven by the rising casualty rate, a huge increase in refugees and internally displaced people, and worsening terror attacks by both al-Qaeda in the Arabian
Peninsula and ISIL. Yemen’s travails have also affected the rankings of some of the country’s neighbours; for example, the UAE’s military intervention in the war, which included dispatching ground troops to southern Yemen, has affected that country’s scores for ongoing domestic and international conflict and militarisation. The growing role of foreign powers in Syria’s debilitating civil war, which has now led to the deaths of between 250,000 and 470,000 people, has had an impact, with, most notably, Jordan launching waves of air strikes in January 2015 after one of its pilots was captured and executed by the Islamic State. Likewise, despite its size, Bahrain has fully participated in both the Yemen and Syria campaigns, which has in turn resulted in an uptick in its military spending and driven its significant score deterioration. Besides intervening abroad however, governments are now having to respond to the growing domestic threat posed by ISIL as demonstrated by the poorer terrorism scores for Saudi Arabia, Libya, Tunisia and Egypt. The latter two experienced a plunge in foreign arrivals following terrorist attacks on tourist targets. Nevertheless, the regional trend is not universally negative: Sudan, Iran and Oman, saw improvements in their scores. In addition, improvements on the Political Terror Scale and financial contributions to UN peacekeeping missions helped Iran strengthen its score. Finally, despite the failure to progress peace efforts with the Palestinians, a slight alleviation in political instability and military expenditure as a percentage of GDP helped garner a small improvement in Israel’s overall score.
TABLE 1.9 MIDDLE EAST & NORTH AFRICA RANKINGSCOUNTRY OVERALL
RANKOVERALL
SCORECHANGE IN SCORE
REGIONAL RANK
Qatar 34 1.716 -0.024 1
Kuwait 51 1.842 0.061 2
United Arab Emirates
61 1.931 0.017 3
Tunisia 64 1.949 -0.024 4
Oman 74 2.016 -0.028 5
Morocco 91 2.086 0.017 6
Jordan 96 2.127 0.024 7
Algeria 108 2.213 -0.024 8
Saudi Arabia 129 2.338 0.042 9
Bahrain 132 2.398 0.072 10
Iran 133 2.411 -0.032 11
Egypt 142 2.574 0.047 12
Israel 144 2.656 -0.037 13
Lebanon 146 2.752 -0.002 14
Palestine 148 2.832 - 15
Libya 154 3.200 0.065 16
Sudan 155 3.269 -0.024 17
Yemen 158 3.399 0.151 18
Iraq 161 3.570 0.006 19
Syria 163 3.806 0.011 20
REGIONAL AVERAGE 2.554
17GLOBAL PEACE INDEX 2016 | Results & Findings

RISERS & FALLERS
PANAM
A
YEMEN
THAILAND
UKRAINE
SRI LANKA
LIBYA
SOUTH AFR
ICA
TURKEY
BAHRAIN
MAURITA
NIA
–0.136
49
–0.120
125
–0.118
97
–0.113
126
–0.104
123
GPI rank 2016
Change in score 2015/16
A lowered score signifies an improved state
of peace
An increased score signifies a deterioration
in the state of peace
Panama recorded the largest score improvement in this year’s GPI, rising 24 positions in the rankings to 49th. It was followed by Thailand, which rose nine positions (albeit to a still-low 125th). Sri Lanka was up by 18 places to 97th while South Africa jumped seven slots to 126th. Mauritania was the next best improver, gaining eight positions to 123rd. Across the top risers there was an improvement in internal peace, with indicators related to internal conflict improving in Mauritania, South Africa and Sri Lanka, and reduced likelihood of violent demonstrations in Panama, Sri Lanka and Thailand. However, notwithstanding increased levels of internal stability, in some cases this was not accompanied with a strengthening of democracy (Thailand, South Africa and Mauritania all deteriorated in the EIU Democracy Index). Finally, military expenditure fell in all five countries except Thailand, while relations with neighbouring countries improved in Sri Lanka and Thailand.
Ongoing troubles in MENA resulted in three out of the five main fallers coming from that region. Yemen had the largest drop in the score, falling nine positions to 158th as its civil war expanded into a regional conflict. Ukraine came in with the second largest deterioration and was down four positions to 156th due to a shaky truce between government and separatists. Turkey was the next worse performer, falling seven slots to 145th due to heightened conflict with its Kurdish population, deteriorated relations with neighbouring countries (mainly Russia) and increased terrorism impact. It was followed by Libya, down three places to 154th on account of persisting factionalism, terrorism and a rise in perceptions of criminality. Finally, Bahrain tumbled 23 positions on the index to 132nd due to worsening relations with Iran, a rising rate of incarceration and a deterioration in the ease of access to small arms and light weapons.
+0.446
158
+0.237
156
+0.224
145
+0.197
154
+0.161
132
Across the top risers there was an improvement in internal peace, with indicators related to internal conflict improving in Mauritania, South Africa and Sri Lanka.
18
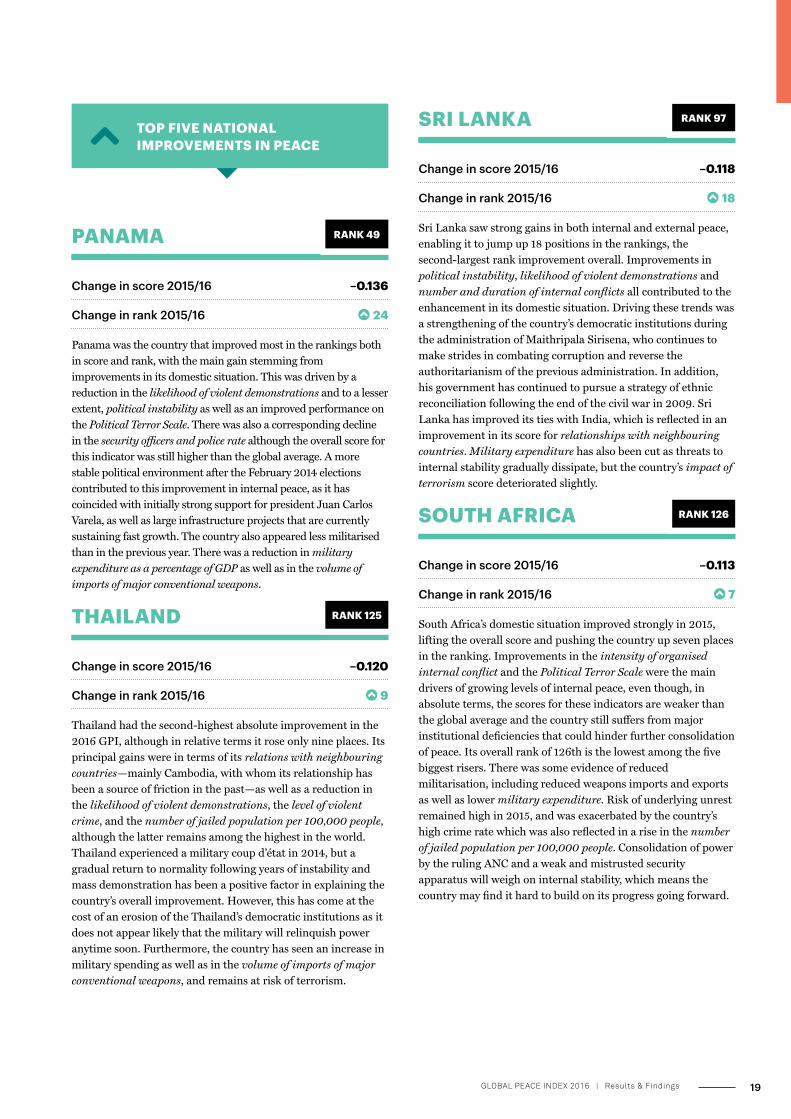
PANAMA RANK 49
Change in score 2015/16 –0.136
Change in rank 2015/16 24
Panama was the country that improved most in the rankings both in score and rank, with the main gain stemming from improvements in its domestic situation. This was driven by a reduction in the likelihood of violent demonstrations and to a lesser extent, political instability as well as an improved performance on the Political Terror Scale. There was also a corresponding decline in the security officers and police rate although the overall score for this indicator was still higher than the global average. A more stable political environment after the February 2014 elections contributed to this improvement in internal peace, as it has coincided with initially strong support for president Juan Carlos Varela, as well as large infrastructure projects that are currently sustaining fast growth. The country also appeared less militarised than in the previous year. There was a reduction in military expenditure as a percentage of GDP as well as in the volume of imports of major conventional weapons.
THAILAND RANK 125
Change in score 2015/16 –0.120
Change in rank 2015/16 9
Thailand had the second-highest absolute improvement in the 2016 GPI, although in relative terms it rose only nine places. Its principal gains were in terms of its relations with neighbouring countries—mainly Cambodia, with whom its relationship has been a source of friction in the past—as well as a reduction in the likelihood of violent demonstrations, the level of violent crime, and the number of jailed population per 100,000 people, although the latter remains among the highest in the world. Thailand experienced a military coup d’état in 2014, but a gradual return to normality following years of instability and mass demonstration has been a positive factor in explaining the country’s overall improvement. However, this has come at the cost of an erosion of the Thailand’s democratic institutions as it does not appear likely that the military will relinquish power anytime soon. Furthermore, the country has seen an increase in military spending as well as in the volume of imports of major conventional weapons, and remains at risk of terrorism.
TOP FIVE NATIONAL IMPROVEMENTS IN PEACE
SRI LANKA RANK 97
Change in score 2015/16 –0.118
Change in rank 2015/16 18
Sri Lanka saw strong gains in both internal and external peace, enabling it to jump up 18 positions in the rankings, the second-largest rank improvement overall. Improvements in political instability, likelihood of violent demonstrations and number and duration of internal conflicts all contributed to the enhancement in its domestic situation. Driving these trends was a strengthening of the country’s democratic institutions during the administration of Maithripala Sirisena, who continues to make strides in combating corruption and reverse the authoritarianism of the previous administration. In addition, his government has continued to pursue a strategy of ethnic reconciliation following the end of the civil war in 2009. Sri Lanka has improved its ties with India, which is reflected in an improvement in its score for relationships with neighbouring countries. Military expenditure has also been cut as threats to internal stability gradually dissipate, but the country’s impact of terrorism score deteriorated slightly.
SOUTH AFRICA RANK 126
Change in score 2015/16 –0.113
Change in rank 2015/16 7
South Africa’s domestic situation improved strongly in 2015, lifting the overall score and pushing the country up seven places in the ranking. Improvements in the intensity of organised internal conflict and the Political Terror Scale were the main drivers of growing levels of internal peace, even though, in absolute terms, the scores for these indicators are weaker than the global average and the country still suffers from major institutional deficiencies that could hinder further consolidation of peace. Its overall rank of 126th is the lowest among the five biggest risers. There was some evidence of reduced militarisation, including reduced weapons imports and exports as well as lower military expenditure. Risk of underlying unrest remained high in 2015, and was exacerbated by the country’s high crime rate which was also reflected in a rise in the number of jailed population per 100,000 people. Consolidation of power by the ruling ANC and a weak and mistrusted security apparatus will weigh on internal stability, which means the country may find it hard to build on its progress going forward.
19GLOBAL PEACE INDEX 2016 | Results & Findings

UKRAINE RANK 156
Change in score 2015/16 +0.237
Change in rank 2015/16 4
Ukraine’s GPI score deteriorated further in 2015 on account of the continuation of the conflict with pro-Russian separatists in the Donbas region that began in 2014. On the positive side, there were greater efforts to end the fighting, notably after the Minsk II agreement in February 2015, even though skirmishes are a regular occurrence. A lasting settlement appears elusive, however, owing to a reluctance to implement the peace deal from both the Russian and Ukrainian sides. Most indicators relating to domestic conflict deteriorated in 2015, as did the Political Terror Scale. The country also became more militarised: military expenditure as a share of GDP was up as were weapons exports and the armed services personnel rate. Ukraine’s internal stability also remains a cause for concern given slow progress on tackling corruption and in reforming state institutions.
TURKEY RANK 145
Change in score 2015/16 +0.224
Change in rank 2015/16 7
In 2015 Turkey suffered from a deepening of its internal security woes, a continued hard-line approach by the government of Recep Tayyip Erdoğan and spillovers from the conflict in neighbouring Syria. The main trigger for the deterioration in the domestic situation was the resurgence of conflict between the state and the Kurdistan Workers’ Party (PKK), as well as a rise in terrorist activity, mostly on the part of ISIL. The intensity of and the number of deaths from internal conflict have both deteriorated. Erdoğan’s tough stance against internal dissent has resulted in an increase in the number of jailed population as well as a rise in the number of security officers and police. Turkey’s relations with neighbouring countries also deteriorated in 2015 on account of frictions with Russia after its Syrian intervention. Turkey shot down a Russian attack aircraft which allegedly strayed into its airspace in November 2015. It has also been at odds with the EU over a solution to the refugee crisis. Although elections in 2015 consolidated Erdoğan’s authority, the excessive concentration of power in his hands, together with the numerous internal and external security threats, provides highly unpredictable prospects for sustained peace.
MAURITANIA RANK 123
Change in score 2015/16 –0.104
Change in rank 2015/16 8
Mauritania’s improvements in its domestic situation contributed strongly to the gains in the overall score, but it was the improvement in ongoing conflict and militarisation scores that was the main factor. Mauritania has been recovering from its own internal conflicts and has occasionally been affected by violent conflict in neighbouring countries, principally Mali. Financial contributions to UN peacekeeping missions was the biggest contributor to the improvement in its score. There has also been a reduction in the deaths from internal conflict as well as in the number and duration of internal conflicts due to greater efforts by the government to tackle extremism. Despite its heightened role in regional security, the country became less militarised: military expenditure fell, as did the number of armed services personnel, although this was partly offset by a rise in weapons imports. The Political Terror Scale also deteriorated as the government of Mohamed Ould Abdel Aziz cemented his authority.
TOP FIVE NATIONAL DETERIORATIONS IN PEACE
YEMEN RANK 158
Change in score 2015/16 +0.446
Change in rank 2015/16 9
Yemen suffered by far the steepest deterioration in its GPI score. In early 2015, its ongoing civil war escalated into a regional conflict due to the intervention of a coalition of Arab states led by Saudi Arabia and including almost every other Gulf state. This resulted in a campaign of airstrikes and ground operations and, coupled with the existing conflict between domestic factions, has created a major humanitarian crisis. The result has been a massive rise in the number of refugees and internally displaced people as well as a rise in deaths from internal conflict. Societal safety and security factors, including perceptions of criminality, likelihood of violent demonstrations and the Political Terror Scale, have also deteriorated significantly. The presence and participation of al-Qaeda and ISIL affiliates further increases the risk of terrorism and instability in the future.
20

LIBYA RANK 154
Change in score 2015/16 +0.197
Change in rank 2015/16 3
Libya remains mired in the fallout from the 2011 NATO intervention which, despite successful in its initial military aims, left the country vulnerable to factionalism and infiltration by terrorist groups. Governability had been rendered ineffective as a result of warring factions that set up separate governments in the eastern and western halves of the country. An additional threat to peace is the presence of ISIL, among other jihadist groups, which has taken advantage of the post-intervention chaos to establish a foothold in the country. It is believed that ISIL forces in Libya are the strongest outside of Syria and Iraq, and the ineffectiveness of either existing government in combating them represents a major threat to peace. A high level of violent crime has been a major drag on the internal and overall scores, as has been a rise in the Political Terror Scale and, to a lesser extent, political instability. Meanwhile, the scores for militarisation have deteriorated due to the sharp rise in military expenditure and weapons imports, along with a reduction in financial contributions to UN peacekeeping missions.
BAHRAIN RANK 132
Change in score 2015/16 +0.161
Change in rank 2015/16 23
Bahrain fell 23 positions in the overall ranking due to a deterioration in ongoing conflict and militarisation scores. This was driven by its participation in the Saudi-led coalition in Yemen; the country has contributed both air and ground forces to the operation, which likely contributed to its increasing military expenditure and weapons imports. At the same time, a downgrade of diplomatic ties with Iran explains a deterioration in the score for relations with neighbouring countries. The domestic situation also deteriorated as a result of a continuing crackdown by the government of the king, Hamad bin Isa al-Khalifa, against dissenters—some of whom have undertaken peaceful opposition, while others have employed violence. As part of this crackdown, the number of jailed population has increased. Meanwhile, the ease of access to small arms has risen, which could be a prelude to greater internal instability. Notwithstanding the monarchy’s hard-line stance, it has attempted to present itself as a moderate and reformist institution, although it is still unclear (and unlikely) that this will translate into an improvement in its domestic situation.
Yemen suffered by far the steepest deterioration in its GPI score.
21GLOBAL PEACE INDEX 2016 | Results & Findings
GPI DOMAIN & INDICATOR ANNUAL CHANGES
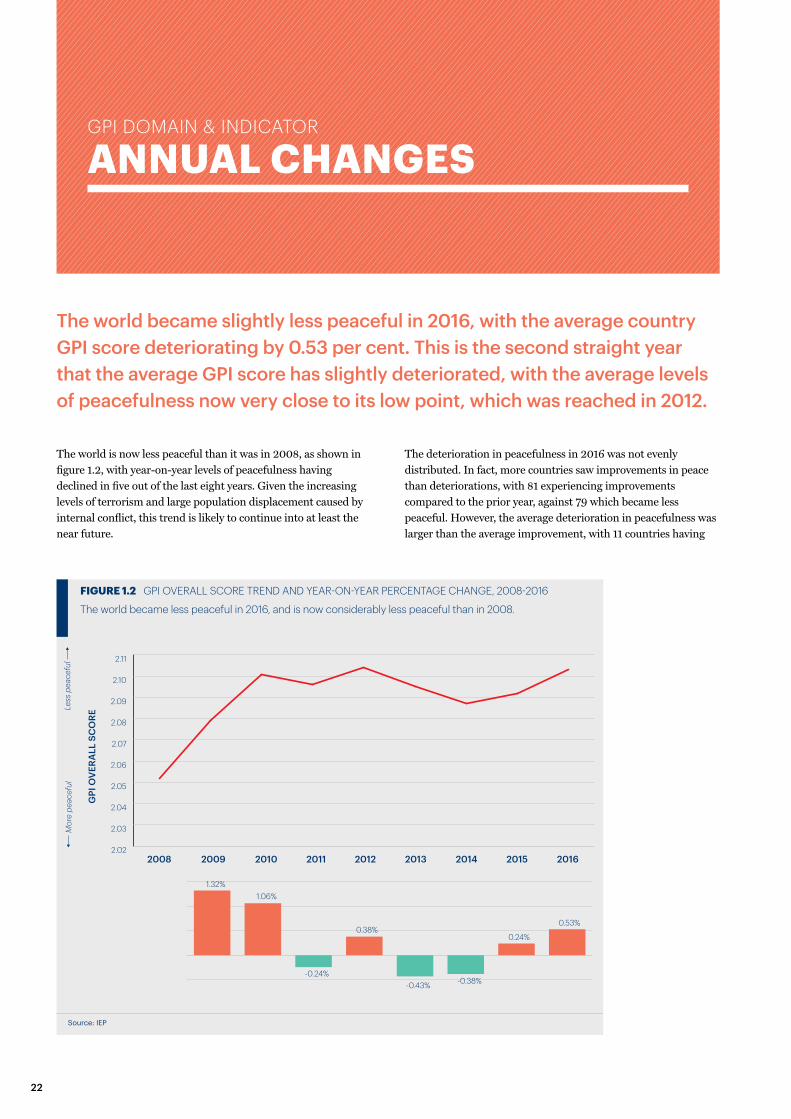
The world became slightly less peaceful in 2016, with the average country GPI score deteriorating by 0.53 per cent. This is the second straight year that the average GPI score has slightly deteriorated, with the average levels of peacefulness now very close to its low point, which was reached in 2012.
The world is now less peaceful than it was in 2008, as shown in figure 1.2, with year-on-year levels of peacefulness having declined in five out of the last eight years. Given the increasing levels of terrorism and large population displacement caused by internal conflict, this trend is likely to continue into at least the near future.
Source: IEP
FIGURE 1.2 GPI OVERALL SCORE TREND AND YEAR-ON-YEAR PERCENTAGE CHANGE, 2008-2016
The world became less peaceful in 2016, and is now considerably less peaceful than in 2008.
2.02
2.03
2.04
2.05
2.06
2.07
2.08
2.09
2.10
2.11
20152014201320122011 2016201020092008
GPI
OV
ERA
LL S
CO
RE
Mor
e pe
acef
ulLe
ss p
eace
ful
1.32%1.06%
0.38%0.24%
0.53%
-0.24%-0.43% -0.38%
The deterioration in peacefulness in 2016 was not evenly distributed. In fact, more countries saw improvements in peace than deteriorations, with 81 experiencing improvements compared to the prior year, against 79 which became less peaceful. However, the average deterioration in peacefulness was larger than the average improvement, with 11 countries having
22

deteriorations of greater than five per cent, compared to only four countries with improvements of greater than five per cent.
Looking at the three GPI domains of societal safety and security, ongoing conflict and militarisation, the average deterioration was also larger than the average improvement. The societal safety and security and ongoing conflict domains both recorded significant deteriorations, as shown in figure 1.3. Deteriorations on the ongoing conflict domain were largely concentrated in a small handful of countries, most notably Egypt and Turkey. Five of the ten largest deteriorations on this domain occurred in countries from the Middle East and North Africa region. Whilst the militarisation domain did improve, the size of the improvement was much smaller.
The largest single indicator deterioration was terrorism impact, which declined by nearly ten per cent, as shown in figure 1.4. The average terrorism impact indicator score has now deteriorated for four years in a row and is over 20 per cent worse than in 2008. Increases in terrorist activity occurred across a number of regions, with prominent attacks occurring in France, Belgium, Turkey and Pakistan in the last six months alone. In total, 77 countries recorded a deterioration in the impact of terrorism, and of the 25 largest increases, nine occurred in OECD countries.
The average political instability score deteriorated by just under five per cent, with large deteriorations in Djibouti, Guinea-Bissau and Poland. However, there was an improvement in Egypt, Nigeria and Sudan, three countries which have suffered from significant instability in recent years. The one other indicator to show a significant deterioration was the Political Terror Scale, with notable deteriorations in Greece, Argentina, South Korea, Ukraine and Yemen. However, the average Political Terror Scale score of 2.58 is still better than the worst year in 2009.
Both military expenditure and external conflicts fought deteriorated by around four per cent in 2016, highlighting an increase in external conflict. However, these deteriorations come on the back of several years of improvement in both indicators, particularly military expenditure. The deterioration in external conflicts fought was driven by countries becoming embroiled in already existing regional conflicts, with Jordan’s strong military response to ISIL leading it to have the largest overall deterioration. In MENA, Bahrain, the United Arab Emirates and Saudi Arabia also became more strongly involved in regional conflict, whilst in sub-Saharan Africa, Niger, Chad, South Sudan and Cameroon experienced significant deteriorations in their external conflicts fought score.
Source: IEP
FIGURE 1.3 GPI YEAR-ON-YEAR SCORE CHANGE AND COUNTRY CHANGES BY DOMAIN, 2015 –2016
The ongoing conflict and societal safety and security domains both deteriorated on average, however, militarisation improved from 2015 to 2016.
-0.020 -0.005 0.000 0.005 0.010 0.015 0.020 0.025
Ongoing conflict
Safety & security
GPI overall score
Militarisation
More peaceful Less peaceful
CHANGE IN AVERAGE DOMAIN SCORE, 2015 TO 2016
No change
Less peaceful
More peaceful
Ongoing conflictSafety & securityGPI overall scoreMilitarisation
76
86
79
81
2
84
77
54 54
54
1
23GLOBAL PEACE INDEX 2016 | Results & Findings

Of the indicators that improved the most, the largest single improvement occurred in the UN peacekeeping funding indicator, followed by the security officers and police rate indicator. According to the most recently available data, the security officers and police rate decreased in 37 countries and increased in just 24, with the largest reductions in police force size occurring in Kazakhstan, Moldova and France. The security officers and police rate also declined in the United States for the fourth consecutive year, with the country now scoring well below the global average on this indicator.
After several years of deterioration, the violent demonstrations and violent crime indicators both improved slightly. There was a
Source: IEP
FIGURE 1.4 FIVE LARGEST INDICATOR IMPROVEMENTS AND DETERIORATIONS, 2015 - 2016
Of the indicators that changed the most from 2015 to 2016, terrorism and political instability had the largest deteriorations, with only UN peacekeeping funding showing a large improvement.
-0.15 -0.10 -0.05 -0.00 0.05 0.10
Terrorism impact
Refugees and IDPs
Political Terror Scale
Military expenditure
External conflicts fought
Violent demonstrations
Incarceration
Violent crime
Security o�icers and police
UN peacekeeping funding
More peaceful Less peacefulCHANGE IN AVERAGE INDICATOR SCORE, 2015 TO 2016
significant fall in the chance of violent demonstrations in Nigeria, Panama, Sudan and Uruguay, albeit with a concurrent increase in Yemen, Senegal, Nepal, Djibouti, Cote d’Ivoire and Burundi.
The violent crime indicator improved in 13 countries and deteriorated in just five, although the largest absolute change occurred in Libya, where the violent crime indicator moved from 3.5 to the maximum possible score of 5. Libya is now one of only 20 countries to have the worst possible score on the violent crime indicator.
24

TRENDS IN PEACE

286%Deaths from terrorism increased by
THE WORLD HAS BECOME 2.44% LESS PEACEFUL SINCE 2008
What has been driving the change in peacefulness?
8,466
101,406
32,715
reduced military expenditure as a % of GDP.
0
10
20
30
40
50
60 In 2015, the UNHCR recorded over 57 million: - refugees - internally-displaced people, - and others of concern
IMPROVEMENTS
106 countries
DETERIORATIONS
34%
65%
5BATTLE DEATHS INCREASED OVER FIVE FOLD
19,601
24 25

THE WORLD HAS BECOME 2.44% LESS PEACEFUL SINCE 2008
What has been driving the change in peacefulness?
� The fall in peacefulness was not evenly distributed around the globe. Seventy-seven countries actually became more peaceful over this period compared to 85 which deteriorated. Most of the deterioration in peacefulness was concentrated in four areas: the Middle East and North Africa, northern sub-Saharan Africa, Central America and the countries dividing Russia from Europe, particularly Ukraine.
� The region with the largest deterioration in peacefulness was the Middle East and North Africa. It had the largest average deterioration on seven of the 23 GPI indicators. Most of these changes were linked to the conflict in Syria and the increase in the number of refugees and IDPs.
� On average, internal indicators deteriorated while external indicators improved. The biggest deteriorations occurred in terrorism impact, refugees and IDPs and deaths from internal conflict, while the biggest improvements occurred in military expenditure, armed service personnel rate and external conflicts fought.
� Two indicators improved by more than ten per cent, external conflicts fought and UN peacekeeping funding.
� The terrorism impact indicator had the greatest overall deterioration, with all but two regions recoding an increase in terrorism over the past decade.
� The total number of deaths from terrorism rose from less than 10,000 in 2008 to over 30,000 in 2014.
� Terrorism is at historical levels, battle deaths are at a 25 year high, and the number of refugees is at a level not seen in sixty years.
� Internal peace and the societal safety and security domain declined every year for the past eight years.
� The armed services personnel rate declined in 39 of the 51 countries classified as authoritarian regimes since 2008.
� The number of refugees and IDPs indicator, deteriorated across all regions and for all government types since 2008.
� Nine countries have more than ten per cent of their population displaced in some form, with Somalia and South Sudan both having more than 20 per cent and Syria over 60 per cent.
� In the long term trend, since the end of the Second World War, there have been a number of positive and negative trends in peacefulness.
� Firstly, there has been a shift away from conflict between nations to conflict within nations, with a parallel shift away from external militarisation to a focus on internal security.
� As internal conflict became more prominent, external parties are now more likely to become involved, or to suffer from the consequences of violence as local conflicts turn into regional or even continental crises.
� Finally, while societal safety and security has been improving, there has been a large increase in expenditure related to containing violence, such as policing and incarceration over the past 50 years, as an absolute inflation-adjusted figure, and also as a percentage of total government spending.
HIGHLIGHTS
The world has become less peaceful over the last decade, with a deterioration of 2.44 per cent in the average country GPI score.
24 25GLOBAL PEACE INDEX 2016 | Trends in Peace

TRENDS IN PEACE SINCE 2008
The overall trend for the past nine years recorded a decrease in peacefulness across multiple domains, regions and indicators. The deteriorating trend in peacefulness was dominated by decreases in internal security in the MENA region. Of the improvements in peacefulness, the majority occurred on indicators related to external peace and militarisation, with both average military expenditure and the armed services personnel rate improving over the past decade.
The change in peacefulness since 2008 was not equally distributed across countries, regions and government types as shown in table 2.1. At the indicator level, the greatest change occurred on terrorism impact, which deteriorated in every region other than South Asia. There was a deterioration of over 15 per cent in seven regions, and deterioration across all four government classifications: full democracy, flawed democracy, hybrid regimes and authoritarian regimes. The only other indicator that deteriorated across nearly as many regions and government types was the refugees and IDPs indicator, which deteriorated across eight regions and for all government types other than full democracies. Of the indicators that improved, the armed services personnel rate fell in seven regions, as did UN peacekeeping funding.
Figure 2.1 shows an index chart of the percentage change by domain and subdomain from 2008. While all of the domains initially deteriorated over the first two years of the index, both external peace and militarisation improved over the past five years. This was driven by increases in UN peacekeeping funding, smaller numbers of army personnel and reduced military spending. By contrast, internal peace and safety and security declined every year for the past eight years, and although there was some improvement on the ongoing conflict domain from 2010 to 2015, recent increases in conflict mean that the average ongoing conflict domain score is two per cent higher in 2016 than in 2008.
Source: IEP
FIGURE 2.1 GPI SCORE CHANGE BY DOMAIN, 2008 — 2016
While external peace and militarisation improved slightly, internal peace and societal safety and security had large deteriorations.
-3
-2
-1
0
1
2
3
4
5
Militarisation
External peace
Ongoing conflict
Internal peaceSafety & security
201620152014201320122011201020092008PERC
ENTA
GE
CH
AN
GE
SIN
CE
200
8Le
ss p
eace
ful
Mor
e pe
acef
ul
26 27

TABLE 2.1 PERCENTAGE CHANGE MATRIX FOR ALL GPI INDICATORS AND DOMAINS BY REGION AND GOVERNMENT TYPE, 2008 TO 2016
Terrorism deteriorated across most regions, while the Middle East and North Africa had the largest number of indicators deteriorating.
IND
ICAT
OR
ASI
A-P
AC
IFIC
CEN
TRA
L A
MER
ICA
AN
D
CA
RIBB
EAN
EURO
PE
MID
DLE
EA
ST A
ND
NO
RTH
AFR
ICA
NO
RTH
AM
ERIC
A
RUSS
IA A
ND
EU
RA
SIA
SOU
TH A
MER
ICA
SOU
TH A
SIA
SUB-
SAH
AR
AN
AFR
ICA
AU
THO
RITA
RIA
N R
EGIM
E
FLAW
ED D
EMO
CR
AC
Y
FULL
DEM
OC
RA
CY
HYB
RID
REG
IME
GPI overall score -2.0% 2.3% -1.3% 13.9% -4.8% -0.6% 2.1% 2.5% 2.3% 5.7% -1.0% -0.5% 2.0%
Safety & security 0.5% 3.0% 1.5% 14.2% -2.2% -1.2% 5.7% 3.1% 4.3% 6.7% 1.7% 0.8% 3.5%
Ongoing conflict -3.4% 3.4% -4.7% 20.6% -13.3% -0.3% -3.8% -0.9% 1.5% 8.4% -3.5% -7.6% 0.5%
Militarisation -6.7% -0.6% -2.7% 1.5% 0.6% -1.7% -2.3% 3.9% -3.9% -1.9% -4.8% 4.5% -2.0%
Perceptions of criminality 1.9% 34.3% 4.4% 22.0% 0.0% -2.6% 13.9% 4.5% 4.3% 9.6% 7.5% 5.3% 8.7%
Police 6.2% -7.2% -3.8% 11.1% -13.6% -6.5% 4.8% 18.4% 0.7% 6.9% -1.7% 2.0% -3.0%
Homicide -4.9% 5.4% -9.2% -1.7% -12.9% -14.3% -1.8% -3.9% -0.7% 0.7% -4.6% -4.9% -6.0%
Incarceration 5.8% 20.6% 2.1% 1.4% -0.1% -11.7% 24.7% 10.3% 1.3% 3.7% 3.9% -0.8% 8.5%
Access to firearms -8.5% 2.4% -0.6% 11.4% 0.0% 0.0% 2.7% 0.0% -3.6% 0.8% -1.0% 0.0% -1.7%
Intensity of internal conflict -4.8% 13.6% 1.9% 31.1% 0.0% 0.0% 14.3% -6.4% 1.2% 13.0% 5.5% -5.0% -2.9%
Violent demonstrations 6.5% -10.8% 14.5% 18.3% 33.3% 5.7% 4.3% 15.2% 4.8% 6.0% 8.3% 11.5% 7.6%
Violent crime -2.1% 1.1% 2.3% 21.3% 0.0% -8.8% 5.6% -4.8% 8.4% 7.8% 3.0% -7.3% 3.4%
Political instability -8.5% -11.2% 13.4% 4.2% 0.0% 3.9% -5.7% -3.1% 4.1% 3.5% -0.4% 5.3% -1.4%
Political terror scale -2.9% -7.6% -15.3% 3.6% -25.0% 7.5% -3.4% -3.9% -2.2% 0.9% -8.7% -12.5% -2.9%
Weapons imports 7.9% 9.2% -10.4% 19.7% 3.8% 22.2% 7.0% 17.3% 8.1% 23.8% -7.6% -0.2% 13.7%
Terrorism 21.7% 7.8% 24.1% 26.9% 39.9% 16.4% 13.6% -3.6% 30.6% 22.4% 16.5% 25.5% 23.2%
Internal conflicts fought -4.2% 24.8% -1.6% 4.5% 0.0% 10.5% -19.3% -6.7% -3.0% 1.4% -8.6% -1.6% -0.5%
Conflicts deaths (internal) 10.4% 33.3% -2.7% 44.4% 0.0% 41.9% -2.4% 3.7% 14.7% 27.4% 1.9% 0.0% 21.5%
Military expenditure -17.6% 4.4% -11.5% 5.8% -12.5% -0.8% -7.3% 7.9% -6.4% -3.8% -9.1% -5.2% -1.4%
Armed services personnel -4.5% 2.2% -5.6% -20.0% -4.6% -2.0% -0.8% 6.2% -3.2% -9.8% -3.1% -5.2% -3.4%
UN peacekeeping funding -22.9% -16.3% 6.2% -9.0% -14.8% -23.8% -16.7% 10.4% -12.4% -15.4% -11.4% 13.2% -11.9%
Nuclear and heavy weapons 0.6% -0.1% -6.4% -4.6% -0.3% -5.3% 0.7% 0.2% 0.9% -2.5% -1.4% -5.1% -1.1%
Weapons exports 7.5% 0.0% 5.6% 0.9% 13.4% 10.8% 0.4% -0.1% 0.7% 3.0% -5.3% 24.7% 2.6%
Refugees and IDPs 1.9% 11.4% 2.6% 83.8% 0.0% 29.2% 35.9% 26.6% 15.7% 29.8% 11.1% 0.0% 26.9%
Neighbouring country relations 1.1% -8.3% 8.8% 20.1% 0.0% 5.0% -13.0% 5.6% -6.1% 5.7% 1.8% -5.0% 0.5%
External conflicts fought -20.9% -35.7% -31.5% 24.7% -4.1% -49.5% 0.0% 4.6% 45.5% 15.0% -31.4% -15.2% -7.2%
Conflict deaths (external) -4.8% -1.1% -4.9% 6.0% -39.5% 2.4% 0.0% 7.5% 0.0% -1.4% 0.3% -13.3% 2.4%
26 27GLOBAL PEACE INDEX 2016 | Trends in Peace

Regionally, the largest deteriorations occurred in the Middle East and North Africa, which deteriorated on average across 19 of the 23 indicators. Many of the deteriorations in the region were highly correlated, as increasing internal conflict led to increasing perceptions of criminality, higher levels of violent crime, greater government repression, the outbreak of terrorism and widespread population displacement. While the average GPI score in the Middle East and North Africa deteriorated by 14 per cent, no other region had an improvement or deterioration of more than five per cent.
Figure 2.2 depicts the percentage change in average indicator score for those indicators that improved or deteriorated by more than five per cent. In total, ten indicators had large fluctuations, with six deteriorating and four improving. All four indicators that improved are measures of external peacefulness, while five of the six indicators that deteriorated are measures of internal peacefulness.
The single greatest indicator change occurred on terrorism impact, which deteriorated by more than 20 per cent on average, followed by refugees and IDPs and internal conflict
deaths. There were also smaller deteriorations for the intensity of internal conflict, violent demonstrations and perceptions of criminality indicators. No indicator improved by more than 15 per cent, with only external conflicts fought and UN peacekeeping funding improving by more than ten per cent.
The past decade has seen a continuation of longer term trends in peacefulness away from external conflicts between states and towards more internal conflicts within states. Although it is too early to state whether the decrease in peacefulness represents a reversal of the ‘long peace’ that started at the end of the Second World War, there are a number of worrying signs that suggest conflict could escalate. The increase in terrorism across regions highlights the ability of terrorist groups to ‘export’ violence beyond national boundaries, as demonstrated by the increase in terrorist attacks in OECD countries in the past year. Similarly, the entanglement of more nations into the Syrian conflict, coupled with the enormous outflow of displaced people, shows that even internal conflicts cannot be quarantined and their repercussions can be felt across borders and even continents.
Source: IEP
FIGURE 2.2 GPI PERCENTAGE CHANGE FROM 2008 TO 2016 BY INDICATOR
Six indicators deteriorated by more than five per cent, with four improving by more than five per cent.
-20%
-15%
-10%
-5%
0%
5%
10%
15%
20%
25%
External conflicts foughtUN peacekeeping funding
Armed services personnelMilitary expenditure
Intensity of internal conflictViolent demonstrationsPerceptions of criminality
Conflicts deaths (internal)Refugees and IDPsTerrorism impact
PERC
ENTA
GE
CH
AN
GE
SIN
CE
200
8Le
ss p
eace
ful
Mor
e pe
acef
ul
201620152014201320122011201020092008
The single greatest indicator change occurred on terrorism impact, which deteriorated by more than 20 per cent on average, followed by refugees and IDPs and internal conflict deaths.
28 29

While still accounting for a small percentage of the total number of violent deaths, terrorism has grown steadily over the past decade. The number of yearly incidents has almost tripled since 2011, and the number of deaths has increased to over 30,000. The total level of terrorist activity increased by 80 per cent from 2013 to 2014, the largest increase in the years covered by the Global Terrorism Database, which has data back to 1970. Estimates created by IEP suggest that the level of terrorism shows no sign of abating in 2015 and early 2016.
INDICATOR TRENDS
The majority of terrorist activity is highly concentrated in five countries: Iraq, Nigeria, Afghanistan, Pakistan and Syria. Between them these countries accounted for 78 per cent of deaths from terrorism in 2014. However, there are signs that terrorism is becoming more common across the globe, with almost every region having an increase in its terrorism impact score from 2008 to 2016. The number of countries with over 500 deaths from terrorism increased from five to 11 between 2013 and 2014. At the other end of the scale, the number of countries which recorded no terrorist incidents at all decreased from 49 in 2008, to 37 in 2016 out of 163 countries.
Although there are many hundreds of active terrorist groups in the world, most are responsible for only a few deaths or no deaths at all. The responsibility for the majority of deaths comes from just a few large terrorist groups, with Boko Haram and ISIL being responsible for over 50 per cent of deaths by known actors. Both of these groups also function as combatants in existing civil and territorial disputes, with ISIL being involved in more than 20,000 battle-related deaths in addition to over 6,000 deaths from terrorism.
The past year has also seen a large increase in the number of deaths from terrorism in the west. The number of deaths from terrorism has more than doubled in Europe (excluding Turkey) over the last five years, with the vast majority of these deaths occurring in early 2016. France, Belgium and the US have all experienced a significant terrorist attack in the last six months. Prior to the recent upswing in terrorism in the West, the majority of deaths from terrorism in Europe and North America since 2001 were caused by lone wolf attacks, usually from individuals with radical nationalist and anti-government ideologies.
TERRORISM
Source: Global Terrorism Database
FIGURE 2.3 TERRORIST INCIDENTS AND DEATHS FROM TERRORISM, 2006-2014
The number of deaths from terrorism has risen dramatically since 2011, from under 10,000 to over 30,000.
35,000
30,000
25,000
20,000
15,000
10,000
5,000
-20142012201020082006
Incidents
Deaths
Source: IEP, Global Terrorism Database
FIGURE 2.4 DEATHS FROM TERRORISM IN EUROPE (EXCLUDING TURKEY) AND NORTH AMERICA, 2006 TO 2015/16
In the last five years the number of deaths from terrorism has doubled compared to the previous five years in both Europe and North America.
0
50
100
150
200
250
300North America
Europe
2015/16201420132012201120102009200820072006
2012-2016(281)
2006-2011(126)
North AmericaEurope
DEA
THS
FRO
M T
ERRO
RISM
2012-2016(79)
2006-2011(24)
28 29GLOBAL PEACE INDEX 2016 | Trends in Peace

REFUGEES AND IDPS
The increase in conflict over the last decade has resulted in a very large increase in the number of refugees and internally displaced people (IDPs), with the number of refugees increasing from 9.8 million in 2006 to over 15 million in 2015, a 52 per cent increase in under a decade. The increase in the number of IDPs was even more dramatic, rising from just under 12.8 million in 2006, to 34 million in 2015, an increase of 166 per cent.
Source: UNHCR
FIGURE 2.5 TOTAL REFUGEES, IDPS AND OTHER POPULATIONS OF CONCERN TO UNHCR
The number of refugees, IDPs, and other populations of concern has almost doubled since 2007.
0
10
20
30
40
50
60
70
2011201020092008 201520142013201220072006
REFU
GEE
S, ID
PS, A
ND
OH
TERS
O
F C
ON
CER
N, M
ILLI
ON
S Others of Concern
IDPs
Refugees
The conflict in Syria was responsible for the vast majority of this increase. In 2007, just 0.1 per cent of the Syrian population was classified as refugees or IDPs. This figure rose to an extraordinary 63.18 per cent in 2015. The majority of these were internally displaced, although in 2015 and 2016 an increasing number began to leave the country, triggering the so-called European refugee crisis.
Whilst no other country comes close to having as many refugees and IDPs as a percentage of its population as Syria, there are nine other countries with more than ten per cent of their population displaced in some form, with Somalia and South Sudan both having more than twenty per cent of their population displaced. The majority of these countries are in the Middle East and North Africa, South Asia, or sub-Saharan Africa regions, with only Colombia and Cyprus being located outside of these three areas.
State failure, conflict and terrorism were the major drivers of the increase in refugees and IDPs, with the largest increases coming in countries engaged in protracted civil conflict. Outside of Syria, conflicts in Yemen, Libya, the Democratic Republic of the Congo and Ukraine all led to huge increases in the displaced population, from below one per cent to 9.3, 6.8, 4.3, and 3.9 per cent respectively.
The vast majority of refugees from conflict in the Middle East and North Africa are being hosted in nearby countries, with Turkey alone hosting an estimated 1.8 million refugees. Pakistan, Lebanon and Iran all hosted over or close to a million refugees as of mid-2015. There has been a large increase in the number of refugees seeking asylum in Europe, with UNHCR estimates suggesting that over a million refugees reached Europe by sea alone in 2015. The majority of asylum claims in Europe are being processed in Germany, with an estimated 159,900 asylum applications in the first half of 2015 alone. However, on a per capita basis Sweden is the European country which has taken in the most refugees, with approximately 1.5 per cent of the population being refugees in mid-2015.
DEATHS FROM INTERNAL CONFLICT
The number of deaths from internal conflict increased considerably over the last decade, rising from just under 36,000 in 2005-2006 to over 305,000 in 2014-2015. The majority of this increase is the result of conflict in Syria. Even if internal deaths from Syria are excluded from the calculations there was still a near five-fold increase in internal conflict deaths over the history of the GPI. Sri Lanka, India, Chad, Ethiopia and Colombia were the only countries that saw significant reductions in the number of deaths from internal conflict. Conversely, 16 countries had increases of over 1,000 deaths, with the largest increases occurring in Syria, Mexico, Iraq, Nigeria and Afghanistan.
Figure 2.6 highlights the nine countries with the largest increase in the number of deaths from internal conflict, excluding Syria. Mexico had an explosion of violence after the government initiated crackdown on cartel activity in 2007, and although the country has begun to become more peaceful over the last few years, the conflict still claimed over 30,000 lives in 2013-2014, which is just under the total number of people killed in terrorist incidents worldwide. The formation of ISIL led to a resurgence of deaths in Iraq, rising to over 32,000 and there was also a re-escalation of the conflict environment in Afghanistan, which experienced a 427 per cent increase in yearly internal conflict deaths from the 2008 GPI to the 2016 GPI, from 4210 to 22,170.
Of the nine countries (excluding Syria) with the most internal conflict deaths in the 2016 GPI, only three had a significant number of deaths nine years prior, with the rest experiencing breakouts of entirely new conflicts. In Nigeria, Boko Haram became the deadliest terrorist organisation in the world in 2014, seriously threatening the country’s internal stability. On top of terrorism, in 2014 Nigeria had 18,000 deaths from internal conflict. In Yemen, the long simmering Houthi insurgency first led to the Yemeni revolution in 2011, followed by the still ongoing Yemeni civil war. The number of internal conflict deaths has risen steadily as a result of this escalation, leading to over 10,000 deaths in the last two years.
30 31

EXTERNAL CONFLICTS FOUGHT
The average external conflicts fought score fell 15 per cent between 2008 and 2016, from 1.71 to 1.48, as shown in figure 2.7. The external conflicts fought indicator measures not only the number of external conflicts, but also the duration and role that states have in conflicts outside of their own borders.
The average external conflicts score improved from 2008 to 2016. However, the number of states involved in external conflicts actually increased over this period even though the average duration of conflicts and the role played by external actors fell. More countries entered into smaller roles in
coalitions, but a number of countries withdrew from their roles in more prominent external conflicts, leading to an improvement in the overall score.
In 2010, 58 nation states were involved in 206 external conflicts. Multiple groups can be involved in a conflict with each conflict pairing being recorded separately. In 2014, this number had increased to 85 states involved in 310 conflicts. Of the 210 conflict pairings that were active in 2010, only 111 were still active in 2014, with 199 being new conflict pairings.
Source: IEP, IISS Armed Conflict Database
FIGURE 2.6 COUNTRIES WITH THE MOST INTERNAL CONFLICT DEATHS, 2016 (EXCLUDING SYRIA)
Of the nine countries (excluding Syria) with the most internal conflict deaths in the 2016 GPI, only four had any internal conflict deaths in 2008.
0 5,000 10,000 15,000 20,000 25,000 30,000 35,000
2016 GPI
2008 GPI
Pakistan
Central African Republic
Ukraine
South Sudan
Yemen
Nigeria
Afghanistan
Iraq
Mexico
Source: IEP
FIGURE 2.7 AVERAGE EXTERNAL CONFLICTS FOUGHT INDICATOR SCORE, 2008 TO 2016 GPI
The average external conflicts fought score fell 15 per cent, with the largest decrease occurring between 2010 − 2015.
1.0
1.1
1.2
1.3
1.4
1.5
1.6
1.7
1.8
1.9
2008 2009 2010 2011 2012 2013 2014 2015 2016
EXTE
RNA
L C
ON
FLIC
TS F
OU
GH
T BA
ND
ED S
CO
RE
Less
pea
cefu
lM
ore
peac
eful
Of the nine countries (excluding Syria) with the most internal conflict deaths in the 2016 GPI, only three had a significant number of deaths nine years prior, with the rest experiencing breakouts of entirely new conflicts.
30 31GLOBAL PEACE INDEX 2016 | Trends in Peace

Source: IISS, IEP Calculations
FIGURE 2.9 CHANGE IN AVERAGE MILITARY EXPENDITURE (%GDP) BY GOVERNMENT TYPE, 2008 - 2016
Military expenditure increased as a percentage of GDP in authoritarian regimes, but fell in full and flawed democracies.
Authoritarian regime
Flawed democracyFull democracy
Hybrid regime
0.0
0.5
1.0
1.5
2.0
2.5
3.0
3.5
4.0
2008 2009 2010 2011 2012 2013 2014 2015 2016
MIL
ITAR
Y EX
PEN
DIT
URE
(% G
DP)
ARMED SERVICES PERSONNEL AND MILITARY EXPENDITURE
The average armed services personnel indicator declined from 2008 to 2014, as several countries sought to cut back on military expenditure and reduce the size of their standing armies. This is a continuation of a trend that began almost twenty years ago, with the number of active military personnel dropping from over 30 million in 1995 to under 29 million in 2011.
Figure 2.8 shows the change in the average armed services personnel rate by government type. All four government types experienced a fall in the average armed service personnel rate, with the biggest average fall occurring in authoritarian regimes, which fell by 18 per cent. Part of this fall can be explained by the dissolution or fragmentation of government forces in Syria and Libya, however, the armed services personnel rate fell in 48 of the 51 countries classified as authoritarian regimes. The second biggest improvement occurred in full democracies, with an average fall of
16 per cent, and both flawed democracies and hybrid regimes showed average improvements of over ten per cent.
The fall in the armed service personnel rate was not strongly correlated with a fall in military expenditure, with many countries increasing weapons expenditure outlay while also reducing the total number of troops, reflecting a longer term shift away from larger standing armies to more technology and capital intensive weapons systems. Figure 2.9 highlights the change in average military expenditure by government type from 2008 to 2016.
The average level of military expenditure as a percentage of GDP declined in both full democracies and flawed democracies. However, there was considerably more variation in the trend in authoritarian regimes and hybrid regimes, which both experienced steep declines from 2010 to 2012, followed by a steady increase in military expenditure for the past four years. The largest increase over the full time period occurred in Afghanistan, where military expenditure rose from 1.66 per cent of GDP to 15.75 per cent in less than a decade. Libya, Oman, Algeria and Syria also had large increases.
Source: UNODC, IEP Calculations
FIGURE 2.8 CHANGE IN AVERAGE ARMED SERVICES PERSONNEL RATE BY GOVERNMENT TYPE, 2008-2016
All four government types experienced falls in the armed forces rate over the past decade.
Authoritarian regime
Flawed democracy
Full democracyHybrid regime
200
300
400
500
600
700
800
2008 2009 2010 2011 2012 2013 2014 2015 2016
ARM
ED S
ERV
ICES
PER
SON
NEL
PE
R 10
0,0
00
PEO
PLE
The fall in the armed service personnel rate was not strongly correlated with a fall in military expenditure.
32 33

Source: CLIO-INFRA, IEP Calculations
FIGURE 2.10 NUMBER OF COUNTRIES INVOLVED IN AN INTERNAL OR EXTERNAL CONFLICT, 1500 - 2000
In the last 50 years, the number of countries involved in internal conflicts overtook the number of countries involved in external conflicts.
Internal ConflictsTen Year Moving Average
External Conflicts10 Year Moving Average
0
5
10
15
20
25
30
35
40
1500 1550 1600 1650 1700 1750 1800 1850 1900 1950 2000
NU
MBE
R O
F C
OU
NTR
IES
INV
OLV
ED I
N A
CO
NFL
ICT
LONG-TERM TRENDS
Many of the approaches to measuring peace focus on conflict and war, ignoring the other dimensions affecting peacefulness, particularly those indicators that measure resources devoted to containing or dealing with violence, such as internal security, police, incarceration or counter-terrorism. While lower levels of violence can be achieved by increasing spending in these areas, this does not necessarily represent a more peaceful world if this decline in violence has only been achieved by devoting more resources to security.
Reconstructing a version of the GPI back to the end of the Second World War is not possible, owing to large data gaps across both indicators and countries. However, it is possible to assemble the existing data and group these datasets into the
three GPI subdomains: ongoing conflict, militarisation and societal safety and security. This data suggests that even though the world has become less violent over the last 60 years, this fall in violence has been offset by an increase in spending on services that aim to contain violence.
Over the past five hundred years there has been a shift away from conflict between states (external conflict) to conflict within states (internal conflict). Figure 2.10 shows the ten year moving average for states involved in internal and external conflicts over the past five hundred years.
The last 60 years have seen the number of internal conflicts not only increase, but also overtake the number of external conflicts.
There is a strong consensus that even though the world has become much less violent since the end of the Second World War, the last decade has seen an increase in conflict and violence, although whether this is a temporary reversal or the start of a new longer-term trend remains to be seen.
32 33GLOBAL PEACE INDEX 2016 | Trends in Peace

Source: Correlates of War Database
FIGURE 2.11 TERRITORIAL CHANGES BY TYPE AND WHETHER A MILITARY CONFLICT WAS INVOLVED, TEN YEAR SUM, 1825-2014
Since the mid-1970s the number of territorial changes categorized as conquests has dropped to almost zero.
0
10
20
30
40
50
60
70
80
90
100
1825 1850 1875 1900 1925 1950 1975 2000
NU
MBE
R O
F TE
RRIT
ORI
AL
CH
ANG
ES (
TEN
YEA
R SU
M)
Other Secession
Annexation Conquest
This shift away from external conflict towards internal conflict is also reflected in figure 2.11 which shows the ten year moving sum of territorial changes by type.
The number of territory changes that were classified as either conquests or annexations peaked in the early 20th century, with only a brief resurgence in the mid-1970s. In the last decade there have only been three territory changes classified as conquests, three changes that involved a military conflict and a general decline in the number of overall territory changes. This lends credence to both the theory that the world has become more peaceful and also that direct conflicts between nations are becoming much rarer.
GPI DOMAIN TRENDS
ONGOING DOMESTIC & INTERNATIONAL CONFLICT
The trend away from external and towards internal conflicts can be seen in figure 2.12, which shows a more detailed account of armed conflicts, which are defined as a conflict that caused more than 25 battle deaths in any one year from 1946 to 2014.
The decline in the number of interstate and extrasystematic is clear, as is the rise of internal conflicts. Overall, the total number of active serious armed conflicts has declined from a peak of 51 conflicts in 1991 to 40 in 2014, although this is the highest number of active conflicts since 1999. In addition, there has been a clear rise in the number of internationalised internal conflicts, which were just three per cent of total conflicts in 1991, but constituted 32.5 per cent of total conflicts in 2014.
The total number of conflicts has jumped sharply in the past few years, rising from 31 in 2010 to 40 in 2014. This increase in the number of internal conflicts has led to a concurrent rise in battle deaths. In 2014, owing largely to the conflict in Syria but also the increasingly protracted conflict in Yemen, battle deaths hit a 25 year high, with this number likely to increase when 2015 data are released. Figure 2.13 highlights the total number of battles deaths from 1946 to 2014, as well as the past 25 years in isolation.
Although the majority of deaths in 2014 occurred in Syria, there were a number of other conflicts that resulted in high numbers of battle deaths. In total, 11 conflicts resulted in more than a thousand deaths each in 2014, with conflict in Iraq and Afghanistan resulting in more than 10,000 deaths each.
BOX 2.1 WHAT ARE THE DIFFERENT TYPES OF CONFLICT?
The UCDP-PRIO Armed Conflict Dataset classifies conflicts in four different ways:
z Extrasystemic armed conflict occurs between a state and a non-state group outside its own territory, for example, colonial wars or wars of independence.
z Interstate armed conflict occurs between two or more states.
z Internal armed conflict occurs between the government of a state and one or more internal opposition groups without intervention from other states.
z Internationalised internal armed conflict occurs between the government of a state and one or more internal opposition groups with intervention from other states on one or both sides.
34 35
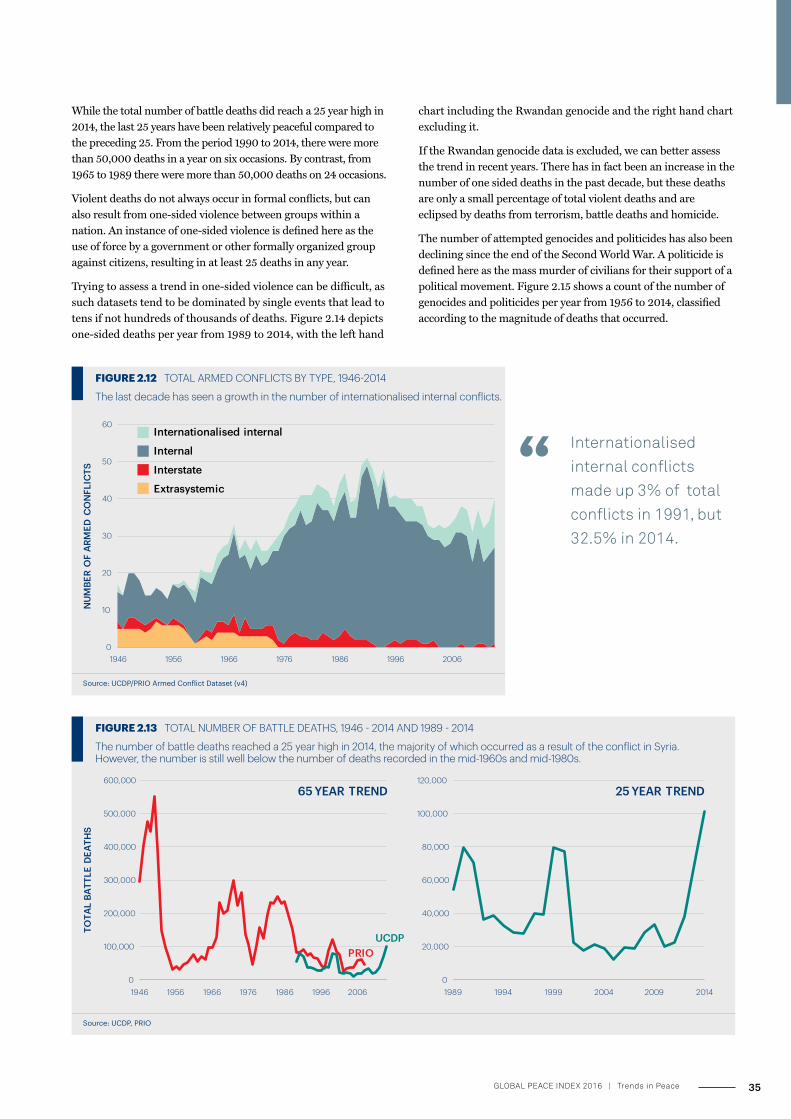
Source: UCDP/PRIO Armed Conflict Dataset (v4)
FIGURE 2.12 TOTAL ARMED CONFLICTS BY TYPE, 1946-2014
The last decade has seen a growth in the number of internationalised internal conflicts.
0
10
20
30
40
50
60
1946 1956 1966 1976 1986 1996 2006
NU
MBE
R O
F AR
MED
CO
NFL
ICTS
Internationalised internal
Internal
Interstate
Extrasystemic
Source: UCDP, PRIO
FIGURE 2.13 TOTAL NUMBER OF BATTLE DEATHS, 1946 - 2014 AND 1989 - 2014
The number of battle deaths reached a 25 year high in 2014, the majority of which occurred as a result of the conflict in Syria. However, the number is still well below the number of deaths recorded in the mid-1960s and mid-1980s.
PRIOUCDP
0
100,000
200,000
300,000
400,000
500,000
600,000
1946 1956 1966 1976 1986 1996 2006
TOTA
L BA
TTLE
DEA
THS
65 YEAR TREND
0
20,000
40,000
60,000
80,000
100,000
120,000
1989 1994 1999 2004 2009 2014
25 YEAR TREND
While the total number of battle deaths did reach a 25 year high in 2014, the last 25 years have been relatively peaceful compared to the preceding 25. From the period 1990 to 2014, there were more than 50,000 deaths in a year on six occasions. By contrast, from 1965 to 1989 there were more than 50,000 deaths on 24 occasions.
Violent deaths do not always occur in formal conflicts, but can also result from one-sided violence between groups within a nation. An instance of one-sided violence is defined here as the use of force by a government or other formally organized group against citizens, resulting in at least 25 deaths in any year.
Trying to assess a trend in one-sided violence can be difficult, as such datasets tend to be dominated by single events that lead to tens if not hundreds of thousands of deaths. Figure 2.14 depicts one-sided deaths per year from 1989 to 2014, with the left hand
chart including the Rwandan genocide and the right hand chart excluding it.
If the Rwandan genocide data is excluded, we can better assess the trend in recent years. There has in fact been an increase in the number of one sided deaths in the past decade, but these deaths are only a small percentage of total violent deaths and are eclipsed by deaths from terrorism, battle deaths and homicide.
The number of attempted genocides and politicides has also been declining since the end of the Second World War. A politicide is defined here as the mass murder of civilians for their support of a political movement. Figure 2.15 shows a count of the number of genocides and politicides per year from 1956 to 2014, classified according to the magnitude of deaths that occurred.
Internationalised internal conflicts made up 3% of total conflicts in 1991, but 32.5% in 2014.
34 35GLOBAL PEACE INDEX 2016 | Trends in Peace

Source: Political Instability Task Force, State Failure Problem Set
FIGURE 2.15 TOTAL NUMBER OF GENOCIDES AND POLITICIDES, 1956 - 2014
There have been six episodes of genocidal violence since 1956 that resulted in more than 256,000 deaths.
Indo
nesi
a
Nig
eria
Paki
stan
Cam
bodi
a
Suda
n
Rwan
da
0
2
4
6
8
10
12
1956 1961 1966 1971 1976 1981 1986 1991 1996 2001 2006 2011
CO
UN
T O
F PO
LITI
CID
ES A
ND
GEN
OC
IDES
More than 256,000 Deaths
64,000 - 256,000
16,000 - 64,000
4,000 - 16,000
1,000 - 4,000
0 - 1,000
Source: UCDP/PRIO One-Sided Conflict
FIGURE 2.14 DEATHS FROM ONE-SIDED VIOLENCE, 1989-2014, INCLUDING AND EXCLUDING THE RWANDAN GENOCIDE
There has been an increase in the number of one-sided violent deaths in the last decade, but there hasn’t been a high magnitude genocide since Rwanda in 1994.
0
100,000
200,000
300,000
400,000
500,000
600,000
1989 1994 1999 2004 2009 2014
TOTA
L O
NE
SID
ED C
ON
FLIC
T D
EATH
S
0
5,000
10,000
15,000
20,000
25,000
30,000
35,000
40,000
45,000
1989 1994 1999 2004 2009 2014
TOTA
L O
NE
SID
ED C
ON
FLIC
T D
EATH
SINCLUDING RWANDA EXCLUDING RWANDA
Both the number and severity of these types of one-sided violence have been declining. There have been six instances of the most severe category of genocidal violence since 1956: in Indonesia, Nigeria, Pakistan, Cambodia, Sudan and most recently Rwanda. However, since 1994 there have been no attempted genocides and politicides that resulted in more than 256,000 deaths and the total count of genocides and politicides has fallen from 11 in 1974 to just two in 2014.
One potential reason for the reduction in one-sided violence is the increased commitment from the international community to violence prevention. Figure 2.16 shows the number of actively deployed, uniformed UN peacekeepers from 1991 to 2016. There has been a large increase in the number of deployed peacekeepers since the turn of the century, with over 100,000 active as of early 2016.
36 37

While peace entails more than the absence of war, the majority of violent deaths in the last decade has occurred in conflict or warlike situations.
The increasing number of deployed peacekeepers and the international community’s improvement in meeting their UN peacekeeping funding dues reached record highs in early 2016, suggesting that the international community is more willing and able to address war and conflict situations than in the immediate period after the Second World War. However, an increase in the resources devoted to violence containment should not be equated with a more peaceful world. The potential for future violent conflict still exists, as attested to by the recent increase in the number of conflicts.
The nature of conflicts that are arising is also changing. While the prospect of direct interstate conflict seems to be becoming much more likely, the potential for indirect or proxy conflict between nation states is rising. This can be seen in the current conflict in Syria, where the conflict between the Assad regime and multiple non-state actors has spilled over into a broader proxy conflict between Saudi Arabia and Iran and more recently the United States and Russia. Tensions between external nations threatened to erupt into a much broader conflict when Turkey shot down a Russian attack aircraft that had allegedly strayed into Turkish airspace.
MILITARISATION
While data availability for militarisation does not extend back to 1950 for all indicators, there is enough data to suggest that both global military expenditure and the number of active duty military personnel have increased since the end of the Second World War, although this has begun to change over the past 20 years.
Harmonized total global military expenditure data is currently only available back to 1990, although it is available back to 1955 for NATO member nations. The total level of NATO military spending (excluding the US) increased from approximately US $150 billion in 1955 to $268 billion in 2015, an increase of 78 per cent. US expenditure increased by 67 per cent over the same period. However, there was a sharp decline in total spending by NATO countries in the last decade, both including and excluding the US. Total military expenditure has decreased every year since 2009.
The end of the Cold War saw a massive reduction in military expenditure, from US$1.5 trillion in 1990, down to $1 trillion in 1996. However, this decline proved to be short lived, with year on year increases from 1996 to 2009 and a plateau in total military spending since then.
In contrast to the increase in military spending, the total number of armed service personnel has been decreasing in the last 20 years. Comparable data is available for the period 1995 to 2014. It shows that the global number of armed service personnel has fallen from 30.1 million in 1995 to 27.3 million in 2014. Of the world’s 50 largest militaries, 26 saw reductions in the total number of armed services personnel, including four of the ten largest standing armies: China, the US, Russia and South Korea.
Source: IPI Peacekeeping Database
FIGURE 2.16 UN DEPLOYED PEACEKEEPERS BY TYPE, 1990-2016 (MONTHLY)
Peacekeeping deployments reached their highest ever levels in 2016.
0
20,000
40,000
60,000
80,000
100,000
120,000
TOTA
L D
EPLO
YED
UN
PEA
CEK
EEPE
RS
Troops
Police
Observers
1990
1992
1994
1996
1998
20002002
20042006
20082010
20122014
One potential reason for the reduction in one-sided violence is the increased commitment from the international community to violence prevention.
36 37GLOBAL PEACE INDEX 2016 | Trends in Peace

Source: SIPRI
FIGURE 2.17 TOTAL MILITARY EXPENDITURE IN 2014 USD, 1955-2015
Total global military expenditure has increased considerably since 1995, but levelled o� over the last decade.
Global Total
NATO(excluding US)
NATO
0
0.2
0.4
0.6
0.8
1
1.2
1.4
1.6
1.8
2
1955 1960 1965 1970 1975 1980 1985 1990 1995 2000 2005 2010 2015TOTA
L M
ILIT
ARY
SPE
ND
ING
(20
14 U
SD
) TR
ILLI
ON
S
Source: World Bank, SIPRI
FIGURE 2.18 MILITARY EXPENDITURE AS A % OF GDP AND TOTAL ARMED SERVICES PERSONNEL, 1995-2012
In the world’s largest military powers, the number of armed forces personnel has been declining.
0.00
0.50
1.00
1.50
2.00
2.50
3.00
3.50
4.00
4.50
1.0%
1.5%
2.0%
2.5%
3.0%
1995 2000 2005 2010
ARM
ED S
ERV
ICES
PER
SON
NEL
(M
ILLI
ON
S)
MIL
ITAR
Y EX
PEN
DIT
UR
E (%
OF
GD
P) CHINA
Milex (% GDP)
Armed Services Personnel
1.00
1.10
1.20
1.30
1.40
1.50
1.60
1.70
1.80
1.90
2.00
1.0%
1.5%
2.0%
2.5%
3.0%
3.5%
4.0%
4.5%
5.0%
1995 2000 2005 2010
ARM
ED S
ERV
ICES
PER
SON
NEL
(M
ILLI
ON
S)
MIL
ITAR
Y EX
PEN
DIT
UR
E (%
OF
GD
P) US
1.00
1.20
1.40
1.60
1.80
2.00
2.20
2.40
2.0%
2.5%
3.0%
3.5%
4.0%
4.5%
5.0%
1995 2000 2005 2010
ARM
ED S
ERV
ICES
PER
SON
NEL
(M
ILLI
ON
S)
MIL
ITAR
Y EX
PEN
DIT
UR
E (%
OF
GD
P) RUSSIA
1.00
1.50
2.00
2.50
3.00
3.50
1.0%
1.5%
2.0%
2.5%
3.0%
3.5%
4.0%
4.5%
5.0%
1995 2000 2005 2010
ARM
ED S
ERV
ICES
PER
SON
NEL
(M
ILLI
ON
S)
INDIA
MIL
ITAR
Y EX
PEN
DIT
UR
E (%
OF
GD
P)
Figure 2.18 highlights the contrast between military expenditure as a percentage of GDP and declining armed forces personnel, both as a global total and for the world’s four largest militaries (excluding North Korea).
After increasing the size of its armed forces in response to conflicts in Iraq and Afghanistan, the US army continued its long downward trend in size. Total spending rose by over $200 billion, although as a percentage of GDP it has returned to the same level as in 1995. The trend in China was very similar, with an even more pronounced increase in spending, up nearly 600 per cent from 1995, although this occurred in tandem with an unprecedented period of economic growth. Russia also decreased its number of armed forces personnel, from 1.8 million down to 1.4. Of the four highlighted countries, only India increased its number of personnel, from 2.15 to 2.72 million, a 27 per cent increase.
The reduction in the number of personnel reflects the decreased likelihood of conflicts
38 39
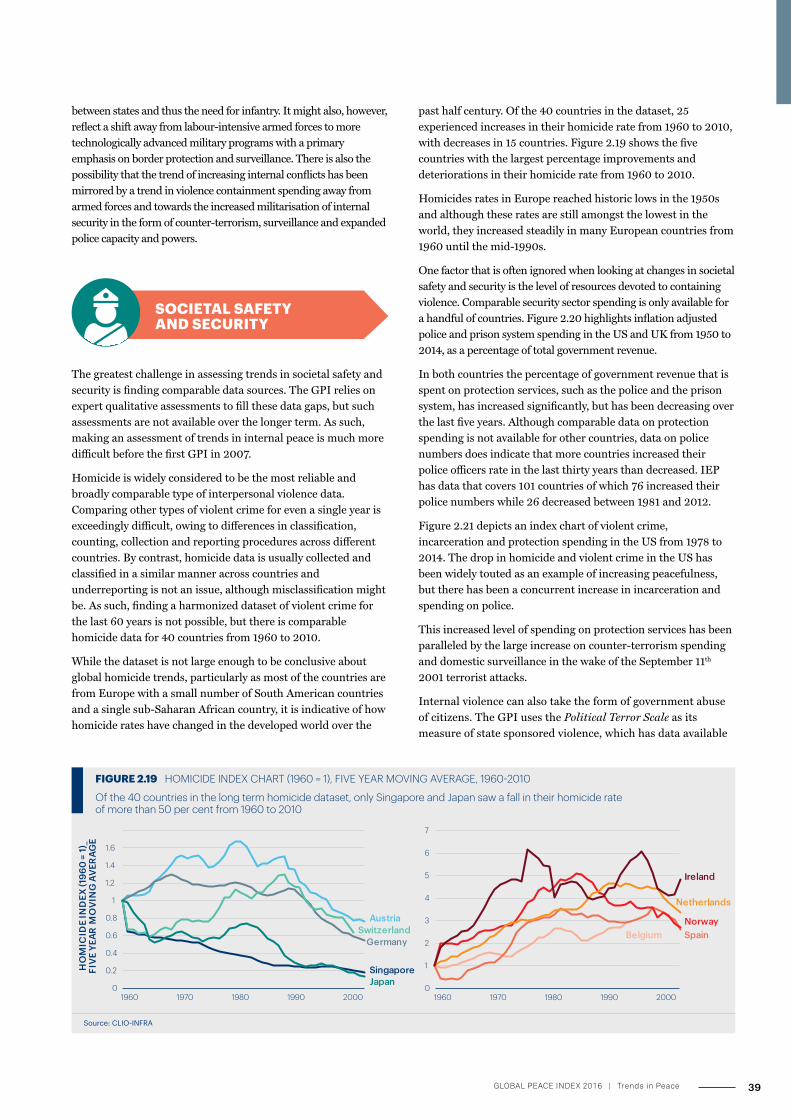
between states and thus the need for infantry. It might also, however, reflect a shift away from labour-intensive armed forces to more technologically advanced military programs with a primary emphasis on border protection and surveillance. There is also the possibility that the trend of increasing internal conflicts has been mirrored by a trend in violence containment spending away from armed forces and towards the increased militarisation of internal security in the form of counter-terrorism, surveillance and expanded police capacity and powers.
SOCIETAL SAFETY AND SECURITY
The greatest challenge in assessing trends in societal safety and security is finding comparable data sources. The GPI relies on expert qualitative assessments to fill these data gaps, but such assessments are not available over the longer term. As such, making an assessment of trends in internal peace is much more difficult before the first GPI in 2007.
Homicide is widely considered to be the most reliable and broadly comparable type of interpersonal violence data. Comparing other types of violent crime for even a single year is exceedingly difficult, owing to differences in classification, counting, collection and reporting procedures across different countries. By contrast, homicide data is usually collected and classified in a similar manner across countries and underreporting is not an issue, although misclassification might be. As such, finding a harmonized dataset of violent crime for the last 60 years is not possible, but there is comparable homicide data for 40 countries from 1960 to 2010.
While the dataset is not large enough to be conclusive about global homicide trends, particularly as most of the countries are from Europe with a small number of South American countries and a single sub-Saharan African country, it is indicative of how homicide rates have changed in the developed world over the
Source: CLIO-INFRA
FIGURE 2.19 HOMICIDE INDEX CHART (1960 = 1), FIVE YEAR MOVING AVERAGE, 1960-2010
Of the 40 countries in the long term homicide dataset, only Singapore and Japan saw a fall in their homicide rate of more than 50 per cent from 1960 to 2010
Austria
Germany
Singapore
Switzerland
Japan0
0.2
0.4
0.6
0.8
1
1.2
1.4
1.6
1960 1970 1980 1990 2000
HO
MIC
IDE
IND
EX (1
960
= 1)
_FI
VE
YEAR
MO
VIN
G A
VER
AGE
Belgium SpainNorway
Netherlands
Ireland
0
1
2
3
4
5
6
7
1960 1970 1980 1990 2000
past half century. Of the 40 countries in the dataset, 25 experienced increases in their homicide rate from 1960 to 2010, with decreases in 15 countries. Figure 2.19 shows the five countries with the largest percentage improvements and deteriorations in their homicide rate from 1960 to 2010.
Homicides rates in Europe reached historic lows in the 1950s and although these rates are still amongst the lowest in the world, they increased steadily in many European countries from 1960 until the mid-1990s.
One factor that is often ignored when looking at changes in societal safety and security is the level of resources devoted to containing violence. Comparable security sector spending is only available for a handful of countries. Figure 2.20 highlights inflation adjusted police and prison system spending in the US and UK from 1950 to 2014, as a percentage of total government revenue.
In both countries the percentage of government revenue that is spent on protection services, such as the police and the prison system, has increased significantly, but has been decreasing over the last five years. Although comparable data on protection spending is not available for other countries, data on police numbers does indicate that more countries increased their police officers rate in the last thirty years than decreased. IEP has data that covers 101 countries of which 76 increased their police numbers while 26 decreased between 1981 and 2012.
Figure 2.21 depicts an index chart of violent crime, incarceration and protection spending in the US from 1978 to 2014. The drop in homicide and violent crime in the US has been widely touted as an example of increasing peacefulness, but there has been a concurrent increase in incarceration and spending on police.
This increased level of spending on protection services has been paralleled by the large increase on counter-terrorism spending and domestic surveillance in the wake of the September 11th 2001 terrorist attacks.
Internal violence can also take the form of government abuse of citizens. The GPI uses the Political Terror Scale as its measure of state sponsored violence, which has data available
38 39GLOBAL PEACE INDEX 2016 | Trends in Peace

Source: Political Terror Scale
FIGURE 2.22 POLITICAL TERROR SCALE, MEDIAN ROUNDED SCORE, 1976 TO 2014
The composition of the Political Terror Scale has not changed much since 1976.
0%
10%
20%
30%
40%
50%
60%
70%
80%
90%
100%1976 1981 1986 1991 1996 2001 2006 2011
PERC
ENTA
GE
OF
CO
UN
TRIE
S
1
2
3
4
5
Little tono politicalterror
Very highlevels ofpoliticalterror
Source: Chantrill (2016), IEP Calculations
FIGURE 2.20 POLICE AND PRISON SYSTEM SPENDING AS A PERCENTAGE OF TOTAL GOVERNMENT REVENUE, US AND UK, 1950-2014
In both the US and UK, the percentage of government revenue spent on protection services has more than doubled.
US
UK
0%
1%
2%
3%
4%
5%
6%
7%
1950 1955 1960 1965 1970 1975 1980 1985 1990 1995 2000 2005 2010
PERC
ENTA
GE
OF
TOTA
L G
OV
ERN
MEN
T RE
VEN
UE
Source: FBI, IEP
FIGURE 2.21 INDEX CHART OF VIOLENT CRIME, INCARCERATION AND POLICE AND PRISON SYSTEM SPENDING IN THE US (1978=1)
Although the violent crime rate in the US has declined, there has been a much larger percentage increase in protection spending and incarceration.
Incarceration rate
Violent crime rate
Police and prison spending
0.000
0.500
1.000
1.500
2.000
2.500
3.000
3.500
4.000
4.500
1978 1983 1988 1993 1998 2003 2008
IND
EX (1
978
= 1)
back to 1976. Figure 2.22 shows the composition of the Political Terror Scale scores from 1976 to 2014.
The average country score improved slightly, moving from 2.53 to 2.43, although there was no change in the median score. In 1976, 23.6 per cent of countries received the best possible score of one, a figure that improved slightly by 2014 to 25.3 per cent. Similarly, the percentage of countries receiving the worst possible score of five rose slightly from 3.9 per cent to 5.6 per cent. Even though other long term indicators of political stability and democratisation improved over the same time period, there was virtually no change in the likelihood of state violence against citizens.
The drop in homicide and violent crime in the US has been widely touted as an example of increasing peacefulness, but there has been a concurrent increase in incarceration and spending on police.
40 PB

GLOBAL ECONOMIC VALUE OF PEACE
$
$
$$$

Losses from conflict$742 billion
Internal security spending
Losses from crime and interpersonal violence
$6.2 trillion
IF THE WORLD DECREASED VIOLENCE BY ONLY 10% ...
IN ANNUAL ECONOMIC RESOURCES & ACTIVITY COULD BE GENERATED, EQUIVALENT TO:
...$1.36 trillion
WHICH IS EQUIVALENT TO
WHICH IS EQUIVALENT TO
The value of global food exports in 2014
10x the total Official Development Assistance in 2014
More than total global foreign direct investment in 2014
GLOBAL ECONOMIC IMPACT OF VIOLENCE
13.3%$5
PER PERSON GLOBALLY PER DAY
$4.2 trillion
$2.5 trillion
WHY?
$13.6
$74
2 bi
llion
$16
7 bi
llion
(2
2% o
f the
cos
t of
con
flict
)
$15
bill
ion
(2%
of t
he c
ost
of c
onfli
ct)
Economic losses from conflict
Total ODA, gross disbursement
Peacekeeping and peacebuilding
Military spending
42 43

HIGHLIGHTS
The economic impact of violence to the global economy was $13.6 trillion in 2015, in purchasing power parity (PPP) terms. This figure is equivalent to approximately 11 times the size of global foreign direct investment, which was $1.23 trillion in 2014.1
� The global economic impact of violence was $13.6 trillion PPP in 2015.
� This figure is equivalent to 13.3 per cent of world GDP or $1,876 PPP for every person in the world.
� The global economic impact of violence decreased by two per cent in 2015, which is equivalent to $246 billion PPP.
� The decrease has been driven mainly by declines in homicide, internal security expenditures and military spending in the industrialised countries.
� The global economic impact of violence is approximately 11 times the size of global foreign direct investment, which was $1.23 trillion in 2014.
� Syria, Iraq and Afghanistan incur the largest economic impact as a percentage of their GDP at 54, 54 and 45 per cent of GDP respectively.
� The global per capita economic impact of violence was $1,876 PPP. This is $5 per day, per person or approximately three times the daily poverty line of $1.90 PPP.
� The direct cost of violence in 2015 is 30 times the amount spent on official development assistance (ODA) in 2014.
� A ten per cent decrease in the economic impact of violence would produce a peace dividend of $1.36 trillion PPP. This dividend would be equivalent to global food exports in 2014.2
� The spending on peacebuilding and peacekeeping is proportionally small compared to the economic losses from armed conflict. Peacebuilding and peacekeeping expenditures represent two per cent of global losses from armed conflict in 2015.
IEP estimates of the economic impact of violence include direct and indirect costs and a multiplier effect that measures the flow on effect that would accrue were these expenditures allocated to more productive areas of the economy.
Global military expenditures are the largest component, at $6.16 trillion PPP. Global military expenditure has declined by ten per cent in the last three years but it still remains considerably higher than its level in 1960.3 The United States and China have the highest expenditure on the military, with 38 and 10 per cent, respectively, of the global share.
Interpersonal violence, which includes homicides and violent and sexual assaults, accounts for 17 per cent of the global economic impact of violence and was $2.3 trillion PPP in 2015. The largest cost associated with interpersonal violence is from homicide and was calculated at $1.79 trillion PPP, equivalent to 13 per cent of the total. Central America and the Caribbean is the region most affected by homicides, followed by South America.
The global economic impact of armed conflict was $742 billion PPP in 2015. The Middle East and North Africa is the region most affected, resulting in a per person cost of conflict at $464 PPP. The economic impact of deaths from internal armed conflict has increased four times from its 2007 level and now stands at $133 billion PPP. In contrast, the losses from external battle deaths have dropped by 70 per cent in the last nine years due to the drawdown of coalition forces in Iraq and Afghanistan.
Despite the deterioration in global peacefulness, the global economic impact of violence decreased by two per cent in 2015, which is equivalent to $246 billion PPP. This decline has been driven mainly by three changes in large industrialised countries: the decline in homicide, domestic security expenditures and military spending.
42 43GLOBAL PEACE INDEX 2016 | Global Economic Value of Peace

An important aspect of IEP’s estimation is the international comparability of the country estimates, thereby allowing cost/benefit analysis of country interventions. The methodology uses constant purchasing power parity (PPP) international dollars.
IEP estimates the economic impact of violence using a comprehensive aggregation of costs related to violence, armed conflict and spending on military and internal security services. The GPI is the initial point of reference for developing the estimates. The 2015 version of the economic impact of violence includes 16 variables in three groups.
Expenditure on containing violence is economically efficient when it effectively prevents violence for the least amount of spending. However, spending beyond an optimal level has the potential to constrain a nation’s economic growth. Therefore, achieving the right levels of spending on expenditures such as the military, judicial and security services is important for the most productive use of capital.
This study includes two types of costs: direct and indirect costs. Examples of direct costs include medical costs for victims of violent crime, capital destruction from violent conflict and costs associated with the security and judicial systems. Indirect costs include lost wages or productivity from crime due to physical and emotional trauma. There is also a measure of the impact of fear on the economy, as people who fear that they may become a victim of violent crime alter their behaviour.4
METHODOLOGY
The global economic impact of violence is defined as the expenditure and economic effect related to “containing, preventing and dealing with the consequences of violence.” The estimates include the direct and indirect cost of violence as well as an economic multiplier. The multiplier effect calculates the additional economic activity that would have accrued if the direct costs of violence had been avoided.
TABLE 3.1 VARIABLES INCLUDED IN THE ECONOMIC IMPACT OF VIOLENCE, 2015
SECURITY SERVICES AND PREVENTION ORIENTED COSTS
ARMED CONFLICT-RELATED COSTS INTERPERSONAL VIOLENCE
Military expenditureDirect costs of deaths from internal violent conflict
Homicides
Internal security expenditureDirect costs of deaths from external violent conflict
Violent assault
Private securityIndirect costs of violent conflict (GDP losses due to conflict)
Sexual assault
UN peacekeeping Losses from status as refugees and IDPs Fear of crime
ODA peacebuilding expenditure Small arms imports Indirect costs of incarceration
Terrorism
44 45

The analysis presents conservative estimates of the global economic impact of violence. The estimation only includes variables of violence for which reliable data could be obtained. The following elements are examples of some of the items not counted in the economic impact of violence:
z Domestic violence
z Violence against children and the elderly
z Household out-of-pocket spending on safety and security
z The cost of crime to business
z Spill over effects from conflict and violence
z Intimate partner violence
z Self-directed violence
z The cost of intelligence agencies
z Judicial system expenditures
BOX 3.1 THE MULTIPLIER EFFECT
The multiplier effect is a commonly used economic concept, which describes the extent to which additional expenditure improves the wider economy. Every time there is an injection of new income into the economy this will lead to more spending which will, in turn, create employment, further income and additional spending. This mutually reinforcing economic cycle is known as the ‘multiplier effect’ and is the reason that a dollar of expenditure can create more than a dollar of economic activity.
Although the exact magnitude of this effect is difficult to measure, it is likely to be particularly high in the case of expenditure related to containing violence. For instance, if a community were to become more peaceful, individuals would spend less time and resources protecting themselves against violence. Because of this decrease in violence there are likely to be substantial flow-on effects for the wider economy, as money is diverted towards more productive areas such as health, business investment, education and infrastructure.
When a homicide is avoided, the direct costs, such as the money spent on medical treatment and a funeral, could be spent elsewhere. The economy also benefits from the lifetime
income of the victim. The economic benefits from greater peace can therefore be significant. This was also noted by Brauer and Tepper-Marlin (2009) who argued that violence or the fear of violence may result in some economic activities not occurring at all.5 More generally, there is strong evidence to suggest that violence and the fear of violence can fundamentally alter the incentives for business. For instance, analysis of 730 business ventures in Colombia from 1997 to 2001 found that with higher levels of violence, new ventures were less likely to survive and profit. Consequently, with greater levels of violence it is likely that we might expect lower levels of employment and economic productivity over the long-term, as the incentives faced discourage new employment creation and longer-term investment.6
This study assumes that the multiplier is one, signifying that for every dollar saved on violence containment, there will be an additional dollar of economic activity. This is a relatively conservative multiplier and broadly in line with similar studies.7
The total economic impact of violence includes the following components:
z Direct costs are the cost of violence to the victim, the perpetrator, and the government. These include direct expenditures, such as the cost of policing.
z Indirect costs accrue after the violent event and include indirect economic losses, physical and physiological trauma to the victim and lost productivity.
z The multiplier effect represents the flow-on effects of direct costs, such as additional economic benefits that would come from investment in business development or education instead of containing or dealing with violence. Box 3.1 provides a detailed explanation of the peace multiplier used.
The term cost of violence containment is used to explain the combined effect of direct and indirect costs. When a country avoids the economic impact of violence, it realises a peace dividend.
44 45GLOBAL PEACE INDEX 2016 | Global Economic Value of Peace

Meanwhile, the decrease in the overall economic impact of violence has largely been driven by the decrease in the economic impact of homicides, internal security and military spending in the advanced western economies. The economic impact of homicide accounted for the majority of the reduction, decreasing by $134 billion PPP or seven per cent from 2014 to 2015. Internal security expenditure, which captures incarceration and police expenses, accounted for the remaining amount, declining globally by three per cent or $118 billion PPP in 2015.
The driver of the reduction in the economic impact of internal security spending was reduced spending in Russia and Kazakhstan but also regionally in Eurasia and Europe. Russia has seen very significant declines in internal security spending due to the plan to cut the Interior Ministry’s budget by more than 10 per cent in 2015.8 The cuts are directly related to the country’s economic recession.
The single largest item was global military expenditure, which reached $6.16 trillion PPP, or 45 per cent of the economic impact of violence in 2015. According to IEP data, global military expenditure decreased slightly in 2015, by one per cent or $67 billion PPP.9 The decline was driven by continued cuts to US military expenditure, which decreased by 21 per cent from its peak in 2010.10
Due to the greater size of per capita income in the advanced economies, changes in underlying measures have a greater impact on the global model. Violence containment spending does not always follow the global trends of peacefulness, as there are some categories of expenditure which are more expensive than others.
Regionally, military expenditure showed some countervailing trends, decreasing the most in Europe followed by South America, North America and sub-Saharan Africa. In contrast, military expenditure increased in Asia-Pacific and South Asia in 2015. The increasing military spending in Asia-Pacific is primarily driven by China’s military build-up, which saw the military budget rise by approximately ten per cent in 2015.
ECONOMIC IMPACT OF VIOLENCE RESULTS
Whilst the world experienced a slight increase in violence last year, the economic impact of violence moved in the opposite direction and decreased by two per cent. The deterioration in global peacefulness was largely attributable to increases in terrorism, higher levels of conflict in the Middle East and North Africa and increases in the number of refugees and internally displaced people.
In the case of the US, military-related expenditures such as the significant spending on Veterans Affairs, the maintenance of the nuclear arsenal and interest payments on military-related debt are also included in the accounting. Due to the size of these expenditures, at $848 billion, and the significance of the US military, it is shown as a separate line item. The US is the only country where these expenditures have been accounted for due primarily to their size and transparent accounts.
There are large regional disparities in military spending. North America and MENA have the highest levels of military expenditure per capita, when calculated on the same basis, while South Asia and sub-Saharan Africa have the lowest levels in per capita terms.
The second largest contributor to the economic impact of violence in 2015 was internal security, which accounted for 26 per cent of the total. Internal security expenditure includes spending on the police and prison systems as well as the indirect costs associated with incarceration. The data for internal security spending is obtained from the OECD and the IMF.11
The global economic impact of violence was $13.6 trillion in 2015, or 13.3% of world GDP.
46 47

TABLE 3.2 ECONOMIC IMPACT OF VIOLENCE 2015, BILLIONS PPP
CATEGORY IMPACT OF DIRECT COST WITH MULTIPLIER
IMPACT OF INDIRECT
COST
TOTAL
Internal security expenditure 3,434.6 98.6 3,533.2
Deaths from external conflict 1.0 - 1.0
Fear - 119.5 119.5
GDP losses due to conflict - 317.4 317.4
Homicide 309.9 1,482.7 1,792.6
Deaths from internal conflict 133.1 - 133.1
Military expenditure 4,461.8 - 4,461.8
US Military related expenditure12 1,696.4 - 1,696.4
Peacebuilding and peacekeeping expenditure
45.5 - 45.5
Private security spending 672.8 - 672.8
Refugees and IDPs 5.5 169.0 174.5
Sexual and violent assault 85.2 459.5 544.6
Small arms 8.3 - 8.3
Terrorism 19.6 93.9 113.5
TOTAL 10,873.6 2,740.6 13,614.2
Source: IEP
Homicides, at 13 per cent, was the third largest category. The economic impact of homicide in 2015 was approximately $1.79 trillion PPP. Economic costs arising from intentional homicides are greater than the costs of any other category of crime or conflict. The model accounts for the costs related to the victim and perpetrators of crime. The indirect costs of homicide are extremely high, as victims of homicide can have no positive influence on productivity, unlike other crimes where the victim may be able to contribute to the economy after recovery; therefore their lifetime earnings are a loss to the economy. Reflecting this, the economic impact of violent and sexual assault was three times less than the impact of homicide. In 2015 violent and sexual crimes accounted for $545 billion PPP or four per cent of the global economic impact of violence.
Source: IEP
FIGURE 3.1 BREAKDOWN OF THE ECONOMIC IMPACT OF VIOLENCE, 2015
Over 70 per cent of the economic impact of violence accrues from spending on military and internal security.
Sexual and violent assault 4%
Internal security 26%
Military expenditure 45%
Other 4%Conflict 3%
Private security 5%
Homicide 13%
Direct costs of homicide and violent crime include medical costs, lost earnings and damages to the victim and the perpetrator. Indirect costs include the lost productivity of the victim, family and friends due to psychological trauma. High levels of crime impose social costs through increased government spending on public health, the criminal justice system and policing. Crime also reduces economic activity and consumption and adversely affects the business climate.13
The economic impact of external and internal conflict was $452 billion PPP and represents three per cent of the total. This figure is highly conservative, as IEP estimates of the economic impact of violent conflict only include in-country effects and do not provide estimates for the negative flow-on effects to other economies.
Source: IEP
FIGURE 3.2 COMPOSITION OF GLOBAL VIOLENCE CONTAINMENT, 2015
The majority of expenditure for violence containment is for the military and internal security.
Military expenditure
MILITARY
Homicides
Violent and sexual crimes
Fear
Small arms
CRIME AND INTERPERSONAL VIOLENCE
Police and prison
GDP losses
Refugees and IDPs
Terrorism
Peacebuilding UN Peacekeeping
CONFLICT Private security services
INTERNAL SECURITY
Deaths from internal conflict
46 47GLOBAL PEACE INDEX 2016 | Global Economic Value of Peace

Despite the deterioration in global peace from 2014 to 2015, the global economic impact of violence in fact decreased by two per cent, or $246 billion PPP, in 2015. This decline has been driven mainly by three changes in large industrialised countries: the decline in economic impact from homicide, domestic security expenditures and military spending.
Table 3.3 sets out the year-on-year change in the economic impact of violence, showing the categories by improvement in descending order. The category that improved the most was homicides, which declined by seven per cent or $134 billion PPP. The economic impact of the second largest category, internal security expenditure, also improved three per cent, which was equivalent to $117 billion PPP.
The economic impact of deaths from internal conflict increased by 15 per cent or $17 billion PPP, reflecting the increased intensity of armed conflicts in the MENA region and Afghanistan. In contrast, the economic impact of deaths from external conflict has decreased by 70 per cent from its 2007 level but increased slightly in 2015, by $300 million PPP.
TABLE 3.3 CHANGES IN THE ECONOMIC IMPACT OF VIOLENCE FROM 2014–2015
CATEGORY ECONOMIC IMPACT 2014
(BILLIONS)
ECONOMIC IMPACT 2015
(BILLIONS)
CHANGE (BILLIONS)
CHANGE (%)
2014-2015 2014-2015
Homicide 1,926.2 1,792.6 -133.6 -7%
Internal security expenditure
3,651.0 3,533.2 -117.8 -3%
Military expenditure
4,529.1 4,461.8 -67.3 -1%
Refugees and IDPs
188.9 174.5 -14.4 -8%
Terrorism 126.8 113.5 -13.3 -10%
Fear 127.5 119.5 -7.9 -6%
Sexual and violent assault
547.7 544.6 -3.1 -1%
Deaths from external conflict
0.7 1.0 0.3 44%
Private security spending
671.8 672.8 1 0%
Peacekeeping and peacebuilding spending
42.8 45.5 2.7 6%
GDP losses due to conflict
304.8 317.4 12.6 4%
Deaths from internal conflict
115.7 133.1 17.4 15%
US military related expenditure
1,619.3 1,696.4 77.1 5%
Small arms 8.3 8.3 - 0%
Total 13,860.6 13,614.2 -246.4 -2.0%
Source: IEP
Armed conflict also has economic flow-on effects that spill over into neighbouring countries. During the period from 2012 to 2014, Lebanese real GDP growth was reduced by 2.9 per cent per annum due to the Syrian civil war. The total fiscal cost of the Syrian civil war to Lebanon is over US$5 billion and includes the costs associated with accommodating high levels of refugees.14 This is an example of figures that are not included in the model.
The indirect cost of conflict comprises the lost productivity resulting from the diversion of public and private capital from productive activities to conflict-related activities. Additionally, it also captures the destruction of capital due to violent conflict.15 The GDP losses due to conflict increased by four per cent in 2015 and now stands at $317 billion PPP.
The economic impact of the fear of crime or insecurity in 2015 was $120 billion PPP. The economic impact of fear includes indirect costs arising from the anticipation of possible victimisation. These costs include changes in the behaviour of individuals and businesses, such as reductions in consumption and production, decreased number of business transactions and lower level of trust in society. The economic impact of the fear of crime decreased by six per cent in 2015.
Although deaths from terrorism have increased by nine times since 2000, this category only accounts for one per cent of the total economic impact of violence. The model includes deaths and injuries resulting from terrorist incidents, including indirect costs, but does not include property damage. In 2015 the economic impact of terrorism was $113 billion PPP. There has also been an increase in expenditure on counterterrorism. European countries, for example, increased counterterrorism expenditure over 16 times in eight years, from €5.7 million in 2002 to €93.5 million in 2009 and is captured in the study under the internal security category.16
The economic impact of population displacement, measured as the number of refugees and IDPs, was $175 billion PPP or one per cent of the economic impact of violence in 2015. This is an increase of nearly eight times from 2007, largely due to the increase in refugees fleeing the Syrian civil war. Direct refugee and internal displacement costs were $12 billion in 2007 and increased to $90.7 billion in 2015.
Changes in violence containment expenditure over the last decade generally reflect trends in peace. The shift away from armed conflicts between states has meant that fewer countries are impacted by the economic costs of conflict. However, those countries that are currently affected by violent conflict are very heavily impacted. For example, in Syria it is estimated that the civil war has cost 54 per cent of GDP.
A higher level of peacefulness in a country reduces the economic impact of violence; the least peaceful countries have a higher economic impact relative to the size of their economies than more peaceful countries.
Figure 3.3 shows that there is a significant difference in the economic impact of violence as a percentage of GDP between less and more peaceful countries. The correlation between overall GPI score and the economic impact of violence as a percentage of GDP in 2015 is r=0.7.
48 49

Source: IEP
0%
10%
20%
30%
40%
50%
60%
1.0 1.5 2.0 2.5 3.0 3.5 4.0ECO
NO
MIC
IMPA
CT
OF
VIO
LEN
CE
CO
NTA
INM
ENT
AS
PERC
ENTA
GE
OF
GD
P GPIMore peaceful Less peaceful
r = 0.7
FIGURE 3.3 ECONOMIC IMPACT OF VIOLENCE CONTAINMENT AS PROPORTION OF GDP COMPARED TO LEVELS OF PEACE IN 2015The economic impact of violence containment is higher in less peaceful countries.
Source: IEP
FIGURE 3.5 TEN COUNTRIES WITH HIGHEST ECONOMIC IMPACT OF VIOLENCE AS PERCENTAGE OF GDP
Conflict and organised crime are the major drivers that create a high economic impact from violence in these countries.
0%
10%
20%
30%
40%
50%
60%
Syria
Iraq
Afghanista
n
Venezuela
South Sudan
Honduras
Colombia
Central A
frican
Republic
North K
orea
Lesotho
ECO
NO
MIC
IMPA
CT
OF
VIO
LEN
CE
AS
PERC
ENTA
GE
OF
GD
P, 2
015
REGIONAL ANALYSIS
The economic impact by type of expenditure is not evenly distributed across regions, with large variations in both the magnitude of expenditure and its composition. Figure 3.4 illustrates the proportion by category for each region. The highest proportion of military expenditure was in North America, where it accounts for 78 per cent of the total economic impact. Europe proportionally spends the most on internal and private security, with this category making up 56 per cent of the economic impact of violence.
In contrast, Central America and the Caribbean has the highest proportion of expenditure related to interpersonal violence, at 56 per cent. This region has very high levels of interpersonal violence and accordingly incurs high costs from intentional homicides, violent and sexual assault and the fear of crime. For example, the economic impact of homicide in Venezuela and Honduras is the equivalent of 36 and 30 per cent of GDP respectively. South Asia and MENA are the worst affected regions for armed conflict.
COUNTRIES WHERE VIOLENCE HAS THE GREATEST ECONOMIC IMPACT
The economic impact of violence for the ten most affected countries accounts for more than 25 per cent of their GDP. They either have high levels of internal conflict or high levels of interpersonal violence. Syria has the highest proportion of its GDP related to violence containment expenditure at 54 per cent.
Of the ten countries where violence containment expenditure is proportionally the largest, five are experiencing armed conflict. These are Syria, Iraq, Afghanistan, South Sudan and the Central African Republic. The other countries have very high levels of interpersonal violence, with the exception of North Korea which is a highly militarised country. Figure 3.5 highlights the ten countries whose economic impact of violence relative to the size of their economy is the highest in the world.
Source: IEP
FIGURE 3.4 REGIONAL ECONOMIC IMPACT OF VIOLENCE BY SPENDING TYPE, 2015The combined impact of the military and internal security accounts for the highest category of spending in all regions aside from Central America and the Caribbean and South America.
78%
50% 48%38% 37%
28%23% 20%
14%
16%
33% 34%
22%
38% 56%
32%
25%27%
6%1%
13%
2%
1%
2%
0.2%2%
6% 11%18%
28% 24%16%
43%
55% 57%
0%
10%
20%
30%
40%
50%
60%
70%
80%
90%
100%
North America
MENA Asia-Pacific South Asia Russia and Eurasia
Europe sub-Saharan Africa
South America
Central America and the
Caribbean
PRO
PORT
ION
OF P
ER C
API
TA E
CO
NO
MIC
IM
PAC
T BY
REG
ION
, 20
15
Violent crime Armed conflictInternal security Military
48 49GLOBAL PEACE INDEX 2016 | Global Economic Value of Peace

Source: IEP
FIGURE 3.6 COST OF CONFLICT COMPARED TO OFFICIAL DEVELOPMENT ASSISTANCE, UN PEACEKEEPING AND PEACEBUILDING SPENDING
Peacebuilding expenditure is proportionally small compared to the economic losses from conflict.
$742
$167
$8.27 $6.80
100
200
300
400
500
600
700
Economic losses from conflict, 2015
Total ODA, gross disbursement, 2013
Total Peacekeeping, 2013
Peacebuilding to 31 conflict-a�ected countries, 2013
GLO
BAL
VALU
E IN
20
15 (B
ILLI
ON
S)
22% of the cost of conflict
1.1% of the cost of conflict
0.9% of the cost of conflict
BOX 3.2 CATEGORIES OF PEACEBUILDING EXPENDITURE
The following 17 categories based on three peacebuilding priority areas, identified as peacebuilding expenditure by the 2009 Report of the Secretary-General on Peacebuilding in the immediate aftermath of conflict (A/63/881 S/2009/304), were taken into consideration.
Priority area 1: Basic safety and security
z Security system management and reform
z Reintegration and small arms and light weapons (SALW) control
z Removal of land mines and explosive remnants of war
z Child soldiers (prevention and demobilisation)
z Participation in international peacekeeping operations
Priority area 2: Inclusive political processes
z Legal and judicial development
z Legislatures and political parties
z Anti-corruption organisations and institutions
z Democratic participation and civil society
z Media and free flow of information
z Human rights
z Women’s equality organisations and institutions
z Civilian peacebuilding, conflict prevention and resolution
Priority area 3: Core Government Functions
z Public sector policy and administrative management
z Public finance management
z Decentralisation and support to subnational government
Other
z Specific peace-related expenditures
PEACEBUILDING & PEACEKEEPING SPENDING COMPARED TO THE COST OF CONFLICT
Peacebuilding and peacekeeping operations are extremely important in preventing and dealing with violent conflict. Peacekeeping operations are measures aimed at responding to a conflict, whereas peacebuilding expenditures are aimed at developing and maintaining the capacities for resilience to conflict. Thus peacebuilding seeks to enable a country to sustain and develop peace over the long term.
This is done through building the core functions of government, ensuring basic levels of safety and security and increasing the internal capacity for dispute resolution by supporting inclusive political process, among other measures. Therefore, peacebuilding is more targeted than peacekeeping in creating the attitudes, institutions and structures that create and sustain peace in a conflict-affected country.
Peacebuilding expenditure aims to reduce the risk of lapsing or relapsing into violent conflict by strengthening national capacities and institutions for conflict management and laying the foundations of sustainable peace and development. These activities are distinct from peacekeeping activity, which is broadly aimed at responding to a conflict and establishing security.
Peacebuilding and peacekeeping related activities in conflict-affected countries are a small proportion of ODA. In 2013, peacebuilding and peacekeeping investments of $US6.8 and $US8.3 billion in were equivalent to nine per cent of total ODA, $US167 in that year.
Fragile and conflict-affected countries are in greater need of investment in peacebuilding to ensure they do not fall back into conflict. To ascertain the current level of aid spent on peacebuilding activities in conflict-affected countries, IEP undertook an assessment of the yearly expenditures that go into peacebuilding. The analysis is conducted using donor expenditures as measured by the Organisation for Economic Cooperation and Development
(OECD) Development Assistance Committee (DAC) Creditor Reporting System (CRS). More details on the categories of expenditure included are provided in Box 3.2.
Figure 3.6 highlights that the spending on peacebuilding and peacekeeping is small compared to the economic losses caused by conflict, representing 0.9 per cent 1.1 per cent respectively in 2015.
50 PB

POSITIVE PEACE & SYSTEMS THINKING

WHAT IS POSITIVE PEACE?
• Positive Peace is defined as the attitudes, institutions and structures which create and sustain peaceful societies. These same factors also lead to many other positive outcomes which society feels are important. Therefore Positive Peace is described as creating the optimum environment for human potential to flourish.
• Positive Peace has been empirically derived by IEP via the statistical analysis of thousands of cross-country measures of economic and social progress to determine what factors are statistically significantly associated with Negative Peace.
• Positive Peace is measured by the Positive Peace Index (PPI) which consists of eight domains, each containing three indicators, totalling 24. This provides a baseline measure of the effectiveness of a country’s institutions and attitudes to build and maintain peace. It also provides a measure for policymakers, researchers and corporations to use for monitoring and evaluation efforts.
• Positive Peace factors can be used as the basis for empirically measuring a country’s resilience, or ability to absorb and recover from shocks. It can also be used to measure fragility and to help predict the likelihood of conflict, violence and instability.
• There is a close relationship between Positive Peace and violence as measured by Negative Peace.
IEP’s framework for Positive Peace is based on eight
factors. The Positive Peace factors not only sustain
peace but also support an environment where human potential flourishes. They interact in complex ways, are multidimensional and
are generally slow moving.
POSITIVE PEACE
Sound business environment
High levels of human capital
Low levels of corruption
Free flow of information
Good relations with neighbours
Acceptance of the rights of others
Well functioning government
Equitable distribution
of resources
THE PILLARS OF PEACE
... is the absence of violence or fear of violence
... is the attitudes, institutions and structures which create and
sustain peaceful societies.
NEGATIVE PEACEPOSITIVE PEACE FACTORS
52 53
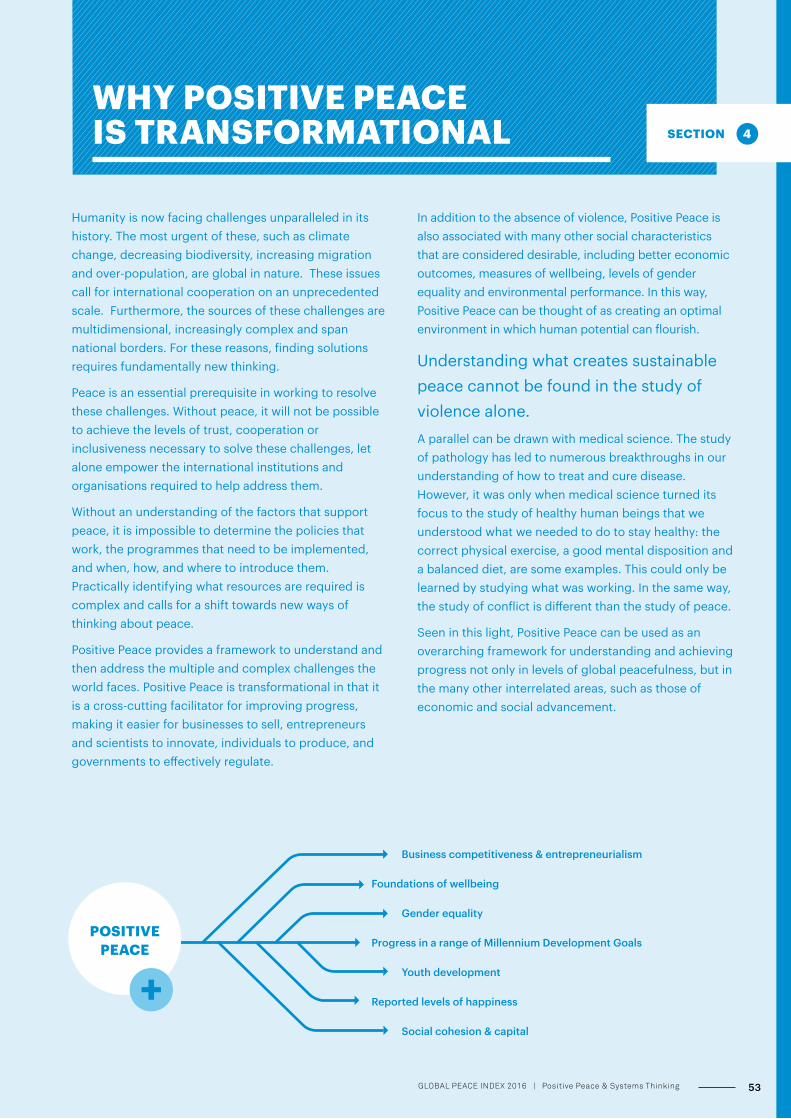
WHY POSITIVE PEACE IS TRANSFORMATIONAL
Humanity is now facing challenges unparalleled in its history. The most urgent of these, such as climate change, decreasing biodiversity, increasing migration and over-population, are global in nature. These issues call for international cooperation on an unprecedented scale. Furthermore, the sources of these challenges are multidimensional, increasingly complex and span national borders. For these reasons, finding solutions requires fundamentally new thinking.
Peace is an essential prerequisite in working to resolve these challenges. Without peace, it will not be possible to achieve the levels of trust, cooperation or inclusiveness necessary to solve these challenges, let alone empower the international institutions and organisations required to help address them.
Without an understanding of the factors that support peace, it is impossible to determine the policies that work, the programmes that need to be implemented, and when, how, and where to introduce them. Practically identifying what resources are required is complex and calls for a shift towards new ways of thinking about peace.
Positive Peace provides a framework to understand and then address the multiple and complex challenges the world faces. Positive Peace is transformational in that it is a cross-cutting facilitator for improving progress, making it easier for businesses to sell, entrepreneurs and scientists to innovate, individuals to produce, and governments to effectively regulate.
In addition to the absence of violence, Positive Peace is also associated with many other social characteristics that are considered desirable, including better economic outcomes, measures of wellbeing, levels of gender equality and environmental performance. In this way, Positive Peace can be thought of as creating an optimal environment in which human potential can flourish.
Understanding what creates sustainable peace cannot be found in the study of violence alone. A parallel can be drawn with medical science. The study of pathology has led to numerous breakthroughs in our understanding of how to treat and cure disease. However, it was only when medical science turned its focus to the study of healthy human beings that we understood what we needed to do to stay healthy: the correct physical exercise, a good mental disposition and a balanced diet, are some examples. This could only be learned by studying what was working. In the same way, the study of conflict is different than the study of peace.
Seen in this light, Positive Peace can be used as an overarching framework for understanding and achieving progress not only in levels of global peacefulness, but in the many other interrelated areas, such as those of economic and social advancement.
POSITIVE PEACE
Business competitiveness & entrepreneurialism
Foundations of wellbeing
Gender equality
Progress in a range of Millennium Development Goals
Youth development
Reported levels of happiness
Social cohesion & capital
52 53GLOBAL PEACE INDEX 2016 | Positive Peace & Systems Thinking

INTRODUCTION
This section introduces systems thinking as it has developed in biology and ecology, then applies it to the nation state. Doing so offers a new and innovative way in which to view a host of old problems.
The section also builds upon these concepts in its discussion on the resilience of nation states. Resilience is commonly understood to relate to two main properties: a country’s ability to absorb and recover from shocks, and its ability to adapt, evolve and improve in challenging circumstances.
Through empirical analysis, it is shown that Positive Peace offers a framework by which to explore these properties.
This section of the 2016 GPI report provides a description of complex systems thinking in relation to Positive Peace and the nation state and presents new research on the link between Positive Peace, which represents “the attitudes, institutions and structures which sustain peace”, and broader societal resilience.
Countries with high levels of Positive Peace, for example, suffer fewer effects from natural disasters, including 13 times fewer fatalities compared to low Positive Peace countries. Furthermore, Positive Peace levels relate to a country’s reaction to different systemic shocks. While high Positive Peace countries are subject to more economic shocks, major internal shocks such as violent political change, violent conflict, and genocide, typically occur in low Positive Peace countries. Trends in the GPI also show that high Positive Peace is a significant determinant of long term improvements in peace.
KEY FINDINGS
z High Positive Peace countries are more likely to maintain stability, adapt and recover from shocks as they overcome challenges.
z Countries that are high in Positive peace are more likely to maintain high levels of peace.
z Twice as many high Positive Peace countries improved in peace between 2008 and 2016 when compared to countries with low Positive Peace.
z Eighty-four per cent of major political shocks occurred in low Positive Peace countries.
z Numbers of lives lost from natural disasters between 2005 and 2015 were 13 times larger in low Positive Peace countries than in high Positive Peace countries, a disproportionately high ratio when compared to the distribution of incidents.
54 55

UNDERSTANDING POSITIVE PEACE
The analysis in this report is based on two simple but useful definitions of peace, each of which has a long history in peace studies – Negative Peace and Positive Peace. These two commonly referenced definitions of peace were categorised by one of the founders of modern peace studies, Johan Galtung.
According to his view, Negative Peace is the absence of violence or fear of violence – an intuitive definition that many agree with and one which enables peace to be measured more easily. Measures of Negative Peace are used to construct the GPI.
A more ambitious conceptualisation of peace is Positive Peace. Well-developed Positive Peace represents the capacity for a society to meet the needs of its citizens, reduce the number of grievances that arise and resolve remaining disagreements without the use of violence. IEP defines Positive Peace as the attitudes, institutions and structures that create and sustain peaceful societies.
BOX 4.1 KEY TERMS
Positive Peace: the presence of the attitudes, institutions and structures that create and sustain peaceful societies.
Negative Peace: the absence of direct violence or fear of violence.
Conflict: a disagreement between two or more individuals or groups. Conflict can either be nonviolent or violent and, depending on how it is dealt with, can be either constructive or destructive.
Resilience: the ability of nations to absorb and recover from shocks. High levels of Positive Peace enhance resilience in situations like natural disasters or economic shocks.
Shock: a sudden change from inside or outside the system that has the potential to cause harm.
Encoded norms: the values by which society self-organises.
Homeostasis: a persistent state of self-regulating and balanced stability.
Self-modification: a process by which society modifies itself to accommodate new situations and challenges.
Human beings encounter conflict regularly – whether at home, at work, among friends, or on a more systemic level between ethnic, religious or political groups. But the majority of these conflicts do not result in violence. Most of the time individuals and groups can reconcile their differences without resorting to violence by using mechanisms such as societal attitudes that curtail violence or legal systems designed to reconcile grievances. Conflict provides the opportunity to negotiate or renegotiate a social contract, and as such it is possible for constructive conflict to involve nonviolence.1 Positive Peace facilitates change and adaptation to new dynamics.
This section describes how Positive Peace can instruct us to build and reinforce the attitudes, institutions and structures that pre-empt conflict or help societies channel disagreements productively rather than falling into violence. Findings from the Global Partnership for the Prevention of Armed Conflict’s (GPPAC) review of civil society and conflict conclude that, “When tensions escalate into armed conflict, it almost always reflects the break down or underdevelopment of routine systems for managing competing interests and values and resulting in the failure to satisfy basic human needs.”2 Thus, the Positive Peace framework draws out the aspects of societies that prevent these breakdowns, based on their statistical association with the absence of violence.
The distinguishing feature of IEP’s work on Positive Peace is that it has been empirically derived through quantitative analysis. There are few known empirical frameworks available to analyse Positive Peace. Historically it has largely been understood qualitatively and based on idealistic concepts of a peaceful society. Instead, IEP’s Positive Peace framework is based on the quantitatively identifiable common characteristics of the world’s most peaceful countries. In order to address the gap in this kind of quantitative research, IEP utilises the time series data contained in the GPI, in combination with existing peace and development literature to statistically analyse the characteristics peaceful countries have in common. An important aspect of this approach is to avoid value judgement and allow statistical analysis to explain the key drivers of peace.
BOX 4.2 THE POSITIVE PEACE INDEX
IEP measures Positive Peace using the Positive Peace Index (PPI), which measures the level of Positive Peace in 162 countries, covering 99 per cent of the world’s population. The PPI is composed of 24 indicators to capture the eight domains of Positive Peace. Each of the indicators was selected based on the strength of its statistically significant relationship to the absence of violence. For more information and the latest results of the PPI, see the 2015 Positive Peace Report, available from www.visionofhumanity.org.
CONCEPTUALISING AND MEASURING THE ATTITUDES, INSTITUTIONS AND STRUCTURES
THAT BUILD A MORE PEACEFUL SOCIETY
54 55GLOBAL PEACE INDEX 2016 | Positive Peace & Systems Thinking

z Good Relations with Neighbours Peaceful relations with other countries are as
important as good relations between groups within
a country. Countries with positive external relations
are more peaceful and tend to be more politically
stable, have better functioning governments, are
regionally integrated and have lower levels of
organised internal conflict. This factor is also
beneficial for business and supports foreign direct
investment, tourism and human capital inflows.
z Free flow of information Free and independent media disseminates
information in a way that leads to greater openness
and helps individuals and civil society work together.
This is reflected in the extent to which citizens can
gain access to information, whether the media is free
and independent, and how well-informed citizens are.
This leads to better decision-making and more
rational responses in times of crisis.
z High levels of human capital A skilled human capital base reflects the extent to
which societies educate citizens and promote the
development of knowledge, thereby improving
economic productivity, care for the young, enabling
political participation and increasing social capital.
Education is a fundamental building block through
which societies can build resilience and develop
mechanisms to learn and adapt.
z Low levels of corruption
In societies with high corruption, resources are
inefficiently allocated, often leading to a lack of
funding for essential services. The resulting
inequities can lead to civil unrest and in extreme
situations can be the catalyst for more serious
violence. Low corruption can enhance confidence
and trust in institutions.
z Well-Functioning Government A well-functioning government delivers high-quality
public and civil services, engenders trust and
participation, demonstrates political stability, and
upholds the rule of law.
z Sound Business Environment Sound business environment – The strength of
economic conditions as well as the formal institutions
that support the operation of the private sector and
determine the soundness of the business environment.
Business competitiveness and economic productivity
are both associated with the most peaceful countries, as
is the presence of regulatory systems that are conducive
to business operations.
z Equitable Distribution of Resources Peaceful countries tend to ensure equity in access to
resources such as education and health, as well as,
although to a lesser extent, equity in income
distribution.
z Acceptance of the Rights of Others Formal laws guaranteeing basic human rights and
freedoms and the informal social and cultural norms
that relate to behaviours of citizens serve as proxies
for the level of tolerance between different ethnic,
linguistic, religious, and socio-economic groups
within the country. Similarly, gender equality and
worker’s rights are important components of societies
that uphold acceptance of the rights of others.
IEP HAS IDENTIFIED EIGHT KEY DOMAINS, OR PILLARS, THAT COMPRISE POSITIVE PEACE:
56 57

...refer to norms, beliefs, preferences and relationships within society. Attitudes influence how people and groups cooperate in society, and can both impact and be impacted upon by the institutions and structures that society creates.
...are the formal bodies created by governments or other groups, such as companies, industry associations or labour unions. They may be responsible for supplying education or rule of law, for example. The way institutions operate is affected by both the attitudes that are prevalent within a society and the structures that define them.
...can be both formal and informal and serve as a shared code-of-conduct that is broadly applicable to most individuals. Informally, it could be as simple as the protocol for queuing or formally, as complex as tax law. Interactions are often governed by informal rules and structures, such as politeness, societal views on morality or the acceptance or rejection of other’s behaviours.
These pillars interact with and affect society’s attitudes, institutions and structures. High levels of Positive Peace occur where attitudes make violence less tolerated, institutions are more responsive to society’s needs and structures underpin the nonviolent resolution of grievances.
Attitudes, institutions and structures are all highly interrelated, and can be difficult to distinguish. But what is more important than the drawing of clear lines between them is the understanding of how they interact as a whole.
IEP does not attempt to determine the specific attitudes, institutions and structures necessary for Positive Peace, as these will very much be dependent on cultural norms and specific situations. What is appropriate in one country may not be appropriate in another.
ATTITUDES
INSTITUTIONS
STRUCTURES
POSITIVE PEACE HAS THE FOLLOWING CHARACTERISTICS:
z Systemic and complex: it is complex; progress occurs in non-linear ways and can be better understood through relationships and communication flows rather than through a linear sequence of events.
z Virtuous or vicious: it works as a process where negative feedback loops or vicious cycles of violence can be created and perpetuated or, alternatively, positive feedback loops are where virtuous cycles of peace are created and perpetuated.
z Preventative: though overall Positive Peace levels tend to change slowly over time, building strength in relevant pillars can prevent violence and violent conflict.
z Underpins resilience and nonviolence: Positive Peace builds the capacity for resilience and incentives for nonviolent alternatives to conflict resolution. It provides an empirical framework to measure an otherwise amorphous concept, resilience.
z Informal and formal: it includes both formal and informal societal factors. This implies that societal and attitudinal factors are equally as important as state institutions.
z Supports development goals: Positive Peace provides an environment in which development goals are more likely to be achieved.
Source: IEP
FIGURE 4.1 THE PILLARS OF POSITIVE PEACE
The factors of Positive Peace are highly interconnected and interact in varied and complex ways.
Wellfunctioninggovernment
Equitabledistributionof resources
Free flowof information
Good relations
with neighboursHigh levels
of human capital
Acceptanceof the rights
of others
Low levelsof corruption
Soundbusiness
environment
PEACE
56 57GLOBAL PEACE INDEX 2016 | Positive Peace & Systems Thinking

The approach presented here is still in its early stages of development but aims to provide a fundamentally new framework for envisioning societies. There is a clear need to better understand how countries can make institutions more relevant to their citizens, be better able to adapt to global challenges, as well as be more certain about how to effectively increase economic wealth and human fulfilment. In an age when serious threats to humanity are posed by our interactions with the natural world through changes in the atmosphere, oceans and biodiversity, systems thinking can help us better understand our collective interdependence on these systems and the interdependence between nations.
Positive Peace is the framework developed by IEP that describes the factors associated with peaceful societies. It consists of eight domains that interact in multi-faceted ways, where the importance of each domain and direction of causality will vary, depending on individual circumstances. Systems thinking provides a mechanism with which to understand how Positive Peace operates and how to better apply it in developing policy.
Systems theory first originated while attempting to better understand the workings of organic organisms, such as cells or the human body. Through such studies, it became clear that merely understanding the individual characteristics of parts of a system was inadequate to describe a system as a whole, which functions as much more than the sum of its parts. When applied to the nation state, this approach offers alternatives to traditional or reductionist techniques of understanding change.
There are four major properties associated with systems thinking:3
z The system cannot be reduced to its parts as individually the parts will have a different pattern of behaviour.
z The system is self-regulating. It aims to maintain a steady state by stabilising itself through feedback loops. The system adjusts to create balance between inputs, outputs and internally coded requirements so as to maintain what is termed homeostasis.
z The system is self-modifying: when there is a persistent mismatch between inputs and its codes, the system searches for a new pattern by which it can function. This creates differentiation from the original system and increases complexity.
z The system does not stand on its own. It is part of a larger system but also contains its own sub-systems. It also interacts with other similar systems. These ‘systems-of-systems’ adapt together.
All systems are considered open, interacting with both the sub-systems within it, other similar systems and the super-system within which it is contained. The nation state is made up of many actors, units and organisations spanning the family, local communities and public and private sectors. As all of these operate both individually and interact with other institutions and organisations, each can be thought of as their own open system within the nation state. Some examples are companies, families, unions, armies or public institutions. Similarly, nation states interact with other nations through trading relations, regional body membership, diplomatic exchanges or through war.
There is one clear distinction between organisms and societies. Organisms have very clear physical boundaries. The boundaries of societies are less clear and can be somewhat arbitrary. However, the nation works well as a system. Most nations have a concept of self-identity, where citizens see themselves as belonging to it, it has control over its territory, and it can regulate and enforce laws.
Figure 4.2 illustrates different system levels that are relevant to the nation state. It shows that the nation state itself is made up of many sub-systems, including the individual, civil society and business communities. Scaling up the view, the nation state is a sub-system of the international community, in which it builds and maintains relationships with other nation states and international organisations. Finally, the international community forms a sub-system of the biosphere. It should be noted that any sub-system within the following diagram can interact with a super system at any level. For example, the individual can interact with the nation state, other nation states, the international community and the natural environment.
SYSTEMS THINKING: THE NATION STATE & PEACE
By applying systems thinking to the nation state, new and unique approaches can be developed to understand how societies work, how to better manage the challenges they face and how to improve overall well-being.
58 59

Source: IEP
FIGURE 4.2 SYSTEMS AND THE NATION STATE
The nation state is both a super and sub system depending on the field of view. The smallest sub system can interact directly with the largest super system.
SUPER SYSTEMAtmosphere, Biosphere, Oceans
International Community
SUB SYSTEM
Nation State
Nation State
Nation State
Nation State
International Community
Markets
Gov’t
NationState
Households
CAUSALITY
Inherent in our understanding of the world and the way we interact within it is the concept of causality. We take an action and expect an outcome. We are so attuned to this concept that it is built into our subconscious. We needn’t think twice about each step we take when we walk down the street because of this built in understanding. In every-day life, physical actions have an effect that always results in the same outcome. The repeatability of certain scientific laws in terms of causality has enabled great strides in human progress, and is no better expressed than in the engineering marvels of today.
Assumptions of linear causality, however, imply that all outcomes can be tracked back in a linear fashion to an initial condition. The idea that things are predetermined by a set of initial conditions leaves no room for genuine novelty, standing in contradiction to our experience of reality. Linear causality is useful for explaining discrete and well-isolated physical phenomena but when multiple variables are involved it becomes increasingly difficult to truly understand the cause.
The difficulty in applying linear causality to human beings, and by extension societies, is best explained through an example. In a conversation, linear causality would imply that the same words would have the same effect on whomever they are spoken to.
However, this is clearly not the case. Take, for example, the words that are written here. Read by three different people, each could interpret them differently due to a number of factors, including their background knowledge, what they may think of the writer, or even their moods on the day. This will naturally affect their interpretation of the text and any subsequent actions related to the text.
This simple example clearly shows how individual human reactions can be unpredictable. The problem of linear causality is compounded when it is extended to social systems. In terms of the nation state, similar actions will result in very different outcomes in the various countries. Due to the differences in cultural norms, a speech given at a political rally in America and the same speech delivered in North Korea would garner different reactions.
To account for this, systems thinking offers a more complex view of causality through the mechanics of mutual feedback loops. In such a view, the separation between cause and effect is blurred. A mutual feedback loop is where two interacting entities modify each other through their feedback. A conversation or negotiation are good examples of mutual feedback loops. A further example can be observed in the relation between the free flow of information and a well-functioning government. Governments can regulate what
58 59GLOBAL PEACE INDEX 2016 | Positive Peace & Systems Thinking

information is available; however, information can also change governments. Both will respond to the action of the other. In systems thinking, a “cause” is seen not as an independent force but as an input to a system which then reacts, producing the effect. The difference in reaction is due to different encoded norms, or values by which society self-organises.
The concept of mutual feedback loops gives rise to the notion of causeless correlations and forms the basis of Positive Peace. Statistically significant correlations describe macro relationships, but the causal relationships will vary depending on the particular circumstances.
Furthermore, from a systems perspective, each “causal” factor does not need to be understood. Rather, multiple interactions that stimulate the system in a particular way negate the need to understand all the causes. Processes can also be mutually causal. For example, as corruption increases, business reacts, which in turn changes the way corruption is undertaken. Similarly, improved health services provide for a more productive workforce, which in turn provides the government with higher income and more money to invest in health.
Systems are also susceptible to tipping points in which a small action can change the structure of the whole system. The Arab Spring began when a Tunisian street vendor set himself alight because he couldn’t earn enough money to support himself. The relationship between corruption and peace follows a similar pattern. IEP research found that increases in corruption have little effect until a certain point, after which small increases in corruption can result in large deteriorations in peace.
HOMEOSTASIS
Homeostasis is where the system aims to maintain a certain state or equilibrium. An example of this is the self-regulation of the body temperature of a mammal. If the body starts to overheat then it begins to sweat, if the body becomes cold then the metabolism will adjust. The system attempts to make small adjustments based on the way inputs are interpreted by its encoded norms. The same model of understanding can be applied to the nation state. Nation states maintain homeostasis through encoded norms.
Encoded norms create reactions to inputs. For example, the desire to seek food when hungry or the release of T-cells in response to infection are encoded reactions to inputs. For the nation state, as inflation increases, interest rates are raised to dampen demand and when an infectious disease outbreak occurs, medical resources are deployed to fix it.
One of the key differences between natural systems, such as the weather or the oceans, and biological systems is that biological systems have intent. Analogously, nation states and governing powers also have intent. For example, when Costa Rica abolished its military in 1948 the government-in-sitting had a clear intent not to go to war. In contrast, other nations with large armies can use these in serving their perceived national interests. Systems also have the ability to modify their behaviour, based on the input that they receive from their environment.
Encoded norms and intent are used to choose and maintain homeostasis. When the state becomes unbalanced, they allow adjustments to be made to match its performance with its intent and encoded norms. These adjustments or actions can also affect the inputs. This, as mentioned, is called a mutual feedback loop. For instance, in a hypothetical event whereby two animals face off to fight over a scrap of food, the movement of the first animal serves as an input for the second, which in turn responds in a novel way. This alters the memory of the first and future responses will take this into account. In relation to a democratic nation state, this is analogous to the continuous interactions between two political parties or the discourse between the media and the public.
These feedback loops provide the system with knowledge of its performance or non-performance in relation to pre-established goals. Given this, it may be possible to analyse political systems through their feedback loops to better understand how “healthy” they may be. Measuring how much political organisations within a society respond to input may be one way of tracking this. Similarly, social values can also be viewed and better recognised by using the mutual feedback model through, for example, understanding what behaviours are shunned and what behaviours are encouraged within a society.
SELF-MODIFICATION
When unchecked or operating in isolation, feedback loops lead to runaway growth or collapse. In cultures, their role can be constructive or destructive. However, these are fundamental in promoting self-modification, which allows the nation state to evolve into a higher level of complexity. The effect of mutual feedback loops can be the accumulation of capital, the intensification of poverty or the spread of disease or new ideas.
If the external or internal factors of the nation state pressure the system into persistent imbalance, then a new level of complexity needs to be developed to maintain stability. In terms of organisms, it can be viewed as genes being switched on in response to its changing environmental factors. Within the biosphere, it could be the mutation of species so their offspring are better adapted to their environment. For the nation, it may take the form of major shifts within the system. For example, as the population of a country increases, this places stress on the agricultural resources of the country. The nation state responds by implementing measures which improve the yield of the available land while building an export industry to produce capital for the importation of food. Without the new responses to over-population the system would slowly degrade as the responses were inadequate to meet the changed needs. Other examples that increase complexity for the nation state could include the movement from an authoritarian system to democracy. Adaptation is more likely when the nation has higher levels of Positive Peace.
Figure 4.3 shows the process for homeostasis and self-modification. Encoded norms and intent combine to set goals for the nation state. The performance of the nation in relation to these goals is then assessed by receiving input either internally or externally. While the nation is performing acceptably with
60 61

respect to its goals and intent, the feedback loops make minor adjustments to maintain homeostasis. However, when the system’s performance is persistently mismatched to desired goals and performance, then it can begin a process of self-modification. This process allows the system to, in accordance with its encoded norms, increase the complexity of its internal structure and adapt to the new challenge. Though figure 4.3 depicts this process using a simple process diagram, in reality, these mechanisms are complex and dynamic.
The relationship between the nation state and other systems, such as the biosphere and atmosphere, is key to the future survival of humanity. If these systems become incapacitated the nation states also weaken. Similarly, the interdependence between nations, when viewed holistically, fundamentally alters the way they are seen to interact.
When applying systems thinking to the nation state it’s important not to over-complicate the analysis. What is important is to view the system as a set of relationships rather than events and to understand the most important feedback loops. Positive Peace provides a framework from which to understand and approach change, moving from simple causality to holistic action.
Source: IEP
FIGURE 4.3 HOMEOSTASIS AND SELF-MODIFICATION
Homeostasis occurs when there is balance between a system’s internal goals and its performance. If performance persistently is not matched to a nation state’s goals, it will self-modify and adapt. Once this change has occurred, the nation state will redefine its goals and attempt to maintain the new homeostasis.
Self modification
Feedback loops
Encoded norms and intent
Goalsetting
Performanceassessment
Homeostasis
Performance input
Persistent mismatch of performance
and goals
The relationship between the nation state and other systems, such as the biosphere and atmosphere, is key to the future survival of humanity. If these systems become incapacitated the nation states also weaken. Similarly, the interdependence between nations, when viewed holistically, fundamentally alters the way they are seen to interact.
60 61GLOBAL PEACE INDEX 2016 | Positive Peace & Systems Thinking

This section explains the key concepts associated with resilience and explores the interaction between Negative and Positive Peace. The term resilience is often used with two meanings:
1. the ability to withstand a shock and maintain the current social system, such as high levels of health, wealth, peace, etc., and/or
2. the characteristic of adaptability, whereby society changes for the better in response to a shock.
To explore this further, figure 4.4 shows a stylised depiction of the link between resilience and Positive Peace. The attitudes, institutions and structures described by the pillars of Positive Peace not only provide a framework for assessing a country’s potential for peace, but also provide a proxy for a country’s ability to plan for and respond to change or shocks. A key reason for this is the mutually reinforcing nature of the societal structures underpinning the pillars. For instance, when a country has strong formal institutions, such as a well-functioning legal system, in combination with strong informal
RESILIENCE AND POSITIVE PEACE
The concept of resilience, which is critical to development and peacebuilding, is both mutually reinforcing and integral to Positive Peace. Positive Peace offers a holistic framework with which to understand why some countries cope well with sudden change while other countries suffer from it. Sudden changes, often referred to as shocks, include natural disasters, epidemics and political and economic changes, but can also be positive events, such as the introduction of a new technology or the discovery of a new mineral resource deposit. A country’s level of resilience reflects how well it responds to sudden changes. The strengths and weaknesses of a country’s pillars of Positive Peace can help explain why it manages shocks well or poorly.
Source: IEP
FIGURE 4.4 LINK BETWEEN RESILIENCE AND POSITIVE PEACE
Positive Peace enables higher resilience. Higher levels of Positive Peace correspond to greater resilience to shocks.
RESI
LIEN
CE
POSITIVE PEACE
Weak Positive Peace and low resilience
Strong Positive Peace and high resilience
Weaker Positive Peace
Low
er re
silie
nce
Stronger Positive Peace
Hig
her r
esili
ence
Countries with high levels of Positive Peace are by far the most stable.
62 63

institutions, such as cohesive communities, it will theoretically respond or adapt to specific shocks more effectively, as depicted in figure 4.5.
IEP’s research has found a link between Positive Peace and the characteristics that make social systems stabilising and adaptive. Additionally, it uses empirical data to show that large shocks tend to have more severe impacts in low Positive Peace countries than in high Positive Peace countries.
Showing this link empirically is complex. Firstly, proving causality from one event to another, in this case, a shock leading to a deterioration in peace, is difficult. Few, if any, deteriorations in peace can be traced back to one source, as shown by the continued debate over the cause of World War I. Secondly, the impact of shocks are non-linear and have unpredictable effects on systems. While the impact of Hurricane Katrina was proportional to its size, the triggering of the Arab Spring from the self-immolation of Mohammad Bouazizi was not. Given these factors, the aim is not to predict when a shock will happen or how a country will fare after a shock, but how well equipped it is to rebound and adapt to the shocks it faces.
Resilience is generally understood to have two properties: stability and adaptability. The following research looks at these properties from three different perspectives. Firstly, maintaining homeostasis and enabling adaptability is shown through examining trends in the GPI. Secondly, it is demonstrated that the relative impact of exogenous shocks, such as natural disasters, in low Positive Peace countries tends to be larger. Finally, it is shown that the types of endogenous shocks that can occur from within a nation tend to be more severe in countries where Positive Peace is weaker. From these observations a taxonomy of shocks based on Positive Peace is developed.
POSITIVE PEACE AND TRENDS IN THE GPI
This section presents research on the link between Positive Peace and a nation’s ability to, firstly, maintain homeostasis and, secondly, self-modify to new, more desirable levels. This section uses the Positive Peace Index (PPI) produced by IEP as a basis
for the analysis. This index covers 162 countries and is built from 24 indicators across all eight pillars of Positive Peace to measure the strength of the attitudes, institutions and structures that create and sustain peaceful societies.
To explore a country’s ability to maintain homeostasis and to self-modify, it is useful to look at changes in GPI scores since 2008 based on Positive Peace levels. A plot of country ranks of Positive Peace and the GPI in 2008 is shown in Figure 4.6. Using the difference in country rankings between the GPI and PPI, IEP calculates a country’s peace gap to explore the potential for improvements in peace, which is measured in the GPI as the absence of violence or fear of violence.
When a country ranks higher in the PPI than in the GPI a country is said to have a Positive Peace surplus, indicating a high level of institutional capacity to support lower levels of violence. Conversely, countries that rank higher in the GPI than in the PPI will have a Positive Peace deficit and are comparatively more vulnerable to external shocks and run a higher risk of increased levels of violence.
On average, the majority of the world’s Positive Peace deficit countries are in sub-Saharan Africa, with the peace gap being greatest for low-income countries. The highly peaceful countries are very tightly clustered in both the PPI and the GPI, demonstrating the resilience of these countries, most of which show only small changes in scores over the period.
Figure 4.7 (overleaf) illustrates changes in the internal GPI score from 2008 to 2016 for three equal groups of countries based on PPI scores. This shows that countries with high levels of Positive Peace are by far the most stable, with around three out of every four countries remaining within ten per cent of 2008 levels of peacefulness. High Positive Peace countries also had the least number of deteriorations in internal peace, around 55 per cent less than either of the other two categories. Figure 4.8 shows changes in the GPI based on Positive Peace deficit or surplus. In this figure it can be seen that nations with a surplus of Positive Peace had the greatest number of countries improving in internal peace after a shock. Conversely, the group of countries with a deficit of Positive Peace had the fewest improvements after a
Source: IEP
FIGURE 4.5 IMPACT OF AN IDENTICAL SHOCK ON A HIGH AND LOW RESILIENCE SYSTEM
An identical event may have starkly di�erent impacts depending on the resilience of a system.
RESI
LIEN
CE
CHANGES IN NEGATIVE PEACE Smaller changes in Negative Peace
Low
er re
silie
nce
Larger changes in Negative Peace
Hig
her r
esili
ence
Shock event in a high resilience system causes only a small change in negative peace
Shock event in a low resilience systemcauses larger changes in negative peace
62 63GLOBAL PEACE INDEX 2016 | Positive Peace & Systems Thinking

Source:
FIGURE 4.6 POSITIVE PEACE AND THE GPI, 2008
The Positive Peace deficit is a measure of the di�erence between the GPI and Positive Peace. The higher the GPI rank is in relation to Positive Peace, the more likely a deterioration in peace.
0
20
40
60
80
100
120
140
160
0 20 40 60 80 100 120 140 160
POSI
TIV
E PE
AC
E IN
DEX
RA
NK
200
8
GLOBAL PEACE INDEX (INTERNAL SCORE) RANK 2008
Positive Peace DeficitPositive Peace EquilibriumPositive Peace Surplus
Mor
e pe
acef
ul
More peaceful
Less
pea
cefu
l
Less peaceful
Source: IEP
FIGURE 4.7 POSITIVE PEACE AND CHANGES IN GPI, 2008-2016
Countries with high levels of Positive Peace are by far the most stable.
0
10
20
30
40
50
60
High Medium Low
NU
MBE
R O
F C
OU
NTR
IES
(BA
SED
ON
CH
AN
GE
IN G
PI 2
00
8-20
16)
POSITIVE PEACE LEVEL
> 10% Deterioration in GPI> 10% Improvement in GPIMinimal Change in GPI
Source: IEP
FIGURE 4.8 POSITIVE PEACE SURPLUS AND DEFICIT AND CHANGES IN THE GPI, 2008-2016
High Positive Peace enables countries to improve their levels of peace over time.
0
10
20
30
40
50
60
NU
MBE
R O
F C
OU
NTR
IES
(BA
SED
ON
CH
AN
GE
IN G
PI 2
00
8-20
16)
POSITIVE PEACE DEFICIT/SURPLUS
> 10% Deterioration in GPI> 10% Improvement in GPIMinimal Change in GPI
PP Surplus PP Equilibrium PP Deficit
64 65

shock. The combination of stability and the ability to evolve highlights the link between Positive Peace and resilience.
POSITIVE PEACE AND SHOCKS
The word shock is used to describe a sudden change in some aspect of a system. In terms of the nation state, shocks are sudden onset events that have the potential to “cause fatalities, injuries, property damage, infrastructure damage, agricultural loss, damage to the environment, interruption of business, or other types of harm or loss.”4 Shocks can be catastrophic events that directly cause loss of life and/or events that trigger the outbreak of violence. Some shocks can be positive events, such as democratic elections, the introduction of a new technology or the discovery of a new mineral resource deposit.
As explained previously, there are three mechanisms that a country uses to continue and evolve:
z Homeostasis is a persistent state of self-regulating and balanced stability.
z Feedback loops are used to restore balance when the homeostasis becomes imbalanced, threatened by forces from inside or outside the system.
z Self-modification is when the system modifies itself to accommodate new situations and challenges. This tends to increase complexity in the system, often allowing the system to become more adaptive.
Feedback loops allow countries to be resilient in the aftermath of shocks. The process of this is depicted in figure 4.9 using a hypothetical scenario between 2008 and 2016. How a country is operating today is its current homeostasis. In the case outlined,
there is a period of homeostasis between 2008 and 2011 when a shock occurs. If feedback loops are enacted then the country returns to the level of performance prior to the shock within a short period, as shown by case A. However, in case B the system is able to self-modify and improve its level of performance in the aftermath, benefiting from the shock in the long run. In case C, the same mechanism restores stability but at a lower level of performance. If feedback loops fail to restore some form of stability, the system will deteriorate into dysfunction (case D).
Shocks are useful phenomena with which to better understand resilience and peace. When they occur, they affect many aspects of an otherwise stable society and their flow-on effects can be long term and unpredictable. Shocks can, therefore, create tense situations that can lead to violence.
The 2010 earthquake in Port-au-Prince, Haiti, is an example of a shock that triggered violence. During the earthquake, the National Penitentiary in Port-au-Prince was severely damaged, allowing over 5,000 prisoners to escape.5 At the same time, police officers were immediately engaged in disaster response, reducing their capacity to respond to crime and violence, and police resources were also damaged in the earthquake.6 Chaotic conditions facilitated the regrouping of formerly dispersed or imprisoned gang members and, combined with general post-disaster lawlessness, the city saw an escalation of turf wars and a rise in homicide, assault and rape.7 The intersection of a severe shock and existing vulnerabilities in the system, such as weak infrastructure and an under-resourced police force, led to a deterioration in peacefulness. However, not all shocks trigger violence.
Countries with high levels of Positive Peace have the attitudes, institutions and structures that are associated with the absence of violence. These can be understood as drivers of nonviolence. The social characteristics that make up Positive Peace give
Source: IEP
FIGURE 4.9 SYSTEM RESPONSES TO A SHOCK
Homeostasis occurs when there is balance between a system’s internal goals and its performance. In the aftermath of a shock the system’s feedback loops are enacted to avoid dysfunction and restore homeostasis.
SYST
EM P
ERFO
RMA
NC
E
2008 2009 2010 2011 2012 2013 2014 2015 2016
Homeostaticperiod
Shock
Feedback loops failand system becomes
dysfunctional
Case A - Feedback Loops
Self-modification creates new homeostasis
Case B
Case C
Case D
Wor
se p
erfo
rman
ceBe
tter p
erfo
rman
ce
64 65GLOBAL PEACE INDEX 2016 | Positive Peace & Systems Thinking

people access to methods of resolving conflicts and addressing change without the perceived need to use violence.
TAXONOMY OF SHOCKS
Social systems can experience two types of shocks. Many shocks are exogenous: a sudden change in a variable outside the system that impacts variables within the system. In this case, it is useful to think of exogenous as meaning “outside of the control of policy makers.” For example, natural disasters may occur inside a country but are largely unexpected and outside of the control of policy makers. However, other shocks such as food and currency price shocks can be within the realm of domestic policy although they can also be caused by factors outside of the control of country governments.
On the other hand, social systems can also produce endogenous shocks. Social unrest, protests, labour strikes or political assassinations, for example, occur when people are responding to something inherent within a system. Economic shocks typically arise from characteristics of the economic and governance system within a country.
There are a host of sudden events that can disrupt a society, potentially resulting in violence. Some can even be caused by violence, such as the refugee crises affecting Europe and Syria’s neighbours in the wake of the Syrian civil war. In Lebanon, the influx of refugees has put downward pressure on wages, causing economic disruption. In Europe, the influx of refugees has overwhelmed social services.
Different types of shocks arise in different types of systems. Political shocks, such as coups d’etat, occur more frequently in low Positive Peace environments while economic shocks, such as stock market crashes, happen more often in high Positive Peace environments.
Table 4.1 lists a variety of types of shocks in terms of their primary levels of exogeneity or endogeneity. Events such as natural disasters lie largely outside of the control of countries while crises such as economic shocks arise because of the conditions within society. Alternatively, some events can arise from either external or internal conditions – or, most likely, a combination of the two.
TABLE 4.1 TAXONOMY OF ENDOGENOUS AND EXOGENOUS SHOCKS
While shocks are often classified as exogenous or endogenous, in reality most arise from a range of exogenous or endogenous factors.
PRIMARILY EXOGENOUS CAN BE BOTH EXOGENOUS AND/OR ENDOGENOUS
PRIMARILY ENDOGENOUS
Natural Disasters Incoming Refugees Economic Shock
Price Shocks Post-conflict reintegration
Social Unrest
Invasion from a Foreign Power
Epidemic Industrial Accident
Pandemic Political Crisis
Terrorism Revolution
Civil War
EXOGENOUS SHOCKS
Natural disasters are the most prevalent and least predictable type of shock. Between 2005 and 2015, there were over 2,400 natural disasters in 196 countries affecting more than 1.8 billion people.8 They occur all over the world, and their frequency has historically been outside the control of policy makers. Importantly, as the effect of climate change accelerates so too may the frequency and impact of natural disasters.
Figure 4.10 shows that natural disasters kill more people in low Positive Peace countries. While this is striking, many factors affect how large the likely effect from a natural disaster may be, other than Positive Peace. Firstly, some countries are located in geographical regions where such events are more frequent. Secondly, some regions are more prone to more severe disasters that naturally affect more people simply due to their magnitude. Finally, the population density of a country is relevant, whereby any disaster will affect more people in a higher density area than it would in a lower density area. However, these factors are not adequate in explaining the full extent of the discrepancy in lives lost shown in Figure 4.10.
BOX 4.3 EMERGENCY EVENTS DATABASE
IEP used data from the Emergency Events Database (EM-DAT) to explore the relationship between resilience and positive peace. EM-DAT captures basic data on the occurrence and effects of natural and technological disasters for the years 1900 to 2015. Events are included in the database if they meet one of the following criteria:
10 or more people reported killed
100 or more people reported affected
declaration of a state of emergency
call for international assistance.
Information on events is sourced from a variety of sources, with preference given to data from UN agencies and country governments.9
To explore the link between Positive Peace and the reduction of impacts from natural disasters it is necessary to examine the distributions of frequency, severity and population density across different levels of Positive Peace. While there will undoubtedly be other factors that determine the impact of a natural disaster in a country, for brevity this report will look at these three major areas.
Figure 4.11 shows the frequency of natural disasters by level of Positive Peace. Figure 4.10 shows that countries at lower levels of Positive Peace experience far more fatalities as a result of natural disasters. Countries with weak Positive Peace have a fatality ratio of 13:1 compared to high Positive Peace environments while the frequency of natural disasters is much closer at 6:5. Figure 4.12 highlights that population densities in lower Positive Peace countries are not significantly larger than higher Positive Peace countries. Neither density nor frequency provides a full explanation of the significant difference in loss of life from natural disasters between high and low Positive Peace countries.
66 67

Figure 4.13 (overleaf) depicts the density of total numbers of people affected by natural disasters by levels of Positive Peace.10 While low Positive Peace countries have had a number of large events affecting more than 100,000 people, in general figure 4.13 shows only minor differences in the number of people affected in low and high Positive Peace countries. Figure 4.14 however shows that higher Positive Peace countries suffer more in terms of economic loss from natural disasters.
Source: EMDAT, IEP
FIGURE 4.11 FREQUENCY OF NATURAL DISASTERS, 2005-2015
Natural disasters are only slightly more frequent in low Positive Peace countries, yet they have a fatality ratio of 13:1 compared to high Positive Peace environments.
Very High High Medium LowNU
MBE
R O
F N
ATU
RA
L D
ISA
STER
S 20
05-
2015
POSITIVE PEACE LEVELS
0
100
200
300
400
500
600
700
800
Source: WORLD BANK, IEP
FIGURE 4.12 POPULATION DENSITIES AND POSITIVE PEACE, 2014
Population density is not significantly greater in low Positive Peace countries and so does not account for the larger loss of life in these nations.
POSITIVE PEACE
POPU
LATI
ON
DEN
SITY
0
250
500
750
1000
Very High High Medium Low
1250
Burundi
Bangladesh
Dominican Republic
HaitiIndia
Jamaica
South Korea
Lebanon
Sri Lanka
Mauritius
Nigeria
Netherlands
Pakistan
Philippines
North Korea
Rwanda
El SalvadorTrinidad and Tobago
Viet Nam
Source: EMDAT, IEP
FIGURE 4.10 TOTAL NUMBER OF DEATHS FROM NATURAL DISASTERS, 2005-2015
More people are killed by natural disasters in low Positive Peace countries than high Positive Peace countries.
0
100,000
200,000
300,000
400,000
500,000
600,000
Very High High Medium Low
NU
MBE
R O
F FA
TALI
TIES
FRO
M
NAT
UR
AL
DIS
AST
ERS
200
5-20
15
POSITIVE PEACE LEVELS
If cross-country data was available on measures of severity, such as the Richter or Beaufort scales, a more accurate model could be developed that may alter the outcome of this analysis.
66 67GLOBAL PEACE INDEX 2016 | Positive Peace & Systems Thinking

ENDOGENOUS SHOCKS
Endogenous shocks are sudden onset events that arise from conditions inside society. Particular conditions may change rapidly or build up over time and result in unexpected events that have the potential to spark violence. Civil unrest is a good example as there can be months or years of ongoing conflict without violence that quickly turns violent because of a sudden, destabilising event. Economic shocks are similar. Economic conditions can be misaligned for a long time before resulting in a sudden crash or crisis that has the potential to spark riots or other types of violence.
Despite being engendered by the social system, endogenous shocks are still unpredictable. It is often impossible to know when, where or how they will arise. But the data does show that different types of shocks occur in low versus high Positive Peace settings and that more shocks overall take place in low Positive Peace countries.
This suggests that it is possible to reduce the impact of shocks by proactively building resilience and Positive Peace. Additionally, countries with high levels of Positive Peace are less likely to deteriorate in Negative Peace post-shock. The onset of different types of shocks is shown in figure 4.15.
Figure 4.15 highlights that twice as many infrastructure accidents occur in countries with low Positive Peace than those with high levels. This is intuitive, as higher Positive Peace countries will generally have better infrastructure due to an efficient well-functioning government, a sound business environment and higher levels of income. Furthermore, economic shocks and crises are far more prevalent in very high
Positive Peace countries. Again, this is intuitive as the risk of financial shocks increases as financial institutions proliferate and become more and more integral to a country’s economy.
Violent shocks such as regime changes, coups d’etat and revolutions have been more prevalent in countries with lower Positive Peace, with 84 per cent of these occurring in medium to low Positive Peace countries. Genocide, being jus cogens in international law, is the largest endogenous systemic breakdown investigated and since 2005 has occurred in three countries. Offensives by the state during the Sri Lankan civil war in 2008 have been classified as genocide against the Tamils. In the Central African Republic, following the forcible displacement of the President Bozizé regime on 24 March 2013, the government engaged in predatory actions against the population. The Sunni extremists organized under the banner of the Islamic State in Iraq since 2014 have targeted Yazidis and Christians in their controlled territories. It is estimated that these operations have killed around 5,000 people.
Source: EMDAT, IEP
FIGURE 4.14 PROPERTY DAMAGE FROM NATURAL DISASTERS BY POSITIVE PEACE, 2005-2015
High Positive Peace countries incur larger property damage due to natural disasters.
50% of natural disasters cost morethan $2,386,107 in high Positive Peace
countries compared to $181,577in low Positive Peace countries
Positive Peace Level
0%
25%
50%
75%
100%
100 10,000 1,000,000 100,000,000
DAMAGE IN '000S US 2005 DOLLARS (LOG 10)
CU
MU
LATI
VE
DEN
SITY
Very HighHighMediumLow
Source: EMDAT, IEP
FIGURE 4.13 NUMBER OF PEOPLE AFFECTED BY NATURAL DISASTERS, BY POSITIVE PEACE, 2005-2015
The severity of natural disasters as indicated by numbers of people a�ected do not significantly di�er depending on Positive Peace.
Positive Peace Level
0.0
0.5
1.0
1,000 100,000
TOTAL NUMBER PEOPLE AFFECTED (LOG 10)
DEN
SITY
OF
PEO
PLE
AFF
ECTE
D
Very HighHighMediumLow
68 69

Source: EMDAT, INSCR, Reinhart and Rogo�, UCDP, IEP
FIGURE 4.15 DISTRIBUTION OF ENDOGENOUS SHOCKS, 2005-2015
Lower Positive Peace countries experience more industrial and political shocks while higher Positive Peace countries su�er more economic shocks.
253 349 358164
61
7038
20
18
17
6
5
4
2
2
210
0
0
Infrastructure Accident(2005−2015)
Economic Shock Onset(2005−2010)
Political Shock Onset(2005−2014)
Violent Conflict Onset(2005−2014)
Genocide Onset(2005−2014)
Very High High Medium Low
POSITIVE PEACE
0%
20%
40%
60%
PERCENTAGE OF TOTAL INCIDENTS
Source: IEP
FIGURE 4.16 RESILIENCE BUILDING IN A POSITIVE PEACE SYSTEM
Positive Peace can be used to not only build resilience directly but also to shift the shocks a country is exposed to from violent to nonviolent .
Resilience building
Resilience reducing
Negative Peace Positive Peace
Impact of Exogenous
Shock
Likelihood of Violent
Endogenous Shocks
BOX 4.4 ENDOGENOUS SHOCKS DATA
IEP has sourced the following data for creating a database of shocks:
Infrastructure accidents are from EMDAT and include transport, industrial and technological disasters.
Economic shocks and crises are from Reinhart and Rogoff (2010) and include incidence of crises in banking, currency, inflation crises, sovereign debt and stock markets.
Political shocks are from Polity IV and include regime changes, coup-d’etats and revolutions.
Violent conflict is from the UCDP Battle deaths dataset.
SYSTEMS MAP OF POSITIVE PEACE AND RESILIENCEAs has been discussed, Positive Peace allows a nation state to build resilience in order to maintain stability while also being able to recover from shocks. Additionally, high Positive Peace countries improve through adaptation to new challenges.
Figure 4.16 explains the links between exogenous and endogenous shocks and Positive and Negative Peace. Countries can reduce the impact of exogenous shocks but not the likelihood. Conversely, they mitigate endogenous shocks by reducing the likelihood and impact. This depiction shows that building Positive Peace assists in reducing the risk of violent exogenous and endogenous shocks in two ways. The first is that it directly reduces the potential for conflict within a country. The second is an indirect relationship, in that Positive Peace minimises the potential for shocks interacting with existing negative drivers, which could create a more volatile situation.
These observations highlight two important aspects of resilience. The first is that building resilience does not have to be direct, using systems thinking it is easy to see how improvements in one area can strengthen resilience in another. Secondly, by building Positive Peace a country can shift the types of shocks it is vulnerable to from violent ones, such as revolutions and regime changes, to non-violent ones, such as infrastructural and economic. By reducing the risk of internal threats, a country will be able to maintain homeostasis more easily.
68 69GLOBAL PEACE INDEX 2016 | Positive Peace & Systems Thinking

IEP’s analysis demonstrates that building resilience in a preventative manner, by building high levels of Positive Peace, is an effective way to reduce the potential for violence. But how should countries go about doing this?
IEP offers two recommendations as entry points to changing peace systems:
1. FOCUS ON THE WEAKEST PILLAR
This intervention aims at targeting the weakest pillar and then building the appropriate actions to stimulate it. This should have the benefit of not only improving the pillar but due to interdependencies, also have a positive flow on effect to the other pillars of Positive Peace.
Nepal is an example of a country where change was driven by progress in its weakest pillar. Nepal was one of the five countries with the greatest improvement in the Positive Peace Index from 2005 to 2015. In 2005, Nepal’s weakest pillar of Positive Peace was free flow of information and this pillar showed the largest improvement from 2005 to 2015, as shown in figure 4.17. Over the course of the next decade, Nepal’s score for free flow of information improved by 30 per cent, driven by a dramatic increase in mobile phone penetration in the country. Shortly thereafter, the country began to show improvement in other areas of Positive Peace. Between 2007 and 2011, Nepal made significant gains in free flow of information, acceptance of the rights of others and equitable distribution of resources. In 2016, Nepal’s internal peace score is two percent better than it was in 2008 and its Positive Peace score was seven per cent better in 2015 than in 2005.
Source: IEP
FIGURE 4.17 POSITIVE PEACE PILLAR SCORES IN NEPAL, 2005-2015
Improvements in free flow of information led the improvements in Positive Peace that Nepal achieved over the decade.
2.5
2.7
2.9
3.1
3.3
3.5
3.7
3.9
4.1
4.3
4.5
2005 2006 2007 2008 2009 2010 2011 2012 2013 2014 2015
POSI
TIVE
PEA
CE
PILL
AR
SCO
REW
eake
r<-
-Str
onge
r
Equitable Distribution of Resources
FREE FLOW OF INFORMATION
High Levels of Human CapitalGood Relations with NeighboursAcceptance of the Rights of OthersWell-Functioning GovernmentSound Business Environment
Low Levels of Corruption
BUILDING POSITIVE PEACE RECOMMENDATIONS FOR CATALYSING SYSTEMIC CHANGE
Violence and conflict continue to thwart efforts to meet humanitarian goals and tackle major challenges, such as climate change or poverty reduction. In 2015, the economic impact of containing or dealing with the consequences of violence was 13.3 per cent of world GDP, yet in comparison far less is devoted to addressing the underlying conditions that lead to violence or conflict.
70 71
2. STIMULATE THE WHOLE SYSTEM
The aim of this approach is to stimulate the system from many different angles and involves finding an intervention for each pillar which has the following characteristics:
z The intervention is practical and can be implemented in the current political dynamics.
z The intervention will have an impact that is substantial.
z The intervention will have an effect over the shorter term as well as the longer term.
This kind of system-wide improvement can create the environment for a virtuous cycle of peacebuilding.
IEP has piloted a program to develop conversations around practical, measurable and impactful investments in the key drivers of peace.
IEP’s Positive Peace workshops are designed to bring together key stakeholders at the national and local level. Workshops seek to meet two main goals. The first is to ground the globally derived factors of Positive Peace in a more localised context, which includes reality testing whether workshop participants see the factors as salient within their country or community. The second is to identify concrete investments that can be made in the Positive Peace factors themselves.
ZIMBABWE POSITIVE PEACE WORKSHOP CASE STUDY
IEP coordinated a workshop on Positive Peace in November 2015 in Harare, Zimbabwe, in partnership with the National Peace Trust, a Zimbabwean organisation. The workshop was supported by IEP and led by the National Peace Trust. Over 50 participants attended, including senior government officials, including Zimbabwe’s Vice President, the Honourable ED Mnangagwa, who made introductory remarks, followed by civil society leaders, church leaders, academics and NGO representatives. The workshop took place over two days and included presentations by identified experts in each of the eight Positive Peace factors.
The workshop brought together representatives of the ruling party, opposition parties and civil society aligned with both sides of politics. One of the tangible outcomes of the workshop is follow-up discussions, planned for later in 2016, about how civil society and government can work together more effectively around the eight Positive Peace pillars.
BACKGROUND TO THE WORKSHOP
The relative peace of a society is underpinned by the material and cultural circumstances of that society. Thus, the overall objective of the workshop was to set up an action-orientated steering group to identify and analyse possible initiatives on the pillars of peace, as well as support efforts to bring those initiatives to fruition.
The most profound observations from an analysis of the Global Peace Index, which forms an important background for this project, show that those countries with stronger levels of Positive Peace also tend to be those that experience more virtuous cycles of peace. Viable initiatives are needed to strengthen the Positive Peace domains and in the process build consensual approaches to address the social, economic and political issues necessary for durable peace.
To understand the concept of Positive Peace in a southern African context, there has to be an understanding of local, regional and national historical and social factors. This lays the groundwork for developing locally relevant conceptualisations of the Positive Peace pillars, which can then be put to use in formal processes of governance.
In southern Africa, the spiritual relationship between people and groups is fundamental in creating peace. Workshop participants emphasised that the collective nature of many African cultures values Ubuntu and Hunhu, the connective social tenets that give emphasis to the collective through which individuals are connected. These principles create the social equilibrium that maintain peace and the capacity to resolve conflict in African communities. When this equilibrium is lost, conflict is often the outcome.
To maintain this equilibrium, Negative Peace is only a starting point. The cultural heritage of southern African communities needs to be taken into account when crafting locally relevant approaches to Positive Peace. While tangible and material needs identified in the Pillars of Peace need to be met to help maintain peace in society, the spiritual and communal side of African culture also needs to be included. The lessons from this communal history can then inform deeper processes of peacebuilding in the West, balancing the preference for formal statebuilding and peacebuilding processes.
To fully engage in the development of Positive Peace, there has to be a shift away from the accusatory approaches to one that focuses on the shared processes of developing peace. While respecting the cultural and spiritual aspects of African societies, there also needs to be a basis for agreement on definitions of peace. A key question that underpins this is: what is the definitive outcome peace is intended to achieve? Is it peace for its own sake, peace for economic and political development, or a value-free programme meant to achieve stable technocracy?
Through a shared understanding of peace in the wider southern Africa region, complex systems and social processes can be explored using innovative tools and methods to find patterns of Positive Peace across communities.
70 71GLOBAL PEACE INDEX 2016 | Positive Peace & Systems Thinking

Sound Business Environment
Strengthening the Links between Government and BusinessCommercial Arbitration CentreThis initiative develops government and business rapport and ability to work together to develop regulatory and social structures that make the most of human capital, while attracting foreign investment. Governments and businesses are not competitors but must be aware of the inter-relatedness between effective regulation and positive business practices.
Equitable Distribution of Resources
Designing and Testing Land Conflict Resolution Models and Equitable Distribution of Resources Institute of Agro StudiesThis initiative develops conflict resolution processes to manage conflicts related to land use and access issues. Follows on from land reforms during the 2000s, tying in local mediation processes with official legal processes.
Well-Functioning Government
Community Participation in the Local Authority Budgetary Processes: Strengthening Local Government Institutions for Effective Service DeliveryAfrica Bureau of Strategic StudiesThis project aims to increase the quality and relevance of government services. It proposes making the budgeting process at the local and national level open to citizen consultation and participation so their needs are encoded into the spending processes that fund public services.
Good Relations with Neighbours
Promoting a Regional Citizen Ethic Zimbabwe Electoral Commission The Southern African Development Community (SDAC) regional body has an official position on promoting good relations between neighbouring states but this does not extend into shared notions of civil ethic and participation at the citizen level. This project is designed to encourage greater cooperation between the SADC bodies, governments and civil society organisations. It would build trust between government leaders and civil society, improving the relations between neighbouring states.
Free Flow of information
Words Are Not Stones CampaignMedia Institute of Southern AfricaA campaign to decriminalise free expression and restructure defamation laws to increase free flows of information in the media. Free flow of information is key to democracy, and this can be further enshrined in the SADC Protocol on Culture, Information and Sport.
Acceptance of the Rights of Others
Training Women’s Clubs for Engagement with Traditional LeadersWomen’s BureauThis initiative has been developed to engage women’s clubs in local settings, providing training on best practices for engaging with local and traditional leadership on youth, food and peacebuilding issues.
High Human Capital Development
Labs for GirlsData AfricaThis initiative addresses the need for girls to have increased opportunities to pursue education and careers in the sciences. It will set up special laboratory spaces to increase girls’ participation in science at 50 secondary schools, increasing girls’ and women’s input into science and increasing their capacity to live independently.
Low Levels of Corruption
Mapping Of Informational Needs, Packaging and Dissemination of Information to Enhance Active Citizen Participation in Promoting AccountabilityZimbabwe Environmental Lawyers AssociationThis project will gather relevant legal and civil society data to empower citizens to check government corruption and demand their rights under the law. It will make this information manageable through data visualisation and infographics that people can easily digest and make use of.
INITIATIVES RELATED TO POSITIVE PEACE IN SOUTHERN AFRICA
The outcome of the National Peace Trust and IEP’s Positive Peace workshop was a plan for one practical initiative to address each of the eight pillars of Positive Peace.
72 PB

SUSTAINABLE DEVELOPMENT GOAL 16
5
NO POVERTY
ZERO HUNGER
GOOD HEALTH & WELLBEING
QUALITY EDUCATION
GENDER EQUALITY
CLEAN WATER AND SANITATION
AFFORDABLE AND CLEAN ENERGY
DECENT WORK AND ECONOMIC GROWTH
INDUSTRY, INNOVATION AND INFRASTRUCTURE
REDUCED INEQUALITIESSUSTAINABLE CITIES AND COMMUNITIESRESPONSIBLE CONSUMPTION AND PRODUCTIONCLIMATE ACTION
LIFE BELOW WATERLIFE ON LANDPEACE, JUSTICE AND STRONG INSTITUTIONS
PARTNERSHIPS FOR THE GOALS
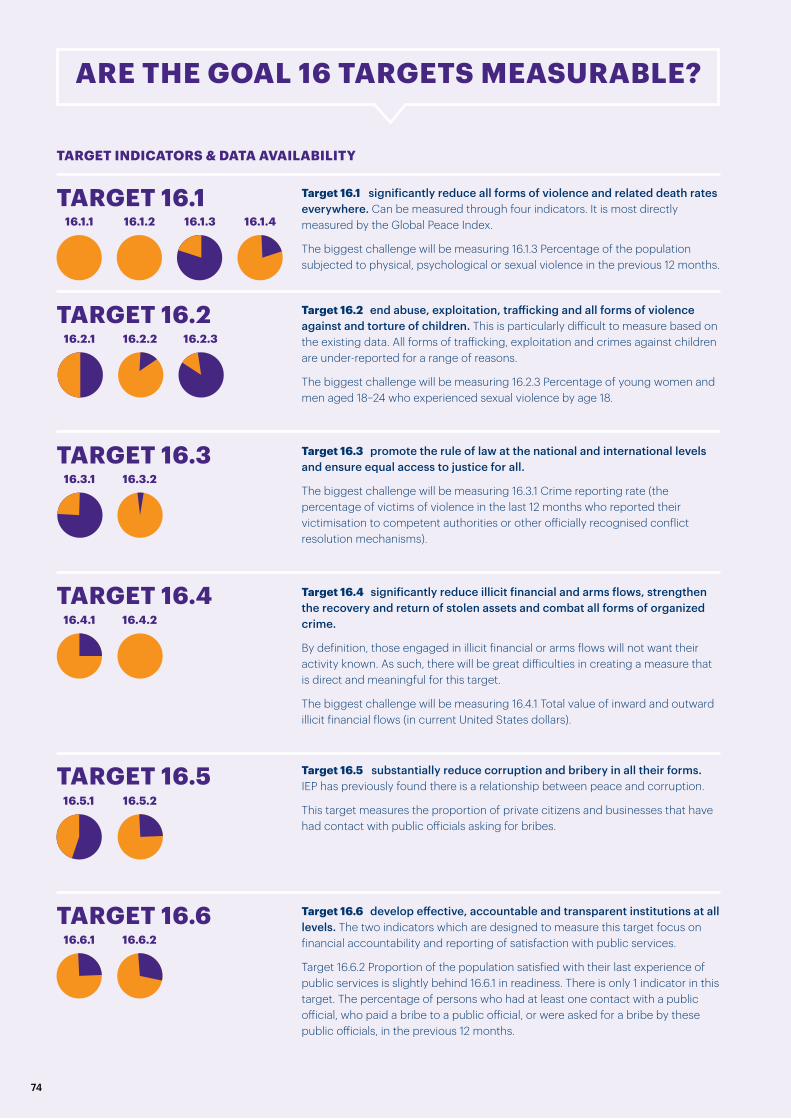
ARE THE GOAL 16 TARGETS MEASURABLE?
TARGET 16.5 Target 16.5 substantially reduce corruption and bribery in all their forms. IEP has previously found there is a relationship between peace and corruption.
This target measures the proportion of private citizens and businesses that have had contact with public officials asking for bribes.
TARGET 16.1 Target 16.1 significantly reduce all forms of violence and related death rates everywhere. Can be measured through four indicators. It is most directly measured by the Global Peace Index.
The biggest challenge will be measuring 16.1.3 Percentage of the population subjected to physical, psychological or sexual violence in the previous 12 months.
TARGET 16.2 Target 16.2 end abuse, exploitation, trafficking and all forms of violence against and torture of children. This is particularly difficult to measure based on the existing data. All forms of trafficking, exploitation and crimes against children are under-reported for a range of reasons.
The biggest challenge will be measuring 16.2.3 Percentage of young women and men aged 18–24 who experienced sexual violence by age 18.
TARGET 16.3 Target 16.3 promote the rule of law at the national and international levels and ensure equal access to justice for all.
The biggest challenge will be measuring 16.3.1 Crime reporting rate (the percentage of victims of violence in the last 12 months who reported their victimisation to competent authorities or other officially recognised conflict resolution mechanisms).
TARGET 16.4 Target 16.4 significantly reduce illicit financial and arms flows, strengthen the recovery and return of stolen assets and combat all forms of organized crime.
By definition, those engaged in illicit financial or arms flows will not want their activity known. As such, there will be great difficulties in creating a measure that is direct and meaningful for this target.
The biggest challenge will be measuring 16.4.1 Total value of inward and outward illicit financial flows (in current United States dollars).
TARGET 16.6 Target 16.6 develop effective, accountable and transparent institutions at all levels. The two indicators which are designed to measure this target focus on financial accountability and reporting of satisfaction with public services.
Target 16.6.2 Proportion of the population satisfied with their last experience of public services is slightly behind 16.6.1 in readiness. There is only 1 indicator in this target. The percentage of persons who had at least one contact with a public official, who paid a bribe to a public official, or were asked for a bribe by these public officials, in the previous 12 months.
16.1.1
16.3.1
16.4.1
16.6.1
16.5.1 16.5.2
16.1.2
16.2.1
16.3.2
16.4.2
16.6.2
16.1.3
16.2.2
16.1.4
16.2.3
TARGET INDICATORS & DATA AVAILABILITY
74 75

5
TARGET 16.7 Target 16.7 ensure responsive, inclusive, participatory and representative decision-making at all levels. A core component of development includes participation in the decisions which have an impact on an individual or groups’ life and wellbeing.
The biggest challenge will be measuring 16.7.1 Proportions of positions (by age group, sex, persons with disabilities and population groups) in public institutions (national and local legislatures, public service, and judiciary) compared to national distributions.
TARGET 16.8 Target 16.8 is to broaden and strengthen the participation of developing countries in the institutions of global governance.
The indicator to measure this is 16.8.1 Percentage of members and voting rights of developing countries in international organisations. In order to be measured it will require a decision on which institutions to include. This is one of the few indicators in Goal 16 that could be measured immediately as it does not require additional input.
TARGET 16.9 Target 16.9 provide legal identity for all, including birth registration.
The indicator to measure this is 16.9.1 Percentage of children under 5 whose births have been registered with a civil authority, disaggregated by age. Registration of children is the first step for recognising their rights under the law. Furthermore, registration helps ensure that children are counted and can access the services of the state.
TARGET 16.10 Target 16.10 ensure public access to information and protect fundamental freedoms, in accordance with national legislation and international agreements.
This target is very similar to the Positive Peace measures of free flow of information and acceptance of the rights of others.
The proxy indicators chosen to measure this are the numbers of verified cases of killing, kidnapping, enforced disappearance, arbitrary detention and torture of journalists, associated media personnel, trade unionists and human rights advocates in the previous 12 months as well as measures of public access to information.
TARGET 16 A & B Target 16 A seeks to strengthen relevant national institutions, including through international cooperation, for building capacity at all levels, in particular in developing countries, to prevent violence and combat terrorism and crime.
This is addressed by compliance with Paris Principles for independent human rights institutions.
Target 16 B is to promote and enforce non-discriminatory laws and policies for sustainable development.
This indicator would benefit from survey collections.
Data available
Data not available
16.7.1
16.8.1
16.9.1
16.7.2
16.10.1
16.A
16.B
16.10.2
74 75GLOBAL PEACE INDEX 2016 | Sustainable Development Goal 16

KEY FINDINGS
• IEP’s comprehensive audit of the existing data for Goal 16 indicates that it is measurable, although with many limitations.
• Fifteen of the 23 indicators in Goal 16 can be measured by currently existing sources. The remaining eight indicators can be measured by proxy indicators.
• There are still significant challenges to data availability, reliability, timeliness and objectivity. It will take significant time and investment for National Statistical Offices to develop the necessary statistical capacity to measure Goal 16.
• Third party initiatives will be required to fill the data gaps and act as a source of independent verification for the National Statistical Offices.
• The targets in Goal 16 are relevant to many of IEP’s Positive Peace factors.
Although this section focuses solely on Goal 16, as this is the area where IEP has the most relevant domain knowledge, the 17 Goals are universal, interconnected and need to be viewed holistically. Enduring environments of peace can only be achieved through holistic approaches. The emphasis on the interconnectedness between prevention, sustaining peace and development is in line and compatible with IEP’s Positive Peace framework which views societal development as systemic.
Goal 16 is the outcome of the international community’s acknowledgement that peace is fundamental to development. By annually measuring the levels of peace in over 160 countries worldwide, IEP has shown that peace is not an abstract concept but something that can be tracked and actioned. The recognition
by the international community that peace can and should be measured for development outcomes is indeed a very positive shift.
Goal 16 aims to promote just, peaceful and inclusive societies. It consists of 12 targets, measuring direct violence, drivers of violence, governance and justice. Such an approach is highly compatible with IEP’s research which addresses both Negative and Positive Peace. Goal 16 is a measure of key aspects of both Negative Peace, which is defined as ‘the absence of violence and the fear of violence’, as well as Positive Peace, which is defined as ‘the attitudes, institutions and structures that support and sustain peaceful societies.’
The 17 SDGs include 169 targets and have been created through a collaborative process over several years. As the goals were only recently agreed to, there is not universal coverage, but proxies are available for most measures. This section only audits third party data; it does not audit the availability of administrative data from National Statistical Offices.
An audit of data that could be used to measure Goal 16 found that there is no existing sources of data that cover the full scope and disaggregation required for any one indicator.
However, of the 23 indicators chosen to measure Goal 16:
• Two indicators can be measured immediately and be fully disaggregated. These are the measures of the independence of national human rights institutions and the representation of developing countries in international organisations.
• An additional 13 indicators can be measured immediately but do not have disaggregation or full coverage.
• A close or similar measure is available for seven indicators.
On 1 January 2016, the 17 Sustainable Development Goals (SDGs) of the 2030 Agenda for Sustainable Development — adopted by UN member states in September 2015 — officially came into force. They provide an overarching, comprehensive and integrated framework for global action on a vast range of critical issues for the next 15 years. Goal 16 is dedicated to the promotion of peaceful and inclusive societies for sustainable development, the provision of access to justice for all and building effective, accountable institutions at all levels.
MEASURING GOAL 16
76 77

• One indicator has only proxy measures available.
• There are measures to gauge progress for all indicators.
Goal 16 does however present a number of potential methodological concerns. In the spirit of the SDGs being country led, the intention is for many of the measurements to be led by National Statistical Offices (NSOs). However, of the 12 targets in Goal 16, ten face potential conflicts of interest in measurement by the state. Currently, there are a number of third party organisations that measure many of the indicators for Goal 16 which can be used for independent verification. These include the Small Arms Survey which measures the illicit trade in small arms and light weapons, the World Justice Project which measures the rule of law, Transparency International which measures press freedom and Peace Research Institute Oslo which measures conflict-deaths. Also,
some indicators do not necessarily relate to the achievement of targets. Nine of the 12 targets in Goal 16 are not adequately measured by the indicators that have been selected.
As a result of this audit, IEP recommends that independent third party organisations provide complimentary support to NSOs and offer a useful benchmark against which to compare results. One such effort is an informal grouping of independent research organisations and networks that will measure and publish Goal 16 using available data. The grouping currently includes the Global Forum for Media Development, the Institute for Democracy and Electoral Assistance, Namati, the Peace Research Institute Oslo, Research 4 Development, Saferworld, the Small Arms Survey, the Sustainable Development Solutions Network, Transparency International, the Transparency, Accountability and Participation Network, the World Justice Project and IEP.
GOAL 16: PEACE, JUSTICE AND STRONG INSTITUTIONS
Goal 16 is one of 17 Global Goals that make up the 2030 Agenda for Sustainable Development. The SDGs build upon the foundation of the Millennium Development Goals (MDGs) which ended in 2015, but focus more on the root causes of poverty and development while recognising that an integrated approach is crucial for progress across the multiple goals. The SDGs reflect that conflict and instability are significant impediments for development.
EFFECT OF CONFLICT ON ACHIEVING THE MDGS
Conflict has prevented many countries from reaching their development goals. There are 33 states that have been identified as fragile and in conflict situations by the World Bank. This includes countries currently in conflict such as Afghanistan, Iraq and Syria. It also includes countries that are fragile but not in conflict and have had historical conflicts or are politically unstable such as Bosnia and Herzegovina, Cote d’Ivoire, Kosovo and Timor-Leste.
These fragile and conflict-affected countries achieved significantly less progress than other developing countries in the MDGs. On average only 16 per cent of these countries met or made progress on their MDGs targets. Fragile and conflict affected countries were on average 25 per cent more likely to have missed their MDG goals than other countries.
MDG indicators for which the majority of fragile and conflict-affected countries had the poorest results for, were those that addressed child mortality, maternal health and environmental
Source: World Bank, IEP Calculations
FIGURE 5.1 AVERAGE PROGRESS IN MILLENNIUM DEVELOPMENT GOALS FOR FRAGILE AND CONFLICT COUNTRIES VS OTHER COUNTRIES
On average, fewer countries that were in conflict situations achieved their Millennium Development Goals than other countries.
0%
10%
20%
30%
40%
50%
60%
70%
80%
90%
100%
ALL OTHER COUNTRIESFRAGILE AND CONFLICT-AFFECTED COUNTRIES
Met target or progress
Met target or progress
Some progress
Some progress
O� target or no data
O� target or no data
PRO
PORT
ION
OF
CO
UN
TRIE
S
76 77GLOBAL PEACE INDEX 2016 | Sustainable Development Goal 16

sustainability. No conflict-affected country achieved the goal of reducing by two-thirds the under-five mortality rate between 1990 and 2015.
Additionally, many of the fragile and conflict-affected countries have difficulty in maintaining the necessary systems to adequately capture the data. This can lead to poor quality data, resulting in situations appearing worse or better than what they are.
The MDG process demonstrated the length of time required to build capacity to capture the relevant data for the international measures. The first indicator for the MDGs was to halve the proportion of people whose income is less than $1.25 a day by 2015. However, in 2015 there were slightly less than half of all countries that had at least two data points on this measure. The effect of this is that progress in these countries could not be determined as at least two data points are required to make a calculation.1
IDENTIFYING OVERLAPS WITH ACTUAL DRIVERS OF VIOLENCE
Through Goal 16, the SDGs recognise the long reaching consequences of conflict and violence for development outcomes. Not only is violence a severe hindrance for development, it can reverse many years of development gains. Conflict greatly affects economic development by reducing foreign direct investment and the broader macro-economic environment. This affects poverty, life expectancy and education outcomes, as well as indicators which are essential for longer term development like infant mortality and
Source: World Bank, IEP Calculations
FIGURE 5.2 PERFORMANCE IN MILLENNIUM DEVELOPMENT GOALS FOR FRAGILE AND CONFLICT-AFFECTED COUNTRIES
Fragile states under-performed the global average or had insuicient data in the vast majority of indicators.
0 5 10 15 20 25 30
MDG 7.9 - IMPROVED SANITATION
MDG 7.8 - IMPROVED WATER
MDG 5.1 - MATERNAL MORTALITY
MDG 4.2 - INFANT MORTALITY
MDG 4.1 - UNDER-5 MORTALITY
MDG 3.1 - EDUCATION GENDER PARITY
MDG 2.1 - PRIMARY COMPLETION
MDG 1.9 - UNDERNOURISHMENT
MDG 1.1 - EXTREME POVERTY
O� target or no dataSome progressSome progressMet target or progress
Number of countries
Source: World Bank, IEP Calculations
FIGURE 5.3 WORLD BANK ESTIMATES OF STATISTICAL CAPACITY IN CONFLICT, FRAGILE AND NON-CONFLICT COUNTRIES
Countries that are fragile and conflict-a�ected have much lower statistical capacity than all other countries. This means they undertake fewer surveys less frequently with less methodological rigour.
0
10
20
30
40
50
60
70
80
STAT
ISTI
CA
L C
APA
CIT
Y SC
ORE
NON-CONFLICT COUNTRIES
FRAGILE COUNTRIES
CONFLICT COUNTRIES
Hig
h ca
paci
tyLo
w c
apac
ity
Many of the fragile and conflict-affected countries have difficulty in maintaining the necessary systems to adequately capture data.
78 79

access to services. Everyday interpersonal violence which Goal 16 also measures, affects all countries and has detrimental social and economic impacts in every country in the world. Even high income countries have interpersonal violence that severely impacts on human wellbeing and socio-economic progress. This underscores the universality of the Goal and its applicability to all nations.
For nations affected by armed conflict, there is also the concept of a conflict trap, whereby the impact of conflict further increases some of the risk factors of conflict. Low socio-economic development can support the conditions for social violence and conflict, but it is also a consequence of violence and conflict. Countries with weak institutions are much more vulnerable to conflict as they do not have an effective means for conflict resolution. Losses in GDP from conflict in 2015 were estimated to be nearly $119 billion in PPP. As conflict impacts the economy in the immediate term, potentially destroying entire industries, the impact of conflict is also long term, reducing future development opportunities.
In order to address the drivers of violence and conflict the focus cannot be purely on the traditional development agenda of health, education and poverty. Rather, as Goal 16 recognises, governance, inequalities and institutions need to be addressed
as well as violence reduction. IEP terms this focus on the drivers of peace as Positive Peace or the “attitudes, institutions and structures which create and sustain peaceful societies.”
PEACE AND THE SDGs
Goal 16 seeks to measure instances of violence, as well as some of the drivers of peace. The first two targets of Goal 16 focus on actual measures of violence which is also known as Negative Peace, a direct measure of violence or fear of violence. Target 16.1 is to significantly reduce all forms of violence and related death rates everywhere. This includes conflict-related deaths as well as deaths from homicide.
Goal 16 also recognises that in order to reduce violence there is a need to focus on certain attitudes, institutions and structures which create and sustain peaceful societies. IEP deals with such factors through the concept of Positive Peace. These same factors also lead to many other positive outcomes which society feels are important. Therefore, Positive Peace is described as creating an optimum environment for human potential to flourish. IEP has empirically developed a framework for Positive Peace which is based on eight factors. These Pillars are partly represented in Goal 16.
TABLE 5.1 COVERAGE OF THE EIGHT POSITIVE PEACE FACTORS AND SUSTAINABLE DEVELOPMENT GOALS
SUSTAINABLE DEVELOPMENT GOALS
VIO
LEN
CE
AN
D C
ON
FLIC
T
AC
CEP
TAN
CE
OF
THE
RIG
HTS
OF
OTH
ERS
EQU
ITA
BLE
DIS
TRIB
UTI
ON
O
F RE
SOU
RCES
FREE
FLO
W O
F IN
FORM
ATIO
N
GO
OD
REL
ATIO
NS
WIT
H
NEI
GH
BOU
RS
HIG
H L
EVEL
S O
F H
UM
AN
C
API
TAL
LOW
LEV
ELS
OF
CO
RRU
PTIO
N
SOU
ND
BU
SIN
ESS
ENV
IRO
NM
ENT
WEL
L-FU
NC
TIO
NIN
G
GO
VER
NM
ENT
Goal 1 End poverty in all its forms everywhere z
Goal 2 End hunger, achieve food security and improved nutrition and promote sustainable agriculture
z z z
Goal 3 Ensure healthy lives and promote well-being for all at all ages z z z z
Goal 4 Ensure inclusive and equitable quality education and promote lifelong learning opportunities for all
z z z z
Goal 5 Achieve gender equality and empower all women and girls z z z
Goal 6 Ensure availability and sustainable management of water and sanitation for all z z z
Goal 7 Ensure access to affordable, reliable, sustainable and modern energy for all z z z
Goal 8 Promote sustained, inclusive and sustainable economic growth, full and productive employment and decent work for all
z z z z z z z
Goal 9 Build resilient infrastructure, promote inclusive and sustainable industrialization and foster innovation
z z
Goal 10 Reduce inequality within and among countries z z z
Goal 11 Make cities and human settlements inclusive, safe, resilient and sustainable z z z z z
Goal 12 Ensure sustainable consumption and production patterns z z
Goal 13 Take urgent action to combat climate change and its impacts z z
Goal 14 Conserve and sustainably use the oceans, seas and marine resources for sustainable development
z z
Goal 15 Protect, restore and promote sustainable use of terrestrial ecosystems, sustainably manage forests, combat desertification, and halt and reverse land degradation and halt biodiversity loss
z z
Goal 16 Promote peaceful and inclusive societies for sustainable development, provide access to justice for all and build effective, accountable and inclusive institutions at all levels
z z z z z z z z z
Goal 17 Strengthen the means of implementation and revitalize the global partnership for sustainable development
z z z z
78 79GLOBAL PEACE INDEX 2016 | Sustainable Development Goal 16

Source: IEP
FIGURE 5.4 POSITIVE PEACE FACTORS AND VIOLENCE BY SDG COVERAGE
The SDGs place an emphasis on high levels of human capital and well-functioning government.
Violence and conflict (2%)
Acceptance of the rights of others (14%)Equitable distribution of resources
(15%)
Free flow of information (3%)
Good relations with neighbours (9%)
High levels of human capital(25%) Low levels of corruption (2%)
Sound business environment (8%)
Well-functioning government (22%)
Figure 5.4 shows the distribution of Positive Peace factors among the SDGs. The SDGs have particular focus on two of the Positive Peace factors. Of the 17 SDGs, 15 are related to the Positive Peace factor of high levels of human capital. This is unsurprising as this factor is most directly related to levels of development. There is also an emphasis on well-functioning government in the SDGs with relevance to 13 of the goals.
However, some of the Positive Peace factors are not strongly covered by the SDGs. In particular, Low Levels of Corruption is only covered by one goal; Goal 16. This is highly relevant as there is a statistically significant relationship between peace and corruption.2 The Positive Peace factor of free flow of information is also not significantly addressed by the SDGs.
As well as Positive Peace factors, there is also limited focus in the SDGs on violence and conflict, which is only covered by Goal 16. As seen earlier, limiting conflict and violence is essential for other development goals to be met. However, Goal 16 only includes a subset of the spectrum of violence that can occur. The GPI, for example, uses 23 indicators to measure violence and the fear of violence.
The GPI is comprised of three domains: ongoing domestic and international conflict; societal safety and security; and militarisation. Goal 16 is focused only on the first two of these domains and ignores militarisation entirely. The only target which includes any reference to weaponry or militarisation is target 16.4 which in part relates to small arms. There are also gaps in societal safety which are included in the GPI but not in Goal 16. This includes measures of the impact of terrorism, violent demonstrations, levels of political instability and political terror.
MEASURING THE OFFICIAL GOAL 16 INDICATORS
This section presents an audit of existing data that could be used to measure Goal 16. Two aspects are important in measuring Goal 16: the length of time required to capture relevant data; and the lack of statistical capacity in many countries, particularly in fragile or conflict affected countries.
Increasing data capacity is particularly important for Goal 16. The least peaceful countries have among the lowest statistical capacity. The Statistical Capacity Indicator by the World Bank measures the capacity of a country’s national statistical system using 25 individual indicators. There is a moderate correlation of -0.37 between statistical capacity and the GPI. The correlation between statistical capacity and peace is likely to be even stronger except the World Bank do not provide a score for many countries that have high statistical capacity. These countries are generally the most peaceful: 18 of the 20 most peaceful countries do not have a score.
Given the experience of the MDGs where data was not captured for all countries for every goal even when the goals had concluded, a greater effort on building the statistical capacities of countries must be an essential component of the SDGs. In measuring Goal 16 significant resources will need to be invested particularly in less peaceful countries that have reduced statistical capacity.
The results of the audit of available data for measuring Goal 16 shows that there is data available with some coverage of the targets. This audit uses a rating system measuring the coverage, disaggregation and suitability of available data to fit the purpose of the indicators. It was found that there are suitable measures for all indicators. Nevertheless, only two indicators could currently be measured to the full scope and required disaggregation.
80 81

Source: World Bank, IEP
FIGURE 5.5 STATISTICAL CAPACITY INDICATOR VS INTERNAL GPI SCORE
Countries that are more peaceful generally have greater statistical capacity.
1.0 1.5 2.0 2.5 3.0 3.5 4.0 4.5 5.00
10
20
30
40
50
60
70
80
90
100
r=-0.37
STA
TIST
ICA
L C
APA
CIT
Y SC
ORE
INTERNAL GPI
Low
cap
acity
Hig
h ca
paci
ty
More peaceful Less peaceful
TABLE 5.2 RESULTS OF AUDIT OF GOAL 16GRADES
A Can be measured immediately, fully disaggregated as required by the indicator
B Can be measured immediately, requires further disaggregation or coverage
C A close measure is available
D Only proxy measures are available
F No suitable measure exists
TARGET TARGET INDICATOR NUMBER
1 2 3 416.1 Significantly reduce all forms of violence and related death rates everywhere B B C B
16.2 End abuse, exploitation, trafficking and all forms of violence against and torture of children B C B
16.3 Promote the rule of law at the national and international levels and ensure equal access to justice for all
B B
16.4 By 2030, significantly reduce illicit financial and arms flows, strengthen the recovery and return of stolen assets and combat all forms of organized crime
C D
16.5 Substantially reduce corruption and bribery in all their forms B C
16.6 Develop effective, accountable and transparent institutions at all levels C B
16.7 Ensure responsive, inclusive, participatory and representative decision-making at all levels B C
16.8 Broaden and strengthen the participation of developing countries in the institutions of global governance
A
16.9 By 2030, provide legal identity for all, including birth registration B
16.10 Ensure public access to information and protect fundamental freedoms, in accordance with national legislation and international agreements
B B
16.a Strengthen relevant national institutions, including through international cooperation, for building capacity at all levels, in particular in developing countries, to prevent violence and combat terrorism and crime
A
16.b Promote and enforce non-discriminatory laws and policies for sustainable development C
Of the 23 indicators to be measured, only two were rated as fully disaggregated. Thirteen indicators can be measured immediately but require further disaggregation or coverage. A close measure is available for seven indicators. This means new data will still need to be developed, but there are data available for short term estimations of progress in these targets.
Limiting conflict and violence is essential for other development goals to be met.
80 81GLOBAL PEACE INDEX 2016 | Sustainable Development Goal 16

TARGET 16.1: REDUCE ALL FORMS OF VIOLENCE
The first target of Goal 16 is the most measurable and can be directly measured by the Global Peace Index. The goal is to significantly reduce all forms of violence and related death rates everywhere and can be measured through four indicators.
16.1.1 Number of victims of intentional homicide per 100,000 population, by sex and age
Intentional homicide is broadly measured at national and international levels and is one of the most direct measures of violence. As such it is included as an indicator in the GPI as a measure of internal violence. Globally, homicides kill many more people than other forms of violence. For example, 13 times as many people are killed globally by homicides than die in terrorist attacks. At least 437,000 people were victims of homicide in 2015.
Most countries already have the internal capacity to record homicides as it is a component of criminal justice systems. Countries report their homicide statistics to the UNODC which then makes the data available in one dataset. The UNODC shows data disaggregated on sex for all but four out of the 193 UN member states. Fewer countries have disaggregation for age groups which will require further record keeping.
There may be some complications that emerge from specific legal contexts as to what is considered international homicide. For example, the International Classification of Crime for Statistical Purposes includes in its definition of intentional homicide killings caused by excessive force by law enforcement. Not all countries record deaths by law enforcement. There are also problems with keeping the data up to date, 61 per cent of countries with intentional homicide reported to the UNODC have 2010 as the most recent year of data.
16.1.2 Conflict-related deaths per 100,000 population (disaggregated by age group, sex and cause)
There are several measures of battle-related and conflict deaths. In the GPI the data sources include Uppsala Conflict Data Program (UCDP) and International Institute for Strategic Studies (IISS) Armed Conflict Database (ACD), both are external sources which provide estimates on deaths from armed conflicts. There is no current data source which has conflict deaths disaggregated by age group and sex.
By definition, conflict-related deaths occur in countries that have either armed conflict or war within their borders. Conflict generally reduces the capabilities of a government and requires resources to be channelled into conflict prevention. As such, countries which are post-conflict also have lesser statistical capacity. All of the 31 member states of the UN that are considered fragile or conflict affected have among the lowest performance for statistical capacity in the world. There are also limits on how accurate data captured in a conflict can be. As an example of this, estimates for the number of deaths from the duration of the Syrian civil war include 200,000 by the Violations Documentation Center3, 250,0004 by the United Nations and 320,000 Syrian Observatory for Human Rights.5
16.1.3 Percentage of the population subjected to physical, psychological or sexual violence in the previous 12 months
Official figures of reported crimes often need to be adjusted for under-reporting, with actual rates much higher. In many cases official figures are under-reported, such as in Mexico where only ten per cent of extortions are reported.
Physical, psychological and sexual violence would be criminal or civil offenses in the majority of countries. However, the indicator is a measure of the proportion of the population who have been victims of these types of violence in the last 12 months, rather than the number of convictions for criminal or civil claims. Accordingly, a better way to accurately measure this indicator is through victimisation surveys. The United Nations Interregional Crime and Justice Research Institute (UNICRI) helps conduct the International Crime Victims Survey which could be expanded from the 18 European countries measured in the European Crime and Safety Survey to cover all countries.
There is currently one very limited relevant data point from the Demographic and Health Surveys (DHS) Program: the percentage of women who experienced sexual violence in past 12 months. This indicator is limited to sexual violence against women and was asked in only 34 countries. The majority of this data is not timely either, with nearly three quarters of countries having no earlier data point than 2012. Countries which have measures of sexual violence against women in the past 12 months, as recorded by the DHS also perform poorly in the GPI. Around two-thirds of the countries that have a measure of sexual violence against women perform in the bottom half of the GPI. This indicator will require expanded victimisation surveying before it can be fully measured.
16.1.4 Proportion of people that feel safe walking alone around the area they live
The Gallup World Poll asks in 164 countries: “Do you feel safe walking alone at night in the city or area where you live?” This indicator is a direct measure of the fear of violence. Perceptions of safety is a proxy for peace in society in general. This is apparent in figure 5.6 which shows a correlation between people who feel safe walking alone and the levels of internal peace in a country.
As this indicator is survey based it can be disaggregated by age and sex. It is important to disaggregate perceptions of fear as there could be segments of the country which disproportionately feel fear. In 2015, across the world, females and the young felt more fear than the global average. There were 39 per cent of females who were fearful of walking alone which is similar to 37 per cent of those aged 15-29 years old. In contrast, 28 per cent of males felt fear from walking alone. This demonstrates that males disproportionately feel safer. Disaggregation is necessary in order to inform policy as it demonstrates which segments of the population are more vulnerable.
82 83

MEASURING TARGET 16.1
There are two of the four indicators which can be measured in Target 16.1 in their current state, however, there are some gaps and disaggregation could be improved. The only disaggregated indicator is perceptions of safety walking alone at night which is based on a survey, but only covers 156 of the 193 UN member states.
Nevertheless, three out of the four indicators in their current state are close to measuring what is required. The only exception being Indicator 16.1.3 which measures physical, psychological or sexual violence in the last 12 months.
Using the available data, a simple index measuring performance for Target 16.1 can be developed. Table 5.3 shows the ten worst countries for Target 16.1, which include three countries that were in conflict in 2014. Whilst this is a very limited measure as the data is incomplete, it does show that there are several countries that have high homicides and relatively few people who feel safe walking alone. There is also a connection between the countries that perform the worst in Target 16.1 and those that perform poorly in the GPI. Seven out of the ten worst ranked countries across Target 16.1 are in the worst performing quadrant of internal measures of peace.
TABLE 5.3 TEN WORST RANKED COUNTRIES ACROSS TARGET 16.1
TARGET 16.1
INDICATOR 16.1.1 16.1.2 16.1.3 16.1.4
RANK COUNTRY HOMICIDE RATE
BATTLE DEATHS
SEXUAL VIOLENCE
SAFE WALKING
193 Syria 2 66,649 no data 32%
192 Venezuela 54 - no data 14%
191 Honduras 84 - 3% 48%
190 Democratic Republic of the Congo
13 978 16% 43%
189 Colombia 32 113 12% 47%
188 El Salvador 40 - no data 36%
187 Lesotho 38 - no data 38%
186 Uganda 11 - 17% 55%
185 Belize 45 - no data 50%
184 South Africa 32 - no data 40%
Source: Gallup, IEP
FIGURE 5.6 2016 INTERNAL GPI VS PERCENTAGE OF PEOPLE WHO FEEL SAFE WALKING ALONE
Countries that are more peaceful internally have a higher proportion of people who feel safe walking alone.
1.0 1.5 2.0 2.5 3.0 3.5 4.0 4.5 5.00%
10%
20%
30%
40%
50%
60%
70%
80%
90%
100%r=-0.4
FEEL
SA
FE W
ALK
ING
ALO
NE
INTERNAL GPI
Less
saf
eM
ore
safe
More peaceful Less peaceful
Most countries already have the internal capacity to record homicides, as it is a component of criminal justice systems.
82 83GLOBAL PEACE INDEX 2016 | Sustainable Development Goal 16

TARGET 16.2: END ABUSE AND VIOLENCE TOWARDS CHILDREN
The second target of Goal 16 is to end abuse, exploitation, trafficking and all forms of violence against and torture of children. This is particularly difficult to fully measure based on the existing stock of data. All forms of trafficking, exploitation and crimes against children are underreported for a range of reasons.
16.2.1 Percentage of children aged 1-17 who experienced any physical punishment and/or psychological aggression by caregivers in the past month
UNICEF has figures for violent discipline of children aged 2-14. This data is disaggregated by physical punishment and psychological aggression, as well as sex, whether victims live in an urban or rural environment and the household wealth quintile. The data is available for 60 of the 193 UN member states and is based on Demographic and Health Surveys (DHS), Multiple Indicator Cluster Surveys (MICS) and other nationally representative surveys. This data relies on answers from the primary caregivers or any adult household member. There may be problems regarding the accuracy of data as the surveys require caregivers to self-report instances of violence which means there is likely to be a very high underreporting rate. As an attempt to verify the data, it could be compared to the reports of total sexual offences against children by the UNODC. This is a measure of the number of police-recorded offences at the national level. There are also global figures of violence against children compiled by UNICEF from 190 countries. Although there is the need for current measures to also include children aged one and 15-17 as well as an increase in coverage to include all countries, there are data currently available to measure this indicator or proxy indicators.
16.2.2 Number of victims of human trafficking per 100,000 population, by sex, age group and form of exploitation
As with violence against children by caregivers, it is very difficult to have accurate numbers for victims of trafficking, however there are some measures that can be used. The UNODC collects information on the number of detected victims of human trafficking and has expertise in measuring hidden populations. The U.S. Department of State also releases a Trafficking in Persons Report which records governmental anti-trafficking initiatives.6 The Slavery Index by the Walk Free Foundation provides estimates on trafficked people all around the world and was selected by this audit purely because of the extended coverage it offered. A consolidated effort to have accurate and disaggregated data that goes beyond ‘like-country estimates’ for all countries of the number of victims of human trafficking will require significant resources. This is not the only measure of slavery in the SDGs. Target 5.2 and Target 8.7 both include the elimination of trafficking.
16.2.3 Proportion of young women and men aged 18-29 who experienced sexual violence by age 18
Currently the Demographic and Health Surveys includes a question relating to sexual violence for women before the age of 18. However, the coverage is limited to only 34 countries and the records are slightly dated with only two inclusions from 2014. Furthermore, it does not cover men. However, the majority of the countries covered by this question have relatively low peace and lesser statistical capacities. This suggests that a similar survey could be undertaken and broadened to measure this indicator.
Source: UNODC, UCDP, Gallup, DHS. IEP Calculations
FIGURE 5.7 AVAILABLE INDICATORS THAT CAN MEASURE TARGET 16.1 VS INTERNAL GPI SCORE
There is a trend with performance in Target 16.1 and peacefulness in a country.
1.0 1.5 2.0 2.5 3.0 3.5 4.0 4.5 5.00%
r=0.47TA
RGET
16.1
SCO
RE
INTERNAL GPI
Bette
r
W
orse
More peaceful Less peaceful
10%
20%
30%
40%
50%
60%
There is also a trend between the measure of Target 16.1 and internal peace from the GPI. However, this should not be surprising as internal peace includes two of the same indicators.
Sexual violence is the only indicator for Target 16.1 that cannot currently be adequately measured.
84 85

TARGET 16.3: PROMOTE THE RULE OF LAW
The third target is to promote the rule of law at the national and international levels and ensure equal access to justice for all. This target is most related to the Positive Peace measure of well-functioning government and to a lesser extent the acceptance of the rights of others. A well-functioning government delivers high-quality public and civil services, creates trust and participation, demonstrates political stability and upholds the rule of law.
There are two indicators to measure the promotion of the rule of law for Goal 16. The first is the crime reporting rate. If there are a large number of crimes that are not reported to authorities, it can reflect either a lack of trust in the system or little perceived concern for that particular crime.
16.3.1 Proportion of victims of violence in the previous 12 months who reported their victimization to competent authorities or other officially recognized conflict resolution mechanisms
This indicator seeks to measure the proportion of victims of violence who had reported being victims. This reporting involves having interactions with police and the judicial system as well as other dispute resolution institutions recognised by the state such as traditional or community justice systems. This data is from victimisation surveys which, according to a review by UNODC, have been implemented by at least 72 countries since 2009. The majority of victimisation surveys have been undertaken by National Statistical Offices. IEP has attempted to compile these various surveys to determine international rates. This includes from L’ Institut National des Hautes Études de la Sécurité et de la Justice (INHESJ), Ministerio de Justicia y Derechos Humanos (MJDH) and other national offices.
There are difficulties in comparing underreporting rates from different countries. Different rates could reflect cultural differences as well as a lack of trust in authorities. This includes a different understanding of what behaviour constitutes a crime or whether there is a culture of not reporting grievances. For example, a slap by an older female to her adult son would not be considered grounds for assault in many countries. Another example is corporal punishment. Although Article 19.1 of the Convention on the Rights of the Child prevents corporal punishment, in some countries it is not considered a crime. If asked, a victim of corporal punishment may not consider they have been the victim of violence but rather see it as a normal and acceptable means of discipline.
There are also potential reporting concerns if victims are subjected to violence perpetrated by the state: there may not be accurate reporting if a state entity is undertaking surveys. In order to better direct policy there is also a requirement for disaggregation of the results of victimisation surveys by sex, age, type of crime and potentially the ethnicity and citizenship of the victim.
16.3.2 Unsentenced detainees as a percentage of overall prison population
Measures of the proportion of unsentenced detainees are indicative of the efficiency of the justice system. Countries which have smaller GDPs per capita and smaller government budgets tend to have fewer people incarcerated or in pre-trial detention. Nevertheless, countries that have high levels of unsentenced prisoners are delaying the carriage of justice. There are certain circumstances whereby pre-trial detention is appropriate, including the risk of absconding or to prevent further crimes. But when pre-trial detention is disproportionately used it reflects a weakness in the judicial system.
The UNODC has measures of unsentenced detention in 114 countries. This data is disaggregated for counts of those in detention by sex, whether they are adults and juveniles, and citizens and foreign citizens. The World Prison Brief by the Institute for Criminal Policy Research also records pre-trial detention in 184 countries. This data is not disaggregated. Compared to many of the indicators for the SDGs, this indicator is relatively well covered. Of the countries covered by the UNODC, 96 per cent have more than one year of data allowing for analysis on progress for the indicator.
TARGET 16.4: REDUCE ILLICIT FINANCIAL AND ARMS FLOWS
Target four is to, by 2030, significantly reduce illicit financial and arms flows, strengthen the recovery and return of stolen assets and combat all forms of organized crime.
By definition, those engaged in illicit financial or arms flows will not want their activity known. As such, there will be great difficulties in creating a measure that is direct and meaningful for this target.
16.4.1 Total value of inward and outward illicit financial flows (in current United States dollars)
Illicit financial flows reduce the potential revenue for a country and undermines governance. There may also be an impact on economic growth as funds are channelled outside a country. Furthermore, there may also be security issues which arise as funds can be used to expand illegal enterprises such as drugs, rebellions or arm cartels.
There are no current effective measures of inward and outward flows with cash transactions particularly covered by current methodologies. The Addis Ababa Action Agenda shows the international community is seeking greater data on illicit financial flows. It is also possible that with the release of the so-called Panama Papers, which documented details of offshore companies that in some cases were seeking tax minimisation strategies, there will be a push towards greater measurement of financial flows.
A measure which could potentially be used in the interim is the International Finance Corporation (IFC) indicator of illicit financial flows for 145 relevant countries. Whilst this measure is an estimate and cannot show the granularity required by the indicator, it does allow for prioritisation of efforts. According to
84 85GLOBAL PEACE INDEX 2016 | Sustainable Development Goal 16

Source: UNODA, IEP
FIGURE 5.9 ADOPTION OF ARMS TRADE TREATY AND SCORE FOR EASE OF ACCESS TO SMALL ARMS AND LIGHT WEAPONS
Over three quarters of UN member states have signed or ratified the Arms Trade Treaty. However, of the countries that are not parties to the treaty, 80 per cent score in the worst three bands for the ease of access to small arms and light weapons indicator in the GPI.
0
10
20
30
40
50
60
70
80
90
Not party to treatySignatoriesRatified
Very easy access
Easy accessModerate access
Limited access
Very limited access
NU
MBE
R O
F C
OU
NTR
IES
the IFC, of the over US$1 trillion in illicit financial flows in 2013, over half was from five countries. These five countries are China, Russia, India, Mexico and Malaysia. With the exception of Malaysia, these countries are all in the 20 largest economies in the world.
These figures can also be broken down on a per capita basis. As figure 5.8 shows, the countries with the highest illicit financial flows per capita are not the biggest economies in the world.
Source: IFC, IEP calculations
FIGURE 5.8 TEN COUNTRIES WITH THE HIGHEST PER CAPITA ILLICIT FINANCIAL FLOWS
Ten countries with the highest illicit financial flows per capita are outside the largest economies in the world.
0.0
0.1
0.2
0.3
0.4
0.5
0.6
0.7
US$
CEN
TS P
ER C
API
TA
AzerbaijanMalaysiaSurinameOmanQatarCosta RicaTrinidad and Tobago
BruneiEquatorial Guinea
Bahamas
86 87

16.4.2 Proportion of seized small arms and light weapons that are recorded and traced, in accordance with international standards and legal instruments
There is no current measure of this indicator. There will be inherent difficulties in measuring the percentage of seized small arms and light weapons that are recorded and traced in compliance with international standards and laws. A proxy for the likelihood of compliance to international standards is the measure of the Arms Trade Treaty.
There are 62 countries that are not parties to the Arms Trade Treaty. Of these countries, 80 per cent score in the bottom three bands for the ease of access to small arms and light weapons indicator in the GPI. This shows that they have moderate to very easy access to small arms. It is likely that in countries with easy access to small arms there would be a higher proportion of seized weapons that are not recorded and traced in accordance with international standards. This is even more likely in countries that are not even parties to these international standards. The Arms Trade Treaty-Baseline Assessment Project (ATT-BAP), an initiative that provides guidance on the obligations of states under the Arms Trade Treaty, could be an important framework for measuring this indicator.7 The UN Office for Disarmament Affairs (UNODA) currently promotes disarmament efforts and records the relationship between states and the Arms Trade Treaty.
Countries with high levels of illicit financial flows and easy access to small arms and light weapons should be prioritised even in the absence of reliable data.
Source: Transparency International, IEP
FIGURE 5.10 CORRUPTION VS 2016 INTERNAL GPI
Lower corruption correlates with greater internal peace.
BRIB
E PA
ID IN
LA
ST 12
MO
NTH
S
INTERNAL GPI
Bette
rW
orse
More peaceful Less peaceful
r = 0.54
1.0 1.5 2.0 2.5 3.0 3.5 4.0 4.5 5.00%
10%
20%
30%
40%
50%
60%
TARGET 16.5: REDUCE CORRUPTION AND BRIBERY
The fifth target for Goal 16 is to substantially reduce corruption and bribery in all their forms. IEP has previously found there is a relationship between peace and corruption.8 It was found that there is a level of corruption which correlates with a significant reduction in peace. If a country has low levels of corruption, then increases in corruption will have little effect on peace. However, once a certain threshold is reached then small increases in corruption can result in large decreases in peace.
16.5.1 Proportion of persons who had at least one contact with a public official, who paid a bribe to a public official, or were asked for a bribe by these public officials, in the previous 12 months, disaggregated by age group, sex, region and population group
There are multiple measures of corruption which rely on survey data. The Global Corruption Barometer 2013 by Transparency International asked people in 91 countries if they had paid a bribe to any one of eight services listed in the past 12 months. This included Education, Judiciary, Medical and Health, Police, Registry and Permit Services, Utilities, Tax Revenue and/or Customs and Land Services. From this data IEP calculated a measure of the percentage of the population that paid a bribe in the last 12 months to a government service. It correlates at a statistically significant level with internal peace.
16.5.2 Proportion of businesses who had at least one contact with a public official and who paid a bribe to a public official, or were asked for a bribe by these public officials, during the previous 12 months
Bribery does not just affect private citizens and public officials. Businesses incur additional costs if they are required to pay bribes as well. The World Bank has estimated that over US$1
If a country has low levels of corruption, then increases in corruption will have little effect on peace. However, once a certain threshold is reached, small increases in corruption can result in large decreases in peace.
86 87GLOBAL PEACE INDEX 2016 | Sustainable Development Goal 16

trillion is paid in bribes each year. As with all forms of corruption, there is incomplete data as much corruption is hidden. A survey of relevant businesses will be required to determine the prevalence and rates of bribery between businesses and public officials in a given year. The World Bank Enterprise Surveys asks more than 130,000 manufacturing and services firms in 135 countries if unofficial payments or gifts are required to do business. This includes a measure of the percentage of firms experiencing at least one bribe payment request. Bribery in businesses significantly correlates at with bribery by individuals with an r value of 0.6
TARGET 16.6: DEVELOP TRANSPARENT INSTITUTIONS
Target six is to develop effective, accountable and transparent institutions at all levels. The two indicators which are designed to measure this target focus on financial accountability as well as reporting of satisfaction with public services.
16.6.1 Primary government expenditures as a percentage of original approved budget, disaggregated by sector (or by budget codes or similar)
This measures the capacity of the state to budget and can act as an indicator of transparency. The Public Expenditure and Financial Accountability Program have a measure of aggregate expenditure compared to original approved budget. This program is a partnership between the World Bank, the European Commission and various other national bodies or governments. The countries that score the worst on this measure also have a history of conflicts. Of the ten countries that had the worst score for this measure, seven of the countries are conflict or post-conflict countries. These countries are Central African Republic, Liberia, Madagascar, South Sudan, Yemen, Timor-Leste and Zimbabwe. This demonstrates that governments which have been in conflict have reduced capacity to provide effective and transparent institutions. It further shows that post-conflict countries need to be prioritised in the SDGs.
16.6.2 Proportion of the population satisfied with their last experience of public services
There are various perception surveys of satisfaction with national governments, including the Barometer surveys, Gallup and World Values Survey. Further disaggregation of questions will enable understanding about satisfaction levels in different parts of a country related to specific services. The most comprehensive single source of data that currently exists to measure this indicator is the Gallup World Poll. The Gallup World Poll asked people in 138 countries whether they have confidence in the national government.
TARGET 16.7: ENSURE PARTICIPATORY DECISION-MAKING
Target seven is to ensure responsive, inclusive, participatory and representative decision-making at all levels. A core component of development includes participation in the decisions which have an impact on an individual or groups’ life and wellbeing.9 Participation also underpins several of the Positive Peace factors. Part of the necessity for free flow of information is to have a free media and access to information, so as to inform participation in the political process. Inclusive and participatory government and public services are also necessary to ensure the acceptance of the rights of others.
16.7.1 Proportions of positions (by age group, sex, persons with disabilities and population groups) in public institutions (national and local legislatures, public service, and judiciary) compared to national distributions
This indicator is a measure of demographic cohort representation in public institutions. It is a proxy for participation on the assumption that if diversity in public institutions reflects national distributions of diversity then minority groups will be better represented. Whilst it is an incomplete measure, as countries that have the highest representation of women in parliament are not necessarily more peaceful or free, it does connect to legitimacy. The World Bank, along with UN Women and the Inter-Parliamentary Union, measure the proportion of women in parliament. There is also information about labour distribution by the International Labour Organisation but needs to be more finely disaggregated to satisfy the goal.
16.7.2 Proportion of population who believe decision-making is inclusive and responsive, by sex, age, disability and population group
This indicator is perception based, asking for the belief of inclusive and responsive decision making across the population. Value based surveys will be the most appropriate way to measure. An available proxy for this indicator is included in the World Values Survey which asks if voters are offered a genuine choice in the elections. This was asked in 39 countries. There is a relationship between democracy and the belief that genuine choice is offered in elections, with the EIU Democracy Index correlating at 0.47 with the World Values Survey measure.10
FIGURE 5.11 CHOICE IN ELECTIONS VS GOVERNMENT TYPE
Countries that are more democratic have higher levels of belief that genuine choice is o�ered in elections.
80%
70%
60%
50%
40%
30%
20%
10%
0FULL
DEMOCRACYFLAWED
DEMOCRACYHYBRID REGIME
AUTHORITARIAN REGIME
POPU
LATI
ON
WH
O B
ELIE
VE V
OTE
RS H
AVE
GEN
UIN
E C
HO
ICE
IN E
LEC
TIO
NS
GOVERNMENT TYPE
Source: World Values Survey, EIU, IEP Calculations
88 89

TARGET 16.8: BROADEN PARTICIPATION IN GLOBAL GOVERNANCE
Target eight is to broaden and strengthen the participation of developing countries in the institutions of global governance. Although the SDGs are meant to apply to all countries, this target explicitly refers to developing countries. The participation and representation of developing countries is often not in accordance with the size of their economies or population. This measure could be recorded immediately as all it requires is a calculation of the level and significance of developing countries involvement in institutions. This includes regional bodies and trade agreements as well as international institutions and international governance structures.
16.8.1 Percentage of members and voting rights of developing countries in international organizations
This indicator is currently not measured. In order to be measured it will require a decision on which institutions to include. This is one of the few indicators in Goal 16 that could be measured immediately; it does not require any input from NSOs as country membership of multi-lateral organisations is available. This indicator, when developed, could be further analysed by population size or share of global GDP.
TARGET 16.9: LEGAL IDENTITY FOR ALL
The ninth target is to, by 2030, provide legal identity for all, including birth registration.
16.9.1 Percentage of children under 5 whose births have been registered with a civil authority, by age
Birth registration is a proxy for legal representation. Registration of children is the first step for recognising their rights under the law. Furthermore, registration helps ensure that children are counted and can access the services of the state. It is essential for government planning for education, health and social services to have accurate demographic information to cope with current and future service demands.
UNICEF maintains global databases for a number of child protection indicators, as well as some regional databases such as the TransMONEE. The main sources of data include nationally representative household surveys, such as Multiple Indicator Cluster Surveys (MICS), Demographic and Health Surveys (DHS), Reproduction Health Surveys (RHS) and AIDS Indicator Surveys (AIS), as well as vital registration systems. The measure is of the percentage of children under age five whose births are registered. It is disaggregated by sex, place of residence and household wealth quintile.
There is a moderately statistically significant relationship between countries that have low statistical capacity and lower proportional levels of birth registration. This suggests that countries that have high statistical capacity also have the institutions in place to provide registration. The effect of this is that statistical capacity will need to be strengthened in the
Source: UNICEF, World Bank
FIGURE 5.12 PROPORTION OF BIRTH REGISTRATIONS FOR CHILDREN UNDER FIVE VS STATISTICAL CAPACITY SCORE
Countries that have lesser statistical capacity also are less likely to have proportionately high levels of birth registrations for children under five.
BIRT
H R
EGIS
TRAT
ION
S
STATISTICAL CAPACITY SCORE
Less
Mor
e
Low capacity High capacity
0 10 20 30 40 50 60 70 80 90 100
0%
10%
20%
30%
40%
50%
60%
70%
80%
90%
100%
r = 0.4
88 89GLOBAL PEACE INDEX 2016 | Sustainable Development Goal 16

countries that are not registering all births. Birth registration could also be viewed as a proxy for statistical capacity.
TARGET 16.10: ENSURE PUBLIC ACCESS TO INFORMATION
The tenth target is to ensure public access to information and protect fundamental freedoms, in accordance with national legislation and international agreements. This target is very similar to the Positive Peace measures of free flow of information and acceptance of the rights of others. However, unlike free flow of information which includes measures of access to information through internet and mobile phone access, the measure for this target focuses on public access to information as well as the media, trade unionists and human rights advocates.
16.10.1 Number of verified cases of killing, kidnapping, enforced disappearance, arbitrary detention and torture of journalists, associated media personnel, trade unionists and human rights advocates in the previous 12 months.
The measure chosen to address target ten focuses on harassment and punishment of journalists as well as civil advocates. This is a proxy for the freedom of the media, which in of itself is a proxy for freedom of expression and information. As the indicator includes not only journalists but also media personnel, trade unionists and human rights advocates.
The Committee to Protect Journalists records instances of deaths of journalists around the world. Whilst this is an incomplete measure that does not include kidnapping, disappearances, arbitrary detention or torture it is a good proxy to these. The trend of deaths of journalists follows the pattern of
conflicts that have occurred. In the mid 1990s there were many conflicts, as well as deaths of journalists. Both conflicts and deaths started to increase again in around 2007.
Civil workers such as trade unionists and human rights activists could be measured by the International Trade Union Confederation who publish the Global Rights Index.11 Indicators used to create this Index include the number of trade unionists who are arrested, detained, imprisoned, charged or fined around the world as well as violations of rights of membership and meetings.
Nearly half of all deaths of journalists in 2015 occurred in conflict countries. The countries that had the most deaths that were not in conflict have high levels of organised crime. This includes Brazil and Mexico. Furthermore, there is a correlation between journalist deaths and battle deaths for 193 countries at 0.67 which is statistically significant.
There is a World Press Freedom Index by Reporters Without Borders which moderately correlates with battle deaths. This measure also correlates with internal peace, highlighting that countries with low levels of peace are more dangerous are also more dangerous to journalists.
16.10.2 Number of countries that adopt and implement constitutional, statutory and/or policy guarantees for public access to information
It is likely that UNESCO will continue collecting data relevant to this indicator through the Media Development Indicators which cover 195 countries. This includes measures of the legal and policy framework, regulatory systems for broadcasting and defamation and censorship laws within a country. Other third party measures can be used whilst statistical capacity is being developed. One such example is the World Press Freedom Index developed by Reporters Without Borders which includes measures of the legislative framework governing news and information activities. The UNESCO Institute for Statistics has data for judicial processes relating to accessing information held by the state for 56 countries. The organisation Freedom Info also records whether countries have freedom of information legislation. There appears to be a relationship with peace and public access to information: 19 of the 20 most peaceful countries have freedom of information legislation compared to only eight of the 20 least peaceful countries.
TARGET 16.A: STRENGTHEN INSTITUTIONS TO PREVENT VIOLENCE
Target 16.a seeks to strengthen relevant national institutions, including through international cooperation, for building capacity at all levels, in particular in developing countries, to prevent violence and combat terrorism and crime.
16.a.1 Existence of independent national human rights institutions in compliance with the Paris PrinciplesPercentage of victims who report physical and/or sexual crime to law enforcement agencies in the previous 12 months, disaggregated by age group, sex, region and population group
The Paris Principles were adopted by the UN in 1993 and establish norms for the functioning of National Human Rights
FIGURE 5.13 ACCREDIATION STATUS OF NATIONAL HUMAN RIGHTS INSTITUTIONS IN ALL UN MEMBER STATES
Nearly half of UN member states do not have accredited National Human Rights Institutions.
Source: ICC, OHCHR
Full Compliance37%
Not Full Compliance
13%Non-Compliance
5%
Not Accredited45%
90 91

Institutions which promote and protect human rights in different countries. This indicator records whether countries have National Human Rights Institutions which comply with these principals, which includeing the independence to monitor and report issues to government. This is not a measure of the status of human rights in a country, rather the legal status and governance rules of National Human Rights Institutions.
Both the most and least peaceful country in the 2016 GPI have not received accreditation. Similarly, Switzerland is in the top ten for the GPI and is considered non-compliant whereas Afghanistan, ranked 160, is fully compliant. Compliance with the Paris Principles is determined by a subcommittee of the International Coordinating Committee (ICC) for National Human Rights Institutions and compiled by the Office of the United Nations High Commissioner for Human Rights (OHCHR). Whilst most National Human Rights Institutions that have been accredited have been found as compliant, 45 per cent of UN member states have not been accredited. As such, 63 per cent of UN member states are either not in compliance with the Paris Principles or have not received accreditation.
TARGET 16.B: PROMOTE NON-DISCRIMINATORY LAWS
Target 16.b is to promote and enforce non-discriminatory laws and policies for sustainable development.
16.b.1 Percentage of the population reporting having personally felt discriminated against or harassed in the previous 12 months on the basis of a ground of discrimination prohibited under international human rights law
The indicator could be measured in the short term by proxy measurements. An available proxy includes the World Values Survey which asks whether people approve of the human rights movement.
METHODOLOGICAL ISSUES WITH GOAL 16
IEP’s methodology as set out in this section of the report is a best effort to measure the official indicators for Goal 16 using available data. However, in doing so, several methodological issues surrounding Goal 16 have emerged. Many of these issues will need to be addressed.
AVAILABILITY
Although many of the goals can be measured to some degree, there are many indicators that are not currently being measured or are only partially measured. Some of the data measured may not be relevant to the indicator or may not be disaggregated at the level necessary. An example of this is indicator 16.2.3 which measures the percentage of young men and women who experienced sexual violence by age 18. The only data relevant and internationally comparable data on this is limited to 34 countries and only includes women.
As table 5.4 highlights, there is little data which is available across all of the 193 countries, which is relevant to the indicator selected and has the required level of disaggregation. This does not mean the data will be unavailable in the future. However, it does mean that to fully measure Goal 16 will take some years at best. A shortcoming of the MDGs was that the countries with the least amount of data all required progress. As the SDGs for Goal 16 relies largely on data which has not yet been captured, the feedback loop will take several years to develop. There are still opportunities to prioritise using other data sources and proxy data.
FIT FOR PURPOSE
Not all of the Indicators in the official IAEG process adequately cover the full ambition of the targets. Only three of the 12
TABLE 5.4 DATA AVAILABILITY, RELEVANCE TO THE INDICATOR AND LEVEL OF DISAGGREGATION REQUIRED
Green bars indicate data availability and whether the available data is relevant and disaggregated. Red means that the indicators are not fully relevant to the target and data is not fully disaggregated.
TARGET AVAILABILITY RELEVANCE DISAGGREGATED
16.1
16.2
16.3
16.4 N/A
16.5
16.6
16.7
16.8 Not counted Not counted Not counted
16.9
16.10
16.a
16.b Not counted Not counted Not counted
Some form of independent analysis is needed to establish the veracity of official reporting.
90 91GLOBAL PEACE INDEX 2016 | Sustainable Development Goal 16

targets are covered by all the indicators selected. That means that for 75 per cent of the targets there will be a substandard level of measurement. This includes incomplete measures such as target 16.2 which does not measure violence against children caused by people who are not caregivers. Another incomplete measure is seen in target 16.5 which seeks a substantial reduction in corruption and bribery in all their forms, but only measures bribery between public officials and the public or business. There are no measures of corruption other than bribery or other forms of governmental corruption, such as embezzlement.
For three targets there are no indicators which measure any aspect of the target. For example, target 16.4 seeks to combat all forms of organised crime, but there is no indicator that measures organised crime. The ways in which different targets are not measured by the chosen indicators is seen in table 5.5.
PERCEPTION BASED DATA
There is an emphasis on the SDGs to build up local capacity through NSOs for data collection. However, there will be perception challenges relating to the objectivity and capacity of many national offices. This necessarily means that some form of independent analysis is needed to establish the veracity of official reporting. Some of the targets which have high levels of political sensitivity include functioning of government, levels of violence and government initiated violence.
Table 5.6 lists potential reasons why some governments may not be best placed as an objective supplier of data. Some of the targets explicitly measure the efficacy of governments or activity of the government. These include measures of corruption, the targeting of journalists, trade unionists and human rights advocates and the inclusiveness of government and its services.
TABLE 5.6 TARGET AND POTENTIAL REASONS WHY THE STATE MAY BE PERCEIVED AS LESS OBJECTIVE
TARGET POTENTIAL CONFLICT OF INTEREST WITH STATE
16.1 Government could be party in conflict
16.2 -
16.3 Assessment of Government efficacy
16.4 Illicit financial flows may involve some Government officials
16.5 Corruption may involve government elites
16.6 Assessment of Government efficacy
16.7 Assessment of Government inclusiveness
16.8 -
16.9 Government may be excluding particular groups
16.10 Government may be restricting access to information
16.a Assessment of Government efficacy
16.b Assessment of Government efficacy
If the government is the perpetrator of violence, then there will be little perceived objectivity of data for many of the indicators. For example, if a government is a party to a conflict then they will be unsuitable to provide estimates of conflict deaths. Similarly, a government may have implemented a policy of explicit discrimination against particular groups. In such a circumstance, government accounts of birth registration would likely be less accurate. The presence of third parties who are responsible either for data collection or validation of data will continue to be necessary, even with further full involvement of NSOs.
TABLE 5.5 HOW EACH INDICATOR WILL MEASURE EACH TARGET AND NOTES ON COVERAGE GAPSTARGET WHAT IS NOT BEING MEASURED
16.1 Significantly reduce all forms of violence and related death rates everywhere
16.2 End abuse, exploitation, trafficking and all forms of violence against and torture of children
Only measuring violence against children caused by caregivers.
16.3 Promote the rule of law at the national and international levels and ensure equal access to justice for all
Not measuring promotion of rule of law at international levels, not related to access to justice.
16.4 By 2030, significantly reduce illicit financial and arms flows, strengthen the recovery and return of stolen assets and combat all forms of organized crime
No indicator related to strengthening the recovery and return of stolen assets. No indicator to measure organized crime.
16.5 Substantially reduce corruption and bribery in all their forms No measures within or between governments.
16.6 Develop effective, accountable and transparent institutions at all levels No measure of effectiveness of government. No focus on local governments.
16.7 Ensure responsive, inclusive, participatory and representative decision-making at all levels
Only measuring representative. No measure on responsiveness, inclusiveness or participatory nature of government.
16.8 Broaden and strengthen the participation of developing countries in the institutions of global governance
16.9 By 2030, provide legal identity for all, including birth registration
16.10 Ensure public access to information and protect fundamental freedoms, in accordance with national legislation and international agreements
No measure of protection of fundamental freedoms or alignment with law.
16.a Strengthen relevant national institutions, including through international cooperation, for building capacity at all levels, in particular in developing countries, to prevent violence and combat terrorism and crime
Not a measure of the target.
16.b Promote and enforce non-discriminatory laws and policies for sustainable development
No measure of enforcement.
92 93

PRACTICAL CONCERNS
Some of the targets in Goal 16 are multidimensional, measuring a large concept. Just as the GPI uses 23 different indicators to measure peace, there are certain concepts which cannot be accurately measured by using only a few indicators. An example of this is the rule of law. The United Nations Rule of Law Indicators used 135 different indicators to measure the rule of law in different countries.12 However, Goal 16.3, which relates to the promotion of the rule of law at the national and
international levels, has two indicators to measure this. Neither of the indicators are actual measures of the rule of law, but rather proxies for the efficacy of government judicial services.
There is also a relationship between some of the indicators for Goal 16 and internal peace. Table 5.7 shows the significant correlations between indicators for Goal 16 and the internal peace measure of the GPI.
TABLE 5.7 RELATIONSHIP BETWEEN INDICATORS FOR GOAL 16 AND INTERNAL PEACEVARIABLE 1 VARIABLE 2 R VALUE
Battle Deaths (16.1.2) Journalists Killed (16.10.1) 0.67
Sexual Violence Before Aged 18 (16.2.3) Sexual Violence in the Past 12 Months (16.1.3) 0.67
Internal GPI Reporters Without Borders (16.10.1) 0.56
Bribe in the last 12 Months (16.5.1) Internal GPI 0.54
Internal GPI Bribe in the last 12 Months (16.5.1) 0.54
Bribe in the last 12 Months (16.5.1) Unsentenced Detainees (16.3.2) 0.42
Bribe in the last 12 Months (16.5.1) Reporters Without Borders (16.10.1) 0.4
Internal GPI Unsentenced Detainees (16.3.2) 0.39
Homicide (16.1.1) Pretrial (16.3.2) 0.37
World Press Freedom Index (16.10.1) Violent Crime Underreporting Rate (16.3.1) 0.37
Sexual Violence in the Past 12 Months (16.1.3) Women in Parliament (16.7.1) 0.37
Battle Deaths (16.1.2) Internal GPI 0.36
Internal GPI Journalists Killed (16.10.1) 0.36
Bribe in the last 12 Months (16.5.1) Government Budget (16.6.1) 0.36
Homicide (16.1.1) Internal GPI 0.32
Bribe in the last 12 Months (16.5.1) Confidence in Government (16.6.2) 0.32
Internal GPI Slavery (16.2.2) 0.31
Journalists Killed (16.10.1) Underreporting Rate (16.3.1) 0.31
Confidence in Government (16.6.2) Safe Walking Alone (16.1.4) 0.26
Arms Treaty (16.4.2) Birth Registration (16.9.1) 0.26
Birth Registration (16.9.1) Safe Walking Alone (16.1.4) 0.25
Slavery (16.2.2) Women in Parliament (16.7.1) -0.25
Safe Walking Alone (16.1.4) Unsentenced Detainees (16.3.2) -0.32
Birth Registration (16.9.1) Internal GPI -0.33
Reporters Without Borders (16.10.1) Youth Policy (16.7.2) -0.34
Bribe in the last 12 Months (16.5.1) Safe Walking Alone (16.1.4) -0.35
Arms Treaty (16.4.2) Internal GPI -0.36
Sexual Offences Against Children (16.2.1) Slavery (16.2.2) -0.36
Battle Deaths (16.1.2) Underreporting Rate (16.3.1) -0.38
Internal GPI Safe Walking Alone (16.1.4) -0.4
Internal GPI Sexual Offences Against Children (16.2.1) -0.42
Bribe in the last 12 Months (16.5.1) Sexual Offences Against Children (16.2.1) -0.44
Reporters Without Borders (16.10.1) Sexual Offences Against Children (16.2.1) -0.45
Homicide (16.1.1) Safe Walking Alone (16.1.4) -0.47
Arms Treaty (16.4.2) Reporters Without Borders (16.10.1) -0.52
Birth Registration (16.9.1) Sexual Violence in the Past 12 Months (16.1.3) -0.54
Birth Registration (16.9.1) Bribe in the last 12 Months (16.5.1) -0.59
92 93GLOBAL PEACE INDEX 2016 | Sustainable Development Goal 16

APPENDICES

APPENDIX A GPI METHODOLOGY
The GPI was founded by Steve Killelea, an Australian technology entrepreneur and philanthropist. It is produced by the Institute for Economics and Peace, a global think tank dedicated to building a greater understanding of the relationship between economics, business and peace. The GPI is collated and calculated by The Economist Intelligence Unit (EIU), which has also contributed to some sections of this report, including the regional analysis and the risers and fallers.
The GPI measures a country’s level of Negative Peace using three domains of peacefulness. The first domain, ongoing domestic and international conflict, investigates the extent to which countries are involved in internal and external conflicts, as well as their role and duration of involvement in conflicts.
The second domain evaluates the level of harmony or discord within a nation; ten indicators broadly assess what might be described as societal safety and security. The assertion is that low crime rates, minimal terrorist activity and violent demonstrations, harmonious relations with neighbouring countries, a stable political scene and a small proportion of the population being internally displaced or made refugees can be equated with peacefulness.
Seven further indicators are related to a country’s militarisation —reflecting the link between a country’s level of military build-up and access to weapons and its level of peacefulness, both domestically and internationally. Comparable data on military expenditure as a percentage of GDP and the number of armed service officers per head are gauged, as are financial contributions to UN peacekeeping missions.
Peace is notoriously difficult to define. The simplest way of approaching it is in terms of the harmony achieved by the absence of violence or the fear of violence, which has been described as Negative Peace. Negative Peace is a compliment to Positive Peace which is defined as the attitudes, institutions and structures which create and sustain peaceful societies.
THE EXPERT PANELAn international panel of independent experts played a key role in establishing the GPI in 2007—in selecting the indicators that best assess a nation’s level of peace and in assigning their weightings. The panel has overseen each edition of the GPI; this year, it included:
Professor Kevin P. Clements, chairperson Foundation Chair of Peace and Conflict Studies and director, National Centre for Peace and Conflict Studies, University of Otago, New Zealand
Dr Sabina Alkire Director, Oxford Poverty & Human Development Initiative (OPHI), University of Oxford, United Kingdom
Dr Ian Anthony Research Coordinator and Director of the Programme on Arms Control, Disarmament and Non-proliferation, Director a.i., Stockholm International Peace Research Institute (SIPRI), Sweden.
Ms Isabelle Arradon Director of Research and Deputy Director of Communications & Outreach, International Crisis Group, Belgium
Mr Nick Grono CEO, The Freedom Fund, United Kingdom
Dr Manuela Mesa Director, Centre for Education and Peace Research (CEIPAZ) and president, Spanish Association for Peace Research (AIPAZ), Madrid, Spain
Dr Ekaterina Stepanova Head, Unit on Peace and Conflict Studies, Institute of the World Economy and International Relations (IMEMO), Russian Academy of Sciences, Russia
95GLOBAL PEACE INDEX 2016 | Appendices

THE INDICATORSThe GPI comprises 23 indicators of the violence or fear of violence. The indicators were originally selected with the assistance of the expert panel in 2007 and have been reviewed by the expert panel on an annual basis. All scores for each indicator are normalised on a scale of 1-5, whereby qualitative indicators are banded into five groupings and quantitative ones are scored from 1-5, to the third decimal point.
Number and duration of internal conflicts Uppsala Conflict Data Program (UCDP) Battle-Related Deaths Dataset, Non-State Conflict Dataset and One-sided Violence Dataset; Institute for Economics and Peace (IEP)
Number of deaths from organised conflict (external) UCDP Armed Conflict Dataset
Number of deaths from organised conflict (internal)International Institute for Strategic Studies (IISS) Armed Conflict Database (ACD)
Number, duration and role in external conflicts UCDP Battle-Related Deaths Dataset; IEP
Intensity of organised internal conflict Qualitative assessment by EIU analysts
Relations with neighbouring countries Qualitative assessment by EIU analysts
Level of perceived criminality in society Qualitative assessment by EIU analysts
Number of refugees and internally displaced people as a percentage of the population Office of the High Commissioner for Refugees (UNHCR) Mid-Year Trends; Internal Displacement Monitoring Centre (IDMC)
Political instability Qualitative assessment by EIU analysts
Political Terror Scale Qualitative assessment of Amnesty International and US State Department yearly reports
Impact of terrorism IEP Global Terrorism Index (GTI)
Number of homicides per 100,000 people United Nations Office on Drugs and Crime (UNODC) Surveys on Crime Trends and the Operations of Criminal Justice Systems (CTS); EIU estimates
Level of violent crime Qualitative assessment by EIU analysts
Likelihood of violent demonstrations Qualitative assessment by EIU analysts
Number of jailed population per 100,000 people World Prison Brief, International Centre for Prison Studies, University of Essex
Number of internal security officers and police per 100,000 people UNODC; EIU estimates
Military expenditure as a percentage of GDP The Military Balance, IISS
Number of armed services personnel per 100,000 people The Military Balance, IISS
Volume of transfers of major conventional weapons as recipient (imports) per 100,000 people Stockholm International Peace Research Institute (SIPRI) Arms Transfers Database
Volume of transfers of major conventional weapons as supplier (exports) per 100,000 people SIPRI Arms Transfers Database
Financial contribution to UN peacekeeping missions United Nations Committee on Contributions; IEP
Nuclear and heavy weapons capabilities The Military Balance, IISS; SIPRI; UN Register of Conventional Arms; IEP
Ease of access to small arms and light weapons Qualitative assessment by EIU analysts
ONGOING DOMESTIC AND INTERNATIONAL CONFLICT
MILITARISATION
SOCIETAL SAFETY AND SECURITY
96

METHODOLOGICAL NOTES
CHANGES TO THE INDEX
In the 2016 edition of the GPI, there were two main improvements.
The first concerns the scoring and banding of indicators. All quantitative indicators are now coded with continuous values (instead of rounding to whole or half numbers), rounded to the third decimal point. The purpose of this change is to make the index more accurate and more responsive to changes in the quantitative indicators. Additionally, the bands of a number of quantitative indicators have been revised in order to remove outliers and make indicators more responsive to changes in score. For more detail on the indicator bands, see Appendix B.
The second concerns the addition of a 163rd country. In this year’s GPI Palestine has been included for the first time. The goal of IEP is to measure the level of peacefulness in as much of the world as possible. Based on the advice of the GPI Expert Panel, IEP and the EIU have worked to develop and source adequate data to include Palestine as the 163rd country or territory covered in the GPI. The geographical definition of Palestine for the purposes of the GPI includes the West Bank (including East Jerusalem) as well as the Gaza Strip.
IEP bases inclusion in the GPI on the basis that a country has a population of at least one million people or a landmass of greater than 20,000 kilometres squared. Smaller countries present unique challenges for the measurement and comparability of data on direct violence. Using these criteria, the GPI covers more than 99.7 per cent of the global population. Beyond these thresholds for the minimum size of a country, inclusion in the index is dependent upon the availability, reliability and practicality of the data for each of the GPI’s 23 indicators.
IEP does not make normative or political judgements about what constitutes an independent state. Rather, the goal is to generate as comprehensive and accurate a measure of peace for as much of the world’s population as possible.
The treatment of Palestine as a country-unit is substantiated by increasing international recognition of the State of Palestine:
• The State of Palestine was granted non-member observer status by the United Nations in 2012, considered a de facto recognition.
• The State is formally recognised by more than 130 other countries.
• Palestine was admitted as a member of the International Criminal Court in 2015.
• The State of Palestine administers its own bodies and institutions, such as a police force and a parliament, making it measurable from a data perspective.
WEIGHTING THE INDEX
When the GPI was launched in 2007 the advisory panel of independent experts apportioned scores based on the relative importance of each of the indicators on a scale 1-5. Two sub-component weighted indices were then calculated from the GPI group of indicators:
1) A measure of how at peace internally a country is;
2) A measure of how at peace externally a country is (its state of peace beyond its borders).
The overall composite score and index was then formulated by applying a weight of 60 percent to the measure of internal peace and 40 percent for external peace. The heavier weight applied to internal peace was agreed upon by the advisory panel, following robust debate. The decision was based on the innovative notion that a greater level of internal peace is likely to lead to, or at least correlate with, lower external conflict. The weights have been reviewed by the advisory panel prior to the compilation of each edition of the GPI.
MEASURING THE ROBUSTNESS OF THE INDEX
• Robustness is an important concept in composite index analysis. It is a measure of how often rank comparisons from a composite index are still true if the index is calculated using different weightings. For example, if the GPI is recalculated using a large number of different weighting schemes and Country A ranks higher than Country B in 60 per cent of these recalculations, the statement “Country A is more peaceful than Country B” is considered to be 60 per cent robust.
• IEP finds that the Global Peace Index (GPI) is at the same level of absolute robustness as the Human Development Index (HDI), a leading measure of development since it was first constructed by the United Nations Development Programme in 1990.
• Technically, the robustness of the GPI is measured by the fact that 70 per cent of pairwise country comparisons are independent of the weighting scheme chosen. In other words, regardless of the weights attributed to each component of the index 70 per cent of the time the pairwise comparisons between countries are the same.
The GPI is a composite index of 23 indicators weighted and combined into one overall score. The weighting scheme within any composite index represents the relative importance of each indicator to the overall aim of the measure, in the GPI’s case, global peace. To fully understand the representative nature or accuracy of any measure it is necessary to understand how sensitive the results of the index are to the specific weighting scheme used. If the analysis holds true for a large subset of all possible weighting schemes then the results can be called robust. While it is expected that ranks will be sensitive to changes in the weights of any composite index, what is more
97GLOBAL PEACE INDEX 2016 | Appendices

TABLE 29 INDICATOR WEIGHTSInternal Peace 60% / External Peace 40%
INTERNAL PEACE (WEIGHT 1 TO 5)
Perceptions of criminality 3
Security officers and police rate 3
Homicide rate 4
Incarceration rate 3
Access to small arms 3
Intensity of internal conflict 5
Violent demonstrations 3
Violent crime 4
Political instability 4
Political Terror 4
Weapons imports 2
Terrorism impact 2
Deaths from internal conflict 5
Internal conflicts fought 2.56
EXTERNAL PEACE (WEIGHT 1 TO 5)
Military expenditure (% GDP) 2
Armed services personnel rate 2
UN peacekeeping funding 2
Nuclear and heavy weapons capabilities 3
Weapons exports 3
Refugees and IDPs 4
Neighbouring countries relations 5
Number, duration and role in external conflicts 2.28
Deaths from external conflict 5
important in a practical sense is the robustness of country comparisons. One of the core aims of the GPI is to allow for Country A to be compared to Country B. This raises the question that for any two countries, how often is the first ranked more peaceful than the second across the spectrum of weights. The more times that the first country is ranked more peaceful than the second, the more confidence can be invested in the statement “Country A is more peaceful than Country B”.
To avoid the computational issue of evaluating every possible combination of 23 indicators, the robustness of pairwise country comparisons has been estimated using the three GPI domains militarisation, societal safety and security and ongoing conflict. Implementing an accepted methodology for robustness, the GPI is calculated for every weighting combination of three weights from 0 to 1 at 0.01 intervals. For computational expedience only weighting schemes that sum to one are selected, resulting in over 5100 recalculated GPI’s. Applying this it is found that around 70 per cent of all pairwise country comparisons in the GPI are independent of the weighting scheme, i.e. 100 per cent robust. This is a similar level of absolute robustness as the Human Development Index.
QUALITATIVE SCORING: THE ECONOMIST INTELLIGENCE UNIT APPROACH
The EIU’s Country Analysis team plays an important role in producing the GPI by scoring seven qualitative indicators and filling in data gaps on quantitative indicators when official data is missing. The EIU employs more than 100 full-time country experts and economists, supported by 650 in-country contributors. Analysts generally focus on two or three countries and, in conjunction with local contributors, develop a deep knowledge of a nation’s political scene, the performance of its economy and the society in general. Scoring follows a strict process to ensure reliability, consistency and comparability:
1) Individual country analysts score qualitative indicators based on a scoring methodology and using a digital platform;
2) Regional directors use the digital platform to check scores across the region; through the platform they can see how individual countries fare against each other and evaluate qualitative assessments behind proposed score revisions;
3) Indicator scores are checked by the EIU’s Custom Research team (which has responsibility for the GPI) to ensure global comparability;
4) If an indicator score is found to be questionable, the Custom Research team, and the appropriate regional director and country analyst discuss and make a judgment on the score;
5) Scores are assessed by the external advisory panel before finalising the GPI;
6) If the expert panel finds an indicator score to be questionable, the Custom Research team, and the appropriate regional director and country analyst discuss and make a final judgment on the score, which is then discussed in turn with the advisory panel.
Because of the large scope of the GPI, occasionally data for quantitative indicators do not extend to all nations. In this case, country analysts are asked to suggest an alternative data source or provide an estimate to fill any gap. This score is checked by Regional Directors to ensure reliability and consistency within the region, and by the Custom Research team to ensure global comparability. Again, indicators are assessed by the external advisory panel before finalisation.
98

NUMBER OF INTERNAL SECURITY OFFICERS AND POLICE PER 100,000 PEOPLE
Indicator type Quantitative
Indicator weight 3
Indicator weight (% of total index) 3.8%
Data source UNODC Survey of Crime Trends and Operations of Criminal Justice Systems, 2014
Measurement period 2013
Alternative Source: EIU. Where data is not provided, the EIU’s analysts have filled them based on likely scores from the set bands of the actual data.
Definition: This indicator is sourced from the UNODC Survey of Crime Trends and Operations of Criminal Justice Systems and refers to the civil police force. Police means personnel in public agencies whose principal functions are the prevention, detection and investigation of crime and the apprehension of alleged offenders. It is distinct from national guards or local militia.
Scoring Bands
1/5 2/5 3/5 4/5 5/5
0–199.8 199.9–399.8 399.9–599.8 599.9–799.8 > 799.9
LEVEL OF PERCEIVED CRIMINALITY IN SOCIETY
Indicator type Qualitative
Indicator weight 3
Indicator weight (% of total index) 3.8%
Data source EIU
Measurement period 16 March 2015 to 15 March 2016
Definition: Assessment of the level of perceived criminality in society, ranked from 1-5 (very low to very high) by the EIU’s Country Analysis team. Country analysts assess this indicator on an annual basis, for the period March to March.
Scoring Criteria:
1 = Very low: The majority of other citizens can be trusted;
very low levels of domestic insecurity.
2 = Low: An overall positive climate of trust with other
citizens.
3 = Moderate: Reasonable degree of trust in other citizens.
4 = High: High levels of distrust in other citizens; high levels
of domestic security.
5 = Very high: Very high levels of distrust in other citizens;
people are extremely cautious in their dealings with
others; large number of gated communities, high
prevalence of security guards.
INTERNAL PEACE INDICATORS
The information below details the sources, definitions, and scoring criteria of the 23 indicators that form the Global Peace Index. All scores for each indicator are banded or normalised on a scale of 1-5, whereby qualitative indicators are banded into five groupings and quantitative ones are either banded into ten groupings or rounded to the first decimal point. The Economist Intelligence Unit has provided imputed estimates in the rare event there are gaps in the quantitative data.
APPENDIX B GPI INDICATOR SOURCES, DEFINITIONS AND SCORING CRITERIA
99GLOBAL PEACE INDEX 2016 | Appendices

NUMBER OF HOMICIDES PER 100,000 PEOPLE
Indicator type Quantitative
Indicator weight 4
Indicator weight (% of total index) 5%
Data source UNODC Survey of Crime Trends and Operations of Criminal Justice Systems, 2014
Measurement period 2013
Alternative Source: EIU. Where data is not provided, the EIU’s analysts have filled them based on likely scores from the set bands of the actual data.
Definition: This indicator comes from the UNODC Survey of Crime Trends and Operations of Criminal Justice Systems. Intentional homicide refers to death deliberately inflicted on a person by another person, including infanticide. The figures refer to the total number of penal code offences or their equivalent, but exclude minor road traffic and other petty offences, brought to the attention of the police or other law enforcement agencies and recorded by one of those agencies.
Scoring Bands
1/5 2/5 3/5 4/5 5/5
0–1.99 2–5.99 6–9.99 10–19.99 > 20
NUMBER OF JAILED POPULATION PER 100,000 PEOPLE
Indicator type Quantitative
Indicator weight 3
Indicator weight (% of total index) 3.8%
Data source International Centre for Prison Studies, University of Essex, World Prison Brief
Measurement period 2014
Definition: Figures are from the International Centre for Prison Studies, and are compiled from a variety of sources. In almost all cases the original source is the national prison administration of the country concerned, or else the Ministry responsible for the prison administration. Prison population rates per 100,000 people are based on estimates of the national population. In order to compare prison population rates, and to estimate the number of persons held in prison in the countries for which information is not available, median rates have been used by the International Centre for Prison Studies to minimise the effect of countries with rates that are untypically high or low. Indeed, comparability can be compromised by different practice in different countries, for example with regard to pre-trial detainees and juveniles, but also psychiatrically ill offenders and offenders being detained for treatment for alcoholism and drug addiction.
Scoring Bands
1/5 2/5 3/5 4/5 5/5
0-126.405 126.406-252.811
252.812-379.217
379.218-505.624
>505.625
Additional Notes: The data provided by World Prison Briefs are not annual averages but indicate the number of jailed population per 100,000 inhabitants in a particular month during the year. The year and month may differ from country to country.
EASE OF ACCESS TO SMALL ARMS AND LIGHT WEAPONS
Indicator type Qualitative
Indicator weight 3
Indicator weight (% of total index) 3.8%
Data source EIU
Measurement period 16 March 2015 to 15 March 2016
Definition: Assessment of the accessibility of small arms and light weapons (SALW), ranked from 1-5 (very limited access to very easy access) by the EIU’s Country Analysis team. Country analysts are asked to assess this indicator on an annual basis, for the period from March to March.
Scoring Criteria:
1 = Very limited access: The country has developed policy
instruments and best practices, such as firearm licences,
strengthening of export controls, codes of conduct, firearms
or ammunition marking.
2 = Limited access: The regulation implies that it is difficult,
time-consuming and costly to obtain firearms; domestic
firearms regulation also reduces the ease with which legal
arms are diverted to illicit markets.
3 = Moderate access: There are regulations and commitment
to ensure controls on civilian possession of firearms,
although inadequate controls are not sufficient to stem the
flow of illegal weapons.
4 = Easy access: There are basic regulations, but they are not
effectively enforced; obtaining firearms is straightforward.
5 = Very easy access: There is no regulation of civilian
possession, ownership, storage, carriage and use of
firearms.
100

INTENSITY OF ORGANISED INTERNAL CONFLICT
Indicator type Qualitative
Indicator weight 5
Indicator weight (% of total index) 6.3%
Data source EIU
Measurement period 16 March 2015 to 15 March 2016
Definition: Assessment of the intensity of conflicts within the country, ranked from 1-5 (no conflict to severe crisis) by the EIU’s Country Analysis team. Country analysts are asked to assess this indicator on an annual basis, for the period March to March.
Scoring Criteria:
1 = No conflict.
2 = Latent conflict: Positional differences over definable
values of national importance.
3 = Manifest conflict: Explicit threats of violence; imposition
of economic sanctions by other countries.
4 = Crisis: A tense situation across most of the country; at
least one group uses violent force in sporadic incidents.
5 = Severe crisis: Civil war; violent force is used with a
certain continuity in an organised and systematic way
throughout the country.
LIKELIHOOD OF VIOLENT DEMONSTRATIONS
Indicator type Qualitative
Indicator weight 3
Indicator weight (% of total index) 3.8%
Data source EIU
Measurement period 16 March 2015 to 15 March 2016
Definition: Assessment of the likelihood of violent demonstrations ranked from 1-5 (very low to very high) by the EIU’s Country Analysis team, based on the question, “Are violent demonstrations or violent civil/labour unrest likely to pose a threat to property or the conduct of business over the next two years?” Country analysts assess this question on a quarterly basis. The score provided for March 2015 - March 2016 is the average of the scores given for each quarter.
Scoring Criteria
“Are violent demonstrations or violent civil/labour unrest likely to pose a threat to property or the conduct of business over the next two years?”
1/5 Strongly no
2/5 No
3/5 Somewhat of a problem
4/5 Yes
5/5 Strongly yes
LEVEL OF VIOLENT CRIME
Indicator type Qualitative
Indicator weight 4
Indicator weight (% of total index) 5%
Data source EIU
Measurement period 16 March 2015 to 15 March 2016
Definition: Assessment of the likelihood of violent crime ranked from 1 to 5 (very low to very high) by the EIU’s Country Analysis team based on the question, “Is violent crime likely to pose a significant problem for government and/or business over the next two years?” Country analysts assess this question on a quarterly basis. The score provided for March 2015 - March 2016 is the average of the scores given for each quarter.
Scoring Criteria
“Is violent crime likely to pose a significant problem for government and/or business over the next two years?”
1/5 Strongly no
2/5 No
3/5 Somewhat of a problem
4/5 Yes
5/5 Strongly yes
POLITICAL INSTABILITY
Indicator type Qualitative
Indicator weight 4
Indicator weight (% of total index) 5%
Data source EIU
Measurement period 16 March 2015 to 15 March 2016
Definition: Assessment of political instability ranked from 0 to 100 (very low to very high instability) by the EIU’s Country Analysis team, based on five questions. This indicator aggregates five other questions on social unrest, orderly transfers, opposition stance, excessive executive authority and an international tension sub-index. Country analysts assess this question on a quarterly basis. The score provided for March 2015–March 2016 is the average of the scores given for each quarter.
Specific Questions:
• What is the risk of significant social unrest during the next two years?
• How clear, established and accepted are constitutional mechanisms for the orderly transfer of power from one government to another?
101GLOBAL PEACE INDEX 2016 | Appendices

• How likely is it that an opposition party or group will come to power and cause a significant deterioration in business operating conditions?
• Is excessive power concentrated or likely to be concentrated in the executive so that executive authority lacks accountability and possesses excessive discretion?
• Is there a risk that international disputes/tensions will
negatively affect the economy and/or polity?
Scoring Bands
1/5 2/5 3/5 4/5 5/5
0–20.4 20.5–40.4 40.5–60.4 60.5–80.4 80.5–100
POLITICAL TERROR SCALE
Indicator type Qualitative
Indicator weight 4
Indicator weight (% of total index) 5%
Data source Gibney, M., Cornett, L. & Wood, R. (2011): Political Terror Scale 1976-2014
Measurement period 2014
Definition: The Political Terror Scale (PTS) measures levels of political violence and terror that a country experiences in a given year based on a 5-level “terror scale” originally developed by Freedom House. The data used in compiling this index comes from two different sources: the yearly country reports of Amnesty International and the US Department of State’s Country Reports on Human Rights Practices. The average of the two scores is taken.
Scoring Criteria:
1 = Countries under a secure rule of law, people are not imprisoned for their view, and torture is rare or exceptional. Political murders are extremely rare.
2 = There is a limited amount of imprisonment for nonviolent political activity. However, few persons are affected, torture and beatings are exceptional. Political murder is rare.
3 = There is extensive political imprisonment, or a recent history of such imprisonment. Execution or other political murders and brutality may be common. Unlimited detention, with or without a trial, for political views is accepted.
4 = Civil and political rights violations have expanded to large numbers of the population. Murders, disappearances, and torture are a common part of life. In spite of its generality, on this level terror affects those who interest themselves in politics or ideas.
5 = Terror has expanded to the whole population. The leaders of these societies place no limits on the means or thoroughness with which they pursue personal or ideological goals.
VOLUME OF TRANSFERS OF MAJOR CONVENTIONAL WEAPONS, AS RECIPIENT (IMPORTS) PER 100,000 PEOPLE
Indicator type Quantitative
Indicator weight 2
Indicator weight (% of total index) 2.5%
Data source SIPRI Arms Transfers Database; EIU
Measurement period 2010-2014
Definition: Measures the total volume of major conventional weapons imported by a country between 2010 and 2014, divided by the average population in this time period at the 100,000 people level (population data supplied by the EIU). The SIPRI Arms Transfers Database covers all international sales and gifts of major conventional weapons and the technology necessary for their production. The transfer equipment or technology is from one country, rebel force or international organisation to another country, rebel force or international organisation. Major conventional weapons include: aircraft, armoured vehicles, artillery, radar systems, missiles, ships, engines.
Scoring Bands
1/5 2/5 3/5 4/5 5/5
0-7.233 7.234-14.468
14.469-21.702
21.703-28.936
>28.937
I
IMPACT OF TERRORISM
Indicator type Quantitative
Indicator weight 2
Indicator weight (% of total index) 2.5%
Data source IEP Global Terrorism Index (GTI)
Measurement period 1 Jan 2004 to 31 March 2016
Definition: Terrorist incidents are defined as “intentional acts of violence or threat of violence by a non-state actor.” This means an incident has to meet three criteria in order for it to be counted as a terrorist act:
A The incident must be intentional – the result of a conscious calculation on the part of a perpetrator.
B The incident must entail some level of violence or threat of violence, including property violence as well as violence against people.
C The perpetrators of the incidents must be sub-national actors. This database does not include acts of state terrorism.
102

The figures relate to the country which is the main area of conflict. For some conflicts no reliable statistics are available. Estimates of war fatalities vary according to source, sometimes by a wide margin. In compiling data on fatalities, the IISS has used its best estimates and takes full responsibility for these figures. Some overall fatality figures have been revised in light of new information. Changes in fatality figures may therefore occur as a result of such revisions as well as because of increased fatalities. Fatality figures for terrorism may include deaths inflicted by the government forces in counter-terrorism operations.
Scoring Bands
1/5 2/5 3/5 4/5 5/5
0–23 deaths 24–998 deaths
999–4,998 deaths
4,999–9,998 deaths
> 9,999 deaths
NUMBER AND DURATION OF INTERNAL CONFLICTS
Indicator type Quantitative
Indicator weight 2.56
Indicator weight (% of total index) 3.2%
Data sources IEP; UCDP Battle-Related Deaths Dataset, Non-State Conflict Dataset and One-sided Violence Dataset
Measurement period 2010-2014
Definition: This indicator measures the number and duration of conflicts that occur within a specific country’s legal boundaries. Information for this indicator is sourced from three datasets from Uppsala Conflict Data Program (UCDP): the Battle-Related Deaths Dataset, Non-State Conflict Dataset and One-sided Violence Dataset. The score for a country is determined by adding the scores for all individual conflicts which have occurred within that country’s legal boundaries over the last five years.
Each individual conflict score is based on the following factors:
Number:
• Number of interstate armed conflicts, internal armed conflict (civil conflicts), internationalised internal armed conflicts, one-sided conflict and non-state conflict located within a country’s legal boundaries.
• If a conflict is a war (1,000+ battle-related deaths) it receives a score of one; if it is an armed conflict (25-999 battle-related deaths) it receives a score of 0.25.
Duration:
• A score is assigned based on the number of years out of the last five that conflict has occurred. For example, if a conflict last occurred five years ago that conflict will receive a score of one out of five.
The cumulative conflict scores are then added and banded to establish a country’s score. This indicator is two years lagging due to when the UCDP data is released.
For all incidents listed, at least two of the following three criteria must be present:
1. The act must be aimed at attaining a political, economic, religious or social goal.
2. There must be evidence of an intention to coerce, intimidate or convey some other message to a larger audience (or audiences) than the immediate victims.
3. The action must be outside the context of legitimate warfare activities.
Methodology: Using the comprehensive, event-based Global Terrorism Database, the GTI combines four variables to develop a composite score: the number of terrorist incidents in a given year, the total number of fatalities in a given year, the total number of injuries caused in a given year and the approximate level of property damage in a given year. The composite score captures the direct effects of terrorist-related violence, in terms of its physical effect, but also attempts to reflect the residual effects of terrorism in terms of emotional wounds and fear by attributing a weighted average to the damage inflicted in previous years. As of the date of publication, the Global Terrorism Database only logs events up to 31 Dec 2013. To assess the impact of terrorism between this date and 15 March 2015 GPI cutoff, IEP uses data from publicly available third party sources to impute terrorist activity in that period.
Scoring Bands
1/5 2/5 3/5 4/5 5/5
0-13.47913.48-181.699
181.7-2,449.309
2,449.31-33,015.949
>33,015.95
NUMBER OF DEATHS FROM ORGANISED CONFLICT (INTERNAL)
Indicator type Quantitative
Indicator weight 5
Indicator weight (% of total index) 6.3%
Data source International Institute for Strategic Studies (IISS) Armed Conflict Database (ACD)
Measurement period 2014-2015
Alternative Source: EIU. When no data was provided by the IISS ACD, then EIU analysts have scored the figures available for 2014 and 2015 according to the set bands of the actual data.
Definition: This indicator uses the UCDP’s definition of conflict. UCDP defines conflict as: “a contested incompatibility that concerns government and/or territory where the use of armed force between two parties, of which at least one is the government of a state, results in at least 25 battle-related deaths in a year.” Statistics are compiled from the most recent edition of the IISS ACD, which has the following definition of armed conflict-related fatalities: ‘Fatality statistics relate to military and civilian lives lost as a direct result of an armed conflict’.
103GLOBAL PEACE INDEX 2016 | Appendices

Scoring Bands
1/5 2/5 3/5 4/5 5/5
No internal conflict
Combined conflict score of up to 4.75
Combined conflict score of up to 9.5
Combined conflict score of up to 14.25
A combined conflict score of 19 or above. This shows very high levels of internal conflict.
EXTERNAL PEACE INDICATORS
MILITARY EXPENDITURE AS A PERCENTAGE OF GDP
Indicator type Quantitative
Indicator weight 2
Indicator weight (% of total index) 2.8%
Data source International Institute for Strategic Studies, The Military Balance 2016
Measurement period 2014–2015
Alternative Source: When no data was provided, several alternative sources were used: National Public Expenditure Accounts, SIPRI information and the Military Balance 2015. Alternative data are from 2007 to 2015, depending upon data availability.
Definition: Cash outlays of central or federal government to meet the costs of national armed forces—including strategic, land, naval, air, command, administration and support forces as well as paramilitary forces, customs forces and border guards if these are trained and equipped as a military force. Published EIU data on nominal GDP (or the World Bank when unavailable) was used to arrive at the value of military expenditure as a percentage of GDP.
Scoring Criteria: This indicator is scored using a min-max normalisation. Applying this method, a country’s score is based on the distance of its military expenditure as a share of GDP from the benchmarks of 0% (for a score of 1) and 12.97% or above (for a score of 5). The bands, while linear, approximately conform as follows:
1/5 2/5 3/5 4/5 5/5
0-2.092 2.093-4.184
4.185-6.277 6.278-8.37 >8.371
NUMBER OF ARMED SERVICES PERSONNEL PER 100,000 PEOPLE
Indicator type Quantitative
Indicator weight 2
Indicator weight (% of total index) 2.8%
Data source International Institute for Strategic Studies, The Military Balance 2016
Measurement period 2015
Alternative Source: World Bank population data used if unavailable from the EIU.
Definition: Active armed services personnel comprise all service men and women on full-time duty in the army, navy, air force and joint forces (including conscripts and long-term assignments from the reserves). Population data provided by the EIU.
Scoring Bands
1/5 2/5 3/5 4/5 5/5
0-657.744 657.745-1,315.489
1,315.49-1,973.234
1,973.235-2,630.98
>2,630.981
Additional Notes: The Israeli reservist force is used to calculate Israel’s number of armed services personnel.
FINANCIAL CONTRIBUTION TO UN PEACEKEEPING MISSIONS
Indicator type Quantitative
Indicator weight 2
Indicator weight (% of total index) 2.8%
Data source IEP; United Nations Committee on Contributions
Measurement period 2011–2014
Methodology: The UNFU indicator measures whether UN member countries meet their UN peacekeeping funding commitments. Although countries may fund other programs in development or peacebuilding, the records on peacekeeping are easy to obtain and understand and provide an instructive measure of a country’s commitment to peace. The indicator calculates the percentage of countries’ “outstanding payments versus their annual assessment to the budget of the current peacekeeping missions” over an average of three years. This ratio is derived from data provided by the United Nations Committee on Contributions Status reports. The indicator is
compiled as follows:
1. The status of contributions by UN member states is
obtained.
2. For the relevant peacekeeping missions, the assessments
(for that year only) and the collections (for that year only)
are recorded. From this, the outstanding amount is
calculated for that year.
3. The ratio of outstanding payments to assessments is
calculated. By doing so a score between 0 and 1 is
obtained. Zero indicates no money is owed; a country has
met their funding commitments. A score of 1 indicates
that a country has not paid any of their assessed
contributions. Given that the scores already fall between 0
and 1, they are easily banded into a score between 1 and 5.
104

5. Aircraft carrier and nuclear submarine = 1000 points
Countries with nuclear capabilities automatically receive the maximum score of five. Other scores are expressed to the second decimal point, adopting a min-max normalisation that sets the max at two standard deviations above the average raw score. Nuclear-weapon equipped states are determined by the SIPRI World Nuclear Forces chapter in the SIPRI Yearbook, as follows:
1/5 Nil–18,185
2/5 18,185–36,368
3/5 36,368–54,553
4/5 54,553–72,737
5/5States with nuclear capability receive a 5, or states with heavy weapons capability of 72,738 or in the top 2% of heavy weapons receive a 5.
VOLUME OF TRANSFERS OF MAJOR CONVENTIONAL WEAPONS AS SUPPLIER (EXPORTS) PER 100,000 PEOPLE
Indicator type Quantitative
Indicator weight 3
Indicator weight (% of total index) 4.2%
Data source SIPRI Arms Transfers Database
Measurement period 2010-2014
Definition: Measures the total volume of major conventional weapons exported by a country between 2010 and 2014 divided by the average population during this time period (population data supplied by the EIU). The SIPRI Arms Transfers Database covers all international sales and gifts of major conventional weapons and the technology necessary for the production of them. The transfer equipment or technology is from one country, rebel force or international organisation to another country, rebel force or international organisation. Major conventional weapons include: aircraft, armoured vehicles, artillery, radar systems, missiles, ships and engines.
Scoring Bands
1/5 2/5 3/5 4/5 5/5
0-3.681 3.682-7.364
7.365-11.046
11.047-14.729
>14.73
The final banded score is a weighted sum of the current
year and the previous two years. The weightings are 0.5 for
the current year, 0.3 for the previous year and 0.2 for two
years prior. Hence it is a three year weighted average.
5. Outstanding payments from previous years and credits are
not included. The scoring is linear to one decimal place.
Scoring Criteria
1/5 0–25% of stated contributions owed
2/5 26–50% of stated contributions owed
3/5 51–75% of stated contributions owed
4/5 75–99% of stated contributions owed
5/5100% of stated contributions owed (no contributions made in past three years)
Additional Notes: All United Nations member states share the costs of United Nations peacekeeping operations. The General Assembly apportions these expenses based on a special scale of assessments applicable to peacekeeping. This scale takes into account the relative economic wealth of member states, with the permanent members of the Security Council required to pay a larger share because of their special responsibility for the maintenance of international peace and security. Due to delays in the release of new data, the 2016 indicator scores take into account a a weighted average from 2011 to 2014.
NUCLEAR AND HEAVY WEAPONS CAPABILITIES
Indicator type Quantitative
Indicator weight 3
Indicator weight (% of total index) 4.2%
Data source IEP; SIPRI; IISS The Military Balance; United Nations Register of Conventional Arms
Measurement period 2014
Methodology: This indicator is based on a categorised system for rating the destructive capability of a country’s stock of heavy weapons. Holdings are those of government forces and do not include holdings of armed opposition groups. Heavy weapons numbers were determined using a combination of the International Institute for Strategic Studies, The Military Balance and the United Nations Register of Conventional Arms.
There are five categories of weapons, each of which receive a certain number of weighted points. The five weapons categories are weighted as follows:
1. Armoured vehicle and artillery pieces = 1 point
2. Tank = 5 points
3. Combat aircraft and combat helicopter = 20 points
4. Warship = 100 points
105GLOBAL PEACE INDEX 2016 | Appendices

NUMBER, DURATION AND ROLE IN EXTERNAL CONFLICTS
Indicator type Quantitative
Indicator weight 2.28
Indicator weight (% of total index) 3.2%
Data source IEP; UCDP Battle-Related Deaths Dataset
Measurement period 2010-2014
Definition: This indicator measures the number and duration of extraterritorial conflicts a country is involved in. Information for this indicator is sourced from the UCDP Battle-Related Deaths Dataset. The score for a country is determined by adding all individual conflict scores where that country is involved as an actor in a conflict outside its legal boundaries. Conflicts are not counted against a country if they have already been counted against that country in the number and duration of internal conflicts indicator.
Each individual conflict score is based on the following factors:
Number:
• Number of internationalised internal armed conflicts and interstate armed conflicts.
• If a conflict is a war (1,000+ battle related deaths) it receives a score of one; if it is an armed conflict (25-999 battle related deaths) it receives a score of 0.25.
Duration:
• A score is assigned based on the number of years out of the last five that conflict has occurred. For example, if a conflict last occurred five years ago that conflict will receive a score of one out of five.
Role:
• If the country is a primary party to the conflict, that conflict receives a score of one; if it is a secondary party (supporting the primary party), that conflict receives a score of 0.25.
• If a country is a party to a force covered by a relevant United Nations Security Council Resolution, then the entire conflict score is multiplied by a quarter; if not, it receives a full score.
The different conflict scores are then added and banded to establish a country’s score. This indicator is two years lagging due to when the UCDP data is released.
Scoring Bands
NUMBER OF REFUGEES AND INTERNALLY DISPLACED PEOPLE AS A PERCENTAGE OF THE POPULATION
Indicator type Quantitative
Indicator weight 4
Indicator weight (% of total index) 5.7%
Data source UNHCR Mid-Year Trends 2015; International Displacement Monitoring Centre (IDMC), 2015
Measurement period 2015
Definition: Refugee population by country or territory of origin plus the number of a country’s internally displaced people (IDPs), as a percentage of the country’s total population.
Scoring Bands
1/5 2/5 3/5 4/5 5/5
0-3.034 3.035-6.069
6.07-9.104 9.105-12.139
>12.14
RELATIONS WITH NEIGHBOURING COUNTRIES
Indicator type Qualitative
Indicator weight 5
Indicator weight (% of total index) 7.1%
Data source EIU
Measurement period 16 March 2015 to 15 March 2016
Definition: Assessment of the intensity of contentiousness of neighbours, ranked from 1-5 (peaceful to very aggressive) by the EIU’s Country Analysis team. Country analysts are asked to assess this indicator on an annual basis, for the period March to March.
Scoring Criteria
1 = Peaceful: None of the neighbours has attacked the country since 1950.
2 = Low: The relationship with neighbours is generally good, but aggressiveness is manifest in politicians’ speeches or in protectionist measures.
3 = Moderate: There are serious tensions and consequent economic and diplomatic restrictions from other countries.
4 = Aggressive: Open conflicts with violence and protests.
5 = Very aggressive: Frequent invasions by neighbouring countries.
106

1/5 2/5 3/5 4/5 5/5
No external conflict
Combined conflict score of up to 1.5
Combined conflict score of up to 3
Combined conflict score of up to 4.5
A combined conflict score of 6 or above. This shows very high levels of external conflict.
NUMBER OF DEATHS FROM ORGANISED CONFLICT (EXTERNAL)
Indicator type Quantitative
Indicator weight 5
Indicator weight (% of total index) 7.1%
Data source UCDP Armed Conflict Dataset
Measurement period 2014-2015
Alternate Source: When no data was provided, several alternative sources have been used: International Institute for Strategic Studies (IISS) Armed Conflict Database; the Iraq Coalition Casualty Count, and the EIU.
Definition: This indicator uses the UCDP’s definition of conflict as “a contested incompatibility that concerns government and/or territory where the use of armed force between two parties, of which at least one is the government of a state, results in at least 25 battle-related deaths in a year”.
Scoring Bands
1/5 2/5 3/5 4/5 5/5
0–23 deaths24–998 deaths
999–4,998 deaths
4,999–9,998 deaths
> 9,999 deaths
107GLOBAL PEACE INDEX 2016 | Appendices
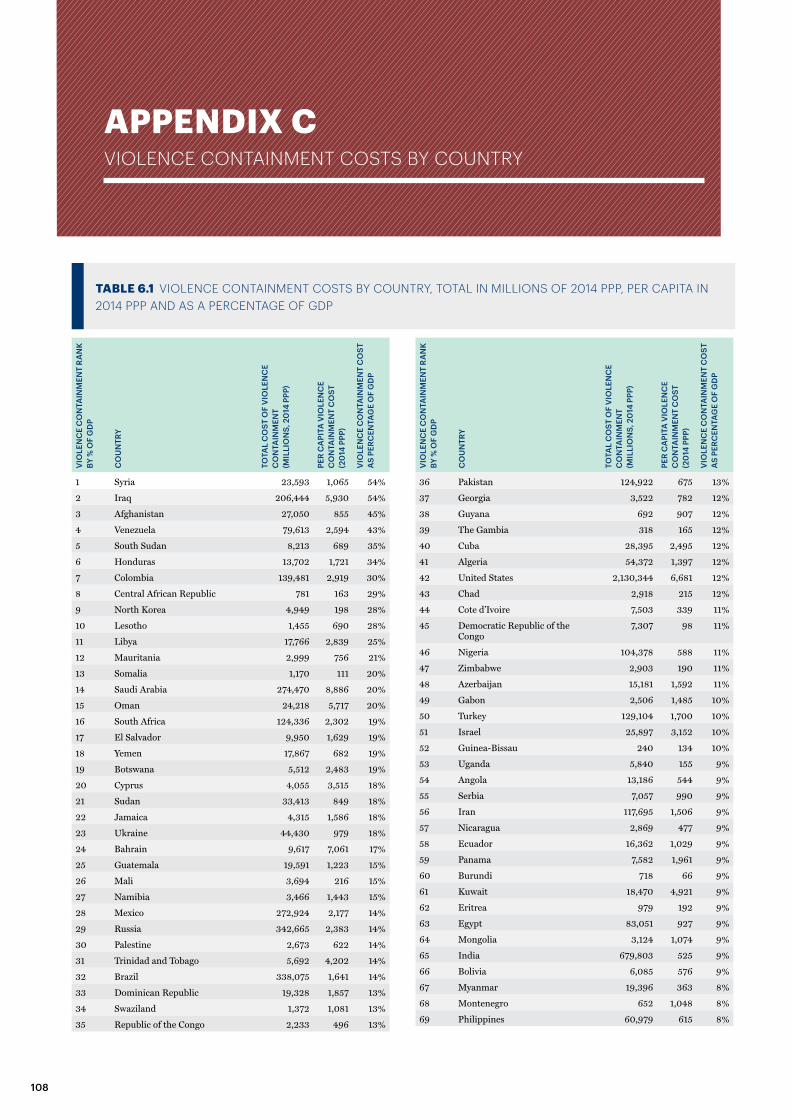
TABLE 6.1 VIOLENCE CONTAINMENT COSTS BY COUNTRY, TOTAL IN MILLIONS OF 2014 PPP, PER CAPITA IN 2014 PPP AND AS A PERCENTAGE OF GDP
APPENDIX C VIOLENCE CONTAINMENT COSTS BY COUNTRY
VIO
LEN
CE
CO
NTA
INM
ENT
RA
NK
BY %
OF
GD
P
CO
UN
TRY
TOTA
L C
OST
OF
VIO
LEN
CE
CO
NTA
INM
ENT
(MIL
LIO
NS,
20
14 P
PP)
PER
CA
PITA
VIO
LEN
CE
CO
NTA
INM
ENT
CO
ST
(20
14 P
PP)
VIO
LEN
CE
CO
NTA
INM
ENT
CO
ST
AS
PERC
ENTA
GE
OF
GD
P
1 Syria 23,593 1,065 54%
2 Iraq 206,444 5,930 54%
3 Afghanistan 27,050 855 45%
4 Venezuela 79,613 2,594 43%
5 South Sudan 8,213 689 35%
6 Honduras 13,702 1,721 34%
7 Colombia 139,481 2,919 30%
8 Central African Republic 781 163 29%
9 North Korea 4,949 198 28%
10 Lesotho 1,455 690 28%
11 Libya 17,766 2,839 25%
12 Mauritania 2,999 756 21%
13 Somalia 1,170 111 20%
14 Saudi Arabia 274,470 8,886 20%
15 Oman 24,218 5,717 20%
16 South Africa 124,336 2,302 19%
17 El Salvador 9,950 1,629 19%
18 Yemen 17,867 682 19%
19 Botswana 5,512 2,483 19%
20 Cyprus 4,055 3,515 18%
21 Sudan 33,413 849 18%
22 Jamaica 4,315 1,586 18%
23 Ukraine 44,430 979 18%
24 Bahrain 9,617 7,061 17%
25 Guatemala 19,591 1,223 15%
26 Mali 3,694 216 15%
27 Namibia 3,466 1,443 15%
28 Mexico 272,924 2,177 14%
29 Russia 342,665 2,383 14%
30 Palestine 2,673 622 14%
31 Trinidad and Tobago 5,692 4,202 14%
32 Brazil 338,075 1,641 14%
33 Dominican Republic 19,328 1,857 13%
34 Swaziland 1,372 1,081 13%
35 Republic of the Congo 2,233 496 13%
VIO
LEN
CE
CO
NTA
INM
ENT
RA
NK
BY %
OF
GD
P
CO
UN
TRY
TOTA
L C
OST
OF
VIO
LEN
CE
CO
NTA
INM
ENT
(MIL
LIO
NS,
20
14 P
PP)
PER
CA
PITA
VIO
LEN
CE
CO
NTA
INM
ENT
CO
ST
(20
14 P
PP)
VIO
LEN
CE
CO
NTA
INM
ENT
CO
ST
AS
PERC
ENTA
GE
OF
GD
P
36 Pakistan 124,922 675 13%
37 Georgia 3,522 782 12%
38 Guyana 692 907 12%
39 The Gambia 318 165 12%
40 Cuba 28,395 2,495 12%
41 Algeria 54,372 1,397 12%
42 United States 2,130,344 6,681 12%
43 Chad 2,918 215 12%
44 Cote d’Ivoire 7,503 339 11%
45 Democratic Republic of the Congo
7,307 98 11%
46 Nigeria 104,378 588 11%
47 Zimbabwe 2,903 190 11%
48 Azerbaijan 15,181 1,592 11%
49 Gabon 2,506 1,485 10%
50 Turkey 129,104 1,700 10%
51 Israel 25,897 3,152 10%
52 Guinea-Bissau 240 134 10%
53 Uganda 5,840 155 9%
54 Angola 13,186 544 9%
55 Serbia 7,057 990 9%
56 Iran 117,695 1,506 9%
57 Nicaragua 2,869 477 9%
58 Ecuador 16,362 1,029 9%
59 Panama 7,582 1,961 9%
60 Burundi 718 66 9%
61 Kuwait 18,470 4,921 9%
62 Eritrea 979 192 9%
63 Egypt 83,051 927 9%
64 Mongolia 3,124 1,074 9%
65 India 679,803 525 9%
66 Bolivia 6,085 576 9%
67 Myanmar 19,396 363 8%
68 Montenegro 652 1,048 8%
69 Philippines 60,979 615 8%
108

VIO
LEN
CE
CO
NTA
INM
ENT
RA
NK
BY %
OF
GD
P
CO
UN
TRY
TOTA
L C
OST
OF
VIO
LEN
CE
CO
NTA
INM
ENT
(MIL
LIO
NS,
20
14 P
PP)
PER
CA
PITA
VIO
LEN
CE
CO
NTA
INM
ENT
CO
ST
(20
14 P
PP)
VIO
LEN
CE
CO
NTA
INM
ENT
CO
ST
AS
PERC
ENTA
GE
OF
GD
P
70 Uzbekistan 14,549 473 8%
71 Benin 1,389 131 8%
72 Lebanon 7,476 1,644 8%
73 Macedonia 1,870 901 8%
74 Jordan 6,491 983 8%
75 Togo 708 100 8%
76 Tanzania 9,153 177 7%
77 Bulgaria 7,327 1,014 7%
78 Cambodia 3,874 253 7%
79 Peru 24,017 775 7%
80 Moldova 1,002 282 7%
81 Armenia 1,602 533 7%
82 Bosnia and Herzegovina 2,312 606 7%
83 Thailand 69,940 1,033 7%
84 Lithuania 4,818 1,645 7%
85 Sri Lanka 16,467 798 7%
86 Viet Nam 38,425 424 7%
87 Haiti 1,295 122 7%
88 Albania 1,829 632 7%
89 Rwanda 1,403 124 7%
90 Tunisia 8,181 744 7%
91 Morocco 16,659 491 7%
92 Paraguay 3,735 570 7%
93 Qatar 18,239 8,397 7%
94 Zambia 3,598 229 6%
95 Laos 2,415 361 6%
96 Nepal 4,676 166 6%
97 Mauritius 1,384 1,098 6%
98 Senegal 1,962 134 6%
99 Ethiopia 10,554 109 6%
100 Kosovo 903 496 6%
101 Estonia 1,948 1,483 6%
102 Turkmenistan 4,754 896 6%
103 Kenya 8,573 191 6%
104 Kazakhstan 23,365 1,351 6%
105 Djibouti 191 218 6%
106 Hungary 12,506 1,268 6%
107 Niger 939 49 6%
108 Greece 13,848 1,264 6%
109 Costa Rica 4,370 918 6%
110 United Arab Emirates 29,806 3,280 6%
111 Belarus 7,953 840 6%
112 United Kingdom 139,886 2,168 6%
113 Romania 19,071 958 6%
114 South Korea 95,630 1,897 6%
115 Argentina 32,123 747 6%
116 Uruguay 3,793 1,109 6%
117 Burkina Faso 1,453 83 6%
118 Latvia 2,237 1,124 6%
VIO
LEN
CE
CO
NTA
INM
ENT
RA
NK
BY %
OF
GD
P
CO
UN
TRY
TOTA
L C
OST
OF
VIO
LEN
CE
CO
NTA
INM
ENT
(MIL
LIO
NS,
20
14 P
PP)
PER
CA
PITA
VIO
LEN
CE
CO
NTA
INM
ENT
CO
ST
(20
14 P
PP)
VIO
LEN
CE
CO
NTA
INM
ENT
CO
ST
AS
PERC
ENTA
GE
OF
GD
P
119 Poland 45,781 1,205 6%
120 Croatia 4,228 998 5%
121 Portugal 13,572 1,305 5%
122 Liberia 194 44 5%
123 Belgium 21,782 1,940 5%
124 France 114,597 1,731 5%
125 Tajikistan 1,008 122 5%
126 Chile 18,991 1,069 5%
127 Bhutan 343 448 5%
128 Sweden 19,523 2,015 5%
129 Guinea 764 62 5%
130 Taiwan 25,751 1,099 5%
131 Slovakia 6,411 1,183 5%
132 Germany 159,833 1,976 5%
133 Australia 43,108 1,835 5%
134 Kyrgyz Republic 903 155 5%
135 Sierra Leone 523 83 5%
136 Czech Republic 13,577 1,292 5%
137 Singapore 19,776 3,616 5%
138 Italy 82,361 1,343 5%
139 Finland 8,518 1,559 5%
140 Netherlands 32,034 1,901 5%
141 Ghana 4,714 176 4%
142 Malaysia 30,285 1,013 4%
143 Equatorial Guinea 767 935 4%
144 Cameroon 2,543 112 4%
145 New Zealand 5,719 1,268 4%
146 Spain 55,165 1,189 4%
147 Slovenia 2,021 980 4%
148 Bangladesh 21,815 137 4%
149 Papua New Guinea 835 112 4%
150 Timor-Leste 293 242 4%
151 China 700,632 514 4%
152 Malawi 678 41 3%
153 Ireland 6,625 1,436 3%
154 Norway 8,514 1,658 3%
155 Denmark 6,665 1,182 3%
156 Japan 121,616 957 3%
157 Madagascar 885 38 3%
158 Switzerland 13,184 1,610 3%
159 Mozambique 914 34 3%
160 Austria 8,772 1,028 3%
161 Iceland 334 1,021 2%
162 Canada 32,431 913 2%
163 Indonesia 52,275 205 2%
109GLOBAL PEACE INDEX 2016 | Appendices

APPENDIX D 2016 GPI DOMAIN SCORES
TABLE 6.2 ONGOING DOMESTIC AND INTERNATIONAL CONFLICT DOMAIN, MOST PEACEFUL TO LEAST
COUNTRY
SCO
RE
Botswana 1
Switzerland 1
Chile 1
Mauritius 1
Uruguay 1
Brazil 1.030
Singapore 1.069
Austria 1.081
Bulgaria 1.081
Spain 1.081
Iceland 1.081
New Zealand 1.081
Portugal 1.081
Romania 1.093
Malaysia 1.111
Finland 1.117
Italy 1.117
Norway 1.117
Sweden 1.117
Czech Republic 1.125
Germany 1.126
Denmark 1.129
Australia 1.137
Netherlands 1.140
Canada 1.149
Belgium 1.165
France 1.191
Costa Rica 1.201
Jamaica 1.201
Namibia 1.201
Panama 1.201
Trinidad and Tobago 1.201
Zambia 1.201
United Kingdom 1.235
Albania 1.282
Croatia 1.282
Ireland 1.282
Mongolia 1.282
Poland 1.291
Angola 1.403
Argentina 1.403
Bolivia 1.403
Bhutan 1.403
Dominican Republic 1.403
Equatorial Guinea 1.403
Guyana 1.403
Japan 1.403
Kuwait 1.403
Lesotho 1.403
Madagascar 1.403
Malawi 1.403
Nicaragua 1.403
Oman 1.403
Qatar 1.403
Swaziland 1.403
Timor-Leste 1.403
Tanzania 1.403
Vietnam 1.403
Peru 1.432
Papua New Guinea 1.432
Benin 1.439
Burkina Faso 1.439
Liberia 1.439
Nepal 1.439
Togo 1.439
Honduras 1.462
El Salvador 1.465
Cambodia 1.469
Ghana 1.475
Sierra Leone 1.475
Bosnia and Herzegovina 1.484
Hungary 1.484
Lithuania 1.484
Latvia 1.484
Montenegro 1.484
Slovakia 1.484
Slovenia 1.484
Guinea 1.498
Indonesia 1.506
Estonia 1.520
United Arab Emirates 1.531
Republic of the Congo 1.604
Cyprus 1.604
Ecuador 1.604
Gabon 1.604
Haiti 1.604
Laos 1.604
Sri Lanka 1.604
Paraguay 1.604
Serbia 1.604
Tunisia 1.604
Taiwan 1.604
South Africa 1.604
Guatemala 1.634
Mozambique 1.634
Kazakhstan 1.635
Turkmenistan 1.635
Guinea-Bissau 1.640
Djibouti 1.669
Bangladesh 1.670
Greece 1.685
United States of America 1.686
Mauritania 1.700
Jordan 1.752
Cote d'Ivoire 1.789
Uganda 1.800
Belarus 1.805
Cuba 1.805
Eritrea 1.805
The Gambia 1.805
Morocco 1.805
Moldova 1.805
Venezuela 1.805
Zimbabwe 1.805
Kosovo 1.810
Uzbekistan 1.832
Senegal 1.871
South Korea 1.886
Macedonia (FYR) 1.886
Georgia 1.895
China 2.004
Rwanda 2.029
Algeria 2.043
Niger 2.043
Saudi Arabia 2.054
Chad 2.056
Kyrgyz Republic 2.094
Bahrain 2.095
Thailand 2.121
Cameroon 2.181
Colombia 2.239
Tajikistan 2.239
Iran 2.267
Burundi 2.280
Armenia 2.325
Azerbaijan 2.356
Mexico 2.418
Israel 2.429
Egypt 2.468
Ethiopia 2.481
Myanmar 2.482
Kenya 2.497
Mali 2.502
North Korea 2.610
Turkey 2.636
Russia 2.639
Philippines 2.664
Lebanon 2.740
Libya 2.984
Palestine 3.018
India 3.045
Nigeria 3.094
Yemen 3.125
Iraq 3.188
Democratic Republic of the Congo 3.191
Ukraine 3.272
Sudan 3.384
Central African Republic 3.402
Somalia 3.538
Afghanistan 3.603
Pakistan 3.617
South Sudan 3.732
Syria 3.827
COUNTRY
SC
ORE
COUNTRY
SC
ORE
COUNTRY
SC
ORE
COUNTRY
SC
ORE
110

TABLE 6.3 SOCIETAL SAFETY AND SECURITY DOMAIN, MOST PEACEFUL TO LEAST
COUNTRY
SCO
RE
Iceland 1.248
Switzerland 1.294
Denmark 1.302
Norway 1.313
Sweden 1.339
Japan 1.347
Austria 1.386
Slovenia 1.415
Finland 1.424
New Zealand 1.449
Canada 1.472
Netherlands 1.528
Germany 1.571
Bhutan 1.571
Portugal 1.573
Australia 1.589
Singapore 1.603
Ireland 1.614
Czech Republic 1.639
South Korea 1.718
Poland 1.747
Slovakia 1.747
Hungary 1.794
Qatar 1.818
Belgium 1.852
Spain 1.852
Croatia 1.863
United Kingdom 1.868
France 1.894
Taiwan 1.896
Romania 1.933
United States of America
2.016
Latvia 2.019
Estonia 2.034
Mauritius 2.044
Serbia 2.094
Ghana 2.095
Bulgaria 2.099
Lithuania 2.112
Chile 2.114
United Arab Emirates 2.124
Botswana 2.126
Sierra Leone 2.134
Oman 2.140
Italy 2.164
Kuwait 2.167
Laos 2.167
Indonesia 2.170
Malawi 2.171
Costa Rica 2.171
Madagascar 2.200
Vietnam 2.224
Malaysia 2.260
Israel 2.261
Armenia 2.265
Uruguay 2.331
Greece 2.333
Georgia 2.340
Montenegro 2.341
Zambia 2.342
Senegal 2.355
Macedonia (FYR) 2.360
Morocco 2.384
Mongolia 2.393
Timor-Leste 2.394
Albania 2.398
Cyprus 2.404
Jordan 2.406
Togo 2.415
Equatorial Guinea 2.416
Bosnia and Herzegovina
2.430
Lesotho 2.430
Moldova 2.433
India 2.450
Tunisia 2.452
Namibia 2.470
Saudi Arabia 2.470
Benin 2.475
Liberia 2.486
Kosovo 2.487
Kazakhstan 2.492
Panama 2.493
Myanmar 2.505
Gabon 2.512
Tajikistan 2.517
Algeria 2.531
China 2.536
Cuba 2.538
Sri Lanka 2.552
Tanzania 2.555
Mozambique 2.557
Ethiopia 2.558
Paraguay 2.574
Ecuador 2.581
Argentina 2.606
Azerbaijan 2.616
Bolivia 2.617
Nepal 2.619
Bangladesh 2.622
Kyrgyz Republic 2.624
Uzbekistan 2.628
Nicaragua 2.637
Belarus 2.648
Burkina Faso 2.663
Uganda 2.670
The Gambia 2.671
Haiti 2.716
Cambodia 2.730
Niger 2.737
Guinea 2.762
Turkmenistan 2.763
Iran 2.786
Peru 2.786
Angola 2.792
Swaziland 2.819
Mali 2.831
Djibouti 2.840
Rwanda 2.841
Egypt 2.849
Dominican Republic 2.867
Bahrain 2.880
Guinea-Bissau 2.904
Papua New Guinea 2.905
Republic of the Congo 2.905
Zimbabwe 2.908
Trinidad and Tobago 2.915
Kenya 2.918
Jamaica 2.932
Cote d'Ivoire 2.936
Philippines 2.949
Thailand 2.965
Burundi 2.967
Mauritania 2.967
Guyana 2.987
Turkey 2.992
Cameroon 3.000
Palestine 3.025
Chad 3.066
North Korea 3.109
Brazil 3.115
Guatemala 3.131
El Salvador 3.133
Lebanon 3.152
Honduras 3.169
South Africa 3.225
Pakistan 3.226
Eritrea 3.235
Mexico 3.239
Russia 3.308
Ukraine 3.384
Nigeria 3.449
Venezuela 3.555
Colombia 3.588
Libya 3.668
Sudan 3.714
Democratic Republic of the Congo
3.809
Yemen 3.992
Somalia 4.071
Central African Republic
4.118
Afghanistan 4.136
South Sudan 4.241
Syria 4.244
Iraq 4.333
COUNTRY
SC
ORE
COUNTRY
SC
ORE
COUNTRY
SC
ORE
111GLOBAL PEACE INDEX 2016 | Appendices
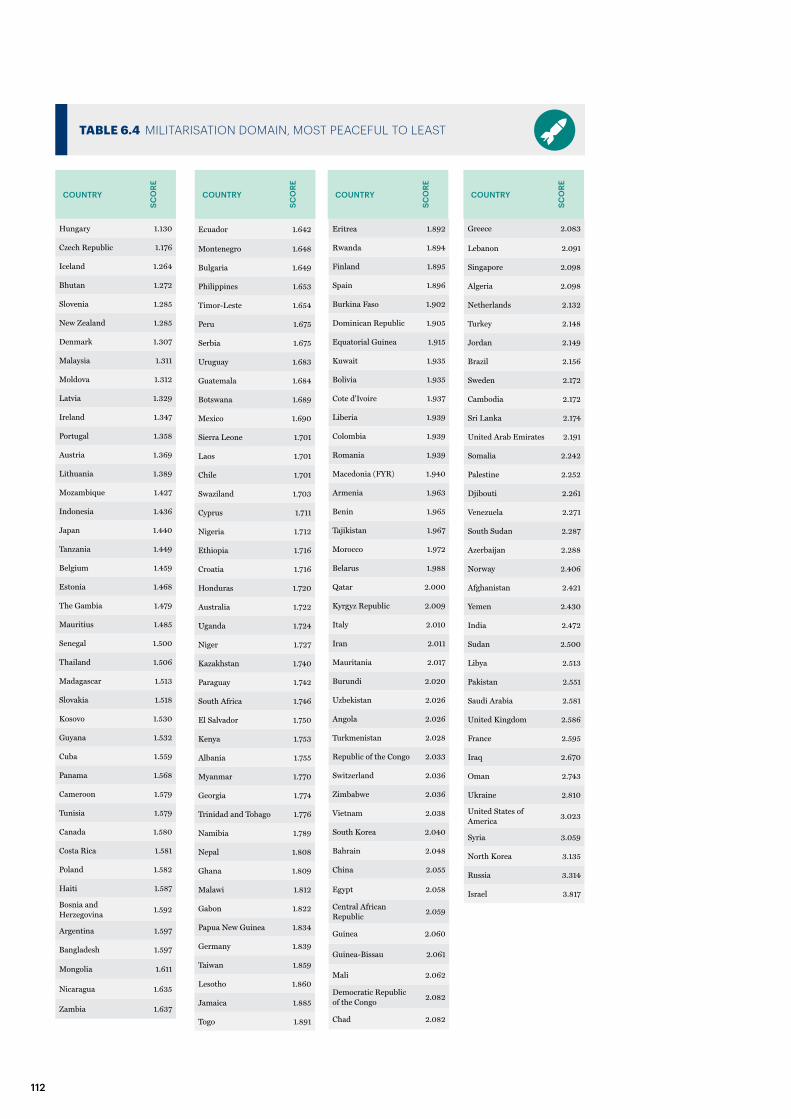
TABLE 6.4 MILITARISATION DOMAIN, MOST PEACEFUL TO LEAST
COUNTRY
SCO
RE
Hungary 1.130
Czech Republic 1.176
Iceland 1.264
Bhutan 1.272
Slovenia 1.285
New Zealand 1.285
Denmark 1.307
Malaysia 1.311
Moldova 1.312
Latvia 1.329
Ireland 1.347
Portugal 1.358
Austria 1.369
Lithuania 1.389
Mozambique 1.427
Indonesia 1.436
Japan 1.440
Tanzania 1.449
Belgium 1.459
Estonia 1.468
The Gambia 1.479
Mauritius 1.485
Senegal 1.500
Thailand 1.506
Madagascar 1.513
Slovakia 1.518
Kosovo 1.530
Guyana 1.532
Cuba 1.559
Panama 1.568
Cameroon 1.579
Tunisia 1.579
Canada 1.580
Costa Rica 1.581
Poland 1.582
Haiti 1.587
Bosnia and Herzegovina
1.592
Argentina 1.597
Bangladesh 1.597
Mongolia 1.611
Nicaragua 1.635
Zambia 1.637
Ecuador 1.642
Montenegro 1.648
Bulgaria 1.649
Philippines 1.653
Timor-Leste 1.654
Peru 1.675
Serbia 1.675
Uruguay 1.683
Guatemala 1.684
Botswana 1.689
Mexico 1.690
Sierra Leone 1.701
Laos 1.701
Chile 1.701
Swaziland 1.703
Cyprus 1.711
Nigeria 1.712
Ethiopia 1.716
Croatia 1.716
Honduras 1.720
Australia 1.722
Uganda 1.724
Niger 1.727
Kazakhstan 1.740
Paraguay 1.742
South Africa 1.746
El Salvador 1.750
Kenya 1.753
Albania 1.755
Myanmar 1.770
Georgia 1.774
Trinidad and Tobago 1.776
Namibia 1.789
Nepal 1.808
Ghana 1.809
Malawi 1.812
Gabon 1.822
Papua New Guinea 1.834
Germany 1.839
Taiwan 1.859
Lesotho 1.860
Jamaica 1.885
Togo 1.891
Eritrea 1.892
Rwanda 1.894
Finland 1.895
Spain 1.896
Burkina Faso 1.902
Dominican Republic 1.905
Equatorial Guinea 1.915
Kuwait 1.935
Bolivia 1.935
Cote d'Ivoire 1.937
Liberia 1.939
Colombia 1.939
Romania 1.939
Macedonia (FYR) 1.940
Armenia 1.963
Benin 1.965
Tajikistan 1.967
Morocco 1.972
Belarus 1.988
Qatar 2.000
Kyrgyz Republic 2.009
Italy 2.010
Iran 2.011
Mauritania 2.017
Burundi 2.020
Uzbekistan 2.026
Angola 2.026
Turkmenistan 2.028
Republic of the Congo 2.033
Switzerland 2.036
Zimbabwe 2.036
Vietnam 2.038
South Korea 2.040
Bahrain 2.048
China 2.055
Egypt 2.058
Central African Republic
2.059
Guinea 2.060
Guinea-Bissau 2.061
Mali 2.062
Democratic Republic of the Congo
2.082
Chad 2.082
Greece 2.083
Lebanon 2.091
Singapore 2.098
Algeria 2.098
Netherlands 2.132
Turkey 2.148
Jordan 2.149
Brazil 2.156
Sweden 2.172
Cambodia 2.172
Sri Lanka 2.174
United Arab Emirates 2.191
Somalia 2.242
Palestine 2.252
Djibouti 2.261
Venezuela 2.271
South Sudan 2.287
Azerbaijan 2.288
Norway 2.406
Afghanistan 2.421
Yemen 2.430
India 2.472
Sudan 2.500
Libya 2.513
Pakistan 2.551
Saudi Arabia 2.581
United Kingdom 2.586
France 2.595
Iraq 2.670
Oman 2.743
Ukraine 2.810
United States of America
3.023
Syria 3.059
North Korea 3.135
Russia 3.314
Israel 3.817
COUNTRY
SC
ORE
COUNTRY
SC
ORE
COUNTRY
SC
ORE
112
END NOTES
Section 3Global Economic Value of Peace1. United Nations Conference on Trade and Development,
‘Global investment report’, 2015, accessed 13 May 2016, http://unctad.org/en/PublicationsLibrary/wir2015_en.pdf
2. Sandler, T., and Justin, G, ‘Military Expenditure Trends for 1960–2014 and What They Reveal.’ Global Policy,2016.
3. World Trade Organisation, ‘International Trade Statistics’, 2015, accessed 9 May 2016, https://www.wto.org/english/res_e/statis_e/its2015_e/its2015_e.pdf
4. Brauer, J., and Marlin, J.T., ‘Nonkilling Economics: Calculating the size of peace gross world product’, Toward a Nonkillin paradigm, Honolulu, Centre for Global Nonkilling, 2009, p. 125-148.
5. Ibid.
6. S. R. Hiatt, and W. D. Sine, ‘Clear and present danger: planning and new venture survival amid political and civil violence’, Strategic Management Journal, vol. 35, no. 5, 2014, pp. 773-785.
7. J. Brauer and J. Tepper-Marlin, Defining Peace Industries and Calculating the Potential Size of a Gross World Product by Country and by Economic Sector, Institute for Economics and Peace, Sydney, 2009.
8. Reuters, ‘Russia’s Putin Order Cuts to Interior Ministry Payroll As Economy Struggles,’ 13 July 2015, accessed 156 May 2016, http://www.themoscowtimes.com/news/article/russias-putin-order-cuts-to-interior-ministry-payroll-as-economy-struggles/525531.html
9. Note this data differs very slightly to SIPRI military expenditure trend data due to slightly different GDP data. Also note SIPRI and IEP measurement years differ by one year.
10. Stockholm International Peace Research Institute, ‘SIPRI Fact Sheet Trends In World Military Expenditure, 2014 and 2015, accessed 02 May 2016, http://books.sipri.org/files/FS/SIPRIFS1604.pdf
11. Organisation for Economic Cooperation and Development, ‘Central Government Expenditure’, accessed 30 April 2016, https://data.oecd.org/gga/central-government-spending.htm and International Monetary Fund, ‘Government Expenditure data’, accessed on 30 April 2016, http://data.imf.org/?sk=5804C5E1-0502-4672-BDCD-671BCDC565A9
12. US military related expenditure includes $848 billion PPP spent on Veterans Affairs, maintenance of the nuclear arsenal and interest payments on military-related debt.
13. Londoño, J. L., and Guerrero, R., ‘Violencia en América Latina: epidemiología y costos.’ Asalto al desarrollo. Violencia en América Latina,2000: 11-57.
14. World Bank, ‘Lebanon - Economic and social impact assessment of the Syrian conflict.’, 2013, accessed 13 May 2016, http://documents.worldbank.org/curated/en/2013/09/18292074/lebanon-economic-social-impact-assessment-syrian-conflict
15. Collier, P.,‘On the economic consequences of civil war.’, Oxford economic papers, 51(1), 168-183, 1999.
16. Sgueo, G., ‘Counter-Terrorism Funding in the EU Budget.’, European Parliamentary Research Service, June, 2015
Section 4Positive Peace & System Thinking1. International Alert, ‘Peace through Prosperity: Integrating
peacebuilding into economic development’, 2015, accessed 13 May 2016, http://www.international-alert.org/sites/default/files/Economy_PeaceThroughProsperity_EN_2015.pdf
2. Barnes, C. 2006. Agents for Change: Civil Society Roles in Preventing War & Building Peace. Global Partnership for the Prevention of Armed Violence. Issue Paper 2. The Hague: September.
3. Macy, J., ‘Mutual Causality in Buddhism and General Systems Theory The Dharma of Natural Systems’, 2010, State University of New York Press, New York.
4. Coppola, D., ‘Introduction to International Disaster Management’, 2007, Oxford: Elsevier, p. 25.
5. United States Institute of Peace, ‘Crime, Politics and Violence in Post-Earthquake Haiti, 2010, http://www.usip.org/sites/default/files/PB%2058%20-%20Crime%20Politics%20and%20Violence%20in%20Post-Earthquake%20Haiti.pdf
6. Ibid.
7. Ibid.
8. Centre for Research on the Epidemiology of Disasters, ‘International Disaster Database’, 2015, accessed 1 April 2016, http://www.emdat.be/
9. Ibid.
10. The log of number of people affected provides a better distribution to visualise.
11. Results filtered for natural disasters that affect greater than 100 people to disregard smaller events.
12. EMDAT reports property damage in US dollars in the year of the event. All amounts have been converted to 2005 USD.
113GLOBAL PEACE INDEX 2016 | Appendices

13. Nzapayeke, A, ‘New CAR PM says ending atrocities is priority’, 2014, accessed 12 May 2016, http://www.aljazeera.com/news/africa/2014/01/new-car-pm-says-ending-atrocities-priority-2014126124325498176.html
14. Spencer, R, ‘Isil carried out massacres and mass sexual enslavement of Yazidis, UN confirms, 2014, accessed 12 May 2016, http://www.telegraph.co.uk/news/worldnews/islamic-state/11160906/Isil-carried-out-massacres-and-mass-sexual-enslavement-of-Yazidis-UN-confirms.html
Section 5Sustainable Development Goal 161. United Nations, 2015, The Millennium Development Goals
Report 2015, accessed 1 April 2016, http://www.un.org/millenniumgoals/2015_MDG_Report/pdf/MDG%202015%20rev%20(July%201).pdf
2. Institute for Economics and Peace, 2015, Peace and Corruption, accessed 1 April 2016, http://economicsandpeace.org/wp-content/uploads/2015/06/Peace-and-Corruption.pdf
3. Karen Yourish, K.K. Rebecca Lai & Derek Watkins, 14 September 2015, Death in Syria, New York Times, accessed 1 April 2016, http://www.nytimes.com/interactive/2015/09/14/world/middleeast/syria-war-deaths.html
4. United Nations Security Council, 17 August 2015, Alarmed by Continuing Syria Crisis, Security Council Affirms Its Support for Special Envoy’s Approach in Moving Political Solution Forward, accessed 1 April 2016, http://www.un.org/press/en/2015/sc12008.doc.htm
5. Syrian Observatory for Human Rights, 16 June 2015, Syrian Civil War Death Toll Climbs Over 320,000 Casualties; Observatory Group Slams International Community’s Silence as Encouraging Bloodshed, accessed 1 April 2016, http://www.syriahr.com/en/2015/06/16/syrian-civil-war-death-toll-climbs-over-320000-casualties-observatory-group-slams-international-communitys-silence-as-encouraging-bloodshed/
6. Department of State, July 2015, Trafficking In Persons Report, accessed 1 April 2016, http://www.state.gov/documents/organization/245365.pdf
7. Arms Trade Treaty, 2014, ATT Baseline Assessment Project, accessed 1 April 2016, http://www.armstrade.info/about-us/
8. Institute for Economics and Peace, 2015, Peace and Corruption, accessed 1 April 2016, http://economicsandpeace.org/wp-content/uploads/2015/06/Peace-and-Corruption.pdf
9. Amartya Sen, 1999, Development as Freedom, Oxford University Press
10. Economist Intelligence Unit, 2015, Democracy Index 2015, accessed 1 April 2016, http://www.eiu.com/public/topical_report.aspx?campaignid=DemocracyIndex2015
11. International Trade Union Confederation, 2015, ITUC Global Rights Index 2015, accessed 1 April 2016, http://www.ituc-csi.org/ituc-global-rights-index-2015
12. United Nations, 2011, UN Rule of Law Indicators, accessed 1 April 2016, http://www.un.org/en/events/peacekeepersday/2011/publications/un_rule_of_law_indicators.pdf
Appendix AGPI Methodology1. J. E. Foster , M. McGillivray and S. Seth, 2012, “Rank
Robustness of Composite Indices: Dominance and Ambiguity”, http://www.ophi.org.uk/wp-content/uploads/ophi-wp-26b.pdf
2. Ibid.
114

Data SourcesArms Trade Treaty, ‘ATT Baseline Assessment Project’, 2014, accessed 1 April 2016, http://www.armstrade.info/about-us/
Chantrill, C. ‘US Government Spending’, 2016, accessed 15 April 2016, http://www.usgovernmentspending.com/download.php
Chantrill, C. ‘UK Public Spending’, 2016, accessed 15 April 2016, http://www.ukpublicspending.co.uk/download_single_year
Center for Systematic Peace, ‘Integrated Network for Societal Conflict Research’, 2015, accessed 12 May 2016, http://www.systemicpeace.org/inscrdata.html
Centre for Research on the Epidemiology of Disasters, ‘International Disaster Database’, 2015, accessed 1 April 2016, http://www.emdat.be/
Department of State, ‘Trafficking In Persons Report’, July 2015, accessed 1 April 2016, http://www.state.gov/documents/organization/245365.pdf
Gallup, ‘World Poll’, 2015, accessed 1 April 2016, http://www.gallup.com/services/170945/world-poll.aspx
Gibney, M., L. Cornett, R. Wood, P. Haschke, and D. Arnon, ‘The Polit¬ic¬al Terror Scale 1976-2015’, 2015, accessed 1 April 2016, http://www.politicalterrorscale.org/
https://data.oecd.org/gga/central-government-spending.htm
Institute for Criminal Policy Research, ‘World Prison Brief ’, 2015, accessed 1 April 2016, http://www.prisonstudies.org/world-prison-brief
International Displacement Monitoring Centre, ‘Global Internal Displacement Database’, 2015, accessed 1 April 2016, http://www.internal-displacement.org/
International Finance Corporation, ‘Illicit Financial Flows’, 2015, accessed 1 April 2016, http://www.ifc.org/
International Institute for Strategic Studies, ‘Armed Conflict Database’, 2015, accessed 1 April 2016, https://acd.iiss.org/
International Institute for Strategic Studies, ‘The Military Balance’, 2015, accessed 1 April 2016, https://www.iiss.org/en/publications/military-s-balance
International Monetary Fund, ‘Government Expenditure data’, accessed on 30 April 2016, http://data.imf.org/?sk=5804C5E1-0502-4672-BDCD-671BCDC565A9
National Consortium for the Study of Terrorism and Responses to Terrorism, ‘Global Terrorism Database’, 2015, accessed 1 April 2016, https://www.start.umd.edu/gtd/
Nzapayeke, A., ‘New CAR PM says ending atrocities is priority’, 2014, accessed 12 May 2016, http://www.aljazeera.com/news/africa/2014/01/new-car-pm-says-ending-atrocities-priority-2014126124325498176.html
Organisation for Economic Cooperation and Development, ‘Central Government Expenditure’, accessed 30 April 2016,
Organisation for Economic Co-Operation and Development, ‘Creditor Reporting System’, 2015, accessed 13 May 2016, https://stats.oecd.org/Index.aspx?DataSetCode=CRS1
Organisation for Economic Co-Operation and Development, ‘Development Assistance Committee’, 2015, accessed 13 May 2016, http://www.oecd.org/development/stats/
Peace Research Institute Oslo, ‘Battle Deaths Dataset v.3’, 2009, accessed 1 April 2016, https://www.prio.org/Data/Armed-Conflict/Battle-Deaths/
Public Expenditure and Financial Accountability Program, ‘Assessment Portal Data’, 2015, accessed 1 April 2016, http://www.pefa.org/en/assessment_search
Reinhart C. M., Rogoff K. S., ‘This Time is Different: Eight Centuries of Financial Folly’, Princeton: Princeton University Press, 2009, accessed 12 May 2016, http://www.reinhartandrogoff.com/
Reporters Without Borders, ‘World Press Freedom Index’, 2015, accessed 1 April 2016, https://rsf.org/en/ranking
Stockholm International Peace Research Institute, ‘Arms Transfer Database’, 2015, accessed 1 April 2016, http://www.sipri.org/databases/armstransfers
The World Bank, ‘Millennium Development Goals Progress Status’, 2015, accessed 1 April 2016, http://data.worldbank.org/mdgs
Tir, J., P. Schafer, P. Diehl, and G. Goertz. 1998. Correlates of War, Territorial Change (v5), “Territorial Changes, 1816-1996: Procedures and Data”, Conflict Management and Peace Science 16:89-97
Transparency International, “Global Corruption Barometer’, 2015, accessed 1 April 2016, http://www.transparency.org/research/gcb/overview
United Nations Children’s Emergency Fund, ‘Multiple Indicator Cluster Surveys’, 2015, accessed 1 April 2016, http://mics.unicef.org/
United Nations Office for Disarmament Affairs, ‘Register of Conventional Arms’, 2015, accessed 1 April 2016, https://www.un.org/disarmament/convarms/Register/
REFERENCES
115GLOBAL PEACE INDEX 2016 | Appendices

United Nations Office on Drugs and Crime, “United Nations Surveys on Crime Trends and the Operations of Criminal Justice Systems (UN-CTS)”, 2015, accessed 1 April 2016, https://www.unodc.org/unodc/en/data-and-analysis/United-Nations-Surveys-on-Crime-Trends-and-the-Operations-of-Criminal-Justice-Systems.html
United Nations Refugee Agency, ‘Mid-Tear Trends 2015’, 2015, accessed 1 April 2016, http://www.unhcr.org/56701b969.html
United Nations, ‘Committee on Contributions’, 2015, accessed 1 April 2016, http://www.un.org/en/ga/contributions/
United States Agency of International Development, ‘Demographic and Health Surveys’, 2015, accessed 1 April 2016, http://dhsprogram.com/data/
Uppsala Conflict Data Program, ‘Battle-Related Deaths Dataset v.5-2015’, 2015, accessed 1 April 2016, http://www.ucdp.uu.se/
Uppsala Conflict Data Program/Peace Research Institute Oslo, ‘Armed Conflict Dataset v.4-2015’, 2015, accessed 1 April 2016, http://www.pcr.uu.se/research/ucdp/datasets/ucdp_prio_armed_conflict_dataset/
Walk Free, ‘Global Slavery Index’, 2014, accessed 1 April 2016, http://www.globalslaveryindex.org/
World Values Survey, ‘Wave 6’, 2015, accessed 1 April 2016, http://www.worldvaluessurvey.org/WVSContents.jsp
Youth Policy Labs, ‘National Youth Policy Overview’, 2015, accessed 1 April 2016, http://www.youthpolicy.org/nationalyouthpolicies/
Works CitedBarnes, C. 2006. Agents for Change: Civil Society Roles in Preventing War & Building Peace. Global Partnership for the Prevention of Armed Violence. Issue Paper 2. The Hague: September.
Brauer, J., and Marlin, J.T., ‘Nonkilling Economics: Calculating the size of peace gross world product’, Toward a Nonkillin paradigm, Honolulu, Centre for Global Nonkilling, 2009, p. 125-148.
Centre for Research on the Epidemiology of Disasters, ‘frequently asked questions’, 2015, http://www.emdat.be/frequently-asked-questions
Collier, P., ‘On the economic consequences of civil war.’, Oxford economic papers, 51(1), 168-183, 1999.
Coppola, D., ‘Introduction to International Disaster Management’, 2007, Oxford: Elsevier, p. 25.
Institute for Economics and Peace, ‘Peace and Corruption’, 2015, http://economicsandpeace.org/wp-content/uploads/2015/06/Peace-and-Corruption.pdf
International Alert, ‘Peace through Prosperity: Integrating peacebuilding into economic development’, 2015, accessed 13 May 2016, http://www.international-alert.org/sites/default/files/Economy_PeaceThroughProsperity_EN_2015.pdf
Foster, J. E., M. McGillivray and S. Seth, ‘Rank Robustness of Composite Indices: Dominance and Ambiguity’, 2012, accessed 12 May 2016,http://www.ophi.org.uk/wp-content/uploads/ophi-wp-26b.pdf
Londoño, J. L., and Guerrero, R., ‘Violencia en América Latina: epidemiología y costos.’ Asalto al desarrollo. Violencia en América Latina, 2000: 11-57.
Macy, J., ‘Mutual Causality in Buddhism and General Systems Theory The Dharma of Natural Systems’, 2010, State University of New York Press, New York.
Nzapayeke, A, ‘New CAR PM says ending atrocities is priority’, 2014, accessed 12 May 2016, http://www.aljazeera.com/news/africa/2014/01/new-car-pm-says-ending-atrocities-priority-2014126124325498176.html
Rummel, R.J., ‘Vol. 5: The Just Peace. Understanding Conflict and War’ 1981, Beverly Hills, CA: Sage Publications, accessed 12 May 2016, http://www.hawaii.edu/powerkills/NOTE14.HTM#FULL
Sandler, T., and Justin, G, ‘Military Expenditure Trends for 1960–2014 and What They Reveal.’ Global Policy,2016.
Sgueo, G., ‘Counter-Terrorism Funding in the EU Budget.’, European Parliamentary Research Service, June, 2015
Spencer, R, ‘Isil carried out massacres and mass sexual enslavement of Yazidis, UN confirms, 2014, accessed 12 May 2016, http://www.telegraph.co.uk/news/worldnews/islamic-state/11160906/Isil-carried-out-massacres-and-mass-sexual-enslavement-of-Yazidis-UN-confirms.html
Stockholm International Peace Research Institute, ‘SIPRI Fact Sheet Trends In World Military Expenditure, 2014 and 2015, accessed 02 May 2016, http://books.sipri.org/files/FS/SIPRIFS1604.pdf
United Nations Conference on Trade and Development, ‘Global investment report’, 2015, accessed 13 May 2016, http://unctad.org/en/PublicationsLibrary/wir2015_en.pdf
United Nations, ‘The Millennium Development Goals Report 2015’, 2015 http://www.un.org/millenniumgoals/2015_MDG_Report/pdf/MDG%202015%20rev%20(July%201).pdf
United Nations, ‘UN Rule of Law Indicators’, 2011, http://www.un.org/en/events/peacekeepersday/2011/publications/un_rule_of_law_indicators.pdf
United States Institute of Peace, ‘Crime, Politics and Violence in Post-Earthquake Haiti, 2010, http://www.usip.org/sites/default/files/PB%2058%20-%20Crime%20Politics%20and%20Violence%20in%20Post-Earthquake%20Haiti.pdf
World Bank, ‘Lebanon - Economic and social impact assessment of the Syrian conflict.’, 2013, accessed 13 May 2016, http://documents.worldbank.org/curated/en/2013/09/18292074/lebanon-economic-social-impact-assessment-syrian-conflict
World Trade Organisation, ‘International Trade Statistics’, 2015, accessed 9 May 2016, https://www.wto.org/english/res_e/statis_e/its2015_e/its2015_e.pdf
116
AVAILABLE FOR DOWNLOAD AT WWW.ECONOMICSANDPEACE.ORG
Other publications from the Institute for Economics and Peace
2012 United States Peace IndexInstitute for Economics and Peace, Apr 2012
The 2012 United States Peace Index has found that
the U.S. is more peaceful now than at any other time
over the last twenty years.
2013 United Kingdom Peace IndexInstitute for Economics and Peace, Apr 2013
The UK Peace Index report analyses the fabric of
peace in the UK over the last decade and has found
that since 2003 the UK has become more peaceful.
Pillars of PeaceInstitute for Economics and Peace, Sept 2013
Pillars of Peace is a new conceptual framework for
understanding and describing the factors that create
a peaceful society.
The Economic Cost of Violence ContainmentInstitute for Economics and Peace, Feb 2014
A new methodology that calculates the cost of preventing
and containing violence in over 150 countries.
2014 Global Peace IndexInstitute for Economics and Peace, Feb 2014
The 2014 GPI Report analyses the state of peace
around the world and identifies countries most at risk
of becoming less peaceful.
A GLOBAL STATISTICAL ANALYSIS ON THE EMPIRICAL LINK BETWEEN PEACE AND RELIGION
The Link between Peace and ReligionInstitute for Economics and Peace, Oct 2014
A global statistical analysis on the empirical link
between peace and religion.
2015 Global Peace IndexInstitute for Economics and Peace, June 2015
A statistical analysis of the state of peace in
162 countries and an assessment of the attitudes,
structures and institutions that sustain peaceful
societies.
2015 Positive Peace ReportInstitute for Economics and Peace, Oct 2015
This report introduces new thinking and evidence
about Positive Peace. It includes the Positive Peace
Index, which measures Positive Peace in 162 countries,
covering 99 per cent of the world’s population.
CONCEPTUALISING AND MEASURING THE ATTITUDES, INSTITUTIONS AND STRUCTURES
THAT BUILD A MORE PEACEFUL SOCIETY
2015 Global Terrorism IndexInstitute for Economics and Peace, Nov 2015
The 2015 Global Terrorism Index Report analyses the
impact of terrorism in 162 countries and identifies the
social, economic and political factors associated with it.MEASURING AND UNDERSTANDING THE IMPACT OF TERRORISM
2014
MEASURING AND UNDERSTANDING THE IMPACT OF TERRORISM
2014 Global Terrorism Index ReportInstitute for Economics and Peace, Nov 2014
The 2014 Global Terrorism Index Report analyses the
impact of terrorism in 162 countries and identifies the
social, economic and political factors associated with it.
2016 Mexico Peace IndexInstitute for Economics and Peace, Apr 2016
The 2016 Mexico Peace Index analyses Mexico’s progress
in improving peacefulness from the height of the drug war
through 2015.
2015 Mexico Peace IndexInstitute for Economics and Peace, Mar 2014
The Mexico Peace Index measures the state of peace in all
32 Mexican states analysing trends and drivers of peace
over the last decade.
Peace and CorruptionInstitute for Economics and Peace, May 2015
The relationship between peace and corruption is
statistically significant, as corruption is a leading
indicator of peace.LOWERING CORRUPTION
— A TRANSFORMATIVE FACTOR FOR PEACE
GlobalPeaceIndex
Radical RealismInstitute for Economics and Peace, Sept 2015
Twelve interviews with peacebuilders on developing the
attitudes, institutions and structures of Positive Peace
in Mexico.
12 ENTREVISTAS CON CONSTRUCTORES DE PAZ

JUNE 2016 / IEP REPORT 39
9 780994 603401 >
ISBN 978-0-9946034-0-1
IEP is an independent, non-partisan, non-profit think tank dedicated to shifting the world’s focus to peace as a positive, achievable, and tangible measure of human well-being and progress.
IEP has offices in Sydney, New York, Brussels and Mexico City. It works with a wide range of partners internationally and collaborates with intergovernmental organizations on measuring and communicating the economic value of peace.


