Embed Size (px)
Citation preview

1 Preface
Portland Water District
Administrative Office
225 Douglass Street
Portland, ME 04101
Board of Trustees
Guy H. Cote, Jr.
President Representing Westbrook
Louise G. Douglas
Vice President Representing Raymond/Windham
Matthew Beck Seth Garrison Kenneth L. Levinsky Cape Elizabeth/South Portland Scarborough Portland
Gary W. Libby William M. Lunt III Kim Rich Portland Cumberland/Falmouth Portland
Joseph Siviski Jamie Willey Cape Elizabeth/South Portland Portland
Carrie Lewis
General Manager
David M. Kane Treasurer

2 Preface
Table of Contents Preface Cover Page…………………………………………………………………………………………………………. 1
Table of Contents……………………………………………………………………………………………….. 2 Portland Water District Budget Reader’s Guide…………………………………………………… 5
Overview of the Water and Wastewater System …................................................. 6 Letter from the General Manager……………………………………………………………………….. 7 Community Connections…………………………………………………………………………………….. 12
Introduction Introduction and Service Territory……………………………………………………………………….. 13 History………………………………………………………………………………………………………………….. 14 Top Reasons to Choose Portland, Maine Now…………………………………………………….. 15 The Regulatory Environment in Which We Function……………………………………………. 16
Water Rate Change Process…………………………………………………………………………………. 18 Organization Structure……………………………………………………………………………………….… 19
Annual Planning and Budget Process…………………………………………………………………… 20 Planning/Budget Process Calendar………………………………………………………………………. 21 Mission Statement……………………………………………………………….……………………………… 22 Strategic Goals………………………………………………………….…………………………….…………… 23 Board Established Guidelines…………………………………………………………………….………… 29
Employees Suggested Action Items…………….………………………………………….……………. 31 External Factors Impacting the Budget……….………………………………………….……………. 33
Significant Budget Uncertainties…………………………………..………………………….…………. 34 Major Policy and Resource Allocation Decisions………………………..…………….…………. 35 Operating Budget Summary…………………………………………………………………….………….. 37 Capital Budget Summary……………………………………………………………………….…………….. 38 Combined Water and Wastewater Operating Funds…………………………..….…………… 39 Combined Operating, Capital and Grant Funds…………………………………….……………… 40 Land Fund…………………………..….………………………………………………………………………….. 41
GFOA Budget Presentation Award……………………………………………………….……………… 42
Budget by Fund Introduction……………………………………………………………………………………………..…………. 43 Relation of Functional Units (Departments) to Funds………………………………………….. 44 2019 Operating Budget by Fund Summary………………………………………………………….. 45 Water Fund………………………………………………………………………………………………………….. 46 Cape Elizabeth Wastewater Fund………………………………………………………………………… 56 Cumberland Wastewater Fund……………………………………………………………………………. 66 Gorham Wastewater Fund…………………………………………………………………………………... 76 Portland Wastewater Fund………………………………………………………………………………….. 88
Westbrook Wastewater Fund……………………………………………………………………………... 98 Windham Wastewater Fund………………………………………………………………………………… 109 Falmouth Assessment and Contracted Billing Services……………………………….……….. 119

3 Preface
Revenue Introduction…………………………………………………………………………………………………………… 121 Water Sales…….……………………………………………………………………………………………………… 122 Water Sales Cost of Service Study.………………...……………………………………………………… 123 Water Sales Metered Revenue……………………...……………………………………………………… 124 Water Sales Metered Revenue, Consumption..…………………………………………………….. 125 Water Sales Metered Revenue, Rates.…………………………………………………………………. 131 Water Sales Non-Metered Revenue…….………………………………………………………………. 135 Water Sales Long-Term Considerations……………………………………………………………….. 136 Wastewater Assessment & Contracted Billing Income…..…………………………………….. 138 Wastewater Assessments Revenue Trend…..……………………………………………………….. 139 Current Municipal Wastewater Rates………………………………………………………………….. 140 Interest Income…..………………………………………………………………………………………………. 141 Other Income…..………………………………………………………………………………………………….. 142 Fund Balance……………………………………………………………………………………………………….. 143 Fee Schedule for Non-Tariff Services…………………………………………………………………… 144
Departmental Expense Introduction and Financial Summary by Category and Department…………………….. 145 Departmental Expense by Category……………………………………………………………………… 146 Salaries/Wages……………………………………………………………………………………….. 146 Employee Benefits and Biosolids Disposal……………………………………………….. 147 Chemicals………………………………………………………………………………………………… 148 Contracted Services………………………………………………………………………………… 149 Deferred Cost Write-off………………………………………………………………………….. 150 Heat/Fuel Oil and Insurance……………………………………………………………………. 151 Materials & Supplies………………………………………………………………………………… 152 Other Expense…………………………………………………………………………………………. 153 Purchased Power…………………………………………………………………………………….. 154 Regulatory/Taxes and Telephone/Other Utilities and Transportation……… 155 Departmental Expense by Department………………………………………………………………… 156 Water Services….…………………………………………………………………………………….. 156 Wastewater Services….…………………………………………………………………………… 176 Environmental Services……………………………………………………………………………. 194 Engineering Services………………………………………………………………………………… 214 Administrative Services……………………………………………………………………………. 227 Non-Departmental…………………………………………………………………………………… 245
Green Bonds Issued in 2019………...………………………………………………………….. 246
Human Resources Introduction………………………………………………………………………………………………………….. 247 Salary Costs…………………………………………………………………………………………………………… 248 Labor Hours/Average Pay Rates……………………………………………………………………………. 249 Employee Benefits……………………………………………………………………………………………….. 250 Authorized Head Count…………………………………………………………………………………….. 253

4 Preface
Human Resources (continued) Non-Union Positions…………………………………………………………………………………………….. 254 Union Positions……………………………………………………………………………………………………… 255 Temporary and Non-Benefit Employees……………………………………………………………….. 256 Work Force Management……………………………………………………………………………………… 258 PWD Professional Representation…………………………………………………………………………. 261 Employee Events………………………………………………………………………………………………….. 262
Capital Finance Introduction and Annual Fund Operating Budget………………………………………………… 263 Bond Financing…………………………………………………………………………………………………….. 264 Water and Wastewater Funds Debt Service…………………………………………………………. 267 Debt Service Summary…………………………………………………………………………………………. 269 Projected Water Debt……………….…………………………………………………………………………. 270 Outstanding Debt by Fund Trends……………………………………………………………………….. 271
Water and Wastewater Debt….……………………………………………………………………………. 272 Capital Reserve……………...……………………………………………………………………………………. 279 Renewal & Replacement..……………………………………………………………………………………. 280 Water Fund – Renewal and Replacement Fund……………………………………………………. 281
Wastewater Fund – Renewal and Replacement Fund………………………………………….. 282
Capital Expenditures Introduction…………………………………………………………………………………………………………. 283 Capital Improvement Program Process………………………………………………………………… 284 Program Summary and Board of Trustee Orders………………………………………………….. 285 Program Summary by Fund ………………..………………………………………………………………. 286 Financing Summary……………………………………………………………………………………………… 287
Capital Improvement Program – Five Year Plan……………………………………………………. 288 CIP Operating Fund Summary Impact…………………………..………………………………………. 289
Project Details………………………………………………………………………………………………………. 290
Financial Policies Introduction…………………………………………………………………………………………………………. 359 Significant Financial Policies…………………………………………………………………………………. 359 Cost Allocation Policy Detail…………………………………………………………………………………. 365
Appendix
Introduction……………………………….……………………………………………………………………….. 377 2021-2025 Financial Forecast………………………………………………………………………………. 378 Maine Measures of Growth 2019 Scorecard……………………………………………………….. 394 Water Benchmark Data………………………………………………………………………………………... 396 Portland Water District Rate Sheet Summary..……………………………………………….……. 398 Customer Satisfaction Survey Results…………………………………………………………….……. 399
Board of Trustees Orders and Resolutions…………………………………………………….…….. 400 Glossary/Acronyms……………………………………………………………………………………………… 407

5 Preface
Portland Water District Budget – Reader’s Guide Welcome to the Portland Water District’s 2020 Budget document. This document is intended to provide practical and pertinent information about the Portland Water District’s (PWD’s) financial planning, policies, goals and priorities for 2020 and beyond. The book holds a wealth of information including how water and wastewater revenues are used to support infrastructure and fund future years’ development. This Budget is a Policy Document. It describes financial and operating policies, goals, and priorities for every fund and department of PWD for the coming year and for our 5-year planning horizon. Our Mission Statement, Strategic Goals, and Board Established Guidelines are found in the Introduction section. Significant Financial Policies are described in the section with that title. This Budget is a Financial Plan. It describes the costs of the services provided by PWD and how they are funded. The Revenue section presents the projected revenues from water sales, wastewater assessments, interest and other income. The Departmental Expense section details expenditures by category and also by department for the Water Operations, Wastewater Operations, Environmental Services, Engineering Services and Administrative Services Departments. The Capital Expenditures section presents details of major projects planned for 2020 and projected projects through 2024. The multi-year financial plan is included in the Appendix. This Budget is a Means of Communication. This budget is an easy-to-read document with summary information in charts and graphs that complement the details in the text. The Letter from the General Manager and Treasurer presents an organizational and financial overview of PWD. The budget for each fund- one water fund and six wastewater funds, one for each community served- is described in detail. Supporting information about the Portland economy, water benchmarks and results of the 2017 Customer Satisfaction Survey are included in the Appendix. This Budget is an Operations Guide. It shows each Department’s organizational chart and budget overview, followed by a detailed budget which includes goals, performance benchmarks and accomplishments for each. Current year projects and initiatives are described in detail. Following the operating budgets are sections for Human Resources, Capital Finance and Financial Policies.

6 Preface
Overview of the Water and Wastewater System The diagram provides a schematic of the District system with common infrastructure terms.

7 Preface
Portland Water District
F r o m S e b a g o L a k e T o C a s c o B a y
October 29, 2019
To the Members of the Board of Trustees,
On behalf of the entire Management Team, we are pleased to submit for your consideration the Portland Water District’s Comprehensive Annual Budget Proposal for 2020. The document is designed to present the comprehensive financial framework for all District activities for the budget year. As you consider the budget for our upcoming 112th year, please reflect on our accomplishments, present challenges and opportunities, and future aspirations. Our dedicated staff of 182 employees works every day to ensure that clean and healthy tap water is delivered to the 210,000 inhabitants of Greater Portland, that adequate water is available for fire protection, and that wastewater is treated to remove pollution and protect the environment. Water Services Water Services ensures that safe, clean and healthy drinking water is delivered throughout the 11 communities in our water service area. It all starts at the Sebago Lake. Because of the excellent raw water quality and strong watershed protection program, the District was granted a waiver from filtration by the Environmental Protection Agency. The District’s continued compliance with the terms of this waiver saves ratepayers the significant costs of financing, constructing and operating a filtration plant. At the Sebago Lake Water Treatment Facility (SLWTF), over 22 million gallons of water are treated each day using the powerful disinfectants of ozone and ultraviolet light. After treatment, drinking water is distributed through a system of 1,000 miles of water mains, three major pump stations, and ten storage facilities. Infrastructure age, cold winter temperatures, and the underground location of many of our assets challenge staff to operate and maintain the system with minimal disruption. Since 2010, we have invested over $51 million in water main renewal. In 2020, initiatives include utilizing the standby generator with newly upgraded emissions system to “peak shave” at SLWTF, purchase a larger vacuum excavator to accomplish digging jobs more quickly and with less pavement restoration required, and on-site testing runs of the new portable pumper to ensure it is ready to provide emergency service. A staff of 56 and a proposed operating budget of $9.2 million and capital budget of $10.9 million supports these activities. Wastewater Services Wastewater treatment is a vital community service that protects public health and the environment. Four wastewater treatment plants operated by the District remove, on average, nearly 95% of the

8 Preface
pollution from the 21 million gallons of wastewater that is received at the plants daily from the six communities served. The clean water is safely released into the aquatic environment and much of the biosolids that remain are converted into compost and energy. Staff manages the collection system consisting of 118 miles of pipe and 76 pump stations that convey wastewater to the plants. In 2020, initiatives include continued effort on nutrient optimization, the transition to UV disinfection at Cape Elizabeth, and participating in finalizing the City of Portland’s Integrated Planning effort. A staff of 39 and operating and capital proposed budgets of $10.1 million and $17.2 million, respectively, support these activities. Engineering Services The Engineering Services Department provides engineering and maintenance services to internal customers (Water, Wastewater and Administrative Departments) and collaborates with external customers, including communities and developers. They oversee design and construction of water and sewer infrastructure, support long range planning, operate and maintain facilities, and support instrumentation. These functions are carried out with an asset management approach to infrastructure acquisition and maintenance. In 2020, Engineering Services efforts include implementing the first phase of the Computerized Maintenance Management System upgrade project, management of $7.0 million of water main replacements (of which $500,000 has been set aside for small mains), supporting design and construction of Maine Turnpike infrastructure crossings and major capital projects including the design of the Windham Water Storage Tank, start-up of the Cape Elizabeth Wastewater Treatment Facility UV Treatment installation and design and construction of wastewater pump stations. A staff of 31 and a proposed budget of $4.3 million support these activities. Environmental Services The District’s Environmental Services Section of the Engineering Services Department monitors and protects water quality from watershed to tap and wastewater from collection to discharge. The Water Resources Group champions the protection of Sebago Lake through source protection, environmental education and outreach, and security. The Laboratory Services Group provides certified analytical testing and operational support to water and wastewater treatment plants and oversees the Industrial Pretreatment Program. In 2020, Environmental Services initiatives include re-accrediting laboratory testing methods for all reportable parameters, renewing expiring Industrial Pretreatment permit (44% of which will expire in 2020), full compliance with Risk and Resiliency Assessment and Emergency Response Plan components of America’s Water Infrastructure Act, collaborating with partners in source protection and environmental education and outreach. A staff of 16 and proposed budget of $2.1 million support these activities. Administrative Services and Employee Services Departments The Administrative and Employee Services Departments support the Engineering, Water and Wastewater Services Departments. In addition, Corporate Counsel and the Public Relations Manager stand ready to serve the District and our customers. Within the Administrative Services Department, the Information Services group provides computer system and technology oversight and maintenance. Financial Services provides purchasing, payroll and financial transaction processing and the Customer

9 Preface
Service Group maintains a call center and provides billing services. The Employee Services Department handles employee recruitment and development, benefits administration and safety. In 2020, Administrative Services will focus on maintaining current service levels while playing a major role in the design and start-up of the new billing and customer relationship system. Customer Service will emphasize training, documentation and procedures for the new system. Information Services will focus on the infrastructure needed for the new systems to perform well, including expanding Wi-Fi networks. Financial Services will ensure that payroll, billing, inventory and transportation data will be available in the financial software system. In 2020, Employee Services will complete a non-union market survey, implement revisions to the non-union planning and performance evaluation process, and will continue to promote safety, supervisory workshops and reviewing and updating policies. A staff of 44 and a proposed budget of $6.1 million support these activities. Financial Overview The proposed budget for 2020 recommends $47.5 million for operations and $28.1 million for the first
year of a five-year Capital Improvement Plan. The operating budget consists of three major expense
categories – salaries/benefits (37%), capital finance (34%) and all other materials and services (29%).
Salaries reflects an increase of 4 in the number of employees, 186, and a wage adjustment of 3.0%
($642,000). Benefit costs increased $57,000, primarily due to higher pension costs. Capital financing
costs are $0.8 million higher primarily due to debt service on bonds issued to finance water main
renewals and upgrades at the Cape Elizabeth and Westbrook wastewater treatment plants. Total other
expenses increased $512,600, or 3.9%, from the prior year.
The significant changes in specific other expense line items include:
Higher electricity costs ($179,000) reflecting a increase in Central Maine Power delivery and Constellation energy charges
Higher chemical costs ($72,000) due to expected price increases, and
Higher biosolids disposal costs ($47,000) reflecting higher volume of material being generated by the wastewater plants and additional surcharge added by the disposal company to reflect industry concerns related to PFAS,
$17.0 $17.7
$15.5 $16.3
$13.0 $13.5
$0
$5
$10
$15
$20
$25
$30
$35
$40
$45
$50
2019 2019
Operating Budget(millions)
Salaries/Benefits Capital Finance Other

10 Preface
The $9.5 million water capital budget includes
$7.0 million replacing aging water mains and
$1.0 million transmission line improvement in
the 407 Zone.
The $17.2 million wastewater capital budget
includes $11.3 million of upgrade at the
Westbrook treatment plant, $1.8 million
upgrade of the electrical system at Portland’s
East End treatment plant and $2.0 million
upgrade of the Baxter Boulevard pump station
in Portland.
Additionally, the capital budget includes an investment of $1.4 million in general assets such as vehicles,
computer system and Douglass Street main office.
BUDGET HIGHLIGHTS NEW INITIATIVES
Investing $7.0 million in water main renewal; including $2.0
million through capital reserve fund
Upgrades to the Portland's East End and Westbrook Regional
Wastewater Treatment Plants ($13.8 million)
Implementation of new Asset Management and Customer Billing system with a scheduled live date of October 2020.
BUDGET SUMMARY
The Operating Budget is proposed to be $47.5 million, an increase of $1.9 million or 4.3%.
Total Revenues are projected at $47.5 million, which assumes a 3.5% water rate increase and
wastewater assessments that meet the municipalities’ expectations, except for
Cumberland..
The Capital Budget is proposed at $28.1 million. It continues commitment to invest in
water mains and wastewater facilities renovations.
Full-time positions increase to 186.
The proposed budget continues funding to
implement technology solutions for knowledge management, continues to invest in staff training, and provides incentives for
multi-skill development.
CHALLENGES AND ISSUES Nutrient optimization approach to manage nitrogen at wastewater facilities Aging infrastructure requires asset replacement Recruiting and retaining new employees and training existing employees to adjust to needed workforce skills Stronger regional economic growth should in time improve revenue growth from new customers.
$9.5
$17.2
$1.4
Capital Budget(millions)
Water Systems
Wastewater Systems
General Assets

11 Preface
Customer Impact
The proposed budget assumes a 3.5% rate adjustment effective May 1, 2020 The increase is consistent
with the Board’s intent to adopt gradual, annual water rate adjustments annually. For a typical
customer, the impact is $8.64 a year or $0.72 a month. Of the 3.5% rate adjustment, 2.5% will be used
for general operation and 1% will be dedicated to fund the capital reserve account that will support a $2
million bond issue dedicated to main renewal replacements.
Assessments to wastewater communities meet or are lower than municipal expectations, except in
Cumberland. The Assessment for Cumberland increased by 6.6%, which was higher than expected due
to the higher costs from the town of Falmouth for treatment services and additional staff time planned.
Cape Elizabeth’s, Gorham’s, Portland’s, Westbrook’s and Windham’s assessments increased by 2.1%,
8.4%, 2.4%, 2.0%, 11.1% and 6.1% respectively. Falmouth’s assessment remained the same as the prior
year.
The 2020 budget guidelines established by the Board of Trustees are mostly met in this budget proposal.
Operating fund expenses are increasing less than 4.4%,
Wastewater assessments meet the municipal expectations, except for the town of Cumberland,
Water rates are affordable and sufficient to meet operational needs,
Full-time positions are optimized to meet the workload, and
Investment in our infrastructure continues as planned.
We strive to successfully execute PWD’s mission statement and meet corporate goals while providing the best value to our ratepayers both today and into the future.
Carrie Lewis David M. Kane
General Manager Treasurer

12 Preface

13 Introduction
Introduction
The Portland Water District (PWD) is a quasi-municipal utility authorized by state charter to provide water service to eleven Greater Portland communities and wastewater treatment and interception services to six of those communities. Water service is provided to 55,400 customers. Sebago Lake provides virtually all the water delivered. A network of 1,000 miles of water mains delivers water from Sebago Lake to customers. The system provides fire protection through 5,100 fire hydrants and 2,300 sprinkler systems. PWD provides additional wastewater-related services through contracts with the communities. Additional services include sewer billing and collector/storm drain system operations. Summary of Wastewater Services Provided:
By Charter: By Contract:
Community Customers Treatment Interceptors Collectors Storm Drains Billing
Cape Elizabeth 2,368 Yes Yes No No YesCumberland 1,185 No Yes Yes No YesFalmouth 1,984 No No No No YesGorham 1,879 Yes Yes Yes No YesPortland 17,136 Yes Yes Peaks Island (only) Peaks Island (only) YesScarborough 405 No No No No YesSouth Portland 7,912 No No No No YesWestbrook 4,697 Yes Yes No No YesWindham 55 Yes Yes Yes No Yes
Service Territory

14 Introduction
History In 1862, a group of citizens foresaw the necessity of improving the Greater Portland water supply to support continued growth. Private wells were no longer sufficient for domestic and fire protection use. This group formed the Portland Water Company. In 1869, the first water flowed from Sebago Lake to Portland, and the first water service was turned on in Portland on Thanksgiving Day. In 1908, the Portland Water District bought the Portland Water Company and the Standish Water and Construction Company, and began serving water to Portland and South Portland. PWD later acquired the Gorham Water Company and the Falmouth Water Company. In the years that followed, Cumberland, Falmouth, Westbrook, Cape Elizabeth, Scarborough, Gorham, and the islands of Casco Bay also began receiving public water from the Portland Water District. During the next 45 years, Greater Portland grew to be the industrial and financial hub of the state. Growth in the Portland area required several upgrades of the Portland Water District’s system, including the construction of water supply systems to serve North Windham, Steep Falls, and Standish. The North Windham system was later decommissioned, partly due to the threat of MtBE contamination. As a logical extension of its role as the regional water supplier, in the 1960s, the Portland Water District offered to handle and treat the region’s wastewater. Since then, PWD constructed treatment plants in Portland (1979), Westbrook (1978), Little Falls (1987), Cape Elizabeth (1987), and Peaks Island (1993). In addition, PWD began providing wastewater maintenance and operating services to the town of Cumberland (1984) and now accepts septage from several Sebago Lake region communities. During the 1990s water utilities around the country faced tighter regulatory requirements, more informed customers who expected a better product, and the emergence of newly detected contaminants and pathogens, which did not exist or were unidentified in years prior. The Portland Water District rose to meet these challenges with a state-of-the-art ozonation facility (built in 1994), a technologically advanced staff with expanded skills, more sampling and monitoring, and an emphasis on honest and ample communication. The decade starting in 2000 also witnessed the aging of PWD’s wastewater treatment facilities and an increased emphasis on odor control. Portland’s East End Wastewater Treatment Facility started undergoing renovations to upgrade the facility and control odors, while a complete evaluation of the Westbrook/Gorham Wastewater Treatment Facility was conducted and upgrades began. Both facilities through the 2010’s continue to address aging equipment with the focus in the next couple of years being the aerations systems. The East End project was completed in 2017. The proposed capital improvement plan includes a $7.9 million Westbrook/Gorham/Windham upgrade in 2020. In 2001, the Town of Raymond became the tenth member of the District; water service in the town began in 2002. A focus on aging water mains began in 2011 when the Board committed to double the main renewal budget by 2016. In 2014, the Board established a capital reserve fund to provide an additional $2 million available for main renewal. A $7.0 million investment in water main replacement is budgeted for 2020. Also, new regulations required a second water treatment process be installed. In 2014, an ultraviolet process was added along the existing ozonation process.

15 Introduction
Top Reasons to Choose Portland, Maine Now
Portland is Maine's business, financial and retail capital and the largest city in the state. Seascapes and cityscapes blend harmoniously in Portland, perched on a peninsula, jutting out into island-studded Casco Bay. The metropolitan hub of Maine's south coast region, Portland is a progressive, lively city incorporating the character of yesteryear into a modern urban environment. Historic architecture blends gracefully with the new as you stroll along her working waterfront or the cobblestone streets of the restored Old Port section of the city. With a metro population of 210,000, the Greater Portland area is home to almost one quarter of Maine's total population. High quality water delivered to homeowners/businesses and cleaned wastewater delivered back to the environment are a key expectation of our customers. Being a desirable place to visit during the summer contributes to variance in water consumption by almost 40% between winter and summer months. With a high concern for the environment, customers support our efforts to protect our watershed and realize the importance of wastewater treatment in protecting our coastal waters.
Portland: Yes. Life's good here.TM
South Portland lands on Money magazine’s list of 100 Best Places to Live in U.S. for 2017 9/2017
Portland was named 2014's 19th Most Educated Metro Area in a recent study from the personal finance outlet WalletHub.com.
Portland Named One of America’s Most Learned Cities Back-to-School Report gives high ranks for Portland’s educated residents.
CardHub released its Back-to-School Report, which identifies cities and states with the best learning environments for children. The report listed Portland, Maine is one of twenty cities in the country that had the most
highly educated citizens. 9/4/2013
Parenting Magazine named the City of Portland the 3rd Best City in the U.S. for Families. Citing the city’s low crime, quality education, and active family living, the magazine described Portland as a “tranquil, kid-friendly
city to call home.” 7/17/ 2012
Concerned About the Environment
Portland Ranked Seventh “Greenest City” in the United States, according
to the readers of Travel & Leisure Magazine. 4/4/2012
Women’s Health Magazine ranks Portland #10 - reflecting efforts to make it easy to live healthy active
lives in Maine’s largest city.01/18/2013
Great Place to VisitWhen it comes to being a food-lovers’ city, Portland is no longer a small side dish – it’s the main course. Bon Appetit magazine has chosen Portland, Maine, as its “City of the Year,” calling it “one of the most unexpected culinary destinations in the country.” 9/2018
Portland, Maine is 2018 Resteaurant City of the Year, Bon Appetit magazine. August 2018
In total, Portland officials expect cruise ships will bring as many as 172,184 passengers this year, the majority in September and October, an 82 percent increase over 2015.
Economic Hub of MainePortland was listed as the ninth best city in
America for female entrepreneurs and the fifth best city overall for starting a business by
NerdWallet in 2016.
Forbes Ranks Portland Area in Top 10 for Job Prospects. 3/3/2012
Techie.com Lists Portland, Maine as One of its 10 Most Unexpected Cities for High-Tech Innovation Techie.com asked innovators,
entrepreneurs, and city leaders this question: "What are the most unexpected cities that are
leading the high-tech revolution?" 4/8/2013

16 Introduction
The Regulatory Environment in Which We Function The Portland Water District functions in a highly regulated environment. Its operations are regulated by federal, state, and local governments, and by a variety of government agencies. The laws and regulations created and implemented by these layers of government affect not only the District’s direct operations in a regulatory sense, but its budget as it complies with various government directives. The District’s water operations are governed at the federal level by the Safe Drinking Water Act (SDWA). Originally enacted in 1974, the SDWA allows the Environmental Protection Agency (EPA) to promulgate national primary drinking water regulations to regulate contaminants that may pose health risks and that are likely to be in the public water supply. Under the SDWA, the EPA establishes a maximum contaminant level standard that regulates physical, chemical, biological and radiological substances in the drinking water supply. The best available technology and treatment techniques that are economically and technically feasible must then be used to meet this standard. The SDWA allows the EPA to delegate to states the primary oversight and enforcement of the law ,or primacy, to the state if the state meets certain requirements. The state of Maine has received primacy and its oversight and enforcement program is administered by the Department of Health and Human Services Drinking Water Program. Wastewater regulation falls under the provisions of the federal Clean Water Act (CWA). Passed in 1972, with significant amendments in 1977 when it became known as the CWA, it is implemented and enforced by the EPA and the Army Corp. of Engineers. The CWA establishes the basic structure for regulating pollutants discharging into the waters of the United States. It gives the EPA authority to implement pollution control programs, such as setting wastewater standards for the industry. The CWA makes it unlawful to discharge a pollutant into navigable waters without a permit (National Pollutant Discharge Elimination System Permit (NPDES)). As with the SDWA, the CWA provides that the EPA will create rules to implement the law, and will delegate to the state the administration and enforcement of the law on a day-to-day basis. In Maine, the Department of Environmental Protection (DEP) has been delegated this function, with EPA retaining concurrent authority to take enforcement action. The DEP has more stringent monitoring requirements for biosolids, whole effluent toxicity and mercury than the requirements established by the EPA. The District’s treatment plants must obtain a discharge permit issued by the DEP utilizing those stricter requirements. In addition to the environmental regulations which govern the District’s operations, the District’s water business is also partially regulated by the state Public Utilities Commission under a system of Maine law found in Title 35-A of the Maine Revised Statutes. In 2014, the state legislature passed a bill, An Act to Reform the Regulation of Consumer-Owned Water Utilities (2014 P.L. 2014 chapter 573) which authorized the Commission to grant exemptions of certain portions of Title 35-A. The District filed exemption requests from certain regulations. Effective January 1, 2016, the District is exempt from the Public Utilities Commission regulation related it its water rates and standards of service. Historically, the Public Utilities Commission regulated the District’s water business operations through review and approval of the District’s Terms and Conditions of Service, and established the rates the District charges

17 Introduction
The Regulatory Environment in Which We Function (continued) for its water services rate adjustments, finance transactions and terms & conditions of service; this function is now performed by the District’s elected Board of Trustees. Local government regulations affect the District’s construction activities, as the District must comply with street opening requirements in the municipalities where it conducts construction or repair operations. The annual costs for the District’s wastewater operations are assessed pursuant to the terms of its charter, enacted by the Maine Legislature (Ch. 84, P. & S.L. 1975 as amended through Ch. 18, P. & S.L. 2009). The District’s charter provides that prior to January 15 of each year, the District shall determine the total anticipated amount to be raised from the participating municipalities based on the trustees’ best estimate of the cost to operate the wastewater and sewage systems for the fiscal year. The amount assessed to the municipalities includes: regional costs, financing costs, and operation and maintenance costs. Municipalities are advised of their yearly assessments by the District and establish their respective sewer user rates considering the District’s assessment and the costs of maintaining their respective sewer collection systems. The District’s charter governs the manner of assessing participating municipalities and the treatment of any surplus funds existing at the end of a calendar year.
Water Rate Change Process In 2020, the District’s Board of Trustees will consider a 3.5% rate adjustment. The chart on the next page outlines the process the District will follow in 2020. The District will continue the same Board and public review process and does not require Maine Public Utilities Commission approval. A Public Utilities Commission rule (chapter 675) allowed for the creation of a capital reserve fund starting in 2014. The fund can be used to pay costs related to water infrastructure. For utilities our size, an additional 10% over other costs may be included in justifying proposed water rates. A system infrastructure assessment (SIA) must be submitted prior to getting approval to fund the reserve. The SIA would include the list of infrastructure projects that will be funded from the reserve. Annual updates of the status of the projects and reserve fund balances are required. The District filed the SIA in October 2013 and has incorporated funding the reserve by designating 1% of the proposed 3.5% rate adjustment for the reserve.
Act to Reform Regulation of Consumer-Owned Water Utilities In 2014, a state law was enacted allowing the State Public Utilities Commission to exempt certain individual utilities from state regulation, if requested by the utility, or classes of utilities (PUC Rule 6114). The District filed for exemptions from certain state regulations and the ability to implement local review and rules. The changes include allowing water rate changes and bond issuance authorizations to be approved solely by the District’s publicly elected officials without state commission review. The exemption request was approved and became effective January 1, 2016.

18 Introduction
Water Rate Case Process
The proposed schedule to implement the next year’s rate adjustment is as follows:
November 25, 2019 Board approves 2020 Budget.
January 13, 2020 Administration and Finance Committee reviews and makes final
recommendation to be sent to customers. Finance staff will provide up-
to-date financial information and revenue projections.
January 27, 2020 Board considers approving Administration and Finance Committee’s
recommendation.
February 10, 2020 Supporting documentation for rate adjustment is available to the Public
February 24, 2020 Publish notice of rate adjustment and provide notice to all customers.
Notice is mailed to all customers and includes an invitation to attend the
public hearing.
March 9, 2020 Special public hearing on proposed rate adjustment. General Manager
and Treasurer provide information supporting the rate adjustment. Public
has an opportunity to ask questions and provide feedback to the Board as
they consider the proposed rate schedule.
March 23, 2020 Board business meeting – Approve final rate schedule. The final rate
schedule incorporates changes based on the public hearing and Board’s
feedback.
April 24, 2020 File final rate schedule based on public hearing and Board review. Rate
schedule is distributed to Maine Public Utilities Commission for
informational purposes only.
May 1, 2020 Rate adjustment are effective date.

19 Introduction
Organization Structure The Portland Water District is overseen by an 11-person Board that is publically elected. The Board appoints a General Manager, who oversees the daily operation of the District. Operation is comprised of five departments – Water Services, Wastewater Services, Environmental Services, Engineering Services and Administrative Services.
54
38
17
31
42
54
39
16
31
42
56
39
16
31
44
0
10
20
30
40
50
60
Water Wastewater Environmental Engineering Administrative
Authorized Number of Employees
2018 2019 2020
Water Services provides water treatment and distribution system operation and maintenance.
Added Water System and Equipment operators.
Wastewater Services provides wastewater treatment and interception/collector system operation and maintenance services. Added Associate Engineer in 2019.
Environmental Services provides watershed protection and laboratory services. Decreased the number of Environmental Scientist by one in 2019.
Engineering Services provides general engineering, facility and vehicle maintenance services.
Administrative Services provides customer, computer, finance and general management services. Added Employee and Information Services employee.
A more detailed organization chart and description of services provided are located in the Operating Expense section. The Human Resource section provides more details on the proposed number of employees and 2020 changes.
Board of Trustees
General Manager
Water ServicesWastewater
Services
Asset Management &
Planning
Environmental Services
Engineering Services
Administrative Services

20 Introduction
Annual Planning/Budget Process An outcome of the annual planning/budget process is a document that outlines the financial and operational plan for the upcoming fiscal year. The resulting annual operating and capital plan provides an overview of the resources expected to be available and how those resources will be used. Decisions made in developing the annual plan incorporate information from other planning processes and sources including the following:
Other Planning Processes and Information Sources:
Budget Document Location:
Mission Statement and Strategic Goals. At the beginning of the annual budget process, management reviews and updates our mission statement and strategic goals. One focus of the review was to identify how resources allocation decisions should be different.
Introduction Section, Mission Statement and Strategic Goals
Annual Budget Guidelines by Board. Board guidelines were established providing important budget parameters.
Introduction Section, Board Established Annual Budget Guidelines
External Factors. A review of the industry, economic, and stakeholders’ trends provided information to make better planning decisions.
Introduction Section, External Factors Impacting the Budget
Multi-Year Ratemaking Revenue Projections. Water revenues and wastewater assessments projections are made for three years to assist in rate making. The proposed budget is consistent with the projections.
Individual Fund Projection in the Budget by Fund Section. Summary is included in the Appendix.
Capital Master Plans and Asset Evaluations Studies. The proposed budget incorporates recommendations from the various infrastructure plans/studies.
Capital Expenditures Section, Infrastructure and Operational Evaluation Plans
Customer Satisfaction Survey. A review of the customer satisfaction survey’s results provided guidance on how best to allocate resources in the upcoming year.
Appendix Section, Customer Satisfaction Survey
Workforce Management. As part of the review of current employee demographics and future employees’ needs, action steps were identified. The budget incorporates those action steps.
Human Resource Section, Workforce Management
Financial Policies. Financial policies were reviewed to assure budget decisions were made consistent with good financial standards.
Financial Policies Section
Employee Satisfaction Survey/Comments. General Manager’s forum was held to receive input from all employees. A formal survey was conducted in 2018
Human Resource Section, Introduction Section

21 Introduction
Planning/Budget Process Calendar The outline below illustrates the process used to arrive at an adopted budget. The only legal requirement is that wastewater communities must be assessed the budgeted operating budget by January 15th. May 1 Senior Management Team reviews budget process and timeline, stakeholders input, external
factors impacting the budget, major policy and resource allocation issues, significant budget uncertainties, and long-term and short-term goals.
27-31 Senior Managers host meetings with Department Managers to review budget parameters and
process June 17 Department Managers submit first draft Operating Budget and conceptual-level Capital & Non-
capital projects and initiatives 17 Board reviews the Staff’s recommended guidelines and provides policy and high-level direction
for the Budget July 16 Senior Management Team provides feedback on first draft submittal and Board feedback 19 Department Managers submit second draft Operating Budget and preliminary-level Capital &
Non-capital projects and initiatives. Aug 16-20 Department Managers present second draft Operating and Capital budget to the Senior
Management Team. Sep 1 Department Managers submit third draft Operating Budget and Capital & Non-capital projects
and initiatives. Finance and Managers meet to discuss the status of the current year CIP. Oct 28 Budget is presented to the Board of
Trustees. Nov 11 Departments present Operating Budget
and Capital & Non-Capital projects and initiatives to their respective Board Committee. The Full Board reviews the Five-Year Capital Improvement Plan.
25 Board considers adopting budget.
Board Committees’ Department Review Responsibility Administration and Finance – Executive Office, Customer Services, Information Services, Financial Services and Employees Services. Operations – Water Services and Wastewater Services Planning – Environmental Services and Engineering Services
Wastewater Communities: The proposed Wastewater Assessment for each municipality is presented
and reviewed with each municipality at meetings scheduled between October 29 and November 24. By
January 15, 2020, the District notifies each municipality of their certified assessment amount.

22 Introduction
Mission Statement The District’s mission is to protect public health, safety, and the environment by providing our customers with reliable and affordable water, wastewater and related services. In order to fulfill the mission, the following six strategic goals have been established.
Goal 1 - Public Health: The District will provide products and services that meet all federal, state and local quality standards. Goal 2 - Public Safety: The District will design and maintain its water system to meet modern firefighting needs. Goal 3 - Environment: The District will promote the sustainability of natural resources within Casco Bay watershed. Goal 4 - Reliability: The District can be trusted to provide its products and services in a manner that meets all reasonable customer expectations. Goal 5 - Affordability: The District will balance the delivery of products and services with customers’ ability to pay water and wastewater rates and charges. Goal 6 - Employees and Work Environment: The District will have well trained and satisfied employees who will work in a safe and work environment conducive to productive work.
Strategic benchmarks have been created to indicate the District’s performance over the long-term. The impact of variations in benchmarks performance is best understood looking at the long-term trend. Additional background explanations of the strategic goals and benchmarks with the impact to the budget are provided on the next six pages. Annual objectives and tactical benchmarks are established to guide and monitor annual performance towards meeting our strategic goals - see individual departments’ objectives and benchmarks in the Operating Expenses section.

23 Introduction
Strategic Goals
Strategic Goal 1: Public Health The District will provide products and services that meet all federal, state and local quality standards.
Background
The District’s water operations are governed at the federal level by the Safe Drinking Water Act (SDWA). Ensuring compliance with the SDWA requires short- and long-term initiatives aimed at protecting, monitoring, and treating for water quality from the source to the tap. Protecting the source begins with protecting the watershed, and protecting the watershed begins with protecting the forest’s natural ability to produce clean water. Therefore, the District’s approach to protecting public health includes programs aimed at promoting forest conservation, monitoring and inspecting development in the watershed, monitoring the water quality of the lake and its tributaries, providing security of the area around the intakes, and performing education/outreach to keep the public involved in the process.
Strategic Benchmarks (updated periodically):
The District is in compliance with all drinking water regulatory standards. Two key measures are the quality of the source water in Sebago Lake and the ability to maintain an adequate level of disinfectant throughout the distribution system. The state of the lake is indicated by the Trophic State Index - an index that tracks water clarity along with the amounts of phosphorus and algae in the water. The current trophic state for Sebago Lake is good for drinking water quality. Chloramines are added to maintain a level of disinfectant throughout the distribution system. The level of chloramines is measured weekly at forty-three locations throughout the service area, and the treatment process is adjusted continuously to maintain desired levels.
Benchmarks: 1998 2003 2008 2013 2018
Percent of Days in Compliance with Water Regulations 100% 100% 100% 100% 100%
Water Quality: Sebago Lake Trophic State Index (goal – 24 to 32) 31 27 30 32 29
10th Percentile Chloramine Residual (goal 0.4 mg/L) N/A N/A 0.2 mg/L 0.3 mg/L 0.77 mg/L
Land in Conservation in the Watershed (acres) N/A 0 350 1100 5826
Service Area Communities served by Education/Outreach Programs N/A N/A 10 11 10
Security (violations per 1000 visitors) N/A N/A 12 7 12
Current Status, Challenges and Impact to Current Budget:
A new water storage tank station in the 407 zone (Windham and Gorham) will be constructed in 2020.
Continue to allocate money to work with watershed partners to prevent non-point pollution into Sebago Lake. Continue developing the Sebago Clean Water coalition to generate funds to protect watershed land.

24 Introduction
Strategic Goal 2: Safety The District will design and maintain its water system to meet modern firefighting needs.
Background
One of the original reasons the District was created was to provide adequate water volume and pressure to combat fires. A common benchmark measuring the fire-fighting capability is the community’s public protection classification, a numerical grade given by the Insurance Service Office (ISO). The classification is developed based on grades given the community’s fire department (60%) and water supply (40%) systems. The District is mainly responsible for the water supply system within our service territory. The classification is developed by the ISO, an international firm that provides information regarding property and liability risk.
Strategic Benchmarks (periodically by ISO):
The 2003 Comprehensive Water System Strategic Plan identified infrastructure and operational changes that would improve the water system rating within our service territory. The date indicates the last time the rating has been updated by ISO. Benchmarks: Stable or Improving Communities’ ISO rating for Water Systems - Communities Improve/Stable Rating
Municipality Percent of Municipality Served by the District
Water System (maximum = 40%)
ISO Rating Date
Cape Elizabeth 78% 36.54% 1995 Cumberland 43% 22.89% 2001 Falmouth 50% 32.93% 1992 Gorham 32% 34.20% 1993 Portland 94% 37.48% 2000 Raymond 3% 27.28% 2002 Scarborough 40% 32.46% 1991 South Portland 90% 37.35% 1999 Standish 13% 25.25% 1996 Westbrook 79% 36.84% 1996 Windham 37% 25.73% 2004
Current Status, Challenges and Impact to Current Budget:
The Capital Improvement Plan includes funding to replace water mains and hydrants, including $6.1 million to continue upgrading the 407 zone, an area in Gorham and Windham, over the next 5 years. Additionally, staff will continue meeting with the municipal fire departments to identify action steps to improve. Annual inspection of all hydrants will be done and any inoperable hydrants will be fixed promptly.

25 Introduction
Strategic Goal 3: Environment The District will promote the sustainability of natural resources within the Casco Bay watershed.
Background
The District treats and returns to Casco Bay watershed 23 million gallons of wastewater each day. The discharged wastewater must meet certain wastewater regulations. Wastewater regulations fall under the provisions of the federal Clean Water Act (CWA). Passed in 1972, with significant amendments in 1977 when it became known as the CWA, it is implemented and enforced by the EPA and the Army Corp. of Engineers. The CWA establishes the basic structure for regulating pollutants discharging into the waters of the United States. It gives the EPA authority to implement pollution control programs, such as setting wastewater standards for industry. The CWA makes it unlawful to discharge a pollutant into navigable waters without a permit called the National Pollutant Discharge Elimination System Permit (NPDES). The CWA provides that the EPA will create rules to implement the law, and will delegate to the state the administration and enforcement of the law on a day-to-day basis. In Maine, the Department of Environmental Protection (DEP) has been delegated this function, with EPA retaining concurrent authority to take enforcement action. The DEP has more stringent monitoring requirements for biosolids, whole effluent toxicity and mercury than the requirements established by EPA. The District’s treatment plants must obtain a discharge permit issued by the DEP adhering to those stricter requirements.
Strategic Benchmarks (updated every 5 years):
The District meets the standards required by each plant DEP-issued wastewater discharge permit. The standards include numerous daily, weekly and monthly benchmarks. In addition, the elimination of any discharges of untreated wastewater during dry weather (i.e. – no rain or snow melt) to watershed is a goal.
2003 2008 2013 2018
Compliance with discharge permit: East End Wastewater Treatment Facility Westbrook / Gorham / Windham Treatment Facility Cape Elizabeth Treatment Facility Peak’s Island (in Portland) Treatment Facility
49 8
10 0
22 8
13 3
5 0 2 0
12 1 5 8
Dry Weather Overflows N/A 1 3 10
Current Status, Challenges and Impact to Current Budget:
Many of the non-compliance incidents occur during wet weather when the facilities cannot treat the volume of water resulting in untreated or less treated wastewater to be discharged to the watershed. In 2019, the focus in each system is as follows: Cape Elizabeth – Assisting the town in identifying the source and solution for the overflow related to the Ottawa Road pump station. Gorham/Westbrook/Windham – Assisting the city in eliminating combined sewer overflow in the city’s collector system. Portland - Assisting the city in eliminating combined sewer overflow in the city’s collector system.

26 Introduction
Strategic Goal 4: Reliability The District can be trusted to provide its products and services in a manner that meets all reasonable customer expectations.
Background
The state has granted the District the exclusive authority to provide public drinking water service and wastewater treatment/interceptor service to customers in our service territory. Customers and regulators assume we will provide appropriate service 24/7. Water service standards are established by the Maine Public Utilities Commission and Department of Human Services; including standards related to customer service and billing. Wastewater service standards are established by the Maine Department of Environmental Protection.
Strategic Benchmarks (updated every 5 years):
The District periodically conducts a formal customer satisfaction survey. Customers expect us to provide two basic services reliably – to provide water to customers’ homes and to treat wastewater delivered to District’s system.
Current Status, Challenges and Impact to Current Budget:
The 2017 customer satisfaction survey was completed and indicates satisfaction continues to be high with 75% of customers indicating they are satisfied or generally pleased with the level, quality and reliability of the water and wastewater services provided. We will continue investing in our ‘value of water’ campaign and explore offering additional self-help options including advance notification of certain events. In 2020, the most significant water system project to increase reliability is the $7.0 million investment in aging water mains, which will reduce main failures. Significant wastewater system projects/programs that will increase reliability include the renovating aging pump stations and treatment faciliies.
2003 2008 2013 2018
Water Service failure per million hours of available service - Total Customer Outage Hrs. / ((51,296 X 365 X 24) / 1,000,000)
15.8 15.7 9.4 13.2
Wastewater Reliability Index – WW Systems infrastructure that is In Service Full (ability to deliver design flow) WW Systems and Pumping Stations convey flow to treatment plants WW Treatment Plants available to treat flow
Not available
Not
available
98.6%
100%
99.6%
100%
Not available
Not
available
Customer Satisfaction Survey Results 89% 85% 87% 75%
27 Introduction
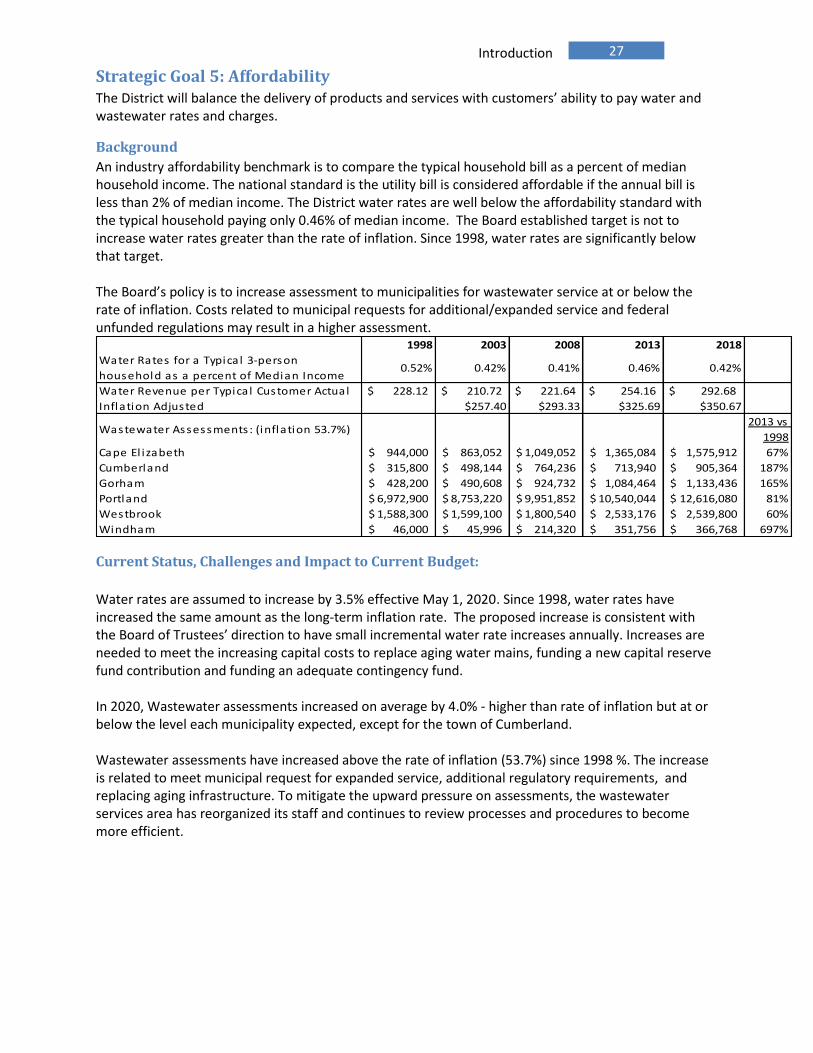
Strategic Goal 5: Affordability The District will balance the delivery of products and services with customers’ ability to pay water and wastewater rates and charges.
Background
An industry affordability benchmark is to compare the typical household bill as a percent of median household income. The national standard is the utility bill is considered affordable if the annual bill is less than 2% of median income. The District water rates are well below the affordability standard with the typical household paying only 0.46% of median income. The Board established target is not to increase water rates greater than the rate of inflation. Since 1998, water rates are significantly below that target. The Board’s policy is to increase assessment to municipalities for wastewater service at or below the rate of inflation. Costs related to municipal requests for additional/expanded service and federal unfunded regulations may result in a higher assessment.
1998 2003 2008 2013 2018
Water Rates for a Typica l 3-person
household as a percent of Median Income 0.52% 0.42% 0.41% 0.46% 0.42%
Water Revenue per Typica l Customer Actual $ 228.12 $ 210.72 $ 221.64 $ 254.16 $ 292.68
Inflation Adjusted $257.40 $293.33 $325.69 $350.67
Wastewater Assessments : (inflation 53.7%)2013 vs
1998
Cape El izabeth 944,000$ 863,052$ 1,049,052$ 1,365,084$ 1,575,912$ 67%
Cumberland 315,800$ 498,144$ 764,236$ 713,940$ 905,364$ 187%
Gorham 428,200$ 490,608$ 924,732$ 1,084,464$ 1,133,436$ 165%
Portland 6,972,900$ 8,753,220$ 9,951,852$ 10,540,044$ 12,616,080$ 81%
Westbrook 1,588,300$ 1,599,100$ 1,800,540$ 2,533,176$ 2,539,800$ 60%
Windham 46,000$ 45,996$ 214,320$ 351,756$ 366,768$ 697%
Current Status, Challenges and Impact to Current Budget:
Water rates are assumed to increase by 3.5% effective May 1, 2020. Since 1998, water rates have increased the same amount as the long-term inflation rate. The proposed increase is consistent with the Board of Trustees’ direction to have small incremental water rate increases annually. Increases are needed to meet the increasing capital costs to replace aging water mains, funding a new capital reserve fund contribution and funding an adequate contingency fund. In 2020, Wastewater assessments increased on average by 4.0% - higher than rate of inflation but at or below the level each municipality expected, except for the town of Cumberland. Wastewater assessments have increased above the rate of inflation (53.7%) since 1998 %. The increase is related to meet municipal request for expanded service, additional regulatory requirements, and replacing aging infrastructure. To mitigate the upward pressure on assessments, the wastewater services area has reorganized its staff and continues to review processes and procedures to become more efficient.

28 Introduction
Strategic Goal 6: Employees and Work Environment The District will have well trained and satisfied employees who work in a safe and productive work environment.
Background
Since 1995, a periodic survey of all employees is conducted. The survey provides employee feedback on the work environment including questions related to compensation, management and policies. The premium paid on workers’ compensation is partially based on a modification factor (MOD). The factor compares the District’s injury rate with other organizations with similar risk exposure. The District seeks workers’ compensation injury rate that is no higher than industry average (i.e. – a rating of 1 or less). Finding time for training is an important goal. The goal that has been established is an average of 80 training hours per employee.
Strategic Benchmarks (updated every 5 years):
1998 2003 2008 2013 2018
District’s biennial Employee Satisfaction Average Score -Range 1 (lowest) to 6 (highest)
3.52 4.02 4.42 4.48 N/A
Workers’ Compensation Modification Factor – 1.00 = Industry average (goal is less than 1)
1.62 0.99 1.06 1.06 087
Average Training Hours Per Employee – current goal is 80 hours
22 55 83 105 82
Note: The employee satisfaction survey format was changed in 2018 so comparable numbers are not available.
Current Status, Challenges and Impact to Current Budget:
In 2017, an employee satisfaction survey was conducted. Based on the survey results, three areas of focus are: inconsistent application of policies, compensation, and improved internal communication. As surveys have traditionally been conducted every other year, another employee survey was held in fall 2019; results were being compiled at the time of this writing. The current workers’ compensation modification factor indicates that our injury rate is below average for our industry. We will continue our efforts to maintaining a rate below 1, which indicates an organization is average. Management development and consistency of practice efforts continue through our commitment of an average of 80 hours of training per employee. The water and wastewater departments continue an apprentice program to provide a broad education to our new employees. In 2020, an additional staff is proposed for the Employees Services department to continue improving services and programs focusing on employment development and support.

29 Introduction
Board Established Annual Budget Guidelines To help guide staff, the Board of Trustees set four guidelines for the budget process.
The Guideline is established to limit growth of the budget to a reasonable growth level not exceeding the inflation rate. The limit can be exceeded if a municipality requests expansion of service or service level. Proposed budget is $47.5 million, $54,000 better than Board guideline.
Guideline Capital expenditures will be consistent with the levels recommended in the Water and Wastewater system plans.
A guideline was established to ensure capital projects are consistent with various plans including the Water Master Plan, Comprehensive Plant and System plans, and Combined Sewer Overflow plans. The proposed capital expenditures meet the guidelines – see Infrastructure and Operational Evaluation Plans in the Capital Expenditures section for details.
Guideline The Operating Funds' Budget will not increase more than the rate of inflation over the long-term. The annual target is rate of inflation plus any unfunded federal/state/local mandates and funding for water main renewal of up to 1% of water revenues. At their June meeting, the Board established a budget target of $47.5M. The target would be higher than the long-term average and was accepted due to the increasing capital project needs.

30 Introduction
Board Established Annual Budget Guidelines (continued)
Guideline Water Revenue Requirement and Wastewater Assessments increases will not exceed the rate of inflation excluding the impact of mutually agreed upon changes in services, capital investments, surplus fund utilization or Board’s request to increase surplus balance.
All Wastewater assessments and Water Rates Increases meet or are below the Board of Trustees and Municipal expectations except Cumberland due to higher system maintenance costs and Falmouth treatment assessment.
2020 Target 2020 Proposed Budget
Water $25,686,370 3.50% $25,684,897 3.49%
Cape Elizabeth $1,705,380 8.5% $1,705,380 8.4%
Cumberland $906,807 0.2% $965,292 6.6%
Gorham $1,160,707 2.4% $1,160,676 2.4%
Portland $13,659,198 8.3% $12,863,340 2.0%
Westbrook $2,880,704 13.6% $2,820,768 11.2%
Windham $389,421 6.2% $389,004 6.1%
Salary and benefits are one of the District’s most significant costs. To control costs, a targeted headcount is established. The proposed budget contains 186 employees and 202.9 full-time equivalent employees – meeting the Goal.
221216
203
196190189189190190190191190188
180178178178178178178178178182182
212211209209209210210209
196196197197196196196196196198198
160
170
180
190
200
210
220
230
19
96
19
97
19
98
19
99
20
00
20
01
20
02
20
03
20
04
20
05
20
06
20
07
20
08
20
09
20
10
20
11
20
12
20
13
20
14
20
15
20
16
20
17
20
18
20
19
Head Count Full-time Equivalent
2020 GoalHead Count – not to exceed 186
Full-time Equivalent – not to exceed 203
Guideline The number of employees will not exceed 186 and the full-time equivalency (FTE) will not exceed 203.

31 Introduction
Employees Suggested Action Items During the planning stages of the budget development, the General Manager held forums giving all employees an opportunity to share suggestions to be included in the 2020 budget. Each item was identified either as completed, in progress or already in place. The table below identifies some of the significant items and the impact to the 2020 budget in red.
Employee Suggestion:
Completed
Safety-related: 4 bright and quiet LED light towers were purchased for Water for night field work. No additional costs in 2020.
LED lighting was installed inside and out on the 2019 crew truck and this will be considered for other vehicles at trade-in. For each vehicle purchased, it is expected to cost an additional $200.
Powered Air Purifying Respirators (PAPR) have been purchased for SLWTF. One time cost in 2019 to purchase with no more than $1,000 of costs to maintain in 2020.
Benefits-related:
The weekly amount paid to employees not taking the health insurance will be increased starting January 2020 from $30 per week to 30% of the single HMO premium amount, which will be $57.60 per week. 2020 Budget impact is approximately $2,000.
Carhartt winter jackets were made available to field personnel. In 2019, the employee clothing allowance was increased to $140 from $125 to cover the cost of clothing including better winter jackets. Increased costs by approximately $2,000.
Staffing-related: IT will re-establish a regular visit to remote sites. Approximately $500 of additional mileage costs.
PWD crews will complete short renewal projects when appropriate. Any costs incurred will reduce the water fund operating expenses and increase the water capital fund expenditures.
Work environment related:
Transition to Google Chrome as default browser is underway. No additional costs in 2020.
Cape and Westbrook access gate control has been moved to East End to streamline entry. Westbrook gate now closes completely with the automatic mechanism. No additional costs in 2020.
The front desk can now be added to Outlook scheduling as a resource so that PWD meeting hosts can be informed of guests and deliveries. No additional costs in 2020.
New boiler has been installed and is functional at East End. Minor budget reduction due to more efficient boiler.
Spare Barnes pump and M-Scope locators have been made stockroom items to improve response to field situations. One-time cost of approximately $6,000 in 2019. No additional costs in 2020.

32 Introduction
Employees Suggested Action Items (continued)
Employee Suggestion:
In progress Adding safety assessment of climbing gear for standpipes onto the agenda of the Fall Protection Committee. Estimated cost is $5000.
Additional person has been budgeted for Information Services for 2020 for overall additional computer support and to improve response time on help desk requests. 2020 Budget impact is approximately $100,000.
Water has budgeted to increase staff to keep up with asset needs. 2020 Budget impact is approximately $150,000.
Improving the onboarding process for new employees. No additional costs in 2020.
Departments will share more of their presentations outside the originating group to keep people in other departments better informed. No additional costs in 2020.
Including all PWD facilities in recycling efforts. Approximately $2,000 in addition cost.
Already in place
All training requests will be considered, whether offered on-line, as individual courses or certificate programs at local colleges/universities, etc. Refer to the Employee Education and Development Program policy. No additional costs in 2020.
Any appropriate documents will be posted on @pwd.org into the document library to make more detailed information available to external customers. No additional costs in 2020.
Desktop IM application capability exists with recently upgraded Mitel phone system. Requests for setup and training can be directed to supervisors. No additional costs in 2020.
Taking of exams for required licenses is allowed on PWD time No additional costs in 2020.
Departments hold meetings on a regular basis. No additional costs in 2020.

33 Introduction
External Factors Impacting the Budget Economy The local economy has rebounded from the last national recession. State unemployment is 2.9% and has
been under 4% for 47 months in a row. The unemployment rate is better than the national
unemployment rate of 3.5%. Cumberland County’s unemployment rate is 1.7%.
Cumberland County’s real estate market continues to thrive with total number of home sales are up by 2% and home prices are up 7% over the prior year. In the 2020 budget, the water consumption projection includes the same number of households as of July 31, 2019 and assumes no customer growth. A typical year’s growth in new customers is 1.5% (750 accounts). The national economy continues the trend of keeping interest rates relatively lower than historical levels affecting interest earning on investments.. However, both investment and have risen in the past year. The 2020 budget includes an increase in interest income of $202,000, or 40%, increase in earnings from operating funds investments as the average rates increase to 2.0% from 1.5%. The strong equity market returns caused the annual pension costs to be maintained despite the higher pension liability. The 2020 estimated actuarially determined contribution to our pension plans is approximately $1.1 million, which is the same as the prior year. The chemical, metal and fuel commodity market prices are impacted by the economy’s health and have been volatile in the past couple of years. Approximately 10% of the District’s expenses are related to chemical, metal and fuel markets. The 2020 budget reflects the commodity prices available in mid-2019. Regulatory Mandates The water and wastewater industry must comply with various federal and state regulations with two of the most important regulations being the Safe Drinking Water Act (SDWA) and Clean Water Act (CWA). The current regulatory focus is compliance with the long-term surface water disinfection rule under the SDWA and the combined sewer overflow requirements under the CWA. The 2020 Budget includes the impact of debt service of $13.5 million in capital expenditures and approximately $200,000 in operating expenses addressing these two focus areas. Water Consumption Though the District has ample supply of water, consumers have reduced their water consumption. Since 2000, the average residential household usage (HCF) has declined by more than 16%. Some of the reasons are rising wastewater fees encouraging conservation and the availability of more water efficient household appliances.
9.1
7.6
5
7
9
11
2000 2002 2004 2006 2008 2010 2012 2014 2016
Average Residential Usage Per Month(in Hundred of Cubic Feet)

34 Introduction
Significant Budget Uncertainties During the budget development, certain assumptions are made. Several budget areas have significant uncertainties including the following: Salaries and Wages ($12.15 million or 25.6% of total budget). A new three year union contract was agreed to during the budget process covering wages from November 2018 to October 2021. For 2020 budget purposes, union wage rates were assumed to increase by 3.0% effective in November 2019 and 2020, Non-union pay rates were assumed to increase by 3.0% effective January 1, 2020. In addition, the budget assumes 17,458 hours of overtime and doubletime pay. The amount of overtime and doubletime is directly related to amount of emergency repair work that is needed. Additional hours were included in the budget to assist in the implementation of the new Asset, Billing and Customer Relations computer system, though the actual hours needed are unknown. For every additional 1,000 hours of overtime/doubletime pay, costs increase by approximately $40,000. Purchased Power ($1.93 million or 4.1% of total budget). Electricity costs consist of delivery charges purchased from Central Maine Power ($822,401) and energy costs purchased from Constellation Energy ($1,107,888). Typically, CMP implements a rate adjustment effective July 1st. The amount of the 2020 increase is unknown. The 2020 budget assumes a 3% increase. For every variance of 1%, the budget would be impacted by approximately $8,000. Energy contracts locks in the prices for the whole year. The actual amount of electricity used varies primarily based on weather conditions, which impacts the amount of water produced and wastewater processed. Since 2007, the variance between the highest and lowest kilowatt amount of electricity for individual accounts in total is 11%, which would impact the budget by approximately $200,000. Chemicals ($1.22 million or 2.6% of total budget). The chemical contract is put out to bid each December. Prices used for the budget are estimates using the June market prices. Chemical prices have been volatile and have reacted to the global/national economy. Biosolids Disposal ($1.72 million or 3.6% of total budget). The volume of material left at the end of the wastewater process can vary significantly based on weather and operational challenges. A key measurement is the percent of solids left after removing as much water as possible from the material. The 2020 budget assumes 21%. In the past 5 years, the average has varied from 18% to 22%. A 1% difference is approximately $86,000. Weather The weather is a noteworthy determinant of operating expenses. The timing and duration of below freezing weather impacts the number of water main and service leaks. The amount of snowfall and timing of snow melt and rainfall impacts the amount of storm water that must be pumped to and treated by wastewater plants. The duration of hot summer days impacts the amount of water produced by the water treatment facility. For this budget, the past three-year average of water produced and wastewater treated was assumed for operating expenses projections.

35 Introduction
Major Policy and Resource Allocation Decisions
Operating Budget Personnel. Four (4) new positions are proposed – a Water Operator and Equipment Operator 1 in Water Operations and a IS Business Systems Analyst and Employee Services Consultant in Administrative Services. In addition two (2) positions were reclassified as two Technical Maintenance Person – Mechanical/Electrical positions were replaced by two Technical Maintenance Person positions. Overall, the budget continues our emphasis on training employees with the continued goal of providing an average of 80 hours training. New billing/customer relations and computerized maintenance management systems are being configures and integrated with a timeline to go live in the fall 2020. These significant projects will impact every employee at the District, ten of whom are dedicated to the implementation. Employee Benefits The costliest employee benefits are health insurance and pension benefits. Health insurance premiums decreased by 2.0%. The budget increase of 2.2% ($53,805) was due to the additions to headcount. The defined benefit plan contributions in the 2020 Budget was relatively unchanged at $1.12 million. The contribution is consistent with the Board adopted long-term funding policy as estimated by the District’s actuary. Overall pension related expenses were up $58,888 (3.7%) primarily due to the $50,000 increase the match to employees’ defined contribution (457) plans. Wastewater Sewer Lines Inspection In 2008, a commitment was made to inspect all sewer lines at least once every 10 years. In 2020, $61,250 was allocated to meet that commitment. Wastewater Combined Sewer Overflow (CSO) Monitoring To assist the municipalities in meeting their federal CSO requirements, the District remotely monitors the flow. In 2020, $156,000 was allocated to meet their request. Water System Flushing Starting in 2012, a renewed effort was made to flush the whole distribution system over a 3-year cycle. Flushing the system improves the water quality in the distribution system. The 2019 budget continues this effort by allocating close to $89,000. Partnership for Safe Water Starting in 2016, staff allocates approximately 1,000 hours participating in the water distribution system benchmarking program through the Partnership for Safe Water. Renewal and Replacement - The annual commitment of current revenue committed to capital projects increased to $5.56 million which is an increase of $451,800 over last year’s budget.

36 Introduction
Major Policy and Resource Allocation Decisions (continued)
Capital Projects The 2003 water strategic master plan noted that a considerable amount of water mains will be reaching the end of their useful life in the next 20 years. In 2020, the amount dedicated to replace aging water mains will be $7.0 million. In 2020, part of the $7.0 million ($500,000) will be dedicated to replace smaller mains. Additionally, a $1.0 million main will be upgraded in the 407 Zone in conjunction with construction of the new Ward’s Hill tank. Water Services and Engineering Services staff will allocate significant resources to manage these projects. Water Services has included additional staffing due to the level of effort allocated to water main inspection. Other significant capital projects include the following:
Westbrook Regional Wastewater Treatment Plant: In 2020, planning will begin construction on the $12 million aeration project.
Portland’s East End Wastewater Treatment Plant: Significant upgrades to electrical system is planned ($1.6 million)
Pump Station upgrades in Cape Elizabeth (Maiden Cove - $ 430,000 ) and Portland (Baxter Boulevard - $1,950,000)
Several projects started in previous years will be completed including Ward’s Hill water tank construction and Portland’s Fore River Wastewater Pump Station.
Revenues To balance the desire to provide funding for infrastructure improvement and operational needs with keeping water rates affordable, the Board adopted a policy of small modest annual increases close to the rate of inflation. The 2020 budget assumes a 3.5% increase in rates. The 3.5% increase includes allocating 1.0% to the Capital Reserve fund. The Maine Public Utilities Commission adopted a rule in 2013 allowing the District to increase water rates up to 10% of water revenues and dedicate revenues for capital improvement. After the proposed increase, the percent of water revenue allocated to the Capital Reserve annually will be 6.67%. The proposed budget assumes the additional reserve will be used to pay the debt service of $2 million bond to finance replacing aging water mains.

37 Introduction
2020 Operating Budget Summary The proposed budget includes $47.49 million in revenues and expenses.
Revenues The two major revenue sources are water sales ($25.7 million or 54.1% of total revenue) and wastewater assessment revenues ($20.2 million or 42.6% of total revenue). Wastewater revenues have increased from $16.29 million (24.0%) since 2011 principally due to addressing capital needs requested by municipalities or aging infrastructure. Water revenues are generated from potable water and sprinkler charges to individual customers, and public fire protection charges to municipalities. The 2019 Budget assumes an increase of 3.5% over current rates effective May 1, 2020.
Wastewater assessments are the amounts billed individual municipalities to provide collection, sewer treatment, interception, utility billing services and, by request, collection and billing services. Assessments in 2020 increased 4.0% overall ($770,100)
$0.0
$10.0
$20.0
$30.0
$40.0
2011 2012 2013 2014 2015 2016 2017 2018 2019 2020
Water Revenue Wastewater Assessment
Water Sales & WW Assessments(millions)
Expenses Operating Expenses increased to $47.5 million, an increase of 4.3%. Personnel Costs, (Salaries/Wages and Employee Benefits) which are 38.9 % of the total budget, increased 5.6% due to the average labor rate increase of 3.0% and the addition of four (4) positions. Debt Service (22.3% of expense) increased 2.8% due to new debt issues. Contracted Services ($4.5 million) increased only 0.8% ($36,609). Renewal and Replace contributions increased $451,800 (8.8%) while Other Expense increased $776,028 (9.1%).
Salaries/Wages26.1%
Employee Benefits
11.7%
Contracted Services
9.5%
Other19.5%
Debt Service22.3%
Renew & Replace11.6%
2020 Expenditures

38 Introduction
2020 Capital Budget Summary
The proposed Capital Budget is $28.08 million with projects for the water and wastewater funds of
$10.95 and $17.13 million, respectively.
Water Of the $10.95 million in water capital projects, the largest component (87%) involves the renewal of water distribution assets such as mains, services, meters and hydrants. The other categories include water facilities and security (7%), vehicles and equipment (4%), technology and SCADA (2%) and water supply (<1%). The implementation of a $4.6 million Billing and Customer Relations & Computerized Maintenance Management software systems, started in 2018, continues to be a significant technology project in 2020. The projects will be funded by issuing $7 million in bonds and utilizing $3.95 million in drawdowns from renewal and replacement funds.
Wastewater The largest project included in the $17.13 million
wastewater capital plan is the $11.25 million
aeration & clarifier upgrade at the Westbrook
WWTF. A total of $3.95 million is planned for the
East End WWTF power project that includes
connecting the plant to CMP’s new substation.
Several projects are also in place for WW pump
stations/collection, such as: $1.95 million for
upgrades to Baxter Blvd. PS in Portland, $430k for
upgrades to Maiden Cove PS in Cape Elizabeth, and
$300k for force main renewal under Little River
Bridge in Gorham.
The projects will be funded by issuing $11.68 million in bonds and by utilizing $1.75 million in drawdowns from renewal and replacement funds.
SCADA and Technology
2%
Vehicle and Equipment
4%
Water Distribution
System87%
Facilities7%
Water
Treatment Plant81%
Collection System19%
Wastewater

39 Introduction
2020 Combined Water and Wastewater Operating Funds Total revenues are $47.49 million, $1.95 million or 4.3% higher than last year’s budget. The Budget proposes a 3.5% water rate increase effective May 2020. Wastewater Assessment increases for the full year are budgeted in Cape Elizabeth (8.4%), Cumberland (6.6%), Gorham (2.4%), Portland (2.0%), Westbrook (11.1%) and Windham (6.1%). Operating Expenses are $47.49 million, an increase of 4.3%. The following pages provide additional detail.
.
2018
Actual
2019
Jan-Jun
2019
Budget
2020
Budget
Budget
Diff $
Budget
Diff %
Beginning Fund Balance $11,270,570 $11,969,153 $11,984,793 $12,888,498
Water Sales 24,056,708 11,111,241 24,817,595 25,686,370 868,775 3.5%Assessment Income 19,003,536 9,724,236 19,448,472 20,218,572 770,100 4.0%Contracted Billing Income 208,440 106,194 212,388 212,460 72 0.0%Interest Income 637,672 614,553 505,383 707,747 202,364 40.0%Other Income 772,566 369,651 553,614 664,790 111,176 20.1%FEMA Reimbursement -6,293 0 0 0 0 n/aTotal Revenue 44,672,629 21,925,875 45,537,452 47,489,939 1,952,487 4.3%
Salaries & Wages 10,785,763 5,376,970 11,507,789 12,149,805 642,016 5.6%Employee Benefits 5,397,419 2,575,405 5,520,409 5,577,447 57,038 1.0%Biosolids Disposal 1,790,923 923,853 1,674,962 1,722,166 47,204 2.8%Chemicals 1,033,051 623,343 1,149,524 1,221,909 72,385 6.3%Contracted Services 4,106,137 1,630,701 4,484,961 4,521,570 36,609 0.8%Deferred Cost W/O 561,101 5,050 10,100 0 -10,100 -100.0%Heat/Fuel Oil 347,064 205,314 331,981 386,485 54,504 16.4%Insurance 190,615 97,879 196,845 211,175 14,330 7.3%Materials & Supplies 1,687,816 720,455 1,752,296 1,760,135 7,839 0.4%Other Expense 659,070 301,958 782,000 836,146 54,146 6.9%Purchased Pow er 1,950,747 981,109 1,751,432 1,930,289 178,857 10.2%Regulatory/Taxes 228,163 206,205 213,965 244,649 30,684 14.3%Tele/Other Utilties 384,967 224,723 356,021 365,099 9,078 2.5%Transportation 1,071,205 536,966 1,139,310 1,167,423 28,113 2.5%Trans Offset -775,113 -366,992 -829,454 -840,466 -11,012 1.3%Department Expense 29,418,928 14,042,939 30,042,141 31,253,832 1,211,691 4.0%Debt Service & Lease Expense 9,342,054 5,039,612 10,392,178 10,678,552 286,374 2.8%Renew al & Replacement - Direct 3,932,741 2,120,274 4,240,549 4,477,349 236,800 5.6%Renew al & Replace - Indirect 850,000 441,906 850,000 1,050,000 200,000 23.5%Renew al & Replacement - Contracted 52,910 7,500 15,000 30,000 15,000 100.0%Operating Expense 43,596,633 21,652,231 45,539,868 47,489,733 1,949,865 4.3%
Current Surplus (Deficit) 1,075,996 273,644 -2,416 206Transfer to R&R -368,299 -125,000 0 0Transfer to Capital Reserve -169,596 -63,919 -127,838 -279,927
Transfer to Land Fund 0 0 0 0Land Cash Reserve Expense 0 25,270 0 0OPEB Surplus Allocated 160,486 0 0 0

40 Introduction
2020 Combined Operating, Capital and Grant Funds The total combined revenue and funding for 2020 is $75.6 million, total combined expenditures are $75.6 million. The combined budgeted surplus for 2020 is $21,119. Operating fund details are included in Operating Revenues, Departmental Expense and Human Resources Sections. Capital funds details are included in the Capital Finance and Capital Expenditures Sections. The Budget by Fund Section provides a summary of the Operating and Capital budget by individual enterprise fund – water fund and six (6) wastewater funds for each community provided with wastewater service.
. Operating Capital Land Fund Total
Water Sales $25,686,370 - - $25,686,370Assessment Income 20,218,572 - - $20,218,572Water Bond - 7,000,000 - $7,000,000Water R&R - 3,946,000 - $3,946,000Wastewater Bond - 15,380,000 - $15,380,000Wastewater R&R - 1,750,000 - $1,750,000Contracted Billing Income 212,460 - - $212,460Interest Income 707,747 - 40,914 $748,661Other Income 664,790 - - $664,790Total Revenue 47,489,939 28,076,000 40,914 75,606,853
Salaries & Wages 12,149,805 386,717 - 12,536,522 Employee Benefits 5,577,447 158,752 - 5,736,199 Biosolids Disposal 1,722,166 - - 1,722,166 Chemicals 1,221,909 - - 1,221,909 Contracted Services 4,521,570 26,916,187 - 31,437,757 Deferred Cost W/O - - - - Heat/Fuel Oil 386,485 - - 386,485 Insurance 211,175 - - 211,175 Materials & Supplies 1,760,135 537,300 - 2,297,435 Other Expense 836,146 - 20,000 856,146 Purchased Power 1,930,289 - - 1,930,289 Regulatory/Taxes 244,649 - - 244,649 Tele/Other Utilties 365,099 - - 365,099 Transportation 1,167,423 77,044 - 1,244,467 Trans Offset (840,466) - - (840,466) Operating Expense 31,253,832 28,076,000 20,000 59,349,832 Debt Service 10,678,552 - 39,791 10,718,343 Renewal & Replacement - Direct 4,477,349 - - 4,477,349 Renewal & Replace - Indirect 1,050,000 - - 1,050,000 Renewal & Replace - Contracted 30,000 - - 30,000 Total Expense 47,489,733 28,076,000 59,791 75,625,524
Surplus (Deficit) 206 - (18,877) (18,671)

41 Introduction
Land Fund
In the 2020 budget document, transactions related to protecting the watershed were separated from
the Operating Fund on the Combined Funds statement on the adjacent page. The District has $2.3
million reserved for activities to protect the watershed land including purchasing conservation
easements and contributions to organization supporting such efforts. A three-year $20,000 pledge has
been made to Sebago Clean Waters. The 2020 Budget assumes the District issues its first bond in
support of the effort – a $245,000 bond to purchase a conservation easement on a property in Sebago
called Tiger Hills.

42 Introduction
GFOA Budget Presentation Award The Government Finance Officers Association of the United States and Canada (GFOA) presented a Distinguished Budget Presentation Award to Portland Water District, Maine for its annual budget for the year beginning January 1, 2019. In order to receive the award, a government unit must publish a budget document that meets program criteria as a policy document, as an operations guide, as a financial plan, and as a communication device. This award is valid for a period of one year only. We believe our current budget continues to conform to program requirements, and are submitting it to GFOA to determine its eligibility for another award.

43 Budget by Fund
Introduction The District uses seven enterprise funds – a water fund and six wastewater funds. The six wastewater funds are for the towns of Cape Elizabeth, Cumberland, Gorham and Windham and the cities of Portland and Westbrook. Each of the seven funds has a separate operating and capital budget appropriation. Details are provided for each fund in the Financial Summary section.
Relationship between Portland Water District Funds/Municipalities’ Sewer Funds and the Ratepayer The District provides water service directly to ratepayers. The cost of water service is recorded in a separate enterprise fund. The District bills ratepayers’ individual monthly charges to customer. The District provides certain wastewater services on behalf of six communities – each with a separate enterprise fund. The services provided by the District and Municipality are listed below. The District bills the Municipality for services rendered. The Municipality determines the ratepayers’ rates to recover the District bill and their internal costs. The Municipality has requested the District to include these monthly fees on the water bill mailed to the Ratepayers.
PWD provides all water services.
Wastewater Service Provided by:
Municipality Treatment/ Interceptors
Collectors Storm Water
Cape Elizabeth PWD Municipality Municipality
Cumberland PWD PWD Municipality
Falmouth Municipality Municipality Municipality
Gorham PWD PWD Municipality
Portland PWD Municipality* Municipality*
Westbrook PWD Municipality Municipality
Windham PWD PWD Municipality
PWD determines rates.
Each Wastewater municipality determines sewer rates based on PWD assessed costs and municipal costs. PWD, by
contract, includes the fees on monthly water bills and remits money received to each municipality.
Customers pay water charges of $24.8 million.
Customers pay Wastewater Charges of $33.8 million = PWD Wastewater Funds ($20.4M) + Municipalities’ Sewer Funds ($13.4)
Water Fund ($25.7 Million)
*By contract, the District maintains collectors and storm drain system on Peaks Island, a small part of Portland
PWD Wastewater Funds ($20.4 Million)
Municipalities’ Sewer Funds ($13.4 Million)
Municipalities’ Sewer Funds
Portland Water District

44 Budget by Fund
Relation of Functional Units (Departments) to Funds As expenses are incurred, each department charges a cost center, which indicates to what fund the expenditure belongs. The totals below show how the costs for each department are spread across the organization. Not surprisingly, 99.1% of the costs of the Water Services department are assigned to the Water Fund and 99.8% of the Wastewater Services department costs go to the Wastewater funds. The expenditures of the remaining departments assign between 61.0% and 71.5% of costs to the Water Fund with the remaining going to the Wastewater funds.
Department Dept Exp Water Cape Eliz Cumber Gorham Portland Westbr Windham Other
Water Srvs $9,207,119 99.1% 0.0% 0.0% 0.0% 0.6% 0.1% 0.0% 0.2%
Wastewater Srvs 10,149,276 0.2% 9.2% 4.2% 4.1% 67.8% 13.0% 1.5% 0.0%
Environmenal Srvs 2,124,837 71.5% 1.7% 0.0% 1.7% 17.0% 7.9% 0.2% 0.0%
Engineering Srvs 4,259,770 67.9% 2.9% 1.3% 2.3% 18.5% 3.9% 0.4% 2.8%
Administration 6,064,147 61.0% 3.1% 1.8% 2.3% 23.6% 5.4% 0.6% 2.2%
Non-Departmental 289,149 100.0% 0.0% 0.0% 0.0% 0.0% 0.0% 0.0% 0.0%
Department Exp 32,094,298
(less ) Trans Exp (840,466)
Fund Expense 31,253,832
Allocation of Costs Between Departments and Funds
0% 20% 40% 60% 80% 100%
Administration
Engineering Srvs
Environmenal Srvs
Wastewater Srvs
Water Srvs
Water
Cape Eliz
Cumberland
Gorham
Portland
Westbrook
Windham
Other
More details on how costs are allocated between departments and funds are included in the Financial
Policy section.

45 Budget by Fund
2020 Operating Budget by Fund Summary The table provides a summary of all funds and contract billing cost centers with a grand total. The individual fund information is on the following pages.
Water, 55.8%
Cape El izabeth, 3.6%
Cumberland, 2.1%
Falmouth, 0.7%
Gorham, 2.5%
Portland, 27.9%
Westbrook, 6.2%
Contracted, 0.4%
Other, 6.5%
Revenues by Fund 2020
Total Water Cape Eliz Cumber Gorham Portland Westbk Windham
Falmouth/
Contract
Beg Balance $12,888,498 $7,495,835 $439,022 $256,136 $294,783 $3,498,825 $786,814 $42,317 $74,766
Water Revenue 25,686,370 25,686,370 - - - - - - - WW Assess 20,218,572 - 1,705,380 965,292 1,160,676 12,863,340 2,820,768 389,004 314,112 Contract Billing 212,460 - - - - - - - 212,460 Interest Income 707,747 408,100 20,884 13,303 18,455 164,504 72,695 8,103 1,703 Other Income 664,790 426,290 - - - 200,000 38,500 - -
47,489,939 26,520,760 1,726,264 978,595 1,179,131 13,227,844 2,931,963 397,107 528,275
Depart Expense 31,253,832 16,963,097 1,281,303 589,573 687,208 9,403,596 1,957,943 216,221 154,891 Debt Service 10,678,552 6,094,410 295,350 303,578 378,541 2,507,235 622,953 139,975 336,510 Renew & Repl 5,557,349 3,461,780 149,611 85,444 113,382 1,317,013 351,067 40,911 38,141
47,489,733 26,519,287 1,726,264 978,595 1,179,131 13,227,844 2,931,963 397,107 529,542
Surplus (Deficit) 206 1,473 - - - - - - (1,267) Xfer-Cap Resrv (279,927) (279,927) - - - - - - -
Ending Surplus $12,608,777 $7,217,381 $439,022 $256,136 $294,783 $3,498,825 $786,814 $42,317 $73,499
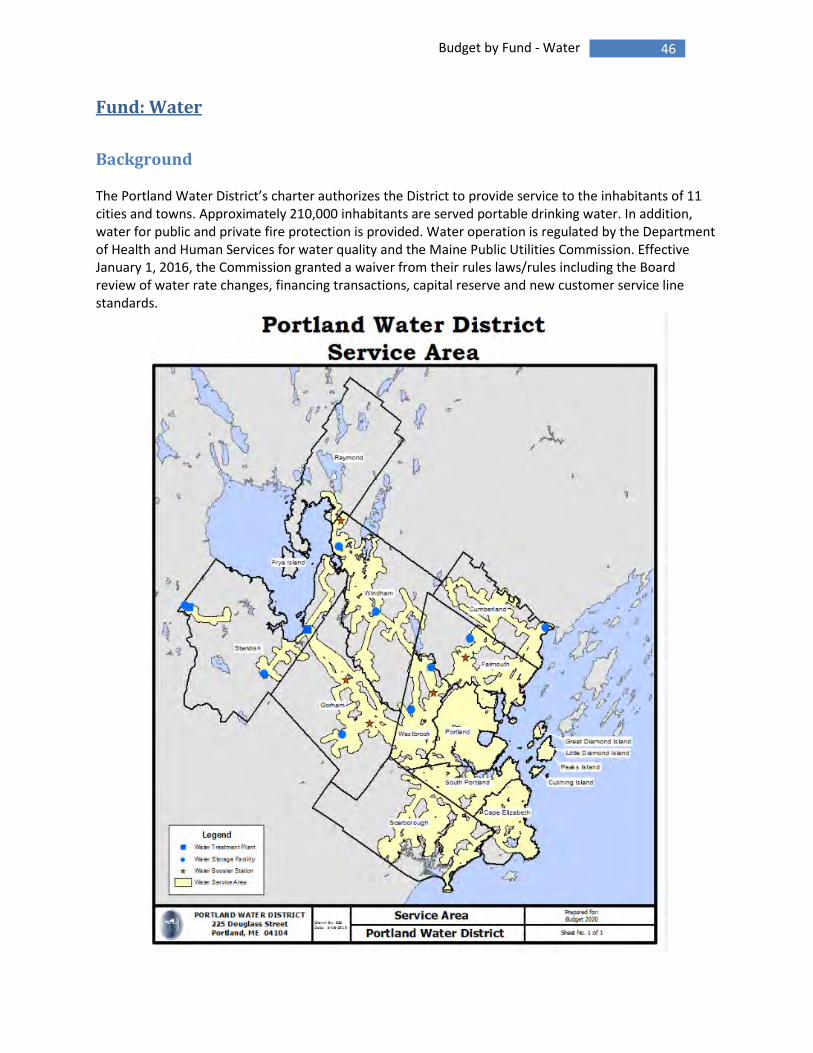
46 Budget by Fund - Water
Fund: Water
Background The Portland Water District’s charter authorizes the District to provide service to the inhabitants of 11 cities and towns. Approximately 210,000 inhabitants are served portable drinking water. In addition, water for public and private fire protection is provided. Water operation is regulated by the Department of Health and Human Services for water quality and the Maine Public Utilities Commission. Effective January 1, 2016, the Commission granted a waiver from their rules laws/rules including the Board review of water rate changes, financing transactions, capital reserve and new customer service line standards.

47 Budget by Fund - Water
Fund: Water The Portland Water District operates two water systems; the Greater Portland System delivers 22 million gallons of water per day from Sebago Lake and the Steep Falls System delivers 30,000 gallons per day from a single well in Standish. The quality of the water from Sebago Lake is exemplary, and the District was fortunate to receive a waiver from the filtration requirement that is normal for most surface water supplies. In order to maintain this waiver, the District must have an effective source protection program and meet stringent requirements for disinfecting the water.
2020 Financial Summary The proposed 2020 Operating expense and Capital budgets are $26,519,287 and $10,946,000, respectively. Operating Expense was $1,044,488 or 4.1%, higher than the previous year. Departmental Expense was up 3.4% ($557,299) and Renewal & Replacement (direct & indirect) was up $176,333 (5.3%). Debt Service increased $310,856 (5.4%) due to newly issued debt.
The Capital budget includes $7 million for distribution main renewals. The other area of focus is on the Elevation 407 Zone that incorporates Gorham and Windham. After the new Wards Hill Booster Station went into service in 2018, the 2019 CIP addressed the need for a new elevated water storage tank scheduled for construction in 2020. In 2020, the $1M transmission main improvements will continue the investment in capacity, service and water quality for that area.
Debt Service23%
Salaries & Wages19%
Renewal & Replacement
13%
Employee Benefits8%
Contracted Services
7%
All Other Expense30%
2020 Operating Expense

48 Budget by Fund - Water
2020 Operating Expense Highlights Salaries/Wages – Wage rates increased an average of 2.4% and total hours increased 2.4% (4,051 hours) due to two additions to the Transmission/Distribution headcount. The result was an overall increase of $231,832 (4.9%).
Employee Benefits – The benefit rate (including FICA) decreased from 50.51% in 2019 to 48.39% in 2020 due to lower overall employee benefit expenses. However, employee benefits expense in the Water Department increased 0.4% ($8,356) due to the increase in hours earlier mentioned was more than the decrease in the benefit rate. Chemicals – Costs are budgeted to decrease $14,171 (3.0%). This reduction was due to a large decreases in the per unit price for Caustic Soda (37.4%) and Fluoride (15.4%). This is partly offset by an escalation in price for Sodium Hypochlorite (18.8%) and Liquid Oxygen (37.3%). Contracted Services – This cost for services provided by third party vendors, increased $59,959 (3.4%). The Waterways Education Program was expanded this year and additional water storage tank cleaning was added to the budget. Heat/Fuel Oil – This expense, which covers the cost of fuel for the generator at the treatment plant, increased 12.7% ($12,956) due to a rise in the per gallon cost of heating oil. Materials and Supplies – This expenses, which is made up of inventory items taken out of the stockroom and asset purchases, increased $22,257 or 3.2% this year. This is for materials to put a new vacuum truck into service along with purchasing tools and equipment for two additional employees. Purchased Power – Overall, the budget was up $43,099, or 12.5%, primarily due to a $28k increase for the Sebago Lake Water Treatment Facility (SLWTF) energy costs because of a change in rates. Gorham booster station, the now backup to Wards Hill, had actual usage and demand that was higher than expected and demand costs also increased approximately $1 per KW over last year’s budget. Transportation - Transportation has increased by $16,067 or 2.1% because aforementioned vacuum truck and an addition to hours this year by Transmission/Distribution Services due to the addition of employees.
Transmission/Distribution
28%
Utility Services
19%Engineering Services16%
Treatment
15%
Environmental Services
14%
Other Departments
8%
2020 Labor Hours Distribution

49 Budget by Fund - Water
Support Services – These costs are related to general work done that cannot be directly charged to a fund as noted above (such as administrative time or training) or work done on behalf of several municipalities at the same time (engineering or laboratory services) that is allocated based on the value to each fund. Overall, Support Services allocated to the Water fund increased $148,957 or 3.2%. The allocation from Administration increased $144,248 (4.0%) as two full time positions were added to Admin’s head count. Debt Service/Lease Expense – This is the annual principal and interest payments on bonds issued to finance capital projects. This expense will increase 5.4% ($310,856) in 2020 due to new debt issued primarily for new main renewal projects and the recognition of a new GASB Lease Standard No. 87 for $9,186 that was previously in operating expenses. Renewal & Replacement – These are dollars put aside to fund capital projects. They will increase $176,333 to help fund capital projects such as main renewals.
2018
Actual
2019
Jan-Jun
2019
Budget
2020
Budget
Budget
Diff $
Budget
Diff %
Water Sales $24,056,708 $11,111,241 $24,817,595 $25,686,370 $868,775 3.5%Interest Income 349,235 329,325 285,521 408,100 122,579 42.9%Other Income 511,671 171,776 374,114 426,290 52,176 13.9%FEMA Reimbursement -384 0 0 0 0 n/aTotal Revenue 24,917,230 11,612,342 25,477,230 26,520,760 1,043,530 4.1%
Salaries & Wages 4,511,670 2,232,034 4,766,758 4,998,590 231,832 4.9%Employee Benefits 2,191,485 1,035,221 2,193,470 2,201,826 8,356 0.4%Chemicals 408,705 218,453 466,568 452,397 -14,171 -3.0%Contracted Services 1,550,432 519,702 1,764,711 1,824,670 59,959 3.4%Deferred Cost W/O 323,719 0 0 0 0 n/aFacilities 120,206 56,419 112,013 112,336 323 0.3%Heat/Fuel Oil 111,488 60,230 102,088 115,044 12,956 12.7%Insurance 24,691 12,827 25,046 27,449 2,403 9.6%Materials & Supplies 776,025 308,302 696,096 718,353 22,257 3.2%Other Expense 133,351 53,144 179,402 187,183 7,781 4.3%Purchased Power 378,842 173,427 345,785 388,884 43,099 12.5%Regulatory/Taxes 228,163 206,205 213,965 244,649 30,684 14.3%Tele/Other Utilties 96,420 53,386 101,532 88,328 -13,204 -13.0%Transportation 690,942 351,110 782,712 798,779 16,067 2.1%SS - Administration 3,395,521 1,616,269 3,588,763 3,733,011 144,248 4.0%SS - Engineering Services 832,687 434,768 890,804 888,615 -2,189 -0.2%SS - Environmental Services 99,924 44,322 72,618 77,074 4,456 6.1%SS - Water Services 74,142 40,088 103,467 105,909 2,442 2.4%Operating Expense 15,948,413 7,415,907 16,405,798 16,963,097 557,299 3.4%Debt Service & Lease Expense 4,930,896 2,870,061 5,783,554 6,094,410 310,856 5.4%Renewal & Replace - Direct 2,600,000 1,375,000 2,750,000 2,800,000 50,000 1.8%Renewal & Replace - Indirect 534,703 277,172 535,447 661,780 126,333 23.6%Total Expense 24,014,012 11,938,140 25,474,799 26,519,287 1,044,488 4.1%
Current Year Surplus (Deficit) 903,218 -325,798 2,431 1,473Transfer to Capital Reserve -169,596 -63,919 -127,838 -279,927Land Cash Reserve Expense 0 25,270 0 0OPEB Surplus Allocated 99,955 0 0 0Prior Year Surplus 5,990,955 6,824,532 6,996,070 7,495,835Accumulated Surplus 6,824,532 6,460,085 6,870,663 7,217,381
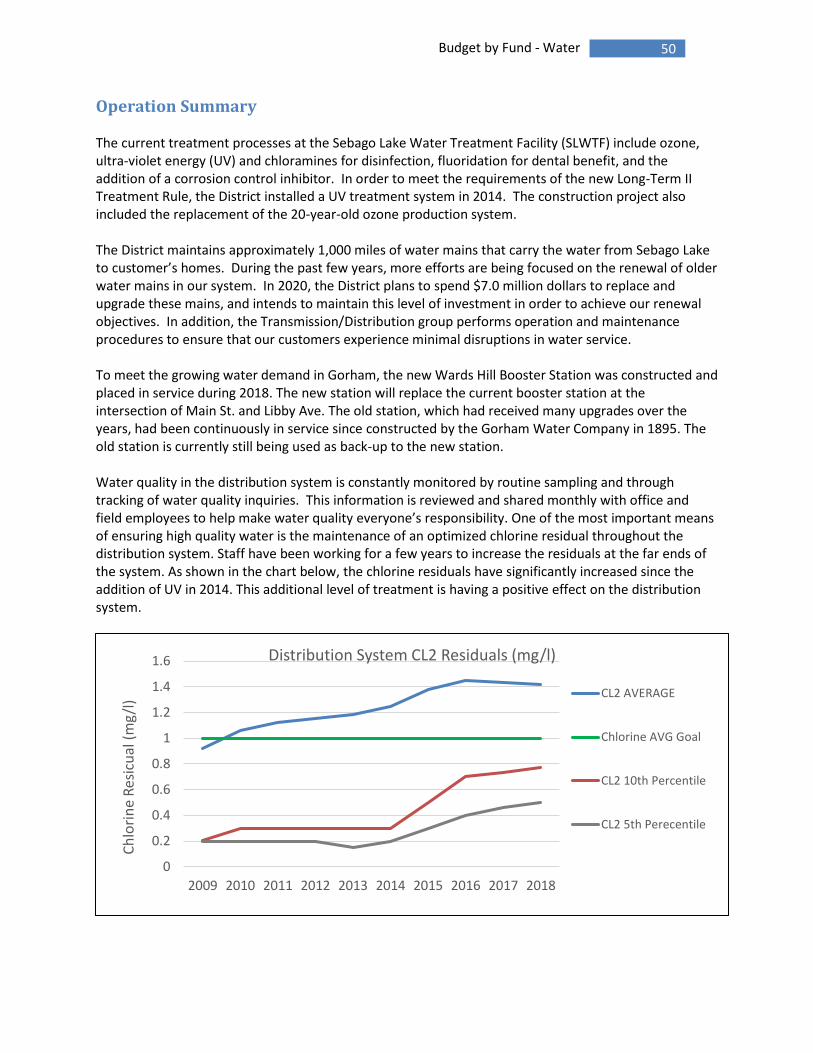
50 Budget by Fund - Water
Operation Summary The current treatment processes at the Sebago Lake Water Treatment Facility (SLWTF) include ozone, ultra-violet energy (UV) and chloramines for disinfection, fluoridation for dental benefit, and the addition of a corrosion control inhibitor. In order to meet the requirements of the new Long-Term II Treatment Rule, the District installed a UV treatment system in 2014. The construction project also included the replacement of the 20-year-old ozone production system. The District maintains approximately 1,000 miles of water mains that carry the water from Sebago Lake to customer’s homes. During the past few years, more efforts are being focused on the renewal of older water mains in our system. In 2020, the District plans to spend $7.0 million dollars to replace and upgrade these mains, and intends to maintain this level of investment in order to achieve our renewal objectives. In addition, the Transmission/Distribution group performs operation and maintenance procedures to ensure that our customers experience minimal disruptions in water service. To meet the growing water demand in Gorham, the new Wards Hill Booster Station was constructed and placed in service during 2018. The new station will replace the current booster station at the intersection of Main St. and Libby Ave. The old station, which had received many upgrades over the years, had been continuously in service since constructed by the Gorham Water Company in 1895. The old station is currently still being used as back-up to the new station. Water quality in the distribution system is constantly monitored by routine sampling and through tracking of water quality inquiries. This information is reviewed and shared monthly with office and field employees to help make water quality everyone’s responsibility. One of the most important means of ensuring high quality water is the maintenance of an optimized chlorine residual throughout the distribution system. Staff have been working for a few years to increase the residuals at the far ends of the system. As shown in the chart below, the chlorine residuals have significantly increased since the addition of UV in 2014. This additional level of treatment is having a positive effect on the distribution system.
0
0.2
0.4
0.6
0.8
1
1.2
1.4
1.6
2009 2010 2011 2012 2013 2014 2015 2016 2017 2018
Ch
lori
ne
Res
icu
al (
mg
/l)
Distribution System CL2 Residuals (mg/l)
CL2 AVERAGE
Chlorine AVG Goal
CL2 10th Percentile
CL2 5th Perecentile

51 Budget by Fund - Water
Operation Summary (continued) In an effort to improve system operation and prioritize activities, the District joined the Partnership for Safe Water in 2014. The Partnership is a voluntary continuous improvement program that uses optimization methods to improve drinking water systems. Initially, the partnership successfully developed and implemented a self-assessment and optimization program for surface water treatment plants by many organizations; including American Water Works Association, US EPA, Association of Metropolitan Water Agencies, National Association of Water Companies, Association of State Drinking Water Administrators, and the Water Research Foundation.
The District reported basic distribution system data for the first few years. In 2016, District staff began a multi-year process to prepare for what the Partnership refers to as the third-phase submittal. The focus of this work is to help utilities evaluate their own distribution system performance against regulatory requirements and industry Best Management Practices. In areas where improvement is desired, a continuous improvement process supports the creation of short-term and long-term goals The Distribution System Optimization Program focuses on topics such as maintenance of system chlorine residuals, hydrant and valve maintenance, management of main breaks, water loss, customer complaints, Cross Connection Control Program, main renewal programs, staffing, and funding. The district is not eligible to join the Treatment Plant Optimization Program, because the District has a waiver from filtration. In future years, the District expects it will adjust and/or change some service standards, develop projects and initiatives to support recommendations, and incorporate industry Best Management Practices into everyday operations.

52 Budget by Fund - Water
Capital Summary A five-year capital plan is updated each year. The projects are prioritized based on operational needs and financing availability. The table below indicates the projects scheduled for the next fiscal year and the funding source of those projects. Detailed descriptions of the projects can be found in the Capital Finance and Capital Expenditures sections. Water only expenditures are for asset exclusively used in the Water Fund. Water allocated expenditures are for assets used in multiple funds. The capital expenditures is recorded in the Water Fund.
Expenditures by CIP Year:
Prior CIP 2020 CIP Total
Projects:
Water Only 2,500,000$ 9,506,000$ 12,006,000$
Water Allocated 1,440,000$ 1,440,000$
Total by CIP Year 2,500,000$ 10,946,000$ 13,446,000$
Source of Funds:
R&R Fund Future Bond Funding Total
Bond Issue
Year
Beginning Balance 6,256,702$
2020 Contribution 4,250,000$
Total R&R Balance Available 10,506,702$
Projects:
Water Only
Wards Hill Tank Construction - 3004 2,500,000$ 2021
2020 CIP Budget 2,506,000$ 7,000,000$ 9,506,000$ 2020
Water Allocated 1,440,000$ 1,440,000$
Total 3,946,000$ 9,500,000$ 10,946,000$
Ending Balance 6,560,702$

53 Budget by Fund - Water
Projections for Rate-Making Purposes
Multi-year projections are made for the water fund to provide an understanding of the future impact on water rates.
Multi-year projections are made for each of the wastewater funds’ assessment. The projections provide guidance to the wastewater municipalities to assist them in determining their wastewater sewer rates. A summary of the projection is provided on next page. Major Assumptions: The assumptions incorporated in the projections are as follows:
Salary increases of 3.0% each year. Additional 1.25 headcount in 2021.
Benefit increases of 5% each year.
Biosolids contract expires in 2021; assumed 1.8% increase in unit prices. Contract renewal in 2022 may result in a significant increase but it is unknown so not forecasted.
Other expenses increase between 2.3% and 3.5% each year.
New debt service and renewal/replacement fund expenditures consistent with the 2020 5-year capital plan. New debt assumed a 20-year life at 3% interest.
Summary of Projection Impact: Water Revenue is projected to increase to $31,773,739 in 2024, a 24% increase over 2020 Budget, with the most significant cost change related to debt service issued to finance capital projects. Operating Reserve balance and Capital R&R balances are above the target balances.

54 Budget by Fund - Water
Projections for Rate-Making Purposes (continued) Water Fund Operating Fund:
Capital Expenditures: (See details in the Capital Expenditure section) Target Balance: $3,015,923
2020 Budget 2021 Forecast 2022 Forecast 2023 Forecast 2024 Forecast
R&R Balance BOY 6,256,702$ 6,560,702$ 6,860,702$ 7,585,702$ 8,460,702$
Contribution 4,250,000$ 4,350,000$ 4,450,000$ 4,550,000$ 4,650,000$
Withdrawals (3,946,000)$ (4,050,000)$ (3,725,000)$ (3,675,000)$ (3,950,000)$
R&R Balance EOY 6,560,702$ 6,860,702$ 7,585,702$ 8,460,702$ 9,160,702$

55 Budget by Fund - Water
Water Main Renewals
Our commitment to maintain aging water infrastructure includes replacing water mains. The 2020 budget continues this commitment with planned projects totaling $7.0 million dollars. The projects will
be funded with current year’s revenue ($1 million) and bond proceeds ($6 million). The increased investment in main renewal has impacted the number of main breaks.

56 Budget by Fund – Wastewater, Cape Elizabeth
Fund: Wastewater - Cape Elizabeth
Background The Portland Water District’s charter authorizes the District to provide wastewater treatment and collection system-interceptors service to the town. The town maintains most of the collection system but has contracted with the District to maintain several pump stations with that system. The District operates a treatment facility that treats wastewater from the southern section of the town and contracts with the City of South Portland to provide treatment services for the northern section of the town. Additionally, by contract, the District provides utility billing services.
Summary of Services
Provided:
Treatment:
Cape South 0.52 million
gallons/ day
Cape North 0.715
million gallons/day
(by South Portland’s
plant)
Collection System:
27 Pump Stations with
18.8 miles of pipe
Utility Billing Services:
Annual Billings of
$2,119,124 on 2,368
Customers (avg.
$74.58/month)

57 Budget by Fund – Wastewater, Cape Elizabeth
Fund: Wastewater - Cape Elizabeth
2020 Financial Summary The proposed assessment of $1,705,380 is an 8.4% increase. The assessment is lower than the forecasted assessment provided to the town last year. The proposed 2020 Operating Expense and Capital budgets are $1,726,264 and $530,000 respectively. The Operating Expense budget increased $139,209 or 8.8%. The 2020 Capital budget includes $430,000 for the construction phase of Maiden Cove pump station’s upgrades. This will be bonded with the $15,000 budgeted for the design last year. An advanced treatment process evaluation to assess the treatment effectiveness of the original plant equipment is planned for the Cape WW Treatment Facility; that budget is $50,000 and will be funded from renewal and replacement funds.
Contracted
Services17%
Debt
Service17%
Salaries &
Wages12%
Renewal & Replacement
9%
Employee
Benefits5%
All Other
Expenses40%
2020 Operating Expense
Assessment Compared to Ratepayers’ Billing The municipality’s fiscal year end is June 30, while the District’s is December 31. The chart below compares the cash as collected by the District for sewer billing on their behalf and the District’s assessment for services rendered. The municipality may incur additional sewer-related costs. The municipality determines when to increase the sewer billing rates.
$1,998,058
$1,914,097
$1,779,903
$1,639,146
$1,556,376
$2,119,124
$2,119,124
$2,119,124
$2,119,124
$2,119,124
$0 $1,000,000 $2,000,000 $3,000,000
FYE June 30,2023
FYE June 30,2022
FYE June 30,2021
FYE June 30,2020
FYE June 30,2019
Town Billing Revenue PWD Assessment
Revenue Assumptions: - Consumption is for the 12
months ending June 30, 2019
- Rates Assumed: Effective Base/Per HCF Date: Mar 2013 $43/$5.25 Mar 2014 $46/$5.41 Mar 2015 $48/$5.57 Mar 2016 $49.50/$5.68

58 Budget by Fund – Wastewater, Cape Elizabeth
2020 Operating Expense Highlights Salaries/Wages – Labor hours budgeted increased 8.6% (620 hours). This combined with the average wage rates increase of 2.9% resulted in an 11.7% ($22,189) increase in Salaries/Wages. Employee Benefits – The benefit rate (including FICA) decreased from 50.51% in 2019 to 48.39% in 2020 due to lower overall employee benefit costs. Overall, Employee Benefits expense increased 6.8% ($6,009). Biosolids Disposal – The budget for Biosolids Disposal increased $830 (4.0%). The budget assumes a steady wet ton amount but a $2.84 (4.2%) price increase to the per ton price as allowed in the vendor contract. Chemicals – The budget increased by $985 (or 9.5%) primarily due to a 20% increase in budgeted usage for Sodium Bicarbonate. Contracted Services – The budget increased 4.6% ($12,680) due to higher treatment costs expected to be charged by South Portland and an increase in lab analysis needed. Heat/Fuel Oil – The budget increased 23.2% ($3,430) due to a rise in price per gallon of propane along with an increase in heating levels at Cape’s pump stations in order to assist with ventilation requirements at those stations. Purchased Power – The Purchased Power budget increased 8.7% ($6,336) driven mainly by wastewater pump stations. Annual usage for small and medium accounts increased 18,000 kWh and 13,000 kWh, respectively. Usage estimates are based on a 2-year average. A 3% assumption is also included for potential CMP rate changes. Support Services – These costs are related to general work done that cannot be directly charged to a fund as noted above (such as customer service, billing or information technology) or work done on behalf of several municipalities at the same time (engineering or laboratory services) that is allocated based on the value to each fund. Overall, Support Services increased $28,245 or 6.65%. The allocation from Administration increased $12,328 (6.6%) because of the two new authorized head count in Information Services and Employee Services. The costs associated with Wastewater increased $14,484 (11.1%) due to redistribution in labor towards the smaller Wastewater funds to mirror actual hours. Debt Service/Lease Expense – This is the annual principal and interest payments on bonds issued to finance capital projects. This cost increased $54,839 (22.8%) from the prior year budget to $295,350
Treatment40%
WW Systems
54%
Other Departments
6%
2020 Labor Hours Distribution

59 Budget by Fund – Wastewater, Cape Elizabeth
with the issuance of debt relating to new capital projects and the recognition of a new GASB Lease Standard No. 87 for $4,795. Lease costs were previously in operating expense. Renewal & Replacement – These are dollars put aside to fund capital projects and the replacement of equipment that has served its useful life. A contribution of $149,611 will be made in 2020.
. 2018
Actual
2019
Jan-Jun
2019
Budget
2020
Budget
Budget
Diff $
Budget
Diff %
Assessment Income $1,539,840 $786,456 $1,572,912 $1,705,380 $132,468 8.4%Interest Income 19,685 16,399 14,143 20,884 6,741 47.7%FEMA Reimbursement -2,569 0 0 0 0 n/aTotal Revenue 1,556,956 802,855 1,587,055 1,726,264 139,209 8.8%
Salaries & Wages 179,892 97,878 189,339 211,528 22,189 11.7%Employee Benefits 87,865 45,778 88,358 94,367 6,009 6.8%Biosolids Disposal 16,185 6,635 20,500 21,330 830 4.0%Chemicals 15,427 8,028 10,420 11,405 985 9.5%Contracted Services 265,158 111,556 273,835 286,515 12,680 4.6%Deferred Cost W/O 27,252 0 0 0 0 n/aHeat/Fuel Oil 17,662 10,170 14,776 18,206 3,430 23.2%Insurance 4,371 2,210 4,317 4,677 360 8.3%Materials & Supplies 41,848 13,647 40,510 39,960 -550 -1.4%Other Expense 3,949 3,455 4,150 1,900 -2,250 -54.2%Purchased Power 91,525 48,061 72,969 79,305 6,336 8.7%Tele/Other Utilties 24,285 11,564 15,778 24,988 9,210 58.4%Transportation 30,297 13,507 38,476 34,025 -4,451 -11.6%SS - Administration 178,915 85,394 185,908 198,236 12,328 6.6%SS - Engineering Services 44,725 25,105 77,290 77,127 -163 -0.2%SS - Environmental Services 25,088 14,628 28,215 29,765 1,550 5.5%SS - Wastewater Services 125,112 63,317 130,654 145,138 14,484 11.1%SS - Water Services 1,996 1,085 2,785 2,831 46 1.7%Operating Expense 1,181,552 562,018 1,198,280 1,281,303 83,023 6.9%Debt Service & Lease Expense 227,181 111,671 240,511 295,350 54,839 22.8%Renewal & Replacement - Direct 100,000 62,500 125,000 120,700 -4,300 -3.4%Renewal & Replace - Indirect 23,508 12,237 23,264 28,911 5,647 24.3%Total Expense 1,532,241 748,426 1,587,055 1,726,264 139,209 8.8%
Current Year Surplus (Deficit) 24,715 54,429 0 0Transfer to R&R -30,551 0 0 0OPEB Surplus Allocated 5,836 0 0 0Prior Year Surplus 398,772 398,772 410,962 439,022Accumulated Surplus 398,772 453,201 410,962 439,022

60 Budget by Fund – Wastewater, Cape Elizabeth
Operation Summary Wastewater Treatment: The Cape Elizabeth Wastewater System is comprised of two general areas, North and South. Flow generated in the Northern area is delivered to South Portland for treatment while flow generated in South Cape is treated at the Cape Elizabeth WWTF. The Cape Elizabeth treatment facility is designed to treat 520,000 gallons per day with a peak capacity of 2.75 mgd during wet weather. PWD owns 715,400 gallons per day of capacity at South Portland’s WWTF. The Cape Elizabeth plant is currently operated in a way that provides some nitrogen removal.
In 2017, the flow in the Northern area averaged 0.410 mgd and the South Cape flow to the treatment plant averaged 0.27 mgd.
Effluent Permit Requirements:
Parameter Discussion
Biological Oxygen Demand (BOD) Measure of organic material and the strength of pollution. The treatment plant removed 93% of the BOD; well above the required 85% removal.
Total Suspended Solids (TSS) Measure of suspended material in the incoming wastewater; also the strength of pollution. The treatment plant removed 94% of the TSS, well above the required 85% removal.
Total Residual Chlorine Used for disinfecting the treated effluent, chlorine must be removed before the effluent is discharged. The permit limit was met at all times. The planned UV disinfection upgrade will eliminate the use of disinfection system chemicals. (Note: the new UV system will eliminate the need to use chlorine for disinfection).
Fecal Coliform Bacteria Following disinfection, the fecal coliform level is monitored to confirm the treatment plant effluent was properly disinfected.
The Discharge Permit was renewed in late 2016. There were five (5) effluent permit violations in 2018. These violations were associated with the performance of the disinfection system. It is anticipated that the new UV disinfection system will resolve this in future years.
-
0.2000
0.4000
0.6000
0.8000
2010 2011 2012 2013 2014 2015 2016 2017 2018
Cape Elizabeth - Wastewater Flow(millions gallons per day)
Cape South South Capacity North Capacity Cape North
4 3
9
0 25
04 5
0
10
Permit Violations

61 Budget by Fund – Wastewater, Cape Elizabeth
Operation Summary (continued) Wastewater Conveyance – interceptors and pumping stations: The Draft Ottawa Road CSO Long Term Control Plan was submitted to Maine Department of Environmental Protection in December 2011 and was approved in September 2013. The 5-year plan began in 2014. The plan’s projects are expected to lower the frequency and volume of overflow during extreme wet weather events by addressing private sources of infiltration and inflow in the collection systems of Cape Elizabeth and South Portland. Both the Town of Cape Elizabeth and the City of South Portland have completed an inventory of private sources of inflow & infiltration. Cape Elizabeth has installed additional storm drainage and redirected private sources of I/I to the storm sewer system. This effort has addressed 35 of 37 known sources of private I/I in 2018. South Portland has completed a project on Drew Rd. to remove 10 private sources of I/I. The project also lined the collection system pipe in the area to reduce infiltration. This project was completed in 2018. The PWD has purchased a new standby generator to improve the reliability of the pump station. The flow meter at the pump station will be replaced in 2019. PWD is assessing alternatives to maximize flow from the pump station while reviewing flow data to quantify the flow reductions realized through the work completed by Cape Elizabeth and South Portland. PWD staff continues to respond and maintain service during various storm events and power failures, while we work to install emergency generators through our Capital Improvement process. This will assist in managing elevated flows during wet weather and often associated power losses. Additional work performed by the Systems group is shown in the table below:
Parameter 2019 Actual to September 2020 Projected
Preventive Work Orders 457 450
Corrective Work Orders 33 40
Wet wells cleaned 35 45
Debris removed (ton) 49.7 40
Dry Weather Overflows 2 0
2019 Other Highlights • Asset Management Software continues to drive the preventive maintenance program; generating
both monthly and annual preventive maintenance tasks for all pump stations, continuing our emphasis on the pump station preventive maintenance program. The new position of Maintenance Manager/Planner will help to optimize efforts. The replacement of the current asset management computer system will further enable improvements in our effectiveness.
• Staff from the East End WWTF handle weekend sampling during the chlorination/disinfection season. This required sampling is expected to be eliminated by the installation of the UV disinfection system
since chlorine chemicals will no longer be added, neutralized or monitored.
2020 Work Plan • Flow monitoring will continue to assess the flow reductions that have been realized due to the
Ottawa Rd. drainage area I/I flow reduction efforts by Cape Elizabeth and South Portland. • Design of the Family Field (Little John) Pump Station is underway. This station serves the entire
Northern Cape Elizabeth Area. • The new UV disinfection system is under construction and will be operational by May 2020. The UV
system will be a welcomed replacement of the current chemical based disinfection system. • Design of the Maiden Cove Pump Station and force main replacement will begin in 2019 with
Construction in 2020. The site is very limited and construction will be challenging. • A process evaluation of the treatment plant will be completed. This assessment will review the
current aeration system and equipment. With the attention to nitrogen reduction (both from a water quality and process performance standpoint), the original aeration equipment will be assessed and updates and improvements will likely be identified.
• The first phase of an HVAC system review and upgrade will be completed in 2020.

62 Budget by Fund – Wastewater, Cape Elizabeth
Capital Summary A five-year capital plan is updated each year. The projects are prioritized based on operational needs and financing availability. The table below indicates the projects scheduled for the next fiscal year and the funding source of those projects. Detailed descriptions of the projects can be found in the Capital Finance and Capital Expenditures sections.
Expenditures by CIP Year:
Prior CIP 2020 CIP CIP Total
Projects:
WW Collection & Pumping
Maiden Cove PS Upgrades - 3002 15,000$ 430,000$ 445,000$
Pump Station R&R - 3130 25,000$ 25,000$
WW Treatment
Treatment Plant HVAC - 2571 375,000$ 375,000$
Treatment Plant UV Disinfection - 2701 1,025,000$ 1,025,000$
Treatment Process Evaluation - 3000 50,000$ 50,000$
Treatment Plant R&R - 3129 25,000$ 25,000$
Total by CIP Year 1,415,000$ 530,000$ 1,945,000$
Source of Funds:
R&R Fund Prior Bond Future Bond
Funding
Total
Bond
Issue Year
Beginning Balance 261,088$
2020 Contribution 120,700$
Total R&R Balance Available 381,788$
Projects:
WW Collection & Pumping
Maiden Cove PS Upgrades - 3002 445,000$ 445,000$ 2021
Pump Station R&R - 3130 25,000$ 25,000$
WW Treatment
Treatment Plant HVAC - 2571 375,000$ 375,000$ 2020
Treatment Plant UV Disinfection - 2701 875,000$ 150,000$ 1,025,000$ 2019/2020
Treatment Process Evaluation - 3000 50,000$ 50,000$
Treatment Plant R&R - 3129 25,000$ 25,000$
Total 100,000$ 875,000$ 970,000$ 1,945,000$
Ending Balance 281,788$
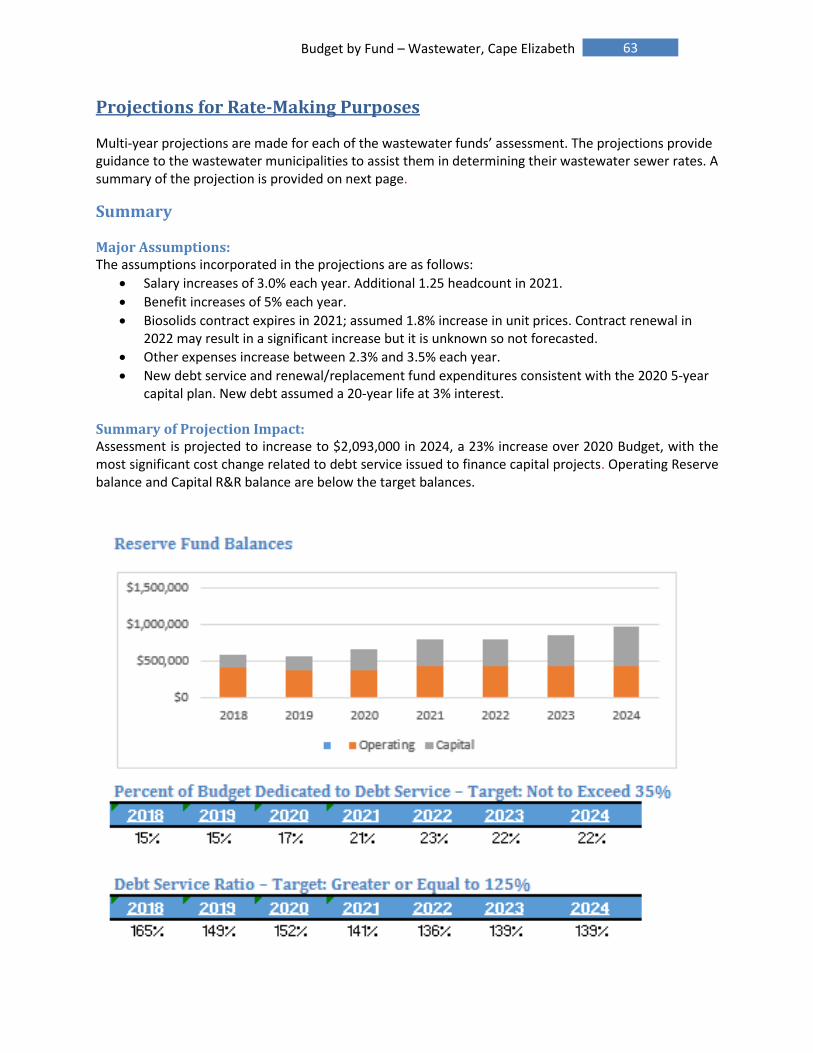
63 Budget by Fund – Wastewater, Cape Elizabeth
Projections for Rate-Making Purposes
Multi-year projections are made for each of the wastewater funds’ assessment. The projections provide guidance to the wastewater municipalities to assist them in determining their wastewater sewer rates. A summary of the projection is provided on next page.
Summary Major Assumptions: The assumptions incorporated in the projections are as follows:
Salary increases of 3.0% each year. Additional 1.25 headcount in 2021.
Benefit increases of 5% each year.
Biosolids contract expires in 2021; assumed 1.8% increase in unit prices. Contract renewal in 2022 may result in a significant increase but it is unknown so not forecasted.
Other expenses increase between 2.3% and 3.5% each year.
New debt service and renewal/replacement fund expenditures consistent with the 2020 5-year capital plan. New debt assumed a 20-year life at 3% interest.
Summary of Projection Impact: Assessment is projected to increase to $2,093,000 in 2024, a 23% increase over 2020 Budget, with the most significant cost change related to debt service issued to finance capital projects. Operating Reserve balance and Capital R&R balance are below the target balances.
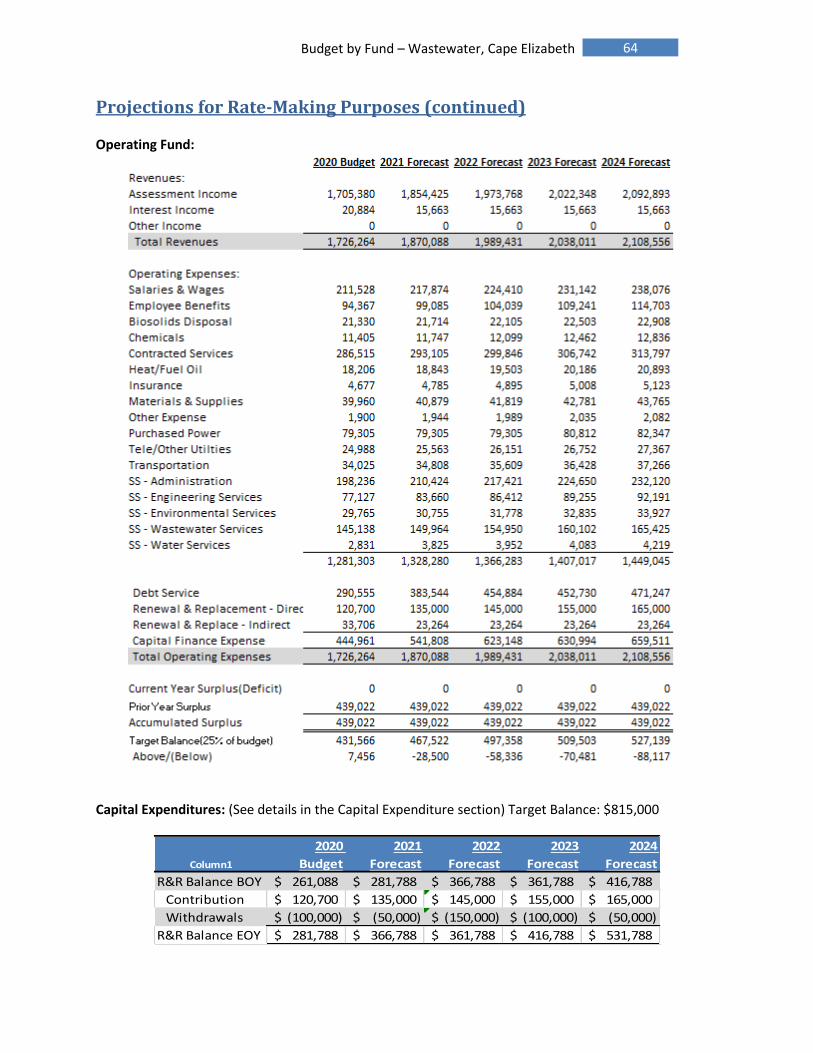
64 Budget by Fund – Wastewater, Cape Elizabeth
Projections for Rate-Making Purposes (continued) Operating Fund:
Capital Expenditures: (See details in the Capital Expenditure section) Target Balance: $815,000
Column1
2020
Budget
2021
Forecast
2022
Forecast
2023
Forecast
2024
Forecast
R&R Balance BOY 261,088$ 281,788$ 366,788$ 361,788$ 416,788$
Contribution 120,700$ 135,000$ 145,000$ 155,000$ 165,000$
Withdrawals (100,000)$ (50,000)$ (150,000)$ (100,000)$ (50,000)$
R&R Balance EOY 281,788$ 366,788$ 361,788$ 416,788$ 531,788$

65 Budget by Fund – Wastewater, Cape Elizabeth
Sewer Billing Statistics The District provides sewer billing services for the municipality by contract. Sewer is billed based on water consumption and is included on Portland Water District’s water bill. The municipality determines the sewer rate. Dollars collected are forwarded to the municipality weekly.
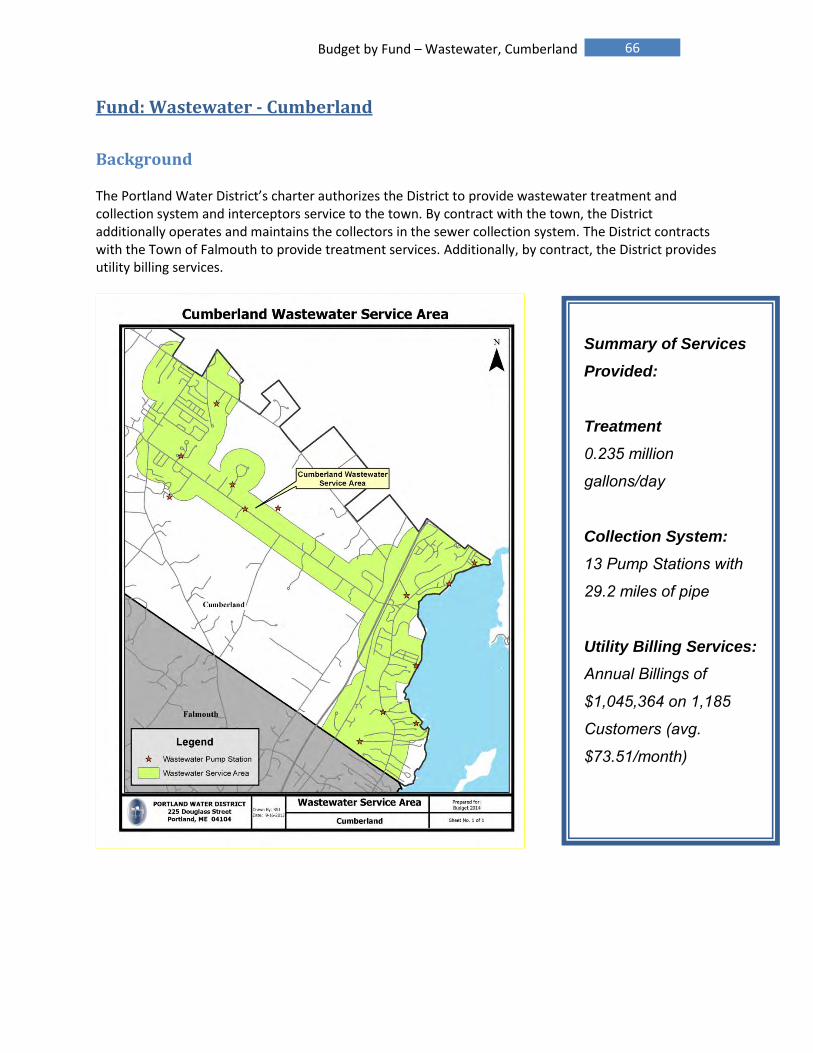
66 Budget by Fund – Wastewater, Cumberland
Fund: Wastewater - Cumberland
Background The Portland Water District’s charter authorizes the District to provide wastewater treatment and collection system and interceptors service to the town. By contract with the town, the District additionally operates and maintains the collectors in the sewer collection system. The District contracts with the Town of Falmouth to provide treatment services. Additionally, by contract, the District provides utility billing services.
Summary of Services
Provided:
Treatment
0.235 million
gallons/day
Collection System:
13 Pump Stations with
29.2 miles of pipe
Utility Billing Services:
Annual Billings of
$1,045,364 on 1,185
Customers (avg.
$73.51/month)

67 Budget by Fund – Wastewater, Cumberland
Fund: Wastewater - Cumberland
2020 Financial Summary The proposed assessment of $965,292 is an increase of $59,928 or 6.6%. The proposed 2020 Operating Expense and Capital budgets are $978,595 and $152,650, respectively. The Operating Expense budget increased $63,251 or 6.9% due to an increase in Salaries & Wages ($14,176), Contracted Services related to repairing manholes ($10,000) and Renewal/Replacement-Contracted ($15,000). The SCADA Radio Modem Replacement Project scheduled for 2019 was postponed to 2020. The project includes 14 Cumberland pump stations and is the primary focus for Cumberland’s 2020 Capital plan.
Assessment Compared to Ratepayers’ Billing The municipality’s fiscal year end is June 30, while the District’s is December 31. The chart below compares the cash as collected by the District for sewer billings on their behalf and the District’s assessment for services rendered. The municipality may incur additional sewer-related costs. The municipality determines if there are adjustments to sewer billing rates.
$1,011,820
$999,400
$978,154
$964,124
$935,328
$905,364
$1,045,364
$1,045,364
$1,045,364
$1,045,364
$1,045,364
$1,045,364
$800,000 $1,200,000
FYE June 30,2024
FYE June 30,2023
FYE June 30,2022
FYE June 30,2021
FYE June 30,2020
FYE June 30,2019
Town Billing Revenue PWD Assessment
Debt Service31%
Renewal & Replacement
6%
Contracted Services24%
Salaries & Wages
7%
Employee Benefits
3%
Purchased Power
3%
All Other Expense
26%
2020 Operating Expense
Revenue Assumptions: - Consumption is the 12
months ending June 30, 2019
- Rates Assumed: Effective Base/Per HCF Date: Jul 2013 $34.25/$4.96 Sep 2013 $34.25/$5.29 Sep 2015 $35.58/$5.29 Sep 2016 $36.92/$5.29 Sep 2018 $36.92/$5.52

68 Budget by Fund – Wastewater, Cumberland
2020 Operating Expense Highlights Salaries/Wages – This expense is budgeted to increase 25% or $14,176 to $70,672. The labor hours for this fund increased 23.2% (489 hours) mostly in the Wastewater Systems area amounting to $13,106 of the increase. This is based on projected personnel efforts needs in this fund. Employee Benefits – The benefit rate (including FICA) decreased from 50.51% in 2019 to 48.39% in 2020. However, the additional time spent in Cumberland caused Employee Benefits expense to increase by 20.1% ($5,334). Contracted Services – This category includes payments to the Town of Falmouth for wastewater treatment and pumping services. Overall Contracted Services increased 5.1% ($11,512) to a total of $237,197. The portion of that amount applicable to the treatment services from the Town of Falmouth is $192,645. Wastewater Systems added $10,000 to the budget for manhole repairs in the coming year. Purchased Power – Overall the budget increased $4,420 (19.9%) driven mainly by wastewater pump stations. Annual usage increased 16,000 kWh and is based on a 2 to 3 year average. A 3% assumption is also included for potential CMP rate changes. Transportation – Transportation costs increased by 12% ($2,427). The increase is related to the corresponding rise in labor hours. Support Services – These costs are related to general work done that cannot be directly charged to a fund as noted above (such as customer service, billing or computer support) or work done on behalf of several municipalities at the same time (engineering or laboratory services) that is allocated based on the value to each fund. Overall, Support Services increased $15,196 or 8.8%. The allocation from Administration increased $9,323 (8.8%) because of the two new authorized head count in Information Services and Employee Services. Debt Service – Debt service expense decreased 3.3% ($10,495) due to the delay in issuing the ABC bond and decline in interest expense as debt is paid down. Renewal and Replacement – This is the annual contribution to a fund to finance smaller capital projects. A contribution of $70,000 ($40,000 for Cumberland only and $30,000 for Falmouth assets utilized) will be made in 2020. The Falmouth portion increased by $15,000 budgeted in 2019 due to projected capital projects at the treatment plant.
WW Systems
94%
Digsafe
Locates0%
Collections
1%Other Depts
5%
2020 Labor Hours Distribution

69 Budget by Fund – Wastewater, Cumberland
. 2018
Actual
2019
Jan-Jun
2019
Budget
2020
Budget
Budget
Diff $
Budget
Diff %
Assessment Income $905,364 $452,682 $905,364 965,292 $59,928 6.6%Interest Income 12,665 12,060 9,980 13,303 3,323 33.3%FEMA Reimbursement -1,377 0 0 0 0 n/aTotal Revenue 916,652 464,742 915,344 978,595 63,251 6.9%
Salaries & Wages 73,120 32,962 56,496 70,672 14,176 25.1%Employee Benefits 37,056 14,446 26,592 31,926 5,334 20.1%Contracted Services 225,343 123,061 225,685 237,197 11,512 5.1%Deferred Cost W/O 8,088 0 0 0 0 n/aHeat/Fuel Oil 120 0 332 332 0 0.0%Insurance 2,955 2,589 842 3,232 2,390 283.8%Materials & Supplies 18,990 2,894 7,850 7,750 -100 -1.3%Other Expense 50 0 0 0 0 n/aPurchased Power 29,747 14,925 22,248 26,668 4,420 19.9%Tele/Other Utilties 2,219 887 2,104 2,160 56 2.7%Transportation 26,424 16,813 20,220 22,647 2,427 12.0%SS - Administration 99,189 48,346 104,934 114,257 9,323 8.9%SS - Engineering Services 20,600 11,292 34,063 34,079 16 0.0%SS - Wastewater Services 38,536 14,963 31,261 37,100 5,839 18.7%SS - Water Services 1,100 597 1,535 1,553 18 1.2%Operating Expense 583,537 283,775 534,162 589,573 55,411 10.4%Debt Service & Lease Expense 322,737 154,299 314,073 303,578 -10,495 -3.3%Renewal & Replacement - Direct 19,628 19,850 39,700 40,000 300 0.8%Renewal & Replace - Indirect 12,477 6,558 12,409 15,444 3,035 24.5%Renewal & Replace - Contracted 52,910 7,500 15,000 30,000 15,000 100.0%Total Expense 991,289 471,982 915,344 978,595 63,251 6.9%
Current Year Surplus (Deficit) -74,637 -7,240 0 0Transfer to R&R 0 0 0 0OPEB Surplus Allocated 2,094 0 0 0Prior Year Surplus 328,678 256,135 279,915 256,136Accumulated Surplus 256,135 248,895 279,915 256,136
Contracted Services – Treatment Services from Town of Falmouth
A significant portion of Cumberland’s total expense involves the treatment services provided by the Town of Falmouth:
$456,834 $414,498 $465,349
$534,455 $500,846 $513,246
$-
$200,000
$400,000
$600,000
$800,000
$1,000,000
$1,200,000
2018 2019 2020
FalmouthTreatment
PWD

70 Budget by Fund – Wastewater, Cumberland
Operation Summary Wastewater Treatment: The wastewater generated in the Town of Cumberland is collected and pumped to the Falmouth Wastewater Treatment Facility (FWWTF). PWD, on behalf of Cumberland, owns 30% of the Falmouth Plant’s design capacity, or 468,000 gallons per day. The town is billed for operating costs based on the ratio of Cumberland flow to the total flow processed at the Falmouth facility. The table below illustrates Cumberland’s flow contribution to the Falmouth plant.
Year Cumberland Flow Falmouth WWTF Flow % Cumberland Flow
2018 0.23 mgd 0.97 mgd 24%
FWWTF Capacity Cumberland Cap (30%) % Capacity Used Capacity Remaining
1.56 mgd 0.468 mgd 49% 0.24 mgd
The flows from the Cumberland system in 2018 were essentially constant from 2017, with Cumberland again using less than half of the allotted capacity in the Falmouth Plant.
Wastewater Conveyance – collectors, interceptors and pumping stations
Parameter 2019 Actual to Sept 2020 Projected
Preventive Work Orders 284 200
Corrective Work Orders 15 15
Wet wells cleaned 34 40
Debris removed (tons) 37 40
Dry Weather Overflows 2 0
0
0.1
0.2
0.3
0.4
0.5
2010 2011 2012 2013 2014 2015 2016 2017 2018
Cumberland - Wastewater Flow (millions gallons day)
Flow
Capacity

71 Budget by Fund – Wastewater, Cumberland
Operation Summary (continued)
2019 Other Highlights
• All pump stations are monitored 24/7 with our SCADA system and dispatch service. Operations staff will continue to visit each station on a weekly basis.
• The Asset Management Program continues to drive the preventive maintenance program, generating both monthly and annual preventive maintenance work orders for each of the pump stations.
• Wet wells will continue to be scheduled for cleaning on a quarterly basis unless experience dictates otherwise.
• A flow meter was installed on Route 1. Along with the Route 88 meter, this meters measures all flows to the Falmouth system. These flow monitors have increased the accuracy of flows sent to Falmouth and have aided in the sizing of pump stations, such as the Mill Creek Pump Station.
2020 Work Plan
• The Asset Management Program will continue to drive the preventive maintenance program, generating both monthly and annual preventive maintenance work orders for each of the pump stations.
• Wet wells will continue to be scheduled for cleaning on a quarterly basis unless experience dictates otherwise.
• The Cumberland radio network enabling SCADA communication (control system) will be upgraded to replace the legacy system.

72 Budget by Fund – Wastewater, Cumberland
Capital Summary A five-year capital plan is updated each year. The projects are prioritized based on operational needs and financing availability. The table below indicates the projects scheduled for the next fiscal year and the funding source of those projects. Detailed descriptions of the projects can be found in the Capital Finance and Capital Expenditures sections.
Expenditures by CIP Year:
2020 CIP CIP Total
Projects:
SCADA & Technology
SCADA Radio Modem Replacement - 3126 (prorated) 132,650$ 132,650$
WW Collection & Pumping
Pump Station R&R - 3136 20,000$ 20,000$
Total by CIP Year 152,650$ 152,650$
Source of Funds:
Regular
R&R Fund
Contracted
R&R Fund Future Bond
Funding
Total
Beginning Balance 382,423$ 2,426$
2020 Contribution 40,000$ 30,000$
Total R&R Balance Available 422,423$ 32,426$
Projects:
SCADA & Technology
SCADA Radio Modem Replacement - 3126 132,650$ -$ 132,650$
WW Collection & Pumping
Pump Station R&R - 3136 20,000$ -$
WW Treatment
Town of Falmouth - estimated expenses -$ 30,000$ 30,000$
Total 152,650$ 30,000$ 162,650$
Ending Balance 269,773$ 2,426$
Prorated Projects: Costs of projects done on infrastructure used by multiple communities are ‘prorated’
between the municipalities based on relative design capacity. In the case of the SCADA radio modem
replacement project, the proration is based on there being 14 Cumberland pump stations out of the 37
total pump stations that are planned to have work done in 2020. This project was postponed from 2019.

73 Budget by Fund – Wastewater, Cumberland
Projections for Rate-Making Purposes
Multi-year projections are made for each of the wastewater funds’ assessment. The projections provide guidance to the wastewater municipalities to assist them in determining their wastewater sewer rates. A summary of the projection is provided on the next page. Major Assumptions: The assumptions incorporated in the projections are as follows:
Salary increases of 3.0% each year. Additional 1.25 headcount in 2021.
Benefit increases of 5% each year.
Biosolids contract expires in 2021; assumed 1.8% increase in unit prices. Contract renewal in 2022 may result in a significant increase but it is unknown so not forecasted.
Other expenses increase between 2.3% and 3.5% each year.
New debt service and renewal/replacement fund expenditures consistent with the 2020 5-year capital plan. New debt assumed a 20-year life at 3% interest.
Summary of Projection Impact: Assessment is projected to increase to $1,018,193 in 2024, a 6% increase over 2020 Budget, with the most significant cost change related to debt service issued to finance capital projects. Operating Reserve balance and Capital R&R balance are below the target balances.
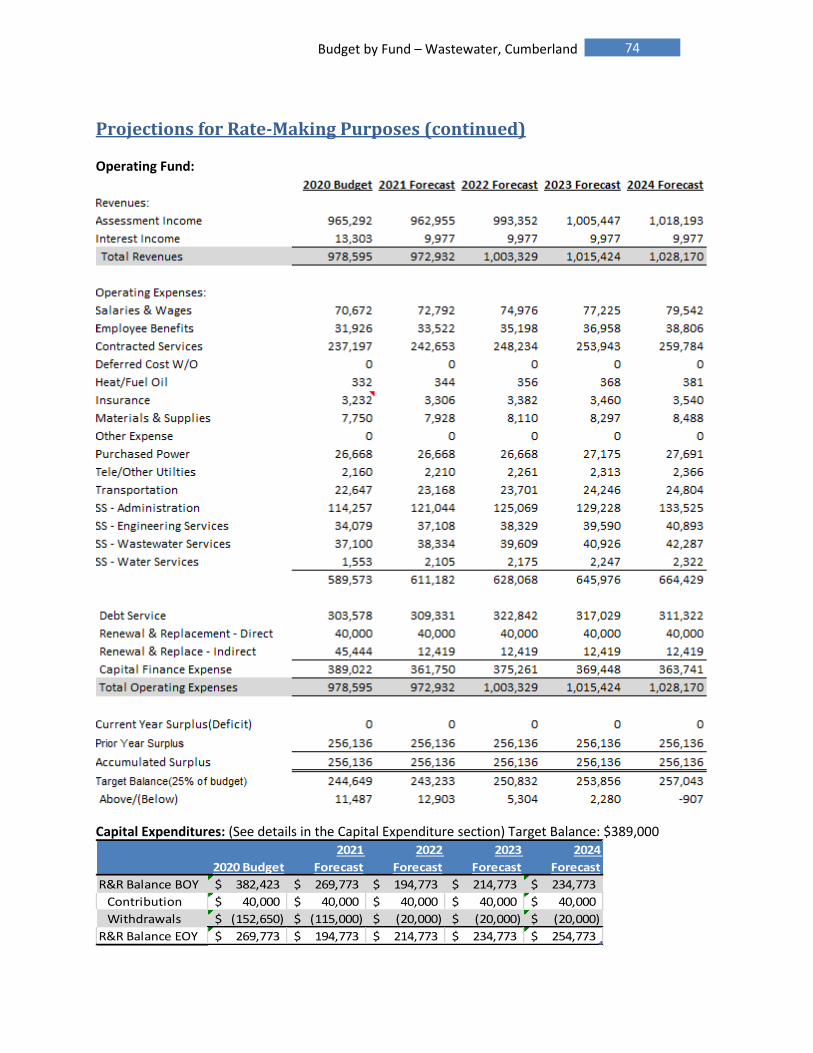
74 Budget by Fund – Wastewater, Cumberland
Projections for Rate-Making Purposes (continued) Operating Fund:
Capital Expenditures: (See details in the Capital Expenditure section) Target Balance: $389,000
2020 Budget
2021
Forecast
2022
Forecast
2023
Forecast
2024
Forecast
R&R Balance BOY 382,423$ 269,773$ 194,773$ 214,773$ 234,773$
Contribution 40,000$ 40,000$ 40,000$ 40,000$ 40,000$
Withdrawals (152,650)$ (115,000)$ (20,000)$ (20,000)$ (20,000)$
R&R Balance EOY 269,773$ 194,773$ 214,773$ 234,773$ 254,773$

75 Budget by Fund – Wastewater, Cumberland
Sewer Billing Statistics The District provides sewer billing services for the municipality by contract. Sewer is billed based on water consumption and is included on Portland Water District’s water bill. The municipality determines the sewer rate. Dollars collected are forwarded to the municipality weekly.

76 Budget by Fund – Wastewater, Gorham
Fund: Wastewater - Gorham
Background The Portland Water District’s charter authorizes the District to provide wastewater treatment and collection system-interceptors service to the town. By contract with the town, the District additionally operates and maintains the collectors in the sewer collection system. Gorham’s wastewater is treated at the treatment facility located in Westbrook and jointly used by the Town of Windham and City of Westbrook. Additionally, by contract, the District provides utility billing services.
Summary of Services
Provided:
Treatment
0.471 million
gallons/day
Collection System
14 Gorham only & 3
Joint use Pump
Stations with 33.7
miles of pipe
Utility Billing
Annual Billings of
$1,147,560 for 1,879
Customers (avg.
$50.89/month)

77 Budget by Fund – Wastewater, Gorham
Fund: Wastewater - Gorham
2020 Financial Summary The proposed assessment is $1,160,676; this is a 2.4% increase over the prior year and was on par with the forecasted assessment provided to the town last year. The proposed 2020 Operating Expense and Capital budgets are $1,179,131 and $3,849,150, respectively. The Operating Expense budget increase is $26,177 or 2.3%. Much of the Fund’s expense comes from joint use facilities with Westbrook and Windham. Gorham’s percentage of the wastewater flows were the same as 2019 for Westbrook but down 3.5% within the Little Falls area. The primary Capital project is upgrading the joint Westbrook Treatment Plant’s Aeration & Clarifier processes. $3.46M is Gorham’s portion of the construction cost.
Assessment Compared to Ratepayers’ Billing The municipality’s fiscal year end is June 30, while the District’s is December 31. The chart below compares the cash as collected by the District for sewer billings on their behalf and the District’s assessment for services rendered. The municipality may incur additional sewer-related costs. The municipality determines whether to increase the sewer billing rates.
$1,490,855
$1,481,756
$1,365,970
$1,207,960
$1,147,056
$1,119,792
$1,147,560
$1,147,560
$1,147,560
$1,147,560
$1,147,560
$1,147,560
$- $500,000 $1,000,000 $1,500,000 $2,000,000
FYE June 30,2024
FYE June 30,2023
FYE June 30,2022
FYE June 30,2021
FYE June 30,2020
FYE June 30,2019
Town Billing Revenue PWD Assessment
Revenue Assumptions: - Consumption is the 12
months ending June 30, 2018
- Rates Assumed: Effective Base/Per HCF Date: Nov 2006 $13.74/6.29 No change in rates since 11/1/2006.
Debt Service
32%
Salaries & Wages
9%
Renewal & Replacement10%
Contracted Services6%
Biosolids Disposal
3%
All Other Expense
40%
2020 Operating Expense
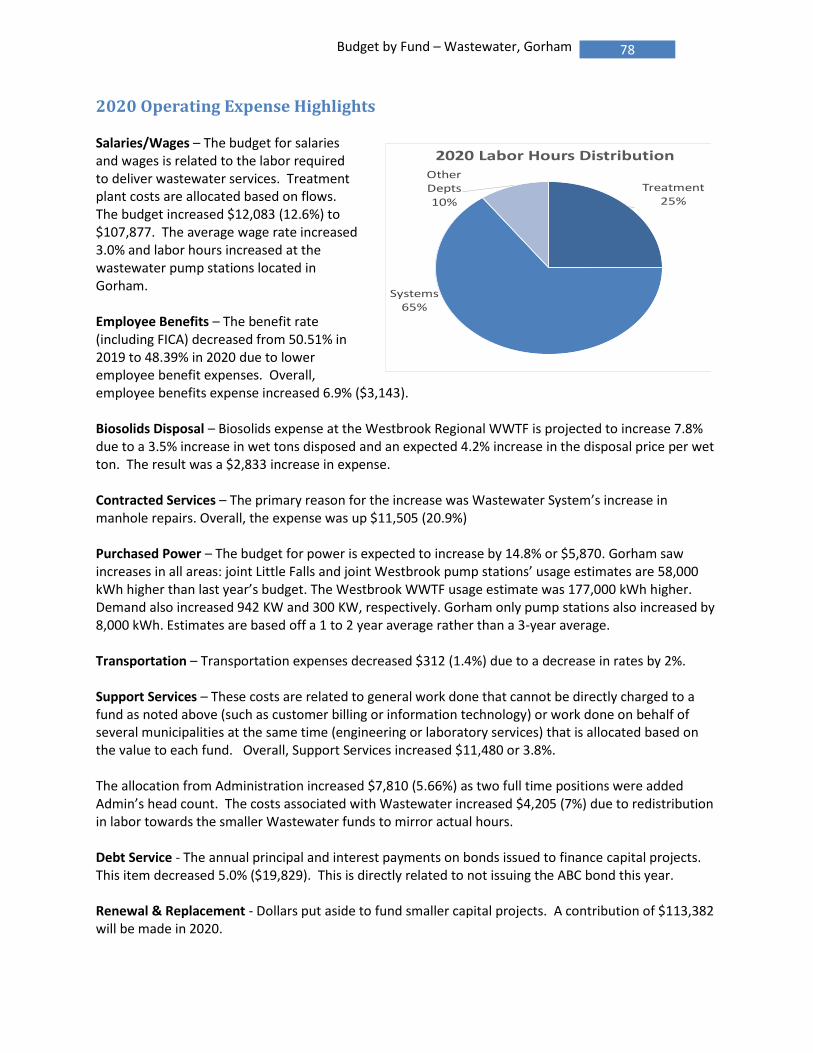
78 Budget by Fund – Wastewater, Gorham
2020 Operating Expense Highlights Salaries/Wages – The budget for salaries and wages is related to the labor required to deliver wastewater services. Treatment plant costs are allocated based on flows. The budget increased $12,083 (12.6%) to $107,877. The average wage rate increased 3.0% and labor hours increased at the wastewater pump stations located in Gorham. Employee Benefits – The benefit rate (including FICA) decreased from 50.51% in 2019 to 48.39% in 2020 due to lower employee benefit expenses. Overall, employee benefits expense increased 6.9% ($3,143). Biosolids Disposal – Biosolids expense at the Westbrook Regional WWTF is projected to increase 7.8% due to a 3.5% increase in wet tons disposed and an expected 4.2% increase in the disposal price per wet ton. The result was a $2,833 increase in expense. Contracted Services – The primary reason for the increase was Wastewater System’s increase in manhole repairs. Overall, the expense was up $11,505 (20.9%) Purchased Power – The budget for power is expected to increase by 14.8% or $5,870. Gorham saw increases in all areas: joint Little Falls and joint Westbrook pump stations’ usage estimates are 58,000 kWh higher than last year’s budget. The Westbrook WWTF usage estimate was 177,000 kWh higher. Demand also increased 942 KW and 300 KW, respectively. Gorham only pump stations also increased by 8,000 kWh. Estimates are based off a 1 to 2 year average rather than a 3-year average. Transportation – Transportation expenses decreased $312 (1.4%) due to a decrease in rates by 2%. Support Services – These costs are related to general work done that cannot be directly charged to a fund as noted above (such as customer billing or information technology) or work done on behalf of several municipalities at the same time (engineering or laboratory services) that is allocated based on the value to each fund. Overall, Support Services increased $11,480 or 3.8%. The allocation from Administration increased $7,810 (5.66%) as two full time positions were added Admin’s head count. The costs associated with Wastewater increased $4,205 (7%) due to redistribution in labor towards the smaller Wastewater funds to mirror actual hours. Debt Service - The annual principal and interest payments on bonds issued to finance capital projects. This item decreased 5.0% ($19,829). This is directly related to not issuing the ABC bond this year. Renewal & Replacement - Dollars put aside to fund smaller capital projects. A contribution of $113,382 will be made in 2020.
Treatment25%
Systems65%
Other Depts10%
2020 Labor Hours Distribution

79 Budget by Fund – Wastewater, Gorham
2018
Actual
2019
Jan-Jun
2019
Budget
2020
Budget
Budget
Diff $
Budget
Diff %
Assessment Income $1,106,148 $566,718 $1,133,436 $1,160,676 $27,240 2.4%Interest Income 26,287 24,528 19,518 18,455 -1,063 -5.4%Other Income 882 0 0 0 0 n/aFEMA Reimbursement -410 0 0 0 0 n/aTotal Revenue 1,132,907 591,246 1,152,954 1,179,131 26,177 2.3%
Salaries & Wages 99,590 41,189 95,794 107,877 12,083 12.6%Employee Benefits 58,045 21,908 36,229 39,062 2,833 7.8%Biosolids Disposal 49,421 19,790 45,569 48,712 3,143 6.9%Chemicals 17,686 10,101 9,169 16,098 6,929 75.6%Contracted Services 82,311 20,008 54,977 66,482 11,505 20.9%Deferred Cost W/O 18,363 0 0 0 0 n/aHeat/Fuel Oil 4,705 6,509 5,327 5,559 232 4.4%Insurance 1,386 650 1,271 1,369 98 7.7%Materials & Supplies 38,328 11,525 26,937 23,708 -3,229 -12.0%Other Expense 981 951 789 854 65 8.2%Purchased Power 54,294 25,958 39,657 45,527 5,870 14.8%Tele/Other Utilties 3,750 1,408 2,959 3,042 83 2.8%Transportation 19,908 12,081 21,954 21,642 -312 -1.4%SS - Administration 135,215 63,341 138,078 145,888 7,810 5.7%SS - Engineering Services 43,420 22,931 71,809 69,881 -1,928 -2.7%SS - Environmental Services 21,014 11,104 23,553 24,891 1,338 5.7%SS - Wastewater Services 64,594 28,930 59,888 64,093 4,205 7.0%SS - Water Services 1,769 959 2,468 2,523 55 2.2%Operating Expense 714,780 299,343 636,428 687,208 50,780 8.0%Debt Service & Lease Expense 373,303 188,129 398,370 378,541 -19,829 -5.0%Renewal & Replacement - Direct 86,690 50,000 100,000 90,800 -9,200 -9.2%Renewal & Replace - Indirect 18,392 9,524 18,156 22,582 4,426 24.4%Total Expense 1,193,165 546,996 1,152,954 1,179,131 26,177 2.3%
Current Year Surplus (Deficit) -60,258 44,250 0 0OPEB Surplus Allocated 3,361 0 0 0Prior Year Surplus 310,000 253,103 310,054 294,783Accumulated Surplus 253,103 297,353 310,054 294,783
$0
$100,000
$200,000
$300,000
$400,000
$500,000
$600,000
$700,000
2019 2020
Gorham only
Gorham Only – Expense up 2.7% or $16.7k.
$0
$250,000
$500,000
$750,000
$1,000,000
$1,250,000
$1,500,000
$1,750,000
2019 2020
Westbrook Joint
Westbrook JT – Expense up 8.4%; Gorham’s share of expense unchanged (13.0%), net expense up $17.4k (7.3%).
$0
$100,000
$200,000
$300,000
$400,000
$500,000
2019 2020
Little Falls Joint
Little Falls JT – Expense down $9.0k, Gorham’s share of expense was down (28.0% to 24.5%), net expense down $7.9k (2.7%).

80 Budget by Fund – Wastewater, Gorham
Operation Summary Wastewater Treatment: All wastewater generated in Gorham is being treated at the Westbrook/ Gorham/Windham Regional WWTF. The table below shows flow from the Gorham and Little Falls section of Gorham to the regional facility. The Town of Gorham shares operational costs at the treatment facility in Westbrook based on the amount of flow the town contributes to the total flow through the treatment facility. Gorham has 30.8% of the treatment facility capacity, or 1,398,320 gallons per day.
Area 2017 Gorham Flow Westbrook WWTF Flow % Gorham Flow
Total Gorham Flow 0.41 mgd 3.04 mgd 13%
WGWWTF Capacity
Gorham Capacity (30.8%)
2017 - % Capacity Used Capacity Remaining
4.54 mgd 1.398 mgd 29% 0.99 mgd
Flow from Gorham remained steady. The Town of Gorham utilized only 29% of the allotted capacity at the treatment plant and has just under 1 million gallons per day of capacity remaining at the treatment plant.
Wastewater Conveyance – interceptors and pumping stations
Parameter 2019 Actual to Sept 2020 Projected
Preventive Work Orders 307 275
Corrective Work Orders 13 20
Wet wells cleaned 29 30
Debris removed (tons) 45.5 35
Dry Weather Overflows 1 0
0
0.2
0.4
0.6
0.8
1
1.2
1.4
1.6
2010 2011 2012 2013 2014 2015 2016 2017 2018
Gorham - Wastewater Flow (million gallons per day)
Flow
Capacity

81 Budget by Fund – Wastewater, Gorham
Operation Summary (continued)
2019 Other Highlights
• The Asset Management Program will continue to drive the preventive maintenance program, generating both monthly and annual preventive maintenance work orders for each of the pump stations.
• The aeration system at the Westbrook/Gorham/Windham Regional WWTF was evaluated in 2015. Several possible approaches to design of the new system were identified and are dependent on future phosphorus permit limits. The loadings to the treatment facility have increased and are creating some operational challenges. Design of the new system is anticipated in 2019 with construction of the upgraded system currently contemplated for 2021.
• Recognizing the increased loading at the treatment plant and in anticipation of the aeration system upgrade in 2020, acceptance of septage at the plant has ceased until after the completion of the aeration upgrade. Septage is being accepted at the East End WWTF in Portland.
• Wet wells will continue to be scheduled for cleaning on a quarterly basis. • Emergency generators installed at existing pump stations, and the installation of generators
as part of new installations have reduced the need to respond to these critical stations during system power failures, improving the level of service to customers.
• The odor control system at the Mallison Falls Pump Station has worked well since it was installed in the summer of 2012. We have received no odor complaints since its installation. We continue to maintain the system and replace the odor removing media on an annual basis.
• The new dewatering system (screw press) at the treatment facility was installed in 2018. Following an extended start-up, the Operations Team has been able to optimize the equipment and performance of the system has increased dramatically. Through September, the %TS had increased from only 15.6 % the year before to 20.1% TS in 2019. This results in the removal of roughly 1,466,000 lbs. of water from the biosolids managed by the facility. This has resulted in a savings in excess of $50,000 over past years.
2020 Work Plan
• The Asset Management Program will continue to drive the preventive maintenance program, generating both monthly and annual preventive maintenance work orders for each of the pump stations.
• Wet wells will continue to be scheduled for cleaning on a quarterly basis. • The Gorham radio network enabling SCADA communication (control system) will be
upgraded to replace the legacy system. • The Westbrook/Gorham/Windham Regional WWTF will have major work on a number of
process areas, including the dewatering conveyance system, odor control for the sludge storage tank and polymer system additions.
• Design of the aeration system upgrade began in 2019.

82 Budget by Fund – Wastewater, Gorham
Capital Summary A five-year capital plan is updated each year. The projects are prioritized based on operational needs and financing availability. The table below indicates the projects scheduled for the next fiscal year and the funding source of those projects. Detailed descriptions of the projects can be found in the Capital Finance and Capital Expenditures sections.
Expenditures by CIP Year:
Prior CIP 2020 CIP Total
Projects:
SCADA & Technology
SCADA Radio Modem Replacement - 3126 (prorated) 141,750$ 141,750$
WW Collection & Pumping -$
Gorham Only Pump Station R&R - 3137 20,000$ 20,000$
Little River Bridge Forcemain Replacement (prorated) 207,000$ 207,000$
WW Treatment -$
Westbrook Treatment Plant -$
Treatment Plant R&R - 3132 (prorated) 15,400$ 15,400$
Sludge Storage Odor Control - 3025 (prorated) 231,000$ 231,000$
Aeration & Clarifier Design - 3022 (prorated) 231,000$ 231,000$
Aeration & Clarifier Construction - 3023 (prorated) 3,465,000$ 3,465,000$
Total by CIP Year 462,000$ 3,849,150$ 4,311,150$
Source of Funds:
R&R Fund Bond Issue 2020 Bond Issue 2021 Funding Total
Beginning Balance 925,773$
2020 Contribution 90,800$
Total R&R Balance Available 1,016,573$
Projects:
SCADA & Technology 141,750$ 141,750$
WW Collection & Pumping 227,000$ 227,000$
WW Treatment 15,400$ 462,000$ 3,465,000$ 3,942,400$
Total 384,150$ 462,000$ 3,465,000$ 4,311,150$
Ending Balance 632,423$
Prorated Projects: Costs of projects done on infrastructure used by multiple communities are ‘prorated’ between the municipalities based on relative design capacity. In the case of the SCADA radio modem replacement project, the proration is based on there being 15 Gorham pump stations out of the 37 total pump stations that are planned to have work done in 2020. This project was postponed from 2019.

83 Budget by Fund – Wastewater, Gorham
Projections for Rate-Making Purposes Multi-year projections are made for each of the wastewater funds’ assessment. The projections provide guidance to the wastewater municipalities to assist them in determining their wastewater sewer rates. A summary of the projection is provided on next page. Major Assumptions: The assumptions incorporated in the projections are as follows:
Salary increases of 3.0% each year. Additional 1.25 headcount in 2021.
Benefit increases of 5% each year.
Biosolids contract expires in 2021; assumed 1.8% increase in unit prices. Contract renewal in 2022 may result in a significant increase but it is unknown so not forecasted.
Other expenses increase between 2.3% and 3.5% each year.
New debt service and renewal/replacement fund expenditures consistent with the 2020 5-year capital plan. New debt assumed a 20-year life at 3% interest.
Summary of Projection Impact: Assessment is projected to increase to $1,494,896 in 2024, a 29% increase over 2020 Budget, with the most significant cost change related to debt service issued to finance capital projects. Operating Reserve balance is slightly below target balance by 2024 and Capital R&R balance are below the target balances for all years. Debt Service as a percent of budget is high due to Gorham’s request to connect the Little Falls area to
the Westbrook Regional Treatment Plant and significant upcoming upgrades at the treatment plant.

84 Budget by Fund – Wastewater, Gorham
Projections for Rate-Making Purposes (continued)
Operating Fund:
Capital Expenditures: (See details in the Capital Expenditure section) Target Balance: $882,000
2020 Budget 2021 Forecast 2022 Forecast 2023 Forecast 2024 Forecast
R&R Balance BOY 925,773$ 632,423$ 481,423$ 162,123$ 226,723$
Contribution 90,800$ 100,000$ 100,000$ 100,000$ 100,000$
Withdrawals (384,150)$ (251,000)$ (419,300)$ (35,400)$ (312,600)$
R&R Balance EOY 632,423$ 481,423$ 162,123$ 226,723$ 14,123$
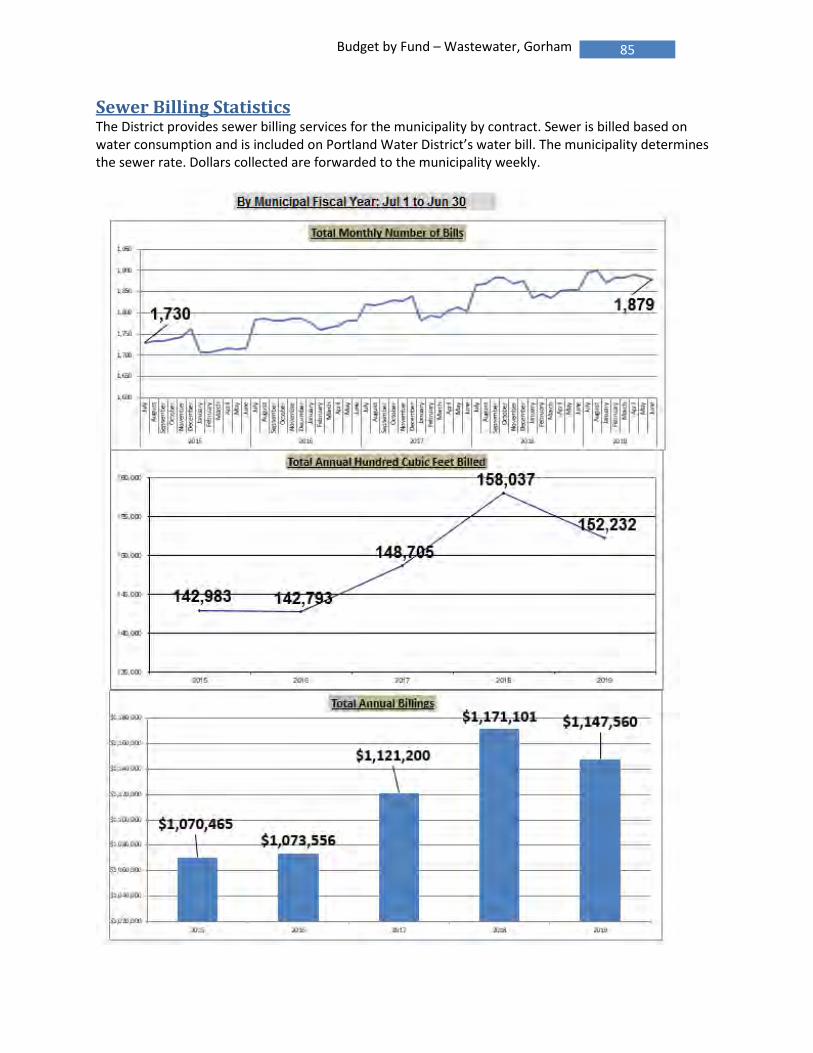
85 Budget by Fund – Wastewater, Gorham
Sewer Billing Statistics The District provides sewer billing services for the municipality by contract. Sewer is billed based on water consumption and is included on Portland Water District’s water bill. The municipality determines the sewer rate. Dollars collected are forwarded to the municipality weekly.

86 Budget by Fund – Wastewater, Portland
Fund: Wastewater - Portland
Background The Portland Water District’s charter authorizes the District to provide wastewater treatment, collection system and interception services to the city. By contract with the city, the District additionally provides Peaks Island’s collection system-collector and storm water system services. The city maintains the mainland’s collection system- collectors that transport wastewater from user’s property to the District’s interceptors. Additionally, by contract, the District provides utility billing services.
Summary of Services
Provided:
Treatment
Mainland: 18.07 million
gallons/day
Peaks Island: 0.104
million gallons/day
Collection System
14 Pump Stations with
23.5 miles of pipe
Storm Water system
Peaks Island with 1.9
miles of pipe
Utility Billing
Annual Billings of
$24,790,430 on 17,136
Customers (avg.
$120.56/month)

87 Budget by Fund – Wastewater, Portland
Fund: Wastewater - Portland
2020 Financial Summary The city’s assessment will increase 2.0% or $247,260 to $12,863,340. The proposed 2020 Operating Expense and Capital budgets are $13,227,844 and $4,545,000, respectively. The Operating Expense budget is $365,225 or 2.8%, lower than the previous year. Departmental expense increased by 3% or $277,320. Debt service decreased $141,941 (5.4%) and renewal & replacement (direct and indirect) will increase $1,317,013 to $229,846.
Assessment Compared to Ratepayers’ Billing The municipality’s fiscal year end is June 30, while the District’s is December 31. The chart below compares the sewer billing cash as collected by the District on their behalf and the District’s assessment for services rendered. The municipality may incur additional sewer-related costs. The municipality determines whether to increase the sewer billing rates.
$14,372,925
$14,054,655
$13,591,743
$13,027,145
$12,739,710
$12,432,252
$28,738,903
$27,901,847
$27,089,172
$26,300,167
$25,534,143
$24,790,430
$- $10,000,000 $20,000,000 $30,000,000 $40,000,000
FYE June 30,2024
FYE June 30,2023
FYE June 30,2022
FYE June 30,2021
FYE June 30,2020
FYE June 30,2019
City Billing Revenue PWD Assessment
Debt Service
19%
Salaries & Wages
9%
Renewal & Replacement
10%
Contracted Services
5%
Biosolids Disposal
10%
All Other Expense
47%
2020 Operating Expense
Revenue Assumptions: - Consumption is the 12
months ending June 30, 2017
- Rates Assumed: Effective Base/Per HCF Date: Jul 1 2013 $8.35 Jul 1 2014 $8.81 Jul 1 2015 $9.70 Jan1 2016 $8.20 Jan 1 2017 $9.35 Jul 1 2017 $9.65 Jul 1 2018 $9.95 Jul 1 2019 $10.40 Assumed 3% increase in July 2020 to 2024.

88 Budget by Fund – Wastewater, Portland
2020 Operating Expense Highlights Salaries/Wages – Budgeted expenses decreased 1.8% or $21,853 to $1,182,968. The decrease was primarily due to a decrease in hours (5.6%) from the Treatment Department, Systems, and Engineering.
Employee Benefits – The benefit rate (including FICA) decreased from 50.51% in 2019 to 48.39% in 2020 due to lower overall employee expenses. Overall, Employee Benefits expense decreased 6.6% ($36,432) due to less labor time allocated to Portland. Biosolids Disposal – The budget for this item was increased 1.8% ($24,581). The budget assumes a decrease in volume (wet tons) of 2.2% due to a downward trend in volume (dry tons) processed at the treatment plant. The assumption for “percent total solids” (%TS) of 21% is unchanged from 2019 Budget. The disposal rate (per wet ton) is expected to increase 4.2% over the prior budget. Chemicals – Overall, this category is up $55,121 or 9.4%. The majority of this increase is related to the 24% increase in per unit costs of Sodium Bisulfite, the chemical used to dechlorinate water in the treatment process. The budget for that chemical is increasing $42,896 or 26.9%. Polymer is also increased by 25% or $41,300 because of a rise in both the projected usage (14%) and per unit price (9%).
Heat/Fuel Oil – The majority of this category is pipeline delivered natural gas but the increase involves container delivered propane at the East End WWTF. The container delivered budget has increased $31,100 or (255%) which is 92% of the total fuel budget increase to reflect better usage estimate. Purchased Power – Power is expected to increase 6.2% ($61,622). Energy contracts reduced the energy rate for East End WWTF & India St. pump station in 2020. Usage for these two sites is estimated to increase 114,000 kWh and 153,000 kWh, respectively and net a demand increase of 900 KW. Medium and small accounts combined is estimated to net a reduction in usage of 22,500 kWh and a higher demand of 286 KW. Transportation – The budget increased $9,021 (11.9%). This is primarily due to a projected use of higher costing vehicles this year based on past utilization. Support Services – These costs are related to general work done that cannot be directly charged to a fund as noted above (such as customer billing or information technology) or work done on behalf of several municipalities at the same time (engineering or laboratory services) that is allocated based on the value to each fund. The combined Support Services costs increased 0.49% ($15,784). The allocation from Administration increased $55,052 (3.8%) because of the two new authorized head count in Information Services and Employee Services. The costs associated with Engineering and
Treatment75%
Systems16%
Other Depts
9%
2020 Labor Hours Distribution
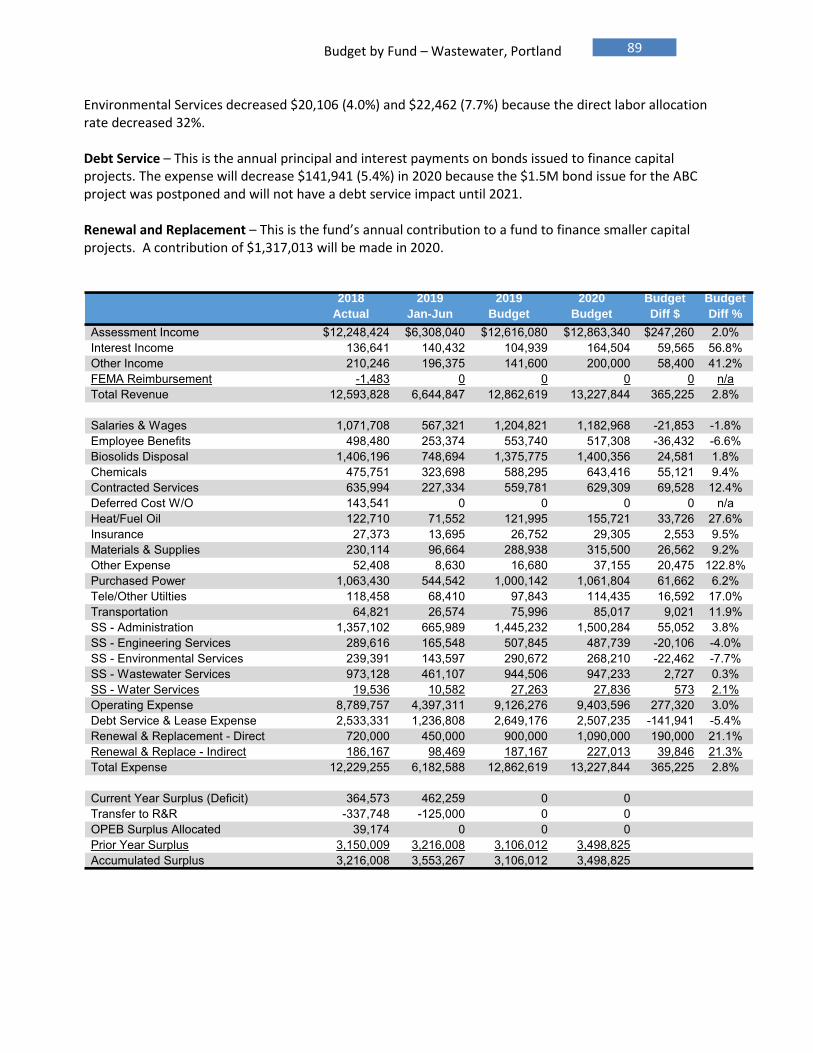
89 Budget by Fund – Wastewater, Portland
Environmental Services decreased $20,106 (4.0%) and $22,462 (7.7%) because the direct labor allocation rate decreased 32%. Debt Service – This is the annual principal and interest payments on bonds issued to finance capital projects. The expense will decrease $141,941 (5.4%) in 2020 because the $1.5M bond issue for the ABC project was postponed and will not have a debt service impact until 2021. Renewal and Replacement – This is the fund’s annual contribution to a fund to finance smaller capital projects. A contribution of $1,317,013 will be made in 2020.
2018
Actual
2019
Jan-Jun
2019
Budget
2020
Budget
Budget
Diff $
Budget
Diff %
Assessment Income $12,248,424 $6,308,040 $12,616,080 $12,863,340 $247,260 2.0%Interest Income 136,641 140,432 104,939 164,504 59,565 56.8%Other Income 210,246 196,375 141,600 200,000 58,400 41.2%FEMA Reimbursement -1,483 0 0 0 0 n/aTotal Revenue 12,593,828 6,644,847 12,862,619 13,227,844 365,225 2.8%
Salaries & Wages 1,071,708 567,321 1,204,821 1,182,968 -21,853 -1.8%Employee Benefits 498,480 253,374 553,740 517,308 -36,432 -6.6%Biosolids Disposal 1,406,196 748,694 1,375,775 1,400,356 24,581 1.8%Chemicals 475,751 323,698 588,295 643,416 55,121 9.4%Contracted Services 635,994 227,334 559,781 629,309 69,528 12.4%Deferred Cost W/O 143,541 0 0 0 0 n/aHeat/Fuel Oil 122,710 71,552 121,995 155,721 33,726 27.6%Insurance 27,373 13,695 26,752 29,305 2,553 9.5%Materials & Supplies 230,114 96,664 288,938 315,500 26,562 9.2%Other Expense 52,408 8,630 16,680 37,155 20,475 122.8%Purchased Power 1,063,430 544,542 1,000,142 1,061,804 61,662 6.2%Tele/Other Utilties 118,458 68,410 97,843 114,435 16,592 17.0%Transportation 64,821 26,574 75,996 85,017 9,021 11.9%SS - Administration 1,357,102 665,989 1,445,232 1,500,284 55,052 3.8%SS - Engineering Services 289,616 165,548 507,845 487,739 -20,106 -4.0%SS - Environmental Services 239,391 143,597 290,672 268,210 -22,462 -7.7%SS - Wastewater Services 973,128 461,107 944,506 947,233 2,727 0.3%SS - Water Services 19,536 10,582 27,263 27,836 573 2.1%Operating Expense 8,789,757 4,397,311 9,126,276 9,403,596 277,320 3.0%Debt Service & Lease Expense 2,533,331 1,236,808 2,649,176 2,507,235 -141,941 -5.4%Renewal & Replacement - Direct 720,000 450,000 900,000 1,090,000 190,000 21.1%Renewal & Replace - Indirect 186,167 98,469 187,167 227,013 39,846 21.3%Total Expense 12,229,255 6,182,588 12,862,619 13,227,844 365,225 2.8%
Current Year Surplus (Deficit) 364,573 462,259 0 0Transfer to R&R -337,748 -125,000 0 0OPEB Surplus Allocated 39,174 0 0 0Prior Year Surplus 3,150,009 3,216,008 3,106,012 3,498,825Accumulated Surplus 3,216,008 3,553,267 3,106,012 3,498,825

90 Budget by Fund – Wastewater, Portland
Operation Summary Wastewater Treatment: The Portland Water District owns, operates and maintains the interceptor and treatment facilities in the City of Portland. The largest facility, the East End WWTF is located off the Eastern Promenade while the Peaks Island facility is located by the ferry dock on the island.
EEWTF Parameter Capacity 2018 Facility Avg 2018 - % Capacity Used
Flow (million gallons per day) 19.8 mgd 17.72 mgd 89 %
Biosolids Removed (wet tons/month) N/A 1,914 wt/month
Effluent Permit Requirements:
35
15
35
7 714
49
7 12
0
20
40
60
2010 2011 2012 2013 2014 2015 2016 2017 2018
EEWWTF License Exceedences
6
23
8
1 1 0 1
8 8
0
10
20
30
Peaks Island WWTF License Exceedences
Parameter Discussion
Biological Oxygen Demand (BOD)
Measure of organic material and the strength of pollution. The treatment plant removed 97% of the BOD; well above the required 85% removal. This is an increase in pollution removal efficiency and is related to the new diffused aeration system that was constructed over the past several years.
Total Suspended Solids (TSS) Measure of suspended material in the incoming wastewater; also the strength of pollution. The treatment plant removed 97% of the TSS, well above the required 85% removal. This is an increase in pollution removal efficiency and is related to the new diffused aeration system that was constructed over the past several years.
Total Residual Chlorine Used for disinfecting the treated effluent, chlorine must be removed before the effluent is discharged. The permit limit was met at all times.
Fecal Coliform Bacteria Following disinfection with chlorine, the fecal coliform level is monitored to confirm the treatment plant effluent was properly disinfected.
Effluent Nitrogen Nitrogen is considered a pollutant that can contribute to water quality issues. The new permit requires monitoring of nitrogen during the warmer months and the development of a “nitrogen optimization” approach where PWD will be asked to operate the plant to reduce the effluent nitrogen loading using existing facilities. To date in 2019, the plant has demonstrated nearly 70% reduction in effluent nitrogen loading from historic levels from May to September.

91 Budget by Fund – Wastewater, Portland
Operation Summary (continued) The 5-year permit issued in 2017 asked PWD to submit an annual “nutrient optimization” report that includes effluent nitrogen results and our efforts to manage nitrogen. The new aeration system is anticipated to be able achieve a 20 – 40% reduction in effluent nitrogen levels. In 2019, the plant has demonstrated a 67% reduction in effluent nitrogen loading from historic levels from May to September. In 2018, the plant demonstrated a 72% reduction. The treatment facility on Peaks Island provides wastewater treatment to the residents and businesses on Peaks Island. The Peaks Island WWTF permit requires monitoring of effluent nitrogen from the treatment plant. Waste solids generated on the island are hauled to the mainland and processed at the Portland’s East End Wastewater Treatment Facility. With the completion of the Island Avenue sewer extension project and eventual connection of those customers adjacent to the new sewer, the capacity in the treatment plant has essentially been reached. In 2018, an analysis of the current capacity, along with suggested upgrades or opportunities for capacity improvements, was completed. Treatment plants have both a hydraulic (flow) and loading (amount of pollution that can be treated) capacity. As show below, while specific high volume storm events are problematic, the plant flow is within the design capacity of the plants. However, the Peaks Island Plant pollutant loading during the peak season is regularly at the capacity of the treatment plant. This has been well managed, but additional sewer connections beyond the current amount and those connected as part of the sewer extension, cannot be readily accommodated by the current facility.
Wastewater Conveyance – interceptors and pumping stations
0
5
10
15
20
25
2010 2011 2012 2013 2014 2015 2016 2017 2018
East End WWTF -Wastewater Flow (million
gallons per day)
Flow Capacity
0
0.05
0.1
0.15
0.2
0.25
0.3
2010 2011 2012 2013 2014 2015 2016 2017 2018
Peaks WWTF - Wastewater Flow
(million gallons per day)
Parameter 2019 Actual to Sept 2020 Projected
Preventive Work Orders 201 200
Corrective Work Orders 29 45
Wet wells cleaned 12 15
Debris removed (tons) 10.38 15
Dry Weather Overflows 1 0
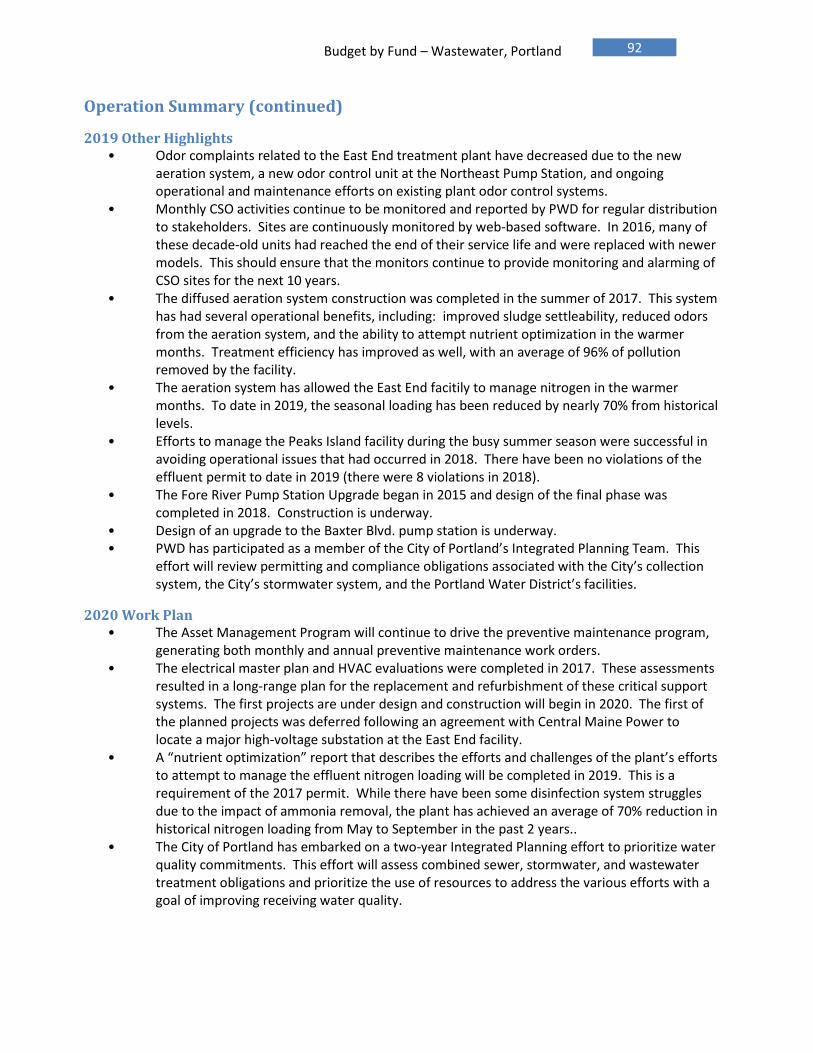
92 Budget by Fund – Wastewater, Portland
Operation Summary (continued)
2019 Other Highlights • Odor complaints related to the East End treatment plant have decreased due to the new
aeration system, a new odor control unit at the Northeast Pump Station, and ongoing operational and maintenance efforts on existing plant odor control systems.
• Monthly CSO activities continue to be monitored and reported by PWD for regular distribution to stakeholders. Sites are continuously monitored by web-based software. In 2016, many of these decade-old units had reached the end of their service life and were replaced with newer models. This should ensure that the monitors continue to provide monitoring and alarming of CSO sites for the next 10 years.
• The diffused aeration system construction was completed in the summer of 2017. This system has had several operational benefits, including: improved sludge settleability, reduced odors from the aeration system, and the ability to attempt nutrient optimization in the warmer months. Treatment efficiency has improved as well, with an average of 96% of pollution removed by the facility.
• The aeration system has allowed the East End facitily to manage nitrogen in the warmer months. To date in 2019, the seasonal loading has been reduced by nearly 70% from historical levels.
• Efforts to manage the Peaks Island facility during the busy summer season were successful in avoiding operational issues that had occurred in 2018. There have been no violations of the effluent permit to date in 2019 (there were 8 violations in 2018).
• The Fore River Pump Station Upgrade began in 2015 and design of the final phase was completed in 2018. Construction is underway.
• Design of an upgrade to the Baxter Blvd. pump station is underway. • PWD has participated as a member of the City of Portland’s Integrated Planning Team. This
effort will review permitting and compliance obligations associated with the City’s collection system, the City’s stormwater system, and the Portland Water District’s facilities.
2020 Work Plan • The Asset Management Program will continue to drive the preventive maintenance program,
generating both monthly and annual preventive maintenance work orders. • The electrical master plan and HVAC evaluations were completed in 2017. These assessments
resulted in a long-range plan for the replacement and refurbishment of these critical support systems. The first projects are under design and construction will begin in 2020. The first of the planned projects was deferred following an agreement with Central Maine Power to locate a major high-voltage substation at the East End facility.
• A “nutrient optimization” report that describes the efforts and challenges of the plant’s efforts to attempt to manage the effluent nitrogen loading will be completed in 2019. This is a requirement of the 2017 permit. While there have been some disinfection system struggles due to the impact of ammonia removal, the plant has achieved an average of 70% reduction in historical nitrogen loading from May to September in the past 2 years..
• The City of Portland has embarked on a two-year Integrated Planning effort to prioritize water quality commitments. This effort will assess combined sewer, stormwater, and wastewater treatment obligations and prioritize the use of resources to address the various efforts with a goal of improving receiving water quality.

93 Budget by Fund – Wastewater, Portland
Capital Summary A five-year capital plan is updated each year. The projects are prioritized based on operational needs and financing availability. The table below indicates the projects scheduled for the next fiscal year and the funding source of those projects. Detailed descriptions of the projects can be found in the Capital Finance and Capital Expenditures sections.
Expenditures by CIP Year:
Projects: Prior CIP 2020 CIP Total
SCADA & Technology 1,500,000$ 9,450$ 1,509,450$
WW Collection & Pumping 4,435,000$ 2,000,000$ 6,435,000$
WW Treatment 4,810,000$ 2,545,000$ 7,355,000$
Total by CIP Year 10,745,000$ 4,554,450$ 15,299,450$
Source of Funds: R&R Fund Bond Issue 2020 Bond Issue 2021 Total Funding
Beginning Balance 4,347,209$
2020 Contribution 1,090,000$
Total R&R Balance Available 5,437,209$
Projects:
SCADA & Technology 9,450$ 1,500,000$ 1,509,450$
WW Collection & Pumping 315,000$ 3,920,000$ 2,200,000$ 6,435,000$
WW Treatment 795,000$ 5,985,000$ 575,000$ 7,355,000$
Total 1,119,450$ 11,405,000$ 2,775,000$ 15,299,450$
Ending Balance 4,317,759$
$4,170,000
$4,810,000
$1,500,000
$265,000
$1,950,000
$1,750,000
$50,000
$795,000
$9,450
Collection
Treatment
Technology
Collection
Collection
Treatment
Collection
Treatment
Scada
Bon
dsR
&R
Bon
dsR
&R
Prio
r C
IP20
20 C
IP

94 Budget by Fund – Wastewater, Portland
Capital Summary (continued)
Projects:
R&R Fund Future Bond Funding Total
Bond Issue
Year
SCADA & Technology
Asset, Billing, Customer Relations System - 2542 1,500,000$ 1,500,000$ 2020
SCADA Radio Modem Replacement - 3126* 9,450$ 9,450$
WW Collection & Pumping
CSO Program - 131 (India St. Tide Gate) - 2577 420,000$ 420,000$ 2020
Stroudwater PS Upgrades Phase 2 - 3006 265,000$ 265,000$
Portland Pump Station R&R - 3135 50,000$ 50,000$
Baxter Blvd PS Upgrades Design - 3144 250,000$ 250,000$ 2021
Baxter Blvd PS Construction - 3143 1,950,000$ 1,950,000$ 2021
Fore River PS Upgrades - 2424 3,500,000$ 3,500,000$ 2020
WW Treatment
East End Treatment Facility 2018 Security Improvements - 2564 25,000$ 25,000$
Influent Screen, Effluent Meter, Piping - 2046 960,000$ 960,000$ 2020
HVAC Upgrades Dewatering Area - 2705 525,000$ 525,000$ 2020
Backup Power Upgrade - 3010 2,000,000$ 2,000,000$ 2020
Primary Clarifier Rehabilitation - 3013 750,000$ 750,000$ 2020
Main 12.4 kV Power Distribution Upgrades 1,750,000$ 1,750,000$ 2020
HVAC Upgrades 3rd Floor - 3017 575,000$ 575,000$ 2021
Process Gate Automation - 3020 50,000$ 50,000$
Power Panel Upgrades - 3021 75,000$ 75,000$
Portable Wastewater Pump - 3024 250,000$ 250,000$
East End WWTF R&R - 3133 75,000$ 75,000$
Odor Control System Tower #2 Rehab - 3203 250,000$ 250,000$
Pri. Gallery Electrical Upgrade Design - 3208 50,000$ 50,000$
Peaks Island Treatment Facility R&R - 3131 20,000$ 20,000$
Total 1,119,450$ 14,180,000$ 15,299,450$
*This cost is for one pump station. This project was postponed from 2019.

95 Budget by Fund – Wastewater, Portland
Projections for Rate-Making Purposes
Multi-year projections are made for each of the wastewater funds’ assessment. The projections provide guidance to the wastewater municipalities to assist them in determining their wastewater sewer rates. A summary of the projection is provided on next page. Major Assumptions: The assumptions incorporated in the projections are as follows:
Salary increases of 3.0% each year. Additional 1.25 headcount in 2021.
Benefit increases of 5% each year.
Biosolids contract expires in 2021; assumed 1.8% increase in unit prices. Contract renewal in 2022 may result in a significant increase but it is unknown so not forecasted.
Other expenses increase between 2.3% and 3.5% each year.
New debt service and renewal/replacement fund expenditures consistent with the 2020 5-year capital plan. New debt assumed a 20-year life at 3% interest.
Summary of Projection Impact: Assessment is projected to increase to $14,629,076 in 2024, a 12% increase over 2020 Budget, with the most significant cost change related to debt service issued to finance capital projects. Operating Reserve balance and Capital R&R balance are below the target balances.

96 Budget by Fund – Wastewater, Portland
Projections for Rate-Making Purposes (continued) Operating Fund:
Capital Expenditures: (See details in the Capital Expenditure section) Target Balance: $5,601,000
2020 Budget 2021 Forecast 2022 Forecast 2023 Forecast 2024 Forecast
R&R Balance BOY 4,347,209$ 4,317,759$ 3,662,759$ 3,792,759$ 3,797,759$
Contribution 1,090,000$ 900,000$ 900,000$ 900,000$ 900,000$
Withdrawals (1,119,450)$ (1,555,000)$ (770,000)$ (895,000)$ (1,095,000)$
R&R Balance EOY 4,317,759$ 3,662,759$ 3,792,759$ 3,797,759$ 3,602,759$

97 Budget by Fund – Wastewater, Portland
Sewer Billing Statistics The District provides sewer billing services for the municipality by contract. Sewer is billed based on water consumption and is included on Portland Water District’s water bill. The municipality determines the sewer rate. Dollars collected are forwarded to the municipality weekly. The total billing decline between 2016 and 2017 is the result of the City’s implementation of a storm water fee to cover costs previously collected as part of sewer billings.

98 Budget by Fund – Wastewater, Westbrook
Fund: Wastewater - Westbrook
Background The Portland Water District’s charter authorizes the District to provide wastewater treatment collection system, and interceptor service to the city. Westbrook’s wastewater is treated at the treatment facility located in Westbrook and jointly used by the towns of Windham and Gorham. The city maintains the collection system-collectors that transport wastewater from user’s property to the District’s interceptor system. Additionally, by contract, the District provides utility billing services.
Summary of Services
Provided:
Treatment
2.397 million
gallons/day
Collection System
2 Westbrook only & 1
Joint use Pump Stations
with 9.2 miles of pipe
Utility Billing
Annual Billings of
$4,366,353 on 4,697
Customers (avg.
$77.47/month)

99 Budget by Fund – Wastewater, Westbrook
Fund: Wastewater - Westbrook
2020 Financial Summary
The proposed assessment of $2,820,768 is an 11.1% increase over the previous year. Much of this is related to the debt service associated with capital projects at the treatment plant and Dana Court pump station. The proposed 2020 Operating Expense and Capital budgets are $2,931,963 and $7,608,600 respectively. The Operating Expense budget is $292,005 higher (11.1%) than the previous year. Departmental Expense decreased by $169,160 or 9.5%, Debt Service increased 22% to $622,953 as well as Renewal & Replacement (direct and indirect) funding increased $10,304 to $351,067. An investment of
$7.49M is Westbrook’s portion of the construction cost for Aeration & Clarifier upgrades.
Assessment Compared to Ratepayers’ Billing The municipality’s and District’s fiscal year end is Dec 31. The chart below compares the cash as collected by the District for sewer billings on their behalf and the District’s assessment for services rendered. The municipality may incur additional sewer-related costs. The municipality determines whether to increase the sewer billing rates.
$3,499,603
$3,468,697
$3,440,278
$2,951,910
$2,820,768
$2,539,800
$2,533,176
$4,562,839
$4,562,839
$4,562,839
$4,562,839
$4,562,839
$4,562,839
$4,366,353
$0 $1,000,000$2,000,000$3,000,000$4,000,000$5,000,000
FYE Dec 31, 2024
FYE Dec 31, 2023
FYE Dec 31, 2022
FYE Dec 31, 2021
FYE Dec 31, 2020
FYE Dec 31, 2019
FYE Dec 31, 2018
City Billing Revenue PWD Assessment
Debt
Service21%
Renewal &
Replacement12%
Salaries &
Wages8%
Biosolids
Disposal9%
Purchased Power
8%
All Other
Expense42%
2020 Operating Expense
Revenue Assumptions: - Consumption assumed
is based on consumption through December 31, 2018
- Rates Assumed: Effective Base/Per HCF Date: Jan 2013 $11.13/$6.13 Jan 2019 $11.53/$6.53

100 Budget by Fund – Wastewater, Westbrook
2020 Operating Expense Highlights
Salaries/Wages – The expense increase of 9.4% ($21,486) has resulted in a budget amount of $250,547. District labor rates increased an average of 3.0% while hours for this fund rose 6.2% or 530. This reflects trends in the area’s labor utilization. Employee Benefits – The benefit rate (including FICA) decreased from 50.51% in 2019 to 48.39% in 2020. Overall, employee benefits expense increased 4.3% ($4,686). Biosolids Disposal – Biosolids expense at the Westbrook Regional WWTF is projected to increase 7.8% ($18,306) due to a 3.5% increase in projected wet tons disposed and an expected 4.2% increase in the price per wet ton. Westbrook’s share of allocated treatment costs remained at 84%. Chemicals – Wastewater Treatment has increased their projected chemical needs this year by $25,555 or 43.1%. The increase of chemicals is related to Sodium Hypochlorite used to disinfect and Polymer used to dewater the waste. Polymer’s price rose 9.7% as well as a 55.6% increase in the amount projected and Sodium Hypochlorite projected an 8.0% increase in quantity with an 18.8% increase in the unit price. The increase in polymer use is related to the enhanced performance of the new dewatering equipment, which requires more polymer than the previous system. Contracted Services – Contracted Services has increased $21,876 or 16.2% with the majority of the increase attributed to a new initiative in right-of-way cleaning. Heat/Fuel Oil – The increase, of $2,014 or 10.2%, was due to an increase in the contracted cost per gallon of container delivered propane in addition to increased heating needs for the treatment plant’s chemical storage area. Purchased Power – The budget for power is expected to increase by 24.8% or $46,272. Westbrook saw increases in all areas: joint Westbrook pump stations’ usage estimates are 50,000 kWh higher than last year’s budget. The Westbrook WWTF usage estimate is 177,000 kWh higher. Westbrook only pump stations also increased by 74,000 kWh. Demand increased 942 KW, 300 KW and 383 KW, respectively. Estimates are based off a 1 to 2 year average. Support Services – These costs are related to general work done that cannot be directly charged to a fund as noted above (such as customer service or information technology) or work done on behalf of several municipalities at the same time (engineering or laboratory services) that is allocated based on the value to each fund. Overall, Support Services increased $39,257 or 5.5%. The allocation from Administration increased $19,513 (6.1%) because of the two new authorized head count in Information Services and Employee Services. The costs associated with Wastewater increased $13,943 (8.1%) due to redistribution in labor towards the smaller Wastewater funds to mirror actual hours. Debt Service – The annual principal and interest payments on bonds issued to finance capital projects, this item increased 22% ($112,541).
Treatment67%
Systems19%
Other Departments
14%
2020 Labor Hours Distribution

101 Budget by Fund – Wastewater, Westbrook
Renewal & Replacement – Dollars put aside to fund capital projects; the 2020 contribution is $351,067.
2018
Actual
2019
Jan-Jun
2019
Budget
2020
Budget
Budget
Diff $
Budget
Diff %
Assessment Income $2,533,176 $1,269,900 $2,539,800 $2,820,768 $280,968 11.1%Interest Income 80,339 79,776 62,258 72,695 10,437 16.8%Other Income 49,585 1,500 37,900 38,500 600 1.6%FEMA Reimbursement -70 0 0 0 0 n/aTotal Revenue 2,663,030 1,351,176 2,639,958 2,931,963 292,005 11.1%
Salaries & Wages 228,231 113,141 229,061 250,547 21,486 9.4%Employee Benefits 112,033 54,023 108,723 113,409 4,686 4.3%Biosolids Disposal 298,519 141,559 234,097 252,403 18,306 7.8%Chemicals 91,394 56,265 59,245 84,800 25,555 43.1%Contracted Services 99,497 33,894 135,245 157,121 21,876 16.2%Deferred Cost W/O 36,985 5,050 10,100 0 -10,100 -100.0%Heat/Fuel Oil 18,419 18,718 19,716 21,730 2,014 10.2%Insurance 4,937 2,549 4,980 5,455 475 9.5%Materials & Supplies 44,944 21,110 50,278 51,667 1,389 2.8%Other Expense 4,658 5,767 4,772 5,202 430 9.0%Purchased Power 231,793 128,139 186,224 232,496 46,272 24.8%Tele/Other Utilties 21,135 13,699 24,271 24,819 548 2.3%Transportation 7,174 4,239 12,365 9,331 -3,034 -24.5%SS - Administration 310,280 145,821 318,336 337,849 19,513 6.1%SS - Engineering Services 59,123 31,852 97,564 98,347 783 0.8%SS - Environmental Services 91,937 57,664 115,064 119,933 4,869 4.2%SS - Wastewater Services 171,534 83,907 172,049 185,992 13,943 8.1%SS - Water Services 4,796 2,598 6,693 6,842 149 2.2%Operating Expense 1,837,389 919,995 1,788,783 1,957,943 169,160 9.5%Debt Service & Lease Expense 455,918 240,164 510,412 622,953 112,541 22.0%Renewal & Replacement - Direct 370,574 150,000 300,000 300,000 0 0.0%Renewal & Replace - Indirect 41,883 21,405 40,763 51,067 10,304 25.3%Total Expense 2,705,764 1,331,564 2,639,958 2,931,963 292,005 11.1%
Current Year Surplus (Deficit) -42,734 19,612 0 0Transfer to R&R 0 0 0 0OPEB Surplus Allocated 9,213 0 0 0Prior Year Surplus 844,744 811,223 752,234 786,814Accumulated Surplus 811,223 830,835 752,234 786,814
$-
$250,000
$500,000
$750,000
$1,000,000
$1,250,000
$1,500,000
2019 2020
Westbrook Only
Westbrook Only – Westbrook Only expenses
were up $187k (11.1%) due to debt service.
$0
$250,000
$500,000
$750,000
$1,000,000
$1,250,000
$1,500,000
$1,750,000
2019 2020
Westbrook Joint
Westbrook JT – Expense up 8.4%; Westbrook’s share
of expense 84.0%, net expense up $105k (8.2%).

102 Budget by Fund – Wastewater, Westbrook
Operation Summary Wastewater Treatment: The wastewater generated in the City of Westbrook is pumped to the Westbrook/Gorham/Windham Regional WWTF on Park Road. Flows from the Little Falls section of Gorham and the Town of Windham, including the Maine Correctional Center, are conveyed to this facility. The table below depicts flows from each contributing community. The chart illustrates capacity used for each community and total plant capacity being used based on the treatment plant capacity of 4.54 MGD.
Municipality (Design Flow)
2018 Flow (mgd)
% of 2018 WWTF Flow
Reserved Capacity (mgd)
% of Capacity Used
Westbrook (66.6%) 2.79 84 % 3.023 93%
Gorham (30.8%) 0.42 13 % 1.398 30%
Windham (2.6%) 0.10 3 % 0.118 85 %
Total Plant Flow 3.31 4.54 73 %
The following tables depict some of the key parameters that are monitored at the facility.
WGWTF Parameter DEP Limit 2018 Facility Average
Biosolids Removed (wet tons/month) N/A 459 wet ton/month
0
1000
2000
3000
4000
2010 2011 2012 2013 2014 2015 2016 2017 2018
Westbrook - Wastewater Flow (million gallons per day)
Westbrook
Capacity
Parameter Discussion
Biological Oxygen Demand (BOD) Measure of organic material and the strength of pollution. The treatment plant removed 94% of the BOD, well above the required 85% removal.
Total Suspended Solids (TSS) Measure of suspended material in the incoming wastewater. The treatment plant removed 94% of the TSS, well above the required 85% removal.
Total Residual Chlorine Used for disinfecting the treated effluent, chlorine must be removed before the effluent is discharged. The permit limit was met at all times.
Fecal Coliform Bacteria Following disinfection with chlorine, the fecal coliform level is monitored to confirm the treatment plant effluent was properly disinfected.
Phosphorus The renewed 5-year permit includes a requirement to monitor phosphorus in the plant’s effluent discharge. Phosphorus can contribute to water quality concerns that might include algae and low dissolved oxygen. The monitoring will likely create a baseline for consideration if effluent permit limitations are established in the future.

103 Budget by Fund – Wastewater, Westbrook
Operation Summary (continued) Effluent Permit Requirements: The effluent permit was renewed in 2017. The permit included reductions in effluent monitoring requirements due to the plant’s past performance and the inclusion of a requirement to monitor effluent phosphorus. The City of Westbrook is a joint permittee for their obligations under the CSO Long Term Control Plan.
Wastewater Conveyance – interceptors and pumping stations
Parameter 2019 Actual to Sept 2020 Projected
Preventive Work Orders 90 80
Corrective Work Orders 22 15
Wet wells cleaned 1 3
Debris removed (tons) 3.61 6
Dry Weather Overflows 0 0
2019 Other Highlights
• The Asset Management Program will continue to drive the preventive maintenance program, generating both monthly and annual preventive maintenance work orders for each of the pump stations. The computerized maintenance management system will be replaced in 2020. Work on this is underway. The Maintenance Manager/Planner Scheduler position, which was created in 2018, will help to implement this new system and to integrate our current departmental efforts into this new management system.
• The aeration system at the Westbrook/Gorham/Windham Regional WWTF was evaluated in 2015. Several possible approaches to design of the new system were identified and are dependent on future phosphorus permit limits. The loadings to the treatment facility have increased and are creating some operational challenges. Design of the new system is anticipated in 2019 with construction of the upgraded system currently contemplated for 2021.
10
3 32
0
2
4
8
1
0
2
4
6
8
10
12
2010 2011 2012 2013 2014 2015 2016 2017 2018
Westbrook/Gorham Regional WWTF -Permit Exceedences

104 Budget by Fund – Wastewater, Westbrook
2019 Other Highlights (continued) • Recognizing the increased loading at the treatment plant and in anticipation of the aeration
system upgrade in 2020, acceptance of septage at the plant has ceased until after the completion of the aeration upgrade. Septage is being accepted at the East End WWTF in Portland.
• Wet wells will continue to be scheduled for cleaning on a quarterly basis at the three pump stations in Westbrook.
• Construction of the recent upgrade of the Dana Court Pump Station took place in 2018-2019. This is the final of the three large stations in Westbrook to have an upgrade completed (Cottage Place and East Bridge St. upgrades were completed in the past). The upgrade included the installation of a new screening system that was similar to the system previously installed at the other pump stations in Westbrook.
• The new dewatering system (screw press) at the treatment facility was installed in 2018. Following an extended start-up, the Operations Team has been able to optimize the equipment and performance of the system has increased dramatically. Through September, the % total solids had increased from only 15.6 % the year before to 20.1% total solids in 2019. This results in the removal of roughly 1,466,000 lbs. of water from the biosolids managed by the facility. This has resulted in a savings in excess of $50,000 over past years.
2020 Work Plan
• The Asset Management Program will continue to drive the preventive maintenance program, generating both monthly and annual preventive maintenance work orders for each of the pump stations.
• Wet wells will continue to be scheduled for cleaning on a quarterly basis. • The Westbrook/Gorham/Windham Regional WWTF will have major work on a number of
process areas, including the dewatering conveyance system, odor control for the sludge storage tank and polymer system additions.
• The construction of the upgraded diffused aeration system will begin in 2020. Design of the system is currently underway.

105 Budget by Fund – Wastewater, Westbrook
Capital Summary A five-year capital plan is updated each year. The projects are prioritized based on operational needs and financing availability. The table below indicates the projects scheduled for the next fiscal year and the funding source of those projects. Detailed descriptions of the projects can be found in the Capital Finance and Capital Expenditures sections.
Expenditures by CIP Year:
Prior CIP 2020 CIP Total
Projects:
SCADA & Technology
SCADA Radio Modem Replacement - 3126 (prorated) 37,800$ 37,800$
WW Collection & Pumping -$
Westbrook Pump Station R&R - 3134 20,000$ 20,000$
Modeling Update - 3164 25,000$ 25,000$
WW Treatment -$
Aeration & Clarifier Design - 3022 (prorated) 499,500$ 499,500$
Aeration & Clarifier Construction - 3023 (prorated) 7,492,500$ 7,492,500$
Sludge Storage Odor Control - 3025 (prorated) 499,500$ 499,500$
Treatment Plant R&R - 3132 (prorated) 33,300$ 33,300$
Total by CIP Year 999,000$ 7,608,600$ 8,607,600$
Source of Funds:
R&R Fund Bond Issue 2020 Bond Issue 2021 Total Funding
Beginning Balance 3,314,543$
2020 Contribution 300,000$
Total R&R Balance Available 3,614,543$
Projects:
SCADA & Technology 37,800$ 37,800$
WW Collection & Pumping 45,000$ 45,000$
WW Treatment 33,300$ 999,000$ 7,492,500$ 8,524,800$
Total 116,100$ 999,000$ 7,492,500$ 8,607,600$
Ending Balance 3,498,443$
Prorated Projects: Costs of projects done on infrastructure used by multiple communities are ‘prorated’ between the municipalities based on relative design capacity. In the case of the SCADA radio modem replacement project, the proration is based on there being 4 Westbrook only pump stations out of the 37 total pump stations that are planned to have work done in 2020. This project was postponed from 2019.

106 Budget by Fund – Wastewater, Westbrook
Projections for Rate-Making Purposes
Multi-year projections are made for each of the wastewater funds’ assessment. The projections provide guidance to the wastewater municipalities to assist them in determining their wastewater sewer rates. A summary of the projection is provided on next page. Major Assumptions: The assumptions incorporated in the projections are as follows:
Salary increases of 3.0% each year. Additional 1.25 headcount in 2021.
Benefit increases of 5% each year.
Biosolids contract expires in 2021; assumed 1.8% increase in unit prices. Contract renewal in 2022 may result in a significant increase but it is unknown so not forecasted.
Other expenses increase between 2.3% and 3.5% each year.
New debt service and renewal/replacement fund expenditures consistent with the 2020 5-year capital plan. New debt assumed a 20-year life at 3% interest.
Summary of Projection Impact: Assessment is projected to increase to $3,499,603 in 2024, a 24% increase over 2020 Budget, with the most significant cost change related to debt service issued to finance capital projects. Operating Reserve balance and Capital R&R balances are near or above the target balances.

107 Budget by Fund – Wastewater, Westbrook
Projections for Rate-Making Purposes (continued) Operating Fund:
Capital Expenditures: (See details in the Capital Expenditure section) Target Balance: $640,203
2020 Budget 2021 Forecast 2022 Forecast 2023 Forecast 2024 Forecast
R&R Balance BOY 3,314,543$ 3,498,443$ 3,203,943$ 3,334,093$ 3,580,793$
Contribution 300,000$ 300,000$ 300,000$ 300,000$ 300,000$
Withdrawals (116,100)$ (594,500)$ (169,850)$ (53,300)$ (652,700)$
R&R Balance EOY 3,498,443$ 3,203,943$ 3,334,093$ 3,580,793$ 3,228,093$

108 Budget by Fund – Wastewater, Westbrook
Sewer Billing Statistics The District provides sewer billing services for the municipality by contract. Sewer is billed based on water consumption and is included on Portland Water District’s water bill. The municipality determines the sewer rate. Dollars collected are forwarded to the municipality weekly.

109 Budget by Fund – Wastewater, Windham
Fund: Wastewater – Windham
Background The Portland Water District’s charter authorizes the District to provide wastewater treatment and collection system-interceptors service to the town. By contract with the town, the District additionally operates and maintains the collectors in the sewer collection system. Windham’s wastewater is treated at the treatment facility located in Westbrook and jointly used by Windham, the Town of Gorham and City of Westbrook. Additionally, by contract, the District provides utility billing services.
Summary of Services
Provided:
Treatment
0.086 Million
gallons/day
Collection System
2 Windham only & 3
Joint use Pump Stations
with 5.8 miles of pipe
Utility Billing
Annual Billings of
$355,759 with 55
Customers

110 Budget by Fund – Wastewater, Windham
Fund: Wastewater - Windham
2020 Financial Summary The town’s proposed assessment of $389,004 is 6.1% increase ($22,236). The proposed 2020 Operating Expense and Capital budgets are $397,107 and $435,150, respectively. Operating Expense was up 6.3%. Windham flows increased in the Little Falls System (72% to 75.5%) and the Westbrook Regional WWTF remained at 3%. The primary Capital project is upgrading the joint Westbrook Treatment Plant’s Aeration & Clarifier processes. $292,500 is Windham’s portion of the construction cost.
Debt Service
35%
Renewal & Replacement
10%
Salaries & Wages
10%
Contracted Services
4%
All Other Expense
41%
2020 Operating Expense
Assessment Compared to Ratepayers’ Billing The municipality’s fiscal year end is June 30, while the District’s is December 31. The chart below compares the cash as collected by the District for sewer billings on their behalf and the District’s assessment for services rendered. The municipality may incur additional sewer-related costs. The municipality determines whether to increase the sewer billing rates. Any shortfall of billing revenue is made up from the Town’s general funds.
$472,026
$447,394
$430,243
$404,094
$377,886
$363,648
$355,759
$355,759
$355,759
$355,759
$355,759
$355,759
$0 $100,000 $200,000 $300,000 $400,000 $500,000
FYE June 30,2024
FYE June 30,2023
FYE June 30,2022
FYE June 30,2021
FYE June 30,2020
FYE June 30,2019
Town Billing Revenue PWD Assessment
Revenue Assumptions: - Consumption is the 12
months ending June 30, 2019
- Rates Assumed: Effective Base/Per HCF Date: April 2009 $48.84/$3.24 No change since 4/1/2009

111 Budget by Fund – Wastewater, Windham
2020 Operating Expense Highlights Salaries/Wages – Wages were budgeted to increase 18.0% ($5,993). The increase was due to a rise of 14% in the hours WW Systems plans to spend in the area to deal with pump station maintenance and repairs. This reflects the labor utilization trend over the past few years. Employee Benefits – Overall, employee benefits expense increased $1,999 (12.6%) but the benefit rate (including FICA) decreased from 50.51% in 2019 to 48.39% in 2020 due to lower overall benefit expenses. Biosolids Disposal –Biosolids expense at the Westbrook Regional WWTF is projected to increase 7.8% due to a 3.5% increase in wet tons disposed and an expected 4.2% increase in the disposal price per wet ton. The impact is a $653 (or 7.8%) increase in expense with the Windham flow allocation from the treatment plant remaining at 3% this year. Chemicals – The 2020 budget for Chemicals has increased by $1,338 or 12.3%. This is mainly due to polymer’s increase in pounds to be used in 2020 by 52.5% at the Westbrook Regional WWTF. Also, the contract price has increased by 9.6% per pound, which is allocated to Windham by the Joint Allocation of 3%. The increase in polymer use is due to the demands of the newly installed dewatering equipment at the treatment plant, which uses more polymer during the dewatering process to achieve improved performance over the prior system. Contracted Services – The budget for this item decreased $3,320 (16.7%) primarily due to an elimination of CCTV work this year based on need. Purchased Power – The budget for power is expected to increase by 17% or $2,668 to $18,326. Windham saw increases in all areas: joint Little Falls and joint Westbrook pump stations’ usage estimates are 58,000 kWh higher than last year’s budget. The Westbrook WWTF usage estimate was 177,000 kWh higher. Demand also increased 942 KW and 300 KW, respectively. Estimates are based off a 1 to 2 year average rather than a 3-year average. Support Services – These costs are related to general work done that cannot be directly charged to a fund as noted above (such as customer billing or information technology) or work done on behalf of several municipalities at the same time (engineering or laboratory services) that is allocated based on the value to each fund. Overall, Support Services increased $5,718 or 7.5%. The allocation from Administration increased $3,579 (9.9%) because of the two new authorized head count in Information Services and Employee Services. The costs associated with Wastewater increased $3,286 (16.2%) due to redistribution in labor towards the smaller Wastewater funds to mirror actual hours. Debt Service - The annual principal and interest payments on bonds issued to finance capital projects. This item decreased 2.8% ($4,059) due to the delay of issuing the ABC.
Treatment15%
Systems84%
Other Departments
1%
2020 Labor Hours Distribution

112 Budget by Fund – Wastewater, Windham
Renewal & Replacement - Dollars put aside to fund capital projects. A contribution of $40,911 will be made in 2020.
2018
Actual
2019
Jan-Jun
2019
Budget
2020
Budget
Budget
Diff $
Budget
Diff %
Assessment Income $360,528 $183,384 $366,768 $389,004 $22,236 6.1%Interest Income 8,449 8,087 6,690 8,103 1,413 21.1%Other Income 182 0 0 0 0 n/aTotal Revenue 369,159 191,471 373,458 397,107 23,649 6.3%
Salaries & Wages 40,970 19,415 33,314 39,307 5,993 18.0%Employee Benefits 11,978 5,056 8,361 9,014 653 7.8%Biosolids Disposal 20,814 9,004 15,879 17,878 1,999 12.6%Chemicals 18,467 5,592 10,855 12,193 1,338 12.3%Contracted Services 15,554 6,056 19,902 16,582 -3,320 -16.7%Deferred Cost W/O 3,154 0 0 0 0 n/aHeat/Fuel Oil 1,477 3,014 2,247 2,399 152 6.8%Insurance 632 312 609 692 83 13.6%Materials & Supplies 6,705 2,331 4,628 4,723 95 2.1%Other Expense 177 202 159 174 15 9.4%Purchased Power 18,286 9,380 15,658 18,326 2,668 17.0%Tele/Other Utilties 560 291 556 571 15 2.7%Transportation 13,982 8,324 11,568 12,861 1,293 11.2%SS - Administration 35,627 17,018 36,185 39,764 3,579 9.9%SS - Engineering Services 10,713 4,619 14,086 13,381 -705 -5.0%SS - Environmental Services 3,361 2,401 5,116 4,673 -443 -8.7%SS - Wastewater Services 26,920 9,761 20,269 23,555 3,286 16.2%SS - Water Services 91 49 127 128 1 0.8%Operating Expense 229,468 102,825 199,519 216,221 16,702 8.4%Debt Service & Lease Expense 145,421 67,568 144,034 139,975 -4,059 -2.8%Renewal & Replacement - Direct 35,849 12,924 25,849 35,849 10,000 38.7%Renewal & Replace - Indirect 4,096 2,172 4,056 5,062 1,006 24.8%Total Expense 414,834 185,489 373,458 397,107 23,649 6.3%
Current Year Surplus (Deficit) -45,675 5,982 0 0OPEB Surplus Allocated 853 0 0 0Prior Year Surplus 109,099 64,277 86,395 42,317Accumulated Surplus 64,277 70,259 86,395 42,317
$0
$50,000
$100,000
$150,000
$200,000
2019 2020
Windham only
Windham Only – Expense up $16.1k (9.6%).
$0
$500,000
$1,000,000
$1,500,000
$2,000,000
2018 2019
Westbrook Joint
Westbrook JT – Expense up 8.4%; Windham’s share of expense unchanged (3.0%), net expense up $8.7k (21.2%).
$0
$100,000
$200,000
$300,000
$400,000
$500,000
2019 2020
Little Falls Joint
Little Falls JT – Expense down $9.0k, Windham’s share of expense up (72.0% to 75.5%), Windham’s share down $1.5k.
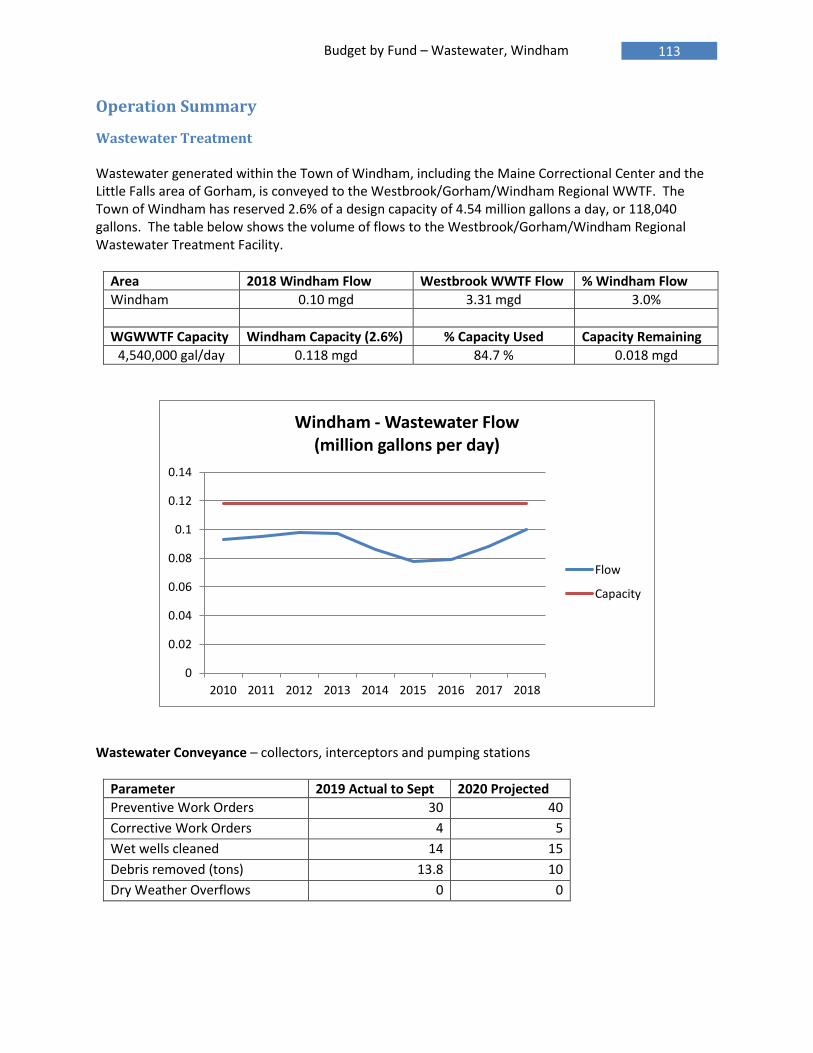
113 Budget by Fund – Wastewater, Windham
Operation Summary
Wastewater Treatment Wastewater generated within the Town of Windham, including the Maine Correctional Center and the Little Falls area of Gorham, is conveyed to the Westbrook/Gorham/Windham Regional WWTF. The Town of Windham has reserved 2.6% of a design capacity of 4.54 million gallons a day, or 118,040 gallons. The table below shows the volume of flows to the Westbrook/Gorham/Windham Regional Wastewater Treatment Facility.
Area 2018 Windham Flow Westbrook WWTF Flow % Windham Flow
Windham 0.10 mgd 3.31 mgd 3.0%
WGWWTF Capacity Windham Capacity (2.6%) % Capacity Used Capacity Remaining
4,540,000 gal/day 0.118 mgd 84.7 % 0.018 mgd
Wastewater Conveyance – collectors, interceptors and pumping stations
Parameter 2019 Actual to Sept 2020 Projected
Preventive Work Orders 30 40
Corrective Work Orders 4 5
Wet wells cleaned 14 15
Debris removed (tons) 13.8 10
Dry Weather Overflows 0 0
0
0.02
0.04
0.06
0.08
0.1
0.12
0.14
2010 2011 2012 2013 2014 2015 2016 2017 2018
Windham - Wastewater Flow (million gallons per day)
Flow
Capacity

114 Budget by Fund – Wastewater, Windham
Operation Summary (continued)
2019 Other Highlights
• Preventive type work continues to be the main focus of system staff. • Wet well and siphon cleaning were performed on a regular schedule using our Hansen
scheduled maintenance program. This effort is in response to odor concerns in the area and the need to regularly clean the siphon to ensure the system operates properly. Staff inspects the siphon weekly.
• Design of a new pump station in the Depot St. area is underway. This pump station would eliminate the siphon and the associated work to inspect and clean the siphon inlet regularly.
• In response to odor concerns at the Mallison St. Pump Station, an odor control system was installed. There have been no complaints of odor since the system was installed in the summer of 2012.
• The Route 202 Pump Station flow meter was replaced in 2015. This meter records the flow from the Windham area.
• A passive odor control unit was installed at the Little River Pump Station (which is jointly used by Windham and Gorham). A more costly and potentially more effective unit could be installed in the future, if it becomes necessary.
• Recognizing the increased loading at the treatment plant and in anticipation of the aeration system upgrade in 2020, acceptance of septage at the plant has ceased until after the completion of the aeration upgrade. Septage is being accepted at the East End WWTF in Portland.
• The new dewatering system (screw press) at the treatment facility was installed in 2018. Following an extended start-up, the Operations Team has been able to optimize the equipment and performance of the system has increased dramatically. Through September, the % total solids had increased from only 15.6 % the year before to 20.1% total solids in 2019. This results in the removal of roughly 1,466,000 lbs. of water from the biosolids managed by the facility. This has resulted in a savings in excess of $50,000 over past years
2020 Work Plan
• All pump stations will be continuously monitored with our SCADA system and dispatch service. Operations staff will visit each station on a weekly basis.
• Asset Management Software will drive the preventive maintenance program, generating both monthly and annual preventive maintenance work orders.
• A new pump station on Depot St. to serve the Windham Little Falls area is planned for installation in 2020.
• Wet wells are scheduled for cleaning on a quarterly basis unless experience dictates otherwise.
• The Routine Renewal and Replacement capital account will be used to address any unanticipated equipment issues.
• The Westbrook/Gorham/Windham Regional WWTF will have major work planned for the aeration system beginning in 2020.

115 Budget by Fund – Wastewater, Windham
Capital Summary A five-year capital plan is updated each year. The projects are prioritized based on operational needs and financing availability. The table below indicates the projects scheduled for the next fiscal year and the funding source of those projects. Detailed descriptions of the projects can be found in the Capital Finance and Capital Expenditures sections.
Expenditures by CIP Year:
Prior CIP 2020 CIP Total
Projects:
SCADA & Technology
SCADA Radio Modem Replacement - 3126 (prorated) 28,350$ 28,350$
WW Collection & Pumping
Windham Only Pump Station R&R - 3138 20,000$ 20,000$
Depot St PS Upgrades Phase 1 - 3139 600,000$ 600,000$
WW Treatment
Westbrook Treatment Plant
Aeration & Clarifier Upgrade Design - 3022 (prorated) 19,500$ 19,500$
Aeration & Clarifier Construction - 3023 (prorated) 292,500$
Sludge Storage Odor Control - 3025 (prorated) 19,500$ 19,500$
Treatment Plant R&R - 3132 (prorated) 1,300$ 1,300$
Little River Bridge Forcemain Replacement - 3212 (prorated) 93,000$ 93,000$
Total by CIP Year 39,000$ 1,035,150$ 781,650$
Source of Funds:
R&R Fund Bond Issue 2020 Grant Funding Total
Beginning Balance 375,519$
2020 Contribution 35,849$
Total R&R Balance Available 411,368$
Projects:
SCADA & Technology 28,350$ 28,350$
WW Collection & Pumping 20,000$ 350,000$ 250,000$ 620,000$
WW Treatment 94,300$ 39,000$ 133,300$
Total 142,650$ 389,000$ 250,000$ 781,650$
Ending Balance 268,718$
Prorated Projects: Costs of projects done on infrastructure used by multiple communities are ‘prorated’ between the municipalities based on relative design capacity. In the case of the SCADA radio modem replacement project, the proration is based on there being 3 Windham pump stations out of the 37 total pump stations that are planned to have work done in 2020. This project was postponed from 2019.

116 Budget by Fund – Wastewater, Windham
Projections for Rate-Making Purposes
Multi-year projections are made for each of the wastewater funds’ assessment. The projections provide guidance to the wastewater municipalities to assist them in determining their wastewater sewer rates. A summary of the projection is provided on next page. Major Assumptions: The assumptions incorporated in the projections are as follows:
Salary increases of 3.0% each year. Additional 1.25 headcount in 2021.
Benefit increases of 5% each year.
Biosolids contract expires in 2021; assumed 1.8% increase in unit prices. Contract renewal in 2022 may result in a significant increase but it is unknown so not forecasted.
Other expenses increase between 2.3% and 3.5% each year.
New debt service and renewal/replacement fund expenditures consistent with the 2020 5-year capital plan. New debt assumed a 20-year life at 3% interest.
Summary of Projection Impact: Assessment is projected to increase to $490,564 in 2024, a 26% increase over 2020 Budget, with the most significant cost change related to debt service issued to finance capital projects. Operating Reserve balance is below target balance by 2024 and Capital R&R balance are above the target balance. Debt Service as a percent of budget is high due to Gorham’s request to connect the Little Falls area to
the Westbrook Regional Treatment Plant and significant upcoming upgrades at the treatment plant.

117 Budget by Fund – Wastewater, Windham
Projections for Rate-Making Purposes (continued) Operating Fund:
Capital Expenditures: (See details in the Capital Expenditure section) Target Balance: $150,000
2020 Budget 2021 Forecast 2022 Forecast 2023 Forecast 2024 Forecast
R&R Balance BOY 375,519$ 268,718$ 265,067$ 275,066$ 289,615$
Contribution 35,849$ 35,849$ 35,849$ 35,849$ 35,849$
Withdrawals (142,650)$ (39,500)$ (25,850)$ (21,300)$ (44,700)$
R&R Balance EOY 268,718$ 265,067$ 275,066$ 289,615$ 280,764$

118 Budget by Fund – Wastewater, Windham
Sewer Billing Statistics
The District provides sewer billing services for the municipality by contract. Sewer is billed based on water consumption and is included on Portland Water District’s water bill. The municipality determines the sewer rate. Dollars collected are forwarded to the municipality weekly.

119 Budget by Fund
Falmouth Assessment and Scarborough and South Portland Contracted
Services
Background By contract, the district provides utility billing and collection services for Falmouth, Scarborough and South Portland. Wastewater services are provided in the towns of Falmouth and Scarborough by their towns’ Sanitary District, both independent wastewater utilities, and in the city of South Portland by Water Resource Protection, a department of the City of South Portland. For Scarborough and South Portland, the district estimates the cost to provide the billing and payment collection service as documented in the annual budget and bills the municipalities the estimated cost. The amount is billed to the municipality in equal monthly payments. For Falmouth, in addition to the billing and payment collection service costs, the District will assess the town for debt service costs related to the bond that the District issued on behalf of Falmouth. The debt and the related assets will be part of the District’s balance sheet but Falmouth will operate and maintain the assets. The municipality determines the system user fees to pay the district bill and any municipal costs related to the sewer system. The district includes the sewer user fees on the monthly water utility bill sent to customers. Sewer user fees collected from users are remitted to the municipality on a weekly basis. Sewer user fees are based on water consumption in South Portland and Scarborough, with a 1 HCF (hundred cubic feet) minimum fee plus an additional fee for each HCF used above the minimum. Falmouth user fees are based on a flat rate per month for residential homeowners and commercial customers are billed a flat rate plus a fee based on the number of fixtures and number of units at the location.
2020 Summary The District is proposing the same assessment as last year, $314,112 in Falmouth and similarly South Portland, remains at $201,132. Scarborough’s annual assessment has gone up 0.6% increased by $72 to $11,328. Total expense for Scarborough is relatively unchanged. Falmouth is decreasing Debt Service by 2.4% or $7,142 for a total expense decrease of $7,221 or 2.3%. South Portland has also decreased Debt Service by $7,387, which is offset by increases in operating expense ($2,060) due to an increase in Collection costs and Indirect Renewal and Replacement related to Meter Servicing ($8,331).

120 Budget by Fund
Falmouth Assessment and Scarborough and South Portland Contracted
Services
Falmouth:
2018
Actual
2019
Jan-Jun
2019
Budget
2020
Budget
Budget
Diff $
Budget
Diff %
Assessment Income $310,056 $157,056 $314,112 $314,112 $0 0.0%Interest Income 2,334 1,220 409 1,100 691 168.9%Total Revenue 312,390 158,276 314,521 315,212 691 0.2%
Operating Expense 12,173 5,388 14,859 14,780 -79 -0.5%Debt Service & Lease Expense 297,184 142,596 299,662 292,520 -7,142 -2.4%Total Expense 309,357 147,984 314,521 307,300 -7,221 -2.3%
Current Year Surplus (Deficit) 3,033 10,292 0 7,912Prior Year Surplus 1,298 4,331 2,652 14,898Accumulated Surplus 4,331 14,623 2,652 22,810
Scarborough:
2018
Actual
2019
Jan-Jun
2019
Budget
2020
Budget
Budget
Diff $
Budget
Diff %
Contracted Billing Income $11,256 $5,628 $11,256 $11,328 $72 0.6%Interest Income 122 114 97 103 6 6.2%Total Revenue 11,378 5,742 11,353 11,431 78 0.7%
Operating Expense 1,576 833 2,100 2,115 15 0.7%Debt Service & Lease Expense 6,387 3,215 5,911 4,902 -1,009 -17.1%Renewal & Replace - Indirect 3,342 1,671 3,342 4,414 1,072 32.1%Total Expense 11,305 5,719 11,353 11,431 78 0.7%
Current Year Surplus (Deficit) 73 23 0 0Prior Year Surplus 6,922 6,995 7,181 7,589Accumulated Surplus 6,995 7,018 7,181 7,589
South Portland:
2018
Actual
2019
Jan-Jun
2019
Budget
2020
Budget
Budget
Diff $
Budget
Diff %
Contracted Billing Income $197,184 $100,566 $201,132 $201,132 $0 0.0%Interest Income 1,915 2,612 1,828 500 -1,328 -72.6%Total Revenue 199,099 103,178 202,960 201,632 -1,328 -0.7%
Operating Expense 120,287 55,539 135,936 137,996 2,060 1.5%Debt Service & Lease Expense 49,694 25,101 46,475 39,088 -7,387 -15.9%Renewal & Replace - Indirect 25,432 12,698 25,396 33,727 8,331 32.8%Total Expense 195,413 93,338 207,807 210,811 3,004 1.4%
Current Year Surplus (Deficit) 3,686 9,840 -4,847 -9,179Prior Year Surplus 130,093 133,779 33,318 52,279Accumulated Surplus 133,779 143,619 28,471 43,100

121 Revenues
Introduction Revenue is obtained from two major sources: payments by individual customers for water services (Water Revenue, 54.1%) and payments from municipalities for wastewater services (Wastewater Assessments, 42.6%). Water revenues in 2020 are projected to increase 3.5% over last year’s budget as a result of the full year impact of the 4.4% May 1, 2019 rate increase and the proposed 3.5% rate increase to take effect in May. The Wastewater Assessments for Cape Elizabeth, Cumberland, Gorham, Westbrook, Windham, and Portland increased to cover estimated 2020 costs. Contracted Billing Income (0.45% of budgeted revenue) is revenue paid by the City of South Portland and Town of Scarborough for wastewater billing services. Other Water and Wastewater revenue (2.89% of budgeted revenue) is derived from other activities, such as interest income, cross connection fees, customer connection and activation fees, jobbing surcharge and septage haulers fees, which are further detailed in this section.
2018 Actual
2019 Actual
Jan-Jun 2019 Budget 2020 Budget $-Diff. %-Diff.
Water Sales $24,056,708 $11,111,241 $24,817,595 $25,686,370 $868,775 3.5%
Assessment Income 19,003,536 9,724,236 19,448,472 20,218,572 770,100 4.0%
Contracted Billing Income 208,440 106,194 212,388 212,460 72 0.0%
Interest Income 637,672 614,553 505,383 707,747 202,364 40.0%
Other Income 766,273 369,651 553,614 664,790 111,176 20.1%
Total Revenues $44,672,629 $21,925,875 $45,537,452 $47,489,939 $1,952,487 4.3%
-
10,000
20,000
30,000
40,000
50,000
2018 Actual 2019 Budget 2020 Budget
Total District Revenue($,000)
Water Sales Assessment Income Other Revenue

122 Revenues
Water Sales Water sales consist of:
Metered Revenue from residential, governmental, industrial and commercial customers. Customers are billed a monthly minimum based on meter size, which includes 1 hundred cubic feet (HCF) of water (748 gallons). For amounts greater than 1 HCF, customers pay based on a four-tier declining block. Current member rates are:
Monthly Water Usage:
From To Rate
1 HCF 30 HCF $2.44
30 HCF 100 HCF $2.13
100 HCF 500 HCF $1.88
Greater than 500 HCF $1.06
Public Fire Protection revenue from charges to municipalities for hydrants. Eleven communities pay a monthly fee based on the number of the hydrants in the community and proportionate share of water system costs to ensure water is available to fight fires.
Private Fire Protection revenue from charges to private users for hydrants and sprinklers. Customers are assessed a monthly fee based on the service line to the hydrant/sprinkler. The fee is based on proportionate share of water system costs to ensure water is available to fight fires.
Other Water Revenue such as interest on delinquent customer balances and customer penalties.
The 2020 Budget of $25,686,370 reflects an assumed rate of usage determined on subsequent pages. Water Sales rates have been adjusted annually. Average rate adjustments of 4.4% and 3.8% were made on May 2019 and 2018, respectively. Prior to 2016, all water rate adjustments were subject to review and approval by the Maine Public Utilities Commission. Starting in 2016, the District’s Board of Trustees can approve rate adjustments solely through their actions. The Board will continue to follow the same public input process before authorizing rate changes.
2018 Actual
2019 Actual
Jan-Jun 2019 Budget 2020 Budget $-Diff. %-Diff.
Metered Revenue $21,487,857 $9,780,166 $22,203,648 $22,914,091 $710,443 3.2%
Public Fire Protection 1,381,691 707,832 1,441,506 1,495,850 54,344 3.8%
Private Fire Protection 1,050,242 546,756 1,102,441 1,158,429 55,988 5.1%
Other Water Revenue 136,918 76,487 70,000 118,000 48,000 68.6%
Total Water Sales $24,056,708 $11,111,241 $24,817,595 $25,686,370 $868,775 3.5%

123 Revenues
Water Sales - Cost of Service Study Every 10 years, a cost of service study is completed that compares the revenue generated by each meter revenue customer class – residential, commercial, industrial and government – as well as fire protection with the costs of providing services to those customers. The most common and widely used cost of service or cost allocation process is presented in the American Water Works Association’s manual of practice M1 – Principles of Water Rates, Fees, and Charges. The process consists of several steps to determine the cost of providing service to various classes of customers.
1. Costs are first assigned to various functions such as supply, treatment, pumping and distribution. The District’s accounting system readily provides this functional breakdown.
2. The functional costs are then allocated to various types of service provided by the water utility or cost components. The most common method is termed the “base-extra capacity method”. Under this method, the functional costs are allocated to the categories:
Base: costs that vary with the amount of water use, independent of peak demands
Extra Capacity: costs that are associated with meeting peak demand requirements
Customer: costs that are related to customer service and independent of water use. These are often subdivided into:
a. General or billing costs (meter reading, collection, etc.)
b. Meter and service costs (cost of meter or service line repair, maintenance and testing)
Direct Fire Protection: costs associated with public fire hydrants
3. Lastly, the costs that have been allocated to cost components are distributed to customer classes or groups based on the relative amount of use that each class has of the various cost components.
In general, we have followed the guidance in the AWWA’s M1 Manual to develop the cost of service analysis for the District. The last study was conducted in 2016. The study indicated that industrial and commercial customers were not paying the full cost of service. Because the rate change needed to those customers would create rate shock and impact economic development, a policy was established to gradually increase the rates impacting those customers over subsequent rate adjustments. The Board confirmed continuing the practice done since 2007 of increasing those rates at a rate of 150% of the rate adjustment for residential customers.

124 Revenues
Water Sales – Metered Revenue Metered water revenue has risen from $19.5 million in 2015 to the 2020 budgeted amount of $22.9 million (17.4% increase). The rise in revenue was the result of rate increases paired with slightly higher metered water usage. The District measures metered consumption by four customer classes: Residential, Commercial, Industrial, and Governmental/Public. The consumption patterns of each of these customer classes vary from one another and these variations have been taken into consideration in estimating the consumption used for the budget (see detailed discussion on subsequent pages).
4,397 4,538 4,418 4,434 4,252 4,337
1,984 2,050 2,043 2,023 2,020 2,009
560 568 539 546 509 536
1,618 1,660 1,487 1,501 1,348 1,401
-
2,000
4,000
6,000
8,000
10,000
2015 Actual 2016 Actual 2017 Actual 2018 Actual 2019 Projection 2020 Budget
Historical Consumption vs. 2020 Budget(,000 HCF)
Residential Commerical Governmental Industrial
8,559 8,816 8,487 8,504 8,2838,129
The ratio of each customer class as a percentage of all sales (shown below) has been fairly stable.
67.2% 67.2% 66.9% 66.8% 66.3% 66.3%
19.6% 20.3% 20.7% 20.6% 21.0% 21.0%
8.4% 8.4% 7.6% 7.8% 7.8% 7.8%
4.8% 4.0% 4.8% 4.8% 4.9% 4.9%
0%
20%
40%
60%
80%
100%
2015 Actual 2016 Actual 2017 Actual 2018 Actual 2019 Budget 2020 Budget
Metered Water Revenue
Residential Commercial Industrial Public/Gov
$22,914,091$19,507,814 $20,765,983$20,937,121 $21,487,857 $22,203,648

125 Revenues
Water Sales – Metered Revenue - Consumption
Residential Residential consumption makes up about 52% of total metered consumption and generates roughly 66.8% of the District’s total metered water revenue. The two segments of residential consumption are monthly billed and seasonal customers. Monthly billed customers receive bills year round on a monthly basis. Seasonal customers receive a bill in the spring for the minimum consumption level and a bill in the fall for any excess usage above the minimum. For monthly customers, consumption has been calculated by determining the core level of consumption, then estimating the amount of additional usage that largely occurs during the summer months. The monthly core level was reached by taking the average of the lowest three months of each year in the sample data and annualizing that value.
80%
85%
90%
95%
100%
105%
110%
2007 2008 2009 2010 2011 2012 2013 2014 2015 2016 2017 2018
Residential Customer & Consumption Trends2007-2018 (Indexed)
No. of Customers Consumption - HCF HCF per Cust.
Linear (No. of Customers) Linear (Consumption - HCF) Linear (HCF per Cust.)
As shown above, overall consumption (red line) has been relatively flat over the last 10 years, even though the number of customers (blue) has been increasing. Therefore, the consumption per customer (green) has also been declining. These trends were taken into account when estimating the residential core usage for 2020. The additional usage was determined by averaging the percentage of additional consumption over the core in the sample years. For the 2020 budget, the core consumption was approximately 3.5 million HCF (hundred cubic feet) and the additional usage was 20% of the core. This falls in line with historical data.

126 Revenues
Water Sales – Metered Revenue - Consumption
Residential (continued)
2015
Act
ual
2016
Act
ual
2017
Act
ual
2018
Act
ual
2019
Bud
get
2020
Bud
get
0
1,000,000
2,000,000
3,000,000
4,000,000
5,000,000
Residential Consumption - Monthly Customers2015 - Present
Core Additional
The monthly additional consumption was determined based on the average monthly consumption from a rolling three-year period ending December 2018. Approximately three-fourths of the additional consumption is used between the months of June through September.
Janu
ary
Febr
uary
Mar
ch
Apr
il
May
June
July
Aug
ust
Sept
embe
r
Oct
ober
Nov
embe
r
Dec
embe
r
-
100,000
200,000
300,000
400,000
500,000
Residential Consumption - Monthly Customers2020 Budget (HCF)
Core Additional
Consumption by seasonal customers makes up only 1.34% of total residential consumption. Residential seasonal consumption for the budget was based on a five-year period from 2014-2018 and is approximately 58,000 HCF for the year.
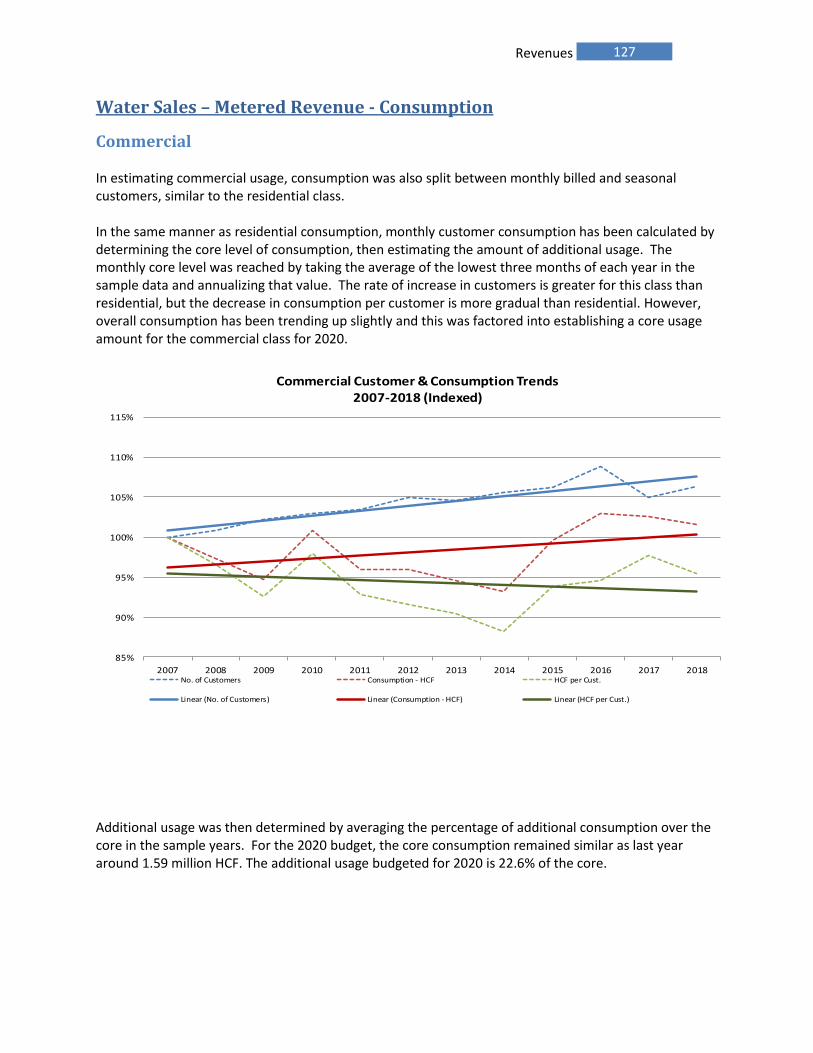
127 Revenues
Water Sales – Metered Revenue - Consumption
Commercial In estimating commercial usage, consumption was also split between monthly billed and seasonal customers, similar to the residential class. In the same manner as residential consumption, monthly customer consumption has been calculated by determining the core level of consumption, then estimating the amount of additional usage. The monthly core level was reached by taking the average of the lowest three months of each year in the sample data and annualizing that value. The rate of increase in customers is greater for this class than residential, but the decrease in consumption per customer is more gradual than residential. However, overall consumption has been trending up slightly and this was factored into establishing a core usage amount for the commercial class for 2020.
85%
90%
95%
100%
105%
110%
115%
2007 2008 2009 2010 2011 2012 2013 2014 2015 2016 2017 2018
Commercial Customer & Consumption Trends2007-2018 (Indexed)
No. of Customers Consumption - HCF HCF per Cust.
Linear (No. of Customers) Linear (Consumption - HCF) Linear (HCF per Cust.)
Additional usage was then determined by averaging the percentage of additional consumption over the core in the sample years. For the 2020 budget, the core consumption remained similar as last year around 1.59 million HCF. The additional usage budgeted for 2020 is 22.6% of the core.

128 Revenues
Water Sales – Metered Revenue - Consumption
Commercial (continued)
2015
Act
ual
2016
Act
ual
2017
Act
ual
2018
Act
ual
2019
Bud
get
2020
Bud
get
0
500,000
1,000,000
1,500,000
2,000,000
2,500,000
Commercial Consumption - Monthly Customers2015 - Present
Core Additional
The monthly additional consumption was determined based on the average monthly consumption from a rolling three-year period ending December 2018. Approximately two-thirds of the additional consumption is used between the months of June through September.
Janu
ary
Febr
uary
Mar
ch
Apr
il
May
June
July
Aug
ust
Sept
embe
r
Oct
ober
Nov
embe
r
Dec
embe
r
-
50,000
100,000
150,000
200,000
250,000
Commerical Consumption - Monthly Customers2020 Budget (HCF)
Core Additional
Consumption by seasonal customers makes up only 2.9% of total commercial consumption. Commercial seasonal consumption for the budget was based on a five-year period from 2014-2018 and is approximately 58,600 HCF for the year.

129 Revenues
Water Sales – Metered Revenue - Consumption
Industrial Historically, approximately 90% of industrial usage has come from just five customers: Calpine, Texas Instruments, Sappi Fine Paper, ON Semiconductor, and B&G Foods. The District makes an effort every year to contact these customers to get an estimate of their expected water needs for the coming year. Overall Industrial usage is budgeted at 1.4 million HCF for 2020.
Calpine The Calpine power plant is the District’s largest customer. Located in Westbrook, Calpine uses two combustion turbines routed to two heat recovery steam generators that provide steam to a turbine. This facility produces enough electric power to meet the needs of more than 500,000 homes throughout New England. The energy market can significantly impact production at the plant. In 2018 and the first half of 2019, Calpine had some substantial breaks in usage when the plant was offline due to lack of demand and to save on overhead costs. Usage trend for Calpine has been highly variable with no clear trend so we plan to keep the usage at the same as last years’ budget, 400,000 HCF. We have taken into consideration actual usage for 2019 and complete shutdowns of the plant to stay conservative.
Texas Instruments Texas Instruments is a company that designs and makes semiconductors that are sold to electronics designers and manufacturers globally. In 2011, the company bought National Semiconductor, a semiconductor manufacturer specializing in analog devices and subsystems that operates a wafer fabrication plant in South Portland. They have had sporadic usage in the last few years, so we are using an average and weighing in how the 2019 projection is looking. Therefore the 2020 Budgeted usage has increased 10,000 to 280,000 HCF (3.7%) heavily due to 2018 actual and 2019 YTD Projected reaching for 300,000 HCF.
Sappi Fine Paper Sappi Fine Paper North America is the leading producer and supplier of coated fine paper, pulp and release paper in the United States. The company has two facilities in Westbrook, a mill and a technology center. The mill is primarily a production facility for specialty release papers and films. The technology center is equipped with two state-of-the-art pilot coaters that enable prototype development for both coated fine papers and specialty release paper. We expect 2020 to follow along the lines of 2018 and 2019 mid-year actual usage.
ON Semiconductor (formerly Fairchild Semiconductor) In September 2016, Fairchild Semiconductor was purchased by ON Semiconductor. The company still operates as a lead electronics component manufacturer, making tiny silicon chips used in a variety of industries, including cellular technology, home goods and automotive applications. ON operates a manufacturing facility in Portland and a business office in South Portland. They have been investing in the plant and expect production to remain the same for at least the next couple of years.
B&G Foods B&G Foods and its subsidiaries manufacture, sell, and distribute a diversified portfolio of high-quality, branded shelf-stable foods across the United States, Canada and Puerto Rico. They own B&M Beans that operates a bean cannery in Portland. 2020 usage is determined by using the trend over the last few years which is consistently in the 70-80 thousand HCF range to come up with a 77,000 HCF budget.

130 Revenues
Water Sales – Metered Revenue - Consumption
Public/Governmental
Yarmouth Water District Approximately 28% of public/governmental consumption comes from usage by the Yarmouth Water District that provides water almost entirely to the Wyman Power Plant on Cousins Island. Wyman Power Plant is a spot producer of power for the Northeast and is only used during peak energy demand because, as an oil-fired generator, it has become obsolete. Because of low oil prices and the high price of electricity in the Northeast, the plant remains online. Wyman ran consistently over the recent years because it supplements with natural gas fired units in New England. They generate roughly half the region’s power and are much cheaper to operate. We are creating the budget off a 3 year actual average (2016-2018) as well as considering the projection of 2019 to bring it down from last years’ budget of 170,000 hundred cubic feet to 155,000 HCF.
Other Public/Governmental Customers Public/Governmental consumption has been in decline since the economic downturn. Government entities have sought out ways to decrease expenditures including their water and sewer bill. As a result, it is not anticipated that usage will return. In 2020 we have predicted that the usage will continue to fall similar to last year.
-
100,000
200,000
300,000
400,000
500,000
600,000
2006 2007 2008 2009 2010 2011 2012 2013 2014 2015 2016 2017 2018
H
C
F
Public/Governmental Consumption2006-2018 (excluding Yarmouth)

131 Revenues
Water Sales – Metered Revenue – Rates
Water Rate Schedule A 3.5% increase is proposed to be implemented effective 5/1/2020. Board of Trustees will review and approve any rate adjustment in the first quarter of 2020.
Typical Customer Increases Current Proposed 3.5% $ %
Residential (per month) .62" meter, 7 HCF $24.39 $25.11 $0.72 2.95%
Commercial (per month) .75" meter, 80 HCF 188.75 196.13 7.38 3.91%
Small Industrial (per month) 2" meter, 1,300 HCF 1,857.46 1,944.24 $86.78 4.67%
Large Industrial (per month) 8" meter, 56,000 HCF 60,115.10 62,949.46 2,834.36 4.71%
Sprinkler (per year) 6" meter 447.2 462.85 $15.65 3.50%
Public Fire (per year) 1,461,652 1,512,678 51,026 3.49%
Seasonal (per year) .62" meter 234.84 243.04 $8.20 3.49%
Current Rates: Effective 05/01/2019
Meter or Service Line Size Member Rate Non-member Rate
Private Fire Monthly Fee2 $3.91 $4.493 8.74 10.04 4 15.59 17.93 6 37.27 42.85 8 62.40 71.73 10 97.47 112.16 12 140.35 161.41 16 249.51 286.95
Minimum Monthly Charges5/8 $9.75 $11.213/4 11.49 13.19 1 14.90 17.16
1 1/2 26.10 30.01 2 37.60 433.22 3 68.22 78.42 4 102.68 118.08 6 198.40 228.15 8 313.24 360.24 10 453.55 521.59 12 600.39 690.43
Low income 2.44 2.81 Monthly Volume ChargeFirst 100 Cf minimum minimumNext 2,900 Cf $2.44 $2.81Next 7,000 Cf 2.13 2.47 Next 40,000 Cf 1.88 2.14 Over 50,000 Cf 1.06 1.50
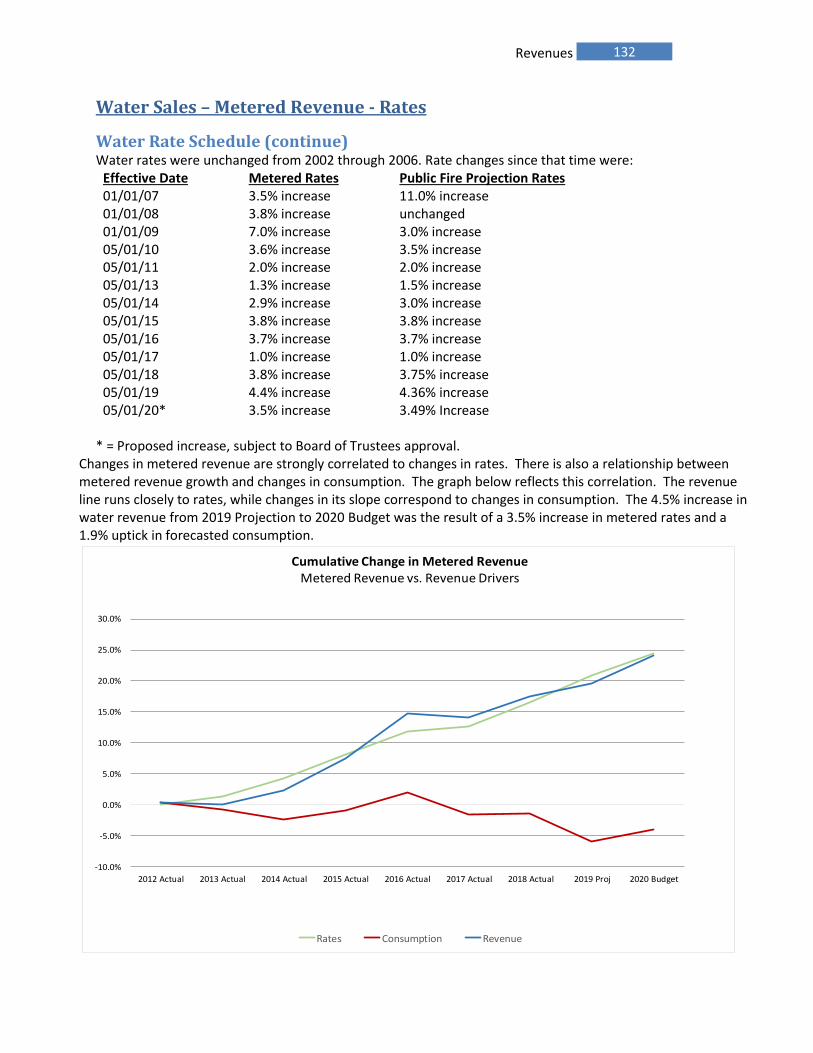
132 Revenues
Water Sales – Metered Revenue - Rates
Water Rate Schedule (continue) Water rates were unchanged from 2002 through 2006. Rate changes since that time were:
Effective Date Metered Rates Public Fire Projection Rates 01/01/07 3.5% increase 11.0% increase 01/01/08 3.8% increase unchanged 01/01/09 7.0% increase 3.0% increase 05/01/10 3.6% increase 3.5% increase 05/01/11 2.0% increase 2.0% increase 05/01/13 1.3% increase 1.5% increase 05/01/14 05/01/15 05/01/16 05/01/17 05/01/18 05/01/19 05/01/20*
2.9% increase 3.8% increase 3.7% increase 1.0% increase 3.8% increase 4.4% increase 3.5% increase
3.0% increase 3.8% increase 3.7% increase 1.0% increase 3.75% increase 4.36% increase 3.49% Increase
* = Proposed increase, subject to Board of Trustees approval. Changes in metered revenue are strongly correlated to changes in rates. There is also a relationship between metered revenue growth and changes in consumption. The graph below reflects this correlation. The revenue line runs closely to rates, while changes in its slope correspond to changes in consumption. The 4.5% increase in water revenue from 2019 Projection to 2020 Budget was the result of a 3.5% increase in metered rates and a 1.9% uptick in forecasted consumption.
-10.0%
-5.0%
0.0%
5.0%
10.0%
15.0%
20.0%
25.0%
30.0%
2012 Actual 2013 Actual 2014 Actual 2015 Actual 2016 Actual 2017 Actual 2018 Actual 2019 Proj 2020 Budget
Cumulative Change in Metered RevenueMetered Revenue vs. Revenue Drivers
Rates Consumption Revenue

133 Revenues
Water Sales – Rate Affordability Study Though residential water rate adjustments since 2000 are below the change in the consumer price index (CPI), the past 5 years rate adjustments have exceeded CPI (2.7% vs 1.6%) and the 5-year financial forecast indicates an average annual rate adjustment of 4.5%. Higher rate adjustments are needed to fund necessary replacements and upgrade to water infrastructure. As the chart indicates below, Portland Water District’s rate adjustments have been lower than other water utilities since 2000 despite significantly investing in our infrastructure. The operational efficiencies that enabled the lower rate adjustments will not be available in future years and rates adjustments will trend closer to the industry average.
With residential rates increasing, a study was conducted to understand the financial burden water rates are having on our customers. An industry benchmark compares a typical bill with the average usage for a month in a household of 4 to the median household income (MHI). From many studies and our purposes, a factor of 2% and under MHI is considered affordable.
0.74% 0.75%0.50%
0.30% 0.36% 0.47% 0.43%0.64% 0.60%
0.35%
0.00%
0.50%
1.00%
1.50%
2.00%
Affordability as a % of MHI(Median Household Income)

134 Revenues
Water Sales – Rate Affordability Study (continued) The table below indicates most customer’s water bills are affordable (below 2% of MHI) with only customers in the lowest income and larger households reaching unaffordable levels (orange and red colors).
Using an alternative tool (Affordability Assessment Tool created by the University of North Carolina), an estimated number of households having unaffordable water bills was calculated. The tool uses information from the 2017 U.S. Census Bureau Website.
To assist low-income households, the District offers 2 different programs. Qualifying households are given a $8 discount on each month’s bill. Customers can also participate in the ‘conservation program’ that provides and installs low flow devices to reduce the customer water consumption and ultimately their bill.
4.70%
3.40% 3.60%
1.30%
4.70%5.10%
2.30%
4.70%
6.70%
1.80%
0.00%
1.00%
2.00%
3.00%
4.00%
5.00%
6.00%
7.00%
Percentage of households in which our rates are unaffordable
Using threshold of unaffordability to be 2% and up for Water
Water
Household
Income Value Annual Bill as Percentage of Household Income by Household Size
HCF 2 5 7 10 12 14 17 19 22
Household Size 1 2 3 4 5 6 7 8 9
20th
Percentile $ 17,100 0.88% 1.41% 1.76% 2.29% 2.64% 3.00% 3.52% 3.88% 4.40%
40th
Percentile $ 37,200 0.41% 0.65% 0.81% 1.05% 1.21% 1.38% 1.62% 1.78% 2.02%
Median $ 48,300 0.31% 0.50% 0.62% 0.81% 0.94% 1.06% 1.25% 1.37% 1.56%
60th
Percentile $ 61,000 0.25% 0.40% 0.49% 0.64% 0.74% 0.84% 0.99% 1.09% 1.23%
80th
Percentile $ 99,400 0.15% 0.24% 0.30% 0.39% 0.45% 0.52% 0.61% 0.67% 0.76%

135 Revenues
Water Sales – Non-Metered Revenue Non-metered water revenue has risen from $2.2 million in 2015 to the budgeted amount of $2.7 million (21.5%) for 2020. The rise in Customer Penalties and Interest budget was due to a newly implemented penalty fee for disconnection of multi-unit properties.
55.7% 55.8% 55.6% 53.8% 55.1% 54.0%
40.2% 40.8% 41.2% 40.9% 42.2% 41.8%
4.1% 3.4% 3.3% 5.3% 2.7% 4.3%
0%
20%
40%
60%
80%
100%
2015 Actual 2016 Actual 2017 Actual 2018 Actual 2019 Budget 2020 Budget
Non-Metered Water Revenue
Public Fire Private Fire Cust. Penalties & Interest
$2,772,279$2,281,045 $2,420,261$2,364,766 $2,568,851 $2,613,947
Service Line
Size Annual Fee
Number of
Customers
(inches)
2 46.92$ 344
3 104.88$ 0
4 187.08$ 227
6 447.24$ 1220
8 748.80$ 590
10 1,169.64$ 38
12 1,684.20$ 22
16 2,994.12$ 1 Allocated based on number of hydrants and inch feet of mains in each municipality.
Allocated between service line sizes based on the relative demand on the water system.
Portland, $405,073
South Portland, $183,670
Westbrook, $150,103
Cape Elizabeth, $98,723
Falmouth, $115,376
Cumberland $60,509
Raymond, $6,828
Scarborough $157,530
Gorham, $91,023
Windham, $110,945
Standish, $54,007
Public Fire Protection Revenue
Private Fire Protection Revenue

136 Revenues
Water Sales - Long-Term Considerations
Revenue & Expense: Fixed vs. Variable As shown below, approximately 38% of the District’s water revenue is fixed, generated from minimum charges on metered accounts and fire protection charges. The remaining 62% varies depending on consumption levels. In comparison, 95% of the District’s expenses are fixed, largely infrastructure costs.
Fixed, 38%
Variable, 62%
Revenue
Fixed, 95%
Variable, 5%
Expenses
Slow Customer Growth Population growth in the District’s service area is lower than in other parts of the country and is not expected to increase. Customers in 2018 total versus 2017 had been increased by an average of 0.8% due to a reclassification from Industrial to Commercial accounts and an overall increase in Residential customers by 345 accounts.
Cost of Service Gap The last Cost of Service Study was completed in 2016. The study indicated that industrial/commercial customers generate less revenue than it costs to serve them. The Board requested the gap be closed over future rate adjustments by increasing revenue generated by industrial/commercial customers at higher increments. The proposed rate schedule will continue to have greater impact on larger customers by a factor of 150% compared to smaller ones.

137 Revenues
Water Sales - Long-Term Considerations (continued)
Decline in Consumption There has been a nationwide trend in recent years toward lower consumption levels. This trend also appears in the District’s consumption data. Some factors contributing to this decline are more efficient appliances and fixtures, increasing water/ sewer rates, and a decrease in average household size. A recent Water Resources Foundation Study found a significant increase in households using more water efficient fixtures and appliances.
On a recent survey the District’s customers were asked, “In the past year, have you taken any of the following measures to reduce your water usage?” The graph below shows customers’ responses to that question:
6% 5%
75%
46%
37%
80%
0%
10%
20%
30%
40%
50%
60%
70%
80%
90%
Clothes Washers Toilets Shower
WRF Study - Household Conservation Efforts
1999
2013
0% 10% 20% 30% 40% 50% 60%
Some other measure
Replaced fixtures and/or applianceswith high-efficiency options
Reduced inside water usage
Reduced outside water usage
Repaired leaks or leaking fixtures

138 Revenues
Wastewater Assessment & Contracted Billing Income Wastewater Assessments are amounts payable by each municipality for wastewater services provided by the District. The assessments cover the operating and debt service costs of operating wastewater facilities maintained by the District. The assessments are billed in monthly installments. In 2020, the assessments for each municipality were increased excluding Falmouth (see table below).
Contracted Billing Income is revenue paid by municipalities for wastewater billing services provided. Scarborough and South Portland operate and maintain their own wastewater collection and treatment systems. The District only provides billing-related services for those communities. Contracted Billing Income
2018 Actual
2019 Actual
Jan-Jun 2019 Budget 2020 Budget $-Diff. %-Diff.
Scarborough 11,256 5,628 11,256 11,328 72 0.6%South Portland 197,184 100,566 201,132 201,132 - 0.0%
$208,440 $106,194 $212,388 $212,460 72$ 0.0%
Cape Elizabeth$1,705,380
Cumberland$965,292
Gorham$1,160,676
Portland$12,863,340
Westbrook$2,820,768
Windham$389,004
Falmouth$314,112
Other$1,668,408
Wastewater Assessments(Dollars)
Wastewater Assessments
2018 Actual
2019 Actual
Jan-Jun 2019 Budget 2020 Budget $-Diff. %-Diff.
Cape Elizabeth $1,539,840 $786,456 $1,572,912 $1,705,380 $132,468 8.4%Cumberland 905,364 452,682 905,364 965,292 59,928 6.6%Falmouth 310,056 157,056 314,112 314,112 - 0.0%Gorham 1,106,148 566,718 1,133,436 1,160,676 27,240 2.4%Portland 12,248,424 6,308,040 12,616,080 12,863,340 247,260 2.0%Westbrook 2,533,176 1,269,900 2,539,800 2,820,768 280,968 11.1%Windham 360,528 183,384 366,768 389,004 22,236 6.1%
$19,003,536 $9,724,236 $19,448,472 $20,218,572 $770,100 4.0%

139 Revenues
Wastewater Assessments Revenue Trend Wastewater assessments rose from $17.1 million in 2015 to a budgeted $20.2 million in 2020 (an increase of 18%). While operating costs did increase over this time period, the majority of the increases were due to capital projects done to upgrade existing wastewater facilities.
Cape Eliz. Cumberland Gorham Portland Westbrook Windham Fa lmouth Tota l
2015 Actual 1,412,112 731,784 1,106,148 10,981,308 2,533,176 351,756 15,012 17,131,296 2016 Actual 1,443,408 750,072 1,106,148 11,308,040 2,533,176 351,756 36,012 17,528,612 2017 Actual 1,468,692 844,584 1,106,148 11,841,972 2,533,176 360,528 263,604 18,418,704 2018 Actual 1,539,840 905,364 1,106,148 12,248,424 2,533,176 360,528 310,056 19,003,536 2019 Budget 1,572,912 905,364 1,133,436 12,616,080 2,539,800 366,768 314,112 19,448,472 2020 Budget 1,705,380 965,292 1,160,676 12,863,340 2,820,768 389,004 314,112 20,218,572
Wastewate r Assessments by Fund:
-
2,250
4,500
6,750
9,000
11,250
13,500
15,750
18,000
20,250
22,500
2015 Actual 2016 Actual 2017 Actual 2018 Actual 2019 Budget 2020 Budget
Assessments by Fund (2015-Present)($,000)
Cape Elizabeth Cumberland Gorham Portland Westbrook Windham Falmouth

140 Revenues
Current Municipal Wastewater Rates Wastewater rates are established by each municipality. The rates are designed to cover the municipal costs, including the District’s annual assessment. The table below indicates the municipal sewer fees for municipalities for whom the District provides billing services. These fees are included on the monthly bill, which includes the District’s water fees. Customers remit their payments for both water and sewer fees to the District. On a weekly basis, the sewer fees are then remitted to the municipalities. Once a month, the municipality pays 1/12th of the annual assessment to the District from these sewer fees.
Sewer Rates Effective 5/01/2019
Minimum HCF Minimum Charge Additional HCF
Portland 1 $10.40 $10.40
Cumberland 0 36.92 5.52
South Portland 1 5.20 5.20
Cape Elizabeth 1 49.50 5.68
Westbrook 1 11.53 6.53
Gorham 1 13.74 6.29
Windham 5 48.84 3.24
HCF= Hundred Cubic Feet (748 gallons) The chart below indicates the percent of sewer fees collected in 2018 that the municipalities used to pay the District’s assessment and their internal costs. In 2018, Windham’s sewer fees were less than the District’s assessment by $36,592. The shortfall was covered by the town’s prior year surplus or general fund appropriation.
0%
20%
40%
60%
80%
100%
Cape Cumberland Gorham Portland Westbrook Windham
Municipal Sewer Fees Collected in 2018
District Assessment Municipal Costs

141 Revenues
Interest Income The District’s investment policy limits investments to US Government obligations, certificates of deposit that are fully insured or collateralized, and other similar issues with the goal of protecting the District’s principal balances. The budgeted rate of return on investments was based on the current annual returns as of July 2019 and cash balances as of December 2018. Rates of return have been trending upward since 2016. In 2008, the Windham fund purchased assets from the Westbrook fund. This purchase was funded by a loan between funds of $264,733 and has an average interest rate of 4.395%. Westbrook will receive $4,800 from that loan in 2020.
2018 Actual
2019 Actual
Jan-Jun 2019 Budget 2020 Budget $-Diff. %-Diff.
Water Fund $349,235 $329,325 $285,521 $408,100 $122,579 42.9%
Wastewater Operating Funds:
Cape Elizabeth 19,685 16,399 14,143 20,884 6,741 47.7%
Cumberland 12,665 12,060 9,980 13,303 3,323 33.3%
Falmouth 2,334 1,220 409 1,100 691 168.9%
Gorham 26,287 24,528 19,518 18,455 (1,063) -5.4%
Portland 136,641 140,432 104,939 164,504 59,565 56.8%
Westbrook 80,339 79,776 62,258 72,695 10,437 16.8%
Windham 8,449 8,087 6,690 8,103 1,413 21.1%
286,400 282,502 217,937 299,044 81,107 37.2%
Contracted Billing:
Scarborough 122 114 97 103 6 6.2%
South Portland 1,915 2,612 1,828 500 (1,328) -72.6%
2,037 2,726 1,925 603 (1,322) -68.7%
Total 637,672$ 614,553$ 505,383$ 707,747$ 202,364$ 40.0%

142 Revenues
Other Income Other revenues consist of fees charged for various other services including fees related to new water assets, new account setups, work done for outside parties and the acceptance of septage. The specific fees are outlined below:
Revenue Type Revenue Description Cross Connection Fees Fees collected for work relating to the inspection of water
backflow devices. Customer Connection Fees
Application fees for new mains, services and meters.
Customer Activation Fees
Fees for new account activations.
Jobbing Revenue
Revenue for work performed by District employees that is billable to outside parties.
Septage Hauler Fees Wastewater Misc. Income
Fees from outside septage haulers for the treatment of wastewater delivered to District wastewater treatment facilities. Treatment services provided at the Westbrook Regional Wastewater Treatment Facility for Portland’s Riverside area per inter-municipal agreement.
Water Fund:
2018 Actual
2019 Actual
Jan-Jun 2019 Budget 2020 Budget $-Diff. %-Diff.
Cross Connection Fees $58,326 $25,987 $35,800 $50,000 $14,200 39.7%
Customer Connection Fees 82,169 42,213 72,600 82,000 9,400 12.9%
Customer Activation Fee 80,830 32,860 79,000 80,000 1,000 1.3%
Jobbing Surcharge 58,401 21,215 66,914 50,000 (16,914) -25.3%
Miscellaneous Income 231,560 49,500 119,800 164,290 44,490 37.1%
Total Water Division $511,285 $171,775 $374,114 $426,290 $52,176 13.9%
Wastewater Funds:
2018 Actual
2019 Actual
Jan-Jun 2019 Budget 2020 Budget $-Diff. %-Diff.
Septage - Gorham $882 $0 $0 $0 $0 0.0%
Septage - Portland 209,646 70,725 141,600 200,000 58,400 41.2%
Septage - Westbrook 10,657 0 0 0 0 0.0%
Septage - Windham 182 0 0 0 0 0.0%
Miscellaneous Income 38,628 1,500 37,900 38,500 600 1.6%
Total Wastew ater Division 259,995 72,225 179,500 238,500 59,000 32.9%
Total Water & Wastew ater $771,280 $244,000 $553,614 $664,790 $111,176 20.1%

143 Revenues
Fund Balance Fund Balance, or Surplus, is the excess of revenues over expenses on a budgetary basis (see Financial Policy section for differences between budgetary and generally accepted accounting principles). In addition, a portion of water net income is reserved in a watershed protection land fund and debt service on capital projects (Capital Reserve). Also, a portion of revenue from the Portland Wastewater fund is reserved for potential expansion of capacity at the Westbrook Wastewater fund’s treatment plant. Additionally, the Board ordered that the proceeds from the sales of certain surplus properties be reserved in the Land Cash Reserve used for watershed protection. In 2009, the District’s Board of Trustees (BOT) adopted a policy setting targets for operating fund balances (25% of net budget) and the watershed protection reserve (15% of water revenues). These policies do not apply to the Contracted Billing municipalities. It is projected that all of the funds with the exception of Windham (10.7%) will be above the operating fund target of 25.0% at the end of 2020. The balances of the renewal and replacement funds and water main capital reserve fund are listed in the Capital Finance section.
Balance Projected Budget Balance Target Projection
1/1/2019 2019 2020 12/31/2020 Balance %
Water $6,824,532 $391,376 $1,473 $7,217,381 $6,629,822 27.2%Cape Elizabeth 398,772 40,250 - 439,022 431,566 25.4%Cumberland 256,136 - - 256,136 244,649 26.2%Gorham 253,103 41,680 - 294,783 294,783 25.0%Portland 3,216,008 282,817 - 3,498,825 3,306,961 26.5%Westbrook 811,223 (24,409) - 786,814 732,991 26.8%Windham 64,277 (21,960) - 42,317 99,277 10.7%
$11,824,051 $709,754 $1,473 $12,535,278 $11,740,049 26.7%
Falmouth & Contracted Billing Operating Surpluses:
Balance Projected Budget Balance
1/1/2019 2019 2020 12/31/2020
Falmouth $4,331 $10,567 $7,912 $22,810Scarborough 6,995 594 - 7,589 So. Portland 133,779 (81,500) (9,179) 43,100
$145,105 ($70,339) ($1,267) $73,499
Combined Surpluses $11,969,156 $639,415 $206 $12,608,777
Watershed Protection Land Funds (Goal 15.0%)
Balance Projected Budget Balance Target Projection
1/1/2019 2019 2020 12/31/2020 Balance %
Watershed Reserve $1,587,520 $117,694 ($9,803) $1,695,411 $3,722,639 6.8%Land Cash Reserve 661,915 (34,907) (9,074) 617,934
$2,249,435 $82,787 (18,877) $2,313,345 $3,722,639 9.0%
Other Reserves:
.
Balance
1/1/2019
Projected
2019
Budget
2020
Balance
12/31/2020
Capital Reserve $575,547 $127,838 $279,927 $983,312Portland Wastewater $67,593 $7,500 $7,500 $82,593

144 Revenues
Fee Schedule for Non-Water Tariff Services Schedule of latest fees adopted by the Board of Trustees effective August 1, 2018.
Description Fee
A. Water
1. Winter hydrant inspection Inspection of private hydrants to verify the operability of hydrant during winter months
$3 per month on monthly water bill. Cost covers the average cost to inspect hydrant
2. Damage Hydrants Repair of hydrants damaged by customers
Costs to repair including labor, benefit overhead, stock items with normal markup (25%), third-party expenses and $7 finance department administrative fee
B. Wastewater 1. Industrial pretreatment
permit Initial and periodic review of the customer premises to assure compliance with IPT regulations
$300 for initial and every 3-year renewal.
2. Septage and Holding Tank Waste
Qualifying haulers may deliver septage, holding tank and other waste to PWD treatment facilities (see policy 6.20-03)
Consistent with the ‘Acceptance Fee Schedule’ included in Policy 6.20-03.
3. Submeter Fee -Monthly Covers the operating and capital cost of the submeter program
$2 per month at the request of Cumberland, Gorham, South Portland and Westbrook
4. Submeter Fees -Other The cost to investigate why a submeter cannot be read after the initial installation of meter/Encoder Receiver Transmitter (ERT).
Sub meter verification fee $19
5. Submeter Fees – Portland Only
Costs or replacing submeters for Portland residents.
Submeter Replacement ERT & Meter $150 Submeter ERT Only Upgrade fee $105 Fees are per City’s request.
C. General 1. Purchases from Stock
Room Qualified third-parties and employees may purchase items from the stockroom – see policy 7.15-02.
Inventory value plus a 50% mark up (See Policy 7.15-02).
2. Freedom of Information Request
Members of the Public requesting access to public records (see policy 7.05-05).
$1 for first page, $0.50 for each additional page, optional $15/hour to compile data. Payment in advance may be required. (See Policy 7.05-05)

145 Departmental Expense
Introduction Operating Expenses are recorded to each department by expense category by fund and program. A summary of all expense categories is provided with an explanation of major assumptions and changes. Additionally, operating expenses for each department is provided. The District has five departments – Water Operations, Wastewater Operations, Environmental Services, Engineering Services and Administrative Services. For each department, the following information is provided:
Description of Core Services
Key Statistics
Performance Benchmarks
Past Accomplishments
Current Year Projects and Initiatives
Financial Summary in total and by sub-departments with a summary of each sub-department fund and program expenses
2020 Financial Summary by Category
2019 Budget 2020 Budget Diff $ Diff %
Salaries & Wages $11,507,789 $12,149,805 $642,016 5.6%Employee Benefits 5,520,409 5,577,447 $57,038 1.0%Biosolids Disposal 1,674,962 1,722,166 $47,204 2.8%Chemicals 1,137,386 1,221,909 $84,523 7.4%Contracted Services 4,484,961 4,521,570 $36,609 0.8%Deferred Cost W/O 10,100 - -$10,100 -100.0%Heat/Fuel Oil 331,981 386,485 $54,504 16.4%Insurance 196,845 211,175 $14,330 7.3%Materials & Supplies 1,764,434 1,760,135 -$4,299 -0.2%Other Expense 782,000 836,146 $54,146 6.9%Purchased Pow er 1,751,432 1,930,289 $178,857 10.2%Regulatory/Taxes 213,965 244,649 $30,684 14.3%Tele/Other Utilties 356,021 365,099 $9,078 2.5%Transportation 1,139,310 1,167,423 $28,113 2.5%Dept Expense 30,871,595 32,094,298 $1,222,703 4.0%Trans Offset (829,454) (840,466) -$11,012 1.3%Fund Expense 30,042,141 31,253,832 $1,211,691 4.0%
2020 Financial Summary by Department
Number of
Employees 2019 Budget
Number of
Employees
2020
Budget
Budget
Diff $
Budget
Diff %
Water Services 54 $8,795,473 56 $9,207,119 $411,646 4.7%Wastewater Services 39 9,567,783 39 10,149,276 581,493 6.1%Environmental Services 16 2,068,960 16 2,124,837 55,877 2.7%Engineering Services 31 4,356,957 31 4,259,770 (97,187) -2.2%Administration 42 5,821,457 44 6,064,147 242,690 4.2%Non-Departmental 0 260,965 0 289,149 28,184 10.8%
182 30,871,595 186 32,094,298 1,222,703 4.0%

146 Departmental Expense
Departmental Expense by Category
Salaries/Wages:
2018
Actual
2019
Jan-Jun
2019
Budget
2020
Budget
Budget
Diff $
Budget
Diff %
660111 - SALARIES/WAGES NON-UNION $4,126,499 $2,167,664 $4,552,112 $4,781,060 $228,948 5.0%660112 - WAGES/OVERTIME NON-UNION 212 317 - - - n/a660121 - WAGES/REGULAR UNION 5,749,301 2,834,552 6,041,999 6,375,012 333,013 5.5%660122 - WAGES/OVERTIME UNION 476,299 223,472 513,046 557,763 44,717 8.7%660123 - WAGES/DOUBLETIME UNION 54,577 20,677 59,805 67,408 7,603 12.7%660124 - WAGES/STANDBY TIME UNION 148,253 70,558 137,677 163,272 25,595 18.6%660131 - WAGES - REGULAR - TEMPS 109,081 46,905 171,150 178,290 7,140 4.2%660132 - WAGES - OVERTIME- TEMPS 116 - - - - n/a660136 - CONTRACTED - TEMP 1,232 - 5,000 - (5,000) -100.0%66014 - VACATION ACCRUAL 69,334 - - - - n/a660141 - TRUSTEES COMPENSATION 21,650 12,825 27,000 27,000 - 0.0%66015 - SICKTIME ACCRUAL 29,208 - - - - n/aSalaries & Wages Total 10,785,763 5,376,970 11,507,789 12,149,805 642,016 5.6%
Labor rates for Non-Union employees were assumed to be 3.0% higher than the rates paid on July 1, 2019. The Union contract calls for increases of 3.0% in November of 2018, 2019 and 2020. Combined, the two regular labor accounts (660111 & 660121) increased $561,961 (5.3%). Total hours increased 8,807 (2.4%) primarily due to the addition of four (4) positions. The average wage change between the budget years was 2.8%. Budgeted hours for overtime/double-time/standby rose 5.8% (781 hours), 9.3% (107 hours) and 14.3% respectively to reflect anticipated need while hours for temporary employees (included contracted) increased 2.1% (250 hours). The budgeted dollars for labor reflect work on operating (O&M) activities. Labor planned for capital projects is included as part of the Capital Improvement Plan (CIP) later in this document. Overall, the percentage of labor planned for CIP projects decreased from 3.3% of total labor in 2019 to 3.1% in 2020 (a decrease of $6,121 or 1.6%). District’s overall number of regular (non-temporary) employees increased to 186.
Positions
2019
Budget
2020
Budget Change
Full Time 180 185 5Part Time 2 1 -1
Total 182 186 4 The Human Resources section has additional details.
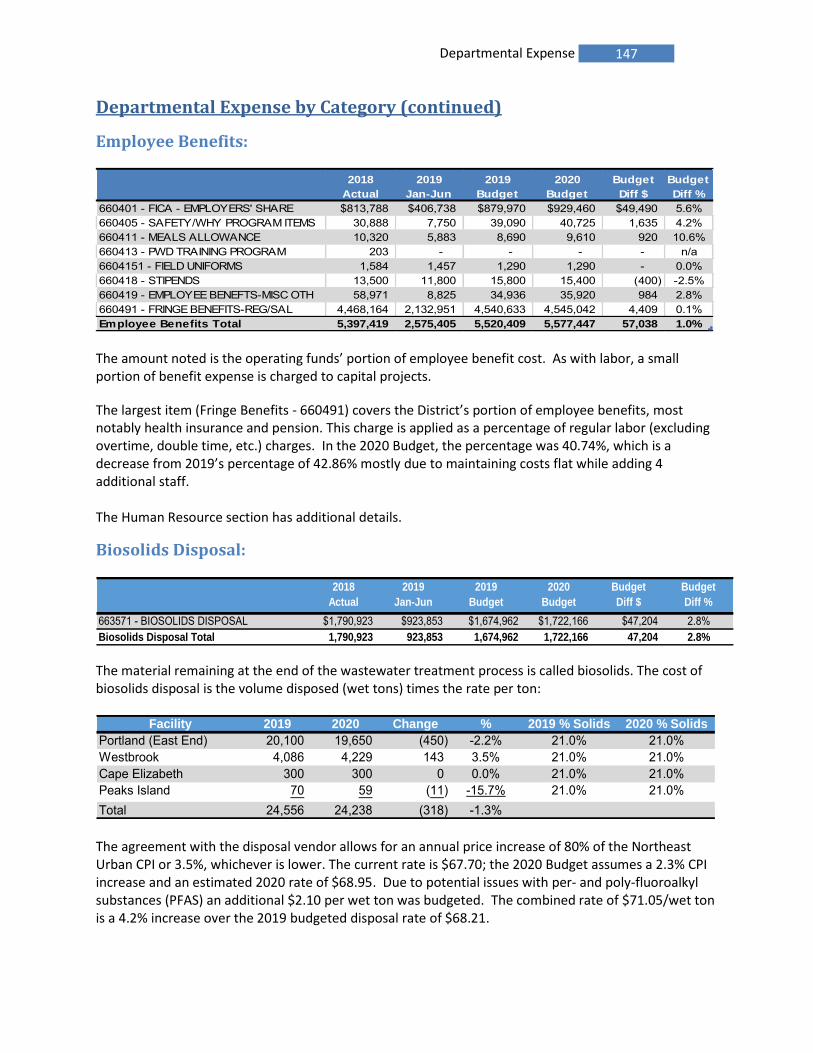
147 Departmental Expense
Departmental Expense by Category (continued)
Employee Benefits:
2018
Actual
2019
Jan-Jun
2019
Budget
2020
Budget
Budget
Diff $
Budget
Diff %
660401 - FICA - EMPLOYERS' SHARE $813,788 $406,738 $879,970 $929,460 $49,490 5.6%660405 - SAFETY/WHY PROGRAM ITEMS 30,888 7,750 39,090 40,725 1,635 4.2%660411 - MEALS ALLOWANCE 10,320 5,883 8,690 9,610 920 10.6%660413 - PWD TRAINING PROGRAM 203 - - - - n/a6604151 - FIELD UNIFORMS 1,584 1,457 1,290 1,290 - 0.0%660418 - STIPENDS 13,500 11,800 15,800 15,400 (400) -2.5%660419 - EMPLOYEE BENEFTS-MISC OTH 58,971 8,825 34,936 35,920 984 2.8%660491 - FRINGE BENEFITS-REG/SAL 4,468,164 2,132,951 4,540,633 4,545,042 4,409 0.1%Employee Benefits Total 5,397,419 2,575,405 5,520,409 5,577,447 57,038 1.0% The amount noted is the operating funds’ portion of employee benefit cost. As with labor, a small portion of benefit expense is charged to capital projects.
The largest item (Fringe Benefits - 660491) covers the District’s portion of employee benefits, most notably health insurance and pension. This charge is applied as a percentage of regular labor (excluding overtime, double time, etc.) charges. In the 2020 Budget, the percentage was 40.74%, which is a decrease from 2019’s percentage of 42.86% mostly due to maintaining costs flat while adding 4 additional staff. The Human Resource section has additional details.
Biosolids Disposal:
2018
Actual
2019
Jan-Jun
2019
Budget
2020
Budget
Budget
Diff $
Budget
Diff %
663571 - BIOSOLIDS DISPOSAL $1,790,923 $923,853 $1,674,962 $1,722,166 $47,204 2.8%Biosolids Disposal Total 1,790,923 923,853 1,674,962 1,722,166 47,204 2.8%
The material remaining at the end of the wastewater treatment process is called biosolids. The cost of biosolids disposal is the volume disposed (wet tons) times the rate per ton:
Facility 2019 2020 Change % 2019 % Solids 2020 % Solids
Portland (East End) 20,100 19,650 (450) -2.2% 21.0% 21.0%Westbrook 4,086 4,229 143 3.5% 21.0% 21.0%Cape Elizabeth 300 300 0 0.0% 21.0% 21.0%Peaks Island 70 59 (11) -15.7% 21.0% 21.0%Total 24,556 24,238 (318) -1.3% The agreement with the disposal vendor allows for an annual price increase of 80% of the Northeast Urban CPI or 3.5%, whichever is lower. The current rate is $67.70; the 2020 Budget assumes a 2.3% CPI increase and an estimated 2020 rate of $68.95. Due to potential issues with per- and poly-fluoroalkyl substances (PFAS) an additional $2.10 per wet ton was budgeted. The combined rate of $71.05/wet ton is a 4.2% increase over the 2019 budgeted disposal rate of $68.21.

148 Departmental Expense
Departmental Expense by Category (continued)
Chemicals:
2018
Actual
2019
Jan-Jun
2019
Budget
2020
Budget
Budget
Diff $
Budget
Diff %
66181 - AMMONIA $23,691 $12,149 $23,752 $21,080 ($2,672) -11.2%661811 - SODIUM BICARBONATE 15,386 8,530 14,620 13,800 (820) -5.6%661812 - SODIUM BISULFITE 120,988 87,628 172,100 217,846 45,746 26.6%66182 - CAUSTIC SODA 110,454 45,008 144,945 92,416 (52,529) -36.2%66183 - FLUORIDE 36,095 15,473 40,340 33,164 (7,176) -17.8%66184 - ZINC ORTHOPHOSPHATE 64,272 45,524 74,727 80,318 5,591 7.5%66185 - SODIUM HYPOCHLORITE 345,412 171,437 402,830 398,282 (4,548) -1.1%66189 - POLYMER 222,814 198,721 195,270 256,765 61,495 31.5%661892 - LIQUID OXYGEN (LOX) 68,412 40,316 61,902 88,900 26,998 43.6%661899 - OTHER CHEMICALS 25,528 8,726 19,038 19,338 12,438 180.3%Chemicals Total 1,033,052 633,511 1,149,524 1,221,909 84,523 7.4%
Chemicals are primarily used at the District’s two water and four wastewater treatment facilities. The budget increase above was driven by both increases in usage and price (see chart below). Actual unit prices will be known in December. Volumes used were adjusted up or down depending upon historic usage or operational changes. The overall decrease at the Water Treatment plant was mostly driven by changes in per unit cost. The East End WWTF in Portland saw large increases (Polymer) and decreases (Sodium Hypochlorite) in volume combined with large increases in per unit cost. The Westbrook WWTF, which just upgraded its dewatering system, budgeted both large increases in volume and unit price.
% Change Budget
Units Per Unit Units Per Unit Units Per Unit Dollars
Water Treatment (Ozone) Ammonia 16,269 $1.46 15,500 $1.36 -4.7% -6.8% -$2,672Caustic Soda 89,958 $1.55 84,972 $0.97 -5.5% -37.4% -$57,012Fluorine Compound 19,162 $2.09 18,600 $1.77 -2.9% -15.4% -$7,176Liquid Oxygen 121,377 $0.51 127,000 $0.70 4.6% 37.3% $26,998Sodium Hypochlorite 146,112 $0.85 140,000 $1.01 -4.2% 18.8% $17,205Zinc Orthophosphate 18,451 $4.05 18,652 $4.31 1.1% 6.3% $5,591
-$17,066East End WWTFPolymer 174,870 $0.93 200,000 $1.02 14.4% 9.7% $41,371Sodium Bisulfite 121,440 $1.31 123,924 $1.63 2.0% 24.4% $42,910Sodium Hypochlorite 294,500 $0.85 219,000 $1.01 -25.6% 18.8% -$29,135
$38,080Westbrook WWTFPolymer 32,120 $0.93 49,980 $1.02 55.6% 9.7% $21,111Sodium Bisulfite 5,500 $2.33 6,521 $2.43 18.6% 4.3% $3,031Sodium Hypochlorite 31,000 $0.85 33,488 $1.01 8.0% 18.8% $7,473
$31,615
2019 Assumption 2020 Assumption

149 Departmental Expense
Departmental Expense by Category (continued)
Contracted Services:
2018
Actual
2019
Jan-Jun
2019
Budget
2020
Budget
Budget
Diff $
Budget
Diff %
662063 - COPIER MAINTENANCE/TONER $14,054 $8,671 $13,000 $15,000 $2,000 15.4%6631 - ENGINEERING SERVICES 86,528 18,071 199,500 217,075 17,575 8.8%6632 - ACCOUNTING SERVICES 35,000 35,500 35,500 37,500 2,000 5.6%66331 - LEGAL - LABOR RELATIONS 86,236 33,103 85,000 65,000 (20,000) -23.5%66333 - BOND COUNSEL 7,500 - 7,500 7,500 - 0.0%66339 - LEGAL - OTHER 13,427 5,347 34,500 19,500 (15,000) -43.5%66352 - CONSTRUCTION SERVICES 3,474 - 5,500 3,500 (2,000) -36.4%663521 - TRAFFIC CONTROL 98,976 52,519 60,050 72,800 12,750 21.2%6635221 - PAVING - MINOR REPAIR 467,740 117,742 526,000 526,000 - 0.0%663523 - SIDEWALK 17,229 12,216 18,500 18,500 - 0.0%663524 - STREET OPENING 56,348 23,785 61,100 61,100 - 0.0%663525 - CONTRACTOR CONSTRUCTION 582,172 174,872 613,500 633,500 20,000 3.3%66353 - REPAIR SERVICES 28,413 11,346 57,500 63,000 5,500 9.6%66354 - MAINTENANCE SERVICES 719,270 335,385 710,715 786,666 75,951 10.7%663542 - LARGE METER TESTING 7,516 - 6,500 6,500 - 0.0%663543 - CSO FLOW MONITORING 102,880 - 156,375 156,375 - 0.0%663544 - MAINT SERVICES - CCTV 76,300 - 65,350 61,250 (4,100) -6.3%663545 - RADIO SERVICING AND EQUIP 12,266 1,148 3,500 4,000 500 14.3%663546 - MAINTENANCE - SNOW REMOVL 110,896 59,540 112,119 129,890 17,771 15.9%663547 - WASTE SLUDGE TRANSPORT 39,859 12,950 32,000 33,800 1,800 5.6%663551 - LAB ANALYSIS 31,890 18,128 45,060 51,445 6,385 14.2%663561 - COMPUTER LICENSES 84,798 67,232 87,190 91,945 4,755 5.5%663562 - COMPUTER MAINTENANCE 288,289 123,137 402,350 288,006 (114,344) -28.4%663563 - COMPUTER CONSULTING/OTHER 19,499 34,118 20,600 25,600 5,000 24.3%663572 - GRIT & SCREENS DISPOSAL 41,327 17,235 74,450 74,450 - 0.0%663573 - GREASE DISPOSAL 25,549 9,824 30,200 30,700 500 1.7%663574 - DISPOSAL SERVICES 24,153 19,022 37,960 44,440 6,480 17.1%6635801 - EMPLOYEE HEALTH SERVICES 8,473 4,413 10,000 10,000 - 0.0%663581 - UTILITY BILLING PRINTING 71,658 33,384 81,094 83,933 2,839 3.5%663582 - PAYMENT PROCESSING 150,134 64,301 150,215 154,630 4,415 2.9%663583 - RECEIVABLE COLLECTIONS 9,270 3,654 10,000 10,000 - 0.0%663584 - BANK SERVICE CHARGES 22,105 12,443 22,800 26,400 3,600 15.8%663585 - TREATMENT CONTRACT SERVIC 510,730 198,967 395,483 410,470 14,987 3.8%6635851 - WW DEWATERING SERVICES 3,998 1,674 5,100 5,020 (80) -1.6%6635852 - WW DEWATERING SRVS CREDIT (3,998) (1,674) (5,500) (5,000) 500 -9.1%663587 - COURIER SERVICES 22,237 11,414 23,300 24,300 1,000 4.3%663588 - EQUIPMENT MAINTENANCE 15,269 2,817 17,470 17,520 50 0.3%663589 - SECURITY SERVICES 85,836 42,594 84,000 30,000 (54,000) -64.3%663592 - RECRUITING SERVICES 2,451 2,620 7,000 7,000 - 0.0%663594 - DIGSAFE 56,828 20,006 71,000 63,000 (8,000) -11.3%663595 - OUTPLACEMENT SERVICES - - 1,000 1,000 - 0.0%663598 - HR CONSULTANT SERVICES 1,900 350 8,000 45,000 37,000 462.5%6635982 - TREE TRIMMING / REMOVAL - - 7,000 7,000 - 0.0%6635984 - LANGUAGE INTERPRETATION 32 51 355 355 - 0.0%6635985 - VEHICLE FLEET GPS SERVICE 21,560 10,780 25,000 25,000 - 0.0%663599 - MISC OTHER SERVICES 40,197 23,536 45,325 34,650 (10,675) -24.0%6636 - TECHNICAL SERVICES 5,868 8,479 24,800 46,250 21,450 86.5%Contracted Services Total 4,106,137 1,630,701 4,484,961 4,521,570 36,609 0.8%
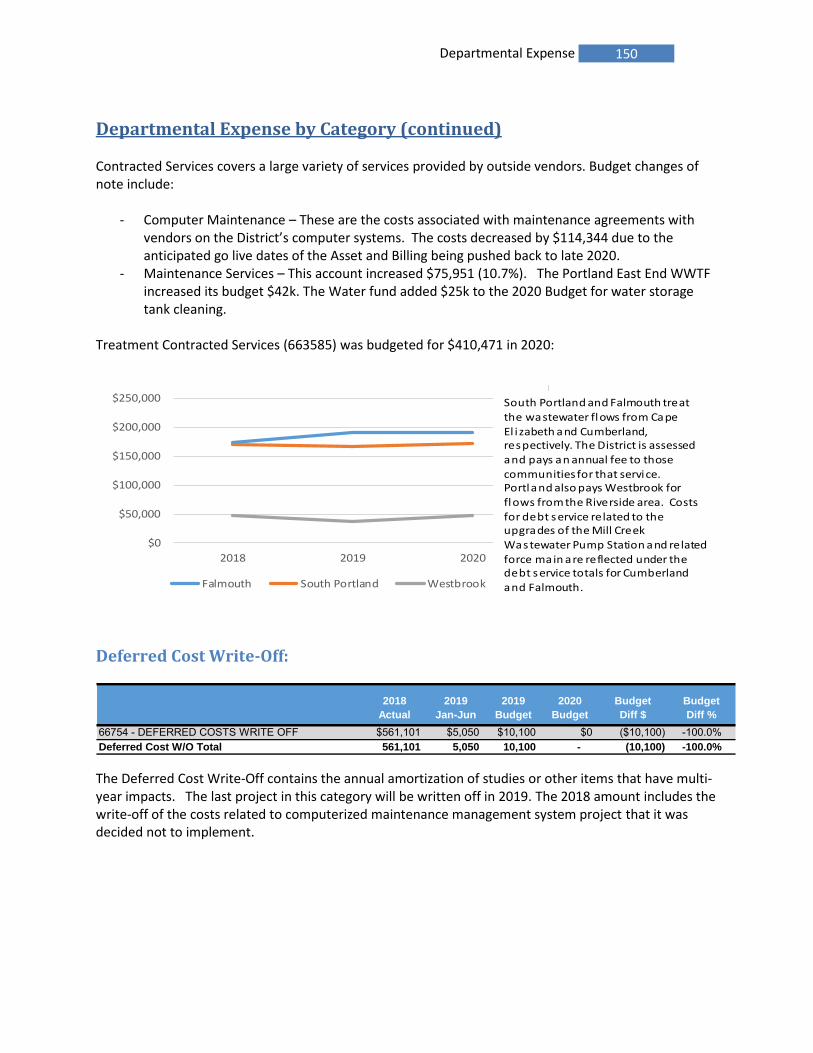
150 Departmental Expense
Departmental Expense by Category (continued) Contracted Services covers a large variety of services provided by outside vendors. Budget changes of note include:
- Computer Maintenance – These are the costs associated with maintenance agreements with vendors on the District’s computer systems. The costs decreased by $114,344 due to the anticipated go live dates of the Asset and Billing being pushed back to late 2020.
- Maintenance Services – This account increased $75,951 (10.7%). The Portland East End WWTF increased its budget $42k. The Water fund added $25k to the 2020 Budget for water storage tank cleaning.
Treatment Contracted Services (663585) was budgeted for $410,471 in 2020:
$0
$50,000
$100,000
$150,000
$200,000
$250,000
2018 2019 2020
Falmouth South Portland Westbrook
South Portland and Falmouth treat the wastewater flows from Cape El i zabeth and Cumberland, respectively. The District is assessed and pays an annual fee to those communities for that service. Portland also pays Westbrook for flows from the Riverside area. Costs for debt service related to the upgrades of the Mill Creek
Wastewater Pump Station and related
force main are reflected under the debt service totals for Cumberland
and Falmouth.
Deferred Cost Write-Off:
2018
Actual
2019
Jan-Jun
2019
Budget
2020
Budget
Budget
Diff $
Budget
Diff %
66754 - DEFERRED COSTS WRITE OFF $561,101 $5,050 $10,100 $0 ($10,100) -100.0%Deferred Cost W/O Total 561,101 5,050 10,100 - (10,100) -100.0%
The Deferred Cost Write-Off contains the annual amortization of studies or other items that have multi-year impacts. The last project in this category will be written off in 2019. The 2018 amount includes the write-off of the costs related to computerized maintenance management system project that it was decided not to implement.

151 Departmental Expense
Departmental Expense by Category (continued)
Heat/Fuel Oil:
2018
Actual
2019
Jan-Jun
2019
Budget
2020
Budget
Budget
Diff $
Budget
Diff %
66161 - HEATING OIL $110,067 $61,102 $95,939 $106,701 $10,762 11.2%661621 - PIPELINE DELIVERED PROPAN 141,046 77,223 155,196 160,016 4,820 3.1%661622 - CONTAINER DELIVERED 73,029 58,276 56,796 95,718 38,922 68.5%66166 - UNLEADED GAS 22,922 8,714 24,050 24,050 - 0.0%Heat/Fuel Oil Total 347,064 205,314 331,981 386,485 54,504 16.4%
The first three accounts in this category (66161 to 661622) involve fuel used for facilities’ heat or backup generators. Unleaded Gas (66166) is for District vehicles that fuel up at remote locations and for the boat used in the District’s Sebago Lake monitoring efforts. The increase in the category is primarily due to a rise in per unit costs and increase usage of natural gas at the Westbrook Treatment Plant.
% Change
Units Per Unit Units Per Unit Units Per Unit
Heating Oil:
Water Treatment/Ozone Plant 35,484 $1.85 35,650 $2.15 0.5% 16.2%Westbrook WWTF 6,000 $2.45 6,000 $2.10 0.0% -14.3%Cape Elizabeth WWTF 2,393 $2.44 3,288 $2.08 37.4% -14.8%Peaks Island WWTF 2,129 $3.45 2,240 $3.19 5.2% -7.5%Water - Throttling Valve Building 964 $2.50 1,100 $2.20 14.1% -12.0%
46,970 $2.04 48,278 $2.19 2.8% 7.1%Natural Gas:
Portland (East End) WWTF 87,836 $1.15 84,658 $1.21 -3.6% 5.2%Dana Court WWPS (Westbrook) 2,609 $1.15 2,479 $1.21 -5.0% 5.2%Douglass Street 42,609 $1.15 42,144 $1.21 -1.1% 5.2%
130,445 $1.15 126,802 $1.21 -2.8% 5.2%
2019 Assumption 2020 Assumption
Insurance:
2018
Actual
2019
Jan-Jun
2019
Budget
2020
Budget
Budget
Diff $
Budget
Diff %
6656 - VEHICAL INSURANCE $26,758 $14,433 $32,233 $30,888 ($1,345) -4.2%6657 - GEN LIABILITY INSURANCE 52,252 27,983 55,966 59,884 3,918 7.0%66592 - DAMAGES & CLAIMS-GOODWILL 5,726 200 4,000 4,500 500 12.5%66593 - UMBRELLA INSURANCE COVER 9,074 4,812 9,606 10,297 691 7.2%66594 - PROFESSION/CRIME BONDING 25,587 12,961 26,027 27,736 1,709 6.6%66599 - PROPERTY & BOILER INSUR 71,218 37,491 69,013 77,870 8,857 12.8%Insurance Total 190,615 97,879 196,845 211,175 14,330 7.3%
Insurance costs include premiums paid on coverage for District property as well as small claims paid directly to outside parties.

152 Departmental Expense
Departmental Expense by Category (continued)
Materials & Supplies:
2018
Actual
2019
Jan-Jun
2019
Budget
2020
Budget
Budget
Diff $
Budget
Diff %
6619 - ASSET PURCHASES 168,182 84,901 219,475 281,075 61,600 28.1%662012 - CRUSHED GRAVEL 3,592 829 550 1,750 1,200 218.2%662016 - SAND - - 3,820 3,820 - 0.0%662017 - SAND AND SALT 1,824 1,260 3,452 3,452 - 0.0%662018 - BANKRUN GRAVEL 1,166 454 - 2,000 2,000 n/a662019 - GRAVEL - TYPE A (DOT) 620 1,627 - 2,000 2,000 n/a66202 - TOOLS 45,712 19,094 45,500 43,500 (2,000) -4.4%66203 - VENDOR PURCHASED SUPPLIES 520,328 184,150 546,870 524,968 (34,040) -6.1%662041 - MATERIALS INVENTORY 209,089 113,543 203,965 220,075 16,110 7.9%662042 - SUPPLIES INVENTORY 107,188 48,664 89,775 94,435 4,660 5.2%66204201 - INVENTORY - QPR 204 1,464 2,500 2,500 - 0.0%66204202 - INVENTORY - BNKRUN GRAVEL 11,021 6,884 14,000 14,500 500 3.6%66204203 - INVENTORY - CRUSHD GRAVEL 19,692 5,498 18,750 18,750 - 0.0%66204204 - INVENTORY - CRUSHED STONE 1,938 2,974 1,700 2,250 550 32.4%66204205 - INVENTORY - LOAM 3,039 152 2,250 1,250 (1,000) -44.4%66204206 - INVENTORY - TYPE A GRAVEL 15,838 8,176 - - - n/a662043 - TOOL INVENTORY 124,223 53,659 92,025 94,025 2,000 2.2%66204301 - INVENTORY - TONER 1,089 698 1,000 500 (500) -50.0%66204302 - INVENTORY - PAPER 3,444 2,254 2,300 4,300 2,000 87.0%66204303 - INVENTORY-COMPUTER EQUIP 18,504 7,528 19,891 20,452 561 2.8%662044 - METER INVENTORY 56,762 1,519 17,850 17,850 - 0.0%662046 - HYDRANT INVENTORY 45,845 16,867 69,400 59,000 (10,400) -15.0%662047 - GARAGE INVENTORY 20,316 9,194 16,450 15,750 (700) -4.3%66204701 - INVENTORY - UNLEADED GAS 101,285 48,611 121,550 102,850 (18,700) -15.4%66204702 - INVENTORY - DIESEL 41,175 24,937 57,057 48,741 (8,316) -14.6%66204703 - INVENTORY - TIRES 9,766 8,561 15,000 15,000 - 0.0%66205 - CONSUMABLE SUPPLIES 82,107 41,766 95,550 93,200 (2,350) -2.5%66206 - COMPUTER RELATED EQUIP 73,866 25,191 91,616 72,142 (19,474) -21.3%Materials & Supplies Total 1,687,816 720,455 1,752,296 1,760,135 (4,299) -0.2%
This group is a wide array of items including vehicle fuel and parts, bulk materials such as gravel, water infrastructure items (mains, meters, hydrants, and fittings) and office supplies. These items are consumed during normal operations and are used for the repair and maintenance of District assets. The 2020 Budget is flat with an overall decrease of 0.2%. Vehicle fuel prices (see below) dropped, as the District was able to lock in lower costs for most of 2020. The assumptions for vehicle fuel were:
% Change
Fuel Type Units Per Unit Units Per Unit Units Per Unit
Diesel 23,100 $2.47 23,100 $2.11 0.0% -14.6%Unleaded Gas 55,000 $2.21 55,000 $1.87 0.0% -15.4%
78,100 78,100 0.0%
2019 Assumption 2020 Assumption
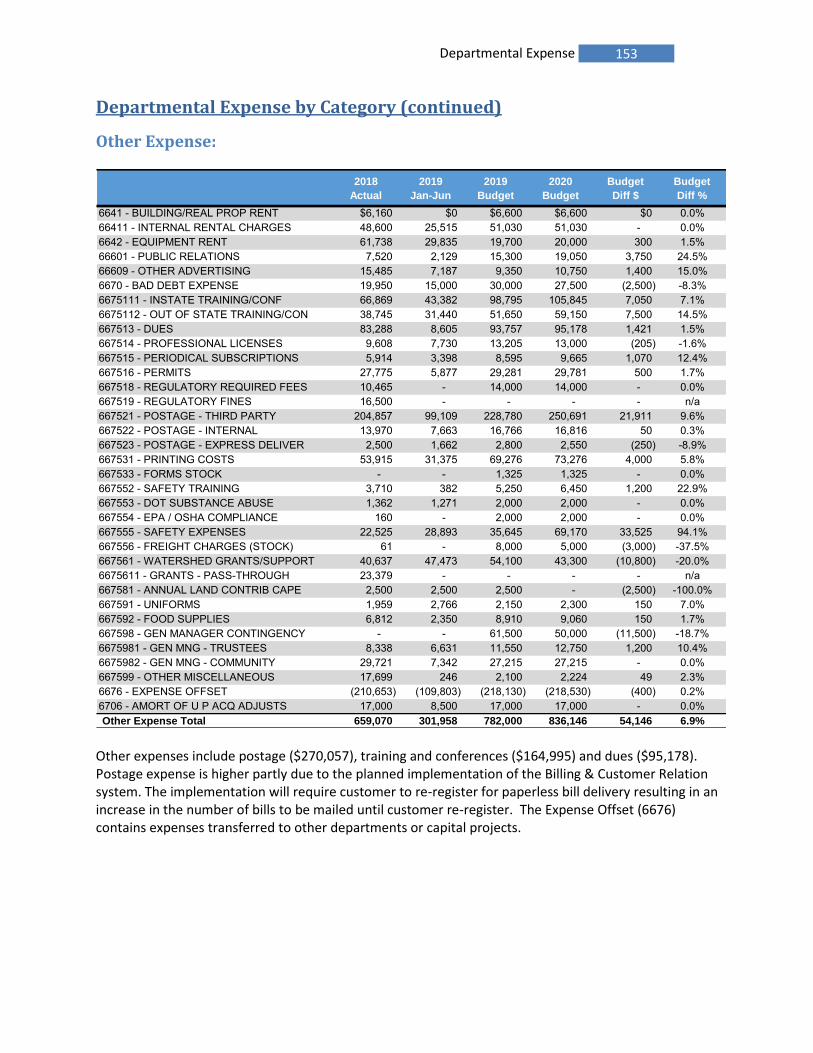
153 Departmental Expense
Departmental Expense by Category (continued)
Other Expense:
2018
Actual
2019
Jan-Jun
2019
Budget
2020
Budget
Budget
Diff $
Budget
Diff %
6641 - BUILDING/REAL PROP RENT $6,160 $0 $6,600 $6,600 $0 0.0%66411 - INTERNAL RENTAL CHARGES 48,600 25,515 51,030 51,030 - 0.0%6642 - EQUIPMENT RENT 61,738 29,835 19,700 20,000 300 1.5%66601 - PUBLIC RELATIONS 7,520 2,129 15,300 19,050 3,750 24.5%66609 - OTHER ADVERTISING 15,485 7,187 9,350 10,750 1,400 15.0%6670 - BAD DEBT EXPENSE 19,950 15,000 30,000 27,500 (2,500) -8.3%6675111 - INSTATE TRAINING/CONF 66,869 43,382 98,795 105,845 7,050 7.1%6675112 - OUT OF STATE TRAINING/CON 38,745 31,440 51,650 59,150 7,500 14.5%667513 - DUES 83,288 8,605 93,757 95,178 1,421 1.5%667514 - PROFESSIONAL LICENSES 9,608 7,730 13,205 13,000 (205) -1.6%667515 - PERIODICAL SUBSCRIPTIONS 5,914 3,398 8,595 9,665 1,070 12.4%667516 - PERMITS 27,775 5,877 29,281 29,781 500 1.7%667518 - REGULATORY REQUIRED FEES 10,465 - 14,000 14,000 - 0.0%667519 - REGULATORY FINES 16,500 - - - - n/a667521 - POSTAGE - THIRD PARTY 204,857 99,109 228,780 250,691 21,911 9.6%667522 - POSTAGE - INTERNAL 13,970 7,663 16,766 16,816 50 0.3%667523 - POSTAGE - EXPRESS DELIVER 2,500 1,662 2,800 2,550 (250) -8.9%667531 - PRINTING COSTS 53,915 31,375 69,276 73,276 4,000 5.8%667533 - FORMS STOCK - - 1,325 1,325 - 0.0%667552 - SAFETY TRAINING 3,710 382 5,250 6,450 1,200 22.9%667553 - DOT SUBSTANCE ABUSE 1,362 1,271 2,000 2,000 - 0.0%667554 - EPA / OSHA COMPLIANCE 160 - 2,000 2,000 - 0.0%667555 - SAFETY EXPENSES 22,525 28,893 35,645 69,170 33,525 94.1%667556 - FREIGHT CHARGES (STOCK) 61 - 8,000 5,000 (3,000) -37.5%667561 - WATERSHED GRANTS/SUPPORT 40,637 47,473 54,100 43,300 (10,800) -20.0%6675611 - GRANTS - PASS-THROUGH 23,379 - - - - n/a667581 - ANNUAL LAND CONTRIB CAPE 2,500 2,500 2,500 - (2,500) -100.0%667591 - UNIFORMS 1,959 2,766 2,150 2,300 150 7.0%667592 - FOOD SUPPLIES 6,812 2,350 8,910 9,060 150 1.7%667598 - GEN MANAGER CONTINGENCY - - 61,500 50,000 (11,500) -18.7%6675981 - GEN MNG - TRUSTEES 8,338 6,631 11,550 12,750 1,200 10.4%6675982 - GEN MNG - COMMUNITY 29,721 7,342 27,215 27,215 - 0.0%667599 - OTHER MISCELLANEOUS 17,699 246 2,100 2,224 49 2.3%6676 - EXPENSE OFFSET (210,653) (109,803) (218,130) (218,530) (400) 0.2%6706 - AMORT OF U P ACQ ADJUSTS 17,000 8,500 17,000 17,000 - 0.0%Other Expense Total 659,070 301,958 782,000 836,146 54,146 6.9%
Other expenses include postage ($270,057), training and conferences ($164,995) and dues ($95,178). Postage expense is higher partly due to the planned implementation of the Billing & Customer Relation system. The implementation will require customer to re-register for paperless bill delivery resulting in an increase in the number of bills to be mailed until customer re-register. The Expense Offset (6676) contains expenses transferred to other departments or capital projects.

154 Departmental Expense
Departmental Expense by Category (continued)
Purchased Power:
2018
Actual
2019
Jan-Jun
2019
Budget
2020
Budget
Budget
Diff $
Budget
Diff %
66151 - POWER - LARGE ENERGY $473,773 $257,110 $469,301 $512,038 $42,737 9.1%66152 - POWER - LARGE T&D 494,389 222,490 438,628 506,079 67,451 15.4%66153 - POWER - MEDIUM ENERGY 386,543 191,387 322,410 347,020 24,610 7.6%66154 - POWER - MEDIUM T&D 234,567 124,453 197,030 253,427 56,397 28.6%66155 - POWER - SMALL ENERGY 62,587 35,222 52,375 61,912 9,537 18.2%66156 - POWER - SMALL T&D 69,302 39,591 64,715 73,195 8,480 13.1%66157 - POWER - OTHER CHARGES 110,050 41,238 105,995 97,108 (8,887) -8.4%66158 - LOAD RESPONSE (21,985) (5,596) (20,800) (10,300) 10,500 -50.5%66159 - POWER - CAPACITY 141,521 75,213 121,778 89,810 (31,968) -26.3%Grand Total 1,950,747 981,109 1,751,432 1,930,289 178,857 10.2% Electricity is delivered through the Central Maine Power transmission & distribution (T&D) system. The average 2020 rate per kwh ranges from $0.047 to $0.079. The District purchases its electricity from Constellation Energy through an energy aggregation group - Maine Power Option. Energy contracts for small and medium accounts have been signed through December 2022. The contract for the Water Treatment Plant has been signed through December 2022 and the contracts for the Wastewater Treatment Plant and India Street Pump Station are in effect through November 2022 The chart below shows the average rates for these 3 large accounts as well as the remaining 106 small and medium sized accounts.
-
5,000,000
10,000,000
15,000,000
20,000,000
2017 2018 2019 2020
KWH
Electricity Usage by Contract and Average T&D/Energy Rate
All Other Accounts
Portland WW Treatment Plant & India Street Pump Station
Water Treatment Plant
3.2¢/5.0¢ 2.8¢/6.4¢ 2.7¢/4.7¢
6.8¢/7.0¢7.2¢/7.7¢5.3¢/4.8¢
4.6¢/6.6¢5.1¢/7.0¢5.6¢/7.8¢ 5.3¢/6.7¢
7.9¢/6.9¢
2.8¢/5.4¢

155 Departmental Expense
Departmental Expense by Category (continued)
Regulatory/Taxes:
2018
Actual
2019
Jan-Jun
2019
Budget
2020
Budget
Budget
Diff $
Budget
Diff %
670821 - STANDISH REAL ESTATE TAX $49,035 $24,152 $47,800 $50,500 $2,700 5.6%670822 - OTHER R/E TAX(NON-STANDI) 8,038 5,288 8,000 8,874 874 10.9%670823 - PUC ASSESSMENT 85,583 94,327 79,500 90,000 10,500 13.2%670824 - ME DRINKING WTR PROGRAM 82,438 82,438 68,665 80,275 11,610 16.9%670825 - PUC PUBLIC ADVOCATE 3,069 - 10,000 15,000 5,000 50.0%Regulatory/Taxes Total 228,163 206,205 213,965 244,649 30,684 14.3%
The District pays real estate taxes to the Town of Standish (670821) & Towns of Windham and Gorham (670822). The District also pays annual assessments to the Maine Public Utility Commission (PUC) and the Maine Drinking Water Program. The PUC fee is based on each utility’s revenues and time spent on matters related to each industry sector.
Telephone/Other Utilities:
2018
Actual
2019
Jan-Jun
2019
Budget
2020
Budget
Budget
Diff $
Budget
Diff %
66101 - WATER $103,317 $51,751 $91,567 $95,659 $4,092 4.5%66102 - WASTEWATER 70,511 34,699 57,202 80,438 23,236 40.6%66103 - STORMWATER CHARGES 30,965 19,706 32,083 32,283 200 0.6%66111 - TELEPHONE LINES 26,470 15,090 26,722 25,712 (1,010) -3.8%66112 - DATA LINES 105,754 67,724 103,650 89,504 (14,146) -13.6%66113 - CELLULAR PHONES 47,028 35,752 43,904 41,100 (2,804) -6.4%66114 - PAGERS 922 - 893 403 (490) -54.9%Tele/Other Utilties Total 384,967 224,723 356,021 365,099 9,078 2.5% An external audit of communications services resulted in an overall decrease in the Telephone, Data and Cellular line items. Stormwater Charges (66103) are a relatively new fee that the City of Portland charges property owners based on the amount of their impermeable surfaces such as roofs and paved surfaces.
Transportation:
2018
Actual
2019
Jan-Jun
2019
Budget
2020
Budget
Budget
Diff $
Budget
Diff %
66501 - TRANSPORTATION - INTERNAL $581,634 $305,188 $647,851 $731,875 $84,024 13.0%665019 - TRANS INTERNAL INACTIVE 421,442 199,902 403,575 353,083 (50,492) -12.5%66502 - TRANSPORTATION - EXTERNAL 48,290 19,949 66,750 58,050 (8,700) -13.0%66503 - MILEAGE REIMBURSEMENT 19,839 11,928 21,134 24,415 3,281 15.5%Transportation Total 1,071,205 536,966 1,139,310 1,167,423 28,113 2.5%
A standard 40-hour week is charged for most vehicles, when the vehicle is in use it is charged to Transportation Internal (66501) and the balance to the Inactive (665019) account. Transportation External (66502) involves ferry related fees to go the islands served and vehicles rented from outside vendors. Mileage Reimbursement (66503) is paid to employees who use their own vehicles when conducting District business.

156 Departmental Expense – Water Services
Water Services
Hydrant Flushing
In an effort to improve the water quality in the distribution system, the District performs multi-directional flushing to remove any sediment that deposits on the bottom of these mains. This sediment can cause a reduction in the area’s chlorine residual and increase customer’s water quality inquiries. During the past four years, staff began to de-chlorinate water discharges, especially in areas of impaired streams and areas with Municipal Separate Stormwater Sewer Systems (MS4).
PWD Flushing Program Overview
Corporate Goal to Flush 1/3 of the system each year Mains Less than 16” In Diameter Roughly 850 Miles of Main < 16” – Approximately 283 Miles Per Year Usually start in late March if weather permits. Successfully moved a majority of flushing to daytime during 2017, to reduce
the number of days that employees work night shifts. Some areas do require nighttime flushing due to traffic and customer impact.
Communities flushed in 2019: Cumberland/North Yarmouth, Scarborough,
Portland East and West End, Gorham, Raymond, Steep Falls and Standish
2018 Actual
2019 Projected
2020Goal
% of System Flushed
33% 32% 34%

157 Departmental Expense – Water Services
Water Services – Purpose Statement To operate and maintain water system infrastructure including the treatment, water storage and distribution systems.
Core Services Water Operations is responsible for operating and maintaining the Sebago Lake and Steep Falls Well treatment and water distribution systems by providing the following services:
Operation and maintenance of distribution system including emergency response, contractor inspection (Transmission/Distribution Group – A2; red in the organization chart). Two additional positions added in 2020 – Equipment and Water System Operators.
Operation and maintenance of the pumping, treatment, storage and chemical addition facilities (Treatment Group - A3; orange in organization chart).
Field support services including customer meter and water quality inquiries, back-flow inspection, system flushing, hydrant inspection and contractor inspection (Utility Services Group – A6; blue in the organization chart).
Water Operations has a five-person group (Administration Group- A1; green in organization chart) that directs, oversees and provides administrative support.
Chief Operator Water Treatment / Systems
Distribution System
Supervisor
Utility Asset Coordinator
Scheduler
/ Coordinator
Technical Admin
Assistant (2)
Utility Services
Supervisor
Distribution System
Forepersons(5)
Equipment Operators
(5)
Water System
Operators (11)
Operations Foreperson
Technical
Maintenance
Treatment /
Systems Operators (7)
Water System
Operator
Utility Specialists
(13)
Water System
Operator
Distribution System
Manager
Director of Water Services
Utility Foreperson
Associate Engineer

158 Departmental Expense – Water Services
Key Statistics
Leaks repaired each year vary by number/severity of leaks and is a significant budgetary variable.
Digsafe locates include marking of water and wastewater infrastructure for others who are working near our assets.
0
20
40
60
80
100
120
140
160
180
200
2008 2010 2012 2014 2016 2018
Leaks Repaired
Total Main Breaks All Other
6,000
7,000
8,000
9,000
10,000
11,000
12,000
2009 2011 2013 2015 2017 2018
Digsafe Locates Performed Annually
Locates
Water Supply Surface – 99% Groundwater -1%
Water Treatment Ozone, Ultraviolet, Chloramination, Corrosion Control, Fluoridation
Water Mains 1002 miles Valves 11,971 Hydrants 5,123 Service Lines 55,245 Water Storage 10 (+2 non-active) Booster Stations 6 Backflow Devices 4,805

159 Departmental Expense – Water Services
Performance Benchmarks
2018 2019 2020
Actual Projected Goal
Corporate Goal – Public Health Compliance of Water Regulations 100% 100% 100%
95% of Distribution System Chlorine Residuals 0.50 mg/l 0.50 mg/l > 0.50 mg/l
Corporate Goal – Public Safety
Meeting with Municipal Fire Chiefs 1 2 2
Hydrant Outage Index 2.7 3.0 3.0
Corporate Goal – Reliability
Water Outage Index 13.2 < 20 < 20
Leaks per 100 mile of main 10 < 10 < 10
Transmission valves exercised 332 449 416
Distribution valves exercised 27 45 100
Customer Appointments On-time 99.9% 99.9% 100%
Corporate Goal – Affordability
Water Facility Maintenance Ratio 66% / 34% 75% / 25% 75% / 25%
Department Cost / million gal $1,132 $1,107 $1,202
Treatment Cost / million gal $303 $309 $337
Unaccounted for Water % 13.6% 13.3% 13.0%
Corporate Goal – Employees and Work Environment
Employee Training Hours 100 95 80
Distribution System Chlorine
Residuals (monthly report indicating the average
for the month)

160 Departmental Expense – Water Services
Past Accomplishments
Water Field (A2 and A6) (2) New F-550 crew trucks were purchased in 2019
o Employee suggestions were implemented as part of the purchase. All aluminum bodies will last longer & LED lighting in the cabinets and rear of
the trucks to help visibility at night. Outfitted trucks with higher quality tools.
Highway transmission main crossings work and coordination with Maine Turnpike Authority (MTA)
o Locates ends of casings, GPS each location, and measure distances to determine level of impact the widening will have on PWD mains
o Significant time was spent on this with little notice from MTA.
I-95 Crossing Leak o Underground Testing Services, LLS provided 2 line stops to minimize the shut down and
customer impact. The shutdown would have put many businesses out of water for several days while valves were installed on either side of the highway crossing to isolate the leak. With the line stop, only a single customer was impacted.
This was the first time Water Operations used line stops and it proved to be a cost effective way to isolate the leak and minimize the shutdown impact.
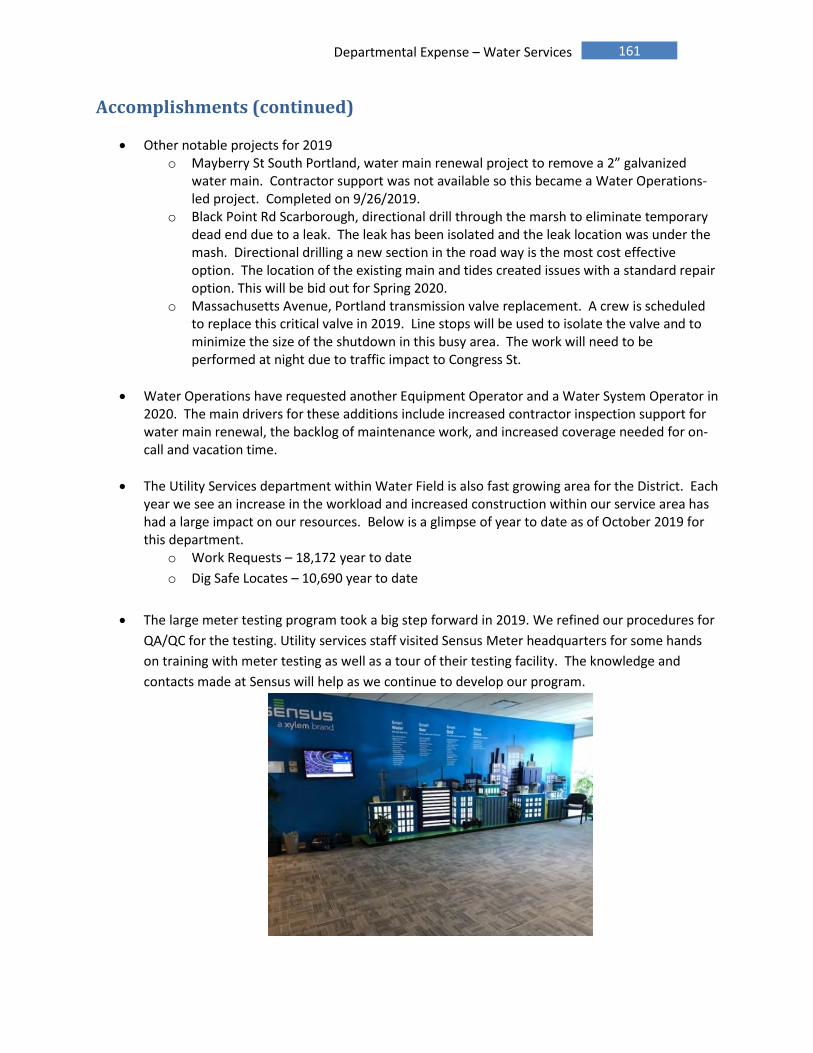
161 Departmental Expense – Water Services
Accomplishments (continued)
Other notable projects for 2019 o Mayberry St South Portland, water main renewal project to remove a 2” galvanized
water main. Contractor support was not available so this became a Water Operations- led project. Completed on 9/26/2019.
o Black Point Rd Scarborough, directional drill through the marsh to eliminate temporary dead end due to a leak. The leak has been isolated and the leak location was under the mash. Directional drilling a new section in the road way is the most cost effective option. The location of the existing main and tides created issues with a standard repair option. This will be bid out for Spring 2020.
o Massachusetts Avenue, Portland transmission valve replacement. A crew is scheduled to replace this critical valve in 2019. Line stops will be used to isolate the valve and to minimize the size of the shutdown in this busy area. The work will need to be performed at night due to traffic impact to Congress St.
Water Operations have requested another Equipment Operator and a Water System Operator in 2020. The main drivers for these additions include increased contractor inspection support for water main renewal, the backlog of maintenance work, and increased coverage needed for on-call and vacation time.
The Utility Services department within Water Field is also fast growing area for the District. Each year we see an increase in the workload and increased construction within our service area has had a large impact on our resources. Below is a glimpse of year to date as of October 2019 for this department.
o Work Requests – 18,172 year to date
o Dig Safe Locates – 10,690 year to date
The large meter testing program took a big step forward in 2019. We refined our procedures for
QA/QC for the testing. Utility services staff visited Sensus Meter headquarters for some hands
on training with meter testing as well as a tour of their testing facility. The knowledge and
contacts made at Sensus will help as we continue to develop our program.

162 Departmental Expense – Water Services
Accomplishments (continued)
Water Plant (A3)
Zero reportable accidents or lost time injuries.
Met all Primary and Secondary Regulations associated with the Surface Water Treatment Rules, including 100% compliance with ozone treatment regulations. SLWTF also achieved >99.99% compliance with UV treatment regulation associated to Long Term 2 Enhanced Surface Water Treatment Regulations, easily surpassing EPA’s 95% compliance requirement. With 1711 Total Coliform rule (TCR) samples collected in 2017, and 1220 so far in 2018, there were zero positive coliform TCR samples collected in 2018 & 2019.
After more than five years of operation, SLWTF Operators completed a change out of all 84 UV lamps in UV Reactor #1. The project also included a hand cleaning of all 84 quartz sleeves that house and protect the UV lamps within the UV Reactor. The UV lamps in Reactor #2 will be swapped out for new lamps by early 2020.
UV Reactor #1 Lamp Power Connections
Successfully limited SLWTF electrical power demand to a minimum (<10kW) during ISO-NE’s peak annual demand hour (July 31st, 2019, @ 23,969 megawatts), which sets Forward Capacity charges beginning June 2020.
Completed the inspection, cleaning, and condition assessment reporting of four water storage facilities: Freeman Hill Reservoir, Gowen Road Tank, Standish Tank & Steep Falls Tank.

163 Departmental Expense – Water Services
2020 Projects and Initiatives
Corporate Goal – Public Health
Corporate Initiative o Continuously improve the water quality in the Distribution System, using guidelines and
action plans developed through the AWWA Partnership for Safe Water (PSW) for Distribution Systems. PWD on track in 2019 to meet PSW guidelines for distribution system chlorine residual (> 0.50 mg/L for 95% of all TCR samples collected in the Distribution System) for the second consecutive year. PWD continues to realize improved water quality at the far ends of the Distribution system because of the dual primary disinfectants (ozone and UV light) being applied at the SLWTF.
Departmental Initiatives o Continue to meet 100% of all Primary and Secondary Surface Water Treatment Rules.
o Continue with the 2019 initiative on programming SCADA control strategy for the use of
hypochlorite for emergency 4-log virus disinfection in the event of an ozone system failure. This 2019 initiative will continue, with work planned to be completed in 2020. An RFP has been developed, and the initial framework is in place. The next step involves PWD hiring an integrator to program the necessary SCADA changes.
Corporate Goal – Public Safety
Departmental Initiative o Regular replacement of magnetic locators for accurate locating of underground assets,
to keep current with changes in technology (employee suggestion).
o A3 Water Treatment: Because of continued compliance with Lead & Copper Rule compliance, the PWD requires 50 samples be collected and tested every 3 years. The next round of Lead & Copper Rule samples are scheduled to be collected in 2020. The last four LCR test results have shown the PWD’s 90th percentile for lead to be consistently 5 parts per billion (ppb) or lower, well below the current 15 PPB Action Level.
Corporate Goal – Reliability
Corporate Initiative o After the initial operator training and test run of
the Emergency Pumper, which took place in September 2019, Operations will schedule on site test runs of the pumper at two distribution sites in 2020 where the unit could potentially be deployed in the future during an actual emergency event.

164 Departmental Expense – Water Services
2020 Projects and Initiatives (continued)
Corporate Goal – Reliability (continued):
Departmental Initiatives o Continue condition assessment of transmission mains to help prioritize investments and
determine potential areas of concern.
o Extend Right-of-Way Maintenance Program into the more developed areas; initiate tracking of current conditions and make plans to repair significant deficiencies. Maintain areas that have already been cleared.
o Continue to replace 1-2 transmission valves each year. Transmission valves are 16 inches in diameter or larger.
o Develop a detailed scope of work for the rebuild of Raw Water Pump #1 & Motor in an effort to secure the most realistic bid prices possible. An independent analysis by Predictive Maintenance Diagnostics has indicted bearing wear and reported this pump should be next in line for maintenance in the near future. The rebuild is planned to be completed in 2020.
o Continue to develop long-term
maintenance plan for Storage Facilities to meet AWWA and Partnership for Safe Water standards to insure cost effective reliability, viability, and water quality.
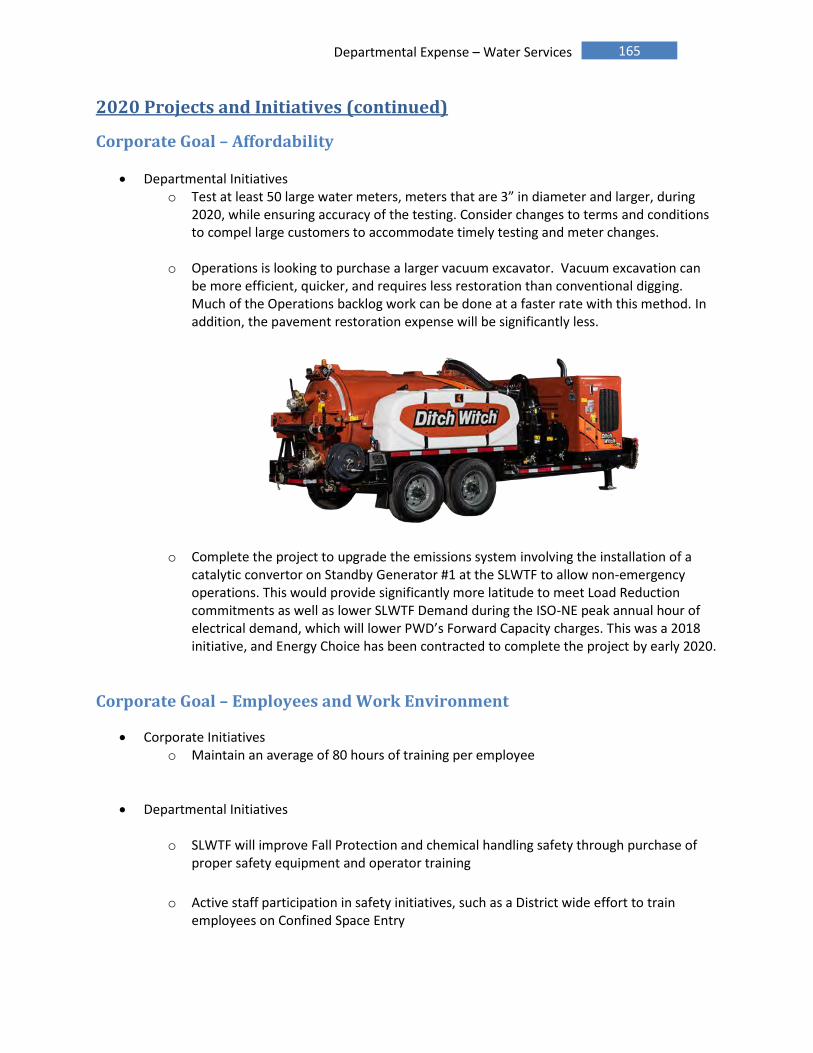
165 Departmental Expense – Water Services
2020 Projects and Initiatives (continued)
Corporate Goal – Affordability
Departmental Initiatives o Test at least 50 large water meters, meters that are 3” in diameter and larger, during
2020, while ensuring accuracy of the testing. Consider changes to terms and conditions to compel large customers to accommodate timely testing and meter changes.
o Operations is looking to purchase a larger vacuum excavator. Vacuum excavation can be more efficient, quicker, and requires less restoration than conventional digging. Much of the Operations backlog work can be done at a faster rate with this method. In addition, the pavement restoration expense will be significantly less.
o Complete the project to upgrade the emissions system involving the installation of a
catalytic convertor on Standby Generator #1 at the SLWTF to allow non-emergency operations. This would provide significantly more latitude to meet Load Reduction commitments as well as lower SLWTF Demand during the ISO-NE peak annual hour of electrical demand, which will lower PWD’s Forward Capacity charges. This was a 2018 initiative, and Energy Choice has been contracted to complete the project by early 2020.
Corporate Goal – Employees and Work Environment
Corporate Initiatives o Maintain an average of 80 hours of training per employee
Departmental Initiatives
o SLWTF will improve Fall Protection and chemical handling safety through purchase of proper safety equipment and operator training
o Active staff participation in safety initiatives, such as a District wide effort to train
employees on Confined Space Entry

166 Departmental Expense – Water Services
Financial Overview
The Water Services Budget for 2020 has increased 4.7% or $411,646. The majority of the increases are for wages & benefits, contracted services, materials and supplies, and chemicals. A1 – The Water Administration area increased 3.1%, of $16,488. The increase is largely in labor, which includes an additional intern to be shared with Wastewater. The intent is to bring in a student that is majoring in Wastewater/Water Operations. A2 – At $224,044, Water Transmission & Distribution is increasing by 5.4%. The increase is largely in labor and benefits ($141,330 salaries/wages and $40,476 in benefits). A2 will be adding 2 union positions (1 equipment operator and 1 water system operator) for 2020 to meet the growing construction demand on resources and to keep up with critical system maintenance. Contracted services represent an increase of $10,500 or 0.8% mainly due to increased traffic control costs. The training budget has also increased by $5,000 for A2 as more new hires require CDL training. A3 – Water Treatment 2020 budget is increasing 5.0%, or $121,847. Some of the increase can be associated to the cost per unit of liquid oxygen (LOX). PWD has limited competitive bid options because of the higher grade of oxygen required to safely and efficiently generate ozone. PWD’s budget for LOX increased by $27,000 in 2020 as a result, a 43.6% increase from 2019. With the increased focus on safely addressing fall protection and chemical handling issues, safety expenses increased by $12,000. Materials Inventory budget will increased by $15,750, or 86%. This is a correction from previous budgets to be more in line with recent year expenses for critical components required to maintain reliable operation our critical instrumentation equipment. Low sulphur diesel fuel, used to heat the SLWTF and operate the standby power generators, has increase by $0.30 gallon, which resulted in an A3 budgetary increase of $11,011. Although the SLWTF takes considerable efforts to control the cost of power, industry increases in $/kW resulted in a 22% increase ($27,978) in the large energy power budget, which is the power consumed at the Sebago Lake Facility.
A6 – The Utility Services 2020 budget is increasing by $49,267 or 3.0%. Wages ($36,007) are increasing and benefits (-$1,656) are decreasing due to contractual obligations. Materials and supplies continue to increase for work related to meters, hydrants, and locating ($5,612.) Asset Purchases ($7,050) is increasing to outfit the spare vans with needed equipment. Training ($5,250) increased due to the Maine Water Utilities Association Trade Show being held in Augusta rather than in Portland.

167 Departmental Expense – Water Services
Water Services: Total
Financial Summary:
.
2018
Actual
2019
Jan-Jun
2019
Budget
2020
Budget
Budget
Diff $
Budget
Diff %
Sub-Group:
A1 - Water Adminis tration $514,662 $259,143 $534,590 $551,078 $16,488 3.1%
A2 - Wtr Transmiss ion/Distrib 3,822,121 1,683,837 4,134,847 4,358,891 224,044 5.4%
A3 - Water Treatment 2,429,960 1,160,086 2,456,365 2,578,212 121,847 5.0%
A6 - Water Uti l i ty Services 1,503,259 718,470 1,669,671 1,718,938 49,267 3.0%
Grand Total 8,270,002 3,821,537 8,795,473 9,207,119 411,646 4.7%
Expense Type:
Salaries & Wages $3,096,542 $1,537,459 $3,262,724 $3,495,009 $232,285 7.1%
Employee Benefi ts 1,459,806 693,143 1,462,802 1,499,604 36,802 2.5%
Chemicals 408,250 218,116 466,126 451,897 -14,229 -3.1%
Contracted Services 1,427,395 461,183 1,648,966 1,679,234 30,268 1.8%
Heat/Fuel Oi l 99,577 57,073 90,088 103,044 12,956 14.4%
Insurance 22,398 11,656 22,772 24,944 2,172 9.5%
Materia ls & Suppl ies 577,769 269,826 609,673 634,717 25,044 4.1%
Other Expense 58,795 16,741 70,208 89,795 19,587 27.9%
Purchased Power 374,898 170,159 342,578 383,631 41,053 12.0%
Tele/Other Uti l ties 91,541 50,534 94,127 83,217 -10,910 -11.6%
Transportation 653,032 335,648 725,409 762,027 36,618 5.0%
Grand Total 8,270,002 3,821,537 8,795,473 9,207,119 411,646 4.7%
Headcount:
Full Time 54 54 54 56 2 3.7%
Part Time 0 0 0 0 0 n/a
Total 54 54 54 56 2 3.7%

168 Departmental Expense – Water Services
.
2018
Actual
2019
Jan-Jun
2019
Budget
2020
Budget
Budget
Diff $
Budget
Diff %
Salaries & Wages
660111 - SALARIES/WAGES NON-UNION $554,908 $275,508 $612,811 $597,709 ($15,102) -2.5%660121 - WAGES/REGULAR UNION 2,034,505 1,040,878 2,125,211 2,312,321 187,110 8.8%660122 - WAGES/OVERTIME UNION 310,731 143,497 311,386 350,768 39,382 12.6%660123 - WAGES/DOUBLETIME UNION 38,075 14,780 38,703 45,288 6,585 17.0%660124 - WAGES/STANDBY TIME UNION 111,070 53,051 104,533 121,723 17,190 16.4%660131 - WAGES - REGULAR - TEMPS 34,130 9,744 66,080 67,200 1,120 1.7%660132 - WAGES - OVERTIME- TEMPS 32 - - - - 660136 - CONTRACTED - TEMP 1,232 - 4,000 - (4,000) -100.0%66014 - VACATION ACCRUAL 3,415 - - - - 66015 - SICKTIME ACCRUAL 8,443 - - - - Salaries & Wages Total 3,096,542 1,537,459 3,262,724 3,495,009 232,285 7.1%
Employee Benefits
660401 - FICA - EMPLOYERS' SHARE 234,896 115,367 249,295 267,364 18,069 7.2%660405 - SAFETY/WHY PROGRAM ITEMS 9,646 3,106 15,000 14,920 (80) -0.5%660411 - MEALS ALLOWANCE 10,190 5,763 8,060 8,960 900 11.2%660418 - STIPENDS 5,300 5,100 6,700 6,300 (400) -6.0%660419 - EMPLOYEE BENEFTS-MISC OTH 22,123 1,300 10,231 16,500 6,269 61.3%660491 - FRINGE BENEFITS-REG/SAL 1,177,650 562,507 1,173,516 1,185,560 12,044 1.0%Employee Benefits Total 1,459,806 693,143 1,462,802 1,499,604 36,802 2.5%
Chemicals
66181 - AMMONIA 23,691 12,149 23,752 21,080 (2,672) -11.2%66182 - CAUSTIC SODA 110,176 40,781 139,675 85,166 (54,509) -39.0%66183 - FLUORIDE 36,095 15,473 40,340 33,164 (7,176) -17.8%66184 - ZINC ORTHOPHOSPHATE 64,272 45,524 74,727 80,318 5,591 7.5%66185 - SODIUM HYPOCHLORITE 105,604 63,873 125,730 143,269 17,539 13.9%661892 - LIQUID OXYGEN (LOX) 68,412 40,316 61,902 88,900 26,998 43.6%Chemicals Total 408,250 218,116 466,126 451,897 (14,229) -3.1%
Contracted Services
6631 - ENGINEERING SERVICES 41,439 - 112,000 112,075 75 0.1%66352 - CONSTRUCTION SERVICES 3,474 - 5,500 3,500 (2,000) -36.4%663521 - TRAFFIC CONTROL 96,804 51,179 59,500 72,000 12,500 21.0%6635221 - PAVING - MINOR REPAIR 467,256 117,742 526,000 526,000 - 0.0%663523 - SIDEWALK 17,229 12,216 18,500 18,500 - 0.0%663524 - STREET OPENING 56,297 23,785 61,100 61,100 - 0.0%663525 - CONTRACTOR CONSTRUCTION 501,926 152,030 588,000 588,000 - 0.0%663527 - EMERGENCY RESPONSE- FEMA 425 425 - - - 66353 - REPAIR SERVICES 5,634 1,402 25,500 30,500 5,000 19.6%66354 - MAINTENANCE SERVICES 152,099 62,261 157,579 172,334 14,755 9.4%663542 - LARGE METER TESTING 7,516 - 6,500 6,500 - 0.0%663546 - MAINTENANCE - SNOW REMOVL 35,964 19,344 36,219 41,090 4,871 13.4%663561 - COMPUTER LICENSES 16,737 11,517 17,163 18,725 1,562 9.1%663574 - DISPOSAL SERVICES 1,716 4,063 4,690 6,990 2,300 49.0%663587 - COURIER SERVICES 2,223 1,141 2,320 2,400 80 3.4%663588 - EQUIPMENT MAINTENANCE 11,228 1,087 10,470 10,520 50 0.5%663594 - DIGSAFE 500 1,000 - - - 6635982 - TREE TRIMMING / REMOVAL - - 7,000 7,000 - 0.0%663599 - MISC OTHER SERVICES 8,927 1,991 10,925 2,000 (8,925) -81.7%Contracted Services Total 1,427,395 461,183 1,648,966 1,679,234 30,268 1.8%

169 Departmental Expense – Water Services
. 2018
Actual
2019
Jan-Jun
2019
Budget
2020
Budget
Budget
Diff $
Budget
Diff %
Heat/Fuel Oil
66161 - HEATING OIL $80,603 $39,247 $68,055 $79,066 $11,011 16.2%
661622 - CONTAINER DELIVERED 18,973 17,826 22,033 23,978 1,945 8.8%
Heat/Fuel Oil Total 99,577 57,073 90,088 103,044 12,956 14.4%
Insurance
66592 - DAMAGES & CLAIMS-GOODWILL 393 - - - -
66599 - PROPERTY & BOILER INSUR 22,004 11,656 22,772 24,944 2,172 9.5%
Insurance Total 22,398 11,656 22,772 24,944 2,172 9.5%
Materials & Supplies
6619 - ASSET PURCHASES 37,941 24,621 47,275 64,325 17,050 36.1%
662012 - CRUSHED GRAVEL 3,592 829 550 1,750 1,200 218.2%
662014 - CRUSHED STONE 461 879 - - -
662015 - LOAM 397 - - - -
662016 - SAND - - 3,820 3,820 - 0.0%
662017 - SAND AND SALT 1,824 1,260 3,452 3,452 - 0.0%
662018 - BANKRUN GRAVEL 1,166 454 - 2,000 2,000 n/a
662019 - GRAVEL - TYPE A (DOT) 620 1,627 - 2,000 2,000 n/a
66202 - TOOLS 22,080 6,258 25,850 25,850 - 0.0%
66203 - VENDOR PURCHASED SUPPLIES 128,856 59,053 119,820 116,368 (3,452) -2.9%
662041 - MATERIALS INVENTORY 147,862 73,440 148,190 164,350 16,160 10.9%
662042 - SUPPLIES INVENTORY 49,816 21,362 37,365 42,350 4,985 13.3%
66204201 - INVENTORY - QPR 204 929 2,500 2,500 - 0.0%
66204202 - INVENTORY - BNKRUN GRAVEL 10,695 6,566 14,000 14,500 500 3.6%
66204203 - INVENTORY - CRUSHD GRAVEL 19,408 2,541 18,750 18,750 - 0.0%
66204204 - INVENTORY - CRUSHED STONE 1,953 1,393 1,700 2,250 550 32.4%
66204205 - INVENTORY - LOAM 2,973 157 2,250 1,250 (1,000) -44.4%
66204206 - INVENTORY - TYPE A GRAVEL 15,829 9,191 - - -
662043 - TOOL INVENTORY 79,521 36,905 62,850 65,050 2,200 3.5%
66204301 - INVENTORY - TONER - 71 - - -
66204302 - INVENTORY - PAPER 90 - - - -
66204303 - INVENTORY-COMPUTER EQUIP 2,668 1,042 1,100 1,113 13 1.2%
662044 - METER INVENTORY (12,667) (2,478) 17,850 17,850 - 0.0%
662045 - TRUCK INVENTORY (84) - - - -
662046 - HYDRANT INVENTORY 42,081 17,040 69,400 59,000 (10,400) -15.0%
662047 - GARAGE INVENTORY 2,729 1,397 3,150 3,150 - 0.0%
66205 - CONSUMABLE SUPPLIES 3,512 2,729 12,200 10,550 (1,650) -13.5%
66206 - COMPUTER RELATED EQUIP 14,242 2,561 17,601 12,489 (5,112) -29.0%
Materials & Supplies Total 577,769 269,826 609,673 634,717 25,044 4.1%

170 Departmental Expense – Water Services
. 2018
Actual
2019
Jan-Jun
2019
Budget
2020
Budget
Budget
Diff $
Budget
Diff %
Other Expense
6641 - BUILDING/REAL PROP RENT $6,160 $0 $6,600 $6,600 $0 0.0%
6642 - EQUIPMENT RENT 31,519 - 13,000 11,950 (1,050) -8.1%
6675111 - INSTATE TRAINING/CONF 27,046 14,519 29,145 35,145 6,000 20.6%
6675112 - OUT OF STATE TRAINING/CON 1,259 5,555 7,000 11,500 4,500 64.3%
667513 - DUES 1,000 - 4,688 2,950 (1,738) -37.1%
667514 - PROFESSIONAL LICENSES 2,561 940 4,720 4,595 (125) -2.6%
667515 - PERIODICAL SUBSCRIPTIONS 123 99 200 200 - 0.0%
667516 - PERMITS 80 - 781 781 - 0.0%
667518 - REGULATORY REQUIRED FEES 416 - - - -
667521 - POSTAGE - THIRD PARTY 2,100 10 4,378 4,378 - 0.0%
667522 - POSTAGE - INTERNAL 292 120 100 100 - 0.0%
667523 - POSTAGE - EXPRESS DELIVER 98 497 200 200 - 0.0%
667531 - PRINTING COSTS 8,005 3,420 8,676 8,676 - 0.0%
667554 - EPA / OSHA COMPLIANCE 160 - 2,000 2,000 - 0.0%
667555 - SAFETY EXPENSES 543 3,992 14,720 26,720 12,000 81.5%
667556 - FREIGHT CHARGES (STOCK) 23 - - - -
667591 - UNIFORMS 268 - - - -
667592 - FOOD SUPPLIES 1,108 302 460 460 - 0.0%
667599 - OTHER MISCELLANEOUS 1,234 519 - - -
6676 - EXPENSE OFFSET (25,200) (13,230) (26,460) (26,460) - 0.0%
Other Expense Total 58,795 16,741 70,208 89,795 19,587 27.9%
Purchased Power
66151 - POWER - LARGE ENERGY 144,391 65,918 121,315 149,293 27,978 23.1%
66152 - POWER - LARGE T&D 90,410 39,029 91,830 92,561 731 0.8%
66153 - POWER - MEDIUM ENERGY 42,824 18,731 39,116 47,561 8,445 21.6%
66154 - POWER - MEDIUM T&D 36,524 18,657 32,978 43,423 10,445 31.7%
66155 - POWER - SMALL ENERGY 15,257 6,884 15,511 12,625 (2,886) -18.6%
66156 - POWER - SMALL T&D 18,138 8,441 18,715 16,064 (2,651) -14.2%
66157 - POWER - OTHER CHARGES 35,804 11,309 36,570 30,234 (6,336) -17.3%
66158 - LOAD RESPONSE (17,445) (5,680) (14,500) (9,000) 5,500 -37.9%
66159 - POWER - CAPACITY 8,996 6,872 1,043 870 (173) -16.6%
Purchased Power Total 374,898 170,159 342,578 383,631 41,053 12.0%
Tele/Other Utilties
66101 - WATER 4,057 1,848 3,500 4,000 500 14.3%
66102 - WASTEWATER 19,479 3,971 20,000 20,000 - 0.0%
66103 - STORMWATER CHARGES 43 1,058 - - -
66111 - TELEPHONE LINES 5,642 2,911 5,580 4,920 (660) -11.8%
66112 - DATA LINES 46,941 30,397 47,820 39,720 (8,100) -16.9%
66113 - CELLULAR PHONES 15,083 10,348 16,980 14,520 (2,460) -14.5%
66114 - PAGERS 296 - 247 57 (190) -76.9%
Tele/Other Utilties Total 91,541 50,534 94,127 83,217 (10,910) -11.6%
Transportation
66501 - TRANSPORTATION - INTERNAL 391,542 206,727 417,671 512,400 94,729 22.7%
665019 - TRANS INTERNAL INACTIVE 236,433 114,959 255,663 206,912 (48,751) -19.1%
66502 - TRANSPORTATION - EXTERNAL 20,828 11,347 47,400 38,100 (9,300) -19.6%
66503 - MILEAGE REIMBURSEMENT 4,229 2,615 4,675 4,615 (60) -1.3%
Transportation Total 653,032 335,648 725,409 762,027 36,618 5.0%
Grand Total 8,270,002 3,821,537 8,795,473 9,207,119 411,646 4.7%

171 Departmental Expense – Water Services
Water Services: Water Administration (A1)
Financial Summary:
. 2018
Actual
2019
Jan-Jun
2019
Budget
2020
Budget
Budget
Diff $
Budget
Diff %
Expense Type:
Salaries & Wages $323,509 $165,802 $345,159 $364,460 $19,301 5.6%
Employee Benefits 179,282 84,476 175,528 174,348 (1,180) -0.7%
Materials & Supplies 3,835 971 1,700 1,713 13 0.8%
Other Expense 5,588 4,682 9,378 8,140 (1,238) -13.2%
Tele/Other Utilties 1,859 2,764 2,100 1,752 (348) -16.6%
Transportation 588 448 725 665 (60) -8.3%
Grand Total 514,662 259,143 534,590 551,078 16,488 3.1%
Programs:
27 - Shore Acre Tank 9,751 7,071 9,547 - (9,547) -100.0%
98 - Training 19,131 13,217 16,653 28,002 11,349 68.1%
99 - Administration 485,780 238,855 508,390 523,076 14,686 2.9%
Grand Total 514,662 259,143 534,590 551,078 16,488 3.1%
Funds:
10 - General 123,608 60,344 99,587 - (99,587) -100.0%
20 - Water General 391,054 198,799 435,003 551,078 116,075 26.7%
Grand Total 514,662 259,143 534,590 551,078 16,488 3.1%
Headcount:
Full-Time 5 5 5 5 0 0.0%
Part-Time 0 0 0 0 0 n/aTotal 5 5 5 5 0 0.0%
Total 5 5 5 5 0 0.0%
Sebago Lake
Water Treatment
Facility

172 Departmental Expense – Water Services
Water Services: Water Transmission/Distribution (A2)
Financial Summary: . 2018
Actual
2019
Jan-Jun
2019
Budget
2020
Budget
Budget
Diff $
Budget
Diff %
Expense Type:
Salaries & Wages $1,220,240 615,320 1,236,456 1,377,786 141,330 11.4%
Employee Benefits 548,996 267,221 539,679 580,155 40,476 7.5%
Contracted Services 1,181,008 368,181 1,389,550 1,400,050 10,500 0.8%
Insurance 393 - - - -
Materials & Supplies 350,976 162,281 363,635 369,097 5,462 1.5%
Other Expense 27,385 8,492 40,700 45,450 4,750 11.7%
Tele/Other Utilties 13,186 10,636 12,853 8,220 (4,633) -36.0%
Transportation 479,936 251,706 551,974 578,133 26,159 4.7%
Grand Total 3,822,121 1,683,837 4,134,847 4,358,891 224,044 5.4%
Programs:
1 - Seasonal Mains 123,313 68,641 132,316 130,270 (2,046) -1.5%
10 - General Distribution 341,704 113,615 260,380 267,305 6,925 2.7%
11 - Mains & Valves Maint 1,291,222 615,904 1,563,299 1,653,000 89,701 5.7%
12 - Services Maintenance 642,395 298,206 591,299 725,197 133,898 22.6%
13 - Emergency Maintenance 138 - - - -
14 - Distribution Flushing 2,453 - - - -
15 - Digsafe Locates 1,904 1,375 563 575 12 2.1%
17 - Hydrant Mainenance 250,239 74,840 269,385 259,986 (9,399) -3.5%
18 - Water Treatment Maint 111 - - - -
2 - Meter Reading 2,275 1,192 9,328 8,799 (529) -5.7%
20 - Meter Service 1,529 451 - - -
34 - Distribution Maintenance 564 558 - - -
4 - Paving (Mains) 167,824 33,285 308,316 306,556 (1,760) -0.6%
44 - WW Pumping 7,189 4,188 1,195 7,398 6,203 519.1%
45 - WW Treatment 160 2,490 3,339 2,621 (718) -21.5%
90 - Vehicles 52,629 19,721 33,160 46,038 12,878 38.8%
91 - Snow Removal 37,723 27,899 28,289 36,357 8,068 28.5%
92 - Bulk Materials Adjustment 7,784 (2,687) 2,500 2,500 - 0.0%
98 - Training 84,908 68,136 110,621 122,321 11,700 10.6%
99 - Administration 806,025 356,025 820,857 789,968 (30,889) -3.8%
Grand Total 3,822,121 1,683,837 4,134,847 4,358,891 224,044 5.4%
Funds:
10 - General 671,830 328,971 612,928 82,395 (530,533) -86.6%
20 - Water General 3,141,430 1,347,516 3,515,345 4,264,523 749,178 21.3%
30 - Water Standish 1,511 671 2,040 1,954 (86) -4.2%
51 - WW Cape Elizabeth - - 457 - (457) -100.0%
53 - WW Cumberland 7,189 3,866 - - -
57 - WW Portland 160 2,812 3,515 9,445 5,930 168.7%
62 - WW Westbrook - - 281 287 6 2.1%
64 - WW Joint Westbrook - - 281 287 6 2.1%
Grand Total 3,822,121 1,683,837 4,134,847 4,358,891 224,044 5.4%
Headcount:
Full-Time 22 22 22 24 2 8.3%
Part-Time 0 0 0 0 0 n/aTotal 22 22 22 24 2 8.3%

173 Departmental Expense – Water Services
Water Services: Water Treatment (A3)
Financial Summary:
. 2018
Actual
2019
Jan-Jun
2019
Budget
2020
Budget
Budget
Diff $
Budget
Diff %
Expense Type:
Salaries & Wages $716,149 $348,432 $732,469 $768,116 $35,647 4.9%
Employee Benefits 333,961 157,490 332,413 331,575 (838) -0.3%
Chemicals 408,250 218,116 466,126 451,897 (14,229) -3.1%
Contracted Services 222,341 89,450 242,446 262,164 19,718 8.1%
Heat/Fuel Oil 99,577 57,073 90,088 103,044 12,956 14.4%
Insurance 22,004 11,656 22,772 24,944 2,172 9.5%
Materials & Supplies 154,558 73,237 136,225 150,182 13,957 10.2%
Other Expense 3,261 (4,542) (3,424) 7,526 10,950 -319.8%
Purchased Power 374,898 170,159 342,578 383,631 41,053 12.0%
Tele/Other Utilties 61,560 23,512 62,014 61,785 (229) -0.4%
Transportation 33,400 15,504 32,658 33,348 690 2.1%
Grand Total 2,429,960 1,160,086 2,456,365 2,578,212 121,847 5.0%
Programs:
1 - Seasonal Mains - - 2,652 2,709 57 2.1%
11 - Mains & Valves Maint 989 1,467 2,607 2,765 158 6.1%
12 - Services Maintenance 39 514 758 861 103 13.6%
17 - Hydrant Mainenance - - 133 135 2 1.5%
18 - Water Treatment Maint 135,584 71,690 98,078 105,985 7,907 8.1%
2 - Meter Reading 817 - 133 135 2 1.5%
24 - Distribution Operations 362,630 149,145 291,470 325,498 34,028 11.7%
25 - Water Storage Maintenace 11,054 12,807 31,687 32,779 1,092 3.4%
28 - Monitoring 16 - - - -
34 - Distribution Maintenance 73,505 19,362 37,132 77,998 40,866 110.1%
45 - WW Treatment 641 - - - -
6 - Water Treatment 1,582,495 792,013 1,730,905 1,767,510 36,605 2.1%
94 - Technology Teams - - 1,774 362 (1,412) -79.6%
98 - Training 30,187 28,922 51,819 46,606 (5,213) -10.1%
99 - Administration 232,002 84,166 207,217 214,869 7,652 3.7%
Grand Total 2,429,960 1,160,086 2,456,365 2,578,212 121,847 5.0%
Funds:
10 - General 211,959 90,466 217,081 - (217,081) -100.0%
20 - Water General 2,165,003 1,044,503 2,190,029 2,511,701 321,672 14.7%
30 - Water Standish 52,357 25,118 49,255 66,511 17,256 35.0%
57 - WW Portland 641 - - - -
Grand Total 2,429,960 1,160,086 2,456,365 2,578,212 121,847 5.0%
Headcount:
Full-Time 11 11 11 11 0 0.0%
Part-Time 0 0 0 0 0 n/aTotal 11 11 11 11 0 0.0%

174 Departmental Expense – Water Services
Water Services: Water Utility Services (A6) . 2018
Actual
2019
Jan-Jun
2019
Budget
2020
Budget
Budget
Diff $
Budget
Diff %
Expense Type:
Salaries & Wages $836,644 $407,905 $948,640 $984,647 $36,007 3.8%
Employee Benefits 397,566 183,955 415,182 413,526 (1,656) -0.4%
Contracted Services 24,046 3,552 16,970 17,020 50 0.3%
Materials & Supplies 68,399 33,337 108,113 113,725 5,612 5.2%
Other Expense 22,560 8,110 23,554 28,679 5,125 21.8%
Tele/Other Utilties 14,937 13,622 17,160 11,460 (5,700) -33.2%
Transportation 139,107 67,991 140,052 149,881 9,829 7.0%
Grand Total 1,503,259 718,470 1,669,671 1,718,938 49,267 3.0%
Programs:
1 - Seasonal Mains 51,651 25,689 58,716 60,144 1,428 2.4%
10 - General Distribution 60,082 21,308 63,871 65,421 1,550 2.4%
11 - Mains & Valves Maint 10,383 4,368 10,167 11,284 1,117 11.0%
12 - Services Maintenance 2,084 1,482 3,432 3,801 369 10.8%
14 - Distribution Flushing 65,468 29,287 88,971 92,156 3,185 3.6%
15 - Digsafe Locates 231,648 100,655 234,507 242,990 8,483 3.6%
16 - Cross Connection 28,259 10,347 24,520 26,008 1,488 6.1%
17 - Hydrant Mainenance 81,357 55,465 144,804 146,922 2,118 1.5%
19 - Winter Hydrant Pump 56,466 1,460 52,608 58,901 6,293 12.0%
2 - Meter Reading 82,478 42,538 104,208 109,239 5,031 4.8%
20 - Meter Service 97,395 57,309 114,839 120,008 5,169 4.5%
21 - Large Meter Testing 8,931 992 37,393 36,334 (1,059) -2.8%
22 - Meter Replacement Program - - 608 63 (545) -89.6%
26 - Submeters 1,087 328 1,260 1,300 40 3.2%
3 - Leak Surveys 377 42 6,607 6,233 (374) -5.7%
31 - Vehicle Cleaning 1,211 1,295 3,490 3,638 148 4.2%
7 - General Investigation 181,774 82,795 236,479 247,195 10,716 4.5%
76 - Collection 14,863 7,729 20,682 20,937 255 1.2%
90 - Vehicles 4,036 631 1,896 2,113 217 11.4%
94 - Technology Teams 2,826 712 - - -
98 - Training 79,607 65,489 82,661 87,174 4,513 5.5%
99 - Administration 441,278 208,549 377,952 377,077 (875) -0.2%
Grand Total 1,503,259 718,470 1,669,671 1,718,938 49,267 3.0%
Funds:
10 - General 524,344 269,364 500,497 183,093 (317,404) -63.4%
20 - Water General 965,108 447,170 1,162,659 1,528,946 366,287 31.5%
30 - Water Standish 2,638 905 5,255 5,599 344 6.5%
51 - WW Cape Elizabeth 436 634 197 203 6 3.0%
53 - WW Cumberland 5,927 53 197 203 6 3.0%
57 - WW Portland 189 207 236 244 8 3.4%
59 - WW South Portland 441 17 236 244 8 3.4%
61 - WW Gorham 3,662 19 197 203 6 3.0%
62 - WW Westbrook 11 11 197 203 6 3.0%
64 - WW Joint Westbrook 247 - - - -
65 - WW Joint LF 257 91 - - -
Grand Total 1,503,259 718,470 1,669,671 1,718,938 49,267 3.0%
Headcount:
Full-Time 16 16 16 16 0 0.0%
Part-Time 0 0 0 0 0 n/aTotal 16 16 16 16 0 0.0%

175 Departmental Expense – Water Services
Water Services A key determinant of Water Services budget is the number of water main breaks. Main breaks occur for a number of reasons, including age, pressure surges, and cold weather. The long-term trend indicates a declining number of leaks partially due to the capital investments made in prior years by targeting the replacement of aging pipes. The Water Research Foundation (WRF) states that the average number of main breaks in North America is 25 breaks per 100 miles of main per year. The Partnership for Safe Water (PSW), a group supported by US EPA and the American Water Works Association, among others, recommends a goal of less than 15 main breaks per 100 miles of main per year. The Portland Water District (PWD) strives to meet a service level goal of 10 main breaks per 100 miles of main per year. The operating budget assumes the typical number of main breaks in a year. As the chart indicates, some years are significantly higher than average resulting in significantly higher expenses.
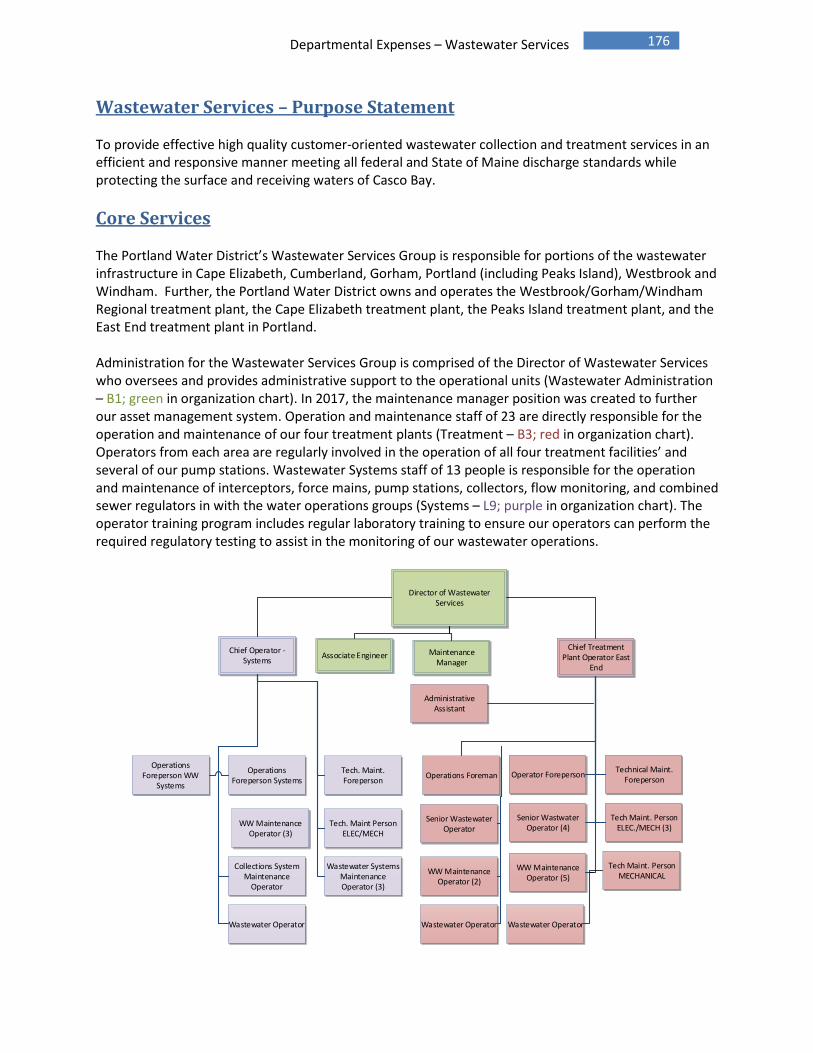
176 Departmental Expenses – Wastewater Services
Wastewater Services – Purpose Statement To provide effective high quality customer-oriented wastewater collection and treatment services in an efficient and responsive manner meeting all federal and State of Maine discharge standards while protecting the surface and receiving waters of Casco Bay.
Core Services The Portland Water District’s Wastewater Services Group is responsible for portions of the wastewater infrastructure in Cape Elizabeth, Cumberland, Gorham, Portland (including Peaks Island), Westbrook and Windham. Further, the Portland Water District owns and operates the Westbrook/Gorham/Windham Regional treatment plant, the Cape Elizabeth treatment plant, the Peaks Island treatment plant, and the East End treatment plant in Portland. Administration for the Wastewater Services Group is comprised of the Director of Wastewater Services who oversees and provides administrative support to the operational units (Wastewater Administration – B1; green in organization chart). In 2017, the maintenance manager position was created to further our asset management system. Operation and maintenance staff of 23 are directly responsible for the operation and maintenance of our four treatment plants (Treatment – B3; red in organization chart). Operators from each area are regularly involved in the operation of all four treatment facilities’ and several of our pump stations. Wastewater Systems staff of 13 people is responsible for the operation and maintenance of interceptors, force mains, pump stations, collectors, flow monitoring, and combined sewer regulators in with the water operations groups (Systems – L9; purple in organization chart). The operator training program includes regular laboratory training to ensure our operators can perform the required regulatory testing to assist in the monitoring of our wastewater operations.
Director of Wastewater Services
Maintenance Manager
WW Maintenance Operator (2)
Senior Wastewater Operator
Operations Foreman
Chief Operator - Systems
Wastewater Systems Maintenance Operator (3)
WW Maintenance Operator (3)
Operations Foreperson Systems
Tech. Maint Person ELEC/MECH
Wastewater Operator
Tech. Maint. Foreperson
Operations Foreperson WW
Systems
Collections System Maintenance
Operator
Wastewater Operator
Administrative Assistant
Chief Treatment Plant Operator East
End
WW Maintenance Operator (5)
Technical Maint. Foreperson
Tech Maint. Person ELEC./MECH (3)
Senior Wastwater Operator (4)
Operator Foreperson
Wastewater Operator
Associate Engineer
Tech Maint. Person MECHANICAL

177 Departmental Expenses – Wastewater Services
Key Statistics
Wastewater Services Group Facts The Wastewater Services Group operates four wastewater treatment plants and provides sewer
services to six communities. The East End treatment plant is the largest municipal treatment facility in Maine.
Our Combined Sewer Overflow (CSO) program includes a web-based system that allows for near real-time monitoring and alarming of over 90% of the total overflow sites for PWD and several member municipalities. The majority of these meters were replaced in 2017. The system regularly demonstrates a 95% uptime rate.
The East End Treatment plant maximizes flow to the treatment facility during wet weather events as a critical component of the City of Portland’s CSO management efforts, treating about half of the total wet weather flow generated in the collection system. This effort reduces the overall CSO discharge in Portland by nearly 50%.
The Wastewater Operator apprentice program has in place for the past eight years. This effort has helped address workforce management issues due to employee retirements. These positions work in each of our treatment plants and the wastewater systems and pumping group. This effort has been essential and very beneficial, as nearly the entire operations team has been replaced through retirements and changes in job assignments.
Nutrient optimization efforts continue at the East End WWTF. Efforts in 2019 have been similar, with initial results being close to the 72 percent seasonal mass loading reduction achieved in 2018.
Efforts to manage odors from treatment plants and pump stations continue to reduce odors and the associated complaints. To date, there were 16 odor complaints related to the East End Facility in Portland (and zero at pump stations, Westbrook, and Peaks Island).
Wastewater Treatment Facilities – 2018 Cape Elizabeth WWTF Average Daily Flow – 0.27 million gallons Portland – East End WWTF Average Daily Flow – 17.7 million gallons
Peaks Island (Portland) WWTF Average Daily Flow – 0.10 million gallons Westbrook/Gorham/Windham Regional WWTF
Average Daily Flow – 3.31 million gallons
0
2000
4000
6000
8000
10000
2004 2007 2010 2013 2016
All Plants: Millions Gallons Treated
0
0.0002
0.0004
0.0006
0.0008
0.001
0.0012
0.0014
2004
2007
2010
2013
2016
All Plants: Cost per Gallon Treated

178 Departmental Expenses – Wastewater Services
Wastewater Systems Responsibility
Performance Benchmarks
2018 Actual 2019 Projected 2020 Goal Wastewater Systems Corporate Goal - Environment Wet wells cleaned 180 150 >125 Feet of pipe cleaned 18,409 18,000 >20,000 Feet of pipe televised* 50,579 30,000 >30,000 Dry weather overflows 10 5 0 Corporate Goal -Reliability Corrective Maintenance tasks 152 110 <200 Corporate Goal -Affordability Preventive Maintenance tasks 1,602 1,500 1,500 Treatment Operations Corporate Goal - Environment Total license excursions 26 15 0 Corporate Goal -Reliability Biosolids removed (wet tons) 26,773 27,000 <25,500 % BOD removed 94 94 >85 % suspended solids removed 95 94 >85
*Note: PWD has completed a 10-year effort to inspect/CCTV the collection and interception system. These levels will decrease as the results of this program are evaluated.
Cape Elizabeth – Interceptors, force mains, and 27 pump stations
Cumberland – Collectors, interceptors, force mains and 13 pump stations
Gorham – Collectors, interceptors, force mains and 17 pump stations
Portland – Interceptors, force mains, 21 combined sewer regulators, CSO monitoring, and 10 pump stations
Peaks Island (Portland) – Collectors, interceptors, force mains, storm drain system and 4 pump stations
Westbrook – Interceptors, force mains, 5 combined sewer regulators, CSO monitoring and 3 pump stations
Windham – Collectors, force mains and 2 pump stations
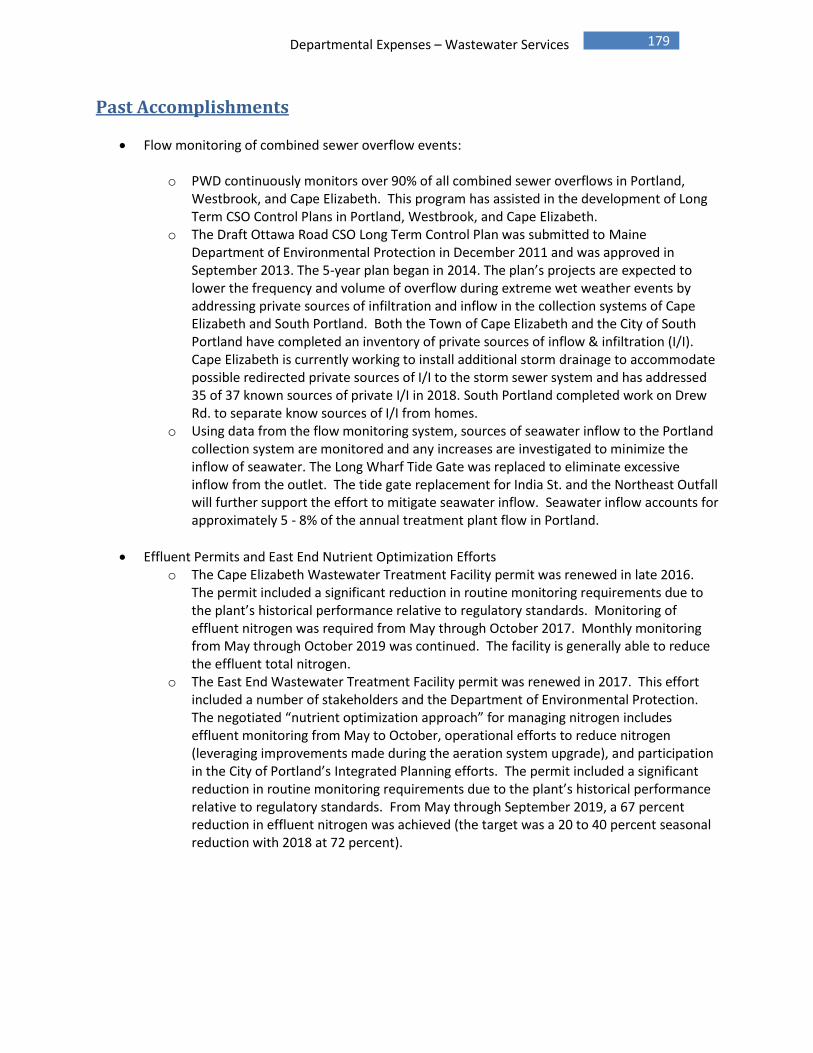
179 Departmental Expenses – Wastewater Services
Past Accomplishments
Flow monitoring of combined sewer overflow events:
o PWD continuously monitors over 90% of all combined sewer overflows in Portland, Westbrook, and Cape Elizabeth. This program has assisted in the development of Long Term CSO Control Plans in Portland, Westbrook, and Cape Elizabeth.
o The Draft Ottawa Road CSO Long Term Control Plan was submitted to Maine Department of Environmental Protection in December 2011 and was approved in September 2013. The 5-year plan began in 2014. The plan’s projects are expected to lower the frequency and volume of overflow during extreme wet weather events by addressing private sources of infiltration and inflow in the collection systems of Cape Elizabeth and South Portland. Both the Town of Cape Elizabeth and the City of South Portland have completed an inventory of private sources of inflow & infiltration (I/I). Cape Elizabeth is currently working to install additional storm drainage to accommodate possible redirected private sources of I/I to the storm sewer system and has addressed 35 of 37 known sources of private I/I in 2018. South Portland completed work on Drew Rd. to separate know sources of I/I from homes.
o Using data from the flow monitoring system, sources of seawater inflow to the Portland collection system are monitored and any increases are investigated to minimize the inflow of seawater. The Long Wharf Tide Gate was replaced to eliminate excessive inflow from the outlet. The tide gate replacement for India St. and the Northeast Outfall will further support the effort to mitigate seawater inflow. Seawater inflow accounts for approximately 5 - 8% of the annual treatment plant flow in Portland.
Effluent Permits and East End Nutrient Optimization Efforts o The Cape Elizabeth Wastewater Treatment Facility permit was renewed in late 2016.
The permit included a significant reduction in routine monitoring requirements due to the plant’s historical performance relative to regulatory standards. Monitoring of effluent nitrogen was required from May through October 2017. Monthly monitoring from May through October 2019 was continued. The facility is generally able to reduce the effluent total nitrogen.
o The East End Wastewater Treatment Facility permit was renewed in 2017. This effort included a number of stakeholders and the Department of Environmental Protection. The negotiated “nutrient optimization approach” for managing nitrogen includes effluent monitoring from May to October, operational efforts to reduce nitrogen (leveraging improvements made during the aeration system upgrade), and participation in the City of Portland’s Integrated Planning efforts. The permit included a significant reduction in routine monitoring requirements due to the plant’s historical performance relative to regulatory standards. From May through September 2019, a 67 percent reduction in effluent nitrogen was achieved (the target was a 20 to 40 percent seasonal reduction with 2018 at 72 percent).

180 Departmental Expenses – Wastewater Services
Past Accomplishments (continued)
o The Westbrook/Gorham Regional Wastewater Treatment Facility permit was renewed in 2017. The permit included a significant reduction in routine monitoring requirements due to the plant’s historical performance relative to regulatory standards along with monthly requirements to monitor effluent phosphorus during the summer months.
o The Peaks Island Wastewater Treatment Facility permit was renewed in 2017. The permit included a significant reduction in routine monitoring requirements due to the plant’s historical performance relative to regulatory standards. Monitoring of effluent nitrogen was required from May through October. The facility is generally able to reduce the effluent total nitrogen.
Westbrook/Gorham/Windham Regional Treatment Facility upgrades o The dewatering system was replaced in 2018 with a new screw press. In 2019, the
equipment has operated as intended with a significant reduction in sludge disposed. o We expect that phosphorus (and possibly nitrogen) limits may be considered in future
permit renewals, including the upcoming 2022 renewal. The design of the aeration system will consider this in design flexibility.
Improvements to Pump Station reliability o PWD monitors all systems through a SCADA computer system. Treatment plants can be
remotely operated from the East End Treatment Facility, the Westbrook/Gorham Regional Treatment Facility, or the Douglass St. Office during emergencies using the SCADA system.
o To improve the reliability of systems during power interruption, PWD requires generators at new pump stations and has installed an average of 3 generators per year at its existing pump stations. The majority of pump stations that require emergency generators have been upgraded or have had generators installed during construction as part of our new infrastructure standards. Bypass connections are also installed to allow the stations to be serviced by a portable pumping unit if needed.
o Staff completed an assessment of all pump stations in 2014. A summary report has been prepared for each community that PWD serves. These findings continue to guide the development and implementation of our long-range capital improvement program. The assessment is updated following station upgrades.
o In 2016, treatment plant staff assumed daily operational responsibility for the Northeast Pump Station (located at the foot of the East End treatment plant). Treatment operators already assist with the daily operation of the Spurwink Pump Station in Cape Elizabeth and with the routine management of screenings at Westbrook pump stations.
o The Fore River Pump Station pumps were replaced in 2017 with the second phase of the upgrade is underway.
o The Dana Court Pump Station upgrade was completed in 2019. Final work to finish the upgrade continues.
o The Northeast Pump Station was upgraded with an odor control system to manage odors from the facility. Coupled with the aeration upgrade at the East End Plant, and staff housekeeping efforts, odors from the facility have decreased significantly.
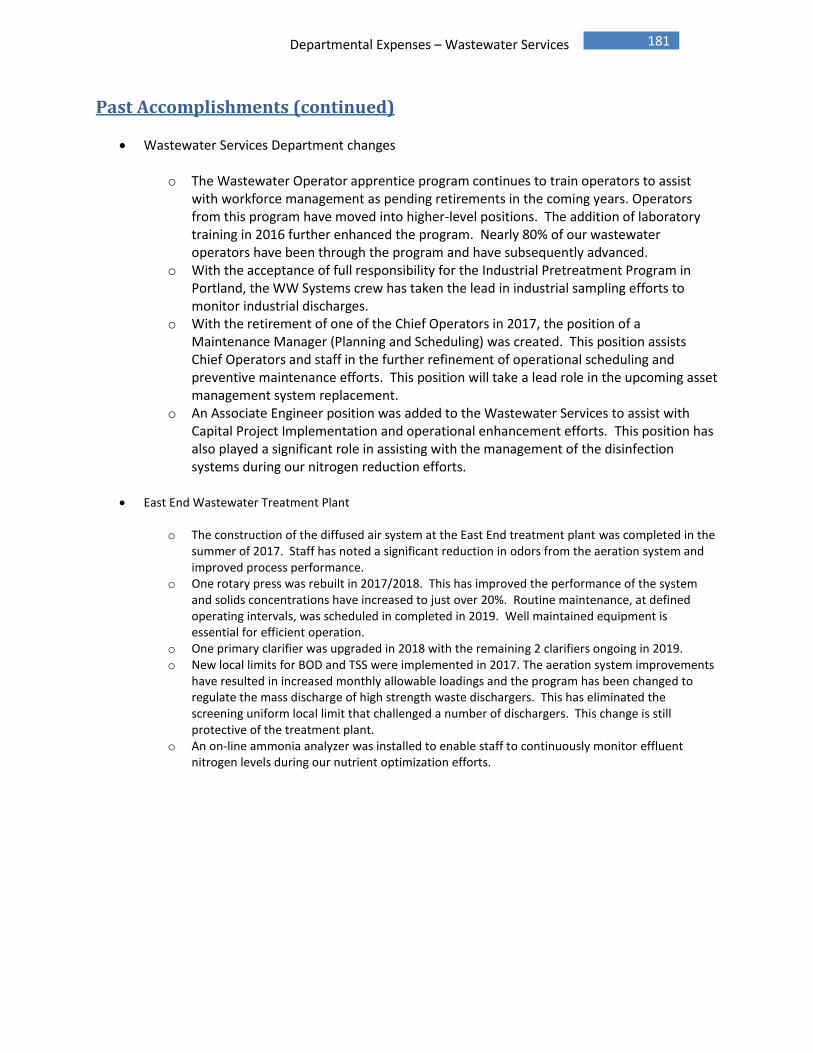
181 Departmental Expenses – Wastewater Services
Past Accomplishments (continued)
Wastewater Services Department changes
o The Wastewater Operator apprentice program continues to train operators to assist with workforce management as pending retirements in the coming years. Operators from this program have moved into higher-level positions. The addition of laboratory training in 2016 further enhanced the program. Nearly 80% of our wastewater operators have been through the program and have subsequently advanced.
o With the acceptance of full responsibility for the Industrial Pretreatment Program in Portland, the WW Systems crew has taken the lead in industrial sampling efforts to monitor industrial discharges.
o With the retirement of one of the Chief Operators in 2017, the position of a Maintenance Manager (Planning and Scheduling) was created. This position assists Chief Operators and staff in the further refinement of operational scheduling and preventive maintenance efforts. This position will take a lead role in the upcoming asset management system replacement.
o An Associate Engineer position was added to the Wastewater Services to assist with Capital Project Implementation and operational enhancement efforts. This position has also played a significant role in assisting with the management of the disinfection systems during our nitrogen reduction efforts.
East End Wastewater Treatment Plant
o The construction of the diffused air system at the East End treatment plant was completed in the summer of 2017. Staff has noted a significant reduction in odors from the aeration system and improved process performance.
o One rotary press was rebuilt in 2017/2018. This has improved the performance of the system and solids concentrations have increased to just over 20%. Routine maintenance, at defined operating intervals, was scheduled in completed in 2019. Well maintained equipment is essential for efficient operation.
o One primary clarifier was upgraded in 2018 with the remaining 2 clarifiers ongoing in 2019. o New local limits for BOD and TSS were implemented in 2017. The aeration system improvements
have resulted in increased monthly allowable loadings and the program has been changed to regulate the mass discharge of high strength waste dischargers. This has eliminated the screening uniform local limit that challenged a number of dischargers. This change is still protective of the treatment plant.
o An on-line ammonia analyzer was installed to enable staff to continuously monitor effluent nitrogen levels during our nutrient optimization efforts.

182 Departmental Expenses – Wastewater Services
2020 Projects and Initiatives
B1 – Administration We continue to monitor changing regulations related to phosphorus, nitrogen, and high flow
management. With the renewal of permits at the treatment plants, we will monitor efforts that could affect the next permit in 2022.
The City of Portland has embarked on a two-year Integrated Planning effort to prioritize water quality commitments. This effort will assess combined sewer, stormwater, and wastewater treatment obligations and prioritize the use of resources to address the various efforts with a goal of improving receiving water quality. Staff is engaged in this effort.
Staff will continue to work closely with our municipal partners in the planning and execution of Long Term Control Plans and other efforts to further manage and mitigate peak wet weather flows. The City of Westbrook has been very active in the implementation of a number of projects that are expected to reduce wet weather flows.
With the completion of the Island Avenue sewer extension project and eventual connect of those customers adjacent to the new sewer, the capacity in the treatment plant on Peaks Island has essentially been reached. In 2018, an analysis of the current capacity, along with suggested upgrades or opportunities for capacity improvements was completed. The Peaks Island Plant has reached the full capacity with I/I reductions likely providing the greatest opportunity for further capacity.
A “nutrient optimization” report that describes the efforts and challenges of the plant’s efforts to attempt to manage the effluent nitrogen loading was completed in 2018. This is a requirement of the 2017 permit. While there have been some disinfection system struggles due to the impact of ammonia removal, the plant has achieved an average of 72 percent reduction in historical nitrogen loading from May to September in 2018 and to date in 2019 has realized a 67 percent reduction in effluent nitrogen loading.
Staff participated in the Casco Bay Estuary Partnership’s Nutrient Council. The final report identifies challenges, suggested efforts, and recommendations to address nutrient levels in Casco Bay.
B3, L9 – Operations Treatment Plant Operators continue to focus on effluent compliance including making process
control adjustments to the operation of the treatment plant as needed, most recently in efforts to manage effluent nitrogen from the Cape Elizabeth, Peaks Island, and East End WWTFs.
The operations team continues to focus on implementing safe work practices throughout the workplace. Focus areas include confined space, lock-out tag-out programs, electrical safety, and the regular use of personal protective equipment by staff. The new Maintenance Manager (Planning and Scheduling) will help to move this effort forward.
Staff continues to work to manage odors from our treatment facilities. The number of odor complaints has been reduced significantly.
In 2016, wastewater systems acquired a new Vactor 2100 series truck that replaced the 13-year-old vactor truck. The addition of this truck will further enable operations crews to maintain wet wells, clean lines, and remove debris from catch basins. A new remote control feature and longer reach with its “snorkel” have already proven useful, allowing operators to access difficult sites in a safe manner more readily. After a brief adjustment period, staff is now very comfortable with the new truck. This unit has been used to regularly maintain and clean our systems.
Systems staff has taken a lead role in the sampling efforts required by the Industrial Pretreatment Program in Portland and Westbrook/Gorham.

183 Departmental Expenses – Wastewater Services
2020 Projects and Initiatives (continued)
Corporate Goal – Reliability
B1 – Administration Assist with the implementation of SCADA Standards through regular coordination with AMaP
and Operations staff. B3, L9 – Operations
The Maintenance Manager (Planning and Scheduling) is helping to further refine the preventive maintenance program as the new Maintenance Management Computer system is implemented.
Continue developing preventive maintenance practices that lead to or exceed a 75%/25% mix of preventive to corrective work order history. It is anticipated that the new asset management system will further enhance these efforts.
Monitor pump system’s ability to minimize pump station downtime. The installation of generators at key pump stations along with bypass pumping connections helps to minimize service interruptions.
As part of the Maintenance Manager (Planning and Scheduling)’s responsibilities, our preventive maintenance program continues to be enhanced. This will include a review of the workload and assignment of work. Part of this review includes the review of current staff utilization and the need for additional staffing or resources. This will include a review of resources that might include remote access capability to obtain information on equipment and processes.
Continue the condition assessment program of combining line cleaning and CCTV inspection of 10% of each community’s buried infrastructure. We completed assessment of our entire buried sewer infrastructure by the end of 2018. The results are being evaluated and staff will develop a monitoring plan over the next two years.
The Peaks Island Facility Controls were upgraded in 2013 to further enhance the operation of the plant and to allow for improved remote operation of the facility. In the spring of 2015, a new ultraviolet (UV) treatment system was installed at the Peak’s Island facility. This has improved the disinfection system significantly.
In 2016, an evaluation of the electrical distribution systems at each treatment plant was completed. This resulted in a prioritized plan to address these aging and critical systems. The first projects from this assessment are currently under design. A recent agreement with Central Maine Power to site a substation at the plant has revised the scope of the project. Enhancement of the in-plant electrical distribution will be completed.
A comprehensive evaluation of the HVAC systems at each treatment plant began in 2016. This evaluation identified aging systems in need of refurbishment and replacement. The project included a review of energy management in the recommendation of future projects. The first projects from this assessment are currently preparing for bidding and construction.

184 Departmental Expenses – Wastewater Services
2020 Projects and Initiatives (continued)
Corporate Goal – Affordability
B1 – Administration The EEWWTF continues to participate in electricity Demand Response through ISO New England
and receives roughly $7,000 for its participation.
Work with operations staff to manage overtime and off-shift coverage.
B3, L9 – Operations Manage departmental budgets with area supervisors that lead to cost savings measures, i.e.
improved dewatered solids at the Westbrook/Gorham and East End WWTFs, station visits, chemical use, etc. Major budget items, including chemicals, power, biosolids, and others are monitored using the WIMS data management system to monitor and control operations and budgets.
Continue to implement process control measures in the operation of wastewater treatment facilities. Operations Plans have been developed for each facility and an on-line computer based Operations Manuals continue to be updated to serve as guidance for the Operations Team.
Continue to support the use of the District’s asset management systems to efficiently manage equipment and systems. Operations staff and maintenance staff are working with the AMaP Department to complete our asset inventory and to develop preventive maintenance tasks for each facility. Engineering interns completed the plant water system in the summer of 2019.
Corporate Goal – Environment
B1 – Administration Continue to monitor existing performance and developing regulations.
B3, L9 – Operations Treatment and Systems teams work to ensure facilities operate in accordance with permit
requirements.
Through process control enhancements at the Peaks Island and Cape Elizabeth WWTF’s, these plants are managing effluent nitrogen levels. With the upgraded aeration system and the requirement for a “nutrient optimization approach” at the East End, efforts to manage and monitor effluent nitrogen began 2018. The configuration of these plants has made this possible with minor control upgrades and the process control enhancements. This will not be possible at the Westbrook/Gorham/Windham Regional WWTF without significant capital investment.
Beginning in 2016, our goal is zero exceedances each year from all treatment plants. This goal continues to direct our operational and compliance efforts into the future.
The developing concern over a class of chemicals referred to as PFAS will present challenges to the management of biosolids generated through wastewater treatment statewide. Staff is engaged locally, regionally, and nationally in ongoing efforts to manage biosolids given the awareness of PFAS.

185 Departmental Expenses – Wastewater Services
2020 Projects and Initiatives (continued)
Corporate Goal – Employees and Work Environment
B1 – Administration Promote the District’s professional development program of a minimum 80 hours of training
each year.
In 2016, the Wastewater Study Group was created. This monthly session involves operators in hands-on learning designed to prepare operators for certification exams and their daily activities in our treatment plants and systems. This group continues to meet and the class content is currently being refined.
Operators are encouraged to obtain required licenses and to continue with advanced licenses for wastewater treatment and collections.
B3, L9 – Operations Provide support to employees through annual performance reviews and regular support.
Following injuries during the opening of manhole covers, and at the suggestion of employees, additional manhole cover opening magnets will be purchased. Once provided, staff will be expected to use the equipment to more safely lift and secure these heavy covers.
Develop and maintain a safe working environment in each area of responsibility. Develop wastewater operators through the apprentice program; operators rotate through systems, treatment plants, the wastewater laboratory, and the Water Services Department.
To ensure safety of our employees near chemical storage facilities and other identified areas, an investment in forced air personal respirator systems was made in 2019. This will enhance our ability to implement an aggressive painting and maintenance program in our facilities.

186 Departmental Expenses – Wastewater Services
Financial Overview The Wastewater Services Group continues to operate with a goal of delivering effective services at reasonable costs to its member communities. Overall, the 2020 budget total includes an increase of $581,493 to $10,149,276. This is a 6.1% increase from the 2019 budget. Salaries/Wages: Overall budgeted staffing have remained consistent. Maintenance support for all treatment plants continues to come from the central treatment maintenance group at the East End treatment plant with these efforts coordinated through our Maintenance Manager. Overall, this category has increased by $91,063 or 3.8%. Biosolids Disposal: The total budget for the hauling and management of biosolids generated from the treatment of wastewater has increased by $47,204 in 2020 or 2.8%. The budgeted % Total Solids from the East End WWTF has been lowered slightly to 21.5%, with current performance approaching this budget goal. The Westbrook/Gorham/Windham Regional WWTF dewatering project has increased performance of the system, which has contributed to lower costs. Overall, biosolids management costs are projected to increase to $1,722,166. An increase of approximately $50,000 is related to an increased fee from our vendor related to statewide management of biosolids impacted by PFAS concerns. Chemicals: Generally, chemicals are used at each of our facilities to treat and disinfect the treated wastewater before being discharged to the environment, to aid in dewatering biosolids, and for odor control. Overall, the total budget for chemicals has increased by $98,452 or 14.8% from the 2019 budget. Operators and our plant control systems closely monitor chemical use at all facilities. Contracted Services: Contracted services include the costs of the Falmouth and South Portland treatment plants to treat flows conveyed by PWD from Cumberland and Northern Cape Elizabeth. Contracted Services also includes a maintenance agreement related to the CSO monitoring services. The budget amount decreased by $119,220 or 9.9% from the 2019 budget. Heat/Fuel Oil: The East End treatment plant converted from fuel oil to natural gas in 2012. Natural gas use is continually monitored and recorded by the SCADA control system. For 2019, the budget has increased 24.1% or $39,554. The total budget is $1,326,458. Purchased Power: The power budget has been increased by $127,232 or 9.5% in the 2020 budget. Transportation: The transportation budget has decreased by $5,389 from the 2019 budget. This 2.1% decrease results in a budget amount of $245,315.
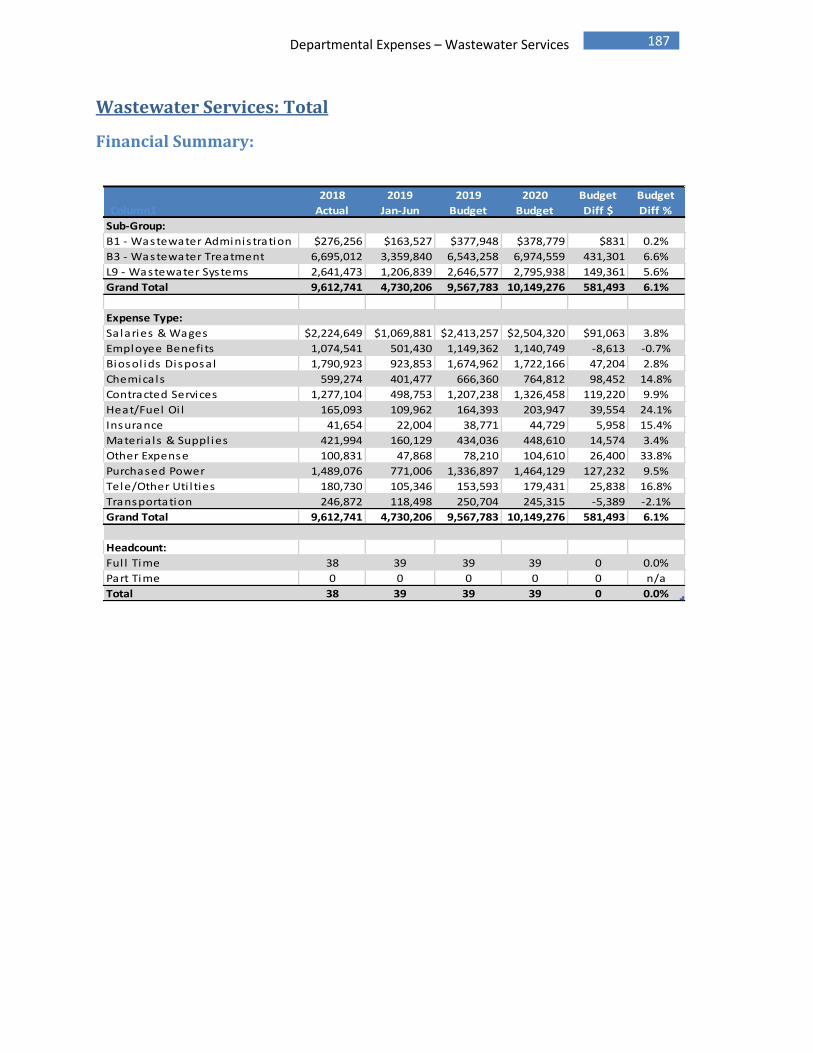
187 Departmental Expenses – Wastewater Services
Wastewater Services: Total
Financial Summary:
Column1
2018
Actual
2019
Jan-Jun
2019
Budget
2020
Budget
Budget
Diff $
Budget
Diff %
Sub-Group:
B1 - Wastewater Adminis tration $276,256 $163,527 $377,948 $378,779 $831 0.2%
B3 - Wastewater Treatment 6,695,012 3,359,840 6,543,258 6,974,559 431,301 6.6%
L9 - Wastewater Systems 2,641,473 1,206,839 2,646,577 2,795,938 149,361 5.6%
Grand Total 9,612,741 4,730,206 9,567,783 10,149,276 581,493 6.1%
Expense Type:
Salaries & Wages $2,224,649 $1,069,881 $2,413,257 $2,504,320 $91,063 3.8%
Employee Benefi ts 1,074,541 501,430 1,149,362 1,140,749 -8,613 -0.7%
Biosol ids Disposal 1,790,923 923,853 1,674,962 1,722,166 47,204 2.8%
Chemicals 599,274 401,477 666,360 764,812 98,452 14.8%
Contracted Services 1,277,104 498,753 1,207,238 1,326,458 119,220 9.9%
Heat/Fuel Oi l 165,093 109,962 164,393 203,947 39,554 24.1%
Insurance 41,654 22,004 38,771 44,729 5,958 15.4%
Materia ls & Suppl ies 421,994 160,129 434,036 448,610 14,574 3.4%
Other Expense 100,831 47,868 78,210 104,610 26,400 33.8%
Purchased Power 1,489,076 771,006 1,336,897 1,464,129 127,232 9.5%
Tele/Other Uti l ties 180,730 105,346 153,593 179,431 25,838 16.8%
Transportation 246,872 118,498 250,704 245,315 -5,389 -2.1%
Grand Total 9,612,741 4,730,206 9,567,783 10,149,276 581,493 6.1%
Headcount:
Ful l Time 38 39 39 39 0 0.0%
Part Time 0 0 0 0 0 n/a
Total 38 39 39 39 0 0.0%

188 Departmental Expenses – Wastewater Services
. 2018
Actual
2019
Jan-Jun
2019
Budget
2020
Budget
Budget
Diff $
Budget
Diff %
660111 - SALARIES/WAGES NON-UNION $330,302 $181,492 $399,599 $405,830 $6,231 1.6%
660121 - WAGES/REGULAR UNION 1,694,882 802,010 1,814,726 1,884,342 69,616 3.8%
660122 - WAGES/OVERTIME UNION 130,125 60,558 140,469 144,441 3,972 2.8%
660123 - WAGES/DOUBLETIME UNION 13,733 5,290 18,019 19,217 1,198 6.6%
660124 - WAGES/STANDBY TIME UNION 36,723 17,506 32,044 40,410 8,366 26.1%
660131 - WAGES - REGULAR - TEMPS 2,128 3,024 8,400 10,080 1,680 20.0%
66014 - VACATION ACCRUAL 9,962 - - - -
66015 - SICKTIME ACCRUAL 6,793 - - - -
Salaries & Wages Total 2,224,649 1,069,881 2,413,257 2,504,320 91,063 3.8%
Employee Benefits
660401 - FICA - EMPLOYERS' SHARE 169,633 81,422 184,621 191,583 6,962 3.8%
660405 - SAFETY/WHY PROGRAM ITEMS 6,611 1,558 6,200 7,800 1,600 25.8%
660411 - MEALS ALLOWANCE 100 90 450 450 - 0.0%
660413 - PWD TRAINING PROGRAM 58 - - - -
6604151 - FIELD UNIFORMS - - 90 90 - 0.0%
660418 - STIPENDS 4,000 2,800 4,600 4,600 - 0.0%
660419 - EMPLOYEE BENEFTS-MISC OTH 7,334 200 4,343 3,200 (1,143) -26.3%
660491 - FRINGE BENEFITS-REG/SAL 886,805 415,359 949,058 933,026 (16,032) -1.7%
Employee Benefits Total 1,074,541 501,430 1,149,362 1,140,749 (8,613) -0.7%
Biosolids Disposal
663571 - BIOSOLIDS DISPOSAL 1,790,923 923,853 1,674,962 1,722,166 47,204 2.8%
Biosolids Disposal Total 1,790,923 923,853 1,674,962 1,722,166 47,204 2.8%
Chemicals
661811 - SODIUM BICARBONATE 15,386 8,530 14,620 13,800 (820) -5.6%
661812 - SODIUM BISULFITE 116,799 82,694 172,100 217,846 45,746 26.6%
6618121 - SODIUM BISULFITE-ACCRUAL 4,189 (4,934) - - -
66182 - CAUSTIC SODA 278 4,729 5,270 7,250 1,980 37.6%
661821 - CAUSTIC SODA - ACCRUAL - (502) - - -
66185 - SODIUM HYPOCHLORITE 225,648 121,990 277,100 255,013 (22,087) -8.0%
661851 - SODIUM HYPO - ACCURAL 14,160 (14,726) - - -
66189 - POLYMER 222,814 198,721 195,270 256,765 61,495 31.5%
661899 - OTHER CHEMICALS - 4,976 2,000 14,138 12,138 606.9%
Chemicals Total 599,274 401,477 666,360 764,812 98,452 14.8%
Contracted Services
6631 - ENGINEERING SERVICES 26,698 18,483 82,500 100,000 17,500 21.2%
663521 - TRAFFIC CONTROL 693 1,340 550 800 250 45.5%
6635221 - PAVING - MINOR REPAIR 484 - - - -
663525 - CONTRACTOR CONSTRUCTION 71,086 21,989 25,500 45,500 20,000 78.4%
66353 - REPAIR SERVICES 9,229 3,231 13,000 13,000 - 0.0%
66354 - MAINTENANCE SERVICES 271,983 147,822 232,196 291,796 59,600 25.7%
663543 - CSO FLOW MONITORING 102,880 - 156,375 156,375 - 0.0%
663544 - MAINT SERVICES - CCTV 76,300 - 65,350 61,250 (4,100) -6.3%
663546 - MAINTENANCE - SNOW REMOVL 49,885 25,244 52,300 55,700 3,400 6.5%
663547 - WASTE SLUDGE TRANSPORT 39,859 12,950 32,000 33,800 1,800 5.6%
663551 - LAB ANALYSIS 804 1,510 1,600 1,600 - 0.0%
663561 - COMPUTER LICENSES 34,882 27,642 35,324 38,397 3,073 8.7%
663562 - COMPUTER MAINTENANCE - 356 - - -
663572 - GRIT & SCREENS DISPOSAL 41,327 17,235 74,450 74,450 - 0.0%
663573 - GREASE DISPOSAL 25,549 9,824 30,200 30,700 500 1.7%
663574 - DISPOSAL SERVICES 10,070 5,650 6,170 7,800 1,630 26.4%
663585 - TREATMENT CONTRACT SERVIC 510,730 198,967 395,483 410,470 14,987 3.8%
6635851 - WW DEWATERING SERVICES 3,998 1,674 5,100 5,020 (80) -1.6%
6635852 - WW DEWATERING SRVS CREDIT (3,998) (1,674) (5,500) (5,000) 500 -9.1%
663587 - COURIER SERVICES 4,447 2,283 4,640 4,800 160 3.4%
663599 - MISC OTHER SERVICES 199 3,981 - - -
6640 - RENTAL-PROPERTY/EQUIPMENT - 248 - - -
Contracted Services Total 1,277,104 498,753 1,207,238 1,326,458 119,220 9.9%

189 Departmental Expenses – Wastewater Services
. 2018
Actual
2019
Jan-Jun
2019
Budget
2020
Budget
Budget
Diff $
Budget
Diff %
Heat/Fuel Oil
66161 - HEATING OIL $29,378 $21,854 $27,884 $27,635 ($249) -0.9%
661621 - PIPELINE DELIVERED PROPAN 85,581 49,065 106,196 109,022 2,826 2.7%
661622 - CONTAINER DELIVERED 49,617 38,911 29,763 66,740 36,977 124.2%
66166 - UNLEADED GAS 516 132 550 550 - 0.0%
Heat/Fuel Oil Total 165,093 109,962 164,393 203,947 39,554 24.1%
Insurance
66599 - PROPERTY & BOILER INSUR 41,654 22,004 38,771 44,729 5,958 15.4%
Insurance Total 41,654 22,004 38,771 44,729 5,958 15.4%
Materials & Supplies
6619 - ASSET PURCHASES 94,881 46,952 102,000 153,000 51,000 50.0%
66202 - TOOLS 13,352 6,288 7,000 7,300 300 4.3%
66203 - VENDOR PURCHASED SUPPLIES 184,797 36,786 217,288 184,150 (33,138) -15.3%
662041 - MATERIALS INVENTORY 65,933 36,435 46,925 47,925 1,000 2.1%
662042 - SUPPLIES INVENTORY 33,423 19,496 28,635 29,035 400 1.4%
66204201 - INVENTORY - QPR - 145 - - -
66204206 - INVENTORY - TYPE A GRAVEL 87 196 - - -
662043 - TOOL INVENTORY 21,681 10,525 13,575 15,075 1,500 11.0%
66204301 - INVENTORY - TONER 90 74 - - -
66204303 - INVENTORY-COMPUTER EQUIP 1,362 666 6,088 5,300 (788) -12.9%
662047 - GARAGE INVENTORY 1,684 821 2,175 2,175 - 0.0%
66205 - CONSUMABLE SUPPLIES 2,457 39 650 650 - 0.0%
66206 - COMPUTER RELATED EQUIP 2,247 1,706 9,700 4,000 (5,700) -58.8%
Materials & Supplies Total 421,994 160,129 434,036 448,610 14,574 3.4%
Other Expense
6642 - EQUIPMENT RENT 24,489 27,757 500 1,250 750 150.0%
66609 - OTHER ADVERTISING 225 - 350 350 - 0.0%
6675111 - INSTATE TRAINING/CONF 12,326 13,477 18,750 23,800 5,050 26.9%
6675112 - OUT OF STATE TRAINING/CON 2,518 3,974 8,750 10,950 2,200 25.1%
667513 - DUES 12,535 3,230 12,800 12,800 - 0.0%
667514 - PROFESSIONAL LICENSES 3,341 1,100 2,480 2,480 - 0.0%
667515 - PERIODICAL SUBSCRIPTIONS 520 274 250 250 - 0.0%
667516 - PERMITS 27,409 5,677 26,500 26,500 - 0.0%
667517 - PLANT OPER LICENSE FEES - - - 75 75 n/a
667518 - REGULATORY REQUIRED FEES 10,049 - 14,000 14,000 - 0.0%
667519 - REGULATORY FINES 16,500 - - - - 0.0%
667521 - POSTAGE - THIRD PARTY 43 281 75 75 - 0.0%
667522 - POSTAGE - INTERNAL 28 16 100 100 - 0.0%
667523 - POSTAGE - EXPRESS DELIVER 412 407 500 500 - 0.0%
667531 - PRINTING COSTS 105 770 - - -
667533 - FORMS STOCK - - 400 400 - 0.0%
667552 - SAFETY TRAINING 1,891 382 1,500 1,500 - 0.0%
667555 - SAFETY EXPENSES 7,273 16,500 12,825 33,650 20,825 162.4%
667581 - ANNUAL LAND CONTRIB CAPE 2,500 2,500 2,500 - (2,500) -100.0%
667592 - FOOD SUPPLIES 1,683 256 500 500 - 0.0%
667599 - OTHER MISCELLANEOUS 383 52 - - -
6676 - EXPENSE OFFSET (23,400) (12,285) (24,570) (24,570) - 0.0%
Other Expense Total 100,831 47,868 78,210 104,610 26,400 33.8%
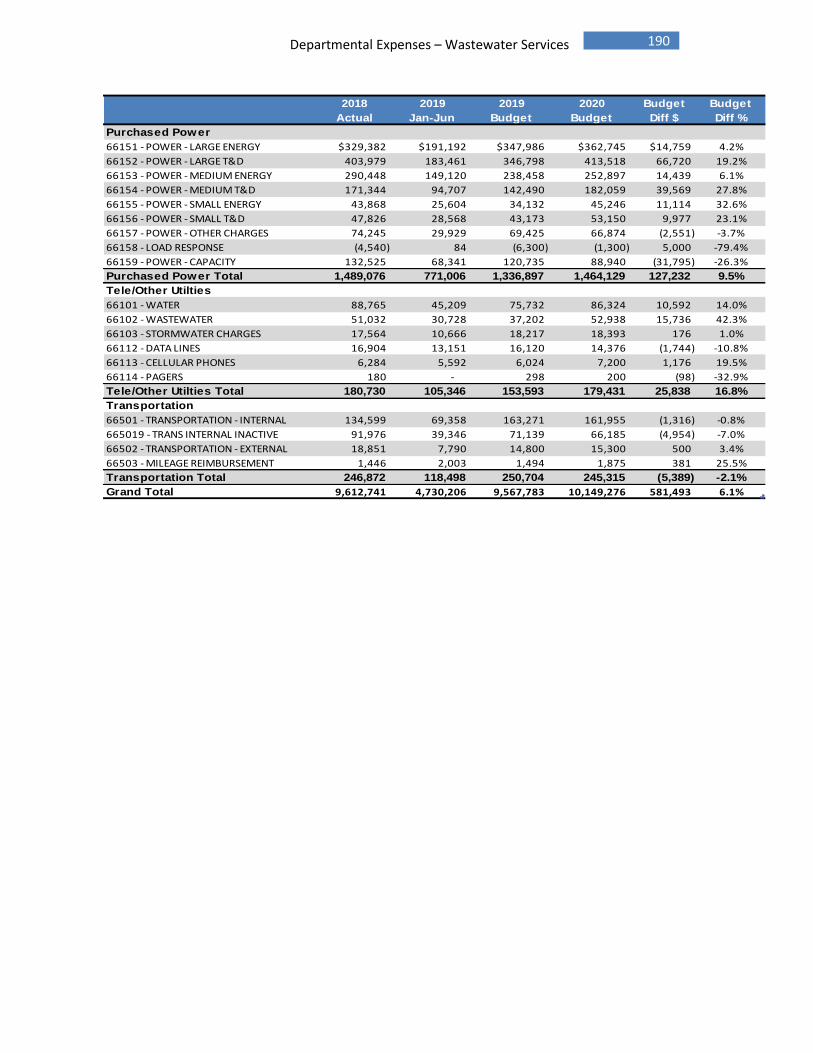
190 Departmental Expenses – Wastewater Services
. 2018
Actual
2019
Jan-Jun
2019
Budget
2020
Budget
Budget
Diff $
Budget
Diff %
Purchased Power
66151 - POWER - LARGE ENERGY $329,382 $191,192 $347,986 $362,745 $14,759 4.2%
66152 - POWER - LARGE T&D 403,979 183,461 346,798 413,518 66,720 19.2%
66153 - POWER - MEDIUM ENERGY 290,448 149,120 238,458 252,897 14,439 6.1%
66154 - POWER - MEDIUM T&D 171,344 94,707 142,490 182,059 39,569 27.8%
66155 - POWER - SMALL ENERGY 43,868 25,604 34,132 45,246 11,114 32.6%
66156 - POWER - SMALL T&D 47,826 28,568 43,173 53,150 9,977 23.1%
66157 - POWER - OTHER CHARGES 74,245 29,929 69,425 66,874 (2,551) -3.7%
66158 - LOAD RESPONSE (4,540) 84 (6,300) (1,300) 5,000 -79.4%
66159 - POWER - CAPACITY 132,525 68,341 120,735 88,940 (31,795) -26.3%
Purchased Power Total 1,489,076 771,006 1,336,897 1,464,129 127,232 9.5%
Tele/Other Utilties
66101 - WATER 88,765 45,209 75,732 86,324 10,592 14.0%
66102 - WASTEWATER 51,032 30,728 37,202 52,938 15,736 42.3%
66103 - STORMWATER CHARGES 17,564 10,666 18,217 18,393 176 1.0%
66112 - DATA LINES 16,904 13,151 16,120 14,376 (1,744) -10.8%
66113 - CELLULAR PHONES 6,284 5,592 6,024 7,200 1,176 19.5%
66114 - PAGERS 180 - 298 200 (98) -32.9%
Tele/Other Utilties Total 180,730 105,346 153,593 179,431 25,838 16.8%
Transportation
66501 - TRANSPORTATION - INTERNAL 134,599 69,358 163,271 161,955 (1,316) -0.8%
665019 - TRANS INTERNAL INACTIVE 91,976 39,346 71,139 66,185 (4,954) -7.0%
66502 - TRANSPORTATION - EXTERNAL 18,851 7,790 14,800 15,300 500 3.4%
66503 - MILEAGE REIMBURSEMENT 1,446 2,003 1,494 1,875 381 25.5%
Transportation Total 246,872 118,498 250,704 245,315 (5,389) -2.1%
Grand Total 9,612,741 4,730,206 9,567,783 10,149,276 581,493 6.1%

191 Departmental Expenses – Wastewater Services
Wastewater Services: Wastewater Administration (B1)
Financial Summary:
. 2018
Actual
2019
Jan-Jun
2019
Budget
2020
Budget
Budget
Diff $
Budget
Diff %
Expense Type:
Salaries & Wages $167,746 $101,532 $238,939 $240,385 $1,446 0.6%
Employee Benefits 90,099 51,780 121,960 117,423 (4,537) -3.7%
Contracted Services - 22 500 500 - 0.0%
Materials & Supplies 527 416 150 150 - 0.0%
Other Expense 14,909 7,458 15,030 18,355 3,325 22.1%
Tele/Other Utilties 1,745 989 1,200 1,416 216 18.0%
Transportation 1,231 1,331 169 550 381 225.4%
Grand Total 276,256 163,527 377,948 378,779 831 0.2%
Programs:
41 - Pretreatment - 209 - - -
98 - Training 10,656 17,143 14,333 20,218 5,885 41.1%
99 - Administration 265,600 146,176 363,615 358,561 (5,054) -1.4%
Grand Total 276,256 163,527 377,948 378,779 831 0.2%
Funds:
10 - General 57 197 - - -
50 - Wastewater General 276,199 163,122 377,948 378,779 831 0.2%
62 - WW Westbrook - 209 - - -
Grand Total 276,256 163,527 377,948 378,779 831 0.2%
Headcount:
Full-Time 2 3 3 3 0 0.0%
Part-Time 0 0 0 0 0 n/aTotal 2 3 3 3 0 0.0%
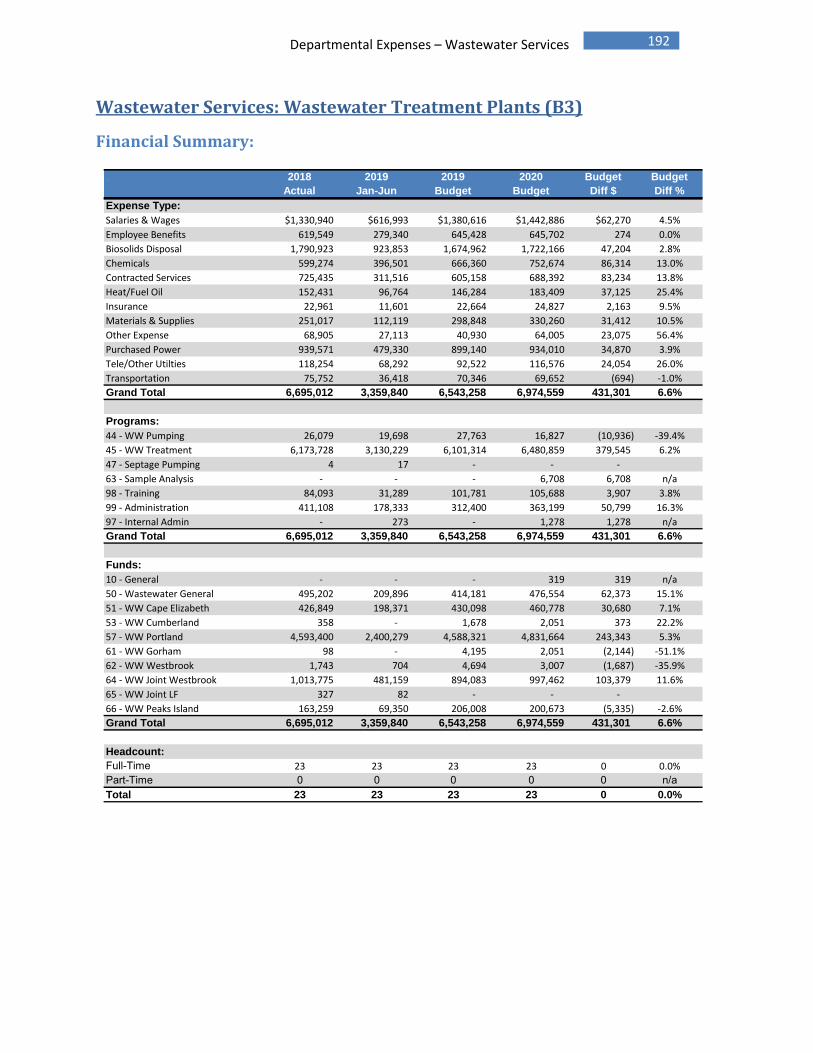
192 Departmental Expenses – Wastewater Services
Wastewater Services: Wastewater Treatment Plants (B3)
Financial Summary:
. 2018
Actual
2019
Jan-Jun
2019
Budget
2020
Budget
Budget
Diff $
Budget
Diff %
Expense Type:
Salaries & Wages $1,330,940 $616,993 $1,380,616 $1,442,886 $62,270 4.5%
Employee Benefits 619,549 279,340 645,428 645,702 274 0.0%
Biosolids Disposal 1,790,923 923,853 1,674,962 1,722,166 47,204 2.8%
Chemicals 599,274 396,501 666,360 752,674 86,314 13.0%
Contracted Services 725,435 311,516 605,158 688,392 83,234 13.8%
Heat/Fuel Oil 152,431 96,764 146,284 183,409 37,125 25.4%
Insurance 22,961 11,601 22,664 24,827 2,163 9.5%
Materials & Supplies 251,017 112,119 298,848 330,260 31,412 10.5%
Other Expense 68,905 27,113 40,930 64,005 23,075 56.4%
Purchased Power 939,571 479,330 899,140 934,010 34,870 3.9%
Tele/Other Utilties 118,254 68,292 92,522 116,576 24,054 26.0%
Transportation 75,752 36,418 70,346 69,652 (694) -1.0%
Grand Total 6,695,012 3,359,840 6,543,258 6,974,559 431,301 6.6%
Programs:
44 - WW Pumping 26,079 19,698 27,763 16,827 (10,936) -39.4%
45 - WW Treatment 6,173,728 3,130,229 6,101,314 6,480,859 379,545 6.2%
47 - Septage Pumping 4 17 - - -
63 - Sample Analysis - - - 6,708 6,708 n/a
98 - Training 84,093 31,289 101,781 105,688 3,907 3.8%
99 - Administration 411,108 178,333 312,400 363,199 50,799 16.3%
97 - Internal Admin - 273 - 1,278 1,278 n/a
Grand Total 6,695,012 3,359,840 6,543,258 6,974,559 431,301 6.6%
Funds:
10 - General - - - 319 319 n/a
50 - Wastewater General 495,202 209,896 414,181 476,554 62,373 15.1%
51 - WW Cape Elizabeth 426,849 198,371 430,098 460,778 30,680 7.1%
53 - WW Cumberland 358 - 1,678 2,051 373 22.2%
57 - WW Portland 4,593,400 2,400,279 4,588,321 4,831,664 243,343 5.3%
61 - WW Gorham 98 - 4,195 2,051 (2,144) -51.1%
62 - WW Westbrook 1,743 704 4,694 3,007 (1,687) -35.9%
64 - WW Joint Westbrook 1,013,775 481,159 894,083 997,462 103,379 11.6%
65 - WW Joint LF 327 82 - - -
66 - WW Peaks Island 163,259 69,350 206,008 200,673 (5,335) -2.6%
Grand Total 6,695,012 3,359,840 6,543,258 6,974,559 431,301 6.6%
Headcount:
Full-Time 23 23 23 23 0 0.0%
Part-Time 0 0 0 0 0 n/aTotal 23 23 23 23 0 0.0%
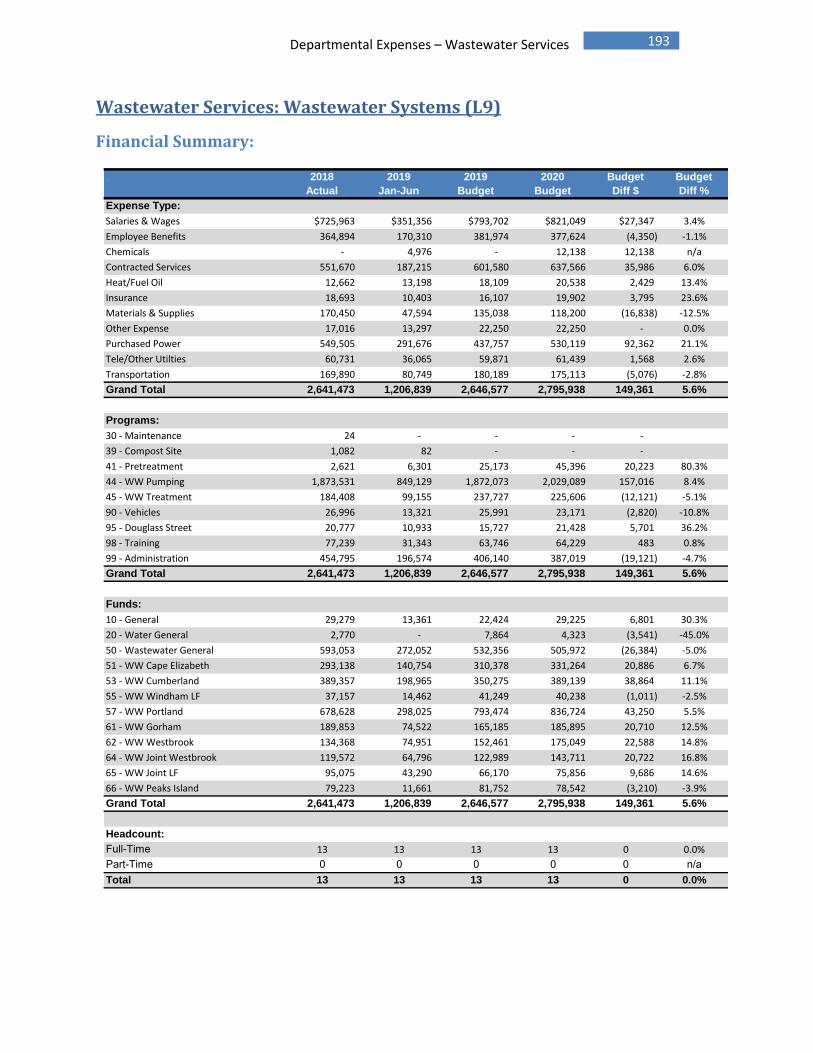
193 Departmental Expenses – Wastewater Services
Wastewater Services: Wastewater Systems (L9)
Financial Summary:
. 2018
Actual
2019
Jan-Jun
2019
Budget
2020
Budget
Budget
Diff $
Budget
Diff %
Expense Type:
Salaries & Wages $725,963 $351,356 $793,702 $821,049 $27,347 3.4%
Employee Benefits 364,894 170,310 381,974 377,624 (4,350) -1.1%
Chemicals - 4,976 - 12,138 12,138 n/a
Contracted Services 551,670 187,215 601,580 637,566 35,986 6.0%
Heat/Fuel Oil 12,662 13,198 18,109 20,538 2,429 13.4%
Insurance 18,693 10,403 16,107 19,902 3,795 23.6%
Materials & Supplies 170,450 47,594 135,038 118,200 (16,838) -12.5%
Other Expense 17,016 13,297 22,250 22,250 - 0.0%
Purchased Power 549,505 291,676 437,757 530,119 92,362 21.1%
Tele/Other Utilties 60,731 36,065 59,871 61,439 1,568 2.6%
Transportation 169,890 80,749 180,189 175,113 (5,076) -2.8%
Grand Total 2,641,473 1,206,839 2,646,577 2,795,938 149,361 5.6%
Programs:
30 - Maintenance 24 - - - -
39 - Compost Site 1,082 82 - - -
41 - Pretreatment 2,621 6,301 25,173 45,396 20,223 80.3%
44 - WW Pumping 1,873,531 849,129 1,872,073 2,029,089 157,016 8.4%
45 - WW Treatment 184,408 99,155 237,727 225,606 (12,121) -5.1%
90 - Vehicles 26,996 13,321 25,991 23,171 (2,820) -10.8%
95 - Douglass Street 20,777 10,933 15,727 21,428 5,701 36.2%
98 - Training 77,239 31,343 63,746 64,229 483 0.8%
99 - Administration 454,795 196,574 406,140 387,019 (19,121) -4.7%
Grand Total 2,641,473 1,206,839 2,646,577 2,795,938 149,361 5.6%
Funds:
10 - General 29,279 13,361 22,424 29,225 6,801 30.3%
20 - Water General 2,770 - 7,864 4,323 (3,541) -45.0%
50 - Wastewater General 593,053 272,052 532,356 505,972 (26,384) -5.0%
51 - WW Cape Elizabeth 293,138 140,754 310,378 331,264 20,886 6.7%
53 - WW Cumberland 389,357 198,965 350,275 389,139 38,864 11.1%
55 - WW Windham LF 37,157 14,462 41,249 40,238 (1,011) -2.5%
57 - WW Portland 678,628 298,025 793,474 836,724 43,250 5.5%
61 - WW Gorham 189,853 74,522 165,185 185,895 20,710 12.5%
62 - WW Westbrook 134,368 74,951 152,461 175,049 22,588 14.8%
64 - WW Joint Westbrook 119,572 64,796 122,989 143,711 20,722 16.8%
65 - WW Joint LF 95,075 43,290 66,170 75,856 9,686 14.6%
66 - WW Peaks Island 79,223 11,661 81,752 78,542 (3,210) -3.9%
Grand Total 2,641,473 1,206,839 2,646,577 2,795,938 149,361 5.6%
Headcount:
Full-Time 13 13 13 13 0 0.0%
Part-Time 0 0 0 0 0 n/aTotal 13 13 13 13 0 0.0%

194 Departmental Expenses – Environmental Services
Environmental Services
Employee Shelter at the Standish Boat Launch
The District collaborated with the Town of Standish to construct this shelter for boat launch employees
at the Standish Boat launch. It includes storage for handouts and other materials, an air conditioner and
refrigerator so employees can take a break from the hot sun and drink something cold periodically
during a shift, and safety equipment. From the porch of the structure, a District or town attendant can
be out of the direct sun and see the boat launch and shorefront.

195 Departmental Expenses – Environmental Services
Environmental Services – Purpose Statement Environmental Services is organized to monitor and protect water quality from watershed to tap and wastewater from collection to discharge.
Core Services Environmental Services has five core areas of focus:
Water Resources Group (A5; red in the organization chart) 1. The Source Protection section monitors Sebago Lake and the watershed, inspects development
projects in the watershed to minimize their impact, works with watershed partners to install pollution prevention and mitigation projects, and works with watershed land trusts to help landowners seeking to conserve their land in perpetuity.
2. The Environmental Education section communicates water quality and environmental principles to children and adults throughout the watershed and service area with the goal of encouraging public stewardship of our water resources.
3. The Security section provides for the daily protection of Sebago Lake by patrolling Lower Bay and enforcing the rules of access to the Sebago Lake Land Reserve and also coordinates the District’s Preparedness and Emergency Response activities.
Laboratory Services Group (L6; blue in organization chart) 4. The Environmental Laboratories ensure the proper collection, analysis and reporting of water,
wastewater and biosolids samples both for compliance purposes and to support the proper functioning of water and wastewater operations. The group ensures the proper maintenance and calibration of laboratory sampling and monitoring equipment at all five of the District’s laboratories.
5. The Industrial Pretreatment Program (IPT) staff are responsible for permitting, monitoring and initiating enforcement actions for sewer customers who discharge significant quantities of non-domestic wastewater to the sewer collection system. The IPT programs are designed to ensure discharges from industrial users do not impact District operations or pollute the Presumpscot River or Casco Bay.
Environmental Manager
Source Protection Coordinator
Water Resources Specialist (4)
Regulatory and Security Advisor
Lead Environmental Scientist
Environmental Scientist (3)
Chief of Security Operations
Environmental Education
Coordinator
Laboratory Assistant II
Environmental Educator
Industrial Pretreatment
Supervisor

196 Departmental Expenses – Environmental Services
Key Statistics
A map illustrating all of the District’s drinking water quality sampling locations from watershed to tap.
Performance Benchmarks
Annual Program Metrics – Environmental Services 2019 Actual
2020 Projected
% Verified - Water Quality Inquiries 26 26
Shore Land Zone Inspections 375 375
Watershed Properties Improved or Recommendations Made 25 25
Lower Bay Water Violations 42 60
Land Reserve Visitors 28,424 30,000
Land Reserve Violations 370 400
Visitors per Land Reserve Violation 77 75
Accredited Laboratory Analytes 74 74
Students Served by WaterWays In-School Program 1,013 1,000
Outreach Events and Presentations Organized by PWD 43 40
Industrial Pretreatment Notices of Violation Issued 28 28
Watershed Monitoring Programs: 12
Annual Watershed Inspections: 400
Individuals reached through Education and Outreach programs: More than 10,000 annually
Annual Land Reserve Day-use Visits: 21,000
Land Reserve Violations Issued: 300
Annual Lower Bay Patrol Hours: 2100
Annual Lower Bay Violators Cited: 90
Accredited Laboratory Analytes: 74
Average Annual Customer Water Quality Inquiries: 270
IPT Industries Regulated: 41

197 Departmental Expenses – Environmental Services
Past Accomplishments: Source Protection since 2000:
Completed nearly 9,800 watershed inspections.
Provided Lakescaping Reports to 494 watershed properties.
Financially supported water quality-related improvements to 195 properties.
Awarded more than $226,000 in Lake Stewards Grants which, when combined with matching funds, resulted in more than $871,000 in improvements to the shore land zone of Sebago Lake
Maintained 12 ongoing lake and watershed monitoring programs.
Reviewed plans for more than 166 large developments and, when necessary, provided planning board feedback in an effort to minimize the impact of these projects.
Responded to 476 complaints, 169 of which prevented or mitigated environmental violations and/or pollution.
Contributed more than $900,000 to assist in the conservation by area land trusts of 5,800 acres of land in the watershed.
Education and Outreach since 2000:
Produced 30 Watershed News newsletters and 5 State of the Lake reports.
Distributed more than 62,000 Sebago Lake maps and 15,100 “Images of Sebago Lake” calendars to watershed residents and visitors.
Distributed more than 56,700 other types of brochures and fact sheets to watershed residents and visitors.
Posted over 380 lake protection related messages on Facebook to an audience that began at 490 in 2013 and has increased to over 2,300 followers.
Sent 43 mass emails about source protection events, publications, and information to a recipient list that started in 2015 with 1,100 email addresses and has increased to over 3,200.
Taught source protection principles to approximately 18,000 middle school-aged students through our HydroLogics and WaterWays in-school education programs.
Provided environmental education to approximately 37,000 additional children, teachers, and adults through tours, events, workshops, field trips, lessons, providing resources, and programs.
Water Resources Security since 2005:
Patrolled Lower Bay by boat and attended the Standish Boat Launch for approximately 24,360 hours combined.
Patrolled the Sebago Lake Land Reserve by using an all-terrain vehicle (Extended Security patrol) for approximately 1,490 hours combined.
Issued more than 1823 warnings for violation of water contact regulations
Recorded 187,177 day-use visits to the Sebago Lake Land Reserve.
Issued more than 3,235 warnings for violation of Land Reserve Rules.
Suspended privileges to visit Land Reserve of 42 individuals for aggravated or multiple Land Reserve Rule violations.

198 Departmental Expenses – Environmental Services
Past Accomplishments (continued)
Environmental Laboratories since 2000:
Combined the water and wastewater laboratories into one functioning unit with shared resources, staff, and expertise.
Consolidated to East End laboratory the daily wastewater analyses for the four wastewater treatment facilities in order to improve consistency and reduce duplication of quality control requirements.
Modified laboratory procedures as needed to meet evolving EPA and state standards to maintain accreditation for water and wastewater analyses.
Consistently analyzed performance testing samples properly to maintain accreditation.
Managed the customer water quality inquiry process to ensure prompt and consistent response by appropriate staff; responded to approximately 250 calls per year.
Contributed to the protection of public health by participating in the Maine Healthy Beaches program.
Supported water and wastewater operations by providing accurate and timely water and wastewater quality data.
Provided training in water quality and environmental regulation to District staff in all departments.
Industrial Pretreatment since 2010:
Accomplished the adoption of local limits on Portland and Westbrook industrial dischargers each time facility permits were renewed.
Created and implemented Industrial Waste Surveys of the Westbrook-Gorham-Windham and Cape Elizabeth systems to identify IPT industries.
Assumed all aspects of the Portland IPT program from the City of Portland.
Received 2015 Regional EPA Industrial Pretreatment Program Excellence Award.

199 Departmental Expenses – Environmental Services
Budget Year 2019 Highlights: Maintained the real-time lake monitoring buoy in the Lower Bay of Sebago Lake to provide
water quality data from multiple depths and feed the data continuously to the PWD website.
Continued development of a water quality data interface (WQDI) that utilizes and integrates the District’s existing databases to display water quality data from the watershed to the distribution system and developed the ability to generate informative fact sheets for more than 300 sample sites.
Partnered with St. Joseph’s College to host the 2019 Sebago Lake Symposium to highlight the new monitoring buoy and perform lake protection outreach to Sebago Lake constituents.
Worked with Sebago Clean Waters partners to further the goals of increasing land trust capacity and development of a new funding source for financing land conservation in the Sebago Watershed.
Board of Trustees approved $345,000 towards conservation of Tiger Hill Community Forest in Sebago. District staff secured a low-interest loan with $50,000 principal forgiveness to finance the contribution.
Applied for and received a $5,000 Source Water Protection Grant from the Maine Drinking Water Program to correct erosion sites at Sebago Lake State Park.
Began a AWIA Risk and Resilience Assessment on the Greater Portland water system
Revised the Source Protection section of the District’s website to improve navigation and readability.
Initiated updates to the Sebago Lake Treatment Facility’s Integrated Contingency Plan (ICP).
Represented the District on the Cumberland District Public Health Council.
Initiated haloacetic acid (HAA9), metals, pesticides, alcohols and SVOC monitoring for the Greater Portland system per the EPA UCMR4 regulation.
Provided laboratory support to the Maine Healthy Beach Program by testing East End beach for bacteria.
Maintained good standing with DHHS lab accreditation program following on-site assessments.
Expanded the WaterWays Program to two additional schools, serving an additional 263 students, through collaboration with partners.
Increased capacity of our TroutKids Program through a revised, online TroutKids Guide and teacher consultations, serving an additional 350 students.
Coordinated a Brewery Collaborative event as part of Drinking Water Week that highlighted the connection between forests, water, and beer and publically launched Sebago Clean Waters.
Organized and participated in a hurricane after-effects exercise with the all operations groups.
Completed the annual update to the PWD Incident Management Plan
Installed a personnel shelter for District and Town of Standish Boat Launch staff to use as an information center, milfoil inspection check point, and Lower Bay observation platform.
Revitalized the Pond Road grave site of Revolutionary War hero and Standish resident, Jebediah Lumbard.
Hosted Portland industrial pretreatment customers at the EEWWTF for a tour and educational event.
Created an Industrial Pretreatment website which is now hosted on www.pwd.org.
Created and posted a short video about IPT to highlight benefits of the program.
Established sampling protocol and procedures for WW Systems Operators and Environmental Service lab staff for both Westbrook-Gorham and Portland IPT programs.
Supported promulgation into municipal ordinances of updated IPT local industrial discharge limits in Westbrook and Portland.

200 Departmental Expenses – Environmental Services
2019 Highlights
Coordinated a Brewery Collaborative event that highlighted the connection between forests, water, and beer and publically launched Sebago Clean Waters.
Expanded the WaterWays Program to two additional schools through collaboration with partners.
Increased capacity of our TroutKids Program through revised TroutKids Guide and teacher consultations.
Initiated haloacetic acid (HAA9), metals, pesticides, alcohols and SVOC monitoring for the Greater Portland system per the EPA UCMR4 regulation.
Began AWIA Risk and Resilience Assessment on the Greater Portland water system.
Installed a District Security and town boat launch attendant home base at the Standish Boat Launch.

201 Departmental Expenses – Environmental Services
2019 Highlights (continued)
District security staff revitalized the Pond Road grave site of Revolutionary War hero and Standish resident, Jedediah Lumbard.
Maintained the real-time lake monitoring buoy in the Lower Bay of Sebago Lake.
Continued development of the water quality data interface (WQDI) that is used to display water quality data from the watershed to the distribution system.
Hosted a tour/event for customers permitted in our Portland pretreatment program at the East End Wastewater Facility.
Initiated implementation of the new federal Dental Amalgam rule to protect receiving waters from potential mercury contamination from dental office wastewater.

202 Departmental Expenses – Environmental Services
2020 Projects and Initiatives
Source Protection
Work with Trickey Pond Environmental Protection Association, the Town of Naples, Lakes Environmental Association, and FB Environmental to develop a Watershed Based Protection Plan for Trickey Pond
Work with Sebago Clean Waters to continue development of a water fund to be used to support forest conservation easements in the watershed.
Continue supporting the land conservation efforts of Sebago Clean Waters.
Continue collaboration with the Town of Standish to influence management of the Rich Memorial Beach, the new Route 35 overlook facility, and operations at the Standish Boat Launch.
Perform inspections of all property development in the shoreland zone of Sebago Lake.
Provide technical assistance and grant funding for shoreland zone property owners, road associations and camps to improve storm water quality and mitigate soil erosion issues.
Complete scheduled sampling and testing for all 12 lake and watershed water quality monitoring programs, analyze the data, and produce and post useful water reports.
Monitor planning board agendas, provide technical assistance, and track large-scale projects such as subdivision and commercial development within the Sebago Lake watershed.
Continue collaboration with the Presumpscot Regional Land Trust to ensure that Sebago to the Sea trail stewardship remains in accordance with District security/land use policies.
Maintain communication with Portland Pipeline Corporation and continue monitoring the status of their operations and potential plans.
Environmental Laboratories
Re-accredit testing methods at East End and Sebago Lake laboratories for all reportable analytes.
Report on water quality inquiries including those at dead end locations.
Complete monitoring for HAA9, metals, alcohols, pesticide and SVOC’s per the EPA’s fourth Unregulated Contaminant Monitoring Rule.
Continue safety awareness and improvements through hazard analysis, Global Harmonized System secondary container labeling, chemical inventory procedures and coordinating District hazardous waste removal.
Provide training to District staff to improve data quality and understanding.
Provide nitrogen and phosphorus monitoring support at wastewater facilities to support nutrient testing program.
Represent the District on the Cumberland District Public Health Council.
Industrial Pretreatment
Collect dental amalgam rule one-time compliance reports from all area dental offices.
Continue managing all aspects of the Westbrook-Gorham and Portland pretreatment programs.
Renew all expiring Industrial Pretreatment permits (in 2020, 44% of all permits will expire).
Collaborate with the City of Portland on a general permit program for breweries and other alcoholic beverage producers.

203 Departmental Expenses – Environmental Services
2020 Projects and Initiatives (continued)
District Security & Preparedness
Lead meetings of the District’s Security Committee. Exercise District’s emergency preparedness with either a full-scale or tabletop exercise. Patrol Lower Bay by boat during summer, ensuring compliance with body contact and trespassing restrictions. Patrol Sebago Lake Land Reserve year-round to ensure compliance with District land use policy. Maintain enhanced patrol of the Otter Pond Parcel of the Sebago Lake Land Reserve to address the growing
number of visitors. Provide field oversight of District logging operations and track documentation. Conduct training for Operations staff in security patrol procedures of District’s water storage facilities. Support local first responders as requested in response to Sebago Lake rescue incidents. Patrol Lower Bay during ice fishing season to minimize impact of activity on water quality. Improve parking conditions at the Route 237 and Smith Mill Road kiosks. Support Water and Wastewater operations in their updates to emergency Integrated Contingency Plans. Perform audits of Facility Security Operating Plans (FSOPs) for all managed District facilities. Strengthen relationship and communication between PWD and local public health agencies. Certify AWIA Risk and Resilience Assessment completion to EPA Complete and certify to EPA the update to the Emergency Response Plan.
Environmental Education and Outreach
Implement the fourth year of WaterWays in watershed and service area schools, serving approximately 1000 middle school students.
Collaborate with two partner organizations to deliver the WaterWays Program at two additional middle schools, reaching an anticipated 220 additional students.
Continue to increase educational capacity through teacher consultations, grants, and the creation and loaning of educational resources.
Begin utilization of a software program to manage our loanable educational resources. With Lakes Environmental Association, create a middle school forestry curriculum that focuses on the
connection between forests and water quality. Coordinate outreach efforts in upper Sebago Lake watershed towns to increase forest conservation and
awareness of Sebago Clean Waters. Collaborate with partners, coordinate events, and serve as a resource for watershed and service area schools
and groups to teach source protection and water stewardship principles. Coordinate outreach initiatives with District public relations efforts. Utilize technology and a variety of media to connect the public with PWD events and environmental stewardship
messages. Recognize Drinking Water Week with District-sponsored initiatives for the public. Provide outreach materials to the public including maps, calendars, and brochures. Provide support to the Southern Maine Children’s Water Festival.
Budget Year 2019 Staffing Changes:
There are no changes in the number of staff proposed in the 2020 budget.

204 Departmental Expenses – Environmental Services
2020 Projects and Initiatives
Coordinate outreach efforts in Upper Sebago Lake watershed towns to increase forest conservation and awareness of Sebago Clean Waters.
Begin to utilize software to manage our loanable educational resources.
Co-design middle school forestry curriculum with Lakes Environmental Association.
Support Water and Wastewater operations to initiate updates to emergency Integrated Contingency Plans.
Maintain real-time water quality monitoring buoy in Lower Bay and continue refinement of data interface and data transmission.

205 Departmental Expenses – Environmental Services
2020 Projects and Initiatives
Continue development of a fund to be used to support forest conservation and accelerate the pace of land conservation in the watershed.
Monitor for HAA9, metals, alcohols, pesticide and SVOC’s per the EPA Unregulated Contaminant Monitoring Rule.
Renew all expiring IPT permits (44% of total).
Issue Industrial Pretreatment General Permits to breweries that discharge to the Portland or Westbrook-Gorham sewer systems.

206 Departmental Expenses – Environmental Services
2020 Proposed Grants to Watershed Partners
2020 Proposed
Type Recipient Purpose
$2,500 Water Education Grants Educators in the service area and
watershed Education
Provides teaching resources to local teachers to support water education.
$16,000 Lakescaping Grants Watershed property owners,
businesses Source Protection
Grants of up to $1,000 are made to individual property owners and up to $2,000 to businesses, associations, or municipalities for implementing erosion and sedimentation control BMPs based on our recommendations. A 50-50 match is required.
$1,250 Lake Protection Support Maine Lakes Society Advocacy
A contribution of $1,000 to Maine Lakes Society to support their operations and $250 to support their annual conference. Their advocacy benefits all surface supplies including PWD.
$1,250 Lake Protection Support Lake Stewards of Maine Advocacy, Monitoring
A contribution of $1,000 to Lake Stewards of Maine to support their operations and $250 to support their annual conference. Their outreach raises awareness statewide to issues of lake protection, particularly invasive aquatic plants. They conduct training at PWD and for PWD
employees on request.
$15,000 Watershed Organization
Support Lakes Environmental Association
Advocacy, Education, Source Protection
LEA provides support for our upper watershed protection efforts. All lakes they work on ultimately lead to Sebago Lake. LEA monitors lake water quality and participates in the planning process in upper watershed towns to minimize development impact. Staff provides technical assistance to lakefront landowners on BMPs for lake protection and compliance with Shoreland zoning and the Natural Resources Protection Act. LEA also
provides water-related education to area schools and operates the Lakes Science Center.
$1,000 Watershed Organization
Support Raymond Waterways Protective
Association Outreach, Source Protection
RWPA works on invasive plant control, BMP installation, and does outreach via a newsletter. They work on 319 (erosion control) projects in the indirect watershed of Sebago Lake. They also receive financial support from the town, grants, and individuals.
$1,500 Land Trust Support Loon Echo Land Trust Source Protection
Loon Echo’s mission is to conserve land in the towns of Denmark, Bridgton, Harrison, Naples, Casco, Sebago, and Raymond. The trust’s service area encompasses 126,000 acres – nearly half - of the Sebago Lake watershed. As they make progress in pursuit of their mission, our water
supply is better protected.

207 Departmental Expenses – Environmental Services
Conservation Land Acquired by Land Trusts with District Support
Year Transactions Acres Amount of District Support Total Value of Land Acquired
in Fee or Easement
2008 1 350 $5,000 $100,000
2009 1 23 $500 $25,000
2010 1 60 $10,000 $1,500,000
2011 1 690 $9,250 $750,000
2012 2 116 $6,900 $297,000
2013 4 1005 $68,990 $718,500
2014 4 1301 $346,443 $2,410,000
2015 3 145 $47,435 $381,600
2016 0 0 $0 $0
2017 2 124 $19,220 $175,000
2018 3 1646 $370,994 $1,781,000
2019 0 0 $0 $0
Totals 22 5460 $884,732 $8,138,100
2020 Proposed Grants to Watershed Partners (Continued)
2020 Proposed
Type Recipient Purpose
$1,500 Land Trust Support Western Maine Foothills
Land Trust Source Protection
The Western Foothills Land Trust is organized to conserve land in the towns of Otisfield, Norway, Bethel and Waterford, among others. The trust’s service area encompasses 54,000 acres – about 20% - of the Sebago Lake watershed. As they make progress in pursuit of their mission,
our water supply is better protected.
$500 Land Trust Support Presumpscot Regional Land
Trust Source Protection
The Presumpscot Regional Land Trust is organized to conserve land in the towns of Gorham, Gray, Standish, Westbrook, and Windham. As they work to conserve land in parts of the watershed towns of Windham and Standish, our water supply is better protected. They are also the
stewards of the Sebago to the Sea Trail that passes through District property.
$500 Maine Water Conference
Support U Maine Mitchell Center Public Relations
Our support mostly serves a public relations function, ensuring the District's name on promotional materials. The conference also provides an opportunity to attract Maine colleges and Universities to research Sebago Lake.
$800 Children's Water Festival Southern Maine CWF
Committee Education, Public Relations
Our support serves a PR purpose and contributes to the educational goal of the event, which is raising student awareness of water issues.
$41,800 Total Grant Support to Watershed Partners

208 Departmental Expenses – Environmental Services
Financial Overview The overall Environmental Services budget is up 2.7% from the 2019 budget. Much of this change is due to increased costs of labor and benefits.
A5: Water Resources We continue to seek partners (Lake Environmental Association and Cumberland County Soil and
Water Conservation District, for example) who can deliver our environmental education messages to wider audiences without adding additional staff. There is an additional $1800 budgeted in 2020 for this purpose.
We are continuing our efforts to be more involved with Upper Watershed municipal and other partners. There is an additional $6300 budgeted for this purpose in 2020. A part of this effort will involve presentations to watershed town managers and boards.
L6: Laboratory Services This is the second budget that fully funds both the Westbrook-Gorham and Portland Industrial
Pretreatment Programs. Prior to 2019, many of the activities of the Portland program were the responsibility of the City of Portland.
Wastewater MePDES permits cover a 5 year period; three facilities are in year 4 which is a screening year during which more intensive effluent testing is required. The 2020 L6 budget includes $10,570 for Whole Effluent toxicity testing at EEWWTF, W-GWWTF and CEWWTF.

209 Departmental Expenses – Environmental Services
Environmental Services: Total
Financial Summary:
Column1
2018
Actual
2019
Jan-Jun
2019
Budget
2020
Budget
Budget
Diff $
Budget
Diff %
Sub-Group:
A5 - Water Resources $1,100,814 $528,726 $1,166,078 $1,208,810 $42,732 3.7%
L6 - Water/WW Laboratory 863,462 446,329 902,882 916,027 13,145 1.5%
Grand Total 1,964,276 975,055 2,068,960 2,124,837 55,877 2.7%
Expense Type:
Salaries & Wages $1,018,173 $503,925 $1,051,655 $1,079,531 $27,876 2.7%
Employee Benefits 513,093 245,807 506,364 499,074 -7,290 -1.4%
Chemicals 5,090 3,750 4,900 5,200 300 6.1%
Contracted Services 94,324 59,016 127,370 162,931 35,561 27.9%
Heat/Fuel Oil 11,910 3,157 12,000 12,000 0 0.0%
Insurance 2,294 1,171 2,274 2,505 231 10.2%
Materials & Supplies 109,732 58,779 122,275 117,901 -4,374 -3.6%
Other Expense 156,545 71,336 189,754 189,043 -711 -0.4%
Purchased Power 3,944 3,267 3,207 5,253 2,046 63.8%
Tele/Other Utilties 4,496 2,609 4,765 5,555 790 16.6%
Transportation 44,675 22,240 44,396 45,844 1,448 3.3%
Grand Total 1,964,276 975,055 2,068,960 2,124,837 55,877 2.7%
Headcount:
Full Time 16 15 15 15 0 0.0%
Part Time 1 1 1 1 0 0.0%
Total 17 16 16 16 0 0.0%

210 Departmental Expenses – Environmental Services
Environmental Services: Total
. 2018
Actual
2019
Jan-Jun
2019
Budget
2020
Budget
Budget
Diff $
Budget
Diff %
Salaries & Wages
660111 - SALARIES/WAGES NON-UNION $395,462 $212,637 $430,394 $443,917 $13,523 3.1%
660121 - WAGES/REGULAR UNION 536,035 259,827 539,520 552,898 13,378 2.5%
660122 - WAGES/OVERTIME UNION 21,721 13,083 26,168 27,480 1,312 5.0%
660123 - WAGES/DOUBLETIME UNION 2,165 607 2,583 2,386 (197) -7.6%
660131 - WAGES - REGULAR - TEMPS 48,360 17,771 52,990 52,850 (140) -0.3%
660132 - WAGES - OVERTIME- TEMPS 84 - - - -
66014 - VACATION ACCRUAL 11,614 - - - -
66015 - SICKTIME ACCRUAL 2,734 - - - -
Salaries & Wages Total 1,018,173 503,925 1,051,655 1,079,531 27,876 2.7%
Employee Benefits
660401 - FICA - EMPLOYERS' SHARE 75,420 37,806 80,450 82,583 2,133 2.7%
660405 - SAFETY/WHY PROGRAM ITEMS 3,133 648 3,650 4,040 390 10.7%
6604151 - FIELD UNIFORMS 1,584 1,457 1,200 1,200 - 0.0%
660418 - STIPENDS 1,700 1,800 1,900 1,800 (100) -5.3%
660419 - EMPLOYEE BENEFTS-MISC OTH 3,273 - 3,460 3,340 (120) -3.5%
660491 - FRINGE BENEFITS-REG/SAL 427,983 204,096 415,704 406,111 (9,593) -2.3%
Employee Benefits Total 513,093 245,807 506,364 499,074 (7,290) -1.4%
Chemicals
661899 - OTHER CHEMICALS 5,090 3,750 4,900 5,200 300 6.1%
Chemicals Total 5,090 3,750 4,900 5,200 300 6.1%
Contracted Services
66353 - REPAIR SERVICES 145 477 2,000 2,000 - 0.0%
66354 - MAINTENANCE SERVICES 43,098 25,236 53,740 52,336 (1,404) -2.6%
663546 - MAINTENANCE - SNOW REMOVL 8,019 3,535 1,600 8,100 6,500 406.3%
663551 - LAB ANALYSIS 31,086 16,618 43,460 49,845 6,385 14.7%
663553 - PHOTOGRAPHY SERVICES 275 - 850 850 - 0.0%
663561 - COMPUTER LICENSES 105 - - - -
663574 - DISPOSAL SERVICES 3,504 3,529 3,600 6,150 2,550 70.8%
663587 - COURIER SERVICES 2,223 1,141 2,320 2,400 80 3.4%
6636 - TECHNICAL SERVICES 5,868 8,479 19,800 41,250 21,450 108.3%
Contracted Services Total 94,324 59,016 127,370 162,931 35,561 27.9%
Heat/Fuel Oil
661622 - CONTAINER DELIVERED 4,439 1,539 5,000 5,000 - 0.0%
66166 - UNLEADED GAS 7,471 1,618 7,000 7,000 - 0.0%
Heat/Fuel Oil Total 11,910 3,157 12,000 12,000 - 0.0%
Insurance
66599 - PROPERTY & BOILER INSUR 2,294 1,171 2,274 2,505 231 10.2%
Insurance Total 2,294 1,171 2,274 2,505 231 10.2%

211 Departmental Expenses – Environmental Services
. 2018
Actual
2019
Jan-Jun
2019
Budget
2020
Budget
Budget
Diff $
Budget
Diff %
Materials & Supplies
6619 - ASSET PURCHASES $20,728 $8,477 $20,250 $14,000 ($6,250) -30.9%
66202 - TOOLS 796 1,250 1,600 1,800 200 12.5%
66203 - VENDOR PURCHASED SUPPLIES 8,588 6,436 14,100 14,700 600 4.3%
662042 - SUPPLIES INVENTORY 748 336 1,725 1,700 (25) -1.4%
662043 - TOOL INVENTORY 1,231 1,028 1,650 1,650 - 0.0%
66204302 - INVENTORY - PAPER 60 - 300 300 - 0.0%
66204303 - INVENTORY-COMPUTER EQUIP 1,717 1,436 1,650 1,313 (337) -20.4%
662047 - GARAGE INVENTORY 4 - 100 100 - 0.0%
66205 - CONSUMABLE SUPPLIES 73,350 38,696 76,600 75,850 (750) -1.0%
66206 - COMPUTER RELATED EQUIP 2,510 1,120 4,300 6,488 2,188 50.9%
Materials & Supplies Total 109,732 58,779 122,275 117,901 (4,374) -3.6%
Other Expense
66411 - INTERNAL RENTAL CHARGES 48,600 25,515 51,030 51,030 - 0.0%
6642 - EQUIPMENT RENT 58 - 300 300 - 0.0%
66601 - PUBLIC RELATIONS 5,076 72 10,050 13,800 3,750 37.3%
66609 - OTHER ADVERTISING 1,707 945 2,500 3,300 800 32.0%
6675111 - INSTATE TRAINING/CONF 5,065 2,996 6,900 5,400 (1,500) -21.7%
6675112 - OUT OF STATE TRAINING/CON 4,188 2,136 6,300 6,600 300 4.8%
667513 - DUES 17,581 1,403 20,254 22,263 2,009 9.9%
667514 - PROFESSIONAL LICENSES 650 4,345 925 845 (80) -8.6%
667515 - PERIODICAL SUBSCRIPTIONS 184 213 670 680 10 1.5%
667521 - POSTAGE - THIRD PARTY 1,686 360 3,300 3,800 500 15.2%
667522 - POSTAGE - INTERNAL 529 206 975 825 (150) -15.4%
667523 - POSTAGE - EXPRESS DELIVER 237 70 200 150 (50) -25.0%
667531 - PRINTING COSTS 18,858 6,109 25,750 30,000 4,250 16.5%
667555 - SAFETY EXPENSES 107 47 100 100 - 0.0%
667561 - WATERSHED GRANTS/SUPPORT 40,637 22,203 54,100 43,300 (10,800) -20.0%
667591 - UNIFORMS 1,691 2,766 2,150 2,300 150 7.0%
667592 - FOOD SUPPLIES 1,547 668 4,200 4,350 150 3.6%
667599 - OTHER MISCELLANEOUS 8,143 1,283 50 - (50) -100.0%
Other Expense Total 156,545 71,336 189,754 189,043 (711) -0.4%
Purchased Power
66155 - POWER - SMALL ENERGY 2,027 1,692 1,591 2,676 1,085 68.2%
66156 - POWER - SMALL T&D 1,917 1,575 1,616 2,577 961 59.5%
Purchased Power Total 3,944 3,267 3,207 5,253 2,046 63.8%
Tele/Other Utilties
66101 - WATER 196 79 335 335 - 0.0%
66111 - TELEPHONE LINES 261 - 350 - (350) -100.0%
66112 - DATA LINES 239 87 540 540 - 0.0%
66113 - CELLULAR PHONES 3,800 2,443 3,540 4,680 1,140 32.2%
Tele/Other Utilties Total 4,496 2,609 4,765 5,555 790 16.6%
Transportation
66501 - TRANSPORTATION - INTERNAL 16,103 7,892 16,169 15,821 (348) -2.2%
665019 - TRANS INTERNAL INACTIVE 19,888 9,654 19,077 18,673 (404) -2.1%
66503 - MILEAGE REIMBURSEMENT 8,685 4,693 9,150 11,350 2,200 24.0%
Transportation Total 44,675 22,240 44,396 45,844 1,448 3.3%
Grand Total 1,964,276 975,055 2,068,960 2,124,837 55,877 2.7%

212 Departmental Expenses – Environmental Services
Environmental Services: Water Resources (A5)
Financial Summary:
. 2018
Actual
2019
Jan-Jun
2019
Budget
2020
Budget
Budget
Diff $
Budget
Diff %
Expense Type:
Salaries & Wages 592,333 288,245 609,550 626,415 16,865 2.8%
Employee Benefits 293,667 140,430 289,414 286,673 (2,741) -0.9%
Contracted Services 49,770 24,514 67,156 91,986 24,830 37.0%
Heat/Fuel Oil 11,910 3,157 12,000 12,000 - 0.0%
Insurance 2,294 1,171 2,274 2,505 231 10.2%
Materials & Supplies 21,781 9,889 34,075 36,088 2,013 5.9%
Other Expense 84,002 37,507 105,875 104,975 (900) -0.9%
Purchased Power 3,944 3,267 3,207 5,253 2,046 63.8%
Tele/Other Utilties 4,428 2,414 4,765 4,775 10 0.2%
Transportation 36,686 18,131 37,762 38,140 378 1.0%
Grand Total 1,100,814 528,726 1,166,078 1,208,810 42,732 3.7%
Programs:
28 - Monitoring 191,757 92,480 153,203 148,424 (4,779) -3.1%
41 - Pretreatment 5,708 2,472 20,109 17,014 (3,095) -15.4%
56 - Tech Ops Support 67,593 31,165 69,397 67,018 (2,379) -3.4%
78 - Education 124,248 67,958 142,576 155,422 12,846 9.0%
82 - Lake Security - Land 153,124 75,833 147,597 143,553 (4,044) -2.7%
83 - Customer Outreach 140,884 77,310 168,461 212,995 44,534 26.4%
84 - Lake Security - Water 31,428 11,469 46,310 50,682 4,372 9.4%
98 - Training 30,671 19,363 38,517 38,398 (119) -0.3%
99 - Administration 355,402 150,677 379,908 375,304 (4,604) -1.2%
Grand Total 1,100,814 528,726 1,166,078 1,208,810 42,732 3.7%
Funds:
10 - General 280,460 129,960 249,504 238,445 (11,059) -4.4%
20 - Water General 814,646 396,294 896,465 953,351 56,886 6.3%
50 - Wastewater General 2,043 1,160 66 64 (2) -3.0%
57 - WW Portland 2,566 963 13,588 10,377 (3,211) -23.6%
61 - WW Gorham 10 - 1,359 1,383 24 1.8%
62 - WW Westbrook 1,090 348 5,096 5,190 94 1.8%
Grand Total 1,100,814 528,726 1,166,078 1,208,810 42,732 3.7%
Headcount:
Full-Time 8 8 8 8 0 0.0%
Part-Time 1 1 1 1 0 0
Total 9 9 9 9 0 0.0%

213 Departmental Expenses – Environmental Services
Environmental Services: Laboratory Service (L6)
Financial Summary:
. 2018
Actual
2019
Jan-Jun
2019
Budget
2020
Budget
Budget
Diff $
Budget
Diff %
Expense Type:
Salaries & Wages 425,841 215,680 442,105 453,116 11,011 2.5%
Employee Benefits 219,426 105,376 216,950 212,401 (4,549) -2.1%
Chemicals 5,090 3,750 4,900 5,200 300 6.1%
Contracted Services 44,554 34,501 60,214 70,945 10,731 17.8%
Materials & Supplies 87,951 48,889 88,200 81,813 (6,387) -7.2%
Other Expense 72,542 33,829 83,879 84,068 189 0.2%
Tele/Other Utilties 68 195 - 780 780 n/a
Transportation 7,989 4,108 6,634 7,704 1,070 16.1%
Grand Total 863,462 446,329 902,882 916,027 13,145 1.5%
Programs:
41 - Pretreatment 108,009 61,866 156,096 154,811 (1,285) -0.8%
56 - Tech Ops Support 71,633 33,982 74,064 76,414 2,350 3.2%
63 - Sample Analysis 356,692 189,712 357,416 370,403 12,987 3.6%
78 - Education - - 1,529 1,561 32 2.1%
98 - Training 27,628 19,004 32,109 31,543 (566) -1.8%
99 - Administration 299,500 141,765 281,668 281,295 (373) -0.1%
Grand Total 863,462 446,329 902,882 916,027 13,145 1.5%
Funds:
10 - General 270,870 133,221 218,269 226,689 8,420 3.9%
20 - Water General 255,654 109,455 242,410 249,139 6,729 2.8%
50 - Wastewater General 207,802 139,334 316,903 293,599 (23,304) -7.4%
51 - WW Cape Elizabeth 2,694 2,933 4,770 6,770 2,000 41.9%
55 - WW Windham LF 35 649 594 175 (419) -70.5%
57 - WW Portland 80,775 35,781 74,205 83,933 9,728 13.1%
61 - WW Gorham 8,338 3,923 6,333 8,835 2,502 39.5%
62 - WW Westbrook 24,501 11,231 25,183 33,124 7,941 31.5%
64 - WW Joint Westbrook 8,984 9,109 10,975 12,064 1,089 9.9%
66 - WW Peaks Island 3,808 693 3,240 1,699 (1,541) -47.6%
Grand Total 863,462 446,329 902,882 916,027 13,145 1.5%
Headcount:
Full-Time 8 7 7 7 0 0.0%
Part-Time 0 0 0 0 0 n/a
Total 8 7 7 7 0 0.0%

214 Departmental Expenses – Engineering Services
Engineering Services - Purpose Statement To provide direct and supported design and construction of water, wastewater and administrative infrastructure and support an asset management approach to infrastructure acquisition and maintenance.
Core Services Engineering Services is responsible for providing engineering and maintenance services to internal and external customers. They are responsible for the following services:
Manages planning and design of developer installed water and sewer infrastructure and coordination of existing District field and facilities assets. Supports long range planning, alternatives evaluation, and detailed design development of water main renewal programs as well as treatment and pumping facility projects. Provides construction oversight/recordkeeping for all infrastructure projects. (Asset Engineering Services Group, E2; purple in organization chart).
Responsible for operation and maintenance of administrative facilities. Provides facility support services including garage, structural maintenance and stock room services (Facility Services Group-C1; blue in organization chart).
Provides design, installation, maintenance and technical support of the Supervisory Control and Data Acquisition (SCADA) systems (Instrumentation Group-E7; red in organization chart).
Director of Asset Management and Planning
Asset Management Program Manager
Engineering Services Manager
Senior Project Engineer
Instrumentation Foreperson
Instrumentation Technician (2)
Engineering Tech II
Project Engineer (3)
Scheduler/Coordinator AMAP
Senior Project Engineer
Associate Engineer Utility Asset Coordinator
Right Of Way AgentAsset Management
Technician (4)
Senior Project Engineer
Administrative Facilities Chief
Operator
Millwright
Facilities Support Generalist
Facility Maintenance Foreperson
Garage Foreperson
Garage Mechanic
Facilities Maintenance Technician (3)
Inventory Control Lead Person
Associate Engineer

215 Departmental Expenses – Engineering Services
Key Statistics
New Water Services
Assets in the Asset Information Management System (AIM)
Performance Benchmarks Corporate Goal – Reliability 2018 Actual 2019 Budget 2020 Budget Leaks per 100 miles of main 10 <10 <10 Main Renewals, feet 28,500 22,700 24,000 Main Extensions, feet 20,000 24,000 24,000 Corporate Goal - Affordability New Water Services 427 500 450 Corporate Goal – Employees and Work Environment Employee Training Hours 82 80 80
0
10
20
30
40
50
60
70
80
90
Jan Feb Mar Apr May Jun Jul Aug Sep Oct Nov Dec
New Services Installed(through August 2019)
2019 2018 2017 Avg (2014-2018)
Facilities 141
Facility Processes & Systems 1,324
Equipment/Components 11,028
Vehicles/Heavy Equipment 113
Water Service Association Assets (meters, backflows, etc.) 221,161
Water Field Assets 48,246
Sewer Field Assets 6,985
Total Assets 288,998

216 Departmental Expenses – Engineering Services
Past Accomplishments
Managed design/installation of 4 miles of water main renewals and 4 miles of extensions.
Oversaw design and construction of projects at East End WWTF (Grit Removal, Odor Control) Cape Elizabeth WWTF (UV Disinfection), Peaks island WWTF (Influent Screens), Fore River Pump Station upgrade, Dana Court Pump Station upgrade, Family Field Pump Station and Baxter Boulevard Pump Stations and Wards Hill (Water Booster Pump Station).
Completed preliminary design of EEWWTF medium voltage power distribution system to address resiliency and reliability issues.
Completed detailed design of HVAC upgrades for EEWWTF and CEWWTF.
Completed preliminary design for Westbrook Gorham Windham Regional WWTF aeration, clarifier and power upgrades.
Added online nitrogen monitoring to EEWWTF to facilitate better process control by Operations
Managed design and construction of water main replacement program including several unanticipated partnering projects with the Turnpike Authority and various municipalities.
Managed selection and began implementation of CMMS software as part of Project ABC.
Worked with water and wastewater operations and environmental services staff to improve asset data and AIM understanding and prepare for CMMS transition.
Managed facilities projects across District including: Douglass St Phase II roof replacement, breakroom ductless heat pump installation and fall protection improvements, EEWWTF Boiler replacement, Northeast Pump Station roof replacement and the Westbrook Gate upgrade.
Continued annual roof inspections on facilities across the District to ensure well planned asset replacements.
2020 Projects and Initiatives
Corporate Goals – Reliability and Affordability
Manage and support vertical asset upgrade projects (WGWRWWTF aeration, clarifier and power upgrades, Windham Water Storage Tank, EEWWTF (Flow Split/Flow Metering, Backup Power), CEWWTF UV Treatment headwork & HVAC, Baxter Boulevard PS, Fore River PS PhII, Little John PS upgrade, etc.).
Improve water main replacement programs and manage design and delivery of projects.
Manage and support design and construction associated with 10 Maine Turnpike infrastructure crossing upgrades.
Lead and support implementation of Lucity CMMS software.
Work with Wastewater and Water Ops, and Environmental Services to improve AIM data and configure CMMS.
Manage facilities projects around District including replacement of Douglass St Generator
Provide core support of asset management and CMMS implementation of ABC project.
Corporate Goal – Employees and Work Environment
Reach an average of 80 hours of training per employee.
Continue to support ongoing workplace safety management and training.

217 Departmental Expenses – Engineering Services
2019 Highlights
Completed EEWWTF Odor Control rehabilitation including 45,000 cfm fan.
Oversaw bidding and construction of Douglass St Phase II Slate Roof replacement project.
Downsized EEWWTF boilers from 160 HP to 80 HP per HVAC master plan and local design assistance.
Completed ceiling replacement to SLWTF lab.
Security gate upgrade
at WGWRWWTF
Enhanced influent screening at Peaks Island WWTF.

218 Departmental Expenses – Engineering Services
2020 Projects and Initiatives
Design and construction support of Maine Turnpike infrastructure crossings
Manage design and construction of Sewage Pump Station Projects – Fore River Ph II, Baxter Boulevard, Stroudwater, and Little John.
Manage final design and construction of WGWRWWTF Aeration upgrade project.
Lead Lead and support CMMS upgrade project
Lead program to prioritize, design and construct water main replacement program.

219 Departmental Expenses – Engineering Services
Financial Overview The Engineering Services 2020 budget request is $4,259,770, which is $97,187 or 2.2% lower than last year’s budget. The group consists of 3 subgroups – Facility Services (C1), Asset Engineering (E2) and Instrumentation (E7). Facility Services’ budget decreases by $42,075 or 2.0% primarily reflecting an anticipated move to having the Douglass Street facility unattended after hours. Asset Engineering’s budget decreases by $56,773 or 2.9%, reflecting an adjustment in CMMS software licensing and a reduction in computer hardware. Instrumentation budget increase is $1,661 or 0.5%. Significant Expense Type changes in 2020 are listed below:
Salaries, Wages and Employee Benefits
Salary and Wage line reflects the average increase of 3%.
Contracted Services
The line item includes a decrease of $93,272 primarily to reflect anticipated unattended operations at the Douglass St. facility. Computer Maintenance is lower due to the delay in the CMMS implementation to fourth quarter of the year.
Deferred Cost Writeoff
This category was zeroed out to reflect the final charge-off of the Westbrook CSO master plan.
Materials and Supplies
The line item includes a decrease of $43,504 (8.0%) to reflect anticipated decrease in costs associated with gasoline and diesel.
Telephone/Other Utilities Additional data lines included in the budget to support the implementation of the CMMS implementation.

220 Departmental Expenses – Engineering Services
Engineering Services – Total
Financial Summary
Column1
2018
Actual
2019
Jan-Jun
2019
Budget
2020
Budget
Budget
Diff $
Budget
Diff %
Sub-Group:
C1 - Faci l i ties Services $2,022,011 $894,623 $2,068,176 $2,026,101 -$42,075 -2.0%
E2 - Asset Engineering $1,728,405 $905,573 $1,932,223 $1,875,450 -$56,773 -2.9%
E7 - Instrumentation $319,410 $179,190 $356,558 $358,219 $1,661 0.5%
Grand Total 4,069,826 1,979,386 4,356,957 4,259,770 -97,187 -2.2%
Expense Type:
Salaries & Wages $1,809,070 $950,213 $1,992,643 $2,052,805 $60,162 3.0%
Employee Benefi ts 955,409 472,024 1,003,489 987,158 -16,331 -1.6%
Contracted Services 482,255 212,838 556,783 463,511 -93,272 -16.8%
Deferred Cost W/O 52,428 5,050 10,100 0 -10,100 -100.0%
Heat/Fuel Oi l 70,485 35,122 65,500 67,494 1,994 3.0%
Insurance 37,922 20,221 43,673 43,273 -400 -0.9%
Materia ls & Suppl ies 530,849 205,273 547,220 503,716 -43,504 -8.0%
Other Expense -133,714 -55,100 -110,270 -112,370 -2,100 1.9%
Purchased Power 82,829 36,677 68,750 77,276 8,526 12.4%
Tele/Other Uti l ties 75,771 45,882 78,700 81,548 2,848 3.6%
Transportation 106,522 51,187 100,369 95,359 -5,010 -5.0%
Grand Total 4,069,826 1,979,386 4,356,957 4,259,770 -97,187 -2.2%
Headcount:
Ful l Time 31 31 31 31 0 0.0%
Part Time 0 0 0 0 0 n/a
Total 31 31 31 31 0 0.0%

221 Departmental Expenses – Engineering Services
. 2018 Actual 2019
Jan-Jun
2019
Budget
2020
Budget
Budget
Diff $
Budget
Diff %
Salaries & Wages
660111 - SALARIES/WAGES NON-UNION $957,377 $528,834 $1,078,608 $1,102,797 $24,189 2.2%
660121 - WAGES/REGULAR UNION 804,987 404,171 856,839 894,954 38,115 4.4%
660122 - WAGES/OVERTIME UNION 7,064 2,970 11,916 11,958 42 0.4%
660123 - WAGES/DOUBLETIME UNION 604 - 500 517 17 3.4%
660124 - WAGES/STANDBY TIME UNION 460 - 1,100 1,139 39 3.5%
660131 - WAGES - REGULAR - TEMPS 19,105 14,238 43,680 41,440 (2,240) -5.1%
66014 - VACATION ACCRUAL 14,250 - - - -
66015 - SICKTIME ACCRUAL 5,223 - - - -
Salaries & Wages Total 1,809,070 950,213 1,992,643 2,052,805 60,162 3.0%
Employee Benefits
660401 - FICA - EMPLOYERS' SHARE 136,670 71,920 152,434 157,039 4,605 3.0%
660405 - SAFETY/WHY PROGRAM ITEMS 6,090 1,167 8,300 7,825 (475) -5.7%
660411 - MEALS ALLOWANCE 20 30 100 100 - 0.0%
660413 - PWD TRAINING PROGRAM 120 - - - -
660418 - STIPENDS 2,200 1,800 2,400 2,500 100 4.2%
660419 - EMPLOYEE BENEFTS-MISC OTH 11,037 6,008 10,722 5,800 (4,922) -45.9%
660491 - FRINGE BENEFITS-REG/SAL 799,272 391,099 829,533 813,894 (15,639) -1.9%
Employee Benefits Total 955,409 472,024 1,003,489 987,158 (16,331) -1.6%
Contracted Services
6631 - ENGINEERING SERVICES 18,392 (412) 5,000 5,000 - 0.0%
663521 - TRAFFIC CONTROL 1,479 - - - -
663524 - STREET OPENING 51 - - - -
663525 - CONTRACTOR CONSTRUCTION 8,600 300 - - -
663526 - INSPECTION SERVICES 135 128 - - -
66353 - REPAIR SERVICES 13,406 6,237 17,000 17,500 500 2.9%
66354 - MAINTENANCE SERVICES 252,089 100,067 267,200 270,200 3,000 1.1%
663546 - MAINTENANCE - SNOW REMOVL 17,028 11,417 22,000 25,000 3,000 13.6%
663561 - COMPUTER LICENSES 31,998 27,955 30,203 32,323 2,120 7.0%
663562 - COMPUTER MAINTENANCE 7,331 1,250 60,000 11,588 (48,412) -80.7%
663563 - COMPUTER CONSULTING/OTHER 1,060 - 600 600 - 0.0%
663574 - DISPOSAL SERVICES 8,863 5,781 23,500 23,500 - 0.0%
663587 - COURIER SERVICES 8,902 4,571 9,280 9,800 520 5.6%
663588 - EQUIPMENT MAINTENANCE 4,041 1,730 5,500 5,500 - 0.0%
663589 - SECURITY SERVICES 85,836 42,594 84,000 30,000 (54,000) -64.3%
6635985 - VEHICLE FLEET GPS SERVICE 21,560 10,780 25,000 25,000 - 0.0%
663599 - MISC OTHER SERVICES 1,485 441 2,500 2,500 - 0.0%
6636 - TECHNICAL SERVICES - - 5,000 5,000 - 0.0%
Contracted Services Total 482,255 212,838 556,783 463,511 (93,272) -16.8%
Deferred Cost W/O
66754 - DEFERRED COSTS WRITE OFF 52,428 5,050 10,100 - (10,100) -100.0%
Deferred Cost W/O Total 52,428 5,050 10,100 - (10,100) -100.0%
Heat/Fuel Oil
661621 - PIPELINE DELIVERED PROPAN 55,464 28,158 49,000 50,994 1,994 4.1%
66166 - UNLEADED GAS 15,020 6,964 16,500 16,500 - 0.0%
Heat/Fuel Oil Total 70,485 35,122 65,500 67,494 1,994 3.0%

222 Departmental Expenses – Engineering Services
. 2018
Actual
2019
Jan-Jun
2019
Budget
2020
Budget
Budget
Diff $
Budget
Diff %
Insurance
6656 - VEHICAL INSURANCE $27,258 $14,433 $32,233 $30,888 ($1,345) -4.2%
66561 - VEHICAL INSURANCE REIMBUR (500) - - - -
66593 - UMBRELLA INSURANCE COVER 5,898 3,128 6,244 6,693 449 7.2%
66599 - PROPERTY & BOILER INSUR 5,266 2,660 5,196 5,692 496 9.5%
Insurance Total 37,922 20,221 43,673 43,273 (400) -0.9%
Materials & Supplies
6619 - ASSET PURCHASES 13,960 3,293 44,950 45,250 300 0.7%
66202 - TOOLS 9,667 5,034 10,750 8,250 (2,500) -23.3%
66203 - VENDOR PURCHASED SUPPLIES 215,527 79,975 204,700 206,450 1,750 0.9%
662041 - MATERIALS INVENTORY (5,774) 2,790 8,850 7,800 (1,050) -11.9%
662042 - SUPPLIES INVENTORY 20,521 6,304 19,650 18,800 (850) -4.3%
66204201 - INVENTORY - QPR - 391 - - -
66204202 - INVENTORY - BNKRUN GRAVEL 326 319 - - -
66204203 - INVENTORY - CRUSHD GRAVEL 197 2,957 - - -
66204204 - INVENTORY - CRUSHED STONE (15) 1,581 - - -
66204205 - INVENTORY - LOAM 66 (6) - - -
66204206 - INVENTORY - TYPE A GRAVEL 10 (1,211) - - -
662043 - TOOL INVENTORY 16,256 4,242 11,300 10,550 (750) -6.6%
66204301 - INVENTORY - TONER 142 16 - - -
66204302 - INVENTORY - PAPER 141 326 - - -
66204303 - INVENTORY-COMPUTER EQUIP 3,864 2,826 3,913 3,700 (213) -5.4%
662044 - METER INVENTORY 69,429 3,997 - - -
662046 - HYDRANT INVENTORY 3,764 (173) - - -
662047 - GARAGE INVENTORY 15,954 6,957 11,025 10,325 (700) -6.3%
66204701 - INVENTORY - UNLEADED GAS 101,285 48,611 121,550 102,850 (18,700) -15.4%
66204702 - INVENTORY - DIESEL 41,175 24,937 57,057 48,741 (8,316) -14.6%
66204703 - INVENTORY - TIRES 9,766 8,561 15,000 15,000 - 0.0%
66205 - CONSUMABLE SUPPLIES 770 - 3,400 3,400 - 0.0%
66206 - COMPUTER RELATED EQUIP 13,818 3,548 35,075 22,600 (12,475) -35.6%
Materials & Supplies Total 530,849 205,273 547,220 503,716 (43,504) -8.0%
Other Expense
6642 - EQUIPMENT RENT 2,780 631 3,000 3,500 500 16.7%
66609 - OTHER ADVERTISING 199 3,493 - - -
6675111 - INSTATE TRAINING/CONF 10,944 6,781 20,500 20,000 (500) -2.4%
6675112 - OUT OF STATE TRAINING/CON 3,603 9,850 9,100 9,600 500 5.5%
667513 - DUES 1,057 248 3,000 3,000 - 0.0%
667514 - PROFESSIONAL LICENSES 2,591 1,081 4,180 4,180 - 0.0%
667515 - PERIODICAL SUBSCRIPTIONS 500 - 800 800 - 0.0%
667516 - PERMITS 286 200 2,000 2,500 500 25.0%
667522 - POSTAGE - INTERNAL 138 29 400 400 - 0.0%
667523 - POSTAGE - EXPRESS DELIVER 1,416 689 1,500 1,300 (200) -13.3%
667531 - PRINTING COSTS - 53 - - -
667552 - SAFETY TRAINING 1,577 - 750 750 - 0.0%
667555 - SAFETY EXPENSES 275 4,795 3,000 3,500 500 16.7%
667556 - FREIGHT CHARGES (STOCK) 38 - 8,000 5,000 (3,000) -37.5%
667592 - FOOD SUPPLIES - - 50 50 - 0.0%
667599 - OTHER MISCELLANEOUS 2,936 1,339 550 550 - 0.0%
6676 - EXPENSE OFFSET (162,053) (84,288) (167,100) (167,500) (400) 0.2%
Other Expense Total (133,714) (55,100) (110,270) (112,370) (2,100) 1.9%

223 Departmental Expenses – Engineering Services
. 2018
Actual
2019
Jan-Jun
2019
Budget
2020
Budget
Budget
Diff $
Budget
Diff %
Purchased Power
66153 - POWER - MEDIUM ENERGY $53,271 $23,537 $44,836 $46,562 $1,726 3.8%
66154 - POWER - MEDIUM T&D 26,700 11,090 21,562 27,945 6,383 29.6%
66155 - POWER - SMALL ENERGY 1,435 1,044 1,141 1,365 224 19.6%
66156 - POWER - SMALL T&D 1,422 1,007 1,211 1,404 193 15.9%
Purchased Power Total 82,829 36,677 68,750 77,276 8,526 12.4%
Tele/Other Utilties
66101 - WATER 10,299 4,615 12,000 5,000 (7,000) -58.3%
66102 - WASTEWATER - - - 7,500 7,500 n/a
66103 - STORMWATER CHARGES 13,358 7,982 13,866 13,890 24 0.2%
66111 - TELEPHONE LINES 20,567 12,161 20,792 20,792 - 0.0%
66112 - DATA LINES 23,109 14,943 24,410 27,476 3,066 12.6%
66113 - CELLULAR PHONES 8,138 6,181 7,380 6,840 (540) -7.3%
66114 - PAGERS 300 - 252 50 (202) -80.2%
Tele/Other Utilties Total 75,771 45,882 78,700 81,548 2,848 3.6%
Transportation
66501 - TRANSPORTATION - INTERNAL 29,124 15,750 41,570 32,605 (8,965) -21.6%
665019 - TRANS INTERNAL INACTIVE 67,500 33,870 52,149 56,004 3,855 7.4%
66502 - TRANSPORTATION - EXTERNAL 7,604 371 3,700 3,800 100 2.7%
66503 - MILEAGE REIMBURSEMENT 2,294 1,196 2,950 2,950 - 0.0%
Transportation Total 106,522 51,187 100,369 95,359 (5,010) -5.0%
Grand Total 4,069,826 1,979,386 4,356,957 4,259,770 (97,187) -2.2%

224 Departmental Expenses – Engineering Services
Engineering Services - Facilities Services (C1)
Financial Summary
. 2018
Actual
2019
Jan-Jun
2019
Budget
2020
Budget
Budget
Diff $
Budget
Diff %
Expense Type:
Salaries & Wages $525,030 $252,733 $537,524 $563,972 $26,448 4.9%
Employee Benefi ts 275,200 126,494 267,555 269,486 1,931 0.7%
Contracted Services 418,721 183,280 458,480 411,500 (46,980) -10.2%
Heat/Fuel Oi l 70,485 35,122 65,500 67,494 1,994 3.0%
Insurance 37,922 20,221 43,673 43,273 (400) -0.9%
Materia ls & Suppl ies 500,264 178,293 495,245 468,216 (27,029) -5.5%
Other Expense (15,014) (6,381) 3,750 1,650 (2,100) -56.0%
Purchased Power 82,829 36,677 68,750 77,276 8,526 12.4%
Tele/Other Uti l ties 66,172 39,437 67,508 67,198 (310) -0.5%
Transportation 60,403 28,749 60,191 56,036 (4,155) -6.9%
Grand Total 2,022,011 894,623 2,068,176 2,026,101 (42,075) -2.0%
Programs:
23 - Stockroom Operations 143,287 54,914 131,816 126,122 (5,694) -4.3%
24 - Dis tribution Operations 37,690 4,230 55,899 29,957 (25,942) -46.4%
30 - Maintenance 221,435 108,236 239,526 222,970 (16,556) -6.9%
55 - Prof Ops Support 87,485 43,815 80,965 91,700 10,735 13.3%
90 - Vehicles 575,531 264,220 656,670 653,499 (3,171) -0.5%
93 - Stockroom Scrap 49,837 43 250 - (250) -100.0%
95 - Douglass Street 709,591 321,676 704,732 704,845 113 0.0%
98 - Tra ining 52,841 23,659 41,481 47,139 5,658 13.6%
99 - Adminis tration 144,314 73,830 156,837 149,869 (6,968) -4.4%
Grand Total 2,022,011 894,623 2,068,176 2,026,101 (42,075) -2.0%
Funds:
10 - General 1,482,276 683,385 1,559,720 1,555,352 (4,368) -0.3%
20 - Water General 450,759 164,655 369,626 349,655 (19,971) -5.4%
30 - Water Standish 3,126 507 5,585 3,588 (1,997) -35.8%
51 - WW Cape El izabeth 17,985 7,273 25,860 26,207 347 1.3%
53 - WW Cumberland 6,800 2,355 8,904 9,235 331 3.7%
55 - WW Windham LF 838 275 721 838 117 16.2%
57 - WW Portland 31,241 21,869 67,076 48,379 (18,697) -27.9%
61 - WW Gorham 6,781 2,520 7,245 7,591 346 4.8%
62 - WW Westbrook 4,848 2,144 4,095 4,237 142 3.5%
64 - WW Joint Westbrook 13,790 7,862 10,693 13,944 3,251 30.4%
65 - WW Joint LF 1,837 700 3,256 1,535 (1,721) -52.9%
66 - WW Peaks Is land 1,730 1,077 5,395 5,540 145 2.7%
Grand Total 2,022,011 894,623 2,068,176 2,026,101 (42,075) -2.0%
Headcount:
Ful l -Time 10 10 10 10 0 0.0%
Part-Time 0 0 0 0 0 n/a
Total 10 10 10 10 0 0.0%

225 Departmental Expenses – Engineering Services
Engineering Services - Asset Engineering Services (E2)
Financial Summary
. 2018
Actual
2019
Jan-Jun
2019
Budget
2020
Budget
Budget
Diff $
Budget
Diff %
Expense Type:
Salaries & Wages $1,117,770 $612,934 $1,275,981 $1,303,344 $27,363 2.1%
Employee Benefi ts 594,718 313,856 646,592 628,871 (17,721) -2.7%
Contracted Services 27,816 2,691 71,850 23,438 (48,412) -67.4%
Deferred Cost W/O 52,428 5,050 10,100 - (10,100) -100.0%
Materia ls & Suppl ies 25,715 14,309 26,900 14,425 (12,475) -46.4%
Other Expense (120,022) (58,961) (124,570) (124,570) - 0.0%
Tele/Other Uti l ties 6,788 4,114 6,900 11,972 5,072 73.5%
Transportation 23,193 11,581 18,470 17,970 (500) -2.7%
Grand Total 1,728,405 905,573 1,932,223 1,875,450 (56,773) -2.9%
Programs:
57 - Means Coordination 405,423 219,719 391,011 396,833 5,822 1.5%
79 - Amap Services 392,117 220,717 546,719 518,268 (28,451) -5.2%
94 - Technology Teams 191,589 107,551 313,001 327,020 14,019 4.5%
98 - Tra ining 94,710 53,498 89,278 90,076 798 0.9%
99 - Adminis tration 644,566 304,088 592,214 543,253 (48,961) -8.3%
Grand Total 1,728,405 905,573 1,932,223 1,875,450 (56,773) -2.9%
Funds:
10 - General 798,383 418,720 904,844 874,032 (30,812) -3.4%
20 - Water General 702,852 344,169 762,529 750,583 (11,946) -1.6%
50 - Wastewater General 26,906 18,699 254,750 250,835 (3,915) -1.5%
51 - WW Cape El izabeth 29,009 16,844 - - -
53 - WW Cumberland 629 - - - -
55 - WW Windham LF 1,392 1,487 - - -
57 - WW Portland 73,165 68,658 - - -
61 - WW Gorham 373 279 - - -
62 - WW Westbrook 39,098 21,414 10,100 - (10,100) -100.0%
64 - WW Joint Westbrook 23,440 7,459 - - -
66 - WW Peaks Is land 33,158 7,844 - - -
Grand Total 1,728,405 905,573 1,932,223 1,875,450 (56,773) -2.9%
Headcount:
Ful l -Time 18 18 18 18 0 0.0%
Part-Time 0 0 0 0 0 n/a
Total 18 18 18 18 0 0.0%

226 Departmental Expenses – Engineering Services
Engineering Services - Instrumentation Services (E7)
Financial Summary . 2018
Actual
2019
Jan-Jun
2019
Budget
2020
Budget
Budget
Diff $
Budget
Diff %
Expense Type:
Salaries & Wages $166,270 $84,546 $179,138 $185,489 $6,351 3.5%
Employee Benefi ts 85,492 31,674 89,342 88,801 (541) -0.6%
Contracted Services 35,719 26,867 26,453 28,573 2,120 8.0%
Materia ls & Suppl ies 4,870 12,672 25,075 21,075 (4,000) -16.0%
Other Expense 1,322 10,242 10,550 10,550 - 0.0%
Tele/Other Uti l ties 2,811 2,331 4,292 2,378 (1,914) -44.6%
Transportation 22,927 10,857 21,708 21,353 (355) -1.6%
Grand Total 319,410 179,190 356,558 358,219 1,661 0.5%
Programs:
81 - Instrumentation & Control 183,784 84,541 223,281 218,065 (5,216) -2.3%
94 - Technology Teams 93 - 1,885 3,847 1,962 104.1%
98 - Tra ining 13,207 9,006 19,737 19,948 211 1.1%
99 - Adminis tration 122,326 85,643 111,655 116,359 4,704 4.2%
Grand Total 319,410 179,190 356,558 358,219 1,661 0.5%
Funds:
10 - General 135,626 94,649 133,277 140,154 6,877 5.2%
20 - Water General 81,514 28,694 82,993 88,840 5,847 7.0%
50 - Wastewater General 16,310 7,183 73,787 77,035 3,248 4.4%
51 - WW Cape El izabeth 17,416 5,056 450 450 - 0.0%
53 - WW Cumberland 5,245 3,134 900 900 - 0.0%
57 - WW Portland 36,218 23,509 63,351 48,940 (14,411) -22.7%
61 - WW Gorham 5,381 2,266 450 450 - 0.0%
62 - WW Westbrook 4,488 3,490 450 450 - 0.0%
64 - WW Joint Westbrook 10,183 3,341 500 500 - 0.0%
65 - WW Joint LF 1,131 4,268 - - -
66 - WW Peaks Is land 5,898 3,601 400 500 100 25.0%
Grand Total 319,410 179,190 356,558 358,219 1,661 0.5%
Headcount:
Ful l -Time 3 3 3 3 0 0.0%
Part-Time 0 0 0 0 0 n/a
Total 3 3 3 3 0 0.0%

227 Departmental Expenses – Administrative Services
Administrative Services - Purpose Statement To provide support services to internal and external customers.
Core Services Administrative Services provides support services to internal and external customers by providing the following services:
External customer call center response and billing services (Customer Service Group- F1; green in the organization chart).
Computer system and related technology support and maintenance services (Information Services Group – G1; orange in the organization chart). In 2020, a new Business Intelligence & Reporting Analyst position is budgeted.
Financial transaction processing and information services (Financial Services Group – H1; blue in the organization chart).
Employee development, benefits and management services (Employee Services Group – I1; purple in the organization chart). In 2020, an additional Employee Consultant position is budgeted.
The District has an eight-person group (Executive Group – J1; black in the organization chart) that directs, oversees and provides administrative support for the District.
General Manager
Executive Director of Administration
Information Services Manager
Business System Analyst
Network Administrator (3)
I, II, III
BSA/GIS Analyst
Database Administrator
Customer Service Manager
Customer Service Coordinator (7)
Collections Coordinator
AMR Specialist
Control Center Operator (3)
Program Manager
Director of Financial Services
Admin Assistant Finance (3)
Financial Analyst (2)
General Accounting Assistant
Buyer / Purchasing
Corporate Counsel
Executive Administrative
Assistant
Employees Services Director
Safety and Training Consultant
Employee Services Consultant (2)
Public Relations Manager
Executive Director of AMAP
Project Manager
Business Intelligence & Reporting Analys)

228 Departmental Expenses – Administrative Services
Past Accomplishments and 2020 Projects and Initiatives
Customer Service
2019 Accomplishments: New Billing System: Customer Service personnel have been involved with implementing the
system from the start. We have dedicated 4 employees to the project – one full-time and three
part-time. Time and effort in supporting the project has been significant and will continue into
next year.
Rates: Changed and tested revised Portland Water District’s water rates and sewer rates for
Cape Elizabeth, Portland, South Portland, Falmouth and Cumberland.
Large meter review: Continued collaboration and focus with Water Ops in reviewing and
addressing any large meters with issues with monthly meetings. This has proven successful, as
the number of outstanding large meters issues has significantly decreased since the start of this
program.
Ongoing monthly refresher training for our Collection Coordinator backup. This included both
field and office training.
Electronic report transition: All CS reports are electronic. All department personnel have been
trained.
2020 Projects and Initiatives: Service Levels and rate changes: Continue focus on meeting both objectives while supporting
new billing system in 2020.
Contribute and support the efforts and progress of the new Asset Management system.
Develop an appropriate plan to transition customers to the billing system/bill while educating
them on other functions that will be available with the online Customer portal.
Update documentation and procedures for the new billing system (Cayenta) process, including
updating the Terms & Conditions as needed.
Work with the Public Relations Manager to promote our low-income programs.
Support the efforts and progress of the new billing system project.
Develop a transition plan for Meter Reader retirement (expected April of 2020.)
Review current collection processes to improve efficiencies with the new Cayenta system.
Participate in New England Water Works’ Customer Service Committee efforts to develop
customer service related training.

229 Departmental Expenses – Administrative Services
Customer Service (continued)
CS Department Key Statistics:
Key Statistic 2016
Actual 2017
Actual 2018
Actual 2019
Actual 2020 Goal
Customers 54,700 55,100 55,500 55,900 56,300
Phone Calls answered within 1 min 88% 86% 93% 90% 82%
Customer Satisfaction 97% 98% 97% 98% 95%
Actual vs Estimated reads 99.63% 99.67% 99.58% 100% 99%
Accurate bill Index 99.96% 99.97% 99.96% 100% 99%
Customer Contacts 54,753 48,971 56,565 59,383 60,000
Bills produced 647,429 652,974 659,174 660,000 664,000
Customer Service – Customer Contacts Customer Services handles over 56,000 customer contacts a year via phone, email and in person. With the billing system implementation scheduled for 2020, we anticipate higher contact levels.

230 Departmental Expenses – Administrative Services
Past Accomplishments and 2020 Projects and Initiatives (continued)
Information Services
2019 Accomplishments System upgrades:
Upgrades of internal Wi-Fi networks to support new asset/work management system.
Continued migration to virtual servers has resulted in increased in network speed and reliability.
Support of the eFinanace Plus upgrade.
Completion of SharePoint 2010 to SharePoint 2016 upgrade.
Support of CRM / Billing replacement project.
Support of Asset, Work Management replacement project.
Call recording software update.
Roll out of Remote Desktop Services.
Upgrades of Wide Area Network data links Process Improvements:
Employee Contact List implemented. Gives employees the ability to update their contact information vs. prior paper based process.
Refined employee call in procedure.
Developed a text alert notification system for employees.
Refined Wide Area Network monitoring process.
Refined network server backups. System Security
Security Awareness Training – End-user Cyber Security training conducted throughout the year to raise awareness related to the topic.
New security software installed to increase our security posture.
Network Security Audit conducted.
Continued build out of cold site - As a backup to our data center at Douglass Street, we continued to build out our cold site at our Sebago Lake Treatment Plant. Tested twice in 2019.
Additional firewalls added to increase security posture.
Staff member attended 4-day Department of Homeland Security Cyber Security Training event.
2020 Projects and Initiatives System upgrades:
Upgrade of Microsoft Exchange email server.
Provide support of CRM / Billing replacement project.
Provide support of Asset, Work Management replacement project.
Continued expansion of Wi-Fi networks to support new Asset, Work Management system.
Continued migration of physical servers to virtual servers.
Hach WIMS upgrade.
Replacement of several data servers as part of annual server refresh program.

231 Departmental Expenses – Administrative Services
Information Services
2020 Projects and Initiatives (continued) Process Improvements:
Develop additional digital workflows to replace paper-based processes.
Implement additional system monitoring.
Conference room upgrades.
System Security
Security Awareness Training – Continue End-user Cyber Security training throughout the year to raise awareness related to the topic.
Network Security Audit – Admin Network
Continued build out of cold site - As a backup to our data center at Douglass Street, we will continue to build out our cold site at our Sebago Lake Treatment Plant.
Training
PWD IS Department Overview sessions – We will be conducting several sessions for employees to understand what the Information Services does on a daily basis
Continued Information Services inter-departmental cross training.
Technical training for Information Services staff.
IS Department Key Statistics:
Devices Maintained
Device Type 2018 2019 2020
Servers 20 15 20
Virtual Servers 50 60 75
Laptops 55 58 59
CPU 25 25 27
Thin Clients 130 140 145
Firewall 7 8 13
Switches 25 25 30
Routers 5 7 10
Phone Switches 11 11 12
Desk Phones 168 170 180
Smart Phones 20 20 21
Printers/Scanner 26 26 26
Copiers 9 9 9
iPads 21 21 21
Total 572 595 648
Major Applications
AutoCAD
Callrex Call Recording
Cayenta CRM
Citrix Presentation Server
eFinance Plus
ESRI GIS
Hach WIMS
Hansen Assent Management /Customer Billing
IBM Cognos Reports
Lucity CMMS
Microsoft Exchange
Microsoft Office 2016
Microsoft Power BI
Microsoft Remote Desktop Services
Microsoft Sharepoint 2016
Microsoft Windows Server
Mitel IP Phone System
Oracle Database (3)
SAP Crystal Reports
Scale Computing
SQL Databases (4)
VMware

232 Departmental Expenses – Administrative Services
Past Accomplishments and 2020 Projects and Initiatives (continued)
Financial Services
2019 Accomplishments
Received Government Finance Officers Association’s “Certificate of Achievement for Excellence in Financial Reporting” for the 2017 Comprehensive Annual Financial Report (CAFR) and the “Distinguished Budget Presentation Award” for the 2019 Comprehensive Budget Report for the ninth year in a row.
Completed the upgrade of the Finance Plus accounting system moving from version 4.3 to version 5.1 of the software. This included a requisition approval process via the vendor’s “work flow” product and an enhanced Employee Access Center (EAC).
Cross-trained new staff members on the different responsibilities of the department as previous staff turnover shifted responsibilities throughout the department.
2020 Projects and Initiatives
Support the Asset and Billing projects so that we can continue to pull billing, payroll, transportation and inventory data into the financial system.
Continue to upgrade financial information provided to the Board of Trustees and management through more visual/graphical presentations of financial data.
Review and update department procedures for the newly updated financial system and in concert with the Asset and Billing projects.
Continue efforts on employee training with a particular focus learning about other areas within the District.

233 Departmental Expenses – Administrative Services
Past Accomplishments and 2020 Projects and Initiatives (continued)
Employee Services
2019 Accomplishments and 2020 Projects Student Outreach Program: With retirements across all industries on the rise, we began a student outreach program at PWD and joined the NEWWA Waterworks Committee. Since last fall, the NEWWA Committee has been collecting data, developing a survey, and working toward engaging local educators to develop some collaboration in our industry to address emerging labor shortages. At PWD, we have contacted high schools, including vocational technical schools, in an effort to raise awareness of careers in Water and Wastewater. We have hosted high school students to job shadow, visit the District for a presentation and tour, and attended high school job fairs. As part of our overall recruitment efforts, we have utilized the District’s new videos and linked career pamphlets to our open positions.
Employee Assistance Program: A more robust and comprehensive Employee Assistance Program (EAP) was introduced to PWD through Anthem in 2018, and we continue to draw on these resources and see an increase in confidential services. Representatives have come to the District and provided presentations on Work/Life Balance for all employees and two presentations to assist supervisors and managers at our supervisory workshops. Compensation: A Request for Proposals was completed to provide a salary market survey for non-union positions. Career Management Associates has been selected and we are in the process of updating all non-union job descriptions for this purpose, and will begin the process this fall. Retirement Planning:
Representatives from the Principal, our carrier for the 457 Plan, provided both group and individual retirement planning counseling sessions.
Presentations were provided on the topics of understanding Medicare and Social Security. Worker’s Compensation: The District’s mod rate dropped for three years in a row to the lowest level in over a decade in 2018. Effective January 1, 2016 it dropped to 0.84, saving approximately $60,000 annually in premiums. Effective January 1, 2017 it dropped to 0.73, resulting in approximately another $10,000 in annual premium reductions. Effective January 1, 2018, the mod rate again dropped to 0.68, saving approximately $4,000 more in annual premiums. However, due to a few high cost workplace injuries, all of which are fully resolved, our mod rate increased to 0.95 effective January 1, 2019. This resulted in an increase of $45,000 in annual premiums. The 2020 mod rate is expected to decline to 0.87. We will continue to vigilantly monitor workplace injuries, investigate all accidents and examine the situations associated with these claims. The following is a recent history of the worker’s compensation experience mod rates for PWD:
1.08 1.16 1.06 1.06 1.09 0.99 1.09 0.99 1.06 1.15 1.160.84 0.73 0.68
0.95 0.87
0
1
2
2005 2006 2007 2008 2009 2010 2011 2012 2013 2014 2015 2016 2017 2018 2019 2020
Mod Rate

234 Departmental Expenses – Administrative Services
Past Accomplishments and 2020 Projects and Initiatives (continued)
Employee Services (continued)
2019 Accomplishments and 2020 Projects (continued) Health Plan: We received a reduction of 2% for the health renewal effective 1/1/20, with no change in our plan design. All employees will pay 9% toward single health insurance coverage in 2020. It should be noted that even with this increase to 9% for both union and non-union employees, the cost of single coverage for all of our benefits eligible employees is still significantly lower than the national average of 17%. Updating Policies: For the purpose of reflecting the workplace that we are and desire to be, we continue to examine our policies as a strategy to retain valued employees and attract qualified candidates to PWD. This is an interdepartmental process to streamline, consolidate, update, and segregate procedures from policies. Union:
Union negotiations for the new three-year contract began in September 2018, and by February 2019, the District sought a mediator to make progress toward a new contract. As of September 2019, we have a new three-year contract.
The Union stewards had their last monthly meeting with the General Manager and the Director of Employee Services in February. Due to the negotiation process underway, we were limited to discussing only day-to-day operations. At that meeting, we discussed the stipends, pension plans, policies, the smoking cessation program offered through the Employee Assistance Program, and the new winter jackets available to employees through the Fall Field Uniform Program. The group has adjourned until after the new contract is in place.
Arbitrations: The last arbitration was in September 2017, when we arbitrated the interpretation of the contract pertaining to pay upgrades and received a favorable decision. Since then, there have been no further arbitrations, nor any grievances pending arbitration.
Safety:
We are utilizing the services of a CDL driving school for ongoing support for CDL drivers.
As needs are identified, Fall Protection is installed in some facilities; new PS200 Gas Detectors purchased and installed in operations; powered air purifying respirators (PAPR) have been purchased. (These are used when working when upgrading/painting of old lead pipes and bulk chemical receiving. Other Personal Protective Equipment (PPE) updated and in stock include vented construction helmets (for heat stress), muck boots (field workers), lineman gloves for electricians.
The following safety audits/drills were completed: o Portland Fire Department conducted a Tier II Chemical Inspection at the East End Treatment
Plant o Maine Municipal Association (MMA) will conduct a safety inspection at Sebago Lake Water
Treatment Facility. An internal inspection took place earlier this year. o A Fire Evacuation drill is scheduled for Douglass Street in September.
2019 SAFETY REQUIRED TRAINING - PWD
Topic # Employees Completed Confined Space 10 May 2019 ( Nov 2019) Chemical Hygiene & Ethics 12 May 2019 VDT On-Line 97 Month of March/April Fleet Driver Safety 80 Nov- Dec-Clark Insurance Respiratory Pro./Fit Testing 46 July 2019 (August 2019) Fire Extinguishers/New Hire Practical 78 June 2019 (November 2019) Gas Detectors 22 April/ongoing Bloodborne Pathogens 90 February 2019

235 Departmental Expenses – Administrative Services
Past Accomplishments and 2019 Projects and Initiatives (continued)
Employee Services (continued)
2019 Accomplishments and 2020 Projects Expanded Wellness initiatives: In the fall of 2019, we held a flu shot clinic, and expanded the offerings at the wellness and safety fair. In addition to the health screenings, we included information from the Poison Control Center, such as childhood lead poisoning prevention, smoking cessation, fire safety, cancer awareness and education and a dietitian from Hannaford. Supervisory Workshops: Quarterly roundtable discussions continue. In April, 2019 and again in August, a representative from our Employee Assistance Program provided presentations on Motivating, Recognizing and Energizing Employees, and Stress Management for Managers. The group has also discussed the General Manager’s Goals, ABC/CMMS updates, union negotiation/mediation updates, upgrade pay and changes to the Fall Field Uniform Program to include the addition of the choice of two winter coats, and a program allowing unused credit from the Spring T Shirt program to defray the cost. Policies: The review and revision of policies continues. Retirement Planning: Group educational and individual counseling sessions continue to be provided to assist employees to better understand their investment and payout options under the 457 Deferred Compensation Plan and how to prepare for retirement. Safety: Safety Training for 2020 is scheduled to include:
Chemical Hygiene and Ethics Confined Space Respiratory/Fit Protection Fire Extinguishers Safety Data Sheet Review VDT Training First Aid/CPR/AED recertification (2 Year cycle) Bloodborne Pathogens Walking/Working Surfaces/Fall Protection Annual Evacuation Drills/Emergency Action Plans
Supplemental Training for Specific Departments
Dig Safe Trenching and Excavations Work Zone and Traffic Safety Lock Out Tag Out Refresher

236 Departmental Expenses – Administrative Services
Financial Overview The Administrative Services budget request is $6,064,147, which is $242,690 or 4.2% higher than last year. The number of employees in the area is 44, an increase of 1 in each of Information and Employee Services area.
Information Service (G1) Group ($1,155,624 request; $117,328 or 11.3% higher)
Salaries/Wages and Benefits: Increased by $113,109, or 14.8%. A new Business Intelligence & Reporting Analyst included in budget. Assumed 3% wage increase and reflects the lower benefits budget.
Telephone/Other Utilities: Decreased by $4,272, or 56.7%. An audit of telecommunication services resulted in lower cell and data line costs.
Financial Services (H1) Group ($924,918 request; $16,978 or 1.9% higher)
Salaries/Wages and Benefits: Increased by $13,706, or 2.1%. No changes in the number of employees. Assumed 3% wage increase and reflects the lower benefits budget.
Contracted Services: Increased by $3,575, or 1.5%, due to increase in new audit contract ($2,000), higher payment process costs ($4,400) partially offset by lower maintenance cost of new finance system software ($3,100).
Employee Service (I1) Group ($588,665 request; $100,967 or 20.7% higher)
Salaries/Wages and Benefits: Increased by $83,031, or 23.6%. An additional ES Consultant was included in the budget. Assumed 3% wage increase and reflects the lower benefits budget.
Contracted Services: Increased by $17,000, or 15.3%, due to hiring a new HR Consultant offset by lower amount for legal expenses.
Executive (J1) Group ($1,770,568 request; $24,748 or 1.4% higher)
Salaries/Wages and Benefits: Increased by $42,412, or 3.2%. The Public Relations Manager is planned to move to full time from a 35 hours per week. Assumed 3% wage increase and reflects the lower benefits budget.
Contracted Services: Decreased by $13,250, or 14%. Less legal expense expected to be spent on legislative issues.
Customer Service (F1) Group ($1,624,372 request; $17,331 or 1.1% lower)
Salaries/Wages and Benefits: Increased by $30,842, or 2.7%. No changes in the number of employees except for a summer-time temporary to support the department during the billing system upgrade. Assumed 3% wage increase and reflects the lower benefits budget.
Contracted Services: Decreased by $71,084, or 26.5%. The new computer system maintenance contract impacts the budget in the fourth quarter 2020 rather than full year. In addition, Digsafe assessment is $8,000 lower than prior year budget.
Other Expenses increased by $22,611 or 10.2% . The new billing system implementation will reduce the number of customer initially signed up for paperless bills, which will cause an increase in postage costs.

237 Departmental Expenses – Administrative Services
Administrative Services - Total
Financial Summary:
.
2018
Actual
2019
Jan-Jun
2019
Budget
2020
Budget
Budget
Diff $
Budget
Diff %
Sub-Group:
F1 - Customer Service $1,478,134 $682,705 $1,641,703 $1,624,372 -$17,331 -1.1%
G1 - Information Services $1,089,207 $562,589 $1,038,296 $1,155,624 $117,328 11.3%
H1 - Financia l Services $896,653 $433,734 $907,940 $924,918 $16,978 1.9%
I1 - Employee Services $479,376 $225,499 $487,698 $588,665 $100,967 20.7%
J1 - BOT & Senior Management $1,528,304 $732,260 $1,745,820 $1,770,568 $24,748 1.4%
Grand Total 5,471,674 2,636,787 5,821,457 6,064,147 242,690 4.2%
Expense Type:
Salaries & Wages $2,637,329 $1,315,493 $2,787,510 $3,018,140 $230,630 8.3%
Employee Benefi ts 1,394,569 663,003 1,398,392 1,450,862 52,470 3.8%
Contracted Services 816,702 386,928 944,604 889,436 -55,168 -5.8%
Insurance 86,348 42,828 89,355 95,724 6,369 7.1%
Materia ls & Suppl ies 67,910 26,447 51,230 55,191 3,961 7.7%
Other Expense 416,284 172,342 507,098 520,568 13,470 2.7%
Tele/Other Uti l ties 32,429 20,351 24,836 15,348 -9,488 -38.2%
Transportation 20,104 9,395 18,432 18,878 446 2.4%
Grand Total 5,471,674 2,636,787 5,821,457 6,064,147 242,690 4.2%
Headcount:
Full Time 41 41 41 44 3 7.3%
Part Time 1 1 1 0 -1 -100.0%
Total 42 42 42 44 2 4.8%

238 Departmental Expenses – Administrative Services
. 2018
Actual
2019
Jan-Jun
2019
Budget
2020
Budget
Budget
Diff $
Budget
Diff %
Salaries & Wages
660111 - SALARIES/WAGES NON-UNION $1,888,451 $969,193 $2,030,700 $2,230,807 $200,107 9.9%
660112 - WAGES/OVERTIME NON-UNION 212 317 - - -
660121 - WAGES/REGULAR UNION 678,892 327,666 705,703 730,497 24,794 3.5%
660122 - WAGES/OVERTIME UNION 6,658 3,365 23,107 23,116 9 0.0%
660131 - WAGES - REGULAR - TEMPS 5,359 2,128 - 6,720 6,720 n/a
660136 - CONTRACTED - TEMP - - 1,000 - (1,000) -100.0%
66014 - VACATION ACCRUAL 30,092 - - - -
660141 - TRUSTEES COMPENSATION 21,650 12,825 27,000 27,000 - 0.0%
66015 - SICKTIME ACCRUAL 6,016 - - - -
Salaries & Wages Total 2,637,329 1,315,493 2,787,510 3,018,140 230,630 8.3%
Employee Benefits
660401 - FICA - EMPLOYERS' SHARE 197,168 100,223 213,170 230,891 17,721 8.3%
660405 - SAFETY/WHY PROGRAM ITEMS 5,407 1,272 5,940 6,140 200 3.4%
660411 - MEALS ALLOWANCE 10 - 80 100 20 25.0%
660413 - PWD TRAINING PROGRAM 25 - - - -
660418 - STIPENDS 300 300 200 200 - 0.0%
660419 - EMPLOYEE BENEFTS-MISC OTH 15,204 1,317 6,180 7,080 900 14.6%
660491 - FRINGE BENEFITS-REG/SAL 1,176,455 559,890 1,172,822 1,206,451 33,629 2.9%
Employee Benefits Total 1,394,569 663,003 1,398,392 1,450,862 52,470 3.8%
Contracted Services
662063 - COPIER MAINTENANCE/TONER 14,054 8,671 13,000 15,000 2,000 15.4%
6632 - ACCOUNTING SERVICES 35,000 35,500 35,500 37,500 2,000 5.6%
66331 - LEGAL - LABOR RELATIONS 86,236 33,103 85,000 65,000 (20,000) -23.5%
66333 - BOND COUNSEL 7,500 - 7,500 7,500 - 0.0%
66339 - LEGAL - OTHER 13,427 5,347 34,500 19,500 (15,000) -43.5%
663545 - RADIO SERVICING AND EQUIP 12,266 1,148 3,500 4,000 500 14.3%
663561 - COMPUTER LICENSES 1,076 119 4,500 2,500 (2,000) -44.4%
663562 - COMPUTER MAINTENANCE 280,959 121,531 342,350 276,418 (65,932) -19.3%
663563 - COMPUTER CONSULTING/OTHER 18,439 34,118 20,000 25,000 5,000 25.0%
6635801 - EMPLOYEE HEALTH SERVICES 8,473 4,413 10,000 10,000 - 0.0%
663581 - UTILITY BILLING PRINTING 71,658 33,384 81,094 83,933 2,839 3.5%
663582 - PAYMENT PROCESSING 150,134 64,301 150,215 154,630 4,415 2.9%
663583 - RECEIVABLE COLLECTIONS 9,270 3,654 10,000 10,000 - 0.0%
663584 - BANK SERVICE CHARGES 22,105 12,443 22,800 26,400 3,600 15.8%
663587 - COURIER SERVICES 4,441 2,277 4,740 4,900 160 3.4%
663588 - EQUIPMENT MAINTENANCE - - 1,500 1,500 - 0.0%
663592 - RECRUITING SERVICES 2,252 2,620 7,000 7,000 - 0.0%
663594 - DIGSAFE 56,328 19,006 71,000 63,000 (8,000) -11.3%
663595 - OUTPLACEMENT SERVICES - - 1,000 1,000 - 0.0%
663598 - HR CONSULTANT SERVICES 1,900 350 8,000 45,000 37,000 462.5%
6635984 - LANGUAGE INTERPRETATION 32 51 355 355 - 0.0%
663599 - MISC OTHER SERVICES 21,153 4,892 31,050 29,300 (1,750) -5.6%
Contracted Services Total 816,702 386,928 944,604 889,436 (55,168) -5.8%
Insurance
6657 - GEN LIABILITY INSURANCE 52,252 27,983 55,966 59,884 3,918 7.0%
66592 - DAMAGES & CLAIMS-GOODWILL 5,333 200 4,000 4,500 500 12.5%
66593 - UMBRELLA INSURANCE COVER 3,176 1,684 3,362 3,604 242 7.2%
66594 - PROFESSION/CRIME BONDING 25,587 12,961 26,027 27,736 1,709 6.6%
Insurance Total 86,348 42,828 89,355 95,724 6,369 7.1%

239 Departmental Expenses – Administrative Services
. 2018
Actual
2019
Jan-Jun
2019
Budget
2020
Budget
Budget
Diff $
Budget
Diff %
Materials & Supplies
6619 - ASSET PURCHASES 424 1,558 5,000 4,500 (500) -10.0%
66202 - TOOLS 65 263 300 300 - 0.0%
66203 - VENDOR PURCHASED SUPPLIES 2,998 1,900 3,100 3,300 200 6.5%
662041 - MATERIALS INVENTORY 210 - - - -
662042 - SUPPLIES INVENTORY 2,680 1,166 2,400 2,550 150 6.3%
662043 - TOOL INVENTORY 5,534 960 2,650 1,700 (950) -35.8%
66204301 - INVENTORY - TONER 947 537 1,000 500 (500) -50.0%
66204302 - INVENTORY - PAPER 3,063 1,928 2,000 4,000 2,000 100.0%
66204303 - INVENTORY-COMPUTER EQUIP 8,894 1,558 7,140 9,026 1,886 26.4%
662047 - GARAGE INVENTORY 29 20 - - -
66205 - CONSUMABLE SUPPLIES 2,017 302 2,700 2,750 50 1.9%
66206 - COMPUTER RELATED EQUIP 41,049 16,256 24,940 26,565 1,625 6.5%
Materials & Supplies Total 67,910 26,447 51,230 55,191 3,961 7.7%
Other Expense
6642 - EQUIPMENT RENT 2,892 1,446 2,900 3,000 100 3.4%
66601 - PUBLIC RELATIONS 2,444 2,057 5,250 5,250 - 0.0%
66609 - OTHER ADVERTISING 13,354 2,750 6,500 7,100 600 9.2%
6675111 - INSTATE TRAINING/CONF 11,489 5,609 23,500 21,500 (2,000) -8.5%
6675112 - OUT OF STATE TRAINING/CON 27,176 9,924 20,500 20,500 - 0.0%
667513 - DUES 51,114 3,725 53,015 54,165 1,150 2.2%
667514 - PROFESSIONAL LICENSES 465 265 900 900 - 0.0%
667515 - PERIODICAL SUBSCRIPTIONS 4,587 2,812 6,675 7,735 1,060 15.9%
667521 - POSTAGE - THIRD PARTY 201,028 98,459 221,027 242,438 21,411 9.7%
667522 - POSTAGE - INTERNAL 12,982 7,293 15,191 15,391 200 1.3%
667523 - POSTAGE - EXPRESS DELIVER 337 - 400 400 - 0.0%
667531 - PRINTING COSTS 27,058 21,157 34,850 34,600 (250) -0.7%
667532 - PHOTOCOPYING COSTS (111) (133) - - -
667533 - FORMS STOCK - - 925 925 - 0.0%
667552 - SAFETY TRAINING 242 - 3,000 4,200 1,200 40.0%
667553 - DOT SUBSTANCE ABUSE 1,362 1,271 2,000 2,000 - 0.0%
667555 - SAFETY EXPENSES 14,327 3,558 5,000 5,200 200 4.0%
667592 - FOOD SUPPLIES 2,475 1,124 3,700 3,700 - 0.0%
667593 - VENDOR INTEREST CHARGES - (4,372) - - -
667598 - GEN MANAGER CONTINGENCY - - 61,500 50,000 (11,500) -18.7%
6675981 - GEN MNG - TRUSTEES 8,338 6,631 11,550 12,750 1,200 10.4%
6675982 - GEN MNG - COMMUNITY 29,721 7,342 27,215 27,215 - 0.0%
667599 - OTHER MISCELLANEOUS 5,003 1,425 1,500 1,599 99 6.6%
Other Expense Total 416,284 172,342 507,098 520,568 13,470 2.7%
Tele/Other Utilties
66111 - TELEPHONE LINES - 18 - - -
66112 - DATA LINES 18,560 9,145 14,760 7,392 (7,368) -49.9%
66113 - CELLULAR PHONES 13,790 11,189 9,980 7,860 (2,120) -21.2%
66114 - PAGERS 78 - 96 96 - 0.0%
Tele/Other Utilties Total 32,429 20,351 24,836 15,348 (9,488) -38.2%
Transportation
66501 - TRANSPORTATION - INTERNAL 10,266 5,460 9,170 9,094 (76) -0.8%
665019 - TRANS INTERNAL INACTIVE 5,644 2,072 5,547 5,309 (238) -4.3%
66502 - TRANSPORTATION - EXTERNAL 1,002 442 850 850 - 0.0%
66503 - MILEAGE REIMBURSEMENT 3,175 1,421 2,865 3,625 760 26.5%
66504 - MTA TRANS-PASS TOLL FEES 16 - - - -
Transportation Total 20,104 9,395 18,432 18,878 446 2.4%
Grand Total 5,471,674 2,636,787 5,821,457 6,064,147 242,690 4.2%

240 Departmental Expenses – Administrative Services
Administrative Services: Customer Services (F1)
Financial Summary:
. 2018
Actual
2019
Jan-Jun
2019
Budget
2020
Budget
Budget
Diff $
Budget
Diff %
Expense Type:
Salaries & Wages $721,666 $346,917 $748,695 $781,913 $33,218 4.4%
Employee Benefi ts 381,556 174,690 373,509 371,133 (2,376) -0.6%
Contracted Services 151,337 56,546 267,949 196,865 (71,084) -26.5%
Materia ls & Suppl ies 7,809 3,612 11,965 13,203 1,238 10.3%
Other Expense 197,315 91,434 221,768 244,379 22,611 10.2%
Tele/Other Uti l ties 2,267 1,836 2,100 1,476 (624) -29.7%
Transportation 16,184 7,671 15,717 15,403 (314) -2.0%
Grand Total 1,478,134 682,705 1,641,703 1,624,372 (17,331) -1.1%
Programs:
74 - Control Center 177,904 78,849 186,011 180,534 (5,477) -2.9%
76 - Col lection 57,106 28,472 60,054 58,197 (1,857) -3.1%
77 - Bi l l ing 265,250 122,943 402,858 344,019 (58,839) -14.6%
80 - Meter Reading 74,426 35,652 79,634 79,850 216 0.3%
98 - Tra ining 92,154 13,030 58,810 163,971 105,161 178.8%
99 - Adminis tration 811,293 403,760 854,336 797,801 (56,535) -6.6%
Grand Total 1,478,134 682,705 1,641,703 1,624,372 (17,331) -1.1%
Funds:
10 - General 1,420,625 654,233 1,581,649 1,566,175 (15,474) -1.0%
20 - Water General 37,136 18,371 37,368 19,343 (18,025) -48.2%
30 - Water Standish 1,975 751 1,769 1,958 189 10.7%
51 - WW Cape El izabeth 1,251 666 1,218 2,534 1,316 108.0%
53 - WW Cumberland 518 206 415 1,056 641 154.5%
54 - WW Falmouth 729 357 595 1,488 893 150.1%
57 - WW Portland 7,874 4,159 10,197 15,634 5,437 53.3%
59 - WW South Portland 3,569 2,094 4,079 7,117 3,038 74.5%
61 - WW Gorham 1,364 429 1,091 2,727 1,636 150.0%
62 - WW Westbrook 3,092 1,439 3,322 6,340 3,018 90.8%
Grand Total 1,478,134 682,705 1,641,703 1,624,372 (17,331) -1.1%
Headcount:
Salaries & Wages
48%Employee Benefits
23%
Contracted Services
12%
Materials & Supplies
1%
Other Expense
15%
Tele/Other Utilties
0%Transportation
1%

241 Departmental Expenses – Administrative Services
Administrative Services: Information Services (G1)
Financial Summary:
. 2018
Actual
2019
Jan-Jun
2019
Budget
2020
Budget
Budget
Diff $
Budget
Diff %
Expense Type:
Salaries & Wages $496,319 $252,645 $506,043 $589,494 $83,451 16.5%
Employee Benefi ts 262,834 129,490 256,342 286,000 29,658 11.6%
Contracted Services 265,858 154,651 232,250 240,841 8,591 3.7%
Materia ls & Suppl ies 46,593 15,495 26,000 29,300 3,300 12.7%
Other Expense 1,114 2,575 9,125 5,225 (3,900) -42.7%
Tele/Other Uti l ties 14,975 7,042 7,536 3,264 (4,272) -56.7%
Transportation 1,514 691 1,000 1,500 500 50.0%
Grand Total 1,089,207 562,589 1,038,296 1,155,624 117,328 11.3%
Programs:
98 - Tra ining 82,666 19,358 36,294 37,147 853 2.4%
99 - Adminis tration 1,006,541 543,231 1,002,002 1,118,477 116,475 11.6%
Grand Total 1,089,207 562,589 1,038,296 1,155,624 117,328 11.3%
Funds:
10 - General 1,089,207 562,589 1,038,296 1,155,624 117,328 11.3%
Grand Total 1,089,207 562,589 1,038,296 1,155,624 117,328 11.3%
Headcount:
Ful l -Time 7 7 7 8 1 12.5%
Part-Time 0 0 0 0 0 n/a
Total 7 7 7 8 1 12.5%
Salaries & Wages
51%
Employee Benefits
25%
Contracted Services
21%
Materials & Supplies
2%
Other Expense
1%

242 Departmental Expenses – Administrative Services
Administrative Services: Financial Services (H1)
Financial Summary:
. 2018
Actual
2019
Jan-Jun
2019
Budget
2020
Budget
Budget
Diff $
Budget
Diff %
Expense Type:
Salaries & Wages $419,892 $211,742 $431,142 $446,232 $15,090 3.5%
Employee Benefi ts 221,443 106,824 218,483 217,099 (1,384) -0.6%
Contracted Services 236,953 113,013 239,755 243,330 3,575 1.5%
Materia ls & Suppl ies 7,548 2,120 4,440 4,988 548 12.3%
Other Expense 10,758 18 13,845 12,994 (851) -6.1%
Transportation 59 17 275 275 - 0.0%
Grand Total 896,653 433,734 907,940 924,918 16,978 1.9%
Programs:
77 - Bi l l ing 171,726 64,301 186,132 181,928 (4,204) -2.3%
98 - Tra ining 20,428 5,368 27,352 27,904 552 2.0%
99 - Adminis tration 704,499 364,064 694,456 715,086 20,630 3.0%
Grand Total 896,653 433,734 907,940 924,918 16,978 1.9%
Funds:
10 - General 818,726 394,284 828,479 843,827 15,348 1.9%
20 - Water General 77,927 39,450 79,461 81,091 1,630 2.1%
Grand Total 896,653 433,734 907,940 924,918 16,978 1.9%
Headcount:
Ful l -Time 8 8 8 8 0 0.0%
Part-Time 0 0 0 0 0 n/a
Total 8 8 8 8 0 0.0%
Salaries & Wages
48%Employee Benefits
24%
Contracted Services
26%
Materials & Supplies
1%
Other Expense
1%

243 Departmental Expenses – Administrative Services
Administrative Services: Employee Services (I1)
Financial Summary:
. 2018
Actual
2019
Jan-Jun
2019
Budget
2020
Budget
Budget
Diff $
Budget
Diff %
Expense Type:
Salaries & Wages $228,514 $114,753 $232,837 $291,642 $58,805 25.3%
Employee Benefi ts 123,936 59,430 119,001 143,227 24,226 20.4%
Contracted Services 98,906 40,036 111,000 128,000 17,000 15.3%
Materia ls & Suppl ies 1,188 856 3,500 3,200 (300) -8.6%
Other Expense 23,662 8,883 18,500 19,900 1,400 7.6%
Tele/Other Uti l ties 2,658 1,395 2,360 2,196 (164) -6.9%
Transportation 513 144 500 500 - 0.0%
Grand Total 479,376 225,499 487,698 588,665 100,967 20.7%
Programs:
98 - Tra ining 15,677 11,510 17,321 21,481 4,160 24.0%
99 - Adminis tration 463,699 213,989 470,377 567,184 96,807 20.6%
Grand Total 479,376 225,499 487,698 588,665 100,967 20.7%
Funds:
10 - General 479,376 225,499 487,698 588,665 100,967 20.7%
Grand Total 479,376 225,499 487,698 588,665 100,967 20.7%
Headcount:
Ful l -Time 3 3 3 4 1 25.0%
Part-Time 0 0 0 0 0 n/a
Total 3 3 3 4 1 25.0%
Salaries & Wages
49%Employee Benefits
24%
Contracted Services
22%
Materials & Supplies
1%
Other Expense
4%

244 Departmental Expenses – Administrative Services
Administrative Services: Executive (J1)
Financial Summary:
. 2018
Actual
2019
Jan-Jun
2019
Budget
2020
Budget
Budget
Diff $
Budget
Diff %
Expense Type:
Salaries & Wages $770,938 $389,437 $868,793 $908,859 $40,066 4.6%
Employee Benefi ts 404,801 192,569 431,057 433,403 2,346 0.5%
Contracted Services 63,647 22,681 93,650 80,400 (13,250) -14.1%
Insurance 86,348 42,828 89,355 95,724 6,369 7.1%
Materia ls & Suppl ies 4,772 4,364 5,325 4,500 (825) -15.5%
Other Expense 183,435 69,432 243,860 238,070 (5,790) -2.4%
Tele/Other Uti l ties 12,529 10,078 12,840 8,412 (4,428) -34.5%
Transportation 1,834 870 940 1,200 260 27.7%
Grand Total 1,528,304 732,260 1,745,820 1,770,568 24,748 1.4%
Programs:
5 - Publ ic Relations 161,245 78,640 172,611 190,217 17,606 10.2%
98 - Tra ining 86,695 21,240 74,717 76,131 1,414 1.9%
99 - Adminis tration 1,280,363 632,338 1,498,492 1,504,220 5,728 0.4%
Grand Total 1,528,304 732,260 1,745,820 1,770,568 24,748 1.4%
Funds:
10 - General 1,476,844 713,790 1,677,720 1,708,768 31,048 1.9%
20 - Water General 47,943 17,908 68,100 61,800 (6,300) -9.3%
50 - Wastewater General 290 279 - - -
57 - WW Portland 3,227 - - - -
62 - WW Westbrook - 284 - - -
Grand Total 1,528,304 732,260 1,745,820 1,770,568 24,748 1.4%
Headcount:
Ful l -Time 9 9 9 10 1 10.0%
Part-Time 1 1 1 0 -1 n/a
Total 10 10 10 10 0 0.0%
Salaries & Wages
52%Employee Benefits
25%
Contracted Services
4%
Insurance5%
Materials & Supplies
0%
Other Expense14%

245 Departmental Expenses – Administrative Services
Non-Departmental Non-Department expenses are expenses that are not specifically assigned to a department. Other expenses include Public Utilities Commission’s assessment, real estate taxes assessed by the Town of Standish and Bad Debt write-off. A one-time write reduction of $508,673 was done in 2018 to reflect the costs of proposed asset management system.
. 2018
Actual
2019
Jan-Jun
2019
Budget
2020
Budget
Budget
Diff $
Budget
Diff %
Contracted Services
663599 - MISC OTHER SERVICES 8,357 11,984 - - - n/a
Contracted Services Total 8,357 11,984 - - - n/a
Deferred Cost W/O
66754 - DEFERRED COSTS WRITE OFF 508,673 - - - - n/a
Deferred Cost W/O Total 508,673 - - - - n/a
Other Expense - n/a
6670 - BAD DEBT EXPENSE 19,950 15,000 30,000 27,500 (2,500) -8.3%
667561 - WATERSHED GRANTS/SUPPORT - 25,270 - - - n/a
6675611 - GRANTS - PASS-THROUGH 23,379 - - - - n/a
6706 - AMORT OF U P ACQ ADJUSTS 17,000 8,500 17,000 17,000 - 0.0%
Other Expense Total 60,329 48,770 47,000 44,500 (2,500) -5.3%
Regulatory/Taxes - n/a
670821 - STANDISH REAL ESTATE TAX 49,035 24,152 47,800 50,500 2,700 5.6%
670822 - OTHER R/E TAX(NON-STANDI) 8,038 5,288 8,000 8,874 874 10.9%
670823 - PUC ASSESSMENT 85,583 94,327 79,500 90,000 10,500 13.2%
670824 - ME DRINKING WTR PROGRAM 82,438 82,438 68,665 80,275 11,610 16.9%
670825 - PUC PUBLIC ADVOCATE 3,069 - 10,000 15,000 5,000 50.0%
Regulatory/Taxes Total 228,163 206,205 213,965 244,649 30,684 14.3%
Grand Total 805,522 266,959 260,965 289,149 28,184 10.8%
The District pays (670821 – Standish Real Estate Tax) real estate taxes. Real estate charges in other municipalities are paid using account 670822 – Other R/E Tax (Non-Standish). The District also pays annual assessments to the Maine Public Utility Commission (PUC) and the Maine Drinking Water Program. The PUC assessment has two components – general assessment (670823 – PUC Assessment) and public advocacy (670825 – PUC Public Advocate). The PUC bases the general assessment on the utility’s size and the amount of time the Commission spends in each industry sector. The assessment from the Drinking Water Program (670824 – ME Drinking WTR Program) is based on population served.
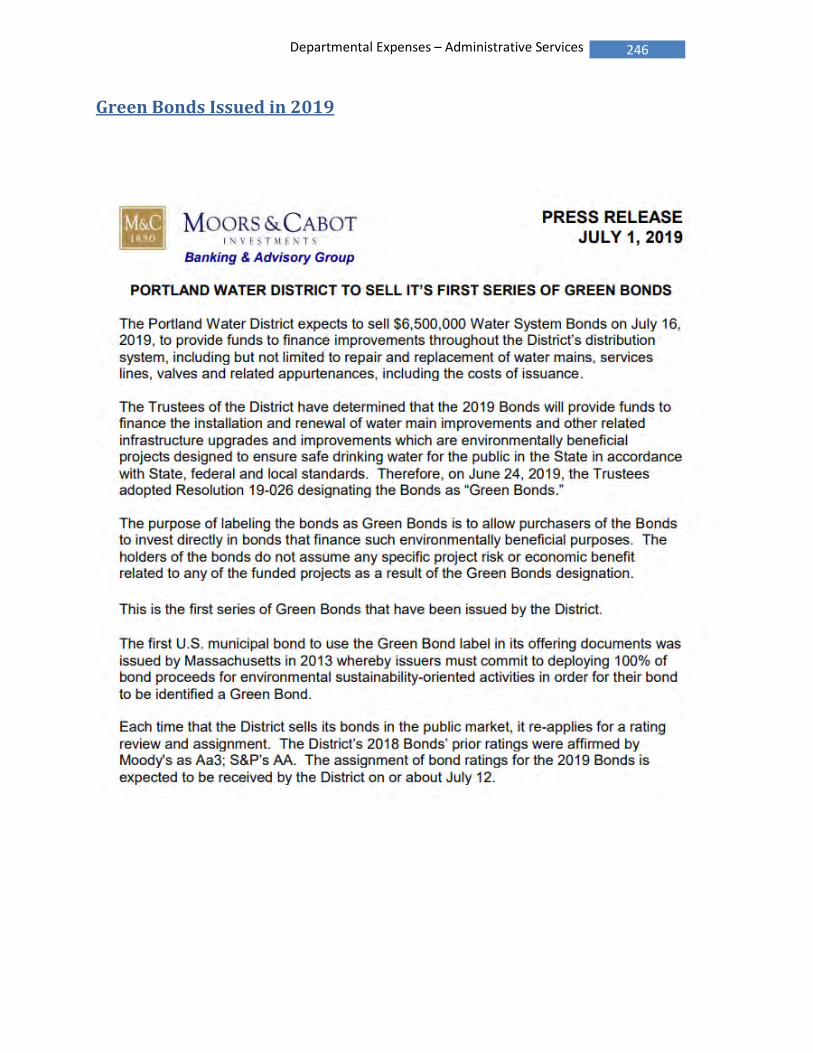
246 Departmental Expenses – Administrative Services
Green Bonds Issued in 2019

247 Human Resources
Introduction Total salaries, wages and benefits budget for 2020 is $18,168,026. This is 3.9% higher than the 2019 budget.
Total Labor & Benefits (O&M and Capital):
2018
Actual
2019
Budget
2020
Budget
Budget
Diff $
Budget
Diff %
Salaries & Wages $11,111,090 $11,900,627 $12,536,522 $635,895 5.3%Employee Benefits 5,479,428 5,587,775 5,631,504 $43,729 0.8%Actual 16,590,518 17,488,402 18,168,026 679,624 3.9%
Employees record their labor hours by specific water and wastewater operating funds and capital projects. Benefits are allocated based on the labor dollars to the funds. It is estimated staff will allocate $440,774 in labor/benefits to capital projects in 2020; which is $19,430 (4.2%) lower than the 2019 budget.
2018
Actual
2019
Budget
2020
Budget
Budget
Diff $
Budget
Diff %
Operations & Maintenance $16,126,687 $17,028,198 $17,727,252 $699,054 4.1%Capital 463,831 460,204 440,774 (19,430) -4.2%
16,590,518 17,488,402 18,168,026 679,624 3.9%
Total Employee Positions: Authorized positions were 182 in 2018 and 2019. They increased by four (4) to 186 in the 2020 Budget as Water Services and Administrative Services both added two (2) positions.
42 42 44
31 31 31
17 16 16
38 39 39
54 54 56
0
20
40
60
80
100
120
140
160
180
200
2018 2019 2020
Water Services
Wastewater Services
Environmental Services
Engineering Services
Administrative Services

248 Human Resources
Salary Costs The Budget for total labor costs will increase by 5.3% ($635,895). Labor rates for Non-Union employees were assumed to be 3.0% higher than the rates paid on July 1, 2019. The Union contract, which ended on 11/04/18, was under negotiation during the budget process. The assumption we used in the budget (that Union pay rates would increase 3.0% in November of 2018, 2019 and 2020) were the terms agreed to with the Union prior to the completion of this document. Overall hours budgeted increased 2.4% due to the addition of four new full time positions as well as increases in hours for overtime, doubletime, standby and temporary employees. Operating labor will increase 5.6% while capital labor will decrease 1.6% as the ratio of operating/ capital labor goes from 96.7%/3.3% in 2019 to 96.9%/3.1% in 2020.
Total Labor (O&M and Capital) by Type:
2018
Actual
2018
Budget
2019
Budget
Budget
Diff $
Budget
Diff %
Regular (Hourly & Salaried) $10,228,910 $10,914,037 $11,468,832 $554,795 5.1%
Overtime 546,565 583,593 629,379 45,786 7.8%Doubletime 55,283 62,170 69,749 7,579 12.2%Standby 148,253 137,677 163,272 25,595 18.6%Premium Time/Standby 750,101 783,440 862,400 78,960 10.1%
Trustee Compensation 21,650 27,000 27,000 0 0.0%
District Employed Temps 109,197 171,150 178,290 7,140 4.2%Agency Temps 1,232 5,000 0 -5,000 -100.0%Temporary Employees 110,429 176,150 178,290 2,140 1.2%
Total Labor Cost 11,111,090 11,900,627 12,536,522 635,895 5.3%
Total Labor Broken Out by O&M and Capital:
2018
Actual
2019
Budget
2020
Budget
Budget
Diff $
Budget
Diff %
Operating Expense $10,785,763 $11,507,789 $12,149,805 $642,016 5.6%Capital Expenditures 325,327 392,838 386,717 -6,121 -1.6%
11,111,090 11,900,627 12,536,522 635,895 5.3%
Operating Expense 97.1% 96.7% 96.9%Capital Expenditures 2.9% 3.3% 3.1%
100.0% 100.0% 100.0%

249 Human Resources
Labor Hours/Average Pay Rates Budgeted hours for the 2020 Budget were up by 9,952 hours or 2.4%. Regular hours were up 8,060 (2.1%) due to the addition of four new positions in the budget. All other labor categories also saw increases in the 2020 Budget.
Total Labor (O&M and Capital) Hours by Type:
2018
Actual
2019
Budget
2020
Budget
Budget
Diff $
Budget
Diff %
Regular (Hourly & Salaried) 365,165 377,520 385,580 8,060 2.1%
Overtime 15,100 15,408 16,151 743 4.8%Doubletime 1,167 1,202 1,307 105 8.7%Standby 5,592 5,495 6,279 784 14.3%Premium Time/Standby 21,859 22,105 23,737 1,632 7.4%
District Employed Temps 7,475 12,225 12,735 510 4.2%Agency Temps 62 250 - (250) -100.0%Temporary Employees 7,537 12,475 12,735 260 2.1%
394,561 412,100 422,052 9,952 2.4%
Labor Rates by Type: On average pay rates were increased 2.6%. Changes to overtime, double-time and standby varied due to shifts in personnel budgeted to cover those hours. Temporary Employee rates are flat.
2018
Actual
2019
Budget
2020
Budget
Budget
Diff $
Budget
Diff %
Regular (Hourly & Salaried) $28.01 $28.91 $29.74 $0.83 2.9%
Overtime 36.20 37.88 38.97 1.09 2.9%Doubletime 47.39 51.72 53.37 1.65 3.2%Standby 26.51 25.05 26.00 0.95 3.8%Premium Time/Standby 34.05 35.44 36.33 0.89 2.5%
District Employed Temps 14.61 14.00 14.00 0.00 0.0%Agency Temps 20.00 20.00 0.00 -20.00 -100.0%Temporary Employees 14.65 14.12 14.00 -0.12 -0.8%
28.10 28.88 29.64 0.76 2.6%

250 Human Resources
Employee Benefits In order to qualify for benefits, employees must work more than 20/24 hours/week (non-union/union). Seasonal or temporary employees are monitored for eligibility as required under Affordable Care Act (ACA), but in general do not qualify for benefits. Benefits are charged to departments as a percentage of the regular non-premium pay. In 2020, the benefits percentage decreased from 42.86% to 40.74% as overall benefit costs were flat while regular wages grew 5.1%.
Health Insurance Based on recent claims experience for the health plan, the District was able to lower the renewal rate by 2.0% for calendar year 2020. However, the budget increased by $53,805 (2.2%) because of the additional number of employees expected to participate in the program. The 2019 Budget assumed the District would pay 91% of an employee’s health insurance premiums and 70% of the premiums for dependents. The 2020 Budget assumes a reduction in the employee coverage to 91% while keeping the dependent percentage the same. The result, when combined with other factors such as changes to employee plans (single, employee with children, employee and spouse only for family plans) resulted in an increase in total employee contributions of $17,192 (3.4%) to $527,802.
$0
$500
$1,000
$1,500
$2,000
$2,500
$3,000
$3,500
2011
Actual
2012
Actual
2013
Actual
2014
Actual
2015
Actual
2016
Actual
2017
Actual
2018
Projected
2019
Budget
2020
Budget
Cost of Health Insurance(In Thousands)
Gross
ER Cost
EE Cost
The District makes health insurance coverage available to regular employees who work over 20 hours per week (24 hours per week for Union employees). The medical cost for part-time employees is pro-rated based on hours worked. The District provides $30/week to any employee who is insured outside the District. The Budget assumed six positions will be vacant:
Year Insured Non-Insured Total 2018 168 8 176 2019 173 7 180 Change +5 -1 4

251 Human Resources
Employee Benefits (continued)
Pension Pension related expenses are $1,662,162 in the 2020 Budget. The District offers employees a defined benefit plan and a deferred compensation plan. The defined benefit plan’s contributions in the 2020 Budget increased 0.7% ($7,888) to $1,120,662. This contribution is consistent with the Board adopted long-term funding policy and represents the amount calculated by the District’s actuary in 2019. The small increase is primarily due to the better than expected investment returns. The plan is solely funded by the District without any employee contributions. In addition, the deferred compensation plan for Union employees hired prior to 2011, and Non-Union employees hired prior to 2012, will fully match employee contributions up to $1,225 annually. This cost has been budgeted at $112,000 for 2020, the same as the prior year. New Union employees hired during or after 2011, and Non-Union employees hired during or after 2012, are enrolled in the deferred compensation plan only. The plan requires employees to contribute 3.0% of their pay, which the District matches at a rate of 150%. Effective April 4, 2016, the District matches up to 4.5% of their pay, with employee contributions above 3% remaining voluntary. The expense for the match is budgeted at $350,000 for 2020, an increase of $50,000 (16.7%).
Workers Compensation The District participates in the Maine Municipal Association’s workers’ compensation program. The premium assessed is based on amount of wages and a claim experience factor. In 2019, the “Mod” factor of 0.68 was increased to 0.95 a number close to the 10-year average of 0.964. The increase over the prior year was due to a few high cost injuries. However, the expected 2020 mode rate is expected to decline to .87. The 2020 Budget is $230,000 with a deductible cost of $9,000 resulting in a total budget of $239,000.
0.870.95
0.680.73
0.841.16
1.151.06
0.991.09
0.99
0.5 0.7 0.9 1.1
2020
2018
2016
2014
2012
2010
Maine Muncipal Assoc. - Mod Factor
Other Benefits Other benefits, which include dental, uniforms, unemployment, long-term disability, life insurance and a contingency for higher benefit costs total $317,112.

252 Human Resources
Employee Benefits (continued)
2018
Actual
2019
Budget
2020
Budget
Budget
Diff $
Budget
Diff %
Health Insurance:
6604041 - HEALTH INSURANCE-EMPLOYEE $2,725,620 $2,898,513 $2,966,990 $68,477 2.4%66040419 - HEALTH INSUR - EE CONTRIB (468,772) (510,610) (527,802) (17,192) 3.4%6604043 - MEDICAL INSURANCE PAYOUT 12,780 12,480 15,000 2,520 20.2%
2,269,628 2,400,383 2,454,188 53,805 2.2%Pension:
66040611 - PEN EXP - DEFINED BENEFIT 81,894 43,500 44,500 1,000 2.3%66040612 - PEN EXP - DEFER COMP 457 20,215 25,000 25,000 - 0.0%6604062 - PENSION CONTRIBUTION 1,414,448 1,112,774 1,120,662 7,888 0.7%6604063 - DEF COMP 457 MATCH - NEW 280,130 300,000 350,000 50,000 16.7%6604064 - DEF COMP 457 MATCH - OLD 116,959 112,000 112,000 - 0.0%6604065 - PENSION LEGAL EXPENSE 12,600 10,000 10,000 - 0.0%
1,926,246 1,603,274 1,662,162 58,888 3.7%Workers Compensation:
660409 - WORKERS' COMPENSATION 167,749 224,000 230,000 6,000 2.7%6604091 - WORKES COMP DEDUCTABLE 5,956 9,000 9,000 - 0.0%
173,705 233,000 239,000 6,000 2.6%Other Benefits:
66025 - BENEFITS CONTINGENCY - 182,500 50,000 (132,500) -72.6%660402 - LONG-TERM DISABILITY 27,232 28,000 30,000 2,000 7.1%660403 - LIFE INSURANCE 19,631 22,000 25,000 3,000 13.6%660407 - EDUCATION SUBSIDY 8,929 11,000 11,000 - 0.0%660408 - PROGRAMS ADMINISTRATION 8,398 15,000 15,000 - 0.0%660410 - UNEMPLOYMENT COMPENSATION 4,936 20,000 20,000 - 0.0%660413 - PWD TRAINING PROGRAM - 5,000 5,000 - 0.0%6604151 - FIELD UNIFORMS 47,314 35,450 36,000 550 1.6%6604152 - OFFICE CLOTHING 6,109 7,200 7,200 - 0.0%660416 - DENTAL COVERAGE 53,356 63,000 65,000 2,000 3.2%660417 - WELLNESS PROGRAM 469 2,500 2,500 - 0.0%660419 - EMPLOYEE BENEFTS-MISC OTH 29,876 34,900 35,775 875 2.5%660420 - WORKFORCE PLANNING - 1,000 1,000 - 0.0%660422 - ACTUARY NON-PENSION 7,241 2,500 2,500 - 0.0%663592 - RECRUITING SERVICES - 10,000 10,000 - 0.0%663598 - HR CONSULTANT SERVICES 1,870 - - - n/a66595 - INDENTITY FRAUD INSURANCE 1,067 1,067 1,142 75 7.0%667599 - OTHER MISCELLANEOUS (3,025) (21) (5) 16 -76.2%
213,403 441,096 317,112 (123,984) -28.1%
Total Employee Benefits 4,582,982 4,677,753 4,672,462 (5,291) -0.1%
660401 - FICA - EMPLOYERS' SHARE 837,474 910,022 959,042 49,020 5.4%
Total Costs 5,420,456 5,587,775 5,631,504 43,729 0.8%
Total Regular Labor (Benefits Basis) 10,130,155 10,914,037 11,468,832 554,795 5.1%
Benefit Rate 45.24% 42.86% 40.74% -2.12% -4.9%
Total Rate (w ith FICA of 7.65%) 52.89% 50.51% 48.39% -2.12% -4.2%
Note: The total employee benefits expense above ($5,631,504) does not include $102,945 in employee benefits charged directly to departments. With these costs, the District’s benefits cost is $5,734,449.

253 Human Resources
Authorized Headcount -
The overall headcount was increased from 182 to 186. Water Operations added a Water System
Operator and an Equipment Operator 1. Administration added an IS Business Intelligence & Reporting
Analyst and an Employee Services Consultant
In addition, Wastewater reclassified two (2) Technical Maintenance Person - Mechanical/Electrical
positions were replaced by two Technical Maintenance Person – Mechanical positions.
2018
Budget
2019
Budget
2020
Budget Change
Water Services
A1 - Water Administration 5 5 5 0A2 - Wtr Transmission/Distrib 22 22 24 2A3 - Water Treatment 11 11 11 0A6 - Water Utility Services 16 16 16 0
54 54 56 2Wastewater Services
B1 - Wastewater Administration 2 3 3 1B3 - Wastewater Treatment 23 23 23 0L9 - Wastewater Systems 13 13 13 0
38 39 39 1Environmental Services
A5 - Water Resources 9 9 9 0L6 - Water/WW Laboratory 8 7 7 -1
17 16 16 -1Engineering Services
C1 - Facilities Services 10 10 10 0E2 - Asset Engineering 18 18 18 0E7 - Instrumentation 3 3 3 0
31 31 31 0Administration
F1 - Customer Service 14 14 14 0G1 - Information Services 7 7 8 1H1 - Financial Services 8 8 8 0I1 - Employee Services 3 3 4 1J1 - BOT & Senior Management 10 10 10 0
42 42 44 2
182 182 186 4
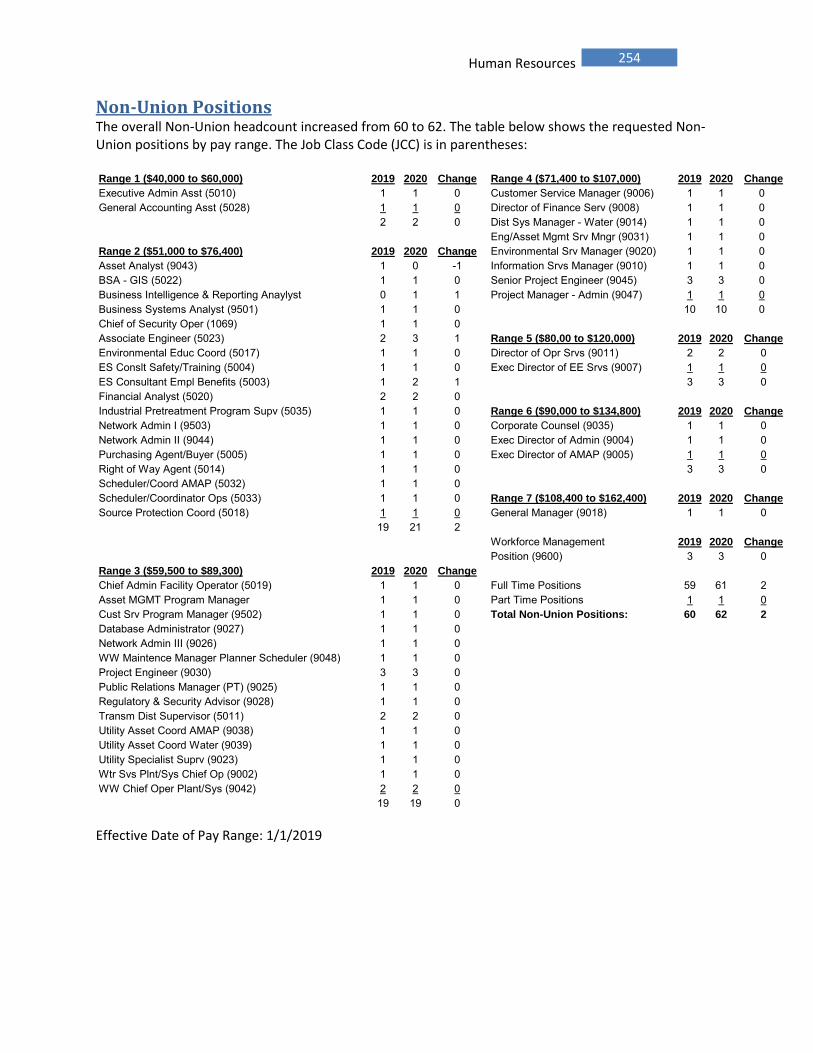
254 Human Resources
Non-Union Positions The overall Non-Union headcount increased from 60 to 62. The table below shows the requested Non-Union positions by pay range. The Job Class Code (JCC) is in parentheses: Range 1 ($40,000 to $60,000) 2019 2020 Change Range 4 ($71,400 to $107,000) 2019 2020 Change
Executive Admin Asst (5010) 1 1 0 Customer Service Manager (9006) 1 1 0General Accounting Asst (5028) 1 1 0 Director of Finance Serv (9008) 1 1 0
2 2 0 Dist Sys Manager - Water (9014) 1 1 0Eng/Asset Mgmt Srv Mngr (9031) 1 1 0
Range 2 ($51,000 to $76,400) 2019 2020 Change Environmental Srv Manager (9020) 1 1 0Asset Analyst (9043) 1 0 -1 Information Srvs Manager (9010) 1 1 0BSA - GIS (5022) 1 1 0 Senior Project Engineer (9045) 3 3 0Business Intelligence & Reporting Anaylyst 0 1 1 Project Manager - Admin (9047) 1 1 0Business Systems Analyst (9501) 1 1 0 10 10 0Chief of Security Oper (1069) 1 1 0Associate Engineer (5023) 2 3 1 Range 5 ($80,00 to $120,000) 2019 2020 Change
Environmental Educ Coord (5017) 1 1 0 Director of Opr Srvs (9011) 2 2 0ES Conslt Safety/Training (5004) 1 1 0 Exec Director of EE Srvs (9007) 1 1 0ES Consultant Empl Benefits (5003) 1 2 1 3 3 0Financial Analyst (5020) 2 2 0Industrial Pretreatment Program Supv (5035) 1 1 0 Range 6 ($90,000 to $134,800) 2019 2020 Change
Network Admin I (9503) 1 1 0 Corporate Counsel (9035) 1 1 0Network Admin II (9044) 1 1 0 Exec Director of Admin (9004) 1 1 0Purchasing Agent/Buyer (5005) 1 1 0 Exec Director of AMAP (9005) 1 1 0Right of Way Agent (5014) 1 1 0 3 3 0Scheduler/Coord AMAP (5032) 1 1 0Scheduler/Coordinator Ops (5033) 1 1 0 Range 7 ($108,400 to $162,400) 2019 2020 Change
Source Protection Coord (5018) 1 1 0 General Manager (9018) 1 1 019 21 2
Workforce Management 2019 2020 Change
Position (9600) 3 3 0Range 3 ($59,500 to $89,300) 2019 2020 Change
Chief Admin Facility Operator (5019) 1 1 0 Full Time Positions 59 61 2Asset MGMT Program Manager 1 1 0 Part Time Positions 1 1 0Cust Srv Program Manager (9502) 1 1 0 Total Non-Union Positions: 60 62 2
Database Administrator (9027) 1 1 0Network Admin III (9026) 1 1 0WW Maintence Manager Planner Scheduler (9048) 1 1 0Project Engineer (9030) 3 3 0Public Relations Manager (PT) (9025) 1 1 0Regulatory & Security Advisor (9028) 1 1 0Transm Dist Supervisor (5011) 2 2 0Utility Asset Coord AMAP (9038) 1 1 0Utility Asset Coord Water (9039) 1 1 0Utility Specialist Suprv (9023) 1 1 0Wtr Svs Plnt/Sys Chief Op (9002) 1 1 0WW Chief Oper Plant/Sys (9042) 2 2 0
19 19 0
Effective Date of Pay Range: 1/1/2019

255 Human Resources
Union Positions For the 2020 Budget, the Union headcount went up by two (2) to 124. One position, Laboratory Assistant II, was moved from Paygrade D to E. The table below shows the requested Union positions by pay grade. The rates shown are effective starting 11/04/19 and will be in effect until 11/02/20. The Job Class Code (JCC) is in parentheses: Paygrade - D ($19.22/$20.23) 2019 2020 Change Paygrade - I ($25.68/$27.03) 2019 2020 Change
AMR Specialist (1577) 1 1 0 Instrumentation Maint Per (1038) 2 2 0Laboratory Assistant II (1092) 1 0 -1 Senior WW Operator (1055) 5 5 0
2 1 -1 Utility Specialist (1085) 13 13 0Wtr Treat Plant Sys Oper (1051) 7 7 0
Paygrade - E ($20.35/$21.42) 2019 2020 Change WW System Maint/Operator (1082) 3 3 0Admin Asst Finance II (1094) 3 3 0 30 30 0Administrative Asst WW (1083) 1 1 0Environmental Educator (5029) 1 1 0 Paygrade - J ($27.27/$28.71) 2019 2020 Change
Laboratory Assistant II (1092) 0 1 1 Environmental Scientist (1022) 3 3 05 6 1 Facility Maint Foreperson (1565) 0 0 0
Tech Maint Pers Mech/Elec (1073) 5 5 0Paygrade - F ($21.56/$22.69) 2019 2020 Change Tech Maint Person SLWTF (1070) 1 1 0Cust Serv Coord Ctrl Ctr (1008) 3 3 0 Water Resource Specialist (1021) 4 4 0Facility Maint Technician (1086) 3 3 0 (1 of 4 is part-time) 13 13 0Facility Supp Generalist (1091) 1 1 0Technical Admin Asst (1522) 2 2 0 Paygrade - K ($28.84/$30.36) 2019 2020 Change
Wastewater Operator (1006) 3 3 0 Dist System Foreperson (1557) 5 5 0Water System Operator (1005) 12 13 1 Facility Maint Foreperson (1565) 1 1 0
24 25 1 Garage Foreperson (1528) 1 1 0Environ Scien Lead Fore (1573) 1 1 0
Paygrade - G ($22.86/$24.06) 2019 2020 Change Operations Foreman, Sys (1090) 1 1 0Collections Coordinator (1028) 1 1 0 Operations Foreperson (1053) 3 3 0Cust Serv Coordinator (1017) 4 4 0 Utility Foreperson (1095) 1 1 0Engineering Tech II (1020) 1 1 0 Ops Foreman, WW System (1093) 1 1 0Equip Operator I (1023) 4 5 1 14 14 0Fleet Maintenance Tech (1058) 1 1 0Millwright I (1049) 1 1 0 Paygrade - L ($30.63/$32.24) 2019 2020 Change
WW Maintenance Operator (1059) 10 10 0 Inst Maint Foreperson (1537) 1 1 022 23 1 Tech Maint Foreperson (1569) 2 2 0
3 3 0Paygrade - H ($24.24/$25.52) 2019 2020 Change
Asset Mgmt Technician (1575) 4 4 0Cust Serv Coordinator (1017) 3 3 0 Full Time Positions 121 123 2Collection Sys Maint Oper (1576) 1 1 0 Part Time Positions 1 1 0Inv Control Leadperson (1564) 1 1 0 Total Union Positions 122 124 2
9 9 0

256 Human Resources
Temporary & Non-Benefit Employees Temporary and non-benefit employees supplement regular employees particularly during the busy times of year. These positions are not benefit eligible, but the hours for benefit eligibility are monitored carefully as is required under the Affordable Care Act. All other positions are classified as “seasonal” employees who also are not offered benefits, but do have their hours tracked to monitor for benefits eligibility. The position totals are listed as full time equivalents (FTE’s). Temporary employees hired via outside agencies are also included below. Water Operations 2018 2019 2020 Change '19 to 20
A1 - Water Administration 0.00 0.00 0.35 0.35A2 - Transmission/Distribution 1.67 0.40 0.00 (0.40)A3 - Water Treatment 0.00 0.00 0.00 0.00A6 - Utility Services 1.00 1.97 1.96 (0.01)
2.67 2.37 2.31 (0.06)
Wastwater Operations
B1 - Wastewater Administration 0.00 0.00 0.00 0.00B3 - Portland/Cape/Peaks WWTP's 0.19 0.19 0.18 (0.01)B4 - Westbrook/Gorham/Windham WWTP 0.00 0.00 0.00 0.00L9 - Water / WW Systems 0.10 0.10 0.17 0.07
0.29 0.29 0.35 0.06
Environmental Services
A5 - Environmental Services 1.72 1.82 1.78 (0.04)L6 - Water / WW Laboratory 0.00 0.00 0.00 0.00
1.72 1.82 1.78 (0.04)
Engineering Services
C1 - Facility Services Administration 0.50 0.50 0.50 0.00E2 - Planning & Design 1.00 1.00 0.92 (0.08)E3 - New Mains & Construction 0.00 0.00 0.00 0.00E7 - Instrumentation 0.00 0.00 0.00 0.00
1.50 1.50 1.42 (0.08)
Administration Department
F1 - Customer Service 0.00 0.00 0.23 0.23G1 - Information Services 0.00 0.00 0.00 0.00H1 - Financial Services 0.00 0.00 0.00 0.00I1 - Employee Services 0.02 0.02 0.00 (0.02)J1 - Executive Office 0.00 0.00 0.00 0.00
0.02 0.02 0.23 0.21
6.20 6.00 6.09 0.09

257 Human Resources
Temporary & Non-Benefit Employees (continued)
Temporary Positions Detail:
District Paid (Account 660131):
Org Job Class #EE Hrs/Wk # Wks Hours FTE's
A1 Water Operations Intern 1.5 40 12 720 0.35
A5 Lake Security 6 10 20 1,200 0.58 Lake Security 2 17 25 850 0.41 Lake Security 1 10 46 460 0.22 Environmental Educator 1 20 26 520 0.25 Watershed Protection Specialist 1 40 17 680 0.33
A6 Construction Laborer 4 40 25.5 4,080 1.96
B3/L9 Wasterwater Operations Intern 1.5 40 12 720 0.35
C1 Facility Maintenance Technician 1 40 26 1,040 0.50
E2 Engineering Intern 4 40 12 1,920 0.92
F1 Customer Service Temp 1 40 12 480 0.23
24 6.09
Headcount – All Regular Employees
Union
67%
Non-Union
33%
Union/Non-Union
Men,
76%
Women, 24%
Gender

258 Human Resources
Work Force Management In 2020, five (5) employees will reach age 65, the normal retirement age. That would bring the total of current employees, at or above 65, to 15. Management has been proactively managing the challenges of baby boomer retirements and the development of promoted personnel and unseasoned new hires. The Wastewater Department has implemented an Apprentice Program to help educate new hires to the breadth of knowledge needed to operate our facilities, as well as to get exposure to other areas of PWD operations. Documentation, such as procedures for operating the rotary press, has further supported knowledge transfer. The Water Department’s apprentice program has been satisfying its labor needs. It has served to launch capable Water System Operators into the more advanced Utility System and Water Treatment System Operator roles. The next challenge is preparing employees for the highest technical roles, and foreperson or supervisory role.
Generally speaking, the Administration Department is well positioned with existing personnel.
20's11%
30's
25%
40's
21%
50's
22%
60's20%
70's1%
Employees by Age
0
2
4
6
8
10
12
14
16
Water Wastewater Environmental Engineering Administration
Age by Department
20's 30's 40's 50's 60's 70's
Average Length of Service (years)Water Wastewater Environmental Engineering Administration All Depts
14.6 15.7 14.6 14.6 11.3 14.1
259 Human Resources
Work Force Management (continued)
Employee Development The District actively promotes skill development by encouraging participation in local, regional and national organizations, and on the job training. Also, a goal of an average of 80 hours of training per employee per year has been established.
Managing Today To address work force management issues, the District requires all employees’ performance be evaluated yearly with an action plan to assist with continuous development. Pay adjustments for non-union employees are based on performance. Non-Union Compensation policy requires that a market survey be conducted every two years to assure we are competitively compensating employees. The non-union market survey was conducted in 2018 with results implemented January 2019. A more detail review is underway review and should be completed early 2020.
Travel Budget The Board of Trustees approves an annual budget for out-of-state and overnight business travel. The General Manager specifically approves these travel requests. The total costs may not exceed the District's total budget without the Board's authorization.
Training Budget Employee development is comprised of the annual budget for all in-state and out-of-state training events. Employee development costs include the travel budget listed above. Department 2019 Budget 2020 Budget Change
Water Services $261,754 $284,103 $22,349Wastewater Services 179,860 190,135 10,275Environmental Services 70,626 69,941 -685Engineering Services 150,496 157,163 6,667Administration 214,494 326,634 112,140
$877,230 $1,027,976 $150,746
Operating Expense Budget $30,042,141 $31,253,832Percentage of O&M Budget 2.9% 3.3%
Department 2019 Budget 2020 Budget Change
Water Services $7,000 $11,500 $4,500Wastewater Services 8,750 10,950 2,200Environmental Services 6,300 6,600 300Engineering Services 9,100 9,600 500Administration 20,500 20,500 0
$51,650 $59,150 $7,500

260 Human Resources
Work Force Management (continued)
Environment and Tools Organizational development and improvement is an on-going process. Management continues to evaluate areas that require additional focus as business needs and demands evolve, and as laws or rules governing our practices change. Many of these focus areas require cross-functional involvement including alignment to ensure understanding, practical and consistent application and communication of changes. Management continues to utilize department monthly meetings to keep employees up to date on Board activities and decisions, significant capital improvement projects, business challenges and changes, and updates of organizational practices and policies. SharePoint will continue to evolve in 2020 as our forum of daily information sharing, and document management across PWD. Developing and implementing a common methodology for cataloging documents to improve knowledge retrieval/sharing, and reducing document redundancy are significant areas of growth this year, ultimately involving every employee. An organization’s total compensation package is a key factor in establishing our competitive posture in the employment market, and employee satisfaction. A detail market review of the non-union salaries will be completed in 2020. As with most organizations, we continue to monitor our health care plan and explore ways to promote employees to live a healthy life style.
Employee Satisfaction Survey A survey of employees on the work climate is conducted every other year and was done late 2019 but the results have not been published. A new survey was devised in 2017 by Market Decisions Research and was used again in 2019. 80% of employees across PWD participated in the 2017 survey and the results have been analyzed. Employee loyalty was reflected in the fact that two out of five employees reported that they are extremely likely to recommend PWD as a workplace. New in the 2017 survey, was the inclusion of Gallup Poll questions as a point of comparison to the overall working population in the United States. From the responses to these questions, 45% of PWD employees are highly engaged as compared to 31% of the general working population. The overall engagement index ratio for PWD is 2.8. This means that employees at PWD are 2.8 times more likely to be engaged rather than disengaged. The factors within that ratio were the responses by participants that they had the materials and equipment to do their jobs safely (4.56); employees said that they know what is expected of them (4.25); and the mission/purpose of PWD makes them feel that their jobs are important.

261 Human Resources
PORTLAND WATER DISTRICT PROFESSIONAL REPRESENTATION IN 2019 Employees participate in the following associations.
Association of Metropolitan Water Agencies Board of Directors Casco Bay Estuary Partnership Executive Committee
Nutrient Council City of Portland Integrated Plan Steering Committee Cumberland District Public Health Council
Executive Committee Health Care Coalition of Southern Maine Steering Committee International Right-of-Way Association Member, Past President Maine GIS User Group Board of Directors Maine Inland Fisheries and Wildlife
Sebago Lake Fisheries Focus Group Maine Sustainability & Water Conference
Planning Committee Maine Water Environment Association
Asset Management Committee Collections System Committee Government Affairs Committee Laboratory Committee
Personal Advancement Committee Pretreatment Committee
Treatment Plant Operators Committee Young Professionals Committee Maine Water Utilities Association Board of Directors
Education & Operations Committee Public Awareness Committee Water Resources Committee
Scholarship Fund Utilities Finance Officer Group National Association of Clean Water Agencies Blending Workgroup National Drinking Water Advisory Council Chair New England Chapter - North American Lake Management Society
Board of Directors
New England Water Environment Association Government Affairs Committee Laboratory Committee Laboratory Certification Subcommittee Laboratory Practices Committee Operations Challenge Committee
Utilities Management Committee
Water Warriors Committee
New England Water Works Association
Board of Directors
Customer Service Committee
Finance Management Committee
Diversity Committee
Management Development Committee
Emergency Preparedness Committee
NEWWA Water WORKS Committee for
Student Outreach
Presumpscot Regional Land Trust
Stewardship Committee
Sebago Clean Waters
Communications Committee Governance and Steering Committees
Southern Maine Children’s Water Festival Organizing Committee Southern Maine Conservation Collaborative Advisory Board Southern Maine Regional Water Council Board of Directors University of Maine Cooperative Extension
Master Gardener Utilities United Against Scams Committee Water Environment Federation Collections Systems Committee Government Affairs Committee

262 Human Resources
Employee Events
Employee Holiday Party

263 Capital Finance
Introduction Capital expenditures are financed either from withdrawals from the Renewal and Replacement fund (R&R fund) established for each enterprise fund or through the issuance of a bond. The financing option for each project is noted when the Board authorizes the project. A summary of the planned 2020 capital financing options (source of funds) are noted in the chart below. The funds will be used to fund $10.95 million in water projects and $17.13 million in wastewater projects.
Annual Fund Operating Budget The annual budget includes the impact of issuing $22.38 million of debt and $5.75 million in contributions to the renewal and replacement funds. All the funds are below the Board target maximum debt service. The projects financed have minimal impact to the operating budget. Most of the projects address aging assets so related maintenance costs of those assets will be lower. The transportation debt service and Renewal & Replacement contributions are allocated to funds and departments through an hourly rate and are included in the transportation - internal line item.
2019 Budget 2020 Budget $ Change
Debt Service Principal, Interest & Related Expense 9,722,048 10,195,431 $473,383Debt Service - Meters Allocated 670,130 469,140 (200,990) Lease Expenses - 13,981 13,981 Debt Service - Watershed Protection - 39,791 39,791 Annual Debt Service 10,392,178 10,718,343 326,165
Renewal & Replacement - Water - General 2,750,000 2,800,000 50,000 Renewal & Replacement - Wastewater 1,505,549 1,677,349 171,800 Renewal & Replacement - Multi-Fund Assets 850,000 1,050,000 200,000 Renewal & Replacement - Funds 5,105,549 5,527,349 421,800 Renewal and Replacement - Transportation 320,000 400,000 80,000 Annual Renewal and Replacement Contributions 5,425,549 5,927,349 501,800
Total Capital / Finance 15,817,727 16,645,692 827,965
Bonds - Wastewater, 55%
Bonds - Water, 25%
R & R - Wastewater, 6%
R & R - Water, 14%
Financing Summary

264 Capital Finance
Bond Financing
Overview The District typically finances larger capital projects by issuing revenue bonds for a term of the asset’s useful life or 20 years, whichever is shorter. Since most of the District’s assets have a useful life in excess of 20 years, the typical bond term is 20 years. A financial analysis is conducted before issuing the bond to determine the optimal bond term. The District’s charter authorizes the District, through its trustees and without vote of its inhabitants, to issue bonds to pay for the costs of capital outlays incurred in connection with acquiring, renovating or constructing water and wastewater assets. Water bonds are secured by the revenues of customers’ water rates and charges. In the event of a bond payment default, the District has the power to assess its member municipalities to provide funds to cure the default. Such assessments would be allocated based upon the municipalities’ respective state valuation. Wastewater bonds are secured by the District’s sewer assessment revenue. In the event of a bond payment default, the municipalities served would be responsible for the debt service related to assets serving that municipality. The annual sewer assessment once certified to the municipality by the District is an obligation of the municipality on parity with the municipalities’ general obligation debt and entitled to the full faith and credit of the municipality.
Water Capital Reserve Bond The 2020 Budget includes issuing a $2 million, 10-Year bond to finance the replacement of aging water mains. In 2013, a law (35-A M.R.S.§§ 6107-A) was enacted allowing utilities to create a capital reserve to pay for infrastructure improvements, including debt service costs, and allows the reserve to be funded by designating a portion of the utility’s revenue. The 2020 budget assumes that 1% of the proposed 3.5% rate adjustment will be used to fund the reserve and will pay for the debt service of the proposed $2 million bond. The tentative plan is to issue a $2 million bond each for the 10 years starting in 2014, which will be funding by raising water rates an additional 1% each year.
Bond Options The District issues bonds either directly to the market or through the Maine Municipal Bond Bank (MMBB). For larger projects, typically greater than $10 million, the District considers issuing directly to the market. For smaller projects, the most cost effective option is to issue through MMBB. MMBB has three different programs – General Bond, Drinking Water SRF (State Revolving Fund) and Clean Water SRF programs. General Bond issues are done twice a year at tax-exempt market rates. The SRF programs have a more flexible closing date and typically result in an interest rate 2% less than market. For qualifying projects, part of the principal may be forgiven. Projects financed through the SRF are competitively awarded by the State of Maine’s Department of Human Services (water projects) or Department of Environmental Protection (wastewater projects). Those projects need to comply with certain procurement standards.

265 Capital Finance
Bond Financing (continued) The current water bond ratings by Moody’s and Standard & Poor’s ratings are Aa3 and AA, respectively. Moody’s bond ratings range from AAA (highest quality) to C (lowest quality) and apply a number qualifier (1-high, 2-mid and 3-low) for each letter range. Standard & Poor’s top four bond ratings (AAA, AA, A and BBB) generally are regarded as eligible for bank investment (AAA is highest rating). The latest rating for both was in July 2019. Moody’s noted the District’s deregulation from the Maine Public Utilities Commission. Additionally, the District’s sizable and wealthy service area, as well as its strong liquidity and sound debt service coverage supported by annual rate increases were factors. In addition to the items Moody noted, S&P noted the District’s sound system operations with virtually unlimited water supply and good financial flexibility due to the affordability of the water rates. Moody’s noted the weak legal security as a challenge. The weak legal security references that the District has to be in default before evoking the municipalities’ ‘double barrel’ general taxes cure.
Maine Municipal Bond Bank The Maine Municipal Bond Bank was created in 1972 by the Maine State Legislature. The agency has an immense history of providing Maine’s cities, towns, school systems, water and sewer districts, and other governmental entities access to low cost capital funds through the sale of its highly rated tax-exempt bonds. Established as an independent agency, the Bond Bank is administered by a board of commissioners appointed by the Governor. The Bond Bank works closely with its municipal clientele to provide unique, cost effective and competitive financing programs.

266 Capital Finance
Bond Financing (continued)
Bond Limits The District has no legal limits of debt. A board-approved policy establishes a target maximum level of debt service to 35% of total fund budget and minimum debt service ratio of 1.25. The table indicates the status and projected status. The projected status is based on the projection included at the end of the Revenue section and includes bond financed capital projects as noted in the 5-year capital plan in the Capital Expenditures section. The Gorham & Windham funds exceed the debt service target due to a 2009 project requested by both municipalities. The project connected the Little Falls area to the Westbrook Regional Treatment Facility. A $10.5M upgrade at the Westbrook Regional Wastewater Treatment facility is planned causing Westbrook’s, Gorham’s and Windham’s debt service ratio to exceed 35% in 2022.
Percent of Budget Dedicated to Debt Service – Target: Not to Exceed 35%
Funds 2018 2019 2020 2021 2022 2023 2024
Water 21% 22% 23% 23% 25% 26% 28%
Wastewater Cape Elizabeth 15% 15% 17% 21% 23% 22% 22% Cumberland 33% 34% 31% 32% 32% 31% 30% Gorham 31% 34% 32% 34% 42% 41% 40% Portland 21% 20% 19% 18% 21% 20% 21% Westbrook 17% 19% 21% 23% 32% 31% 30% Windham 35% 38% 35% 38% 39% 39% 43%
Debt Service Ratio – Target: Greater or Equal to 1.25
Funds 2018 2019 2020 2021 2022 2023 2024
Water 1.82 1.51 1.57 1.57 1.53 1.49 1.44
Wastewater Cape Elizabeth 1.65 1.49 1.52 1.41 1.36 1.39 1.39 Cumberland 1.03 1.19 1.28 1.17 1.16 1.17 1.17 Gorham 1.12 1.25 1.30 1.29 1.20 1.20 1.21 Portland 1.50 1.36 1.53 1.52 1.42 1.45 1.42 Westbrook 1.81 1.67 1.56 1.47 1.29 1.30 1.30 Windham 0.96 1.19 1.29 1.25 1.23 1.22 1.19

267 Capital Finance
Water & Wastewater Funds Debt Service
Long-Term Debt Principal & Interest The District has $8,199,667 and $2,227,170 of principal and interest payments in 2020. Of the total, $7,708,254 and $2,171,141 of principal and interest, respectively, are expensed to the individual funds. A portion of the debt service related to Meters is allocated to water and wastewater funds (principal of $444,250 and interest of $51,318) based on relative benefit received by each fund. Lease expense, which is based on the present value of future lease payments, was budgeted for $13,981 in 2020. Principal and interest related to Watershed Protection debt service totals to $37,893.
Administrative Fees Maine Municipal Bond Bank (MMBB) bonds issued under the Drinking Water State Revolving Fund (DWSRF) for Water and the State Revolving Fund (SRF) for Wastewater assess an administrative fee of 5% of each year’s principal and coupon interest payments. Maine Municipal Bond Bank Non-SRF bonds do not assess any administrative fees. Water and Wastewater bonds issued as stand-alone bonds directly to the market also do not assess administrative fees. Total fees in 2020 are budgeted at $196,233.
Debt Issuance Expense The Water and Wastewater funds incur costs for issuance of the permanent financing. Prior to 2014 governments were allowed to carry the cost of these issuances on their balance sheets and write off the expense over the life of the debt. A change in accounting rules now requires that all issuance costs be recognized in the year of debt issuance. That cost in 2020 is estimated to be $86,475.
Premiums & Deferred Outflow The District has received premiums on bonds issued directly to the market. These premiums are recognized over the life of the bonds as a reduction in interest expense. In addition, a bond refunding was done in 2016 that resulted in a deferred outflow being added to the District’s balance sheet. That outflow is being amortized over the remaining life of those bonds as an addition to interest expense. The net impact of these items on the 2020 Budget is a reduction of debt service expense of $286,604.
Contracted Debt Service, Intra-Fund Note & Lease Expense The Cumberland Wastewater Fund contracts with the Town of Falmouth for the use of treatment and wastewater pump stations. Contracted Debt Service expense are payments made by Cumberland to reimburse Falmouth for debt issued to support the services provided, that cost in 2020 is $290,601. The Windham Intra-fund note payable to Westbrook is for Windham’s portion of a one-time buy-in of the regional treatment facility. The original note of $264,733 was issued on 4/1/08 at 4.395% interest with annual principal and interest payments. The 2020 principal ($13,240) and interest expense ($4,801) totaling $18,041 are budgeted for 2020.

268 Capital Finance
Water & Wastewater Funds Debt Service (continued)
Summary of Debt Service
. Principal Interest
MMBB &
DEP Admin
Fees
Debt
Issuance
Expense
Premiums,
Deferred
Outflow
Contracted &
Notes
Debt
Service
Total
Direct Charges
Water Fund:Water General Assets 3,172,613 1,203,589 53,030 50,000 (251,176) - 4,228,056 Water Capital Reserve 1,172,500 378,084 - 20,000 - - 1,570,584 Sub-Total Water 4,345,113 1,581,673 53,030 70,000 (251,176) - 5,798,640
Wastew ater:Cape Elizabeth 218,100 48,462 9,954 2,200 - - 278,716 Cumberland 6,250 614 344 - - 290,601 297,809 Falmouth 238,000 40,587 13,933 - - - 292,520 Gorham 303,766 50,018 14,788 853 - - 369,425 Portland 2,025,757 313,143 77,371 10,875 (9,000) 2,418,146 Westbrook 469,095 123,170 19,859 1,675 - (13,240) 600,559 Windham 102,173 13,474 5,056 872 - 18,041 139,616 Sub-Total Wastew ater 3,363,141 589,468 141,305 16,475 (9,000) 295,402 4,396,791
Total Direct 7,708,254 2,171,141 194,335 86,475 (260,176) 295,402 10,195,431
Meters
Water Fund 271,736 30,478 - - (15,630) - 286,584
Wastew ater:Cape Elizabeth 11,148 1,449 - - (758) - 11,839 Cumberland 5,441 684 - - (356) - 5,769 Falmouth - - - - - - - Gorham 8,601 1,073 - - (558) - 9,116 Portland 84,218 10,098 - - (5,227) - 89,089 Westbrook 21,162 2,557 - - (1,325) - 22,394 Windham 340 40 - - (21) - 359 Sub-Total Wastew ater 130,910 15,901 - - (8,245) - 138,566
Contracted Services:Scarborough 4,648 521 - - (267) - 4,902 South Portland 36,956 4,418 - - (2,286) - 39,088 Sub-Total Contracted 41,604 4,939 - - (2,553) - 43,990
Total Meters Allocated 444,250 51,318 - - (26,428) - 469,140
Leases
Water Fund 8,906 280 - - - - 9,186 Cape Elizabeth WW 3,757 1,038 - - - - 4,795 Total Leases 12,663 1,318 - - - - 13,981
Total Water/WW Funds 8,165,167 2,223,777 194,335 86,475 (286,604) 295,402 10,678,552
Watershed Protection 34,500 3,393 1,898 - - - 39,791
Total Debt Service 8,199,667 2,227,170 196,233 86,475 (286,604) 295,402 10,718,343

269 Capital Finance
Debt Service Summary The debt service expense for each fund consists of three parts: Direct Debt Service – These charges are related to assets belonging to the specific fund such as treatment plants, pump stations, mains, etc. Meter (Allocated) Debt Service – Meters are an asset of the Water fund but are used to calculate both water and wastewater bills. The debt related to meters is allocated to each fund based on number and size of the meters in each municipality.
Lease Expense – This recognizes the costs of leased property/equipment under GASB 87. Under this rule, the District calculates present value of the future lease payments and recognizes each year portion of the cost, including interest.
. Direct Meters (Alloc) Lease Expense Total
Water Fund 5,798,640 286,584 9,186 6,094,410
Wastew ater:Cape Elizabeth 278,716 11,839 4,795 295,350 Cumberland 297,809 5,769 - 303,578 Falmouth 292,520 - - 292,520 Gorham 369,425 9,116 - 378,541 Portland 2,418,146 89,089 - 2,507,235 Westbrook 600,559 22,394 - 622,953 Windham 139,616 359 - 139,975 Sub-Total Wastew ater 4,396,791 138,566 4,795 4,540,152
Contracted Services:Scarborough - 4,902 - 4,902 South Portland - 39,088 - 39,088 Sub-Total Contracted - 43,990 - 43,990
Total Water/WW Funds 10,195,431 469,140 13,981 10,678,552
Watershed Protection 39,791 - - 39,791
10,235,222 469,140 13,981 10,718,343
Long-Term Water Fund Target The long-term water fund target was established in 2013. Projected 2020-2024 is below the established target at 22-27% in those years.
0%
5%
10%
15%
20%
25%
30%
35%
20
13
20
14
20
15
20
16
20
17
20
18
20
19
20
20
20
21
20
22
20
23
20
24
20
25
20
26
20
27
20
28
20
29
20
30
20
31
20
32
20
33
20
34
20
35
Debt Service as Percent of Revenue
Board Policy: No more than 35% of Revenue

270 Capital Finance
Projected Water Debt The Water Fund has significant future bond financing needs including completing the 407 zone system upgrade and main renewals. In 2011, the Board adopted the policy to double the investment in main renewal by incrementally increasing the amount spent by $500,000 until reaching an annual level of $4 million in 2016. Starting in 2014, an additional annual investment of $2 million was bonded to pay for main renewal and funded through the capital reserve. Other major projects include the installation of a new meter reading system and transmission line projects.
The 2020 Budget requests $6.1 million of debt service, below the long-term plan
The updated multi-year projection indicates debt service payments will be $9.2 million in 2023,
$200,000 below 2013 target.
$-
$2,000,000
$4,000,000
$6,000,000
$8,000,000
$10,000,000
$12,000,000
2013 2015 2017 2019 2021 2023 2025 2027 2029 2031 2033 2035
Capital Reserve
Current Main
Other Project
407 Zone
Existing Debt
Projected Debt Service

271 Capital Finance
Outstanding Debt by Fund Trends The proposed 2020 budget results in outstanding debt increasing by 256% and 186% higher than 2004 for the water and wastewater funds, respectively. Between 2004 and 2009, significant bonded capital projects including the connecting the Little Falls area in Windham and Gorham to the Westbrook Regional Treatment facility and upgrades at the treatment facilities. Investments in water main renewal, water 407 zone and water and wastewater treatment plants & pump stations are driving the more recent increase.
Outstanding Debt By Fund
2004 2009 2014 2020
Water $22,940,000 $30,950,023 $39,645,214 $58,814,558WW- Cape Elizabeth 839,000 159,250 2,276,000 4,251,950WW- Cumberland 147,600 130,850 75,000 37,500WW- Falmouth 0 0 0 3,846,000WW- Gorham 590,081 5,552,894 4,042,816 3,007,525WW- Portland 19,914,857 19,263,106 15,517,561 24,623,670WW- Westbrook 1,792,859 5,325,885 3,645,084 6,326,869WW- Windham 37,736 1,925,071 1,414,740 1,221,843
Total $ 46,262,133 $ 63,307,079 $ 66,616,415 $ 102,129,915
135%
173%
256%
139% 116%
186%
100%
120%
140%
160%
180%
200%
220%
240%
260%
280%
2004 2009 2014 2020
Percent Change Since 2004
Water Wastewater
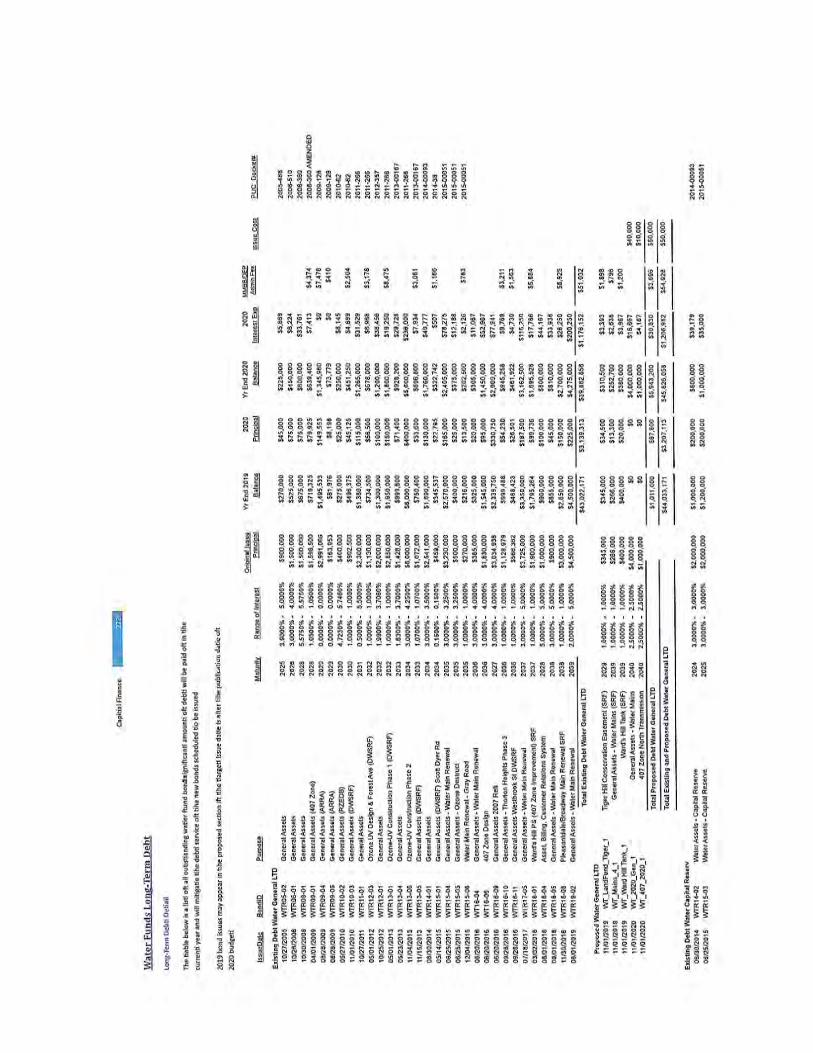


279 Capital Finance
Capital Reserve – Water In 2013, a new state law (35-A M.R.S. 6107-A, Funding for Infrastructure Improvements for Water Utilities) was enacted. The law allows a water utility to fund future infrastructure improvements through recovery in rates. As required by the law, the Maine Public Utilities Commission adopted a rule (Chapter 675 – Infrastructure Surcharge and Capital Reserve Accounts) that outlines the maximum amount of funds the may be recovered through rates, use of those funds, and reporting requirements. The maximum dollar amount of funds that may be recovered through rates depends on the size of the utility. Portland Water District is considered a large utility (utilities with revenues greater than $750,000 are considered large) and therefore the amount of revenue requirement attributed to funding a capital reserve should not exceed either of the following: 1% of Gross Plant (as of 12/31/2018) $ 3,264,964 10% of Revenue Requirement (2020 Budget) $ 2,568,489 The capital reserve can only be used to pay for the costs of construction associated with the projects identified in the utility’s System Infrastructure Assessment Report (SIA) and are related to transmission, distribution, and treatment of water. The District submitted a SIA that identified water mains that need to be replaced due to age or type of material.
The District has chosen to increase each year an additional 1% for 10 years with the revenue reserved to pay the debt service costs of issuing a $2 million bond each year. The bond proceeds will be used to replace water mains identified in the SIA. The 2020 budget assumes 1% of the proposed water rate adjustment be dedicated to the capital reserve. Starting in 2014, 1% of the rate adjustments has been dedicated to the reserve.
.
2019
Budget
2019
Projected
2020
Budget
Revenue 1,402,364 1,402,364 1,704,558
Expense 1,274,526 1,274,526 1,424,631
Annual Charge 127,838 127,838 279,927 Carry Forward 551,397 575,547 703,385
679,235 703,385 983,312

280 Capital Finance
Renewal & Replacement Each fund contributes to a renewal and replacement (R&R) fund. These funds are used to pay for smaller capital projects as an alternative to issuing long-term debt. Each fund maintains a R&R fund for assets owned by that fund. In addition, R&R balances are maintained for other groups of assets that, while owned by the Water fund, serve the needs of all District funds. These other R&R balances are: Douglass St – This fund is for the building and grounds that serve as the District’s main headquarters. Meters – Water meters measure water flow but provide data used in both water and wastewater billing. Technology – This category includes both computer hardware and software systems that serve all District funds. Transportation – These assets are used by all District funds. The charge for the R&R funding is part of the hourly rate of each vehicle (an internal line item). 2020 Contributions:
Fund Douglass St Meters Technology Combined* Total
Water $2,800,000 $294,308 $255,372 $112,100 $661,780 $3,461,780
Wastewater:Cape Elizabeth 120,700 14,766 6,825 7,320 28,911 149,611 Cumberland 40,000 7,360 3,744 4,340 15,444 55,444 Gorham 90,800 11,178 6,084 5,320 22,582 113,382 Portland 1,090,000 102,994 67,119 56,900 227,013 1,317,013 Westbrook 300,000 22,310 16,497 12,260 51,067 351,067 Windham 35,849 2,990 312 1,760 5,062 40,911
Contracted Services:Falmouth - - - - - - Scarborough - 46 4,368 - 4,414 4,414 South Portland - 4,048 29,679 - 33,727 33,727
R&R - Funds $4,477,349 460,000 390,000 200,000 1,050,000 $5,527,349
R&R - Transportation 400,000
R&R - Total 5,927,349
*Combined = Douglass St + Meters + Technology

281 Capital Finance
Water Fund - Renewal & Replacement Fund The District will contribute a total of $4,250,000 to the renewal and replacement fund in 2020. Similar to the debt service costs, renewal and replacement reserve is directly received from the fund or indirectly through the appropriate allocation method from all funds. The Water renewal and replacement contribution is capped at approximately $4,400,000, which is the estimated depreciation of all water assets, per Maine Public Utility Commission rules. Starting in 2011, the District began to track and reserve balances by different categories of renewal & replacement with part of the general surplus designated to the transportation, technology, meter and Douglass Street building reserves.
0
1,000
2,000
3,000
4,000
5,000
2011 2012 2013 2014 2015 2016 2017 2018 2019 2020
Water Fund - R&R Contribution($,000)
Transportation
Technology
Meter
Douglass Street
Water General
Water General Douglass Street Water Meters Technology Transportation Total
Balance 12/31/17 4,738,462 115,651 (211,304) 431,137 566,854 5,640,800
Contribution - 2018 2,600,000 360,000 290,000 200,000 320,000 3,770,000 Expenditure (568,288) (390,661) (366,589) (376,137) (495,094) (2,196,769) Balance 12/31/18 6,770,174 84,990 (287,893) 255,000 391,760 7,214,031
Contribution - 2019 2,750,000 360,000 290,000 200,000 320,000 3,920,000 Expenditure (Est'd) (3,641,616) (325,000) (300,000) (216,171) (394,542) (4,877,329) Balance 12/31/19 (Est'd) 5,878,558 119,990 (297,893) 238,829 317,218 6,256,702
Contribution - 2020 2,800,000 460,000 390,000 200,000 400,000 4,250,000 Expenditure (Est'd) (2,506,000) (450,000) (390,000) (200,000) (400,000) (3,946,000) Balance 12/31/20 (Est'd) 6,172,558 129,990 (297,893) 238,829 317,218 6,560,702
Target R&R Balance (1% of Gross Fixed Asset Cost) $3,218,000

282 Capital Finance
Wastewater Funds - Renewal & Replacement Funds Each wastewater fund includes an annual contribution to the renewal and replacement (R&R) reserve to finance capital additions or replacements. At the end of 2018, Portland’s operating surplus of $301,066 was transferred to Portland’s R&R reserve. Unlike the prior year, no other funds had incoming transfers at the end of 2018. In 2020, R&R contributions decreased for Cape Elizabeth ($125,000 to $120,700), Cumberland ($54,700 to $40,000) and Gorham ($100,000 to $90,800). Contributions for Portland ($900,000 to $1,090,000) and Windham ($25,849 to $35,849) increased. Westbrook remained the same at $300,000. Portland R&R is increased by a $125,000 contribution made by CMP for the use of land for a substation. The estimated 2020 expenditures from the R&R funds are based on the 2020 Capital Improvements Budget as outlined in the Capital Expenditure section.
CAPE
ELIZABETH CUMBERLAND GORHAM PORTLAND WESTBROOK WINDHAM
Balance 12/31/17 208,371 247,816 939,593 4,065,613 3,241,557 338,538
Contribution - 2018 100,000 72,538 86,690 720,000 370,574 35,849 Operating Surplus Transfer 32,896 32,270 8,131 381,289 40,323 19,935 Expenditure (29,943) (4,901) (25,911) (572,168) (141,289) (10,099) Balance 12/31/18 Estimated 311,324 347,723 1,008,503 4,594,734 3,511,165 384,223
Contribution - 2019 125,000 54,700 100,000 900,000 300,000 25,849 Operating Surplus Transfer - - - 301,066 - - Expenditure (Est'd) (175,236) (20,000) (182,730) (1,713,591) (496,622) (34,553) Balance 12/31/19 Estimated 261,088 382,422 925,773 4,082,209 3,314,543 375,519
Contribution - 2020 120,700 40,000 90,800 1,090,000 300,000 35,849 Operating Surplus Transfer 125,000 Expenditure (Est'd) (100,000) (152,650) (384,150) (854,450) (116,100) (142,650) Balance 12/31/20 Estimated 281,788 269,772 632,423 4,442,759 3,498,443 268,718
Target Renew al & Replacement (5% of Gross Capital Assets) $824,000 $392,000 $892,000 $5,673,000 $1,025,000 $151,000
The Cumberland fund has a separate contracted R&R reserve that is used to pay its share of capital expenses to the Town of Falmouth. Falmouth operates the facilities and manages the capital projects. They then bill the Cumberland fund for a portion of those capital expenditures because those Falmouth facilities are also used to provide wastewater services to Cumberland. The contracted R&R reserve started in 2018 with a contribution of $52,910. Contributions are $15,000 and $30,000 for 2019 and 2020, respectively. The projected 2020 end of year balance is $2,426.
-
10,000
20,000
30,000
40,000
50,000
60,000
-
10,000
20,000
30,000
40,000
50,000
60,000
$ Amt Balance

283 Capital Expenditures
S
S
Introduction A five-year capital improvement plan is developed each year taking into consideration various factors including Infrastructure and Operational Evaluation Plans, Strategic/Tactical Goals and Benchmarks, Multi-year Financial Projections and Board Established Budget Guidelines (described in the Introduction Section). The plan is developed with much of our stakeholder’s input, including input from customers, municipalities, regulators and staff. Staff recommends the Board of Trustees authorize the projects for the first year of the plan to be completed. Capital Expenditures are for a physical asset that exceeds $10,000 and has a useful life of greater than 5 years or extends the useful life of an existing asset for more than 5 years.
*CWSSP – Comprehensive Water System Strategic Plan
Service Goals
Stakeholder Input
Trustees Goals
Master Plans
Financial Goals

284 Capital Expenditures
Capital Improvement Program Process
East End CPEPortland Pump
Station CPE
CWSSP PlanWater Storage
Facilities Evaluation
Westbrook CPEGorham Windham
System Master Plans
Asset Management Yearly Pump Station
Report
CIP Draft Recommendations
5-10 year Financial ModelsCWSSP rate Model
Portland Assessment modelWestbrook/Gorham Assessment model
Cumberland rate modelCape Elizabeth assessment model
Windham assessment model
Do Results Meet the Financial Management Goals
Final 5-year CIP
Revised Proposed
CIP
IF NO
Water Supply Study - Otter
Ponds
Technology Master Plan
Douglass Street Facilities plan
Municipal and MDOT plans and projectsMunicipal Input- Public Works, planners and yearly assessment meetings
Life cycle costing
Audit of AssetsLevel of Services
Board of Trustees GoalsAssessment meeting input
Infrastructure and Operational Evaluation Plans
Infrastructure and Operational Evaluation Plans The water and wastewater industry is an infrastructure-oriented industry. Approximately 95% of the District’s total assets are infrastructure assets and capital-financing costs related to those assets are 30% of the annual budget. As the chart above indicates, a number of studies have been conducted to provide an assessment of those assets and is the basis for the capital improvement plan. Some of the studies are discussed in future pages by fund.

285 Capital Expenditures
Program Summary and Board of Trustees Approval Order
Program -2020- -2021- -2022- -2023- -2024- -Total-
Comprehensive Planning $750,000 $750,000
SCADA & Technology $616,000 $600,000 $250,000 $250,000 $250,000 $1,966,000
Vehicle/Equipment Replacement $400,000 $400,000 $400,000 $400,000 $400,000 $2,000,000
Water Distribution System $9,465,000 $8,475,000 $10,675,000 $16,475,000 $9,475,000 $54,565,000
Water Facilities Program $790,000 $4,825,000 $1,050,000 $925,000 $2,025,000 $9,615,000
Water Supply $25,000 $25,000 $25,000 $25,000 $25,000 $125,000
WW Collection & Pumping $2,860,000 $1,660,000 $635,000 $1,320,000 $2,155,000 $8,630,000
WW Treatment $13,920,000 $3,840,000 $2,620,000 $6,620,000 $6,070,000 $33,070,000
Grand Total $28,076,000 $20,575,000 $15,655,000 $26,015,000 $20,400,000 $110,721,000
Proposed Board Action: ORDERED: that the 2020-2024 Capital Improvement Plan is hereby adopted and the General Manager is authorized to solicit bids or proposals for the year 2020 projects, and to authorize the General Manager to award contracts for approved projects to the lowest bidder if the bid is within the project budget. BE IT FURTHER ORDERED: that the General Manager shall solicit bids or proposals and to partner with Municipalities, MDOT and Developers for the year 2019 for the replacement and extension of water mains, services, valves and hydrants as outlined in the Water Distribution Systems Program and to authorize the General Manager to award and enter into contracts if the bid or partnering proposals are within the overall program budget.
SCADA & Technology, $616,000
Vehicle/Equipment Replacement, $400,000
Water Distribution System, $9,465,000
Water Facilities Program, $790,000
Water Supply, $25,000
WW Collection & Pumping, $2,860,000
WW Treatment, $13,920,000
2020 CIP

286 Capital Expenditures
Program Summary by Fund
Capital projects are recorded into the appropriate Water or Wastewater fund. The table summarizes the
proposed 2020 Capital Improvement Plan by fund with a page reference where more details are provided on the
projects. Gorham, Westbrook and Windham Wastewater system has a jointly used treatment plant located in
Portland. Those costs are allocated between the municipalities – see the financial policies section for more
information.
Program Summary
Fund(s) -2020-
Page Reference
Introduction
Page Reference
Project Listing
Water $9,506,000 290 293 SCADA & Technology $66,000
Water Distribution System $9,075,000
Water Facilities Program $340,000
Water Supply $25,000
Cape Elizabeth Wastewater $530,000 311 312 WW Collection & Pumping $455,000
WW Treatment $75,000
Cumberland Wastewater $20,000 316 317 WW Collection & Pumping $20,000
Gorham Wastewater $20,000 290 292 WW Collection & Pumping $20,000
Westbrook Wastewater $45,000
WW Collection & Pumping $45,000 320 323 Windham Wastewater $20,000
WW Collection & Pumping $20,000 320 323 Gorham/Westbrook/Windham Wastewater $11,300,000
WW Treatment $11,300,000 320 323 Gorham/Windham Wastewater $300,000
WW Collection & Pumping $300,000 320 323 Portland Wastewater $4,545,000
WW Collection & Pumping $2,000,000 333 335 WW Treatment $2,545,000
Wastewater-All $350,000 342 343 SCADA & Technology $350,000
Water and Wastewater $1,440,000 345 345 Comprehensive Planning
SCADA & Technology $200,000
Vehicle/Equipment Replacement $400,000
Water Distribution System $390,000
Water Facilities Program $450,000
Grand Total $28,076,000

287 Capital Expenditures
Financing Summary of 2020 Capital Improvement Plan
Capital projects are financed through the issuance of bonds – general market bonds or low-interest rate state
revolving loan program bonds – or drawdowns from the renewal and replacement funds. The Capital Financing
section contains more information.
Bond General
Program
Bond State
Revolving Loan
Renewal and
Replacement Grand Total
Water $7,000,000 $2,506,000 $9,506,000
SCADA & Technology $66,000 $66,000
Water Distribution System $7,000,000 $2,075,000 $9,075,000
Water Facilities Program $340,000 $340,000
Water Supply $25,000 $25,000
Cape Elizabeth Wastewater $430,000 $100,000 $530,000
WW Collection & Pumping $430,000 $25,000 $455,000
WW Treatment $75,000 $75,000
Cumberland Wastewater $20,000 $20,000
WW Collection & Pumping $20,000 $20,000
Portland Wastewater $3,700,000 $845,000 $4,545,000
WW Collection & Pumping $1,950,000 $50,000 $2,000,000
WW Treatment $1,750,000 $795,000 $2,545,000
Gorham Wastewater $20,000 $20,000
WW Collection & Pumping $20,000 $20,000
Westbrook Wastewater $45,000 $45,000
WW Collection & Pumping $45,000 $45,000
Windham Wastewater $20,000 $20,000
WW Collection & Pumping $20,000 $20,000
Gorham/Westbrook/Windham Wastewater $11,250,000 $50,000 $11,300,000
WW Treatment $11,250,000 $50,000 $11,300,000
Gorham/Windham Wastewater $300,000 $300,000
WW Collection & Pumping $300,000 $300,000
Wastewater-All $350,000 $350,000
SCADA & Technology $350,000 $350,000
Water and Wastewater $1,440,000 $1,440,000
SCADA & Technology $200,000 $200,000
Vehicle/Equipment Replacement $400,000 $400,000
Water Distribution System $390,000 $390,000
Water Facilities Program $450,000 $450,000
Grand Total $7,430,000 $14,950,000 $5,696,000 $28,076,000

288 Capital Expenditures
Five-Year Capital Improvement Plan
In addition to planning the capital projects for the upcoming year, a five-year plan has been developed to assist
us in managing our staff, communicating to our external partners to improve coordination and developing
financial projections to set expectations of future water rate and wastewater assessments adjustments.
The table below summarizes the planned capital projects in the upcoming year. Additional details on each
program are provided on the following pages.
Program Summary Fund(s) -2020- -2021- -2022- -2023- -2024- -Total-
Water $9,506,000 $12,225,000 $10,800,000 $16,300,000 $9,650,000 $58,481,000
SCADA & Technology $66,000 $50,000 $50,000 $50,000 $50,000 $266,000
Water Distribution System $9,075,000 $8,075,000 $10,275,000 $16,075,000 $9,075,000 $52,575,000
Water Facilities Program $340,000 $4,075,000 $450,000 $150,000 $500,000 $5,515,000
Water Supply $25,000 $25,000 $25,000 $25,000 $25,000 $125,000
Cape Elizabeth Wastewater $530,000 $330,000 $150,000 $415,000 $325,000 $1,750,000
WW Collection & Pumping $455,000 $305,000 $25,000 $340,000 $25,000 $1,150,000
WW Treatment $75,000 $25,000 $125,000 $75,000 $300,000 $600,000
Cumberland Wastewater $20,000 $420,000 $20,000 $20,000 $20,000 $500,000
WW Collection & Pumping $20,000 $420,000 $20,000 $20,000 $20,000 $500,000
Portland Wastewater $4,545,000 $3,865,000 $2,470,000 $6,895,000 $6,870,000 $24,645,000
WW Collection & Pumping $2,000,000 $800,000 $200,000 $400,000 $2,050,000 $5,450,000
WW Treatment $2,545,000 $3,065,000 $2,270,000 $6,495,000 $4,820,000 $19,195,000
Gorham Wastewater $20,000 $20,000 $350,000 $20,000 $20,000 $430,000
WW Collection & Pumping $20,000 $20,000 $350,000 $20,000 $20,000 $430,000
Westbrook Wastewater $45,000 $95,000 $20,000 $20,000 $20,000 $200,000
WW Collection & Pumping $45,000 $95,000 $20,000 $20,000 $20,000 $200,000
Windham Wastewater $20,000 $20,000 $20,000 $520,000 $20,000 $600,000
WW Collection & Pumping $20,000 $20,000 $20,000 $520,000 $20,000 $600,000
Gorham/Westbrook/Windham WW $11,300,000 $750,000 $225,000 $50,000 $950,000 $13,275,000
WW Treatment $11,300,000 $750,000 $225,000 $50,000 $950,000 $13,275,000
Gorham/Windham Wastewater $300,000 $300,000
WW Collection & Pumping $300,000 $300,000
Wastewater-All $350,000 $350,000 $700,000
SCADA & Technology $350,000 $350,000 $700,000
Water and Wastewater $1,440,000 $2,500,000 $1,600,000 $1,775,000 $2,525,000 $9,840,000
Comprehensive Planning $750,000 $750,000
SCADA & Technology $200,000 $200,000 $200,000 $200,000 $200,000 $1,000,000
Vehicle/Equipment Replacement $400,000 $400,000 $400,000 $400,000 $400,000 $2,000,000
Water Distribution System $390,000 $400,000 $400,000 $400,000 $400,000 $1,990,000
Water Facilities Program $450,000 $750,000 $600,000 $775,000 $1,525,000 $4,100,000
Grand Total $28,076,000 $20,575,000 $15,655,000 $26,015,000 $20,400,000 $110,721,000

289 Capital Expenditures
Five-Year Capital Improvement Plan Impact on the Operating Budget
The proposed Capital Improvement Plan impacts the Operating results of the fund due to changes in on-going
operating costs and debt service payments for those projects being bonded. The Operating results impact is
included in the 5-year projections in the Budget by Fund section. The Capital Financing section includes more
information on the debt service payment impact. The table below indicates the impact on operating expenses for
the 2020 CIP only.
Operating Expense Impact of Proposed CIPFund(s) -2020- -2021- -2022- -2023- -2024- -Total-
Water
SCADA & Technology $0 $0 $0 $0 $0 $0
Water Distribution System $97,501 $615,000 $604,750 $594,500 $584,250 $2,496,001
Water Facilities Program $0 $0 $0 $0 $0 $0
Water Supply $0 $0 $0 $0 $0 $0
Cape Elizabeth Wastewater
WW Collection & Pumping $0 $1,100 $33,325 $32,734 $32,143 $99,302
WW Treatment $0 $0 $0 $0 $0 $0
Cumberland Wastewater
WW Collection & Pumping $0 $0 $0 $0 $0 $0
Portland Wastewater
WW Collection & Pumping $0 $2,000 $138,600 $137,445 $136,290 $414,335
WW Treatment $0 $2,800 $126,000 $124,950 $123,900 $377,650
Gorham Wastewater
WW Collection & Pumping $0 $0 $0 $0 $0 $0
Westbrook Wastewater
WW Collection & Pumping $0 $0 $0 $0 $0 $0
Windham Wastewater
WW Collection & Pumping $0 $0 $0 $0 $0 $0
Gorham/Westbrook/Windham WW
WW Treatment $0 $15,000 $708,750 $702,844 $699,938 $2,126,532
Gorham/Windham Wastewater
WW Collection & Pumping $0 $0 $0 $0 $0 $0
Wastewater-All
SCADA & Technology $0 $0 $0 $0 $0 $0
Water and Wastewater
Comprehensive Planning $0 $750,000 $0 $0 $0 $750,000
SCADA & Technology $0 $0 $0 $0 $0 $0
Vehicle/Equipment Replacement $0 $0 $0 $0 $0 $0
Water Distribution System $0 $0 $0 $0 $0 $0
Water Facilities Program $0 $0 $0 $0 $0 $0
Grand Total $97,501 $1,385,900 $1,611,425 $1,592,473 $1,576,521 $6,263,820

290 Capital Expenditures
Water Fund
Comprehensive Water System Strategic Plan (CWSSP) - March 2003 Camp Dresser & McKee, engineering consultants, completed the master plan of the distribution system in March of 2003. The plan was prepared to guide the development, operations and financing of the water system through year 2020. The first 7- year planning cycle (priority - 1 projects 2003-2010) included an investment increase in the water main renewal program (see chart below). Along with the increase in water main renewals, the District also undertook the replacement of our existing water meters with new radio read meters. The project was completed in 2009 as recommended in the plan. CWSSP also recommended removal or rehabilitation of existing water storage tanks. The District has removed three tanks from the system – Munjoy Hill reservoir, Shore Acres and Oak Hill. In 2008, the District rehabilitated 2-tanks, Steep Falls and Gowen. In 2009, the Standish Tank was rehabilitated and a bulk mixer added. In 2012, modifications were made to the concrete tanks to comply with OHSA fall protection standards. In the plan, system deficiencies and recommended actions were identified. The most significant project identified from the priority - 1 projects was inadequacies associated with service from the Elevation 407 zone. CWSSP recommended the combining of the 407-north zone with the south zone. Many projects have been completed to that end. This included transmission main piping in the MDOT Rte. 202/Presumpscot River Bridge project, installation of 8,000 feet of trunk main on Fort Hill road along with several upgrades in the Little Falls area of Gorham and Windham as part of the Little Falls Conveyance Project. In 2008, 4,000 feet of transmission main was extended to the new pump station location on Ward’s Hill road. In 2009, the transmission main was extended from the end of the Fort Hill main along Huston Road to the proposed pump station location. In 2016 the District completed the Transmission portion of the north 407 zone by extending 24” main from the pump station site 6,500 feet down Dyer Road and Huston Road to Rte. 202 connecting into the 2008 upgrades. This project provided an increase in pressure to approximately 150 customers that had substandard pressure and increased fire protection to the area. A hydraulic analysis of the combined system and final design of the new 407 zone pump station (Wards Hill) was completed in 2017. The pump station construction started in 2017 (CIP #307) and was on-line in September 2018. Land acquisition and design for a new storage facility to replace the Windham Center Tank is underway and construction of the new tank was funded in the 2019 CIP (CIP #307) with an expected construction start of fall 2020. Proposed in the 2020 CIP is to extend the 407 zone transmission system to connect the south zone to the north zone. (CIP 307/3066).
1.2 1.9 1.9 2.5 3 3.56 6.5 7 7 7
8.87
$0
$5
$10
20
02
20
04
20
07
20
11
20
12
20
13
20
14
20
15
20
16
20
17
20
18
20
19
20
20
Funding for Water Main Replacements
2002 -2020 $Millions
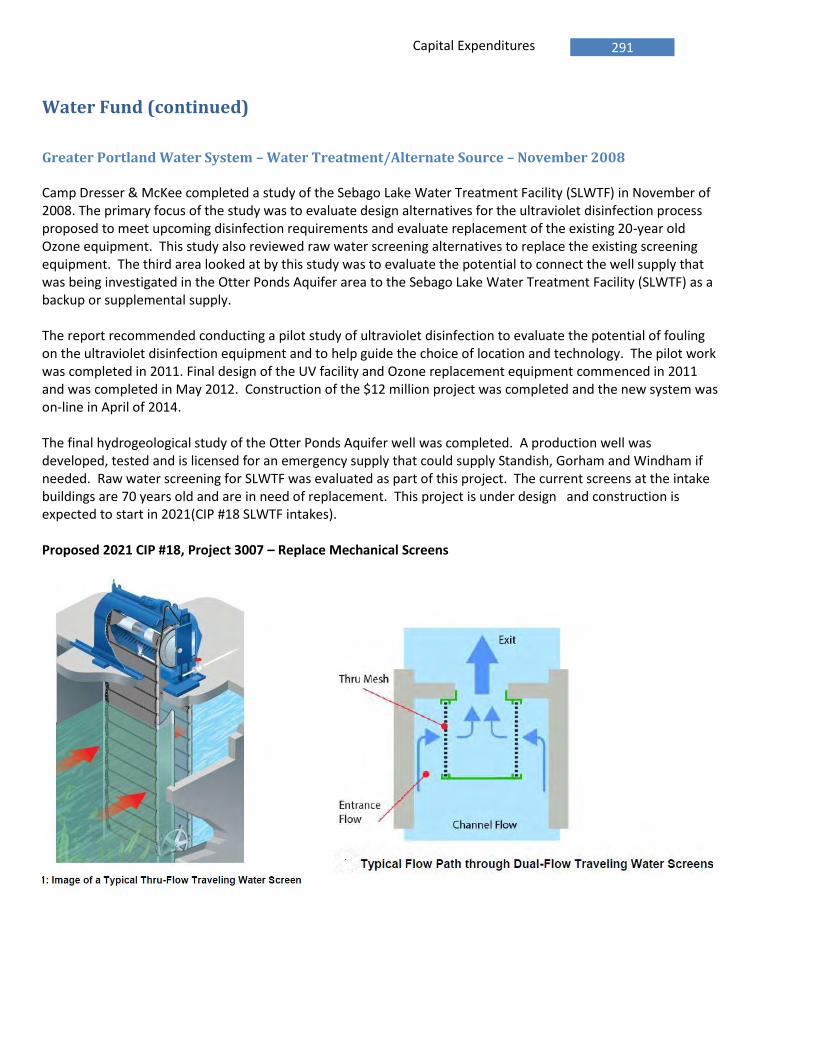
291 Capital Expenditures
Water Fund (continued)
Greater Portland Water System – Water Treatment/Alternate Source – November 2008 Camp Dresser & McKee completed a study of the Sebago Lake Water Treatment Facility (SLWTF) in November of 2008. The primary focus of the study was to evaluate design alternatives for the ultraviolet disinfection process proposed to meet upcoming disinfection requirements and evaluate replacement of the existing 20-year old Ozone equipment. This study also reviewed raw water screening alternatives to replace the existing screening equipment. The third area looked at by this study was to evaluate the potential to connect the well supply that was being investigated in the Otter Ponds Aquifer area to the Sebago Lake Water Treatment Facility (SLWTF) as a backup or supplemental supply. The report recommended conducting a pilot study of ultraviolet disinfection to evaluate the potential of fouling on the ultraviolet disinfection equipment and to help guide the choice of location and technology. The pilot work was completed in 2011. Final design of the UV facility and Ozone replacement equipment commenced in 2011 and was completed in May 2012. Construction of the $12 million project was completed and the new system was on-line in April of 2014. The final hydrogeological study of the Otter Ponds Aquifer well was completed. A production well was developed, tested and is licensed for an emergency supply that could supply Standish, Gorham and Windham if needed. Raw water screening for SLWTF was evaluated as part of this project. The current screens at the intake buildings are 70 years old and are in need of replacement. This project is under design and construction is expected to start in 2021(CIP #18 SLWTF intakes). Proposed 2021 CIP #18, Project 3007 – Replace Mechanical Screens
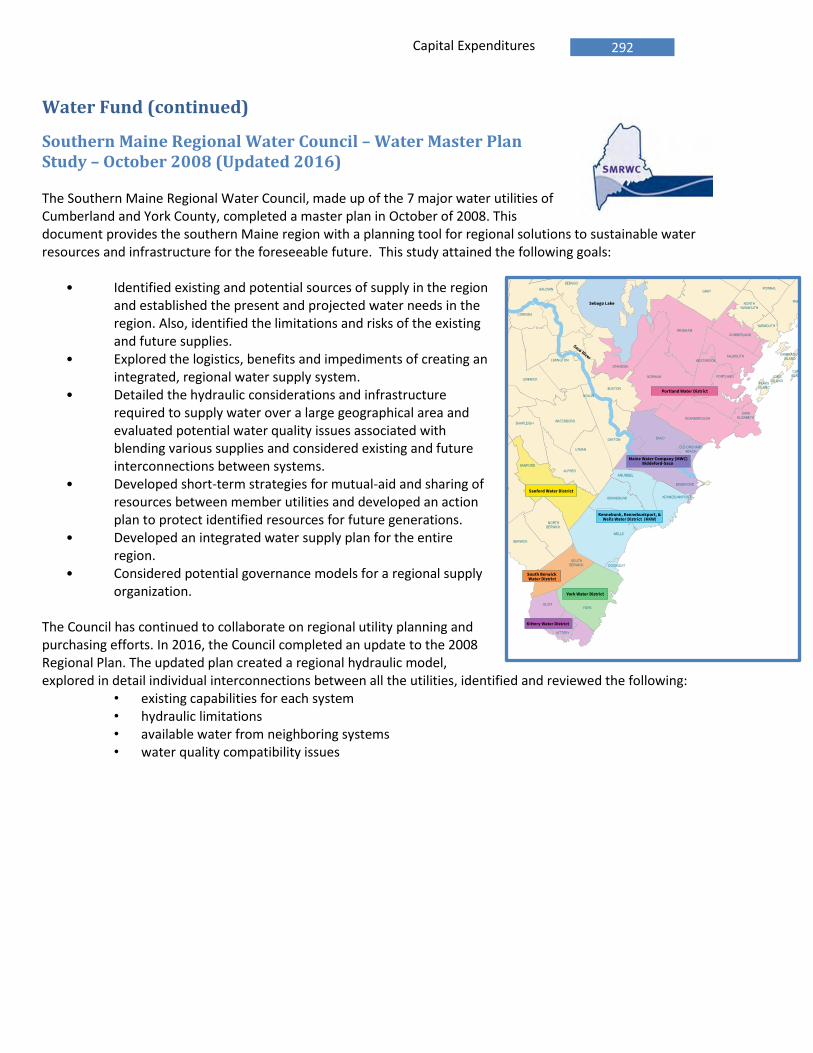
292 Capital Expenditures
Water Fund (continued)
Southern Maine Regional Water Council – Water Master Plan Study – October 2008 (Updated 2016) The Southern Maine Regional Water Council, made up of the 7 major water utilities of Cumberland and York County, completed a master plan in October of 2008. This document provides the southern Maine region with a planning tool for regional solutions to sustainable water resources and infrastructure for the foreseeable future. This study attained the following goals:
• Identified existing and potential sources of supply in the region and established the present and projected water needs in the region. Also, identified the limitations and risks of the existing and future supplies.
• Explored the logistics, benefits and impediments of creating an integrated, regional water supply system.
• Detailed the hydraulic considerations and infrastructure required to supply water over a large geographical area and evaluated potential water quality issues associated with blending various supplies and considered existing and future interconnections between systems.
• Developed short-term strategies for mutual-aid and sharing of resources between member utilities and developed an action plan to protect identified resources for future generations.
• Developed an integrated water supply plan for the entire region.
• Considered potential governance models for a regional supply organization.
The Council has continued to collaborate on regional utility planning and purchasing efforts. In 2016, the Council completed an update to the 2008 Regional Plan. The updated plan created a regional hydraulic model, explored in detail individual interconnections between all the utilities, identified and reviewed the following:
• existing capabilities for each system • hydraulic limitations • available water from neighboring systems • water quality compatibility issues

293 Capital Expenditures
Water Fund (continued)
Program Summary Fund(s) -2020- -2021- -2022- -2023- -2024- -Total-
Water
SCADA & Technology $66,000 $50,000 $50,000 $50,000 $50,000 $266,000
Water Dis tribution System $9,075,000 $8,075,000 $10,275,000 $16,075,000 $9,075,000 $52,575,000
Water Faci l i ties Program $340,000 $4,075,000 $450,000 $150,000 $500,000 $5,515,000
Water Supply $25,000 $25,000 $25,000 $25,000 $25,000 $125,000
Water Total $9,506,000 $12,225,000 $10,800,000 $16,300,000 $9,650,000 $58,481,000
Grand Total $9,506,000 $12,225,000 $10,800,000 $16,300,000 $9,650,000 $58,481,000
Project by Program and Subprogram/Project Summary Program -2020- -2021- -2022- -2023- -2024- -Total-
SCADA & Technology
110\3058 Miscel laneous Control Project Upgrades $50,000 $50,000 $50,000 $50,000 $50,000 $250,000
110\3062 SLWTF SCADA Server Replacement Project $16,000 $16,000
SCADA & Technology Total $66,000 $50,000 $50,000 $50,000 $50,000 $266,000
Water Distribution System
262\3069 SLWTF - Emergency Storage/Transmiss ion- Des ign $600,000 $600,000
262\3070 SLWTF - Emergency Storage/Trans - Construction $6,000,000 $6,000,000
307\3066 407 Zone North Transmiss ion Improvements( Depot)$1,000,000 $1,000,000
307\3067 407 Zone Rel iabi l i ty Improvements $1,600,000 $1,600,000
307\3068 407 Zone Rel iabi l i ty Improvements $2,000,000 $2,000,000
408\3092 Water System Redundancy (looping), Ups izing $50,000 $50,000 $50,000 $50,000 $50,000 $250,000
43\3121A WMR- Various Main Replacements $6,000,000 $6,000,000 $6,000,000 $6,000,000 $7,000,000 $31,000,000
43\3121B WMR- Various Main Replacements $1,000,000 $1,000,000 $1,000,000 $1,000,000 $1,000,000 $5,000,000
53\3087 Water Valve Replacement $200,000 $200,000 $200,000 $200,000 $200,000 $1,000,000
56\3077 Water Main Replacement - Seasonal Mains $25,000 $25,000 $25,000 $25,000 $25,000 $125,000
61\3082 Water Services - Renew Domestic and Fi re $600,000 $600,000 $600,000 $600,000 $600,000 $3,000,000
65\3072 Water Hydrant Replacement $200,000 $200,000 $200,000 $200,000 $200,000 $1,000,000
Water Distribution System Total $9,075,000 $8,075,000 $10,275,000 $16,075,000 $9,075,000 $52,575,000
Water Facilities Program
122\3008 Steep Fa l l s Finished Water Piping Replacement$125,000 $125,000
122\3032 Water Faci l i ties R&R $50,000 $100,000 $100,000 $100,000 $100,000 $450,000
122\3033 Ozone Generator Cool ing - Auto Temp Control $115,000 $115,000
122\3210 Chemica l Storage Faci l i ties Upgrades $300,000 $300,000
122\3211 Windham Pump Upgrades $350,000 $350,000
18\3007 SLWTF Intake Screening Phase 1 $3,500,000 $3,500,000
203\3102 Water Storage Faci l i ty Maintenance & Upgrade$50,000 $25,000 $50,000 $50,000 $50,000 $225,000
203\3104 Water Tank Maintenance- Gorham Tank Rehab $450,000 $450,000
Water Facilities Program Total $340,000 $4,075,000 $450,000 $150,000 $500,000 $5,515,000
Water Supply
46\3097 Water System Securi ty Improvements $25,000 $25,000 $25,000 $25,000 $25,000 $125,000
Water Supply Total $25,000 $25,000 $25,000 $25,000 $25,000 $125,000
Grand Total $9,506,000 $12,225,000 $10,800,000 $16,300,000 $9,650,000 $58,481,000

294 Capital Expenditures
Water Fund (continued)
Financing Summary (see table on adjacent page for specific project)Funding Source -2020- -2021- -2022- -2023- -2024- -Total-Bond General Program $7,000,000 $9,500,000 $8,200,000 $14,000,000 $7,000,000 $45,700,000
Renewal and Replacement $2,506,000 $2,725,000 $2,600,000 $2,300,000 $2,650,000 $12,781,000
Grand Total $9,506,000 $12,225,000 $10,800,000 $16,300,000 $9,650,000 $58,481,000
Project Purpose (see table on adjacet page for specific project)
0
2000000
4000000
6000000
8000000
10000000
12000000
14000000
16000000
18000000
-2020- -2021- -2022- -2023- -2024-
Upgrade Obsolete Facility
Improvement

295 Capital Expenditures
Subprogram # 110 SCADA/Process Control - Water Division: Water - General Manager: Pellerin, Greg Funding: R & R – Water-Div. 20 Priority: Upgrade obsolete facility
Description:
The program supports 30 water sites across the District in upgrading and replacing the existing Supervisory Control and Data Acquisition (SCADA) equipment. The work needed is replacement of hardware and software to be compatible to the District SCADA standards and provide for increased automation of the water systems and treatment. Programmable Logic Controllers (PLC) have been replaced across the District to meet the new standards and remove outdated, non-maintainable equipment. Justification / Impact:
The benefit of this program is to increase the automation and reduce the staff hours needed to perform routine activities for the systems and treatment plants across the District. History:
The District started changing out the system in 2003 by replacing the existing 20 year-old system and installing new SCADA equipment where it did not exist. Most systems have been retrofitted or replaced but more automation of these systems will continue. Origin of the Subprogram:
Budget Summary:
Budget year Project Budget Year Cost 2020 - R&R 3058 Miscellaneous Control Project Upgrades $50,000 2020 - R&R 3062 SLWTF SCADA Server Replacement Project $16,000 2021 - R&R 3058 Miscellaneous Control Project Upgrade $50,000 2022 - R&R 3058 Micellaneous Control Projects Upgrades $50,000 2023 - R&R 3058 Micellaneous Control Projects Upgrades $50,000 2024 - R&R 3058 Miscellaneous Control Project Upgrades $50,000
Total Cost, All Years: $266,000
Previous Years on CIP: 2003 Related Projects: Subprogram #177

296 Capital Expenditures
Subprogram # 262 SLWTF - Emergency Storage/60" Transmission Ph. 1 Division: Water - General Manager: Johnson, Gordon Funding: Bonds - Water - Div. 20 Priority: Customer driven
Description:
Construct a 7.0 Million Gallon Prestressed Concrete Reservoir near the Sebago Lake Water Treatment Facility (SLWTF). Justification / Impact:
The purpose is to provide additional storage for partial redundancy of the SLWTF so that it can be shut down for longer periods of time and improve water quality by relying less on system storage. History:
This project was conceived as part of the Comprehensive Water System Strategic Plan, as a future need and will be assessed further during a future "Water Purification Master Plan." Origin of the Subprogram:
This is a CWSSP recommendation to improve water quality and backup storage. Budget Summary:
Budget year Project Budget Year Cost 2022 - Bond 3069 SLWTF- Emergency Storage/60" Transmission - Design $ 600,000 2023 - Bond 3070 Emergency Storage Tank - 7.0 MG / 60" transmission $6,000,000
Total Cost, All Years: $6,600,000
Previous Years on CIP: 2004 Related Projects: CWSSP #267-1150 Procurement Issues: Standard consulting and/or contractor retention procedures.

297 Capital Expenditures
Subprogram # 307 Gorham/Windham 407 Zone Improvements Division: Water - General Manager: Johnson, Gordon Funding: Bonds – Water - Div. 20 Priority: Upgrade obsolete facility
Description:
Phased design and construction of transmission mains, pumps & water tank for the integration of the 407 Zones (Gorham & Windham). Justification / Impact:
The growth in these communities requires increased capacity. There are also specific service deficiencies and water quality issues that need to be addressed in the 407 Zones. History:
The projects listed below were anticipated by the 1989 Master Plan. Further analysis and identification was undertaken as part of the CWSSP study. Origin of the Subprogram: Projects identified and proposed phasing outlined in Comprehensive Water System Strategic Plan. Budget Summary:
Budget year Project Budget Year Cost 2020 - Bond 3066 407 Zone North Transmission Improvements – Depot St. WI $1,000,000 2022 - Bond 3067 407 Zone Reliability Improvements $1,600,000 2023 - Bond 3068 407 Zone Reliability Improvements II $2,000,000
Total Cost, All Years: $7,500,000
Previous Years on CIP: 2000 Related Projects:
Elevated Storage for 407 zone north. This project will replace an old undersized 1950 Tank (left) with new tank (right) and Land Acquisition.

298 Capital Expenditures
Subprogram # 307 Gorham/Windham 407 Zone Improvements
Public Health, System Reliability and Public Safety Benefits
Replacement of two obsolete pumping Stations (Gorham- 1898, Prides Corner – 1950) with state of the art single new pump station (Wards Hill)
Elimination of pressure limitations to approximately 150 customers
Replacement of old 1950 undersized 0.2 MG Windham Center tank with new 1.0 MG elevated tank
Improved water quality and water age in entire combined system
Fire Flow improvements to Gorham Village and Windham

299 Capital Expenditures
Subprogram # 43 Water Main Replacement Division: Water - General Manager: Johnson, Gordon Funding: Bonds and R&R - Water- Div. 20 Priority: Routine replacement
Description:
Renew, replace, upgrade and loop cast iron water mains using materials and sizing for current and future conditions. Approximately 20,000 feet is scheduled for yearly replacement. Justification / Impact:
This is a cost saving and water quality improvement process. Mains selected for replacement use the same priority system as the Galvanized Main Renewal Program: water quality complaints, leak frequency data, and municipal/state reconstruction projects. History:
Cast iron mains in sizes 2 inches and above had been a standard from the late 1800s until the introduction of Ductile Iron pipe in the late 1960s and early 1970s and PVC and HDPE pipe in the 1980s. The rigidity and lack of flexibility of cast iron has been attributed to failures such as frost movement, cross trenches, water hammers, contractor damages, as well as normal deterioration and corrosion through age. A percentage of these mains are unlined causing iron build up resulting in restricted flow and dirty water complaints. The District has a long term program to upgrade these mains. Origin of the Subprogram:
The current list of projects is determined on the basis of water quality complaints, leak frequency data, age of main, and municipal/state reconstruction projects. Budget Summary:
Budget Year Project Budget Year Cost
2020 Bond 3110 WMR- Walton, Mackworth, Irving, Sawyer , PO $2,000,000
2020 Bond 3111 WMR – Brighton, Deering, Falmouth, Bedford - PO $1,000,000
2020 R&R 3115 WMR- Fore St, Mountfort to Morning, PO $1,000,000
2020 Bond 3117 WMR -College Street, School to Husky Drive -GO $750,000
2020 Bond 3118 WMR - Veranda Street Wordsworth to Martin Pt. - PO $500,000
2020 Bond 3219 WMR – Pearl Street, Commercial to Congress- PO $350,000
2020 Bond 3220 WMR- Mosher Rd- Little River Bridge - GO $200,000
2020 Bond 3221 WMR – Warren Ave- New Turnpike Crossing - PO $600,000
2020 Bond 3222 WMR – Tuttle Road, Culvert at Harris Road – CU $100,000
2020 Bond 3121 WMR- Various Main Replacements - Operations $500,000
2021 Bond 3121 WMR- Various Main Replacements $7,000,000
2022 Bond 3121 WMR- Various Main Replacements $7,000,000
2023 Bond 3121 WMR- Various Main Replacement s $7,000,000
2024 Bond 3121 WMR- Various Main Replacements $7,000,000
Total Cost, All Years $28,000,000
Level of Service – Reliability Performance
Water main break frequency - 10 breaks per
100 miles

300 Capital Expenditures
Subprogram # 43 Water Main Replacement (continued)
Estimated Installed Price/Ft
Walton, Canco to Ocean and Mackworth, Ocean to Clifton, Irving, Sawyer PO 2,000,000$ 5600 357$ PO CSO
Brighton Ave/ Deering /Falmouth/ Bedford - roundabout PO 1,000,000$ 2400 417$ PACTS
Fore Street, Mountfort to Morning Ave PO 1,200,000$ 3000 400$ PO CSO
Warren Ave- Turnpike Crossing PO 600,000$ 1700 353$ MTA/PO
Veranda Street Wordsworth to Martin Pt. 1928 PO 500,000$ 1600 313$ Portland/MDOT
Pearl Street, Commercial to Congress PO 400,000$ 1000 400$ PO CSO
Mosher Road - Little River Bridge replacement project - Gorham GO 200,000$ 400 500$ MDOT
College Street, School to Husky Drivie, Academy GO 750,000$ 2000 375$ Gorham
Tuttle Road, Cumberland - Culvert at Harris Road CU 100,000$ 400 250$ MDOT
Water Main Replacement Projects - Operations 500,000$ 1500 333$
Depot Street, 202 to River Road ( high system connector 407 zone) * WI 1,000,000$ 2600 385$ Windham
*includes $7,000,000 from Subprogram 43 and $1,000,000 from Subprogram 307 $8,000,000
Contracting
Partnering AgencyWater Main Replacement Projects - 2020 DistrictsCIP Budget Pipe Footage

301 Capital Expenditures
City of Portland – CSO Storm Water Separation Project – Mackworth Basin
The following old water mains will be replaced in conjunction with the City of Portland Combined Sewer Overflow (CSO) storm separation project.
Walton Street, Canco to Ocean Ave. - 1600 feet of 6” 1888 cast iron
Ocean Ave Walton to Forest- 2200 feet of 12”, 1911 cast iron (1 leak)
Mackworth St. – Ocean to Clifton – 1300 feet of 6” 1932 cast iron (6 leaks)
Irving Street – Ocean to Bryant – 600 feet of 6” 1914 cast iron
Hersey Street – Ocean to Clifton – 1500 feet of 6” 1931 cast iron (5 leaks) (removed
from project)
Sawyer Street – Ocean to Irving – 700 feet of 6” 1914 cast iron
1.2 1.9 1.9 2.5 3 3.5
6 6.5 7 7 78.8
7
2002 2004 2007 2011 2012 2013 2014 2015 2016 2017 2018 2019 2020
Funding for Water Main Replacements 2002 -2020 $Millions

302 Capital Expenditures
Subprogram # 53 Water Valve Replacement Division: Water - General Manager: Wallace, Jim Funding: R & R - Water - Div. 20 Priority: Routine replacement
Description:
Replacement of deteriorated valves in the distribution system. Justification / Impact:
Replacement is determined and prioritized through data and workorders generated from our Distribution Valve Operation Program, Inspectors Valve Operation Reports, Leak Reports, Flushing Program Data, and the Distribution Maintenance Crews. History:
Internal inspection of valves replaced has shown decay of the discs and spreaders which render the valves non-operational and ineffective in isolating a section of the distribution system. External inspection has shown corrosion of nuts and bolts, corroded operating nuts, and bent operating stems. Repacking and rebolting these valves has only provided a costly and temporary solution to the external portion of the valve. Replacement insures the valve will be up to standard and operational for many years to come with no required maintenance. Origin of the Subprogram:
Our target is to replace 50 ( + or - ) valves per year. Budget Summary:
Budget year Project Budget Year Cost 2020 - R&R 3087 Replace Distribution Valves $200,000 2021 - R&R 3087 Replace Distribution Valves $200,000 2022 - R&R 3087 Replace Distribution Valves $200,000 2023 - R&R 3087 Replace Distribution Valves $200,000 2024 - R&R 3087 Replace Distribution Valves $200,000
Total Cost, All Years: $1,000,000
Previous Years on CIP: All Related Projects: Procurement Issues: Work is to be performed using District Staff, equipment, and materials.

303 Capital Expenditures
Subprogram # 56 Water Main Renewal - Seasonal Mains Division: Water - General Manager: Wallace, Jim Funding: R & R – Water- Div. 20 Priority: Routine replacement
Description:
This portion of the Water Main Renewal Program is to replace depreciated Seasonal Surface mains with new Seasonal Surface mains. Approximately 2000 to 3000 feet of main are included annually in this general program. Justification / Impact:
This program improves customer satisfaction with improved water flow and quality and reduces maintenance costs via new leak free materials. History:
This is a long term program in which old galvanized seasonal water mains with capacity, water quality or maintenance problems are replaced on an as-needed basis. Origin of the Subprogram:
Projects are initiated by monitoring customer complaints and leakage problems. When consistent problems are identified, the main is scheduled for replacement. Budget Summary:
Budget year Project Budget Year Cost 2020 - R&R 3077 Water Main Replacement - Seasonal Mains $25,000 2021 - R&R 3077 Water Main Replacement - Seasonal Mains $25,000 2022 - R&R 3077 Water Main Replacement - Seasonal Mains $25,000 2023 - R&R 3077 Water Main Replacement - Seasonal Mains $25,000 2024 - R&R 3077 Water Main Replacement - Seasonal Mains $25,000
Total Cost, All Years: $125,000
Previous Years on CIP: All Related Projects: Procurement Issues: This work is accomplished by District Staff, equipment and material.

304 Capital Expenditures
Subprogram # 61 Water Services - Renew Domestic & Fire Division: Water - General Manager: Wallace, Jim Funding: R & R – Water- Div. 20 Priority: Routine replacement
Description:
Replace obsolete galvanized, cast iron, cement lined iron, and 50 year old copper services with current materials and sized for future conditions. Justification / Impact:
Replacement is determined and prioritized by water quality concerns, leaking conditions, street reconditioning, distribution main replacement, and area/report analysis through District Data. This Project is also coordinated with the various municipal paving projects in order to minimize future inflated municipal street opening costs and repairs. History:
Galvanized and cast iron were common materials used in the installation of services from the early 1900s to the late 1940s. Copper was also used starting in the 1930s. The relatively inferior material of galvanized and cast iron are subject to rust related water quality and restricted flow problems from plugging as well as leak frequency from deterioration and corrosion. Older copper lines (50 years old + or -) are starting to show signs of leak failures from the old tube nut fittings used to couple fittings together. From a cost and end product comparison it is more efficient to replace than repair. The District has a long term program to replace and upgrade all sub standard services. Origin of the Subprogram:
There are approximately 1,000 ( 1/2" to 2" size) galvanized, cement lined iron, and cast iron domestic services, and an additional 11,000 copper services installed prior to 1950. We also have 260 cast iron services installed prior to 1950. Our goal is to replace at least 300 services per year. Budget Summary:
Budget year Project Budget Year Cost 2020 - R&R 3082 Water Services Replacement $600,000 2021 - R&R 3082 Water Services Replacement $600,000 2022 - R&R 3082 Water Services Replacement $600,000 2023 - R&R 3082 Water Services Replacement $600,000 2024 - R&R 3082 Water Services Replacement $600,000
Total Cost, All Years: $3,000,000
Previous Years on CIP: All Related Projects: Procurement Issues: Project to be performed using District Staff, equipment, and materials
and contracted through our main replacement projects.

305 Capital Expenditures
Subprogram # 61 Water Services - Renew Domestic & Fire
Active (Unexpired) Water Services by Install Date
Install Date # Services % Unknown 3,275 5.9% <= 1910 76 0.1% 1911-1930 1,131 2.0% 1931-1950 9,196 16.5% 1951-1970 13,682 24.6% 1971-2017 31,565 56.7%
Total 55,650

306 Capital Expenditures
Subprogram # 65 Water Hydrants Replacement Division: Water - General Manager: Wallace, Jim Funding: R & R – Water –Div. 20 Priority: Routine replacement
Description:
Replace and upgrade obsolete hydrants to meet current safety and operational standards, and to insure inventory parts availability for hydrant repairs. Justification / Impact:
Replacement is determined and prioritized by: (1) hydrant failures (major damage and/or external leak,) (2) upgrade and replacement of obsolete sub standard hydrants based on (age - safety standards - repair parts availability - cost comparison to replace or repair,) (3) distribution main replacement program, (4) municipal and state reconstruction projects and (5) data gathered from the Hydrant Repair and Reconditioning Programs and the Winter Hydrant Inspection Program. History:
The O&M Hydrant Repair/Reconditioning Programs and the Hydrant Winter Inspection Programs have been in place since the early 60s. These programs insure that our hydrants meet fire protection standards and provide direction for our C. I. P. Replacement Program. In recent times the ability to procure replacement parts for the 620 Matthews Post hydrants (Vintage late 1800s to the late 1940s) has become difficult or impossible. The 870 Darling B-50 hydrants (vintage early 1950s to early 1960s) require major internal rebuilding. Both hydrant makes are not traffic model hydrants and fail to have a sheer point to breakaway on impact. This failure results in costly repairs and replacements, and is unsafe in many highway standards (Deadly-Fixed-Objects Regulation). Origin of the Subprogram:
Our project is focused on replacing and upgrading 75 hydrants per year over a twenty year replacement program of 1450 hydrants. Budget Summary:
Budget year Project Budget Year Cost 2020 - R&R 3072 Hydrant Replacement $200,000 2021 - R&R 3072 Hydrant Replacement $200,000 2022 - R&R 3072 Hydrant Replacement $200,000 2023 - R&R 3072 Hydrant Replacement $200,000 2024 - R&R 3072 Hydrant Replacement $200,000
Total Cost, All Years: $1,000,000
Previous Years on CIP: All Related Projects: Procurement Issues: Project is performed using District staff, equipment, and materials.
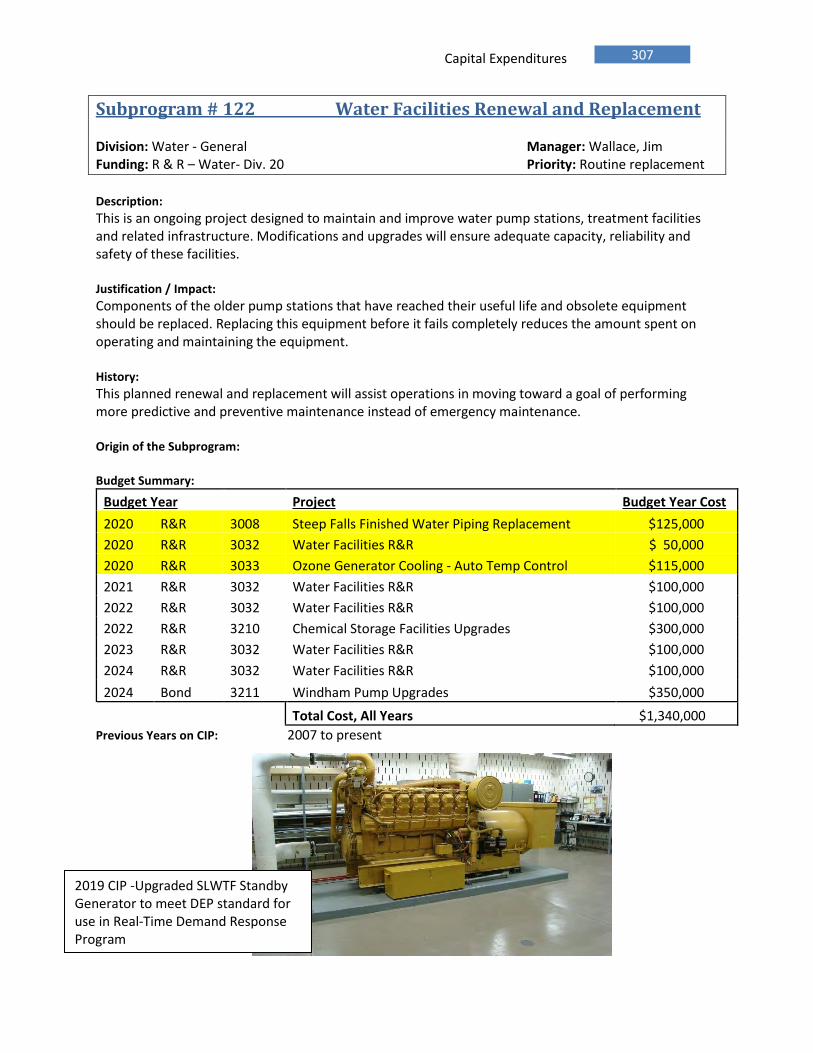
307 Capital Expenditures
Subprogram # 122 Water Facilities Renewal and Replacement Division: Water - General Manager: Wallace, Jim Funding: R & R – Water- Div. 20 Priority: Routine replacement
Description:
This is an ongoing project designed to maintain and improve water pump stations, treatment facilities and related infrastructure. Modifications and upgrades will ensure adequate capacity, reliability and safety of these facilities. Justification / Impact:
Components of the older pump stations that have reached their useful life and obsolete equipment should be replaced. Replacing this equipment before it fails completely reduces the amount spent on operating and maintaining the equipment. History:
This planned renewal and replacement will assist operations in moving toward a goal of performing more predictive and preventive maintenance instead of emergency maintenance. Origin of the Subprogram:
Budget Summary:
Budget Year Project Budget Year Cost
2020 R&R 3008 Steep Falls Finished Water Piping Replacement $125,000
2020 R&R 3032 Water Facilities R&R $ 50,000
2020 R&R 3033 Ozone Generator Cooling - Auto Temp Control $115,000
2021 R&R 3032 Water Facilities R&R $100,000
2022 R&R 3032 Water Facilities R&R $100,000
2022 R&R 3210 Chemical Storage Facilities Upgrades $300,000
2023 R&R 3032 Water Facilities R&R $100,000
2024 R&R 3032 Water Facilities R&R $100,000
2024 Bond 3211 Windham Pump Upgrades $350,000
Total Cost, All Years $1,340,000
Previous Years on CIP: 2007 to present
2019 CIP -Upgraded SLWTF Standby Generator to meet DEP standard for use in Real-Time Demand Response Program

308 Capital Expenditures
Subprogram # 18 SLWTF Intakes - Replace Mechanical Screens Division: Water - General Manager: Johnson, Gordon Funding: Bonds - Water- Div. 20 Priority: Routine replacement
Description:
This project involves selecting and installing a screen system to replace the existing screens in service at the intakes on Sebago Lake. The present systems use two travelling screens with backwash at each location with three sets of hand screens at the 1925 Intake and two sets of hand screens at the 1952 Intake. Justification / Impact:
The existing equipment is approaching 50 years old and is basically worn out. The new equipment will be chosen to automate the screening process as much as possible to minimize operator time and reduce/prevent fish breakthrough. History:
The intake screens were supposed to be retired after SLWTF start-up. Manual screens, designed for the inlet channel of the ozone contactor, were supposed to replace the need for the ones at the intakes. Unfortunately, a method for washing the screens was not designed into the facility. Many attempts were made to use the inlet screens before deciding to continue the use of the intake screens. Origin of the Subprogram:
The hand and travelling screens at the intake buildings were installed in the early 1950's. They are past their expected lifespan. Present washing procedures are labor intensive, requiring nine to fifteen labor hours per week. We have experienced small fish getting by the screens and showing up in the clearwell. The ozone and chlorination process kills the fish, but we do not want to let them escape into the system. Budget Summary:
Budget year Project Budget Year Cost 2021 - Bond 3007 Replace Mechanical Screens $3,500,000
Total Cost, All Years: $3,500,000
Previous Years on CIP: 1998 to present Related Projects: Procurement Issues: Internal engineering services followed by competitive proposals for
purchase and installation.

309 Capital Expenditures
Subprogram # 203 Water Storage Facility Maintenance & Upgrade Division: Water - General Manager: Johnson, Gordon Funding: R & R - Water - Div. 20 Priority: Routine replacement
Description:
This project consists of developing a maintenance program. Maintenance that may be necessary includes leak repair, painting, inside liners, base and/or cover needs. Once this work is complete, a multi-year program of maintenance contracts will be implemented to upgrade individual facilities. In some facilities, recirculation systems to routinely turn over the water in the tank and/or new altitude valves will be installed. Justification / Impact:
Basic maintenance to preserve and prolong the useful life of needed facilities. Prevent water quality problems due to corrosion and from water stagnating in the tank. History:
Several steel standpipes and elevated tanks have been removed over the last decade. Those that remain will be evaluated for their hydraulic value and water quality impact in the Comprehensive Water System Strategic Plan. Those that are considered to be valuable hydraulic assets to the water system will be upgraded via this ongoing program. Origin of the Subprogram:
Maintenance has been deferred for several years pending completion of a hydraulic study to determine which tanks still have hydraulic value. Budget Summary:
Budget year Project Budget Year Cost 2020 - R&R 3102 Water Tank Maintenance $ 50,000 2021 - R&R 3102 Water Tank Maintenance $ 25,000 2021 - Bond 3104 Water Tank Maintenance: Gorham Tank $450,000 2022 - R&R 3102 Water Tank Maintenance $ 50,000 2023 - R&R 3102 Water Tank Maintenance $ 50,000 2024 - R&R 3102 Water Tank Maintenance $ 50,000
Total Cost, All Years: $675,000
Previous Years on CIP: Since 2000 Procurement Issues: RFP preparation and contract administration will be by District Staff.
Maintenance and repair services will be competitively bid.

310 Capital Expenditures
Subprogram # 46 Water System Security Division: Water - General Manager: Wallace, Jim Funding: R & R – Water – Div.20 Priority: Security of facilities
Description:
This program is to improve the physical security of the District's water facilities. The program supports installing and upgrading security measures on District property and facilities. These measures include perimeter fencing, signage, access control, cyber keys and locks, video surveillance and monitoring, security lighting and improved SCADA monitoring. Justification / Impact:
The District has performed two Vulnerability Assessments (2003, 2015) and has been following the recommendations from these reports. History:
In the fall of 2004 and summer of 2005 fencing was installed on the East and West side of the lower bay inside the 2 mile limit. This was funded through the CIP. In 2005 hatch covers along with alarms were installed over tank hatches and a cyberlock system was installed on all SCADA panels. This was funded by a grant from MEMA - Homeland Security. In subsequent years video surveillance and access control were expanded to all major facilities across the District along with continued improvements to perimeter fencing and access control. Origin of the Subprogram:
The vulnerability assessment completed in March of 2003 indicated that physical protection of existing facilities could be improved. Many of those recommendations were completed and a new Vulnerability Assesstment was completed in 2015 and new recommendations are now determining the water system security improvements. Budget Summary:
Budget year Project Budget Year Cost 2020 - R&R 3097 Water System Security Improvements $25,000 2021 - R&R 3097 Water System Security Improvements $25,000 2022 - R&R 3097 Water System Security Improvements $25,000 2023 - R&R 3097 Water System Security Improvements $25,000 2024 - R&R 3097 Water System Security Improvements $25,000
Total Cost, All Years: $125,000
Previous Years on CIP: 2004 to present Related Projects: Procurement Issues: Standard purchasing procedures will apply.

311 Capital Expenditures
Cape Elizabeth Wastewater
Cape Elizabeth – Wastewater Treatment Facilities In response to a regulatory requirement to eliminate bypassing of flows during periods of wet weather, upgrades were completed in 2012 to increase the peak flow capacity of the facility. These upgrades included new influent screening, high flow and low flow return sludge pumps, upsizing a portion of the secondary clarifier effluent piping, and new effluent pumps. Recent engineering evaluations include assessments of the aeration and secondary clarifier structures, disinfection systems, and HVAC equipment. Upgrades recently completed or ongoing include:
Influent alkalinity metering system for enhanced buffering capacity and activated sludge stability
Heating and ventilation system to serve the
headworks and sludge thickening areas
(ongoing)
Replacement of the chlorine and sodium bisulfite chemical disinfection systems with Ultraviolet Disinfection (ongoing)
Cape Elizabeth – Sewer System The current CSO Master Plan identifies reduction of CSO volume through infiltration/inflow (I/I) reduction within the Town’s and City of South Portland’s collection systems and improvements to the Ottawa Road Pump Station. The Town of Cape Elizabeth completed a project that installed new storm drains and helped remove private I/I from residential homes. South Portland has also done work removing catch basins from the sewer system and installing storm drains. PWD work is underway with improvements to the Ottawa Road Pump Station including upgrades to standby power, flow measurement, and pumping. CCTV assessment of the collection system is ongoing as part of the District’s 10 year program to inspect its entire collection system.
Cape Elizabeth - Pump Stations The District has continued with the installation of standby power generators at key pump stations. These generators enable systems to operate during the frequent power outages that occur in Cape Elizabeth while reducing manpower during these events. Additionally, automated emergency power goes a long way towards eliminating the occasional back-ups that have occurred within the collection system. In 2018 CIP an upgrade project was approved for the Family Field (Little John) Pump Station. The District is nearing completion of the detailed design and plans to put the upgrade project out to bid this coming winter for construction in the 2020-2021 season.
UV Disinfection System Project – 2018 CIP 424, project 2701 - Construction of the upgrade will be completed by Spring 2020.

312 Capital Expenditures
Cape Elizabeth Wastewater (continued)
Project by Program and Subprogram/Project Summary Program -2020- -2021- -2022- -2023- -2024- -Total-
WW Collection & Pumping
52\3002 Maiden Cove PS Upgrades $430,000 $430,000
52\3005 Ottawa Rd PS Upgrades $280,000 $280,000
52\3130 Cape Elizabeth Pump Station $25,000 $25,000 $25,000 $25,000 $25,000 $125,000
52\3168 Stonegate South Upgrades $90,000 $90,000
52\3169 Algonquin PS Upgrades $135,000 $135,000
52\3170 Peabbles Cove PS Upgrades $90,000 $90,000
WW Collection & Pumping Total $455,000 $305,000 $25,000 $340,000 $25,000 $1,150,000
WW Treatment
424\3000 Cape WWTF Process Evaluation $50,000 $50,000
424\3129 Cape Elizabeth WWTF $25,000 $25,000 $25,000 $25,000 $25,000 $125,000
424\3188 Phase 2 Improvements $275,000 $275,000
424\3189 Boiler Upgrade/Replacement $100,000 $100,000
424\3213 WAS Piping and RDT Drive Upgrade $50,000 $50,000
WW Treatment Total $75,000 $25,000 $125,000 $75,000 $300,000 $600,000
Grand Total $530,000 $330,000 $150,000 $415,000 $325,000 $1,750,000
Financing Summary (see table above for specific project)Funding Source -2020- -2021- -2022- -2023- -2024- -Total-
Bond General Program $430,000 $280,000 $315,000 $275,000 $1,300,000
Renewal and Replacement $100,000 $50,000 $150,000 $100,000 $50,000 $450,000
Grand Total $530,000 $330,000 $150,000 $415,000 $325,000 $1,750,000
Project Purpose (see table above for specific project)
0
100000
200000
300000
400000
500000
600000
-2020- -2021- -2022- -2023- -2024-
Upgrade Obsolete Facility
Regulatory Mandate

313 Capital Expenditures
Subprogram # 52 Cape Elizabeth Pump Stations - R&R Division: Wastewater - Cape Elizabeth Manager: Poulin, Charlene Funding: Bond and R&R – Wastewater – Div. 51 Priority: Routine replacement
Description:
This program provides a planned approach for the replacement of obsolete equipment in Cape Elizabeth wastewater pump stations. Justification / Impact:
The pump stations have reached the end of their useful design life and obsolete equipment must be replaced. Upgrades, including the addition of VFD's in some cases, will provide more pumping capacity, mitigate CSO activity, and provide some power savings. History:
This planned approach will assist maintenance and operations in moving toward a goal of performing more predictive/preventative maintenance instead of emergency maintenance. Budget Summary:
Budget Year Project Cost
2020 Bond 3002 Maiden Cove PS Upgrades $ 430,000
2020 R&R 3130 Cape Elizabeth Pump Station R&R $ 25,000
2021 Bond 3005 Ottawa Rd PS Upgrades $ 280,000
2021 R&R 3130 Cape Elizabeth Pump Station R&R $ 25,000
2022 R&R 3130 Cape Elizabeth Pump Station R&R $ 25,000
2023 R&R 3130 Cape Elizabeth Pump Station R&R $ 25,000
2023 Bond 3168 Stonegate South Upgrades $ 90,000
2023 Bond 3169 Algonquin PS Upgrades $ 135,000
2023 Bond 3170 Peabbles Cove PS Upgrades $ 90,000
2024 R&R 3130 Cape Elizabeth Pump Station R&R $ 25,000
Total Cost, All Years $ 1,150,000
Previous Years on CIP: 2005 to present Related Projects: Subprogram #407
Ottawa Road Pump Station – Installed in
1976 – scheduled for upgrade in 2021

314 Capital Expenditures
Condition Assessment – Cape Elizabeth Pump Stations
2014 Cape Elizabeth Pump Station Report
Station Rating Station Type Address
Algonquin Pump Station 3.30 Sub Dup 10 Waumbek Road
Birch Knolls 4.00 Sub Sing 19 Birch Knolls
Broad Cove No. Pump Station 3.79 Sub Tri 53 Broad Cove Road
Broad Cove So. Pump Station (2016) 3.15 4.5 Sub Dup 32A Broad Cove Road
Clifford 4.00 Sub Sing 886A Shore Road
Cragmoor North 3.65 Sub Dup 7A Cragmoor
Cragmoor South 3.30 Sub Sing 876A Shore Road
Cross Hill 3.65 Sub Dup 59 Wells Road
Family Field (2018 under design Construction 2020; formerly known as Little John))
2.76 Packaged Dry Pit 7 Little John Road
Garden Ln Pump Station (2014) 5 Sub Dup 5 Garden Lane
Gull Crest - Public Works Building 3.08 Sub Dup 9 Cooper Drive
Gull Crest - Public Works Transfer Station
3.04 Sub Sing 21 Dennison Drive
Hunts Point 3.90 Sub Dup 1A Hunt’s Point Road
Maiden Cove Pump Station Postponed until 2020
1.98 Ejection 5 Kenyon Lane
Mitchell Rd Pump Station (2017) 3.16 Sub Dup 468 Mitchell Road
Oakhurst Pump Station 2.94 Sub Dup 123 Oakhurst Road
Ottawa Rd. Pump Station 2.09 Packaged Dry Pit 14 Ottawa Road
Pachios 3.97 Sub Dup 880A Shore Road
Peabbles Cove Pump Station 3.31 Sub Dup 15 Peabbles Cove Road
Peabbles Point Pump Station 2.87 Sub Dup 56 Shipwreck Cove Road
Running Tide Pump Station 3.59 Sub Dup 13A Running Tide Road
Spurwink Pump Station 4.16 Canned 445 Spurwink Ave
Stonegate North (2016) 3.47 4.5
Sub Dup 30 Stonegate Road
Stonegate South 3.04 Sub Dup 8 Stonegate Road
Tall Pines East Pump Station 4.67 Sub Dup 225 Ocean House Road
Tall Pines Pump Station 2.58 Sub Dup 30 Tall Pine Road
Wildwood Pump Station (2015) 2.95 4.5 Sub Dup 34A Wildwood Drive
Cape Elizabeth Average 3.38
PWD Overall Average (74 Stations) 3.47

315 Capital Expenditures
Subprogram # 424 Cape Elizabeth WWTF Division: Wastewater - Cape Elizabeth Manager: Rodriguez, Paul Funding: R & R – Wastewater – Div. 51 Priority: Routine replacement
Description:
Provide for plant upgrades required to continue to meet regulatory and operational requirements and for the timely routine replacement of equipment nearing the end of its service life. The plant came online in 1988 along with the Spurwink Pump Station which pumps all of the Southern Cape Elizabeth system’s flow to the plant. Treated water is pumped to an outfall located near Peabbles Cove in accordance with the plant’s discharge permit which was renewed in December 2016. Justification / Impact:
Physical assets require scheduled maintenance and eventual replacement. Planned upgrades include instrumentation and control in accordance with current industry practice and provide enhanced automation, monitoring and control of the treatment processes. Regulatory requirements are continuously revised and updated by the EPA and administered by the Maine Department of Environmental Protection. This account provides for the equipment replacement and system upgrades necessary to continue to meet regulatory and operational requirements. History: In response to a regulatory requirement to eliminate bypassing of flows during periods of wet weather, upgrades were completed in 2012 to increase the peak flow capacity of the facility. These upgrades included new influent screening, high flow and low flow return sludge pumps, upsizing a portion of the secondary clarifier effluent piping, and new effluent pumps. Recent engineering evaluations include assessments of the aeration and secondary clarifier structures, disinfection systems, and HVAC equipment. Upgrades recently completed or ongoing include:
Influent alkalinity metering system for enhanced buffering capacity and activated sludge stability
Heating and ventilation system to serve the headworks and sludge thickening areas (ongoing)
Replacement of the chlorine and sodium bisulfite chemical disinfection systems with Ultraviolet
Disinfection (ongoing)
Budget Summary:
Budget Year Project Cost
2020 R&R 3000 Cape WWTF Process Evaluation $ 50,000
2020 R&R 3129 Cape Elizabeth WWTF- R&R $ 25,000
2021 R&R 3129 Cape Elizabeth WWTF- R&R $ 25,000
2022 R&R 3129 Cape Elizabeth WWTF- R&R $ 25,000
2022 R&R 3189 Boiler Upgrade/Replacement $ 100,000
2023 R&R 3129 Cape Elizabeth WWTF- R&R $ 25,000
2023 Bond 3213 WAS Piping and RDT Drive Upgrade $ 50,000
2024 R&R 3129 Cape Elizabeth WWTF- R&R $ 25,000
2024 Bond 3188 Phase 2 Improvements $ 275,000
Total Cost, All Years $ 600,000
Previous Years on CIP: 2006

316 Capital Expenditures
Cumberland Wastewater
Cumberland – Pump Stations In 2007, the District completed upgrading the Tuttle Road pump station and the Foreside Road pump station. The Powell Road pump station was completed in 2008. In 2011, the 4th year of CCTV assessment of buried infrastructure was completed. An emergency generator was installed at the Smalls Brook Crossing pump station. This was part of a continued program to install emergency generators at pump stations. In 2014, an assessment of all of the pump stations in the system was completed to assist with prioritization and CIP development. In 2017, the Longmeadow pump station was upgraded including replacement pumps and telemetry panel. The District and the Town of Cumberland have investigated infiltration and inflow (I/I) sources in the collection system. CCTV work, flow monitoring, and smoke testing are used to identify sources of I/I. The Town of Cumberland, with the District’s assistance, also inspect homes in an effort to properly manage sump pumps and other sources of inflow. This project is intended to better understand the peak flows that will be sent to Falmouth for treatment and will possibly impact the capacity and cost of shared infrastructure in Falmouth.
The Town of Falmouth replaced the joint use Mill Creek Pump Station and Force Main, which came online in 2017. Planned improvements to the Cumberland system are shown in CIP subprogram #41.

317 Capital Expenditures
Cumberland Wastewater (continued)
Project by Program and Subprogram/Project Summary Program -2020- -2021- -2022- -2023- -2024- -Total-
WW Collection & Pumping
41\3136 Cumberland WW Pump Stations 20,000$ 20,000$ 20,000$ 20,000$ 20,000$ $100,000
41\3171 Stony Ridge Pump Replacement 30,000$ $30,000
41\3172 Ocean Terrace PS Pump Replacement 50,000$ $50,000
41\3173 Ferne Lane PS Pump Replacement 30,000$ $30,000
41\3174 Ledge Rd PS Upgrades 75,000$ $75,000
41\3175 Brookside PS Pump and Electrical 35,000$ $35,000
41\3176 Cumberland Meadows PS Upgrades 85,000$ $85,000
41\3177 Smalls Brook PS Upgrades 95,000$ $95,000
WW Collection & Pumping Total $20,000 $420,000 $20,000 $20,000 $20,000 $500,000
Grand Total $20,000 $420,000 $20,000 $20,000 $20,000 $500,000
Financing Summary (see table above for specific project)Funding Source -2020- -2021- -2022- -2023- -2024- -Total-
Bond General Program $305,000 $305,000
Renewal and Replacement $20,000 $115,000 $20,000 $20,000 $20,000 $195,000
Grand Total $20,000 $420,000 $20,000 $20,000 $20,000 $500,000
Project Purpose (see table above for specific project)
0
50000
100000
150000
200000
250000
300000
350000
400000
450000
-2020- -2021- -2022- -2023- -2024-
Upgrade Obsolete Facility
Upgrade Obsolete Facility

318 Capital Expenditures
Subprogram # 41 Cumberland WW Pump Stations - R&R Division: Wastewater - Cumberland Manager: Poulin, Charlene Funding: R & R – Wastewater- Div. 60 Priority: Routine replacement
Description:
This project provides for continual upgrade of the pumping stations located within the Cumberland wastewater system. In most cases the work involves pump and rail replacements along with control modifications. Justification / Impact:
Physical assets require scheduled maintenance and eventual replacement. This program will provide a planned approach to the maintenance management of Cumberland's wastewater pump stations. History:
This planned approach will assist maintenance and operations in moving towards a goal of predictive and preventative maintenance. Origin of the Subprogram:
Budget Summary:
Budget year Project Cost 2020 - R&R 3136 Cumberland WW Pump Stations - R&R $20,000 2021 - R&R 3136 Cumberland WW Pump Stations - R&R $20,000 2021 - Bond 3171 Stony Ridge Pump Station Upgrades $30,000 2021 - Bond 3172 Ocean Terrace PS Pump Replacement, Bypass $50,000 2021 - Bond 3173 Ferne Lane PS Upgrade $30,000 2021 - Bond 3174 Ledge Rd PS Upgrades $75,000 2021 - Bond 3175 Brookside PS pump and Electrical Upgrades $35,000 2021 - Bond 3176 Cumberland Meadows PS Upgrades $85,000 2021 - Bond 3177 Smalls Brook PS Upgrades $95,000 2022 - R&R 3136 Cumberland WW Pump Stations - R&R $20,000 2023 - R&R 3136 Cumberland WW Pump Stations - R&R $20,000 2024 - R&R 3136 Cumberland WW Pump Stations - R&R $20,000
Total Cost, All Years: $500,000
Previous Years on CIP: 2001 to present Related Projects: Procurement Issues: RFP for engineering services. Construction services will be low bid.

319 Capital Expenditures
Condition Assessment – Cumberland Pump Stations
2014 Cumberland Pump Station Report
Station Rating Station Type Address
Brookside PS (2015) 3.18 4.5 Sub Dup 14 Brookside Drive
Cumberland Meadows 3.63 Sub Dup 12 Red Mill Way
Drowne Rd. 4.93 Sub Dup 2 Baxter Lane
Fern Ln. PS 3.81 Sub Dup 26 Ferne Lane
Foreside Rd. PS 3.75 Canned 82 Foreside Road
Ledge Rd. PS 3.82 Sub Dup 23 Ledge Road Unit A
Longmeadow Dr. PS (2016) 3.65 4.5 Sub Dup 17 Longmeadow Road
Ocean Terrace PS 3.26 Canned 12 Ocean Terrace
Powell Rd. PS 3.73 Canned 5 Powell Road
Small Brook Crossing 3.43 Sub Dup 18 Crossing Brook Road
Stony Ridge PS 3.60 Sub Dup 29 Stony Ridge Road
Tuttle Rd. 3.80 Canned 229 Tuttle Road
Twin Brook 3.83 Sub Dup 185 Tuttle Road
Cumberland Average 3.72
PWD Overall Average 3.47
2016 – Longmeadow P.S. installed in 1983 – condition rating was 3.26 - Upgrades included new SCADA and pump control panels, pumps, valves, and electrical work. New rating is 4.5

320 Capital Expenditures
Gorham/Westbrook/Windham Wastewater
Westbrook Regional Treatment Plant Wright-Pierce completed a comprehensive plant evaluation of the Westbrook Regional WWTF in 2001. The plan outlined recommended upgrades to the facility that had been constructed in the late ‘70s. To date, the District has made improvements to:
Plant water system (2006)
Clarifier scum removal (2006)
Scum handling, and sludge conveyances control (2006)
Plant electrical system – Standby Generator (2008)
Polymer system (2010)
RAS pumps (2011)
Plant Control System (2013)
RAS and flow split to the secondary clarifiers (2014)
Sludge Dewatering (2018) Proposed major modifications for a headworks upgrade were set aside in favor of installing screens at the two major pump stations feeding the treatment plant. Start-up of these systems at the Cottage Place and East Bridge St. Pump Stations in 2008 successfully eliminated pump plugging and has reduced the quantity of rags at the treatment plant. As part of the aeration and clarifier upgrade design effort, reducing the spacing of the screens at the pump stations is under consideration to provide additional protection for the new equipment and reduce associated maintenance. Also under consideration are alternatives for providing septage screening and handling at the plant. In 2013, design and replacement of the control system began. This was completed in 2014 along with chemical feed pumps, residual samplers, and enhanced automation of the disinfection system. The aeration system was evaluated in 2015 to develop a roadmap for the eventual upgrade of the aeration system as it nears the end of its service life, and in light of potential regulatory changes. The recommended upgrades to the aeration system will facilitate process control to maintain dissolved oxygen to meet today’s loadings, match current peak demand, and provide more energy efficient oxygen delivery. Similar to the East End plant in Portland, a selector is recommended to enhance process control and improve settleability. In the summer of 2014, the Department of Environmental Protection requested that treatment plants across the State of Maine complete ambient and treatment plant effluent sampling for nitrogen and phosphorus. The recommended upgrades to the aeration facilities would be incorporated into any additional treatment system upgrades for nutrient removal, should that become necessary in the future; however, the latest permit renewal includes continued sampling and monitoring only. The secondary clarification process at Westbrook has not been
upgraded or modified since its original construction and the sludge
withdrawal mechanisms are nearing the end of their useful life
based on an assessment of the clarifiers completed in 2016. Design
of the aeration and secondary clarification upgrade is underway,
targeting spring 2020 for bidding. A CIP project for construction is proposed for consideration this year (CIP
#416 project 3023).

321 Capital Expenditures
Gorham/Westbrook/Windham Wastewater (continued) In 2015, the District completed an evaluation of sludge dewatering technologies for the Westbrook Regional WWTF, including rehabilitation of the existing belt filter press. Alternative technologies were piloted to quantify the improvement in dewatering performance as compared to the existing equipment. It was determined that alternative technologies would increase the dewatered sludge solids content from an average of approximately 16% to a minimum of 20%, which significantly reduces the volume of sludge to be disposed. This would reduce sludge disposal costs while enhancing flexibility with respect to future sludge disposal alternatives. As a result, in 2016 the proposed belt filter press rehabilitation project (CIP #416 project 2075) was replaced with a proposed upgrade to an alternative technology (CIP #167 project 2534). In 2016, alternative technologies were evaluated and competitively procured through an evaluated bid process that resulted in a recommendation to upgrade to a screw press technology in January of 2017. This project was completed in the spring of 2018 and has been performing well and achieving the target minimum cake solids. In the winter of 2019 the belt filter press equipment was removed and a platform was installed around the screw press to facilitate access for operation and maintenance. Work to remove the belt filter press control panel, which includes a number of hard-wired interconnects with various system components, along with associated control system modifications is scheduled to begin this fall.
2018 CIP 416 project 3027 - Screw Press Access Stair and Platform

322 Capital Expenditures
Gorham/Westbrook/Windham Wastewater (continued)
Westbrook – Sewer System In late 2007, the District hired Woodard & Curran, Brown & Caldwell and Jordan Environmental to update the City of Westbrook’s CSO Master Plan. This plan was completed and submitted to Maine DEP in 2008. Some of the work included in the plan involved the City, and some involved the District. Because the City operates the collection system, the bulk of the first five years would focus on the removal of infiltration and inflow (I/I) from the City collection system. Later portions of the plan would include storage and other work on District owned assets. Since the plan was updated, all flow from all the CSO outfalls are now continuously monitored. The plan was updated in 2014 and submitted to the DEP per the State’s requirements. The plan included a summary of the work completed in the first 5 years and a revised set of projects and schedule. The projects that involve District facilities are being completed in accordance with the Master Plan and have included several projects to increase the capacity of the interceptor system. The Master Plan includes upgrades and capacity increase at the Dana Court Pump Station (CIP #29 project 2527). This project was substantially completed this summer. The plan also includes the addition of floatables containment at the CSO diversion structure prior to the Cottage Place pump station (CIP #29 project 2524) which is currently underway.
Gorham/Windham – Pump Stations and Collector Systems In May of 2008, flows from the Town of Windham, the Maine Correctional Center and the Little Falls section of Gorham were re-directed to the Westbrook/Gorham WWTF for treatment. This action led to the closure of two outfalls into the Presumpscot River. This project also led to an upgrade of the Tow Path pump station and the decommissioning of the treatment plant in Little Falls in 2010. Due to the relatively young age of most of Gorham’s other pump stations, preventive maintenance, condition assessment through CCTV inspection of buried infrastructure, and minor repairs have been the focus in recent years. To increase reliability and improve service during power outages, standby generators have been installed at most of the pump stations. In 2014, an assessment of all of the pump stations in the system was completed, and stations with identified needs were then flagged for more detailed investigation. As a result of those studies, upgrades at the Androscoggin PS (CIP #180 project 2317) and Canterbury Pines PS (CIP #60 project 1117) were completed by the end of 2017. To ensure that accurate wastewater flow is measured and used for allocating operating costs to the Town of Gorham, a flow meter was installed to measure the flow from the Town of Gorham to the Westbrook Gorham Windham WWTF. This meter was installed and is maintained by a third party vendor as part of the District’s extensive flow monitoring program.

323 Capital Expenditures
Gorham/Westbrook/Windham Wastewater (continued) Gorham, Westbrook and Windham are served by a centralized wastewater treatment plant in Westbrook.
Capital costs are allocated by each municipalities relative design capacity of the specific infrastructure.
Program Summary Fund(s) -2020- -2021- -2022- -2023- -2024- -Total-
Gorham Wastewater
WW Collection & Pumping $20,000 $20,000 $350,000 $20,000 $20,000 $430,000
Gorham Wastewater Total $20,000 $20,000 $350,000 $20,000 $20,000 $430,000
Westbrook Wastewater
WW Collection & Pumping $45,000 $95,000 $20,000 $20,000 $20,000 $200,000
Westbrook Wastewater Total $45,000 $95,000 $20,000 $20,000 $20,000 $200,000
Windham Wastewater
WW Collection & Pumping $20,000 $20,000 $20,000 $520,000 $20,000 $600,000
Windham Wastewater Total $20,000 $20,000 $20,000 $520,000 $20,000 $600,000
Gorham/Westbrook/Windham WW
WW Treatment $11,300,000 $750,000 $225,000 $50,000 $950,000 $13,275,000
Gorham/Westbrook/Windham WW Total $11,300,000 $750,000 $225,000 $50,000 $950,000 $13,275,000
Gorham/Windham Wastewater
WW Collection & Pumping $300,000 $300,000
Gorham/Windham Wastewater Total $300,000 $300,000
Grand Total $11,685,000 $885,000 $615,000 $610,000 $1,010,000 $14,805,000
Program Summary - Percent Allocated to Each MunicipalityFund(s) -2020- -2021- -2022- -2023- -2024- -Total-
Gorham Wastewater
WW Collection & Pumping - Gorham Share 100.0% 100.0% 100.0% 100.0% 100.0% 100.0%
Westbrook Wastewater
WW Collection & Pumping -Westbrook Share 100.0% 100.0% 100.0% 100.0% 100.0% 100.0%
Windham Wastewater
WW Collection & Pumping -Windham Share 100.0% 100.0% 100.0% 100.0% 100.0% 100.0%
Gorham/Westbrook/Windham Wastewater
WW Treatment -Gorham Share 30.8% 30.8% 30.8% 30.8% 30.8% 30.8%
WW Treatment -Westbrook Share 66.6% 66.6% 66.6% 66.6% 66.6% 66.6%
WW Treatment -Windham Share 2.6% 2.6% 2.6% 2.6% 2.6% 2.6%
Gorham/Windham Wastewater
WW Collection & Pumping -Gorham Share 69.0% 69.0% 69.0% 69.0% 69.0% 69.0%
WW Collection & Pumping -Windham Share 31.0% 31.0% 31.0% 31.0% 31.0% 31.0%
Program Summary - Percent Allocated to Each MunicipalityFund(s) -2020- -2021- -2022- -2023- -2024- -Total-
Gorham Wastewater
WW Collection & Pumping - Gorham Share $20,000 $20,000 $350,000 $20,000 $20,000 $430,000
Westbrook Wastewater
WW Collection & Pumping -Westbrook Share $45,000 $95,000 $20,000 $20,000 $20,000 $200,000
Windham Wastewater
WW Collection & Pumping -Windham Share $20,000 $20,000 $20,000 $520,000 $20,000 $600,000
Gorham/Westbrook/Windham WW
WW Treatment -Gorham Share $3,480,400 $231,000 $69,300 $15,400 $292,600 $4,088,700
WW Treatment -Westbrook Share $7,525,800 $499,500 $149,850 $33,300 $632,700 $8,841,150
WW Treatment -Windham Share $293,800 $19,500 $5,850 $1,300 $24,700 $345,150
Gorham/Westbrook/Windham WW Total 11,300,000$ 750,000$ 225,000$ 50,000$ 950,000$ 13,275,000$
Gorham/Windham Wastewater
WW Collection & Pumping -Gorham Share $207,000 $0 $0 $0 $0 $207,000
WW Collection & Pumping -Windham Share $93,000 $0 $0 $0 $0 $93,000
Gorham/Windham Wastewater Total $300,000 $1 $0 $0 $0 $300,000

324 Capital Expenditures
Gorham/Westbrook/Windham Wastewater (continued)
Project by Program and Subprogram/Project Summary Program -2020- -2021- -2022- -2023- -2024- -Total-
WW Collection & Pumping
180\3138 Windham- Little Falls WW System $20,000 $20,000 $20,000 $20,000 $20,000 $100,000
181\3139 Windham - Depot Street Pump Station $500,000 $500,000
29\3163 CSO Master Plan Update $75,000 $75,000
29\3164 Modeling Update $25,000 $25,000
411\3134 Westbrook WW Systems R&R $20,000 $20,000 $20,000 $20,000 $20,000 $100,000
60\3137 Gorham WW Pump Station - R&R $20,000 $20,000 $20,000 $20,000 $20,000 $100,000
60\3178 Gateway Commons PS Upgrades $85,000 $85,000
60\3179 Park South PS Upgrades $95,000 $95,000
60\3180 Briarwood PS Telemetry Upgrade $75,000 $75,000
60\3181 Meadowland PS Telemetry Upgrade $75,000 $75,000
60\3212 Little River Bridge Forcemain $300,000 $300,000
WW Collection & Pumping Total $385,000 $135,000 $390,000 $560,000 $60,000 $1,530,000
WW Treatment
416\3023 Aeration and Secondary Clarifiers $11,250,000 $11,250,000
416\3132 Westbrook Gorham Windham WWTF $50,000 $50,000 $50,000 $50,000 $50,000 $250,000
416\3159 Plant Water System Rehab/Controls $75,000 $75,000
416\3160 Influent/Septage Screening $700,000 $700,000
416\3166 Process Area Ventilation Upgrades $750,000 $750,000
416\3190 Access Road and Parking Lot $100,000 $100,000
416\3191 TWAS Mixer Replacement $150,000 $150,000
WW Treatment Total $11,300,000 $750,000 $225,000 $50,000 $950,000 $13,275,000
Grand Total $11,685,000 $885,000 $615,000 $610,000 $1,010,000 $14,805,000
Financing Summary (see table on above for specific project)Funding Source -2020- -2021- -2022- -2023- -2024- -Total-
Bond General Program $500,000 $500,000
Bond State Revolving Loan $11,250,000 $11,250,000
Renewal and Replacement $435,000 $885,000 $615,000 $110,000 $1,010,000 $3,055,000
Grand Total $11,685,000 $885,000 $615,000 $610,000 $1,010,000 $14,805,000
Project Purpose (see table on above for specific project)
0
2000000
4000000
6000000
8000000
10000000
12000000
14000000
-2020- -2021- -2022- -2023- -2024-
Upgrade Obsolete Facility
Regulatory Mandate
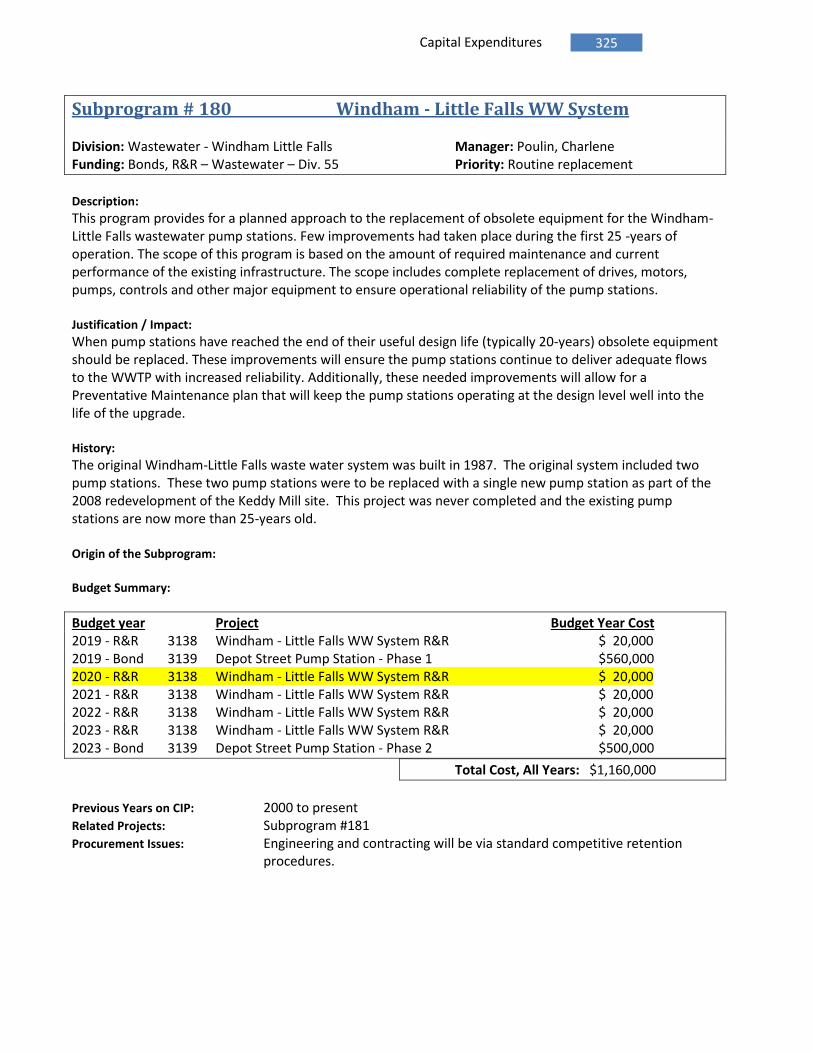
325 Capital Expenditures
Subprogram # 180 Windham - Little Falls WW System Division: Wastewater - Windham Little Falls Manager: Poulin, Charlene Funding: Bonds, R&R – Wastewater – Div. 55 Priority: Routine replacement
Description:
This program provides for a planned approach to the replacement of obsolete equipment for the Windham-Little Falls wastewater pump stations. Few improvements had taken place during the first 25 -years of operation. The scope of this program is based on the amount of required maintenance and current performance of the existing infrastructure. The scope includes complete replacement of drives, motors, pumps, controls and other major equipment to ensure operational reliability of the pump stations. Justification / Impact:
When pump stations have reached the end of their useful design life (typically 20-years) obsolete equipment should be replaced. These improvements will ensure the pump stations continue to deliver adequate flows to the WWTP with increased reliability. Additionally, these needed improvements will allow for a Preventative Maintenance plan that will keep the pump stations operating at the design level well into the life of the upgrade. History:
The original Windham-Little Falls waste water system was built in 1987. The original system included two pump stations. These two pump stations were to be replaced with a single new pump station as part of the 2008 redevelopment of the Keddy Mill site. This project was never completed and the existing pump stations are now more than 25-years old. Origin of the Subprogram:
Budget Summary:
Budget year Project Budget Year Cost 2019 - R&R 3138 Windham - Little Falls WW System R&R $ 20,000 2019 - Bond 3139 Depot Street Pump Station - Phase 1 $560,000 2020 - R&R 3138 Windham - Little Falls WW System R&R $ 20,000 2021 - R&R 3138 Windham - Little Falls WW System R&R $ 20,000 2022 - R&R 3138 Windham - Little Falls WW System R&R $ 20,000 2023 - R&R 3138 Windham - Little Falls WW System R&R $ 20,000 2023 - Bond 3139 Depot Street Pump Station - Phase 2 $500,000
Total Cost, All Years: $1,160,000
Previous Years on CIP: 2000 to present Related Projects: Subprogram #181 Procurement Issues: Engineering and contracting will be via standard competitive retention
procedures.

326 Capital Expenditures
Subprogram # 180 Windham - Little Falls WW System The Depot Street Project will be in conjunction with the District replacing water mains on Depot Street and installing a 407- zone transmission main.

327 Capital Expenditures
Subprogram # 29 Westbrook CSO Abatement Division: Wastewater - Westbrook Manager: Poulin, Charlene Funding: R&R – Wastewater – Div. 62 Priority: Regulatory mandate
Description:
This project contemplates funding and programing the design and construction of projects recommended in a study that was completed by Woodard & Curran and Brown & Caldwell. The purpose of the study was to update the Westbrook CSO Master Plan. Justification / Impact:
The District, City of Westbrook and the DEP agreed that an upgrade to the existing CSO Master Plan was favored over work previously scheduled for the sewer between Brown and King Streets. The Westbrook/Gorham WWTF license was renewed in 2006. Written into the new license was a requirement for the District to submit a CSO Master Plan update and abatement schedule on or before December 31, 2008. This was completed on time and submitted to DEP for their approval. History:
King Street/Brown Street sewer work was put aside in lieu of updating the Westbrook CSO Master Plan. Project awarded to Woodard and Curran/Brown and Caldwell. Updated Master Plan due on or before 12/31/08 for Department review and approval. Origin of the Subprogram:
Budget Summary:
Budget year Project Budget Year Cost 2020 R&R 3164 Modeling Update $ 25,000 2022 R&R 3163 CSO Master Plan Update $ 75,000 PEND 2522 Construction of New Storage Facility $3,200,000
Total Cost, All Years: $3,300,000
Previous Years on CIP: 2000 to present Related Projects: Procurement Issues:
Weir at Warren Ave CSO

328 Capital Expenditures
Subprogram # 411 Westbrook WW Systems R&R Division: Wastewater - Westbrook Manager: Poulin, Charlene Funding: R&R - Wastewater – Div. 62 Priority: Routine replacement
Description:
This project provides for the timely renewal of equipment associated with pump stations and the purchase of monitoring equipment for the interceptor system. Major pump stations have been recently upgraded but funds need to be available for replacement parts when necessary. Justification / Impact:
An on-going study to upgrade the Westbrook CSO Master Plan will be complemented with the addition of a portable flow monitoring device. The Dana Court pump station has yet to be upgraded and funds are required to assure continued operation. Budget Summary:
Budget year Project Budget Year Cost 2020 - R&R 3134 Westbrook WW Systems R&R $20,000 2021 - R&R 3134 Westbrook WW Systems R&R $20,000 2022 - R&R 3134 Westbrook WW Systems R&R $20,000 2023 - R&R 3134 Westbrook WW Systems R&R $20,000 2024 - R&R 3134 Westbrook WW Systems R&R $20,000
Total Cost, All Years: $100,000

329 Capital Expenditures
Subprogram # 60 Gorham WW Pump Stations - R&R Division: Wastewater - Gorham Village Manager: Poulin, Charlene Funding: Bond and R&R – Wastewater – Div. 61 Priority: Routine replacement
Description:
This is an ongoing project designed to maintain and improve Gorham wastewater pump stations. Modifications and upgrades will ensure adequate capacity, reliability and safety. Justification / Impact:
Components of the older pump stations have reached their useful life and obsolete equipment should be replaced. Replacing this equipment before it fails completely reduces the amount spent on operating and maintaining the equipment. History:
This planned renewal and replacement will assist operations in moving toward a goal of performing more predictive and preventive maintenance instead of emergency maintenance. Budget Summary:
Budget year Project Budget Year Cost 2020 – R&R 3212 Little River Bridge Replacment – Force Main $300,000 2020 - R&R 3137 Gorham WW Pump Stations - R&R $20,000 2021 - R&R 3137 Gorham WW Pump Stations - R&R $20,000 2022 - R&R 3137 Gorham WW Pump Stations - R&R $20,000 2022 - Bond 3178 Gateway Commons PS Upgrades $85,000 2022 - Bond 3179 Park South PS Upgrades $95,000 2022 - Bond 3180 Briarwood PS Upgrades $75,000 2022 - Bond 3181 Meadowland PS Upgrades $75,000 2023 - Bond 3137 Gorham WW Pump Stations - R&R $20,000 2024 - R&R 3137 Gorham WW Pump Stations - R&R $20,000
Total Cost, All Years: $730,000
Previous Years on CIP: 2000 - present Related Projects: Procurement Issues: Primarily staff labor for installation using standard parts procured competitively.

330 Capital Expenditures
Condition Assessment – Gorham Pump Stations
2014 Gorham Pump Station Report
Station Rating Station Type Address
Briarwood 3.78 Sub Dup 62 Briarwood Lane
Canterbury Pines 3.54 Sub Dup 14 Canterbury Pines Drive
Gateway Commons 3.83 Sub Dup 57 Clearview Drive
Glenwood Ave 3.59 Sub Dup 21 Glenwood Ave
Heartwood 3.81 Sub Dup 18 Caitlin Drive
Little River 4.08 Sub Dup 240B Mosher Road
Mallison 4.06 Sub Dup 35 Mallison Street
Meadowland Condo 3.72 Sub Dup 33A Joseph Drive
Old Dynamite 4.96 Sub Dup 14 Old Dynamite Way
Olde Canal 4.03 Sub Dup 338 Mosher Road
Park South Condo 3.98 Sub Dup 16 Kiara Lane
Running Spring/Southwoods 3.63 Sub Dup 50 Running Springs Road
Tink Drive 4.93 Sub Dup 46 Tink Drive(back)
University 3.95 Sub Dup 166 School Street
Woodlawn 3.76 Sub Dup 24 Tow Path Road
Gorham Average 3.98
PWD Overall Average (74 Stations) 3.47

331 Capital Expenditures
Subprogram # 416 Westbrook Gorham Windham Regional WWTF Division: Wastewater - Joint Westbrook Manager: Rodriguez, Paul Funding: Bonds, R&R – Wastewater- Div. 64 Priority: Upgrade obsolete facility
Description:
The Westbrook Comprehensive Plant Evaluation (CPE) Program completed in 2001 identified a series of recommended system improvements and upgrades to replace inefficient, non-existent, or obsolete equipment and systems. Many of the items identified are intended to improve plant performance and efficiency. This CPE Upgrade Program represents the phased implementation of that long range program. Justification / Impact:
The current facility is over 27 years old and many of the existing systems have reached or exceeded the design life of the equipment. Even with the excellent level of maintainance, many of the systems will eventually require replacement. Additionally, the identified programs are designed to provide for more efficient and cost effective treatment systems. Regulatory requirements continue to increase and the technology required to meet these levels has increased. Achieving these standards through a more reliable, efficient, and cost effective manner is the ultimate goal of this program. History:
This program is the result of the CPE study performed by Wright-Pierce dated March 2001. Recent studies and evaluations include the Aeration System Alternatives Analysis (2015) and the Secondary Clarifier Condition Assessment (2016). Budget Summary:
Budget Year Project Cost
2020 SRF 3023 Aeration and Secondary Clarifiers - Construction $ 11,250,000
2020 R&R 3132 Westbrook Gorham Windham WWTF R&R $ 50,000
2021 R&R 3132 Westbrook Gorham Windham WWTF R&R $ 50,000
2021 R&R 3160 Influent/Septage Screening $ 700,000
2022 R&R 3132 Westbrook Gorham Windham WWTF R&R $ 50,000
2022 R&R 3159 Plant Water System Rehab/Controls $ 75,000
2022 R&R 3190 Access Road and Parking Lot Resurfacing $ 100,000
2023 R&R 3132 Westbrook Gorham Windham WWTF R&R $ 50,000
2024 R&R 3132 Westbrook Gorham Windham WWTF R&R $ 50,000
2024 Bonds 3166 Process Area Ventilation Upgrades $ 750,000
2024 R&R 3191 TWAS Mixer Replacement $ 150,000
Total Cost, All Years $ 13,275,000

332 Capital Expenditures
Subprogram # 416 Westbrook Gorham Windham Regional WWTF

333 Capital Expenditures
Portland Wastewater
East End Treatment Plant PWD has completed a number of significant upgrade projects to key systems at the East End Wastewater Treatment Facility in recent years, including the following
Aeration (2015)
Sludge Dewatering (2011)
Installation of a second CSO rated screen in the headworks (2010)
Addition of a second waste activated sludge thickener, enclosed for odor control (2015)
Building envelope improvements including roofing and windows (2016-2017)
Addition of a screenings wash press (2014)
Rehabilitation of the grit removal equipment and piping (2017-2019) In 2015, upgrade of the aeration system began to expand the system’s capabability to manage the spikes in pollutant loading to the treatment plant while exercising regular process control to better manage the performance of the treatment system. Since substantial completion in 2017, the upgrade has had a significant positive impact on the activated sludge system by promoting good settling, reducing odors, and enabling a significant amount of nitrogen management. The project was awarded a grant from Efficiency Maine for energy efficient design. In 2015-2016, evaluations of the plant’s electrical and HVAC systems were completed and long term replacement programs were developed. In 2018 design of the EEWWTF/Northeast PS Backup Power Upgrade began. Due to the purchase and sale agreement with Central Maine Power for installation of a substation and new primary feeders for the East End plant, this effort is recommended for combination with switchgear replacement which was also recommended as part of the electrical system evaluation. Construction of power distribution upgrades for EEWWTF/NEPS is recommended as part of the 2020 CIP (#21, project 3014) Also underway as part of the 2018-2019 CIP are two significant upgrades to the HVAC systems at the plant – the sludge dewatering areas (CIP#21, project 2705) and the Third Floor HVAC Upgrade (CIP #21, project 3017). Rehabilitation of primary clarifier sludge removal mechanism #3 was completed in 2018. Underway and scheduled for completion this coming winter is rehabilitation of mechanisms #1 and #2. Upgrades to the chlorine contact tank isolation gate actuators has begun and is anticipated to be complete in winter 2020. Replacement of the sodium hypochlorite storage tanks and piping was completed in September 2019. In the spring of 2019 overhaul of the main odor control system fan (OCF-1) was completed including installation of the spare fan impeller and replacement of all wear components. Assessments of the secondary clarifiers, return sludge piping, and effluent flow meter replacement are currently in progress.
Peaks Island Treatment Plant In 2014, the District conducted a feasibility study of ultraviolet disinfection at the Peaks facility as a potential replacement of the batch chlorination/dechlorination process. The study concluded that UV disinfection would provide a cost effective alternative to chlorination while enhancing the plant’s ability to disinfect during wet weather flows. The system was installed in 2015 and has been performing well. In 2018, the District installed a control panel and associated lifting systems to facilitate sequencing batch reactor tank dewatering in a timely fashion for maintenance, inspection and repairs. In the spring of 2019 the influent screen was replaced with a new combination screen/screenings washer-compactor.

334 Capital Expenditures
Portland Wastewater (continued)
Pump Stations PWD has undertaken several significant upgrades to the Portland pumping systems in recent years. India Street was upgraded in 2008 to include self-cleaning wet wells, new pumps, and odor control. Upgrades to the Northeast pump station have included internal piping and Pumps 2, 3 and 4 in 2007-2008, Pump 1 replacement in 2017, and the addition of odor control in 2018. Further modifications to the Northeast pump station are pending future CSO and storm water work planned by the City. CIP subprogram #70 outlines future plans for the remaining pump stations in the City. The full upgrade of the Baxter Boulevard Pump Station was delayed (only pumps, with the ability to be expanded, were replaced) to allow the City’s plan to include possible upgrades to the flow capacity of the pump station. Thompson Point Pump Station and the associated force main were upgraded along with the Arcadia Pump Station in 2013. Phase 1 of the Fore River Pump Station pumping system and controls upgrade is complete. Phase 2 of upgrades to the Fore River station are underway, including installation of a bypass connection and force main condition assessment. The phase 2 design was completed in 2018 with anticipated construction completion in 2020, and will primarily include upgrade of the station’s screening, electrical, and ventilation systems. Detailed design of the Baxter Blvd. Pump Station upgrades (CIP #70 project 3144) is underway and is expected to be bid in the spring of 2020. Design of the Stroudwater Pump Station (CIP #70 project 3006) is nearing completion and construction is expected to be complete in 2020. The City of Portland submitted a Tier III Long-Term Control Plan for the mitigation of CSO flows to Maine DEP in 2011. The plan includes a $167 million plan over 15 years. This plan focuses on storage and dedicated wet weather systems at the East End WWTF in the later years of the plan. A 2-million gallon storage conduit along Baxter Blvd. and Payson Park was commissioned in 2013. Design and construction of the next two storage conduits is underway. These storage conduits are part of the City’s collection system and are owned, operated, and maintained by the City. The treatment of flow from the storage conduits is coordinated with the City on an ongoing and regular basis. The Portland City Council approved a $3.1 million sewer expansion on Peaks Island. The project was managed, constructed, and financed by the District. The project was completed in 2014.
New East End Treatment Plant’s Influent Screen Rotated out of the Channel for Inspection

335 Capital Expenditures
Portland Wastewater (continued)
Project by Program and Subprogram/Project Summary Program -2020- -2021- -2022- -2023- -2024- -Total-
WW Collection & Pumping
131\3162 Model ing and Flow Assessment $50,000 $50,000
423\3161 Stormwater Piping Rehabi l i tation $50,000 $50,000
70\3135 Portland WW Pump Stations - R&R $50,000 $50,000 $50,000 $50,000 $50,000 $250,000
70\3143 Baxter Blvd PS Upgrades - Construction 1,950,000$ $1,950,000
70\3184 Garrison St PS Upgrade to Submers ible $375,000 $375,000
70\3185 Congress St PS Upgrade to Submers ible $375,000 $375,000
70\3186 Westbrook St PS Upgrades $100,000 $100,000
70\3187 India St PS Generator Upgrade $300,000 $300,000
70\3205 Northeast PS Generator and Switchgear 2,000,000$ $2,000,000
WW Collection & Pumping Total $2,000,000 $800,000 $200,000 $400,000 $2,050,000 $5,450,000
WW Treatment
21\2564 - 2018 Securi ty Improvements $25,000 $25,000 $50,000
21\3009 Dewatering Odor Control Rehab 950,000$ $950,000
21\3014 Main 12.4 kV Switchgear Upgrades 1,750,000$ $1,750,000
21\3016 Plant Water System Upgrade 540,000$ $540,000
21\3020 Process Gate Automation $50,000 $50,000 $50,000 $50,000 $50,000 $250,000
21\3021 Power Panel Upgrades $75,000 $75,000
21\3024 Portable Wastewater Pump $250,000 $250,000
21\3133 East End WWTF R&R $75,000 $75,000 $75,000 $75,000 $75,000 $375,000
21\3145 Lower Lot Paving $150,000 $150,000
21\3146 Gravi ty Belt Thickener Replacement $550,000 $550,000
21\3147 Secondary Clari fier Sludge Rake $5,000,000 $5,000,000
21\3148 Return Sludge Piping Replacement $750,000 $750,000
21\3149 HVAC Upgrades - Process Area $400,000 $400,000
21\3150 HVAC -Tunnel and Pump Gal lery $900,000 $900,000
21\3151 Influent Screen#2/Headworks Conveyors $350,000 $350,000
21\3152 Gravi ty Thickener #1/Sol ids Monitoring $1,400,000 $1,400,000
21\3153 Primary Sludge Pumping $300,000 $300,000
21\3156 Clari fier Venti lation $1,375,000 $1,375,000
21\3202 Thickened Sludge Storage/Mixing Rehab $400,000 $400,000
21\3203 Odor Control System Tower#2 $250,000 $250,000
21\3204 Dewatering System Upgrade $2,000,000 $2,000,000
21\3206 Primary Gal lery Power/MCC Upgrade $500,000 $500,000
21\3208 Pri . Gal lery Electrica l Prel im. Des ign $50,000 $50,000
423\3131 Peaks Is land R&R $20,000 $20,000 $20,000 $20,000 $20,000 $100,000
423\3192 Aeration System Upgrade $250,000 $250,000
423\3193 Decanter/Valve Replace/Refurbish $200,000 $200,000
423\3194 SBR B Influent Valve Replacement $30,000 $30,000
WW Treatment Total $2,545,000 $3,065,000 $2,270,000 $6,495,000 $4,820,000 $19,195,000
Grand Total $4,545,000 $3,865,000 $2,470,000 $6,895,000 $6,870,000 $24,645,000

336 Capital Expenditures
Portland Wastewater (continued)
Financing Summary (see table on adjacent page for specific project)Funding Source -2020- -2021- -2022- -2023- -2024- -Total-
Bond General Program $500,000 $450,000 $400,000 $1,350,000
Bond State Revolving Loan $3,700,000 $1,940,000 $1,700,000 $5,550,000 $5,375,000 $18,265,000
Renewal and Replacement $845,000 $1,425,000 $770,000 $895,000 $1,095,000 $5,030,000
Grand Total $4,545,000 $3,865,000 $2,470,000 $6,895,000 $6,870,000 $24,645,000
Project Purpose (see table on adjacet page for specific project)
0
1000000
2000000
3000000
4000000
5000000
6000000
7000000
8000000
-2020- -2021- -2022- -2023- -2024-
Upgrade Obsolete Facility
Security of Facilities
Regulatory Mandate
Maintenance
Improvement

337 Capital Expenditures
Subprogram # 131 Portland CSO Mitigation Division: Wastewater - Portland Manager: Rodriguez, Paul Funding: R&R – Wastewater – Div 57 Priority: Regulatory mandate
PWD owns and operates 21 of the 31 licensed CSO outfalls in the City of Portland. Upstream mitigation of CSO flows is primarily the responsibility of the City of Portland through their ongoing Long-Term Control Plan, currently in the third tier. Permanent monitors operated by PWD and located at critical sites allow for the continuous monitoring of nearly all outfalls. This provides accurate measurement of flow totals, alarming to prevent dry weather overflows, and for the measurement and verification of ongoing mitigation efforts by the City of Portland. It is critical that we have real time monitoring at CSO sites. This monitoring allows us to proactively address potential dry weather events as well as increasing our ability to implement operational measures based on system performance. Justification / Impact:
In 2007 PWD started to install ADS Flowshark Meters at 7 key critical sites in Portland. By 2009 sixteen (16) were installed in Portland that monitor continuous flow and provide real time data and alarming at CSO sites. Due to technological changes and cellular capabilities, the current ADS Flowshark monitors have started to reach their expected life span. The benefit to the real time monitors has been valuable to both the City and to PWD. With real time monitoring, reduction of CSO events due to projects can be quantified. The reliability of the data is solid with a 98% uptime of the CSO meters during rain events allowing us to rely on actual data for CSO reporting. Over the past eight years, staff has been able to prevent Dry Weather Overflows and respond in a quick manner due to the alarming capabilities. History:
All except for two CSO’s are real time monitored by either ADS Environmental or Flow Assessment since 2010. Minor evaluation of India Street Tide gate was performed by Johnson and Jordan in 2013. Budget Summary:
Budget year Project Budget Year Cost 2022 - RR 3162 Modeling and flow assessment $50,000
Total Cost, All Years: $50,000
Previous Years on CIP: 2007 Related Projects: Procurement Issues:

338 Capital Expenditures
Subprogram # 70 Portland WW Pump Stations - R&R Division: Wastewater - Portland Manager: Poulin, Charlene Funding: R&R, Bonds – Wastewater- Div. 57 Priority: Routine replacement
Description:
This program provides for a planned approach to the replacement of obsolete equipment in the Portland wastewater pump stations. Few improvements have taken place during the 25 years of operation. Pumps have to be upgraded, screens reconsidered and control systems revamped. Justification / Impact:
The pump stations have reached the end of their useful design life and obsolete equipment must be replaced. Continued attention to the pump stations will allow for a predictive approach to maintenance while ensuring operatonal optimization and reliability. History:
This program is based on the Portland Pump Station CPE performed by Wright-Pierce and contemplates improvements with funding from the R&R accounts. Budget Summary:
Budget Year Project Cost
2020 R&R 3135 Portland WW Pump Stations - R&R $ 50,000
2020 SRF 3143 Baxter Blvd PS Upgrades - Construction $ 1,950,000
2021 R&R 3135 Portland WW Pump Stations - R&R $ 50,000
2021 Bonds 3184 Garrison St PS Upgrade to Submersible $ 375,000
2021 Bonds 3185 Congress St PS Upgrade to Submersible $ 375,000
2022 R&R 3135 Portland WW Pump Stations - R&R $ 50,000
2022 Bonds 3186 Westbrook St PS Upgrades $ 100,000
2023 R&R 3135 Portland WW Pump Stations - R&R $ 50,000
2023 Bonds 3187 India St PS Generator Upgrade $ 300,000
2024 R&R 3135 Portland WW Pump Stations - R&R $ 50,000
2024 SRF 3205 Northeast PS Generator and Switchgear Replacement $ 2,000,000
Total Cost, All Years $ 5,350,000
Previous Years on CIP: 2003 Procurement Issues:

339 Capital Expenditures
Subprogram # 21 East End WWTF Upgrade Division: Wastewater – Portland Manager: Rodriguez, Paul Funding: Bonds – Wastewater – Div.57 Priority: Upgrade obsolete facility
Description:
The Portland Comprehensive Plant Evaluation (CPE) Program completed in 1998 identified a long range series of plant system upgrades needed to replace obsolete equipment and systems to meet future operating and regulatory conditions. This CPE Upgrade Program represents the phased implementation of that long range program. The inclusion of the initial phase of odor control was requested by the City of Portland and included in this Program. This Program continues to provide for the replacement of outdated and obsolete systems, including the primary clarifier sludge collection equipment and sludge dewatering system. Justification / Impact:
The current facility is forty-years old and many of the original systems are worn out and/or functionally obsolete. Implementation of the program shown below allows the District to meet current and future regulatory requirements while obtaining the operating cost advantages of new technology. The impact and benefit of this program is reduced operating cost, system reliability and the ability to meet permit conditions. History:
This implementation program began with the Woodard & Curran CPE completed in 1998. Wright-Pierce and CH2M-Hill were retained to implement the initial phases of this on-going program. Since then, work has been completed on the influent channels, screening, grit removal, primary sedimentation basins, odor control and secondary clarifiers. Construction of the new dewatering system, including the Fournier Rotary Presses, was completed in 2005. Fine bubble aeration system replaced the old mechancial air system in 2017. Origin of the Subprogram:
The aging facility and increasing difficulty to achieve reliable operations that consistently meet license requirements led to the CPE. This implementation program is a direct result of the CPE. Budget Summary:
Budget Year Project Cost
2020 Bonds 3014 Main 12.4 kV Power Distribution Upgrades Project $ 1,750,000
2020 R&R 3020 Process Gate Automation $ 50,000
2020 R&R 3021 Power Panel Upgrades $ 75,000
2020 R&R 3024 Portable Wastewater Pump $ 250,000
2020 R&R 3133 East End WWTF R&R $ 75,000
2020 R&R 3203 Odor Control System Tower#2 Rehabilitation $ 250,000
2020 R&R 3208 Pri. Gallery Electrical Upgrade Prelim. Design $ 50,000
2020 R&R 2564 Security Improvements $ 25,000
2021 R&R 3016 Plant Water System Upgrade $ 540,000
2021 R&R 3020 Process Gate Automation $ 50,000
2021 R&R 3133 East End WWTF R&R $ 75,000
2021 R&R 3145 Lower Lot Paving $ 150,000
2021 R&R 3152 Gravity Thickener #1 Rehab and Solids Monitoring $ 1,400,000
2021 R&R 3153 Primary Sludge Pumping Upgrade/Rehabilitation $ 300,000
2021 R&R 3201 Thickened Primary Sludge Pumping Rehabilitation $ 450,000
2021 Bonds 3206 Primary Gallery Power/MCC Upgrade $ 500,000

340 Capital Expenditures
2022 Bonds 3009 Dewatering Odor Control Rehab and Expansion $ 950,000
2022 R&R 3020 Process Gate Automation $ 50,000
2022 R&R 3133 East End WWTF R&R $ 75,000
2022 SRF 3148 Return Sludge Piping Replacement $ 750,000
2022 Bonds 3149 HVAC Upgrades - Process Area $ 400,000
2022 R&R 2564 Security Improvements $ 25,000
2023 R&R 3020 Process Gate Automation $ 50,000
2023 R&R 3133 East End WWTF R&R $ 75,000
2023 Bonds 3146 Gravity Belt Thickener Replacement $ 550,000
2023 SRF 3147 Secondary Clarifier Sludge Rake Replacement $ 5,000,000
2023 R&R 3151 Influent Screen #2 and Headworks Conveyors $ 350,000
2024 R&R 3020 Process Gate Automation $ 50,000
2024 R&R 3133 East End WWTF R&R $ 75,000
2024 SRF 3150 HVAC Upgrades - Tunnel and Pump Gallery $ 900,000
2024 Bonds 3156 Clarifier Ventilation $ 1,375,000
2024 R&R 3202 Thickened Sludge Storage and Mixing Rehab $ 400,000
2024 Bonds 3204 Dewatering System Upgrade $ 2,000,000
Total Cost, All Years $ 19,065,000
Previous Years on CIP: 1999 to present Related Projects: Procurement Issues: RFP for engineering services. Construction services will be low bid.
Site Plan for 2020 proposed East End WWTF Main 12.4Kv Power Distribution Upgrades Project

341 Capital Expenditures
Subprogram # 423 Peaks Island WW Treatment and Systems Division: Wastewater - Peaks Manager: Rodriguez, Paul Funding: R & R - Wastewater Priority: Routine replacement
Description:
This account will provide for timely routine replacement of equipment at the Peaks Island Treatment Plant and pump stations. Justification / Impact:
Physical assets require scheduled maintenance and eventual replacement. This project provides funding for the efficient and timely replacement of equipment using routine and replacement funds. History:
This program has been used at most PWD wastewater systems in the past. Budget Summary:
Budget year Project Budget Year Cost 2020 - R&R 3131 Peaks Island R&R $ 20,000 2021 - R&R 3131 Peaks Island R&R $ 20,000 2021 - R&R 3194 SBR Influent valve replacement $ 30,000 2022 - R&R 3131 Peaks Island R&R $ 20,000 2023 - R&R 3161 Stormwater Piping Rehabilitation $ 50,000 2023 - R&R 3131 Peaks Island R&R $ 20,000 2023 - R&R 3192 Aeration System Upgrade $250,000 2023 - R&R 3193 Decanter and Valve replacement /Refurbishment $200,000 2024 - R&R 3131 Peaks Island R&R $ 20,000
Total Cost, All Years: $630,000
Previous Years on CIP: 2007 - present Related Projects: Procurement Issues: Peaks Island Treatment Plant – Built 1994

342 Capital Expenditures
Wastewater – Multi-fund Program
SCADA and Process Control Plan In the early part of this decade, the District began installing Supervisory Control and Data Acquisition (SCADA) equipment throughout its service area. The goal was to bring all critical alarming back into the District. Since then, standards have developed and SCADA is in place at most all of our installations. The next step is to meet our goal of bringing all wastewater related SCADA information into a single site located at the East End WWTF in Portland. This will allow us to monitor each wastewater facility at a single wastewater location. The construction of the Central Control Center at the East End WWTF began in 2010. During this time, the Westbrook/Gorham/Windham WWTF was connected to the Central Control Center directly, improving the ability to monitor and control this facility. Subsequently, Peaks Island WWTF and Cape Elizabeth WWTF automation and control system improvements occurred allowing for their connection to the Central Control Center. Future programming routines will allow staff to interact with remote sites from a central location. In the end, our goal is to have operation staff in position to acknowledge alarms, trouble shoot mechanical problems and make process adjustments to four wastewater plants and better than 70 pump stations without having to call in additional staff. CIP subprogram #177 outlines much of the work that is needed to complete the long-range SCADA plan. In 2020, Phase 2 of the SCADA Radio Modem Replacement Project is proposed (CIP #177, project 3126). This project will replace 17-year old radios, Programmable Logic Controllers (PLC) and antennas and will therefore provide more reliable networks.
The SCADA panel for the newly installed Great Pond Pump Station for the Peaks Island Sewer Extension Project

343 Capital Expenditures
Wastewater – Multi-fund Program(continued) The projects below are being completed and benefits multiple wastewater funds and are allocated to the respective fund based on the relative use of the asset.
Program Summary Fund(s) -2020- -2021- -2022- -2023- -2024- -Total-
Wastewater-All
SCADA & Technology $350,000 $350,000 $700,000
Wastewater-All Total $350,000 $350,000 $700,000
Grand Total $350,000 $350,000 $700,000
Project by Program and Subprogram/Project Summary Program -2020- -2021- -2022- -2023- -2024- -Total-
SCADA & Technology
177\3125 SCADA Radio Modem Replacement Project $350,000 $350,000
177\3126 SCADA Radio Modem Replacement Project $350,000 $350,000
SCADA & Technology Total $350,000 $350,000 $700,000
Grand Total $350,000 $350,000 $700,000
Financing Summary (see table above for specific project)Funding Source -2020- -2021- -2022- -2023- -2024- -Total-
Bond General Program $220,000 $220,000
Renewal and Replacement $350,000 $130,000 $480,000
Grand Total $350,000 $350,000 $700,000
Project Purpose (see table above for specific project)
0
50000
100000
150000
200000
250000
300000
350000
400000
-2020- -2021- -2022- -2023- -2024-
Upgrade Obsolete Facility
Upgrade Obsolete Facility

344 Capital Expenditures
Subprogram # 177 SCADA/Process Control - Wastewater Division: Wastewater - Portland Manager: Pellerin, Greg Funding: R & R - Wastewater Priority: Upgrade obsolete facility
Description:
The program supports all 80 wastewater sites across the District in upgrading and replacing the existing Supervisory Control and Data Acquisition (SCADA) equipment. The work needed is replacement of hardware and software to be compatible to the District SCADA standards and provide for increased automation of wastewater systems and treatment. Programmable Logic Controllers (PLC) have been replaced across the District to meet the new standards and remove outdated, non-maintainable equipment. Justification / Impact:
The benefit of this program is to increase the automation and reduce the staff hours needed to perform routine activities for the systems and treatment plants across the District. History:
The District started changing out the system in 2003 by replacing the existing 20 year-old system across the six wastewater communities and installing new SCADA equipment where it did not exist. All systems have been retrofitted or replaced but more automation of these systems will continue. Budget Summary:
Budget year Project Budget Year Cost 2020 - R&R 3126 SCADA Radio Modem Replacement Project - Phase 2 $350,000 2020 - R&R 3127 Westbrook SCADA Server Renewal Program $ 20,000 2021 - R&R 3125 SCADA Radio Modem Replacement Project – Phase3 $300,000 2020 - R&R 3128 EEWWTP SCADA Server Replacement Project $ 20,000
Total Cost, All Years: $690,000
Previous Years on CIP: 2003 to present Related Projects: Subprogram #110 Procurement Issues:
In 2017, the new aeration system went on line. The system is fully automated and is represented in the District’s SCADA system.

345 Capital Expenditures
Water and Wastewater – Multi-fund Program The projects below are being completed and benefits multiple water and wastewater funds and are allocated to the respective fund based on the relative use of the asset.
Project by Program and Subprogram/Project Summary Program -2020- -2021- -2022- -2023- -2024- -Total-
Comprehensive Planning
3\3071 Asset Management Plan $750,000 $750,000
Comprehensive Planning Total $750,000 $750,000
SCADA & Technology
50\3038 Technology Upgrade $200,000 $200,000 $200,000 $200,000 $200,000 $1,000,000
SCADA & Technology Total $200,000 $200,000 $200,000 $200,000 $200,000 $1,000,000
Vehicle/Equipment Replacement
326\3041 Vehicle and Equipment $400,000 $400,000 $400,000 $400,000 $400,000 $2,000,000
Vehicle/Equipment Replacement Total $400,000 $400,000 $400,000 $400,000 $400,000 $2,000,000
Water Distribution System
63\3046 Meter Replacement $390,000 $400,000 $400,000 $400,000 $400,000 $1,990,000
Water Distribution System Total $390,000 $400,000 $400,000 $400,000 $400,000 $1,990,000
Water Facilities Program
68\3050 Facility Upgrades $50,000 $50,000 $50,000 $300,000 $300,000 $750,000
68\3053 Douglass Street Roof $250,000 $250,000
68\3054 HVAC Improvements $425,000 $475,000 $400,000 $1,225,000 $2,525,000
68\3215 Generator/Electrical $400,000 $400,000
68\3216 Stockroom Platform Demo $25,000 $25,000
68\3217 SMT Carpet/Lighting $75,000 $75,000
68\3218 Renovation of Finance $75,000 $75,000
Water Facilities Program Total $450,000 $750,000 $600,000 $775,000 $1,525,000 $4,100,000
Financing Summary (see table above for specific project)Funding Source -2020- -2021- -2022- -2023- -2024- -Total-
Bond General Program $425,000 $475,000 $400,000 $1,225,000 $2,525,000
Operating Budget $750,000 $750,000
Renewal and Replacement $1,440,000 $1,325,000 $1,125,000 $1,375,000 $1,300,000 $6,565,000
Grand Total $1,440,000 $2,500,000 $1,600,000 $1,775,000 $2,525,000 $9,840,000
Project Purpose (see table above for specific project)
0
500000
1000000
1500000
2000000
2500000
3000000
-2020- -2021- -2022- -2023- -2024-
Upgrade Obsolete Facility
Improvement

346 Capital Expenditures
Subprogram # 3 Comprehensive Infrastructure Asset Management Plan (Updated CWWSP Plan) Division: Allocation Manager: Crovo, Chris Funding: Operating Funds – Water and Wastewater Funds Priority:
Description:
The District completed a Comprehensive Water System Stategic Plan (CWSSP) in 2003. This plan has served as the District’s water system master plan for the past 16 years and also serve as a driver to develop an Asset Management approach to infrastructure maintenance and replacement of all the District’s assets. This project will provide the an update to the existing CWSSP plan but will also build out Asset Management Plans for all the District’s water and wastewater critical assets Justification / Impact:
Since the completion of the CWSSP plan in 2003 the District has completed the following;
Completed an Asset Inventory of our Infrastructure Systems
Fully develop and integrated our CMMS and GIS system (Asset Information Management System – AIM)
Updated portions of the Hydraulic Model for the Water system
Completed many of the recommended capital projects
Maintained a financial model for water system and wastewater communities
Conducted many evaluations and condition assessments of many critical assets The District is preparing to take the next step in Asset Management and would be seeking consulting assistance to completed the following;
Determine assets that are critical to sustained performance and develop asset management plans for each asset class
Development of condition-based monitoring plans and deployment
Determine long-term optimized financial strategy
This effort would be used to update and create a single document outlining the status of our infrastructure and a multi-year plan on projects to be completed in the coming decade.
Budget Summary:
Budget year Project Budget Year Cost 2021 - R&R 3071 Comprehensive Infrastructure AMP $750,000
Total Cost, All Years: $ 750,000
Previous Years on CIP: Related Projects: Procurement Issues:

347 Capital Expenditures
Subprogram # 50 Technology Upgrade and Replacement Division: Allocation Manager: Davis, Chad Funding: R & R – Water- Div. 10 Priority: Routine replacement
Description:
PWD has made a commitment to using technology as a means of operating more efficiently. This project is therefore an ongoing one and crosses all department lines and major processes. The focus is on establishing and maintaining a stable reliable network and databases to support PWD decision making, planning, budgeting and daily work activities. The project must also plan for growth and adaptation as new technology solutions become feasible. Justification / Impact:
While economic payback can be demonstrated for many of the line items in this project, replacement of obsolete facilities is also a factor in technology investment. A fast, secure, reliable network and databases impacts PWD ability to be proactive and competitive. Better available information that is timely supports a customer-centric business perspective. History:
Technology infusion into PWD began anew after an EMA study in 1996 recommended the use of technology to reduce a competitive gap, improve customer service and operating efficiency. Early on a technology master plan was developed as a guide for our investments. Key development work focused on building a stable reliable network infrastructure, acquiring best fit software solutions and populating the associated databases and documenting standard operating procedures. Most of the work was done in team environments to ensure the technology solution met the needs of the target PWD employee group. The PWD network consists of a 206 PC/Laptop/Thin Client wide area network supported by 39 servers housing various applications and data sources supporting asset management, customer billing, financials, GIS, voice mail, email, and VoIP phone. Our network also supports over fifty employees in the field via a wireless data network. Technology advances and cost savings continue to influence the design and delivery of information to our employees and customers. Budget Summary:
Budget year Project Budget Year Cost 2020 - R&R 3038 Technology Upgrades $200,000 2021 - R&R 3038 Technology Upgrades $200,000 2022 - R&R 3038 Technology Upgrades $200,000 2023 - R&R 3038 Technology Upgrades $200,000 2024 - R&R 3038 Technology Upgrades $200,000
Total Cost, All Years: $1,000,000
Previous Years on CIP: All since 1996 Related Projects: Procurement Issues: Standard procurement procedures are used for major hardware, software and
consulting purchases.

348 Capital Expenditures
Assets - Billing and Customer & Computerized Maintenance Management
System Project (previously known as the ABC project)
This 2018 project, CIP #50 project 2542 – Hansen System Replacement (Billing and Customer Relations & Computerized Maintenance Mangement Systems) $4,600,000 is expected to be on-line late 2020.
ABC 76,530 Work and
Service Orders
286,000 Assets $40,000,000
Revenue
680,000 Bills
55,000 Customers 186
Employees

349 Capital Expenditures
Subprogram # 326 Vehicle and Equipment Replacement Division: Allocation Manager: Welch, Andrew Funding: R & R – Water- Div. 10 Priority: Routine replacement
Description:
This project is to replace a portion of the District's Vehicle and Equipment fleet each year. This year’s review included the evaluation of all of the vehicles and equipment which have met or exceeded the trade criteria. In reviewing the fleet, the replacement cost is between $4,500,000 and $5,000,000. Justification / Impact:
The rolling stock and construction equipment fleet are essential to the District's "mission to provide our customers with quality water, wastewater and related environmental services." Maintaining a reliable fleet of vehicles and equipment enables staff to fullfill the mission with safety, efficiency and timeliness. Worker safety, efficient operations and customer satisfaction are the basic benefits of maintaining a sound vehicle and equipment inventory. History:
The Asset Management Department conducts an annual evaluation of major pieces of equipment and vehicles to determine our annual replacement needs. The various trade criteria are also reviewed to assure that they are appropriate. Based on the age and use of the fleet, projections of future annual costs are included in the five-year plan. These projections are re-reviewed each year to develop a minimum replacement program for the current year. Several major pieces of equipment will need to be replaced in the next two to four years. Origin of the Subprogram:
Annual review and replacement of vehicles and equipment is a basic operating need of any geographically dispersed utility. Budget Summary:
Budget year Project Budget Year Cost 2020 - R&R Vehicle and Equipment Replacement $400,000 2021 - R&R Vehicle and Equipment Replacement $400,000 2022 - R&R Vehicle and Equipment Replacement $400,000 2023 - R&R Vehicle amd Equipment Replacement $400,000 2024 - R&R Vehicle and Equipment Replacement $400,000
Total Cost, All Years: $2,100,000
Previous Years on CIP: All Procurement Issues: Specifications are developed and proposals are solicited from approximately thirty
vehicle and equipment dealers. Purchases are made on the basis of price and other criteria which lead to lowest life cycle cost.

350 Capital Expenditures
2020 Annual Vehicle and Equipment Estimated Replacement Cost and Trade-in values
2020 Air Compressor ASSET PURCHASE $24,000
TRL05510 2005 Air Compressor TRADE ($2,500)
2020 1-Ton 4x4 Cab, Chassis and Utility Body ASSET PURCHASE $39,000
VEH11080 2011 4x4 Utility TRADE ($6,000)
2020 Wheeler Dump ASSET PURCHASE $150,000
VEH08030 2008 Mack Wheeler Dump TRADE ($50,000)
2020 4x4 1/2 Ton Extended Cab P.U. ASSET PURCHASE $29,000
VEH15110 2015 Dodge Ram 1/2 ton P.U. TRADE ($9,000)
2020 Cargo Van ASSET PURCHASE $25,000
VEH08100 2008 GMC G2500 Van TRADE ($3,000)
2020 2x4 1/2 on P.U. 8' Bed with lift gate ASSET PURCHASE $26,000
VEH10050 2010 2x4 1/2 ton P.U. with lift gate TRADE ($3,500)
2020 2x4 3/4 ton P.U. 8' bed ASSET PURCHASE $28,000
VEH11100 2011 2x4 3/4 ton Extended Cab Utility Body
TRADE ($4,000)
2020 4x4 1-ton with Plow and Utility Body ASSET PURCHASE $45,000
VEH13040 2013 4x4 with Plow and Utility Body TRADE ($8,000)
Vacuum Excavation Trailer ASSET PURCHASE $120,000
Total CIP Request $400,000

351 Capital Expenditures
Subprogram # 63 Meter Replacement and Leak Detection Division: Allocation Manager: Wallace, Jim Funding: R & R – Water - Div. 10 Priority: Routine replacement
Description:
This work includes the cost to maintain the Long Service Meter Change program, and replacement of damaged meters. It also include the purchasing of leak detection and monitoring equipment. The District completed a change out all of its 50,000 meters to radio read system in 2009. The meters and batteries are expected to last 20 years for the smaller meters and less for the larger meters. Justification / Impact:
This is a required program to meet PUC requirements and maintain accurate billing of customer accounts and account for lost water. Since long service meters typically under estimate the actual water flow, the Long Service Meter Change program is needed to ensure that the District receives all the revenue to which it is entitled. History:
New terms and conditions have recently been instituted to increase the long service interval from 15 to 20 years. Origin of the Subprogram:
These costs do not reflect the value of meters and radio reading devices which is contributed by customers. Budget Summary:
Budget year Project Budget Year Cost 2020 - R&R 3046 Meter Replacement and Leak Detection $390,000 2021 - R&R Meter Replacement and Leak Detection $400,000 2022 - R&R Meter Replacement and Leak Detection $400,000 2023 - R&R Meter Replacement and Leak Detection $400,000 2024 - R&R Meter Replacement and Leak Detection $400,000
Total Cost, All Years: $1,990,000
Previous Years on CIP: All Related Projects: none Procurement Issues: Standard meter procurement procedures.

352 Capital Expenditures
Subprogram # 63 Meter Replacement and Leak Detection
The above graph is projecting the life cycle of the District’s 50,000 meters. The next major meter change-out is projected for 2026-2028.

353 Capital Expenditures
Subprogram # 68 Facilities Improvements Division: Allocation Manager: Welch, Andrew Funding: R & R – Water- Div. 10 Priority: Upgrade obsolete facility
Description:
This project is a combination of numerous subprojects addressing the improvements and maintenance needs of the Douglass Street and Lake office facilities. Some of the projects shown in this years plan are ongoing projects while others are for the current plan year only. Justification / Impact:
In order to maintain our office facilities in good condition and provide a suitable environment for our employees and customers, it is necessary to have a program to address any problem areas and additional requirements. In order to maintain the integrity of the facilities, problem areas such as leaks, indoor air quality, worn out or aging equipment and infrastructure needs to be addressed on an ongoing basis.
Budget Summary:
Budget Year Project Cost
2020 R&R 3050 Facility Upgrades $ 50,000
2020 Bonds 3215 Generator/Electrical Upgrades $ 400,000
2021 R&R 3053 Douglass Street Roof replacement - Phase 3 of 3 $ 250,000
2021 Bonds 3054 HVAC Improvements -Phases 1 $ 425,000
2021 R&R 3216 Stockroom Platform Demo $ 25,000
2022 R&R 3050 Facility Upgrades $ 25,000
2022 Bonds 3054 HVAC Improvements -Phases 2 $ 475,000
2022 R&R 3217 SMT Renovation/Carpet/Lighting $ 75,000
2023 R&R 3050 Facility Upgrades $ 300,000
2023 Bonds 3054 HVAC Improvements -Phases 3 $ 400,000
2023 R&R 3218 Renovation of Finance $ 75,000
2024 R&R 3050 Facility Upgrades $ 300,000
2024 Bonds 3054 HVAC Improvements -Phases 4 $ 1,225,000
Total Cost, All Years $ 4,075,000
Previous Years on CIP: 2000

354 Capital Expenditures
Related Projects: Procurement Issues:
2019 – Douglass Street – Slate Roof replacement – Phase 2 – Project Started November

355 Capital Expenditures
Watershed/Land Funds
Subprogram # 1 Watershed Land Acquisition Division: Water - General Manager: Twaddel, Norman Funding: Watershed Land Reserve Priority: Regulatory mandate
Description:
Purchase land with or without buildings in accordance with the Watershed Land Purchase Policy. Justification / Impact:
Ownership of land, particularly along the shore of Sebago Lake within the two-mile limit is the surest way to control land use that affects Lower Bay water quality and body contact. History:
The District has a long standing policy to purchase Sebago Lake water frontage and other critical land for the purpose of watershed protection and long-term maintenance of Sebago Lake water quality. We do not aggressively solicit land to buy, but we have made public our interest to purchase Watershed land and, in recent times, all purchases have resulted from seller initiated contacts. Origin of the Subprogram:
Budget Summary:
Budget year Project Budget Year Cost PEND 1 Watershed Protection Land Purchase $434,000
Total Cost, All Years: $434,000
Previous Years on CIP: All since 1994 Related Projects: None Procurement Issues: Purchase decisions are negotiated on the basis of professional real estate appraisals.
Board of Trustees approval of individual purchases is required.
Eel Cove – Shorefront properties within the 2 mile limit left. (Lanni/Porter purchased in 2007, Stanford in 2008 ,Messenger 2017, Webb 2018)

356 Capital Expenditures
Subprogram # 2 Watershed Land Conservation Division: Water - General Manager: Hunt, Paul Funding: Watershed Land Reserve Priority: Regulatory mandate
Description:
Contribute towards land conservation projects in accordance with the Watershed Land Conservation Policy. Justification / Impact:
There is a direct link between the degree to which a watershed is forested and the quality of water in the lakes and streams within it (AWWA, 2004). Conservation of forested land in perpetuity protects water quality, which benefits both customers of the Portland Water District and all other users of Sebago Lake. History:
In 2007 the Portland Water District trustees adopted a policy to support measures to preserve Sebago Lake watershed land in perpetuity and to provide open space for lake-friendly public access. The District acknowledges that it is neither feasible nor necessary to own all land in the watershed. Instead the District cooperates and partners with organizations and individuals who seek to preserve and manage their watershed lands in a manner that protects water quality and therefore protects the health of drinking water consumers. In 2012, the policy was amended to allow for a contribution of up to 25% of the easement/acquisition value and a Standard Operating Procedure was developed for assessing projects. Budget Summary:
Budget year Project Budget Year Cost PEND 2 Watershed Land Conservation $200,000
Total Cost, All Years: $200,000
Previous Years on CIP: None Related Projects: Subprogram #1 – Watershed Land Aquisition Procurement Issues: Project contributions are recommended by staff based on a formula. Board of
Trustees approval of contributions is required. Subprogram #1 and #2 are pending unscheduled work that may occur in 2020. If projects are undertaken, the Board of Trustees will be requested to approve and the Capital Improvement Plan amended. The project funding has not been included in the 2020 budget.

357 Capital Expenditures
Summary of Watershed Conservation Projects 2008-2018 – 5826 Acres Conserved – District’s contribution $900,732
Project Town Acres Year PWD
ContributionHague Waterford 350 2008 $5,000
Little Moose Pond Waterford 23 2009 $500
Watkins Waterford 690 2011 $9,250
Camp Wawenock Raymond 60 2010 $10,000
Tenny River Raymond 28 2012 $5,000
Hague Farmstead Waterford 88 2012 $1,900
Perley Mills Bridgton/Denmark 800 2013 $50,000
Maple Ridge Harrison 35 2013 $5,880
Moon Valley Harrison 14 2013 $5,510
Flint Farm Albany Township 156 2013 $7,600
Perley Pond/NW River Sebago 150 2014 $33,600
Crooked River Watershed Forestland Harrison/Otisfield 791 2014 $268,899
Cummings Parcel Harrison 10 2014 $5,000
Stanley Parcel Waterford 21 2015 $1,575
Raymond Community Forest Raymond 350 2014 $38,944
Whitney Pond Stoneham 70 2015 $36,860
Proctor Pond Albany Township 54 2015 9000
Howe Woodlot Waterford 40 2017 3,200
Fogg Lot Otisfield 68 2017 13,600
Hawk Mountain Waterford 16 2017 2,420
Crooked River Forest Harrison 38 2018 5,270
Peabody-Fitch Bridgton 191 2018 20,724
Tiger Hill/ Sebago Community Forest Sebago 1417 2018 345,000

358 Capital Expenditures

359 Financial Policies
Introduction The District has the responsibility to manage their financial resources by establishing and following prudent financial policies and procedures. A summary of the significant financial policies is listed below. The district is in compliance with the policies except where noted below. Each policy is designated as being adopted by Law, Board or Management – see designation in parenthesis by policy title.
Significant Financial Policies
Accounting, Auditing, and Financial Reporting:
Basis of Accounting (Law-Charter)
The District maintains its accounting records and reports on its financial conditions and results of operations in accordance with generally accepted accounting principles as promulgated by the Governmental Accounting Standards Board (GAAP). As a business-type activity, the District is accounted for in enterprise funds. The basic financial statements are accounting for on the flow of economic resources measurement focus, using the accrual basis of accounting. Under this method, all assets and liabilities are included in the statement of net position, revenues are recorded when earned, and expenses are recorded the time the liabilities are incurred. (See Budgeting and Financial Planning section for difference between GAAP and Budget.)
Fund Structure (Law-Charter) As required by the District’s charter, eight-supporting enterprise funds will be maintained – one fund for water service and seven funds for each of the communities we provide wastewater service. Revenues and expenses that are solely for the benefit of that fund are allocated directly to the enterprise fund. Enterprise funds, used for business-like activities, operate on an accrual basis. The accrual basis of accounting used by enterprise funds requires revenue to be recognized when it is earned and expenses to be recognized when the related benefit is received. By contract, the District provides billing and meter reading services to two other communities. Related costs are recorded in the appropriate fund. Costs that benefits more than one fund are recorded in an allocated fund. The balance in each fund is fully allocated to the appropriate enterprise or contracted utility billing funds. A detail explanation of the allocation methods used is provided on subsequent pages (see Cost Allocation Policy Detail on subsequent pages).
Annual Audit (Law-Charter) Annual audit shall be conducted each year by the June 30. The Board of Trustees shall appoint auditors.
2020 Policy Changes Highlights Leases: A new accounting rule issued by GASB changes the way leases are recorded. In the past, the revenue received or payment paid were included as revenue and expenses. The new rule requires the present value of the future lease payments be recorded on the balance sheet and amortized over the life of the lease agreement. The District is capitalizing transactions with a present value greater than $10,000, the same level as other asset purchases. The change impacts the budget by increasing expense by $2,480 and revenue by $39,770. Watershed Protection Fund: The District protects the Sebago Lake water source by purchasing land and conservation easements. In 2019, the District issued a bond to purchase conservation easement. A Watershed Protection fund was created within the financial system and this Budget document. In the past, those transactions were recorded within the Water Fund.

360 Financial Policies
Significant Financial Policies (continued)
Financial Planning Policies:
Financial Reporting (Management) Monthly financial reports should be distributed to the Board of Trustees and Management for their review. The report should include a comparison of actual results to budget with variance noted and explained.
Basis of Budgeting (Management) The budget is consistent with GAAP, including the utilization of accrual accounting, except for the following items:
Depreciation, being a non-cash expense, is not budgeted,
Contributions to asset renewal and replacement cash reserve is budgeted,
Principal Payments are included in the budget,
Contributed assets are not included in the operating or capital budget,
Pension Actuarially Determined Contribution is included in the budget opposed to the pension expense, and
Net proceeds of asset sales are not recorded in the budget. The Board must authorize any amendment to the operating budget that results in a net increase in the total net operating budget. The general manager and treasurer are authorized to approve transfers between department and funds. The Board of Trustees must approve all capital projects. The upcoming year’s projects listed in the Capital Expenditure section of this document are approved when the document is adopted. As long as the actual costs are at or below the approved amount and it is awarded to the lowest bidder, the project does not need additional Board approval. The policy requires the preparation of a multi-year projection of operating and capital expenses. The budget must be completed so the wastewater communities can be assessed the annual estimated costs by January 15th. The budget year is January 1 to December 31.
Balanced Budget (Charter) A balanced operating budget is a budget that has total expenditures equal to total revenues, including use of fund balance. A balanced capital budget is a budget that has total expenditures that do not exceed available renewal/replacement fund amounts and external financing (bonds, grants or contributions).

361 Financial Policies
Significant Financial Policies (continued)
Financial Planning Policies (continued):
Long –Range Planning (Management) Capital Improvement Plan A five-year capital improvement plan will be updated annually. The Board may authorize capital expenditures in the upcoming year as long the staff awards the project to lowest bidder and the total project budget is within the amount in the capital improvement plan. Operating Budget Operating projections of at least three future years are created. For the water fund, the projection is used to decide the appropriate water rate adjustment to consider. For most communities, wastewater services are a joint effort of the District providing treatment and interception service and the community providing collection and storm drain services. The District’s projected assessment of our cost and their internal costs are considered when determining the appropriate sewer rate. All funds incorporate the recommendations of the capital improvement plans and operational evaluations/studies when projecting operating costs.
Asset Inventory (Management) The District utilizes an asset management system that identifies the District assets. All employees must record their time to work orders and the applicable asset they are working on. Assets classifications are being reviewed for accuracy and completeness with review focusing on the most important assets. Condition rating of assets has been done on some assets and efforts will continue on critical assets. Asset evaluation studies are completed periodically on critical assets.
Revenue Policies:
Water Rates (Board) Water rates are established to provide sufficient revenues to fully support the operation of the water fund’s activities. In 1994, 2006, and 2016 cost of service studies calculated for each customer class (e.g. – residential, commercial, etc.) the amount of revenues generated and costs incurred. The study indicated that some classes were subsidizing other classes. Recognizing the impact of changing rates to reflect the cost of service for each customer class would cause significant rate shock for some customers, the approach of gradually adjusting rates over the future rate adjustments was adopted. Cost of service studies should be done periodically, approximately every 10 years, or if significant financial or operational change occurs that may have shifted the costs to serve the different customer classes. Generally, the Board has approved a small annual rate adjustment near the increase in the consumer price index. In 2013, a new state law allowed for funding through an infrastructure capital reserve. The law allows the District to include an additional 10% in rates to fund a capital reserve. The 2019 budget assumes 1% of the proposed 4.4% water rate adjustment be dedicated to the capital reserve. The 1% will fund the debt service on $2 million, 10-year bond for replacing aging water mains. Past practice is to issue 20-year bond to finance main renewal. An additional 1% will be added for the each of the ten years beginning in 2014.

362 Financial Policies
Significant Financial Policies (continued)
Revenue Policies (continued):
Wastewater Assessment (Law -Charter) Wastewater assessments are established to provide sufficient revenues to support the operation for each of wastewater funds’ activities. By state law, the municipality must pay the district’s assessment.
Service Fees (Board) Fees for miscellaneous service should be based on the cost to provide the service. Effective January 1, 2016, the District’s Board can unilaterally authorize changes for water related fees. The District must file ‘terms and conditions’ (T&C) with the Maine Public Utilities Commission for information only. The T&C includes the fees for any service the District requires customers to obtain from the District. The District intends to file updated T&C at least every two years to assure the fees assessed covers the costs of providing the service. Updated T&C were approved with an effective date of May 1, 2019. Additionally the Board approved a policy authorizing non-water related fees and will approve those fees in the future at the same time they approve the water related fees.
Investments (Board) Operating fund investments must be invested with the primary objective, in priority order, of safety, liquidity and yield. Investments should be made in securities that are backed directly or indirectly by the federal government. Currently, we are in compliance with the policy.
Pension funds’ investments will be primarily invested in a diversified portfolio of equity and debt
securities within guidelines established in the policy. The policy was revised to allow for US equities portion of plan assets, securities of foreign-based issuers that are transacted in US dollars on US exchanges are permitted up to a limit of 20%, an increase from 10%, and will be classified as US equities. Minimum Target Maximum Weight Weight Weight US Equities 30% 40% 50% International Equities 10% 25% 30% Bonds 20% 25% 40% Alternatives 0% 10% 15% Cash & Equivalents 0% 0% 30%
Use of One-time/Unpredictable Revenue (Board) The District’s Board has established a fund to collect the net proceeds of water land sales. The fund is dedicated to future investment in protecting the watershed land. Unexpected water net income is typically allocated to contingency or rainy day fund. However, the Board considers whether any portion should be allocated to the watershed land fund. The Board has established a goal of 25% and 15% of operating expense for the contingency and watershed land funds, respectively. Unexpected wastewater net income is retained in the individual funds contingency fund.

363 Financial Policies
Significant Financial Policies (continued)
Expenditure Policies:
Debt (Board) Debt may be issued for capital expenditures only. There is no legal limit for the amount of debt the District can issue. However, the Board has set a maximum target for debt service in any fund to 35% of total budget. The target is close to industry standard (AWWA Industry Benchmark, median quartile, 2012). In addition, operating revenue available for debt service should be at least 125% of the annual debt service. The District is in compliance with the policy with the exception that the Windham wastewater fund is above the 35% limit due to construction of the Little Falls Conveyance system in 2009 at the request of the Towns of Windham and Gorham. Debt will not be issued for longer than the useful life of the assets being financed. The average duration of outstanding debt should be 10 years or less.
Reserve Balances (Board) Each operating fund has a target balance of 25% of annual net operating budget. All funds, except Portland and Windham wastewater funds, are expected to meet the target in the coming year. Portland and Windham funds are 3% and 4% below the target reserve balance. Each fund has a cash reserve fund for the renewal and replacement of fixed assets. The target balance for the water and wastewater funds are 1% and 5%, respectively, of gross fixed asset costs. The wastewater target was increased from 3% to 5% in 2017. Westbrook and Windham meet the revised wastewater target. Cape Elizabeth, Cumberland, Gorham and Portland do not meet the increased target. The Water fund balance is anticipated to meet the target in 2021. In addition, the Water fund has a target balance of 15% of the annual net operating budget for a watershed land reserve. We project the reserve to be at 8% at the end of 2019. The 2020– 2024 trend of operating and renewal & replacements fund balances for each of the Water & Wastewater funds are located in the Budget by Fund section.
Capital Expenditures (Board) A capital expenditure is a project with a cost of $10,000 or more and has a useful life greater than 5 years. An exception is made for certain assets annually purchased in bulk that exceed the $10,000 amount in a year. For example, individual hydrants, meters and service lines costs less than $10,000 but total annual purchases exceed $10,000. The Board of Trustees must approve all capital expenditures. An annual capital improvement plan is reviewed and approved by the Board and provides authorization for capital expenditures as long as the project costs is not exceeded and the lowest bid is accepted. If project cost is anticipated to exceed budget or the lowest bid is not accepted, the Board must specifically authorize. The General Manager who must inform the Board of the expenditure must approve emergency capital expenditures.
Purchasing (Board) The policy outlines the requirements for obtaining competitive pricing and the formal bidding processes. It also establishes authorization levels for operating expenses including the requirement that expenses greater than $50,000 be approved by the Board. Amounts less than $50,000 must be included in the Board approved budget. We are in compliance with the policy.
364 Financial Policies
Significant Financial Policies (continued)
Expenditure Policies (continued):
Pension Funding Policy (Board) The Board voted to fully fund the District’s defined benefit plan by contributing at least the annual required contribution as calculated by the actuary. Because of new accounting rules that went into effect in 2015, the Board adopted a new pension funding policy effective for 2015. The policy states the District’s intention to adequately fund the pension plan and contribute at least the actuarially determined contribution consistent with assumption used to calculate the pension expense under the new accounting rule, except to spread out the funding for impact of changes of the benefits negotiated as part of the three-year union contract over the life of the union contract. The policy states the District will fund $1 million a year, assuming the $1 million is greater than the actuarially determined contribution (ADC). The 2020 Budget assumes the ADC of $1.1 million will be paid in 2020.
Risk Management Policies
Maine Tort Claims Act (Law- State) As a public entity, the District's liability for third party tort claims is limited by the provisions of the Maine Tort Claims Act. The Act provides that the District is immune from claims, unless the Act provides a specific exception from immunity. In the District's case, the exception most likely to affect the District is one making the District liable for negligent use of machinery and equipment. Should the District be liable for a claim under the provisions of the Act, its liability is capped by the Act at $400,000. The immunity provided public entities by the Tort Claims Act helps keep to keep the cost of the District's insurance lower, allowing the District to pass this savings to its ratepayers.
Property and Liability Insurance (Board) Property and liability insurance is purchased to cover building and personal property losses including losses due to flood and earthquakes. Certain liability claims are limited under the Maine Tort Claim Act to $400,000. The Board adopted a change to limit insurance on claims covered by the Tort Claim Act to the Act’s limit.
Safety Program (Management) A full-time safety officer and executive safety team oversee various safety policies including confined space entry, electrical safety, ergonomic for video display terminals, fall protection, hazard communication and safety commitment policies. A safety incentive policy outlines an employee award program recognizing good safety performance.
Employee Management (Management) A four-person Employee Services department oversees the district’s employee relations management and practices. Over 60 policies have been created to guide management and employees with one goal of reducing the District’s risk to losses.
In-House Legal Counsel (Board) In 2006, the Board authorized hiring in-house legal counsel. Legal counsel actively participates in overseeing the district’s operation, including reviewing all contracts, and proactively identifying ways to reduce or avoid legal issues.

365 Financial Policies
Cost Allocation Policy Detail The District has one water fund and six wastewater funds (Cape Elizabeth, Cumberland, Gorham, Portland, Westbrook and Windham). In addition, the District also provides billing and/or meter reading services to three other municipalities (Falmouth, Scarborough and South Portland). It is the District’s policy to directly assign expenses to a fund/municipality whenever possible. However, there are some expenses, such as paid time off or work done by administrative personnel, where such an assignment is not possible. In such cases, an allocation of that cost must be done. In 1995, the District engaged an outside consultant to review and update its cost allocation process. Since that time, organizational and other changes have necessitated updates and modifications. The changes that were made used the guidelines from the 1995 study. The current allocations were reviewed and approved by the District’s current auditors during 2013. Currently the District uses the following methods to allocate costs:
Customers Served
Direct Labor
General Allocation Percentage
Gross Asset Value
Meter Equivalent Units
Relative Benefits
Square Footage Utilized A description of each method, the percentages used in this Budget and the dollars allocated, are in the following pages. Each financial transaction is assigned a cost center number when the transaction is recorded in the financial system. The fund number indicates whether it is a ‘direct’ charge to the fund or an ‘indirect’ charge that will be allocated. Each department’s costs are broken down into the fund category in the Departmental Expense section. All costs ultimately are assigned to the one of the seven enterprise funds or three contact billing municipalities.
Fund Description Fund Description
10 Allocated to All Direct Funds 57 Portland Wastewater
20 Water - members 59 South Portland Billing
30 Water - nonmembers 61 Gorham Wastwater
50 Allocated to All Wastewater Funds 62 Westbrook Wastewater
51 Cape Elizabeth Wastewater 64 Allocated to
53 Cumberland Wastewater Gorham/Westbrook/Windham
54 Falmouth Wastewater 65 Allocated to Gorham/Windham
55 Windham Wastewater 66 Portland Wastewater (Peaks Island)

366 Financial Policies
Customers Served This method determines the ratio of customers per fund to the total number of customers served based on the average total number of water and sewer customers. The costs for Customer Service have three different allocations (general, billing and meter reading costs) that vary slightly. Falmouth has flat billings for their sewer customers; therefore, their general needs are limited (compared with sewer bills based on usage) and they do not utilize meter reading data. In addition, Scarborough does its own billing and payment processing utilizing the District’s meter reading data, thus they have no general or billing expenses. Sub-Groups Using Method:
F1 – Customer Service H1 – Financial Services (payment processing)
2 0 2 0 Alloc a tion %: 2 0 19 Alloc a tion %:
-
Ge ne ra l
F1
Billing
F1
Me te r
Re a d F1
Pa ymts
H1 -
Ge ne ra l
F1
Billing
F1
Me te r
Re a d F1
Pa ymts
H1
Water 67.50% 66.13% 67.57% 66.13% Water 67.50% 66.04% 67.48% 66.04%Cape Eliz 2.15% 2.15% 2.15% 2.15% Cape Eliz 2.15% 2.15% 2.15% 2.15%Cumberland 1.08% 1.08% 1.08% 1.08% Cumberland 1.08% 1.08% 1.08% 1.08%Falmouth 0.36% 1.82% 0.00% 1.82% Falmouth 0.36% 1.82% 0.00% 1.82%Gorham 1.69% 1.71% 1.71% 1.71% Gorham 1.69% 1.69% 1.69% 1.69%Portland 15.67% 15.60% 15.60% 15.60% Portland 15.67% 15.67% 15.67% 15.67%Scarborough 0.00% 0.00% 0.38% 0.00% Scarborough 0.00% 0.00% 0.38% 0.00%So Portland 7.23% 7.20% 7.20% 7.20% So Portland 7.23% 7.23% 7.23% 7.23%Westbrook 4.27% 4.26% 4.26% 4.26% Westbrook 4.27% 4.27% 4.27% 4.27%Windhan 0.05% 0.05% 0.05% 0.05% Windhan 0.05% 0.05% 0.05% 0.05%
100.00% 100.00% 100.00% 100.00% 100.00% 100.00% 100.00% 100.00%
Dolla rs Alloc a te d: Dolla rs Alloc a te d:
-
Ge ne ra l
F1
Billing
F1
Me te r
Re a d F1
Pa ymts
H1 -
Ge ne ra l
F1
Billing
F1
Me te r
Re a d F1
Pa ymts
H1
Water $697,482 $227,500 $53,955 $120,309 Water $664,589 $266,047 $53,737 $122,922Cape Eliz $22,216 $7,396 $1,717 $3,911 Cape Eliz $21,168 $8,661 $1,712 $4,002Cumberland $11,160 $3,715 $862 $1,965 Cumberland $10,633 $4,351 $860 $2,010Falmouth $3,720 $6,261 $0 $3,311 Falmouth $3,544 $7,332 $0 $3,388Gorham $17,463 $5,883 $1,365 $3,111 Gorham $16,639 $6,808 $1,346 $3,146Portland $161,919 $53,667 $12,457 $28,381 Portland $154,283 $63,128 $12,479 $29,167Scarborough $0 $0 $303 $0 Scarborough $0 $0 $303 $0So Portland $74,708 $24,769 $5,749 $13,099 So Portland $71,185 $29,127 $5,758 $13,457Westbrook $44,122 $14,655 $3,402 $7,750 Westbrook $42,041 $17,202 $3,400 $7,948Windhan 517 173 40 91 Windhan 495 202 39 92
$1,033,307 $344,019 $79,850 $181,928 $984,577 $402,858 $79,634 $186,132

367 Financial Policies
Direct Labor This method calculates the ratio of labor dollars directly charged by the area to specific funds. Sub-Groups Using Method: B1 – Wastewater Administration B3 – East End (Portland) Wastewater Treatment C1 – Facilities Services E7 – Instrumentation (general wastewater)
L6 – Laboratory L9 – Water/Wastewater Systems
2020 Allocation %: B1 B3 C1 E7 L6 L9
Water 0.00% 0.00% 83.08% 0.00% 34.00% 0.00%Cape Elizabeth 11.88% 7.34% 3.69% 11.88% 4.68% 11.88%Cumberland 4.00% 0.00% 0.84% 4.00% 0.00% 4.00%Gorham 5.73% 2.28% 1.09% 5.73% 3.94% 5.73%Portland 63.39% 75.73% 8.74% 63.39% 35.82% 63.39%Westbrook 12.72% 14.15% 2.41% 12.72% 21.02% 12.72%Windham 2.28% 0.50% 0.15% 2.28% 0.54% 2.28%
100.00% 100.00% 100.00% 100.00% 100.00% 100.00%Dollars Allocated: B1 B3 C1 E7 L6 L9
Water $0 $0 $167,983 $0 $77,074 $0Cape Elizabeth 46,612 34,416 7,461 9,152 10,609 63,425Cumberland 15,694 0 1,698 3,081 0 21,355Gorham 22,482 10,691 2,204 4,414 8,932 30,592Portland 248,713 355,088 17,672 48,832 81,200 338,429Westbrook 49,907 66,348 4,873 9,799 47,650 67,910Windham 8,946 2,344 303 1,757 1,224 12,173
$392,354 $468,887 $202,194 $77,035 $226,689 $533,884
2019 Allocation %: B1 B3 C1 E7 L6 L9
Water 0.00% 0.00% 80.00% 0.00% 33.27% 0.00%Cape Elizabeth 10.90% 6.69% 3.36% 10.90% 4.14% 10.90%Cumberland 3.31% 0.00% 0.66% 3.31% 0.00% 3.31%Gorham 5.35% 2.26% 1.01% 5.35% 3.13% 5.35%Portland 66.12% 77.27% 12.88% 66.12% 41.20% 66.12%Westbrook 12.38% 13.31% 1.70% 12.38% 17.67% 12.38%Windham 1.94% 0.47% 0.39% 1.94% 0.59% 1.94%
100.00% 100.00% 100.00% 100.00% 100.00% 100.00%Dollars Allocated: B1 B3 C1 E7 L6 L9
Water $0 $0 $162,787 $0 $72,618 $0Cape Elizabeth 41,874 27,709 6,837 8,043 9,036 61,071Cumberland 12,716 0 1,343 2,442 0 18,545Gorham 20,553 9,360 2,055 3,948 6,832 29,975Portland 254,009 320,038 26,209 48,788 89,927 370,459Westbrook 47,559 55,127 3,459 9,135 38,568 69,363Windham 7,453 1,947 794 1,431 1,288 10,869
$384,163 $414,181 $203,484 $73,787 $218,269 $560,283

368 Financial Policies
General Allocation Percentage The ratio is calculated by determining each fund’s operating budget (total expenditures less other/interest income) as a percentage to the total operating budget. Sub-Groups Using Method: E7 – Instrumentation G1 – Information Service
H1 – Financial Services I1 – Employee Services
J1 – General Manager’s Office
2020 Allocation %: E7 G1 H1 I1 J1
Water 56.05% 56.05% 56.05% 56.05% 56.05%Cape Elizabeth 3.66% 3.66% 3.66% 3.66% 3.66%Cumberland 2.17% 2.17% 2.17% 2.17% 2.17%Gorham 2.66% 2.66% 2.66% 2.66% 2.66%Portland 28.45% 28.45% 28.45% 28.45% 28.45%Westbrook 6.13% 6.13% 6.13% 6.13% 6.13%Windham 0.88% 0.88% 0.88% 0.88% 0.88%
100.00% 100.00% 100.00% 100.00% 100.00%
Dollars Allocated: E7 G1 H1 I1 J1
Water $84,284 $671,708 $407,200 $346,575 $1,021,198Cape Elizabeth 5,504 43,862 26,590 22,631 66,683Cumberland 3,263 26,005 15,765 13,418 39,536Gorham 4,000 31,878 19,325 16,448 48,464Portland 42,781 340,947 206,688 175,915 518,342Westbrook 9,218 73,462 44,534 37,904 111,685Windham 1,323 10,546 6,392 5,440 16,034
$150,373 $1,198,408 $726,494 $618,331 $1,821,942
2019 Allocation %: E7 G1 H1 I1 J1
Water 55.89% 55.89% 55.89% 55.89% 55.89%Cape Elizabeth 3.59% 3.59% 3.59% 3.59% 3.59%Cumberland 2.08% 2.08% 2.08% 2.08% 2.08%Gorham 2.64% 2.64% 2.64% 2.64% 2.64%Portland 28.91% 28.91% 28.91% 28.91% 28.91%Westbrook 6.04% 6.04% 6.04% 6.04% 6.04%Windham 0.85% 0.85% 0.85% 0.85% 0.85%
100.00% 100.00% 100.00% 100.00% 100.00%
Dollars Allocated: E7 G1 H1 I1 J1
Water $80,222 $604,199 $395,038 $289,146 $1,000,868Cape Elizabeth 5,153 38,810 25,375 18,573 64,289Cumberland 2,986 22,486 14,702 10,761 37,248Gorham 3,789 28,540 18,660 13,658 47,277Portland 41,496 312,532 204,340 149,565 517,715Westbrook 8,670 65,295 42,692 31,248 108,163Windham 1,220 9,189 6,008 4,397 15,222
$143,535 $1,081,050 $706,814 $517,348 $1,790,781

369 Financial Policies
Gross Asset Value The allocation percentage is each fund's gross (fixed) asset value as a ratio to all gross assets. Costs allocated include those that involve all District assets (All) or in some cases only wastewater assets (WW). The same asset values are used in both calculations except that the Water assets are removed for the wastewater calculations. Sub-Group Using Method:
E2 – Planning and Design
2020 Allocation %: 2019 Allocation %:
All WW All WW
Water 64.36% 0.00% Water 63.64% 0.00%Cape Elizabeth 3.25% 9.12% Cape Elizabeth 3.33% 9.17%Cumberland 1.54% 4.31% Cumberland 1.59% 4.36%Falmouth 0.00% 0.00% Falmouth 0.00% 0.00%Gorham 3.50% 9.83% Gorham 3.61% 9.92%Portland 22.36% 62.74% Portland 22.77% 62.64%Westbrook 4.40% 12.34% Westbrook 4.44% 12.21%Windham 0.59% 1.66% Windham 0.62% 1.70%
100.00% 100.00% 100.00% 100.00%
Dollars Allocated: Dollars Allocated:
All WW All WW
Water $636,348 $0 Water $647,795 $0Cape Elizabeth 32,134 22,876 Cape Elizabeth 33,896 23,361Cumberland 15,226 10,811 Cumberland 16,185 11,107Falmouth 0 0 Falmouth 0 0Gorham 34,606 24,657 Gorham 36,746 25,271Portland 221,080 157,374 Portland 231,777 159,575Westbrook 43,504 30,953 Westbrook 45,195 31,105Windham 5,834 4,164 Windham 6,311 4,331
$988,732 $250,835 $1,017,905 $254,750

370 Financial Policies
Meter Equivalent Units This calculation takes each meter and assigns a weight based on its size to determine a value of meter service provided to each fund. Sub-Group Using Method:
A6 – Utility Services (meter service)
2020 Allocation %: 2019 Allocation %:
A6 A6
Water 65.48% Water 65.39%Cape Elizabeth 1.75% Cape Elizabeth 1.76%Cumberland 0.96% Cumberland 0.97%Gorham 1.56% Gorham 1.56%Portland 17.21% Portland 17.23%Scarborough 1.12% Scarborough 1.14%South Portland 7.61% South Portland 7.64%Westbrook 4.23% Westbrook 4.23%Windham 0.08% Windham 0.08%
100.00% 100.00%
Dollars Allocated: Dollars Allocated:
A6 A6
Water $105,909 Water $103,467Cape Elizabeth 2,831 Cape Elizabeth 2,785Cumberland 1,553 Cumberland 1,535Gorham 2,523 Gorham 2,468Portland 27,836 Portland 27,263Scarborough 1,812 Scarborough 1,804South Portland 12,309 South Portland 12,089Westbrook 6,842 Westbrook 6,693Windham 128 Windham 127
$161,743 $158,231

371 Financial Policies
Relative Benefits This method of allocation is based upon management's assessment of the benefit received by the departments and funds from the areas providing the service. Customer Service (control/dispatch) allocation assumes most work (95%) will involve the Water fund; the remaining dollars are allocated to wastewater funds based on the number of pump stations in each community. The Laboratory wastewater split was determined by the number of tests run for each community. The allocation (new in 2019) for Industrial Pretreatment (IPT) is based on the applicable industries in each community. Sub-Groups Using Method:
F1 – Customer Service (control/dispatch center) L6 – Laboratory (general wastewater) L6 – Industrial Pretreatment (IPT)
2020 Allocation %: 2019 Allocation %:
F1 L6 IPT F1 L6 IPT
Water 95.00% 0.00% 0.00% Water 95.00% 0.00% 0.00%Cape Elizabeth 1.64% 7.94% 0.00% Cape Elizabeth 1.64% 7.94% 0.00%Cumberland 0.93% 0.00% 0.00% Cumberland 0.93% 0.00% 0.00%Gorham 0.99% 3.80% 12.00% Gorham 0.99% 3.80% 10.00%Portland 1.00% 62.50% 64.00% Portland 1.00% 62.50% 66.00%Westbrook 0.17% 24.80% 22.00% Westbrook 0.17% 24.80% 22.00%Windham 0.27% 0.96% 2.00% Windham 0.27% 0.96% 2.00%
100.00% 100.00% 100.00% 100.00% 100.00% 100.00%
Dollars Allocated: Dollars Allocated:
F1 L6 IPT F1 L6 IPT
Water $187,084 $0 $0 Water $192,217 $0 $0Cape Elizabeth 3,230 19,156 0 Cape Elizabeth 3,318 19,179 0Cumberland 1,831 0 0 Cumberland 1,882 0 0Gorham 1,950 9,168 6,783 Gorham 2,003 9,179 7,542Portland 1,969 150,790 36,179 Portland 2,023 150,971 49,774Westbrook 335 59,833 12,436 Westbrook 344 59,905 16,591Windham 532 2,317 1,131 Windham 547 2,320 1,508
$196,931 $241,264 $56,529 $202,334 $241,554 $75,415

372 Financial Policies
Square Footage Utilized The costs of the Douglass Street administrative facility are charged to each area based on the square footage they occupy. Office space is charged out at a higher rate (five times higher) than warehouse space. Dollars are allocated to the sub-groups.
2020 Allocation %: 2019 Allocation %:
Water Operations Water Operations
A1 - Water Administration 2.00% A1 - Water Administration 2.67%A2 - Transmission/Distribution 5.79% A2 - Transmission/Distribution 5.25%A6 - Utility Services 1.56% A6 - Utility Services 1.58%
9.35% 9.50%Environmental Services Environmental Services
A5 - Water Resources 0.82% A5 - Water Resources 0.83%L6 - Water/WW Laboratory (IPT) 0.55% L6 - Water/WW Laboratory (IPT) 0.00%
1.37% 0.83%Wastewater Operations Wastewater Operations
B1 - WW Administration 1.78% B1 - WW Administration 0.83%L9 - Water/WW Systems 3.66% L9 - Water/WW Systems 3.73%
5.44% 4.56%Engineering Services Engineering Services
C1 - Facility Services 23.12% C1 - Facility Services 23.54%E2 - Planning & Design 15.04% E2 - Planning & Design 15.10%E7 - Instrumentation 1.34% E7 - Instrumentation 1.37%
39.50% 40.01%Administration Administration
F1 - Customer Service 11.53% F1 - Customer Service 11.72%G1 - Information Services 5.61% G1 - Information Services 5.71%H1 - Financial Services 8.47% H1 - Financial Services 8.61%I1 - Employee Services 3.89% I1 - Employee Services 3.96%J1 - BOT & Senior Management 14.84% J1 - BOT & Senior Management 15.10%
44.34% 45.10%
100.00% 100.00%
Dollars Allocated: Dollars Allocated:
$ $
Water Operations $71,306 Water Operations $71,131Environmental Services 10,448 Environmental Services 6,215Wastewater Operations 41,487 Wastewater Operations 34,143Engineering Services 301,239 Engineering Services 299,574Administration 338,150 Administration 337,685
$762,630 $748,748

373 Financial Policies
Vehicle Rates Internal Transportation costs are charges the departments receive for the availability of District owned vehicles. Each type of vehicle and piece of equipment has an assigned hourly rate. Most vehicles are charged for 40 hours per week. Charges are either assigned directly to the task or to a “stand-by” account or later allocated. Transportation costs represent the expense of operating the garage and include labor, materials, occupancy and depreciation. Overall budget is 0.9% greater than 2019.
2020 Budget Details Vehicle Type Rate Active Hours Stand-by Hours Total Hours
Backhoe/Loader <19,501 GVW $33.96 2,308 2,308 Backhoe/Loader >=19,500 GVW $39.10 560 560 Car $3.22 686 686 Compressor $20.56 2,641 2,641 Dump Truck < 15,000 GVW $8.68 1,590 490 2,080 Dump Truck 15,001-40,000 GVW $11.14 1,692 2,468 4,160 Dump Truck >= 40,000 GVW $14.89 3,153 3,087 6,240 Generator/Load Bank $34.98 442 442 Misc. Const. Equipment - Forklif t, etc. $23.66 1,476 1,476 Misc. Trailed Equipment - Cement Mixer, Jet Machine, Pipe Cleaner, Welder, Pipe Thaw er, Flat-Bed Trailer, Trailer Mounted Pump, etc.$15.45 1,665 1,665 Pick-up Truck/SUV - Light - < 6,000 GVW $3.22 1,430 2,730 4,160 Pick-up Truck/SUV - Medium - 6,001-7,500 GVW $3.47 14,339 23,102 37,440 Pick-up Truck/SUV - Heavy - 7,501-10,000 GVW $4.21 6,920 9,720 16,640 Special Purpose - C - Crane, Sludge, etc. $46.30 100 100 Special Purpose - D - Jetvac, etc. $61.73 2,756 2,756 Utility Truck 10,001 - 14,000 GVW $3.47 9,852 6,788 16,640 Utility Truck 14,001 - 16,000 GVW $4.95 3,671 2,569 6,240 Utility Truck 16,001 - 19,500 GVW $5.45 6,836 3,564 10,400 Utility Truck 6,001 - 10,000 GVW $5.94 5,170 3,150 8,320 Van < 6,000 GVW $3.22 1,890 2,270 4,160 Van 6,001-7,500 GVW $3.46 1,132 948 2,080 Van 7,501-10,000 GVW $4.21 24,224 15,296 39,520 Total Hours 94,533 76,182 170,714
Sub-Group 2019 Budget 2020 Budget $ - Difference % - Difference
A1 - Water Administration $0 $0 $0 n/aA2 - Transmission/Distribution 581,553 598,008 $16,455 2.8%A3 - Water Treatment 32,971 32,427 ($544) -1.6%A5 - Water Resources 35,244 34,524 ($720) -2.0%A6 - Utility Services 153,956 161,219 $7,263 4.7%B1 - WW Administration 0 0 $0 n/aB3 - Wastew ater Treatment 56,326 55,141 ($1,185) -2.1%C1 - Facility Services 56,505 52,283 ($4,222) -7.5%E2 - Planning & Design 18,527 17,970 ($557) -3.0%E7 - Instrumentation 21,560 21,133 ($427) -2.0%F1 - Customer Service 14,717 14,417 ($300) -2.0%I1 - Employee Services 0 0 $0 n/aJ1 - BOT & Senior Management 0 0 $0 n/aL6 - Water/WW Laboratory 0 0 $0 n/aL9 - Water/WW Systems 178,096 172,942 ($5,154) -2.9%
$1,149,454 $1,160,064 $10,610 0.9%

374 Financial Policies
Joint Use Facilities – Operations and Maintenance Allocations The District has two areas where wastewater flows from more than one community are combined. Costs associated with these combinations are allocated by the percentage of the flow contributed by each community. The areas of combined flow are:
Portland Water District Facilities: Westbrook Regional – All of the wastewater from Gorham, Westbrook and Windham is treated at Westbrook Regional Wastewater Treatment Facility, with one pump station handling the combined waste from all three communities. The budget for 2020 is $1,167,968, up $128,447 or 12.4% due to higher costs for biosolids disposal and chemcials. Little Falls – The Little Falls areas of Gorham and Windham used to be a self-contained system with its own small treatment facility. Starting in 2008, wastewater from this area was conveyed to the Westbrook Regional Wastewater Treatment Facility. Currently, wastewater from Windham moves into Gorham where it is combined with that community’s flow until it joins with the Westbrook flow at the Westbrook town line. The budget is $77,391, up 11.5% ($7,965) mostly due higher labor/benefit costs.
Gorham Westbrook Windham Gorham Windham
2014 14.00% 83.70% 2.30% 15.00% 85.00%2015 13.00% 84.70% 2.30% 20.00% 80.00%2016 15.00% 82.00% 3.00% 22.50% 77.50%2017 16.50% 80.25% 3.25% 21.50% 78.50%2018 15.75% 81.00% 3.25% 27.50% 72.50%2019 13.00% 84.00% 3.00% 28.00% 72.00%2020 13.00% 84.00% 3.00% 24.50% 75.50%
-------- Westbrook Regional -------- ------ Little Falls ------
Contracted Services Facilities: South Portland – All of the wastewater from the Northern portion of Cape Elizabeth is treated at the South Portland Treatment Facility through a contractual agreement. Charges to the District are budgeted to be $171,700 in 2020 (an increase of 3.1%). Falmouth – All of the wastewater from Cumberland is treated at the Falmouth Treatment Facility through a contractual agreement. This cost is budgeted to be $513,246 in 2020 (2.5% increase). The decrease primarily due to future capital costs.
Cape Eliz So Portland Cumberland Falmouth Millcreek PS
2014 6.7% 93.3% 24.0% 76.0% 40.8%2015 6.7% 93.3% 24.0% 76.0% 40.8%2016 6.7% 93.3% 24.0% 76.0% 40.8%2017 6.7% 93.3% 24.0% 76.0% 40.8%2018 6.7% 93.3% 24.0% 76.0% 40.8%2019 6.7% 93.3% 24.0% 76.0% 40.8%2020 6.7% 93.3% 24.0% 76.0% 40.8%
----- South Portland ----- ------------------ Falmouth ------------------
Note: Starting in 2013 Millcreek Pump Station (PS) costs were be allocated to Cumberland at the
specific rate above whereas in prior years it was allocated based on the Cumberland flow ratio.

375 Financial Policies
Joint Use Facilities – Capital Cost Sharing Allocations The District has two areas where wastewater flows from more than one community are combined. Costs associated with these combinations are allocated by the percentage of the design flow contributed by each community. The areas of combined flow are:
Portland Water District Facilities: Westbrook Regional – All of the wastewater from Gorham, Westbrook and Windham is treated at Westbrook Regional Wastewater Treatment Facility. In addition, one pump station handles the combined waste from all three communities.
System Westbrook Gorham Windham Total Westbrook Gorham Windham
Southside Interceptor above Manhole 60
0.16 1.06 0.12 1.34 12.0% 79.1% 9.0%
Manhole 60 up to and including Siphon
5.00 1.06 0.12 6.18 81.0% 17.2% 1.9%
Cottage Place Pumping Station & Force Main
2.12 0.70 0.06 2.88 73.7% 24.3% 2.1%
Westbrook Regional WWTF & Outfall 3.02 1.40 0.12 4.54 66.6% 30.8% 2.6%
--- Millions of Gallons/Day (MGD) --- ----- Flow Percentage -----
Little Falls – The Little Falls areas of Gorham and Windham used to be a self-contained system with its own small treatment facility. Starting in 2008, wastewater from this area was conveyed to the Westbrook Regional Wastewater Treatment Facility. As it is presently constituted, wastewater from Windham moves into Gorham where it is combined with that community’s flow until it joins with the Westbrook flow at the Westbrook town line.
Facility Name Gorham Windam Total Gorham Windam
Gray Rd/Mallison St Gravity Sew er 63,500 53,500 117,000 54.3% 45.7%
Mallison St Pump Station (PS)/Flow Meter (FM)
84,000 100,000 184,000 45.6% 54.4%
Mosher Rd Gravity Sew er 145,000 100,000 245,000 59.2% 40.8%
Little River PS/FM 222,500 100,000 322,500 69.0% 31.0%
Mosher Rd & Cross Country Gravity Sew er
638,000 100,000 738,000 86.4% 13.6%
Industrial Park Gravity Sew er Upgrade 2,105,000 100,000 2,205,000 95.5% 4.5%
Woodlaw n Ave PS (Tow Path Rd) effective 2008
- - - 100.0% 0.0%
Fire Station (Route 202) PS - - - 0.0% 100.0%
Androscoggin St PS - - - 0.0% 100.0%
-------- Gallons/Day -------- -- Flow Percent --
376 Financial Policies
Contracted Services Facilities: South Portland – All of the wastewater from the Northern portion of Cape Elizabeth is treated at the South Portland Treatment Facility through a contractual agreement.
Facility Name Cape Eliz So Portland Total Cape Eliz So Portland
Treatment Plant 0.716 8.584 9.300 7.7% 92.3%
Note: In Cape Elizabeth 1/13th of average design flow = 7.7% per Sew er Service Agreement dated 08/11/93.
--- Millions Gallons/Day (MGD) --- ----- Flow Percentage -----
Falmouth – All of the wastewater from Cumberland is treated at the Falmouth Treatment Facility through a contractual agreement.
Facility Name Cumberland Falmouth Total Cumberland Falmouth
Route 88 Interceptor - Tow n Line to Millcreek PS
1.790 1.007 2.797 64.0% 36.0%
Millcreek PS & Force Main 1.076 1.998 3.074 35.0% 65.0%
Millcreek Interceptor 2.030 1.595 3.625 55.5% 44.5%
Treatment Facility (average design f low )
0.468 1.092 1.560 30.0% 70.0%
Cumberland Route 1 Sew er Extension to Johnson Rd PS
0.144 0.490 0.634 22.7% 77.3%
Existing Sew ers & Mains - Johnson Rd to Millcreek Interceptors
0.144 0.216 0.360 40.0% 60.0%
Johnson Road PS (gallons pumped per minute)
100 150 250 40.0% 60.0%
* = Peak flow unless noted otherwise
Millions of Gallons/Day (MGD)* ----- Flow Percentage -----

377 Appendix
Introduction
The appendix contains the following:
• 2021-2024 Financial Forecast
• Maine Measures of Growth 2019 Scorecard • Water Benchmark Data
• Portland Water District Rate Sheet Summary • Customer Satisfaction Survey • Board of Trustees’ Orders and Resolutions
• Glossary

378 Appendix
2021 to 2024 Financial Forecast A long-term financial forecast is developed incorporating estimated cost adjustments to operating expense line items and impact of projects in the capital improvement plan. A summary of the operating and capital budget plans are provided below. An income statement for each fund is provided in the Budget by Fund section. Consolidated Operating Budget:
Consolidated Capital Budget:

379 Appendix
2021 to 2024 Financial Forecast(continued) A summary of future revenue impact to water ratepayers and wastewater municipal assessments is provided below. Total water revenues are projected to increase between 4.9% and 6.0% each year. The impact to retail customers is listed in the second table. All 2020 wastewater assessments are at or below projections that were provided to the wastewater municipalities for ratemaking purposes last year except for Cumberland. The updated 2021-2024 are preliminary and will be reviewed with municipal officials in November 2019 before being finalized.
Water Revenues and Municipal Assessments:
Proposed 2020
Budget
Prior Year
2020
Projection
2021
Forecast
2022
Forecast 2023 Forecast 2024 Forecast
Water 25,686,370$ 26,169,676$ 27,232,956$ 28,536,589$ 30,114,889$ 31,773,739$ 4.9% 5.4% 6.0% 4.8% 5.5% 5.5%
Wastewater: Cape Elizabeth 1,705,380 1,705,860 1,854,425 1,973,768 2,022,348 2,092,893
8.4% 8.5% 8.7% 6.4% 2.5% 3.5%Cumberland 965,292 906,807 962,955 993,352 1,005,447 1,018,193
6.6% 0.2% -0.2% 3.2% 1.2% 1.3%Falmouth 314,112 312,050 312,050 310,089 308,147 306,225
0.00% -0.70% -0.7% -0.6% -1.3% -1.2%Gorham 1,160,676 1,160,707 1,255,249 1,476,697 1,486,814 1,494,896
2.4% 2.4% 8.1% 17.6% 0.7% 0.5%Portland 12,863,340 13,659,198 13,190,949 13,792,536 13,916,774 14,429,076
2.0% 8.3% 2.5% 4.6% 0.9% 3.7%Westbrook 2,820,768 2,880,704 2,951,910 3,440,278 3,468,697 3,499,603
11.1% 13.4% 4.6% 16.5% 0.8% 0.9%Windham 389,004 389,421 419,184 441,301 453,487 490,564
6.1% 6.2% 7.8% 5.3% 2.8% 8.2%

380 Appendix
2021 to 2024 Financial Forecast (continued) Total expenses are projected to increase to over $56 million by 2023, a 42% total increase since 2016 (or 5.25% a year). As the chart shows, increases in capital financing are driving the increases with water and wastewater capital finance cost increasing by 78% and 40%, respectively. Capital finance costs consists of two components – debt service payments and contribution to the renewal and replacement funds. The debt service component portion of the total budget increases from 19% of the total budget to 26%.
Major assumptions incorporated in the projections are as follows:
Salary increases of 3.0% each year. Assumed 1.25 increase in headcount 2021.
Benefit increases of 5% each year.
Biosolids contract expires in 2021; assumed 5% increase in unit prices.
Other expenses increase between 2.3% and 3.5% each year.
New debt service and renewal/replacement fund expenditures consistent with the 2020 5-year capital plan. The Capital Expenditures Section provides details of the projects.
Plan incorporates costs related to completion of the new billing and asset management computer system in 2021, additional resources to fully implement a large meter testing program and updating the Asset Management Master Plan in 2021.
The following pages provides additional information on the each major expense category.
$15.3 $15.5 $15.9 $16.7 $17.0 $17.8 $18.3 $18.9 $19.5
$7.1 $7.8 $8.1 $9.1 $9.6 $9.9 $10.7 $11.7 $12.7 $7.6 $7.9 $8.6 $8.7 $8.9
$9.5 $9.8
$10.1 $10.5
$9.8 $10.7
$10.9 $11.5 $12.3
$12.3 $13.5
$13.4 $13.7
$-
$10.0
$20.0
$30.0
$40.0
$50.0
$60.0
2016 Actual 2017 Actual 2018Budget
2019 Budget 2020Forecast
2021Forecast
2022Forecast
2023Forecast
2024Forecast
WT Operating WT Capital Finance WW Operating WW Capital Finance
27%
78%
38%
40%
Total Operating Expense - 2016
Increase between 2016 and 2024
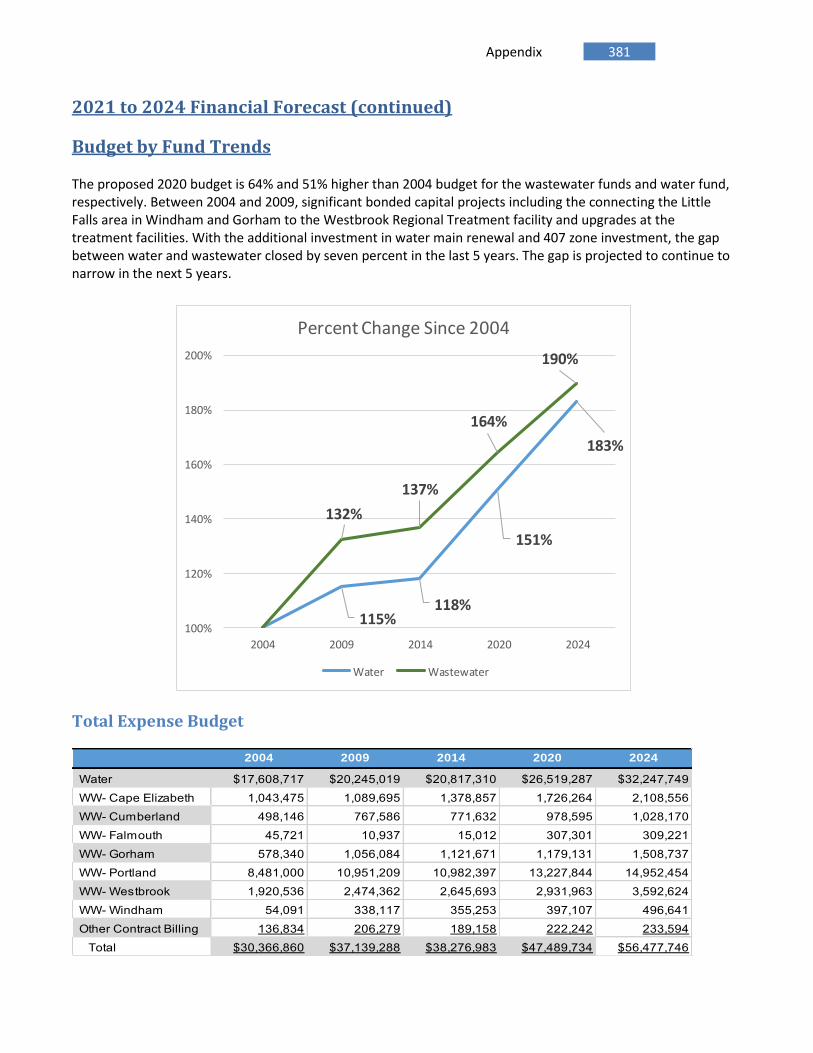
381 Appendix
2021 to 2024 Financial Forecast (continued)
Budget by Fund Trends The proposed 2020 budget is 64% and 51% higher than 2004 budget for the wastewater funds and water fund, respectively. Between 2004 and 2009, significant bonded capital projects including the connecting the Little Falls area in Windham and Gorham to the Westbrook Regional Treatment facility and upgrades at the treatment facilities. With the additional investment in water main renewal and 407 zone investment, the gap between water and wastewater closed by seven percent in the last 5 years. The gap is projected to continue to narrow in the next 5 years.
115%118%
151%
183%
132%
137%
164%
190%
100%
120%
140%
160%
180%
200%
2004 2009 2014 2020 2024
Percent Change Since 2004
Water Wastewater
Total Expense Budget
2004 2009 2014 2020 2024
Water $17,608,717 $20,245,019 $20,817,310 $26,519,287 $32,247,749WW- Cape Elizabeth 1,043,475 1,089,695 1,378,857 1,726,264 2,108,556WW- Cumberland 498,146 767,586 771,632 978,595 1,028,170WW- Falmouth 45,721 10,937 15,012 307,301 309,221WW- Gorham 578,340 1,056,084 1,121,671 1,179,131 1,508,737WW- Portland 8,481,000 10,951,209 10,982,397 13,227,844 14,952,454WW- Westbrook 1,920,536 2,474,362 2,645,693 2,931,963 3,592,624WW- Windham 54,091 338,117 355,253 397,107 496,641Other Contract Billing 136,834 206,279 189,158 222,242 233,594 Total $30,366,860 $37,139,288 $38,276,983 $47,489,734 $56,477,746

382 Appendix
2021 to 2024 Financial Forecast (continued) Revenue Waters and Wastewater Assessments are increased to cover the expenses all the expenses net of interest income and other miscellaneous income. Interest Income assumed interest rates would decline from 1.8% to 1.4% over the 2021-2024 time frame.
Expenses Expenses are based on the proposed 2020 budget with appropriate changes as described on the following pages for each category in the graph below. The District has over a half billion dollars of infrastructure to operate and maintain so it isn’t surprising the largest cost relates to Capital at 34% of the total budget. To operate and maintain the assets, staff’s wages and benefits make up 38% of the budget. All other costs are 28% of the budget.
Capital34%
Wages26%
Benefits12%
Biosolids4%
Electricity4%
Chemicals2%
Fuel2%
Services/Material16%
2020 Budget

383 Appendix
2021 to 2024 Financial Forecast (continued) Capital The operating budget includes the annual contribution to a renewal/replacement fund to pay for smaller capital projects, and debt service on existing and proposed larger capital projects. The contribution to the renewal/replacement fund remains the same except for $100,000 and $10,000 increases each year in the Water and Cape Elizabeth Wastewater Fund. Existing debt service declines due to the lower interest costs on declining outstanding principal balance. Over $81 million of new bonds are forecasted to be issued between 2020 and 2024. Eligible projects will be financed through the State Revolving Loan fund at a subsidized interest. After consultation with the District’s financial advisor, the assumed rate are 1.0% and 1.5% for the SRF bonds for the years 2020-21 and 2022-2024,respectively, and 2.5% and 3.0% for General bonds for the years 2020-21 and 2022-2024,respectively The Capital Improvement Plan assumes the following funding of future projects.
Capital Expenses are forecasted to increase between 3.7% and 9.4% in the upcoming years.

384 Appendix
2021 to 2024 Financial Forecast (continued)
Bond Limits The District has no legal limits of debt. A board-approved policy establishes a target maximum level of debt service to 35% of total fund budget and minimum debt service ratio of 1.25. The table indicates the status and projected status. The projected status is based on the projection included at the end of the Revenue section and includes bond financed capital projects as noted in the 5-year capital plan in the Capital Expenditures section.
Percent of Budget Dedicated to Debt Service – Target: Not to Exceed 35%
Funds 2018 2019 2020 2021 2022 2023 2024
Water 21% 22% 23% 23% 25% 26% 28%
Wastewater Cape Elizabeth 15% 15% 17% 21% 23% 22% 22% Cumberland 33% 34% 31% 32% 32% 31% 30% Gorham 31% 34% 32% 34% 42% 41% 40% Portland 21% 20% 19% 18% 21% 20% 21% Westbrook 17% 19% 21% 23% 32% 31% 30% Windham 35% 38% 35% 38% 39% 39% 43%
Debt Service Ratio – Target: Greater or Equal to 1.25
Funds 2018 2019 2020 2021 2022 2023 2024
Water 1.82 1.51 1.57 1.57 1.53 1.49 1.44
Wastewater Cape Elizabeth 1.65 1.49 1.52 1.41 1.36 1.39 1.39 Cumberland 1.03 1.19 1.28 1.17 1.16 1.17 1.17 Gorham 1.12 1.25 1.30 1.29 1.20 1.20 1.21 Portland 1.50 1.36 1.53 1.52 1.42 1.45 1.42 Westbrook 1.81 1.67 1.56 1.47 1.29 1.30 1.30 Windham 0.96 1.19 1.29 1.25 1.23 1.22 1.19 Long-Term Water Fund Target The long-term water fund target was established in 2013. Projected 2020-2024 is below the established target at 22-27% in those years.
0%
10%
20%
30%
40%
20
13
20
14
20
15
20
16
20
17
20
18
20
19
20
20
20
21
20
22
20
23
20
24
20
25
20
26
20
27
20
28
20
29
20
30
20
31
20
32
20
33
20
34
20
35
Debt Service as Percent of Revenue
Board Policy: No more than 35% of Revenue

385 Appendix
2021 to 2024 Financial Forecast (continued) Projected Water Debt The Water Fund has significant future bond financing needs including completing the 407 zone system upgrade and main renewals. In 2011, the Board adopted the policy to double the investment in main renewal by incrementally increasing the amount spent by $500,000 until reaching an annual level of $4 million in 2016. Starting in 2014, an additional annual investment of $2 million was bonded to pay for main renewal and funded through the capital reserve. Other major projects include the installation of a new meter reading system and transmission line projects.
The 2020 Budget requests $6.1 million of debt service, below the long-term plan
The updated multi-year projection indicates debt service payments will be $9.2 million in 2023,
$200,000 below 2013 target.
$-
$2,000,000
$4,000,000
$6,000,000
$8,000,000
$10,000,000
$12,000,000
2013 2015 2017 2019 2021 2023 2025 2027 2029 2031 2033 2035
Capital Reserve
Current Main
Other Project
407 Zone
Existing Debt
Projected Debt Service

386 Appendix
2021 to 2024 Financial Forecast (continued)
Outstanding Debt by Fund Trends The proposed 2020 budget results in outstanding debt increasing by 256% and 186% higher than 2004 for the water and wastewater funds, respectively. Between 2004 and 2009, significant bonded capital projects including the connecting the Little Falls area in Windham and Gorham to the Westbrook Regional Treatment facility and upgrades at the treatment facilities. Investments in water main renewal, water 407 zone and water and wastewater treatment plants & pump stations are driving the more recent increase.
Outstanding Debt By Fund
2004 2009 2014 2020
Water $22,940,000 $30,950,023 $39,645,214 $58,814,558WW- Cape Elizabeth 839,000 159,250 2,276,000 4,251,950WW- Cumberland 147,600 130,850 75,000 37,500WW- Falmouth 0 0 0 3,846,000WW- Gorham 590,081 5,552,894 4,042,816 3,007,525WW- Portland 19,914,857 19,263,106 15,517,561 24,623,670WW- Westbrook 1,792,859 5,325,885 3,645,084 6,326,869WW- Windham 37,736 1,925,071 1,414,740 1,221,843
Total $ 46,262,133 $ 63,307,079 $ 66,616,415 $ 102,129,915
135%
173%
256%
139% 116%
186%
100%
120%
140%
160%
180%
200%
220%
240%
260%
280%
2004 2009 2014 2020
Percent Change Since 2004
Water Wastewater

387 Appendix
2021 to 2024 Financial Forecast (continued)
Salaries and Wages The second largest expense category is Salaries and Wages. One of our Corporate Goals is optimize the number of employees for the workload. For 2020, a decision was made to increase staffing levels by 4 full-time employees – 2 water operations, 1 information services and 1 employee services employees. The increases emphasize the need to allocate more resources maintaining our water infrastructure, computer system, and employees. Looking ahead, the forecast assume 1 additional employee for Engineering Services – emphasizing the continued efforts on asset management. Given the historic low unemployment attracting and retaining employees has been challenge. Competitive wages are an important in those efforts. The chart bellows indicate we have given wage at a rising and competitive rate compared to others in Maine. Looking ahead, the recently approved union contract calls for increases of 3% through most of 2021. As the second chart indicates wages increases are expected to be around 3% in the years after 2021. A 1% variance is approximately $380,000.
0.0%
1.0%
2.0%
3.0%
4.0%
2010 2011 2012 2013 2014 2015 2016 2017 2018 2019 2020 2021 2022 2023 2024
PWD vs Maine Average WageCumulative Compound Change
Maine Average PWD

388 Appendix
2021 to 2024 Financial Forecast (continued) Benefits The third largest line is Employee Benefits. Benefits consist of 3 major components – Health Insurance , Pension and All Other Benefits. Health Insurance. For 2020, a small decline in premium was negotiated. In 2019, employee share of the costs was increased to 9% from 8%. For the upcoming years, no change in the co-payment has been forcasted. The District’s Benefit consultant has estimated premiums should increase by 7% in the future years. To assist in reducing the costs, Employee Services has developed a employee wellness program and an increase in the amount paid to employees who opt out of the District’s plan has been increased.
Pension. The District has a closed defined benefit plan and continues to Board adopted policy of funding 100% of the amount calculated by the actuary. The 457 Plan cost is expected to increase by $30,000 to match the new hire contribution as they replace the retiring employees that participate in the defined benefit plan.
All other benefits are assumed to increase by 2% resulting in an average 2021-2024 increase in Benefits of 5%.
-10.0%
0.0%
10.0%
20.0%
30.0%
Health Insurance Increase
Increase
Borislow- Benefit Consultant Estimate - 7%
$-
$500,000
$1,000,000
$1,500,000
$2,000,000
$2,500,000
2020 Budget 2021 2022 2023 2024
Pension5% Average Increase
Defined Benefit 457 Plan Other

389 Appendix
2021 to 2024 Financial Forecast (continued) Purchased Power Electricity Costs consist of two major categories - Energy and Transmission & Distribution costs.
Energy costs are currently purchased from Constellation Energy. Contracts have been signed through the end of 2022 with an overall decrease of 7% from the 2020 costs. No increase is anticipated in 2023 and 2024. T&D costs are charged by Central Maine Power. CMP cost increases are unknown however they have indicated they will strive to keep it increases in the 3% range. For every 1% difference, costs would be approximately $9,000 higher per year. The combined anticipated change is 0.0%, -0.6% ,1.9% & 1.9% for the years 2021 through 2024. The forecast assumes the same level on consumption assumed in the 2020 Budget. Actual consumption varies based on weather conditions, which impact the amount of drinking water produced and wastewater processes. Since 2007, the variance between the highest and lowest amount of electricity is 11%, which would impact the budget by approximately $200,000.
$0
$500,000
$1,000,000
$1,500,000
$2,000,000
$2,500,000
2020 2021 2022 2023 2024
T&D
Energy
-
5,000,000
10,000,000
15,000,000
20,000,000
2007 2008 2009 2010 2011 2012 2013 2014 2015 2016 2017 2018 2019 2020
Electricity Usage
Large All Other

390 Appendix
2021 to 2024 Financial Forecast (continued) Biosolids Biosolids cost is based on the number of wet tons disposed. The amount disposed in dependent on the amount of water that can be removed from the material generated at the end of the wastewater treatment process as represented by the percent of solid - the lower the percent the more wet tons to be disposed. The 2021-2024 forecast assumes the same amount of wet tons produced as included in the 2020 budget. Unit price increases each year by 80% of the CPI up to 5%, per the contract with the vendor. The 2021-2024 forecast assumes unit prices increase by 1.8% - 80% of the estimated CPI increase. The contract will be extended in 2021 if both parties agree to mutually extend for an additional 5-years. Recent general industry concerns with relations to PFAS in biosolids and it impact on how biosolids is disposed has created some doubt at whether the current service provider will want to extend on the current terms. The impact could be significant. Every 10% increase unit price impacts the District by approximately $180,000.
0.0%
5.0%
10.0%
15.0%
20.0%
25.0%
0.00
5,000.00
10,000.00
15,000.00
20,000.00
25,000.00
30,000.00
2010 2011 2012 2013 2014 2015 2016 2017 2018 2019 2020
Wet Tons and Percent Solid
Wet Tons % Solids

391 Appendix
2021 to 2024 Financial Forecast (continued) Chemicals Chemicals are the sixth largest cost line item. As the charts indicate, the unit prices for the chemicals have been volatile over the past years due to change expectation on transportations costs and demand for the chemicals. The forecast assumes a 3% increase each year to reflect anticipated higher transportation costs (see Heat/ Fuel Oil page).
-40.0%
-30.0%
-20.0%
-10.0%
0.0%
10.0%
20.0%
30.0%
40.0%
2015 2016 2017 2018 2019 2020
Water Chemicals Price Change Variance from Average
Caustic Soda Liquid Oxygen Sodium Hypochlorite Zinc Orthophosphate
-40.0%
-30.0%
-20.0%
-10.0%
0.0%
10.0%
20.0%
30.0%
40.0%
2015 2016 2017 2018 2019 2020
Wastewater Chemicals Price Change Variance from Average
Sodium Hypochlorite Polymer-EEWTF Sodium Bisulfite-EEWTR
Polymer-WWTF Sodium Bisulfite-WWTF

392 Appendix
2021 to 2024 Financial Forecast (continued) Heat/Fuel Oil Heating fuel, Gasoline and Diesal volume have average close to 125,000 gallons. We currently have the price locked in for 2020 at around $2 per gallon. Prices beyond 2020 are uncertain - include a 6 cents or 3.5% increase in the future years, as recommended by Maine Power Options. The District has taken a number of steps to reduce the volume heat and fuel.
$-
$1.00
$2.00
$3.00
$4.00
$5.00
$6.00
0
20,000
40,000
60,000
80,000
100,000
120,000
140,000
160,000
2010 2011 2012 2013 2014 2015 2016 2017 2018 2019 2020
Heating, Diesal and Gasoline Volume and Price
Heating Oil -Units Unleaded Gas-Units Diesal-Units
Heating Oil-Price Unleaded Gas-Price Diesal-Price

393 Appendix
2021 to 2024 Financial Forecast (continued) Other Expenses including Contracted Services and Materials Combined all other expenses total $7.7 million and consists of many and variety of services and materials. The forecast assumes an increase over 2020 levels of 2.3 as estimated by International Monetary Fund and Congressional Business Office.

394 Appendix
Maine Measures of Growth 2019 Scorecard
Source: Maine Economic Growth Council, see details: https://www.mdf.org/wp-content/uploads/2019/04/MOG-ExecutiveSummary2019-FNL.pdf
Why is this of significance to Portland Water District? Ability to hire new skilled employees will be a challenge in the future. Cost of doing business in Maine is high, which might inhibit the ability to continue to increase water rates.

395 Appendix
Maine Measures of Growth 2019 Scorecard
Why is this of significance to Portland Water District? Electricity is 4% of budget, the declining costs will be helpful. Housing affordability is high. Rising water/sewer rates will cause further increase in affordability. Water quality is recognized as important to measure and maintain. Support for our efforts from ratepayers is strong.

396 Appendix
Water Benchmark Data
Maine Water Utilities Survey Results The District participates in a survey of Maine water utilities. Two selected items surveyed are average customer revenue per thousand and debt per capita.
District’s average revenue collected per customer is lower than other utilities indicating the relative efficiency of the District’s operation.
District has relatively lower debt service costs per capita, indicating the relative higher ratepayer capacity to pay for additional debt financing.

397 Appendix
Water Benchmark Data (continued)
Water Rates The District‘s The rates are well below the Environmental Protection Agency’s affordability standard – water rates should not
exceed 2% of median income. The District’s service territory is a subset of Cumberland County and is the
primary reason Cumberland County’s rates are the lower than other Maine counties.
The District’s water rates for a typical household are relatively lower than other Maine, Massachusetts and National utilities.

398 Appendix
Portland Water District Rate Sheet Summary A summary of Portland Water District’s Water Rates and Municipalities’ Sewer Rates as of October 1, 2019 is presented below. Water and Sewer is billed based on actual water consumption for all communities except Falmouth Wastewater customers. The chart shows the typical usage by the number of occupants in the household.

399 Appendix
Customer Satisfaction Survey A periodic customer satisfaction survey is conducted. The last survey was conducted in 2017. A summary of the results is below and indicate that overall satisfaction remains high relative to other local utilities.
Year Overall Water Service/Quality Sewer 2017 75% 89% 85% 2014 82% 88% 70% 2011 87% 92% 71% 2008 85% 90% 76% 2005 88% 89% 78% 2002 89% 90% 83% 2000 89% 91% 79% 1998 NA 85% 74%

400 Appendix
Proposed Board of Trustees’ Orders and Resolutions
BOARD OF TRUSTEES / AGENDA ITEM SUMMARY
Agenda Items:
Date of Meeting: November 25, 2019
Subject: Proposed Budget Orders
Presented By: Carrie Lewis
The Administration and Finance, Operations and Planning Committees reviewed the 2020 Budget and CIP for which they have jurisdiction. Below are the recommended motions to be considered at the regular meeting. The proposed motion accepts the 2020 budget and authorizes billing the municipalities for wastewater and billing services. Order 19-035
ORDERED that the 2020 Budget and Wastewater Assessments as presented by the General Manager are accepted and adopted and shall be filed with the minutes of this meeting; and pursuant to Section 12 of the District’s Charter, to assess for 2020 the participating municipalities for wastewater related costs as follows:
Town of Cape Elizabeth Town of Cumberland Town of Falmouth Town of Gorham City of Portland City of Westbrook Town of Windham
$ 1,705,380 965,292 314,112
1,160,676 12,863,340
2,820,768 389,004
and to assess non-participating municipal corporations for billing-related costs as follows:
City of South Portland Scarborough Sanitary District
$ 201,132 11,328

401 Appendix
The motion accepts the proposed capital improvement plan and authorizes staff to implement the 2020 projects within the restrictions stated below and in compliance with the purchasing policy guidelines. Order 19-036
ORDERED that the 2020-2024 Capital Improvement Plan is hereby adopted and the General Manager is authorized to solicit bids or proposals for the year 2019 projects and to authorize the General Manager to award contracts for approved projects to the lowest bidder if the bid is within the project budget.; BE IT FURTHER ORDERED that the General Manager shall solicit bids or proposals and to partner with Municipalities, MDOT and Developers for the year 2020 for the replacement and extension of water mains, services, valves and hydrants as outlined in the Water Distribution Systems Upgrades Program and to authorize the General Manager to award and enter into contracts if the bid or partnering proposals are within the overall program budget.
Before approving water rate adjustment, staff will provide additional information for the Board’s consideration. Additionally, if the Board decides a rate adjustment is necessary, public notice will be provided to all customers and a public hearing will be held. Order 19-037
ORDERED that the Board of Trustees directs the General Manager and Treasurer to undertake the preliminary steps necessary to prepare a rate adjustment of approximately 3.5% for further Board consideration.

402 Appendix
In compliance with Internal Revenue Service (IRS) regulation, an ‘intent to borrow’ motion must be approved by the Board before expenditures are incurred on a project that may be financed with tax-exempt financing. Resolutions 19-016 to 19-019 are intent to borrow motions for each fund. Before a bond is actually authorized or issued, a public hearing will be held. Subsequent to the hearing, the Board will consider authorizing the bond. Resolution 19 - 016
RESOLVED the Board hereby declares its intent to issue debt to reimburse costs incurred by the District for water fund projects identified in the 2020 CIP. The full form of the resolution is attached hereto and incorporated herein by reference, and shall be part of the minutes of this meeting.
Resolution 19 - 017 RESOLVED the Board hereby declares its intent to issue debt to reimburse costs incurred by the District for the Cape Elizabeth wastewater fund projects identified in the 2020 CIP. The full form of the Resolution is attached hereto and incorporated herein by reference, and shall be part of the minutes of this meeting.
Resolution 19 – 018
RESOLVED the Board hereby declares its intent to issue debt to reimburse costs incurred by the District for the Portland wastewater fund projects identified in the 2020 CIP. The full form of the Resolution is attached hereto and incorporated herein by reference, and shall be a part of the minutes of this meeting.
Resolution 19 – 019 RESOLVED the Board hereby declares its intent to issue debt to reimburse costs incurred by the District for the Westbrook, Gorham and Windham wastewater fund projects identified in the 2020 CIP. The full form of the Resolution is attached hereto and incorporated herein by reference, and shall be a part of the minutes of this meeting.

403 Appendix
Resolution 19-016 DECLARATION OF OFFICIAL INTENT PURSUANT TO
TREASURY REGULATION §1.150-2 (Water Fund)
WHEREAS, the Portland Water District (the “Issuer”) intends to proceed with the projects described in section 2 below (the “Projects”); and WHEREAS, the Issuer intends to finance some or all of the costs of the Projects through the issuance of bonds or notes in anticipation thereof; and WHEREAS, the Issuer may incur certain of the costs of the Projects prior to the issuance of such notes or bonds and the Issuer expects to be reimbursed from the proceeds thereof; and WHEREAS, Treasury Regulation §1.150-2 requires that the Issuer declare its official intent to reimburse itself for such expenditures with the proceeds of such notes or bonds. NOW, THEREFORE, the Issuer does hereby declare its official intent as follows: 1. Declaration of Intent. The Issuer reasonably expects to reimburse itself for expenditures made on the
Projects with the proceeds of bonds or notes in anticipation thereof to be issued by the Issuer to finance the costs of the Projects in the maximum principal amount of $15,415,000.
2. General Description of Property to which Reimbursement Relates. The following is a reasonably accurate
general functional description of the type and use of the property with respect to which reimbursements will be made:
Construction or installation of new water mains, valves, hydrants, services and meters;
Acquisition of vehicles, leak detection and related equipment;
Renovation of various water facilities;
Acquisition and installation of various computer-related equipment; and
Building improvements at the Douglass Street facilities;
3. Public Availability of Official Intent. This Declaration of Official Intent shall be maintained as a public record of the Issuer.
4. Treasury Regulations. This is a declaration of official intent pursuant to the requirements of Treasury Regulations § 1.150-2.
5. Authority for Declaration. This declaration is adopted pursuant to the following action of the Issuer: Resolution adopted by the Portland Water District Board of Trustees.
404 Appendix
Resolution 19-017 DECLARATION OF OFFICIAL INTENT PURSUANT TO
TREASURY REGULATION §1.150-2 (Cape Elizabeth Sewer Fund)
WHEREAS, the Portland Water District (the “Issuer”) intends to proceed with the projects described in section 2 below (the “Projects”); and WHEREAS, the Issuer intends to finance some or all of the costs of the Projects through the issuance of bonds or notes in anticipation thereof; and WHEREAS, the Issuer may incur certain of the costs of the Projects prior to the issuance of such notes or bonds and the Issuer expects to be reimbursed from the proceeds thereof; and WHEREAS, Treasury Regulation §1.150-2 requires that the Issuer declare its official intent to reimburse itself for such expenditures with the proceeds of such notes or bonds. NOW, THEREFORE, the Issuer does hereby declare its official intent as follows: 1. Declaration of Intent. The Issuer reasonably expects to reimburse itself for expenditures made on the
Projects with the proceeds of bonds or notes in anticipation thereof to be issued by the Issuer to finance the costs of the Projects in the maximum principal amount of $530,000.
2. General Description of Property to which Reimbursement Relates. The following is a reasonably accurate
general functional description of the type and use of the property located in the Town of Cape Elizabeth with respect to which reimbursements will be made:
Replacement of obsolete assets or installation of new equipment at various pump stations, including Maiden Cove pump station, and
Replacement or installation of equipment at the treatment plant. 3. Public Availability of Official Intent. This Declaration of Official Intent shall be maintained as a public record
of the Issuer. 4. Treasury Regulations. This is a declaration of official intent pursuant to the requirements of Treasury
Regulations § 1.150-2. 5. Authority for Declaration. This declaration is adopted pursuant to the following action of the Issuer:
Resolution adopted by the Portland Water District Board of Trustees.

405 Appendix
Resolution 19-018
DECLARATION OF OFFICIAL INTENT PURSUANT TO TREASURY REGULATION §1.150-2
(Portland Sewer Fund)
WHEREAS, the Portland Water District (the “Issuer”) intends to proceed with the projects described in section 2 below (the “Projects”); and WHEREAS, the Issuer intends to finance some or all of the costs of the Projects through the issuance of bonds or notes in anticipation thereof; and WHEREAS, the Issuer may incur certain of the costs of the Projects prior to the issuance of such notes or bonds and the Issuer expects to be reimbursed from the proceeds thereof; and WHEREAS, Treasury Regulation §1.150-2 requires that the Issuer declare its official intent to reimburse itself for such expenditures with the proceeds of such notes or bonds. NOW, THEREFORE, the Issuer does hereby declare its official intent as follows: 1. Declaration of Intent. The Issuer reasonably expects to reimburse itself for expenditures made on the
Projects with the proceeds of bonds or notes in anticipation thereof to be issued by the Issuer to finance the costs of the Projects in the maximum principal amount of $4,545,000.
2. General Description of Property to which Reimbursement Relates. The following is a reasonably accurate general functional description of the type and use of the property located in the City of Portland with respect to which reimbursements will be made:
Renovation and repair of equipment and facilities at the East End Treatment Plant, including projects related to the Main 12.4 kV Power Distribution Upgrades;
Renovation and repair of equipment and facilities at the Peaks Island Treatment Plant; and
Replacement of equipment at various pump stations, including Baxter Boulevard Pump Stations.
3. Public Availability of Official Intent. This Declaration of Official Intent shall be maintained as a public record of the Issuer.
4. Treasury Regulations. This is a declaration of official intent pursuant to the requirements of Treasury
Regulations § 1.150-2. 5. Authority for Declaration. This declaration is adopted pursuant to the following action of the Issuer:
Resolution adopted by the Portland Water District Board of Trustees.

406 Appendix
Resolution 19-019 DECLARATION OF OFFICIAL INTENT PURSUANT TO
TREASURY REGULATION §1.150-2 (Westbrook,Gorham and Windham Sewer Funds)
WHEREAS, the Portland Water District (the “Issuer”) intends to proceed with the projects described below (the “Projects”); and WHEREAS, the Issuer intends to finance some or all of the costs of the Projects through the issuance of bonds or notes in anticipation thereof; and WHEREAS, the Issuer may incur certain of the costs of the Projects prior to the issuance of such notes or bonds and the Issuer expects to be reimbursed from the proceeds thereof; and WHEREAS, Treasury Regulation §1.150-2 requires that the Issuer declare its official intent to reimburse itself for such expenditures with the proceeds of such notes or bonds. NOW, THEREFORE, the Issuer does hereby declare its official intent as follows: 1. Declaration of Intent. The Issuer reasonably expects to reimburse itself for expenditures made on the Projects with the proceeds of bonds or notes in anticipation thereof to be issued by the Issuer to finance the costs of the Projects in the maximum principal amount of $ 11,685,000. 2. General Description of Property to which Reimbursement Relates. The following is a reasonably accurate general functional description of the type and use of the property located in the City of Westbrook with respect to which reimbursements will be made:
Replacement of obsolete assets or installation of new equipment at various pump stations, and
Renovation and repair of equipment and facilities at the Westbrook Regional Treatment Plant, including aeration and secondary clarifier project, and
Replacement of the Little River Bridge Force Main and related infrastructure.
3. Public Availability of Official Intent. This Declaration of Official Intent shall be maintained as a public record of the Issuer.
4. Treasury Regulations. This is a declaration of official intent pursuant to the requirements of Treasury Regulations § 1.150-2. 5. Authority for Declaration. This declaration is adopted pursuant to the following action of the Issuer: Resolution adopted by the Portland Water District Board of Trustees.

407 Appendix
Glossary/Acronyms
Term Description 407 Zone A water pressure zone, supported by pump
stations and water tanks, that is at an elevation above the District's water source (Sebago Lake).
ABC Project
ABC stands for “Asset, Billing & Customer Relations”. It involves the replacement of the District’s current asset management and customer billing/information systems.
Accurate bill index
The ratio of correct read adjustments on accounts to the total of all accounts.
Accrual Basis The method of accounting under which revenues
are recorded when they are earned (whether or not cash is received at that time) and expenditures are recorded when goods and services are received (whether or not cash disbursements are made at the time)
AMaP Asset Management and Planning group, consisting
of Engineering and Environmental Services Amortization The write-off of costs that has a financial benefit
exceeding 1 year but is not a capital expenditure. The write-off period is determined based on an estimate of asset's useful life.
AMR Automated Meter Reading ARRA American Recovery and Reinvestment Act of 2009.
The federal stimulus law that provided federal subsidies for various projects in order to boost employment during a recessionary period.
Asset Information Management System Computerized asset identification system used to
document all asset maintenance schedules / procedures from day of acquisition to disposal.
AWWA
American Water Works Association

408 Appendix
Glossary/Acronyms BOD
Biochemical Oxygen Demand - a measure of organic material in the influent / effluent of the wastewater system expressed in lbs./ day
Bond A written promise to pay (debt) a specified sum of
money (called principal) at a specified future date (called the maturity date(s)) along with periodic interest payments at a specific percentage of principal (interest rate).
Booster Station
Water pump station
Capital Expenditure Expenditures for a physical asset that exceeds
$5,000 and has a useful life of greater than 5 years or extends the useful life of an existing asset for more than 5 years.
CCTV CEWWTF
Closed Circuit Television Cape Elizabeth Wastewater Treatment Facility
CMP Combined Sewer Overflow (CSO)
Acronym for Central Maine Power, electricity provider CSO’s are a part of a combined sewer system that contains both sanitary waste and storm water. Under high flow events, generally due to wet weather that exceed the sewer system’s capacity, CSO’s will discharge excess flows into nearby bodies of water.
CPE
Comprehensive Plant Evaluation
Cross Connection Fees Fees collected for work relating to the inspection of
water backflow devices. Cryptosporidium A one cell parasite that originates from the feces of
infected animals and humans that can cause gastrointestinal illness.
Customer Activation Fees Fees charged customer if a new billing account
needs to be created; typically when a customer moves into a new home.

409 Appendix
Glossary/Acronyms Customer Connection Fees
Applications fees charged to customers requesting to install a new water main, service line or meter.
Customer Penalties Disconnection fees charged to customers for non-
payment of services. CWSSP Comprehensive Water System Strategic Plan Deferred Costs
Costs that have been incurred for a purpose that has a beneficial period in excess of one year but does not culminate into a capital expenditure. These costs are normally written-off to operating expense over the estimated useful life of the item.
DEP Department of Environmental Protection, State of
Maine Depreciation The write-off of an asset based on the decrease in
value of property over its estimated useful life. DHHS Department of Health and Human Services EEWWTF East End Wastewater Treatment Facility Enterprise Fund A proprietary fund used by governments to
account for business-type activities. Such a fund is appropriately used for operations that are financed and operated in a manner similar to private business enterprise where the intent is that the costs be financed or recovered primarily through user charges.
EPA Environmental Protection Agency, Federal Agency ERP Emergency Response Plan FEMA Federal Emergency Management Agency - a federal
agency that provides financial assistance after declared national disasters.
Fire Service Outage Index Standard to monitor hydrants returned to service
within 3 business days.

410 Appendix
Glossary/Acronyms Force Main (Sewer)
Sewer force mains are necessary when gravity flow is not sufficient to move water runoff and sewage through a gravity line. Force mains move wastewater under pressure by using pumps or compressors located in lift stations.
Fouling Settlement, and sometimes the growth, of
undesired materials on solid surfaces in a way that reduces the efficiency of the affected part.
Fund An independent fiscal and accounting entity with a
self-balancing set of accounts recording cash and /or other resources together with all related liabilities, obligations, reserves, and equities which are segregated for the purpose of carrying on specific activities or attaining certain objectives.
Generally Accepted Accounting Principal (GAAP) Uniform minimum standards of, and guidelines for,
external financial and reporting. They govern the form and content of basic financial statements of an entity. GAAP encompasses the conventions, rules and procedures necessary to define accepted accounting practice at a particular time. The primary authoritative statements on the application of GAAP to local governments are Government Accounting Standards Board pronouncements (GASB).
HCF Hundred Cubic Feet- the standard measure used
for billing water usage, 1 HCF is equal to 748 gallons of water, 1 cubic foot of water is equal to 7.48 gallons.
Hydrogeological Adjective of hydrogeology that means the branch
of geology dealing with the waters below the earth’s surface and with the geological aspects of surface waters.
Industrial Pretreatment Program A program responsible for permitting and monitoring industrial sewer customers who discharge significant quantities of non-domestic wastewater to the collection system to ensure their activities do not impact our operation or the receiving waters.

411 Appendix
Glossary/Acronyms I/I
Abbreviation for Infiltration and Inflow. Inflow and infiltration are terms used to describe the ways that groundwater and storm water enter the sanitary sewer system. Inflow is water that is dumped into the sewer system through improper connections, such as downspouts and groundwater sump pumps. Infiltration is groundwater that enters the sewer system through leaks in the pipe.
Interest from Customers Late fees charged to past due balances. An account
is considered delinquent 25 days after the bill is mailed to customer.
Jobbing Revenue Revenue for work performed by District employees
which is billable to outside parties. LOX Liquid Oxygen, LOX is used by the District in the
production of ozone which is used in the water treatment process
LTD Long Term Debt MDOT Cash Reserve Funds received from Maine Department of
Transportation from sales of land to be reserved for future land purchases.
MEANS Main Extension and New Services program MGD Acronym for million gallons per day (Mgal/d).
Measures rate of flow of liquid. MMBB Maine Municipal Bond Bank Ozone PFAS
A gas formed by electrical discharge in air used as an oxidizing, deodorizing and bleaching agent in the purification of water. Per- and polyfluoroalkyl substances (PFAS) are a group of man-made chemicals potentially impacting the District’s wastewater biosolids.
PI Plant Information - a database used to
automatically compile performance information on a specific asset.

412 Appendix
Glossary/Acronyms PIWWTF
Peaks Island Wastewater Treatment Facility
PLC
Programmable logic controller is an industrial computer control system that continuously monitors the state of input devices and makes decisions based upon a custom program to control the state of output devices
Proprietary Funds
Accounting funds established to separate assets and operational costs based on the type of system (i.e. Water or Wastewater) or Wastewater municipality.
PS Pump Station PUC Public Utilities Commission, a State of Maine
agency charged with regulating utilities. Quasi-municipality Independent government entity as defined by state
law. It has many of the responsibilities and rights of a typical governmental entity.
R&R Multi-fund Assets Assets utilized by all funds and paid for by
allocations to the funds (i.e. computers, meters, administrative office space).
Renewal and Replacement Funds A cash reserve created to fund smaller capital
projects. Sanitary Sewer Overflows (SSO) Sewer systems that contain only sanitary flows that
may discharge directly into water bodies without being treated.
SCADA
Supervisory Control and Data Acquisition
SLWTF Sebago Lake Water Treatment Facility SOP Standard operating procedure Spatial Scheduling Use of the district's geographic information system
to schedule customer appointments on a daily basis to best utilize manpower and vehicle usage.
SRF State Revolving Fund- Maine Municipal Bond Bank
program for long-term financing

413 Appendix
Glossary/Acronyms
STD Short Term Debt SU Standard units of measuring pH with a range of 1 -
14. Sub-meters Meters installed to measure water that will not be
returned to the sewer system for disposal. This water may be used for irrigation purposes or other outside use and therefore should not be included in the calculation of wastewater disposal charges.
SWTR standards Surface Water Treatment Rules TCR samples Total Coliform Rule 10th Percentile Chlorine Residual Minimum residual found in water samples
approximately 90% of the time. TIF Tax Increment Finance - a designated municipal
fund established to fund structural improvements TPS Thickened Primary Sludge Tropic State Index Calculated measure of lake productivity with clear,
clean water as the desired result. Range of less than 30 to greater than 100 with the lower the number, the better the results.
TSS Total Suspended Solids - a measure of suspended
material in the influent / effluent of the wastewater system expressed in lbs. / day
Unaccounted for Water Water not measured by metered flow such as fire
service use, main leaks, etc. UV UV stands for Ultra Violet. UV water or wastewater
treatment systems use special lamps that emit UV light of a particular wavelength that have the ability, based on their length, to disrupt the DNA of micro-organisms.

414 Appendix
Glossary/Acronyms Water Outage Index
Index of the ratio of customer outage hours/million hours available. Customer outage hours are computed by taking the # of customers without water service times the number of hours the outage lasts. The hours available is derived by taking the number of customers times number of days times 24 hours per day.
Watershed A stretch of high land dividing the areas drained by
different rivers or river systems into Sebago Lake. Watershed Reserve
PUC allowed reserve of Water revenue to be used for future land purchases to protect PWD's watershed.
Weighted average unit price Total cost of a product divided by the total product
units WGWRWWTF WIMS
Westbrook/Gorham/Windham Regional Treatment Facility Water information management solution (software)
WWPS Wastewater Pump Station WTF WWTF
(Drinking) Water Treatment Facility Wastewater Treatment Facility


