Embed Size (px)
Citation preview
2021
Full-year
Results
-25 February 2022
» In France, the Group's key geographies, such as Paris and south-east France, wereparticularly hit by the 2020-2021 health crisis (decline in customer traffic and touristnumbers, restricted access to stores)
» In this environment, the Group has undergone a deep transformation and is nowrefocused on the most buoyant and structurally profitable formats (premium,convenience, e-commerce)
› The cost savings plans implemented during the period reduced the cost base andsustainably increased banner profitability. The restructuring generated non-recurring expenses, which temporarily weighed on cash flow generation
› Implementation of the disposal plan initiated in France in 2018, of which €3.2bnhas been completed to date, slowed during the health crisis
» Cdiscount's business model has been completely transformed over the last two years,shifting from a model based on direct sales to one based on the marketplace, digitalmarketing and a decrease in direct sales, pending the major start-up of its B2B activities(Octopia) in 2022. In this environment, all Cdiscount indicators improved over two yearsafter an exceptional year in 2020
» In Latin America, the Group's geographies were heavily affected by the pandemic. TheGroup's banners had to adapt to the new situation. Thanks to major transactions (Assaíspin-off, sale of GPA Extra Hypermarkets to Assaí), the Group now has well-adaptedassets ready to accelerate growth in their respective markets
» Amid the ongoing normalisation of the health situation, the completion of thetransformation plans and the continued expansion of convenience formats ande-commerce enable to aim for a return to growth in 2022 in France on profitable andcash-flow generating formats
» In view of the current outlook and the options available, the Group is confident tocomplete its €4.5bn disposal plan in France by the end of 2023 at the latest
2Full-year Results – Friday, 25 February 2022
Introduction
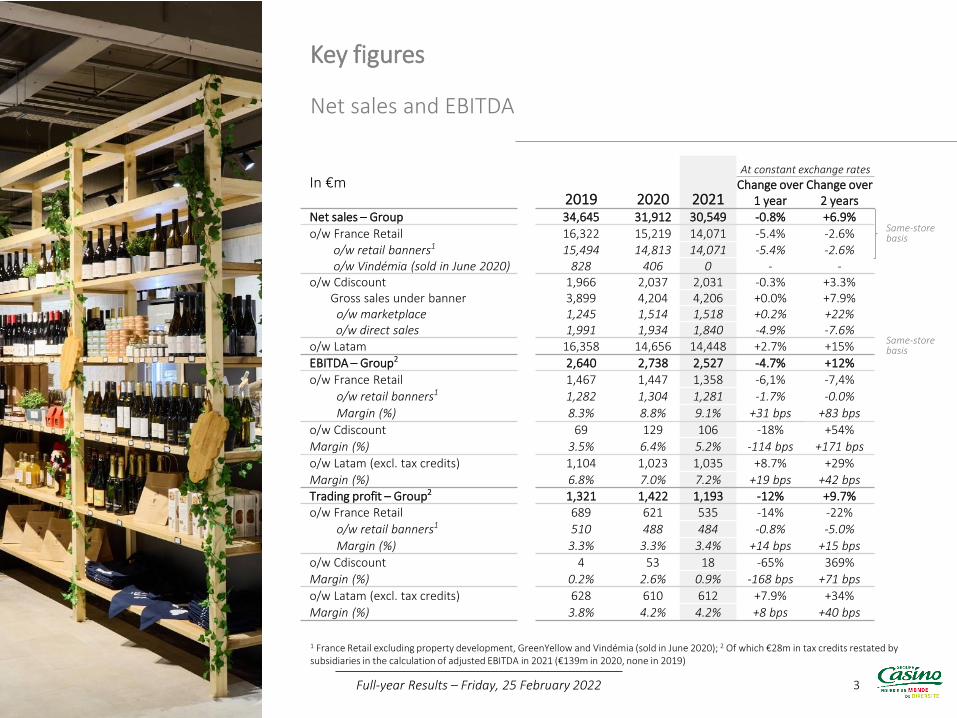
Net sales and EBITDA
Key figures
Full-year Results – Friday, 25 February 2022
1 France Retail excluding property development, GreenYellow and Vindémia (sold in June 2020); 2 Of which €28m in tax credits restated by subsidiaries in the calculation of adjusted EBITDA in 2021 (€139m in 2020, none in 2019)
In €m2019 2020 2021
At constant exchange rates
Change over 1 year
Change over 2 years
Net sales – Group 34,645 31,912 30,549 -0.8% +6.9%
o/w France Retail 16,322 15,219 14,071 -5.4% -2.6%o/w retail banners1 15,494 14,813 14,071 -5.4% -2.6%o/w Vindémia (sold in June 2020) 828 406 0 - -
o/w Cdiscount 1,966 2,037 2,031 -0.3% +3.3%Gross sales under banner 3,899 4,204 4,206 +0.0% +7.9%
o/w marketplace 1,245 1,514 1,518 +0.2% +22%o/w direct sales 1,991 1,934 1,840 -4.9% -7.6%
o/w Latam 16,358 14,656 14,448 +2.7% +15%
EBITDA – Group2 2,640 2,738 2,527 -4.7% +12%
o/w France Retail 1,467 1,447 1,358 -6,1% -7,4%
o/w retail banners1 1,282 1,304 1,281 -1.7% -0.0%
Margin (%) 8.3% 8.8% 9.1% +31 bps +83 bps
o/w Cdiscount 69 129 106 -18% +54%
Margin (%) 3.5% 6.4% 5.2% -114 bps +171 bps
o/w Latam (excl. tax credits) 1,104 1,023 1,035 +8.7% +29%
Margin (%) 6.8% 7.0% 7.2% +19 bps +42 bpsTrading profit – Group2 1,321 1,422 1,193 -12% +9.7%o/w France Retail 689 621 535 -14% -22%
o/w retail banners1 510 488 484 -0.8% -5.0%
Margin (%) 3.3% 3.3% 3.4% +14 bps +15 bps
o/w Cdiscount 4 53 18 -65% 369%
Margin (%) 0.2% 2.6% 0.9% -168 bps +71 bps
o/w Latam (excl. tax credits) 628 610 612 +7.9% +34%
Margin (%) 3.8% 4.2% 4.2% +8 bps +40 bps
3
Same-store basis
Same-store basis
Refocus on the most buoyant and structurally profitable formats
» The Group is now refocused on the most buoyant formats (premium, convenience,e-commerce), which represent 76% of its sales (+16 pts vs. 2018)
› Further increase of +31 bps to 9.1% in the retail banners1 EBITDA margin driven byefficiency plans (+83 bps vs. 2019)
› All banners are profitable, with a very satisfactory level of profitability for buoyantformats
» The Group prioritises formats experiencing structural growth: (i) convenience storesand (ii) e-commerce in partnership with European or world leaders (Ocado, Amazon,Gorillas)
› Convenience: 730 convenience stores opened in urban (Franprix, Naturalia, Monop'),semi-urban and rural (Vival, Spar, etc.) areas since January 2021
› Food e-commerce: home delivery up +48% over the year, ahead of the market (+25%2),with strong leadership in the Ile-de-France region
▫ Partnership set up with Gorillas, now supplied by Monoprix
▫ Signing of a partnership related to the development of Ocado's services in France
» Launch of the purchasing alliance with Intermarché in September 2021, to beextended to purchases of goods and services not for resale from April 2022
» Progress on the disposal plan now representing €3.2bn
› Sale of Floa to BNPP completed end-January 2022 (€200m)
› Earn-out relating to the Apollo and Fortress joint ventures revised upwards to €118m
› Sale of 3% of Mercialys in 2021(€24m) and of 6.5% in early 2022 (€59m)
4
1 France Retail excluding GreenYellow, Vindémia and property development; 2 Source: NielsenIQ
Full-year Results – Friday, 25 February 2022
France highlights
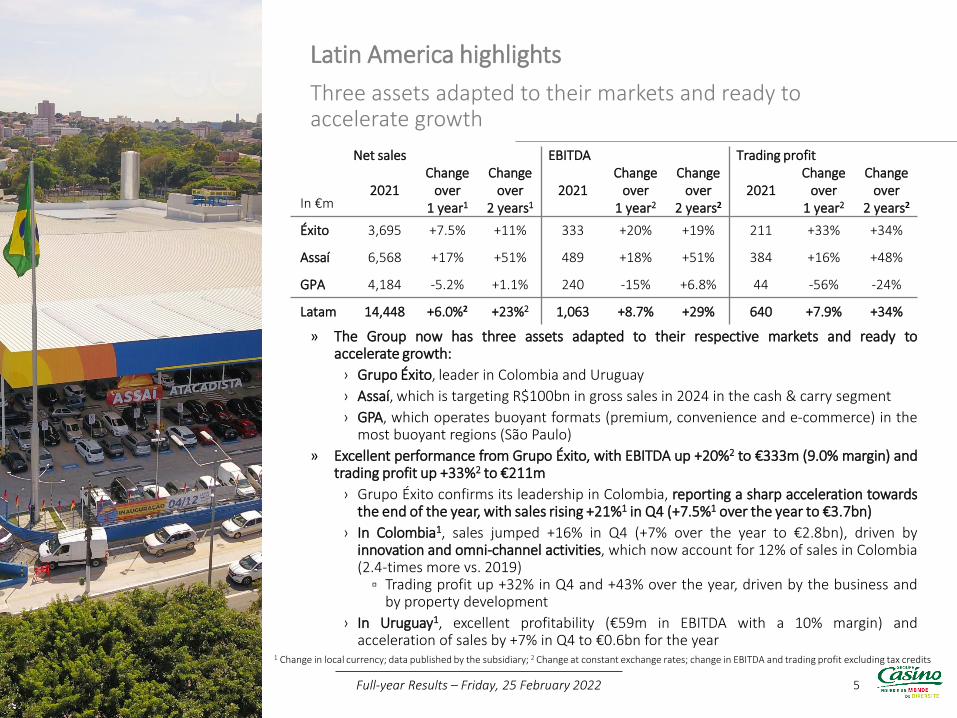
» The Group now has three assets adapted to their respective markets and ready toaccelerate growth:
› Grupo Éxito, leader in Colombia and Uruguay
› Assaí, which is targeting R$100bn in gross sales in 2024 in the cash & carry segment
› GPA, which operates buoyant formats (premium, convenience and e-commerce) in themost buoyant regions (São Paulo)
» Excellent performance from Grupo Éxito, with EBITDA up +20%2 to €333m (9.0% margin) andtrading profit up +33%2 to €211m
› Grupo Éxito confirms its leadership in Colombia, reporting a sharp acceleration towardsthe end of the year, with sales rising +21%1 in Q4 (+7.5%1 over the year to €3.7bn)
› In Colombia1, sales jumped +16% in Q4 (+7% over the year to €2.8bn), driven byinnovation and omni-channel activities, which now account for 12% of sales in Colombia(2.4-times more vs. 2019)
▫ Trading profit up +32% in Q4 and +43% over the year, driven by the business andby property development
› In Uruguay1, excellent profitability (€59m in EBITDA with a 10% margin) andacceleration of sales by +7% in Q4 to €0.6bn for the year
5
1 Change in local currency; data published by the subsidiary; 2 Change at constant exchange rates; change in EBITDA and trading profit excluding tax credits
Full-year Results – Friday, 25 February 2022
Latin America highlights
Three assets adapted to their markets and ready to accelerate growth
In €m
Net sales EBITDA Trading profit
2021Change
over 1 year1
Change over
2 years1
2021Change
over 1 year2
Change over
2 years2
2021Change
over 1 year2
Change over
2 years2
Éxito 3,695 +7.5% +11% 333 +20% +19% 211 +33% +34%
Assaí 6,568 +17% +51% 489 +18% +51% 384 +16% +48%
GPA 4,184 -5.2% +1.1% 240 -15% +6.8% 44 -56% -24%
Latam 14,448 +6.0%2 +23%2 1,063 +8.7% +29% 640 +7.9% +34%
» 2021 highlights include:
› Assaí's listing on the Novo Mercado and the New York StockExchange in March 2021, following the spin-off from GPA in late2020
› Sale of 70 Extra hypermarkets owned by GPA to Assaí
» Assaí's highly profitable business model steps up a gear
› EBITDA growth of +18%1 in 2021 to €489m, with a +51 bps marginimprovement
› Opening of 28 stores in 2021 (total of 212 stores)
› Gross sales target of R$100bn (€17bn) in 2024 (+30% p.a.) to beachieved by: (i) opening around 50 stores between 2022 and 2024,and (ii) converting 70 Extra hypermarkets (including 40 stores in H22022)
▫ The 23 Extra Hiper stores already converted confirm thepotential for future conversions (three-fold increase in sales)
» GPA refocused on premium, convenience and e-commerce
› Focus on profitable premium and convenience formats by divestingor converting hypermarkets (conversion of hypermarkets notdivested into Pão de Açúcar or Mercado Extra supermarkets)
▫ However, hypermarket closures and conversions had atransitory impact on 2021 earnings
› Priority given to food e-commerce, where sales have increased by+363%2 vs. 2019, accounting for 8%2 of food sales in 2021 (vs. 2%in 2019)
› Acceleration in the São Paulo region, where GPA enjoys strongvisibility
6
1 Change at constant exchange rates, excluding tax credits; 2 Data published by the subsidiary
Full-year Results – Friday, 25 February 2022
Latin America highlights
Faster growth for Assaí and development of GPA in buoyant formats
30 39 46
100
2019 2020 2021 2024
+30% p.a.
Assaí gross sales(In R$bn)
7.0%7.5%
7.9%
2019 2020 2021
Assaí adjusted EBITDA margin
(as a % of sales2)
7
Activities in France
6% 2%
11%
<1% 11%
23%
21%
46%
37%
46%
37%14%
18%
6%9% 13%
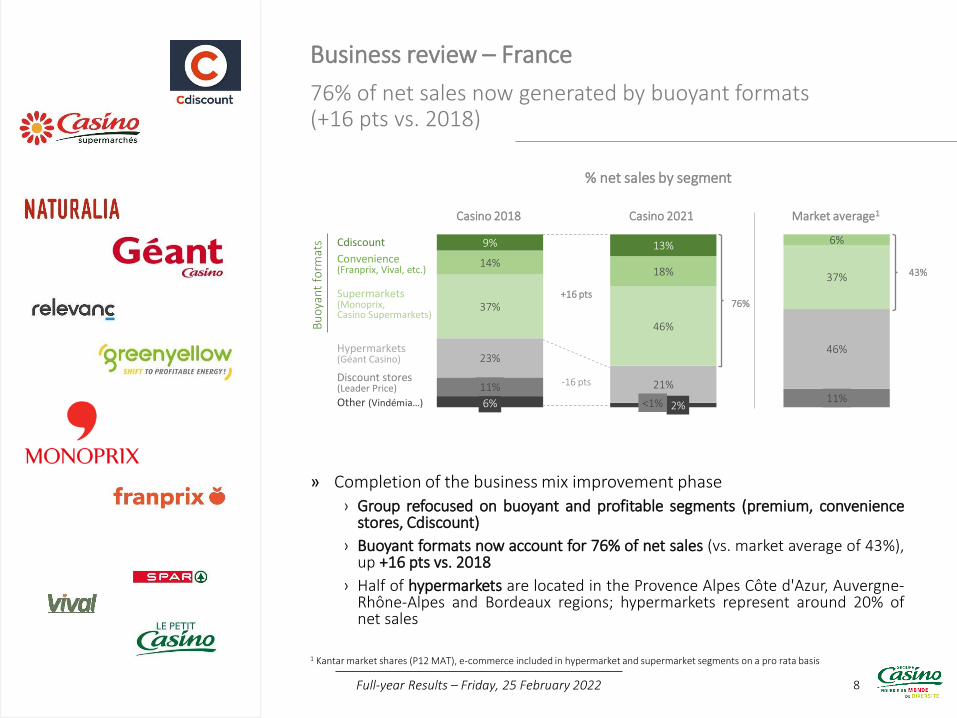
76% of net sales now generated by buoyant formats (+16 pts vs. 2018)
» Completion of the business mix improvement phase
› Group refocused on buoyant and profitable segments (premium, conveniencestores, Cdiscount)
› Buoyant formats now account for 76% of net sales (vs. market average of 43%),up +16 pts vs. 2018
› Half of hypermarkets are located in the Provence Alpes Côte d'Azur, Auvergne-Rhône-Alpes and Bordeaux regions; hypermarkets represent around 20% ofnet sales
Business review – France
8
1 Kantar market shares (P12 MAT), e-commerce included in hypermarket and supermarket segments on a pro rata basis
% net sales by segment
-16 pts
+16 pts
Cdiscount
Convenience(Franprix, Vival, etc.)
Supermarkets(Monoprix, Casino Supermarkets)
Hypermarkets(Géant Casino)
Casino 2018 Casino 2021 Market average1
76%
43%
Full-year Results – Friday, 25 February 2022
Discount stores(Leader Price)
Bu
oya
nt
form
ats
Other (Vindémia…)
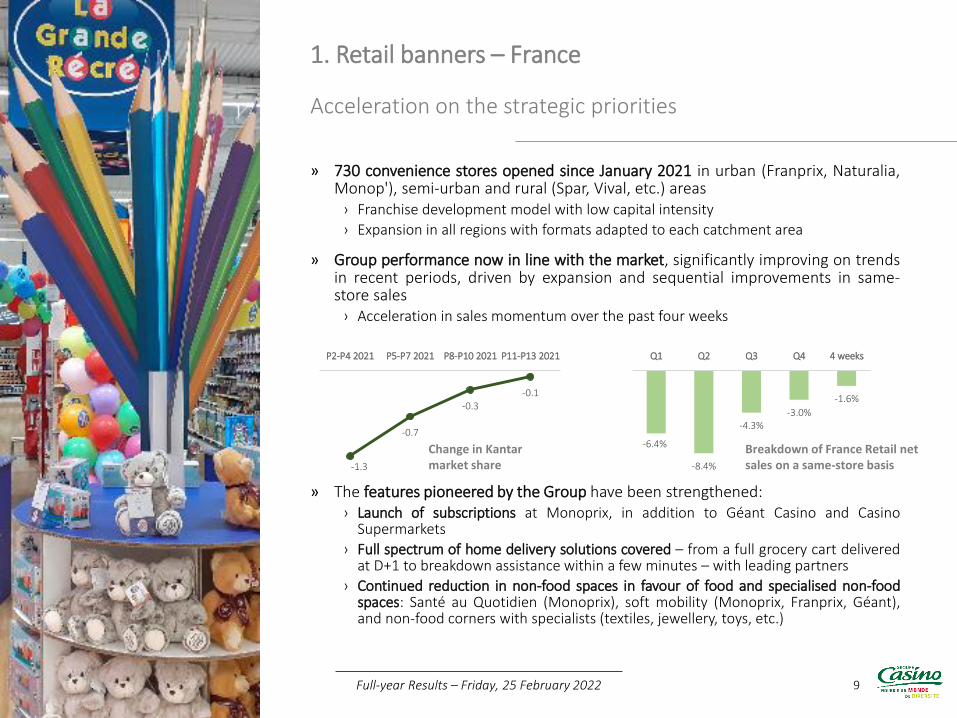
» 730 convenience stores opened since January 2021 in urban (Franprix, Naturalia,Monop'), semi-urban and rural (Spar, Vival, etc.) areas
› Franchise development model with low capital intensity
› Expansion in all regions with formats adapted to each catchment area
» Group performance now in line with the market, significantly improving on trendsin recent periods, driven by expansion and sequential improvements in same-store sales
› Acceleration in sales momentum over the past four weeks
» The features pioneered by the Group have been strengthened:› Launch of subscriptions at Monoprix, in addition to Géant Casino and Casino
Supermarkets
› Full spectrum of home delivery solutions covered – from a full grocery cart deliveredat D+1 to breakdown assistance within a few minutes – with leading partners
› Continued reduction in non-food spaces in favour of food and specialised non-foodspaces: Santé au Quotidien (Monoprix), soft mobility (Monoprix, Franprix, Géant),and non-food corners with specialists (textiles, jewellery, toys, etc.)
Acceleration on the strategic priorities
1. Retail banners – France
9
-1.3
-0.7
-0.3-0.1
P2-P4 2021 P5-P7 2021 P8-P10 2021 P11-P13 2021
Change in Kantar market share
Full-year Results – Friday, 25 February 2022
-6.4%
-8.4%
-4.3%-3.0%
-1.6%
Q1 Q2 Q3 Q4 4 weeks
Breakdown of France Retail net sales on a same-store basis
10
1 10% discount on purchases for a membership fee of approximately €10 per month. Decreasing membership fees based on the term of the subscription
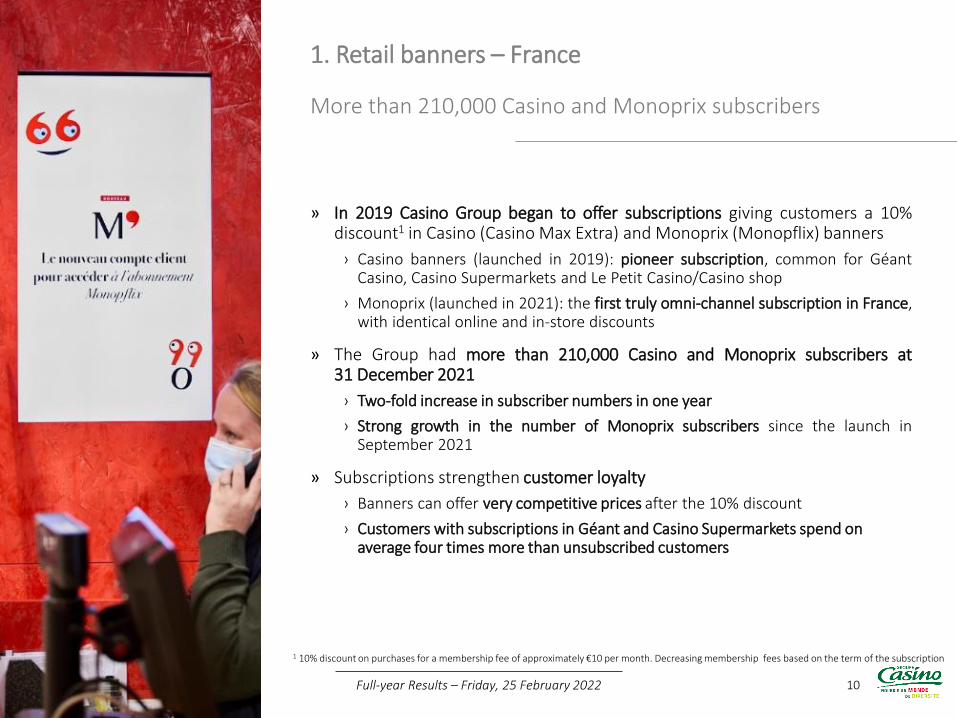
» In 2019 Casino Group began to offer subscriptions giving customers a 10%discount1 in Casino (Casino Max Extra) and Monoprix (Monopflix) banners
› Casino banners (launched in 2019): pioneer subscription, common for GéantCasino, Casino Supermarkets and Le Petit Casino/Casino shop
› Monoprix (launched in 2021): the first truly omni-channel subscription in France,with identical online and in-store discounts
» The Group had more than 210,000 Casino and Monoprix subscribers at31 December 2021
› Two-fold increase in subscriber numbers in one year
› Strong growth in the number of Monoprix subscribers since the launch inSeptember 2021
» Subscriptions strengthen customer loyalty
› Banners can offer very competitive prices after the 10% discount
› Customers with subscriptions in Géant and Casino Supermarkets spend on average four times more than unsubscribed customers
Full-year Results – Friday, 25 February 2022
1. Retail banners – France
More than 210,000 Casino and Monoprix subscribers
E-commerce: home delivery up +48%
» Strong momentum in home delivery, up +48% (vs. +25% for the market1), withstrong leadership in the Ile de France region2
› Including Drive, food e-commerce grew by +15% (+6% for the market1)
» The Group is supported by technological partners who are leaders in their fields› Partnership with Ocado stepped up
▫ 2017: partnership signed▫ 2020: start of operations at the O'logistique automated warehouse in Fleury-
Merogis▫ 2022: partnership related to the development of Ocado's services in France
› Amazon partnership▫ 2018: Monoprix in Amazon Prime in Paris (delivery in 2 hours)▫ 2019: Amazon lockers in stores▫ 2020: extension of Amazon Prime (Lyon, Bordeaux, etc.)▫ 2021: Monoprix becomes Amazon’s sole partner for grocery home delivery with the
termination of its own operations; click & collect from Casino stores (currently 85stores out of a target of 180), and lockers in more than 800 stores
› Partnership with Gorillas▫ 2021: partnership signed▫ 2022: Gorillas’ dark stores supplied by Monoprix
» These wide-ranging retailer innovations provide a unique customer experience› Development of an affinity program› Innovation: launch of a commercial interface on WhatsApp, streamed live shopping
events, virtual reality product presentations, presence in the metaverse
1. Retail banners – France
11
1 Source: NielsenIQ, P13 MAT; 2 Source: NielsenIQ, Q4 2021
Full-year Results – Friday, 25 February 2022
Digital tools to enhance customer service and operations
» A unique omni-channel experience› Fully digitalized customer journey, including in-store purchases (use of
smartphones to access the catalogue and special offers, and to scan and pay forproducts)
› 639 autonomous stores able to open evenings and Sundays (vs. 533 at the endof 2020), and 63% of sales in Géant hypermarkets and Casino supermarketsmade via smartphone or automatic checkout (61% and 48%, respectively, at theend of 2020)
» Personalisation of offers and monetisation of data› High rate of personalised offers in Géant hypermarkets and Casino
supermarkets, with 26% of net sales made by CasinoMax application users at theend of the year
› Monetisation of Group customer traffic among brands and advertising agenciesthrough relevanC and Infinity Advertising1 (targeted advertising, measure ofcommercial performance)
» Optimisation of operations through digital tools› Use of artificial intelligence in stores (e.g., 50% reduction in stock-outs with
Belive.ai's real-time solutions in 253 Casino stores, and SES Imotag in100 Monoprix stores) and for logistics activities (shift optimisation)
› AI expertise brought in-house at relevanC and the banners
› Project to implement new business tools in partnership with Google Cloud andAmazon Web Services
1. Retail banners – France
12
1 JV between Casino Group and Intermarché
Full-year Results – Friday, 25 February 2022
New purchasing partnership with Intermarché
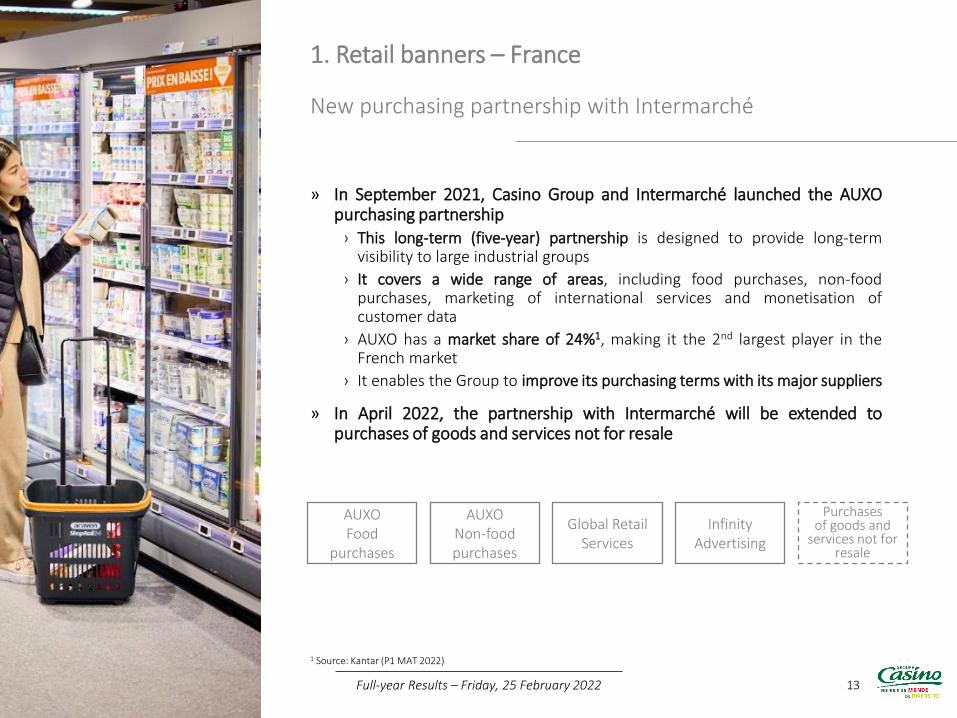
» In September 2021, Casino Group and Intermarché launched the AUXOpurchasing partnership
› This long-term (five-year) partnership is designed to provide long-termvisibility to large industrial groups
› It covers a wide range of areas, including food purchases, non-foodpurchases, marketing of international services and monetisation ofcustomer data
› AUXO has a market share of 24%1, making it the 2nd largest player in theFrench market
› It enables the Group to improve its purchasing terms with its major suppliers
» In April 2022, the partnership with Intermarché will be extended topurchases of goods and services not for resale
1. Retail banners – France
13
1 Source: Kantar (P1 MAT 2022)
Full-year Results – Friday, 25 February 2022
AUXOFood
purchases
AUXONon-food purchases
Global Retail Services
Infinity Advertising
Purchases of goods and
services not for resale
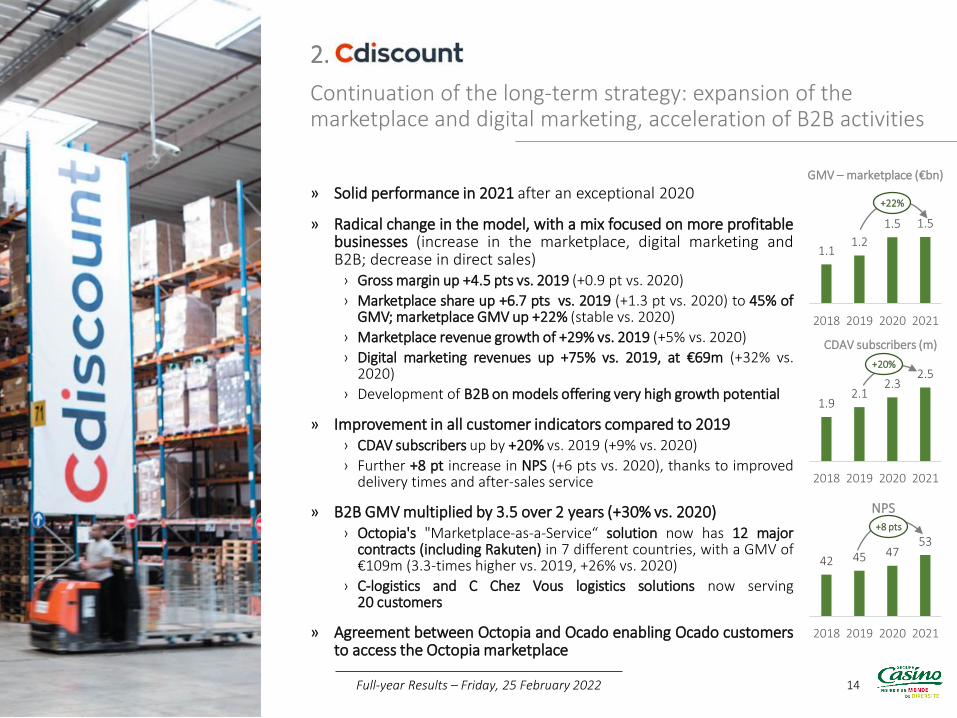
Continuation of the long-term strategy: expansion of the marketplace and digital marketing, acceleration of B2B activities
» Solid performance in 2021 after an exceptional 2020
» Radical change in the model, with a mix focused on more profitablebusinesses (increase in the marketplace, digital marketing andB2B; decrease in direct sales)
› Gross margin up +4.5 pts vs. 2019 (+0.9 pt vs. 2020)
› Marketplace share up +6.7 pts vs. 2019 (+1.3 pt vs. 2020) to 45% ofGMV; marketplace GMV up +22% (stable vs. 2020)
› Marketplace revenue growth of +29% vs. 2019 (+5% vs. 2020)
› Digital marketing revenues up +75% vs. 2019, at €69m (+32% vs.2020)
› Development of B2B on models offering very high growth potential
» Improvement in all customer indicators compared to 2019› CDAV subscribers up by +20% vs. 2019 (+9% vs. 2020)
› Further +8 pt increase in NPS (+6 pts vs. 2020), thanks to improveddelivery times and after-sales service
» B2B GMV multiplied by 3.5 over 2 years (+30% vs. 2020)› Octopia's "Marketplace-as-a-Service“ solution now has 12 major
contracts (including Rakuten) in 7 different countries, with a GMV of€109m (3.3-times higher vs. 2019, +26% vs. 2020)
› C-logistics and C Chez Vous logistics solutions now serving20 customers
» Agreement between Octopia and Ocado enabling Ocado customersto access the Octopia marketplace
2. Cdiscount
14
1.92.1
2.32.5
2018 2019 2020 2021
CDAV subscribers (m)
42 45 4753
2018 2019 2020 2021
NPS
Full-year Results – Friday, 25 February 2022
1.11.2
1.5 1.5
2018 2019 2020 2021
GMV – marketplace (€bn)
+8 pts
+20%
+22%
Ongoing development of a fast-growing business
» Ongoing development and strategic expansion for relevanC
› Launch of Infinity Advertising in partnership with Intermarché to provideretail media and promotional targeting services for food brands(cumulative base of 17 million profiles)
› Launch of activities in Latin America (Brazil and Colombia)
› Acquisition of Inlead to extend relevanC's services and customer base tophysical store networks (e.g., Afflelou opticians)
» Development of partnerships with technology leaders
› Google Cloud and Accenture: commercial and technological partnershipfor international customers
› Amazon Web Services: partnership project to improve customerexperience through algorithms
» Marketing of a B2B retail media platform to other retailers in Franceand international markets to monetise their data and advertising space
› relevanC counts among its clients Everli, the first European service forhome delivery of groceries via personal shoppers
3. relevanC
15Full-year Results – Friday, 25 February 2022
Strong activity momentum in 2021
» Increase of +31% in photovoltaic capacity installed or under constructionand of +16% in energy efficiency projects installed or under construction vs.31 December 2020
› Photovoltaic capacity installed or under construction up +31% to 740 MW(563 MW at end-2020), with an advanced pipeline1 of 816 MW (+44% vs.2020)
› Energy efficiency projects installed or under construction up +16% to985 GWh, with an advanced pipeline1 of 317 GWh (+26% vs. 2020)
› EBITDA up +30% to €80m2
» Continued geographical expansion and promising partnerships› Development in new regions in Eastern Europe (4MW project for Solvay in
Bulgaria) and consolidation in historical regions (signing of the 200th PPA3 inSouth-East Asia)
› Strategic partnership with Schneider Electric to provide turnkey energyefficiency programmes to large international companies
› Partnership with Amazon Web Services to provide renewable electricity for itsoperations
» Capital raising of €109m from an institutional investor (convertible bondswith warrants attached) and set-up of a €87m syndicated credit facility toaccelerate growth in 2022
4. GreenYellow
16Full-year Results – Friday, 25 February 2022
1 The advanced pipeline comprises projects at the "awarded" and "advanced pipeline" stages within GreenYellow's portfolio of projectsunder development; 2 Data published by the subsidiary. Contribution to consolidated EBITDA: €63m (€57m in 2020); 3 Power PurchaseAgreement
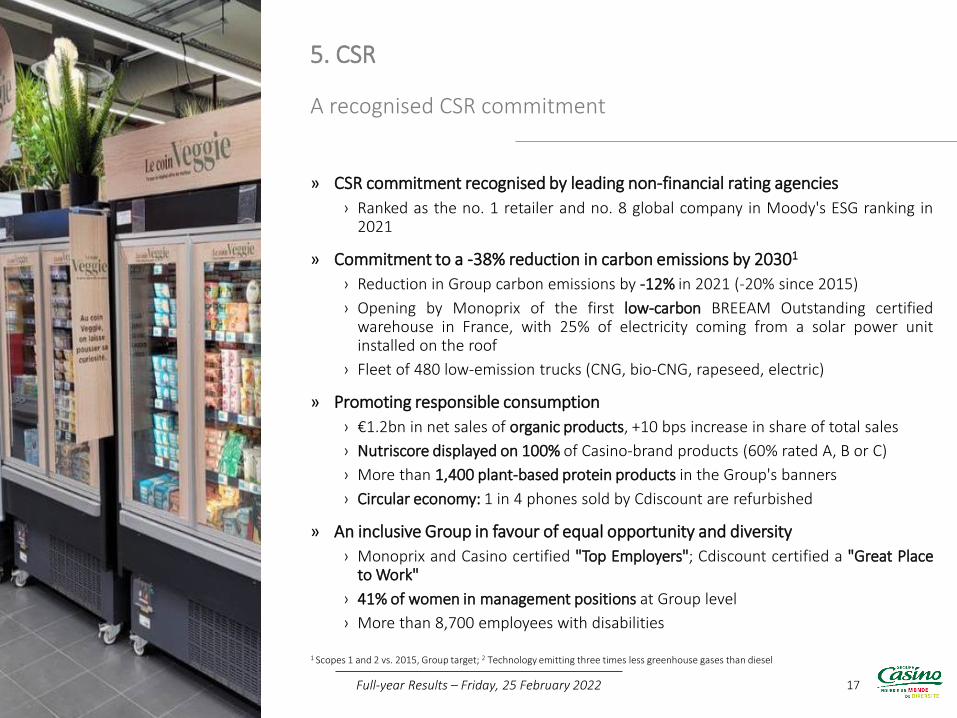
A recognised CSR commitment
» CSR commitment recognised by leading non-financial rating agencies
› Ranked as the no. 1 retailer and no. 8 global company in Moody's ESG ranking in2021
» Commitment to a -38% reduction in carbon emissions by 20301
› Reduction in Group carbon emissions by -12% in 2021 (-20% since 2015)
› Opening by Monoprix of the first low-carbon BREEAM Outstanding certifiedwarehouse in France, with 25% of electricity coming from a solar power unitinstalled on the roof
› Fleet of 480 low-emission trucks (CNG, bio-CNG, rapeseed, electric)
» Promoting responsible consumption
› €1.2bn in net sales of organic products, +10 bps increase in share of total sales
› Nutriscore displayed on 100% of Casino-brand products (60% rated A, B or C)
› More than 1,400 plant-based protein products in the Group's banners
› Circular economy: 1 in 4 phones sold by Cdiscount are refurbished
» An inclusive Group in favour of equal opportunity and diversity
› Monoprix and Casino certified "Top Employers"; Cdiscount certified a "Great Placeto Work"
› 41% of women in management positions at Group level
› More than 8,700 employees with disabilities
5. CSR
17
1 Scopes 1 and 2 vs. 2015, Group target; 2 Technology emitting three times less greenhouse gases than diesel
Full-year Results – Friday, 25 February 2022
18
Financial results
19
» IFRS 5
› Leader Price, which was sold on 30 November 2020, is presented as adiscontinued operation in 2020 and 2021
» IFRS IC decision
› IFRS IC decision relating to the recognition of liabilities for certainpost-employment benefits
› Retrospective application of this interpretation led to restatements inthe 2020 financial statements
Preliminary comments
Full-year Results – Friday, 25 February 2022
20
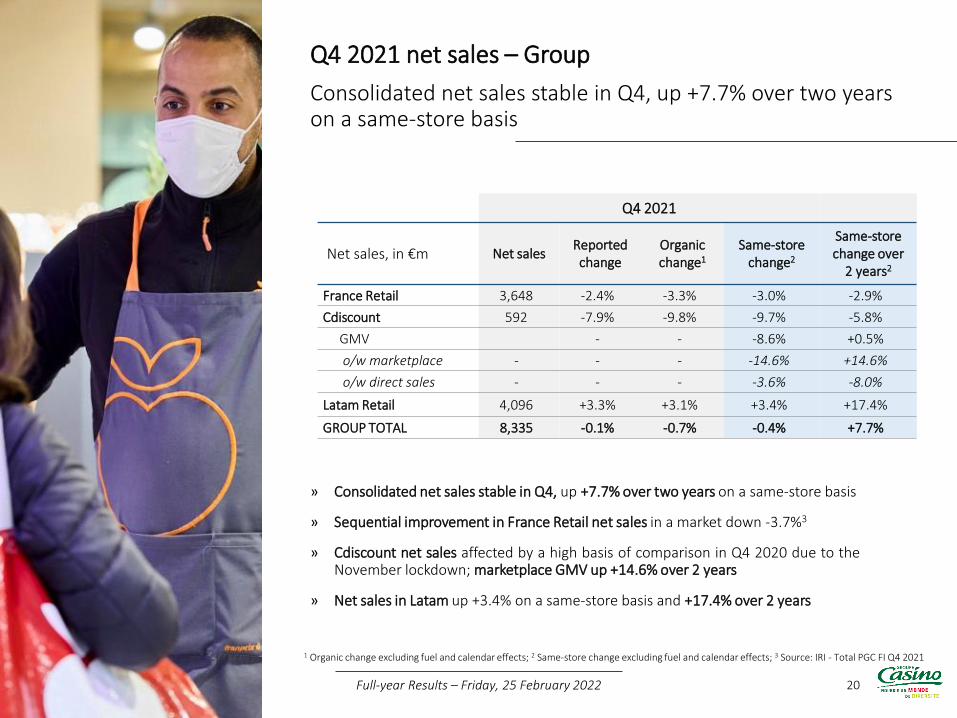
Consolidated net sales stable in Q4, up +7.7% over two years on a same-store basis
» Consolidated net sales stable in Q4, up +7.7% over two years on a same-store basis
» Sequential improvement in France Retail net sales in a market down -3.7%3
» Cdiscount net sales affected by a high basis of comparison in Q4 2020 due to theNovember lockdown; marketplace GMV up +14.6% over 2 years
» Net sales in Latam up +3.4% on a same-store basis and +17.4% over 2 years
Q4 2021 net sales – Group
1 Organic change excluding fuel and calendar effects; 2 Same-store change excluding fuel and calendar effects; 3 Source: IRI - Total PGC FI Q4 2021
Q4 2021
Net sales, in €m Net salesReportedchange
Organicchange1
Same-store change2
Same-store change over
2 years2
France Retail 3,648 -2.4% -3.3% -3.0% -2.9%
Cdiscount 592 -7.9% -9.8% -9.7% -5.8%
GMV - - -8.6% +0.5%
o/w marketplace - - - -14.6% +14.6%
o/w direct sales - - - -3.6% -8.0%
Latam Retail 4,096 +3.3% +3.1% +3.4% +17.4%
GROUP TOTAL 8,335 -0.1% -0.7% -0.4% +7.7%
Full-year Results – Friday, 25 February 2022
21
Sequential improvement in net sales
» Sequential improvement with like-for-like growthup +1.3 pt vs. Q3 2021
› Sequential improvement for most banners,including Monoprix and Franprix in a marketdown by -5.6%3 in the Ile-de-France region
Q4 net sales – France Retail
1 Organic change excluding fuel and calendar effects; 2 Same-store change excluding fuel and calendar effects; 3 Source: IRI – Total PGC FI Q4 2021
Q4 2021 Q3 2021 Q4 vs. Q3
Net sales, in €m Net salesReportedchange
Organicchange1
Same-store change2
Same-store change2
Same-store change
Monoprix 1,191 -2.3% -1.8% -2.8% -4.1% +1.3 pt
Supermarkets 767 +5.6% -4.0% -3.3% -2.7% -0.6 pt
Franprix 366 -3.3% -2.2% -2.0% -3.6% +1.6 pt
Gross sales under banner 432 -0.2% - - - -
Convenience 327 +3.5% +3.7% -0.7% -1.3% +0.6 pt
Gross sales under banner 490 +5.0% - - - -
Hypermarkets 899 -6.3% -8.4% -4.7% -8.5% +3.8 pts
Other 98 -30% - - - -
France Retail 3,648 -2.4% -3.3% -3.0% -4.3% +1.3 pt
Full-year Results – Friday, 25 February 2022
-12.8%-11.0%
-3.2% -2.4%
Q1 Q2 Q3 Q4
» Overall -2.4% decrease in net sales
› In the convenience segment, sales were up+3.5% and gross sales under banner up+5.0% , driven by the expansion
Change in 2021 net sales
22
Sequential improvement over the last four weeks
» Over the last four weeks, same-store sales improved by +1.4 pts compared toQ4 2021
› Strong growth in convenience formats, up +5.9%
› Improved trends in the hypermarkets segment, down -1.5%
» Franprix and Convenience gross sales under banner increased by +2.5% in Q4 and+5.1% over the last four weeks, up +2.6 pts
Net sales for the four weeks to 20 February 2022
1 Same-store change excluding fuel and calendar effects
Full-year Results – Friday, 25 February 2022
Same-store change1 Q3 2021 Q4 20214 weeks to 20
February
Monoprix -4.1% -2.8% -3.4%
Supermarkets -2.7% -3.3% -2.2%
Franprix -3.6% -2.0% -1.8%
Convenience -1.3% -0.7% +5.9%
Hypermarkets -8.5% -4.7% -1.5%
France Retail -4.3% -3.0% -1.6%
+1,3 pt +1,4 pt
Gross sales under banner Q3 2021 Q4 20214 weeks to 20
February
Franprix -2.5% -0.2% -1.0%
Convenience +5.0% +5.0% +10%
Franprix and Convenience +2.1% +2.5% +5.1%
+0,4 pt +2,6 pts
In €m – France Retail 2019 2020 2021Change
over 1 yearChange
over 2 years
Net sales 16,322 15,219 14,071 -5.4%1 -2.6%1
EBITDARetail banners2 1,282 1,304 1,281 -1.7% -0.0%EBITDA margin (%) 8.3% 8.8% 9.1% +31 bps +83 bps
Vindémia 53 22 0 n.a. n.a.Property development 56 64 14 -78% -75%GreenYellow3 76 57 63 +10% -17%Total France Retail 1,467 1,447 1,358 -6.1% -7.4%EBITDA margin (%) 9.0% 9.5% 9.7% +15 bps +70 bps
Trading profitRetail banners2 510 488 484 -0.8% -5.0%Trading margin (%) 3.3% 3.3% 3.4% +14 bps +15 bps
Vindémia 53 22 0 n.a. n.a.Property development 54 63 13 -80% -85%GreenYellow 72 48 39 -19% -46%Total France Retail 689 621 535 -14% -22%Trading margin (%) 4.2% 4.1% 3.8% -27 bps -40 bps
23
Retail banners EBITDA margin up +83 bps over two years
» Net sales affected by asset disposals (Rocade plan, Vindémia)
» Retail banners EBITDA stable over two years and margin at 9.1%, up +83 bps thanks toefficiency plans; trading margin at 3.4%
» Change in GreenYellow's business model from a development-based model to an assetholding model
Results – France Retail
Note: GreenYellow's trading profit impacted by higher depreciation and amortisation in line with the investment momentum1 Same-store basis excluding fuel and calendar effects; 2 France Retail excluding GreenYellow, Vindémia and property development;3 Contribution to consolidated figures. Data published by the subsidiary: EBITDA at €80m in 2021 (€62m in 2020)
Full-year Results – Friday, 25 February 2022
24
All indicators up over two years after an exceptional year in 2020
» Change in Cdiscount's business model towards a more profitable business mix (increasein marketplace, digital marketing and B2B; decrease in direct sales), resulting in afavourable margin impact
› Improvement of +4.5 pts in gross margin vs. 2019 (+0.9 pt vs. 2020)
» Cdiscount delivered a solid performance after an exceptional year in 2020, with allindicators up over two years
› EBITDA up by +54%; 2021 trading profit including additional depreciation andamortisation related to investments in Octopia
› Marketplace GMV up +22%
› Marketplace revenues up +29% and digital marketing up +75%
Results – E-commerce (Cdiscount)
1 Contribution to consolidated figures. Data published by the subsidiary: 2021 EBITDA at €109m (2020: €133m) and trading profit at €18m (2020: €53m)
In €m – E-commerce (Cdiscount) 2019 2020 2021Change over 1 year
Change over 2 years
GMV 3,899 4,204 4,206 +0.0% +7.9%o/w marketplace 1,245 1,514 1,518 +0.2% +22%o/w direct sales 1,991 1,934 1,840 -4.9% -7.6%Marketplace contribution 38.5% 43.9% 45.2% +1.3 pts +6.7 pts
Net sales 1,966 2,037 2,031 -0.3% +3.3%
Marketplace revenues 150 184 193 +4.9% +29%Digitalmarketing
40 52 69 +32% +75%
EBITDA 69 129 106 -18% +54%EBITDA margin (%) 3.5% 6.4% 5.2% -114 bps +170 bps
Trading profit 4 53 18 -65% +369%Trading margin (%) 0.2% 2.6% 0.9% -168 bps +71 bps
Full-year Results – Friday, 25 February 2022
25
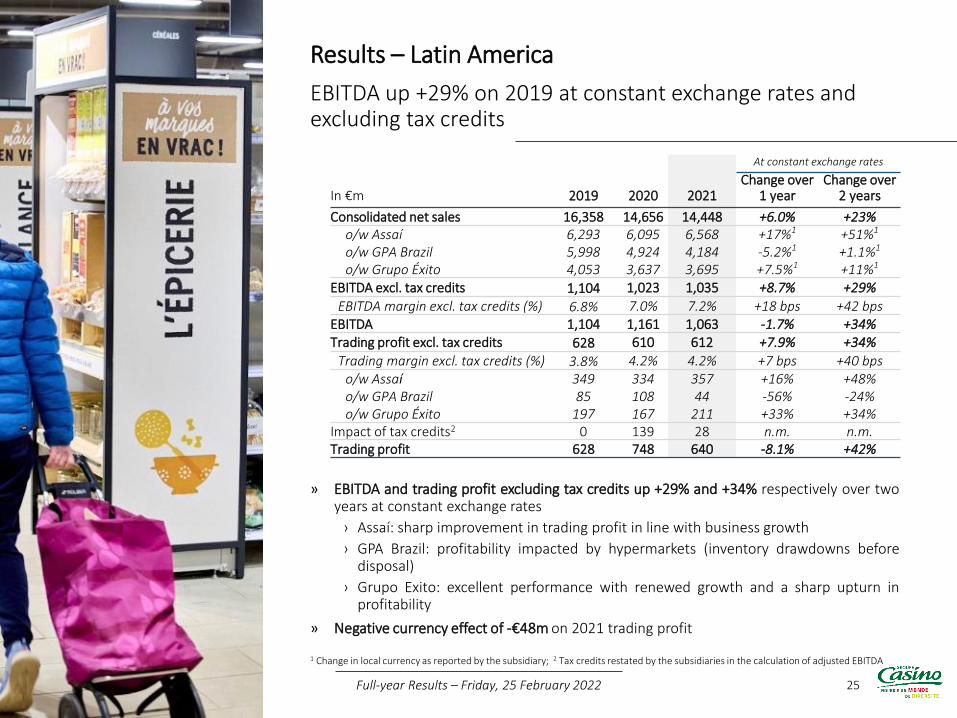
EBITDA up +29% on 2019 at constant exchange rates and excluding tax credits
» EBITDA and trading profit excluding tax credits up +29% and +34% respectively over twoyears at constant exchange rates
› Assaí: sharp improvement in trading profit in line with business growth
› GPA Brazil: profitability impacted by hypermarkets (inventory drawdowns beforedisposal)
› Grupo Exito: excellent performance with renewed growth and a sharp upturn inprofitability
» Negative currency effect of -€48m on 2021 trading profit
Results – Latin America
1 Change in local currency as reported by the subsidiary; 2 Tax credits restated by the subsidiaries in the calculation of adjusted EBITDA
Full-year Results – Friday, 25 February 2022
In €m 2019 2020 2021
At constant exchange rates
Change over 1 year
Change over 2 years
Consolidated net sales 16,358 14,656 14,448 +6.0% +23%o/w Assaío/w GPA Brazilo/w Grupo Éxito
6,2935,9984,053
6,0954,9243,637
6,5684,1843,695
+17%1
-5.2%1
+7.5%1
+51%1
+1.1%1
+11%1
EBITDA excl. tax credits 1,104 1,023 1,035 +8.7% +29%
EBITDA margin excl. tax credits (%) 6.8% 7.0% 7.2% +18 bps +42 bpsEBITDA 1,104 1,161 1,063 -1.7% +34%Trading profit excl. tax credits 628 610 612 +7.9% +34%
Trading margin excl. tax credits (%) 3.8% 4.2% 4.2% +7 bps +40 bpso/w Assaío/w GPA Brazilo/w Grupo Éxito
34985
197
334108167
35744
211
+16%-56%+33%
+48%-24%+34%
Impact of tax credits2 0 139 28 n.m. n.m.Trading profit 628 748 640 -8.1% +42%
26
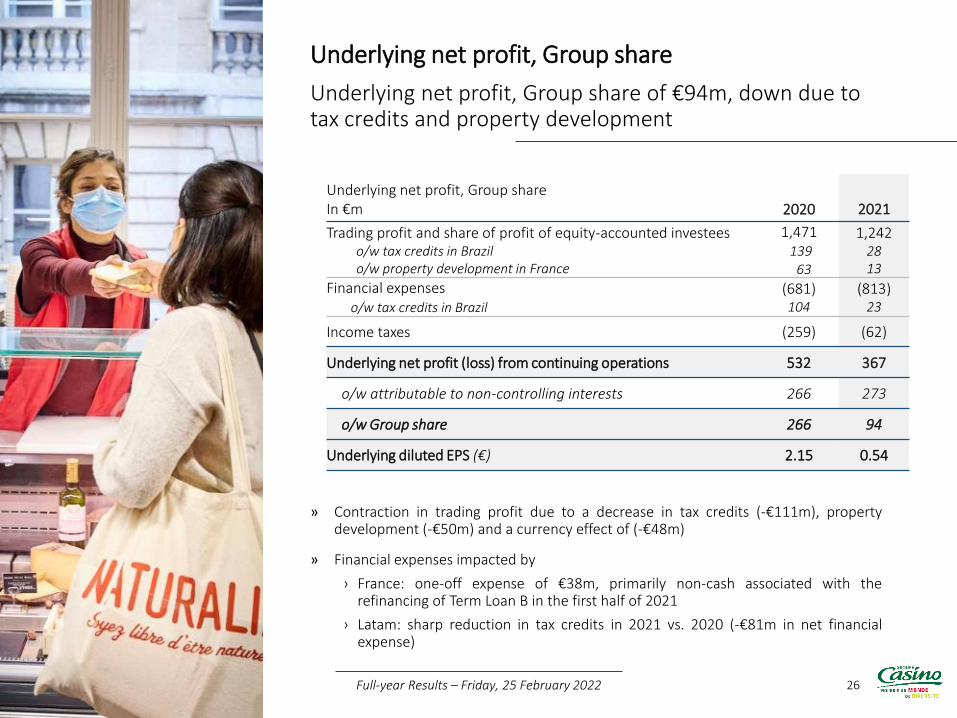
Underlying net profit, Group share of €94m, down due to tax credits and property development
» Contraction in trading profit due to a decrease in tax credits (-€111m), propertydevelopment (-€50m) and a currency effect of (-€48m)
» Financial expenses impacted by
› France: one-off expense of €38m, primarily non-cash associated with therefinancing of Term Loan B in the first half of 2021
› Latam: sharp reduction in tax credits in 2021 vs. 2020 (-€81m in net financialexpense)
Underlying net profit, Group share
Underlying net profit, Group shareIn €m 2020 2021
Trading profit and share of profit of equity-accounted investeeso/w tax credits in Brazilo/w property development in France
1,471139
63
1,2422813
Financial expenseso/w tax credits in Brazil
(681)104
(813)23
Income taxes (259) (62)
Underlying net profit (loss) from continuing operations 532 367
o/w attributable to non-controlling interests 266 273
o/w Group share 266 94
Underlying diluted EPS (€) 2.15 0.54
Full-year Results – Friday, 25 February 2022
27
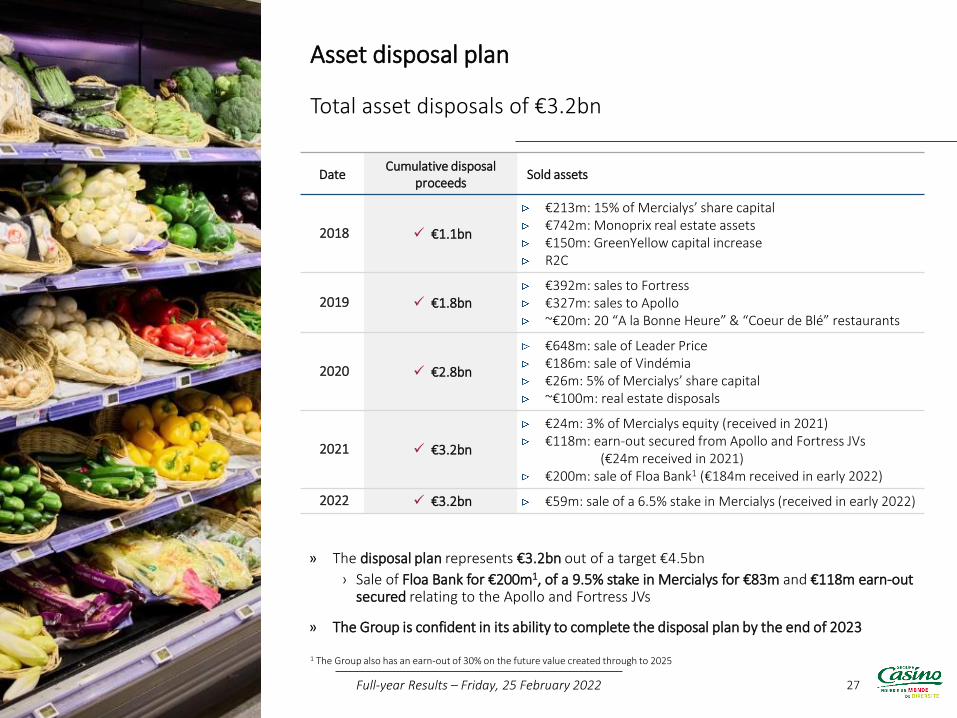
Total asset disposals of €3.2bn
» The disposal plan represents €3.2bn out of a target €4.5bn
› Sale of Floa Bank for €200m1, of a 9.5% stake in Mercialys for €83m and €118m earn-outsecured relating to the Apollo and Fortress JVs
» The Group is confident in its ability to complete the disposal plan by the end of 2023
Asset disposal plan
1 The Group also has an earn-out of 30% on the future value created through to 2025
DateCumulative disposal
proceedsSold assets
2018 €1.1bn
€213m: 15% of Mercialys’ share capital€742m: Monoprix real estate assets€150m: GreenYellow capital increaseR2C
2019 €1.8bn€392m: sales to Fortress€327m: sales to Apollo~€20m: 20 “A la Bonne Heure” & “Coeur de Blé” restaurants
2020 €2.8bn
€648m: sale of Leader Price€186m: sale of Vindémia€26m: 5% of Mercialys’ share capital~€100m: real estate disposals
2021 €3.2bn
€24m: 3% of Mercialys equity (received in 2021)€118m: earn-out secured from Apollo and Fortress JVs
(€24m received in 2021)€200m: sale of Floa Bank1 (€184m received in early 2022)
2022 €3.2bn €59m: sale of a 6.5% stake in Mercialys (received in early 2022)
Full-year Results – Friday, 25 February 2022
28
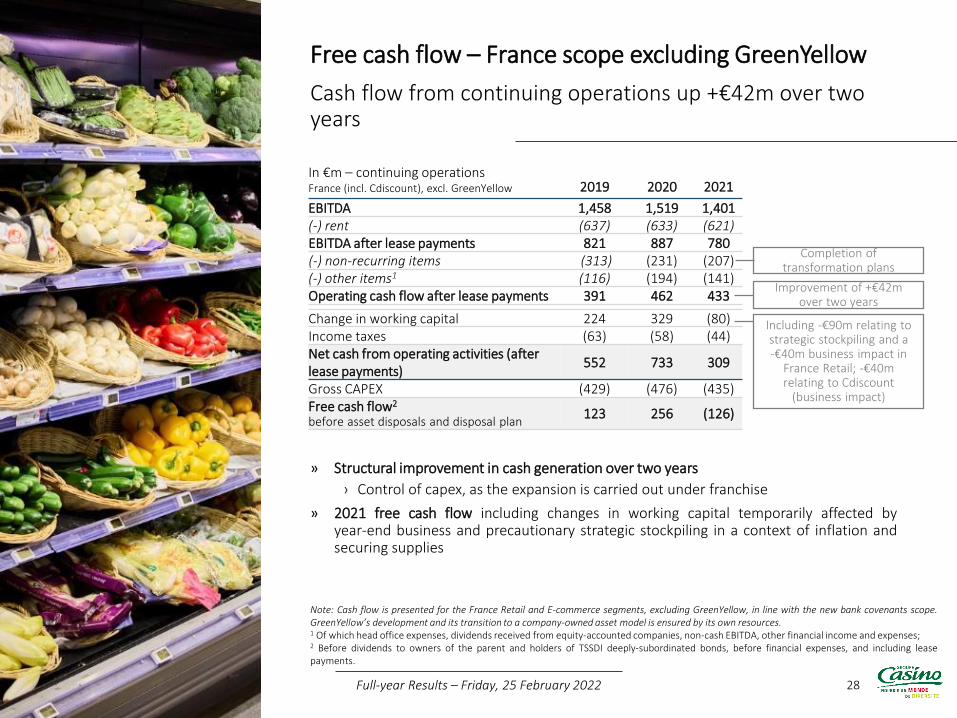
Cash flow from continuing operations up +€42m over two years
» Structural improvement in cash generation over two years
› Control of capex, as the expansion is carried out under franchise
» 2021 free cash flow including changes in working capital temporarily affected byyear-end business and precautionary strategic stockpiling in a context of inflation andsecuring supplies
Free cash flow – France scope excluding GreenYellow
Note: Cash flow is presented for the France Retail and E-commerce segments, excluding GreenYellow, in line with the new bank covenants scope.GreenYellow’s development and its transition to a company-owned asset model is ensured by its own resources.1 Of which head office expenses, dividends received from equity-accounted companies, non-cash EBITDA, other financial income and expenses;2 Before dividends to owners of the parent and holders of TSSDI deeply-subordinated bonds, before financial expenses, and including leasepayments.
In €m – continuing operationsFrance (incl. Cdiscount), excl. GreenYellow 2019 2020 2021
EBITDA 1,458 1,519 1,401(-) rent (637) (633) (621)EBITDA after lease payments 821 887 780(-) non-recurring items (313) (231) (207)(-) other items1 (116) (194) (141)Operating cash flow after lease payments 391 462 433
Change in working capital 224 329 (80)Income taxes (63) (58) (44)Net cash from operating activities (after lease payments)
552 733 309
Gross CAPEX (429) (476) (435)Free cash flow2
before asset disposals and disposal plan123 256 (126)
Full-year Results – Friday, 25 February 2022
Including -€90m relating to strategic stockpiling and a-€40m business impact in
France Retail; -€40m relating to Cdiscount
(business impact)
Improvement of +€42m over two years
Completion of transformation plans
29
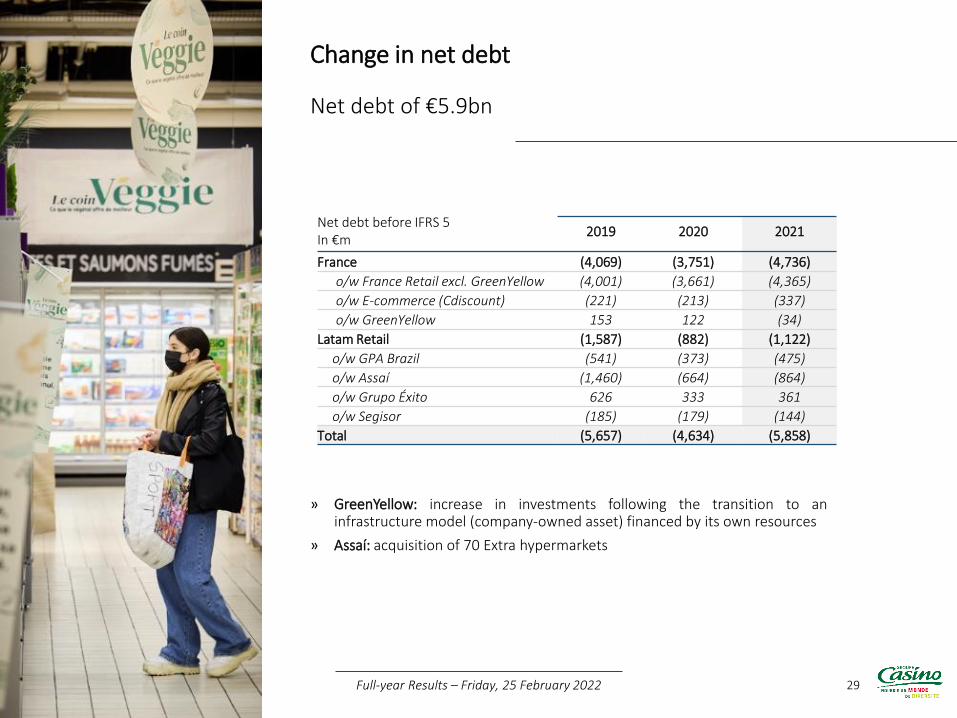
Net debt of €5.9bn
Change in net debt
Net debt before IFRS 5In €m
2019 2020 2021
France (4,069) (3,751) (4,736)
o/w France Retail excl. GreenYellow (4,001) (3,661) (4,365)
o/w E-commerce (Cdiscount) (221) (213) (337)
o/w GreenYellow 153 122 (34)
Latam Retail (1,587) (882) (1,122)
o/w GPA Brazil (541) (373) (475)
o/w Assaí (1,460) (664) (864)
o/w Grupo Éxito 626 333 361
o/w Segisor (185) (179) (144)
Total (5,657) (4,634) (5,858)
Full-year Results – Friday, 25 February 2022
» GreenYellow: increase in investments following the transition to aninfrastructure model (company-owned asset) financed by its own resources
» Assaí: acquisition of 70 Extra hypermarkets
30
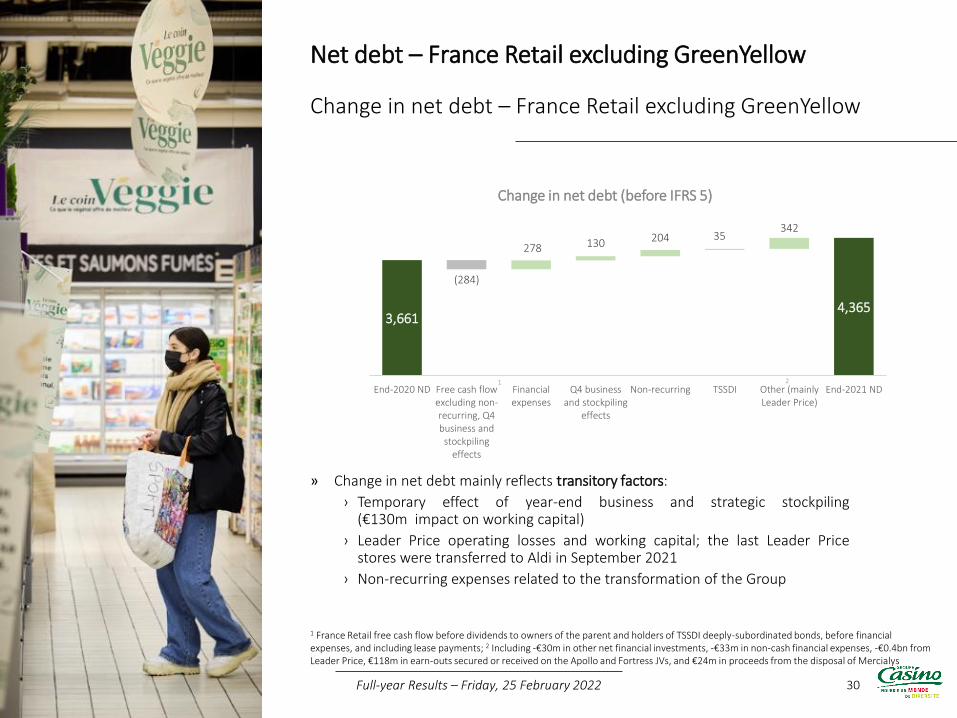
Change in net debt – France Retail excluding GreenYellow
» Change in net debt mainly reflects transitory factors:
› Temporary effect of year-end business and strategic stockpiling(€130m impact on working capital)
› Leader Price operating losses and working capital; the last Leader Pricestores were transferred to Aldi in September 2021
› Non-recurring expenses related to the transformation of the Group
Net debt – France Retail excluding GreenYellow
Full-year Results – Friday, 25 February 2022
3,6614,365
278 130 204 35342
(284)
End-2020 ND Free cash flowexcluding non-recurring, Q4business andstockpiling
effects
Financialexpenses
Q4 businessand stockpiling
effects
Non-recurring TSSDI Other (mainlyLeader Price)
End-2021 ND
1 France Retail free cash flow before dividends to owners of the parent and holders of TSSDI deeply-subordinated bonds, before financial expenses, and including lease payments; 2 Including -€30m in other net financial investments, -€33m in non-cash financial expenses, -€0.4bn from Leader Price, €118m in earn-outs secured or received on the Apollo and Fortress JVs, and €24m in proceeds from the disposal of Mercialys
1 2
Change in net debt (before IFRS 5)
31
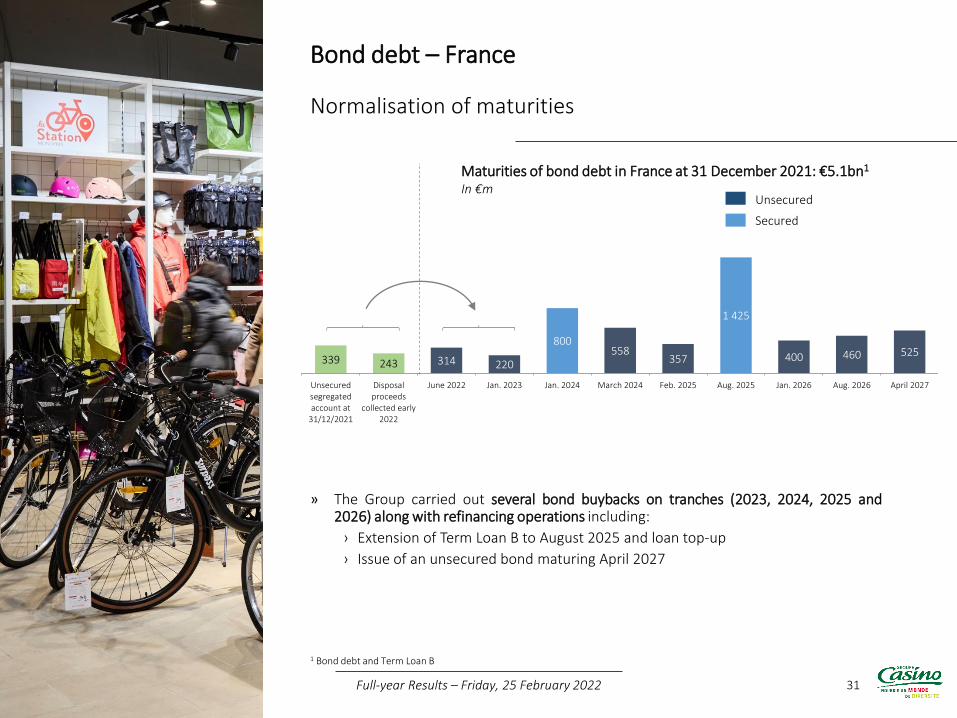
Normalisation of maturities
» The Group carried out several bond buybacks on tranches (2023, 2024, 2025 and2026) along with refinancing operations including:
› Extension of Term Loan B to August 2025 and loan top-up
› Issue of an unsecured bond maturing April 2027
Bond debt – France
1 Bond debt and Term Loan B
Maturities of bond debt in France at 31 December 2021: €5.1bn1
In €m
339 243 314 220
800558
357
1 425
400 460 525
Unsecuredsegregatedaccount at
31/12/2021
Disposalproceeds
collected early2022
June 2022 Jan. 2023 Jan. 2024 March 2024 Feb. 2025 Aug. 2025 Jan. 2026 Aug. 2026 April 2027
Unsecured
Secured
Full-year Results – Friday, 25 February 2022
32
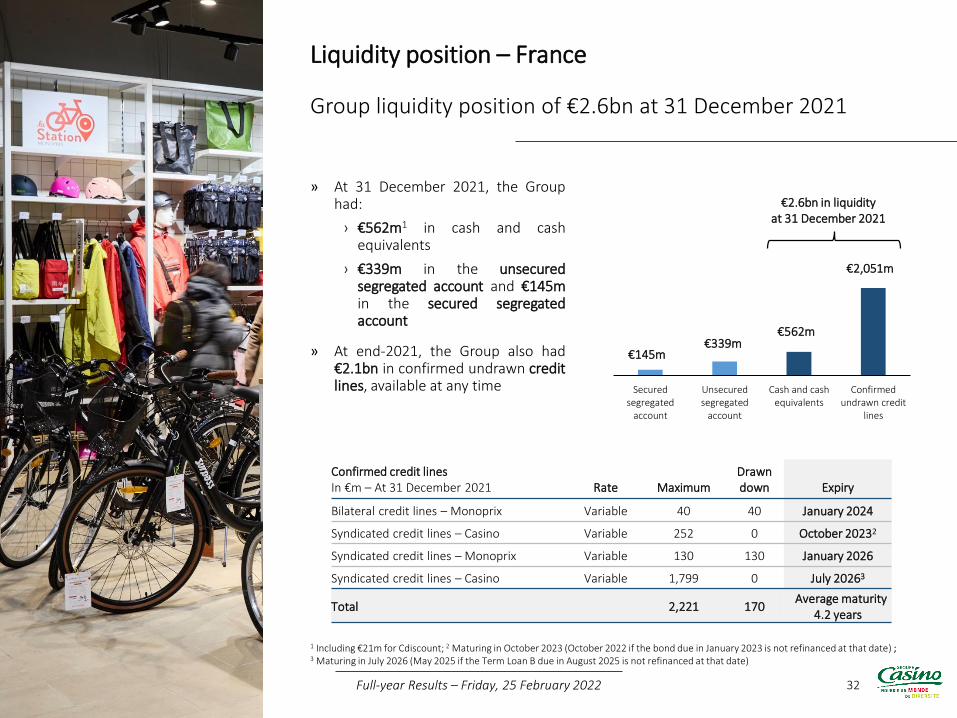
Group liquidity position of €2.6bn at 31 December 2021
» At 31 December 2021, the Grouphad:
› €562m1 in cash and cashequivalents
› €339m in the unsecuredsegregated account and €145min the secured segregatedaccount
» At end-2021, the Group also had€2.1bn in confirmed undrawn creditlines, available at any time
Liquidity position – France
1 Including €21m for Cdiscount; 2 Maturing in October 2023 (October 2022 if the bond due in January 2023 is not refinanced at that date) ; 3 Maturing in July 2026 (May 2025 if the Term Loan B due in August 2025 is not refinanced at that date)
Securedsegregated
account
Unsecuredsegregated
account
Cash and cashequivalents
Confirmedundrawn credit
lines
€2.6bn in liquidityat 31 December 2021
€2,051m
€562m€339m
€145m
Confirmed credit linesIn €m – At 31 December 2021 Rate Maximum
Drawn down Expiry
Bilateral credit lines – Monoprix Variable 40 40 January 2024
Syndicated credit lines – Casino Variable 252 0 October 20232
Syndicated credit lines – Monoprix Variable 130 130 January 2026
Syndicated credit lines – Casino Variable 1,799 0 July 20263
Total 2,221 170Average maturity
4.2 years
Full-year Results – Friday, 25 February 2022
33
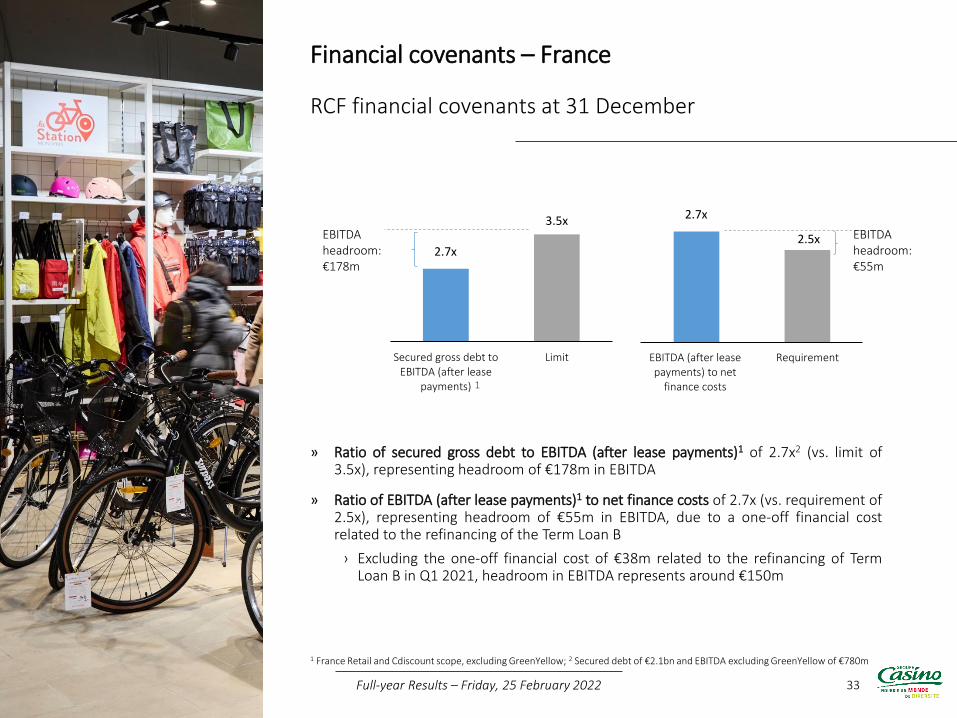
RCF financial covenants at 31 December
» Ratio of secured gross debt to EBITDA (after lease payments)1 of 2.7x2 (vs. limit of3.5x), representing headroom of €178m in EBITDA
» Ratio of EBITDA (after lease payments)1 to net finance costs of 2.7x (vs. requirement of2.5x), representing headroom of €55m in EBITDA, due to a one-off financial costrelated to the refinancing of the Term Loan B
› Excluding the one-off financial cost of €38m related to the refinancing of TermLoan B in Q1 2021, headroom in EBITDA represents around €150m
Financial covenants – France
1 France Retail and Cdiscount scope, excluding GreenYellow; 2 Secured debt of €2.1bn and EBITDA excluding GreenYellow of €780m
2.7x
3.5x
Secured gross debt toEBITDA (after lease
payments)
Limit
2.7x
2.5x
EBITDA (after leasepayments) to net
finance costs
Requirement
1
EBITDA headroom: €178m
Full-year Results – Friday, 25 February 2022
EBITDA headroom: €55m
34
Since all formats are profitable, the focus is on organic growth
» In 2021, the Group completed its repositioning in structurally buoyantformats with a good profitability level
» In 2022, as the health situation gradually gets back to normal, the Groupis confident it will enjoy renewed sales momentum by capitalising on itsdifferentiating assets and innovative services
i. Convenience formats (Monop', Franprix, Naturalia, Spar, Vival,etc.) with a target of more than 800 stores to be opened,mainly under franchise
ii. Confirmation of leadership in e-commerce, particularly in homedelivery, supported by its partners Ocado, Amazon and Gorillasand the store network
› Maintain high level of profitability and improve cash flow generation
› Continuation of the €4.5bn disposal plan in France. In view of thevarious options available, the Group is confident that this plan willbe completed by the end of 2023
Outlook – France
Full-year Results – Friday, 25 February 2022
35
Appendices
36
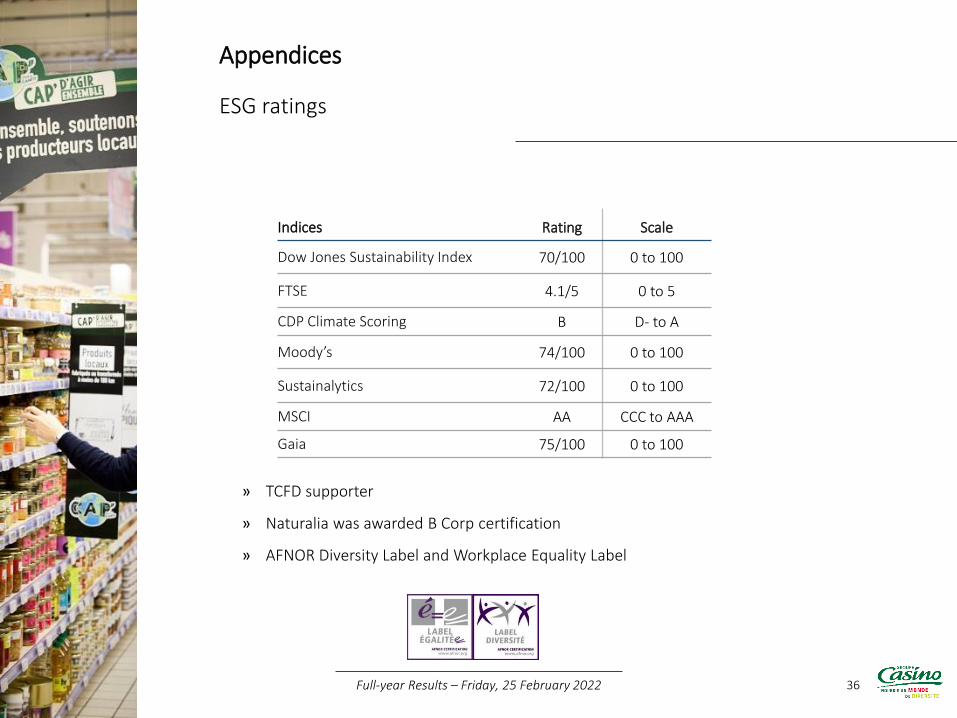
ESG ratings
» TCFD supporter
» Naturalia was awarded B Corp certification
» AFNOR Diversity Label and Workplace Equality Label
Appendices
Indices Rating Scale
Dow Jones Sustainability Index 70/100 0 to 100
FTSE 4.1/5 0 to 5
CDP Climate Scoring B D- to A
Moody’s 74/100 0 to 100
Sustainalytics 72/100 0 to 100
MSCI AA CCC to AAA
Gaia 75/100 0 to 100
Full-year Results – Friday, 25 February 2022
Full-year Results – Friday, 25 February 2022 37
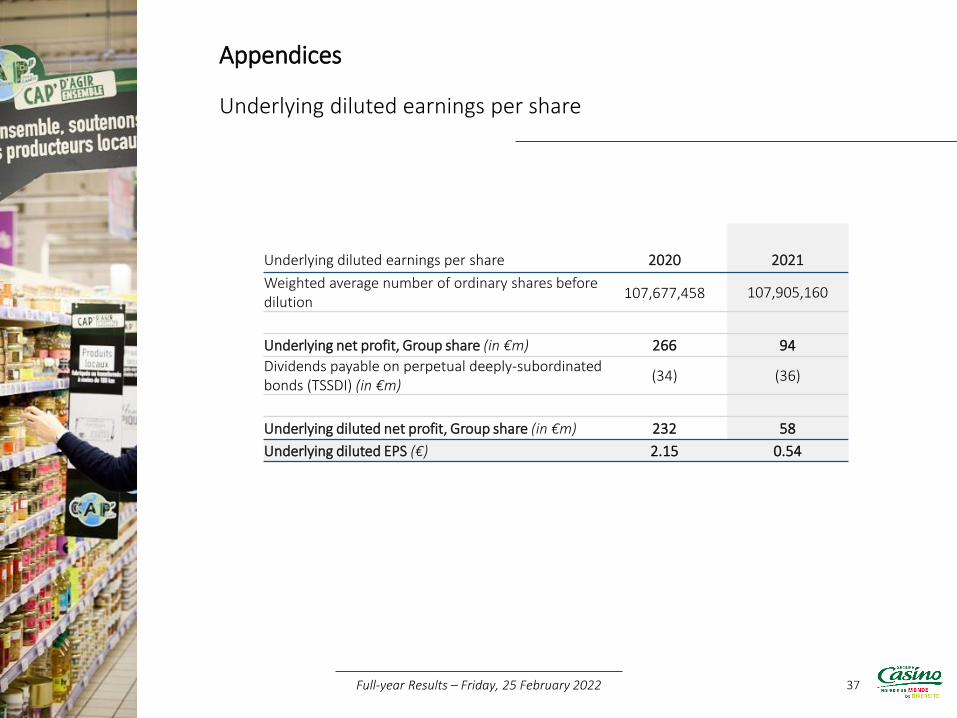
Underlying diluted earnings per share
Appendices
Underlying diluted earnings per share 2020 2021
Weighted average number of ordinary shares before dilution
107,677,458 107,905,160
Underlying net profit, Group share (in €m) 266 94
Dividends payable on perpetual deeply-subordinated bonds (TSSDI) (in €m)
(34) (36)
Underlying diluted net profit, Group share (in €m) 232 58
Underlying diluted EPS (€) 2.15 0.54
38
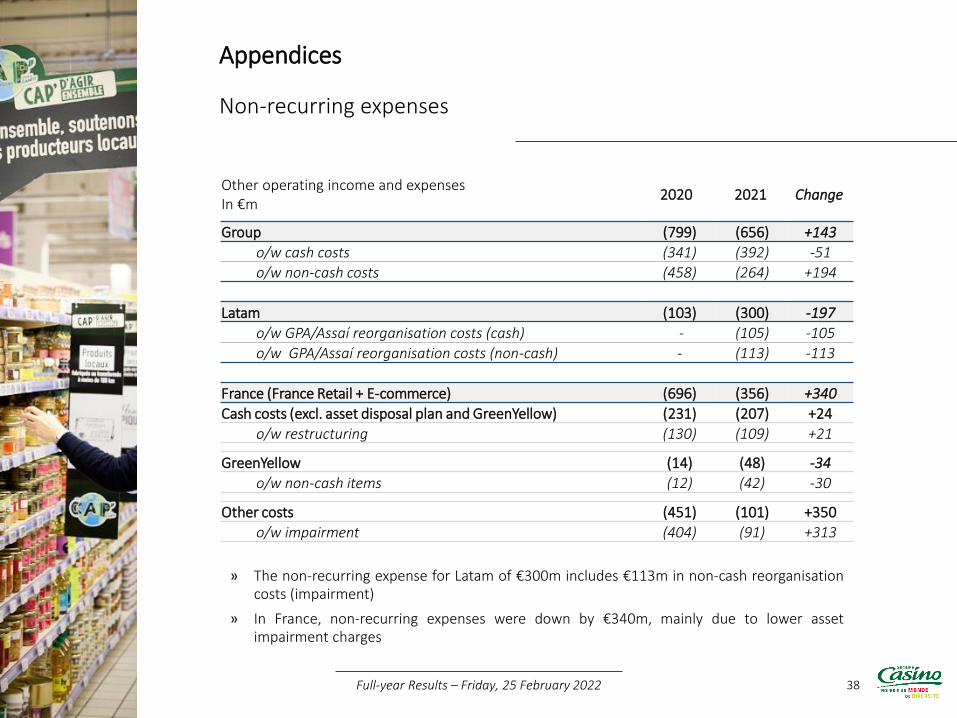
Non-recurring expenses
Appendices
Full-year Results – Friday, 25 February 2022
» The non-recurring expense for Latam of €300m includes €113m in non-cash reorganisationcosts (impairment)
» In France, non-recurring expenses were down by €340m, mainly due to lower assetimpairment charges
Other operating income and expensesIn €m
2020 2021 Change
Group (799) (656) +143
o/w cash costs (341) (392) -51
o/w non-cash costs (458) (264) +194
Latam (103) (300) -197
o/w GPA/Assaí reorganisation costs (cash) - (105) -105
o/w GPA/Assaí reorganisation costs (non-cash) - (113) -113
France (France Retail + E-commerce) (696) (356) +340
Cash costs (excl. asset disposal plan and GreenYellow) (231) (207) +24
o/w restructuring (130) (109) +21
GreenYellow (14) (48) -34
o/w non-cash items (12) (42) -30
Other costs (451) (101) +350
o/w impairment (404) (91) +313
39
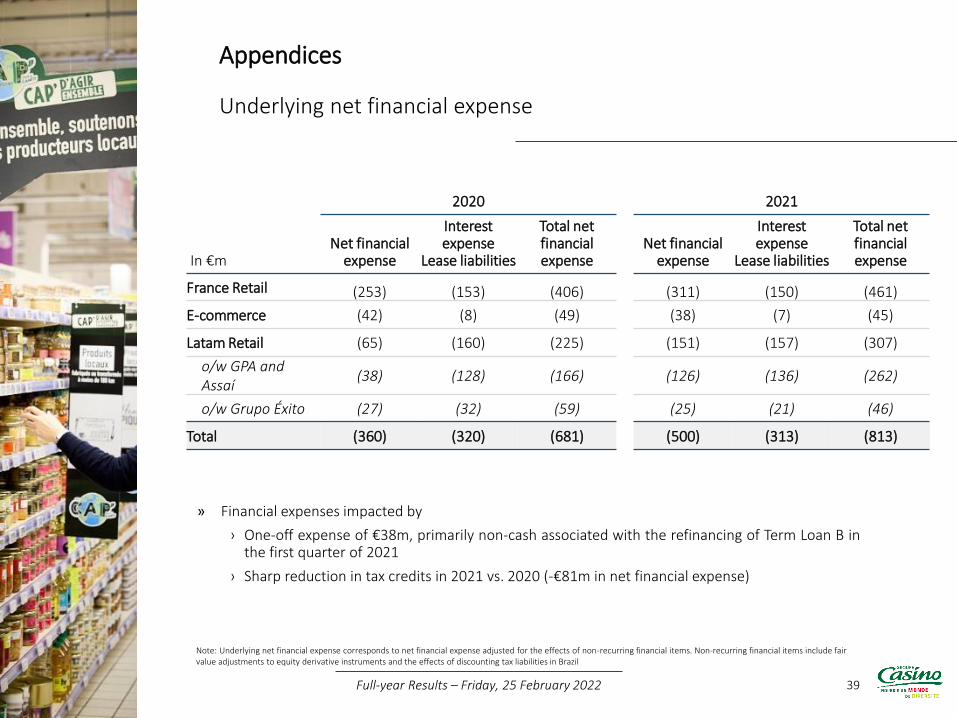
Underlying net financial expense
» Financial expenses impacted by
› One-off expense of €38m, primarily non-cash associated with the refinancing of Term Loan B inthe first quarter of 2021
› Sharp reduction in tax credits in 2021 vs. 2020 (-€81m in net financial expense)
Appendices
Note: Underlying net financial expense corresponds to net financial expense adjusted for the effects of non-recurring financial items. Non-recurring financial items include fair value adjustments to equity derivative instruments and the effects of discounting tax liabilities in Brazil
In €m
2020 2021
Net financial expense
Interest expense
Lease liabilities
Total net financial expense
Net financial expense
Interest expense
Lease liabilities
Total net financial expense
France Retail (253) (153) (406) (311) (150) (461)
E-commerce (42) (8) (49) (38) (7) (45)
Latam Retail (65) (160) (225) (151) (157) (307)
o/w GPA and Assaí
(38) (128) (166) (126) (136) (262)
o/w Grupo Éxito (27) (32) (59) (25) (21) (46)
Total (360) (320) (681) (500) (313) (813)
Full-year Results – Friday, 25 February 2022
40
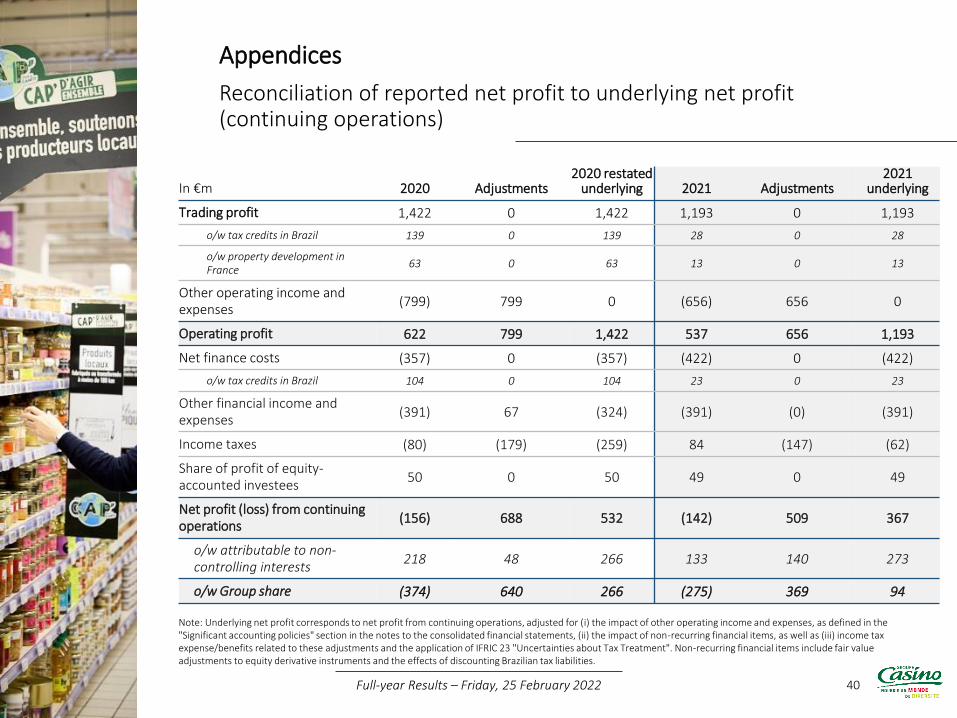
Reconciliation of reported net profit to underlying net profit (continuing operations)
Appendices
Note: Underlying net profit corresponds to net profit from continuing operations, adjusted for (i) the impact of other operating income and expenses, as defined in the "Significant accounting policies" section in the notes to the consolidated financial statements, (ii) the impact of non-recurring financial items, as well as (iii) income tax expense/benefits related to these adjustments and the application of IFRIC 23 "Uncertainties about Tax Treatment". Non-recurring financial items include fair value adjustments to equity derivative instruments and the effects of discounting Brazilian tax liabilities.
Full-year Results – Friday, 25 February 2022
In €m 2020 Adjustments2020 restated
underlying 2021 Adjustments2021
underlying
Trading profit 1,422 0 1,422 1,193 0 1,193
o/w tax credits in Brazil 139 0 139 28 0 28
o/w property development in France
63 0 63 13 0 13
Other operating income and expenses
(799) 799 0 (656) 656 0
Operating profit 622 799 1,422 537 656 1,193
Net finance costs (357) 0 (357) (422) 0 (422)
o/w tax credits in Brazil 104 0 104 23 0 23
Other financial income and expenses
(391) 67 (324) (391) (0) (391)
Income taxes (80) (179) (259) 84 (147) (62)
Share of profit of equity-accounted investees
50 0 50 49 0 49
Net profit (loss) from continuing operations
(156) 688 532 (142) 509 367
o/w attributable to non-controlling interests
218 48 266 133 140 273
o/w Group share (374) 640 266 (275) 369 94
41
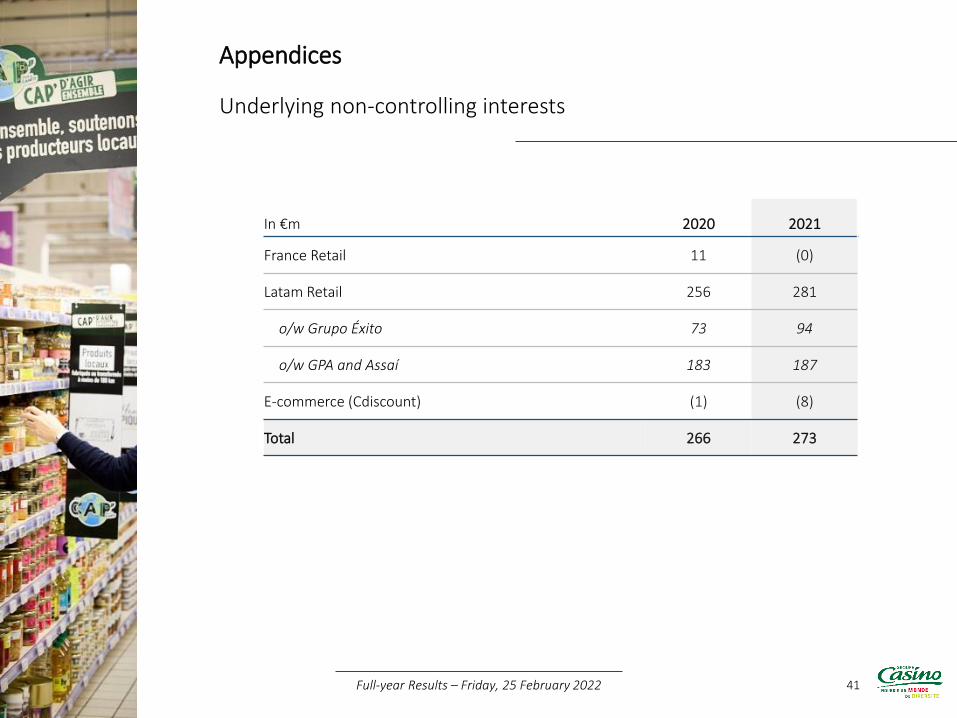
Underlying non-controlling interests
Appendices
In €m 2020 2021
France Retail 11 (0)
Latam Retail 256 281
o/w Grupo Éxito 73 94
o/w GPA and Assaí 183 187
E-commerce (Cdiscount) (1) (8)
Total 266 273
Full-year Results – Friday, 25 February 2022
42
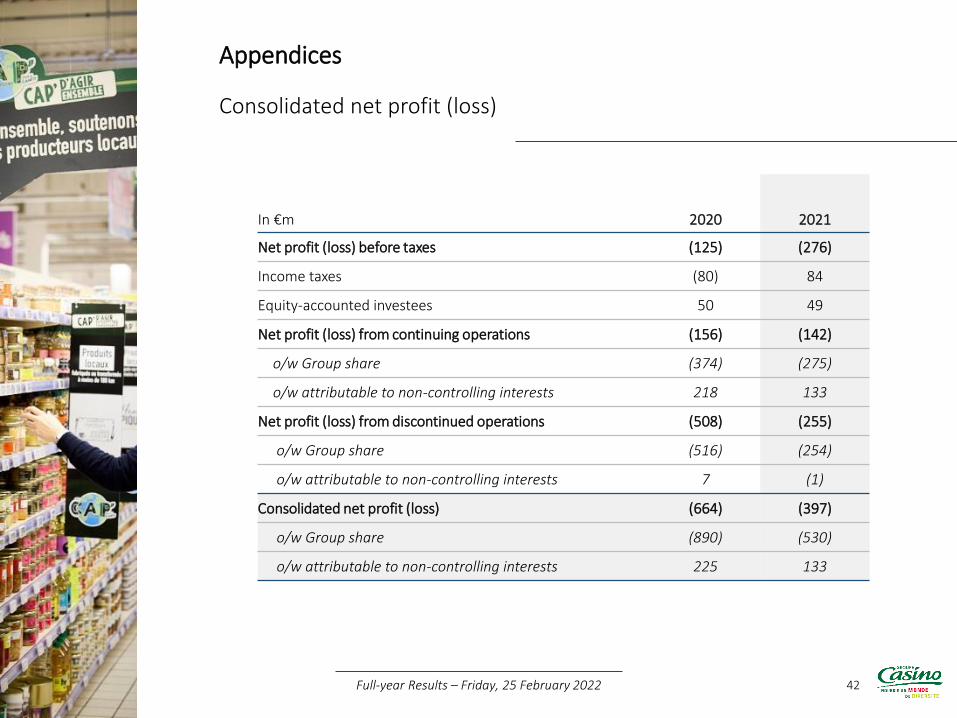
Consolidated net profit (loss)
Appendices
In €m 2020 2021
Net profit (loss) before taxes (125) (276)
Income taxes (80) 84
Equity-accounted investees 50 49
Net profit (loss) from continuing operations (156) (142)
o/w Group share (374) (275)
o/w attributable to non-controlling interests 218 133
Net profit (loss) from discontinued operations (508) (255)
o/w Group share (516) (254)
o/w attributable to non-controlling interests 7 (1)
Consolidated net profit (loss) (664) (397)
o/w Group share (890) (530)
o/w attributable to non-controlling interests 225 133
Full-year Results – Friday, 25 February 2022
43
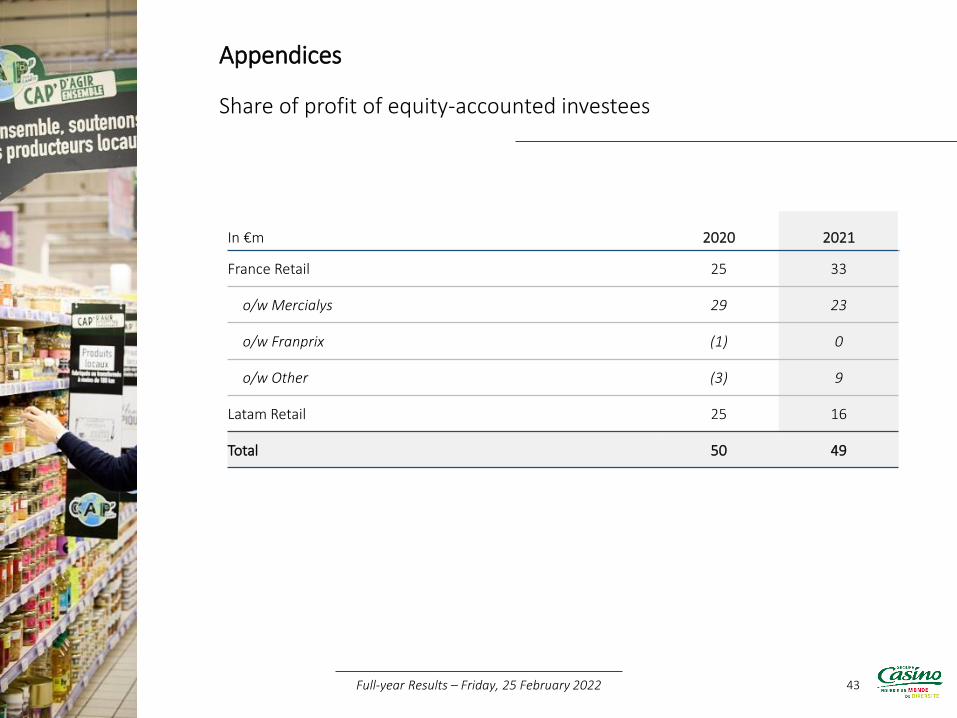
Share of profit of equity-accounted investees
Appendices
In €m 2020 2021
France Retail 25 33
o/w Mercialys 29 23
o/w Franprix (1) 0
o/w Other (3) 9
Latam Retail 25 16
Total 50 49
Full-year Results – Friday, 25 February 2022
44
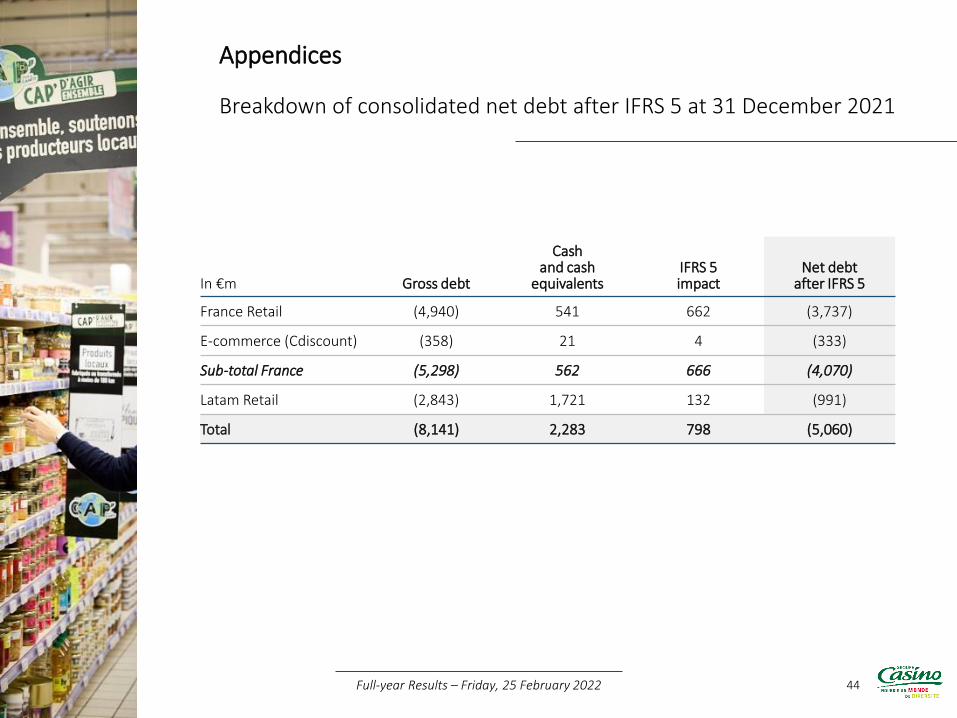
Breakdown of consolidated net debt after IFRS 5 at 31 December 2021
Appendices
In €m Gross debt
Cashand cash
equivalentsIFRS 5impact
Net debt after IFRS 5
France Retail (4,940) 541 662 (3,737)
E-commerce (Cdiscount) (358) 21 4 (333)
Sub-total France (5,298) 562 666 (4,070)
Latam Retail (2,843) 1,721 132 (991)
Total (8,141) 2,283 798 (5,060)
Full-year Results – Friday, 25 February 2022
45
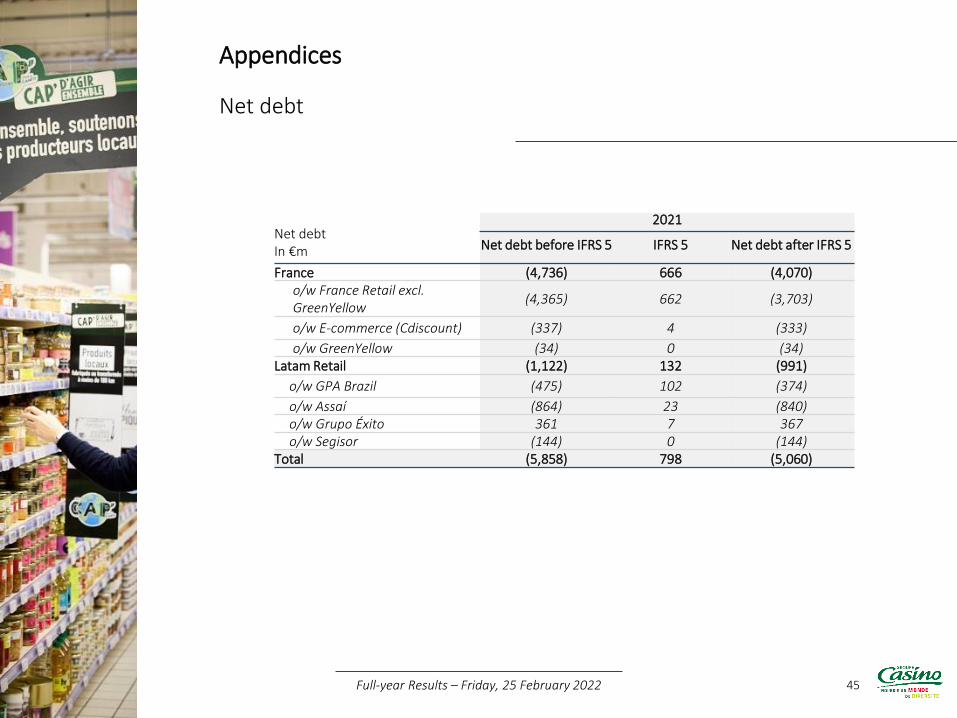
Net debt
Appendices
Net debtIn €m
2021
Net debt before IFRS 5 IFRS 5 Net debt after IFRS 5
France (4,736) 666 (4,070)o/w France Retail excl. GreenYellow
(4,365) 662 (3,703)
o/w E-commerce (Cdiscount) (337) 4 (333)
o/w GreenYellow (34) 0 (34)Latam Retail (1,122) 132 (991)
o/w GPA Brazil (475) 102 (374)
o/w Assaí (864) 23 (840)o/w Grupo Éxito 361 7 367 o/w Segisor (144) 0 (144)
Total (5,858) 798 (5,060)
Full-year Results – Friday, 25 February 2022
46
Consolidated income statement
Appendices
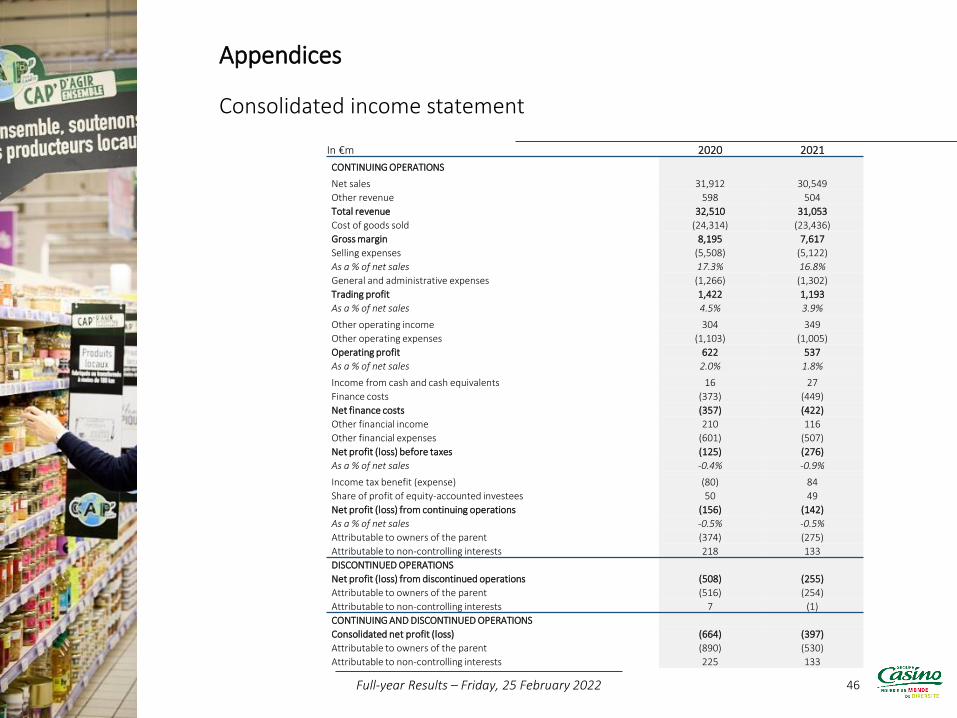
In €m 2020 2021
CONTINUING OPERATIONS
Net sales 31,912 30,549
Other revenue 598 504
Total revenue 32,510 31,053
Cost of goods sold (24,314) (23,436)
Gross margin 8,195 7,617
Selling expenses (5,508) (5,122)
As a % of net sales 17.3% 16.8%
General and administrative expenses (1,266) (1,302)
Trading profit 1,422 1,193
As a % of net sales 4.5% 3.9%
Other operating income 304 349
Other operating expenses (1,103) (1,005)
Operating profit 622 537
As a % of net sales 2.0% 1.8%
Income from cash and cash equivalents 16 27
Finance costs (373) (449)
Net finance costs (357) (422)
Other financial income 210 116
Other financial expenses (601) (507)
Net profit (loss) before taxes (125) (276)
As a % of net sales -0.4% -0.9%
Income tax benefit (expense) (80) 84
Share of profit of equity-accounted investees 50 49
Net profit (loss) from continuing operations (156) (142)
As a % of net sales -0.5% -0.5%
Attributable to owners of the parent (374) (275)
Attributable to non-controlling interests 218 133
DISCONTINUED OPERATIONS
Net profit (loss) from discontinued operations (508) (255)
Attributable to owners of the parent (516) (254)
Attributable to non-controlling interests 7 (1)
CONTINUING AND DISCONTINUED OPERATIONS
Consolidated net profit (loss) (664) (397)
Attributable to owners of the parent (890) (530)
Attributable to non-controlling interests 225 133
Full-year Results – Friday, 25 February 2022
47
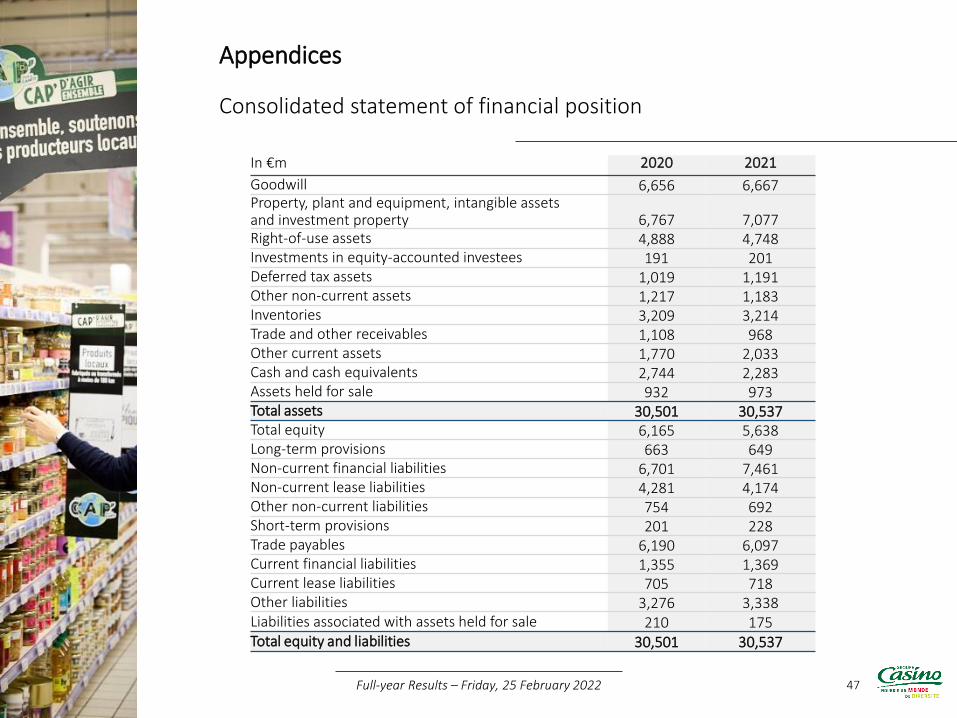
Consolidated statement of financial position
Appendices
In €m 2020 2021
Goodwill 6,656 6,667 Property, plant and equipment, intangible assetsand investment property 6,767 7,077 Right-of-use assets 4,888 4,748 Investments in equity-accounted investees 191 201 Deferred tax assets 1,019 1,191 Other non-current assets 1,217 1,183 Inventories 3,209 3,214 Trade and other receivables 1,108 968 Other current assets 1,770 2,033 Cash and cash equivalents 2,744 2,283 Assets held for sale 932 973Total assets 30,501 30,537 Total equity 6,165 5,638 Long-term provisions 663 649 Non-current financial liabilities 6,701 7,461 Non-current lease liabilities 4,281 4,174 Other non-current liabilities 754 692Short-term provisions 201 228 Trade payables 6,190 6,097 Current financial liabilities 1,355 1,369 Current lease liabilities 705 718 Other liabilities 3,276 3,338 Liabilities associated with assets held for sale 210 175 Total equity and liabilities 30,501 30,537
Full-year Results – Friday, 25 February 2022
48
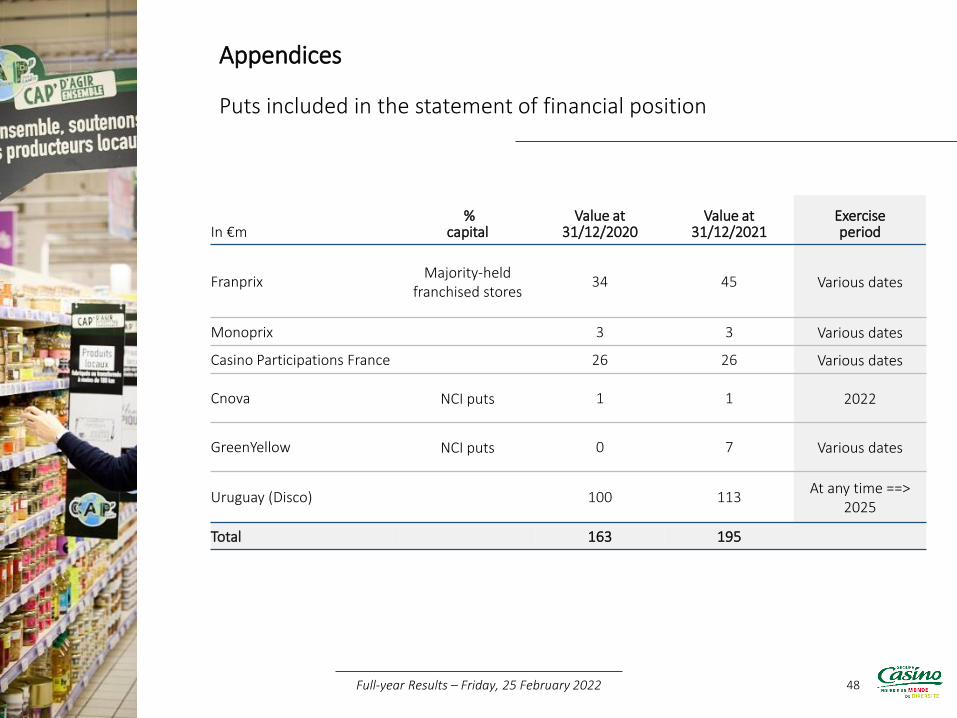
Puts included in the statement of financial position
Appendices
In €m%
capitalValue at
31/12/2020Value at
31/12/2021Exercise period
FranprixMajority-held
franchised stores34 45 Various dates
Monoprix 3 3 Various dates
Casino Participations France 26 26 Various dates
Cnova NCI puts 1 1 2022
GreenYellow NCI puts 0 7 Various dates
Uruguay (Disco) 100 113 At any time ==>
2025
Total 163 195
Full-year Results – Friday, 25 February 2022
49
Disclaimer
Appendices
This presentation contains forward-looking information and statements about Casino. Forward-lookingstatements are statements that are not historical facts. These statements include financial forecasts andestimates and their underlying assumptions, statements regarding plans, objectives, and expectationswith respect to future operations, products and services, and statements regarding futureperformance. Forward-looking statements are usually identified by the terms "expects", "anticipates","believes", "intends", "estimates", and other similar expressions. Although the management of Casinobelieves that the expectations reflected in such forward-looking statements are reasonable, investorsand holders of Casino securities are warned that this forward-looking information and these statementsare subject to various risks and uncertainties, many of which are difficult to predict and generallybeyond Casino’s control, and which could cause actual results and developments to differ materiallyfrom those expressed in, implied, or forecast by the forward-looking information and statements. Theserisks and uncertainties include those discussed or identified in Casino’s public filings with the Autoritédes Marchés Financiers (“AMF”), including those listed under “Risk Factors and Insurance” in theUniversal Registration Document filed by Casino on 31 March 2021. Except as required by applicablelaw, Casino makes no commitment to updating any forward-looking information or statements.
This presentation was prepared solely for information purposes, and must not be interpreted as asolicitation or an offer to purchase or sell transferable securities or related financial instruments.Similarly, it does not give and should not be treated as giving investment advice. It has no regard to thespecific investment objectives, financial situation or particular needs of any recipient. Norepresentation or warranty, either express or implied, is provided in relation to the accuracy,completeness or reliability of the information contained herein. Recipients should not consider it as asubstitute for the exercise of their own judgement. All the opinions expressed herein are subject tochange without notice. This presentation and its contents are proprietary information, and cannot bereproduced or disseminated in whole or in part without Casino Group's prior written consent.
Full-year Results – Friday, 25 February 2022


