Embed Size (px)
Citation preview

Investor Presentation
November 2021
2 INVESTOR PRESENTATION
Disclaimer
This presentation may contain forward-looking statements and comments relating to the objectives and strategy of Groupe BPCE. By their very nature,
these forward-looking statements inherently depend on assumptions, project considerations, objectives and expectations linked to future events, transactions, products and services as
well as on suppositions regarding future performance and synergies.
No guarantee can be given that such objectives will be realized; they are subject to inherent risks and uncertainties and are based on assumptions relating
to the Group, its subsidiaries and associates and the business development thereof; trends in the sector; future acquisitions and investments; macroeconomic conditions and conditions
in the Group’s principal local markets; competition and regulation. Occurrence of such events is not certain, and outcomes may prove different from current expectations, significantly
affecting expected results. Actual results may differ significantly from those anticipated or implied by the forward-looking statements. Groupe BPCE shall in no event have any obligation
to publish modifications or updates of such objectives.
Information in this presentation relating to parties other than Groupe BPCE or taken from external sources has not been subject to independent verification;
the Group makes no statement or commitment with respect to this third-party information and makes no warranty as to the accuracy, fairness, precision
or completeness of the information or opinions contained in this presentation. Neither Groupe BPCE nor its representatives shall be held liable for any errors
or omissions or for any harm resulting from the use of this presentation, the content of this presentation, or any document or information referred to in this presentation.
The financial information presented in this document relating to the fiscal period ended September 30, 2021, has been drawn up in compliance with IFRS standards, as adopted in the
European Union. This financial information is not the equivalent of summary financial statements for an interim period as defined by IAS 34 “Interim Financial Reporting”.
Preparation of the financial information requires Management to make estimates and assumptions in certain areas with regard to uncertain future events. These estimates are based onthe judgment of the individuals preparing this financial information and the information available at the balance sheet date. Actual future results may differ from these estimates.
The financial results contained in this presentation have not been reviewed by the statutory auditors.
The quarterly financial information of Groupe BPCE for the period ended September 30, 2021, approved by the Management Board at the meeting convened on November 2, 2021,were verified and reviewed by the Supervisory Board at a meeting convened on November 4, 2021.
3 INVESTOR PRESENTATION
A cooperative bank with a diversified business model, leading positions,and strong commitments to society
Delivering solid performance based on synergies and moderate risk appetite
Operating with robust capital ratios, strong loss-absorbing capacity and high credit ratings
Global and innovative issuer, committed to society
01
02
03
04
4
01A cooperative bank with a diversifiedbusiness model, leading positions, and strong commitments to society
5 INVESTOR PRESENTATION
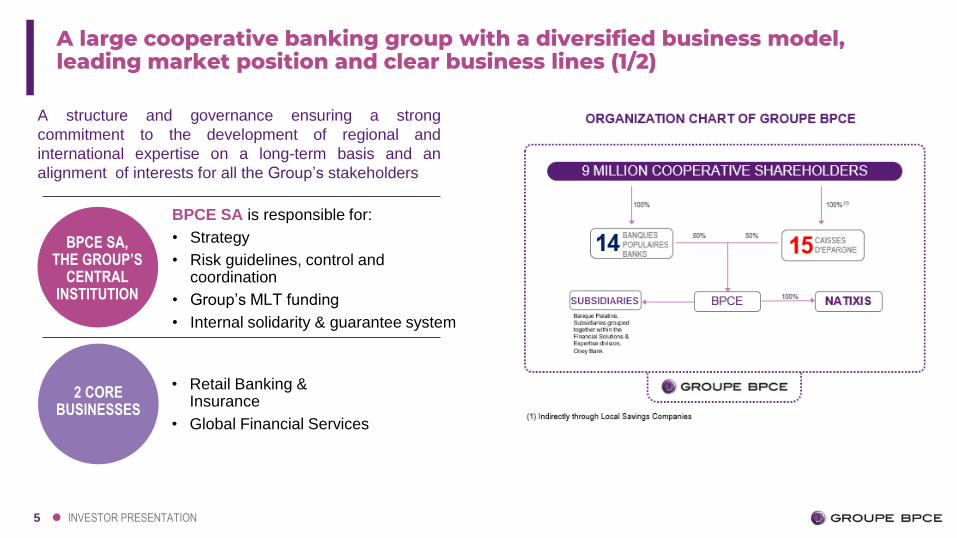
A large cooperative banking group with a diversified business model,leading market position and clear business lines (1/2)
BPCE SA,THE GROUP’S
CENTRAL INSTITUTION
BPCE SA is responsible for:
• Strategy
• Risk guidelines, control and coordination
• Group’s MLT funding
• Internal solidarity & guarantee system
2 CORE BUSINESSES
• Retail Banking & Insurance
• Global Financial Services
A structure and governance ensuring a strong
commitment to the development of regional and
international expertise on a long-term basis and an
alignment of interests for all the Group’s stakeholders
6 INVESTOR PRESENTATION
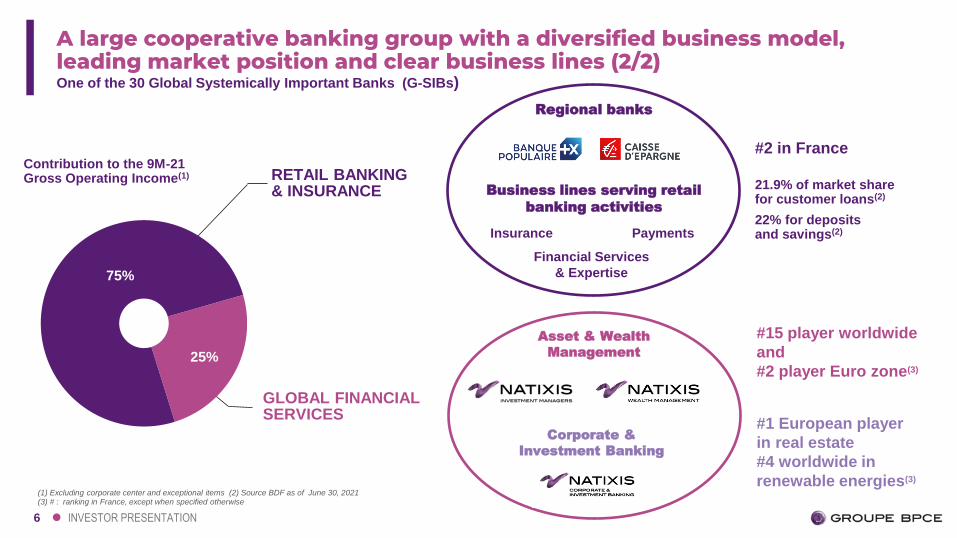
25%
75%
A large cooperative banking group with a diversified business model, leading market position and clear business lines (2/2)One of the 30 Global Systemically Important Banks (G-SIBs)
#2 in France
21.9% of market sharefor customer loans(2)
22% for depositsand savings(2)
#15 player worldwide
and
#2 player Euro zone(3)
(1) Excluding corporate center and exceptional items (2) Source BDF as of June 30, 2021(3) # : ranking in France, except when specified otherwise
#1 European player
in real estate
#4 worldwide in
renewable energies(3)
RETAIL BANKING & INSURANCE
Contribution to the 9M-21Gross Operating Income(1)
GLOBAL FINANCIAL SERVICES
Regional banks
Business lines serving retail
banking activities
Insurance Payments
Financial Services
& Expertise
Asset & Wealth
Management
Corporate &
Investment Banking
7 INVESTOR PRESENTATION
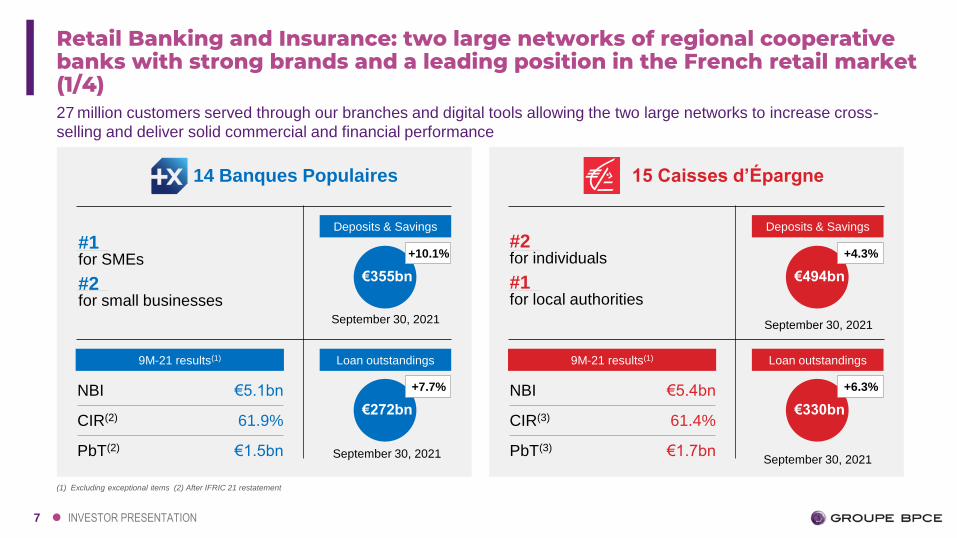
Retail Banking and Insurance: two large networks of regional cooperative banks with strong brands and a leading position in the French retail market (1/4) 27 million customers served through our branches and digital tools allowing the two large networks to increase cross-
selling and deliver solid commercial and financial performance
(1) Excluding exceptional items (2) After IFRIC 21 restatement
14 Banques Populaires
#1 for SMEs
#2 for small businesses
9M-21 results(1)
Deposits & Savings
NBI €5.1bn
CIR(2) 61.9%
PbT(2) €1.5bn
September 30, 2021
Loan outstandings
€355bn
+10.1%
€272bn
+7.7%
15 Caisses d’Épargne
#2 for individuals
#1 for local authorities
9M-21 results(1)
Deposits & Savings
NBI €5.4bn
CIR(3) 61.4%
PbT(3) €1.7bn
Loan outstandings
€494bn
+4.3%
€330bn
+6.3%
September 30, 2021
September 30, 2021
September 30, 2021
8 INVESTOR PRESENTATION
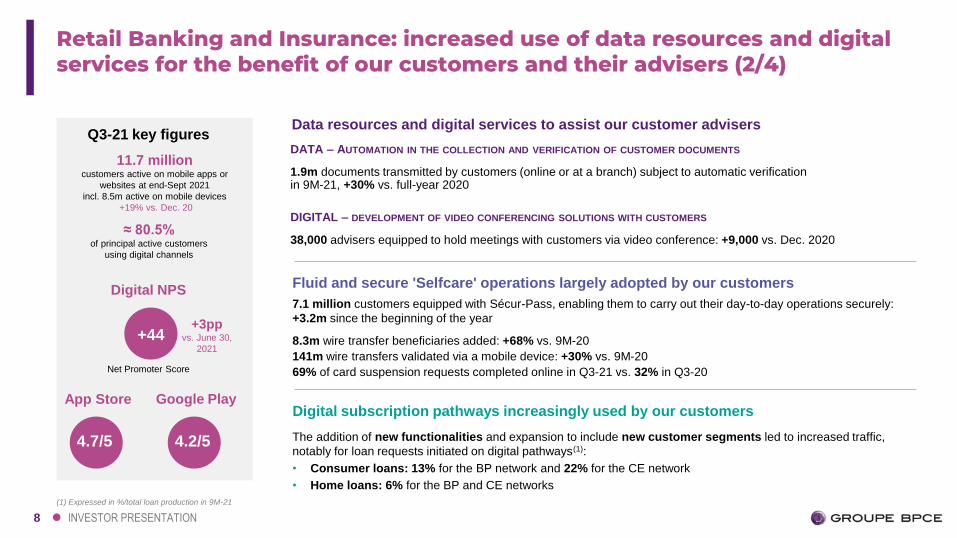
Q3-21 key figures
11.7 million customers active on mobile apps or
websites at end-Sept 2021
incl. 8.5m active on mobile devices
+19% vs. Dec. 20
≈ 80.5% of principal active customers
using digital channels
Net Promoter Score
+44
Digital NPS
4.7/5
App Store
DATA – AUTOMATION IN THE COLLECTION AND VERIFICATION OF CUSTOMER DOCUMENTS
1.9m documents transmitted by customers (online or at a branch) subject to automatic verification in 9M-21, +30% vs. full-year 2020
DIGITAL – DEVELOPMENT OF VIDEO CONFERENCING SOLUTIONS WITH CUSTOMERS
38,000 advisers equipped to hold meetings with customers via video conference: +9,000 vs. Dec. 2020
Data resources and digital services to assist our customer advisers
4.2/5
Google Play
Fluid and secure 'Selfcare' operations largely adopted by our customers
7.1 million customers equipped with Sécur-Pass, enabling them to carry out their day-to-day operations securely:
+3.2m since the beginning of the year
8.3m wire transfer beneficiaries added: +68% vs. 9M-20
141m wire transfers validated via a mobile device: +30% vs. 9M-20
69% of card suspension requests completed online in Q3-21 vs. 32% in Q3-20
Digital subscription pathways increasingly used by our customers
The addition of new functionalities and expansion to include new customer segments led to increased traffic,
notably for loan requests initiated on digital pathways(1):
• Consumer loans: 13% for the BP network and 22% for the CE network
• Home loans: 6% for the BP and CE networks
+3ppvs. June 30,
2021
(1) Expressed in %/total loan production in 9M-21
Retail Banking and Insurance: increased use of data resources and digital services for the benefit of our customers and their advisers (2/4)
9 INVESTOR PRESENTATION
9M-20 9M-21
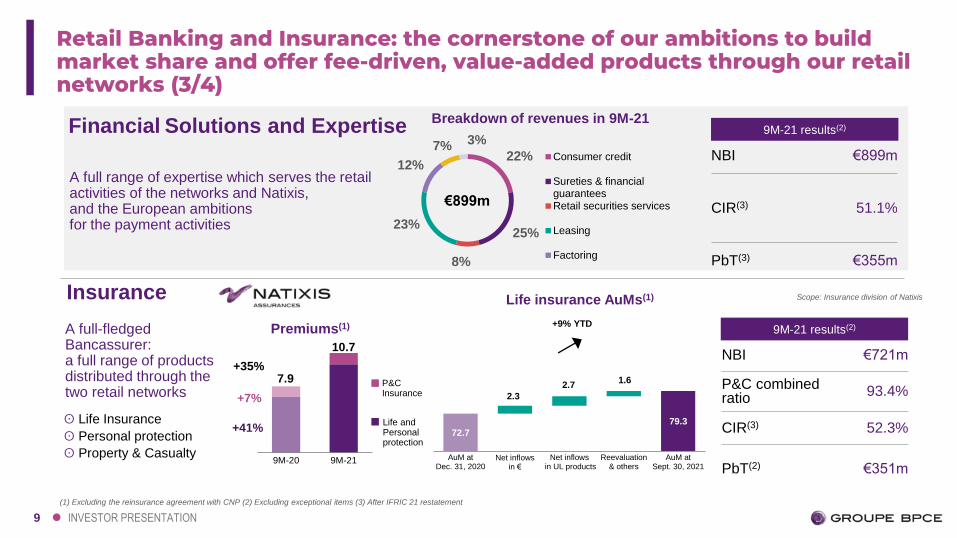
Retail Banking and Insurance: the cornerstone of our ambitions to build market share and offer fee-driven, value-added products through our retail networks (3/4)
Financial Solutions and Expertise
A full range of expertise which serves the retail activities of the networks and Natixis, and the European ambitions for the payment activities
A full-fledged Bancassurer: a full range of products distributed through the two retail networks
9M-21 results(2)
NBI €721m
P&C combined ratio
93.4%
CIR(3) 52.3%
PbT(2) €351m
ʘ Life Insurance
ʘ Personal protection
ʘ Property & Casualty
Insurance
9M-21 results(2)
NBI €899m
CIR(3) 51.1%
PbT(3) €355m
Breakdown of revenues in 9M-21
€899m
Premiums(1)
+7%
+35%7.9
10.7
P&C Insurance
Life andPersonal protection
(1) Excluding the reinsurance agreement with CNP (2) Excluding exceptional items (3) After IFRIC 21 restatement
Scope: Insurance division of Natixis
+41%
22%
25%
8%
23%
12%
7% 3%
Consumer credit
Sureties & financialguaranteesRetail securities services
Leasing
Factoring
72.777.7 79.3
2.3
2.71.6
AuM atDec. 31, 2020
Net inflows in €
Net inflows in UL products
Reevaluation& others
AuM atSept. 30, 2021
+9% YTD
Life insurance AuMs(1)
10 INVESTOR PRESENTATION
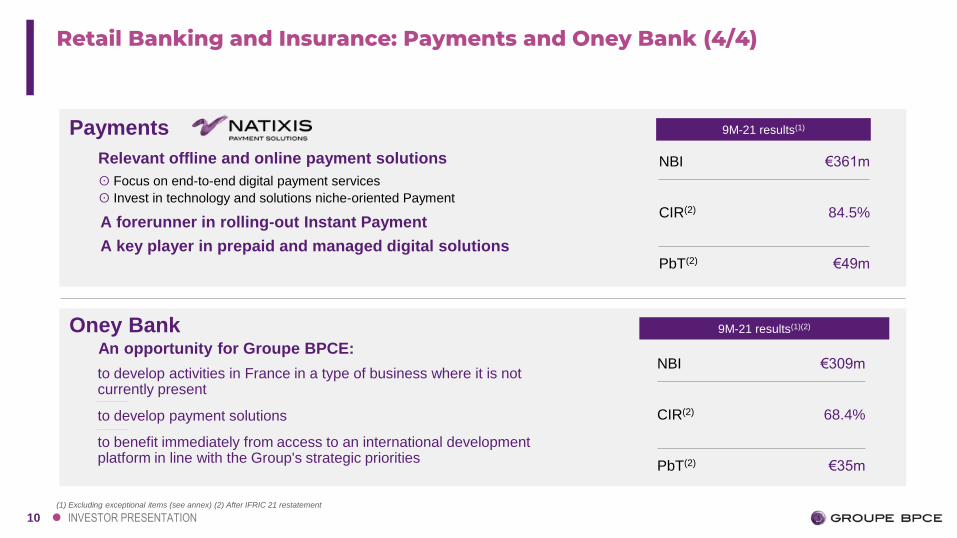
to develop activities in France in a type of business where it is not currently present
to develop payment solutions
to benefit immediately from access to an international development platform in line with the Group's strategic priorities
An opportunity for Groupe BPCE:
Retail Banking and Insurance: Payments and Oney Bank (4/4)
Relevant offline and online payment solutions
ʘ Focus on end-to-end digital payment services
ʘ Invest in technology and solutions niche-oriented Payment
A forerunner in rolling-out Instant Payment
A key player in prepaid and managed digital solutions
Payments
Oney Bank
9M-21 results(1)
NBI €361m
CIR(2) 84.5%
PbT(2) €49m
9M-21 results(1)(2)
NBI €309m
CIR(2) 68.4%
PbT(2) €35m
(1) Excluding exceptional items (see annex) (2) After IFRIC 21 restatement
11 INVESTOR PRESENTATION
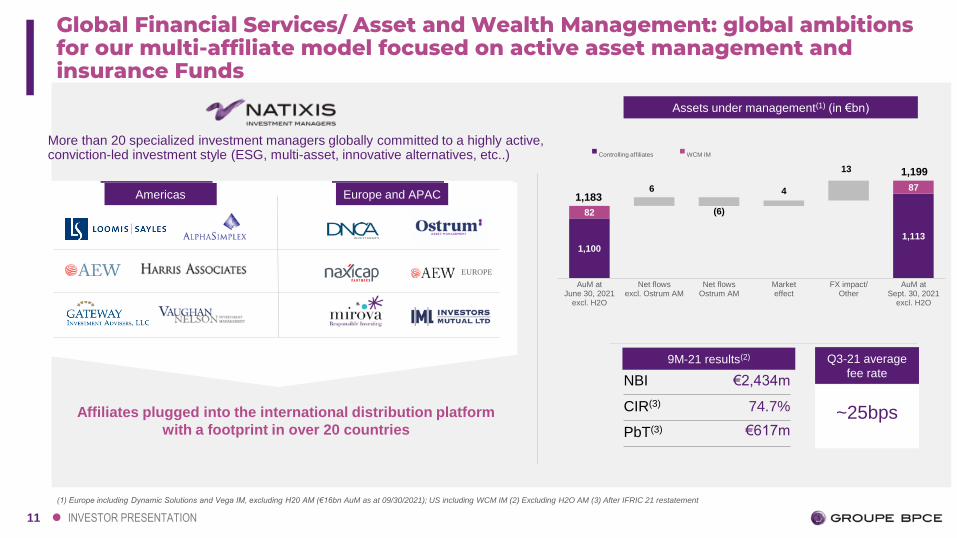
(3)
1,100
1,113
82
6
(6)
4
13
87
AuM atJune 30, 2021
excl. H2O
Net flowsexcl. Ostrum AM
Net flowsOstrum AM
Marketeffect
FX impact/Other
AuM atSept. 30, 2021
excl. H2O
Controlling affiliates WCM IM
Global Financial Services/ Asset and Wealth Management: global ambitions for our multi-affiliate model focused on active asset management and insurance Funds
More than 20 specialized investment managers globally committed to a highly active, conviction-led investment style (ESG, multi-asset, innovative alternatives, etc..)
Q3-21 average
fee rate
2243~25bps
Assets under management(1) (in €bn)
Affiliates plugged into the international distribution platform
with a footprint in over 20 countries
Americas Europe and APAC
EUROPE
9M-21 results(2)
NBI €2,434m
CIR(3) 74.7%
PbT(3) €617m
1,183
1,199
Americas Europe and APAC
EUROPE
(1) Europe including Dynamic Solutions and Vega IM, excluding H20 AM (€16bn AuM as at 09/30/2021); US including WCM IM (2) Excluding H2O AM (3) After IFRIC 21 restatement
12 INVESTOR PRESENTATION
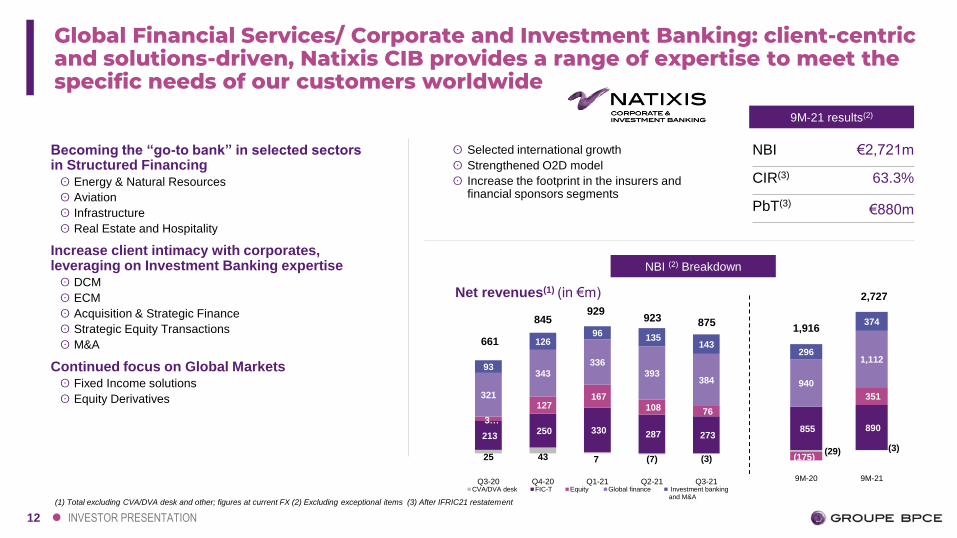
Global Financial Services/ Corporate and Investment Banking: client-centric and solutions-driven, Natixis CIB provides a range of expertise to meet the specific needs of our customers worldwide
9M-21 results(2)
NBI €2,721m
CIR(3) 63.3%
PbT(3)€880m
ʘ Selected international growth
ʘ Strengthened O2D model
ʘ Increase the footprint in the insurers and financial sponsors segments
Becoming the “go-to bank” in selected sectorsin Structured Financingʘ Energy & Natural Resources
ʘ Aviation
ʘ Infrastructure
ʘ Real Estate and Hospitality
Increase client intimacy with corporates, leveraging on Investment Banking expertiseʘ DCM
ʘ ECM
ʘ Acquisition & Strategic Finance
ʘ Strategic Equity Transactions
ʘ M&A
Continued focus on Global Marketsʘ Fixed Income solutions
ʘ Equity Derivatives
NBI (2) Breakdown
Net revenues(1) (in €m)
(1) Total excluding CVA/DVA desk and other; figures at current FX (2) Excluding exceptional items (3) After IFRIC21 restatement
661
845929
9231,916
2,727
25 43 7 (7) (3)
213250 330 287 273
3…
127167
108 76
321
343
336
393384
93
12696
135143
Q3-20 Q4-20 Q1-21 Q2-21 Q3-21CVA/DVA desk FIC-T Equity Global finance Investment banking
and M&A
(29) (3)
855 890
(175)
351
940
1,112296
374
9M-20 9M-21
875
13 INVESTOR PRESENTATION
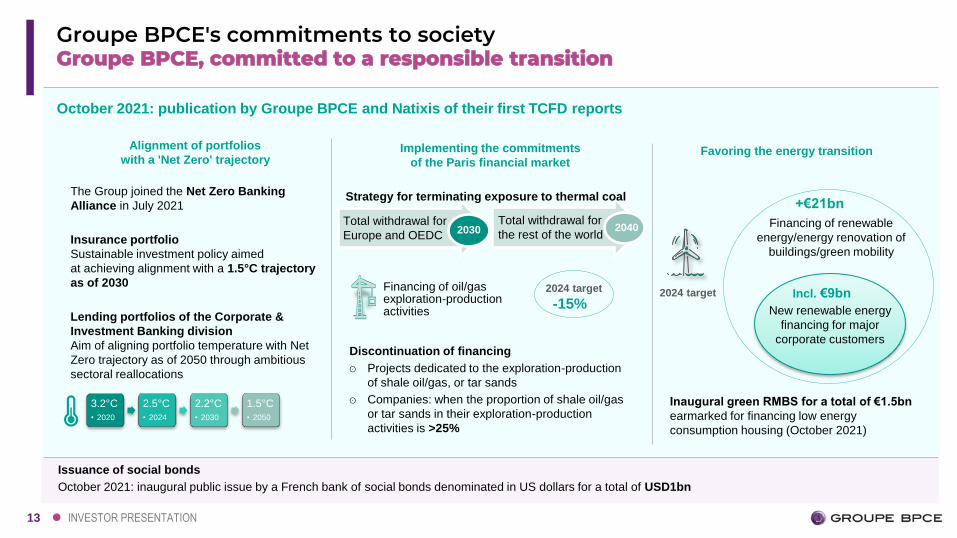
2030 2040
Financing of oil/gas exploration-production activities
Groupe BPCE, committed to a responsible transitionGroupe BPCE's commitments to society
Issuance of social bonds
October 2021: inaugural public issue by a French bank of social bonds denominated in US dollars for a total of USD1bn
October 2021: publication by Groupe BPCE and Natixis of their first TCFD reports
Alignment of portfolios
with a 'Net Zero' trajectory
The Group joined the Net Zero Banking
Alliance in July 2021
Insurance portfolio
Sustainable investment policy aimed
at achieving alignment with a 1.5°C trajectory
as of 2030
Lending portfolios of the Corporate &
Investment Banking division
Aim of aligning portfolio temperature with Net
Zero trajectory as of 2050 through ambitious
sectoral reallocations
Favoring the energy transition Implementing the commitments
of the Paris financial market
Strategy for terminating exposure to thermal coal
3.2°C
• 2020
2.5°C
• 2024
2.2°C
• 2030
1.5°C
• 2050
Incl. €9bn
New renewable energy
financing for major
corporate customers
+€21bn
Financing of renewable
energy/energy renovation of
buildings/green mobility
2024 target-15%
Discontinuation of financing
ʘ Projects dedicated to the exploration-production
of shale oil/gas, or tar sands
ʘ Companies: when the proportion of shale oil/gas
or tar sands in their exploration-production
activities is >25%
2024 target
Inaugural green RMBS for a total of €1.5bn
earmarked for financing low energy
consumption housing (October 2021)
Total withdrawal for
Europe and OEDC
Total withdrawal for
the rest of the world
14
02Delivering solid performance based on synergies and moderate risk appetite
15 INVESTOR PRESENTATION
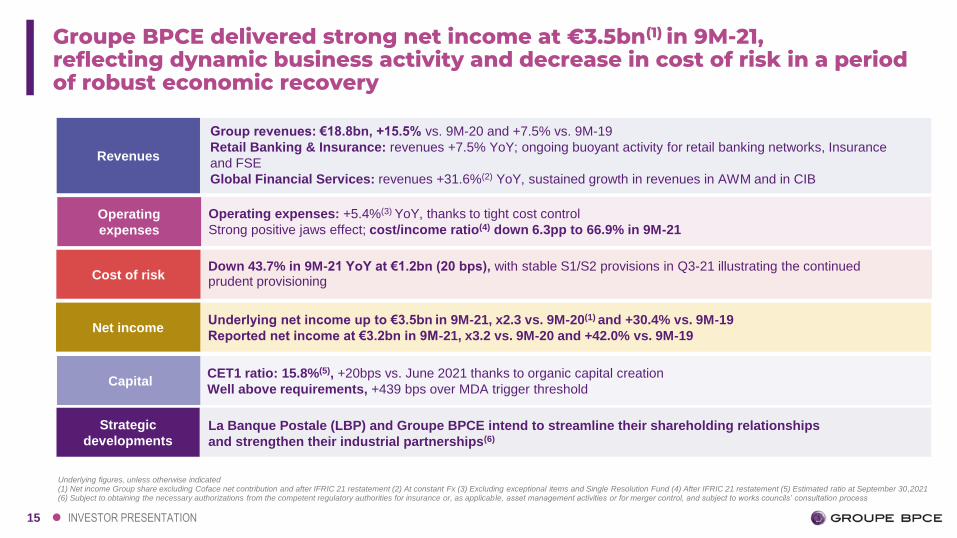
Groupe BPCE delivered strong net income at €3.5bn(1) in 9M-21, reflecting dynamic business activity and decrease in cost of risk in a period of robust economic recovery
Revenues
Group revenues: €18.8bn, +15.5% vs. 9M-20 and +7.5% vs. 9M-19
Retail Banking & Insurance: revenues +7.5% YoY; ongoing buoyant activity for retail banking networks, Insurance
and FSE
Global Financial Services: revenues +31.6%(2) YoY, sustained growth in revenues in AWM and in CIB
Operating
expenses
Operating expenses: +5.4%(3) YoY, thanks to tight cost control
Strong positive jaws effect; cost/income ratio(4) down 6.3pp to 66.9% in 9M-21
Cost of riskDown 43.7% in 9M-21 YoY at €1.2bn (20 bps), with stable S1/S2 provisions in Q3-21 illustrating the continued prudent provisioning
Underlying net income up to €3.5bn in 9M-21, x2.3 vs. 9M-20(1) and +30.4% vs. 9M-19
Reported net income at €3.2bn in 9M-21, x3.2 vs. 9M-20 and +42.0% vs. 9M-19Net income
Underlying figures, unless otherwise indicated (1) Net income Group share excluding Coface net contribution and after IFRIC 21 restatement (2) At constant Fx (3) Excluding exceptional items and Single Resolution Fund (4) After IFRIC 21 restatement (5) Estimated ratio at September 30,2021(6) Subject to obtaining the necessary authorizations from the competent regulatory authorities for insurance or, as applicable, asset management activities or for merger control, and subject to works councils’ consultation process
CapitalCET1 ratio: 15.8%(5), +20bps vs. June 2021 thanks to organic capital creation
Well above requirements, +439 bps over MDA trigger threshold
Strategic
developmentsLa Banque Postale (LBP) and Groupe BPCE intend to streamline their shareholding relationships
and strengthen their industrial partnerships(6)
16 INVESTOR PRESENTATION
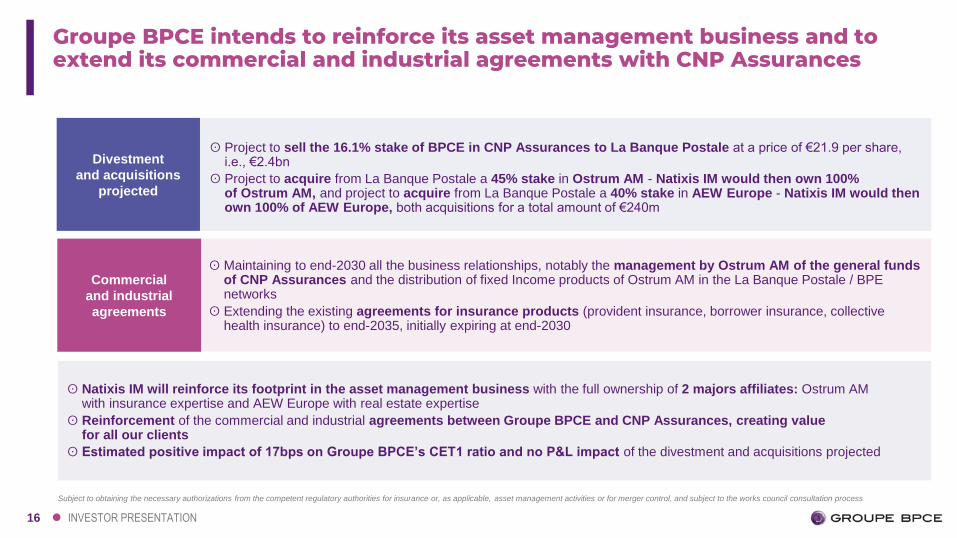
Groupe BPCE intends to reinforce its asset management business and to extend its commercial and industrial agreements with CNP Assurances
Divestment
and acquisitions
projected
ʘ Project to sell the 16.1% stake of BPCE in CNP Assurances to La Banque Postale at a price of €21.9 per share, i.e., €2.4bn
ʘ Project to acquire from La Banque Postale a 45% stake in Ostrum AM - Natixis IM would then own 100% of Ostrum AM, and project to acquire from La Banque Postale a 40% stake in AEW Europe - Natixis IM would then own 100% of AEW Europe, both acquisitions for a total amount of €240m
Commercial
and industrial
agreements
Subject to obtaining the necessary authorizations from the competent regulatory authorities for insurance or, as applicable, asset management activities or for merger control, and subject to the works council consultation process
ʘ Natixis IM will reinforce its footprint in the asset management business with the full ownership of 2 majors affiliates: Ostrum AM with insurance expertise and AEW Europe with real estate expertise
ʘ Reinforcement of the commercial and industrial agreements between Groupe BPCE and CNP Assurances, creating value for all our clients
ʘ Estimated positive impact of 17bps on Groupe BPCE’s CET1 ratio and no P&L impact of the divestment and acquisitions projected
ʘ Maintaining to end-2030 all the business relationships, notably the management by Ostrum AM of the general funds of CNP Assurances and the distribution of fixed Income products of Ostrum AM in the La Banque Postale / BPE networks
ʘ Extending the existing agreements for insurance products (provident insurance, borrower insurance, collective health insurance) to end-2035, initially expiring at end-2030
17 INVESTOR PRESENTATION
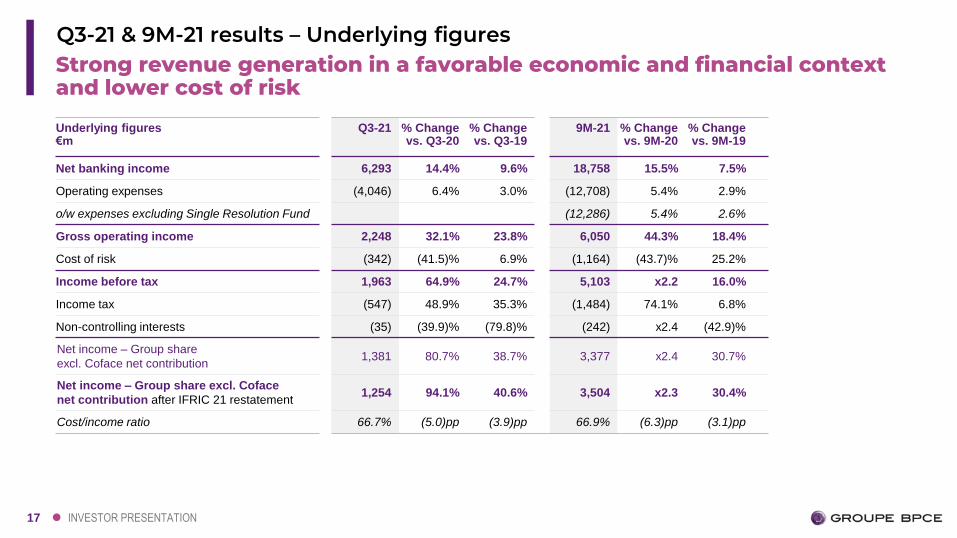
Strong revenue generation in a favorable economic and financial context and lower cost of risk
Q3-21 & 9M-21 results – Underlying figures
Underlying figures€m
Q3-21 % Change vs. Q3-20
% Change vs. Q3-19
9M-21 % Change vs. 9M-20
% Change vs. 9M-19
Net banking income 6,293 14.4% 9.6% 18,758 15.5% 7.5%
Operating expenses (4,046) 6.4% 3.0% (12,708) 5.4% 2.9%
o/w expenses excluding Single Resolution Fund (12,286) 5.4% 2.6%
Gross operating income 2,248 32.1% 23.8% 6,050 44.3% 18.4%
Cost of risk (342) (41.5)% 6.9% (1,164) (43.7)% 25.2%
Income before tax 1,963 64.9% 24.7% 5,103 x2.2 16.0%
Income tax (547) 48.9% 35.3% (1,484) 74.1% 6.8%
Non-controlling interests (35) (39.9)% (79.8)% (242) x2.4 (42.9)%
Net income – Group share
excl. Coface net contribution1,381 80.7% 38.7% 3,377 x2.4 30.7%
Net income – Group share excl. Coface
net contribution after IFRIC 21 restatement1,254 94.1% 40.6% 3,504 x2.3 30.4%
Cost/income ratio 66.7% (5.0)pp (3.9)pp 66.9% (6.3)pp (3.1)pp
18 INVESTOR PRESENTATION
1139
930
6 9 (18) 20(1)
112
124
112 65
478 29
116
28
5
2613
36
5 (1)4 15 3
17
20
10
13
2019 17
1518
84455
229591
92 (14) 26
767104
420
526356
332
398 345 316
1,302
1,060
Q1-20 Q2-20 Q3-20 Q4-20 Q1-21 Q2-21 Q3-21 9M-20 9M-21
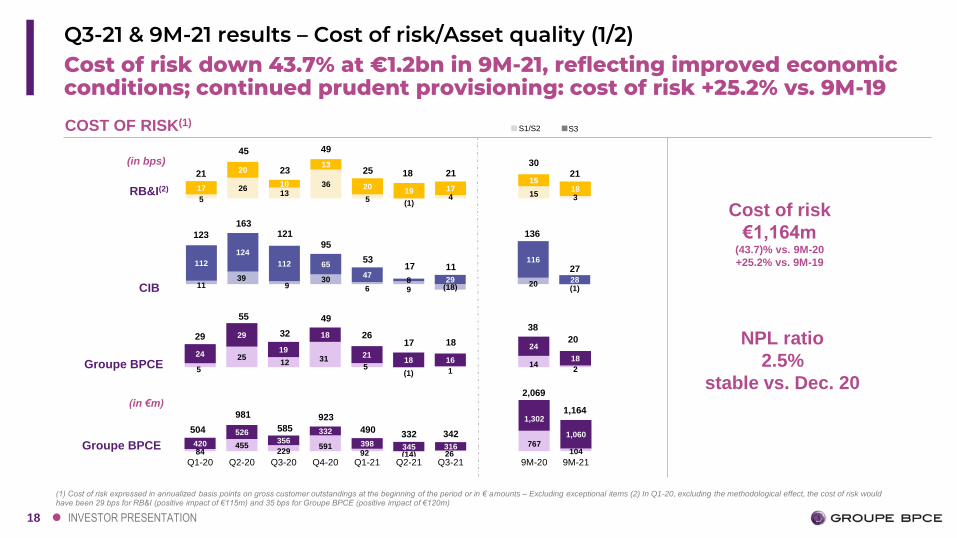
Cost of risk down 43.7% at €1.2bn in 9M-21, reflecting improved economic conditions; continued prudent provisioning: cost of risk +25.2% vs. 9M-19
(1) Cost of risk expressed in annualized basis points on gross customer outstandings at the beginning of the period or in € amounts – Excluding exceptional items (2) In Q1-20, excluding the methodological effect, the cost of risk would have been 29 bps for RB&I (positive impact of €115m) and 35 bps for Groupe BPCE (positive impact of €120m)
COST OF RISK(1)
Q3-21 & 9M-21 results – Cost of risk/Asset quality (1/2)
Groupe BPCE
Groupe BPCE
CIB
(in bps)
(in €m)
Cost of risk
€1,164m(43.7)% vs. 9M-20
+25.2% vs. 9M-19
NPL ratio
2.5%
stable vs. Dec. 20
981
585
923
5
2512 31
5(1) 1
142
24
29
19
18
2118 16
24
18
17
55
32
49
136163
18
45
23
49
S3S1/S2
25
12195
53
26
490332
2,069
1,164
38
20
17 27
3021
504
29
123
21
RB&I(2)
342
18
11
21
19 INVESTOR PRESENTATION
30%
8%
27%4%
6%
4%
19%
1%
1%
Individual customers
Small businesses
Corporate customers
Financial institutions
Local governments
Central administrations
Central banks and other sovereign exposures
Securitization
Equities
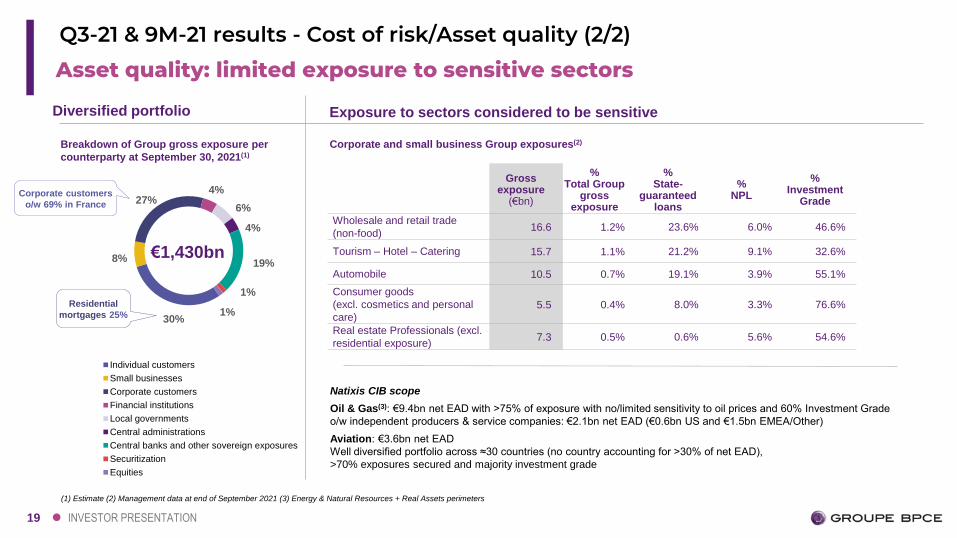
Asset quality: limited exposure to sensitive sectors
Q3-21 & 9M-21 results - Cost of risk/Asset quality (2/2)
Breakdown of Group gross exposure per
counterparty at September 30, 2021(1)
Diversified portfolio
(1) Estimate (2) Management data at end of September 2021 (3) Energy & Natural Resources + Real Assets perimeters
Corporate customers
o/w 69% in France
Residential
mortgages 25%
Exposure to sectors considered to be sensitive
Corporate and small business Group exposures(2)
Gross exposure
(€bn)
% Total Group
gross exposure
% State-
guaranteed loans
% NPL
% Investment
Grade
Wholesale and retail trade
(non-food) 16.6 1.2% 23.6% 6.0% 46.6%
Tourism – Hotel – Catering 15.7 1.1% 21.2% 9.1% 32.6%
Automobile 10.5 0.7% 19.1% 3.9% 55.1%
Consumer goods
(excl. cosmetics and personal
care)5.5 0.4% 8.0% 3.3% 76.6%
Real estate Professionals (excl.
residential exposure)7.3 0.5% 0.6% 5.6% 54.6%
Natixis CIB scope
Oil & Gas(3): €9.4bn net EAD with >75% of exposure with no/limited sensitivity to oil prices and 60% Investment Grade
o/w independent producers & service companies: €2.1bn net EAD (€0.6bn US and €1.5bn EMEA/Other)
Aviation: €3.6bn net EAD
Well diversified portfolio across ≈30 countries (no country accounting for >30% of net EAD),
>70% exposures secured and majority investment grade
€1,430bn
20
03Operating with robust capital ratios, strong loss-absorbing capacityand high credit ratings
21 INVESTOR PRESENTATION
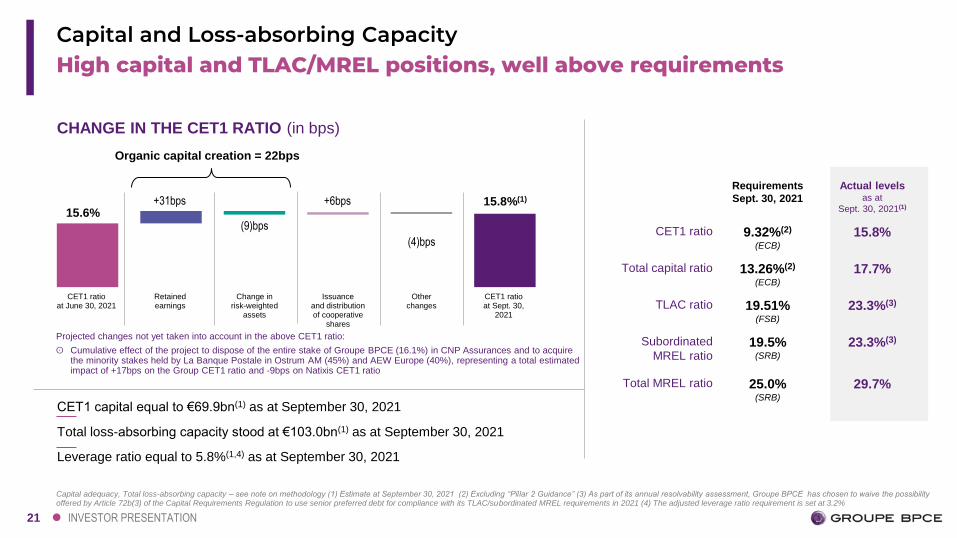
Requirements
Sept. 30, 2021
Actual levelsas at
Sept. 30, 2021(1)
CET1 ratio 9.32%(2)
(ECB)
15.8%
Total capital ratio 13.26%(2)
(ECB)
17.7%
TLAC ratio 19.51%(FSB)
23.3%(3)
Subordinated
MREL ratio19.5%
(SRB)
23.3%(3)
Total MREL ratio 25.0%(SRB)
29.7%
CET1 capital equal to €69.9bn(1) as at September 30, 2021
Total loss-absorbing capacity stood at €103.0bn(1) as at September 30, 2021
Leverage ratio equal to 5.8%(1,4) as at September 30, 2021
High capital and TLAC/MREL positions, well above requirementsCapital and Loss-absorbing Capacity
+31bps +6bps
(9)bps
(4)bps
CET1 ratioat June 30, 2021
Retainedearnings
Change inrisk-weighted
assets
Issuanceand distributionof cooperative
shares
Otherchanges
CET1 ratioat Sept. 30,
2021
15.6%
CHANGE IN THE CET1 RATIO (in bps)
Capital adequacy, Total loss-absorbing capacity – see note on methodology (1) Estimate at September 30, 2021 (2) Excluding “Pillar 2 Guidance” (3) As part of its annual resolvability assessment, Groupe BPCE has chosen to waive the possibility offered by Article 72b(3) of the Capital Requirements Regulation to use senior preferred debt for compliance with its TLAC/subordinated MREL requirements in 2021 (4) The adjusted leverage ratio requirement is set at 3.2%
Organic capital creation = 22bps
15.8%(1)
Projected changes not yet taken into account in the above CET1 ratio:
ʘ Cumulative effect of the project to dispose of the entire stake of Groupe BPCE (16.1%) in CNP Assurances and to acquire the minority stakes held by La Banque Postale in Ostrum AM (45%) and AEW Europe (40%), representing a total estimated impact of +17bps on the Group CET1 ratio and -9bps on Natixis CET1 ratio
22 INVESTOR PRESENTATION
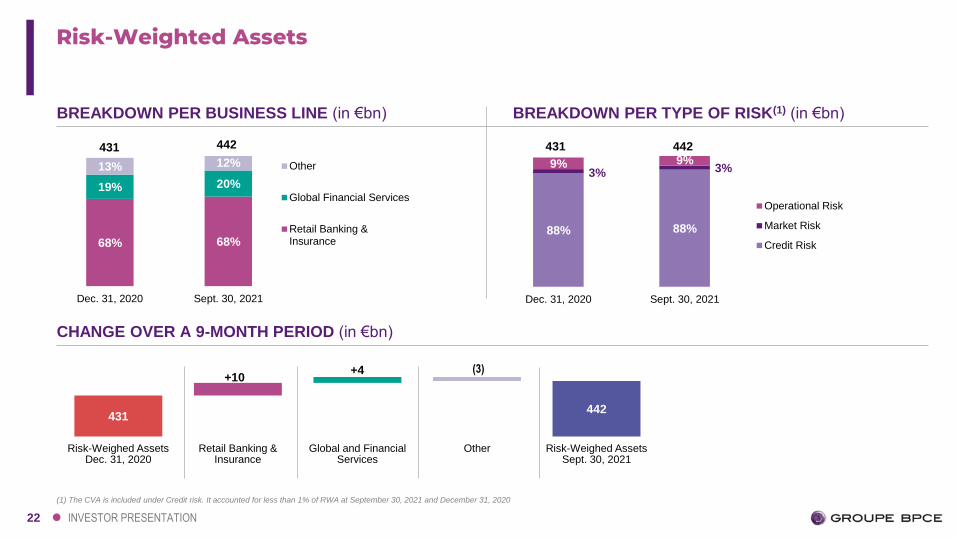
68% 68%
19% 20%
13% 12%
Dec. 31, 2020 Sept. 30, 2021
Other
Global Financial Services
Retail Banking &Insurance
Risk-Weighted Assets
442431
88% 88%
3% 3%9% 9%
Dec. 31, 2020 Sept. 30, 2021
Operational Risk
Market Risk
Credit Risk
431 442
CHANGE OVER A 9-MONTH PERIOD (in €bn)
431442
+10+4 (3)
Risk-Weighed AssetsDec. 31, 2020
Retail Banking & Insurance
Global and Financial Services
Other Risk-Weighed Assets Sept. 30, 2021
BREAKDOWN PER BUSINESS LINE (in €bn) BREAKDOWN PER TYPE OF RISK(1) (in €bn)
(1) The CVA is included under Credit risk. It accounted for less than 1% of RWA at September 30, 2021 and December 31, 2020
23 INVESTOR PRESENTATION
Own funds
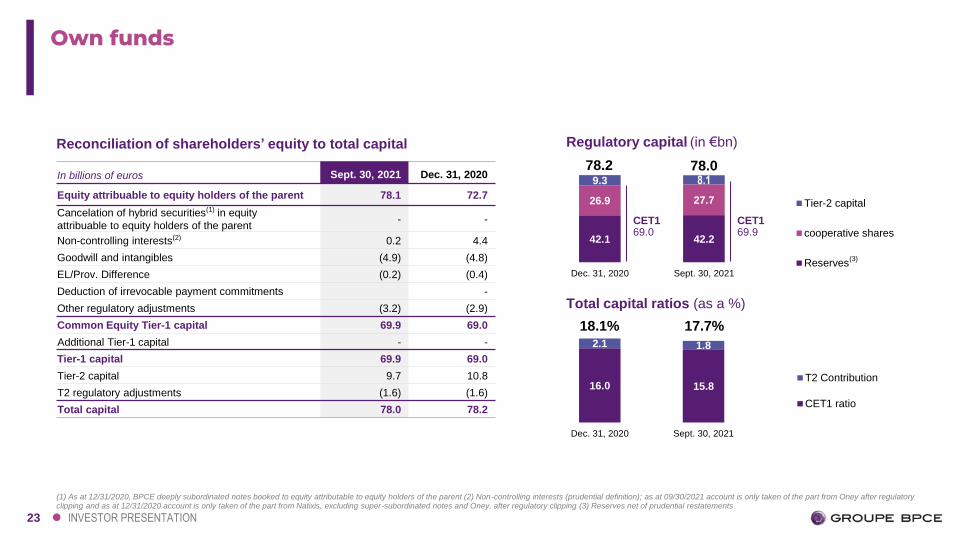
Reconciliation of shareholders’ equity to total capital
In billions of euros Sept. 30, 2021 Dec. 31, 2020
Equity attribuable to equity holders of the parent 78.1 72.7
Cancelation of hybrid securities(1) in equity
attribuable to equity holders of the parent- -
Non-controlling interests(2) 0.2 4.4
Goodwill and intangibles (4.9) (4.8)
EL/Prov. Difference (0.2) (0.4)
Deduction of irrevocable payment commitments -
Other regulatory adjustments (3.2) (2.9)
Common Equity Tier-1 capital 69.9 69.0
Additional Tier-1 capital - -
Tier-1 capital 69.9 69.0
Tier-2 capital 9.7 10.8
T2 regulatory adjustments (1.6) (1.6)
Total capital 78.0 78.2
(1) As at 12/31/2020, BPCE deeply subordinated notes booked to equity attributable to equity holders of the parent (2) Non-controlling interests (prudential definition); as at 09/30/2021 account is only taken of the part from Oney after regulatory clipping and as at 12/31/2020 account is only taken of the part from Natixis, excluding super-subordinated notes and Oney, after regulatory clipping (3) Reserves net of prudential restatements
16.0 15.8
2.1 1.8
Dec. 31, 2020 Sept. 30, 2021
T2 Contribution
CET1 ratio
42.1 42.2
26.9 27.7
9.3 8.1
Dec. 31, 2020 Sept. 30, 2021
Tier-2 capital
cooperative shares
Reserves
Regulatory capital (in €bn)
Total capital ratios (as a %)
78.2 78.0
18.1% 17.7%
CET169.0
CET169.9
(3)
24 INVESTOR PRESENTATION
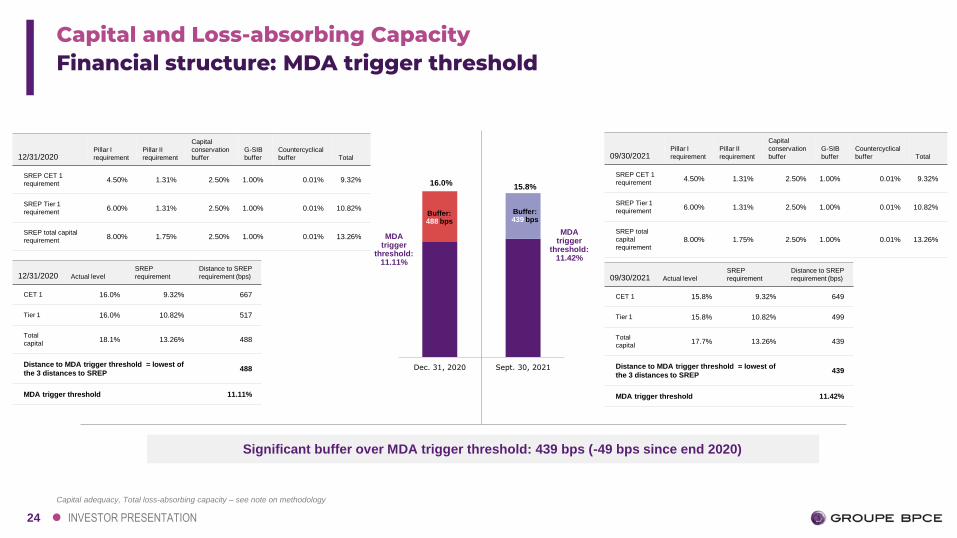
Financial structure: MDA trigger threshold Capital and Loss-absorbing Capacity
Capital adequacy, Total loss-absorbing capacity – see note on methodology
Significant buffer over MDA trigger threshold: 439 bps (-49 bps since end 2020)
12/31/2020Pillar I
requirement
Pillar II
requirement
Capital
conservation
buffer
G-SIB
buffer
Countercyclical
buffer Total
SREP CET 1
requirement4.50% 1.31% 2.50% 1.00% 0.01% 9.32%
SREP Tier 1
requirement6.00% 1.31% 2.50% 1.00% 0.01% 10.82%
SREP total capital
requirement8.00% 1.75% 2.50% 1.00% 0.01% 13.26%
12/31/2020 Actual level
SREP
requirement
Distance to SREP
requirement (bps)
CET 1 16.0% 9.32% 667
Tier 1 16.0% 10.82% 517
Total
capital18.1% 13.26% 488
Distance to MDA trigger threshold = lowest of
the 3 distances to SREP488
MDA trigger threshold 11.11%
09/30/2021 Actual level
SREP
requirement
Distance to SREP
requirement (bps)
CET 1 15.8% 9.32% 649
Tier 1 15.8% 10.82% 499
Total
capital17.7% 13.26% 439
Distance to MDA trigger threshold = lowest of
the 3 distances to SREP439
MDA trigger threshold 11.42%
Dec. 31, 2020 Sept. 30, 2021
Buffer: 488 bps
Buffer: 439 bps
16.0%
MDA trigger
threshold:11.11%
15.8%
MDA trigger
threshold:11.42%
09/30/2021Pillar I
requirement
Pillar II
requirement
Capital
conservation
buffer
G-SIB
buffer
Countercyclical
buffer Total
SREP CET 1
requirement4.50% 1.31% 2.50% 1.00% 0.01% 9.32%
SREP Tier 1
requirement6.00% 1.31% 2.50% 1.00% 0.01% 10.82%
SREP total
capital
requirement8.00% 1.75% 2.50% 1.00% 0.01% 13.26%
25 INVESTOR PRESENTATION
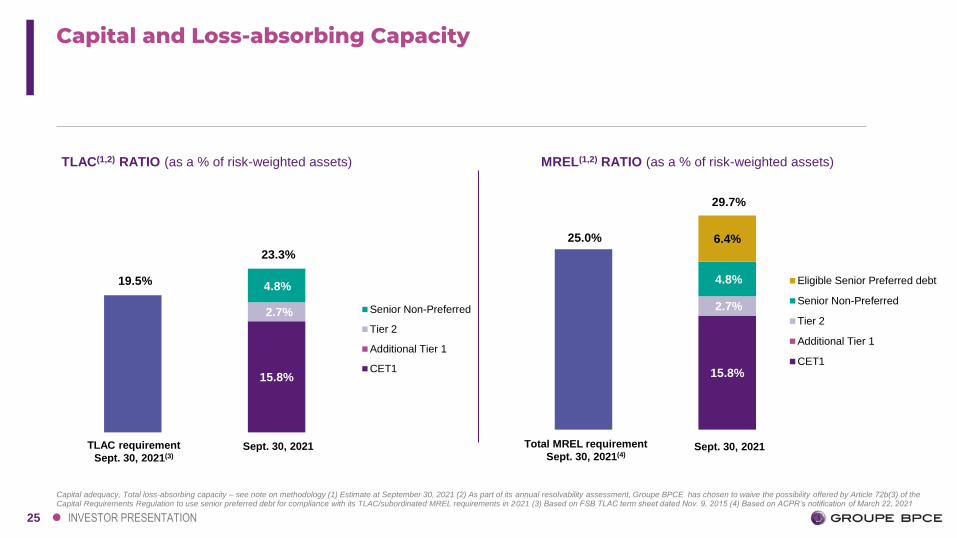
15.8%
4.8%
2.7% Senior Non-Preferred
Tier 2
Additional Tier 1
CET1 15.8%
4.8%
2.7%
6.4%
Eligible Senior Preferred debt
Senior Non-Preferred
Tier 2
Additional Tier 1
CET1
Capital and Loss-absorbing Capacity
TLAC(1,2) RATIO (as a % of risk-weighted assets)
Sept. 30, 2021
MREL(1,2) RATIO (as a % of risk-weighted assets)
Sept. 30, 2021
Capital adequacy, Total loss-absorbing capacity – see note on methodology (1) Estimate at September 30, 2021 (2) As part of its annual resolvability assessment, Groupe BPCE has chosen to waive the possibility offered by Article 72b(3) of the Capital Requirements Regulation to use senior preferred debt for compliance with its TLAC/subordinated MREL requirements in 2021 (3) Based on FSB TLAC term sheet dated Nov. 9, 2015 (4) Based on ACPR’s notification of March 22, 2021
19.5%
23.3%
25.0%
29.7%
TLAC requirement
Sept. 30, 2021(3)
Total MREL requirement
Sept. 30, 2021(4)
26 INVESTOR PRESENTATION
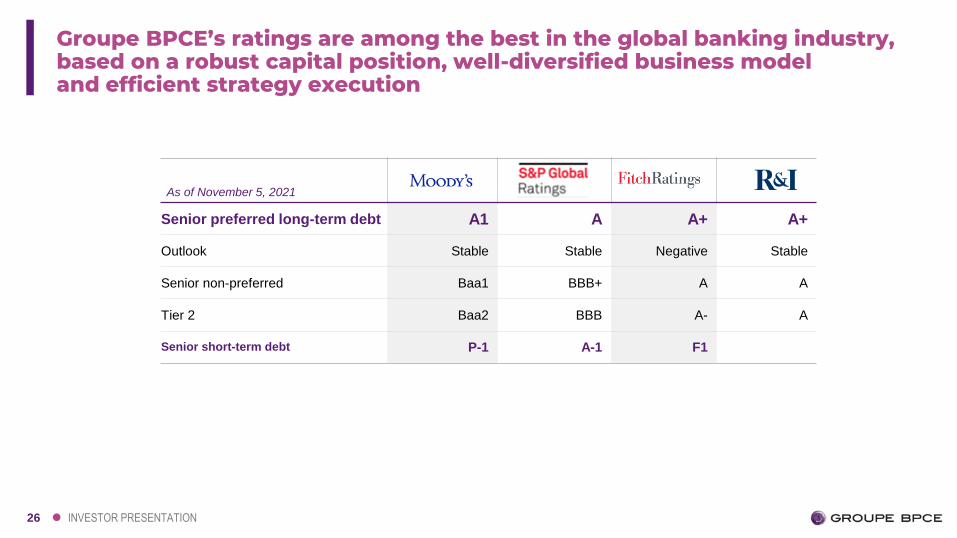
Groupe BPCE’s ratings are among the best in the global banking industry, based on a robust capital position, well-diversified business model and efficient strategy execution
As of November 5, 2021
Senior preferred long-term debt A1 A A+ A+
Outlook Stable Stable Negative Stable
Senior non-preferred Baa1 BBB+ A A
Tier 2 Baa2 BBB A- A
Senior short-term debt P-1 A-1 F1
27
04Global and innovative issuer, committed to society
28 INVESTOR PRESENTATION
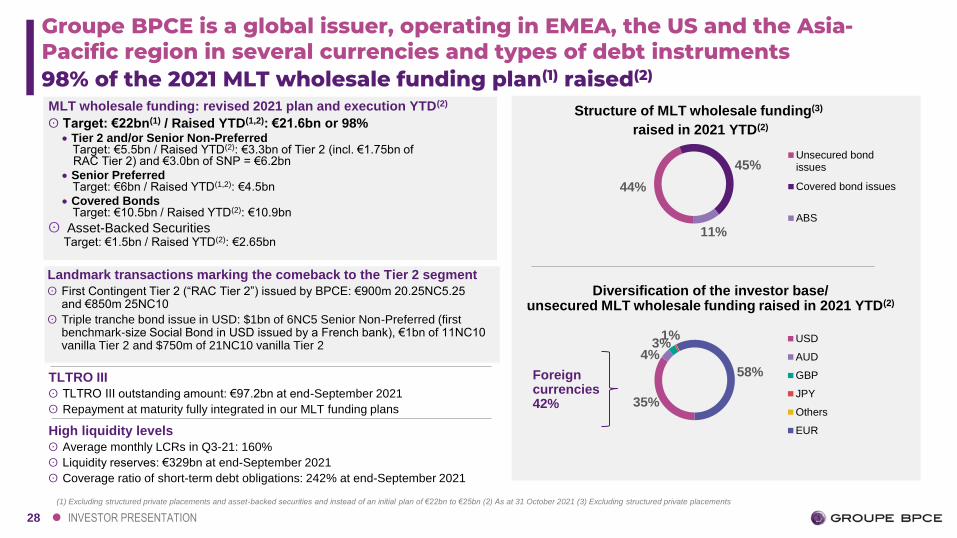
High liquidity levels
ʘ Average monthly LCRs in Q3-21: 160%
ʘ Liquidity reserves: €329bn at end-September 2021
ʘ Coverage ratio of short-term debt obligations: 242% at end-September 2021
98% of the 2021 MLT wholesale funding plan(1) raised(2)
44%
45%
11%
Unsecured bondissues
Covered bond issues
ABS
35%
4%3%
1%
58%
USD
AUD
GBP
JPY
Others
EUR
Foreigncurrencies42%
Structure of MLT wholesale funding(3)
raised in 2021 YTD(2)
Diversification of the investor base/unsecured MLT wholesale funding raised in 2021 YTD(2)
(1) Excluding structured private placements and asset-backed securities and instead of an initial plan of €22bn to €25bn (2) As at 31 October 2021 (3) Excluding structured private placements
TLTRO III
ʘ TLTRO III outstanding amount: €97.2bn at end-September 2021
ʘ Repayment at maturity fully integrated in our MLT funding plans
MLT wholesale funding: revised 2021 plan and execution YTD(2)
ʘ Target: €22bn(1) / Raised YTD(1,2): €21.6bn or 98%• Tier 2 and/or Senior Non-Preferred
Target: €5.5bn / Raised YTD(2): €3.3bn of Tier 2 (incl. €1.75bn ofRAC Tier 2) and €3.0bn of SNP = €6.2bn
• Senior PreferredTarget: €6bn / Raised YTD(1,2): €4.5bn
• Covered BondsTarget: €10.5bn / Raised YTD(2): €10.9bn
ʘ Asset-Backed SecuritiesTarget: €1.5bn / Raised YTD(2): €2.65bn
Landmark transactions marking the comeback to the Tier 2 segment
ʘ First Contingent Tier 2 (“RAC Tier 2”) issued by BPCE: €900m 20.25NC5.25 and €850m 25NC10
ʘ Triple tranche bond issue in USD: $1bn of 6NC5 Senior Non-Preferred (first benchmark-size Social Bond in USD issued by a French bank), €1bn of 11NC10 vanilla Tier 2 and $750m of 21NC10 vanilla Tier 2
Groupe BPCE is a global issuer, operating in EMEA, the US and the Asia-Pacific region in several currencies and types of debt instruments
29 INVESTOR PRESENTATION
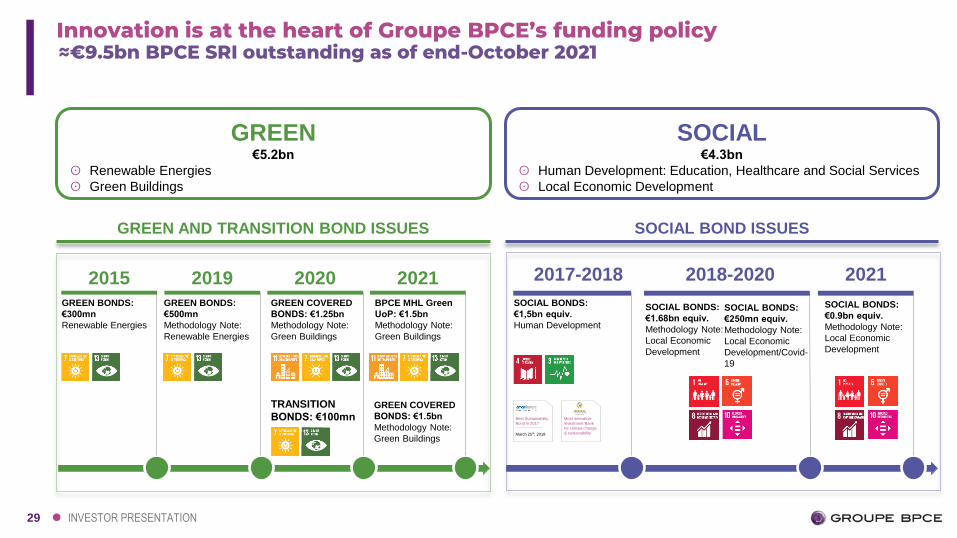
Innovation is at the heart of Groupe BPCE’s funding policy≈€9.5bn BPCE SRI outstanding as of end-October 2021
GREEN€5.2bn
ʘ Renewable Energies
ʘ Green Buildings
SOCIAL€4.3bn
ʘ Human Development: Education, Healthcare and Social Services
ʘ Local Economic Development
GREEN AND TRANSITION BOND ISSUES SOCIAL BOND ISSUES
GREEN BONDS:
€300mn
Renewable Energies
2015 2021BPCE MHL Green
UoP: €1.5bn
Methodology Note:
Green Buildings
2019GREEN BONDS:
€500mn
Methodology Note:
Renewable Energies
2020
TRANSITION
BONDS: €100mn
GREEN COVERED
BONDS: €1.25bn
Methodology Note:
Green Buildings
2018-2020
SOCIAL BONDS:
€1.68bn equiv.
Methodology Note:
Local Economic
Development
2021
SOCIAL BONDS:
€250mn equiv.
Methodology Note:
Local Economic
Development/Covid-
19
SOCIAL BONDS:
€1,5bn equiv.
Human Development
2017-2018
Best Sustainability
Bond in 2017
March 25th, 2018
Most innovative
Investment Bank
for climate change
& sustainability
GREEN COVERED
BONDS: €1.5bn
Methodology Note:
Green Buildings
SOCIAL BONDS:
€0.9bn equiv.
Methodology Note:
Local Economic
Development
30 INVESTOR PRESENTATION
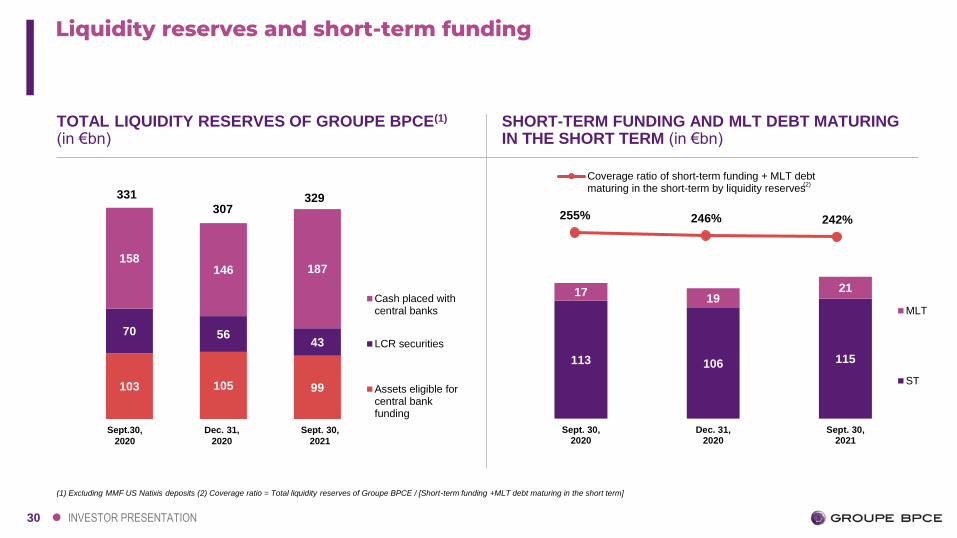
Liquidity reserves and short-term funding
TOTAL LIQUIDITY RESERVES OF GROUPE BPCE(1)
(in €bn)
(1) Excluding MMF US Natixis deposits (2) Coverage ratio = Total liquidity reserves of Groupe BPCE / [Short-term funding +MLT debt maturing in the short term]
SHORT-TERM FUNDING AND MLT DEBT MATURING IN THE SHORT TERM (in €bn)
255% 246% 242%
Coverage ratio of short-term funding + MLT debtmaturing in the short-term by liquidity reserves
113 106 115
1719
21
Sept. 30,2020
Dec. 31,2020
Sept. 30,2021
MLT
ST103 105 99
70 5643
158146 187
Cash placed withcentral banks
LCR securities
Assets eligible forcentral bankfunding
307
Sept. 30,
2021
(2)
Sept.30,
2020
Dec. 31,
2020
331 329

31
ADDITIONAL INFORMATION
32 INVESTOR PRESENTATION
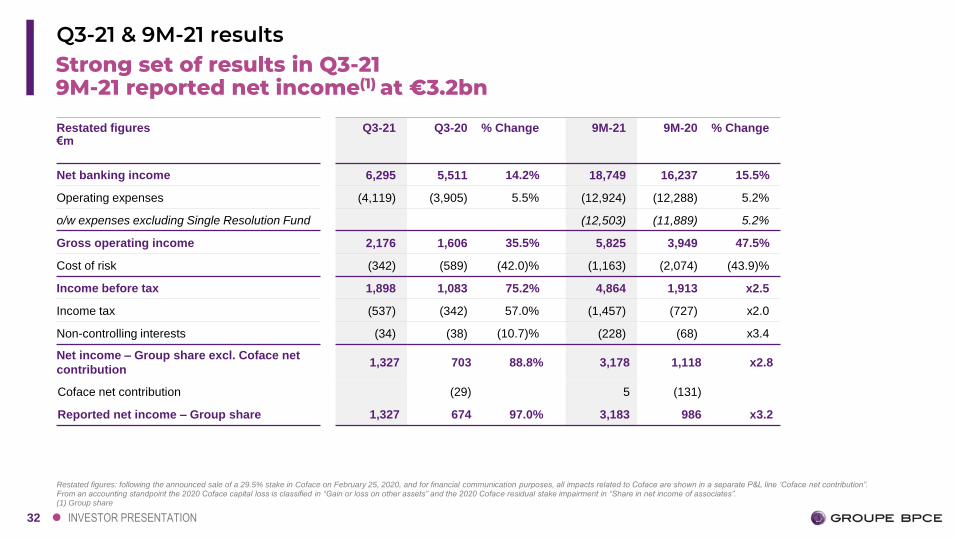
Strong set of results in Q3-21 9M-21 reported net income(1) at €3.2bn
Q3-21 & 9M-21 results
Restated figures€m
Q3-21 Q3-20 % Change 9M-21 9M-20 % Change
Net banking income 6,295 5,511 14.2% 18,749 16,237 15.5%
Operating expenses (4,119) (3,905) 5.5% (12,924) (12,288) 5.2%
o/w expenses excluding Single Resolution Fund (12,503) (11,889) 5.2%
Gross operating income 2,176 1,606 35.5% 5,825 3,949 47.5%
Cost of risk (342) (589) (42.0)% (1,163) (2,074) (43.9)%
Income before tax 1,898 1,083 75.2% 4,864 1,913 x2.5
Income tax (537) (342) 57.0% (1,457) (727) x2.0
Non-controlling interests (34) (38) (10.7)% (228) (68) x3.4
Net income – Group share excl. Coface net
contribution1,327 703 88.8% 3,178 1,118 x2.8
Coface net contribution (29) 5 (131)
Reported net income – Group share 1,327 674 97.0% 3,183 986 x3.2
Restated figures: following the announced sale of a 29.5% stake in Coface on February 25, 2020, and for financial communication purposes, all impacts related to Coface are shown in a separate P&L line ‘Coface net contribution”.From an accounting standpoint the 2020 Coface capital loss is classified in “Gain or loss on other assets” and the 2020 Coface residual stake impairment in “Share in net income of associates”. (1) Group share
33 INVESTOR PRESENTATION
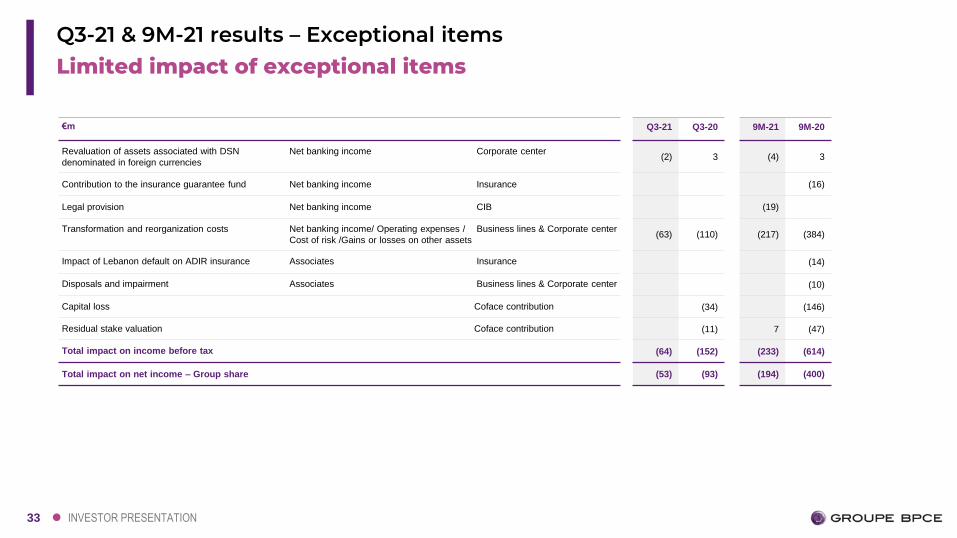
Limited impact of exceptional itemsQ3-21 & 9M-21 results – Exceptional items
€m Q3-21 Q3-20 9M-21 9M-20
Revaluation of assets associated with DSN
denominated in foreign currencies
Net banking income Corporate center(2) 3 (4) 3
Contribution to the insurance guarantee fund Net banking income Insurance (16)
Legal provision Net banking income CIB (19)
Transformation and reorganization costs Net banking income/ Operating expenses /
Cost of risk /Gains or losses on other assets
Business lines & Corporate center(63) (110) (217) (384)
Impact of Lebanon default on ADIR insurance Associates Insurance (14)
Disposals and impairment Associates Business lines & Corporate center (10)
Capital loss Coface contribution (34) (146)
Residual stake valuation Coface contribution (11) 7 (47)
Total impact on income before tax (64) (152) (233) (614)
Total impact on net income – Group share (53) (93) (194) (400)

34 INVESTOR PRESENTATION
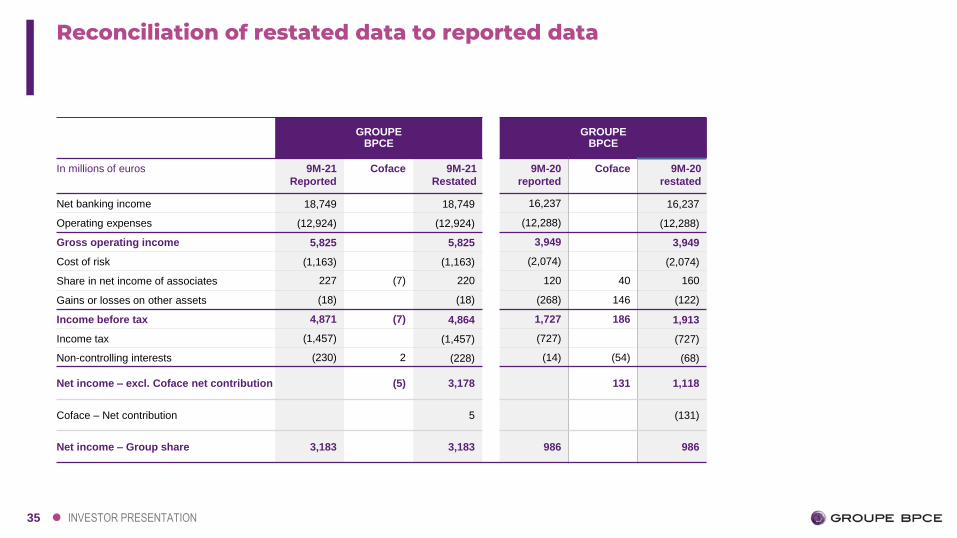
Reconciliation of restated data to reported data
GROUPE BPCE
GROUPE BPCE
In millions of euros Q3-21
Reported
Coface Q3-21
Restated
Q3-20
reported
Coface Q3-20
restated
Net banking income 6,295 6,295 5,511 5,511
Operating expenses (4,119) (4,119) (3,905) (3,905)
Gross operating income 2,176 2,176 1,606 1,606
Cost of risk (342) (342) (589) (589)
Share in net income of associates 71 71 52 8 60
Gains or losses on other assets (7) (7) (26) 33 7
Income before tax 1,898 1,898 1,042 41 1,083
Income tax (537) (537) (342) (342)
Non-controlling interests (34) (34) (27) (11) (38)
Net income – excl. Coface net contribution 1,327 1,327 29 703
Coface – Net contribution (29)
Net income – Group share 1,327 1,327 674 674
35 INVESTOR PRESENTATION
Reconciliation of restated data to reported data
GROUPE BPCE
GROUPE BPCE
In millions of euros 9M-21
Reported
Coface 9M-21
Restated
9M-20
reported
Coface 9M-20
restated
Net banking income 18,749 18,749 16,237 16,237
Operating expenses (12,924) (12,924) (12,288) (12,288)
Gross operating income 5,825 5,825 3,949 3,949
Cost of risk (1,163) (1,163) (2,074) (2,074)
Share in net income of associates 227 (7) 220 120 40 160
Gains or losses on other assets (18) (18) (268) 146 (122)
Income before tax 4,871 (7) 4,864 1,727 186 1,913
Income tax (1,457) (1,457) (727) (727)
Non-controlling interests (230) 2 (228) (14) (54) (68)
Net income – excl. Coface net contribution (5) 3,178 131 1,118
Coface – Net contribution 5 (131)
Net income – Group share 3,183 3,183 986 986
36 INVESTOR PRESENTATION
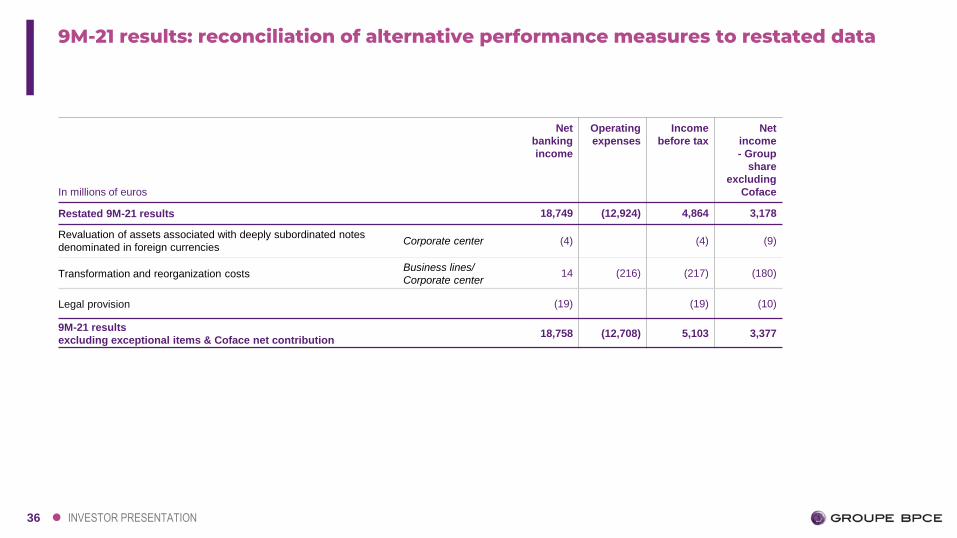
9M-21 results: reconciliation of alternative performance measures to restated data
In millions of euros
Net
banking
income
Operating
expenses
Income
before tax
Net
income
- Group
share
excluding
Coface
Restated 9M-21 results 18,749 (12,924) 4,864 3,178
Revaluation of assets associated with deeply subordinated notes
denominated in foreign currenciesCorporate center (4) (4) (9)
Transformation and reorganization costsBusiness lines/
Corporate center14 (216) (217) (180)
Legal provision (19) (19) (10)
9M-21 results
excluding exceptional items & Coface net contribution18,758 (12,708) 5,103 3,377
37 INVESTOR PRESENTATION
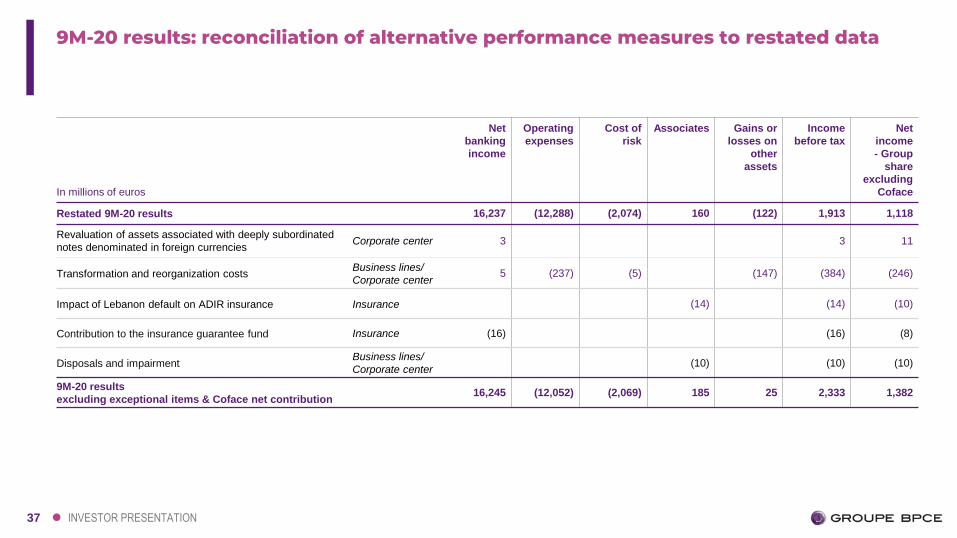
9M-20 results: reconciliation of alternative performance measures to restated data
In millions of euros
Net
banking
income
Operating
expenses
Cost of
risk
Associates Gains or
losses on
other
assets
Income
before tax
Net
income
- Group
share
excluding
Coface
Restated 9M-20 results 16,237 (12,288) (2,074) 160 (122) 1,913 1,118
Revaluation of assets associated with deeply subordinated
notes denominated in foreign currenciesCorporate center 3 3 11
Transformation and reorganization costsBusiness lines/
Corporate center5 (237) (5) (147) (384) (246)
Impact of Lebanon default on ADIR insurance Insurance (14) (14) (10)
Contribution to the insurance guarantee fund Insurance (16) (16) (8)
Disposals and impairmentBusiness lines/
Corporate center(10) (10) (10)
9M-20 results
excluding exceptional items & Coface net contribution16,245 (12,052) (2,069) 185 25 2,333 1,382
38 INVESTOR PRESENTATION
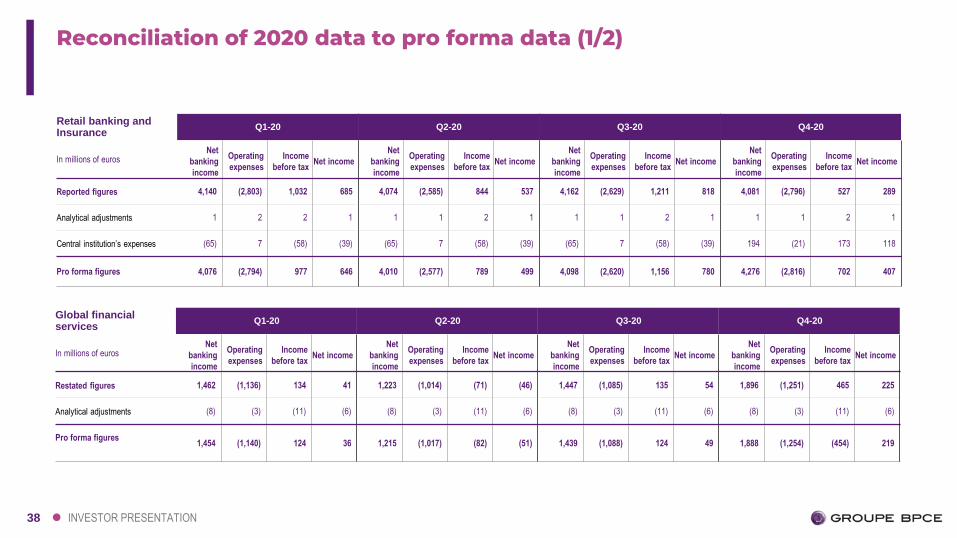
Reconciliation of 2020 data to pro forma data (1/2)
Retail banking and Insurance
Q1-20 Q2-20 Q3-20 Q4-20
In millions of eurosNet
banking
income
Operating
expenses
Income
before taxNet income
Net
banking
income
Operating
expenses
Income
before taxNet income
Net
banking
income
Operating
expenses
Income
before taxNet income
Net
banking
income
Operating
expenses
Income
before taxNet income
Reported figures 4,140 (2,803) 1,032 685 4,074 (2,585) 844 537 4,162 (2,629) 1,211 818 4,081 (2,796) 527 289
Analytical adjustments 1 2 2 1 1 1 2 1 1 1 2 1 1 1 2 1
Central institution’s expenses (65) 7 (58) (39) (65) 7 (58) (39) (65) 7 (58) (39) 194 (21) 173 118
Pro forma figures 4,076 (2,794) 977 646 4,010 (2,577) 789 499 4,098 (2,620) 1,156 780 4,276 (2,816) 702 407
Global financial services
Q1-20 Q2-20 Q3-20 Q4-20
In millions of eurosNet
banking
income
Operating
expenses
Income
before taxNet income
Net
banking
income
Operating
expenses
Income
before taxNet income
Net
banking
income
Operating
expenses
Income
before taxNet income
Net
banking
income
Operating
expenses
Income
before taxNet income
Restated figures 1,462 (1,136) 134 41 1,223 (1,014) (71) (46) 1,447 (1,085) 135 54 1,896 (1,251) 465 225
Analytical adjustments (8) (3) (11) (6) (8) (3) (11) (6) (8) (3) (11) (6) (8) (3) (11) (6)
Pro forma figures 1,454 (1,140) 124 36 1,215 (1,017) (82) (51) 1,439 (1,088) 124 49 1,888 (1,254) (454) 219
39 INVESTOR PRESENTATION
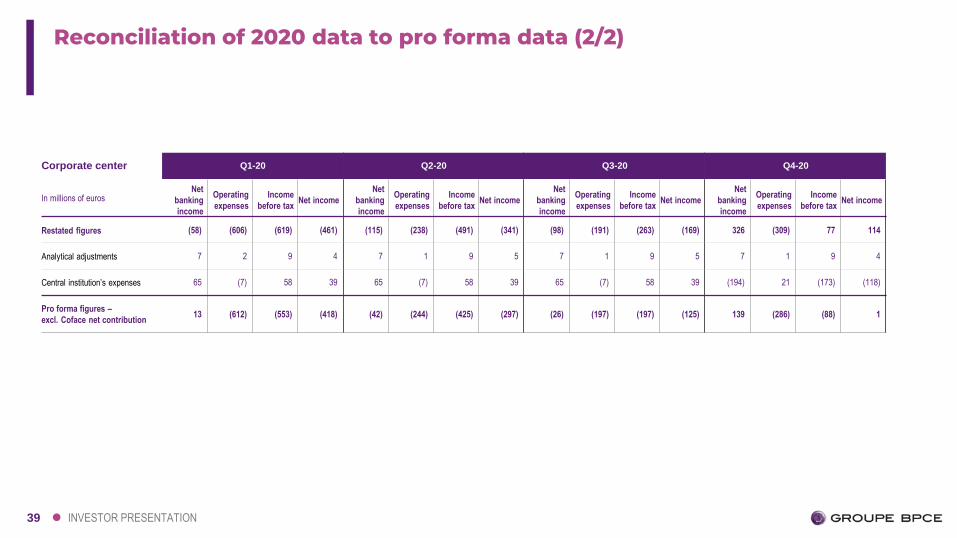
Reconciliation of 2020 data to pro forma data (2/2)
Corporate center Q1-20 Q2-20 Q3-20 Q4-20
In millions of eurosNet
banking
income
Operating
expenses
Income
before taxNet income
Net
banking
income
Operating
expenses
Income
before taxNet income
Net
banking
income
Operating
expenses
Income
before taxNet income
Net
banking
income
Operating
expenses
Income
before taxNet income
Restated figures (58) (606) (619) (461) (115) (238) (491) (341) (98) (191) (263) (169) 326 (309) 77 114
Analytical adjustments 7 2 9 4 7 1 9 5 7 1 9 5 7 1 9 4
Central institution’s expenses 65 (7) 58 39 65 (7) 58 39 65 (7) 58 39 (194) 21 (173) (118)
Pro forma figures –
excl. Coface net contribution13 (612) (553) (418) (42) (244) (425) (297) (26) (197) (197) (125) 139 (286) (88) 1
40 INVESTOR PRESENTATION
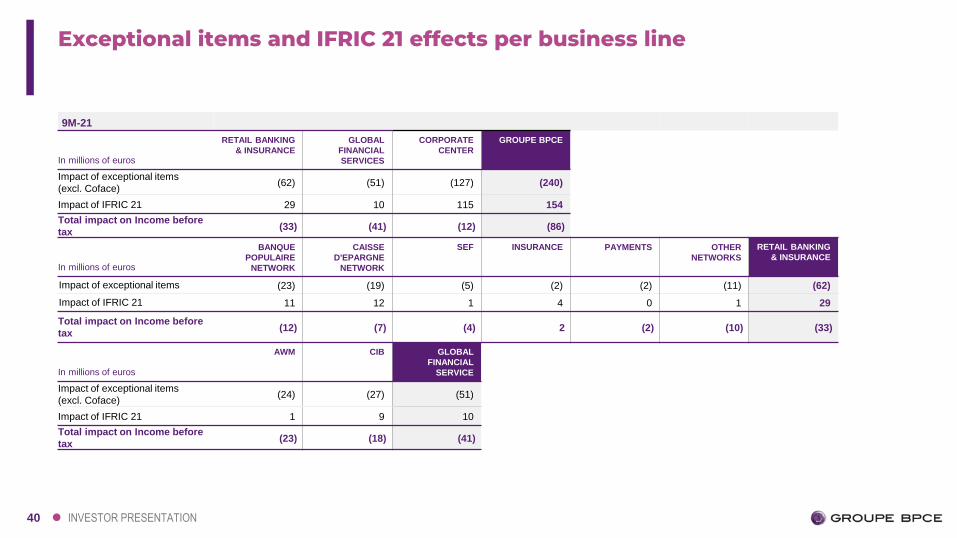
Exceptional items and IFRIC 21 effects per business line
9M-21
In millions of euros
RETAIL BANKING
& INSURANCE
GLOBAL
FINANCIAL
SERVICES
CORPORATE
CENTER
GROUPE BPCE
Impact of exceptional items
(excl. Coface)(62) (51) (127) (240)
Impact of IFRIC 21 29 10 115 154
Total impact on Income before
tax(33) (41) (12) (86)
In millions of euros
BANQUE
POPULAIRE
NETWORK
CAISSE
D'EPARGNE
NETWORK
SEF INSURANCE PAYMENTS OTHER
NETWORKS
RETAIL BANKING
& INSURANCE
Impact of exceptional items (23) (19) (5) (2) (2) (11) (62)
Impact of IFRIC 21 11 12 1 4 0 1 29
Total impact on Income before
tax(12) (7) (4) 2 (2) (10) (33)
In millions of euros
AWM CIB GLOBAL
FINANCIAL
SERVICE
Impact of exceptional items
(excl. Coface)(24) (27) (51)
Impact of IFRIC 21 1 9 10
Total impact on Income before
tax(23) (18) (41)
41 INVESTOR PRESENTATION
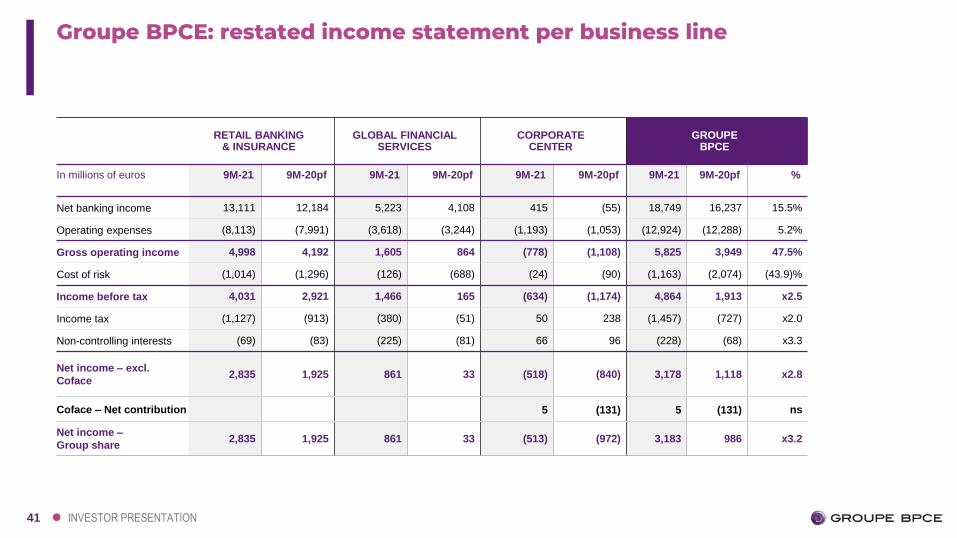
Groupe BPCE: restated income statement per business line
RETAIL BANKING & INSURANCE
GLOBAL FINANCIAL SERVICES
CORPORATE CENTER
GROUPE BPCE
In millions of euros 9M-21 9M-20pf 9M-21 9M-20pf 9M-21 9M-20pf 9M-21 9M-20pf %
Net banking income 13,111 12,184 5,223 4,108 415 (55) 18,749 16,237 15.5%
Operating expenses (8,113) (7,991) (3,618) (3,244) (1,193) (1,053) (12,924) (12,288) 5.2%
Gross operating income 4,998 4,192 1,605 864 (778) (1,108) 5,825 3,949 47.5%
Cost of risk (1,014) (1,296) (126) (688) (24) (90) (1,163) (2,074) (43.9)%
Income before tax 4,031 2,921 1,466 165 (634) (1,174) 4,864 1,913 x2.5
Income tax (1,127) (913) (380) (51) 50 238 (1,457) (727) x2.0
Non-controlling interests (69) (83) (225) (81) 66 96 (228) (68) x3.3
Net income – excl.
Coface2,835 1,925 861 33 (518) (840) 3,178 1,118 x2.8
Coface – Net contribution 5 (131) 5 (131) ns
Net income –
Group share2,835 1,925 861 33 (513) (972) 3,183 986 x3.2
42 INVESTOR PRESENTATION
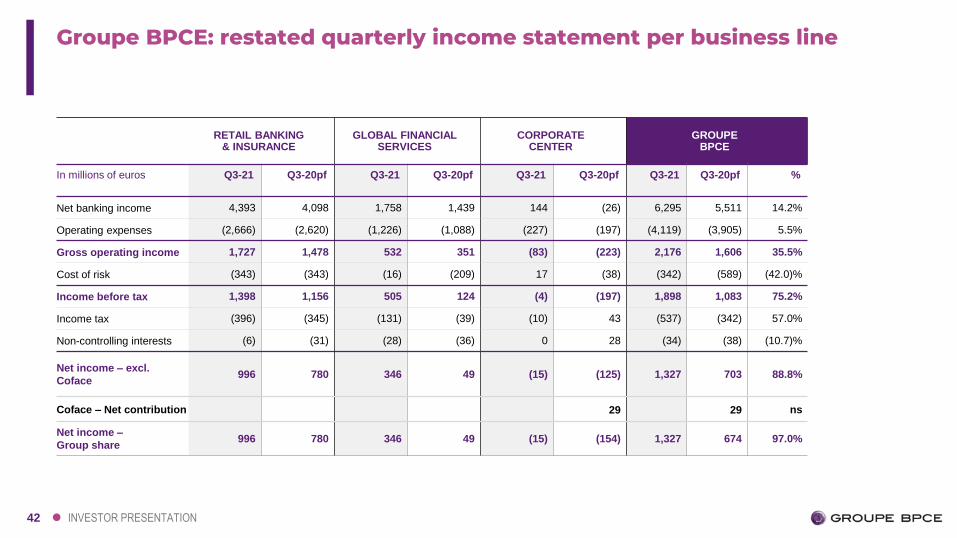
Groupe BPCE: restated quarterly income statement per business line
RETAIL BANKING & INSURANCE
GLOBAL FINANCIAL SERVICES
CORPORATE CENTER
GROUPE BPCE
In millions of euros Q3-21 Q3-20pf Q3-21 Q3-20pf Q3-21 Q3-20pf Q3-21 Q3-20pf %
Net banking income 4,393 4,098 1,758 1,439 144 (26) 6,295 5,511 14.2%
Operating expenses (2,666) (2,620) (1,226) (1,088) (227) (197) (4,119) (3,905) 5.5%
Gross operating income 1,727 1,478 532 351 (83) (223) 2,176 1,606 35.5%
Cost of risk (343) (343) (16) (209) 17 (38) (342) (589) (42.0)%
Income before tax 1,398 1,156 505 124 (4) (197) 1,898 1,083 75.2%
Income tax (396) (345) (131) (39) (10) 43 (537) (342) 57.0%
Non-controlling interests (6) (31) (28) (36) 0 28 (34) (38) (10.7)%
Net income – excl.
Coface996 780 346 49 (15) (125) 1,327 703 88.8%
Coface – Net contribution 29 29 ns
Net income –
Group share996 780 346 49 (15) (154) 1,327 674 97.0%
43 INVESTOR PRESENTATION
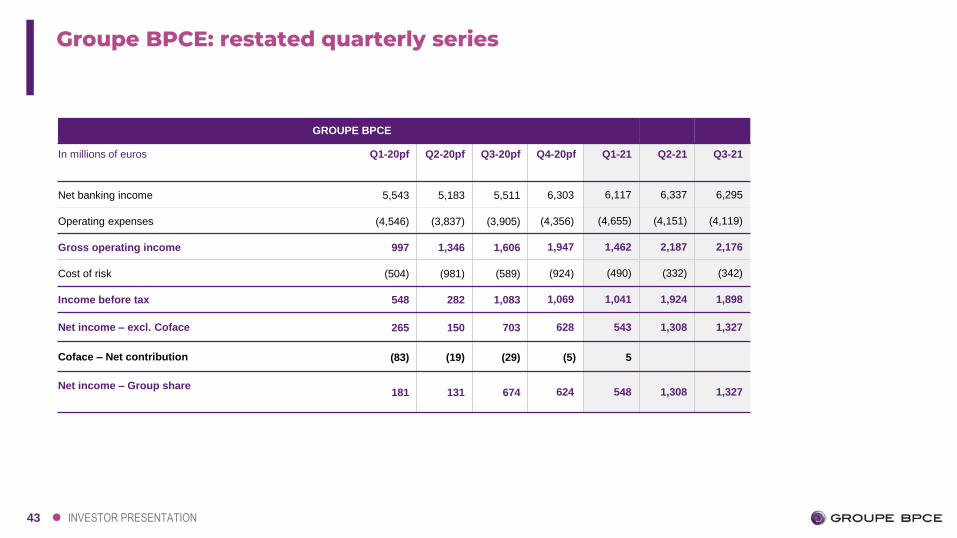
Groupe BPCE: restated quarterly series
GROUPE BPCE
In millions of euros Q1-20pf Q2-20pf Q3-20pf Q4-20pf Q1-21 Q2-21 Q3-21
Net banking income 5,543 5,183 5,511 6,303 6,117 6,337 6,295
Operating expenses (4,546) (3,837) (3,905) (4,356) (4,655) (4,151) (4,119)
Gross operating income 997 1,346 1,606 1,947 1,462 2,187 2,176
Cost of risk (504) (981) (589) (924) (490) (332) (342)
Income before tax 548 282 1,083 1,069 1,041 1,924 1,898
Net income – excl. Coface 265 150 703 628 543 1,308 1,327
Coface – Net contribution (83) (19) (29) (5) 5
Net income – Group share181 131 674 624 548 1,308 1,327
44 INVESTOR PRESENTATION
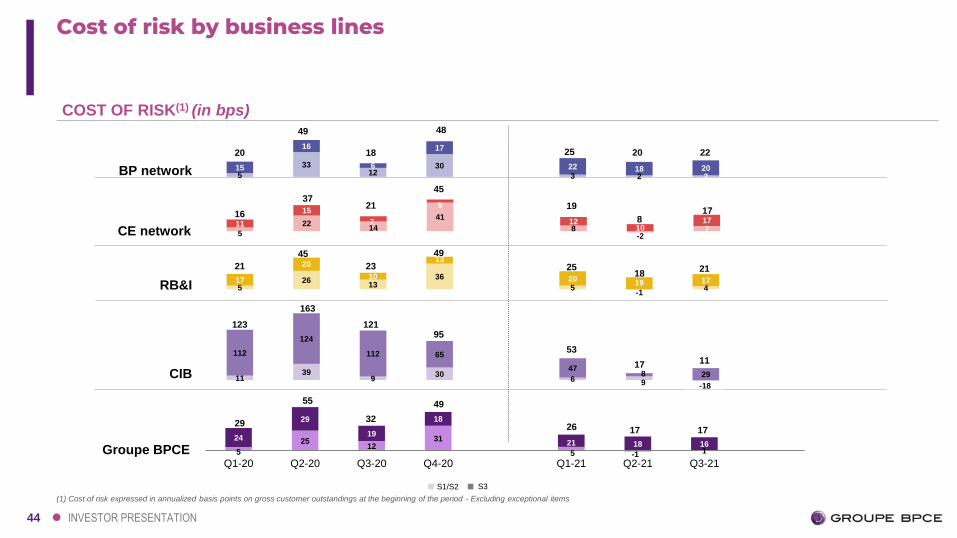
COST OF RISK(1) (in bps)
BP network
CIB
Groupe BPCE
CE network
5
3312
30
3 2 215
16
6
17
22 18 20
Cost of risk by business lines
5
2214
41
8-2
711
15
7
5
1210
17
1139
930
6 9
112
124
112 65
478 29
-18
5
2512
31
5 -1 1
24
29
19
18
21 18 16
Q1-20 Q2-20 Q3-20 Q4-20 Q1-21 Q2-21 Q3-21
RB&I 526
1336
5-1
417
20
10
13
2019 17
55
29
123
163
21
45
16
37
20
49
(1) Cost of risk expressed in annualized basis points on gross customer outstandings at the beginning of the period - Excluding exceptional items
32
23
21
18
49
49
45
48
25
19
25
12195
53
26
S3S1/S2
17
17
18
8
20 22
17
21
11
17
45 INVESTOR PRESENTATION
9,831 10,591
BP + CE networks
9M-20 9M-21
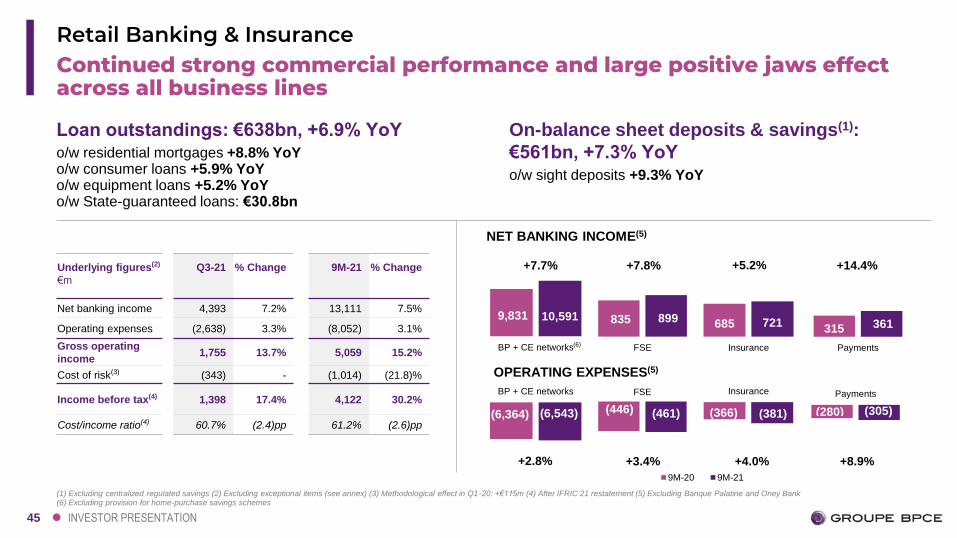
Continued strong commercial performance and large positive jaws effect across all business lines
Retail Banking & Insurance
+2.8% +3.4% +4.0% +8.9%
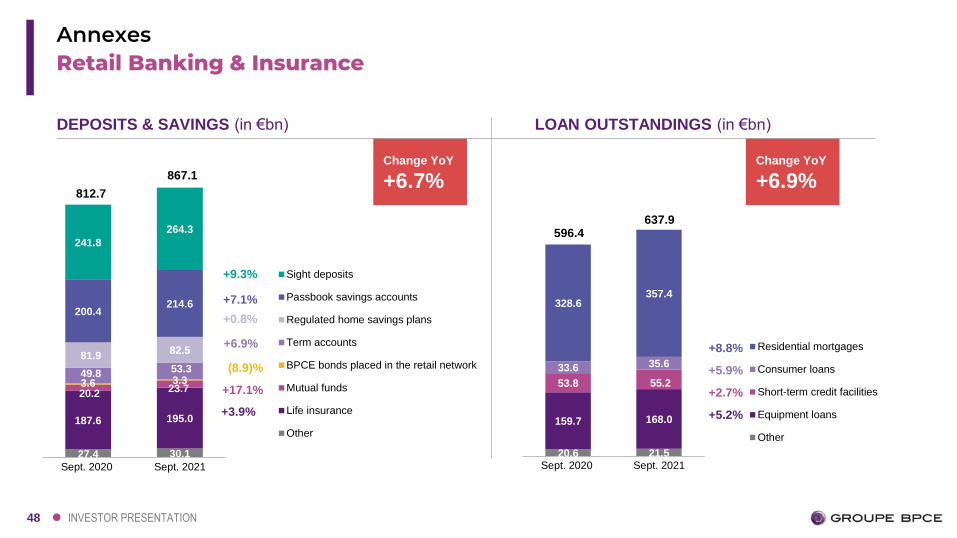
Loan outstandings: €638bn, +6.9% YoYo/w residential mortgages +8.8% YoYo/w consumer loans +5.9% YoYo/w equipment loans +5.2% YoYo/w State-guaranteed loans: €30.8bn
On-balance sheet deposits & savings(1):
€561bn, +7.3% YoYo/w sight deposits +9.3% YoY
Underlying figures(2)
€m
Q3-21 % Change 9M-21 % Change
Net banking income 4,393 7.2% 13,111 7.5%
Operating expenses (2,638) 3.3% (8,052) 3.1%
Gross operating
income1,755 13.7% 5,059 15.2%
Cost of risk(3) (343) - (1,014) (21.8)%
Income before tax(4) 1,398 17.4% 4,122 30.2%
Cost/income ratio(4) 60.7% (2.4)pp 61.2% (2.6)pp
685 721
Insurance
835 899
FSE
OPERATING EXPENSES(5)
(6,364) (6,543)
BP + CE networks
(366) (381)
Insurance
(446) (461)
(1) Excluding centralized regulated savings (2) Excluding exceptional items (see annex) (3) Methodological effect in Q1-20: +€115m (4) After IFRIC 21 restatement (5) Excluding Banque Palatine and Oney Bank (6) Excluding provision for home-purchase savings schemes
+7.7% +7.8% +5.2% +14.4%
NET BANKING INCOME(5)
(280) (305)
PaymentsFSE
(6)
315 361
Payments
46 INVESTOR PRESENTATION
35.8%38.4%
2,695 3,069
Net interest income
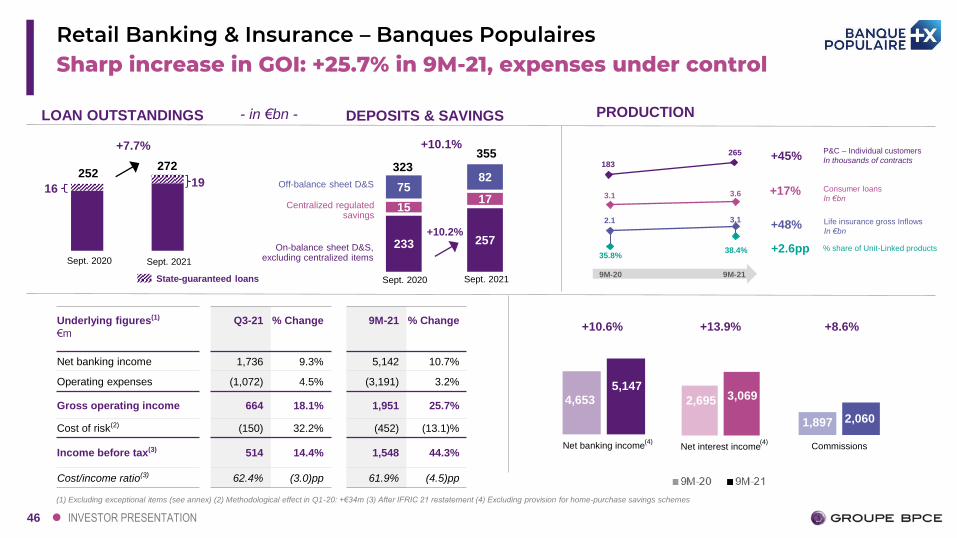
Sharp increase in GOI: +25.7% in 9M-21, expenses under controlRetail Banking & Insurance – Banques Populaires
LOAN OUTSTANDINGS
+7.7%
252272
4,6535,147
Net banking income
1,897 2,060
Commissions
+13.9% +8.6%
(4)
+10.6%
(4)
233 257
1517
7582
Sept. 2020 Sept. 2021
+10.2%
Off-balance sheet D&S
Centralized regulated savings
On-balance sheet D&S, excluding centralized items
+10.1%
323355
DEPOSITS & SAVINGS- in €bn - PRODUCTION
183
265 P&C – Individual customers
In thousands of contracts
Consumer loans
In €bn
+45%
3.1 3.6 +17%
9M-20 9M-21
(1) Excluding exceptional items (see annex) (2) Methodological effect in Q1-20: +€34m (3) After IFRIC 21 restatement (4) Excluding provision for home-purchase savings schemes
Sept. 2020 Sept. 2021
State-guaranteed loans
19
Underlying figures(1)
€m
Q3-21 % Change 9M-21 % Change
Net banking income 1,736 9.3% 5,142 10.7%
Operating expenses (1,072) 4.5% (3,191) 3.2%
Gross operating income 664 18.1% 1,951 25.7%
Cost of risk(2) (150) 32.2% (452) (13.1)%
Income before tax(3) 514 14.4% 1,548 44.3%
Cost/income ratio(3) 62.4% (3.0)pp 61.9% (4.5)pp
16
Life insurance gross Inflows
In €bn
% share of Unit-Linked products
2.1 3.1+48%
+2.6pp
47 INVESTOR PRESENTATION
6.810.3
33.4%
35.9%
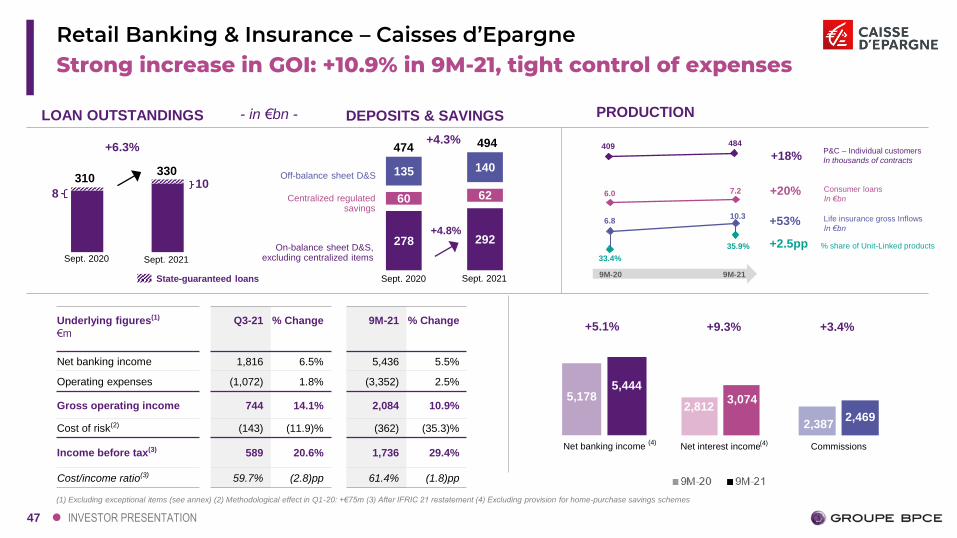
Strong increase in GOI: +10.9% in 9M-21, tight control of expensesRetail Banking & Insurance – Caisses d’Epargne
310330
+6.3%
2,8123,074
Net interest income
2,3872,469
Commissions
+9.3% +3.4%
5,1785,444
Net banking income
+5.1%
(4) (4)
278 292
60 62
135 140
+4.8%
+4.3%474 494
Sept. 2020 Sept. 2021
Off-balance sheet D&S
Centralized regulated savings
On-balance sheet D&S, excluding centralized items
(1) Excluding exceptional items (see annex) (2) Methodological effect in Q1-20: +€75m (3) After IFRIC 21 restatement (4) Excluding provision for home-purchase savings schemes
LOAN OUTSTANDINGS DEPOSITS & SAVINGS- in €bn -
Sept. 2020 Sept. 2021
PRODUCTION
State-guaranteed loans
10
Underlying figures(1)
€m
Q3-21 % Change 9M-21 % Change
Net banking income 1,816 6.5% 5,436 5.5%
Operating expenses (1,072) 1.8% (3,352) 2.5%
Gross operating income 744 14.1% 2,084 10.9%
Cost of risk(2) (143) (11.9)% (362) (35.3)%
Income before tax(3) 589 20.6% 1,736 29.4%
Cost/income ratio(3) 59.7% (2.8)pp 61.4% (1.8)pp
8
409 484
Consumer loans
In €bn
+18%
6.0 7.2 +20%
9M-20 9M-21
Life insurance gross Inflows
In €bn
% share of Unit-Linked products
+53%
+2.5pp
P&C – Individual customers
In thousands of contracts
48 INVESTOR PRESENTATION
Retail Banking & InsuranceAnnexes
27.4 30.1
187.6 195.0
20.2 23.73.6 3.349.8 53.3
81.982.5
200.4214.6
241.8
264.3
Sept. 2020 Sept. 2021
Sight deposits
Passbook savings accounts
Regulated home savings plans
Term accounts
BPCE bonds placed in the retail network
Mutual funds
Life insurance
Other
20.6 21.5
159.7 168.0
53.8 55.2
33.6 35.6
328.6357.4
Sept. 2020 Sept. 2021
Residential mortgages
Consumer loans
Short-term credit facilities
Equipment loans
Other
+9.3%
+7.1%
+0.8%
+6.9%
(8.9)%
+17.1%
+3.9%
+8.8%
+5.9%
+2.7%
+5.2%
DEPOSITS & SAVINGS (in €bn) LOAN OUTSTANDINGS (in €bn)
Change YoY
+6.9%Change YoY
+6.7%812.7
867.1
596.4637.9
49 INVESTOR PRESENTATION
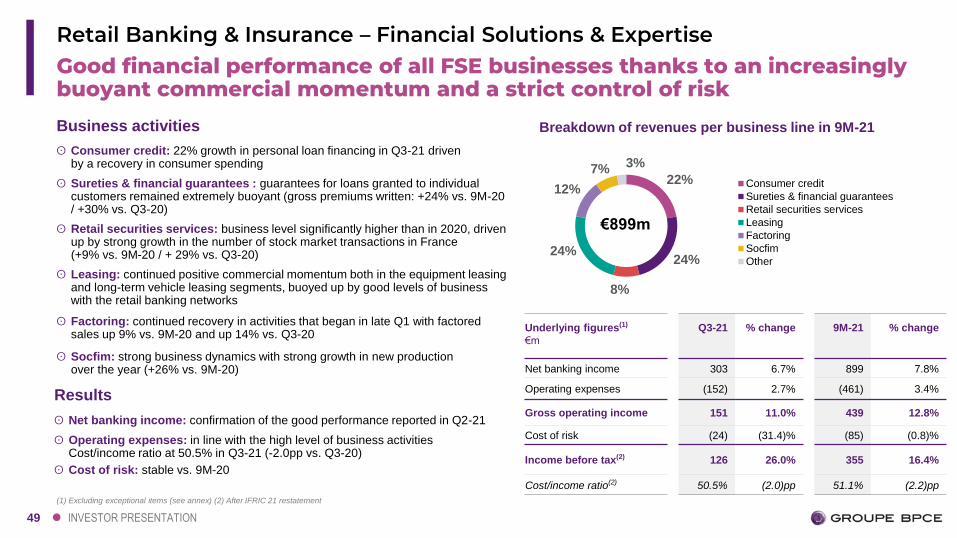
Good financial performance of all FSE businesses thanks to an increasingly buoyant commercial momentum and a strict control of risk
Retail Banking & Insurance – Financial Solutions & Expertise
(1) Excluding exceptional items (see annex) (2) After IFRIC 21 restatement
22%
24%
8%
24%
12%
7% 3%
Consumer credit
Sureties & financial guarantees
Retail securities services
Leasing
Factoring
Socfim
Other
Results
ʘ Net banking income: confirmation of the good performance reported in Q2-21
ʘ Operating expenses: in line with the high level of business activitiesCost/income ratio at 50.5% in Q3-21 (-2.0pp vs. Q3-20)
ʘ Cost of risk: stable vs. 9M-20
Breakdown of revenues per business line in 9M-21
€899m
Business activities
ʘ Consumer credit: 22% growth in personal loan financing in Q3-21 driven by a recovery in consumer spending
ʘ Sureties & financial guarantees : guarantees for loans granted to individual customers remained extremely buoyant (gross premiums written: +24% vs. 9M-20 / +30% vs. Q3-20)
ʘ Retail securities services: business level significantly higher than in 2020, driven up by strong growth in the number of stock market transactions in France (+9% vs. 9M-20 / + 29% vs. Q3-20)
ʘ Leasing: continued positive commercial momentum both in the equipment leasing and long-term vehicle leasing segments, buoyed up by good levels of business with the retail banking networks
ʘ Factoring: continued recovery in activities that began in late Q1 with factored sales up 9% vs. 9M-20 and up 14% vs. Q3-20
ʘ Socfim: strong business dynamics with strong growth in new production over the year (+26% vs. 9M-20)
Underlying figures(1)
€m
Q3-21 % change 9M-21 % change
Net banking income 303 6.7% 899 7.8%
Operating expenses (152) 2.7% (461) 3.4%
Gross operating income 151 11.0% 439 12.8%
Cost of risk (24) (31.4)% (85) (0.8)%
Income before tax(2) 126 26.0% 355 16.4%
Cost/income ratio(2) 50.5% (2.0)pp 51.1% (2.2)pp
50 INVESTOR PRESENTATION
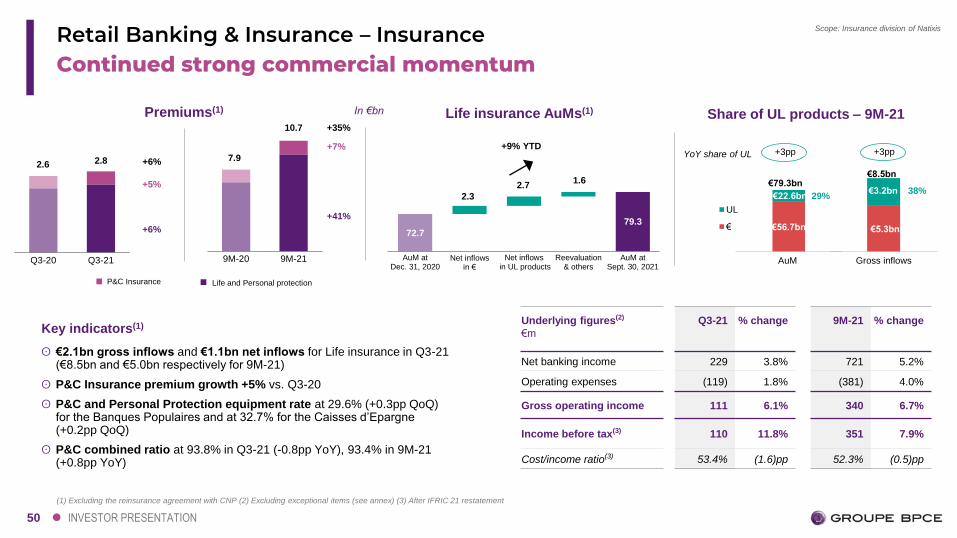
+3pp
Continued strong commercial momentumRetail Banking & Insurance – Insurance
(1) Excluding the reinsurance agreement with CNP (2) Excluding exceptional items (see annex) (3) After IFRIC 21 restatement
Life insurance AuMs(1)In €bn
Scope: Insurance division of Natixis
Q3-20 Q3-21
Premiums(1)
+6%
+5%
+6%2.6 2.8
Underlying figures(2)
€m
Q3-21 % change 9M-21 % change
Net banking income 229 3.8% 721 5.2%
Operating expenses (119) 1.8% (381) 4.0%
Gross operating income 111 6.1% 340 6.7%
Income before tax(3) 110 11.8% 351 7.9%
Cost/income ratio(3) 53.4% (1.6)pp 52.3% (0.5)pp
72.777.7 79.3
2.3
2.71.6
AuM atDec. 31, 2020
Net inflows in €
Net inflows in UL products
Reevaluation& others
AuM atSept. 30, 2021
+9% YTD
Key indicators(1)
ʘ €2.1bn gross inflows and €1.1bn net inflows for Life insurance in Q3-21 (€8.5bn and €5.0bn respectively for 9M-21)
ʘ P&C Insurance premium growth +5% vs. Q3-20
ʘ P&C and Personal Protection equipment rate at 29.6% (+0.3pp QoQ) for the Banques Populaires and at 32.7% for the Caisses d’Epargne (+0.2pp QoQ)
ʘ P&C combined ratio at 93.8% in Q3-21 (-0.8pp YoY), 93.4% in 9M-21(+0.8pp YoY)
€5.3bn
Gross inflows
YoY share of UL
€56.7bn
AuM
UL
€
€79.3bn
€22.6bn 29%
€8.5bn
38%€3.2bn
Share of UL products – 9M-21
9M-20 9M-21
+41%
+7%
+35%
P&C Insurance Life and Personal protection
7.9
10.7
+3pp
51 INVESTOR PRESENTATION
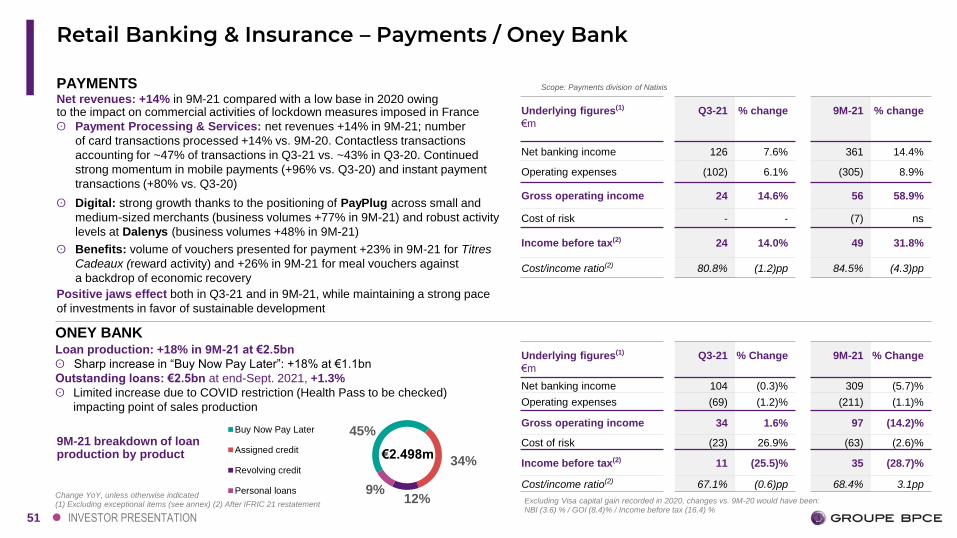
Retail Banking & Insurance – Payments / Oney Bank
Change YoY, unless otherwise indicated(1) Excluding exceptional items (see annex) (2) After IFRIC 21 restatement
ONEY BANK
9%12%
34%
45%Buy Now Pay Later
Assigned credit
Revolving credit
Personal loans
9M-21 breakdown of loan production by product €2.498m
Scope: Payments division of Natixis
Net revenues: +14% in 9M-21 compared with a low base in 2020 owing to the impact on commercial activities of lockdown measures imposed in France
ʘ Payment Processing & Services: net revenues +14% in 9M-21; number
of card transactions processed +14% vs. 9M-20. Contactless transactions
accounting for ~47% of transactions in Q3-21 vs. ~43% in Q3-20. Continued
strong momentum in mobile payments (+96% vs. Q3-20) and instant payment
transactions (+80% vs. Q3-20)
ʘ Digital: strong growth thanks to the positioning of PayPlug across small and
medium-sized merchants (business volumes +77% in 9M-21) and robust activity
levels at Dalenys (business volumes +48% in 9M-21)
ʘ Benefits: volume of vouchers presented for payment +23% in 9M-21 for Titres
Cadeaux (reward activity) and +26% in 9M-21 for meal vouchers against
a backdrop of economic recovery
Positive jaws effect both in Q3-21 and in 9M-21, while maintaining a strong pace
of investments in favor of sustainable development
PAYMENTS
Loan production: +18% in 9M-21 at €2.5bn
ʘ Sharp increase in “Buy Now Pay Later”: +18% at €1.1bn
Outstanding loans: €2.5bn at end-Sept. 2021, +1.3%
ʘ Limited increase due to COVID restriction (Health Pass to be checked)
impacting point of sales production
Underlying figures(1)
€m
Q3-21 % Change 9M-21 % Change
Net banking income 104 (0.3)% 309 (5.7)%
Operating expenses (69) (1.2)% (211) (1.1)%
Gross operating income 34 1.6% 97 (14.2)%
Cost of risk (23) 26.9% (63) (2.6)%
Income before tax(2) 11 (25.5)% 35 (28.7)%
Cost/income ratio(2) 67.1% (0.6)pp 68.4% 3.1pp
Underlying figures(1)
€m
Q3-21 % change 9M-21 % change
Net banking income 126 7.6% 361 14.4%
Operating expenses (102) 6.1% (305) 8.9%
Gross operating income 24 14.6% 56 58.9%
Cost of risk - - (7) ns
Income before tax(2) 24 14.0% 49 31.8%
Cost/income ratio(2) 80.8% (1.2)pp 84.5% (4.3)pp
Excluding Visa capital gain recorded in 2020, changes vs. 9M-20 would have been:NBI (3.6) % / GOI (8.4)% / Income before tax (16.4) %
52 INVESTOR PRESENTATION
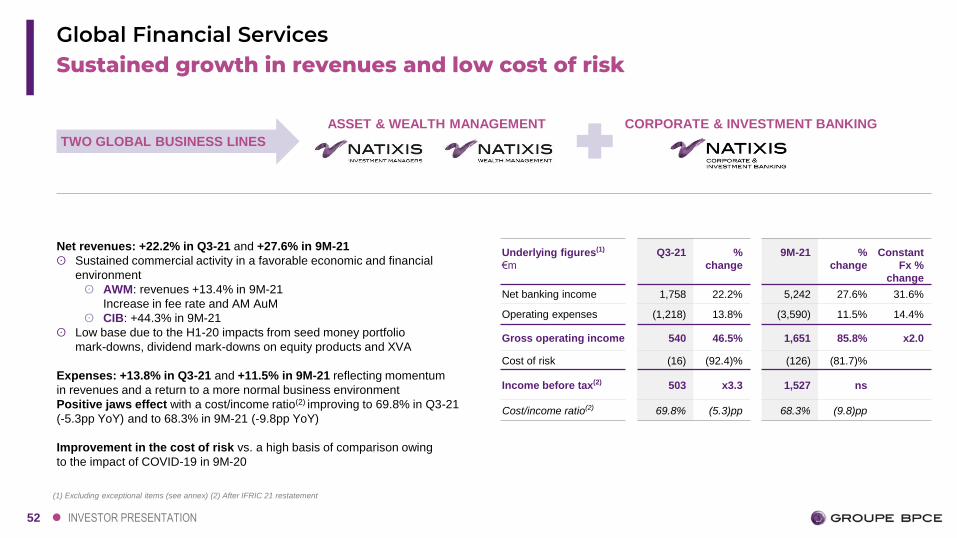
Sustained growth in revenues and low cost of riskGlobal Financial Services
(1) Excluding exceptional items (see annex) (2) After IFRIC 21 restatement
TWO GLOBAL BUSINESS LINES
CORPORATE & INVESTMENT BANKINGASSET & WEALTH MANAGEMENT
Underlying figures(1)
€m
Q3-21 %
change
9M-21 %
change
Constant
Fx %
change
Net banking income 1,758 22.2% 5,242 27.6% 31.6%
Operating expenses (1,218) 13.8% (3,590) 11.5% 14.4%
Gross operating income 540 46.5% 1,651 85.8% x2.0
Cost of risk (16) (92.4)% (126) (81.7)%
Income before tax(2) 503 x3.3 1,527 ns
Cost/income ratio(2) 69.8% (5.3)pp 68.3% (9.8)pp
Net revenues: +22.2% in Q3-21 and +27.6% in 9M-21
ʘ Sustained commercial activity in a favorable economic and financial
environment
ʘ AWM: revenues +13.4% in 9M-21
Increase in fee rate and AM AuM
ʘ CIB: +44.3% in 9M-21
ʘ Low base due to the H1-20 impacts from seed money portfolio
mark-downs, dividend mark-downs on equity products and XVA
Expenses: +13.8% in Q3-21 and +11.5% in 9M-21 reflecting momentum
in revenues and a return to a more normal business environment
Positive jaws effect with a cost/income ratio(2) improving to 69.8% in Q3-21
(-5.3pp YoY) and to 68.3% in 9M-21 (-9.8pp YoY)
Improvement in the cost of risk vs. a high basis of comparison owing
to the impact of COVID-19 in 9M-20
53 INVESTOR PRESENTATION
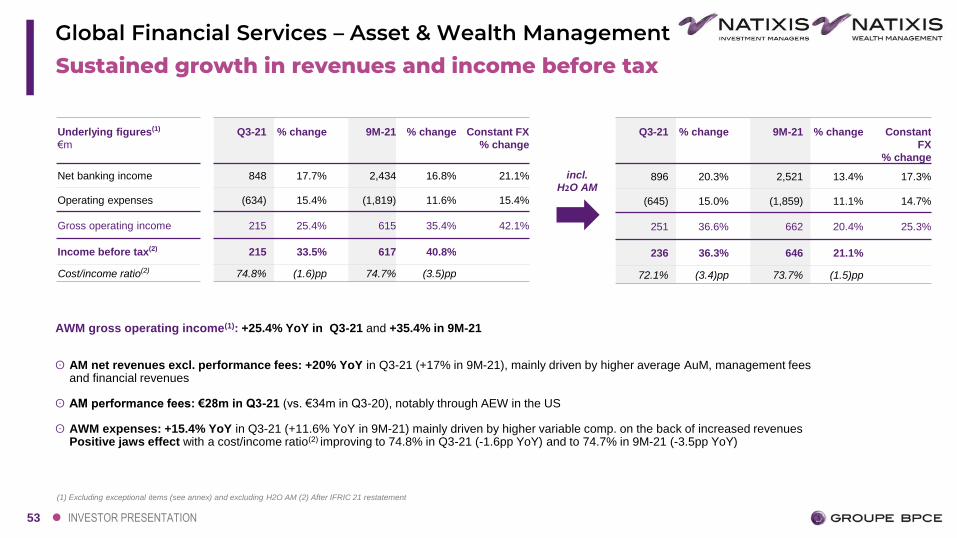
Sustained growth in revenues and income before tax
Global Financial Services – Asset & Wealth Management
AWM gross operating income(1): +25.4% YoY in Q3-21 and +35.4% in 9M-21
ʘ AM net revenues excl. performance fees: +20% YoY in Q3-21 (+17% in 9M-21), mainly driven by higher average AuM, management fees and financial revenues
ʘ AM performance fees: €28m in Q3-21 (vs. €34m in Q3-20), notably through AEW in the US
ʘ AWM expenses: +15.4% YoY in Q3-21 (+11.6% YoY in 9M-21) mainly driven by higher variable comp. on the back of increased revenues Positive jaws effect with a cost/income ratio(2) improving to 74.8% in Q3-21 (-1.6pp YoY) and to 74.7% in 9M-21 (-3.5pp YoY)
(1) Excluding exceptional items (see annex) and excluding H2O AM (2) After IFRIC 21 restatement
Underlying figures(1)
€m
Q3-21 % change 9M-21 % change Constant FX
% change
Net banking income 848 17.7% 2,434 16.8% 21.1%
Operating expenses (634) 15.4% (1,819) 11.6% 15.4%
Gross operating income 215 25.4% 615 35.4% 42.1%
Income before tax(2) 215 33.5% 617 40.8%
Cost/income ratio(2) 74.8% (1.6)pp 74.7% (3.5)pp
833
Q3-21 % change 9M-21 % change Constant
FX
% change
896 20.3% 2,521 13.4% 17.3%
(645) 15.0% (1,859) 11.1% 14.7%
251 36.6% 662 20.4% 25.3%
236 36.3% 646 21.1%
72.1% (3.4)pp 73.7% (1.5)pp
incl. H2O AM
54 INVESTOR PRESENTATION
25 43 7 (7) (3)
213250 330 287 273
33
127167
10876
321
343
336
393384
93
12696
135143
Q3-20 Q4-20 Q1-21 Q2-21 Q3-21
CVA/DVA desk FIC-T Equity Global finance Investment bankingand M&A
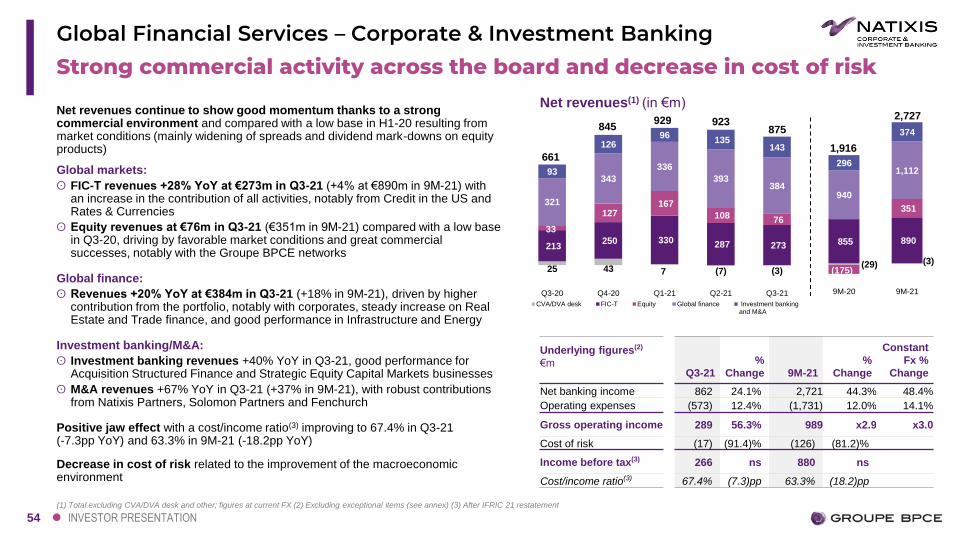
Strong commercial activity across the board and decrease in cost of risk
Global Financial Services – Corporate & Investment Banking
Net revenues continue to show good momentum thanks to a strong commercial environment and compared with a low base in H1-20 resulting from market conditions (mainly widening of spreads and dividend mark-downs on equity products)
Global markets:
ʘ FIC-T revenues +28% YoY at €273m in Q3-21 (+4% at €890m in 9M-21) withan increase in the contribution of all activities, notably from Credit in the US and Rates & Currencies
ʘ Equity revenues at €76m in Q3-21 (€351m in 9M-21) compared with a low base in Q3-20, driving by favorable market conditions and great commercial successes, notably with the Groupe BPCE networks
Global finance:
ʘ Revenues +20% YoY at €384m in Q3-21 (+18% in 9M-21), driven by higher contribution from the portfolio, notably with corporates, steady increase on Real Estate and Trade finance, and good performance in Infrastructure and Energy
Investment banking/M&A:
ʘ Investment banking revenues +40% YoY in Q3-21, good performance for Acquisition Structured Finance and Strategic Equity Capital Markets businesses
ʘ M&A revenues +67% YoY in Q3-21 (+37% in 9M-21), with robust contributions from Natixis Partners, Solomon Partners and Fenchurch
Positive jaw effect with a cost/income ratio(3) improving to 67.4% in Q3-21 (-7.3pp YoY) and 63.3% in 9M-21 (-18.2pp YoY)
Decrease in cost of risk related to the improvement of the macroeconomic environment
(1) Total excluding CVA/DVA desk and other; figures at current FX (2) Excluding exceptional items (see annex) (3) After IFRIC 21 restatement
Net revenues(1) (in €m)
845
Underlying figures(2)
€mQ3-21
%
Change 9M-21
%
Change
Constant
Fx %
Change
Net banking income 862 24.1% 2,721 44.3% 48.4%
Operating expenses (573) 12.4% (1,731) 12.0% 14.1%
Gross operating income 289 56.3% 989 x2.9 x3.0
Cost of risk (17) (91.4)% (126) (81.2)%
Income before tax(3) 266 ns 880 ns
Cost/income ratio(3) 67.4% (7.3)pp 63.3% (18.2)pp
929 923875
661
(29) (3)
855 890
(175)
351
940
1,112296
374
9M-20 9M-21
1,916
2,727
55 INVESTOR PRESENTATION
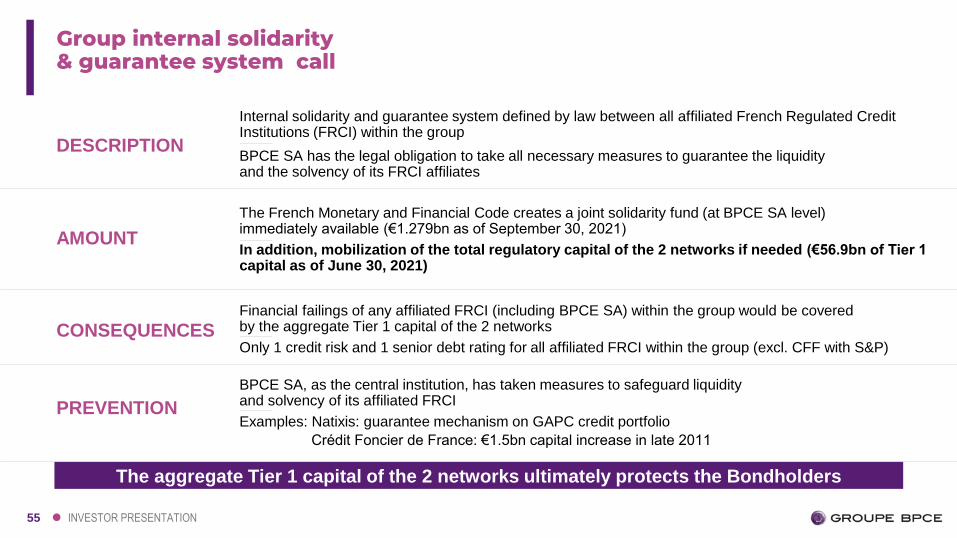
Group internal solidarity& guarantee system call
DESCRIPTION
Internal solidarity and guarantee system defined by law between all affiliated French Regulated Credit Institutions (FRCI) within the group
BPCE SA has the legal obligation to take all necessary measures to guarantee the liquidity and the solvency of its FRCI affiliates
AMOUNT
The aggregate Tier 1 capital of the 2 networks ultimately protects the Bondholders
The French Monetary and Financial Code creates a joint solidarity fund (at BPCE SA level) immediately available (€1.279bn as of September 30, 2021)
In addition, mobilization of the total regulatory capital of the 2 networks if needed (€56.9bn of Tier 1 capital as of June 30, 2021)
CONSEQUENCESFinancial failings of any affiliated FRCI (including BPCE SA) within the group would be covered by the aggregate Tier 1 capital of the 2 networks
Only 1 credit risk and 1 senior debt rating for all affiliated FRCI within the group (excl. CFF with S&P)
PREVENTION
BPCE SA, as the central institution, has taken measures to safeguard liquidity and solvency of its affiliated FRCI
Examples: Natixis: guarantee mechanism on GAPC credit portfolio
Crédit Foncier de France: €1.5bn capital increase in late 2011
56 INVESTOR PRESENTATION
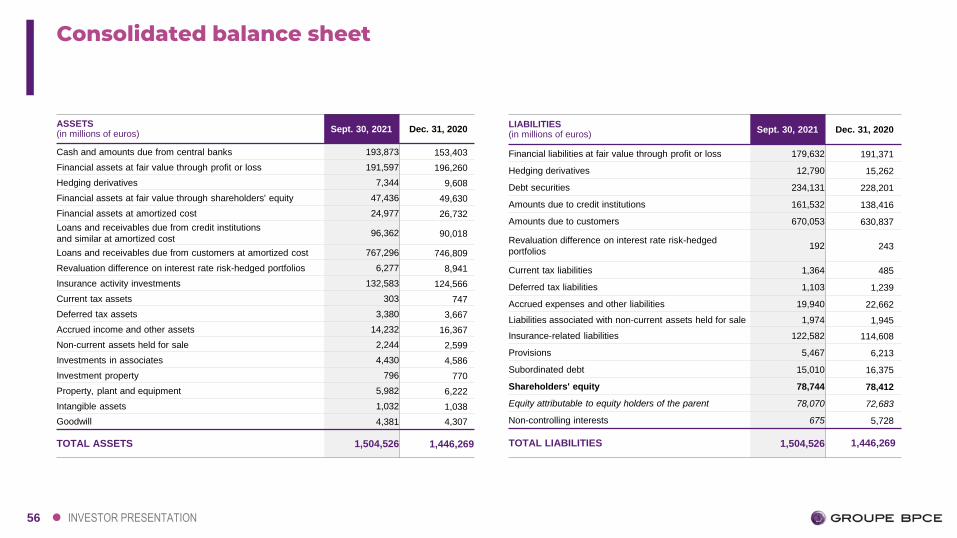
Consolidated balance sheet
ASSETS (in millions of euros)
Sept. 30, 2021 Dec. 31, 2020
Cash and amounts due from central banks 193,873 153,403
Financial assets at fair value through profit or loss 191,597 196,260
Hedging derivatives 7,344 9,608
Financial assets at fair value through shareholders' equity 47,436 49,630
Financial assets at amortized cost 24,977 26,732
Loans and receivables due from credit institutions
and similar at amortized cost96,362 90,018
Loans and receivables due from customers at amortized cost 767,296 746,809
Revaluation difference on interest rate risk-hedged portfolios 6,277 8,941
Insurance activity investments 132,583 124,566
Current tax assets 303 747
Deferred tax assets 3,380 3,667
Accrued income and other assets 14,232 16,367
Non-current assets held for sale 2,244 2,599
Investments in associates 4,430 4,586
Investment property 796 770
Property, plant and equipment 5,982 6,222
Intangible assets 1,032 1,038
Goodwill 4,381 4,307
TOTAL ASSETS 1,504,526 1,446,269
LIABILITIES (in millions of euros)
Sept. 30, 2021 Dec. 31, 2020
Financial liabilities at fair value through profit or loss 179,632 191,371
Hedging derivatives 12,790 15,262
Debt securities 234,131 228,201
Amounts due to credit institutions 161,532 138,416
Amounts due to customers 670,053 630,837
Revaluation difference on interest rate risk-hedged
portfolios192 243
Current tax liabilities 1,364 485
Deferred tax liabilities 1,103 1,239
Accrued expenses and other liabilities 19,940 22,662
Liabilities associated with non-current assets held for sale 1,974 1,945
Insurance-related liabilities 122,582 114,608
Provisions 5,467 6,213
Subordinated debt 15,010 16,375
Shareholders' equity 78,744 78,412
Equity attributable to equity holders of the parent 78,070 72,683
Non-controlling interests 675 5,728
TOTAL LIABILITIES 1,504,526 1,446,269
57 INVESTOR PRESENTATION
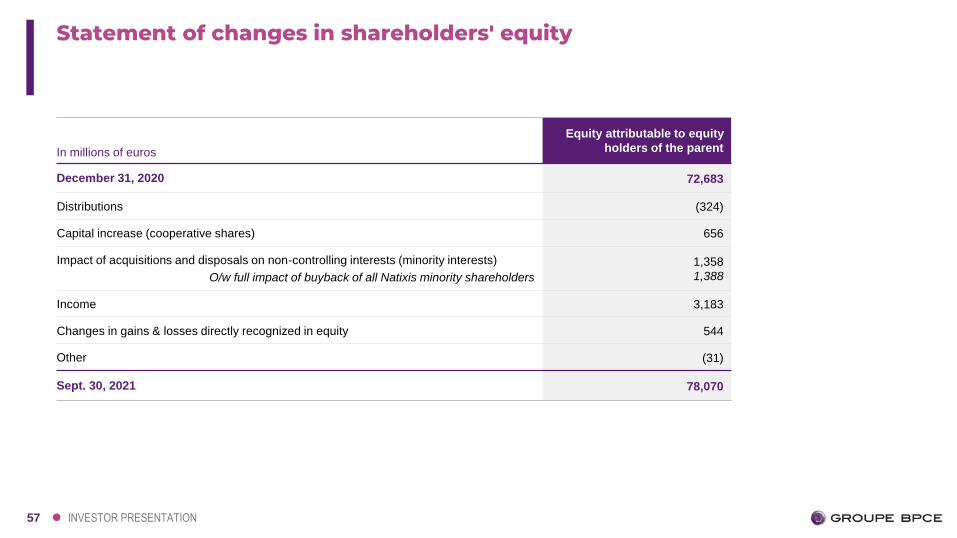
Statement of changes in shareholders' equity
In millions of euros
Equity attributable to equity
holders of the parent
December 31, 2020 72,683
Distributions (324)
Capital increase (cooperative shares) 656
Impact of acquisitions and disposals on non-controlling interests (minority interests)
O/w full impact of buyback of all Natixis minority shareholders
1,358
1,388
Income 3,183
Changes in gains & losses directly recognized in equity 544
Other (31)
Sept. 30, 2021 78,070
58 INVESTOR PRESENTATION
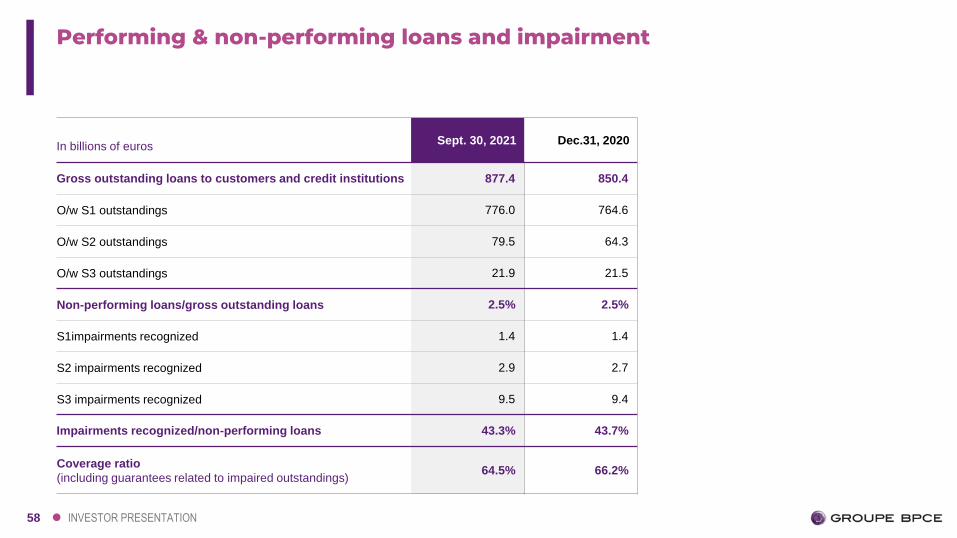
Performing & non-performing loans and impairment
In billions of eurosSept. 30, 2021 Dec.31, 2020
Gross outstanding loans to customers and credit institutions 877.4 850.4
O/w S1 outstandings 776.0 764.6
O/w S2 outstandings 79.5 64.3
O/w S3 outstandings 21.9 21.5
Non-performing loans/gross outstanding loans 2.5% 2.5%
S1impairments recognized 1.4 1.4
S2 impairments recognized 2.9 2.7
S3 impairments recognized 9.5 9.4
Impairments recognized/non-performing loans 43.3% 43.7%
Coverage ratio
(including guarantees related to impaired outstandings)64.5% 66.2%
59 INVESTOR PRESENTATION
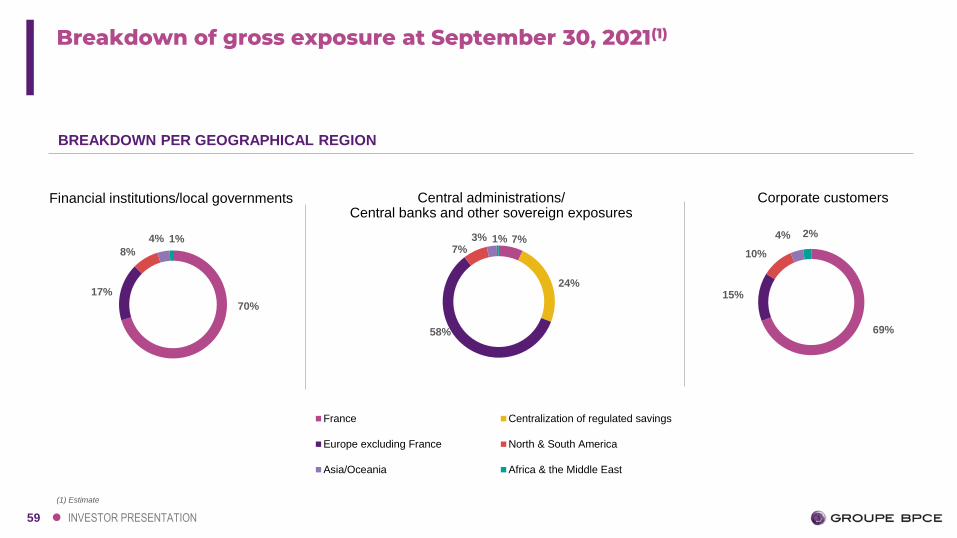
7%
24%
58%
7%3% 1%
France Centralization of regulated savings
Europe excluding France North & South America
Asia/Oceania Africa & the Middle East
Breakdown of gross exposure at September 30, 2021(1)
Financial institutions/local governments Central administrations/Central banks and other sovereign exposures
Corporate customers
70%
17%
8%
4% 1%
BREAKDOWN PER GEOGRAPHICAL REGION
(1) Estimate
69%
15%
10%
4% 2%
60 INVESTOR PRESENTATION
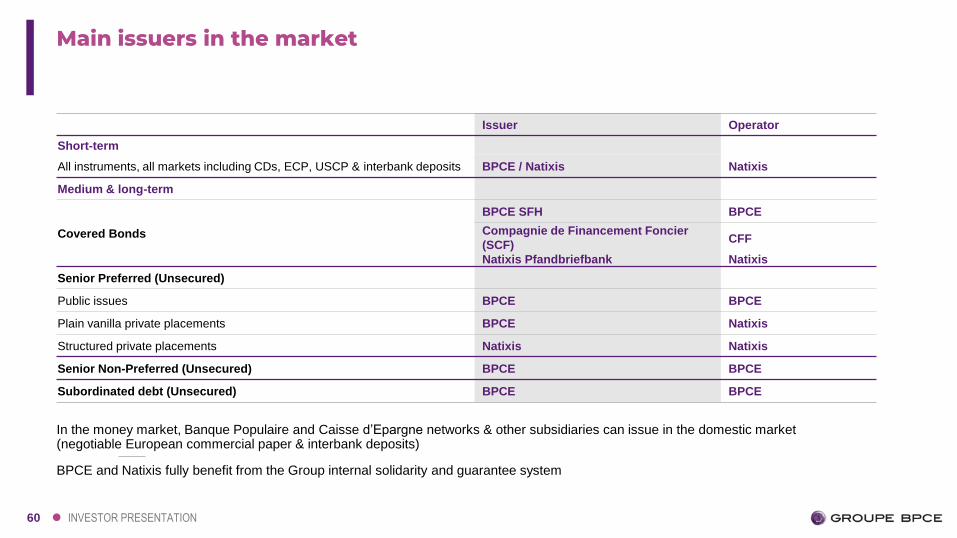
Main issuers in the market
Issuer Operator
Short-term
All instruments, all markets including CDs, ECP, USCP & interbank deposits BPCE / Natixis Natixis
Medium & long-term
Covered Bonds
BPCE SFH BPCE
Compagnie de Financement Foncier
(SCF)
Natixis Pfandbriefbank
CFF
Natixis
Senior Preferred (Unsecured)
Public issues BPCE BPCE
Plain vanilla private placements BPCE Natixis
Structured private placements Natixis Natixis
Senior Non-Preferred (Unsecured) BPCE BPCE
Subordinated debt (Unsecured) BPCE BPCE
In the money market, Banque Populaire and Caisse d’Epargne networks & other subsidiaries can issue in the domestic market (negotiable European commercial paper & interbank deposits)
BPCE and Natixis fully benefit from the Group internal solidarity and guarantee system
61 INVESTOR PRESENTATION
CONTACT LIST
BPCE
Roland CharbonnelHead of Group Funding & Investor Relations
+33 1 58 40 69 30
Jean-Philippe BerthautHead of Group Funding
+33 1 58 40 69 15
François CourtoisHead of Investor Relations
+33 1 58 40 46 69
France de SuryDeputy Head of Investor Relations
+33 1 58 40 39 95
Anne SadournyInvestor Relations
+33 1 58 40 76 59
Cindy AmarInvestor Relations APAC
+ 852 3915 1314
Marianne MedoraInvestor Relations Americas
+1 212 891 5782
Damien PommierInvestor Relations Americas
+1 212 632 2856