Embed Size (px)
Citation preview

Michael Cembalest
Chairman of Market and Investment Strategy
JP Morgan Asset Management
2022 Ey e on the Market Energy Paper
The events in Europe underscore the three unifying principles of our annual energy paper since its inception 12 years ago:
energy transitions differ sharply from transitions in technology, healthcare and other sectors
decarbonization of electricity is underway but decarbonization of industrial production, transport and heating lag m uch further behind
countries that reduce production of fossil fuels under the assumption that renewables can quickly replace them face substantial economic and geopolitical risks
The bottom chart shows performance of fossil fuel companies and their reportedly stranded assets vs renewable energy companies. To quote Mark Twain: “Reports of my death are greatly exaggerated”/ We review many of the reasons why in this year’s paper/ My recommendation as you think about energy issues: ignore all the hype, hyperbole and hockey stick forecasts and focus on the actual trends in the energy transition.
Speed of disruption: some of these things are not like the others
1
Percent90% Percent of US population owning a smartphone
NYC rideshare percent of dispatched trips80%
Rural home broadband adoption70%
Digital share of ad sales60% Developing world internet access
50%
40% Percent of adults using Instagram
30%E-commerce share of clothing sales
20%
10% Wind and solar share of global primary energy consumption
EV share of global vehicles owned0%
2000 2003 2006 2009 2012 2015 2018 2021
Source: GroupM, Census, BP, IEA, FHV, Pew Research, NYC Taxi & Limousine Commission, JPMAM. 2021.
Reports of my death are greatly exaggeratedRolling 12 mo. outperformance of fossil fuels vs renewable energy, %
100%
50%
0%
-50%
-100%
-150%
-200%
2014 2015 2016 2017 2018 2019 2020 2021 2022
Renewable composite:NASDAQ Clean Edge IndexWilderHill Clean Energy IndexFTSE Environmental Opportunities Index S&P Global Clean Energy Index MAC Global Solar Energy IndexFossil fuels: MSCI Global Energy Composite
Source: Bloomberg, MSCI, JPMAM. April 29, 2022.
2
Executive Summary
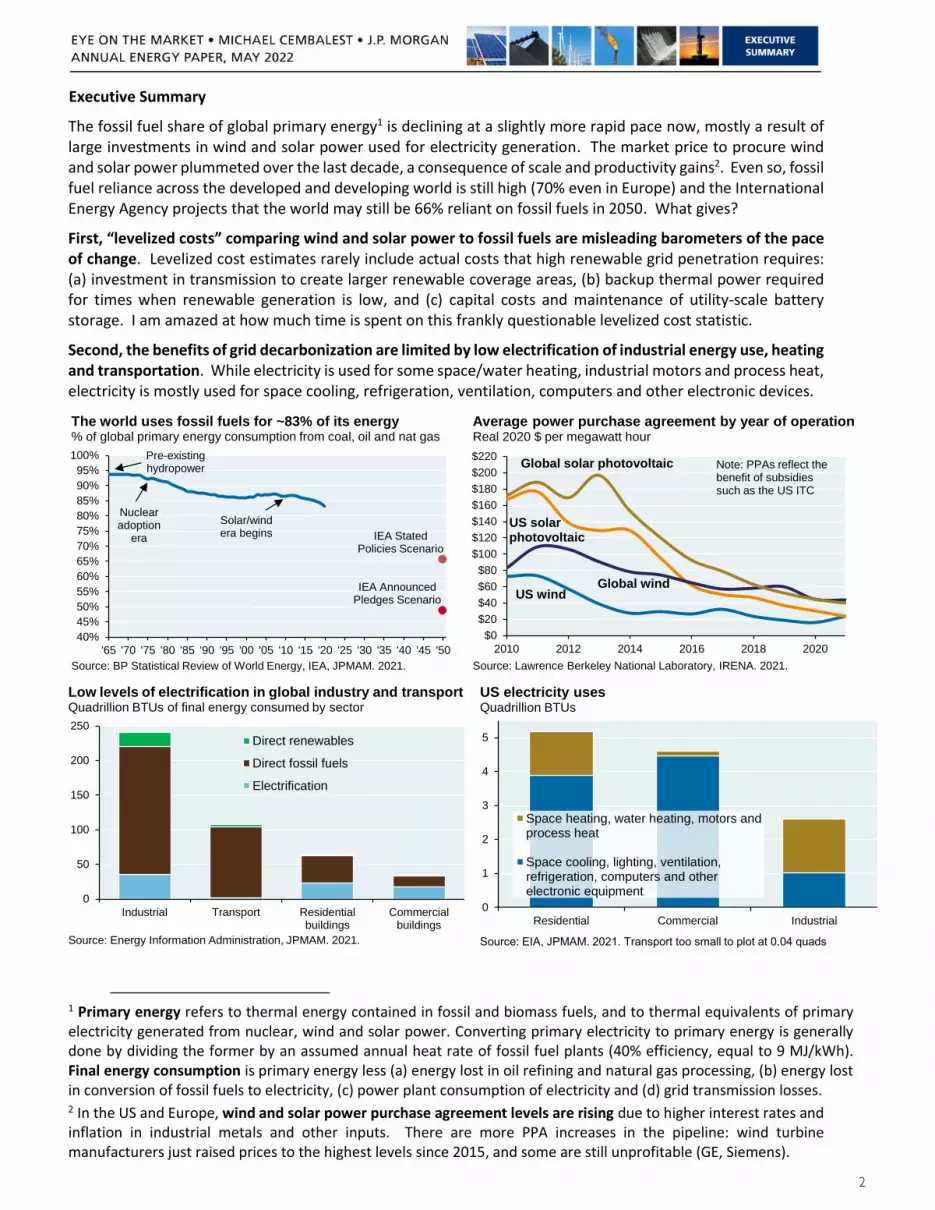
The fossil fuel share of global primary energy1 is declining at a slightly more rapid pace now, mostly a result of large investments in wind and solar power used for electricity generation. The market price to procure wind and solar power plummeted over the last decade, a consequence of scale and productivity gains2. Even so, fossil fuel reliance across the developed and developing world is still high (70% even in Europe) and the International Energy Agency projects that the world may still be 66% reliant on fossil fuels in 2050. What gives?
First, “levelized costs” comparing wind and solar power to fossil fuels are misleading barometers of the pace of change. Levelized cost estimates rarely include actual costs that high renewable grid penetration requires: (a) investment in transmission to create larger renewable coverage areas, (b) backup thermal power required for times when renewable generation is low, and (c) capital costs and maintenance of utility-scale battery storage. I am amazed at how much time is spent on this frankly questionable levelized cost statistic.
Second, the benefits of grid decarbonization are limited by low electrification of industrial energy use, heating and transportation. While electricity is used for some space/water heating, industrial motors and process heat, electricity is mostly used for space cooling, refrigeration, ventilation, computers and other electronic devices.
The world uses fossil fuels for ~83% of its energy% of global primary energy consumption from coal, oil and nat gas
40%
45%
50%
55%
60%
65%
70%
75%
80%
85%
90%
95%
100%
'65 '70 '75 '80 '85 '90 '95 '00 '05 '10 '15 '20 '25 '30 '35 '40 '45 '50
Nuclearadoption
era
Solar/windera begins
Pre-existinghydropower
IEA Stated Policies Scenario
IEA Announced Pledges Scenario
Source: BP Statistical Review of World Energy, IEA, JPMAM. 2021.
Average power purchase agreement by year of operation Real 2020 $ per megawatt hour
$0
$20
$40
$60
$80
$100
$120
$140
$160
$180
$200
$220
2010 2012 2014 2016 2018 2020
US windGlobal wind
US solarphotovoltaic
Global solar photovoltaic Note: PPAs reflect the benefit of subsidies such as the US ITC
Source: Lawrence Berkeley National Laboratory, IRENA. 2021.
Low levels of electrification in global industry and transportQuadrillion BTUs of final energy consumed by sector
0
50
100
150
200
250
Industrial Transport Residential Commercialbuildings
Direct renewables
Direct fossil fuels
Electrification
buildings
Source: Energy Information Administration, JPMAM. 2021.
US electricity usesQuadrillion BTUs
0
1
2
3
4
5
Residential Commercial Industrial
Space heating, water heating, motors andprocess heat
Space cooling, lighting, ventilation,refrigeration, computers and otherelectronic equipment
Source: EIA, JPMAM. 2021. Transport too small to plot at 0.04 quads
1 Primary energy refers to thermal energy contained in fossil and biomass fuels, and to thermal equivalents of primary electricity generated from nuclear, wind and solar power. Converting primary electricity to primary energy is generally done by dividing the former by an assumed annual heat rate of fossil fuel plants (40% efficiency, equal to 9 MJ/kWh). Final energy consumption is primary energy less (a) energy lost in oil refining and natural gas processing, (b) energy lost in conversion of fossil fuels to electricity, (c) power plant consumption of electricity and (d) grid transmission losses. 2 In the US and Europe, wind and solar power purchase agreement levels are rising due to higher interest rates and inflation in industrial metals and other inputs. There are more PPA increases in the pipeline: wind turbine manufacturers just raised prices to the highest levels since 2015, and some are still unprofitable (GE, Siemens).

The third critical issue: the energy divide between the developed and developing world. Over the last 25 years, the developed world shifted much of its carbon-intensive manufacturing of steel, cement, ammonia and plastics to the developing world. While the developed world is projected to continue reducing its energy consumption, developing world energy consumption is projected to keep rising (second chart). And as a reminder, coal is still widely relied upon in many developing countries, and also Japan (fourth chart).
A shift in energy intensive manufacturing to the emerging world, % of global production
0%10%20%30%40%50%60%70%80%90%
100%
1995 2020 1998 2021 1998 2020 1998 2021 2005 2020Manufacturing SteelAmmonia Cement
Developed economies
Emerging economies
Plastic
Source: UN Dept. of Social and Economic Affairs, Worldsteel, PlasticsEurope, USGS. 2021.
China is the only EM country projected to slow primary energy consumption growth over the next three decadesChange in primary energy, exajoules
-20
-10
0
10
20
30
40
50
EU Japan US LatinAmerica
SE Asiaex-
China/India
MiddleEast
Africa China India
Historical change 2010 to 2020Projected change 2020 to 2050
Source: International Energy Agency Stated Policies Scenario. 2021.
Wind, solar, hydro and other renewables share of primary energy, Percent, with dotted line for wind/solar only
0%
2%
4%
6%
8%
10%
12%
14%
16%
1965 1975 1985 1995 2005 2015 2025
OECDChinaNon-OECD ex China
Source: BP Statistical Review of World Energy, JPMAM. 2021.
Coal share of primary energy consumptionPercent
0%
10%
20%
30%
40%
50%
60%
70%
80%
'90 '93 '96 '99 '02 '05 '08 '11 '14 '17 '20
South Africa
China
India
Vietnam
Poland
Indonesia
Japan
Germany
US
Source: BP Statistical Review of World Energy, JPMAM. 2021.
The world gets more energy efficient every year, but emissions levels keep rising/ That’s why most deep decarbonization ideas rely on replacement of fossil fuels rather than on reducing fossil fuel consumption per capita or per unit of performance.
Global CO2 intensity declining, CO2 emissions risingTonnes of CO2 / thousand $2020 GDP Billion tonnes
10
15
20
25
30
35
0.20
0.25
0.30
0.35
0.40
0.45
0.50
0.55
1965 1970 1975 1980 1985 1990 1995 2000 2005 2010 2015 2020
CO2 intensity CO2 emissions
Source: BP Statistical Review of World Energy, Conference Board, IHS Markit, JPMAM. 2021.
3

“Reports of my death are greatly exaggerated”
Some of the most ill-advised things I’ve ever heard about energy were said during the spike in renewable energy stocks in 2020/ The short version. “fossil fuel stocks are dead money since the renewable transition is irreversible, ready to power large economies and rapidly displacing the former/” Irreversible, yes- the rest of it, not so much. In our 2020 and 2021 energy papers, we argued that stars were aligning for a substantial rebound in oil and gas profitability. The reason: poor oil & gas stock price performance was the result of management decisions to focus on market share and revenue rather than profits, and not because of imminent displacement by renewable energy. As shown below, oil & gas industry cash flow and oil demand rebounded sharply in 2021.
The big picture: global gas and coal consumption in 2021 were already above pre-COVID levels, and global oil consumption should surpass pre-COVID levels sometime next year. Looking further out, some forecasts of oil demand in 2030 and 2040 are not that different from today. We also estimate that the US might need almost as much natural gas in the year 2035 as it consumes today, based on assumptions we made on wind and solar growth, EV and heat pump adoption and the decommissioning of coal and nuclear plants3. With energy demand still in excess of supply, I believe the MSCI Global Energy Composite will outperform both renewable energy stocks4 and the broad equity market again over the next year.
Reports of my death are greatly exaggeratedRolling 12 mo. outperformance of fossil fuels vs renewable energy, %
-200%
-150%
-100%
-50%
0%
50%
100%
2014 2015 2016 2017 2018 2019 2020 2021 2022
Renewable composite: NASDAQ Clean Edge IndexWilderHill Clean Energy IndexFTSE Environmental Opportunities IndexS&P Global Clean Energy Index MAC Global Solar Energy IndexFossil fuels: MSCI Global Energy Composite
Source: Bloomberg, MSCI, JPMAM. April 29, 2022.
Oil and gas industry finally turns a profitFree cash flow, $ billions
-$12
-$8
-$4
$0
$4
$8
$12
$16
$20
$24
2013 2014 2015 2016 2017 2018 2019 2020 2021 2022
S&P 1500 Oil and Gas E&P Index
Shale revolution portfolio(22 companies)
Source: Bloomberg. Q1 2022. Dots represent consensus estimates.
Oil demand, supply from existing fields and demand projectionsMillion barrels per day
JPM IB
40
50
60
70
80
90
100
110
120
130
1970 1980 1990 2000 2010 2020 2030 2040 2050
Oil supply (assuming no new
development)
BP BAU
Wood Mac
OPEC
EIA RC
IEA AP
IEA SP
JPM IB Investment BankWood MackenzieEIA RC Reference CaseEIA LG Low GDP GrowthIEA SP Stated PoliciesBP BAU Business as UsualIEA AP Announced Pledges
EIA LG
Source: BP, EIA, IEA, OPEC, Wood Mackenzie, JP Morgan Investment Bank, JPMAM. 2021.
Energy sector highlights
Earnings estimates still do not reflect higher energy prices, rising domestic production and operating leverage
Energy sector still trades at 9.5x fwd earnings vs 16.5x avg since 1990
Energy sector trades at 1x book value and is an inflation hedge; also capital intensive and less sensitive to wages
Energy sector only 4% of S&P market cap vs 20 year avg of 8%
Some asset manager ESG filters may be relaxed after recent performance
Source: JP Morgan Global Equity Strategy
3 See 2021 Eye on the Market energy paper, pages 32-33. 4 Renewable energy profitability, or lack thereof. From 40%-60% of the companies in the Renewable Energy indices shown above are not expected to have positive free cash flow in 2023. Furthermore, most indices include large industrial companies with subsidiary renewable energy businesses (Con Ed, ON semiconductors, the Indian conglomerate Adani, Quanta Services infrastructure, Linde and Air Liquide industrial gases, Wolfspeed semiconductors, etc). In other words, “pure play” renewable companies have an even higher rate of negative free cash flow if we strip out the big industrial companies.
4

Europe is paying a steep price for its reliance on Russian energy
Europe miscalculated by reducing its production of fossil fuels much faster than it reduced its own consumption of fossil fuels, and is caught in the vice of Russian energy reliance. Ramifications for Europe include: a likely recession; energy consumption displacing non-energy goods and services; a lower rate of growth and a decline in competitiveness of exported energy intensive goods; risks that “cold turkey” withdrawal from Russian energy will require curtailment of industrial production (steel, fertilizer, cement etc) and related employment; higher food prices; and domestic political tensions as anti-establishment candidates take advantage of distress. Latest news: Russia cut off Poland and Bulgaria from natural gas shipments since they refused to pay in Rubles.
For the record: Mitt Romney warned everyone about Russia during the 2012 Presidential election. He was mocked by Democrats for doing so in 2012, and then ignored by Republicans in 2016.
Europe curtails oil & gas production while keeping imports unchanged, Thousand barrels per day of oil equivalent
0
2,000
4,000
6,000
8,000
10,000
12,000
14,000
'80 '84 '88 '92 '96 '00 '04 '08 '12 '16 '20
European oil and gas production
European oil and gas imports from Russia
All other European oil and gas imports
Source: BP, Gazprom, Eurostat, Perovic et al, Russia Federal Customs Service, JPMAM calculations. 2021.
Energy dependence and independenceNet imports of oil, natural gas and coal in million tonnes of oil equiv.
-800
-600
-400
-200
0
200
400
600
800
1,000
1980 1990 2000 2010 2020
Europe
US
China
RussiaNet exporter
Net importer
Source: BP Statistical Review, NBS China, JPMAM. 2021.
The US-Europe electricity gapWholesale electricity price, US$/MWh, 7 day average
US, $50
Germany, Spain & France,
$235
UK, $209
$0$50
$100$150$200$250$300$350$400$450$500
2015 2016 2017 2018 2019 2020 2021 2022 2023Source: Bloomberg. May 3, 2022. Dots represent latest daily price.
The US-Europe natural gas gapWholesale natural gas price, US$ per MMBTU
US Henry Hub, $8
UK, $21
Europe, $32
$0
$10
$20
$30
$40
$50
$60
$70
$80
2019 2020 2021 2022Source: Bloomberg. May 3, 2022.
Russia dominates European gas import capacityAnnual gas import capacity for EU 27, TWh
Russia, 2,800
Norway, 1,100
North Africa,
800
Azerbaijan, 130
Spain, 700
France, 440
Italy, 200
Belgium, 170
Netherlands, 140
Greece, 70
Portugal, 70Poland, 60
Lithuania, 40
Croatia, 30
LNG import facility
Pipeline imports
Source: Bruegel, JPMAM. 2022.
Russian natural gas exports to EuropeMillion cubic meters per day, 7 day average
050
100150200250300350400450500550
Jan '19 Jul '19 Jan '20 Jul '20 Jan '21 Jul '21 Jan '22
Nord Stream 1
Via Ukraine
Yamal (Poland)
LNG
Source: Bloomberg, EIA, JPMAM. May 1, 2022. Excludes pipelines to and through Turkey. Annual LNG data amortized daily; no LNG data for 2022.
5

6
Can Europe quickly change course? They will try to. One plan we have seen entails replacing 2.6 mm bpd of Russian crude oil imports via the US (0.8 mm) and increased production from Canada, Norway, UK and Denmark (0.8 mm). Anything else could require a deal with Iran which still exports 1.3 mm bpd less than in 2018. Gas substitution is a lot harder: Europe imports 174 bcm per year from Russia, and our understanding is that there is not a lot of spare LNG regasification capacity. Spanish LNG regasification utilization rates were only 45% in January but it has limited pipeline connections with the rest of Europe. My guess is that Europe gets part of the way this year through diversification and then has to rely on longer term adjustments. Faster wind and solar? Installations are often constrained by transmission delays and local factors. Electrification of residential heating? So far, mostly confined to Scandinavia (see Section 3). More LNG regasification capacity? Expensive and time consuming. Greater use of nuclear power? The region has been abandoning it other than in France.
Europe is not the only region at risk: on a global basis, capital spending on oil and gas production is declining while oil and gas consumption is not. Many countries are now faced with three broad choices: ramp up their domestic production of fossil fuels to avoid a geopolitical and economic trap; rely on the countries in the table below for imported energy; or confront the obstacles to a faster renewable transition head-on.
The last option is not something that can be accomplished by increasing the cost of capital for fossil fuel companies or by university divestment. A faster transition requires a lot more than that: policymakers would have to curtail community delays and cancellation of renewable energy/transmission projects, and build consensus for some kind of price on carbon. Without these efforts, decarbonization will remain stuck in the slow lane despite all the corporate disclosure rules, shareholder resolutions, ESG policies, etc. A revival of the US “Build Back Better” bill could speed up the US transition a little5, but there is no news to report yet.
By the way, which country benefits most from renewable energy adoption from a production standpoint? China, of course (see table).
050100150200250300350400450500550
$0
$50
$100
$150
$200
$250
$300
$350
$400
$450
2005 2007 2009 2011 2013 2015 2017 2019 2021
Fossil fuel capex falling despite no change in consumptionUS$, billions Exajoules
Source: BP, Bloomberg, IEA, JPMAM. Dec 2021. Dotted lines = estimates.
Global primary energy fossil fuel use
Capital spending by S&P Global 1200 Energy companies
2020 COVID decline
Med
ia
Insu
ranc
e
Prof
essi
onal
ser
vice
s
Inte
rnet
Phar
ma
& b
iote
ch
Oil
refin
ers
Stee
l
Mar
ine
ship
ping
Min
ing
& m
etal
s
Oil
and
gas
prod
ucer
s
-50%
-40%
-30%
-20%
-10%
0%
10%
20%
Collapse in global investment in energy-intensive industries, 2022 expected investment level vs 10 year average
Source: GS, JPMAM. November 10, 2021.
Largest proven reserves of oil and natural gasNatural gas (tr cu ft)
1 Russia 1,3202 Iran 1,1343 Qatar 8714 Turkmenistan 4805 US 4466 China 2977 Venezuela 2218 Saudi Arabia 2139 UAE 21010 Nigeria 19311 Iraq 12512 Azerbaijan 88
Oil (billion barrels)1 Venezuela 3042 Saudi Arabia 2983 Canada 1684 Iran 1585 Iraq 1456 Russia 1087 Kuwait 1028 UAE 989 US 6910 Libya 4811 Nigeria 3712 Kazakhstan 30
Source: BP Statistical Review of World Energy. 2020.
Renewable production global market shareChina US EU
Solar PV module shipments, 2019 63% <5% <5%Wind capacity order book, 2019 46% 14% 40%Lithium ion battery manuf. capacity, 2021 79% 6% 9%EV mineral processing/refining (Nickel, Cobalt, Graphite, Lithium, Manganese avg)
79% 1% 6%
EV cathode/anode production 85% 1% 1%Sources: IEA, BNEF, S&P, Benchmark Mineral Intelligence, 2021.
5 Most of the bill's proposed spending is reportedly focused on energy efficiency in buildings, tax credits for wind/solar, raising EV tax credits from $7k to $12k, EV infrastructure, air pollution mitigation and reforestation. Proposed spending on hydrogen, CCS, nuclear power, transmission and renewable fuels is smaller.

Before getting started: beware of industrial decarbonization and carbon capture fairy tales
We covered two topics last year that are critical parts of the decarbonization challenge: the real-world difficulty in electrifying industrial energy use, and the massive cost/scope required for geologic carbon sequestration to make a material impact. Beware of hockey stock forecasts on these topics; progress has been and will likely remain very slow/ You can read more about them via the links below to last year’s sections.
Challenges of industrial electrification and decarbonization
Plastics, cement, steel, ammonia and other industrial materials form the building blocks of the modern world. Electricity is a small share of the energy used to create them; in the US, the electrification share has been unchanged for decades, a testament to the difficulty in increasing it. The primary challenges: (a) industrial production often relies on waste-to-heat energy which is lost during electrification, and (b) many industrial products are non-metallic which makes electrification harder. Natural gas and petroleum remain the dominant energy sources for industrial products. You can learn more at the link above.
Electricity a small share of industrial energy useQuadrillion BTUs of industrial energy consumed
0102030405060708090
100
Rest of non-OECD
China US Europe
Direct renewables
Direct fossil fuels
Electrification
Source: Energy Information Administration, JPMAM. 2021.
Electricity share of US industrial energy use unchanged for decades, Share of industrial energy use
0%
5%
10%
15%
20%
25%
30%
35%
40%
45%
1950 1960 1970 1980 1990 2000 2010 2020
Natural gas
Electricity
Petroleum
Source: EIA. October 2021.
The challenging energy math of geologic carbon sequestration and direct air carbon capture
One of the highest ratios in the world of energy science: the number of academic papers written on carbon sequestration divided by the actual amount of carbon sequestration (~0.1% of global emissions at last count). The infrastructure required for meaningful geologic carbon sequestration would be enormous. In addition, the energy and materials requirements for direct air carbon capture are essentially unworkable/ Here’s a quick summary of our conclusions on the topic from last year.
To sequester just 15%-20% of US CO2 emissions via traditional carbon capture and storage, the volume of US carbon sequestration (1.2 billion cubic meters) would need to exceed the volume of all US oil production in 2019 (858 billion cubic meters)/ That’s a LOT of infrastructure that does not exist
Gathering and storing 25% of global CO2 through direct air carbon capture could require 40% or more of global electricity generation, even when assuming the presence of waste heat to power the carbon capture, requiring ~1,200 TWh per Gt of CO2. This is clearly an absurd proposition. To quote one of the researchers we worked with, “direct air carbon capture is unfortunately an energetically and financially costly distraction in effective mitigation of climate changes at a meaningful scale”
Other efforts are based on “letting nature do the carbon capture work”/ One involves conversion of agricultural waste into low-energy, high-carbon oil using pyrolysis, after which the oil is injected underground. Another involves fast growing ocean kelp absorbing carbon, after which it sinks to low temperature depths which may limit the kelp’s decomposition/ Some profitable tech companies are reportedly paying $600 to $2,000 per ton of carbon to such start-ups. While these ideas might help individual companies hit their carbon footprint targets at a very high price, they are highly unlikely to move the sequestration needle on any meaningful scale.
7

.......................................................................................
.................................................................................
...
.................................
.................................
.................
.....................................................................................................................
This year’s energy paper: the Elephants in the Room
The phrase “elephants in the room” refers to glaringly obvious issues that need to be resolved. This year’s paper covers some of the elephants in the room regarding the energy transition.
We start with three topics on electrification, which is the foundation of many deep decarbonization plans. First, the morass of the US transmission grid, clogged interconnection queues and the growing number of renewable transmission projects rejected by landowners and environmental groups. After all, without a robust grid, electrification will be more difficult. Then, the latest on electric vehicle adoption, what policies might be needed to get US gasoline “super-users” to switch and how rising metals prices affect battery costs. We conclude the electrification section with a look at home heating. Replacing on-site combustion of natural gas, propane and fuel oil with electric heat pumps has been mentioned by the IEA as a critical step for the OECD to reduce its GHG footprint. But so far, residential heat pump adoption is mostly a Scandinavian phenomenon.
Next, a deep dive into the so-called hydrogen economy, which is still in its infancy. Ultimate hydrogen use cases may be narrower than advertised once costs, round-trip efficiency, materials handling and competition from direct electrification are factored in. The final section is on China, whose carbon intensity of energy consumption and emissions are the highest in the world. The IEA sees a path for deep decarbonization in China, but this path is highly reliant on a lot of very aggressive assumptions. We take a closer look.
Closing remarks: for some people who write about wind and dead birds, I made you a new name badge.
Table of Contents
Introductory comments on the electrification of everything 11
[1] The US transmission quagmire shows little sign of changing 12
[2] How should the US deal with gasoline super-users? And what about rising metals prices and battery costs? 16
[3] Residential heat pumps and fossil fuel combustion bans: more complicated than it looks 22
[4] Whydrogen? Use cases may be narrower than advertised, and the timeline is a long one 28
[5] China deep decarbonization projections are built upon a mountain of very aggressive assumptions 40
�losing comments: “Hello My Name Is<” 45
What am I not writing about? The GHG benefits of natural gas vs coal, since it’s not totally clear what they are
If you accept EP! data at face value, methane “leakage” rates from natural gas have fallen to ~1%, down from 2% in 1990. These rates include leakage from exploration, production, gathering, processing, transmission, storage and distribution. However, EPA emissions data is usually provided by the oil & gas industry and may not reflect variations in utilization or operating performance. As a result, climate scientists conduct their own measurements. Based on aerial, satellite and other surveillance methods, some believe that the EPA underestimates methane leakage rates by 50%-100% (some estimates are even higher). This would offset part of the very large GHG benefits normally associated with coal to gas switching; on a pure CO2 basis, gas has a 60% lower emissions rate than coal per MWh.
To be clear, coal mining has other highly negative environmental impacts: sulfur dioxide and nitrogen oxide emissions (though they have fallen sharply since the 2005 Clean Air Interstate Rule), mercury emissions and the aftermath from sludge, slurry and fly ash ponds that contain a variety of toxins. In any case, the real-world GHG impact of coal to gas switching may be quite different than the optimal version often assumed.
Sources include Robert Howarth (Cornell), the Harvard School of Public Health and the following studies: “Analysis of Oil and Gas Ethane and Methane Emissions in the Southcentral and Eastern US Using Four Seasons of Continuous Aircraft Ethane Measurements”, Barkley et al, JGR Atmospheres, May 2021 “Assessment of methane emissions from the U.S. oil and gas supply chain”, !lvarez et al, Science, June 2018 “Quantifying methane emissions from the largest oil-producing basin from space”, Zhang et al, Science Advances, April 2020
8
9
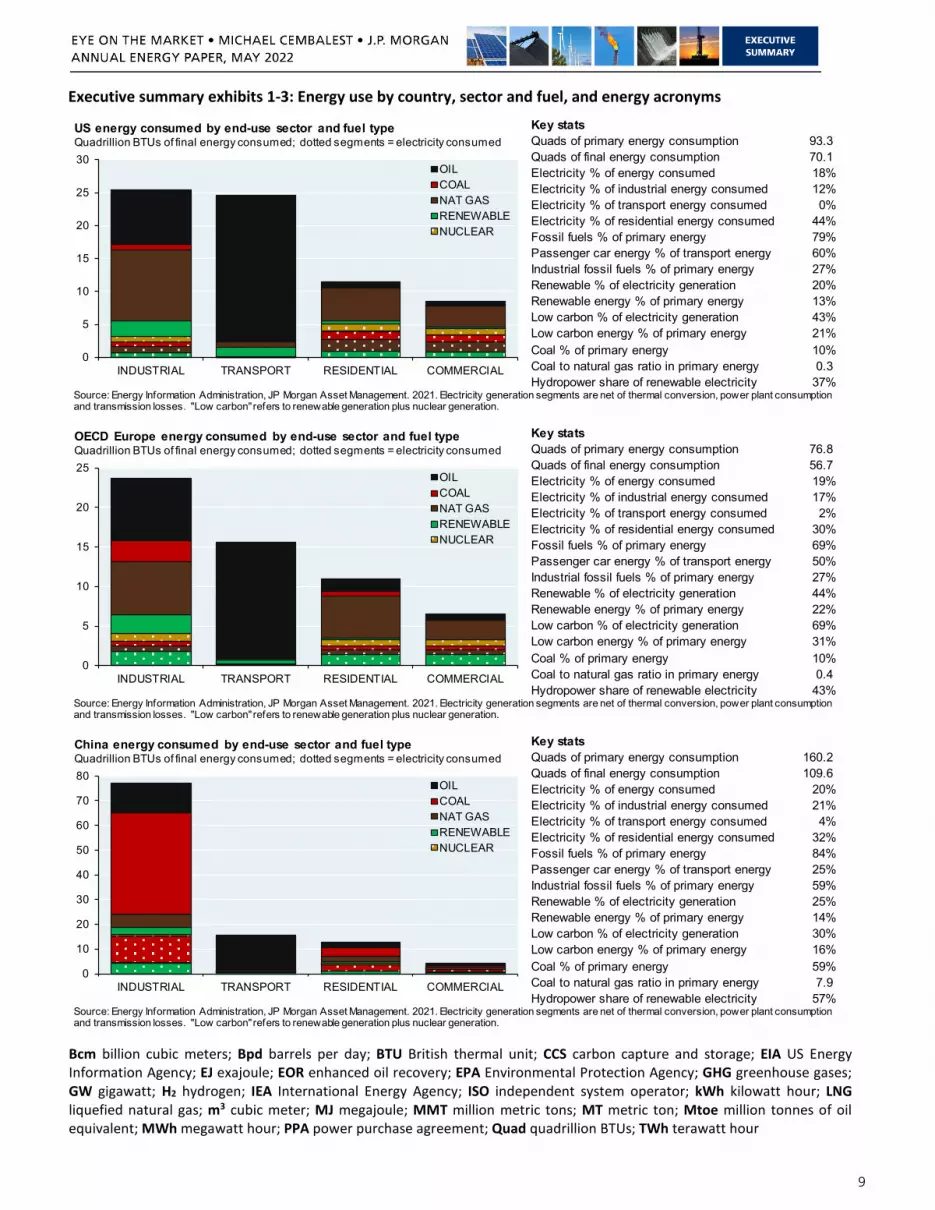
Executive summary exhibits 1-3: Energy use by country, sector and fuel, and energy acronyms
Key statsQuads of primary energy consumption 93.3 Quads of final energy consumption 70.1 Electricity % of energy consumed 18%Electricity % of industrial energy consumed 12%Electricity % of transport energy consumed 0%Electricity % of residential energy consumed 44%Fossil fuels % of primary energy 79%Passenger car energy % of transport energy 60%Industrial fossil fuels % of primary energy 27%Renewable % of electricity generation 20%Renewable energy % of primary energy 13%Low carbon % of electricity generation 43%Low carbon energy % of primary energy 21%Coal % of primary energy 10%Coal to natural gas ratio in primary energy 0.3 Hydropower share of renewable electricity 37%
0
5
10
15
20
25
30
INDUSTRIAL TRANSPORT RESIDENTIAL COMMERCIAL
OILCOALNAT GASRENEWABLENUCLEAR
US energy consumed by end-use sector and fuel typeQuadrillion BTUs of final energy consumed; dotted segments = electricity consumed
Source: Energy Information Administration, JP Morgan Asset Management. 2021. Electricity generation segments are net of thermal conversion, power plant consumption and transmission losses. "Low carbon" refers to renewable generation plus nuclear generation.
Key statsQuads of primary energy consumption 76.8 Quads of final energy consumption 56.7 Electricity % of energy consumed 19%Electricity % of industrial energy consumed 17%Electricity % of transport energy consumed 2%Electricity % of residential energy consumed 30%Fossil fuels % of primary energy 69%Passenger car energy % of transport energy 50%Industrial fossil fuels % of primary energy 27%Renewable % of electricity generation 44%Renewable energy % of primary energy 22%Low carbon % of electricity generation 69%Low carbon energy % of primary energy 31%Coal % of primary energy 10%Coal to natural gas ratio in primary energy 0.4 Hydropower share of renewable electricity 43%
0
5
10
15
20
25
INDUSTRIAL TRANSPORT RESIDENTIAL COMMERCIAL
OILCOALNAT GASRENEWABLENUCLEAR
OECD Europe energy consumed by end-use sector and fuel typeQuadrillion BTUs of final energy consumed; dotted segments = electricity consumed
Source: Energy Information Administration, JP Morgan Asset Management. 2021. Electricity generation segments are net of thermal conversion, power plant consumption and transmission losses. "Low carbon" refers to renewable generation plus nuclear generation.
Key statsQuads of primary energy consumption 160.2 Quads of final energy consumption 109.6 Electricity % of energy consumed 20%Electricity % of industrial energy consumed 21%Electricity % of transport energy consumed 4%Electricity % of residential energy consumed 32%Fossil fuels % of primary energy 84%Passenger car energy % of transport energy 25%Industrial fossil fuels % of primary energy 59%Renewable % of electricity generation 25%Renewable energy % of primary energy 14%Low carbon % of electricity generation 30%Low carbon energy % of primary energy 16%Coal % of primary energy 59%Coal to natural gas ratio in primary energy 7.9 Hydropower share of renewable electricity 57%
0
10
20
30
40
50
60
70
80
INDUSTRIAL TRANSPORT RESIDENTIAL COMMERCIAL
OILCOALNAT GASRENEWABLENUCLEAR
China energy consumed by end-use sector and fuel typeQuadrillion BTUs of final energy consumed; dotted segments = electricity consumed
Source: Energy Information Administration, JP Morgan Asset Management. 2021. Electricity generation segments are net of thermal conversion, power plant consumption and transmission losses. "Low carbon" refers to renewable generation plus nuclear generation.
Bcm billion cubic meters; Bpd barrels per day; BTU British thermal unit; CCS carbon capture and storage; EIA US Energy Information Agency; EJ exajoule; EOR enhanced oil recovery; EPA Environmental Protection Agency; GHG greenhouse gases; GW gigawatt; H2 hydrogen; IEA International Energy Agency; ISO independent system operator; kWh kilowatt hour; LNG liquefied natural gas; m3 cubic meter; MJ megajoule; MMT million metric tons; MT metric ton; Mtoe million tonnes of oil equivalent; MWh megawatt hour; PPA power purchase agreement; Quad quadrillion BTUs; TWh terawatt hour
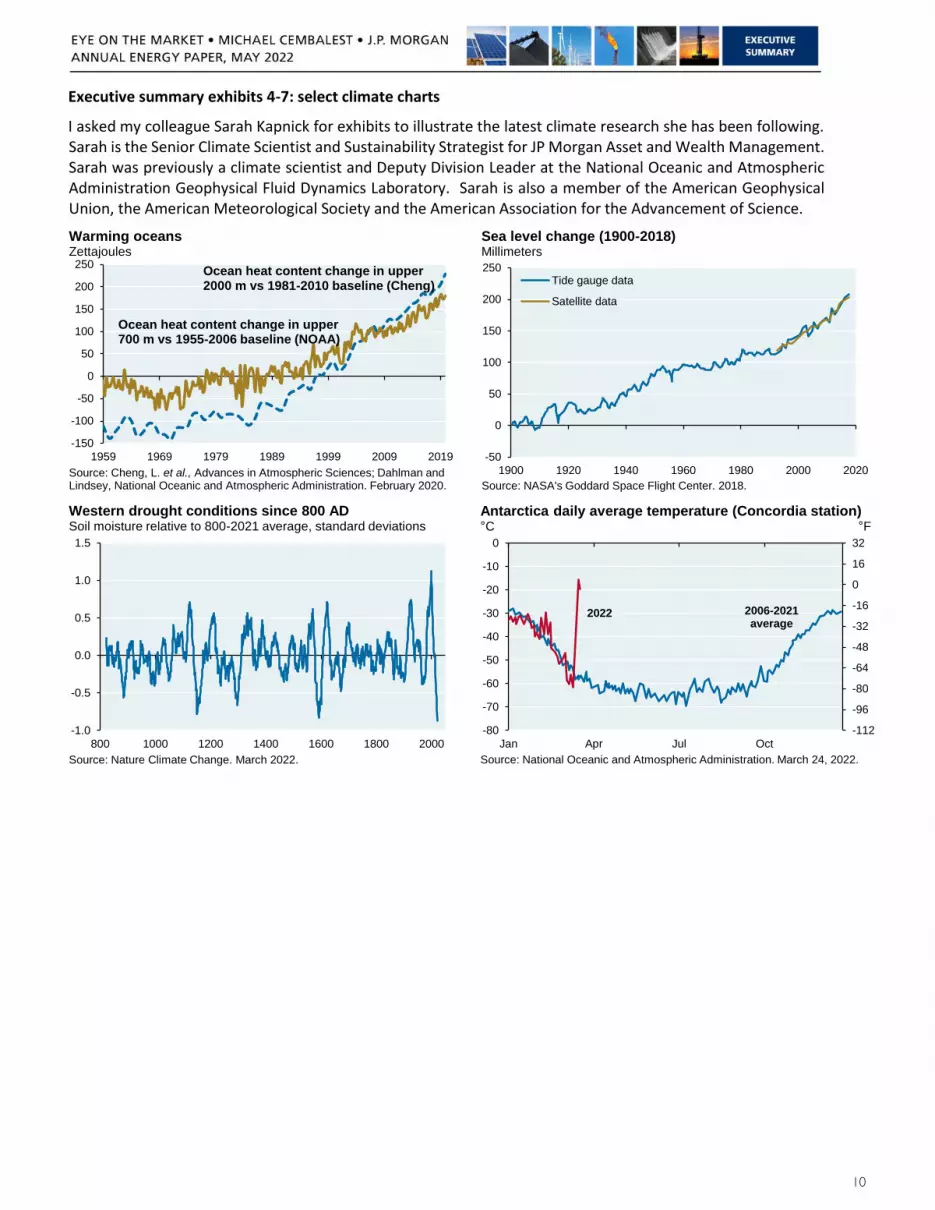
Executive summary exhibits 4-7: select climate charts
I asked my colleague Sarah Kapnick for exhibits to illustrate the latest climate research she has been following. Sarah is the Senior Climate Scientist and Sustainability Strategist for JP Morgan Asset and Wealth Management. Sarah was previously a climate scientist and Deputy Division Leader at the National Oceanic and Atmospheric Administration Geophysical Fluid Dynamics Laboratory. Sarah is also a member of the American Geophysical Union, the American Meteorological Society and the American Association for the Advancement of Science.
Warming oceans
-150
-100
-50
0
50
100
150
200
250 Ocean heat content change in upper 2000 m vs 1981-2010 baseline (Cheng)
Ocean heat content change in upper 700 m vs 1955-2006 baseline (NOAA)
1959 1969 1979 1989 1999 2009 2019
Zettajoules
Source: Cheng, L. et al., Advances in Atmospheric Sciences; Dahlman and Lindsey, National Oceanic and Atmospheric Administration. February 2020.
Sea level change (1900-2018)
Millimeters
250
200
150
100
50
0
-50
1900 1920 1940 1960 1980 2000 2020
Tide gauge data
Satellite data
Source: NASA's Goddard Space Flight Center. 2018.
Western drought conditions since 800 AD Soil moisture relative to 800-2021 average, standard deviations
1.5
1.0
0.5
0.0
-0.5
-1.0
800 1000 1200 1400 1600 1800 2000
Source: Nature Climate Change. March 2022.
Antarctica daily average temperature (Concordia station) C F
0 32
-10 16
-20 0
-16 -30
-32 -40
-48 -50
-64
-60 -80
-70 -96
-80 -112
Jan Apr Jul Oct
2006-2021 average
2022
Source: National Oceanic and Atmospheric Administration. March 24, 2022.
10

IMPORTANT INFORMATION This report uses rigorous security protocols for selected data sourced from Chase credit and debit card transactions to ensure all information is kept confidential and secure. All selected data is highly aggregated and all unique identifiable information, including names, account numbers, addresses, dates of birth, and Social Security Numbers, is removed from the data before the report’s author receives it. The data in this report is not representative of Chase’s overall credit and debit cardholder population.
The views, opinions and estimates expressed herein constitute Michael Cembalest’s judgment based on current market conditions and are subject to change without notice. Information herein may differ from those expressed by other areas of J.P. Morgan. This information in no way constitutes J.P. Morgan Research and should not be treated as such.
The views contained herein are not to be taken as advice or a recommendation to buy or sell any investment in any jurisdiction, nor is it a commitment from J.P. Morgan or any of its subsidiaries to participate in any of the transactions mentioned herein. Any forecasts, figures, opinions or investment techniques and strategies set out are for information purposes only, based on certain assumptions and current market conditions and are subject to change without prior notice. All information presented herein is considered to be accurate at the time of production. This material does not contain sufficient information to support an investment decision and it should not be relied upon by you in evaluating the merits of investing in any securities or products. In addition, users should make an independent assessment of the legal, regulatory, tax, credit and accounting implications and determine, together with their own professional advisers, if any investment mentioned herein is believed to be suitable to their personal goals. Investors should ensure that they obtain all available relevant information before making any investment. It should be noted that investment involves risks, the value of investments and the income from them may fluctuate in accordance with market conditions and taxation agreements and investors may not get back the full amount invested. Both past performance and yields are not reliable indicators of current and future results.
Non-affiliated entities mentioned are for informational purposes only and should not be construed as an endorsement or sponsorship of J.P. Morgan Chase & Co. or its affiliates.
For J.P. Morgan Asset Management Clients: J.P. Morgan Asset Management is the brand for the asset management business of JPMorgan Chase & Co. and its affiliates worldwide. To the extent permitted by applicable law, we may record telephone calls and monitor electronic communications to comply with our legal and regulatory obligations and internal policies. Personal data will be collected, stored and processed by J.P. Morgan Asset Management in accordance with our privacy policies at https://am.jpmorgan.com/global/privacy.ACCESSIBILITYFor U.S. only: If you are a person with a disability and need additional support in viewing the material, please call us at 1-800-343-1113 for assistance.This communication is issued by the following entities: In the United States, by J.P. Morgan Investment Management Inc. or J.P. Morgan Alternative Asset Management, Inc., both regulated by the Securities and Exchange Commission; in Latin America, for intended recipients’ use only, by local J.P. Morgan entities, as the case may be.; in Canada, for institutional clients’ use only, by JPMorgan Asset Management (Canada) Inc., which is a registered Portfolio Manager and Exempt Market Dealer in all Canadian provinces and territories except the Yukon and is also registered as an Investment Fund Manager in British Columbia, Ontario, Quebec and Newfoundland and Labrador. In the United Kingdom, by JPMorgan Asset Management (UK) Limited, which is authorized and regulated by the Financial Conduct Authority; in other European jurisdictions, by JPMorgan Asset Management (Europe) S.à r.l. In Asia Pacific (“APAC”), by the following issuing entities and in the respective jurisdictions in which they are primarily regulated: JPMorgan Asset Management (Asia Pacific) Limited, or JPMorgan Funds (Asia) Limited, or JPMorgan Asset Management Real Assets (Asia) Limited, each of which is regulated by the Securities and Futures Commission of Hong Kong; JPMorgan Asset Management (Singapore) Limited (Co. Reg. No. 197601586K), which this advertisement or publication has not been reviewed by the Monetary Authority of Singapore; JPMorgan Asset Management (Taiwan) Limited; JPMorgan Asset Management (Japan) Limited, which is a member of the Investment Trusts Association, Japan, the Japan Investment Advisers Association, Type II Financial Instruments Firms Association and the Japan Securities Dealers Association and is regulated by the Financial Services Agency (registration number “Kanto Local Finance Bureau (Financial Instruments Firm) No. 330”); in Australia, to wholesale clients only as defined in section 761A and 761G of the Corporations Act 2001 (Commonwealth), by JPMorgan Asset Management (Australia) Limited (ABN 55143832080) (AFSL 376919). For all other markets in APAC, to intended recipients only.
For J.P. Morgan Private Bank Clients: ACCESSIBILITYJ.P. Morgan is committed to making our products and services accessible to meet the financial services needs of all our clients. Please direct any accessibility issues to the Private Bank Client Service Center at 1-866-265-1727.
LEGAL ENTITY, BRAND & REGULATORY INFORMATIONIn the United States, bank deposit accounts and related services, such as checking, savings and bank lending, are offered by JPMorgan Chase Bank, N.A. Member FDIC. JPMorgan Chase Bank, N.A. and its affiliates (collectively “JPMCB”) offer investment products, which may include bank-managed investment accounts and custody, as part of its trust and fiduciary services. Other investment products and services, such as brokerage and advisory accounts, are offered through J.P. Morgan Securities LLC (“JPMS”), a member of FINRA and SIPC. Annuities are made available through Chase Insurance Agency, Inc. (CIA), a licensed insurance agency, doing business as Chase Insurance Agency Services, Inc. in Florida. JPMCB, JPMS and CIA are affiliated companies under the common control of JPM. Products not available in all states. In Germany, this material is issued by J.P. Morgan SE, with its registered office at Taunustor 1 (TaunusTurm), 60310 Frankfurt am Main, Germany, authorized by the Bundesanstalt für Finanzdienstleistungsaufsicht (BaFin) and jointly supervised by the BaFin, the German Central Bank (Deutsche Bundesbank) and the European Central Bank (ECB). In Luxembourg, this material is issued by J.P. Morgan SE – Luxembourg Branch, with registered office at European Bank and Business Centre, 6 route de Treves, L-2633, Senningerberg, Luxembourg, authorized by the Bundesanstalt für Finanzdienstleistungsaufsicht (BaFin) and jointly supervised by the BaFin, the German Central Bank (Deutsche Bundesbank) and the European Central Bank (ECB); J.P. Morgan SE – Luxembourg Branch is also supervised by the Commission de Surveillance du Secteur Financier (CSSF); registered under R.C.S Luxembourg B255938. In the United Kingdom, this material is issued by J.P. Morgan SE – London Branch, registered office at 25 Bank Street, Canary Wharf, London E14 5JP, authorized by the Bundesanstalt für Finanzdienstleistungsaufsicht (BaFin) and jointly supervised by the BaFin, the German Central Bank (Deutsche Bundesbank) and the European Central Bank (ECB); J.P. Morgan SE – London Branch is also supervised by the Financial Conduct Authority and Prudential Regulation Authority. In Spain, this material is distributed by J.P. Morgan SE, Sucursal en España, with registered office at Paseo de la Castellana, 31, 28046 Madrid, Spain, authorized by the Bundesanstalt für

Finanzdienstleistungsaufsicht (BaFin) and jointly supervised by the BaFin, the German Central Bank (Deutsche Bundesbank) and the European Central Bank (ECB); J.P. Morgan SE, Sucursal en España is also supervised by the Spanish Securities Market Commission (CNMV); registered with Bank of Spain as a branch of J.P. Morgan SE under code 1567. In Italy, this material is distributed by J.P. Morgan SE – Milan Branch, with its registered office at Via Cordusio, n.3, Milan 20123, Italy, authorized by the Bundesanstalt für Finanzdienstleistungsaufsicht (BaFin) and jointly supervised by the BaFin, the German Central Bank (Deutsche Bundesbank) and the European Central Bank (ECB); J.P. Morgan SE – Milan Branch is also supervised by Bank of Italy and the Commissione Nazionale per le Società e la Borsa (CONSOB); registered with Bank of Italy as a branch of J.P. Morgan SE under code 8076; Milan Chamber of Commerce Registered Number: REA MI 2536325. In the Netherlands, this material is distributed by J.P. Morgan SE – Amsterdam Branch, with registered office at World Trade Centre, Tower B, Strawinskylaan 1135, 1077 XX, Amsterdam, The Netherlands, authorized by the Bundesanstalt für Finanzdienstleistungsaufsicht (BaFin) and jointly supervised by the BaFin, the German Central Bank (Deutsche Bundesbank) and the European Central Bank (ECB); J.P. Morgan SE – Amsterdam Branch is also supervised by De Nederlandsche Bank (DNB) and the Autoriteit Financiële Markten (AFM) in the Netherlands. Registered with the Kamer van Koophandel as a branch of J.P. Morgan SE under registration number 72610220. In Denmark, this material is distributed by J.P. Morgan SE – Copenhagen Branch, filial af J.P. Morgan SE, Tyskland, with registered office at Kalvebod Brygge 39-41, 1560 København V, Denmark, authorized by the Bundesanstalt für Finanzdienstleistungsaufsicht (BaFin) and jointly supervised by the BaFin, the German Central Bank (Deutsche Bundesbank) and the European Central Bank (ECB); J.P. Morgan SE – Copenhagen Branch, filial af J.P. Morgan SE, Tyskland is also supervised by Finanstilsynet (Danish FSA) and is registered with Finanstilsynet as a branch of J.P. Morgan SE under code 29010. In Sweden, this material is distributed by J.P. Morgan SE – Stockholm Bankfilial, with registered office at Hamngatan 15, Stockholm, 11147, Sweden, authorized by the Bundesanstalt für Finanzdienstleistungsaufsicht (BaFin) and jointly supervised by the BaFin, the German Central Bank (Deutsche Bundesbank) and the European Central Bank (ECB); J.P. Morgan SE – Stockholm Bankfilial is also supervised by Finansinspektionen (Swedish FSA); registered with Finansinspektionen as a branch of J.P. Morgan SE. In France, this material is distributed by JPMCB, Paris branch, which is regulated by the French banking authorities Autorité de Contrôle Prudentiel et de Résolution and Autorité des Marchés Financiers. In Switzerland, this material is distributed by J.P. Morgan (Suisse) SA, with registered address at rue de la Confédération, 8, 1211, Geneva, Switzerland, which is authorised and supervised by the Swiss Financial Market Supervisory Authority (FINMA), as a bank and a securities dealer in Switzerland. Please consult the following link to obtain information regarding J.P. Morgan’s EMEA data protection policy: https://www.jpmorgan.com/privacy.
In Hong Kong, this material is distributed by JPMCB, Hong Kong branch. JPMCB, Hong Kong branch is regulated by the Hong Kong Monetary Authority and the Securities and Futures Commission of Hong Kong. In Hong Kong, we will cease to use your personal data for our marketing purposes without charge if you so request. In Singapore, this material is distributed by JPMCB, Singapore branch. JPMCB, Singapore branch is regulated by the Monetary Authority of Singapore. Dealing and advisory services and discretionary investment management services are provided to you by JPMCB, Hong Kong/Singapore branch (as notified to you). Banking and custody services are provided to you by JPMCB Singapore Branch. The contents of this document have not been reviewed by any regulatory authority in Hong Kong, Singapore or any other jurisdictions. You are advised to exercise caution in relation to this document. If you are in any doubt about any of the contents of this document, you should obtain independent professional advice. For materials which constitute product advertisement under the Securities and Futures Act and the Financial Advisers Act, this advertisement has not been reviewed by the Monetary Authority of Singapore. JPMorgan Chase Bank, N.A. is a national banking association chartered under the laws of the United States, and as a body corporate, its shareholder’s liability is limited. With respect to countries in Latin America, the distribution of this material may be restricted in certain jurisdictions. We may offer and/or sell to you securities or other financial instruments which may not be registered under, and are not the subject of a public offering under, the securities or other financial regulatory laws of your home country. Such securities or instruments are offered and/or sold to you on a private basis only. Any communication by us to you regarding such securities or instruments, including without limitation the delivery of a prospectus, term sheet or other offering document, is not intended by us as an offer to sell or a solicitation of an offer to buy any securities or instruments in any jurisdiction in which such an offer or a solicitation is unlawful. Furthermore, such securities or instruments may be subject to certain regulatory and/or contractual restrictions on subsequent transfer by you, and you are solely responsible for ascertaining and complying with such restrictions. To the extent this content makes reference to a fund, the Fund may not be publicly offered in any Latin American country, without previous registration of such fund’s securities in compliance with the laws of the corresponding jurisdiction. Public offering of any security, including the shares of the Fund, without previous registration at Brazilian Securities and Exchange Commission— CVM is completely prohibited. Some products or services contained in the materials might not be currently provided by the Brazilian and Mexican platforms. JPMorgan Chase Bank, N.A. (JPMCBNA) (ABN 43 074 112 011/AFS Licence No: 238367) is regulated by the Australian Securities and Investment Commission and the Australian Prudential Regulation Authority. Material provided by JPMCBNA in Australia is to “wholesale clients” only. For the purposes of this paragraph the term “wholesale client” has the meaning given in section 761G of the Corporations Act 2001 (Cth). Please inform us if you are not a Wholesale Client now or if you cease to be a Wholesale Client at any time in the future.
JPMorgan Chase Bank, N.A. (JPMCBNA) (ABN 43 074 112 011/AFS Licence No: 238367) is regulated by the Australian Securities and Investment Commission and the Australian Prudential Regulation Authority. Material provided by JPMCBNA in Australia is to “wholesale clients” only. For the purposes of this paragraph the term “wholesale client” has the meaning given in section 761G of the Corporations Act 2001 (Cth). Please inform us if you are not a Wholesale Client now or if you cease to be a Wholesale Client at any time in the future. JPMS is a registered foreign company (overseas) (ARBN 109293610) incorporated in Delaware, U.S.A. Under Australian financial services licensing requirements, carrying on a financial services business in Australia requires a financial service provider, such as J.P. Morgan Securities LLC (JPMS), to hold an Australian Financial Services Licence (AFSL), unless an exemption applies. JPMS is exempt from the requirement to hold an AFSL under the Corporations Act 2001 (Cth) (Act) in respect of financial services it provides to you, and is regulated by the SEC, FINRA and CFTC under U.S. laws, which differ from Australian laws. Material provided by JPMS in Australia is to “wholesale clients” only. The information provided in this material is not intended to be, and must not be, distributed or passed on, directly or indirectly, to any other class of persons in Australia. For the purposes of this paragraph the term “wholesale client” has the meaning given in section 761G of the Act. Please inform us immediately if you are not a Wholesale Client now or if you cease to be a Wholesale Client at any time in the future. This material has not been prepared specifically for Australian investors. It:
• May contain references to dollar amounts which are not Australian dollars;• May contain financial information which is not prepared in accordance with Australian law or practices;• May not address risks associated with investment in foreign currency denominated investments; and• Does not address Australian tax issues.


