Embed Size (px)
Citation preview
ORIGINAL ARTICLE
Alternative Ready-To-Use Therapeutic Food Yields LessRecovery Than the Standard for Treating Acute Malnutritionin Children From GhanaKristin Kohlmann,a Meghan Callaghan-Gillespie,a Julia M. Gauglitz,b Matilda Steiner-Asiedu,c
Kwesi Saalia,c Carly Edwards,d Mark J. Manarya,e
In Ghana, an alternative ready-to-use food (RUTF) formulation that met all specifications was not as good asstandard RUTF in affecting recovery from acute malnutrition among children aged 6 to 59 months.
ABSTRACTBackground: Only 20% of children with severe acute malnutrition (SAM) have access to ready-to-use therapeutic food (RUTF), and RUTFcost limits its accessibility.Methods: This randomized, double-blind controlled study involved a clinical equivalence trial comparing the effectiveness of an alterna-tive RUTF with standard RUTF in the home-based treatment of uncomplicated SAM and moderate malnutrition in Ghanaian childrenaged 6 to 59 months. The primary outcome was recovery, equivalence was defined as being within 5 percentage points of the controlgroup, and an intention-to-treat analysis was used. Alternative RUTF was composed of whey protein, soybeans, peanuts, sorghum, milk,sugar, and vegetable oil. Standard RUTF included peanuts, milk, sugar, and vegetable oil. The cost of alternative RUTF ingredients was14% less than standard RUTF. Untargeted metabolomics was used to characterize the bioactive metabolites in the RUTFs.Results: Of the 1,270 children treated for SAM or moderate malnutrition, 554 of 628 (88%) receiving alternative RUTF recovered(95% confidence interval [CI]=85% to 90%) and 516 of 642 (80%) receiving standard RUTF recovered (95% CI=77% to 83%). The dif-ference in recovery was 7.7% (95% CI=3.7% to 11.7%). Among the 401 children with SAM, the recovery rate was 130 of 199 (65%)with alternative RUTF and 156 of 202 (77%) with standard RUTF (P=.01). The default rate in SAM was 60 of 199 (30%) for alternativeRUTF and 41 of 202 (20%) for standard RUTF (P=.04). Children enrolled with SAM who received alternative RUTF had less daily weightgain than those fed standard RUTF (2.4 6 2.4 g/kg vs. 2.9 6 2.6 g/kg, respectively; P<.05). Among children with moderate wasting,recovery rates were lower for alternative RUTF, 386 of 443 (87%), than standard RUTF, 397 of 426 (93%) (P=.003). More isoflavonemetabolites were found in alternative RUTF than in the standard.Conclusion: The lower-cost alternative RUTF was less effective than standard RUTF in the treatment of severe and moderate malnutritionin Ghana.
INTRODUCTION
In sub-Saharan Africa, 17 million children under 5 arewasted, which is defined as having a weight-for-
length z score (WLZ)< 2 standard deviations (SD) belowthe mean World Health Organization (WHO) ChildGrowth Standards.1 Wasting leaves these children withan increased risk of illness and death.2 A large fraction
of wasting occurs in children aged 6 to 24 months, a dy-namic period of physical and neurological develop-ment.3 The majority of wasted children do not live incommunities beset with emergencies, but rather comefrom the poorest segments of all countries. In general,these countries do not have the resources from donatedor endogenous sources to sponsor widespread feedingand education programs to combat wasting. Effectiveand cost-efficient solutions to reduce wasting outside ofacute emergencies will be necessary to achieve theSustainable Development Goals.2
Among children under 5 years of age in Ghana, theprevalence of wasting is about 5%.2 Treatment for se-vere wasting, which is defined as WLZ � �3 SD belowthe mean, is available in the northernmost regions ofGhana, where the density of SAM is greatest but where
aDepartment of Pediatrics, Washington University, St. Louis, MO, USA.bCollaborative Mass Spectrometry Innovation Center, Skaggs School ofPharmacy and Pharmaceutical Sciences, University of California, San Diego, SanDiego, CA, USA.cDepartment of Nutrition and Food Science, University of Ghana, Legon, Ghana.dProject Peanut Butter, Kumasi, Ghana.eChildren’s Nutrition Research Center, Baylor College of Medicine, Houston, TX,USA.Correspondence to Mark Manary ([email protected]).
Global Health: Science and Practice 2019 | Volume 7 | Number 2 203

only 17% of the population reside. Treatment ofmoderate wasting, defined by WLZ > �3 and� �2 and known as moderate acute malnutrition(MAM), is almost entirely unavailable in Ghana.
Home-based therapy with ready-to-use thera-peutic food (RUTF) for children with SAM has rev-olutionized the management of wasted children,offering a superior alternative to inpatient treat-ment.4,5 Unfortunately, RUTF reaches only about15% of the children worldwide who need it.Despite being highly cost-effective, SAM treatmentis expensive in absolute terms, with a cost of US$150 to $200 per child, and in Ghana, one limitedstudy estimated the cost of treating SAM to be$805 per child.6,7 Worldwide, standard RUTF(S-RUTF) is an expensive component of treatment,costing $47 to $61 per child treated.8 S-RUTFis composed of 25% skimmed milk powder and27% peanut paste, a vegetable oil rich in omega-3polyunsaturated fatty acids such as canola and sugar.
In 2013, our team initiated amultinational alter-native RUTF (A-RUTF) formulation project with theaim to reduce the cost of RUTF, and in doing so, en-able the existing resource envelope for SAM to beused to treat more children. The work began with acomprehensive literature and nutrient databaseanalysis and subsequent development of a food for-mulation linear programming (LP) tool.9 The LP toolis a conventional computer database program thatlists all potential ingredients, nutritional composi-tions, prices, and country-specific availability. Thetool has default nutrient constraints that align theformulations with the international RUTF nutrientspecifications and food safety guidelines.10 The toolalso allows for ingredient constraints, which sup-ports organoleptic optimization.9,11 It has been suc-cessfully used by our investigative team to createcountry-specific locally produced A-RUTF formula-tions for Ghana, Ethiopia, Pakistan, and India thatwere proven to be feasible, acceptable, and withoutadverse side effects in formal acceptability trials.12
However, the relative effectiveness of an A-RUTF toS-RUTF has yet to be shown.
This article describes the operation and resultsfrom a randomized, double-blind controlled clini-cal trial testing the hypothesis that a locally pro-duced A-RUTF was equivalent to S-RUTF for thetreatment of uncomplicated SAM and MAM, inthe Brong Ahafo region of Ghana.
METHODSSubjects and SettingEligible children were between 6 and 59 monthsof age and experiencing acute malnutrition. SAM
was defined as WLZ � �3, or having a mid-upperarm circumference (MUAC) of<11.5 cm or biped-al edema. MAM was defined as not having SAMand having WLZ � �2 or MUAC of <12.5 cm. Inaddition to meeting the anthropometric criteria,children were required to consume 30 g of RUTFin a supervised setting to be eligible for enroll-ment. Children were excluded if they were in-volved in another research trial or feedingprogram, had a chronic debilitating illness (e.g.,cerebral palsy), or had a history of peanut or milkallergy.
Informed consent was obtained from the pri-mary caregiver of the participant and documentedby the caregiver’s signature or thumbprint.The study received ethical approval from theWashington University in St. Louis InstitutionalReview Board, the Noguchi Memorial Institutefor Medical Research Institutional Review Board,and the Ghana Health Service.
Study participants were recruited at 29 clinicsthroughout 5 districts in the Brong Ahafo regionof Ghana. The Brong Ahafo region is the secondlargest region in Ghana and has the sixth largestpopulation at 2.3 million.13 In 2011, the under-5 mortality rate in the region was 108 deaths per1,000 live births, 32% higher than the nationalunder-5 mortality rate.14 Although wasting ratesin the latest Demographic and Health Surveyshowed a national decline, regional trends indicat-ed that rates in the Brong Ahafo region had in-creased.15 In addition, 16% of all households inthis region are considered food insecure.16
Study DesignThis randomized, double-blind controlled studywas based on a clinical equivalence trial of treatingacutemalnutritionwith 1 of 2 therapeutic foods, A-RUTF or S-RUTF. The primary outcome was recov-ery, defined as having achieved eitherWLZ>�2 orMUAC>12.4 cmat any point during the treatment.Equivalence was chosen as being within 5 percent-age points of the control group. Secondary out-comes were rates of weight and MUAC gain, thenumber of visits before recovery, cost of RUTF perchild recovered, and adverse events. The samplesize was estimated to be 1,262 children, whichgave the comparison sufficient power to detect a5% difference in recovery, assuming the controlgroup achieved recovery rate of 85% using anequivalence design. The assumption that recoverywould be 85% overall for the treatment of MAMand SAM was based on our trials in Malawi.5 Thetrial was publicly registered as ISRCTN14788669.
We testedwhethera locally producedA-RUTFwasequivalent toS-RUTF fortreating acutemalnutrition inGhana.
Study participantswere recruited inthe Brong Ahaforegion, where theunder-5mortalitywas 32% higherthan the nationalrate in 2011.
Alternative RUTF Yields Lower SAM Recovery Than the Standard www.ghspjournal.org
Global Health: Science and Practice 2019 | Volume 7 | Number 2 204
Participation and Data CollectionAll participants were randomized to receive eitherA-RUTF or S-RUTF via a closed envelope tech-nique. Allocation of the food intervention wasconducted by a nurse who had the participant’scaregiver draw an opaque envelope containing1 of 4 colors. Each color corresponded to a type ofRUTF. Both the research team and study partici-pants were blinded to color assignments.
Management of MAM and SAM followed anoptimized protocol that incorporated many ele-ments from the community management ofacute malnutrition (CMAM), which is describedin Table 1. Notable deviations from CMAM were(1) visits were fortnightly instead of weekly,(2) the ration of RUTF for SAMwas reduced as thechild gained weight, (3) MAM children were givensupplementary food in addition to counseling, and(4) exit criteria for the study were achievement ofMUAC >12.4 cm on a single occasion or comple-tion of 12 weeks of feeding, instead of requiring3 occasions withMUAC>12.4 cm.
The children had MUAC, weight, and lengthmeasured upon enrollment.MUACwasmeasuredon the left arm with a standard insertion tape tothe nearest 0.1 cm (TALC, Herts, UK); weight wasmeasured to the nearest 5 g using an electronicscale (Seca 334, Hamburg Germany, calibratedweekly); and recumbent length was measured intriplicate to the nearest 0.2 cm, using a rigidlength board (Seca 417 length board, Hamburg,Germany). The staff received standardized training
every 8 weeks in the measurement of edema andanthropometry by a senior clinician, and 10% ofthe field measurements were rechecked in the fieldfor quality purposes. During the initial visit, demo-graphic and health informationwere recorded, anda 2-week supply of their assigned RUTF was dis-pensed. The dosage of RUTF provided a daily intakeof about 150 kcal/kg for SAM participants andabout 75 kcal/kg for MAM participants. The dailySAM ration provided about 100% of the child’sneeds for growth and maintenance and was typi-cally about 200 g. The daily MAM ration providedabout 60% of the child’s needs for growth andmaintenance and was typically about 100 g.Caregivers and study participants were asked to re-turn every 2 weeks for follow-up. At follow-up,caregivers reported on the child’s clinical symp-toms, anthropometric measurements were taken,and additional RUTF was distributed for those thatremained wasted. The dosage of RUTF distributedat each follow-up visit was determined by thechild’s current weight. As SAM participants beganto recover and reached a MUAC ≥11.5 cm, theywere transitioned to the MAM dosage of 75 kcal/kg/day of their assigned RUTF. No additional foodrations were given when subjects reached an out-come, nor were the children asked to return forfollow-up at regular intervals.
The study was implemented by trained nursesworking for Project Peanut Butter, a registeredNGO in Ghana. A research associate fromWashington University resided in Ghana for the
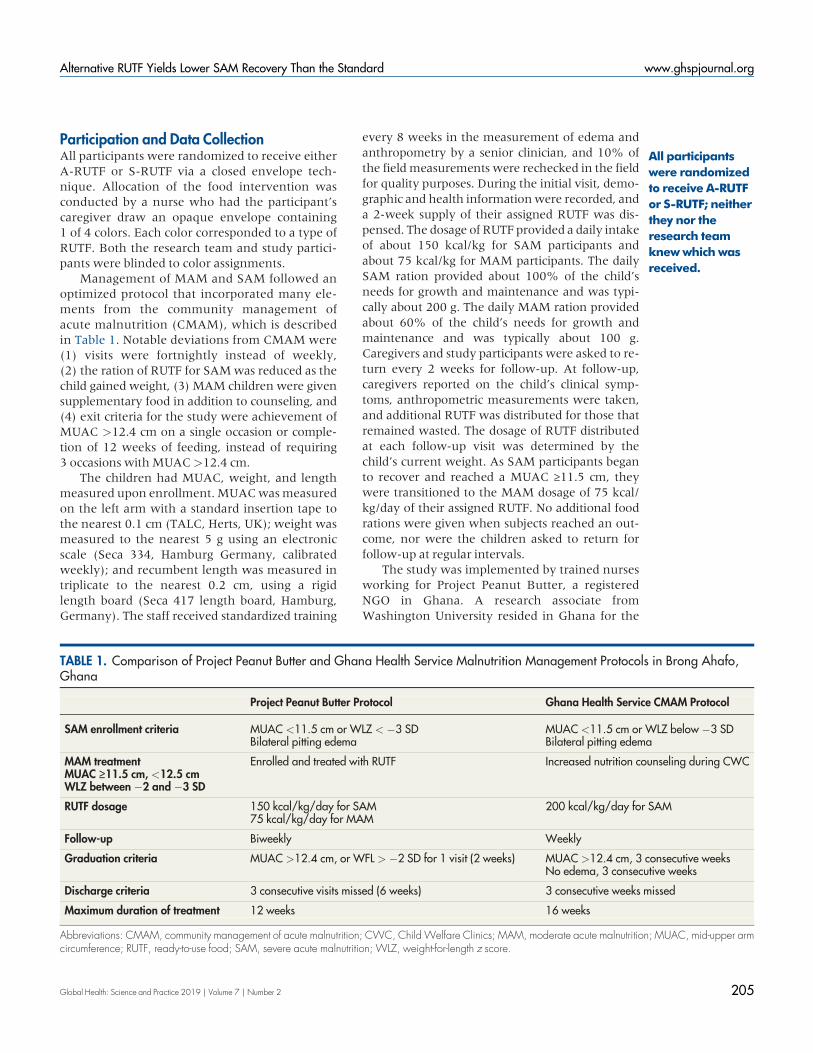
TABLE 1. Comparison of Project Peanut Butter and Ghana Health Service Malnutrition Management Protocols in Brong Ahafo,Ghana
Project Peanut Butter Protocol Ghana Health Service CMAM Protocol
SAM enrollment criteria MUAC <11.5 cm or WLZ < �3 SDBilateral pitting edema
MUAC <11.5 cm or WLZ below �3 SDBilateral pitting edema
MAM treatmentMUAC ≥11.5 cm, <12.5 cmWLZ between �2 and �3 SD
Enrolled and treated with RUTF Increased nutrition counseling during CWC
RUTF dosage 150 kcal/kg/day for SAM75 kcal/kg/day for MAM
200 kcal/kg/day for SAM
Follow-up Biweekly Weekly
Graduation criteria MUAC >12.4 cm, or WFL > �2 SD for 1 visit (2 weeks) MUAC >12.4 cm, 3 consecutive weeksNo edema, 3 consecutive weeks
Discharge criteria 3 consecutive visits missed (6 weeks) 3 consecutive weeks missed
Maximum duration of treatment 12 weeks 16 weeks
Abbreviations: CMAM, community management of acute malnutrition; CWC, ChildWelfare Clinics; MAM, moderate acute malnutrition; MUAC, mid-upper armcircumference; RUTF, ready-to-use food; SAM, severe acute malnutrition; WLZ, weight-for-length z score.
All participantswere randomizedto receive A-RUTFor S-RUTF; neitherthey nor theresearch teamknewwhich wasreceived.
Alternative RUTF Yields Lower SAM Recovery Than the Standard www.ghspjournal.org
Global Health: Science and Practice 2019 | Volume 7 | Number 2 205
purposes of implementing the study as well.Health center facilities were used as locationswhere malnutrition treatment services were giv-en, but Project Peanut Butter ensured that RUTFwas always available and research staff were al-ways present on the appointed days to deliver ser-vice. This was done so that the results of the trialcould be interpreted as a comparison of the effec-tiveness of 2 types of RUTF, without bias due tobarriers to consistent implementation.
Study FoodsBoth RUTFs were produced at Project PeanutButter in Kumasi, Ghana, a certified local supplier.Both RUTF formulations met the nutritional spe-cifications and microbiological requirements forRUTF set forth by United Nations agenciesin 2007 and underwent safety testing for aflatoxinandmicrobial contamination at Eurofins ScientificInc. (Des Moines, Indiana, USA).10 The S-RUTFcontained peanut paste, sugar, nonfat dried milk,vegetable oil, a premix containing concentratedminerals and vitamins, and an emulsifier. The A-RUTF replaced about half the amount of peanutwith locally available soybean and sorghum flour,and the 50% of protein from dairy per UnitedNations specification came from a combination ofwhey protein concentrate 34 and nonfat driedmilk. A-RUTF also included canola oil, sugar, a vi-tamin and mineral premix, as well as less nonnu-tritive emulsifier (Table 2).
Whenever study food was given to children,the nurses counseled the caregivers to feed theRUTF inwhatevermanner the child would readilyaccept it, which was most often sucking the foodout of the flexible package from a small tear.Caregivers were also counseled to feed the RUTFstrictly to the malnourished child and not to shareor sell the RUTF.
The ingredient cost of A-RUTF was US$1.90/kgcomparedwith $2.20/kg for the S-RUTF, a 14%costreduction in ingredients. This reduction was largelyachieved by substituting the less expensive sorghumand soy for peanut. Ingredient priceswere estimatedusing the LP tool, which employed a modelingmethod that determined the median commodityprices in 2012 in Ghana from a comprehensive vari-ety of sources, including accounting for transporta-tion and taxes. The price variation seen in thesubsequent 5 years was then added to the model toestimate “typical” prices for the ingredients.
Protein quality was calculated to better charac-terize A-RUTF and S-RUTF. The Digestible Indi-spensable Amino Acid Score (DIAAS) method
with the reference population being healthy chil-dren aged 1–3 years was used to calculate proteinquality.17 In addition, the DIAAS was recalculatedusing malnourished children in a phase of rapidcatch-up growth as a reference population.18
Coverage SurveyTo determine coverage ofMAMand SAM childrenreceiving RUTF feeding (i.e., the proportion ofchildren with acute malnutrition who were ac-cessing services), we used the simplified lot qualityassurance sampling evaluation of access and cov-erage (SLEAC) method.19 The coverage surveywas conducted as a routine measure of programeffectiveness, which allowed us to understand ifthe research feeding achieved similar coverage asoperational programs in sub-Saharan Africa.
Metabolomics AnalysisTo characterize the nonnutritive components ofthe RUTFs, which might contribute to the clinicaleffect, untargeted metabolomics analyses wereconducted. A-RUTF and S-RUTF were extractedto a final concentration of 1 lg/lL in 50% meth-anol and 95% ethanol for untargeted metaboliteanalysis. Data were acquired for each samplein triplicate using an ultra-high performanceliquid chromatography–tandem mass spectro-metry system (UltiMate 3000 UHPLC system[Thermo Scientific, Waltham, MA, USA] coupledto a Maxis Q-TOF mass spectrometer [BrukerDaltonics, Bremen, Germany]), using electrosprayionization in positive mode and a reverse phaseC18 column (Kinetex, 100 � 2.1 mm, 1.7-lmparticle size, 100-Å pore size; Phenomenex,Torrance, CA, USA). Raw data files were converted tomzXML format using Bruker DataAnalysis softwareafter lock mass correction (m/z=622.0290; Hexakis[SynQuest Laboratories,Alachua, FL,USA]) and an-alyzed with molecular networking and library spec-tral matching using the web-based platform GNPS(https://gnps.ucsd.edu). The analysis is availableat https://gnps.ucsd.edu/ProteoSAFe/status.jsp?task=a474e2ed686f43d7b2946a53225495c2.
Data AnalysisData were double entered into a Microsoft Accessdatabase and discrepant values corrected byreviewing the original data collection cards. Forchildren older than 24 months, height was esti-mated from the measured length by subtracting1.5 cm from the length.20 Z scores were calculatedusing the WHO Anthroplus version 1.0.4 (WHO,Geneva), based on the 2006 WHO Child Growth
Both RUTFformulations usedin the studymetnutritional andmicrobiologicalrequirements andunderwent safetytesting.
Alternative RUTF Yields Lower SAM Recovery Than the Standard www.ghspjournal.org
Global Health: Science and Practice 2019 | Volume 7 | Number 2 206

Standards.21 Rates of weight gain were calculatedfor the first 4 weeks of treatment by dividingweight gain in grams by the enrollment weight inkilograms and the days of treatment betweenmeasurements. Mean daily MUAC gain was alsocalculated for the first 4 weeks of treatment by di-viding MUAC gain in millimeters by days of treat-ment between measurements.
Data were analyzed by using SPSS Statisticssoftware (version 25.0; IBM Corp., Armonk, NY,USA). Summary statistics were calculated for theparticipants as mean 6 SD for continuous para-meters and n (%) for categorical parameters.Analyses were done by intention to treat (ITT) forwhich defaulters were considered to be failures inaccordance with the Sphere Standards.22 In accor-dance with the trial designation as an equivalencetrial, the 95% confidence intervals (CIs) aroundthe recovery rates were calculated to determine if
there was overlap between the groups and the dif-ference was compared to determine if it exceededthe threshold of 5 percentage points.
Subgroup analyses were performed on chil-drenwith SAMandMAM. For secondary and sub-group outcomes treatment groups were comparedusing the Student’s test or Mann-Whitney U testfor continuous variables and Fisher’s exact testfor categorical measures.
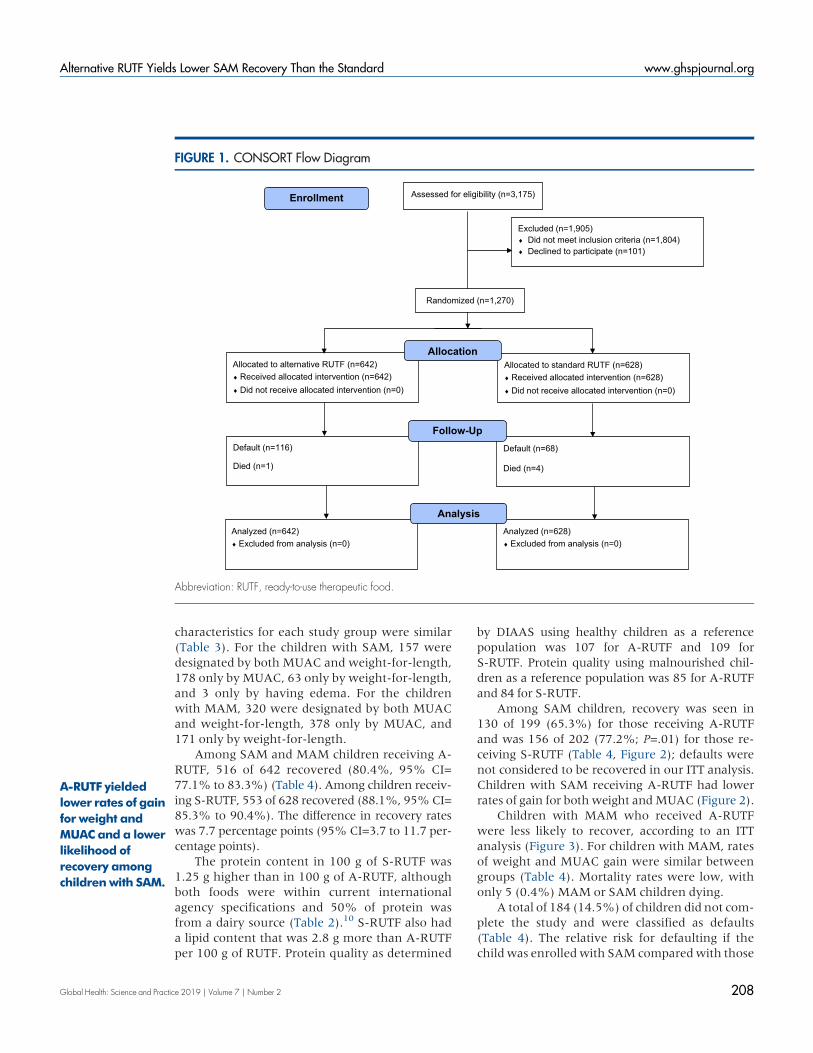
RESULTSA total of 1,270 childrenwere enrolled in the studyfrom February 2017 to February 2018 (Figure 1).Of these, 401 were diagnosed with SAM andwere assigned to receive either A-RUTF (n=199)or S-RUTF (n=202); 869 children were diagnosedwith MAM and were assigned to receive either A-RUTF (n=443) or S-RUTF (n=426). The baseline
TABLE 2. Ingredient and Nutrient Composition of Study Foodsa
Ingredient/Nutrient Alternative-RUTF Standard-RUTF
Ingredient
Cereal/grain, sorghum, g/100 g 9.00 —
Legume, g/100 g
Groundnut 14.00 27.00
Soybean 2.00 —
Milk, g/100 g
Dry, nonfat, regular, without added vitamin A and vitamin D 5.00 25.00
Whey protein concentrate 34% 20.18 —
Oil, g/100 g
Canola 20.50 —
Palm — 15.48
Soybean — 2.92
Sugar, g/100 g 25.00 24.64
Micronutrient and vitamin premix, g/100 g 2.92 2.96
Emulsifier, g/100 g 1.40 2.00
Nutrient
Energy, kcal/100 g 560 559
Protein, g/100 g 14.5 15.8
Lipids, g/100 g 29.2 33.0
n-6 fatty acids, g/100 g 6.3 5.7
n-3 fatty acids, g/100 g 1.9 0.03
Abbreviation: RUTF, ready-to-use therapeutic food.a Both foods were a soft, brown, homogeneous paste with small granules perceptible to the tongue. They were packaged in identical,unlabeled metalized polyethylene terephthalate sachets with the only marking being a colored dot to indicate the type of RUTF.
A total of1,270 childrenwere enrolled inthe study fromFebruary 2017 toFebruary 2018.
Alternative RUTF Yields Lower SAM Recovery Than the Standard www.ghspjournal.org
Global Health: Science and Practice 2019 | Volume 7 | Number 2 207
characteristics for each study group were similar(Table 3). For the children with SAM, 157 weredesignated by both MUAC and weight-for-length,178 only by MUAC, 63 only by weight-for-length,and 3 only by having edema. For the childrenwith MAM, 320 were designated by both MUACand weight-for-length, 378 only by MUAC, and171 only by weight-for-length.
Among SAM and MAM children receiving A-RUTF, 516 of 642 recovered (80.4%, 95% CI=77.1% to 83.3%) (Table 4). Among children receiv-ing S-RUTF, 553 of 628 recovered (88.1%, 95%CI=85.3% to 90.4%). The difference in recovery rateswas 7.7 percentage points (95% CI=3.7 to 11.7 per-centage points).
The protein content in 100 g of S-RUTF was1.25 g higher than in 100 g of A-RUTF, althoughboth foods were within current internationalagency specifications and 50% of protein wasfrom a dairy source (Table 2).10 S-RUTF also hada lipid content that was 2.8 g more than A-RUTFper 100 g of RUTF. Protein quality as determined
by DIAAS using healthy children as a referencepopulation was 107 for A-RUTF and 109 forS-RUTF. Protein quality using malnourished chil-dren as a reference population was 85 for A-RUTFand 84 for S-RUTF.
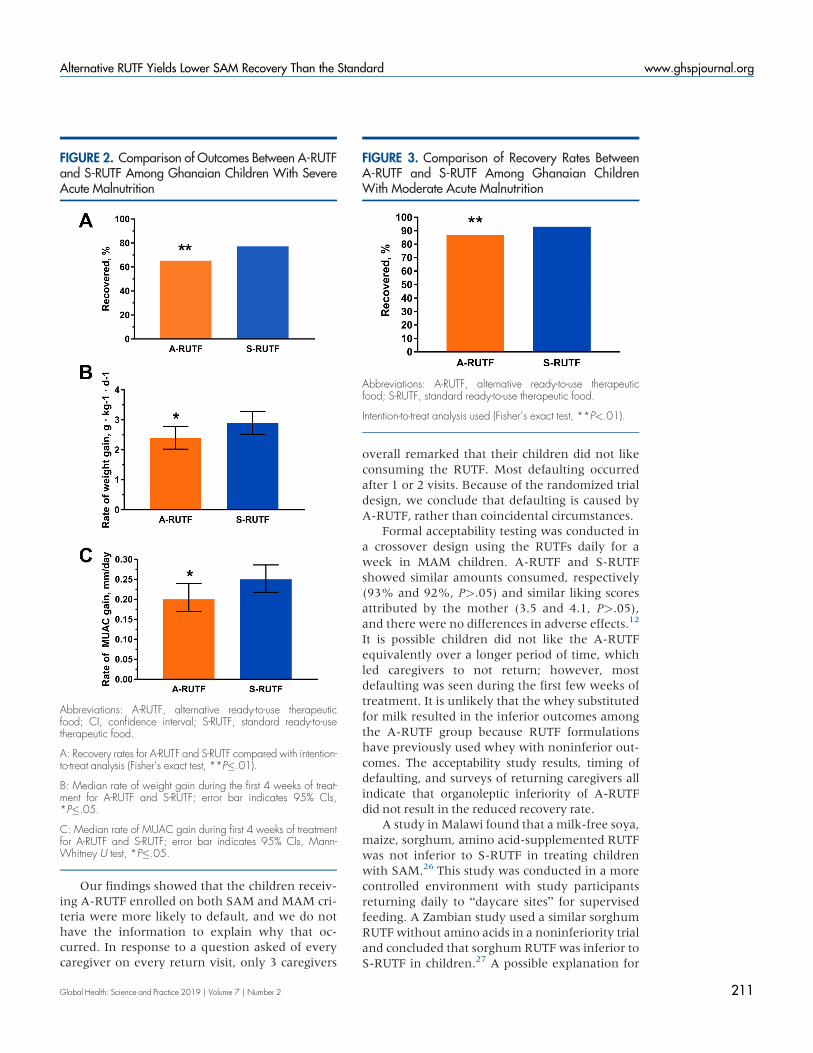
Among SAM children, recovery was seen in130 of 199 (65.3%) for those receiving A-RUTFand was 156 of 202 (77.2%; P=.01) for those re-ceiving S-RUTF (Table 4, Figure 2); defaults werenot considered to be recovered in our ITT analysis.Children with SAM receiving A-RUTF had lowerrates of gain for bothweight andMUAC (Figure 2).
Children with MAM who received A-RUTFwere less likely to recover, according to an ITTanalysis (Figure 3). For children with MAM, ratesof weight and MUAC gain were similar betweengroups (Table 4). Mortality rates were low, withonly 5 (0.4%) MAM or SAM children dying.
A total of 184 (14.5%) of children did not com-plete the study and were classified as defaults(Table 4). The relative risk for defaulting if thechildwas enrolledwith SAM comparedwith those
FIGURE 1. CONSORT Flow Diagram
Assessed for eligibility (n=3,175)
Excluded (n=1,905) � Did not meet inclusion criteria (n=1,804) � Declined to participate (n=101)
Analyzed (n=642) � Excluded from analysis (n=0)
Default (n=116)
Died (n=1)
Allocated to alternative RUTF (n=642) � Received allocated intervention (n=642) � Did not receive allocated intervention (n=0)
Default (n=68)
Died (n=4)
Allocated to standard RUTF (n=628) � Received allocated intervention (n=628) � Did not receive allocated intervention (n=0)
Analyzed (n=628) � Excluded from analysis (n=0)
Allocation
Analysis
Follow-Up
Randomized (n=1,270)
Enrollment
Abbreviation: RUTF, ready-to-use therapeutic food.
A-RUTF yieldedlower rates of gainfor weight andMUAC and a lowerlikelihood ofrecovery amongchildren with SAM.
Alternative RUTF Yields Lower SAM Recovery Than the Standard www.ghspjournal.org
Global Health: Science and Practice 2019 | Volume 7 | Number 2 208

with MAM was 3.39 (CI 95%=2.53 to 4.53). Ofthe children who defaulted, 116 (63.0%) receivedA-RUTF compared with 68 (37.0%, P<.001) whoreceived S-RUTF. Considering the SAM childrenwho defaulted, 68 of 101 (67.3%) did so be-fore the 4-week follow-up, and 7 of 101 (6.9%)did so after the 8-week follow-up. Only 26 of101 (25.7%) attained anMUAC>11.4 cm, indica-tive of improvement from SAM to MAM.
Coverage surveys were conducted throughoutcatchment areas in February 2018. During the sur-vey, the data collection teams assessed a total of560 children. Among these children, 11 (2.0%)had SAM and 52 (9.3%) had MAM. The coverageof SAM children was 7 of 11 (63.6%) and MAMchildren was 18 of 52 (34.6%). Mothers wereasked if they were aware there was a treatmentprogram in their community, and 8 of 11 (72.7%)of mothers with SAM children and 28 of52 (53.8%) of mothers with MAM childrenresponded positively.
The cost of A-RUTF used per MAM child re-covered was US$7.07, while for S-RUTF the costwas $8.20 (16% higher). The cost of A-RUTF perSAM child recovered was $28.72, while forS-RUTF this was $28.48, a similar amount.
Untargeted metabolomics of A-RUTF and S-RUTF showed that among the 26 unique
metabolites found in A-RUTF, 5 were isoflavones,consistent with the addition of soy products inA-RUTF; while S-RUTF had only 9 unique meta-bolites, and most were likely to be minor compo-nents of the food emulsifier or peanuts (Table 5).No xenobiotics were found in the A-RUTF thatwere also not present in the S-RUTF.
DISCUSSIONAn acute malnutrition treatment program wassuccessfully instituted at 29 rural sites in BrongAhafo, where the prevalence of acute malnutri-tion was high and a coverage estimate met thosetypically reported as well as international stan-dards.23,24 Unexpectedly, A-RUTF was not equiv-alent to S-RUTF in the treatment of SAM or MAMin Ghana in this randomized, double-blind, clini-cal, controlled trial comparedwith an ITT analysis.The primary compositional differences were thatsorghum and soy were used in A-RUTF in placeof some of the peanut paste in S-RUTF and a largeportion of the dried skim milk in S-RUTF wasreplaced with whey protein in A-RUTF.
The trial was limited by the large number ofchildren who were lost to follow-up. Their out-comes were unknown; however, lost to follow-upor “default” was regarded as a negative outcome,
TABLE 3. Characteristics of Study Children at Enrollment
Severe Acute Malnutrition Moderate Acute Malnutrition
A-RUTF S-RUTF A-RUTF S-RUTFCharacteristic (n=199) (n=202) (n=443) (n=426)
Male, No. (%) 88 (44.2) 94 (46.5) 189 (42.7) 163 (38.3)
Age, months, mean (SD) 14.38 (8.0) 13.25 (7.6) 15.79 (9.3) 13.89 (7.2)
Roof made of metal, No. (%) 152 (76.4) 153 (75.7) 358 (80.8) 346 (81.2)
Animals sleep with child, No. (%) 120 (60.3) 127 (62.9) 259 (58.5) 275 (64.6)
Electricity in home, No. (%) 111 (55.8) 113 (55.9) 285 (65.2) 267 (62.7)
Clean water source, No. (%) 83 (41.7) 91 (45.0) 206 (46.5) 206 (48.4)
Edema, No. (%) 5 (2.5) 3 (1.5) — —
Mid-upper arm circumference, cm, mean (SD) 11.1 (0.9) 11.0 (0.8) 12.2 (0.4) 12.2 (0.4)
Weight, kg, mean (SD) 6.28 (1.3) 6.12 (1.2) 7.34 (1.3) 7.19 (1.2)
Length, cm, mean (SD) 69.8 (7.5) 68.5 (6.6) 72.4 (7.2) 71.2 (6.6)
Weight-for-length, z score, mean (SD) -3.16 (0.8) -3.07 (0.9) �2.08 (0.6) �1.97 (0.6)
Length-for-age, z score, mean (SD) -2.56 (1.4) -2.64 (1.4) �1.98 (1.2) �1.80 (1.1)
Weight-for-age, z score, mean (SD) -3.65 (0.9) -3.64 (1.0) �2.59 (0.7) �2.41 (0.9)
Abbreviations: A-RUTF, alternative ready-to-use therapeutic food; SD, standard deviation; S-RUTF, standard ready-to-use therapeutic food.
The cost of A-RUTFused perMAMchild recoveredwas US$7.07 and$8.20 for S-RUTF(16%higher).
Unexpectedly,A-RUTF was notequivalent toS-RUTF in thetreatment ofSAM orMAM inthis trial.
Alternative RUTF Yields Lower SAM Recovery Than the Standard www.ghspjournal.org
Global Health: Science and Practice 2019 | Volume 7 | Number 2 209

following other RUTF trials and internationalstandards.4,21 Concerted efforts to seek malnour-ished children in Malawi who were lost to follow-up found that death or hospitalization occurred atabout twice the rate as in those who reached a de-finitive outcome.4 There were no differencesbetween the characteristics of children lost tofollow-up comparedwith thosewho reached a de-finitive outcome in this study (data not shown).
Weused ITT analyses, which are considered thestrongest approach for randomized clinical trials toensure unbiased comparisons among the treatmentgroups. If a per protocol analysis had been con-ducted on these SAM data from Ghana, recoveryrates would have been 92% and 96% for A-RUTF
and S-RUTF, respectively (P>.05). If we assumethat half of the children lost to follow-up had a de-finitive negative outcome, then recovery rates forSAM would have been 79% and 87% for A-RUTFand S-RUTF, respectively (P=.05). This study is oneof very few published clinical trials treating acutemalnutrition in Ghana. Previously, a treatment tri-al of SAM in the Upper East region found a recov-ery rate of 71% (95% CI=68.0% to 76.0%) anddefault at 28% (95% CI=24.0% to 32.0%),25
results that are similar to our findings from BrongAhafo. While we believe that our data support theconclusion that A-RUTF is inferior to S-RUTF, thisconclusion is tempered by uncertainty from chil-dren defaulting.
TABLE 4. Comparison of Outcomes Between Assigned Treatment Food for Ghanaian Children With SevereAcute Malnutrition and Moderate Acute Malnutrition
OutcomeAssignedA-RUTF
AssignedS-RUTF P Valuea
All study participants n=642 n=628
Defaulted,b No. (%) 116 (18.1) 68 (10.8) <.001
Died, No. (%) 1 (0.2) 4 (0.6) .21
Recovered, No. (%) 516 (80.4) 554 (88.2) <.001
Remained malnourished, No. (%) 9 (1.4) 2 (0.3) .06
Rate of weight gain,c g/kg/d, mean (SD) 1.88 (1.8) 2.04 (2.0) .31
Rate of MUAC gain,c mm/d, mean (SD) 0.16 (0.2) 0.18 (0.2) .04
Participants with SAM n=199 n=202
Defaulted,b No. (%) 60 (30.1) 41 (20.3) .03
Died, No. (%) 1 (0.5) 3 (1.5) .62
Recovered, No. (%) 130 (65.3) 156 (77.2) .01
Remained malnourished, No. (%) 8 (4.0) 2 (1.0) .06
Rate of weight gain,c g/kg/d, mean (SD) 2.40 (2.4) 2.90 (2.6) .04
Rate of MUAC gain,c mm/d, mean (SD) 0.20 (0.2) 0.25 (0.2) .047
Participants with MAM n=443 n=426
Defaulted,b No. (%) 56 (12.6) 27 (6.3) .002
Died, No. (%) 0 (0.0) 1 (0.2) >.99
Recovered, No. (%) 386 (87.1) 398 (93.4) .003
Remained malnourished, No. (%) 1 (0.2) 0 (0) >.99
Rate of weight gain,c g/kg/d, mean (SD) 1.66 (1.5) 1.61 (1.5) .62
Rate of MUAC gain,c mm/d, mean (SD) 0.13 (0.2) 0.14 (0.2) .29
Abbreviations: A-RUTF, alternative ready-to-use therapeutic food; MAM, moderate acute malnutrition; MUAC, mid-upper arm circum-ference; SAM, severe acute malnutrition; S-RUTF, standard ready-to-use therapeutic food.a Statistical comparisons made using Student’s t test for continuous parameters and Fisher’s exact test for categorical parameters.b Defaulters were treated as unrecovered in the calculation of recovery rates.c Calculated for the first 4 weeks of treatment.
Our data supportthat A-RUTF isinferior to S-RUTF,but the conclusionmaybeaffectedbydefaulting.
Alternative RUTF Yields Lower SAM Recovery Than the Standard www.ghspjournal.org
Global Health: Science and Practice 2019 | Volume 7 | Number 2 210
Our findings showed that the children receiv-ing A-RUTF enrolled on both SAM and MAM cri-teria were more likely to default, and we do nothave the information to explain why that oc-curred. In response to a question asked of everycaregiver on every return visit, only 3 caregivers
overall remarked that their children did not likeconsuming the RUTF. Most defaulting occurredafter 1 or 2 visits. Because of the randomized trialdesign, we conclude that defaulting is caused byA-RUTF, rather than coincidental circumstances.
Formal acceptability testing was conducted ina crossover design using the RUTFs daily for aweek in MAM children. A-RUTF and S-RUTFshowed similar amounts consumed, respectively(93% and 92%, P>.05) and similar liking scoresattributed by the mother (3.5 and 4.1, P>.05),and there were no differences in adverse effects.12
It is possible children did not like the A-RUTFequivalently over a longer period of time, whichled caregivers to not return; however, mostdefaulting was seen during the first few weeks oftreatment. It is unlikely that the whey substitutedfor milk resulted in the inferior outcomes amongthe A-RUTF group because RUTF formulationshave previously used whey with noninferior out-comes. The acceptability study results, timing ofdefaulting, and surveys of returning caregivers allindicate that organoleptic inferiority of A-RUTFdid not result in the reduced recovery rate.
A study inMalawi found that a milk-free soya,maize, sorghum, amino acid-supplemented RUTFwas not inferior to S-RUTF in treating childrenwith SAM.26 This study was conducted in a morecontrolled environment with study participantsreturning daily to “daycare sites” for supervisedfeeding. A Zambian study used a similar sorghumRUTFwithout amino acids in a noninferiority trialand concluded that sorghum RUTF was inferior toS-RUTF in children.27 A possible explanation for
FIGURE 2. Comparison of Outcomes Between A-RUTFand S-RUTF Among Ghanaian Children With SevereAcute Malnutrition
Abbreviations: A-RUTF, alternative ready-to-use therapeuticfood; CI, confidence interval; S-RUTF, standard ready-to-usetherapeutic food.
A: Recovery rates for A-RUTF and S-RUTF compared with intention-to-treat analysis (Fisher’s exact test, **P�.01).
B: Median rate of weight gain during the first 4 weeks of treat-ment for A-RUTF and S-RUTF; error bar indicates 95% CIs,*P�.05.
C: Median rate of MUAC gain during first 4 weeks of treatmentfor A-RUTF and S-RUTF; error bar indicates 95% CIs, Mann-Whitney U test, *P�.05.
FIGURE 3. Comparison of Recovery Rates BetweenA-RUTF and S-RUTF Among Ghanaian ChildrenWith Moderate Acute Malnutrition
Abbreviations: A-RUTF, alternative ready-to-use therapeuticfood; S-RUTF, standard ready-to-use therapeutic food.
Intention-to-treat analysis used (Fisher’s exact test, **P<.01).
Alternative RUTF Yields Lower SAM Recovery Than the Standard www.ghspjournal.org
Global Health: Science and Practice 2019 | Volume 7 | Number 2 211

the inferior outcomes among children receivingthe dairy-free sorghum RUTF may have been theacknowledged inferior protein quality comparedto S-RUTF. We found that a novel A-RUTF,which also included soy and sorghum, as wellas having a similar protein quality as S-RUTF,caused less Ghanaian children to recover fromSAM.
Under stressful physiological states, such asduring rapid growth, nucleotides are required in
the diet for optimal host response.28 There arelimited data describing the nucleotide content infoods; purine tables are most frequently used toestimate nucleotide content. Grains, such as sor-ghum, have a low purine content,29,30 whichsuggests that A-RUTF had a lower nucleotidecontent than S-RUTF. However, we were notable to detect differences in nucleotide contentbetween the foods in the untargeted metabolo-mics assays.
Table 5. Untargeted Metabolomic Assessment of A-RUTF and S-RUTF
Metabolite Class Specific Metabolites Identified Only in Alternative RUTF Pathobiological Significance
Phosphatidylcholines 1,2-Dipalmitoleoyl-sn-glycero-3-phosphocholine1-O-Hexadecyl-2-deoxy-2-thio-S-acetyl-sn-glyceryl-3phosphorylcholine1-Stearoyl-2-myristoyl-sn-glycero-3-phosphocholine1-Palmitoyl-2-docosahexaenoyl-sn-glycero-3-phosphocholinePC(O-16:0/16:1)PC(18:1/20:2)PC(18:0/20:4)Palmitoyleicosapentaenoyl phosphatidylcholine
Major component of most biological mem-branes, found in soy foods
Phosphoethanolamines 2-Arachidonoyl-1-palmitoyl-sn-glycero-3-phosphoethanolamine2-Linoleoyl-1-palmitoyl-sn-glycero-3-phosphoethanolamine
Ethanolamine derivative of phospholipids
Cholesterols 4-Cholestenone7-Oxocholesterol4-Beta-hydroxycholesterol 4-acetate
Oxidized forms of cholesterol, the likely sourcein RUTF is dairy products
Ceramides Ceramide (18:1/16:0)N-Palmitoyl-D-sphingosine
A lipid component of cell membranes thatenhances membrane rigidity and facilitates cellsignaling through the membrane
Phytosterols Cholestan-3-oneDihydrodaidzein
Plant-derived sterols typically found in soyproducts
Isoflavones GenistinGlycitin600-O-Acetylgenistin600-O-AcetylglycitinDaidzin
Isoflavonoid compounds almost entirely derivedfrom legume species, interact with estrogenreceptors
Vitamins Flavine mononucleotide Form of riboflavin
Glucosyl glucose (3beta,5xi,9xi,18xi,22beta)-22,25-Dihydroxyolean-12-en-3-yl6-deoxy-alpha-L-mannopyranosyl-(1->2)-beta-D-xylopyranosyl-(1->2)-beta-D-glucopyranosiduronic acid
A small carbohydrate component of cellulose
Specific metabolites identified only in standard RUTF
Phosphatidylcholines 1-Palmitoyl-2-stearoyl-sn-glycero-3-phosphocholine1-Docosahexaenoyl-2-stearoyl-sn-glycero-3-phosphocholine1-Palmitoyl-2-oleoyl-sn-glycerol
Major component of most biologicalmembranes
Lipids Erucic acidGlycerol 1-myristate
Minor components of edible oils; fatty acid anda monoglyceride
Phenylpropranoids 14-(Methylpentadecanoylamino)-3-phenylpropanoic acid3,5-Dimethoxy-4-hydroxycinnamic acid3-Hydroxy-4-methoxycinnamic acid
Food additive made from cinnamic acid and anatural product in coffee and tea
Phenylethylamide Phenylethylamide 359 Flavoring agent, naturally occurs in peanut
Abbreviations: A-RUTF, alternative ready-to-use therapeutic food; S-RUTF, standard ready-to-use therapeutic food.
Alternative RUTF Yields Lower SAM Recovery Than the Standard www.ghspjournal.org
Global Health: Science and Practice 2019 | Volume 7 | Number 2 212

Our cost data indicate for SAM that A-RUTFand S-RUTF are similar per child recovered, inspite of a 14% cost reduction per kilogram for theA-RUTF. No savings would be realized by using A-RUTF compared to S-RUTF in SAM.
While A-RUTF and S-RUTF met internationalspecifications for nutrient content, the greateramounts of protein and fat in S-RUTF comparedto A-RUTF led to greater rates of weight gain, butthese seem unlikely to be important factors in in-creasing defaulting. RUTF specifications were de-termined on the basis of expert opinion, notclinical evidence; thus, protein and fat require-ments may not be optimal. Some form of foodintolerance may possibly have occurred withA-RUTF, resulting in greater default rates. Thisproblem has been observed by the senior author inthe past with RUTFmade with chickpea in Africa.
With regard to the bioactive metabolites in A-RUTF compared to S-RUTF, the presence of isofla-vonoids might have contributed to the poorer out-come. Isoflavonoids have metabolic effects toreduce lipogenesis, which is often thought to be anadvantage for healthy consumers in the developedworld; however, in this population of acutely mal-nourished children, this would not be the case.31,32
No xenobiotics or toxins were found in A-RUTF.The sum of the evidence presented here indi-
cates that A-RUTF is inferior to S-RUTF; it causeslower recovery in SAMandMAM, aswell as lowerrates of weight and MUAC gain in SAM. It is mostimportant that RUTF facilitate recovery in SAMbecause SAM causes the most deaths. The certain-ty of this evidence is tempered by the observationthat most failures in our trial were the result ofdefaulting, and the definitive outcomes in thosecases are unknown. In conclusion, we cannot en-dorse this A-RUTF as noninferior to S-RUTF, andwe recommend caution and further testing beforeany alternative RUTF is used in an operational set-ting. These data emphasize the utility of random-ized trials to assess different RUTFs that meetinternational standards to determine equivalence.
Funding: Supported by the Children’s Investment Fund Foundation(CIFF) and the Hickey Family Foundation (HFF). The opinions expressedherein are those of the authors and do not necessarily reflect the views ofCIFF or HFF.
Competing Interests:None declared.
REFERENCES1. United Nations Children’s Fund (UNICEF); World Health
Organization (WHO); International Bank for Reconstruction andDevelopment/The World Bank. Levels and Trends in Child
Malnutrition: Key Findings of the 2018 Edition of the Joint ChildMalnutrition Estimates. Geneva:WHO; 2018. http://www.who.int/nutgrowthdb/2018-jme-brochure.pdf?ua=1. Accessed April 20,2019.
2. Liu L, Oza S, Hogan D, et al. Global, regional, and national causes ofunder-5 mortality in 2000–15: an updated systematic analysis withimplications for the Sustainable Development Goals. Lancet.2016;388(10063):3027–3035. CrossRef. Medline
3. Ijarotimi OS. Determinants of childhood malnutrition and conse-quences in developing countries. Curr Nutr Rep. 2013;2(3):129–133. CrossRef
4. Ciliberto MA, Sandige H, Ndekha MJ, et al. Comparison of home-based therapy with ready-to-use therapeutic food with standardtherapy in the treatment of malnourished Malawian children: a con-trolled, clinical effectiveness trial. Am J Clin Nutr. 2005;81(4):864–870. CrossRef. Medline
5. Linneman Z, Matilsky D, Ndekha M, Manary MJ, Maleta K, ManaryMJ. A large-scale operational study of home-based therapy withready-to-use therapeutic food in childhood malnutrition in Malawi.Matern Child Nutr. 2007;3(3):206–215. CrossRef. Medline
6. Lenters LM,Wazny K, Webb P, Ahmed T, Bhutta ZA. Treatment ofsevere and moderate acute malnutrition in low- and middle-incomesettings: a systematic review, meta-analysis and Delphi process.BMC Public Health. 2013;13(suppl 3):S23. CrossRef. Medline
7. Abdul-Latif AMC, Nonvignon J. Economic cost of community-basedmanagement of severe acute malnutrition in a rural district in Ghana.Health. 2014;06(10):886–889. CrossRef
8. Ready-to-use therapeutic food (RUTF) price data. UNICEF website.https://www.unicef.org/supply/index_59716.html. UpdatedJanuary 28, 2019. Accessed April 20, 2019.
9. Ryan KN, Adams KP, Vosti SA, Ordiz MI, Cimo ED, Manary MJ. Acomprehensive linear programming tool to optimize formulations ofready-to-use therapeutic foods: an application to Ethiopia.Am J ClinNutr. 2014;100(6):1551–1558. CrossRef. Medline
10. World Health Organization (WHO); World Food Programme;United Nations System Standing Committee on Nutrition; UnitedNations Children’s Fund. Community-Based Management of SevereAcute Malnutrition. Geneva: WHO; 2007. http://www.who.int/nutrition/topics/Statement_community_based_man_sev_acute_mal_eng.pdf. Accessed April 20, 2019.
11. Weber J, Callaghan M. Optimizing ready-to-use therapeutic foodsfor protein quality, cost, and acceptability. Food Nutr Bull. 2016;37(suppl 1):S37–S46. CrossRef. Medline
12. Weber JM, Ryan KN, Tandon R, et al. Acceptability of locally pro-duced ready-to-use therapeutic foods in Ethiopia, Ghana, Pakistanand India.Matern Child Nutr. 2017;13(2):e12250. CrossRef.Medline
13. Ghana Statistical Service. 2010 Population and Housing Census.Accra, Ghana: Ghana Statistical Services; 2012.
14. United Nations Children’s Fund (UNICEF). The Status of Education inGhana: Results from the Multiple Indicator Cluster Surveys (MICS)2006–2011. Accra, Ghana: UNICEF; 2013.
15. Ghana Statistical Service (GSS); Ghana Health Service (GHS); ICFInternational.Ghana Demographic and Health Survey 2014.Rockville, MD: GSS, GHS, and ICF International; 2015. https://dhsprogram.com/pubs/pdf/fr307/fr307.pdf. AccessedApril 20, 2019.
16. World Food Programme. Emergency Food Security and MarketAssessment: Ghana. World Food Programme; 2016. https://www.wfp.org/content/ghana-emergency-food-security-and-market-assessment-june-2016. Accessed April 20, 2019.
17. FAO; IFAD; UNICEF; WFP; WHO. The State of Food Security andNutrition in the World 2018: Building Climate Resilience for Food
Alternative RUTF Yields Lower SAM Recovery Than the Standard www.ghspjournal.org
Global Health: Science and Practice 2019 | Volume 7 | Number 2 213

Security and Nutrition. Rome: FAO; 2018. http://www.fao.org/3/I9553EN/i9553en.pdf. Accessed April 20, 2019.
18. Callaghan M, Oyama M, Manary M. Sufficient protein quality offood aid varies with the physiologic status of recipients. J Nutr.2017;147(3):277–280. CrossRef. Medline
19. Myatt M,Guevarra E, Fieschi L, et al. Semi-Quantitative Evaluation ofAccess and Coverage (SQUEAC)/Simplified Lot Quality AssuranceSampling Evaluation of Access and Coverage (SLEAC) TechnicalReference. Washington, DC: FHI 360/FANTA; 2012.
20. WHOMulticentre Growth Reference Study Group. Assessment ofdifferences in linear growth among populations in the WHOMulticentre Growth Reference Study. Acta Paediatr Suppl.2006;450:56–65. Medline
21. Dibley MJ, Staehling N, Nieburg P, Trowbridge FL. Interpretation ofZ-score anthropometric indicators derived from the internationalgrowth reference. Am J Clin Nutr. 1987;46(5):749–762. CrossRef.Medline
22. The Sphere Project. Humanitarian Charter and Minimum Standardsin Humanitarian Response. The Sphere Project; 2011. https://www.ifrc.org/PageFiles/95530/The-Sphere-Project-Handbook-20111.pdf. Accessed April 20, 2019.
23. Rogers E, Myatt M, Woodhead S, Guerrero S, Alvarez JL. Coverageof community-based management of severe acute malnutrition pro-grammes in twenty-one countries, 2012–2013. PLoS One. 2015-13;10(6):e0128666. CrossRef. Medline
24. FANTA. 2013 SQUEAC/SLEAC Coverage Survey Report: AgonaWest Municipal District. Washington, DC: FHI 360/FANTA; 2013.https://www.fantaproject.org/sites/default/files/resources/Coverage%20Survey%20Report%20-%20Ghana%20Agona-2013.pdf. Accessed April 20, 2019.
25. Akparibo R, Harris J, Blank L, Campbell MJ, Holdsworth M. Severeacute malnutrition in children aged under 5 years can be successfullymanaged in a non-emergency routine community healthcare setting
in Ghana.Matern Child Nutr. 2017;13(4):e12417. CrossRef.Medline
26. Bahwere P, Akomo P, Mwale M, et al. Soya, maize, and sorghum–based ready-to-use therapeutic food with amino acid is as effica-cious as the standard milk and peanut paste–based formulation forthe treatment of severe acute malnutrition in children: a noninfer-iority individually randomized controlled efficacy clinical trial inMalawi. Am J Clin Nutr. 2017;106(4):1100–1112. CrossRef.Medline
27. Irena AH, Bahwere P, Owino VO, et al. Comparison of the effective-ness of a milk-free soy-maize-sorghum-based ready-to-use thera-peutic food to standard ready-to-use therapeutic food with 25% milkin nutrition management of severely acutely malnourished Zambianchildren: an equivalence non-blinded cluster randomized controlledtrial.Matern Child Nutr. 2015;11(suppl 4):105–119. CrossRef.Medline
28. Singhal A, Kennedy K, Lanigan J, et al. Dietary nucleotides and earlygrowth in formula-fed infants: a randomized controlled trial.Pediatrics. 2010;126(4):e946–e953. CrossRef. Medline
29. Domínguez-Álvarez J, Mateos-VivasM, Rodríguez-Gonzalo E, et al.Determination of nucleosides and nucleotides in food samples by us-ing liquid chromatography and capillary electrophoresis. TrACTrends in Analytical Chemistry. 2017;92:12–31. CrossRef
30. Uuay-Dagach R, Quan R Significance of nucleic acids, nucleotidesand related compounds in infant nutrition. In: RäihäNCR, ed. ProteinMetabolism During Infancy. New York: Raven Press; 1994:197–210.
31. Ronis MJJ. Effects of soy containing diet and isoflavones on cyto-chrome P450 enzyme expression and activity. Drug Metab Rev.2016;48(3):331–341. CrossRef. Medline
32. Miadoková E. Isoflavonoids - an overview of their biological activitiesand potential health benefits. Interdiscip Toxicol. 2009;2(4):211–218. CrossRef. Medline
Peer Reviewed
Received: December 22, 2018; Accepted: April 2, 2019; First Published Online: June 12, 2019
Cite this article as: Kohlmann K, Callaghan-Gillespie M, Gauglitz JM, et al. Alternative ready-to-use therapeutic food yields less recovery than thestandard for treating acute malnutrition in children from Ghana. Glob Health Sci Pract. 2019;7(2):203-214. https://doi.org/10.9745/GHSP-D-19-00004
© Kohlmann et al. This is an open-access article distributed under the terms of the Creative Commons Attribution 4.0 International License (CC BY 4.0),which permits unrestricted use, distribution, and reproduction in any medium, provided the original author and source are properly cited. To view acopy of the license, visit http://creativecommons.org/licenses/by/4.0/. When linking to this article, please use the following permanent link: https://doi.org/10.9745/GHSP-D-19-00004
Alternative RUTF Yields Lower SAM Recovery Than the Standard www.ghspjournal.org
Global Health: Science and Practice 2019 | Volume 7 | Number 2 214