Embed Size (px)
Citation preview

Chapter-II
Performance Audits 1.
Farmer Welfare and Agriculture Development Department
2.1 Implementation of National Food Security Mission
Executive Summary
National Food Security Mission (NFSM) is a centrally sponsored crop
development scheme which aimed at achieving additional production of food
grains and restoring soil health. NFSM provided for demonstration of
production and protection technologies, distribution of seeds, nutrient
managements, farm mechanisation and training as major interventions in the
scheme. The scheme is implemented in identified districts of different States
under five components (Rice, Wheat, Pulses, Coarse cereals and Commercial
Crops). For 12th
Five Year Plan (2012-13 to 2016-17), the scheme had set
targets for additional production of 10 million tonnes of rice, 8 million tonnes
of wheat, 4 million tonnes of pulses and 3 million tonnes of coarse cereals.
In Madhya Pradesh, the scheme was being implemented in eight districts
under NFSM-Rice, 17 districts under NFSM-Wheat and all 51 districts
under NFSM-Pulses. Since 2014-15, NFSM-Coarse cereals and
NFSM-Commercial crops were being implemented in 16 districts and eight
districts respectively. During 2012-13 to 2015-16, the State had incurred
` 945.18 crore out of ` 1,051.41 crore received as grants-in-aid from the
Government of India for activities to be undertaken under the scheme. A
performance audit of the implementation of NFSM in the State covering the
period from 2012-13 to 2015-16 revealed the following:
Impact of scheme on production of food grains in NFSM districts
The objective of NFSM was to achieve additional production target of
25 million tonnes of food grains in 12th
Five Year Plan period at national
level. However, State Government did not communicate any target to NFSM
districts. As a result, the progress of NFSM districts in achieving additional
production targets during 2012-13 to 2015-16 could not be ascertained.
Two per cent of the total farmers in the State had been benefitted under
NFSM, as such the contribution of NFSM in overall food grain production of
the State was limited.
The scheme could only marginally increase the sown area of rice by five
per cent in NFSM-Rice districts. This was substantially lower than average
increase of 26 per cent in the sown area of rice during 2012-15 at the State
level. Any of the eight NFSM-Rice districts in 2012-13, six districts in
2013-14 and five districts in 2014-15 could not attain even the average yield
of rice in the State. The district wise production data of crops for the year
2015-16 was awaited as of December 2016.
The scheme could not maintain sustained growth of the wheat in NFSM
districts, as the sown areas in eight out of 17 NFSM districts decreased in
2014-15 as compared to 2013-14. The average yield of wheat in NFSM
Audit Report Economic Sector for the year ended 31 March 2016
8
districts was 2,872 kg/hectare during 2014-15, which was lower than the
State average yield of 3,079 kg/hectare. NFSM-Wheat districts also could not
achieve the level of State average yield during any of the years.
The production of pulses was highest (50.43 lakh MT) during 2012-13, which
was the first year of implementation of NFSM. It reduced during subsequent
years to 39.18 lakh MT during 2013-14 and 43.50 lakh MT during 2014-15.
However, the provisional data for production of pulses for the year 2015-16
had again indicated increase in production. Thus, the impact of NFSM on
production of pulses during successive years of implementation was not
conspicuous.
(Paragraph 2.1.6)
Planning
District Annual Action Plans were not prepared after obtaining inputs from
the Block offices. As a result, items without demand from the farmers were
also included under various interventions of NFSM.
Directorate did not prepare the perspective plan for scheme implementation in
the State. The baseline survey and feasibility studies were also not conducted
due to which the status of crop production, its potential and demand remained
unassessed.
(Paragraph 2.1.7)
Execution of scheme interventions
Distribution of seeds: Out of budget allocation of ` 177.14 crore for
distribution of rice, wheat, pulse and coarse cereals seeds during 2012-13 to
2015-16, Department incurred only ` 39.26 crore (22 per cent). The shortfall
in achievement of physical targets for distribution of quality seeds was
79 per cent in high yield variety of rice seeds, 57 per cent in wheat seeds,
63 per cent in pulse seeds and 94 per cent in coarse cereal seeds. The
distribution of pulse seeds in the State was decreasing during the years
2012-13 to 2015-16, which reduced to only 17 and 10 per cent during the
years 2014-15 to 2015-16 respectively. The shortfall in achievement of
physical targets was attributed to inadequate availability of seeds.
District offices could not ensure quality of seeds distributed to farmers, which
put to risk the production and income generation of farmers. Out of 3,126
samples taken for quality testing in 17 test-checked districts, 582 samples
were collected after sowing period. Out of 3,110 quality test reports received,
1,218 reports were received after sowing period. Further, 369 samples of
certified seeds were found sub-standard.
(Paragraph 2.1.8)
Field demonstration: Department incurred an expenditure of ` 153.37 crore
during the years 2012-16 on field demonstration of production and protection
technologies. However, the objective of demonstration remained largely
unfulfilled due to failure in preparation of comparative demonstration results
of demonstration plot (for improved practices) and control plot (for farmer’s
practices) and lack of involvement of scientists. District offices failed to
adhere the guidelines for conducting cropping system based demonstrations,
Chapter-II Performance Audit
9
which deprived awareness generation among farmers about cropping pattern
that could be adopted to increase the farm level economy.
(Paragraph 2.1.9)
Farm mechanisation: The Department did not fix the agencies and rates of
farm implements as envisaged under the NFSM operational guidelines. The
assistance to farmers on purchase of farm implements from unapproved
agencies and on unapproved rates resulted in irregular expenditure of
` 261.81 crore.
The Department did not adhere subsidy norms on sprinkler sets and ‘pipe for
carrying water from source to field’, which resulted in irregular excess
assistance of ` 5.11 crore to 8,337 farmers in 14 districts.
(Paragraph 2.1.11)
Fund Management
Out of ` 1,062.92 crore available for implementation of NFSM in the State,
Department utilised ` 945.18 crore (88 per cent) during 2012-13 to 2015-16.
However, the utilisation of NFSM fund had a decreasing trend, as it reduced
from 95 per cent in 2012-13 to 64 per cent in 2015-16. Directorate released
` 26.63 crore in eight test-checked districts during 2012-13 and 2013-14 for
implementation of NFSM-wheat, but these districts were not covered under
the scheme.
(Paragraph 2.1.15)
Monitoring of the scheme
The scheme was implemented in the State through Directorate of Farmers
Welfare and Agriculture Development and its district offices. However, the
operational guidelines for NFSM provided implementation of scheme at
district level through ‘Agricultural Technology Management Agency’, which
consisted of representatives of all line departments concerning agriculture
and allied sectors, research institutions at the district level and farmer’s
organisations. As a result of this deviation, the interventions under NFSM
could not be dovetailed with Strategic Research and Extension Plan of
Districts.
District level project management teams, which was responsible to help in
implementation and monitoring of the scheme, were not functional in most
cases. Further, the activities of mission was not reviewed by State Food
Security Mission Executive Committee.
(Paragraph 2.1.16)
2.1.1 Introduction
National Food Security Mission (NFSM), launched as a Centrally Sponsored
Scheme by Government of India (GoI) (October 2007) during the 11th
Five
Year Plan, is a crop development scheme that aimed at achieving additional
production of food grains and restoring soil health. The scheme was continued
during the 12th
Five Year Plan (2012-13 to 2016-17) setting new targets of
additional production of 25 million tonnes of food grains comprising of
10 million tonnes of rice, 8 million tonnes of wheat, 4 million tonnes of pulses
and 3 million tonnes of coarse cereals by the end of the 12th
Five Year Plan.
Audit Report Economic Sector for the year ended 31 March 2016
10
The scheme had been implemented in identified districts of different States
under five components, viz., NFSM-Rice, NFSM-Wheat, NFSM-Pulses,
NFSM-Coarse cereals and NFSM-Commercial Crops.
In Madhya Pradesh, the scheme was being implemented in eight districts
under NFSM-Rice, 17 districts under NFSM-Wheat and all 51 districts under
NFSM-Pulses. Since 2014-15, NFSM-Coarse cereals and NFSM-Commercial
crops were being implemented in 16 districts1 and eight districts
2 respectively.
During 2012-13 to 2015-16, the State had incurred ` 945.18 crore out of
` 1,051.41 crore received as grants-in-aid from the GoI for activities to be
undertaken under the scheme.
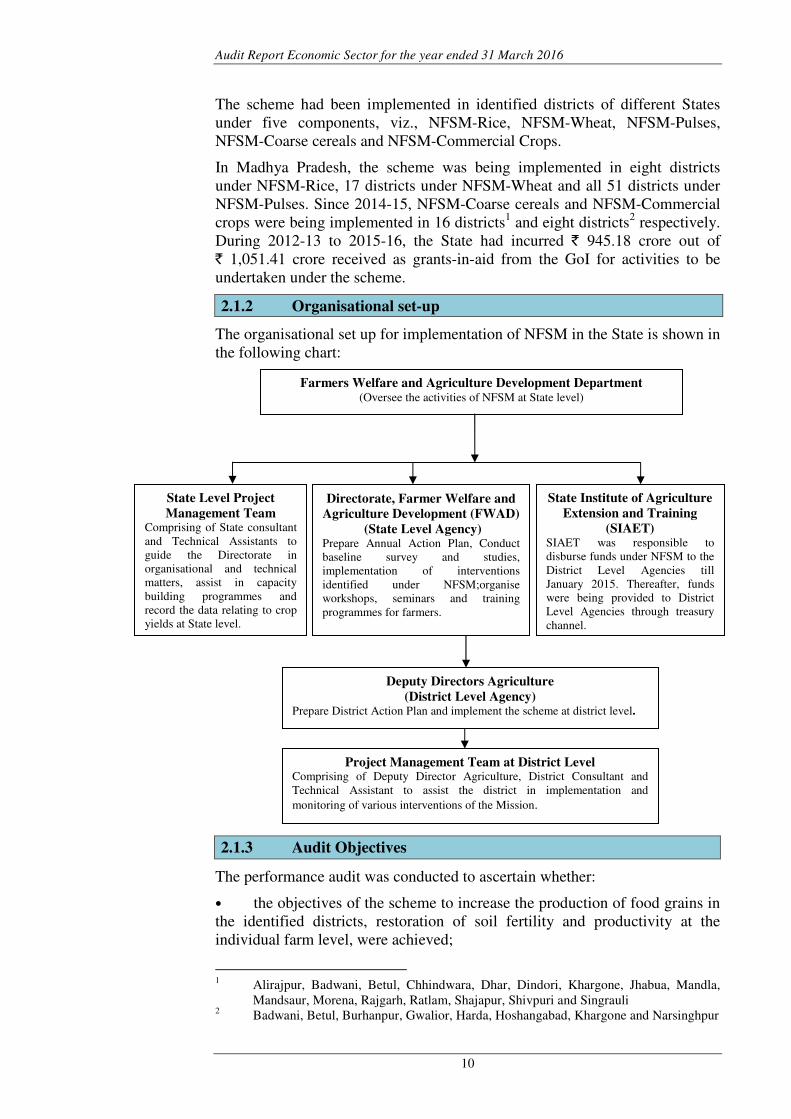
2.1.2 Organisational set-up
The organisational set up for implementation of NFSM in the State is shown in
the following chart:
2.1.3 Audit Objectives
The performance audit was conducted to ascertain whether:
• the objectives of the scheme to increase the production of food grains in
the identified districts, restoration of soil fertility and productivity at the
individual farm level, were achieved;
1 Alirajpur, Badwani, Betul, Chhindwara, Dhar, Dindori, Khargone, Jhabua, Mandla,
Mandsaur, Morena, Rajgarh, Ratlam, Shajapur, Shivpuri and Singrauli 2 Badwani, Betul, Burhanpur, Gwalior, Harda, Hoshangabad, Khargone and Narsinghpur
Farmers Welfare and Agriculture Development Department (Oversee the activities of NFSM at State level)
Deputy Directors Agriculture
(District Level Agency) Prepare District Action Plan and implement the scheme at district level.
Project Management Team at District Level Comprising of Deputy Director Agriculture, District Consultant and
Technical Assistant to assist the district in implementation and
monitoring of various interventions of the Mission.
State Level Project
Management Team Comprising of State consultant
and Technical Assistants to
guide the Directorate in
organisational and technical
matters, assist in capacity
building programmes and
record the data relating to crop
yields at State level.
Directorate, Farmer Welfare and
Agriculture Development (FWAD)
(State Level Agency) Prepare Annual Action Plan, Conduct
baseline survey and studies,
implementation of interventions
identified under NFSM;organise
workshops, seminars and training
programmes for farmers.
State Institute of Agriculture
Extension and Training
(SIAET) SIAET was responsible to
disburse funds under NFSM to the
District Level Agencies till
January 2015. Thereafter, funds
were being provided to District
Level Agencies through treasury
channel.
Chapter-II Performance Audit
11
• interventions were properly planned and executed efficiently and
effectively as per the operational guidelines of the scheme, and requisite
records and data were maintained at various levels;
• funds were released, accounted for and utilised by the agencies in
compliance with the provisions of the scheme; and,
• monitoring and evaluation had been done as envisaged under NFSM.
2.1.4 Audit Criteria
The audit findings were benchmarked against the following criteria:
• NFSM guidelines (12th
Five Year Plan)
• NFSM Commercial crops Operational Guidelines (12th
Five Year Plan)
• Provision of General Financial Rules
• Instructions issued through Government orders from time to time
• Impact Evaluation Report of the Scheme
2.1.5 Scope and methodologies of audit
The implementation of NFSM in the State during the period 2012-16 was
reviewed in the Performance Audit conducted during January 2016 to July
2016. For test check of records, 17 districts3, out of 51 districts in the State,
were selected on random sampling method. These selected districts included
five NFSM-Rice districts, seven NFSM-Wheat districts, 17 NFSM-Pulse
districts, five NFSM-Coarse cereals districts and three NFSM-Commercial
crop districts (Appendix 2.1). The records of offices of Deputy Directors,
Agriculture in the selected districts were test checked during the performance
audit. In addition, scheme related information was also collected from the
Directorate, Farmer Welfare and Agriculture Development. A beneficiary
survey was also carried out to assess the satisfaction amongst beneficiaries of
various interventions implemented in NFSM.
The audit objectives, scope, criteria and methodology were discussed with the
Principal Secretary, Farmer Welfare and Agriculture Development
Department in the entry conference held on 24 February 2016. The exit
conference was held on 10 November 2016 with the Principal Secretary to
discuss the audit findings. The reply of the Government on the draft report
was received in December 2016. Views expressed during the exit conference
and replies of Government have been incorporated suitably in the report.
Audit findings
2.1.6 Production of food grains
Madhya Pradesh has received National Krishi Karman Award4 2012-13 and
2014-15 for achieving highest food grain production and National Krishi
Karman Award 2013-14 for achieving highest wheat production. The sown
3 Bhind, Chhattarpur, Damoh, Dhar, Dindori, Guna, Harda, Hoshangabad, Indore,
Khargone, Mandla, Panna, Shajapur, Sidhi, Seoni, Ujjain and Vidisha. 4 An yearly award given under NFSM to best performer States for raising country’s food
grain production
Audit Report Economic Sector for the year ended 31 March 2016
12
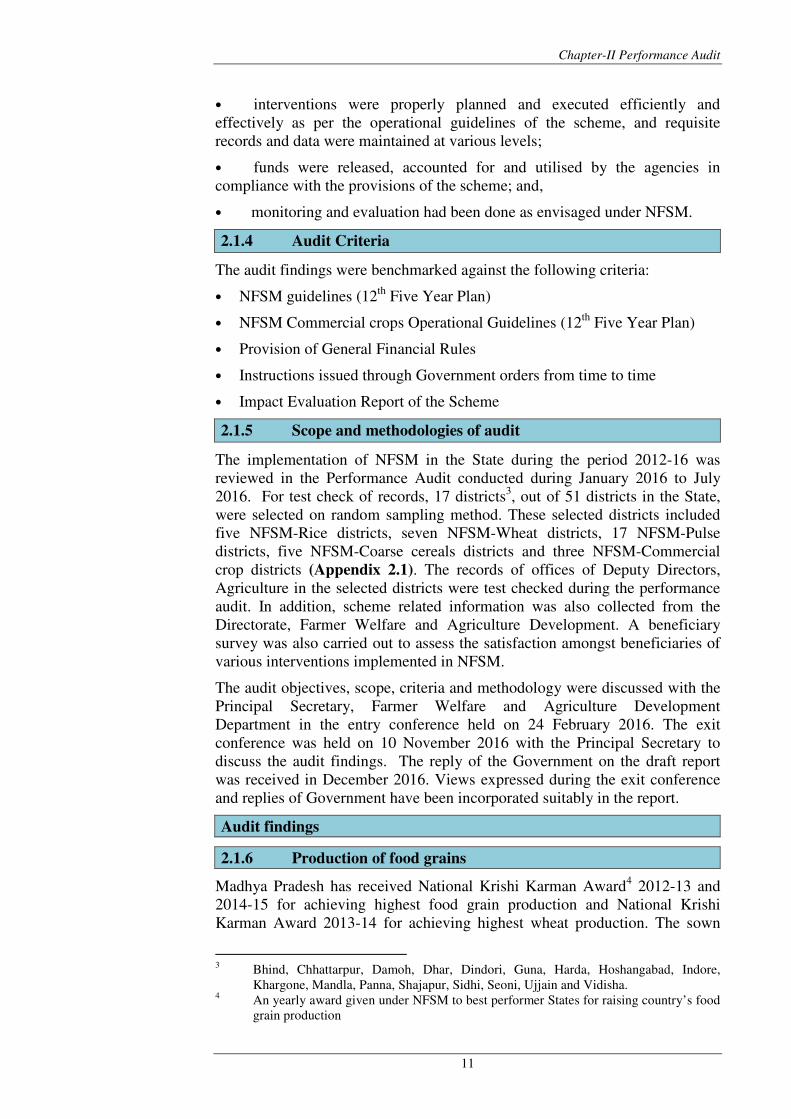
areas of rice, wheat and pulses, their production and yields in the State during
2012-13 to 2015-16 over the base year level (i.e., 2011-12 for implementation
of NFSM during 12th
Five Year Plan) were as shown in the table 2.1.1.
Table 2.1.1: Year wise position of sown areas, production and yield of rice, wheat and
pulses in Madhya Pradesh
Year
Sown area
(in 000’hectare)
Production
(in 000’ MT)
Yield
(in kg/ha)
Rice Wheat Pulse Rice Wheat Pulse Rice Wheat Pulse
2011-12 (Base Year)
1,703 5,261 4,763 2,280 14,544 3,718 1,339 2,764 781
2012-13 1,801 5,613 5,329 3,113 16,518 5,043 1,728 2,943 946
2013-14 1,930 5,976 4,832 5,361 17,478 3,918 2,778 2,925 810
2014-15 2,153 6,002 4,911 5,438 18,480 4,350 2,526 3,079 885
2015-16 (Provisional)
2,024 5,911 5,267 5,614 18,510 5,125 2,774 3,131 973
(Source: State Land Records data provided by the Directorate, Farmer Welfare and
Agriculture Development)
Table 2.1.1 indicates that the production of food grains increased over the
base year levels. The percentage increase was 146 per cent in rice, 27 per cent
in wheat and 38 per cent in pulses. The growth in production could be
attributed to increase in the sown areas as well as increase in per hectare yields
of the respective crops with inter-year variations. However, the yield of rice
decreased by nine per cent in the year 2014-15 as compared to the previous
year and the yield of pulses decreased by 14 per cent during 2013-14 with
reference to 2012-13.
The Government stated (December 2016) that the productivity of wheat and
pulses in 2013-14 affected due to less rainfall and hailstorm. The Government
further stated that the productivity of rice in 2014-15 affected due to
pre-monsoon rain and less rainfall during the rainy season.
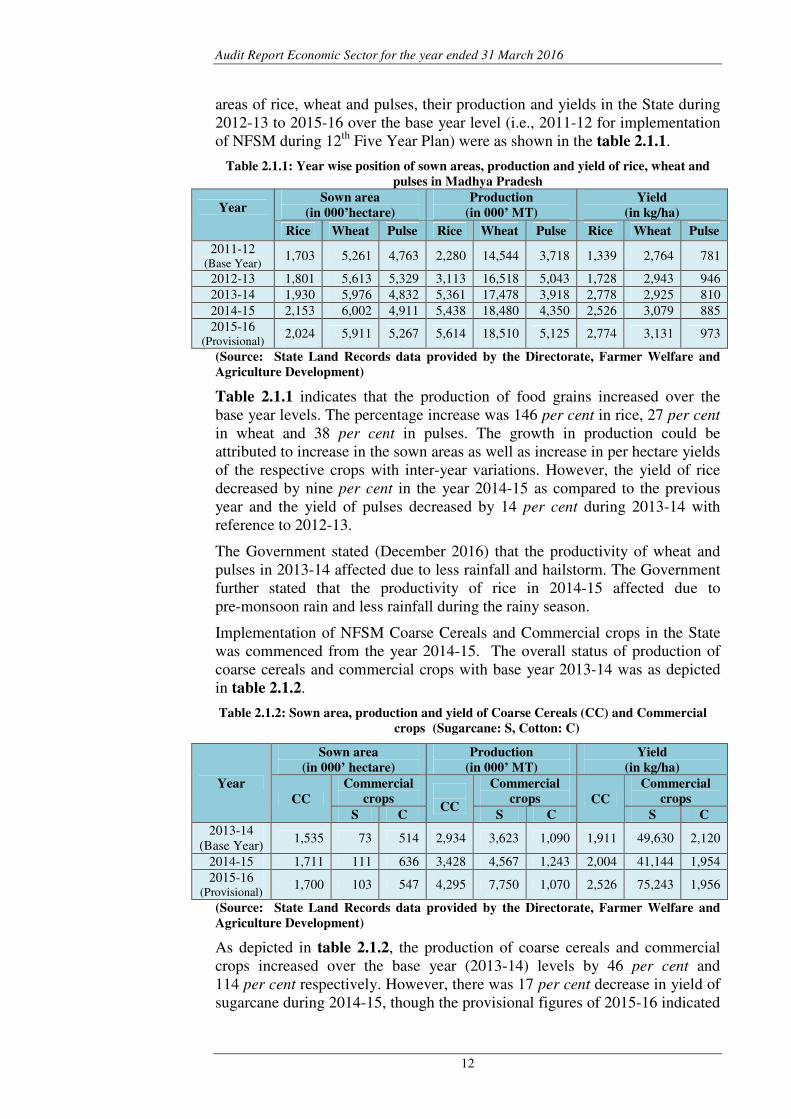
Implementation of NFSM Coarse Cereals and Commercial crops in the State
was commenced from the year 2014-15. The overall status of production of
coarse cereals and commercial crops with base year 2013-14 was as depicted
in table 2.1.2.
Table 2.1.2: Sown area, production and yield of Coarse Cereals (CC) and Commercial
crops (Sugarcane: S, Cotton: C)
Year
Sown area
(in 000’ hectare)
Production
(in 000’ MT)
Yield
(in kg/ha)
CC
Commercial
crops
CC
Commercial
crops CC
Commercial
crops
S C S C S C
2013-14
(Base Year) 1,535 73 514 2,934 3,623 1,090 1,911 49,630 2,120
2014-15 1,711 111 636 3,428 4,567 1,243 2,004 41,144 1,954
2015-16 (Provisional)
1,700 103 547 4,295 7,750 1,070 2,526 75,243 1,956
(Source: State Land Records data provided by the Directorate, Farmer Welfare and
Agriculture Development)
As depicted in table 2.1.2, the production of coarse cereals and commercial
crops increased over the base year (2013-14) levels by 46 per cent and
114 per cent respectively. However, there was 17 per cent decrease in yield of
sugarcane during 2014-15, though the provisional figures of 2015-16 indicated
Chapter-II Performance Audit
13
52 per cent increase in its yield. The production of cotton decreased from
1,090 tonne in 2013-14 to 1,070 tonne in 2015-16 and its yield also declined
by eight per cent in the year 2014-15 and 2015-16 as compared to the year
2013-14. Directorate informed (February 2017) that the decline in production
of cotton was due to unavailability of indigenous cotton seeds and change of
cotton area to pulses area.
2.1.6.1 Production of food grains in NFSM districts
The objective of NFSM was to achieve additional production target of
25 million tons of food grains at national level. However, Directorate of
Farmer Welfare and Agriculture Development informed (January 2017) that
GoI had not communicated any target for production under NFSM and also
State Government had not fixed any target for NFSM scheme. In the absence
of any production targets, the progress of NFSM districts with reference to the
scheme objectives to achieve additional production targets for different food
grains could not be ascertained in audit.
The sown area, production and yield of three components (Rice, Wheat and
Pulses) in NFSM districts of the State during 2011-12 (Base Year) to 2014-15
were as shown in charts 2.1.1, 2.1.2 and 2.1.3. The Department could not
provide (December 2016) the district-wise data for 2015-16 due to which the
performance of NFSM (Rice and Wheat) districts during 2015-16 and overall
performance under NFSM (Coarse cereals and Commercial Crops) were not
available.
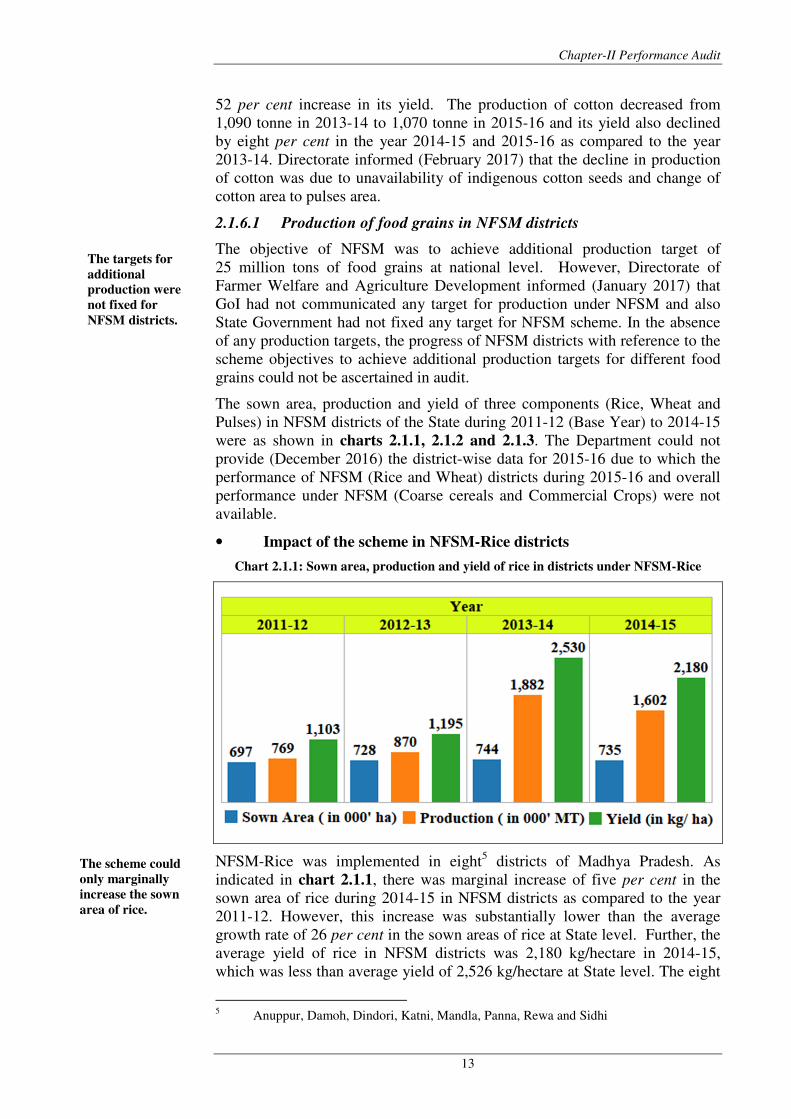
• Impact of the scheme in NFSM-Rice districts
Chart 2.1.1: Sown area, production and yield of rice in districts under NFSM-Rice
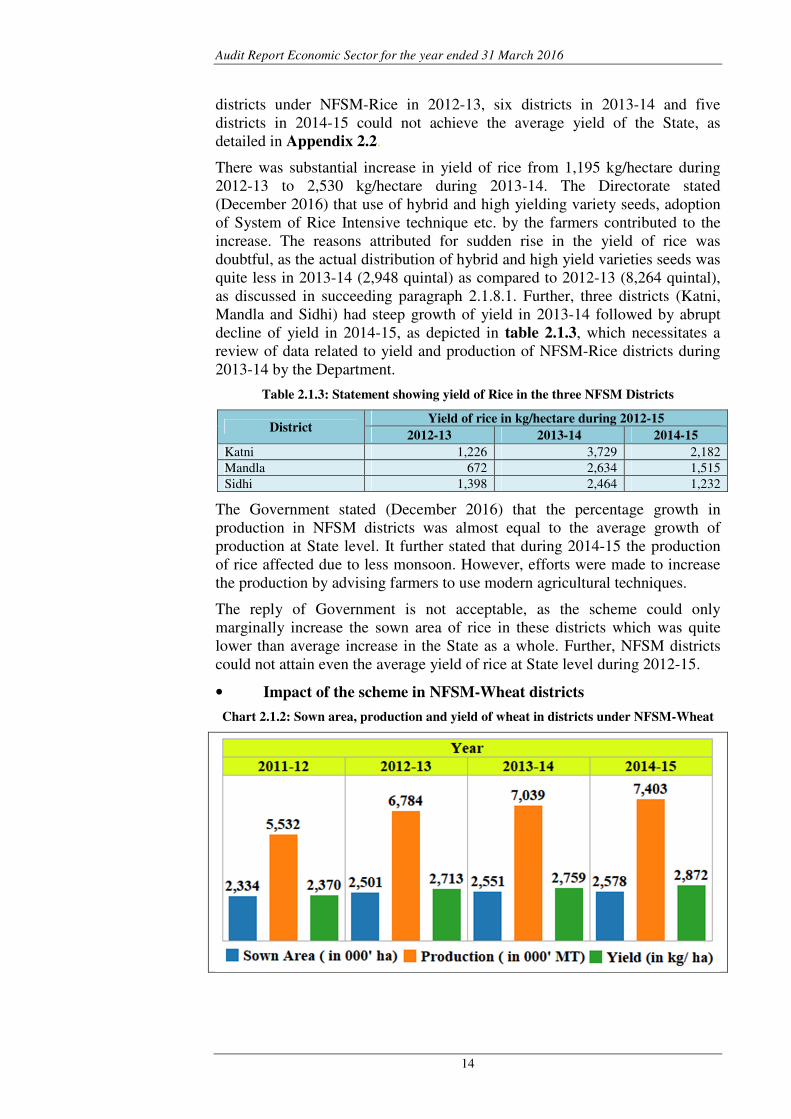
NFSM-Rice was implemented in eight5 districts of Madhya Pradesh. As
indicated in chart 2.1.1, there was marginal increase of five per cent in the
sown area of rice during 2014-15 in NFSM districts as compared to the year
2011-12. However, this increase was substantially lower than the average
growth rate of 26 per cent in the sown areas of rice at State level. Further, the
average yield of rice in NFSM districts was 2,180 kg/hectare in 2014-15,
which was less than average yield of 2,526 kg/hectare at State level. The eight
5 Anuppur, Damoh, Dindori, Katni, Mandla, Panna, Rewa and Sidhi
The targets for
additional
production were
not fixed for
NFSM districts.
The scheme could
only marginally
increase the sown
area of rice.
Audit Report Economic Sector for the year ended 31 March 2016
14
districts under NFSM-Rice in 2012-13, six districts in 2013-14 and five
districts in 2014-15 could not achieve the average yield of the State, as
detailed in Appendix 2.2.
There was substantial increase in yield of rice from 1,195 kg/hectare during
2012-13 to 2,530 kg/hectare during 2013-14. The Directorate stated
(December 2016) that use of hybrid and high yielding variety seeds, adoption
of System of Rice Intensive technique etc. by the farmers contributed to the
increase. The reasons attributed for sudden rise in the yield of rice was
doubtful, as the actual distribution of hybrid and high yield varieties seeds was
quite less in 2013-14 (2,948 quintal) as compared to 2012-13 (8,264 quintal),
as discussed in succeeding paragraph 2.1.8.1. Further, three districts (Katni,
Mandla and Sidhi) had steep growth of yield in 2013-14 followed by abrupt
decline of yield in 2014-15, as depicted in table 2.1.3, which necessitates a
review of data related to yield and production of NFSM-Rice districts during
2013-14 by the Department.
Table 2.1.3: Statement showing yield of Rice in the three NFSM Districts
District Yield of rice in kg/hectare during 2012-15
2012-13 2013-14 2014-15
Katni 1,226 3,729 2,182
Mandla 672 2,634 1,515
Sidhi 1,398 2,464 1,232
The Government stated (December 2016) that the percentage growth in
production in NFSM districts was almost equal to the average growth of
production at State level. It further stated that during 2014-15 the production
of rice affected due to less monsoon. However, efforts were made to increase
the production by advising farmers to use modern agricultural techniques.
The reply of Government is not acceptable, as the scheme could only
marginally increase the sown area of rice in these districts which was quite
lower than average increase in the State as a whole. Further, NFSM districts
could not attain even the average yield of rice at State level during 2012-15.
• Impact of the scheme in NFSM-Wheat districts
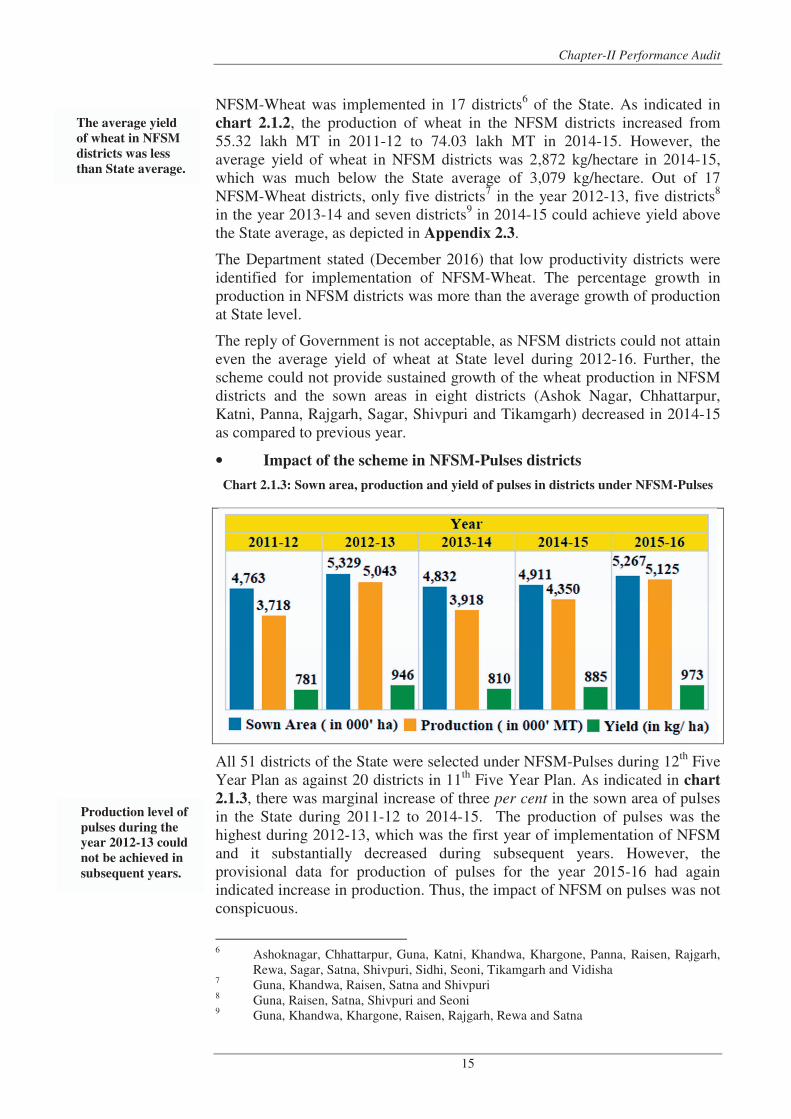
Chart 2.1.2: Sown area, production and yield of wheat in districts under NFSM-Wheat
Chapter-II Performance Audit
15
NFSM-Wheat was implemented in 17 districts6 of the State. As indicated in
chart 2.1.2, the production of wheat in the NFSM districts increased from
55.32 lakh MT in 2011-12 to 74.03 lakh MT in 2014-15. However, the
average yield of wheat in NFSM districts was 2,872 kg/hectare in 2014-15,
which was much below the State average of 3,079 kg/hectare. Out of 17
NFSM-Wheat districts, only five districts7 in the year 2012-13, five districts
8
in the year 2013-14 and seven districts9 in 2014-15 could achieve yield above
the State average, as depicted in Appendix 2.3.
The Department stated (December 2016) that low productivity districts were
identified for implementation of NFSM-Wheat. The percentage growth in
production in NFSM districts was more than the average growth of production
at State level.
The reply of Government is not acceptable, as NFSM districts could not attain
even the average yield of wheat at State level during 2012-16. Further, the
scheme could not provide sustained growth of the wheat production in NFSM
districts and the sown areas in eight districts (Ashok Nagar, Chhattarpur,
Katni, Panna, Rajgarh, Sagar, Shivpuri and Tikamgarh) decreased in 2014-15
as compared to previous year.
• Impact of the scheme in NFSM-Pulses districts
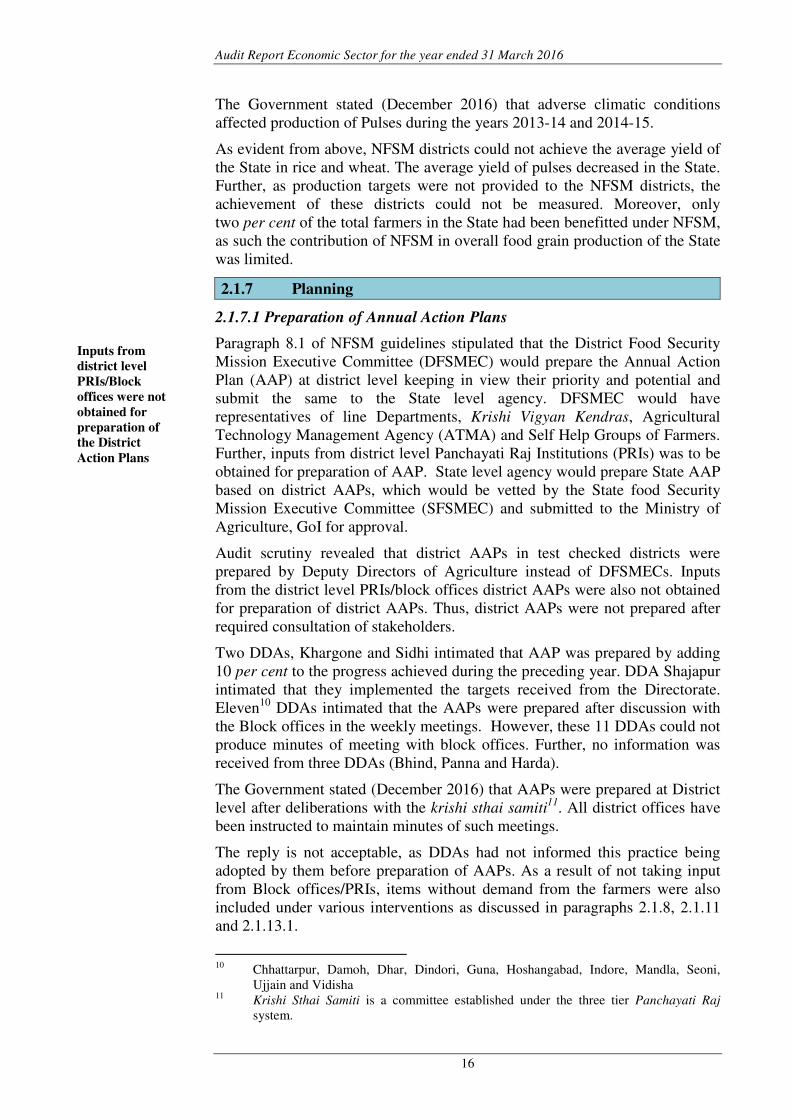
Chart 2.1.3: Sown area, production and yield of pulses in districts under NFSM-Pulses
All 51 districts of the State were selected under NFSM-Pulses during 12th
Five
Year Plan as against 20 districts in 11th
Five Year Plan. As indicated in chart
2.1.3, there was marginal increase of three per cent in the sown area of pulses
in the State during 2011-12 to 2014-15. The production of pulses was the
highest during 2012-13, which was the first year of implementation of NFSM
and it substantially decreased during subsequent years. However, the
provisional data for production of pulses for the year 2015-16 had again
indicated increase in production. Thus, the impact of NFSM on pulses was not
conspicuous.
6 Ashoknagar, Chhattarpur, Guna, Katni, Khandwa, Khargone, Panna, Raisen, Rajgarh,
Rewa, Sagar, Satna, Shivpuri, Sidhi, Seoni, Tikamgarh and Vidisha 7 Guna, Khandwa, Raisen, Satna and Shivpuri
8 Guna, Raisen, Satna, Shivpuri and Seoni
9 Guna, Khandwa, Khargone, Raisen, Rajgarh, Rewa and Satna
The average yield
of wheat in NFSM
districts was less
than State average.
Production level of
pulses during the
year 2012-13 could
not be achieved in
subsequent years.
Audit Report Economic Sector for the year ended 31 March 2016
16
The Government stated (December 2016) that adverse climatic conditions
affected production of Pulses during the years 2013-14 and 2014-15.
As evident from above, NFSM districts could not achieve the average yield of
the State in rice and wheat. The average yield of pulses decreased in the State.
Further, as production targets were not provided to the NFSM districts, the
achievement of these districts could not be measured. Moreover, only
two per cent of the total farmers in the State had been benefitted under NFSM,
as such the contribution of NFSM in overall food grain production of the State
was limited.
2.1.7 Planning
2.1.7.1 Preparation of Annual Action Plans
Paragraph 8.1 of NFSM guidelines stipulated that the District Food Security
Mission Executive Committee (DFSMEC) would prepare the Annual Action
Plan (AAP) at district level keeping in view their priority and potential and
submit the same to the State level agency. DFSMEC would have
representatives of line Departments, Krishi Vigyan Kendras, Agricultural
Technology Management Agency (ATMA) and Self Help Groups of Farmers.
Further, inputs from district level Panchayati Raj Institutions (PRIs) was to be
obtained for preparation of AAP. State level agency would prepare State AAP
based on district AAPs, which would be vetted by the State food Security
Mission Executive Committee (SFSMEC) and submitted to the Ministry of
Agriculture, GoI for approval.
Audit scrutiny revealed that district AAPs in test checked districts were
prepared by Deputy Directors of Agriculture instead of DFSMECs. Inputs
from the district level PRIs/block offices district AAPs were also not obtained
for preparation of district AAPs. Thus, district AAPs were not prepared after
required consultation of stakeholders.
Two DDAs, Khargone and Sidhi intimated that AAP was prepared by adding
10 per cent to the progress achieved during the preceding year. DDA Shajapur
intimated that they implemented the targets received from the Directorate.
Eleven10
DDAs intimated that the AAPs were prepared after discussion with
the Block offices in the weekly meetings. However, these 11 DDAs could not
produce minutes of meeting with block offices. Further, no information was
received from three DDAs (Bhind, Panna and Harda).
The Government stated (December 2016) that AAPs were prepared at District
level after deliberations with the krishi sthai samiti11
. All district offices have
been instructed to maintain minutes of such meetings.
The reply is not acceptable, as DDAs had not informed this practice being
adopted by them before preparation of AAPs. As a result of not taking input
from Block offices/PRIs, items without demand from the farmers were also
included under various interventions as discussed in paragraphs 2.1.8, 2.1.11
and 2.1.13.1.
10
Chhattarpur, Damoh, Dhar, Dindori, Guna, Hoshangabad, Indore, Mandla, Seoni,
Ujjain and Vidisha 11
Krishi Sthai Samiti is a committee established under the three tier Panchayati Raj
system.
Inputs from
district level
PRIs/Block
offices were not
obtained for
preparation of
the District
Action Plans
Chapter-II Performance Audit
17
2.1.7.2 Preparation of Perspective Plan and conduct of Baseline Study
Paragraph 4.2.4 of the guidelines stipulates that State level agency will prepare
perspective plan in consonance with the mission’s goals and objectives in
close co-ordination with the State Agriculture Universities and Indian Council
of Agricultural Research. The State Level Agency also had to
organise/conduct baseline survey and feasibility studies in the area of
operation (district, sub-district or a group of districts) to determine the status
of crop production, its potential and demand.
Audit scrutiny revealed that the Directorate, which was the State level agency
for NFSM, did not prepare the perspective plan. The baseline survey and
feasibility studies were also not conducted due to which the level of crop
productivity and its potential remained unassessed.
The Government stated (December 2016) that AAPs received from districts,
suggestions received from State Agricultural Universities and tentative
outlay/programme received from GoI were taken into consideration for
preparing the State level AAP. In respect of conducting baseline survey, the
Government replied that this was done on the basis of data provided by the
State Land Record.
The reply is not acceptable, as State level agency did not prepare the
perspective plan though required under the scheme. Further, State Land
Record data did not contain the database of potential and demand of crop in
the areas of operation, which was to be assessed in baseline survey and
feasibility studies under NFSM.
2.1.8 Execution of Interventions
In order to enhance the efficiency of the farmers in performing field operations
and economise upon the cost of cultivation, NFSM guidelines provided for
following major interventions:
• Accelerated Crop Production Programme (ACPP), under which
demonstrations of production and protection technologies in cropping system
based mode was to be done;
• Need based inputs, which had distribution of hybrid/certified seed,
nutrient management/soil ameliorants12
, plant protection measures, farm
mechanisation and training as its sub-interventions; and,
• Award for the best performing districts and local initiatives.
Each intervention had an interactive role with other interventions and their
synchronised implementation under each crop component could only produce
the intended results. The intervention-wise shares in budget allotment were as
shown in table 2.1.4.
12 Stuff that makes the soil more pleasant for plants to grow in and/or provide nutrients for
the soil.
Perspective plan
and baseline
survey was not
conducted to
determine the
status of crop
production, its
potential and
demand.
Audit Report Economic Sector for the year ended 31 March 2016
18
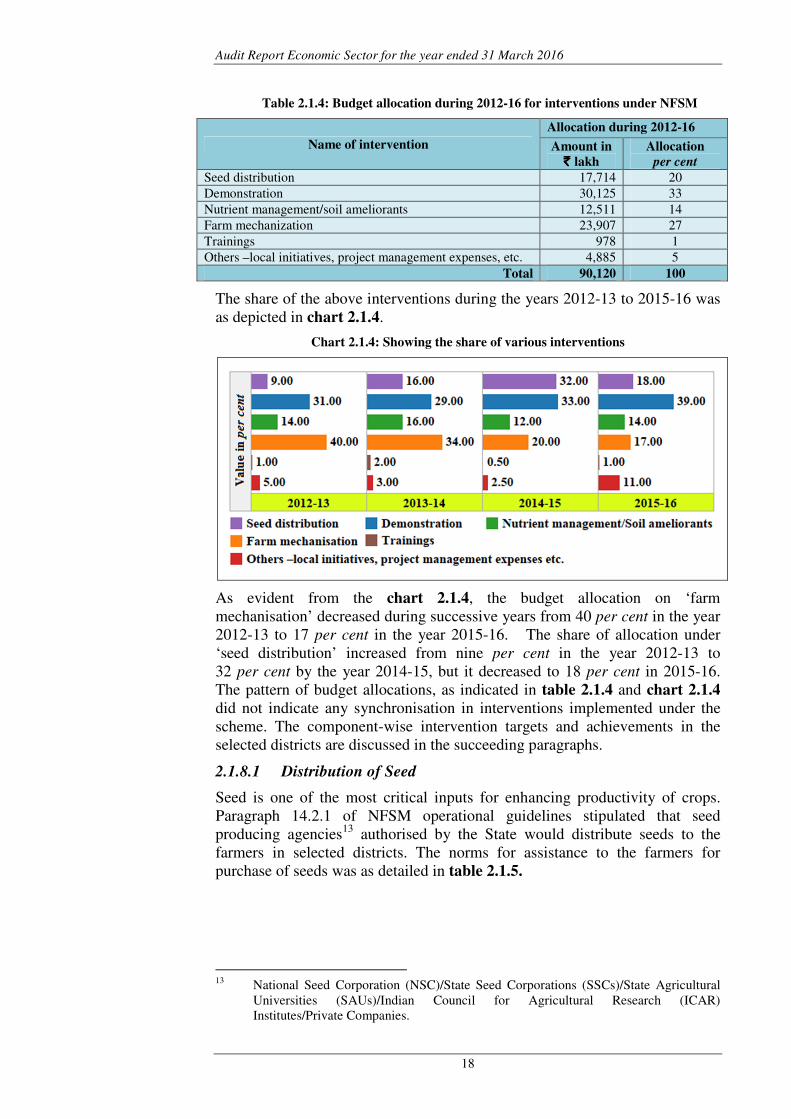
Table 2.1.4: Budget allocation during 2012-16 for interventions under NFSM
Name of intervention
Allocation during 2012-16
Amount in
`̀̀̀ lakh
Allocation
per cent
Seed distribution 17,714 20
Demonstration 30,125 33
Nutrient management/soil ameliorants 12,511 14
Farm mechanization 23,907 27
Trainings 978 1
Others –local initiatives, project management expenses, etc. 4,885 5
Total 90,120 100
The share of the above interventions during the years 2012-13 to 2015-16 was
as depicted in chart 2.1.4.
Chart 2.1.4: Showing the share of various interventions
As evident from the chart 2.1.4, the budget allocation on ‘farm
mechanisation’ decreased during successive years from 40 per cent in the year
2012-13 to 17 per cent in the year 2015-16. The share of allocation under
‘seed distribution’ increased from nine per cent in the year 2012-13 to
32 per cent by the year 2014-15, but it decreased to 18 per cent in 2015-16.
The pattern of budget allocations, as indicated in table 2.1.4 and chart 2.1.4
did not indicate any synchronisation in interventions implemented under the
scheme. The component-wise intervention targets and achievements in the
selected districts are discussed in the succeeding paragraphs.
2.1.8.1 Distribution of Seed
Seed is one of the most critical inputs for enhancing productivity of crops.
Paragraph 14.2.1 of NFSM operational guidelines stipulated that seed
producing agencies13
authorised by the State would distribute seeds to the
farmers in selected districts. The norms for assistance to the farmers for
purchase of seeds was as detailed in table 2.1.5.
13
National Seed Corporation (NSC)/State Seed Corporations (SSCs)/State Agricultural
Universities (SAUs)/Indian Council for Agricultural Research (ICAR)
Institutes/Private Companies.
Chapter-II Performance Audit
19
Table 2.1.5: Norms for assistance to the farmers for purchase of seeds
Name of crop Hybrids Varieties less than 10 years
Rice ` 50/kg or 50 per cent of
cost, whichever is less ` 10/kg
Wheat -- ` 10/kg
Pulses -- ` 25/kg or 50 per cent of cost, whichever is less
Coarse cereals ` 50/kg ` 15/kg or 50 per cent of cost, whichever is less
Out of budget allocation of ` 177.14 crore for distribution of rice, wheat, pulse
and coarse cereal seeds during 2012-13 to 2015-16, Department could incur
only ` 39.26 crore. The crop wise status of physical target and achievement
under this intervention was as follows:
Distribution of rice seeds
The physical targets and achievements of rice seeds during the years 2012-13
to 2015-16 were as shown in table 2.1.6.
Table 2.1.6: Physical targets and achievements of Distribution of rice Seed
(in quintals)
Year
Hybrid Varieties High Yielding Varieties
In eight NFSM-
Rice Districts
Test Checked
Districts
(five districts)
In eight NFSM-Rice
Districts
Test Checked
Districts (five
districts)
T A Per
cent T A
Per
cent T A
Per
cent T A
Per
cent
2012-13 500 1,464 293 175 110 63 15,000 6,800 45 6,720 2,216 33
2013-14 2,000 71 4 760 0 0 20,000 2,877 14 8,200 1,395 17
2014-15 5,900 52 1 2,170 0 0 31,000 2,002 6 11,300 288 3
2015-16 2,400 8 0 1,800 0 0 15,000 5,236 35 13,600 5,068 37
Total 10,800 1,595 14.77 4,905 110 2 81,000 16,915 21 39,820 8,967 23
(Source: Progress report of the District offices)
Thus, the distribution of hybrid and high yield variety rice seeds in the NFSM
districts was only 15 per cent of target for hybrid and 21 per cent of target for
distribution of high yielding varieties of rice seeds during the years 2012-16.
Distribution of wheat seeds
During the years 2012-14, assistance was provided to farmers for purchase of
certified wheat seed “varieties less than 10 years”. However, assistance for
purchase of High Yield Varieties was provided during the years 2014-15 to
2015-16. The physical targets and achievements in distribution of wheat seeds
during the years 2012-16 were as shown in table 2.1.7.
Table 2.1.7: Physical targets and achievements of Distribution of Wheat Seed
(in quintals)
Year
In 17 NFSM-Wheat Districts Test checked (seven districts)
Target Achievement Achievement
per cent Target Achievement
Achievement
per cent
2012-13 1,40,000 1,07,983 77.13 25,471 16,697 65.55
2013-14 2,40,000 1,17,873.80 49.11 46,000 16,070 34.93
2014-15 2,40,000 42,040.57 17.52 84,000 20,483 24.38
2015-16 68,004 25,843 38.00 32,860 9,190 27.96
Total 6,88,004 2,93,740.37 42.69 1,88,331 62,440 33.15
(Source: Progress report of the District offices)
There was
shortfall in
achieving targets
for distribution of
rice, wheat, pulses
and coarse cereal
seeds in NFSM
districts.
Audit Report Economic Sector for the year ended 31 March 2016
20
Thus, there was substantial shortfall in achieving targets for distribution of
wheat seeds. Directorate informed (January 2017) that target for 2015-16 was
kept low in view of the tentative outlay communicated by GoI. However, the
achievement against even the reduced target was dismal.
Distribution of Pulse seeds
NFSM-Pulse was implemented in all 51 districts. During the years 2012-14,
assistance was provided to farmers for purchase of pulse seed varieties ‘less
than 10 years old’ and ‘more than 10 years old’. During the years 2014-16,
assistance was provided for purchase of high yield varieties. The physical
targets and achievements of distribution of pulse seeds were as shown in table
2.1.8.
Table 2.1.8: Physical targets and achievements of Distribution of Pulse Seed
(in quintals)
Year Seed
variety
State (51 districts) Test checked (17 districts)
Target Achievement Achievement
per cent Target Achievement
Achievement
per cent
2012-13 < 10 years 16,500 14,837 90 7,170 12,315 172
>10 years 50,590 41,429 82 22,250 17,869 80
2013-14 < 10 years 32,000 26,015 81 25,797 19,065 74
>10 years 1,53,650 1,12,650 73 74,848 70,839 95
2014-15 HYV 2,65,000 45,656 17 1,21,460 42,674 35
2015-16 HYV 1,80,080 18,116 10 75,790 10,298 14
Total 6,97,820 2,58,703 37 3,27,315 1,73,060 53
(Source: Progress report of the District offices)
Thus, the progress in distribution of pulse seeds in the State as a whole was
decreasing during the years 2012-13 to 2015-16, which reduced to only 17 and
10 per cent during the years 2014-15 to 2015-16 respectively.
Distribution of Coarse Cereal seeds
NFSM-coarse cereal was implemented in the State from the year 2014-15.
The achievement of distribution of Coarse Cereal seeds during the years
2014-16 were as given in table 2.1.9.
Table 2.1.9: Targets and Achievements of Distribution of Coarse Cereal seeds
(in quintals)
Year
Hybrid High Yielding Varieties
State (16 districts) Test Checked District
(five districts) State
Test Checked
Districts (five)
T A Per
cent T A Per cent T A
Per
cent T A
Per
cent
2014-15 4,450 905 20.33 1,411 180 12.75 6,500 169 2.6 1,316 0 0
2015-16 9,499 0 0 1,100 0 0 9,736 835 8.57 1,050 0 0
Total 13,949 905 6.48 2,511 180 7.17 16,236 1,004 6.00 2,366 0 0
(Source: Progress report of the District offices)
As indicated in table 2.1.9, the progress in distribution of hybrid and high
yield variety Coarse Cereal seeds in the State was meagre, as only six per cent
targets for distribution of hybrid and high yield variety Coarse cereal seeds
could be achieved during the years 2014-16.
Thus, the overall performance in the State in distribution of quality seeds to
farmers was deficient in all the crop components. Test checked districts
Chapter-II Performance Audit
21
intimated unavailability of seeds, lack of demand from farmers etc. as the
reason for meagre achievement. It is pertinent to mention that 250 out of 260
beneficiaries of this intervention reported in the beneficiary survey that they
had achieved higher yield by using seeds provided by the department. This
necessitates a review in the mechanism of seed distribution to interested
farmers so as to achieve the additional production targeted under the NFSM
scheme.
The Government stated (December 2016) that targets of distribution of rice,
wheat and pulse seeds were affected due to inadequate availability of high
yielding varieties (below 10 years) and distribution of coarse cereal seeds due
to problem in availability of hybrid/high yield varieties. Efforts would be
made to ensure availability of seeds during the coming season.
The reply is not acceptable, as the State Government was responsible for
ensuring availability of quality seeds for distribution to beneficiary farmers.
2.1.8.2 Functioning of District Seed committee
Paragraph 12.5 of operational guidelines stipulated that a district level Seed
Committee will be constituted by the Chairman of the DFSMEC to ensure
availability and distribution of seeds to the farmers. The seed committee had to
verify the list of beneficiaries for seeds, its indent and its ultimate distribution
to end users.
Audit scrutiny revealed that, Seed Committee was not constituted in five14
out
of test checked 17 districts. In remaining 12 districts, where these committees
were formed, it could not be ascertained from records as to whether the seed
committees verified the list of beneficiaries for seeds and its distribution.
The Government stated (December 2016) that instructions had been issued to
the district offices for setting up District Seed Committees and conduct regular
meetings.
2.1.8.3 Quality of seeds
Quality of seeds distributed to farmers is being regulated under the Seed Act
1966, vide which no person shall carry on the business of selling, keeping for
sale, offering to sell, bartering or otherwise supplying any seed of any notified
kind or variety, unless such seed conforms to the minimum limits of
germination and purity. NFSM envisages for distribution of certified seeds to
farmers.
Audit scrutiny revealed that test checked 17 districts received a target of
conducting 3,766 seed quality tests from the Directorate during the years
2014-15 and 2015-16, out of which 3,126 (83 per cent) seed samples were
taken as detailed in Appendix 2.4. Seeds were to be sampled and tested before
distribution to farmers. However, 582 samples were collected after the sowing
period (Kharif: last week of June to 1st week of July; Rabi: mid-October to
first week of November) in seven15
test checked districts.
Out of 3,110 reports for quality tests received, 1,218 results were received
after the sowing period. Further, 369 samples of certified seeds (11.86 per cent
14
Hoshangabad, Mandla, Sidhi, Ujjain and Vidisha 15
Damoh, Dhar, Hoshangabad, Mandla , Sidhi, Ujjain and Vidisha
Quality of seeds
were not
ensured due to
delay in taking
samples and
receipt of results
after the sowing
period.
Audit Report Economic Sector for the year ended 31 March 2016
22
of total reports received) were found sub-standard. The quantum of seeds
distributed from these substandard lots could not be verified, as related records
were not made available.
Delay in taking samples and delayed receipts of quality test reports of seeds
led to sowing of substandard seeds by the farmers, which put to risk, the
production and income generation of farmers.
The Government stated (December 2016) that instructions had been issued to
district offices for timely collection of seed samples and the strict compliance
would be ensured.
2.1.9 Field demonstrations
Under NFSM scheme, field demonstration of production and protection
technologies was to be conducted on cropping system as well as on sole crop.
At least 30 per cent demonstrations were to be done on cropping system based
approach. The demonstrations were to be conducted by dividing the fields in
two blocks, one for improved practices (Demonstration plot) and the other for
farmer’s practices (Control plot). The District Consultants/Technical
Assistants of NFSM were to monitor the conduct of demonstrations and report
the outcome in prescribed format to the district level Project Management
Team (PMT).
Selection of beneficiaries was to be done adopting participatory approach by
holding meetings in the village by explaining the objectives of the
demonstrations. The cost of demonstration for one hectare area for sole crop
was ` 7,500 and ` 12,500 for a cropping sequence, while the cost of
demonstration for one hectare area for coarse cereals was ` 5,000.
Year-wise targets and achievement of demonstration in the State and selected
districts during 2012-16 are indicated in Appendix 2.5. An abstract thereof is
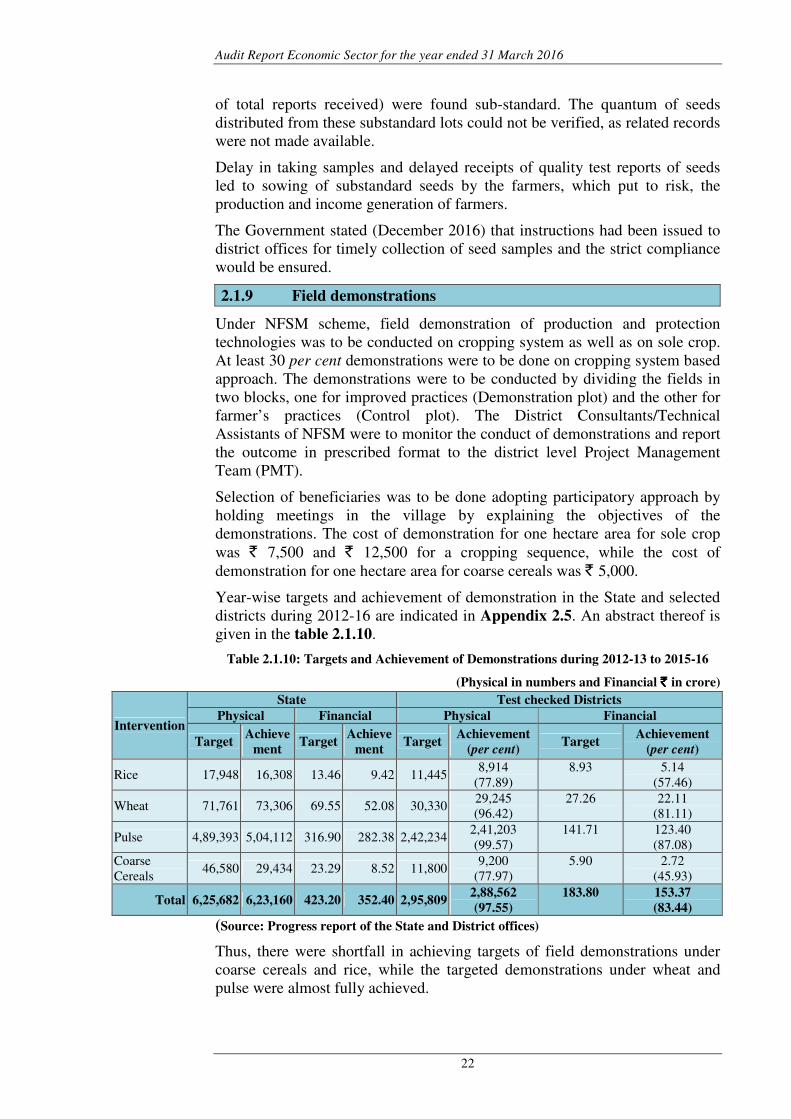
given in the table 2.1.10.
Table 2.1.10: Targets and Achievement of Demonstrations during 2012-13 to 2015-16
(Physical in numbers and Financial ` ` ` ` in crore)
Intervention
State Test checked Districts
Physical Financial Physical Financial
Target Achieve
ment Target
Achieve
ment Target
Achievement
(per cent) Target
Achievement
(per cent)
Rice 17,948 16,308 13.46 9.42 11,445 8,914
(77.89)
8.93 5.14
(57.46)
Wheat 71,761 73,306 69.55 52.08 30,330 29,245
(96.42)
27.26 22.11
(81.11)
Pulse 4,89,393 5,04,112 316.90 282.38 2,42,234 2,41,203
(99.57)
141.71 123.40
(87.08)
Coarse
Cereals 46,580 29,434 23.29 8.52 11,800
9,200
(77.97)
5.90 2.72
(45.93)
Total 6,25,682 6,23,160 423.20 352.40 2,95,809 2,88,562
(97.55)
183.80 153.37
(83.44)
(Source: Progress report of the State and District offices)
Thus, there were shortfall in achieving targets of field demonstrations under
coarse cereals and rice, while the targeted demonstrations under wheat and
pulse were almost fully achieved.
Chapter-II Performance Audit
23
The Government stated (December 2016) that targeted coarse cereals and rice
demonstrations could not be achieved due to shortage of quality seeds.
The reply is not acceptable, as the State Government was responsible for
ensuring availability of quality seeds for demonstration as well as for
distribution to beneficiary farmers.
2.1.9.1 Finalisation of Field Demonstration Technology
Operational guidelines provided that a package of inputs to be provided for the
demonstrations was to be identified in consultation with Regional Research
Stations of SAUs/KVKs16
located in the area. Audit scrutiny revealed that the
Directorate had prepared a package of inputs for demonstrations in
consultation with SAUs at the State Level and provided to the districts for
compliance. Due to adoption of this package by the districts, without its
ratification from the district level research stations of SAU/KVKs, the
technology adopted lacked location specific requirements.
The Government stated (December 2016) that instructions had been issued for
making changes in the package, after consultation with district level research
stations of KVKs.
2.1.9.2 Cropping system based field demonstrations
Cropping system based approach entails that field demonstrations are done in
cropping sequence on the same plot of land. NFSM guidelines provided for
conducting 30 per cent demonstrations on cropping system.
Test checked districts did not adhere to the required norms for conducting
demonstrations on cropping system. Out of total 2.89 lakh demonstrations
conducted by test checked districts during period 2012-16, only 6,555
demonstrations were conducted on cropping system which worked out to only
2.27 per cent, as detailed in the Appendix 2.6.
The Government stated (December 2016) that instructions had been issued
(November 2016) for conducting cropping system based demonstrations at
appropriate time.
The fact remains that the failure of District offices in adhering the guidelines
for conducting cropping system based demonstrations deprived awareness
generation among farmers about cropping pattern that could be adopted to
increase the farm level economy.
2.1.9.3 Records for demonstration results
The results of demonstrations should be compiled at Block, district and State
Level. At the State level, the results of the demonstrations should be compiled
in the form of document. A demonstration register was to be maintained at
Block level containing all information regarding selection of farmer, date of
soil testing, name of seed variety used, date of sowing, name and quantity of
materials used and results of crop cutting experiments. Each result should
bear signatures of the farmer, Rural Agricultural Extension Officer (RAEO),
Senior Agriculture Development officer (SADO). The guideline additionally
16
State Agricultural Universities/Krishi Vigyan Kendra
Demonstrated
technology
lacked location
specific
requirements due
to adoption of
generalised
package.
Audit Report Economic Sector for the year ended 31 March 2016
24
provides that the results should be prepared by the Districts and Technical
consultants of NFSM.
Records of demonstration were not provided for verification by eight
test-check districts (Bhind, Chhattarpur, Dindori, Hoshangabad, Indore,
Mandla, Seoni and Vidisha), though 1,73,636 demonstrations were reported to
be held in these districts during last four years incurring expenditure of
` 91.71 crore. In another seven test-checked districts17
, the results of
demonstration did not provide the comparative results of demonstration and
control plot and also did not have joint signatures of farmer, RAEO and
SADO. Role of Consultants in preparation of results in these districts were
also not ascertainable as the results did not have their signatures. District
Ujjain provided only summary of results of all demonstrations, instead of
farmer-wise demonstration results.
The Government in its reply stated (December 2016) that results of
demonstrations may not had been prepared due to shortage of staff in districts
offices and issued instructions (December 2016) for proper maintenance of
records.
The fact remains that the expenditure of ` 91.71 crore in eight test checked
districts for 1,73,636 demonstrations rendered unfruitful in the absence of
records for demonstration results. Further, the preparation of results of
demonstration without mentioning the comparative results of demonstration
plot and control plot resulted in defeating the very purpose of informing
farmers about the benefits of demonstrated technology.
2.1.9.4 Use of Display board
Display board containing information regarding number of farmers, village,
variety of seed used, type of demonstration, fertilizers applied, bio-fertilizers
applied, micronutrient applied, date of sowing/transplanting, Seed Rate and
Spacing, mobile number of District Consultant/Technical Assistant were to be
displayed at the demonstration plots.
Audit scrutiny revealed that expenditure was incurred for placing display
boards of demonstrations in the demonstration plots. However, joint physical
verification of display boards in two districts - Chhattarpur and Seoni revealed
that the display boards did not contain all information as required under the
guidelines. Further, DDA Khargone intimated that display boards were not
used in 2015-16.
17
Damoh, Dhar, Guna, Harda, Khargone, Panna and Sidhi
The objective of
bringing
awareness
among farmers
about improved
practices
remained
unachieved due
to improper
maintenance of
records,
incomplete
information on
display boards.
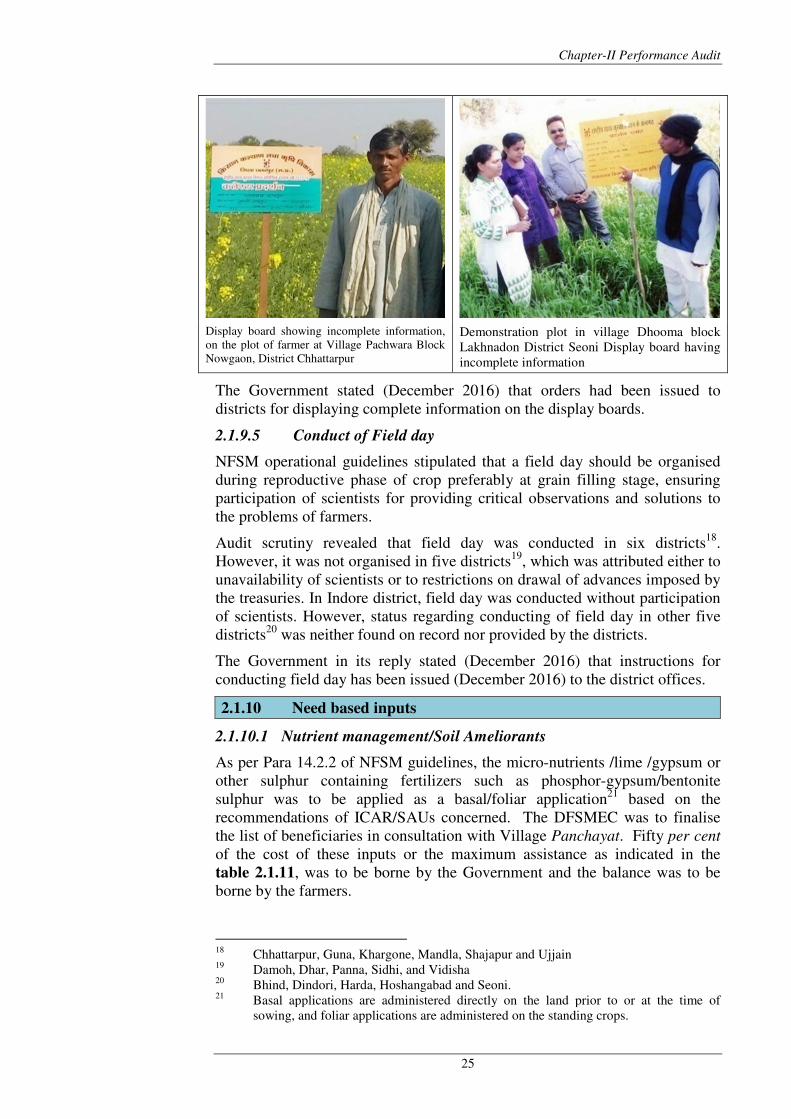
Chapter-II Performance Audit
25
Display board showing incomplete information,
on the plot of farmer at Village Pachwara Block
Nowgaon, District Chhattarpur
Demonstration plot in village Dhooma block
Lakhnadon District Seoni Display board having
incomplete information
The Government stated (December 2016) that orders had been issued to
districts for displaying complete information on the display boards.
2.1.9.5 Conduct of Field day
NFSM operational guidelines stipulated that a field day should be organised
during reproductive phase of crop preferably at grain filling stage, ensuring
participation of scientists for providing critical observations and solutions to
the problems of farmers.
Audit scrutiny revealed that field day was conducted in six districts18
.
However, it was not organised in five districts19
, which was attributed either to
unavailability of scientists or to restrictions on drawal of advances imposed by
the treasuries. In Indore district, field day was conducted without participation
of scientists. However, status regarding conducting of field day in other five
districts20
was neither found on record nor provided by the districts.
The Government in its reply stated (December 2016) that instructions for
conducting field day has been issued (December 2016) to the district offices.
2.1.10 Need based inputs
2.1.10.1 Nutrient management/Soil Ameliorants
As per Para 14.2.2 of NFSM guidelines, the micro-nutrients /lime /gypsum or
other sulphur containing fertilizers such as phosphor-gypsum/bentonite
sulphur was to be applied as a basal/foliar application21
based on the
recommendations of ICAR/SAUs concerned. The DFSMEC was to finalise
the list of beneficiaries in consultation with Village Panchayat. Fifty per cent
of the cost of these inputs or the maximum assistance as indicated in the
table 2.1.11, was to be borne by the Government and the balance was to be
borne by the farmers.
18
Chhattarpur, Guna, Khargone, Mandla, Shajapur and Ujjain 19
Damoh, Dhar, Panna, Sidhi, and Vidisha 20
Bhind, Dindori, Harda, Hoshangabad and Seoni. 21
Basal applications are administered directly on the land prior to or at the time of
sowing, and foliar applications are administered on the standing crops.
Audit Report Economic Sector for the year ended 31 March 2016
26
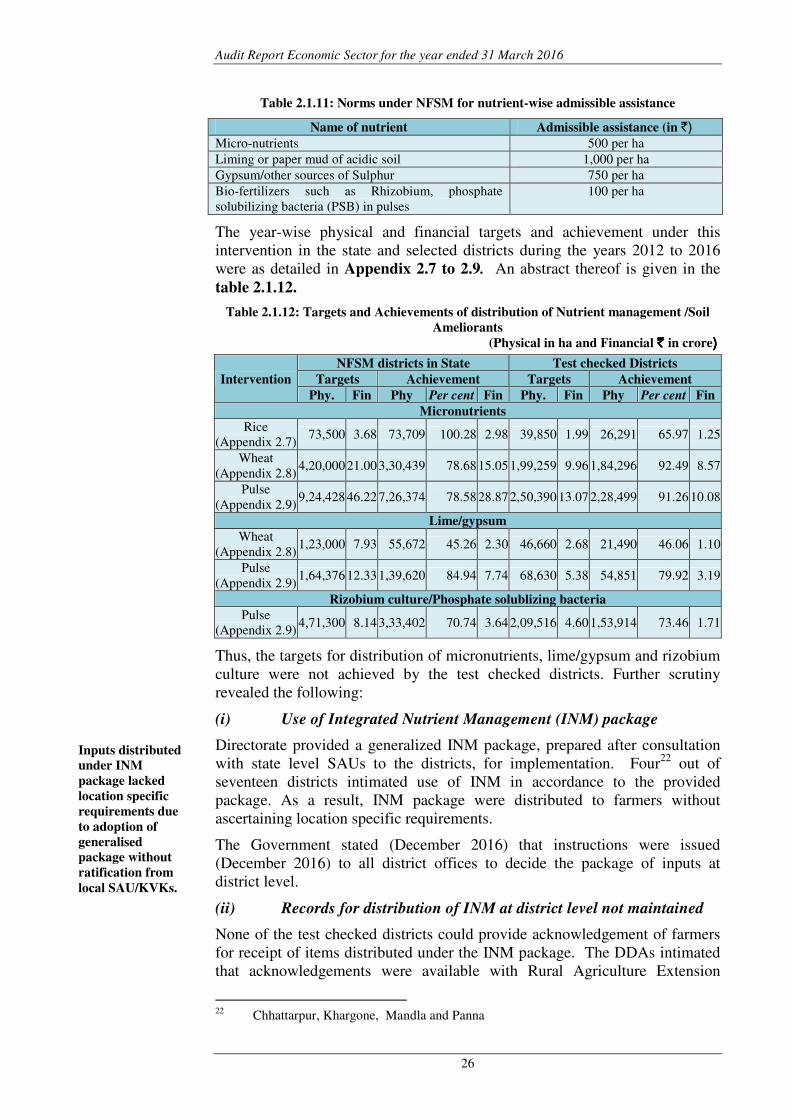
Table 2.1.11: Norms under NFSM for nutrient-wise admissible assistance
Name of nutrient Admissible assistance (in `)
Micro-nutrients 500 per ha
Liming or paper mud of acidic soil 1,000 per ha
Gypsum/other sources of Sulphur 750 per ha
Bio-fertilizers such as Rhizobium, phosphate
solubilizing bacteria (PSB) in pulses
100 per ha
The year-wise physical and financial targets and achievement under this
intervention in the state and selected districts during the years 2012 to 2016
were as detailed in Appendix 2.7 to 2.9. An abstract thereof is given in the
table 2.1.12.
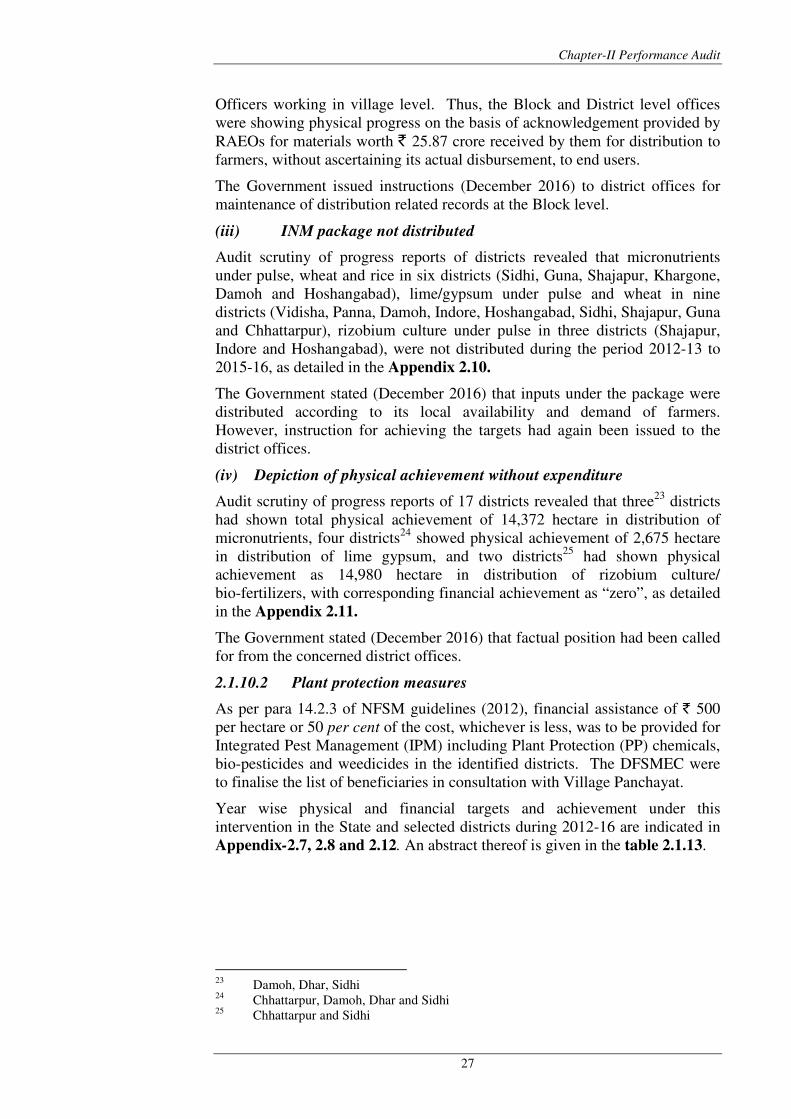
Table 2.1.12: Targets and Achievements of distribution of Nutrient management /Soil
Ameliorants
(Physical in ha and Financial `̀̀̀ in crore))))
Intervention
NFSM districts in State Test checked Districts
Targets Achievement Targets Achievement
Phy. Fin Phy Per cent Fin Phy. Fin Phy Per cent Fin
Micronutrients
Rice
(Appendix 2.7) 73,500 3.68 73,709 100.28 2.98 39,850 1.99 26,291 65.97 1.25
Wheat
(Appendix 2.8) 4,20,000 21.00 3,30,439 78.68 15.05 1,99,259 9.96 1,84,296 92.49 8.57
Pulse
(Appendix 2.9) 9,24,428 46.22 7,26,374 78.58 28.87 2,50,390 13.07 2,28,499 91.26 10.08
Lime/gypsum
Wheat
(Appendix 2.8) 1,23,000 7.93 55,672 45.26 2.30 46,660 2.68 21,490 46.06 1.10
Pulse
(Appendix 2.9) 1,64,376 12.33 1,39,620 84.94 7.74 68,630 5.38 54,851 79.92 3.19
Rizobium culture/Phosphate solublizing bacteria
Pulse
(Appendix 2.9) 4,71,300 8.14 3,33,402 70.74 3.64 2,09,516 4.60 1,53,914 73.46 1.71
Thus, the targets for distribution of micronutrients, lime/gypsum and rizobium
culture were not achieved by the test checked districts. Further scrutiny
revealed the following:
(i) Use of Integrated Nutrient Management (INM) package
Directorate provided a generalized INM package, prepared after consultation
with state level SAUs to the districts, for implementation. Four22
out of
seventeen districts intimated use of INM in accordance to the provided
package. As a result, INM package were distributed to farmers without
ascertaining location specific requirements.
The Government stated (December 2016) that instructions were issued
(December 2016) to all district offices to decide the package of inputs at
district level.
(ii) Records for distribution of INM at district level not maintained
None of the test checked districts could provide acknowledgement of farmers
for receipt of items distributed under the INM package. The DDAs intimated
that acknowledgements were available with Rural Agriculture Extension
22
Chhattarpur, Khargone, Mandla and Panna
Inputs distributed
under INM
package lacked
location specific
requirements due
to adoption of
generalised
package without
ratification from
local SAU/KVKs.
Chapter-II Performance Audit
27
Officers working in village level. Thus, the Block and District level offices
were showing physical progress on the basis of acknowledgement provided by
RAEOs for materials worth ` 25.87 crore received by them for distribution to
farmers, without ascertaining its actual disbursement, to end users.
The Government issued instructions (December 2016) to district offices for
maintenance of distribution related records at the Block level.
(iii) INM package not distributed
Audit scrutiny of progress reports of districts revealed that micronutrients
under pulse, wheat and rice in six districts (Sidhi, Guna, Shajapur, Khargone,
Damoh and Hoshangabad), lime/gypsum under pulse and wheat in nine
districts (Vidisha, Panna, Damoh, Indore, Hoshangabad, Sidhi, Shajapur, Guna
and Chhattarpur), rizobium culture under pulse in three districts (Shajapur,
Indore and Hoshangabad), were not distributed during the period 2012-13 to
2015-16, as detailed in the Appendix 2.10.
The Government stated (December 2016) that inputs under the package were
distributed according to its local availability and demand of farmers.
However, instruction for achieving the targets had again been issued to the
district offices.
(iv) Depiction of physical achievement without expenditure
Audit scrutiny of progress reports of 17 districts revealed that three23
districts
had shown total physical achievement of 14,372 hectare in distribution of
micronutrients, four districts24
showed physical achievement of 2,675 hectare
in distribution of lime gypsum, and two districts25
had shown physical
achievement as 14,980 hectare in distribution of rizobium culture/
bio-fertilizers, with corresponding financial achievement as “zero”, as detailed
in the Appendix 2.11.
The Government stated (December 2016) that factual position had been called
for from the concerned district offices.
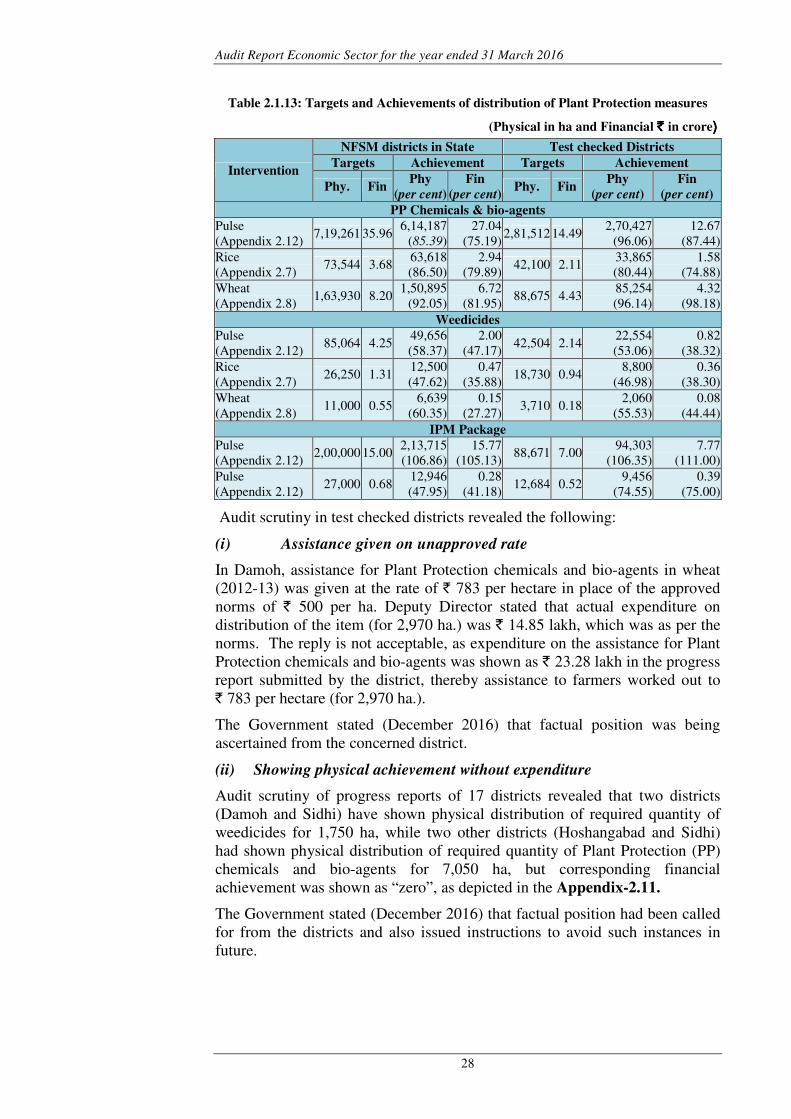
2.1.10.2 Plant protection measures
As per para 14.2.3 of NFSM guidelines (2012), financial assistance of ` 500
per hectare or 50 per cent of the cost, whichever is less, was to be provided for
Integrated Pest Management (IPM) including Plant Protection (PP) chemicals,
bio-pesticides and weedicides in the identified districts. The DFSMEC were
to finalise the list of beneficiaries in consultation with Village Panchayat.
Year wise physical and financial targets and achievement under this
intervention in the State and selected districts during 2012-16 are indicated in
Appendix-2.7, 2.8 and 2.12. An abstract thereof is given in the table 2.1.13.
23
Damoh, Dhar, Sidhi 24
Chhattarpur, Damoh, Dhar and Sidhi 25
Chhattarpur and Sidhi
Audit Report Economic Sector for the year ended 31 March 2016
28
Table 2.1.13: Targets and Achievements of distribution of Plant Protection measures
(Physical in ha and Financial `̀̀̀ in crore))))
Intervention
NFSM districts in State Test checked Districts
Targets Achievement Targets Achievement
Phy. Fin Phy
(per cent)
Fin
(per cent) Phy. Fin
Phy
(per cent)
Fin
(per cent)
PP Chemicals & bio-agents
Pulse
(Appendix 2.12) 7,19,261 35.96
6,14,187
(85.39)
27.04
(75.19) 2,81,512 14.49
2,70,427
(96.06)
12.67
(87.44)
Rice
(Appendix 2.7) 73,544 3.68
63,618
(86.50)
2.94
(79.89) 42,100 2.11
33,865
(80.44)
1.58
(74.88)
Wheat
(Appendix 2.8) 1,63,930 8.20
1,50,895
(92.05)
6.72
(81.95) 88,675 4.43
85,254
(96.14)
4.32
(98.18)
Weedicides
Pulse
(Appendix 2.12) 85,064 4.25
49,656
(58.37)
2.00
(47.17) 42,504 2.14
22,554
(53.06)
0.82
(38.32)
Rice
(Appendix 2.7) 26,250 1.31
12,500
(47.62)
0.47
(35.88) 18,730 0.94
8,800
(46.98)
0.36
(38.30)
Wheat
(Appendix 2.8) 11,000 0.55
6,639
(60.35)
0.15
(27.27) 3,710 0.18
2,060
(55.53)
0.08
(44.44)
IPM Package
Pulse
(Appendix 2.12) 2,00,000 15.00
2,13,715
(106.86)
15.77
(105.13) 88,671 7.00
94,303
(106.35)
7.77
(111.00)
Pulse
(Appendix 2.12) 27,000 0.68
12,946
(47.95)
0.28
(41.18) 12,684 0.52
9,456
(74.55)
0.39
(75.00)
Audit scrutiny in test checked districts revealed the following:
(i) Assistance given on unapproved rate
In Damoh, assistance for Plant Protection chemicals and bio-agents in wheat
(2012-13) was given at the rate of ` 783 per hectare in place of the approved
norms of ` 500 per ha. Deputy Director stated that actual expenditure on
distribution of the item (for 2,970 ha.) was ` 14.85 lakh, which was as per the
norms. The reply is not acceptable, as expenditure on the assistance for Plant
Protection chemicals and bio-agents was shown as ` 23.28 lakh in the progress
report submitted by the district, thereby assistance to farmers worked out to
` 783 per hectare (for 2,970 ha.).
The Government stated (December 2016) that factual position was being
ascertained from the concerned district.
(ii) Showing physical achievement without expenditure
Audit scrutiny of progress reports of 17 districts revealed that two districts
(Damoh and Sidhi) have shown physical distribution of required quantity of
weedicides for 1,750 ha, while two other districts (Hoshangabad and Sidhi)
had shown physical distribution of required quantity of Plant Protection (PP)
chemicals and bio-agents for 7,050 ha, but corresponding financial
achievement was shown as “zero”, as depicted in the Appendix-2.11.
The Government stated (December 2016) that factual position had been called
for from the districts and also issued instructions to avoid such instances in
future.
Chapter-II Performance Audit
29
(iii) IPM package not distributed
Audit scrutiny of progress reports of districts revealed that IPM package
including inputs for plant protection were not distributed in five districts
(Sidhi, Guna, Shajapur, Panna and Indore) during 2012-13 to 2015-16, as
detailed in the Appendix-2.10.
The Government stated (December 2016) that inputs were distributed
according to their local availability and demand from farmers. All district
offices had been instructed to achieve the targeted distribution.
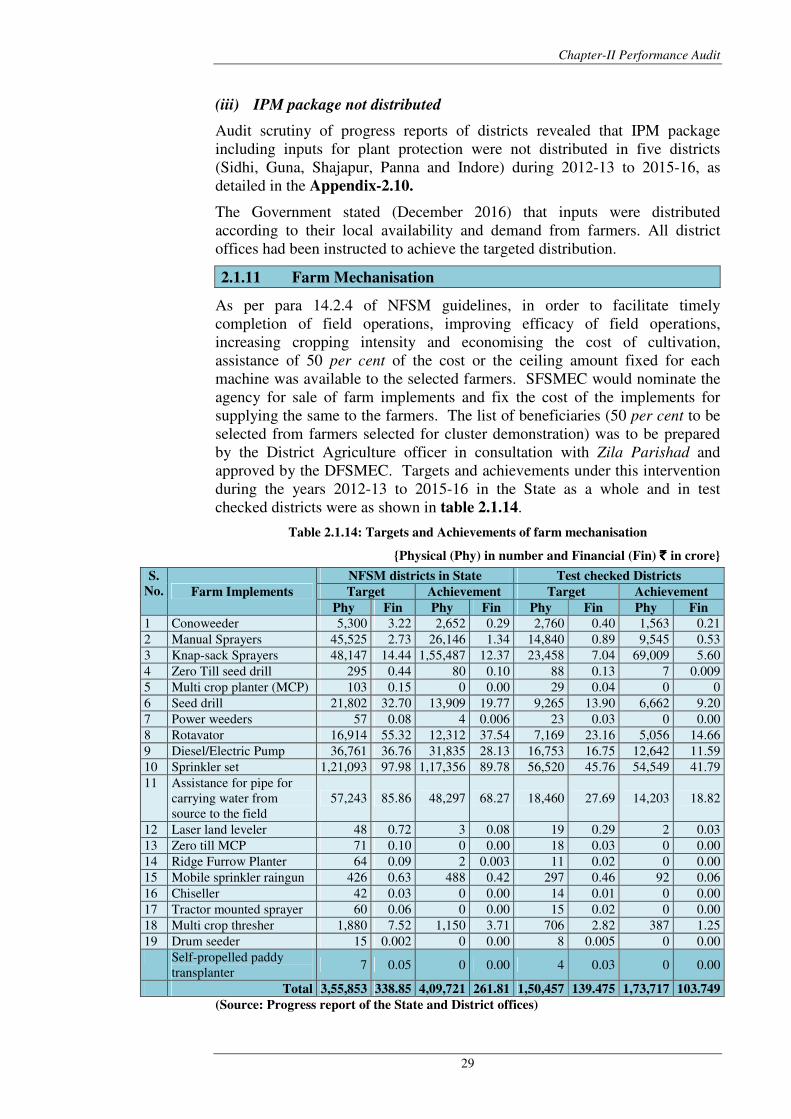
2.1.11 Farm Mechanisation
As per para 14.2.4 of NFSM guidelines, in order to facilitate timely
completion of field operations, improving efficacy of field operations,
increasing cropping intensity and economising the cost of cultivation,
assistance of 50 per cent of the cost or the ceiling amount fixed for each
machine was available to the selected farmers. SFSMEC would nominate the
agency for sale of farm implements and fix the cost of the implements for
supplying the same to the farmers. The list of beneficiaries (50 per cent to be
selected from farmers selected for cluster demonstration) was to be prepared
by the District Agriculture officer in consultation with Zila Parishad and
approved by the DFSMEC. Targets and achievements under this intervention
during the years 2012-13 to 2015-16 in the State as a whole and in test
checked districts were as shown in table 2.1.14.
Table 2.1.14: Targets and Achievements of farm mechanisation
{Physical (Phy) in number and Financial (Fin) ` ` ` ` in crore}
S.
No. Farm Implements
NFSM districts in State Test checked Districts
Target Achievement Target Achievement
Phy Fin Phy Fin Phy Fin Phy Fin
1 Conoweeder 5,300 3.22 2,652 0.29 2,760 0.40 1,563 0.21
2 Manual Sprayers 45,525 2.73 26,146 1.34 14,840 0.89 9,545 0.53
3 Knap-sack Sprayers 48,147 14.44 1,55,487 12.37 23,458 7.04 69,009 5.60
4 Zero Till seed drill 295 0.44 80 0.10 88 0.13 7 0.009
5 Multi crop planter (MCP) 103 0.15 0 0.00 29 0.04 0 0
6 Seed drill 21,802 32.70 13,909 19.77 9,265 13.90 6,662 9.20
7 Power weeders 57 0.08 4 0.006 23 0.03 0 0.00
8 Rotavator 16,914 55.32 12,312 37.54 7,169 23.16 5,056 14.66
9 Diesel/Electric Pump 36,761 36.76 31,835 28.13 16,753 16.75 12,642 11.59
10 Sprinkler set 1,21,093 97.98 1,17,356 89.78 56,520 45.76 54,549 41.79
11 Assistance for pipe for
carrying water from
source to the field
57,243 85.86 48,297 68.27 18,460 27.69 14,203 18.82
12 Laser land leveler 48 0.72 3 0.08 19 0.29 2 0.03
13 Zero till MCP 71 0.10 0 0.00 18 0.03 0 0.00
14 Ridge Furrow Planter 64 0.09 2 0.003 11 0.02 0 0.00
15 Mobile sprinkler raingun 426 0.63 488 0.42 297 0.46 92 0.06
16 Chiseller 42 0.03 0 0.00 14 0.01 0 0.00
17 Tractor mounted sprayer 60 0.06 0 0.00 15 0.02 0 0.00
18 Multi crop thresher 1,880 7.52 1,150 3.71 706 2.82 387 1.25
19 Drum seeder 15 0.002 0 0.00 8 0.005 0 0.00
Self-propelled paddy
transplanter 7 0.05 0 0.00 4 0.03 0 0.00
Total 3,55,853 338.85 4,09,721 261.81 1,50,457 139.475 1,73,717 103.749
(Source: Progress report of the State and District offices)
Audit Report Economic Sector for the year ended 31 March 2016
30
As evident from table 2.1.14, during 2012-16 out of 1.50 lakh farm
implements to be distributed, the Government did not distribute Multi crop
planter, Zero till multi crop planter, Chiseller, Tractor mounted sprayer, Drum
seeder and Self-propelled paddy transplanter. During the course of
performance audit, feedback from 330 beneficiaries under this intervention
was obtained. Of which, 291 beneficiaries intimated satisfaction out of the
equipment received by them and reported higher yield by using these
equipment.
2.1.11.1 Irregular expenditure due to not fixing supplying agencies and
rates for farm implements
The Department did not nominate the agencies and also did not fix the price of
different farm implements to be supplied to farmers, though it was required as
per NFSM operational guidelines. Thus, the assistance to farmers on purchase
of 4.10 lakh farm implements from unapproved agencies and on unapproved
rates resulted in irregular expenditure of ` 261.81 crore during the years
2012-16. Further, the Department had no control over the rates of farm
implements fixed by the supplying agencies, as a result affordability of these
implements by farmers was not ensured.
In the exit conference (November 2016), the Principal Secretary stated that
they had no role in fixation of rates or agencies as the implements were
distributed by MP Agro or Marketing Federation (MARKFED), who had their
own system for selection of supplier and rates of implements.
The reply is not acceptable, as guidelines provided that State Food Security
Mission Executive Committee (SFSMEC) would nominate the agency for sale
of farm implements and fix the cost of the implements for supplying the same
to the farmers. Further, there was no relaxation under NFSM for procurement
through MP Agro or MARKFED. Thus, assistance to farmers for purchase on
unapproved rates and from unapproved agencies was in violation of NFSM
operation guidelines.
2.1.11.2 Prescribed norms for selection of the farmers not ensured
The district offices did not have a system to ensure that the prescribed norms
were followed for selecting 50 per cent farmers from those who were also
selected under the intervention Demonstration.
The Government accepted (December 2016) the audit observation and issued
instructions to the district offices to follow the provisions of guidelines.
2.1.11.3 Irregular excess assistance on distribution of implements
The Directorate had provided assistance for sprinkler sets at the rate of ` 7,500
per hectare or 50 per cent of the cost whichever is less up to 2013-14. From
2014-15 ceiling rate was revised to ` 10,000 per ha. In two (Shajapur and
Ujjain) out of 17 test checked districts audit scrutiny revealed that 470 farmers
having less than one ha land were provided assistance at the maximum rate, in
place of giving it on pro-rata basis resulting in grant of irregular excess
assistance ` 12.89 lakh as detailed in the Appendix 2.13.
Similarly, the prescribed norms of assistance for “pipe for carrying water from
source to field” as per NFSM guidelines 2012 was 50 per cent of the cost, or
` 25 per metre for maximum 600 metre, whichever is less with a financial
The pattern of
assistance were
not followed in
providing
sprinkler sets
(`̀̀̀ 12.89 lakh) and
pipe for carrying
water from source
to field (`̀̀̀ 4.98
crore), resulted in
providing excess
assistance of
`̀̀̀ 5.11 crore.
SFSMEC did not
fix the agencies
and rate of farm
implements to be
provided to
farmers rendering
expenditure of
` ` ` ` 261.81 crore
irregular.
Chapter-II Performance Audit
31
ceiling of ` 15,000. In 14 out of 17 test checked districts, audit scrutiny
revealed that the criteria of ` 25 per metre was not followed, due to which
7,867 farmers who purchased pipes less than 600 metre were provided
assistance at the maximum rate of ` 15,000, which resulted in grant of
irregular excess assistance of ` 4.98 crore as detailed in the Appendix 2.14.
The Government stated (December 2016) that explanation has been called for
from the concerned district offices.
Thus, the farm implements required for improving efficiency as well as
economy in cultivation were not made available at affordable price, due to
violation of provisions of clause 14.2.4 of guidelines. Implements for which
there was no demand from farmers were also included in the plan resulting in
zero/minimum progress in its distribution. Subsidy norms were not adhered to
in respect of distribution of sprinkler sets and pipeline.
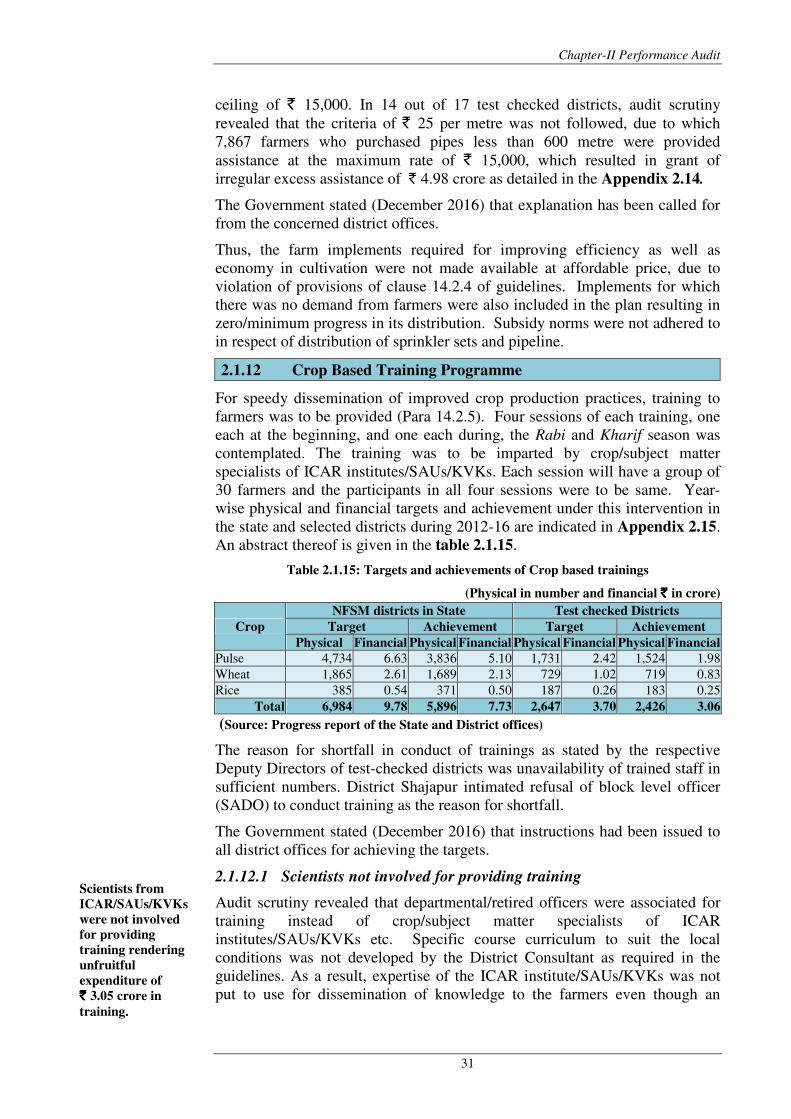
2.1.12 Crop Based Training Programme
For speedy dissemination of improved crop production practices, training to
farmers was to be provided (Para 14.2.5). Four sessions of each training, one
each at the beginning, and one each during, the Rabi and Kharif season was
contemplated. The training was to be imparted by crop/subject matter
specialists of ICAR institutes/SAUs/KVKs. Each session will have a group of
30 farmers and the participants in all four sessions were to be same. Year-
wise physical and financial targets and achievement under this intervention in
the state and selected districts during 2012-16 are indicated in Appendix 2.15.
An abstract thereof is given in the table 2.1.15.
Table 2.1.15: Targets and achievements of Crop based trainings
(Physical in number and financial ` ` ` ` in crore)
Crop
NFSM districts in State Test checked Districts
Target Achievement Target Achievement
Physical Financial Physical Financial Physical Financial Physical Financial
Pulse 4,734 6.63 3,836 5.10 1,731 2.42 1,524 1.98
Wheat 1,865 2.61 1,689 2.13 729 1.02 719 0.83
Rice 385 0.54 371 0.50 187 0.26 183 0.25
Total 6,984 9.78 5,896 7.73 2,647 3.70 2,426 3.06
(Source: Progress report of the State and District offices)
The reason for shortfall in conduct of trainings as stated by the respective
Deputy Directors of test-checked districts was unavailability of trained staff in
sufficient numbers. District Shajapur intimated refusal of block level officer
(SADO) to conduct training as the reason for shortfall.
The Government stated (December 2016) that instructions had been issued to
all district offices for achieving the targets.
2.1.12.1 Scientists not involved for providing training
Audit scrutiny revealed that departmental/retired officers were associated for
training instead of crop/subject matter specialists of ICAR
institutes/SAUs/KVKs etc. Specific course curriculum to suit the local
conditions was not developed by the District Consultant as required in the
guidelines. As a result, expertise of the ICAR institute/SAUs/KVKs was not
put to use for dissemination of knowledge to the farmers even though an
Scientists from
ICAR/SAUs/KVKs
were not involved
for providing
training rendering
unfruitful
expenditure of
` ` ` ` 3.05 crore in
training.
Audit Report Economic Sector for the year ended 31 March 2016
32
amount of ` 3.05 crore was spent during the years 2012-16 on training of
farmers in the test checked districts.
The Government stated (December 2016) that trainings were provided by
departmental/retired officers due to unavailability of scientists at district level.
The reply is not acceptable, as conduct of training programme without specific
course curriculum to suit local conditions and without involving scientists
affected the standard of training imparted to the farmers.
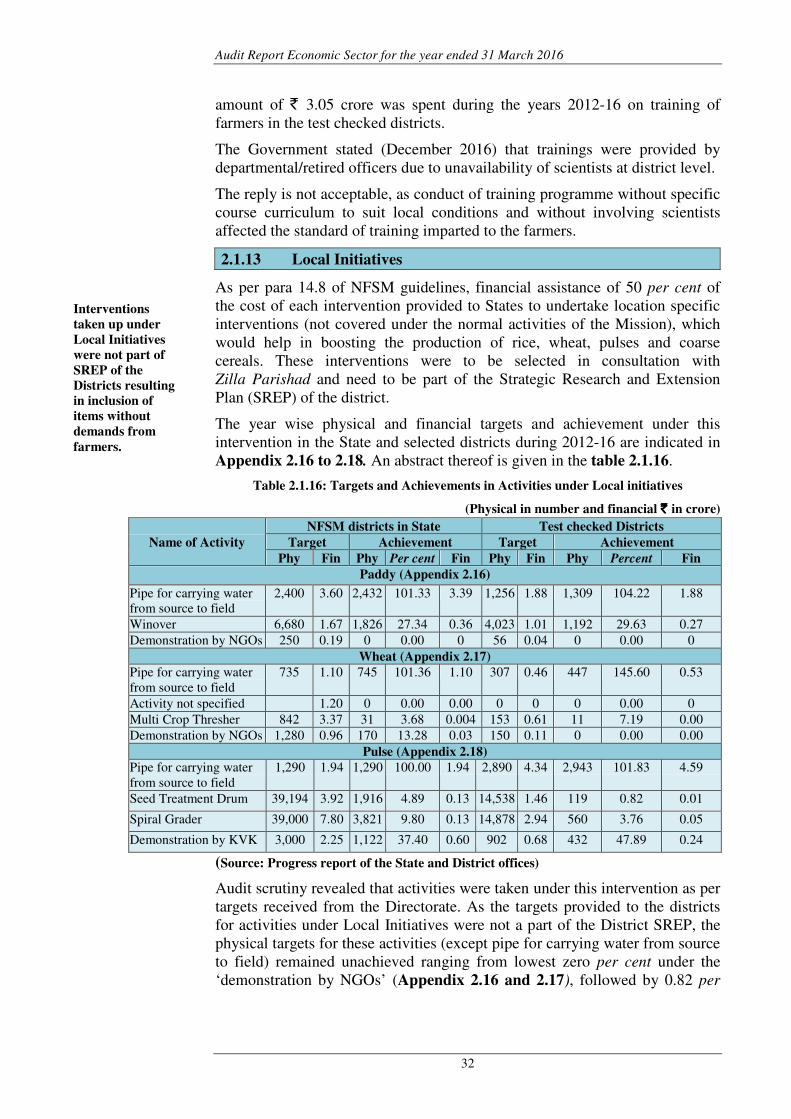
2.1.13 Local Initiatives
As per para 14.8 of NFSM guidelines, financial assistance of 50 per cent of
the cost of each intervention provided to States to undertake location specific
interventions (not covered under the normal activities of the Mission), which
would help in boosting the production of rice, wheat, pulses and coarse
cereals. These interventions were to be selected in consultation with
Zilla Parishad and need to be part of the Strategic Research and Extension
Plan (SREP) of the district.
The year wise physical and financial targets and achievement under this
intervention in the State and selected districts during 2012-16 are indicated in
Appendix 2.16 to 2.18. An abstract thereof is given in the table 2.1.16.
Table 2.1.16: Targets and Achievements in Activities under Local initiatives
(Physical in number and financial `̀̀̀ in crore)
Name of Activity
NFSM districts in State Test checked Districts
Target Achievement Target Achievement
Phy Fin Phy Per cent Fin Phy Fin Phy Percent Fin
Paddy (Appendix 2.16)
Pipe for carrying water
from source to field
2,400 3.60 2,432 101.33 3.39 1,256 1.88 1,309 104.22 1.88
Winover 6,680 1.67 1,826 27.34 0.36 4,023 1.01 1,192 29.63 0.27
Demonstration by NGOs 250 0.19 0 0.00 0 56 0.04 0 0.00 0
Wheat (Appendix 2.17)
Pipe for carrying water
from source to field
735 1.10 745 101.36 1.10 307 0.46 447 145.60 0.53
Activity not specified 1.20 0 0.00 0.00 0 0 0 0.00 0
Multi Crop Thresher 842 3.37 31 3.68 0.004 153 0.61 11 7.19 0.00
Demonstration by NGOs 1,280 0.96 170 13.28 0.03 150 0.11 0 0.00 0.00
Pulse (Appendix 2.18)
Pipe for carrying water
from source to field
1,290 1.94 1,290 100.00 1.94 2,890 4.34 2,943 101.83 4.59
Seed Treatment Drum 39,194 3.92 1,916 4.89 0.13 14,538 1.46 119 0.82 0.01
Spiral Grader 39,000 7.80 3,821 9.80 0.13 14,878 2.94 560 3.76 0.05
Demonstration by KVK 3,000 2.25 1,122 37.40 0.60 902 0.68 432 47.89 0.24
(Source: Progress report of the State and District offices)
Audit scrutiny revealed that activities were taken under this intervention as per
targets received from the Directorate. As the targets provided to the districts
for activities under Local Initiatives were not a part of the District SREP, the
physical targets for these activities (except pipe for carrying water from source
to field) remained unachieved ranging from lowest zero per cent under the
‘demonstration by NGOs’ (Appendix 2.16 and 2.17), followed by 0.82 per
Interventions
taken up under
Local Initiatives
were not part of
SREP of the
Districts resulting
in inclusion of
items without
demands from
farmers.
Chapter-II Performance Audit
33
cent under ‘seed treatment drum’ and 3.76 per cent under ‘spiral grader’
(Appendix 2.18) during 2015-16.
Further scrutiny revealed that “pipe for carrying water from source to field”,
which was available under the normal NFSM activity of “Efficient water
application tools”, was also carried out under local initiatives. This was
contrary to NFSM guidelines for taking up only those activities under local
initiative, which were not undertaken under normal activities
The Government accepted (December 2016) the audit observation and assured
to prepare annual action plan in future on the basis of provisions given in the
guidelines.
2.1.14 Award for the best performing districts
As per 14.7 of NFSM guidelines (2012), cash award of ` five lakh in every
two years to be given to the best performing districts for each of the four
NFSM components – Rice, Wheat, Pulses and Coarse Cereals. The SFSMEC
on the basis of criteria for assessing the performance was required to select the
districts for giving the award. However, Department did not submit proposals
for award for the best performing district to GoI so far.
The Government stated (December 2016) that action was in progress. Thus,
the State failed to provide encouragement to districts for better performance
under NFSM during the years during the years 2012-16.
2.1.15 Fund Management
Mechanism of fund flow as prescribed in paragraph 7 of NFSM guidelines
(12th
Five Year Plan) stipulated that funds for implementing the Mission’s
programme would be released to State Governments, which in-turn would
release the funds to the State Level Agency. The State Level Agency would
make fund available to the District Level Agency in accordance with the
approved programme of the districts. Funds were to be released in instalments
based on the progress report and submission of utilisation certificates (UCs).
Audit scrutiny revealed that GoI released grants-in-aid during the years
2012-13 and 2013-14 under the NFSM directly to State Institute of Agriculture
Extension and Training (SIAET), the State Nodal Agency for implementation
of NFSM in Madhya Pradesh. Upon receiving the demand from the
Directorate, SIAET disbursed NFSM fund to Deputy Directors, Agriculture at
district level through electronic transfer in their respective bank accounts.
However, from 2014-15 onwards, grants-in-aid under NFSM were released
directly to State Government, which were disbursed by the Directorate to the
district offices through State Budget/State Treasury System.
The status of year-wise availability and utilisation of funds under NFSM
during the years 2012-13 to 2015-16 is depicted in the table 2.1.17.
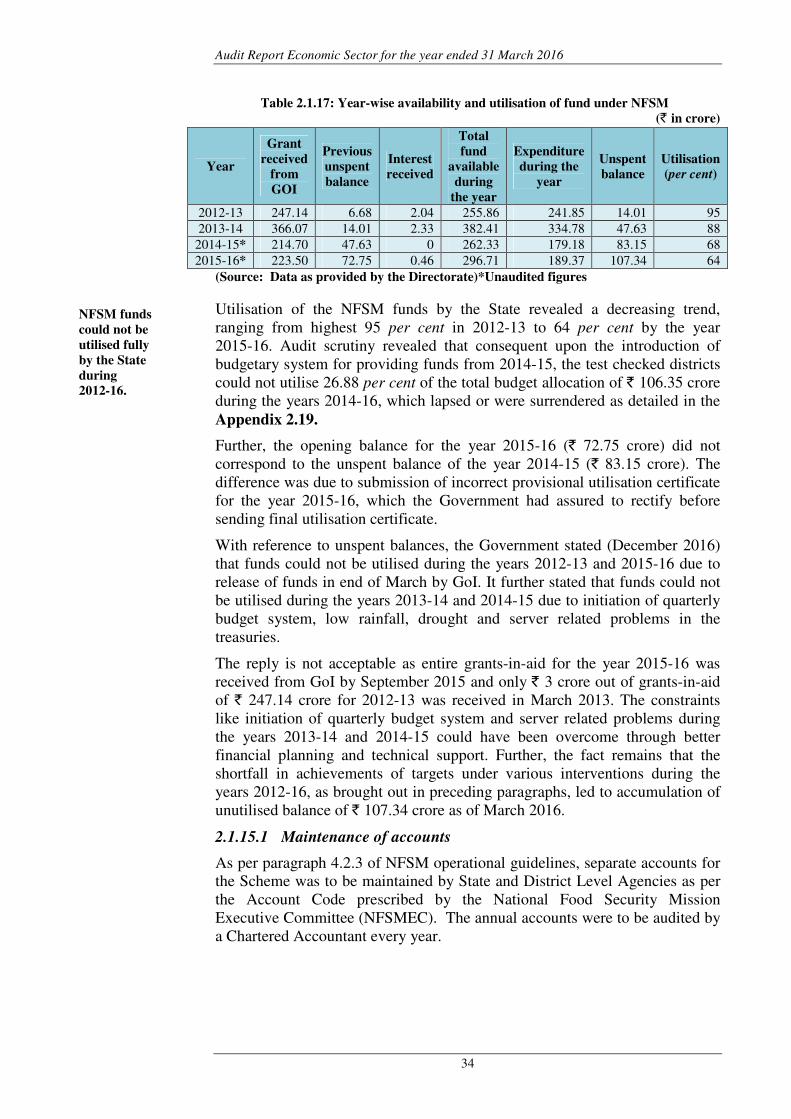
Audit Report Economic Sector for the year ended 31 March 2016
34
Table 2.1.17: Year-wise availability and utilisation of fund under NFSM
(` in crore)
Year
Grant
received
from
GOI
Previous
unspent
balance
Interest
received
Total
fund
available
during
the year
Expenditure
during the
year
Unspent
balance
Utilisation
(per cent)
2012-13 247.14 6.68 2.04 255.86 241.85 14.01 95
2013-14 366.07 14.01 2.33 382.41 334.78 47.63 88
2014-15* 214.70 47.63 0 262.33 179.18 83.15 68
2015-16* 223.50 72.75 0.46 296.71 189.37 107.34 64
(Source: Data as provided by the Directorate)*Unaudited figures
Utilisation of the NFSM funds by the State revealed a decreasing trend,
ranging from highest 95 per cent in 2012-13 to 64 per cent by the year
2015-16. Audit scrutiny revealed that consequent upon the introduction of
budgetary system for providing funds from 2014-15, the test checked districts
could not utilise 26.88 per cent of the total budget allocation of ` 106.35 crore
during the years 2014-16, which lapsed or were surrendered as detailed in the
Appendix 2.19.
Further, the opening balance for the year 2015-16 (` 72.75 crore) did not
correspond to the unspent balance of the year 2014-15 (` 83.15 crore). The
difference was due to submission of incorrect provisional utilisation certificate
for the year 2015-16, which the Government had assured to rectify before
sending final utilisation certificate.
With reference to unspent balances, the Government stated (December 2016)
that funds could not be utilised during the years 2012-13 and 2015-16 due to
release of funds in end of March by GoI. It further stated that funds could not
be utilised during the years 2013-14 and 2014-15 due to initiation of quarterly
budget system, low rainfall, drought and server related problems in the
treasuries.
The reply is not acceptable as entire grants-in-aid for the year 2015-16 was
received from GoI by September 2015 and only ` 3 crore out of grants-in-aid
of ` 247.14 crore for 2012-13 was received in March 2013. The constraints
like initiation of quarterly budget system and server related problems during
the years 2013-14 and 2014-15 could have been overcome through better
financial planning and technical support. Further, the fact remains that the
shortfall in achievements of targets under various interventions during the
years 2012-16, as brought out in preceding paragraphs, led to accumulation of
unutilised balance of ` 107.34 crore as of March 2016.
2.1.15.1 Maintenance of accounts
As per paragraph 4.2.3 of NFSM operational guidelines, separate accounts for
the Scheme was to be maintained by State and District Level Agencies as per
the Account Code prescribed by the National Food Security Mission
Executive Committee (NFSMEC). The annual accounts were to be audited by
a Chartered Accountant every year.
NFSM funds
could not be
utilised fully
by the State
during
2012-16.
Chapter-II Performance Audit
35
Audit scrutiny revealed that account code prescribed by NFSMEC was not
available in the test-checked district offices. Further, audit of Annual Accounts
of the NFSM for the years 2014-15 and 2015-16 has not been taken up so far
(December 2016). In the absence of certification of accounts, reasonable
assurance about regularity of receipts and proper utilisation of funds could not
be ascertained. Further, State Government could not submit the final
Utilisation Certificates to GoI for the years 2014-15 and 2015-16 due to delay
in finalisation of audited annual accounts of NFSM.
The Government intimated (December 2016) that separate account code had
not been received from GoI. However, Government did not intimate the
reasons for delay in finalisation of annual account of NFSM for the years
2014-15 and 2015-16.
2.1.15.2 Operation of NFSM Bank account
In order to ensure proper utilisation and monitoring of funds provided to the
districts under NFSM, Directorate Farmers Welfare and Agriculture
Development (FWAD), Government of Madhya Pradesh had issued
instructions (September 2011) to all district offices to open a separate bank
account for NFSM. The system of transferring fund to the bank accounts of
district offices was discontinued from 2014-15 and funds were provided
through the treasury system on quarterly basis. With the change in the
mechanism for scheme financing, NFSM bank accounts were not to be
operated for the scheme and therefore, no longer required to be continued.
Audit scrutiny of records, however, revealed that the Directorate did not issue
any order for closure of the NFSM bank account.
Further scrutiny revealed that out of 17 test checked Deputy Directors
Agriculture (DDAs), 12 DDAs26
did not close the NFSM Bank account and
had a balance of ` 8.68 crore (Appendix 2.20). These accounts were also
being used by DDAs to park unutilised funds of other schemes27
, which was
irregular. Thus, the unutilised amount in NFSM bank accounts were continued
to be held by district offices, in the absence of any order for its refund to the
Directorate.
The continuance of NFSM bank account without any purpose had also
exposed these bank accounts to the risk of misuse. Audit scrutiny of records
revealed that Deputy Director Agriculture, Vidisha had withdrawn an amount
of ` 1.66 lakh and used it for activities (office expenses etc.) other than NFSM
activities. These withdrawals included cash withdrawals of ` 0.79 lakh (of
which ` 0.50 lakh was paid in cash to a travel agency) and vouchers for
utilisation of balance amount of ` 0.29 lakh was not found on record. DDA
intimated (February 2016) that funds were withdrawn from NFSM bank
accounts to meet urgent office expenses for which they did not have budget
provision.
Audit scrutiny revealed that none of the district offices were conducting
reconciliation of bank accounts with the transactions from cash book on
26
Bhind, Chhattarpur, Dhar, Dindori, Guna, Hoshangabad, Mandla, Panna, Seoni,
Shajapur, Sidhi and Vidisha. 27
Rashtriya Krishi Vikas Yojna, Beej gram, Krishi Vigyan Kendra, sukharahat, soil
health.
Directorate did not
issue instructions
for closure of NFSM
Bank accounts of
district offices,
though these
accounts were not to
be operated for the
scheme since
2014-15. Unutilised
balance of `̀̀̀ 8.68
crore was available
in the accounts of
12 test-checked
district offices.
Audit Report Economic Sector for the year ended 31 March 2016
36
monthly basis, which was contrary to the instructions28
(July 2014) of the
Finance Department, Government of Madhya Pradesh issued to all
departmental officers maintaining bank accounts under various government
schemes. Further, there was a difference of ` 6.38 crore between the figures of
available balances as per cash book and that shown in the pass book in 12 out
of 17 test checked districts, as detailed in Appendix 2.20. However, the
reasons for the difference could not be ascertained in the absence of bank
reconciliation statements.
The Government stated (December 2016) that the remaining bank accounts
would be closed immediately after utilising the off-budget funds. The
Government further stated that instructions had been issued to the district
offices for conducting bank reconciliations.
The reply is not acceptable, as an unutilised off-budget fund was required to
be channelised through State Budget/State Treasury System due to change in
the mechanism for scheme financing since the year 2014-15.
2.1.15.3 Diversion of funds due to release of NFSM funds to districts not
identified for NFSM-Wheat
Audit scrutiny revealed that eight districts, where NFSM-Wheat was not to be
implemented, were provided funds of ` 26.63 crore of scheme fund, against
which an amount of ` 27.21 crore had been spent by these districts. In
addition, one identified NFSM-Rice district and five identified NFSM-Coarse
cereal districts were not provided funds during the years 2012-14. The details
were as shown in Appendix 2.21.
The Government stated (December 2016) that though 12th
Five Year Plan
commenced from the year 2012-13, the guidelines was received from GoI in
April 2014, due to which targets were given to districts identified for
implementation of NFSM in 11th
Five Year Plan.
The fact remains that the release of NFSM funds to districts where NFSM was
not to be implemented resulted in diversion of funds for which approval from
GoI was to be obtained. In addition, farmers of six other identified districts
were prevented from getting benefits under the scheme due to failure to
provide funds to these identified districts.
2.1.16 Monitoring of the Scheme
2.1.16.1 Organisational Mismatches in implementing agencies at State
and District levels
As per NFSM guidelines for 11th
Five Year Plan (2007-12), the State
Government were required to nominate or create a suitable autonomous
agency registered under the Societies registration Act for implementing NFSM
at State and district levels. Such an agency could be the State Agricultural
Management & Extension Training Institute (SAMETI) at the State level and
the ATMA at the district level.
ATMA is a registered society of key stakeholders at district level, involved in
project planning and implementation of various farm activities for sustainable
agricultural development. It consisted of the district level representatives of all
28
Letter no. 2014/3499 dated 16.7.2014
During the years
2012-14, eight
unidentified
NFSM-Wheat
districts were
provided funds
under the
mission; while one
identified NFSM-
Rice district and
five identified
NFSM-Coarse
cereal district
were not provided
funds.
Chapter-II Performance Audit
37
line Departments concerning agriculture & allied sectors, research institutions,
farmers’ organisations and NGOs. The operational guidelines of
implementation of the scheme during 12th
Five Year Plan (2012-17) envisaged
for continuance of these nominated agencies during 12th
Plan period.
Audit scrutiny revealed that State Government constituted an autonomous
body, ‘State Institute of Agriculture Extension and Training’ (SIAET) in
December 2007. The fund for implementation of NFSM during 2012-14 was
directly released by the GoI to SIAET, considering it as implementing agency
for the scheme. However, SIAET was not functioning as implementing
agency, except for a brief period March 2014 to January 2015.
State Government declared (October 2011) SIAET as custodian of the funds of
Mission and the scheme implementation was entrusted to Directorate of
Farmers Welfare and Agriculture Development (FWAD). Similarly, the
scheme was being implemented at district level by Deputy Director of FWAD
instead of ATMA.
The reasons for these organisational mismatches could not be ascertained from
the records. The Government stated (December 2016) that though an
Autonomous agency was created, shortage of staff and unavailability of
extension officers in the agency caused implementation of the mission by the
department itself.
The reply is not acceptable, as the failure to utilise the institutional
arrangements of SIAET and ATMA was a deviation from the operational
guidelines for NFSM. State Government was responsible for adequate
strengthening of these agencies. Further, the activities under NFSM could not
be dovetailed with Strategic Research and Extension Plan29
of Districts and
failed to have convergence from other schemes, which could have been
facilitated through ATMA structure.
2.1.16.2 Project Management Teams at State and District Level
Paragraph 4.4.2 of operational guidelines stipulated constitution of a Project
Management Team (PMT) at the State and District Level with Consultants and
Technical Assistants, appointed on contractual basis, as the members of the
PMT. The State/District level PMT had the responsibility of ensuring
collaboration among various line departments concerning agriculture & allied
sectors to achieve the targets, providing guidance in organizational and
technical matters, helping in implementation and monitoring of the various
interventions of the mission. In addition, the PMT had also to assist in
capacity building programmes; monitor the implementation of each
demonstration, record the data on crop yield through crop cutting experiments,
compiling the results of each demonstration at block, district and State level in
the form of a booklet, assist the district/State agencies in concurrent
evaluation, document and disseminate the success stories, and undertake
publicity/information campaign to create awareness about the Mission
activities.
29
Under the ATMA model, Strategic Research and Extension Plan is the basic document
from which the Block Action Plan, District Action Plan and State Extension Work Plan
are to be derived on an annual basis.
Autonomous
agency set-up for
implementation of
NFSM at State
level was reduced
to mere custodian
of funds. The
organisational
structure of
ATMA at district
level was not
utilised for
implementation of
scheme.
Audit Report Economic Sector for the year ended 31 March 2016
38
State Government had constituted the PMTs at the State and District level in
November 2007. Audit scrutiny of records revealed that the consultants and
technical assistants appointed on contractual basis for PMTs were being
utilised for routine office works. Out of test checked 17 DDAs, only five30
DDAs actually constituted district PMTs that too without including District
Consultants and Technical Assistants as members of PMT. Further, Khargone
district did not constitute PMT and the status of constitution of PMTs in
remaining 11 districts could not be ascertained in audit in the absence of
related records.
Thus, district PMTs were not functional in most of the cases. As a result, the
Directorate was dependent upon the crop production data of Revenue
Department. However, there was time lag in availability of data from Revenue
Department. The production related data of NFSM districts for the year
2015-16 was not available with the Department as of December 2016. Since
these data were vital for the planning, implementation and monitoring of the
interventions under NFSM, its delayed availability with the Directorate
affected the implementation of scheme. Moreover, as the scheme was not
implemented at district level through ATMA and also PMT were not
functional, the requisite collaboration with various line departments could not
be ensured. Further, results of each demonstration were not compiled at State
level in the form of a booklet as required in the guidelines.
The Government intimated (December 2016) that contractual nature of
appointment of PMT staff forced these employees to leave the job, due to
which there were vacancies. Process for filling up vacant posts in PMT was
being initiated. All the district offices were being instructed for setting up the
PMT again. The Government also stated that crop cutting experiments were
done by the Revenue Department.
The reply is not acceptable, as NFSM provided for recording of crop cutting
data through PMT. Further, State Government was responsible for ensuring
availability of sufficient manpower for State/District levels PMTs.
2.1.16.3 Functioning of State Food Security Mission Executive
Committee (SFSMEC)
Paragraph 4.2.1 of Operational guidelines of NFSM stipulated constitution of
the SFSMEC under the chairmanship of Chief Secretary along with the
Secretaries from various Government Departments31
as its members. State
Government constituted (October 2007) the SFSMEC and made it responsible
to monitor the activities of the Mission, suggest state-specific changes required
if any, in the operational guidelines prescribed by the Central Government and
send the State Annual Action Plan after due approval to GoI.
The existence of SFSMEC during the years 2012-13 to 2015-16 could not be
ascertained in audit, as the Directorate could not produce minutes of meetings
of this Committee. Audit noticed that State Action Plan was sent to GoI
without approval of SFSMEC.
30
Chhattarpur, Dhar, Indore, Panna and Shajapur 31
Departments of Agriculture, Irrigation, Power, Panchayati Raj, Tribal Affairs and
Social Welfare.
Working of
SFSMEC during
2012-16 could not
be ensured in
absence of
minutes of
meetings. SAP
was sent to GoI
without approval
of SFSMEC.
Chapter-II Performance Audit
39
The Government stated (December 2016) that SFSMEC had been set up.
However, review of NFSM was done in Departmental review meetings headed
by Chief Minister and also in other review meetings organised under the
chairmanship of Principal Secretary and Agricultural Production
Commissioner. The Government also assured that SFSMEC meetings would
be held soon.
The fact remains that the activity of Mission was not reviewed by SFSMEC
during the years 2012-13 to 2015-16.
2.1.16.4 District Food Security Mission Executive Committee
Paragraph 4.3.2 of operational guidelines envisaged for constitution of District
Food Security Mission Executive Committee32
(DFSMEC) for project
formulation, implementation and monitoring of the scheme components
through the Agriculture Department.
All the test-checked districts intimated constitution of the DFSMEC.
However, only four districts33
produced minutes of meetings in support of the
working of DFSMEC. Therefore, the working of DFSMEC in 13 districts was
not evident from records produced in audit.
The Government stated (December 2016) that district offices would be
instructed for timely conduct of DFSMEC meetings. The Government also
stated that instructions would be given to District offices to evaluate the
activities of the scheme through DFSMEC.
2.1.17 Impact Evaluation Study on NFSM
After completion of 11th
five year plan period, an impact evaluation Study was
conducted by Department of Agriculture and Co-operation, Ministry of
Agriculture GoI. Six districts34
of the State were also covered for the study.
Some of the recommendations of the report with reference to the State and
status of their implementation were as under:
• Impact evaluation report mentioned that during the entire period of
11th
Plan, only eight meetings of SFSMEC were held in the State, which
worked out to an average of 1.6 meeting per year. It was recommended that
the SFSMEC meeting be held at least once in every quarter to oversee the
activities of the Mission in the State more closely. However, audit scrutiny
revealed that SFSMEC meeting were not conducted during the 12th
Plan, as
discussed in Para 2.1.16.3.
• According to Impact evaluation report, District Consultants and
Technical Assistants engaged under the mission at district level were mostly
utilised for office work of routine nature and not for intended technical service
and monitoring of NFSM intervention. The similar trend continued during the
period of performance audit, as discussed in para 2.1.6.2.
• Impact evaluation report further mentioned that convening of meetings
of DFSMEC was poor and in majority of cases DFSMEC meeting was
combined with other review meetings of the Agriculture Department which
32
DFSMEC had representatives from the line departments 33
Dhar, Khargone, Sidhi and Ujjain 34
Shahdol, Rajgarh, Dewas, Satna, Dindori, and Tikamgarh
Audit Report Economic Sector for the year ended 31 March 2016
40
resulted in lack of focus and in-depth deliberation. The record of meetings
was also not maintained properly.
The performance audit revealed continuance of the shortcoming, as minutes of
DFSMEC meeting were available in only four out of 17 districts, as discussed
in paragraph 2.1.16.4.
• As per Impact evaluation report, Separate seed Committee were not
constituted in half of the studied districts and suggested all districts to put in
place Seed Committees to ensure adequate availability of seed to avoid
adverse impact on production of crops.
The performance audit revealed that seed committees were not formed in
five test checked districts, as discussed in para 2.1.8.2. Thus, follow up
measures for remedial action suggested in the Impact Evaluation Report, for
effective implementation and monitoring of the mission were not taken.
2.1.18 Conclusion
Targets for production of food grains were not fixed for NFSM districts in the
State. As a result their progress in achieving scheme objective of additional
production could not be ascertained. Despite an expenditure of ` 945.18 crore
under NFSM in the State during 2012-16, only two per cent of the total
farmers in the State had benefitted.
NFSM districts could increase the sown area of rice by five per cent only as
against the average growth rate of 26 per cent in sown area of rice at State
level. NFSM-Wheat districts also did not achieve sustained growth, as the
sown areas decreased in 2014-15 as compared to previous year. Production of
pulses was substantially decreased by 22 per cent in 2013-14 and by
14 per cent in 2014-15 as compared to 2012-13. Thus, the impact of NFSM
on pulses was not conspicuous. However, utilisation of funds received
under NFSM by the Department decreased from 95 per cent in 2012-13 to
64 per cent in 2015-16.
The Government did not provide adequate seeds in time. As a result, the
objective of the Scheme of distributing quality seeds at subsidised rates could
not be achieved. However, a beneficiary survey of farmers conducted by the
audit revealed that 250 out of 260 farmers reported the achievement of higher
yield by using quality seeds provided by the Department.
District offices could not ensure quality testing of seeds distributed to farmers
before its sowing, which put to risk, the production and income generation of
farmers.
The Department did not fix the agencies and rates of farm implements
as required under the NFSM operational guidelines. The assistance to
farmers on purchase of farm implements resulted in irregular expenditure of
` 261.81 crore.
Norms for providing subsidy to farm implements such as pipes and sprinkler
sets were not adhered to by the Department. As a result, the Department
provided irregular subsidy of ` 5.11 crore to 8,337 farmers in 14 districts.
Chapter-II Performance Audit
41
Perspective plan for implementation of scheme in the State was not prepared.
Baseline survey and feasibility studies were also not conducted due to which
the status of crop productivity and its potential remained unassessed. Inputs
from the Block offices were not obtained for preparation of District Annual
Action Plans.
The objective of demonstration to disseminate the knowledge of improved
practices were largely not fulfilled due to deficiencies in conducting cropping
system demonstrations, lack of involvement of scientist and deficiency in
preparation of results of demonstration. In eight test checked districts,
expenditure of ` 91.71 crore on 1.74 lakh demonstrations rendered unfruitful
due to failure to maintain prescribed records for demonstration results.
Inadequate coordination at State and District level of the Department to ensure
proper functioning of Project Management Teams affected the planning,
implementation and monitoring of the scheme.
2.1.19 Recommendations
State should provide production targets to districts and monitor its progress to
ensure achievement of objective of increase in sown areas, production and
yield in all crop components. State should also strive to widen the coverage of
farmers under the scheme to provide benefits of scheme to maximum farmers.
The Department should evolve a mechanism to ensure full utilisation of funds
received during a financial year.
Government has accepted the recommendation.
Mechanism of seed distribution and their quality testing should be
strengthened to ensure availability of certified seeds to all interested farmers.
State should ensure preparation of demonstration results in a manner that
farmers get awareness of benefits of using demonstrated technology, besides
involvement of scientists in demonstrations.
Government has accepted the recommendation.
State should ensure proper functioning of various institutions prescribed for
implementation and monitoring of the NFSM at State and District level.
Baseline survey and feasibility studies should be conducted to assess the
resource endowments of farmers, level of crop production, its potential and
demand.
Government has accepted the recommendation.
Audit Report Economic Sector for the year ended 31 March 2016
42
Water Resources Department
2.2 Implementation of Madhya Pradesh Water Sector
Restructuring Project
Executive Summary
The Madhya Pradesh Water Sector Restructuring Project (MPWSRP) was
taken up by Water Resources Department (WRD), Government of Madhya
Pradesh (GoMP) with assistance from the World Bank. It aimed to
modernise 654 irrigation schemes in five river basins (Chambal, Betwa, Ken,
Sindh and Tons). The Project Implementation Plan (PIP) also envisaged for
agricultural intensification and diversification through effective collaboration
with line departments, such as Farmer Welfare and Agriculture Development
and Horticulture and Food Processing.
Investment clearance to MPWSRP for ` 1,919 crore on 2011-12 price level
was accorded by the Planning Commission. The administrative approval of
the project was revised (April 2015) to ` 2,498 crore from ` 1,919 crore
(August 2004). MPWSRP, after five time extensions, was closed (June 2015)
with total expenditure of ` 2,497.52 crore.
A performance audit on implementation of MPWSRP during the period
2010-11 to 2015-16 revealed delayed implementation of the project, poor
integration of line Departments, deficient contract management and lack of
monitoring. The significant audit findings were as follows:
Changes in scope of assets modernisation
The project aimed to rehabilitate and modernise 654 existing irrigation
schemes of these five river basins with a total Culturable Command Area of
6.18 lakh hectares. As a result of slow performance of the project, the scope
of MPWSRP was restructured in June 2012 and 362 irrigation schemes were
dropped. Out of the balance 292 schemes, WRD could rehabilitate 228
schemes only by the end of the project.
(Paragraph 2.2.7.1)
In the year 2012, the Department reduced the allocation of funds in all
basins ranging from 51.43 per cent to 78.68 per cent except the Sindh basin,
where allocation was increased by 488.93 per cent due to significantly large
allocation on Chambal Canal System.
(Paragraph 2.2.8.2)
During 2012-14 the Department incurred 24 per cent of overall expenditure
of MPWSRP on execution of Chambal Canal System. The overemphasis
resulted in basin wise imbalances in irrigation schemes and this, coupled
with the delay in implementation of modernisation plan resulted in exclusion
of 362 minor irrigation scheme from project. CC lining, which was easy for
execution constituted 94 per cent of the expenditure and Chambal Canal
System during 2012-14. It also affected the farm level economy of envisaged
beneficiaries of excluded schemes.
(Paragraph 2.2.7.1)
Chapter-II Performance Audit
43
Agriculture intensification and diversification
Against the estimated provision of ` 144.61 crore in the Project
Implementation Plan (PIP) for the line departments, actual expenditure was
` 115.04 crore which was 4.61 per cent of the total expenditure under the
MPWSRP. Poor integration with line departments, absence of sustainable
water supply to farmers and lack of training to Water User Associations
(WUAs) impacted crop diversification.
During beneficiary survey, 133 out of 334 (40 per cent) farmers reported of
not participating in any training programme of FW&AD. Thus, there was
lack of effort at institutional level to generate awareness among farmers
about the benefits of crop diversification.
Agriculture intensification and diversification did not correspond to the
increase in the achievement of irrigated area under MPWSRP. The impact of
sown area of gram, arhar and mustard was taken as an indicator for
agriculture intensification in PIP. Audit scrutiny revealed reduction in sown
areas of gram and arhar during 2014-15 by 20 per cent and 35 per cent
respectively as compared to 2011-12. Further, the sown area of mustard was
reduced in 2014-15 by 19 per cent as compared to 2012-13. Plantation area
of fruits, vegetables and spices remained low ranging from 2.90 per cent to
7.31 per cent, as against the target of 21 per cent of the irrigated area
envisaged in PIP and was even below state average of nine per cent.
(Paragraph 2.2.7.4)
Contract management and execution
The Department incurred ` 263.85 crore on CC lining beyond the scope of
Scheme Modernisation Plans (SMP) without any assessment of necessity
justifying deviation from SMP.
(Paragraph 2.2.8.3)
Provisions of specifications appended with NCB were ignored by Chief
Engineer at the time of according technical sanction, which led to irregular
expenditure of ` 65.18 crore in works for trimming of earthwork and CC
lining of canals, besides, inadequate quality control of works.
(Paragraphs 2.2.9.2, 2.2.9.4, 2.2.9.6 and 2.2.10.3)
Adherence with agreement clauses was not ensured by Executive Engineers
resulting into undue financial benefits to contractor amounting to
` 68.74 crore on inadequate additional security deposit, liquidated damages,
royalty charges and insurance coverage of works.
(Paragraphs 2.2.9.9, 2.2.9.10, 2.2.9.11 and 2.2.9.12)
Provisions of schedule of rates were not followed, as instances of extra cost
of ` 24.02 crore due to incorrect lead of metal, incorrect rate for
embankment and inclusion of inadmissible items of blasting and excess
payment on account of shrinkage allowance were noticed.
(Paragraphs 2.2.9.3, 2.2.9.5, 2.2.9.7 and 2.2.9.14)
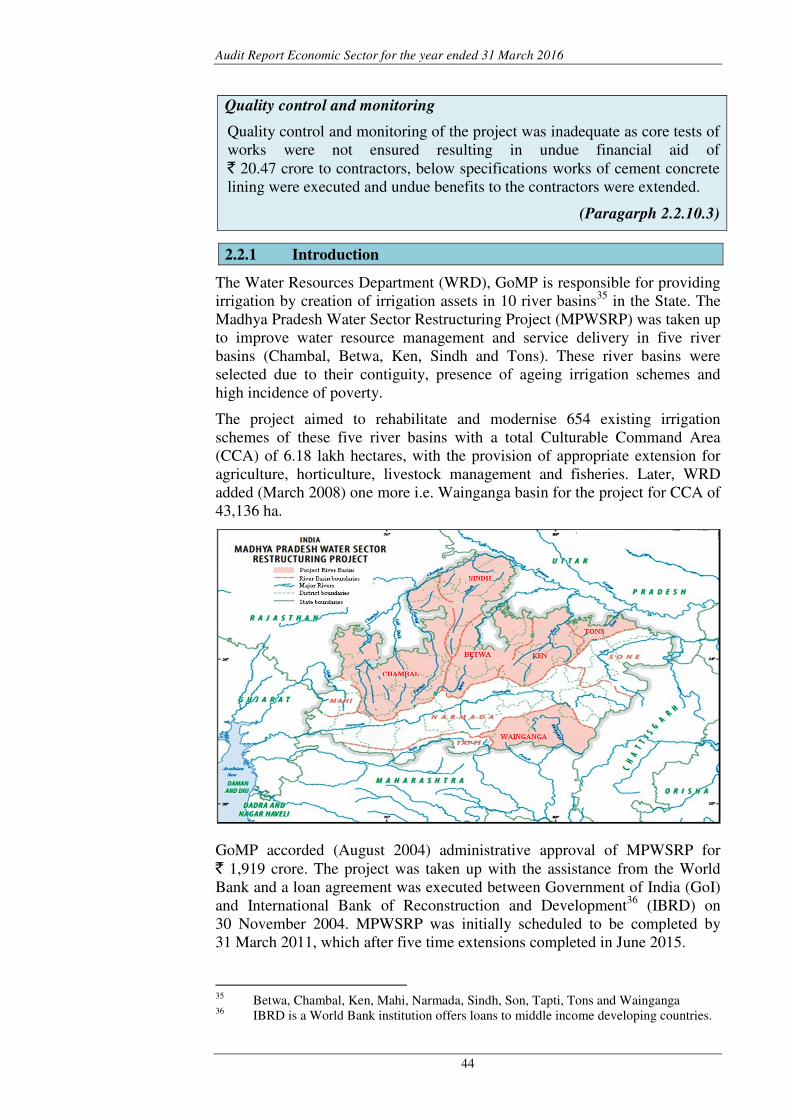
Audit Report Economic Sector for the year ended 31 March 2016
44
Quality control and monitoring
Quality control and monitoring of the project was inadequate as core tests of
works were not ensured resulting in undue financial aid of ` 20.47 crore to contractors, below specifications works of cement concrete
lining were executed and undue benefits to the contractors were extended.
(Paragarph 2.2.10.3)
2.2.1 Introduction
The Water Resources Department (WRD), GoMP is responsible for providing
irrigation by creation of irrigation assets in 10 river basins35
in the State. The
Madhya Pradesh Water Sector Restructuring Project (MPWSRP) was taken up
to improve water resource management and service delivery in five river
basins (Chambal, Betwa, Ken, Sindh and Tons). These river basins were
selected due to their contiguity, presence of ageing irrigation schemes and
high incidence of poverty.
The project aimed to rehabilitate and modernise 654 existing irrigation
schemes of these five river basins with a total Culturable Command Area
(CCA) of 6.18 lakh hectares, with the provision of appropriate extension for
agriculture, horticulture, livestock management and fisheries. Later, WRD
added (March 2008) one more i.e. Wainganga basin for the project for CCA of
43,136 ha.
GoMP accorded (August 2004) administrative approval of MPWSRP for
` 1,919 crore. The project was taken up with the assistance from the World
Bank and a loan agreement was executed between Government of India (GoI)
and International Bank of Reconstruction and Development36
(IBRD) on
30 November 2004. MPWSRP was initially scheduled to be completed by
31 March 2011, which after five time extensions completed in June 2015.
35
Betwa, Chambal, Ken, Mahi, Narmada, Sindh, Son, Tapti, Tons and Wainganga 36
IBRD is a World Bank institution offers loans to middle income developing countries.
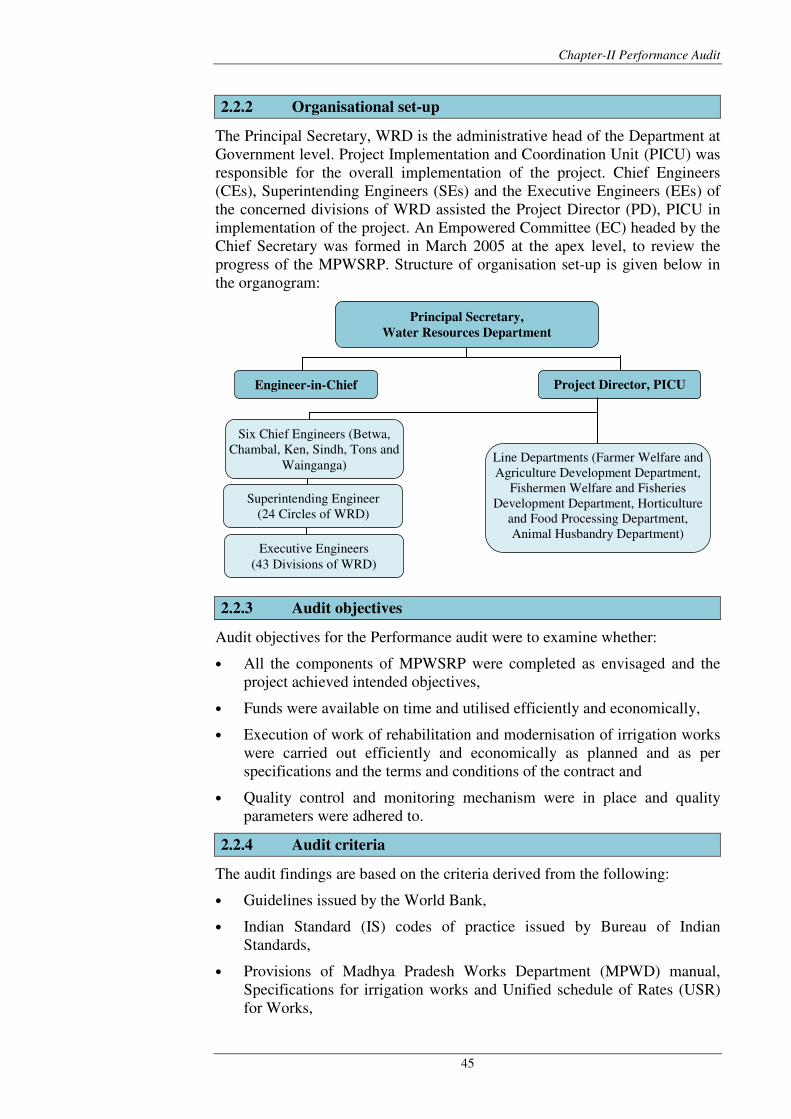
Chapter-II Performance Audit
45
2.2.2 Organisational set-up
The Principal Secretary, WRD is the administrative head of the Department at
Government level. Project Implementation and Coordination Unit (PICU) was
responsible for the overall implementation of the project. Chief Engineers
(CEs), Superintending Engineers (SEs) and the Executive Engineers (EEs) of
the concerned divisions of WRD assisted the Project Director (PD), PICU in
implementation of the project. An Empowered Committee (EC) headed by the
Chief Secretary was formed in March 2005 at the apex level, to review the
progress of the MPWSRP. Structure of organisation set-up is given below in
the organogram:
2.2.3 Audit objectives
Audit objectives for the Performance audit were to examine whether:
• All the components of MPWSRP were completed as envisaged and the
project achieved intended objectives,
• Funds were available on time and utilised efficiently and economically,
• Execution of work of rehabilitation and modernisation of irrigation works
were carried out efficiently and economically as planned and as per
specifications and the terms and conditions of the contract and
• Quality control and monitoring mechanism were in place and quality
parameters were adhered to.
2.2.4 Audit criteria
The audit findings are based on the criteria derived from the following:
• Guidelines issued by the World Bank,
• Indian Standard (IS) codes of practice issued by Bureau of Indian
Standards,
• Provisions of Madhya Pradesh Works Department (MPWD) manual,
Specifications for irrigation works and Unified schedule of Rates (USR)
for Works,
Principal Secretary,
Water Resources Department
Engineer-in-Chief Project Director, PICU
Line Departments (Farmer Welfare and
Agriculture Development Department,
Fishermen Welfare and Fisheries
Development Department, Horticulture
and Food Processing Department,
Animal Husbandry Department)
Superintending Engineer
(24 Circles of WRD)
Six Chief Engineers (Betwa,
Chambal, Ken, Sindh, Tons and
Wainganga)
Executive Engineers
(43 Divisions of WRD)
Audit Report Economic Sector for the year ended 31 March 2016
46
• Technical circulars and other orders issued by Departments,
• Detailed project reports and plan documents, and
• Terms and conditions of agreements for execution of works.
2.2.5 Scope and methodologies of Audit
2015-16 under MPSWRP. The works under MPWSRP was being executed
through 43 divisions of WRD in six river basins under six controlling offices
(Chief Engineers).
The implementation of MPWSRP during 2010-11 to 2015-16 was covered in
audit. Thirteen divisions37
were selected using stratified random sampling for
the performance audit so as to have at least one division from each basin. The
records of PD, PICU and 13 selected divisions were test-checked in the
performance audit during January 2016 to June 2016. In selected 13 divisions,
105 agreements of completed works valuing to ` 1,424.35 crore were
analysed, out of which 94 agreements were entered into during period of
2010-16 at a cost of ` 968.13 crore.
Entry conference was held on 02 February 2016 with Additional Chief
Secretary, WRD to appraise the audit objectives, audit criteria, scope and
methodologies of audit. The draft report was issued to the Government in
August 2016. The audit findings were also discussed during the exit
conference held on 03 October 2016 with the Principal Secretary. The
responses of the Government on audit observations have been suitably
incorporated in the Performance Audit.
Information relating to the project was also collected from the CEs of six river
basins and line departments of Farmer Welfare and Agriculture Development,
Horticulture and Food Processing, Fishermen Welfare and Fisheries
Development (FW&FD) and Animal Husbandry and Jawahar Lal Nehru
Krishi Vishwavidyalaya (JNKVV). Besides, beneficiary survey and interviews
with stakeholders of line departments were also conducted (June 2016,
December 2016 and January 2017) and their responses have suitably been
incorporated in the Performance Audit.
Audit acknowledges the cooperation extended by the Department for
conducting the Performance Audit.
2.2.6 Lessons learnt and sensitivity to error signals
The performance audit on MPWSRP for the period from 2005-06 to 2009-10
was earlier reported as Para 1.3 of C&AG Audit Report (Civil) for the year
ended 31 March 2010. Major shortcomings and Government’s reply to the
Public Account Committee (PAC) was as detailed in table 2.2.1.
37
WRD Divisons - Balaghat, Bhind, Dewas, Gohad, Jaura, Rajgarh, Raisen, Sagar, Satna,
Sabalgarh, Shajapur, Sheopurkala and Morena
The Department incurred ` 1,797.80 crore between the period of 2010-11 and
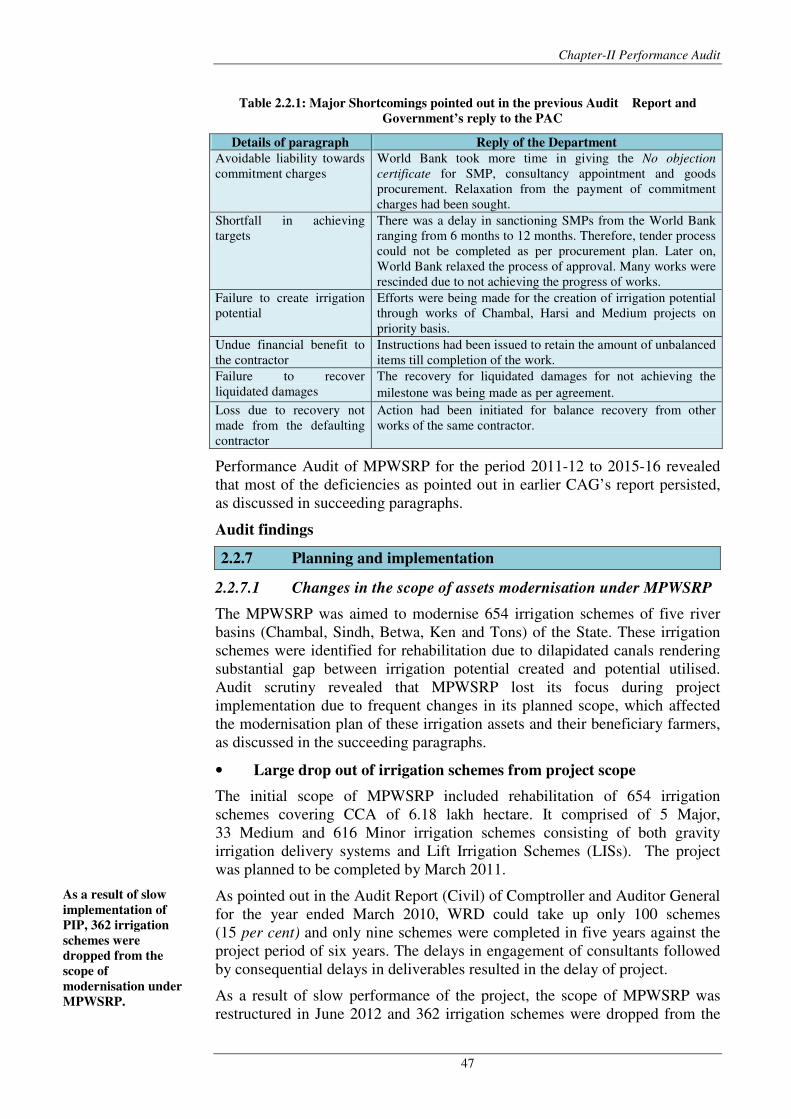
Chapter-II Performance Audit
47
Table 2.2.1: Major Shortcomings pointed out in the previous Audit Report and
Government’s reply to the PAC
Details of paragraph Reply of the Department
Avoidable liability towards
commitment charges
World Bank took more time in giving the No objection
certificate for SMP, consultancy appointment and goods
procurement. Relaxation from the payment of commitment
charges had been sought.
Shortfall in achieving
targets
There was a delay in sanctioning SMPs from the World Bank
ranging from 6 months to 12 months. Therefore, tender process
could not be completed as per procurement plan. Later on,
World Bank relaxed the process of approval. Many works were
rescinded due to not achieving the progress of works.
Failure to create irrigation
potential
Efforts were being made for the creation of irrigation potential
through works of Chambal, Harsi and Medium projects on
priority basis.
Undue financial benefit to
the contractor
Instructions had been issued to retain the amount of unbalanced
items till completion of the work.
Failure to recover
liquidated damages
The recovery for liquidated damages for not achieving the
milestone was being made as per agreement.
Loss due to recovery not
made from the defaulting
contractor
Action had been initiated for balance recovery from other
works of the same contractor.
Performance Audit of MPWSRP for the period 2011-12 to 2015-16 revealed
that most of the deficiencies as pointed out in earlier CAG’s report persisted,
as discussed in succeeding paragraphs.
Audit findings
2.2.7 Planning and implementation
2.2.7.1 Changes in the scope of assets modernisation under MPWSRP
The MPWSRP was aimed to modernise 654 irrigation schemes of five river
basins (Chambal, Sindh, Betwa, Ken and Tons) of the State. These irrigation
schemes were identified for rehabilitation due to dilapidated canals rendering
substantial gap between irrigation potential created and potential utilised.
Audit scrutiny revealed that MPWSRP lost its focus during project
implementation due to frequent changes in its planned scope, which affected
the modernisation plan of these irrigation assets and their beneficiary farmers,
as discussed in the succeeding paragraphs.
• Large drop out of irrigation schemes from project scope
The initial scope of MPWSRP included rehabilitation of 654 irrigation
schemes covering CCA of 6.18 lakh hectare. It comprised of 5 Major,
33 Medium and 616 Minor irrigation schemes consisting of both gravity
irrigation delivery systems and Lift Irrigation Schemes (LISs). The project
was planned to be completed by March 2011.
As pointed out in the Audit Report (Civil) of Comptroller and Auditor General
for the year ended March 2010, WRD could take up only 100 schemes
(15 per cent) and only nine schemes were completed in five years against the
project period of six years. The delays in engagement of consultants followed
by consequential delays in deliverables resulted in the delay of project.
As a result of slow performance of the project, the scope of MPWSRP was
restructured in June 2012 and 362 irrigation schemes were dropped from the
As a result of slow
implementation of
PIP, 362 irrigation
schemes were
dropped from the
scope of
modernisation under
MPWSRP.

Audit Report Economic Sector for the year ended 31 March 2016
48
scope of MPWSRP. However, WRD could actually rehabilitate 228 irrigation
schemes as against the restructured planning of 292 schemes by the end of the
project. The scheme-wise details of planned and executed schemes are shown
in table 2.2.2.
Table 2.2.2: Status of revision of schemes
Type of scheme Major Medium Minor Total
Identified schemes in original PIP in
2004 5 33 616 654
Command area in ha (as per PIP) 2,97,150 90,063 2,31,548 6,18,761
Schemes as per revised plan in 2012 4 23 265 292
Command area in ha (as per revision
in 2012) 3,29,949 82,337 76,093 4,88,379
Schemes actually executed 5 21 202 228
Command area in ha (as per
execution) 5,22,736 70,413 57,785 6,50,934
(Source: Information furnished by the PICU)
On being pointed out, PICU replied (July 2016) that 217 irrigation schemes,
comprising of one major, one medium and 215 minor schemes, were dropped
from the scope of MPWSRP to avail Central assistance under Repair,
Renovation and Restoration (RRR) scheme and ‘Bundelkhand draught
mitigation package’. It also informed that 148 scheme were excluded as these
were found unfeasible for rehabilitation due to loss of catchment and
command areas owing to urbanisation and hydrological problems.
The reply was not acceptable, as the exclusion of 362 schemes from the scope
of MPWSRP was not a result of well thought out plan, but it was due to delay
in rehabilitation of identified irrigation assets. ‘Bundelkhand draught
mitigation package38
’ was approved by Government of India in December
2009 by which time 248 out of 250 irrigation schemes of Betwa river basin
and 117 out of 118 irrigation schemes of Ken river basin was planned for
taking up in phases under MPWSRP. As such, shifting of 79 irrigation
schemes of MPWSRP to Bundelkhand draught mitigation package’ was
indicative of the failure of WRD to modernise these irrigation assets as
per stipulated scheduled under MPWSRP. Besides, these delays worsen the
draught situation in Bundelkhand region. Further, the Department could not
explain the reason for dropping 64 schemes from the restructured scope of
MPWSRP.
Thus, the scope of assets modernisation under MPWSRP was subject to major
change at the implementation stage. Further, the delayed implementation of
project rendered 148 schemes (22 per cent of total identified scheme)
unfeasible.
• Overemphasis on rehabilitation of Chambal Canal System due to
easy execution
Under the project implementation plan of MPWSRP, the emphasis on major,
medium and minor irrigation schemes in terms of CCAs were 48 per cent,
15 per cent and 37 per cent. However, as depicted in table 2.2.2, the CCA of
rehabilitated major schemes was 5.22 lakh hectares, which was more than 80
38 Bundelkhand package was applicable for Betwa and Ken river basins only.
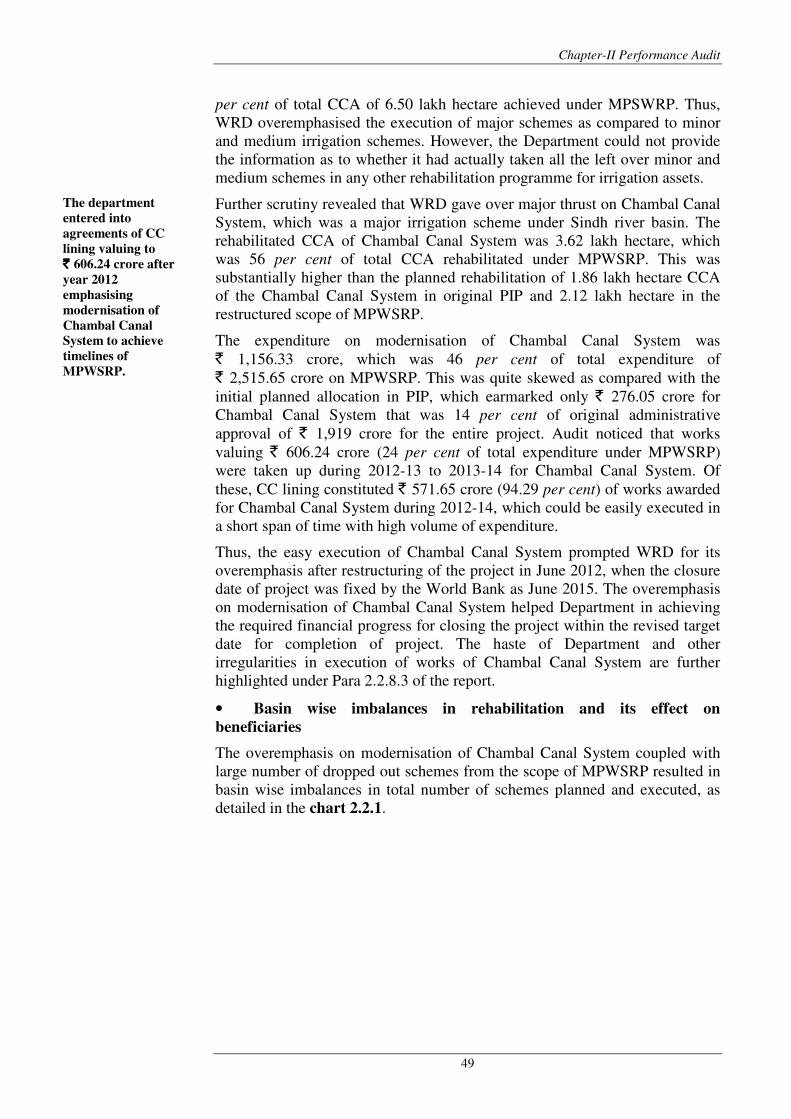
Chapter-II Performance Audit
49
per cent of total CCA of 6.50 lakh hectare achieved under MPSWRP. Thus,
WRD overemphasised the execution of major schemes as compared to minor
and medium irrigation schemes. However, the Department could not provide
the information as to whether it had actually taken all the left over minor and
medium schemes in any other rehabilitation programme for irrigation assets.
Further scrutiny revealed that WRD gave over major thrust on Chambal Canal
System, which was a major irrigation scheme under Sindh river basin. The
rehabilitated CCA of Chambal Canal System was 3.62 lakh hectare, which
was 56 per cent of total CCA rehabilitated under MPWSRP. This was
substantially higher than the planned rehabilitation of 1.86 lakh hectare CCA
of the Chambal Canal System in original PIP and 2.12 lakh hectare in the
restructured scope of MPWSRP.
The expenditure on modernisation of Chambal Canal System was
` 1,156.33 crore, which was 46 per cent of total expenditure of
` 2,515.65 crore on MPWSRP. This was quite skewed as compared with the
initial planned allocation in PIP, which earmarked only ` 276.05 crore for
Chambal Canal System that was 14 per cent of original administrative
approval of ` 1,919 crore for the entire project. Audit noticed that works
valuing ` 606.24 crore (24 per cent of total expenditure under MPWSRP)
were taken up during 2012-13 to 2013-14 for Chambal Canal System. Of
these, CC lining constituted ` 571.65 crore (94.29 per cent) of works awarded
for Chambal Canal System during 2012-14, which could be easily executed in
a short span of time with high volume of expenditure.
Thus, the easy execution of Chambal Canal System prompted WRD for its
overemphasis after restructuring of the project in June 2012, when the closure
date of project was fixed by the World Bank as June 2015. The overemphasis
on modernisation of Chambal Canal System helped Department in achieving
the required financial progress for closing the project within the revised target
date for completion of project. The haste of Department and other
irregularities in execution of works of Chambal Canal System are further
highlighted under Para 2.2.8.3 of the report.
• Basin wise imbalances in rehabilitation and its effect on
beneficiaries
The overemphasis on modernisation of Chambal Canal System coupled with
large number of dropped out schemes from the scope of MPWSRP resulted in
basin wise imbalances in total number of schemes planned and executed, as
detailed in the chart 2.2.1.
The department
entered into
agreements of CC
lining valuing to
`̀̀̀ 606.24 crore after
year 2012
emphasising
modernisation of
Chambal Canal
System to achieve
timelines of
MPWSRP.
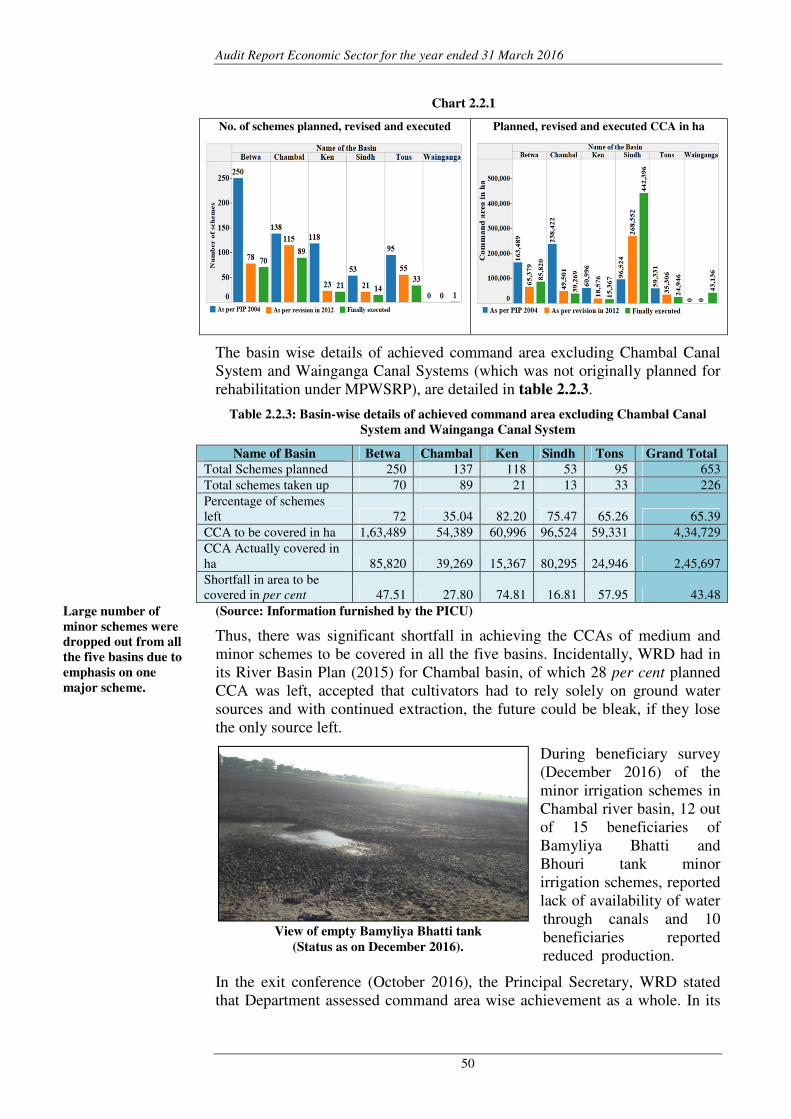
Audit Report Economic Sector for the year ended 31 March 2016
50
Chart 2.2.1
No. of schemes planned, revised and executed
Planned, revised and executed CCA in ha
The basin wise details of achieved command area excluding Chambal Canal
System and Wainganga Canal Systems (which was not originally planned for
rehabilitation under MPWSRP), are detailed in table 2.2.3.
Table 2.2.3: Basin-wise details of achieved command area excluding Chambal Canal
System and Wainganga Canal System
Name of Basin Betwa Chambal Ken Sindh Tons Grand Total
Total Schemes planned 250 137 118 53 95 653
Total schemes taken up 70 89 21 13 33 226
Percentage of schemes
left 72 35.04 82.20 75.47 65.26 65.39
CCA to be covered in ha 1,63,489 54,389 60,996 96,524 59,331 4,34,729
CCA Actually covered in
ha 85,820 39,269 15,367 80,295 24,946 2,45,697
Shortfall in area to be
covered in per cent 47.51 27.80 74.81 16.81 57.95 43.48
(Source: Information furnished by the PICU)
Thus, there was significant shortfall in achieving the CCAs of medium and
minor schemes to be covered in all the five basins. Incidentally, WRD had in
its River Basin Plan (2015) for Chambal basin, of which 28 per cent planned
CCA was left, accepted that cultivators had to rely solely on ground water
sources and with continued extraction, the future could be bleak, if they lose
the only source left.
During beneficiary survey
(December 2016) of the
minor irrigation schemes in
Chambal river basin, 12 out
of 15 beneficiaries of
Bamyliya Bhatti and
Bhouri tank minor
irrigation schemes, reported
lack of availability of water
through canals and 10
beneficiaries reported
reduced production.
In the exit conference (October 2016), the Principal Secretary, WRD stated
that Department assessed command area wise achievement as a whole. In its
Large number of
minor schemes were
dropped out from all
the five basins due to
emphasis on one
major scheme.
View of empty Bamyliya Bhatti tank
(Status as on December 2016).
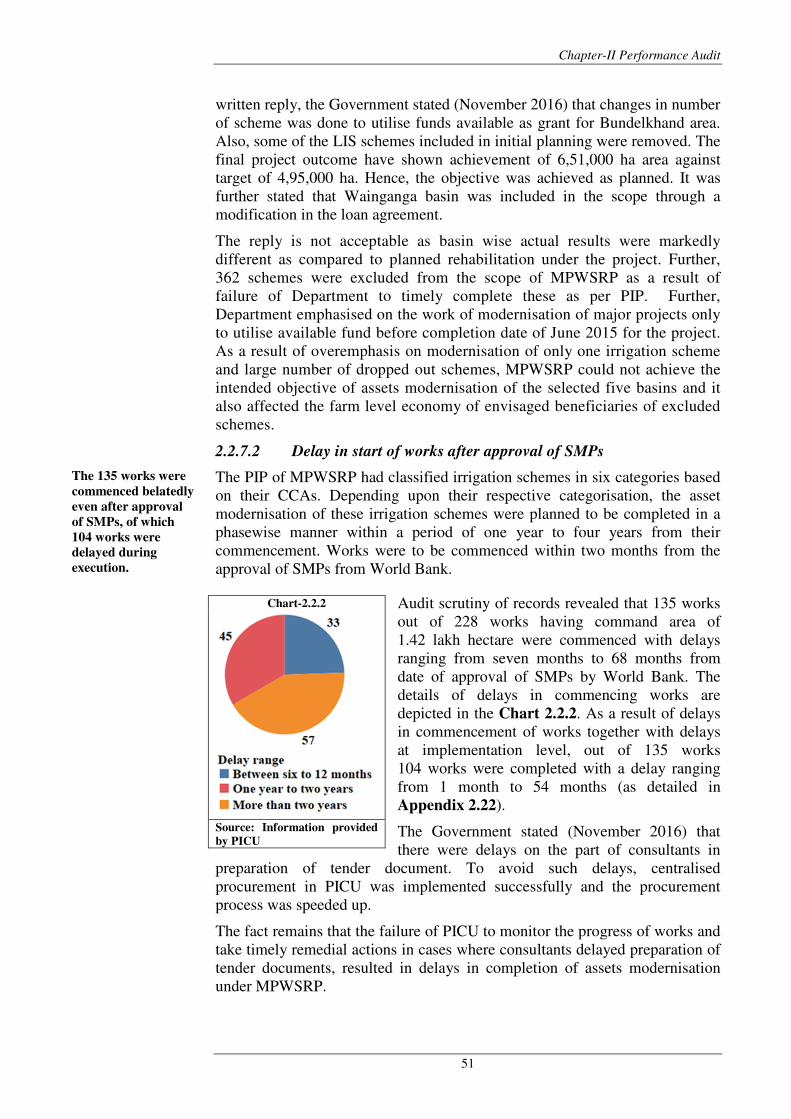
Chapter-II Performance Audit
51
written reply, the Government stated (November 2016) that changes in number
of scheme was done to utilise funds available as grant for Bundelkhand area.
Also, some of the LIS schemes included in initial planning were removed. The
final project outcome have shown achievement of 6,51,000 ha area against
target of 4,95,000 ha. Hence, the objective was achieved as planned. It was
further stated that Wainganga basin was included in the scope through a
modification in the loan agreement.
The reply is not acceptable as basin wise actual results were markedly
different as compared to planned rehabilitation under the project. Further,
362 schemes were excluded from the scope of MPWSRP as a result of
failure of Department to timely complete these as per PIP. Further,
Department emphasised on the work of modernisation of major projects only
to utilise available fund before completion date of June 2015 for the project.
As a result of overemphasis on modernisation of only one irrigation scheme
and large number of dropped out schemes, MPWSRP could not achieve the
intended objective of assets modernisation of the selected five basins and it
also affected the farm level economy of envisaged beneficiaries of excluded
schemes.
2.2.7.2 Delay in start of works after approval of SMPs
The PIP of MPWSRP had classified irrigation schemes in six categories based
on their CCAs. Depending upon their respective categorisation, the asset
modernisation of these irrigation schemes were planned to be completed in a
phasewise manner within a period of one year to four years from their
commencement. Works were to be commenced within two months from the
approval of SMPs from World Bank.
Audit scrutiny of records revealed that 135 works
out of 228 works having command area of
1.42 lakh hectare were commenced with delays
ranging from seven months to 68 months from
date of approval of SMPs by World Bank. The
details of delays in commencing works are
depicted in the Chart 2.2.2. As a result of delays
in commencement of works together with delays
at implementation level, out of 135 works
104 works were completed with a delay ranging
from 1 month to 54 months (as detailed in
Appendix 2.22).
The Government stated (November 2016) that
there were delays on the part of consultants in
preparation of tender document. To avoid such delays, centralised
procurement in PICU was implemented successfully and the procurement
process was speeded up.
The fact remains that the failure of PICU to monitor the progress of works and
take timely remedial actions in cases where consultants delayed preparation of
tender documents, resulted in delays in completion of assets modernisation
under MPWSRP.
The 135 works were
commenced belatedly
even after approval
of SMPs, of which
104 works were
delayed during
execution.
Chart-2.2.2
Source: Information provided
by PICU
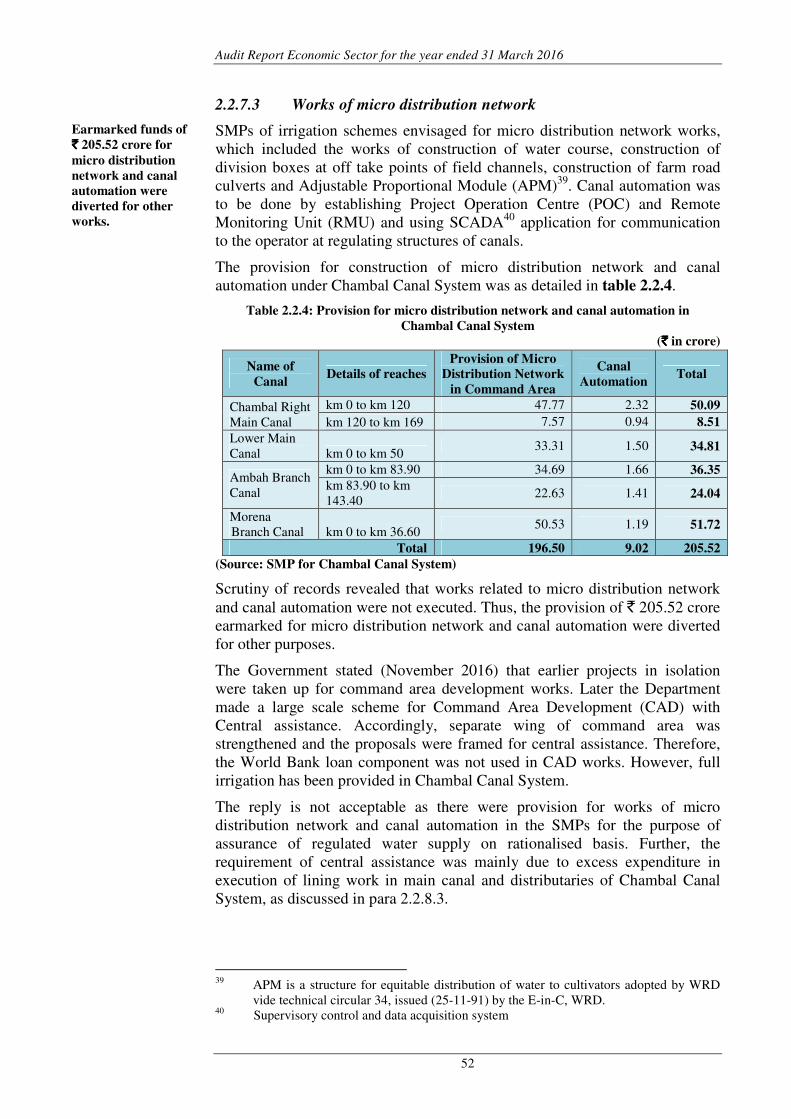
Audit Report Economic Sector for the year ended 31 March 2016
52
2.2.7.3 Works of micro distribution network
SMPs of irrigation schemes envisaged for micro distribution network works,
which included the works of construction of water course, construction of
division boxes at off take points of field channels, construction of farm road
culverts and Adjustable Proportional Module (APM)39
. Canal automation was
to be done by establishing Project Operation Centre (POC) and Remote
Monitoring Unit (RMU) and using SCADA40
application for communication
to the operator at regulating structures of canals.
The provision for construction of micro distribution network and canal
automation under Chambal Canal System was as detailed in table 2.2.4.
Table 2.2.4: Provision for micro distribution network and canal automation in
Chambal Canal System
(`̀̀̀ in crore)
Name of
Canal Details of reaches
Provision of Micro
Distribution Network
in Command Area
Canal
Automation Total
Chambal Right
Main Canal
km 0 to km 120 47.77 2.32 50.09
km 120 to km 169 7.57 0.94 8.51
Lower Main
Canal km 0 to km 50 33.31 1.50 34.81
Ambah Branch
Canal
km 0 to km 83.90 34.69 1.66 36.35
km 83.90 to km
143.40 22.63 1.41 24.04
Morena
Branch Canal km 0 to km 36.60 50.53 1.19 51.72
Total 196.50 9.02 205.52
(Source: SMP for Chambal Canal System)
Scrutiny of records revealed that works related to micro distribution network
and canal automation were not executed. Thus, the provision of ` 205.52 crore
earmarked for micro distribution network and canal automation were diverted
for other purposes.
The Government stated (November 2016) that earlier projects in isolation
were taken up for command area development works. Later the Department
made a large scale scheme for Command Area Development (CAD) with
Central assistance. Accordingly, separate wing of command area was
strengthened and the proposals were framed for central assistance. Therefore,
the World Bank loan component was not used in CAD works. However, full
irrigation has been provided in Chambal Canal System.
The reply is not acceptable as there were provision for works of micro
distribution network and canal automation in the SMPs for the purpose of
assurance of regulated water supply on rationalised basis. Further, the
requirement of central assistance was mainly due to excess expenditure in
execution of lining work in main canal and distributaries of Chambal Canal
System, as discussed in para 2.2.8.3.
39
APM is a structure for equitable distribution of water to cultivators adopted by WRD
vide technical circular 34, issued (25-11-91) by the E-in-C, WRD. 40
Supervisory control and data acquisition system
Earmarked funds of
`̀̀̀ 205.52 crore for
micro distribution
network and canal
automation were
diverted for other
works.
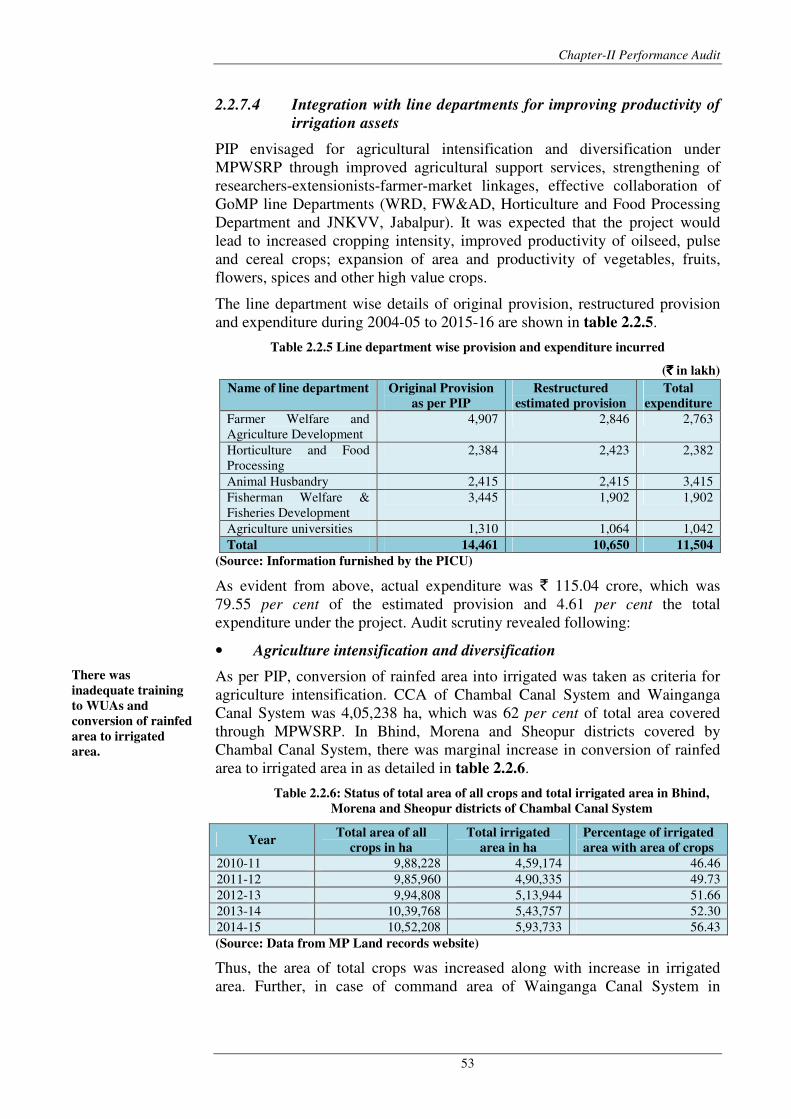
Chapter-II Performance Audit
53
2.2.7.4 Integration with line departments for improving productivity of
irrigation assets
PIP envisaged for agricultural intensification and diversification under
MPWSRP through improved agricultural support services, strengthening of
researchers-extensionists-farmer-market linkages, effective collaboration of
GoMP line Departments (WRD, FW&AD, Horticulture and Food Processing
Department and JNKVV, Jabalpur). It was expected that the project would
lead to increased cropping intensity, improved productivity of oilseed, pulse
and cereal crops; expansion of area and productivity of vegetables, fruits,
flowers, spices and other high value crops.
The line department wise details of original provision, restructured provision
and expenditure during 2004-05 to 2015-16 are shown in table 2.2.5.
Table 2.2.5 Line department wise provision and expenditure incurred
(`̀̀̀ in lakh) Name of line department Original Provision
as per PIP
Restructured
estimated provision
Total
expenditure
Farmer Welfare and
Agriculture Development
4,907 2,846 2,763
Horticulture and Food
Processing
2,384 2,423 2,382
Animal Husbandry 2,415 2,415 3,415
Fisherman Welfare &
Fisheries Development
3,445 1,902 1,902
Agriculture universities 1,310 1,064 1,042
Total 14,461 10,650 11,504
(Source: Information furnished by the PICU)
As evident from above, actual expenditure was ` 115.04 crore, which was
79.55 per cent of the estimated provision and 4.61 per cent the total
expenditure under the project. Audit scrutiny revealed following:
• Agriculture intensification and diversification
As per PIP, conversion of rainfed area into irrigated was taken as criteria for
agriculture intensification. CCA of Chambal Canal System and Wainganga
Canal System was 4,05,238 ha, which was 62 per cent of total area covered
through MPWSRP. In Bhind, Morena and Sheopur districts covered by
Chambal Canal System, there was marginal increase in conversion of rainfed
area to irrigated area in as detailed in table 2.2.6.
Table 2.2.6: Status of total area of all crops and total irrigated area in Bhind,
Morena and Sheopur districts of Chambal Canal System
Year Total area of all
crops in ha
Total irrigated
area in ha
Percentage of irrigated
area with area of crops
2010-11 9,88,228 4,59,174 46.46
2011-12 9,85,960 4,90,335 49.73
2012-13 9,94,808 5,13,944 51.66
2013-14 10,39,768 5,43,757 52.30
2014-15 10,52,208 5,93,733 56.43
(Source: Data from MP Land records website)
Thus, the area of total crops was increased along with increase in irrigated
area. Further, in case of command area of Wainganga Canal System in
There was
inadequate training
to WUAs and
conversion of rainfed
area to irrigated
area.
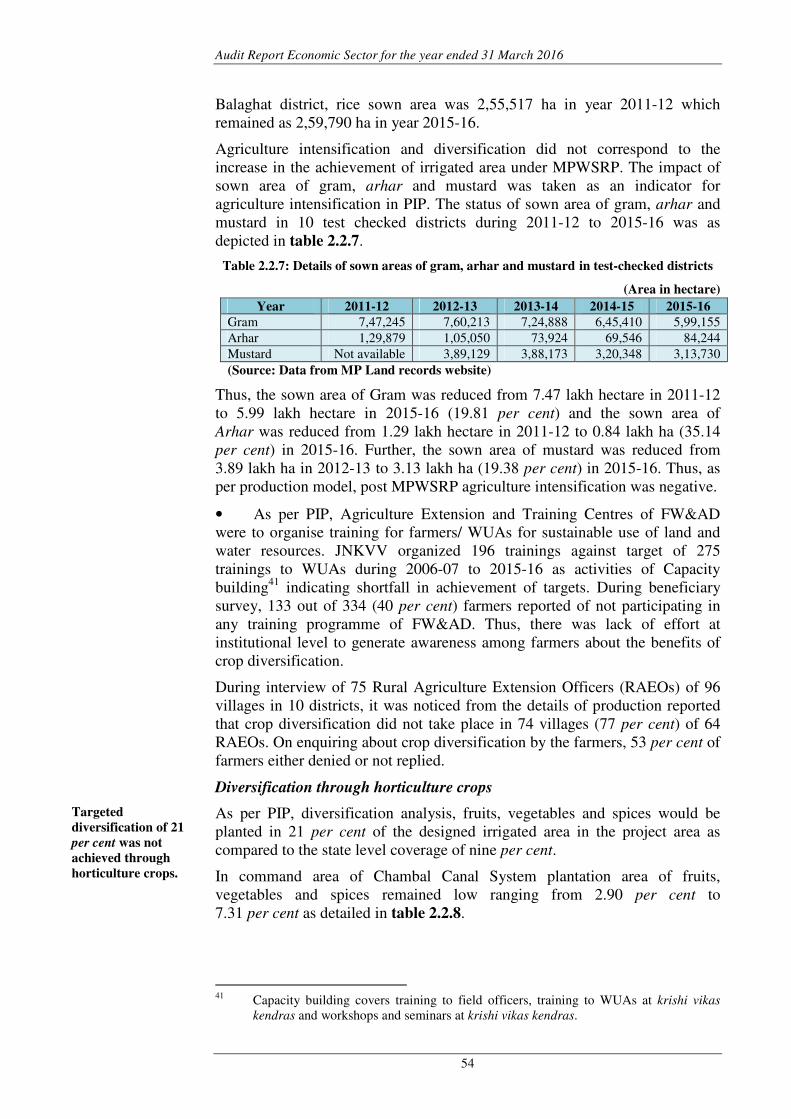
Audit Report Economic Sector for the year ended 31 March 2016
54
Balaghat district, rice sown area was 2,55,517 ha in year 2011-12 which
remained as 2,59,790 ha in year 2015-16.
Agriculture intensification and diversification did not correspond to the
increase in the achievement of irrigated area under MPWSRP. The impact of
sown area of gram, arhar and mustard was taken as an indicator for
agriculture intensification in PIP. The status of sown area of gram, arhar and
mustard in 10 test checked districts during 2011-12 to 2015-16 was as
depicted in table 2.2.7.
Table 2.2.7: Details of sown areas of gram, arhar and mustard in test-checked districts
(Area in hectare)
Year 2011-12 2012-13 2013-14 2014-15 2015-16
Gram 7,47,245 7,60,213 7,24,888 6,45,410 5,99,155
Arhar 1,29,879 1,05,050 73,924 69,546 84,244
Mustard Not available 3,89,129 3,88,173 3,20,348 3,13,730
(Source: Data from MP Land records website)
Thus, the sown area of Gram was reduced from 7.47 lakh hectare in 2011-12
to 5.99 lakh hectare in 2015-16 (19.81 per cent) and the sown area of
Arhar was reduced from 1.29 lakh hectare in 2011-12 to 0.84 lakh ha (35.14
per cent) in 2015-16. Further, the sown area of mustard was reduced from
3.89 lakh ha in 2012-13 to 3.13 lakh ha (19.38 per cent) in 2015-16. Thus, as
per production model, post MPWSRP agriculture intensification was negative.
• As per PIP, Agriculture Extension and Training Centres of FW&AD
were to organise training for farmers/ WUAs for sustainable use of land and
water resources. JNKVV organized 196 trainings against target of 275
trainings to WUAs during 2006-07 to 2015-16 as activities of Capacity
building41
indicating shortfall in achievement of targets. During beneficiary
survey, 133 out of 334 (40 per cent) farmers reported of not participating in
any training programme of FW&AD. Thus, there was lack of effort at
institutional level to generate awareness among farmers about the benefits of
crop diversification.
During interview of 75 Rural Agriculture Extension Officers (RAEOs) of 96
villages in 10 districts, it was noticed from the details of production reported
that crop diversification did not take place in 74 villages (77 per cent) of 64
RAEOs. On enquiring about crop diversification by the farmers, 53 per cent of
farmers either denied or not replied.
Diversification through horticulture crops
As per PIP, diversification analysis, fruits, vegetables and spices would be
planted in 21 per cent of the designed irrigated area in the project area as
compared to the state level coverage of nine per cent.
In command area of Chambal Canal System plantation area of fruits,
vegetables and spices remained low ranging from 2.90 per cent to
7.31 per cent as detailed in table 2.2.8.
41
Capacity building covers training to field officers, training to WUAs at krishi vikas
kendras and workshops and seminars at krishi vikas kendras.
Targeted
diversification of 21
per cent was not
achieved through
horticulture crops.
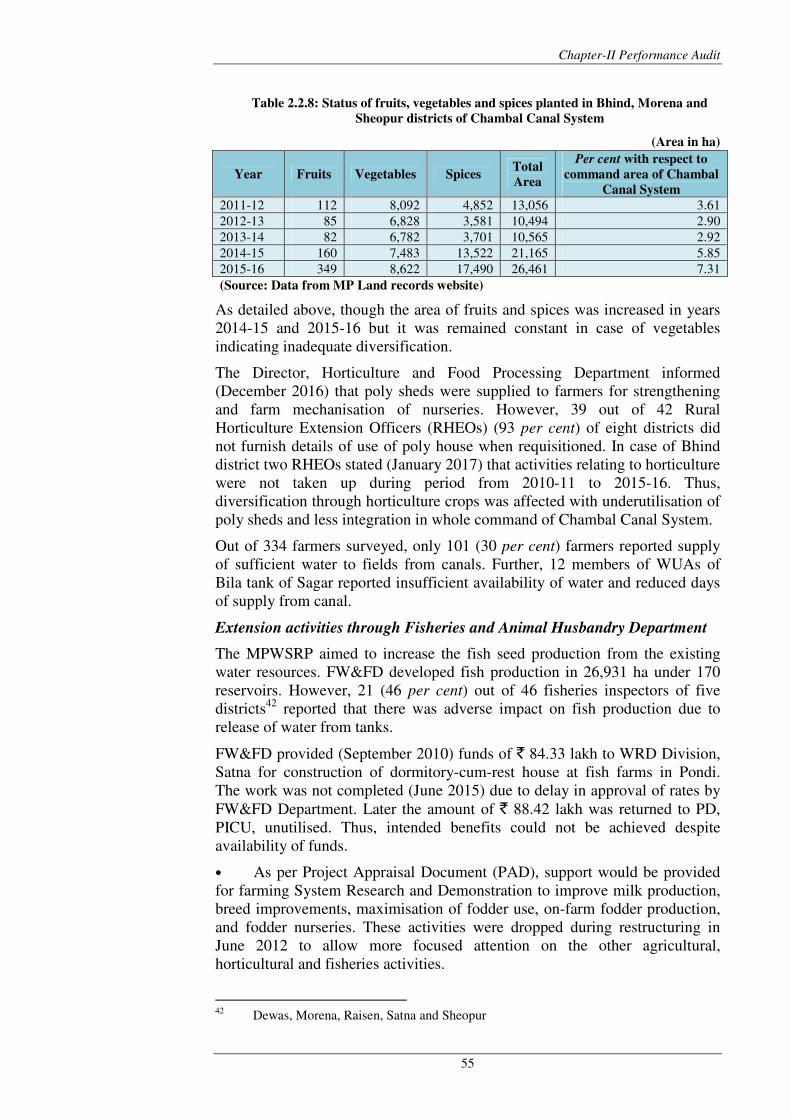
Chapter-II Performance Audit
55
Table 2.2.8: Status of fruits, vegetables and spices planted in Bhind, Morena and
Sheopur districts of Chambal Canal System
(Area in ha)
Year Fruits Vegetables Spices Total
Area
Per cent with respect to
command area of Chambal
Canal System
2011-12 112 8,092 4,852 13,056 3.61
2012-13 85 6,828 3,581 10,494 2.90
2013-14 82 6,782 3,701 10,565 2.92
2014-15 160 7,483 13,522 21,165 5.85
2015-16 349 8,622 17,490 26,461 7.31
(Source: Data from MP Land records website)
As detailed above, though the area of fruits and spices was increased in years
2014-15 and 2015-16 but it was remained constant in case of vegetables
indicating inadequate diversification.
The Director, Horticulture and Food Processing Department informed
(December 2016) that poly sheds were supplied to farmers for strengthening
and farm mechanisation of nurseries. However, 39 out of 42 Rural
Horticulture Extension Officers (RHEOs) (93 per cent) of eight districts did
not furnish details of use of poly house when requisitioned. In case of Bhind
district two RHEOs stated (January 2017) that activities relating to horticulture
were not taken up during period from 2010-11 to 2015-16. Thus,
diversification through horticulture crops was affected with underutilisation of
poly sheds and less integration in whole command of Chambal Canal System.
Out of 334 farmers surveyed, only 101 (30 per cent) farmers reported supply
of sufficient water to fields from canals. Further, 12 members of WUAs of
Bila tank of Sagar reported insufficient availability of water and reduced days
of supply from canal.
Extension activities through Fisheries and Animal Husbandry Department
The MPWSRP aimed to increase the fish seed production from the existing
water resources. FW&FD developed fish production in 26,931 ha under 170
reservoirs. However, 21 (46 per cent) out of 46 fisheries inspectors of five
districts42
reported that there was adverse impact on fish production due to
release of water from tanks.
FW&FD provided (September 2010) funds of ` 84.33 lakh to WRD Division,
Satna for construction of dormitory-cum-rest house at fish farms in Pondi.
The work was not completed (June 2015) due to delay in approval of rates by
FW&FD Department. Later the amount of ` 88.42 lakh was returned to PD,
PICU, unutilised. Thus, intended benefits could not be achieved despite
availability of funds.
• As per Project Appraisal Document (PAD), support would be provided
for farming System Research and Demonstration to improve milk production,
breed improvements, maximisation of fodder use, on-farm fodder production,
and fodder nurseries. These activities were dropped during restructuring in
June 2012 to allow more focused attention on the other agricultural,
horticultural and fisheries activities.
42
Dewas, Morena, Raisen, Satna and Sheopur
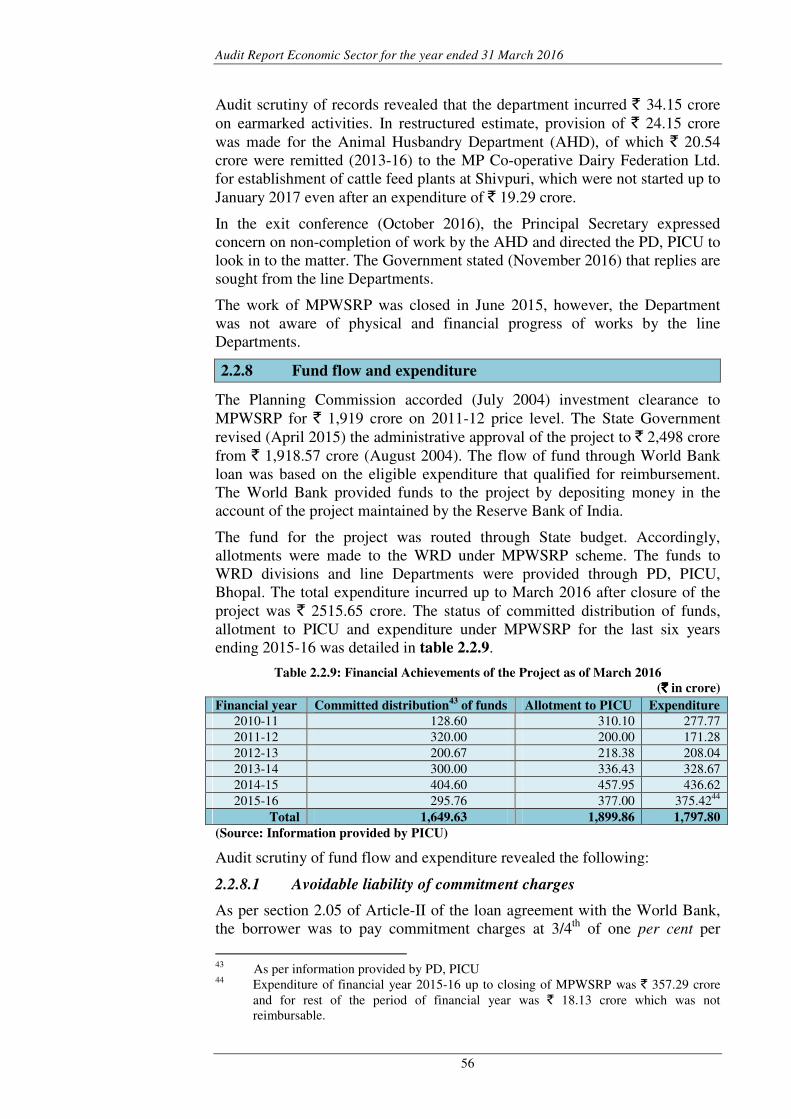
Audit Report Economic Sector for the year ended 31 March 2016
56
Audit scrutiny of records revealed that the department incurred ` 34.15 crore
on earmarked activities. In restructured estimate, provision of ` 24.15 crore
was made for the Animal Husbandry Department (AHD), of which ` 20.54
crore were remitted (2013-16) to the MP Co-operative Dairy Federation Ltd.
for establishment of cattle feed plants at Shivpuri, which were not started up to
January 2017 even after an expenditure of ` 19.29 crore.
In the exit conference (October 2016), the Principal Secretary expressed
concern on non-completion of work by the AHD and directed the PD, PICU to
look in to the matter. The Government stated (November 2016) that replies are
sought from the line Departments.
The work of MPWSRP was closed in June 2015, however, the Department
was not aware of physical and financial progress of works by the line
Departments.
2.2.8 Fund flow and expenditure
The Planning Commission accorded (July 2004) investment clearance to
MPWSRP for ` 1,919 crore on 2011-12 price level. The State Government
revised (April 2015) the administrative approval of the project to ` 2,498 crore
from ` 1,918.57 crore (August 2004). The flow of fund through World Bank
loan was based on the eligible expenditure that qualified for reimbursement.
The World Bank provided funds to the project by depositing money in the
account of the project maintained by the Reserve Bank of India.
The fund for the project was routed through State budget. Accordingly,
allotments were made to the WRD under MPWSRP scheme. The funds to
WRD divisions and line Departments were provided through PD, PICU,
Bhopal. The total expenditure incurred up to March 2016 after closure of the
project was ` 2515.65 crore. The status of committed distribution of funds,
allotment to PICU and expenditure under MPWSRP for the last six years
ending 2015-16 was detailed in table 2.2.9.
Table 2.2.9: Financial Achievements of the Project as of March 2016
(`̀̀̀ in crore)
Financial year Committed distribution43
of funds Allotment to PICU Expenditure
2010-11 128.60 310.10 277.77
2011-12 320.00 200.00 171.28
2012-13 200.67 218.38 208.04
2013-14 300.00 336.43 328.67
2014-15 404.60 457.95 436.62
2015-16 295.76 377.00 375.4244
Total 1,649.63 1,899.86 1,797.80
(Source: Information provided by PICU)
Audit scrutiny of fund flow and expenditure revealed the following:
2.2.8.1 Avoidable liability of commitment charges
As per section 2.05 of Article-II of the loan agreement with the World Bank,
the borrower was to pay commitment charges at 3/4th
of one per cent per
43
As per information provided by PD, PICU 44
Expenditure of financial year 2015-16 up to closing of MPWSRP was ` 357.29 crore
and for rest of the period of financial year was ` 18.13 crore which was not
reimbursable.
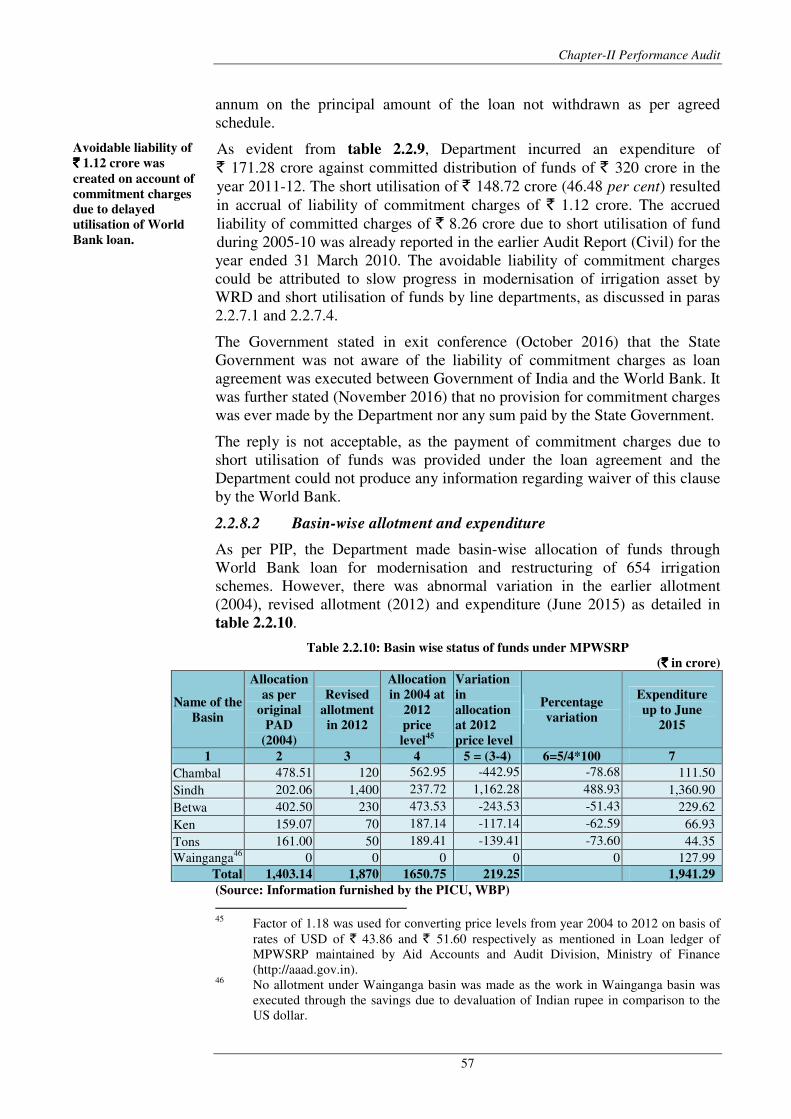
Chapter-II Performance Audit
57
annum on the principal amount of the loan not withdrawn as per agreed
schedule.
As evident from table 2.2.9, Department incurred an expenditure of
` 171.28 crore against committed distribution of funds of ` 320 crore in the
year 2011-12. The short utilisation of ` 148.72 crore (46.48 per cent) resulted
in accrual of liability of commitment charges of ` 1.12 crore. The accrued
liability of committed charges of ` 8.26 crore due to short utilisation of fund
during 2005-10 was already reported in the earlier Audit Report (Civil) for the
year ended 31 March 2010. The avoidable liability of commitment charges
could be attributed to slow progress in modernisation of irrigation asset by
WRD and short utilisation of funds by line departments, as discussed in paras
2.2.7.1 and 2.2.7.4.
The Government stated in exit conference (October 2016) that the State
Government was not aware of the liability of commitment charges as loan
agreement was executed between Government of India and the World Bank. It
was further stated (November 2016) that no provision for commitment charges
was ever made by the Department nor any sum paid by the State Government.
The reply is not acceptable, as the payment of commitment charges due to
short utilisation of funds was provided under the loan agreement and the
Department could not produce any information regarding waiver of this clause
by the World Bank.
2.2.8.2 Basin-wise allotment and expenditure
As per PIP, the Department made basin-wise allocation of funds through
World Bank loan for modernisation and restructuring of 654 irrigation
schemes. However, there was abnormal variation in the earlier allotment
(2004), revised allotment (2012) and expenditure (June 2015) as detailed in
table 2.2.10.
Table 2.2.10: Basin wise status of funds under MPWSRP
(`̀̀̀ in crore)
Name of the
Basin
Allocation
as per
original
PAD
(2004)
Revised
allotment
in 2012
Allocation
in 2004 at
2012
price
level45
Variation
in
allocation
at 2012
price level
Percentage
variation
Expenditure
up to June
2015
1 2 3 4 5 = (3-4) 6=5/4*100 7
Chambal 478.51 120 562.95 -442.95 -78.68 111.50
Sindh 202.06 1,400 237.72 1,162.28 488.93 1,360.90
Betwa 402.50 230 473.53 -243.53 -51.43 229.62
Ken 159.07 70 187.14 -117.14 -62.59 66.93
Tons 161.00 50 189.41 -139.41 -73.60 44.35
Wainganga46
0 0 0 0 0 127.99
Total 1,403.14 1,870 1650.75 219.25 1,941.29
(Source: Information furnished by the PICU, WBP) 45
Factor of 1.18 was used for converting price levels from year 2004 to 2012 on basis of
rates of USD of ` 43.86 and ` 51.60 respectively as mentioned in Loan ledger of
MPWSRP maintained by Aid Accounts and Audit Division, Ministry of Finance
(http://aaad.gov.in). 46
No allotment under Wainganga basin was made as the work in Wainganga basin was
executed through the savings due to devaluation of Indian rupee in comparison to the
US dollar.
Avoidable liability of
`̀̀̀ 1.12 crore was
created on account of
commitment charges
due to delayed
utilisation of World
Bank loan.
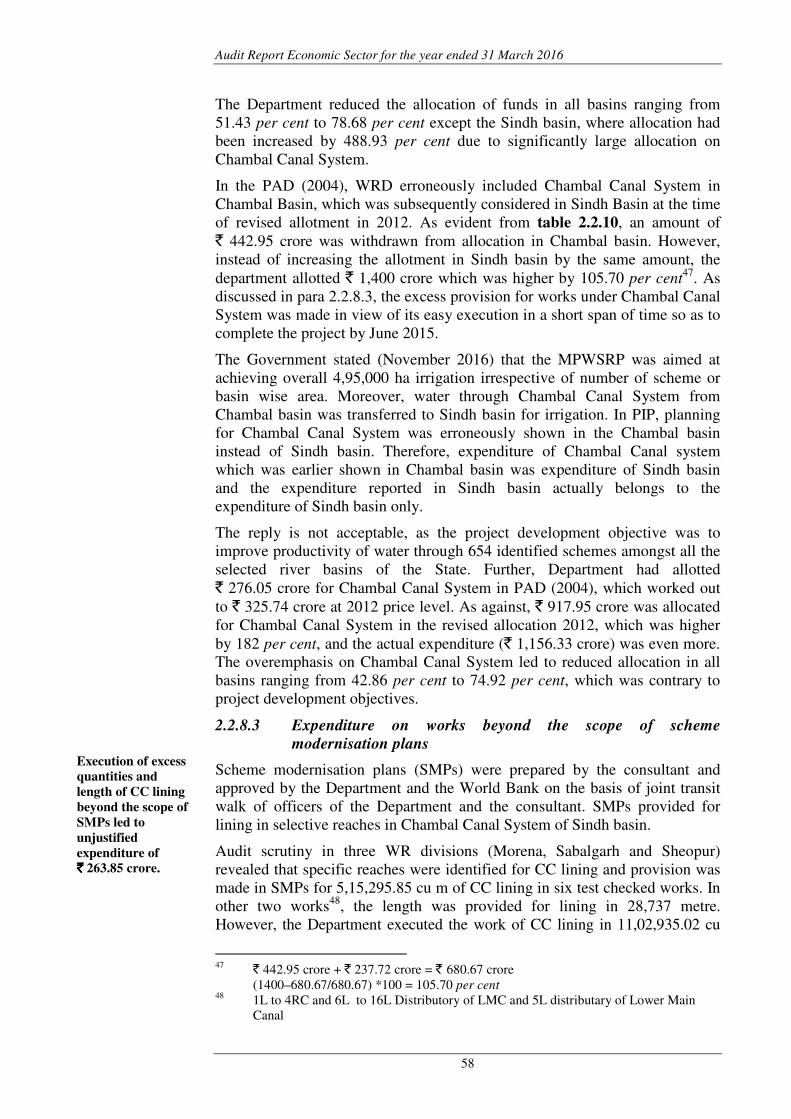
Audit Report Economic Sector for the year ended 31 March 2016
58
The Department reduced the allocation of funds in all basins ranging from
51.43 per cent to 78.68 per cent except the Sindh basin, where allocation had
been increased by 488.93 per cent due to significantly large allocation on
Chambal Canal System.
In the PAD (2004), WRD erroneously included Chambal Canal System in
Chambal Basin, which was subsequently considered in Sindh Basin at the time
of revised allotment in 2012. As evident from table 2.2.10, an amount of
` 442.95 crore was withdrawn from allocation in Chambal basin. However,
instead of increasing the allotment in Sindh basin by the same amount, the
department allotted ` 1,400 crore which was higher by 105.70 per cent47
. As
discussed in para 2.2.8.3, the excess provision for works under Chambal Canal
System was made in view of its easy execution in a short span of time so as to
complete the project by June 2015.
The Government stated (November 2016) that the MPWSRP was aimed at
achieving overall 4,95,000 ha irrigation irrespective of number of scheme or
basin wise area. Moreover, water through Chambal Canal System from
Chambal basin was transferred to Sindh basin for irrigation. In PIP, planning
for Chambal Canal System was erroneously shown in the Chambal basin
instead of Sindh basin. Therefore, expenditure of Chambal Canal system
which was earlier shown in Chambal basin was expenditure of Sindh basin
and the expenditure reported in Sindh basin actually belongs to the
expenditure of Sindh basin only.
The reply is not acceptable, as the project development objective was to
improve productivity of water through 654 identified schemes amongst all the
selected river basins of the State. Further, Department had allotted
` 276.05 crore for Chambal Canal System in PAD (2004), which worked out
to ` 325.74 crore at 2012 price level. As against, ` 917.95 crore was allocated
for Chambal Canal System in the revised allocation 2012, which was higher
by 182 per cent, and the actual expenditure (` 1,156.33 crore) was even more.
The overemphasis on Chambal Canal System led to reduced allocation in all
basins ranging from 42.86 per cent to 74.92 per cent, which was contrary to
project development objectives.
2.2.8.3 Expenditure on works beyond the scope of scheme
modernisation plans
Scheme modernisation plans (SMPs) were prepared by the consultant and
approved by the Department and the World Bank on the basis of joint transit
walk of officers of the Department and the consultant. SMPs provided for
lining in selective reaches in Chambal Canal System of Sindh basin.
Audit scrutiny in three WR divisions (Morena, Sabalgarh and Sheopur)
revealed that specific reaches were identified for CC lining and provision was
made in SMPs for 5,15,295.85 cu m of CC lining in six test checked works. In
other two works48
, the length was provided for lining in 28,737 metre.
However, the Department executed the work of CC lining in 11,02,935.02 cu
47
` 442.95 crore + ` 237.72 crore = ` 680.67 crore
(1400–680.67/680.67) *100 = 105.70 per cent 48
1L to 4RC and 6L to 16L Distributory of LMC and 5L distributary of Lower Main
Canal
Execution of excess
quantities and
length of CC lining
beyond the scope of
SMPs led to
unjustified
expenditure of
`̀̀̀ 263.85 crore.
Chapter-II Performance Audit
59
m in six works and in entire length of 71,441 metre in other two works. The
excess execution of CC lining was without any assessment of necessity which
required deviation from SMPs finalised after joint transit walk. Thus, the
excess quantities of CC lining of 5.88 lakh cu m and 42,704 metre resulted in
unjustified expenditure of ` 263.85 crore (Appendix 2.23).
In the exit conference (October 2016), the Department stated that initially the
lining was to be done in patches, but later it was realised that lining was
required in entire length of canals. The Government in it’s written reply stated
(November 2016) that it was decided to take up lining work in all the possible
reaches for efficient use of water in view of the water logging problem after
rains and irrigation.
The replies are not acceptable, as the requirement of CC lining was assessed
for selected reaches in SMPs through joint walk of officers of WRD and
consultants. The reaches for CC lining were identified in view of the risk of
seepage of canal waters and water logging. Though WR Division, Jaora
followed the provisions of CC lining as detailed in the SMPs, other Divisions
deviated from SMPs without assessment of necessity for excess execution of
CC lining.
2.2.9 Contract management and work execution
Contract management is the process of systematically and efficiently
managing contract creation, execution and analysis for the purpose of financial
and operational performance and minimising risk of cost over run and time
over run. There were shortcomings in estimation, tendering and execution
leading to extra cost/excess payments/undue benefit/inadmissible
payments/inflated payments to the contractors valuing ` 204.10 crore in
respect of 71 contracts of restructuring and modernisation of canals and tanks.
2.2.9.1 Irregular execution of CC lining
As per the provision of Technical Circular (TC) No. 1/8449
, CC lining in
M-1050
grade is required to be provided for canals carrying discharge of water
from 0.3 cumec to 3 cumec and more. The Department again confirmed
(March 2003) the provision for providing CC lining in M-10 grade vide
TC No. 47.
Audit scrutiny of records revealed that in case of 30 works under seven WR
divisions51
of restructuring and modernisation of canals, the Department
provided and executed 10,63,440 cu m M-15 grade cement concrete lining.
Provision and execution of M-15 grade CC lining was contrary to the
provisions of TC and criteria for MPWSRP works. This resulted in irregular
execution of CC lining of ` 47.70 crore as detailed in Appendix 2.24.
The Government stated (November 2016) that the work of CC lining was
executed as per specifications and broad guidelines of technical specification
issued for MPWSRP works. These specifications had been part of agreement.
It was mentioned that concrete would be generally governed by IS 456-2000,
which provided M-15 as minimum grade of concrete. The technical circular
49
Technical Circular (TC) No 1/84 issued by the E-in-C, WRD 50
This represents cement, sand and course aggregate in the ratio of 1:3:6. 51
Balaghat, Bhind, Jaora, Morena, Sabalgarh, Satna and Sheopur
Irregular
expenditure of
`̀̀̀ 47.70 crore was
incurred due to
adoption of richer
specification for
canal lining.
Audit Report Economic Sector for the year ended 31 March 2016
60
(TC) 1 of 84-85 was a very old TC and had been under revision since long.
Further, Director (Canals), BODHI informed (February 2017) that revised
guidelines for canal lining superseding TC 1/84 has been issued
(December 2016).
The reply is not acceptable, as IS 456: 2000 did not stipulate M-15 as
minimum grade of concrete and the provision of M-10 grade having specified
characteristic strength of 10 N/mm2 was also included for grades of concrete.
Further, the fact remains that TC 1/84 was in force during period of execution
and therefore, was to be followed and accountability for overruling the circular
without authority was required to be fixed.
2.2.9.2 Extra cost due to unwarranted provision for trimming of
earthwork
As per clause 7 of chapter-III of specifications for canal lining appended with
National Competitive Bidding (NCB) document, final preparation of
sub-grade for placement of concrete included provision of work of trimming in
canal section up to the underside of concrete lining and preparation of
sub-grade for concrete placement include removal of pride section52
. Pride
section equivalent to thickness of lining on the sides and bed on the underside
of lining shall be left unexcavated. The rate for providing and laying
embankment was including the cost of final preparation of sub-grade for
placement of concrete lining and no separate payment on this account was
admissible.
Audit scrutiny of records of 37 works53
in seven WR divisions54
revealed that
item of earthwork was prepared by inclusion of items of stripping, excavation
(housing), earthwork for embankment, watering and compaction. It was
noticed that a separate item of trimming was provided in the schedule of items
of NCB and an amount of ` 17.73 crore was paid for execution of 178.78 lakh
sq m. Since the item of final preparation of sub-grade for placement of
concrete already included provision and execution of trimming, inclusion of
trimming as a separate item and payment was contrary to provisions of NCB.
This resulted in extra cost due to unwarranted provision for trimming of
earthwork of ` 17.73 crore, as detailed in Appendix 2.25.
The Government stated (November 2016) that the item of mechanised
trimming was included as per item provided in USR. It was essential to trim
the sub-grade to keep the thickness of lining in uniformity and there were
small undulations in sub-grade even after compaction.
The reply is not acceptable, as the specification of canal lining appended with
NCB document stipulated that the final preparation of sub-grade included
work of trimming. Therefore, separate payment on account of trimming was
inadmissible and accountability of respective officers was required to be fixed
for incorrect inclusion of this item in estimates and approving the same in TS.
52
Section of canal having uneven surfaces 53
WRD Dn Bhind and WRD Dn Gohad 54
Balaghat, Bhind, Gohad, Jaora, Morena, Sabalgarh and Sheopur
Extra cost due to
unwarranted
provision for
trimming of
earthwork of
`̀̀̀ 17.73 crore.
Chapter-II Performance Audit
61
2.2.9.3 Excess payment on account of inclusion of lead/rate of Black
Trap metal
The availability of the type of course aggregate in the near vicinity of work
area is the main governing factor, while selecting the type of metal for CC
work in canal lining during estimation. There is no specific guidelines for use
of Black Trap (BT), Basalt or local metal as course aggregate.
Audit scrutiny of records in case of 18 works in six WR divisions55
revealed
that estimates for CC lining included provision of extra rate of lead for use of
BT metal by including lead charges up to 220 km, as detailed in Appendix
2.26. Further scrutiny revealed that the quarry metal available at nearer leads
up to 83 km was not used on the ground of using BT metal. The provision for
excess lead for BT metal was unwarranted as the course aggregate available in
the near vicinity could be used for CC lining work.
Audit scrutiny further revealed that the mix designs were prepared for CC
lining works reportedly including coarse aggregate as BT metal. However, the
specific gravity56
of course aggregate measured in the mixed design was up to
2.65. Since the specific gravity of BT metal ranges from 2.8 to 3.0, as such BT
metal was not actually used in the mix designs of concrete and therefore, in
CC lining work. Thus, the payment of lead for BT metal without its actual use
resulted in avoidable excess payment of ` 16.43 crore in 18 works.
The Government stated (November 2016) that the thickness of CC lining
provided was 7.5 cm to 10 cm. Twenty mm metal obtained from crusher was
used in CC lining. The crusher used BT/ Granite/ Basalt rocks for making
metal. The UCSR rate of lead of BT/ Granite/ Basalt metal was same.
Therefore, the lead had been added for BT/ Granite/ Basalt metal. As far as the
specific gravity of course aggregate in design mix was concerned, the metal
might be Granite for which specific gravity was in the range of 2.6 to 2.7.
Thus, no excess payment on account of lead/rate of BT metal had been paid.
The reply is not acceptable as the course aggregate available near the vicinity
of work area was not used. Further, even after the BT metal with extra lead
was included in the estimates of CC lining, EE did not ensure use of BT metal
in the work. Thus, the condition on the ground did not warrant extra payment
of ` 16.43 crore on account of lead for BT metal.
2.2.9.4 Extra cost due to inclusion of superfluous item of work
According to clause 9.2 of the specifications of chapter–III canal lining, Air
Entraining Agent (AEA) as an admixture shall be added to the concrete in
such a manner to ensure uniform distribution of admixture throughout the
concrete. Further clause 7 of chapter-II of specifications provides that AEA
shall only be added after approval of Engineer-in-Charge. The unit rate of
concrete shall cover application of admixture.
In two WR divisions, Jaora and Morena, audit scrutiny of records revealed
(May and June 2016) that mix designs of CC lining work did not include
55
Bhind, Gohad, Jaora, Morena, Sabalgarh and Sheopur 56
The specific gravity of solids is defined as dimension less unit is a ratio of density of
material to the density of water.
Excess payment
of ` ` ` ` 16.43 crore
on account of
inclusion of
lead/rate of BT
metal.
Superfluous item of
Air Entraining Agent
was made in item of
CC lining leading to
Extra cost of
`̀̀̀ 5.46 crore.
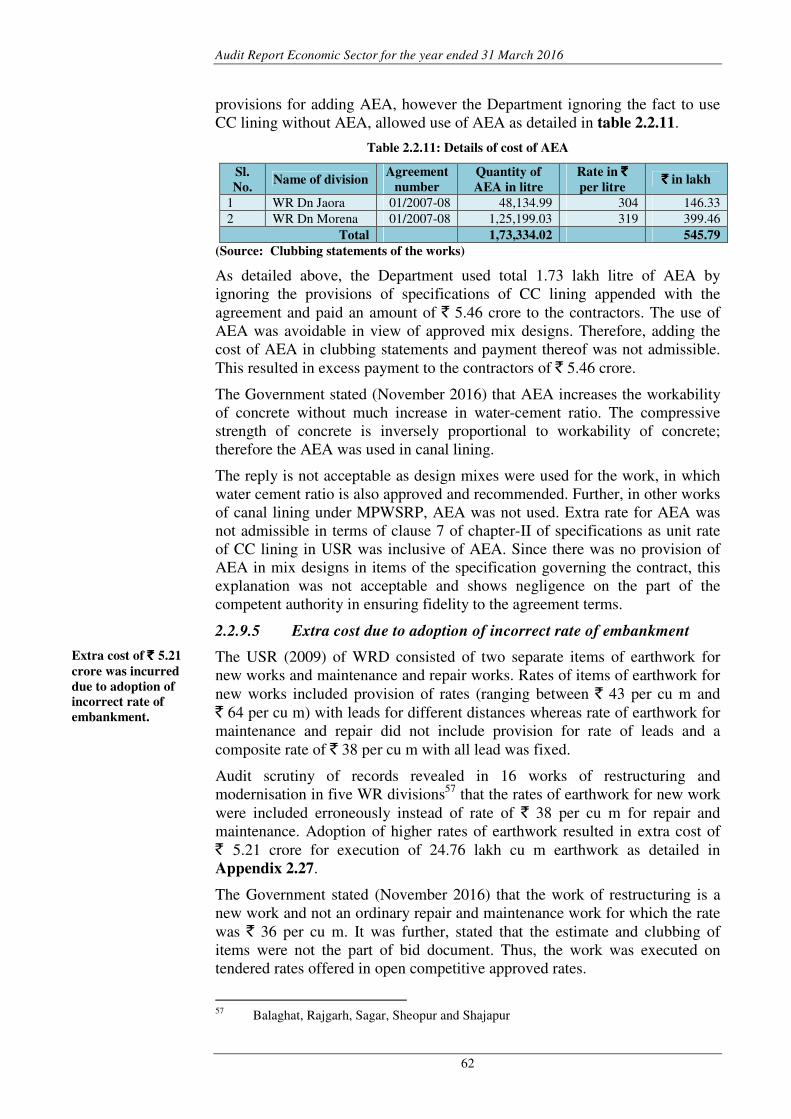
Audit Report Economic Sector for the year ended 31 March 2016
62
provisions for adding AEA, however the Department ignoring the fact to use
CC lining without AEA, allowed use of AEA as detailed in table 2.2.11.
Table 2.2.11: Details of cost of AEA
Sl.
No. Name of division
Agreement
number
Quantity of
AEA in litre
Rate in `̀̀̀
per litre `̀̀̀ in lakh
1 WR Dn Jaora 01/2007-08 48,134.99 304 146.33
2 WR Dn Morena 01/2007-08 1,25,199.03 319 399.46
Total 1,73,334.02 545.79
(Source: Clubbing statements of the works)
As detailed above, the Department used total 1.73 lakh litre of AEA by
ignoring the provisions of specifications of CC lining appended with the
agreement and paid an amount of ` 5.46 crore to the contractors. The use of
AEA was avoidable in view of approved mix designs. Therefore, adding the
cost of AEA in clubbing statements and payment thereof was not admissible.
This resulted in excess payment to the contractors of ` 5.46 crore.
The Government stated (November 2016) that AEA increases the workability
of concrete without much increase in water-cement ratio. The compressive
strength of concrete is inversely proportional to workability of concrete;
therefore the AEA was used in canal lining.
The reply is not acceptable as design mixes were used for the work, in which
water cement ratio is also approved and recommended. Further, in other works
of canal lining under MPWSRP, AEA was not used. Extra rate for AEA was
not admissible in terms of clause 7 of chapter-II of specifications as unit rate
of CC lining in USR was inclusive of AEA. Since there was no provision of
AEA in mix designs in items of the specification governing the contract, this
explanation was not acceptable and shows negligence on the part of the
competent authority in ensuring fidelity to the agreement terms.
2.2.9.5 Extra cost due to adoption of incorrect rate of embankment
The USR (2009) of WRD consisted of two separate items of earthwork for
new works and maintenance and repair works. Rates of items of earthwork for
new works included provision of rates (ranging between ` 43 per cu m and
` 64 per cu m) with leads for different distances whereas rate of earthwork for
maintenance and repair did not include provision for rate of leads and a
composite rate of ` 38 per cu m with all lead was fixed.
Audit scrutiny of records revealed in 16 works of restructuring and
modernisation in five WR divisions57
that the rates of earthwork for new work
were included erroneously instead of rate of ` 38 per cu m for repair and
maintenance. Adoption of higher rates of earthwork resulted in extra cost of
` 5.21 crore for execution of 24.76 lakh cu m earthwork as detailed in
Appendix 2.27.
The Government stated (November 2016) that the work of restructuring is a
new work and not an ordinary repair and maintenance work for which the rate
was ` 36 per cu m. It was further, stated that the estimate and clubbing of
items were not the part of bid document. Thus, the work was executed on
tendered rates offered in open competitive approved rates.
57
Balaghat, Rajgarh, Sagar, Sheopur and Shajapur
Extra cost of ` ` ` ` 5.21
crore was incurred
due to adoption of
incorrect rate of
embankment.
Chapter-II Performance Audit
63
The reply did not explain why the technical sanction was granted on basis of
incorrect rates in contravention of provisions of USR. In the absence of clear
nomenclature for separation of USRs, the amount of ` 5.21 crore was wrongly
paid and needed to be recovered. Therefore, the accountability was to be fixed
for granting technical sanction on the basis of incorrect rates.
2.2.9.6 Unwarranted execution of excess thickness of lining
According to the paragraph 25.6.3.2 of specifications for canal lining issued
by WRD, maximum 75 mm thick cast in situ lining was to be provided for
canals having depth of water less than 2.5 metre and capacity five cumec to
50 cumec discharge of the canals.
Audit scrutiny of records (June 2016) in WR division Jaora revealed that head
discharge of Morena Branch Canal (MBC) was 14.16 cumec and depth of
water was 1.45 metre, hence the 75 mm thickness of lining was to be adopted
for lining in MBC from km 0 to km 36.10. However, the Department adopted
thickness of 100 mm using M-15 grade concrete. Therefore, execution of
lining in excess of the required thickness in MBC was contrary to the
provision of specifications and resulted in extra cost of ` 4.82 crore58
. The
Department failed to furnish the reasons for adoption of excessive thickness of
canal lining.
The Government stated (November 2016) that thickness of lining for a
particular discharge or depth of water should not be less than the minimum
thickness prescribed. It can be more as per site condition and requirement.
Accordingly the specifications for MPWSRP were drawn and appended with
the tender document/agreement. The work was executed accordingly.
The reply is not tenable as per specifications para 5.2 of IS Code IS: 3872,
1993, the range of depth of water should be less than 2.5 metre for the canal
having discharge from 5 cumec to 50 cumec and full supply depth up to
2.5 metre, the thickness of canal lining should have been 60-75 mm. The
thickness can be increased for deeper channels and when surface deterioration
in freezing climate is expected. Contrary to the provisions of IS Code, higher
thickness of CC lining was adopted by the Department without any
justification for such deviation. Thus, incorrect provision and estimate against
the irrigation specifications and execution of higher value of 100 mm
thickness in the canal lining by the Department resulted in extra cost of
` 4.82 crore.
2.2.9.7 Extra cost due to inclusion of inadmissible item of blasting
According to the item 2512 of USR issued by WRD, the rate of item of CC
lining was a complete item for providing and placing of cement concrete
inclusive of cost of all the material i.e. cement, sand, metal and water. Besides,
leads for carting of material such as cement, metal and sand was included in
clubbing for item of CC lining which were payable.
Audit scrutiny of records in WR division Balaghat revealed that Department
worked out the rate for composite item of CC lining after clubbing59
of the
58
25 per cent of (` 3,645 per cu m * 52,919.19 cu m = 19,28,90,447) = ` 4,82,22,611 59
The clubbing statement is prepared for the work by including various items of USR for
working out the rate of composite item.
Extra cost of
`̀̀̀ 4.82 crore was
incurred for
unwarranted
excess thickness of
CC lining.
Extra cost of
`̀̀̀ 85.72 lakh was
made due to
inclusion of item of
blasting in CC
lining.
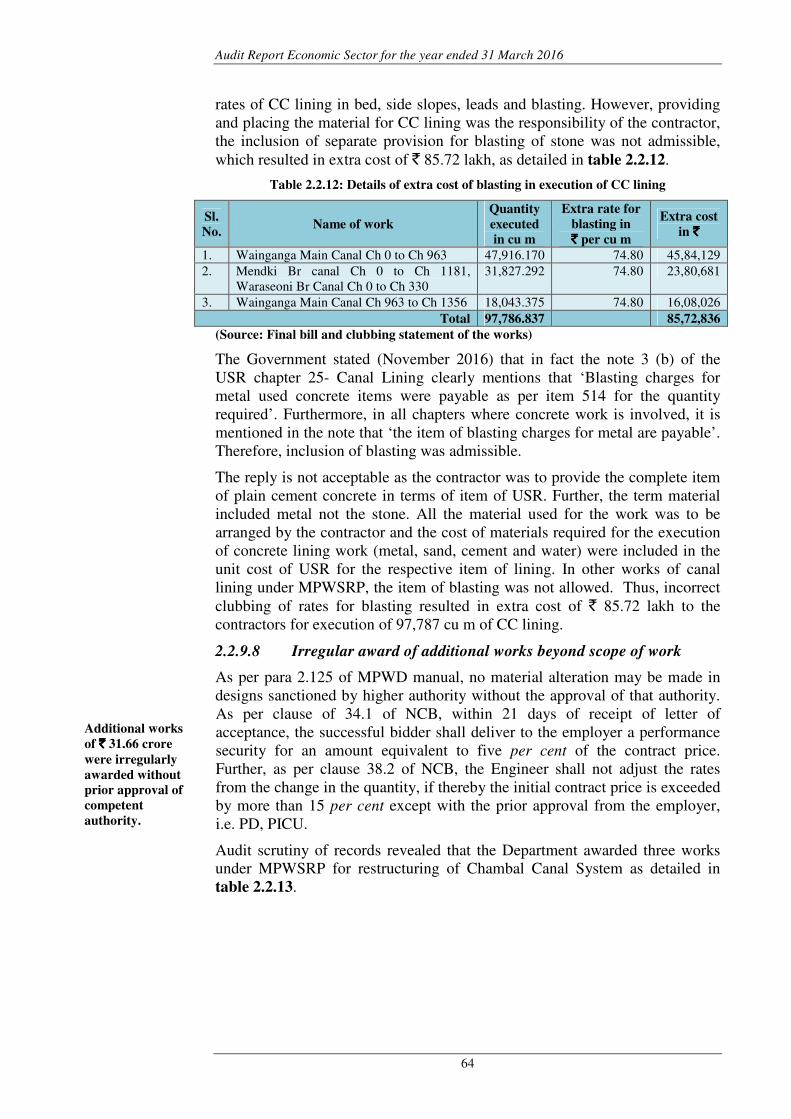
Audit Report Economic Sector for the year ended 31 March 2016
64
rates of CC lining in bed, side slopes, leads and blasting. However, providing
and placing the material for CC lining was the responsibility of the contractor,
the inclusion of separate provision for blasting of stone was not admissible,
which resulted in extra cost of ` 85.72 lakh, as detailed in table 2.2.12.
Table 2.2.12: Details of extra cost of blasting in execution of CC lining
Sl.
No. Name of work
Quantity
executed
in cu m
Extra rate for
blasting in
`̀̀̀ per cu m
Extra cost
in `̀̀̀
1. Wainganga Main Canal Ch 0 to Ch 963 47,916.170 74.80 45,84,129
2. Mendki Br canal Ch 0 to Ch 1181,
Waraseoni Br Canal Ch 0 to Ch 330
31,827.292 74.80 23,80,681
3. Wainganga Main Canal Ch 963 to Ch 1356 18,043.375 74.80 16,08,026
Total 97,786.837 85,72,836
(Source: Final bill and clubbing statement of the works)
The Government stated (November 2016) that in fact the note 3 (b) of the
USR chapter 25- Canal Lining clearly mentions that ‘Blasting charges for
metal used concrete items were payable as per item 514 for the quantity
required’. Furthermore, in all chapters where concrete work is involved, it is
mentioned in the note that ‘the item of blasting charges for metal are payable’.
Therefore, inclusion of blasting was admissible.
The reply is not acceptable as the contractor was to provide the complete item
of plain cement concrete in terms of item of USR. Further, the term material
included metal not the stone. All the material used for the work was to be
arranged by the contractor and the cost of materials required for the execution
of concrete lining work (metal, sand, cement and water) were included in the
unit cost of USR for the respective item of lining. In other works of canal
lining under MPWSRP, the item of blasting was not allowed. Thus, incorrect
clubbing of rates for blasting resulted in extra cost of ` 85.72 lakh to the
contractors for execution of 97,787 cu m of CC lining.
2.2.9.8 Irregular award of additional works beyond scope of work
As per para 2.125 of MPWD manual, no material alteration may be made in
designs sanctioned by higher authority without the approval of that authority.
As per clause of 34.1 of NCB, within 21 days of receipt of letter of
acceptance, the successful bidder shall deliver to the employer a performance
security for an amount equivalent to five per cent of the contract price.
Further, as per clause 38.2 of NCB, the Engineer shall not adjust the rates
from the change in the quantity, if thereby the initial contract price is exceeded
by more than 15 per cent except with the prior approval from the employer,
i.e. PD, PICU.
Audit scrutiny of records revealed that the Department awarded three works
under MPWSRP for restructuring of Chambal Canal System as detailed in
table 2.2.13.
Additional works
of `̀̀̀ 31.66 crore
were irregularly
awarded without
prior approval of
competent
authority.
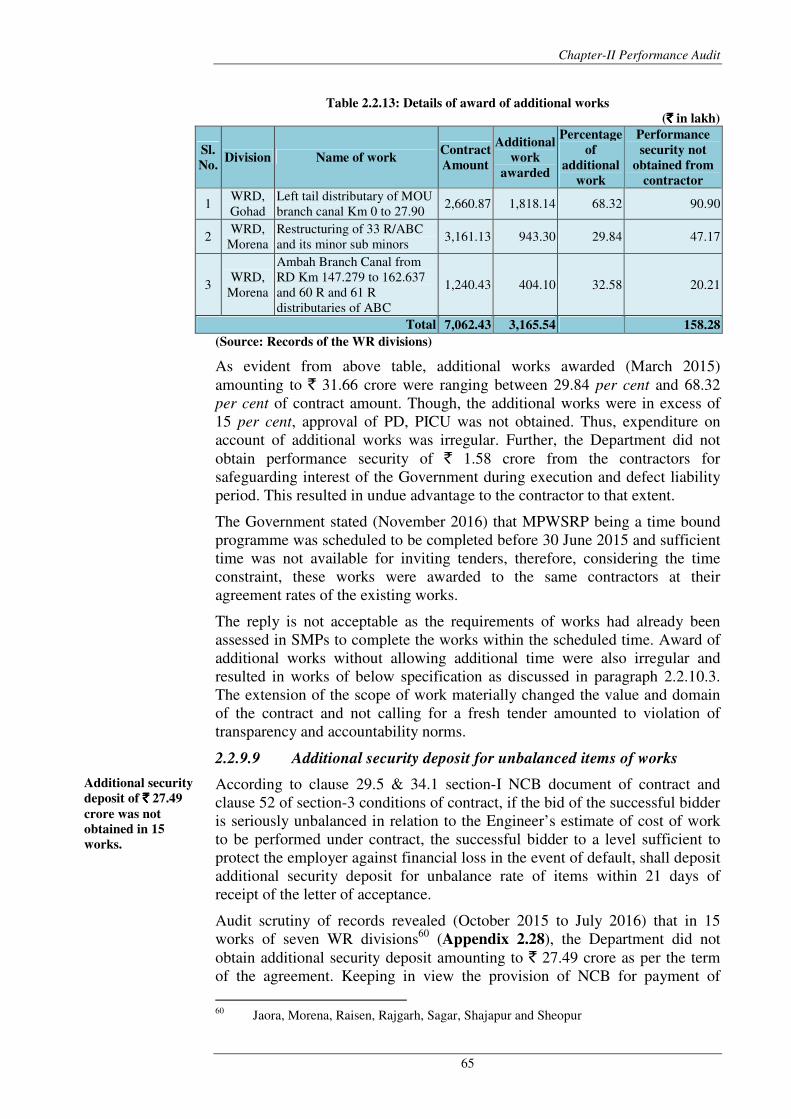
Chapter-II Performance Audit
65
Table 2.2.13: Details of award of additional works
(`̀̀̀ in lakh)
Sl.
No. Division Name of work
Contract
Amount
Additional
work
awarded
Percentage
of
additional
work
Performance
security not
obtained from
contractor
1 WRD,
Gohad
Left tail distributary of MOU
branch canal Km 0 to 27.90 2,660.87 1,818.14 68.32 90.90
2 WRD,
Morena
Restructuring of 33 R/ABC
and its minor sub minors 3,161.13 943.30 29.84 47.17
3 WRD,
Morena
Ambah Branch Canal from
RD Km 147.279 to 162.637
and 60 R and 61 R
distributaries of ABC
1,240.43 404.10 32.58 20.21
Total 7,062.43 3,165.54 158.28
(Source: Records of the WR divisions)
As evident from above table, additional works awarded (March 2015)
amounting to ` 31.66 crore were ranging between 29.84 per cent and 68.32
per cent of contract amount. Though, the additional works were in excess of
15 per cent, approval of PD, PICU was not obtained. Thus, expenditure on
account of additional works was irregular. Further, the Department did not
obtain performance security of ` 1.58 crore from the contractors for
safeguarding interest of the Government during execution and defect liability
period. This resulted in undue advantage to the contractor to that extent.
The Government stated (November 2016) that MPWSRP being a time bound
programme was scheduled to be completed before 30 June 2015 and sufficient
time was not available for inviting tenders, therefore, considering the time
constraint, these works were awarded to the same contractors at their
agreement rates of the existing works.
The reply is not acceptable as the requirements of works had already been
assessed in SMPs to complete the works within the scheduled time. Award of
additional works without allowing additional time were also irregular and
resulted in works of below specification as discussed in paragraph 2.2.10.3.
The extension of the scope of work materially changed the value and domain
of the contract and not calling for a fresh tender amounted to violation of
transparency and accountability norms.
2.2.9.9 Additional security deposit for unbalanced items of works
According to clause 29.5 & 34.1 section-I NCB document of contract and
clause 52 of section-3 conditions of contract, if the bid of the successful bidder
is seriously unbalanced in relation to the Engineer’s estimate of cost of work
to be performed under contract, the successful bidder to a level sufficient to
protect the employer against financial loss in the event of default, shall deposit
additional security deposit for unbalance rate of items within 21 days of
receipt of the letter of acceptance.
Audit scrutiny of records revealed (October 2015 to July 2016) that in 15
works of seven WR divisions60
(Appendix 2.28), the Department did not
obtain additional security deposit amounting to ` 27.49 crore as per the term
of the agreement. Keeping in view the provision of NCB for payment of
60
Jaora, Morena, Raisen, Rajgarh, Sagar, Shajapur and Sheopur
Additional security
deposit of `̀̀̀ 27.49
crore was not
obtained in 15
works.
Audit Report Economic Sector for the year ended 31 March 2016
66
interest at the rate of 12 per cent for delayed payment by the Department, the
interest on ASD worked out to be ` 14.12 crore. Thus, the failure of
Department in obtaining the ASD resulted in further undue benefit of
` 41.61 crore to the contractor.
The Government stated (November 2016) that as per standard practice under
World Bank guidelines, unbalanced bids to the extent of five per cent was
secured through performance security in addition to the security of five
per cent against the entire contract amount. Besides, six per cent retention
money is also deducted from each running bill. It was further stated that
wherever it was felt that the Department needs to protect the Government
interest/risk, additional security deposit has been obtained from the contractor.
The reply is not acceptable as EE did not ensure adherence of the condition of
agreement for deduction of additional security deposit. If the contractor were
awarded this benefit, rates could have been negotiated.
2.2.9.10 Liquidated damages for delay in execution of works
As per conditions of contracts, liquidated damages (LD) as penalty for delays
in execution of works on part of the contractor was required to be levied as per
rates mentioned in the contract data61
subject to maximum of 10 per cent of
final contract price.
Audit scrutiny of records revealed that in nine works under five WR
divisions62
that there were delays on the part of contractors ranging between
15 months and 48 months and the contractors failed to complete the works till
the scheduled closure date of MPWSRP (June 2015). However, the
Department did not levy LD at the rate specified in the agreement and
deducted LDs of ` 99.90 lakh in case of three works against leviable
liquidated damages of ` 17.10 crore. This resulted in short levy of liquidated
damages of ` 16.11 crore as detailed in Appendix 2.29.
The Government stated (November 2016) that as per agreement, Chief
Engineer was the employer and had to decide the compensation event.
MPWSRP works were executed with a limited working period of April-June,
July-September being rainy season and in October-March canals were used for
Rabi season. With this constraint the employer had revised the milestones and
hence LDs was not admissible. It was further stated that the work of BMC
Ch 902 to Ch 2,565 and its distributaries and minors was carried out under
special repair whose completion period was six months and extension was
granted under agreement clause. In Chambal Right Main Canal (CRMC) 0 km
to 60 km, LD had been imposed but the matter was pending in Hon’ble High
Court for decision. In work of 6L to 15L, extension was granted and
milestones were revised by the employer, hence no LD was admissible.
The reply is not acceptable as period allowed for execution of work was
inclusive of rainy season. Further there was no provision in the agreement for
relaxing the provision of imposition of penalty for delay in case of revision of
milestone.
61
Contract data is appended with the contract indicating data to be used with various
clauses of the contract. 62
Balaghat, Bhind, Raisen, Satna and Sheopur
Liquidated damages
of `̀̀̀ 16.11 crore were
short levied/not
levied for delay in
execution of works.
Chapter-II Performance Audit
67
2.2.9.11 Collection of royalty charges against use of minerals
According to the Minor Mineral Act of Mining Department, royalty charges at
the prescribed rate shall be deducted from the bills of the contractor for the use
of minor minerals on the work. As per amendment issued (March 2013) by the
Mining Department, quarry permit holder/contractor engaged in the
construction works shall obtain certificate of no mining dues to ensure
payment of royalty for the mineral used in the construction works. Further, the
mining Department again issued (December 2006) instructions for
incorporating the condition in agreements for obtaining no dues certificate
from the Collectors for use of minor minerals before payment of final bills of
the contractors.
Audit scrutiny of records in eight works under four WR divisions63
revealed
that the Department included the special condition 45.1 (c) for obtaining no
dues certificate before payment of final bills to the contractors in agreements.
However, the contractors had neither submitted certificate of no mining dues
nor the Department stopped payment of final bills of the contractors for use of
minor minerals in the works. Further, the Department irregularly paid final
bills of the contractors by keeping Fixed Deposit Receipts (FDRs) amounting
` 4.16 crore without ensuring no dues certificates from the Collectors for an
amount of ` 6.23 crore of royalty charges (Appendix 2.30).
The Government stated (November 2016) that there was no provision in the
tender document/agreement regarding recovery/deduction of mining royalty
charges. It is the responsibility of the mining Department to collect the royalty
charges of minor minerals used for the construction work. However, the
Department retained, as additional precautionary measure, sum in the form of
FDRs from the contractor’s so that whenever any need arises to recover the
royalty from the contractor, same can be realized.
The reply is not acceptable as condition 45.1 (c) was provisioned in the
agreement of works. The Department was, therefore, required to be stopped
the payment of final bills for want of no dues certificate from the Collector.
There should be proper mechanism in the Department to ensure collection of
royalty charges against the procurement of material. Further, obtaining FDRs
against the royalty receivable from the contractors was contrary to the
provision of Minor Mineral Act.
2.2.9.12 Insurance coverage of works
According to clause 13 of the condition of the contract, the contractor was
required to provide the insurance cover, from the date of commencement of
the contract to the end of defect liability64
for the amounts specified in the
contract for covering various hazards.
Audit scrutiny of test checked records of one major, one medium and three
minor schemes revealed that in 29 agreements, despite contractual
requirement, the Department did not get the works insured in respect of 12
63
Bhind, Gohad, Morena and Sabalgarh 64
Defect liability period is a period of one year from the date of completion of the work
during which the contractor shall rectify at his cost all defects noticed by the employer
during this period.
Audit Report Economic Sector for the year ended 31 March 2016
68
WR divisions65
as detailed in Appendix 2.31. The Department did not recover
an amount of ` 4.79 crore from the contractors on account of insurance
premium to get the works insured itself.
The Government stated (November 2016) that directions were being issued to
recover the amount on account of insurance coverage from the contractor’s
sum available with the Department.
2.2.9.13 Excess payment to the contractor due to inflated measurements
As per provisions of MPWD manual, measurement books (MBs) are
maintained for the works executed by the Department. The running bills and
final bills are paid to the contractor on the basis of actual measurements
recorded in the MBs.
Audit scrutiny of records revealed that that the work of CRMC km 0 to km 60
was started in November 2007 and completed on June 2013. Penultimate bill
as 61st running bill was paid (June 2013) to the contractor for total value of
` 155.77 crore. The final bill was prepared for payment of ` 142.67 crore,
which was not finalised till July 2016. This indicated that quantities of items
of the work paid to the contractor in 61st running bill were more
than quantities measured finally. The value of excess quantities paid for
was ` 13.10 crore. There was no source to recover the amount due from
the contractor.
The Government stated (November 2016) that the CE, Yamuna Basin Gwalior
has reported that an amount of ` 13.13 crore has been deducted due to
non-compliance of repair work by the contractor in defect liability period.
Matter is however, under court of Tribunal for decision.
The reply is not acceptable, as deduction for failure to carry out repair work
was to be mentioned separately in the bills and it would not affect total value
of work done in final bill. Total value of work done in final bill was less than
the penultimate bill. Thus, department made excess payment of ` 13.10 crore
for quantities actually not executed.
2.2.9.14 Excess payment due to not deducting shrinkage allowance
As per the general note of chapter 4 of USR issued (2009) by the WRD,
10 per cent sectional measurements were to be deducted for earthwork rolled
and watered with light rolling66
. The estimates of restructuring and
modernisation works included provision of light rolling for earthwork.
Audit scrutiny of records revealed that in case of five works of restructuring
and modernisation in Gohad WR division, the Department executed total
25,94,278.77 cu m of earthwork for which shrinkage allowance from sectional
measurement at rate of 10 per cent was not deducted, even though the
compaction was executed by light rolling. Test results of compaction of
earthwork also indicated compaction at rate of 90 per cent of maximum dry
density. The failure to deduct the shrinkage allowance resulted in excess
payment to the contractors of ` 1.52 crore as detailed in Appendix 2.32.
65
Bhind, Dewas, Gohad, Jaura, Morena, Raisen, Rajgarh, Sabalgarh, Sagar, Satna,
Shajapur and Sheopur 66
Compaction by non-powered rollers/hand ramming
Excess payment of
`̀̀̀ 13.10 crore was
made to a
contractor for
quantities actually
not executed.
Excess payment of
`̀̀̀ 1.52 crore was
made to the
contractors due to
non-deduction of
shrinkage
allowance.
Chapter-II Performance Audit
69
The Government stated (November 2016) that there was no excess payment to
the contractors as earthwork on existing canal sections was done. It was not a
new construction. It was also stated that shrinkage height was added in the
earthwork and therefore no deduction of shrinkage was made.
The reply is not acceptable as restructuring work in cited cases involved new
earthwork for which shrinkage allowance was to be deducted. Therefore,
Department had to deduct 10 per cent quantity from measurement as per
provision of USR, which was not done. The amount of ` 1.52 crore was,
therefore recoverable from the contractor.
2.2.10 Monitoring and quality control
As per PIP, an effective monitoring system and benchmarks for achievement
of the project objectives should be implemented during early stage of the
project. All the construction work would be subjected to third party
supervision by a reputed company selected though National Competitive
Bidding. Quality control should be ensured in execution of works.
Performance indicators of irrigated area rehabilitated was included in the
restructuring paper of MPWSRP to ensure the realistic impact of project
implementation.
Issues relating to monitoring and quality control discussed below were
noticed:
2.2.10.1 Constitution of State Water Tariff/Rights Regulatory
Commission
As per project objectives in Project Appraisal Document (PAD), a centralised
autonomous agency State Water Tariff/ Rights Regulatory Commission
(SWaTReC), under Component A of MPWSRP was to be established to
review and monitor water sector costs and revenues, and to rationalise and set
bulk water user fees to enable the sector institutions to be financially
self-sustaining by December 2005 i.e. in early stage of MPWSRP.
Audit scrutiny of records revealed that the World Bank conducted a constraint
analysis for slow water sector reforms under Component “Institutions and
instruments” and reportedly mentioned that the “Institutions and instruments”
was not well understood and proposed that the mandate of the centralised
autonomous agency SWaTReC and State Water Resources Data and Analysis
Centre (SWRDAC) was to be merged into one institute with overall mandate.
However, discussion on role of such regulatory authority was continued till
December 2015 even after closure of MPWSRP (June 2015). Thus, purpose of
enabling the sector institutions to be financially self-sustaining was defeated.
The Government stated (November 2016) that this component was found to
infringe upon the sovereignty of the Legislature and therefore while
restructuring the project, the WB dropped this component from the project.
The reply is not acceptable as a centralised autonomous agency was to be
established for monitoring water costs and revenue which could not be done.
2.2.10.2 Third party supervision of works
All the construction work would be subjected to third party supervision by a
reputed company selected through National Competitive Bidding.
Audit Report Economic Sector for the year ended 31 March 2016
70
Audit scrutiny of records revealed that the Department was to deploy
consultancy services through NCB for third party supervision/ technical
examination of works executed under MPWSRP by July 2005, which was not
done.
The Government agreeing with the facts stated (October 2016) in exit
conference that, Department did not engage any consultant for the work and
that supervision work was conducted departmentally.
The reply is not acceptable as independent quality supervision/ assurance was
envisaged in the PIP which was not adhered to.
2.2.10.3 Quality control in execution of works
Further, Clause 14 (Chapter-3) of contract agreement stipulates that
conducting core test67
was mandatory to evaluate the quality, density,
thickness of concrete lining laid in the respective reaches. The core shall also
be tested for compressive strength. The core test shall be considered
acceptable if the average equivalent strength of the core is equal to at least
85 per cent of the cube strength. Final payment of the concrete lining shall be
made after the satisfactory core test results acceptable to the Engineer. Further,
as per clause 16, running payments were required to be made at 80 per cent of
the accepted unit rate and the final payment at 100 per cent rate was to be
made after receipt of test results of the core. Audit scrutiny revealed the
following:
• In case of 12 works under eight divisions68
, mandatory tests for
ascertaining quality, density, thickness and compressive strength of concrete
lining laid in the respective reaches were not conducted. However, the full
rates of CC lining were paid to the contractors instead of making the payments
at the rate of 80 per cent of agreed rate. This resulted in undue financial aid to
the contractors to the tune of ` 20.47 crore as shown in Appendix 2.33.
Besides, the quality of these works could not be validated.
• In case of nine works of five WR divisions69
, mix designs for CC lining
was prepared for the works. Audit scrutiny revealed that results of
compressive strength of cube tests and compressive strength of core tests were
not conforming to required strength of mix designs. Audit scrutiny further
revealed that compressive strength of core tests was more than compressive
strength of cube tests which was contrary to provisions of average equivalent
strength which was not possible. This vitiated the sanctity of test results.
Further, the contractors were paid for full amount of CC lining item. The
failure of divisions to retain 20 per cent of amount of CC lining due to test
results not as per mix design resulted in undue financial aid to the contractor
amounting to ` 37.17 crore (Appendix 2.34).
The Government stated (November 2016) that the Department has Quality
Control labs for tests required for construction works. The cube test and core
test have been performed for CC lining works in the Departmental labs as and
when required.
67
Term core tests used for sample testing of CC lining by taking piece from lining work
after 28 days for checking thickness, density, strength and quality of lining. 68
Balaghat, Dewas, Gohad, Raisen, Rajgarh, Sabalgarh, Satna and Shajapur 69
Balaghat, Gohad, Jaora, Sabalgarh and Sheopur
Core tests of works
were not ensured
and undue
financial aid was
extended to
contractors.
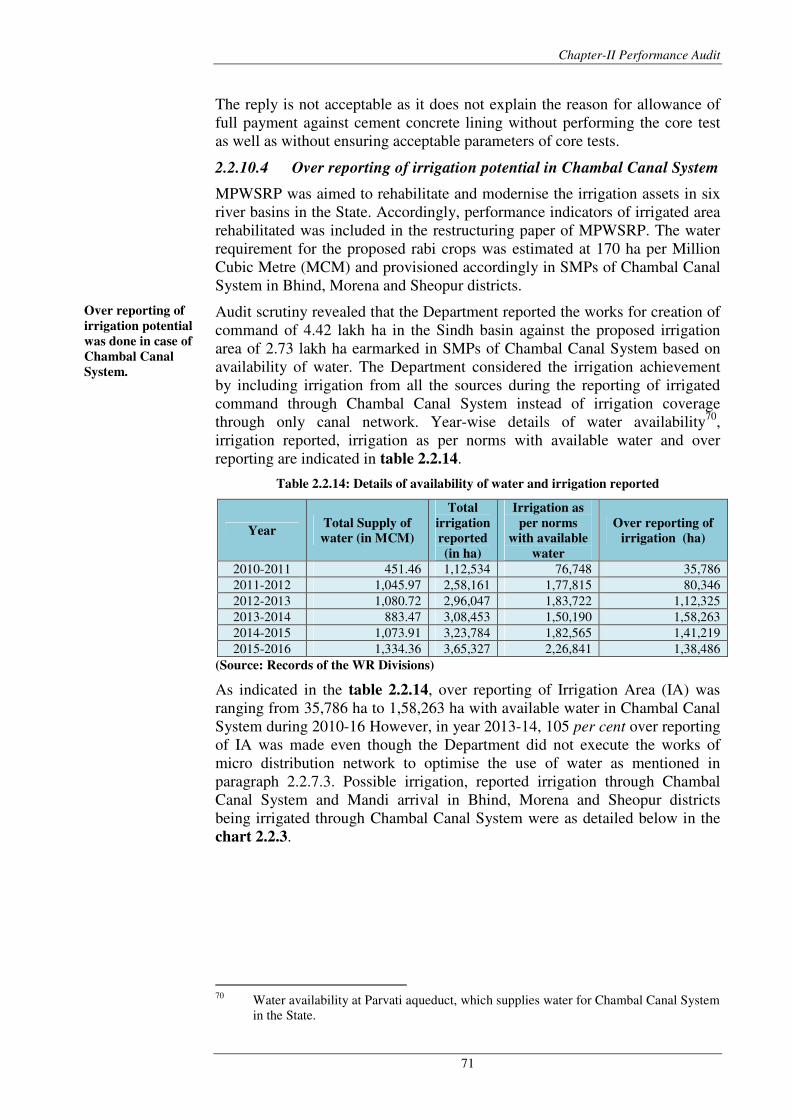
Chapter-II Performance Audit
71
The reply is not acceptable as it does not explain the reason for allowance of
full payment against cement concrete lining without performing the core test
as well as without ensuring acceptable parameters of core tests.
2.2.10.4 Over reporting of irrigation potential in Chambal Canal System
MPWSRP was aimed to rehabilitate and modernise the irrigation assets in six
river basins in the State. Accordingly, performance indicators of irrigated area
rehabilitated was included in the restructuring paper of MPWSRP. The water
requirement for the proposed rabi crops was estimated at 170 ha per Million
Cubic Metre (MCM) and provisioned accordingly in SMPs of Chambal Canal
System in Bhind, Morena and Sheopur districts.
Audit scrutiny revealed that the Department reported the works for creation of
command of 4.42 lakh ha in the Sindh basin against the proposed irrigation
area of 2.73 lakh ha earmarked in SMPs of Chambal Canal System based on
availability of water. The Department considered the irrigation achievement
by including irrigation from all the sources during the reporting of irrigated
command through Chambal Canal System instead of irrigation coverage
through only canal network. Year-wise details of water availability70
,
irrigation reported, irrigation as per norms with available water and over
reporting are indicated in table 2.2.14.
Table 2.2.14: Details of availability of water and irrigation reported
Year Total Supply of
water (in MCM)
Total
irrigation
reported
(in ha)
Irrigation as
per norms
with available
water
Over reporting of
irrigation (ha)
2010-2011 451.46 1,12,534 76,748 35,786
2011-2012 1,045.97 2,58,161 1,77,815 80,346
2012-2013 1,080.72 2,96,047 1,83,722 1,12,325
2013-2014 883.47 3,08,453 1,50,190 1,58,263
2014-2015 1,073.91 3,23,784 1,82,565 1,41,219
2015-2016 1,334.36 3,65,327 2,26,841 1,38,486
(Source: Records of the WR Divisions)
As indicated in the table 2.2.14, over reporting of Irrigation Area (IA) was
ranging from 35,786 ha to 1,58,263 ha with available water in Chambal Canal
System during 2010-16 However, in year 2013-14, 105 per cent over reporting
of IA was made even though the Department did not execute the works of
micro distribution network to optimise the use of water as mentioned in
paragraph 2.2.7.3. Possible irrigation, reported irrigation through Chambal
Canal System and Mandi arrival in Bhind, Morena and Sheopur districts
being irrigated through Chambal Canal System were as detailed below in the
chart 2.2.3.
70
Water availability at Parvati aqueduct, which supplies water for Chambal Canal System
in the State.
Over reporting of
irrigation potential
was done in case of
Chambal Canal
System.
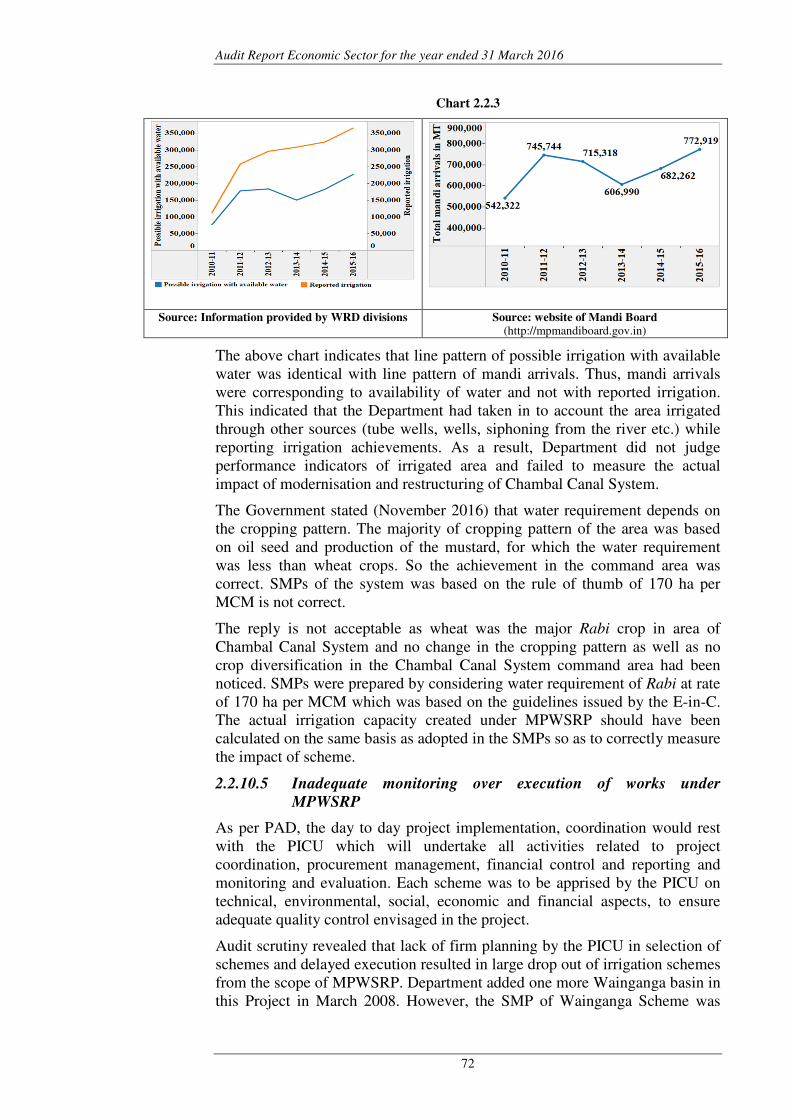
Audit Report Economic Sector for the year ended 31 March 2016
72
Chart 2.2.3
Source: Information provided by WRD divisions Source: website of Mandi Board (http://mpmandiboard.gov.in)
The above chart indicates that line pattern of possible irrigation with available
water was identical with line pattern of mandi arrivals. Thus, mandi arrivals
were corresponding to availability of water and not with reported irrigation.
This indicated that the Department had taken in to account the area irrigated
through other sources (tube wells, wells, siphoning from the river etc.) while
reporting irrigation achievements. As a result, Department did not judge
performance indicators of irrigated area and failed to measure the actual
impact of modernisation and restructuring of Chambal Canal System.
The Government stated (November 2016) that water requirement depends on
the cropping pattern. The majority of cropping pattern of the area was based
on oil seed and production of the mustard, for which the water requirement
was less than wheat crops. So the achievement in the command area was
correct. SMPs of the system was based on the rule of thumb of 170 ha per
MCM is not correct.
The reply is not acceptable as wheat was the major Rabi crop in area of
Chambal Canal System and no change in the cropping pattern as well as no
crop diversification in the Chambal Canal System command area had been
noticed. SMPs were prepared by considering water requirement of Rabi at rate
of 170 ha per MCM which was based on the guidelines issued by the E-in-C.
The actual irrigation capacity created under MPWSRP should have been
calculated on the same basis as adopted in the SMPs so as to correctly measure
the impact of scheme.
2.2.10.5 Inadequate monitoring over execution of works under
MPWSRP
As per PAD, the day to day project implementation, coordination would rest
with the PICU which will undertake all activities related to project
coordination, procurement management, financial control and reporting and
monitoring and evaluation. Each scheme was to be apprised by the PICU on
technical, environmental, social, economic and financial aspects, to ensure
adequate quality control envisaged in the project.
Audit scrutiny revealed that lack of firm planning by the PICU in selection of
schemes and delayed execution resulted in large drop out of irrigation schemes
from the scope of MPWSRP. Department added one more Wainganga basin in
this Project in March 2008. However, the SMP of Wainganga Scheme was
Chapter-II Performance Audit
73
submitted to World Bank after five years in March 2013 i.e. after two years of
initial intended date of completion (March 2011) of MPWSRP.
During the course of audit, several inconsistencies in estimation, tendering and
breach of contract conditions leading to extra/excess payment/ undue benefit/
inadmissible payments etc., were noticed. MPWSRP could not indicate
substantial crop diversification due to inadequate integration with line
departments for improving productivity of irrigation assets thereby affecting
the overall achievement of objective and performance of the project. This
indicated deficient internal control over execution of works and inadequate
monitoring at PICU level.
2.2.11 Conclusions
The MPWSRP was taken up by the WRD with assistance from the World
Bank for restructuring and modernisation of irrigation assets and taking up
different activities by the line Departments in six basins. Due to frequent
changes in the planning, the implementation of the project could not achieve
the objective of balanced and sustainable development of irrigation potential
in all river basins through rehabilitation of major, medium and minor schemes
even after incurring an expenditure of ` 2,498 crore during the project period
of 2004-15.
The project aimed to rehabilitate and modernise 654 existing irrigation
schemes of these five river basins with a total Culturable Command Area of
6.18 lakh hectares. As a result of slow performance of the project, the scope of
MPWSRP was restructured in June 2012 and 362 irrigation schemes were
dropped. Out of the balance 292 schemes, WRD could rehabilitate
228 schemes only by the end of the project.
During 2012-14 the Department incurred 24 per cent of overall expenditure of
MPWSRP on execution of Chambal Canal System. The overemphasis resulted
in basin wise imbalances in irrigation schemes and this, coupled with the delay
in implementation of modernisation plan resulted in exclusion of 362 minor
irrigation scheme from project. CC lining, which was easy for execution
constituted 94 per cent of the expenditure and Chambal Canal System during
2012-14. It also affected the farm level economy of envisaged beneficiaries of
excluded schemes.
Against the estimated provision of ` 144.61 crore in the PIP for the line
departments, actual expenditure was ` 115.05 crore. However, poor
integration with the line departments, absence of sustainable water supply to
farmers and lack of training to WUAs impacted crop diversification.
Agriculture intensification and diversification did not correspond to the
increase in the achievement of irrigated area under MPWSRP. The impact of
sown area of gram, arhar and mustard was taken as an indicator for
agriculture intensification in PIP. Audit scrutiny revealed reduction in sown
areas of gram and arhar during 2014-15 by 20 per cent and 35 per cent
respectively as compared to 2011-12. Further, the sown area of mustard was
reduced in 2014-15 by 19 per cent as compared to 2012-13. Plantation area of
fruits, vegetables and spices remained low ranging from 2.90 per cent to
7.31 per cent, as against the target of 21 per cent of the irrigated area
envisaged in PIP and was even below state average of nine per cent.
Audit Report Economic Sector for the year ended 31 March 2016
74
Provisions of specifications appended with NCB were ignored by Chief
Engineer at the time of according technical sanction, which led to irregular
expenditure of ` 65.18 crore in works for trimming of earthwork and CC
lining of canals, besides, inadequate quality control of works.
Adherence with agreement clauses was not ensured by Executive Engineers
resulting into undue financial benefits to contractor amounting to
` 68.75 crore on inadequate additional security deposit, liquidated damages,
royalty charges and insurance coverage of works.
Provisions of schedule of rates were not followed, as instances of extra cost of
` 24.02 crore due to incorrect lead of metal, incorrect rate for embankment
and inclusion of inadmissible items of blasting and excess payment on account
of shrinkage allowance were noticed.
Quality control and monitoring of the project was inadequate as instances of
not conducting core tests, execution of below specifications works of CC
lining and extension of undue benefits to the contractors were noticed.
2.2.12 Recommendations
The Government should make a firm plan and adequate internal control
mechanism to utilise the available loan in time to avoid the payment of
commitment charges.
The Department agreed with the recommendation as suggested by the Audit.
The Government should adopt concrete criteria for selection of schemes and
distribution of funds throughout the project to avoid slippage in scheme
coverage and delays in their execution.
The Department agreed with the recommendation as suggested by the Audit.
The Government should ensure strict adherence with provisions of SMPs for
the execution of micro distribution network along with modernisation work of
main canal for optimal utilisation of water by end user.
The Department agreed with the recommendation as suggested by the Audit.
The Government should strengthen internal control system for strict adherence
with contract management for ensuring recovery of extra cost/ excess
payments, penalty for delay, deduction of additional security deposit and
insurance coverage of works from the defaulting contractors in order to
safeguard its interest.
The Department agreed with the recommendation as suggested by the Audit.
The Government should consider making suitable arrangements for third party
supervision of works and strengthening quality control mechanism for
conducting the quality tests to ensure execution of works according to the laid
down specifications.
The Department agreed with the recommendation as suggested by the Audit.