Embed Size (px)
Citation preview

125
2.3.1.1. Cannabis herb
Production is globally dispersed
Over the 1992-2002 period, 79 countries providedUNODC with cannabis production estimates, indicat-ing that cannabis production took place on their terri-tory. The total number of cannabis producing countriesis, however, still larger. Ninety four countries providinginformation on the origin of seized cannabis herb cited82 different source countries for the year 2002. Overthe 1998-2002 period, 111 cannabis herb source coun-tries were identified with this approach. If cannabisplant seizures are used as an indicator of domesticcannabis production (the plant as such is not usuallyshipped across borders), 124 source countries over the1998-2002 were identified, or 142 source countries overthe 1992-2002 period.
Based on the number of countries which providedcannabis production estimates and cannabis plantseizures to UNODC, data suggest that the majority ofcannabis source countries are located in the Americas.The largest number of countries cited as a source forcannabis herb by other countries are, however, found inAfrica. At the same time, data also show that thecannabis source countries are distributed across theworld fairly evenly, clearly showing that cannabis pro-duction is a truly global problem.
Nonetheless, some concentrations can be identified.North America seems to be the world's largest cannabismarket, accounting for 2/3 of global cannabis herbseizures over the 2001-2002 period. US authoritiesreport that two thirds of cannabis herb is domesticallyproduced. Out of cannabis herb imports into the USA,63% came from Mexico and 23% from Canada in2002. Mexico reported that 95% of the cannabis herbon its market came from domestic sources; 5% was
imported from Guatemala. The Canadian authoritiesreported all seized cannabis herb as having originatedfrom domestic sources.
In South America, Colombia is a main source country(for Venezuela and several other countries in the Amer-icas). In addition, Paraguay seems to play a key role insupplying the markets of Brazil, Argentina (99%),Uruguay (100%) and Chile (79%). Local productionalso takes place in all of these countries. Jamaica is fre-quently mentioned as a major source country in theCaribbean region. In addition, significant levels of
2.3. Cannabis market
2.3.1. Production
Fig. 90: Spread of cannabis production around theworld
6
26
31
2
21
33
30
25
14
17
24
24
39
40
0 10 20 30 40
Oceania
Asia
Africa
Europe
Americas
Number of countriesCountries providing cannabis production estimates to UNODC1992-2002Countries reported by other countries as a source country,1998-2002
Countries reporting cannabis plant seizures to UNODC, 19922002
Source: UNODC, Annual Reports Questionnaire Data / DELTA.

domestic cannabis production seem to take place inother countries of the Caribbean region as well. Practi-cally all of the Central American countries are men-tioned as major source countries for cannabis herbwithin Central America.
Cannabis production in Africa is reported from practi-cally every country. There are also important move-ments of cannabis herb across borders in Africa.Significant source countries in central and westernAfrica are - inter alia - Ghana, Nigeria, Cameroon,Côte d'Ivoire, the Democratic Republic of Congo,Congo and Senegal; in southern Africa: the Republic ofSouth Africa, Malawi, Lesotho, Swaziland and Zambia;in eastern Africa: Tanzania, Uganda and Kenya; and innorthern Africa: Egypt and Morocco. Cannabis herbexports to Europe are mainly from countries in WesternAfrica (notably for exports to France) and from theRepublic of South Africa (notably for exports to theUK, Ireland and Belgium).
Most countries in Europe also report domestic produc-tion of cannabis. The most frequently cited sourcecountry in Europe is Albania which supplies most coun-tries in the Balkan region (Bulgaria, FYR of Macedonia,Serbia and Montenegro, Croatia) as well as Greece, Italy,Slovenia, Austria and Sweden. The Netherlands was thesecond most frequently cited source country in Europein 2002. In addition, criminal groups importingcannabis herb from the Russian Federation were identi-fied as the main source of the cannabis herb by severalEast European countries. The Central State DrugsCommittee of the Russian Federation estimated, how-ever, that only 30% of the cannabis herb on its marketwas of Russian origin; 70% was from Kazakhstan.
In Central Asia all of the countries reported cannabis tohave been of domestic origin, with Russia being themain export market. In the countries of the Near andMiddle East, Lebanon and Egypt were identified as themain source countries. Lebanon was also the mainsource for cannabis found in Turkey. The main sourcecountry in South Asia is India. The main source coun-tries in South-East Asia are Cambodia, Thailand and the
Philippines. With regard to cannabis herb exports fromSouth-East Asia to Europe, Thailand was most fre-quently mentioned in 2002.
Most of the cannabis herb in the Oceania region is ofdomestic origins. In addition, North America (33% ofimports) and the UK (20% of imports) were mentionedas source countries.
Production has been rising and may have reached some32,000 tons in 2002
Previous UNDCP estimates for the mid 1990s sug-gested that global cannabis production (cannabis herband cannabis resin, expressed in cannabis herb equiva-lents) was around 30,000r tons. More recent estimatesseem to confirm these orders of magnitude, thoughshowing slightly higher figures.
According to US government estimates cannabis herbproduction outside the USA was around 15,400 tons in2002, up from 11,200 tons in 1999s. Annual produc-tion of marijuana in the USA was estimated by the USauthorities to amount to more than 10,000t tons in2001/2002. This would result in a global cannabis herbproduction of more than 25,000 tons. This includes anestimate for cannabis herb production of 3,500 tons forcountries other than the USA, Mexico and Colombia.The latter estimate, however, appears to be rather con-servative. US authorities also reckon that "there may beconsiderable amounts of undetected cannabis cultiva-tion in Central and East Asia, and on the African con-tinent.u" Estimates provided by member states over thelast few years to UNODC suggest that the latter figurecould be substantially higher, probably close to 9,000tons (still conservatively estimated). Global cannabisherb production could thus amount to some 32,000tons. (This is a tentative estimate which could changesubstantially as more information becomes available).
If available estimates from various sources are com-bined, data show a strong decline of cannabis herb pro-duction over the 1989-1992 period, followed by anincrease over the subsequent decade so that globalcannabis herb production in 2002 has again reached
126
World Drug Report 2004 Volume I. Analysis
r) UNDCP, “Cannabis as an Illicit Narcotic Crop: A review of the Global Situation of Cannabis Consumption, Trafficking and Production" inUNDCP, Bulletin on Narcotics, Double Issue on Cannabis: Recent Development, Vol XLIX No. 1 and 2, 1997 and Vol. L, Nos. 1 and 2, 1998, pp.45-83.
s) Department of State, International Narcotics Control Strategy Report, March 2003. t) ONDCP, National Drug Control Strategy, February 2003, p. 30. u) A survey conducted in 1998 in Kazakhstan revealed a (minimum) harvest of 1,517 tons (though the potential harvest could have been as high as
148,000 tons). The (minimum) production in Kyrgyzstan amounted to 677 tons (with a potential production of 4250 tons). Paraguay reportedthe production of 1,415 tons (1998), the Philippines 1,353 tons (2000), Brazil 1,110 tons (2000); India 663 tons (1998), Indonesia 512 tons(1997), South Africa 467 tons (2002), Lebanon 218 tons (2000), Swaziland 210 tons (2001), Nigeria 200 tons (1999), Malawi 175 tons (2000),Guatemala 150 tons (2000), Kenya 130 tons (1999), the Russian Federation 90 tons (1999), Honduras 52 tons (2002), Thailand 25 tons (1997),Tanzania 22 tons (1992), Uganda 21 tons (1999), etc.

levels similar to the late 1980s. It may also be interest-ing to note that the trend of global cannabis herbseizures exhibits a very similar pattern over the sameperiod.
A global production of 32,000 tons of cannabis herbwould result in a global interception rate of 15%. Anestimate of 32,000 tons is thus probably a minimumestimate. A production any lower than this would mean
an even higher interception rate - which does not seemto be very likely in the case of cannabis. An estimate of32,000 tons would be equivalent to an average annualconsumption of around 220 grams of cannabis herb percannabis user.
It should be noted that the current production estimatesdo not tally with consumption estimates for individualcountries. Supply side estimates for the USA, forinstance, see a cannabis herb market (including imports)of close to 18,000 tons (range: 10,000 to 24,000 tons)for 2001/2002, consisting of a domestic production ofmore than 10,000 tons and imports of more than 7,000tons. Consumption based estimates see a cannabis herbmarket of around 1,000 tons for the USAv. Thus far,this discrepancy has not been resolved.
127
2. Trends Cannabis market
Sources: United States Department of State, International Narcotics Control Strategy Report, March 2003, Drug Availability SteeringCommittee, Drug Availability Estimates in the United States, December 2002, Office on National Drug Control Policy, National DrugControl Strategy, February 2003, UNODC, Annual Reports Questionnaire Data.
Country mid range estimates
USA* 11,150 5,577 16,731
Mexico 7,900
Colombia 4,000
Others (conservative estimate) 3,500
Sub-total (based on US estimates) 26,550 20,900 43,300
Others (not included above) 5,500
Total (rounded) 32,000
range:
Table 9: Cannabis herb production in 2002 in metric tons
Fig. 91: Global cannabis herb production estimates,1988/89 - 2002
6,000 6,50011,150
27,105
13,20811,200
15,400
0
10,000
20,000
30,000
40,000
1988/89 1992 1999* 2002
ton
s
Adjustment of non-US productionNon-US production (US estimates)US production Total
* tentative estimate of US production in 1999.
Sources: United States Department of State, InternationalNarcotics Control Strategy Report, March 2003, Drug AvailabilitySteering Committee, Drug Availability Estimates in the UnitedStates, December 2002, Office on National Drug Control Policy,National Drug Control Strategy, February 2003, UNODC, AnnualReports Questionnaire Data.
Fig. 92: Global cannabis herb seizures, 1989-2002
0
1,000
2,000
3,000
4,000
5,000
89 90 91 92 93 94 95 96 97 98 99 00 01 02
ton
s
Seizures Trend
Source: UNODC, Annual Reports Questionnaire Data / DELTA.
v) Drug Availability Steering Committee, Drug Availability Estimates in the United States, December 2002.
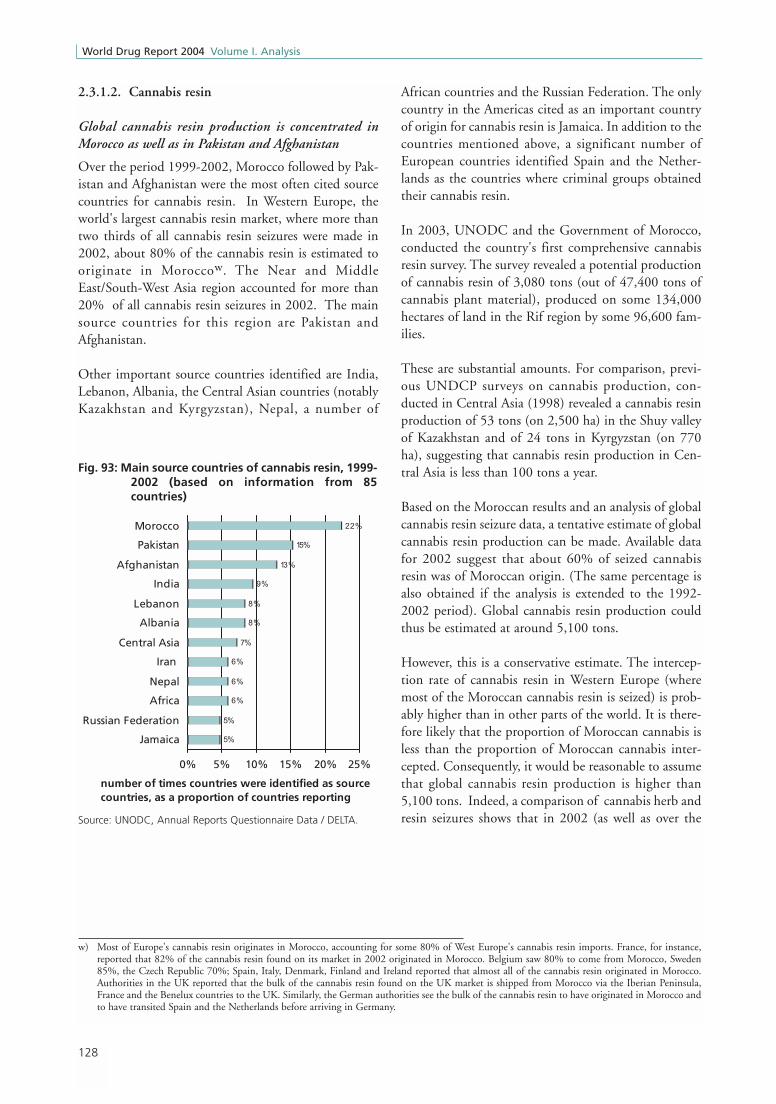
2.3.1.2. Cannabis resin
Global cannabis resin production is concentrated inMorocco as well as in Pakistan and Afghanistan
Over the period 1999-2002, Morocco followed by Pak-istan and Afghanistan were the most often cited sourcecountries for cannabis resin. In Western Europe, theworld's largest cannabis resin market, where more thantwo thirds of all cannabis resin seizures were made in2002, about 80% of the cannabis resin is estimated tooriginate in Moroccow. The Near and MiddleEast/South-West Asia region accounted for more than20% of all cannabis resin seizures in 2002. The mainsource countries for this region are Pakistan andAfghanistan.
Other important source countries identified are India,Lebanon, Albania, the Central Asian countries (notablyKazakhstan and Kyrgyzstan), Nepal, a number of
African countries and the Russian Federation. The onlycountry in the Americas cited as an important countryof origin for cannabis resin is Jamaica. In addition to thecountries mentioned above, a significant number ofEuropean countries identified Spain and the Nether-lands as the countries where criminal groups obtainedtheir cannabis resin.
In 2003, UNODC and the Government of Morocco,conducted the country's first comprehensive cannabisresin survey. The survey revealed a potential productionof cannabis resin of 3,080 tons (out of 47,400 tons ofcannabis plant material), produced on some 134,000hectares of land in the Rif region by some 96,600 fam-ilies.
These are substantial amounts. For comparison, previ-ous UNDCP surveys on cannabis production, con-ducted in Central Asia (1998) revealed a cannabis resinproduction of 53 tons (on 2,500 ha) in the Shuy valleyof Kazakhstan and of 24 tons in Kyrgyzstan (on 770ha), suggesting that cannabis resin production in Cen-tral Asia is less than 100 tons a year.
Based on the Moroccan results and an analysis of globalcannabis resin seizure data, a tentative estimate of globalcannabis resin production can be made. Available datafor 2002 suggest that about 60% of seized cannabisresin was of Moroccan origin. (The same percentage isalso obtained if the analysis is extended to the 1992-2002 period). Global cannabis resin production couldthus be estimated at around 5,100 tons.
However, this is a conservative estimate. The intercep-tion rate of cannabis resin in Western Europe (wheremost of the Moroccan cannabis resin is seized) is prob-ably higher than in other parts of the world. It is there-fore likely that the proportion of Moroccan cannabis isless than the proportion of Moroccan cannabis inter-cepted. Consequently, it would be reasonable to assumethat global cannabis resin production is higher than5,100 tons. Indeed, a comparison of cannabis herb andresin seizures shows that in 2002 (as well as over the
128
World Drug Report 2004 Volume I. Analysis
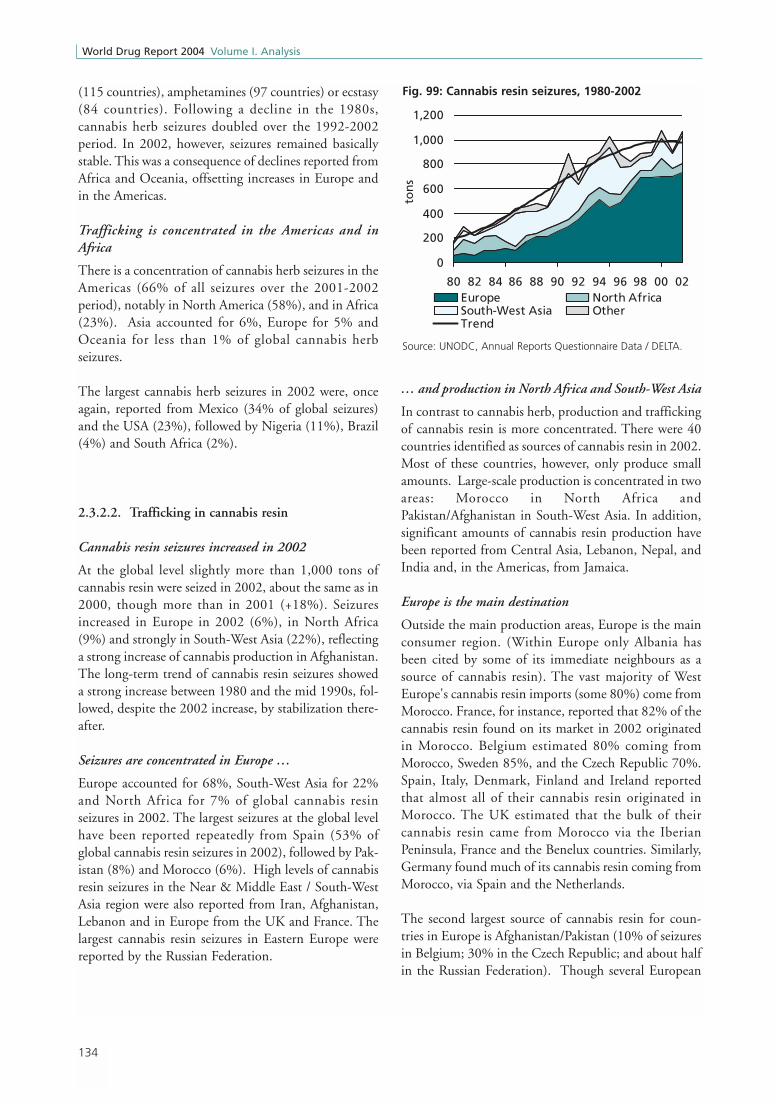
Fig. 93: Main source countries of cannabis resin, 1999-2002 (based on information from 85countries)
5%
5%
6%
6%
6%
7%
8%
8%
9%
13%
15%
22%
0% 5% 10% 15% 20% 25%
Jamaica
Russian Federation
Africa
Nepal
Iran
Central Asia
Albania
Lebanon
India
Afghanistan
Pakistan
Morocco
number of times countries were identified as source countries, as a proportion of countries reporting
Source: UNODC, Annual Reports Questionnaire Data / DELTA.
w) Most of Europe's cannabis resin originates in Morocco, accounting for some 80% of West Europe's cannabis resin imports. France, for instance,reported that 82% of the cannabis resin found on its market in 2002 originated in Morocco. Belgium saw 80% to come from Morocco, Sweden85%, the Czech Republic 70%; Spain, Italy, Denmark, Finland and Ireland reported that almost all of the cannabis resin originated in Morocco.Authorities in the UK reported that the bulk of the cannabis resin found on the UK market is shipped from Morocco via the Iberian Peninsula,France and the Benelux countries to the UK. Similarly, the German authorities see the bulk of the cannabis resin to have originated in Morocco andto have transited Spain and the Netherlands before arriving in Germany.

1998-2002 period) cannabis resin seizures amounted to23% of cannabis herb seizures. Applying the estimate of32,000 tons for cannabis herb, the corresponding pro-duction figure for cannabis resin could be around 7,400tons. Based on this estimate Morocco would account forsome 40% of global cannabis resin production, but lessthan 10% of global cannabis herb and resin productiontaken together.
129
2. Trends Cannabis market
Table 10: Tentative estimates of global cannabis resin production, 2003
Western Europe 732 80% 585
North Africa 71 90% 64
Seizures related to Moroccan cannabis resin 649
Global seizures 1,073
in % 60%
Cannabis resin production in tons 60% 3,080
Estimate of global cannabis resin production, rounded 5,100
Cannabis seizures in tons (2002 data ) 4,741 1,076 23%
Cannabis production estimates, rounded 32,000 23% 7,400
Sources: UNODC, Annual Reports Questionnaire Data
Seizures in tons (2002)
Cannabis resin production in
tons
Cannabis resinCannabis resin production in
tons
2. Estimate based on cannabis herb estimates and seizures
Cannabis herb Proportion
1. Estimate based on Moroccan cannabis resin production and seizures
Estimated proportion related to cannabis resin originating in
Morocco
Potential seizures related to Moroccan
cannabis in tons

Cannabis is the most extensively trafficked drug world-wide
The two cannabis products, cannabis herb (marijuana)and cannabis resin (hashish) remain the most exten-sively trafficked drugs worldwide. Practically all thecountries of the world are affected by cannabis traffick-ing. Seizures of cannabis exceed those of other drugs inalmost all countries. In 2002, a total of some 5,800 tonsof cannabis products were seized globally. This totalincludes more than 4,700 tons of cannabis herb, morethan 1,000 tons of cannabis resin and more than 1 tonof cannabis oil. The volume of seized cannabis productswas more than 15 times the volume of cocaine and morethan 100 times the amount of heroin seized.
Cannabis herb seizures were stable but cannabis resinseizures rose in 2002
The upward trend in cannabis seizures, which began inthe early 1990s, continued in 2002. Cannabis herbseizures remained generally stable, but cannabis resinseizures increased in 2002, offsetting the declinereported the previous year. Overall cannabis seizureswere almost twice as high in 2002 as a decade earlier.
Cannabis seizures concentrated in the Americas and inAfrica
Over the 2001-2002 period, 55% of all cannabisseizures were reported from the Americas, 20% fromAfrica, 16% from Europe, 9% from Asia and less than
1% from Oceania. In 2002 cannabis seizures fell inOceania and in Africa but increased in Asia, the Amer-icas and in Europe.
2.3.2.1. Trafficking in Cannabis herb
Cannabis herb seizures rose strongly in recent years, butwere stable in 2002
Cannabis herb is by far the most widely trafficked drugworldwide. Over the 2000-2002 period, 169 countriesreported seizures of cannabis herb, more than heroin(143 countries), cocaine (140 countries), cannabis resin
130
World Drug Report 2004 Volume I. Analysis
2.3.2. Trafficking
Fig. 94: Cannabis seizures, 1985-2002
0
1,000
2,000
3,000
4,000
5,000
6,000
85 87 89 91 93 95 97 99 01
ton
s
Cannabis resin Cannabis herb Trend
Source: UNODC, Annual Reports Questionnaire Data / DELTA.
Fig. 95: Cannabis seizures, regional distribution,1985-2002
0
1,000
2,000
3,000
4,000
5,000
6,000
85 87 89 91 93 95 97 99 01
ton
s
Americas Europe AsiaAfrica Oceania Trend
Source: UNODC, Annual Reports Questionnaire Data / DELTA.
Fig. 96: Cannabis herb seizures, 1985-2002
0
1,000
2,000
3,000
4,000
5,000
85 87 89 91 93 95 97 99 01
ton
s
Americas Africa EuropeAsia Oceania Trend
Source: UNODC, Annual Reports Questionnaire Data / DELTA.

131
2. Trends Cannabis market
Year 1992 1993 1994 1995 1996 1997 1998 1999 2000 2001 2002
Metric tons 2,355 3,361 2,359 3,211 3,078 195 2,985 3,992 4,544 4,678 4,741
1,633,326
1,110,525
506,846
194,080
104,978
93,507
93,477
90,411
77,738
76,998
68,346
61,291
49,537
26,741
23,920
21,893
20,920
27,137
29,848
44,824
42,675
48,141
- 200,000 400,000 600,000 800,000 1,000,000 1,200,000 1,400,000 1,600,000 1,800,000
Mexico
United States
Nigeria
Brazil
South Africa
Morocco
India
United Republic of Tanzania
Kenya
Colombia
Pakistan
Indonesia
Puerto Rico
Paraguay
Argentina
Netherlands
Russian Federation
Jamaica
United Kingdom
Belgium
Switzerland
Venezuela
34%
23%
11%
4%
2%
2%
2%
2%
2%
526,148
408,114
175,664
163,043
23,304
5,918
5,735
110,804
141,894
65,204
81,117
87,036
93,507
96,604
2,757,130
-
500,0
00
1,000,
000
1,500,
000
2,000,
000
2,500,
000
3,000,
000
North America
West and Central Africa
South America
East Africa
Western Europe
Southern Africa
Caribbean
South Asia
North Africa
Near and Middle East /South-West Asia
East and South-East Asia
Eastern Europe
Central Asia and Transcaucasian countries
Oceania
Central America
(58%)
(9%)
(4%)
(3%)
(3%)
(11%)
(2%)
SEIZURES OF CANNABIS HERB in % of world total and kg- HIGHEST RANKING COUNTRIES - 2002
SEIZURES OF CANNABIS HERB in kg and % - BY REGION - 2002
0
500
1,000
1,500
2,000
2,500
3,000
3,500
4,000
4,500
5,000
1992 1993 1994 1995 1996 1997 1998 1999 2000 2001 2002
Metr
ic t
on
s
Fig. 97: Global seizures of cannabis herb, 1992 -2002
* data refer to 2001.
*

132
World Drug Report 2004 Volume I. Analysis
CANNABIS HERB INTERCEPTED - ASIA - 1992-2002
0
100
200
300
400
500
1992 1993 1994 1995 1996 1997 1998 1999 2000 2001 2002
met
ric
ton
s
CANNABIS HERB INTERCEPTED - WORLD -1992-2002
0
1000
2000
3000
4000
5000
1992 1993 1994 1995 1996 1997 1998 1999 2000 2001 2002
met
ric
ton
s
CANNABIS HERB INTERCEPTED - AMERICAS - 1992-2002
0
1000
2000
3000
4000
1992 1993 1994 1995 1996 1997 1998 1999 2000 2001 2002
met
ric
ton
s
CANNABIS HERB INTERCEPTED - EUROPE - 1992-2002
0
100
200
300
400
500
1992 1993 1994 1995 1996 1997 1998 1999 2000 2001 2002
met
ric
ton
s
CANNABIS HERB INTERCEPTED - AFRICA - 1992-2002
0
400
800
1200
1600
1992 1993 1994 1995 1996 1997 1998 1999 2000 2001 2002
met
ric
ton
s
CANNABIS HERB INTERCEPTED - OCEANIA - 1992-2002
0.0
0.4
0.8
1.2
1.6
1992 1993 1994 1995 1996 1997 1998 1999 2000 2001 2002
met
ric
ton
s
Fig. 98: Global seizures of cannabis herb, 1992 -2002

133
2. Trends Cannabis market
9
67
Au
stra
lia
Car
ibb
ean
Ven
ezu
ela
Ca
na
da
Bra
zil
Bo
livia
Suri
nam
eC
entr
al A
mer
ica
Mex
ico
Peru C
hile
Uru
gu
ay
Para
gu
ay
Arg
enti
na
Ecua
dor
Sou
th A
fric
a
Zim
bab
we
Mal
awi
Zam
bia
Bo
tsw
ana
Nam
ibia
Tanz
ania
Ken
yaSom
alia
Beni
n
Togo
Gha
na
Nig
eria
Cote
d’Iv
oire
Gam
bia
Ug
and
a
Co
ng
o
Rwan
da
Eth
iop
ia
Sri L
anka
Ind
ia
Ban
gla
des
h
Nep
al
Ind
ia
Ku
wai
t
Mya
nm
ar
Thai
lan
d Ind
on
esiaM
alay
sia
Ho
ng
Ko
ng
SA
R, C
hin
a
Phili
pp
ines
Ch
ina
Jap
anK
ore
a R
ep.
Lao
PD
R
Isra
el
Syri
aTu
rkey
New
Zea
lan
d
Eu
rop
ea
nU
nio
n/E
FTA
Ea
ste
rnE
uro
pe
(exclu
din
gC
.I.S
)
Ru
ssia
nF
ed
era
tio
n Ka
za
kh
sta
n
Kyr
gyz
stan
Uzb
ekis
tan
Aze
rbai
jan
Tajik
ista
n
Paki
stan
Sau
di A
rab
ia
Swaz
ilan
d
Mo
zam
biq
ue
Leso
tho
Mai
n tr
affi
ckin
g ro
utes
Oth
er T
raff
icki
ng r
oute
sCa
nnab
is h
erb
seiz
ures
rep
orte
dto
UN
OD
C (1
998-
2002
)
Se
izu
res
Tre
nd
(2
00
1-2
00
2)
Sta
ble
(+
/- 1
0%
)
Incr
ea
se
(>1
0%
)
De
cre
ase
(>
10
%)
10
0
5.0
Vo
lum
e in
me
tric
to
ns
1.7
Co
lom
bia
Sen
egal
Mo
rocc
o
Cam
ero
on
Un
ited
Sta
tes
of
Am
eric
a
0.6
11
1
13
0.2
1.5
3
1,6
33
1,1
10
19
4
48
77
21 9
0.2
0.2
0.1
0.4
0.6
0.7
0.4
5
5
4
6
94
93
68
12
6
32
2
50
7
158
35
0.3
1.1
1.3
0.8
1
17
30
1.7
0.5
0.9
1
10
5
907
8
1.6
11
046
0.6
1.4
0.2
0.3
5
61
12
7
0.6
45
0.9
3
1.9
Map
15:
Can
nab
is h
erb
sei
zure
s 20
01 -
200
2: e
xten
t an
d t
ren
ds
(cou
ntrie
s re
port
ing
seiz
ures
of
mor
e th
an 1
0 kg
.)
Not
e: R
oute
s sh
own
are
not
nece
ssar
ily d
ocum
ente
d ac
tual
rou
tes,
but
are
rat
her
gene
ral i
ndic
atio
ns o
f th
e di
rect
ions
of
illic
it dr
ug f
low
s.
134
World Drug Report 2004 Volume I. Analysis
(115 countries), amphetamines (97 countries) or ecstasy(84 countries). Following a decline in the 1980s,cannabis herb seizures doubled over the 1992-2002period. In 2002, however, seizures remained basicallystable. This was a consequence of declines reported fromAfrica and Oceania, offsetting increases in Europe andin the Americas.
Trafficking is concentrated in the Americas and inAfrica
There is a concentration of cannabis herb seizures in theAmericas (66% of all seizures over the 2001-2002period), notably in North America (58%), and in Africa(23%). Asia accounted for 6%, Europe for 5% andOceania for less than 1% of global cannabis herbseizures.
The largest cannabis herb seizures in 2002 were, onceagain, reported from Mexico (34% of global seizures)and the USA (23%), followed by Nigeria (11%), Brazil(4%) and South Africa (2%).
2.3.2.2. Trafficking in cannabis resin
Cannabis resin seizures increased in 2002
At the global level slightly more than 1,000 tons ofcannabis resin were seized in 2002, about the same as in2000, though more than in 2001 (+18%). Seizuresincreased in Europe in 2002 (6%), in North Africa(9%) and strongly in South-West Asia (22%), reflectinga strong increase of cannabis production in Afghanistan.The long-term trend of cannabis resin seizures showeda strong increase between 1980 and the mid 1990s, fol-lowed, despite the 2002 increase, by stabilization there-after.
Seizures are concentrated in Europe …
Europe accounted for 68%, South-West Asia for 22%and North Africa for 7% of global cannabis resinseizures in 2002. The largest seizures at the global levelhave been reported repeatedly from Spain (53% ofglobal cannabis resin seizures in 2002), followed by Pak-istan (8%) and Morocco (6%). High levels of cannabisresin seizures in the Near & Middle East / South-WestAsia region were also reported from Iran, Afghanistan,Lebanon and in Europe from the UK and France. Thelargest cannabis resin seizures in Eastern Europe werereported by the Russian Federation.
… and production in North Africa and South-West Asia
In contrast to cannabis herb, production and traffickingof cannabis resin is more concentrated. There were 40countries identified as sources of cannabis resin in 2002.Most of these countries, however, only produce smallamounts. Large-scale production is concentrated in twoareas: Morocco in North Africa andPakistan/Afghanistan in South-West Asia. In addition,significant amounts of cannabis resin production havebeen reported from Central Asia, Lebanon, Nepal, andIndia and, in the Americas, from Jamaica.
Europe is the main destination
Outside the main production areas, Europe is the mainconsumer region. (Within Europe only Albania hasbeen cited by some of its immediate neighbours as asource of cannabis resin). The vast majority of WestEurope's cannabis resin imports (some 80%) come fromMorocco. France, for instance, reported that 82% of thecannabis resin found on its market in 2002 originatedin Morocco. Belgium estimated 80% coming fromMorocco, Sweden 85%, and the Czech Republic 70%.Spain, Italy, Denmark, Finland and Ireland reportedthat almost all of their cannabis resin originated inMorocco. The UK estimated that the bulk of theircannabis resin came from Morocco via the IberianPeninsula, France and the Benelux countries. Similarly,Germany found much of its cannabis resin coming fromMorocco, via Spain and the Netherlands.
The second largest source of cannabis resin for coun-tries in Europe is Afghanistan/Pakistan (10% of seizuresin Belgium; 30% in the Czech Republic; and about halfin the Russian Federation). Though several European
Fig. 99: Cannabis resin seizures, 1980-2002
0
200
400
600
800
1,000
1,200
80 82 84 86 88 90 92 94 96 98 00 02
ton
s
Europe North AfricaSouth-West Asia OtherTrend
Source: UNODC, Annual Reports Questionnaire Data / DELTA.

135
2. Trends Cannabis market
countries cite Pakistan (and not Afghanistan) as asource, the Pakistani authorities estimate that much ofthe cannabis resin found on their market originates inAfghanistan. Iran also reported a strong increase ofcannabis resin imports from Afghanistan in recent years.Turkey reported that traffickers obtained cannabis resinin Iran for final destination in Germany. Afghancannabis resin also leaves the country via its northernborders. Tajikistan reported that 80% of seized cannabisresin, which originates almost exclusively fromAfghanistan, was destined for the Russian Federationand a further 10% for other Central Asian countries.
Cannabis resin produced in Central Asia also plays animportant role in the CIS region. The Russian authori-ties estimate that about 30% of cannabis resin importedinto their country originates Kazakhstan and 20% inKyrgyzstan. Some 30% of imports are destined for re-export to the Baltic countries. This is confirmed indi-rectly by reports from some of the Baltic countries.Lithuania, for instance, reported that 50% of thecannabis resin on its market originated in Central Asia.(Estonia, in contrast, reported that the bulk of cannabisresin seized in the country was shipped via Spain). Somecannabis resin is re-exported from Russia to the CzechRepublic as well as to the Netherlands and the UK.Overall cannabis resin exports to Europe are estimatedto amount to some 10% of Russian Federation’s totalsupply (domestic production and imports).
Trafficking to other regions remains limited
Trafficking of cannabis resin to other regions remainslimited. Just 3% of global cannabis resin seizures weremade in countries outside Europe, South-West Asia andNorth Africa in 2002. Of these other regions, the largesttrafficking areas are South Asia, followed by EasternAfrica. Cannabis resin trafficked in South Asia origi-nates mainly in Pakistan and in Nepal. Cannabis resinfound in Eastern Africa was reported to have beensmuggled from Pakistan and India.
Most of the cannabis resin found in Oceania is shippedto Australia via Europe (mainly via the UK, Spain andthe Netherlands). Similarly, most of the cannabis resinin the USA was reported to have been trafficked viaEurope (90% via the Netherlands) to the USA. Ship-ments via Canada accounted for 5% of all cannabisresin imports. The main source for Canada's cannabisresin was reported to be Pakistan. Jamaica was reportedto be the main source for cannabis resin in theCaribbean region.

136
World Drug Report 2004 Volume I. Analysis
Year 1992 1993 1994 1995 1996 1997 1998 1999 2000 2001 2002
Metric tons 665 846 901 1,030 877 818 895 898 1,081 907 1,073
564,809
85,126
66,394
64,166
58,997
50,836
50,314
28,670
28,600
19,979
7,022
5,298
5,003
2,148
1,866
1,424
1,318
2,635
2,893
3,315
3,127
4,487
- 100,000 200,000 300,000 400,000 500,000 600,000
Spain
Pakistan
Morocco
Iran (Islamic Republic of)
United Kingdom
France
Afghanistan
Lebanon
Italy
Sri Lanka
Portugal
Belgium
Germany
India
Ireland
United Arab Emirates
Israel
Denmark
Algeria
United Republic of Tanzania
Russian Federation
Switzerland
53%
8%
6%
6%
6%
5%
5%
3%
3%
2%
731,636
236,215
70,600
25,322
2,063
1,886
1,744
1,341
780
752
560
238
56
2
-
-
,0
00
,0
00
,0
00
,0
00
,0
00
,0
00
,0
00
,0
00
Western Europe
Near and Middle East /South-West Asia
North Africa
South Asia
Eastern Europe
East Africa
Southern Africa
South America
North America
East and South-East Asia
Caribbean
Central Asia and Transcaucasian countries
Oceania
West and Central Africa
Central America
(68%)
(7%)
(2%)
(22%)
SEIZURES OF CANNABIS RESIN in % of world total and kg- HIGHEST RANKING COUNTRIES - 2002
SEIZURES OF CANNABIS RESIN in kg and % - BY REGION - 2002
0
200
400
600
800
1000
1200
1992 1993 1994 1995 1996 1997 1998 1999 2000 2001 2002
Met
ric
ton
sFig. 100: Global seizures of cannabis resin, 1992 - 2002
*
* data refer to 2001.

137
2. Trends Cannabis market
CANNABIS RESIN INTERCEPTED - ASIA 1992-2002
0
50
100
150
200
250
300
350
400
450
1992 1993 1994 1995 1996 1997 1998 1999 2000 2001 2002
met
ric
ton
s
CANNABIS RESIN INTERCEPTED - WORLD 1992-2002
0
200
400
600
800
1000
1200
1992 1993 1994 1995 1996 1997 1998 1999 2000 2001 2002
met
ric
ton
s
CANNABIS RESIN INTERCEPTED - AMERICAS 1992-2002
0
10
20
30
40
50
60
70
80
1992 1993 1994 1995 1996 1997 1998 1999 2000 2001 2002
met
ric
ton
s
CANNABIS RESIN INTERCEPTED - EUROPE 1992 -2002
0
100
200
300
400
500
600
700
800
1992 1993 1994 1995 1996 1997 1998 1999 2000 2001 2002
met
ric
ton
s
CANNABIS RESIN INTERCEPTED - AFRICA 1992-2002
020406080
100120140160180200
1992 1993 1994 1995 1996 1997 1998 1999 2000 2001 2002
met
ric
ton
s
CANNABIS RESIN INTERCEPTED - OCEANIA 1992 -2002
0
1
2
3
4
5
6
7
8
1992 1993 1994 1995 1996 1997 1998 1999 2000 2001 2002
met
ric
ton
s
Fig. 101: Cannabis interception

138
World Drug Report 2004 Volume I. Analysis
Mai
n tr
affi
ckin
g ro
utes
Oth
er t
raff
icki
ng r
oute
s
0.6
Se
izu
res
Tre
nd
(2
00
1-2
00
2)
Stab
le
(+/-
10%
)
Incr
ease
(>
10%
)
Dec
reas
e (>
10%
)
50
Vo
lum
e in
me
tric
to
ns
0.0
6Icel
and
Mo
rocc
o
Tun
isia
73
0
66
Turk
ey
East
ern
Eu
rop
e ex
cl. C
.I.S
Egyp
t
Ben
in
Leb
ano
n
Isra
el
0.0
1
Alg
eria
2.1
Jord
an
Un
ited
Ara
b E
mir
ates
Ru
ssia
n F
eder
atio
n
29
2.9
1.1
0.9
1.4
1
0.6
0.0
2
Pa
kis
tan N
epa
l
Afg
ha
nis
tan
Ka
za
kh
sta
n
Uzb
ekis
tan
Th
aila
nd
Ind
ia
Sri
La
nka
Ke
nya
Iran,
I.R
.
Qat
ar 0.0
50
.05
Yem
en
Syri
a0
.04
0.2
85
50
64
20
4.5
3.1
1.2
0.9
0.0
3
Ja
pa
n
Ph
ilip
pin
es
Om
an
Re
pu
blic
ofK
ore
a
0.0
7
Euro
pean
Unio
n/E
FTA
0.6
0.2
Can
ada
Bra
zil
Para
gu
ay
Car
ibb
ean
Un
ited
Sta
tes
of
Am
eric
a
0.0
4
0.0
7 1.3
0.7
0.0
1
Au
stra
lia
Tan
zan
ia
Zam
bia
Sou
th A
fric
a
Zim
bab
we
0.0
6
1
1.9
0.3
0.2
0.3
0.9
Cann
abis
res
in s
eizu
res
repo
rted
to U
NO
DC
(199
8-20
02)
Map
16:
Can
nab
is r
esin
sei
zure
s 20
01 -
200
2: e
xten
t an
d t
ren
ds
(cou
ntrie
s re
port
ing
seiz
ures
of
mor
e th
an 1
0 kg
.)
Not
e: R
oute
s sh
own
are
not
nece
ssar
ily d
ocum
ente
d ac
tual
rou
tes,
but
are
rat
her
gene
ral i
ndic
atio
ns o
f th
e di
rect
ions
of
illic
it dr
ug f
low
s.

Cannabis is the most widely consumed illicit drug.Some 146 million people or 3.7% of the population 15-64 consumed cannabis in 2001-2003.
The number of people treated for cannabis abuse ismuch smaller than for opiates or cocaine. The propor-tions of patients treated for cannabis abuse, has, how-ever, shown an upward trend in several parts of theworld in recent years, reflecting growing consumption,almost unlimited supply and the availability of morepotent varieties with a higher THC content.
Though cannabis use continues rising, UNODC's esti-mate on global cannabis consumption had to be reviseddownwards compared to last year's estimate (publishedin Global Illicit Drug Trends 2003). Some of the 'decline'was due to a methodological change prompted by the
new Annual Reports Questionnairex. Moreover, someUNODC estimates, when replaced with actual house-hold survey data, turned out to be smaller than previ-ously expected. The most striking example in this regardwas Brazil, which affected estimates for South Americaas a whole. While previous estimates, derived from stu-dent studies, suggested that Brazil's cannabis consump-tion was significantly above the global average, estimatesreported by the Brazilian authorities last year (based ona national household survey) showed an annual preva-lence rate of just 1% among the adult population. Thiswas clearly below the global average. As a result,UNODC's overall estimates for South America (includ-ing the Caribbean and Central America) had to be cutby half (to 6.5 million persons or 2.4% of the popula-tion age 15-64).
139
2. Trends Cannabis market
2.3.3. Abuse
2.3.3.1. Extent
x) In line with a change in the question on prevalence asked in the new Annual Reports Questionnaire, the population base used for calculating thetotal number of drug users was reduced from 'age 15 and above' to age 15-64', implicitly assuming that no or only negligible cannabis use takesplace among the population age 65 and above. As many countries did not increase the reported proportions of drug users among the adultpopulation, the calculated total number of drug users declined.
Number of people in % of population(in million) age 15 - 64
OCEANIA 3.40 16.40
AFRICA 34.60 7.70
AMERICAS 34.90 6.30
- North America 28.50 10.30
- South America 6.50 2.40
EUROPE 28.80 5.30
- West Europe 20.40 6.70
- East Europe 8.40 3.60
ASIA 44.70 1.90
GLOBAL 146.30 3.70
Cannabis abuse above global average Cannabis abuse close to global average Cannabis abuse below global average
Sources: UNODC, Annual Reports Questionnaire data, various Govt. reports, reports of regional bodies, UNODC estimates.
Table 11: Annual prevalence estimates of use of cannabis: 2001-2003
In terms of average annual prevalence, the reported ratesare highest in the Oceania region (16.4%), followed byAfrica (7.7%), the Americas (6.3%) and Europe(5.3%). In North America and in Western Europe therates are 10.3% and 6.6% respectively. The highestlevels in the Americas were reported from the USA(11% of the population age 12 and above or more than13% of the population age 15-64 in 2002). The high-est levels in Europe were reported from the UK (10.9%of those age 16-59 in 2003), the Czech Republic(10.9% in 2002), France (9.8% in 2002) and Spain(9.7% in 2001). Cannabis use in Australia affected 15%of the population age 15-64 in 2001.
Relatively low cannabis prevalence rates, in contrast, arereported from countries in Asia (1.9%) mainly reflect-ing low levels of cannabis use in China and other coun-tries of South-East Asia. In Thailand, for instance, ahousehold survey conducted in 2001 revealed an annualprevalence rate of cannabis use of 1.5% among thoseage 12-65. Nonetheless, the largest numbers of cannabisusers are found in Asia (some 45 million people), whichaccounts for more than 30% of global cannabis use.
The Americas and Africa account for 24% each of allcannabis use worldwide and Europe for 20%. Cannabisuse in Africa is widespread across the continent and par-ticularly high in countries of Western and SouthernAfrica.
Importance of cannabis use compared to other drugs
In the vast majority of countries, cannabis is the mostwidely consumed drugy. This applies to all countries inthe Oceania region, almost all countries in westernEurope and North America, most countries in Africaand a majority of countries in Asia. Given this, it ismore interesting to identify the countries in whichcannabis does not rank 1st.
In some of the East and South East Asian countries,including China, cannabis is reported to rank 3rd afteropiates and ATS. In Japan it was reported to rank 3rdafter methamphetamine and solvents.
The authorities in the Ukraine report cannabis rankingthird after the use of 'kompot' an opium straw extractwhich is usually injected, and ephedrone (methcathi-
none) which is often injected as well. In Sweden, Hun-gary and Slovakia cannabis was reported to rank 2ndafter sedatives & tranquilizers (mostly benzodiazepines)and in Croatia, Serbia & Montenegro as well as inLatvia and Lithuania authorities reported cannabis 2ndafter opiates.
In Venezuela and El Salvador cannabis use was reportedto rank second after cocaine. In Brazil, Panama andGuatemala cannabis use was reported to rank 2nd afterbenzodiazepines.
In countries around the Horn of Africa, notably inYemen, Somalia and Ethiopia, rapid assessment studiesrevealed that Khat was more widespread than cannabis.
In some countries of the Near and Middle East use ofbenzodiazepines, opiates or ATS (notably fenetylline)appear to be close to, or exceeding cannabis use.
The cannabis ranking for some of the countries men-tioned above, however, could change if all of the infor-mation were based on household surveys. This isbecause registration systems in place often have a built-in bias for the identification of drugs other thancannabis.
140
World Drug Report 2004 Volume I. Analysis
y) Reference is made to the 'unadjusted ranking' provided by Member States. Subsequent adjustments, as reflected in the ranking of the cannabis map,have been made in order to improve comparability as some countries include alcohol and tobacco as 'drugs', so that cannabis only ranks third inthese countries, while most of the countries do not have alcohol and tobacco included in their drug rankings.

141
2. Trends Cannabis market
Map 17: Use of cannabis 2001 - 2003 (or latest year available)
> 8% of population
1 - 5% of population< 1% of population
5 - 8% of population
Main cultivation areas
Level of abuse (Annual prevalence)
Abuse, extent unknownData not available
2
1
Ranking(1 = most prevalent drug)
7 or more
4 - 6
3 No data provided
Sources: UNODC Annual Reports Questionnaires data, SAMSHA US National Household Survey on Drug Abuse, Iranian Ministry of Health,Rapid Assessement Study and UNODC ARQ,Council of Europe, ESPAD.
Map 18: Ranking of cannabis in order of prevalence in 2002 (or latest year available)

142
World Drug Report 2004 Volume I. Analysis
Overview
Cannabis use rises again strongly…
Based on UNODC's Drug Abuse Trend Index globalcannabis consumption continued its steep increase overthe 2000-2002 period. This follows a gradual increasein the early 1990s (1991-1997) and some stabilizationover the 1997-2000 period.
There are significantly more countries reporting risinglevels of cannabis use than there are countries reportingfalling levels. Overall, 54% of countries reporting per-ceived cannabis consumption trends in 2002 (n = 95countries) saw an increase, while only 11% reported adecline. A year earlier, 53% of those countries reportedan increase and 14% saw a decline.
Increases for 2002 were reported from a majority ofcountries in Africa, South America, Europe and severalparts of Asia, excluding most countries in South-EastAsia and Australia. In North America, the trend wasbasically stable.
AMERICAS
Cannabis use remains largely stable in North America
Data for the USA, the world's largest cannabis marketin economic terms, showed strong increases in the1960s and the 1970s, followed by significant declines inthe 1980s and increases in the 1990s. Annual prevalenceof cannabis use among the general population (age 12and above) fell from 16.6% in 1979 to 7.9% in 1992,and rose again to 9.3% in 2001.
In 2002 11% of the US population age 12 and aboveconsumed cannabis. This figure is not directly compa-rable with the results of previous years due to changes inmethodology which were aimed at reducing under-reporting. Based on life-time prevalence data collectedin 2002, it was found that there was some increase inlife-time prevalence among those 18-25 year olds (53%in 2001 to 53.8% in 2002) and some decline amongthose 12-17 year olds (from 21.9% to 20.6%). This sug-gests that overall the level of cannabis use remainedlargely stable in 2002 as compared to a year earlier.
Regular high-school surveys revealed a gradual declinein cannabis consumption after 1997. Annual prevalenceof cannabis use among 12th grade high-school studentsfell slightly from 38.7% in 1997 to 37% in 2001,
2.3.3.2. Trends
Fig. 102: Cannabis consumption trend based onnational experts' perceptions
0
1
2
3
4
91 92 93 94 95 96 97 98 99 00 01 02
dru
g a
bu
se t
ren
d in
dex
Source: UNODC, Annual Reports Questionnaire Data.
Fig. 103: Cannabis use trends in 2001 (n = 95 countries)
large increase
15%
some increase
38%
stable33%
large decline
4%
some decline
10%
Source: UNODC, Annual Reports Questionnaire Data.
Fig. 104: Cannabis use trends in 2002 (n = 95 countries)
large increase
17%
some increase
37%
stable35%
some decline
8%
large decline
3%
Source: UNODC, Annual Reports Questionnaire Data.

143
2. Trends Cannabis market
36.2% in 2002 and 34.9% in 2003. There is a strongnegative correlation between perceived harmfulness('great risk to smoke marijuana occasionally') andannual prevalence of cannabis use (R = -0.96 over the1975-2003 period) and a positive correlation betweenperceived availability ('easy or fairly easy to get') andannual prevalence of cannabis use (R = +0.67 over the1975-2003 period or +0.96 over the 1990-2003period). Data suggest that the decline of cannabis usein the 1980s was a consequence of a rising awareness ofthe negative consequences of cannabis consumption andsome reductions in availability (reflecting large-scaleeradications in Latin America). Similarly, the strongincrease in cannabis use in the early 1990s occurred inparallel to a decline in perceptions that cannabis washarmful (as prevention campaigns of the 1980s becameoutdated) and a rising market supply (due mainly to arise in domestic production). Finally, the stabilization /decline of cannabis use after 1997 took place in parallelto some reduction in availability (reflecting inter aliaintensified domestic eradication and eradication ofcannabis plant in Mexico). The downward trend in theharmfulness perceptions of the early 1990s gave way toa stabilization, following major investment into newprevention efforts. All of this led to declining levels ofconsumption among high-school students over the1997-2003 period.
However, data also show that availability of cannabisremains high and that the perceived harmfulness is lim-ited as compared to other drugs. In 2003 16% of 12thgrade students considered it to be a 'great risk' to usecannabis once or twice. The corresponding ratios forconsidering it a 'great risk' to use amphetamines,
cocaine or heroin, once or twice, were significantlyhigher (37%, 46% and 58%, respectively). While 87%of the students surveyed reported that cannabis waseasily available, the corresponding ratios for ampheta-mines, cocaine or heroin were significantly lower (55%,37% and 28%, respectively). Probably as a consequenceof this, the use of cannabis (annual prevalence of 34.9%among 12th graders in 2003) is significantly more wide-spread than that of amphetamines (9.9%) cocaine(4.8%) or heroin (0.8%).
In Canada's most populous province, Ontario, high-school surveys revealed a pattern largely similar to thatobserved in the USA: increases in the 1970's, declinesin the 1980's, followed by significant increases in the
Fig. 105: USA: cannabis prevalence, perceived harmfulness and availability among 12th graders
21.9
38.5
50.8
34.9
40.0
12.4
40.6
24.726.6
18.1 23.2
87.8
90.1
82.7
90.4
87.1
0
10
20
30
40
50
60
75 77 79 81 83 85 87 89 91 93 95 97 99 01 03
Prev
alen
ce a
nd
per
ceiv
ed
har
mfu
llnes
s in
%
80
82
84
86
88
90
92
Perc
eive
d a
vaila
bili
ty in
%
annual prevalence of cannabis use among 12th gradersharmfulness ('great risk to smoke marijuana occasionally')Availability ('easy or fairly easy to get')
Source: NIDA, Monitoring the Future.
Fig. 106: Cannabis use among high-school students inOntario (Canada) and in the USA
29.125.1
21.919.4
13.811.9 9.911.5
21.923.9 26.227.826.8
30.3
15.5
25.
0
10
20
30
40
79 81 83 85 87 89 91 93 95 97 99 01 03
ann
ual
pre
vale
nce
in %
Ontario, 7th,9th,11th grade
USA*, 8th, 10th,12th grade* US data for 1979 to 1989 are estimates extrapolated from survey results of 12th grade students
Sources: Centre for Addiction and Mental Health, Drug UseAmong Ontario Students 1977-2003 and NIDA, Monitoring theFuture.
144
World Drug Report 2004 Volume I. Analysis
1990s and a stabilization in subsequent years. Over the1999-2003 period, stable to slightly increasing levelswere reported from Ontario. With an annual prevalencerate of 27.8% among Ontario high-school students(7th, 9th and 11th graders), cannabis use was still lowerthan in the late 1970s (29.1% in 1979). However, theprevalence rate was - for the first time - higher than inthe USA, mainly a consequence of the decline ofcannabis prevalence rates in the USA over the 1997-2003 period (from 30.3% to 25.3% among8th,10th,12th graders). One in ten of Ontario high-school cannabis users was found to have a dependenceproblem with cannabis. Annual prevalence of cannabisuse among the general population affected 11.2% (age18 and above) in Ontario in 2001, about the same levelas reported from the USA and about the same level asreported a year earlier (10.8%), though up from 6.2%reported in 1992.
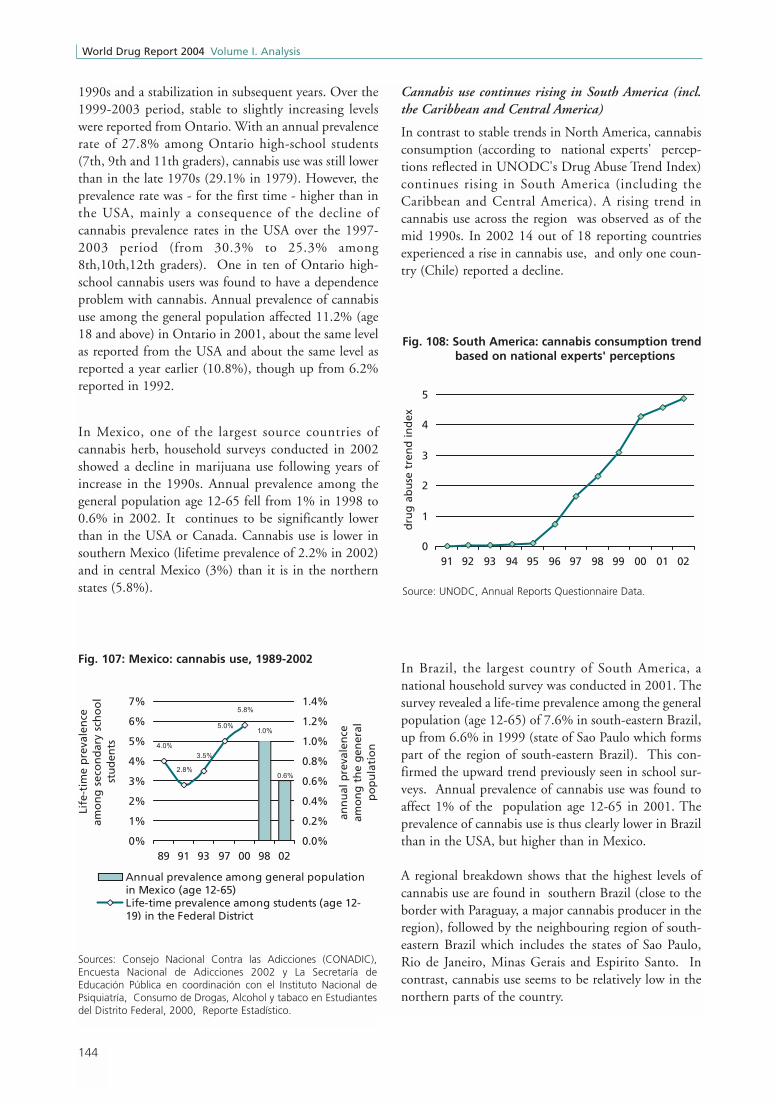
In Mexico, one of the largest source countries ofcannabis herb, household surveys conducted in 2002showed a decline in marijuana use following years ofincrease in the 1990s. Annual prevalence among thegeneral population age 12-65 fell from 1% in 1998 to0.6% in 2002. It continues to be significantly lowerthan in the USA or Canada. Cannabis use is lower insouthern Mexico (lifetime prevalence of 2.2% in 2002)and in central Mexico (3%) than it is in the northernstates (5.8%).
Cannabis use continues rising in South America (incl.the Caribbean and Central America)
In contrast to stable trends in North America, cannabisconsumption (according to national experts' percep-tions reflected in UNODC's Drug Abuse Trend Index)continues rising in South America (including theCaribbean and Central America). A rising trend incannabis use across the region was observed as of themid 1990s. In 2002 14 out of 18 reporting countriesexperienced a rise in cannabis use, and only one coun-try (Chile) reported a decline.
In Brazil, the largest country of South America, anational household survey was conducted in 2001. Thesurvey revealed a life-time prevalence among the generalpopulation (age 12-65) of 7.6% in south-eastern Brazil,up from 6.6% in 1999 (state of Sao Paulo which formspart of the region of south-eastern Brazil). This con-firmed the upward trend previously seen in school sur-veys. Annual prevalence of cannabis use was found toaffect 1% of the population age 12-65 in 2001. Theprevalence of cannabis use is thus clearly lower in Brazilthan in the USA, but higher than in Mexico.
A regional breakdown shows that the highest levels ofcannabis use are found in southern Brazil (close to theborder with Paraguay, a major cannabis producer in theregion), followed by the neighbouring region of south-eastern Brazil which includes the states of Sao Paulo,Rio de Janeiro, Minas Gerais and Espirito Santo. Incontrast, cannabis use seems to be relatively low in thenorthern parts of the country.
Fig. 107: Mexico: cannabis use, 1989-2002
1.0%
0.6%
4.0%
2.8%
3.5%
5.0%
5.8%
0%
1%
2%
3%
4%
5%
6%
7%
89 91 93 97 00 98 02
Life
-tim
e p
reva
len
ce
amo
ng
sec
on
dar
y sc
ho
ol
stu
den
ts
0.0%
0.2%
0.4%
0.6%
0.8%
1.0%
1.2%
1.4%
ann
ual
pre
vale
nce
amo
ng
th
e g
ener
al
po
pu
lati
on
Annual prevalence among general populationin Mexico (age 12-65)Life-time prevalence among students (age 12-19) in the Federal District
Sources: Consejo Nacional Contra las Adicciones (CONADIC),Encuesta Nacional de Adicciones 2002 y La Secretaría deEducación Pública en coordinación con el Instituto Nacional dePsiquiatría, Consumo de Drogas, Alcohol y tabaco en Estudiantesdel Distrito Federal, 2000, Reporte Estadístico.
Fig. 108: South America: cannabis consumption trendbased on national experts' perceptions
0
1
2
3
4
5
91 92 93 94 95 96 97 98 99 00 01 02
dru
g a
bu
se t
ren
d in
dex
Source: UNODC, Annual Reports Questionnaire Data.

145
2. Trends Cannabis market
Argentina reported higher levels of cannabis use than inBrazil. A national household survey conducted in 1999found an annual prevalence rate of 3.7% and a life-timeprevalence rate of 8.5% among the general population(age 16-64). Argentina reported an continuous increaseof cannabis use in 2000, 2001 and 2002.
In neighbouring Chile, 5.2% of the general population(age 12-64) used (annual prevalence) cannabis in 2002,i.e. more than in Brazil or Argentina. Following
increases of cannabis consumption in the 1990s therewas, however, some decline in the annual prevalencerate of cannabis use between 2000 and 2002. Yet,monthly prevalence rates of cannabis use remainedstable between 2000 and 2002 suggesting that thedecline affected mainly experimental users.
In Bolivia cannabis use was lower than in Chile orArgentina. A general population survey conducted in2000 by the Centro Latinoamericano de InvestigaciónCientifica (CELIN)z found an annual prevalence rate of2.2% among the population age 12 and above and alife-time prevalence rate of 3.7% in 2000 (which wasstill lower than that reported from Brazil). Cannabis usewas, however, increasing in Bolivia throughout the1990s. The monthly prevalence rate of cannabis use rosefrom 0.2% of the population age 12-50 in 1992 to1.4% in 2000. School surveys, conducted in 2000 andin 2002, suggest that the upward trend continued.
In contrast, studies conducted in Peru suggest thatcannabis use has remained basically stable since the mid1990s. The life-time prevalence rate of cannabis use was5.8% of the general population age 12-64 in2002/2003, which was almost the same as in 1995,1998 and 2001 (and less than in 1997). Annual preva-lence of cannabis use concerned 1.8% of the populationage 12-64 and was thus slightly lower than in Bolivia. In Ecuador, on the other hand, school surveys suggest
Fig. 109: Brazil: Life-time prevalence of cannabis use,1987-2001
6.6%7.6%
4.5%3.4%
7.6%
2.8%
0%
2%
4%
6%
8%
10%
12%
87 89 91 93 95 97 99 01 life
-tim
e p
reva
len
ce in
sch
oo
l su
rvey
s in
%
0%1%2%
3%4%5%6%
7%8%
life-
tim
e p
reva
len
ce in
gen
eral
p
op
ula
tio
n s
urv
eys
in %
General population surveys (age 12-65); Stateof Sao Paulo (1999) / South-East Brazil (2001)
National school surveys (age 10-19) in statecapital cities
Sources: CEBRID, I Levantamento Domiciliar Sobre O Uso deDrogas Psicotrópicas no Brasil 2001 and CEBRID, I Levantamentodomiciliar Nacional Sobre O Uso de Drogas Psicotrópicas - Estudoenvolvendo as 24 Maiores Cidades do Estado de São Paulo 1999,CEBRID, IV Levantamento Sobre O Uso de Drogas entre Estudantesde 1 e 2 graus am 10 Capitais Brasileiras, 1997.
Fig. 110: Brazil: Life-time prevalence of cannabis useamong the general population (age 12-65)
6.9%
5.0% 5.0%5.5%
7.6%8.4%
0%
2%
4%
6%
8%
10%
Brazil North Centre-
West
North-
East
South-
West
South
Life
-tim
e p
reva
len
ce
Sources: CEBRID, I Levantamento Domiciliar Sobre O Uso deDrogas Psicotrópicas no Brasil 2001.
Fig. 111: Chile: Cannabis use among the generalpopulation (age 12-64), 1994-2002
1.7%1.2%
2.0%
2.9% 2.9%
3.8% 4.0%
4.8%5.2%
5.8%
0%
1%
2%
3%
4%
5%
6%
1994 1996 1998 2000 2002
pre
vale
nce
in %
monthly prevalenceannual prevalence
Source: CONACE, Estudio Nacional de Drogas en la PoblaciónGeneral de Chile, 2002, Santiago de Chile, 2003.
z) Centro Latinoamericano de Investigación Cientifica (CELIN), El Use Indebido de Drogas en Ciudades Bolivianas (Estudio Urbano, Año 2000,Cuadros Estadísticos.

146
World Drug Report 2004 Volume I. Analysis
that cannabis use continued to rise (from a life-timeprevalence of 3.9% among those 13-18 year olds sur-veyed in 1998 to 8.6% of those 12-18 year olds sur-veyed in 2001/02). Similarly, strong increases amongsecondary school students were reported from Panamaand Guatemala.
Authorities in Colombia, Venezuela, Suriname,Argentina, Paraguay, Uruguay, Costa Rica, El Salvador,Guatemala, Barbados and Bahamas all reported risinglevels of cannabis consumption in 2002.
High-school surveys conducted in recent years in LatinAmerica show that life-time prevalence of cannabis useamong secondary school students is particularly high insome of the Caribbean countries (St. Lucia, Jamaica andBarbados), where about a quarter of all students haveexperimented with cannabis. The highest levels of anySouth-American country were reported from Chile fol-lowed by Colombia. The highest levels in Central Amer-ica were reported by Belize and Guatemala. Despitethese high levels, cannabis use is still less prevalent thanin the USA.
Table 12: Life-time prevalence of cannabis use among secondary school students in Latin America in 2002 or latest year available
Sources: UNODC, Annual Reports Questionnaire Data, UNODC, Global Assessment Programme (GAP), OAS/CICAD, Resumen Estadísticosobre Drogas, 2003 and OAS/CICAD, Drug Prevalence Survey of Secondary School Students, 2003 - a comparison report of threeCaribbean countries: Barbados, Belize and Guyana.
Age groupLife-time
prevalence in %Source
St. Lucia 13 - 20 27.4 UNODC. GAP
Jamaica 12 – 16 26.9 UNODC, ARQ
Barbados 12 – 18 23.3 UNODC, ARQ
Chile 13 – 18 23 UNODC, ARQ
St. Vicent and the Grenadines 13 - 19 20.6 UNODC, GAP
Belize 12 – 18 20.5 CICAD
Bahamas 11 – 19 14.9 UNODC, ARQ
Guatemala 12 – 20 12.3 UNODC, ARQ
Uruguay 13 – 17 11.9 UNODC, ARQ
Colombia 10 – 24 8.9 UNODC, ARQ
Ecuador 12 – 18 8.6 CICAD
Brazil 10 – 19 7.6 UNODC, ARQ
Guyana 12 – 18 7.1 CICAD
Panama 12 – 18 6.9 CICAD
Nicaragua 13 – 18 6.7 UNODC, ARQ
Bolivia 12 – 21 6.4 UNODC, ARQ
Suriname 12 – 16 6 UNODC, ARQ
Mexico 12 – 20 5.8 UNODC, ARQ
Argentina 12 – 18 5.3 UNODC, ARQ
Paraguay 12 – 18 4.3 CICAD
Honduras 15 – 25 2.7 UNODC, ARQ
Venezuela 12 – 21 2.3 UNODC, ARQ
Dominican Republic 12 – 20 2.2 UNODC, ARQ
Costa Rica 12 – 18 1.7 UNODC, ARQ
11
7.4
33.3NIDA, Monitoring the
Future
Memo:
USA2003 13-17/18
2000
2001
Average: unweighted
weighted by population
2001
2001/02
2002
2001
2002
2002
2002
2000
2001/02
1997
2002
2001/02
2002
2002
2001
2001
2002
2001
2002
2002
Year
2002
1997

147
2. Trends Cannabis market
Approximately 11% (unweighted average) of secondaryschool students in Latin America experimented withcannabis. This is a third of the corresponding ratereported from the USA. However, data are not alwaysdirectly comparable. In some countries the age group ofstudents 17 years and above (which has the highestprevalence rate) is under-represented because mostpupils leave the school earlier. Thus for some of thecountries showing a low cannabis use prevalence, theactual reason is that older students, who would havehigher prevalence rates, are under-represented in thesecountries.
EUROPE
Cannabis use continues to rise in Europe
Cannabis use has increased in Europe throughout thelast decade - as reflected in UNODC's Drug AbuseTrend Index. This is unlike the situation in NorthAmerica where cannabis use stabilized or declined inrecent years. During that period several European coun-tries have been softening their drug laws with regard tocannabis.
A stabilization of cannabis consumption in Europe wasreported by the Nordic countries (Finland, Norway andSweden), the UK (following a decade of massiveincreases) and a few other countries. Apart from theseexceptions, most countries of continental Europe con-tinued reporting rising levels of cannabis use.
In France, for instance, annual prevalence of cannabisuse more than doubled between 1992 and 2002 (from3.9% of the population age 18-74 to 9.8% of the pop-ulation age 15-64). Similarly, life-time prevalence ofcannabis use among 17 year olds more than doubled
between 1993 and 2002 affecting 44.7% of all studentsage 17 in 2002.
High prevalence rates among pupils were also reportedfrom Switzerland. School surveys conducted among 15-16 year olds revealed a life-time prevalence rate of44.5% for 2002, signalling a four-fold increase as com-pared to 1990 or the mid 1980s. The prevalence of 15-16 year old students who used cannabis several timesrose from 25% in 1998 to 32% in 2002 period, equiv-alent to a 25% increase over this period. Some of the risecan be linked to availability which is, in general, betterthan in several neighbouring countries. Apart from theblack market, Switzerland has some 200 retail outletsacross the country where a broad range of cannabisproducts (for decoration purposes, etc.) can be bought,
Fig. 112: Europe: cannabis consumption trend basedon national experts' perceptions
0
1
2
3
4
5
91 92 93 94 95 96 97 98 99 00 01 02
dru
g a
bu
se t
ren
d in
dex
Source: UNODC, Annual Reports Questionnaire Data.
Fig. 113: France: annual prevalence of cannabis useamong the general population age 15-64,1992-2002
3.9%4.7%
7.4%
8.4%
9.8%
0%
2%
4%
6%
8%
10%
1992 1995 1999 2000 2002
ann
ual
pre
vale
nce
in %
Sources: EMCDDA, Data Library and UNODC, Annual ReportsQuestionnaire Data.
Fig. 114: France: life-time prevaleence of cannabis useamong 17 year olds, 1992-2002
40.1%
17.1%
27.8%
38.1%
45.7%
47.3%
24.7%
50.1% 54.6%
40.9%
0%
10%
20%
30%
40%
50%
60%
1992 1994 1996 1998 2000 2002
life-
tim
e p
reva
len
ce
male students female students
Sources: INSERM 1993, CADIS-OFDT 1997, ESPAD 1999,EESCAPAD 2000 and 2002 quoted in OFDT, Drogues etAdolescence, Sept. 2003.

148
World Drug Report 2004 Volume I. Analysis
including - until recently - cannabis products that had aTHC content sufficient to be suitable for smoking.Against this background and the large spread ofcannabis in the country, the Swiss upper house passed abill to fully decriminalize cannabis, including consump-tion, distribution and production. However, the bill wasrejected by the lower house in 2003. Cannabis use in
Spain was stable during the 1990s but increased signif-icantly over the 1999-2001 period (from 6.8% to 9.9%among the general population age 15-64) to levelsslightly higher than in France. School surveys also con-firmed an upward trend of cannabis use over the 1998-2000 period. Given the existence of good preventionprogrammes, the increase can possibly be explained asthe result of larger supply - probably due to the
increases of cannabis production in neighbouringMorocco and the role of Spain as a major transhipmentlocation. Cannabis prevalence rates above the nationalaverage were reported - inter alia - from the Baleares(18.3%), the Basque region, located close to France(13.7%) and Madrid (12.7%).
In Italy, most of the increase in cannabis use took placein the second half of the 1990s (1995-1999). Some(minor) increases in cannabis use occured between 2000and 2002. A general population survey conducted in2001 found an annual prevalence of 6.4% among thepopulation age 15-44, suggesting that cannabis use inItaly is less widespread than in Spain or France.
Both general population surveys and youth surveys inGermany showed a clear upward trend of cannabis useover the last decade. The annual prevalence of cannabisuse among the general population and life-time preva-lence among youth more than doubled. Most of theincrease took place in the 'new provinces' (former EastGermany). A continuation of this upward trend wasalso reported by the German authorities for the year2002. Nonetheless, data also show that cannabis use inGermany (annual prevalence of 6% among the popula-tion age 18-59 in 2000) is lower than amongst its neigh-bours - France, Switzerland and the Czech Republic -and lower than in the UK or Spain.
Some increase in cannabis use was also reported fromthe Netherlands between 1997 and 2001 (from 5.5% to6.1% of the population age 15-64). In Amsterdam, thecity with the highest cannabis use levels in the Nether-lands (more than twice the national average), annual
Fig. 115: Switzerland :Cannabis use among 15-16 yearolds, 1984-2002
44.5%
35.0%
9.7%
24.0%
12.3%14.6%
40.6%
10.6%
4.9%
21.4%
29.5%
39.1%
49.9%
27.0%
0%
10%
20%
30%
40%
50%
1986 1990 1994 1998 2002
Life
-tim
e p
reva
len
ce
15-16 year olds male female
Source: SFA/ISPA, Trends im Konsum psychoaktiver Substanzenvon Schülerinnen und Schülern in der Schweiz, Lausanne 2003.
Fig. 116: Spain: annual prevalence of cannabis useamong the general population age 15-64,1989-2001
6.7%7.3% 7.6%
7.0%
9.7%
0%
2%
4%
6%
8%
10%
1989* 1995 1997 1999 2001
ann
ual
pre
vale
nce
in %
* municipality of Madrid.
Sources: Ministerio del Interior, Observatorio Español sobreDrogas, Informe No 6 Nov. 2003 and UNODC, Annual ReportsQuestionnaire Data.
Fig. 117: Italy: Life-time prevalence of cannabis useamong secondary school students, 1995-2002
18.5%
25.5%
30.9%32.7% 33.5%
0%
10%
20%
30%
95 99 00 01 02Li
fe-t
ime
pre
vale
nce
ESPAD 16 year olds ESPAD/ITALY 15-19 year olds
Sources: Council of Europe, The 1995 ESPAD Report and The1999 ESPAD Report, and Ministero del Lavoro e delle PoliticheSociali, Relazione Annuale al Parlamento sullo Stato delleTossicodipendenze in Italia 2002.

149
2. Trends Cannabis market
prevalence of cannabis use rose from 9.5% of the pop-ulation age 12 and above in 1987 to 13.2% in 1997. Itremained basically unchanged over subsequent years(13.1% in 2001)aa. Over the same period stricter reg-ulations led to an (approximately) 20% decline in thenumber of 'coffee shops' in Amsterdam (from 340 in1997 to 280 in 2001 and 270 in 2002)ab . Some 40%
of the cannabis in the Netherlands is bought by the end-consumers in such 'coffee shops' (ranging from 37% ofthe 12-17 year old cannabis users to 47% of cannabisusers age 18 and above)ac. Increases in cannabis useover the 1997-2001 period, in contrast, were reportedfrom Rotterdam, one of the main cannabis tranship-ment locations, and several other locationsad. TheDutch authorities reported a stabilization of cannabisuse in 2002 (ARQ).
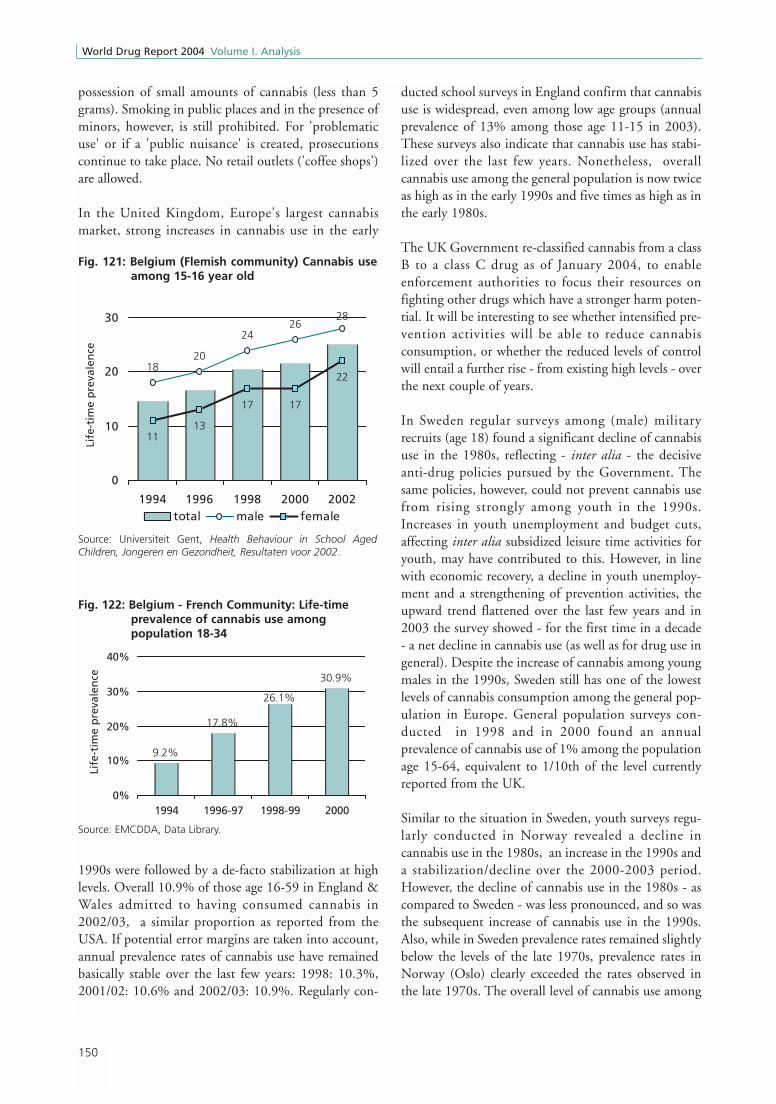
Strong increases in cannabis use over the last decadewere reported from Belgium. Life-time prevalenceamong 15-16 year olds rose in the Flemish part of thecountry from less than 15% in 1994 to about 25% in2002. Following increases in the 1990s, life-time preva-lence among 15-16 year olds continues to be higheramong the 'French community' than among the 'Flem-ish community'. In the French community it continuedrising from 27.9% in 1997/98 (HBSC study) to 29%in 2002 (ARQ). Among young adults in the Frenchspeaking community, life-time prevalence of cannabisuse rose by some 70% (from 17.8% in 1996/97 to30.9% in 2000 among the population age 18-34) andwas thus similar to levels reported from former WestGermany (30.8%) or the Netherlands (31.5% amongthose 15-34), though still less than in Spain (35%),France (35.7%) or the UK (43%) in 2000. (Percentagesfor the latter countries refer to the age group 15-34).Belgium introduced a new law in 2003 which partiallydecriminalizes cannabis use and de-facto allows for the
Fig. 118: Germany: Cannabis use among the generalpopulation and among youth, 1989-2001
2.3%
4.4%4.1%
6.0%
16%19%
26%
12%
0%
5%
10%
1989 1991 1993 1995 1997 1999 2001ann
ual
pre
vale
nce
of
the
gen
eral
po
pu
lati
on
in %
0%
10%
20%
30%
life-
tim
e p
reva
len
ce o
f yo
uth
in
%
General population (age 18-59)Youth (age 12-25)
* estimate for 1989 based on overall prevalence of illegal drug use in West Germany.
Sources: UNODC, Annual Reports Questionnaire Data, Ministry ofHealth, Repräsentativerhebung Drogen 1995, 1997 and 2000,BZgA, Die Drogen-affinität Jugendlicher in der BundesrepublikDeutschland 1997 and 2001.
Fig. 119: Netherlands: Cannabis use among thegeneral population age 15-64
5.5%6.1%
0%
2%
4%
6%
8%
1997 2001
ann
ual
pre
vale
nce
in %
Source: EMCDDA, Data Library.
Fig. 120: Amsterdam (Netherlands): Annualprevalence of cannabis use (age 12 andabove), 1987-2001
9.5%10.2%
11.2%13.1%13.2%
0%
4%
8%
12%
16%
1987 1990 1994 1997 2001
ann
ual
pre
vale
nce
in %
Source: Licit and Illicit Drug Use in Amsterdam, 1987-2001
aa) CEDRO, Licit and Illicit Drug Use in Amsterdam, 1987-2001. ab) The decline in the overall number of coffee shops in the Netherlands over the 1997-2002 period was even more important: from 1179 to 782.
(Trimbos Instituut, National Drug Monitor2003).ac) CEDRO, Licit and Illicit Drug Use in the Netherlands 2001, Amsterdam 2002.ad) Trimbos Instituut, National Drug Monitor2002 and 2003.
150
World Drug Report 2004 Volume I. Analysis
possession of small amounts of cannabis (less than 5grams). Smoking in public places and in the presence ofminors, however, is still prohibited. For 'problematicuse' or if a 'public nuisance' is created, prosecutionscontinue to take place. No retail outlets ('coffee shops')are allowed.
In the United Kingdom, Europe's largest cannabismarket, strong increases in cannabis use in the early
1990s were followed by a de-facto stabilization at highlevels. Overall 10.9% of those age 16-59 in England &Wales admitted to having consumed cannabis in2002/03, a similar proportion as reported from theUSA. If potential error margins are taken into account,annual prevalence rates of cannabis use have remainedbasically stable over the last few years: 1998: 10.3%,2001/02: 10.6% and 2002/03: 10.9%. Regularly con-
ducted school surveys in England confirm that cannabisuse is widespread, even among low age groups (annualprevalence of 13% among those age 11-15 in 2003).These surveys also indicate that cannabis use has stabi-lized over the last few years. Nonetheless, overallcannabis use among the general population is now twiceas high as in the early 1990s and five times as high as inthe early 1980s.
The UK Government re-classified cannabis from a classB to a class C drug as of January 2004, to enableenforcement authorities to focus their resources onfighting other drugs which have a stronger harm poten-tial. It will be interesting to see whether intensified pre-vention activities will be able to reduce cannabisconsumption, or whether the reduced levels of controlwill entail a further rise - from existing high levels - overthe next couple of years.
In Sweden regular surveys among (male) militaryrecruits (age 18) found a significant decline of cannabisuse in the 1980s, reflecting - inter alia - the decisiveanti-drug policies pursued by the Government. Thesame policies, however, could not prevent cannabis usefrom rising strongly among youth in the 1990s.Increases in youth unemployment and budget cuts,affecting inter alia subsidized leisure time activities foryouth, may have contributed to this. However, in linewith economic recovery, a decline in youth unemploy-ment and a strengthening of prevention activities, theupward trend flattened over the last few years and in2003 the survey showed - for the first time in a decade- a net decline in cannabis use (as well as for drug use ingeneral). Despite the increase of cannabis among youngmales in the 1990s, Sweden still has one of the lowestlevels of cannabis consumption among the general pop-ulation in Europe. General population surveys con-ducted in 1998 and in 2000 found an annualprevalence of cannabis use of 1% among the populationage 15-64, equivalent to 1/10th of the level currentlyreported from the UK.
Similar to the situation in Sweden, youth surveys regu-larly conducted in Norway revealed a decline incannabis use in the 1980s, an increase in the 1990s anda stabilization/decline over the 2000-2003 period.However, the decline of cannabis use in the 1980s - ascompared to Sweden - was less pronounced, and so wasthe subsequent increase of cannabis use in the 1990s.Also, while in Sweden prevalence rates remained slightlybelow the levels of the late 1970s, prevalence rates inNorway (Oslo) clearly exceeded the rates observed inthe late 1970s. The overall level of cannabis use among
Fig. 121: Belgium (Flemish community) Cannabis useamong 15-16 year old
Source: Universiteit Gent, Health Behaviour in School AgedChildren, Jongeren en Gezondheit, Resultaten voor 2002.
1820
2426
28
1113
17 17
22
0
10
20
30
1994 1996 1998 2000 2002
Life
-tim
e p
reva
len
ce
total male female
Fig. 122: Belgium - French Community: Life-timeprevalence of cannabis use amongpopulation 18-34
9.2%
17.8%
30.9%
26.1%
0%
10%
20%
30%
40%
1994 1996-97 1998-99 2000
Life
-tim
e p
reva
len
ce
Source: EMCDDA, Data Library.

151
2. Trends Cannabis market
the general population (age 15-64) amounted to 4.5%in 1999 and was thus significantly higher than inSweden (1% in 2000) or Finland (2.2% in 2000) butlower than in Denmark (6.2% in 2000) and severalother European countries.
General upward trend of cannabis use in EasternEurope
Various school surveys conducted over the last decade inEastern Europe showed that the increase in cannabis usein the 1990s (although starting from low levels) was sig-nificantly stronger than in Western Europe, both in thefirst and in the second half of the 1990s. In most EastEuropean countries the ESPAD school surveysae, con-ducted under the auspices of the Council of Europe,found a doubling of life-time prevalence rates among15-16 year olds between 1995 and 1999. Thus cannabisuse (as well as drug use in general) showed a trendtoward convergence with drug use levels observed inWestern Europe. Cannabis use in the Czech Republic,for instance, was found to have been already as high asin France or the UK (life-time prevalence of 35%among 15-16 year olds) in 1999 and cannabis use inSlovenia (25%) was already as high as in Italy. Ratherhigh levels were also reported from Moscow (22%), theUkraine (20%), the Slovak Republic (19%), Latvia(17%) and Croatia (16%). Relatively low levels, in con-trast, were still reported from Romania (1%), theFormer Yugoslav Republic of Macedonia (8%), Hun-gary (11%) and Bulgaria (12%).
Fig. 123: Sweden: Life-time prevalence of cannabis use among male military conscripts, age 18, 1976 - 2003
15.216.2
17.517.518.3
16.515.6
10.8
5.36.5
7.5
10.9
13.013.9
15.015.616.016.416.7
7.0
5.6
4.4 4.3 4.4
4.2
3.12.5 2.2 2.3
15.2
0
5
10
15
20
76 77 78 79 80 81 82 83 84 85 86 87 88 89 90 91 92 93 94 95 96 00 01 02 03*
life-
tim
e p
reva
len
ce in
%
cannabis hashish marijuana
Source: Swedish Council for Information on Alcohol and other Drugs (CAN), Drogutvecklingen i Sverige - Rapport 2003.
Fig. 124: Norway: Cannabis use among youth (age 15-20)
0
5
10
15
20
25
30
75 78 81 84 87 90 93 96 99 02
Life
-tim
e p
reva
len
ce in
%
Norway Trend Norway
Oslo Trend Oslo
Source: Norwegian Institute for Alcohol and Drug Research,Alcohol and Drugs in Norway, 2003.
ae) Council of Europe (Pompidou Group), The 1999 ESPAD Report, Alcohol and Other Drug Use Among Students in 30 European Countries, Stockholm,December 2000.

152
World Drug Report 2004 Volume I. Analysis
High levels of cannabis use in the Czech Republic werealso confirmed in a national survey, conducted in 2002,which revealed an annual prevalence of cannabis useamong the general population (age 15-64) of 10.9%,the same level as reported from England & Wales andmarginally higher than in France or Spain. Cannabisuse in the Czech Republic is thus far more widespreadthan in neighbouring Slovakia (3.6% of the generalpopulation age 15-64 in 2002), Poland (2.4% of thepopulation age 16 and above in 1999) or in Hungary.While the Czech Republic reported a life-time preva-lence rate of cannabis use of 21.1% among the generalpopulation, the corresponding rate in Hungaryamounted to 5.7% in 2001.
There are, however, some positive trends. Whilecannabis use continues to increase in rural areas (char-acterized by low prevalence rates), in several largertowns, where cannabis use levels already reached highlevels, consumption levels stabilized or declined. (Thisappears to be the case in Warsaw and some cities inHungary and in the Czech Republic).
Nonetheless, national school surveys conducted among15-16 year old students in the Czech Republic continueto show a clear upward trend. Life-time prevalence ofcannabis use among this age group rose from 22% in1995 to 35% in 1999 and reached almost 44% in 2003(ESPAD). This is definitely one of the highest rates andcould turn out to be among the highest cannabis preva-lence rates among students across Europe in 2003.
Increases in cannabis use have been also reported fromother countries in the region, notably from countries
which, so far, have had low prevalence rates. Thus, theESPAD studies showed a rising trend of cannabis use inHungary: life-time prevalence of 5% among 15-16 yearolds in 1995 (or 7% among secondary school studentsin Budapest), rising to 12% in 1999 among 15-16 yearolds (or 25% among secondary school students inBudapest), and increasing to 28.1% among 16-17 yearold Hungarian students in 2002. Though there are dif-ferences in the age groups analysed, it can be assumed
that overall cannabis use continued increasing amongHungarian students over the 1999-2002 period. Simi-larly, a school survey conducted in 2001-2002 in thecapital of Romania, Bucharest, already found a preva-lence rate of cannabis use of 34% among 14-17 year oldstudents (ARQ 2002) while the 1999 ESPAD study,conducted across Romania, found a lifetime prevalencerate of cannabis use among 15-16 year old students ofjust 1%. Even taking into account that prevalence ratesin capital cities are, in general, larger than in the coun-try as a whole and that the age groups investigated werenot identical, reported differences were so large that onecan take it for granted that cannabis use increased sig-nificantly among high-school students in Romania overthe 1999-2002 period.
Increases in cannabis use also took place in Bulgaria.The 1999 ESPAD study found a life-time prevalencerate of 12% among 15-16 year olds. A study conductedin 2001 in Sofia found the life-time prevalence rate ofcannabis to have increased to 26.9%af.
Fig. 125: Czech Republic, Cannabis use among 15-16year olds
22%
35%
44%
0%
10%
20%
30%
40%
50%
1995 1997 1999 2001 2003
Life
-tim
e p
reva
len
ce
Source: Psychiatrické Centrum Praha, ESPAD 03, The EuropeanSchool Survey on Alcohol and Other Drugs - The Czech Republic2003
Fig. 126: Hungary: Cannabis use among high-schoolstudents, 1992-2002
24.7%
5%
12%
24.5%
6.3%
16.9%
28.1%*
7.3%
0%
10%
20%
30%
1992 1994 1996 1998 2000 2002
Life
-tim
e p
reva
len
ce
Secondary school students in Budapest15-16 year old students in Hungary (ESPAD)
* data for 16-17 year old students in Hungary in 2002.
Sources: Council of Europe, The 1995 and 1999 ESPAD Reports,National Report Hungary 2001 and UNODC, Annual ReportsQuestionnaire 2002.
af ) EMCDD, The State of the Drugs Problem in the Acceding and Candidate Countries to the European Union, Lisbon 2003.

153
2. Trends Cannabis market
AFRICA
Cannabis use continues to increase …
Cannabis is the main drug of concern in Africa. It iseasily available and is the primary drug associated withtreatment demand in Africa. In most African countries,for which information is available, cannabis alsoaccounts for the bulk of arrests for drug trafficking anduse.
Cannabis consumption in Africa has been increasingsteadily over the last decade. This is reflected inUNODC's Drug Abuse Trend Index. If it were not forlimited levels of reporting UNODC's Drug AbuseTrend Index would show even stronger increases forAfrica. Throughout the 1992-2002 period, 50% to100% of countries reporting saw rising levels ofcannabis use. Out of 19 countries reporting in 2002, 16countries (84%) reported rising levels of cannabis use.Large increases in cannabis use in 2002 were reported byMorocco in North Africa as well as by Malawi and Zim-babwe in Southern Africa, by Tanzania and Somalia inEastern Africa, and by Côte d'Ivoire in Western Africa.
The only comprehensive time series data available arefor South Africa. According to data collected by theSouth African Community Epidemiology Network onDrug Use (SACENDU) the proportion of people intreatment for cannabis abuse in South Africa rose fromaround 5% in 1996 to around 20% in 2002. Aboveaverage proportions have been reported from Gauteng(Johannesburg and Pretoria: 23% in 2002) and fromDurban (24%). The number of people treated forcannabis abuse rose more than 3-fold in Cape Town,more than 6-fold in Durban over the 1996-2002period, and - over the 1998-2002 period - by a factor of2.4 in Gauteng. There are more people in treatment for
cannabis abuse in South Africa (and most other Africancountries) than for any other substance, except alcohol.The next most frequently encountered substance inSouth Africa is Mandrax (a methaqualone preparation)in combination with cannabis. Among adolescents (age20 or less) cannabis is the main substance leading totreatment demand, ahead of alcohol (on average 54% infirst half of 2003.) For the first half of 2003 somedeclines in the number of people treated for cannabisabuse were observed in Cape Town, Durban and Gaut-eng, though increases continued in Mpumalanga,located close to the border with Mozambique.
Increases in cannabis use over the last decade were alsoreported for the countries forming part of the SouthernAfrican Development Community (SADC). However,in the first half of 2003 the overall proportion of peoplein treatment for cannabis abuse appears to haveremained rather stable as compared to 2002. Increasesreported from Malawi, a major cannabis producingcountry in the region (from 67% to 80% of all treat-ment demand) were offset by declines reported fromSouth Africa, Namibia and Botswana. For other coun-tries in the region the levels of people treated forcannabis abuse remained basically unchanged. Thehighest proportions of people in treatment for cannabisabuse are found in Malawi (80%), followed by Lesotho.Overall around 25% of treatment is cannabis related(unweighted average of country results).
Excluding alcohol, cannabis accounts for some 60% oftreatment demand. In Lesotho, Malawi and Botswana
Fig. 127: Cannabis consumption trend in Africa basedon national experts' perceptions, 1991 -2002
0
1
2
3
4
91 92 93 94 95 96 97 98 99 00 01 02
dru
g a
bu
se t
ren
d in
dex
Source: UNODC, Annual Reports Questionnaire Data.
Fig. 128: South Africa*: Proportion of people intreatment for cannabis abuse, 1996-2003
0%
5%
10%
15%
20%
25%
96b 97b 98b 99b 00b 01b 02b* Average from Cape Town, Gauteng (Johannesburg/ Pretoria), Durban and Mpumalanga.
Source: SACENDU, Research Brief, Vol. 6. 2003.

154
World Drug Report 2004 Volume I. Analysis
practically all drug treatment was cannabis-related in2002 and 2003. In Zambia the proportion amounted to70% (2002) and in South Africa to around 40%(2002/03). In Mauritius, in contrast, which suffers fromsignificant levels of heroin abuse, cannabis onlyaccounts for some 13% of drug treatment. The overalllargest number of people seeking treatment for cannabisabuse are found in South Africa.
Similarly, practically all of the countries forming part ofthe East Africa Drug Information System (EADIS)reported rising levels of cannabis useag and most of thecountries also reported high proportions of people intreatment for cannabis abuse. High proportions ofpeople in treatment for cannabis abuse were reported bycountries located in the Indian Ocean such as Mada-gascar (88% in 2001)ah or the Seychelles where practi-cally all drug treatment was cannabis related (thoughthe authorities of the Seychelles reported that in 2002 -for the first time - some of the cannabis users had alsoconsumed ecstasy, benzodiazepines and cocaine).
High proportions of people in treatment for cannabisabuse have been also encountered in most West Africancountries. In Nigeria, for instance, 92% of all drugtreatment demand (excl. alcohol) was linked to cannabisabuse in 2002, in Ghana 86% in 2002 and in Togo 77%in 2001 (ARQ).
The overall numbers of people receiving treatment inAfrica for substance abuse are, however, small (a fewhundred people in the larger countries and a few dozenin the smaller countries; only in South Africa thenumber of people receiving treatment for substanceabuse (incl. alcohol) amounted to some 12,000 personsin 2002). This is not a consequence of low levels oftreatment demand in Africa but of a limited availabilityof treatment facilities. Many people in Africa receivetreatment outside the clinical system, or their cases aredealt with in a psychiatric ward which is not recorded astreatment.
ag) Djibouti, Ethiopia, Kenya, Madagascar, Mauritius, Seychelles, Uganda, United Republic of Tanzania (UNODC, GAP - East Africa DrugInformation System, EADIS Second Annual Meeting, Nov. 2002.)
ah) UNODC, GAP, op. cit.
Fig. 130: Proportion of people in treatment forcannabis abuse in countries of southernAfrica, 2002 and 2003
99.3%
0.0%
37.7%
63.7%
100%
12.9%
59.1%
100%
0%
20%
40%
60%
80%
100%
Avera
ge*
Mau
ritiu
s
Namib
ia
South
Afri
ca
Moza
mbiq
ue**
Botswan
a
Mala
wi***
Leso
tho
in %
of
trea
tmen
t d
eman
d (
excl
. alc
oh
ol)
Jan-Dec 2002 Jan-June 2003
* unweighted average ** 2002 data for Mozambique refer to Oct.-Dec. 2002 period; *** 2002 data for Malawi refer to Jul-Dec. 2002 period.
Fig. 129: Proportion of people in treatment forcannabis abuse in countries of southernAfrica, 2002 and 2003
29.8%
0.0%
16.4%18.2%20.2%
8.2%
24.7%
79.8%
0%
20%
40%
60%
80%
Avera
ge*
Maurit
ius
Namibia
Botswana
South
Afri
ca
Moza
mbique**
Leso
tho***
Mala
wi****
Jan-Dec 2002 Jan-June 2003
* unweighted average ** 2002 data for Mozambique refer to Oct.-Dec. 2002 period; '2002 data' for Lesotho refer to July 2001-Dec. 2002 period; 2002 data for Malawi refer to Jul-Dec. 2002 period.
Source: Southern African Development Community Epidemiology on Drug Use (SENDU), January - June 2003.
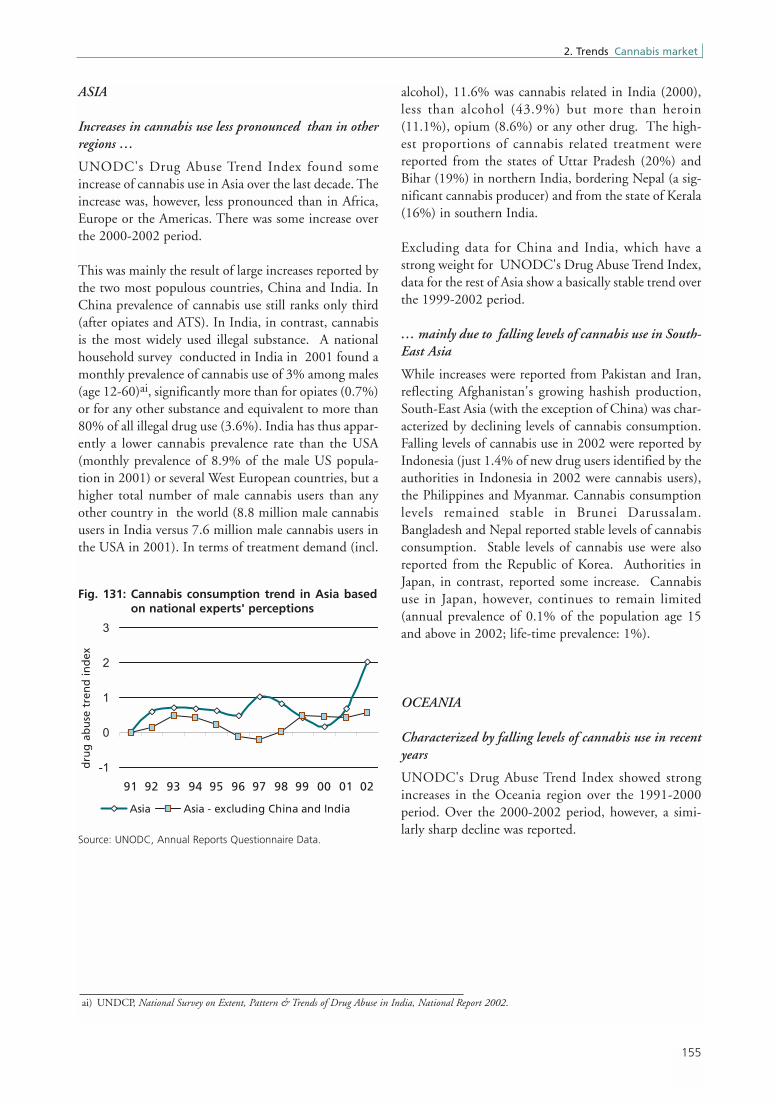
155
2. Trends Cannabis market
ASIA
Increases in cannabis use less pronounced than in otherregions …
UNODC's Drug Abuse Trend Index found someincrease of cannabis use in Asia over the last decade. Theincrease was, however, less pronounced than in Africa,Europe or the Americas. There was some increase overthe 2000-2002 period.
This was mainly the result of large increases reported bythe two most populous countries, China and India. InChina prevalence of cannabis use still ranks only third(after opiates and ATS). In India, in contrast, cannabisis the most widely used illegal substance. A nationalhousehold survey conducted in India in 2001 found amonthly prevalence of cannabis use of 3% among males(age 12-60)ai, significantly more than for opiates (0.7%)or for any other substance and equivalent to more than80% of all illegal drug use (3.6%). India has thus appar-ently a lower cannabis prevalence rate than the USA(monthly prevalence of 8.9% of the male US popula-tion in 2001) or several West European countries, but ahigher total number of male cannabis users than anyother country in the world (8.8 million male cannabisusers in India versus 7.6 million male cannabis users inthe USA in 2001). In terms of treatment demand (incl.
alcohol), 11.6% was cannabis related in India (2000),less than alcohol (43.9%) but more than heroin(11.1%), opium (8.6%) or any other drug. The high-est proportions of cannabis related treatment werereported from the states of Uttar Pradesh (20%) andBihar (19%) in northern India, bordering Nepal (a sig-nificant cannabis producer) and from the state of Kerala(16%) in southern India.
Excluding data for China and India, which have astrong weight for UNODC's Drug Abuse Trend Index,data for the rest of Asia show a basically stable trend overthe 1999-2002 period.
… mainly due to falling levels of cannabis use in South-East Asia
While increases were reported from Pakistan and Iran,reflecting Afghanistan's growing hashish production,South-East Asia (with the exception of China) was char-acterized by declining levels of cannabis consumption.Falling levels of cannabis use in 2002 were reported byIndonesia (just 1.4% of new drug users identified by theauthorities in Indonesia in 2002 were cannabis users),the Philippines and Myanmar. Cannabis consumptionlevels remained stable in Brunei Darussalam.Bangladesh and Nepal reported stable levels of cannabisconsumption. Stable levels of cannabis use were alsoreported from the Republic of Korea. Authorities inJapan, in contrast, reported some increase. Cannabisuse in Japan, however, continues to remain limited(annual prevalence of 0.1% of the population age 15and above in 2002; life-time prevalence: 1%).
OCEANIA
Characterized by falling levels of cannabis use in recentyears
UNODC's Drug Abuse Trend Index showed strongincreases in the Oceania region over the 1991-2000period. Over the 2000-2002 period, however, a simi-larly sharp decline was reported.
Fig. 131: Cannabis consumption trend in Asia basedon national experts' perceptions
-1
0
1
2
3
91 92 93 94 95 96 97 98 99 00 01 02
dru
g a
bu
se t
ren
d in
dex
Asia Asia - excluding China and India
Source: UNODC, Annual Reports Questionnaire Data.
ai) UNDCP, National Survey on Extent, Pattern & Trends of Drug Abuse in India, National Report 2002.

156
World Drug Report 2004 Volume I. Analysis
The index for the Oceania region reflects primarilyreported cannabis consumption in Australia. Annualprevalence of cannabis use, as reflected in householdsurveys, rose slightly between 1993 and 1995 and sig-nificantly between 1995 and 1998, but fell between1998 and 2001 by 28% to 12.9% among those age 14and above. The rate is thus still marginally higher thanin the USA (11% of those age 12 and above in 2002) orthe UK (10.9% of those age 16-59 in 2002/03), but thedifferences are far less significant than they used to be inthe late 1990s. Studies conducted among school stu-dents, age 15-16, revealed a life-time prevalence rate ofcannabis use of 20.6% in 2001 (ARQ) less than theresults of previous UN surveys. Similarly, drug testsamong detainees showed declines in cannabis use overthe 1999-2001 period. For 2002, however, there wereno indications that the downward trend continued.
In New Zealand the annual prevalence in cannabis useincreased slightly over the 1990-1998 period and
remained basically stable over the 1998-2001 period.With an annual prevalence rate of 20% among thoseage 15-45 in 2001, the prevalence rate in New Zealandwas largely the same as the prevalence of cannabis use inAustralia for this age group.
Fig. 132: Cannabis consumption trend in Oceaniabased on national experts' perceptions
0
1
2
3
4
5
91 92 93 94 95 96 97 98 99 00 01 02
dru
g a
bu
se t
ren
d in
dex
Source: UNODC, Annual Reports Questionnaire Data.
Fig. 133: Australia: Cannabis use in % of populationage 14 and above
12.7% 13.1%
17.9%
12.9%
0%
5%
10%
15%
20%
1993 1995 1998 2001
ann
ual
pre
vale
nce
in %
Source: AIHW, Statistics on Illicit Drug Use in Australia 2002
Fig. 134: Australia: Percent testing positive forcannabis among male police detainees*,1999-2002
40
45
50
55
60
65
Q1*
*Q
2**
Q3
Q4
Q1
Q2
Q3
Q4
Q1
Q2
Q3
Q4
Q1
Q2
Q3
Q4
1999 2000 2001 2002
Det
ain
ees
test
ing
po
siti
ve in
%
Percent of detainees testing positive forcannabis (4-sites)Percent of detainees testing positive forcannabis (7-sites)***Trend
* unweighted average of results from Bankstown, Parramatta,South
Port and East Perth.
** unweighted average of results from South-Port and East Perth only.
*** 4 sites mentioned above plus Adelaide, Brisbane and Elizabeth
Source: Australian Institute of Criminology, Drug Use Monitoringin Australia (DUMA).
Fig.135: New Zealand: Cannabis use among 15-45year olds
18%
21%20%
0%
5%
10%
15%
20%
25%
1990 1998 2001
An
nu
al p
reva
len
ce
Sources: APHRU, Drugs in New Zealand, Drug Use in New ZealandComparison Surveys 1990-1998 and APHRU, Drug Use in NewZealand: National Surveys Comparison 1998 & 2001, May 2002.

157
2. Trends Cannabis market
So
me
inc
re
as
e
La
rg
ein
cre
as
e
Str
on
gd
ec
lin
e
No
ta
va
ila
ble
So
me
de
cli
ne
Sta
ble
2001
2002
2002
1998
2002
2002
2002
2000
2002
2002
2002
2002
2002
2002
2000
2000
2002
2002
20
02
20
02
20
02
20
02
20
02
20
02
20
02
2000
1998
2002
2000
20
02
20
02
20
01
2002
20
02
20
00
20
02
20
02
2002
2002
2002
2000
2002
2002
2001
2000
2002
2002
2002
2002
2002
2002
2002
1999
2002
2002
2001
2002
2001
2002
2001
2002
2001
2002
2002
2002
2002
2002
2002
2002
2002
2002
1996
2001
2002
1999
2002
2001
2001
2001
2002
2002
2002
1997
2002
2002
1997
2001
2002
2002
1998
2002
2002
2001
2002
2001
2001
2002
2002
2001
2001
1997
2002
2002
2002 2
001
2002
2001
2002
2000
2001
2002
2002
2002
2002
1999
2002
2002
2002
2001
2000
2002
2002
2001
2001
2002
2002
2002
2002
1999
2002
2002
2001
2002
1999
1999
1998
2002
2002
Map
19:
Ch
ang
es in
use
of
can
nab
is, 2
002
(or
late
st y
ear
avai
lab
le)
Sour
ce:
UN
OD
C A
nnua
l Rep
orts
Que
stio
nnai
re D
ata
and
natio
nal r
epor
ts.