Embed Size (px)
Citation preview
2nd Annual International Interdisciplinary Conference, AIIC 2014, 8-12 July, Azores, Portugal Proceedings, Vol.3
2nd Annual International Interdisciplinary Conference, AIIC 2014, 8-12 July, Azores, Portugal Proceedings, Vol.3
PROCEEDINGS
2nd Annual International Interdisciplinary Conference, AIIC 2014
8-12 July 2014, Azores Islands, Portugal
(Conference place: University of the Azores, Ponta Delgada)

2nd Annual International Interdisciplinary Conference, AIIC 2014, 8-12 July, Azores, Portugal Proceedings, Vol.3
PROCEEDINGS
2nd Annual International Interdisciplinary Conference, AIIC 2014
8-12 July 2014, Azores Islands, Portugal
(Conference place: University of the Azores, Ponta Delgada)
European Scientific Institute, ESI (publishing)

2nd Annual International Interdisciplinary Conference, AIIC 2014, 8-12 July, Azores, Portugal Proceedings, Vol.3
Impressum Bibliographic information published by the National and University Library "St. Kliment Ohridski" in Skopje, Macedonia; detailed bibliographic data are available in the internet at http://www.nubsk.edu.mk/; CIP - 37(100)(062) 33(100)(062) COBISS. MK-ID 96954634 Any brand names and product names mentioned in this book are subject to trademark, brand or patent protection and trademarks or registered trademarks of their respective holders. The use of brand names, product names, common names, trade names, product descriptions etc. even without a particular marking in this works is in no way to be construed to mean that such names may be regarded as unrestricted in respect of trademark and brand protection legislation and could thus be used by anyone. PROCEEDINGS: 2nd Annual International Interdisciplinary Conference (2 ; 2014 ; Azores Islands) Proceedings. / 2nd Annual International Interdisciplinary Conference, AIIC 2014, 8-12 July, Azores Islands, Portugal European Scientific Institute, ESI, 2014.. - (554, 576, 479 p.) : ilust. ; 28 cm Kocani, Republic of Macedonia Email: [email protected] Printed in Republic of Macedonia ISBN 978-608-4642-26-8 Copyright © 2014 by the authors, ESI and licensors All rights reserved. 2014

2nd Annual International Interdisciplinary Conference, AIIC 2014, 8-12 July, Azores, Portugal Proceedings, Vol.3
PROCEEDINGS
2nd Annual International Interdisciplinary Conference, AIIC 2014
8-12 July 2014, Azores Islands, Portugal
(Conference place: University of the Azores, Ponta Delgada)

2nd Annual International Interdisciplinary Conference, AIIC 2014, 8-12 July, Azores, Portugal Proceedings, Vol.3
Table Of Contents: COMMUNICATION MANAGEMENT AMONG ATHLETE AND COACHES………1 Ezzeldin R. Aly TRENDS IN THE AD/HD EPIDEMIC IN NORWAY (1992–2011).................................14 Bjørg Mari Hannås EMERGENCY TROLLEYS: AVAILABLE AND MAINTAINED, BUT ARE THEIR LOCATIONS KNOWN? – CLOSING THE LOOP...........................................................31 Ahmed Kolkailah Sawsan Ghonaimy Naomi Cassells Allan Gillespie UTILIZATION OF DILATED EYE EXAMS AMONG ADULTS WITH DIABETES..............................................................................................................................35 DeLawnia Comer-HaGans Ning Lu Zo Ramamonjiarivelo STUDY THE ROLE OF MASS SPORTS AND PHYSICAL ACTIVITY IN A HEALTHY EGYPTIAN SOCIETY.....................................................................................46 Ezzeldin R. Aly HOW INTERPRETING BUSINESS PRINCIPLES THROUGH THE LENS OF “NEW SCIENCE” CAN HELP SOCIAL ORGANIZATIONS RESPOND TO GLOBAL AND LOCAL THREATS AND OPPORTUNITIES WHILE PROTECTING THEIR GOALS AND VALUES: A HEALTH CARE EXAMPLE OF SCIENTIFIC HUMANISM, COMPLEXITY, AND IMPLICATE ORDER....................................................................59 Dr. Paul Becker USE OF MEDICINAL PLANTS BY THE VILLAGERS OF TAPOTZINGO, NACAJUCA, TABASCO, MEXICO....................................................................................67 Miguel Alberto Magaña Alejandro Manuel Sanchez Mendoza Merly Iveth Magaña Rodríguez INSECURITY AND RIGHT TO HEALTH OF NIGERIANS: CHALLENGES AND SOLUTIONS...........................................................................................................................74 N.G. Egbue Nwankwo,Ignatius Uche THE DIFFERENCES IN OBESITY RATING BETWEEN BMI AND SKIN FOLD TESTING................................................................................................................................83 Ezzeldin R. Aly

2nd Annual International Interdisciplinary Conference, AIIC 2014, 8-12 July, Azores, Portugal Proceedings, Vol.3
DETERMINANTS OF CHILD IMMUNIZATION AND MEASURMENT OF GENDER BIAS......................................................................................................................93 Poulami Chatterjee HOW TO ALLOW FOR USER-CENTERED INNOVATION OVER AN ESTABLISHED INFORMATION INFRASTRUCTURE WITHIN AN INSTITUTIONALIZED CONTEXT.................................................................................103 Synnøve Thomassen Andersen TECHNOLOGY ADOPTION USING MEDICAL IMAGE PROCESSING TOOLS IN GLOBAL HEALTH SECTOR DEVELOPMENT...........................................................119 Dr. Venkatesh Jaganathan Thenmozhi Srinivasan Dr. Balasubramanie Palanisamy Priyesh Cherurveettil Aarthy Chellasamy Dr. T. Suganthalakshmi CHILDHOOD OBESITY IN THE UNITED STATES OF AMERICA……………….126 Ezzeldin R. Aly ASSESSMENT OF FOOD AND NUTRIENT INTAKE OF COMMUNITIES ACROSS THREE AGRO-BIODIVERSITY HOTSPOTS IN INDIA.............................................135 Prabhakaran T. Raghu Kalaiselvan N.N. Arivudai Nambi V. Chandra Guptha B. Mahana R.K. Venkatesan.G. Arunraj R. Maria Philip P.I. EYE TRACKING AND AUTONOMIC NERVOUS SYSTEM REACTIVITY DURING PERCEPTION OF VISUAL ENVIRONMENTS OF DIFFERENT COMFORT........148 Zvyagina Natalya Sokolova Lyudmila Morozova Lyudmila Lukina Svetlana Cherkasova Anna THE ANALYSIS OF BLOOD DEFECTION AND ITS COMPONENTS IN SYSTEM OF MEASURES FOR THE PREVENTION OF INFECTION WITH TRANSFUSION AND TRANSMISSIBLE INFECTIONS...........................................................................157 Kamal Tashtemirov Sagit Imangazinov Olga Tashtemirova Saule Imangazinova

2nd Annual International Interdisciplinary Conference, AIIC 2014, 8-12 July, Azores, Portugal Proceedings, Vol.3
EVALUATION OF THE EFFECTIVENESS OF PHYSIOTHERAPY BASED ON THE LOCATION THE JOINT CHANGES IN RHEUMATOID ARTHRITIS....................166 Agnieszka Krawczyk-Wasielewska Ewa Mojs Roksana Malak Przemysław Keczmer Piotr Kalmus Dariusz Łucka Włodzimierz Samborski SACROILIAC JOINT SYNDROME – DESCRIPTION OF PAIN ETIOLOGY.........170 Agnieszka Krawczyk-Wasielewska Elżbieta Skorupska Ewa Mojs Roksana Malak Przemysław Keczmer Piotr Kalmus Włodzimierz Samborski SCREENING FOR IODINE DEFICIENCY – MORE THAN A MEDICAL APPROACH.........................................................................................................................175 Carmen Vulpoi Maria-Christina Ungureanu Doina Azoicai Iuliana Vulpoi-Naghel Mihaela Cristina Anton Cristina Preda ANTERIOR RECURRENT EPISTAXIS FROM KIESSELBACH'S AREA...............180 Neven Skitarelić Željko Čulina Ivan Bačić Nataša Skitarelić RECOMMENDATIONS OF THE ALZHEIMER'S DISEASE INTERNATIONAL CONCERNING THE CARE OF PATIENTS WITH DEMENTIA AND THE SITUATION IN POLAND..................................................................................................184 Agnieszka Krawczyk-Wasielewska Roksana Malak Ewa Mojs José C. Millán-Calenti Ana Maseda Rikke Gregersen Kirsten Maibom

2nd Annual International Interdisciplinary Conference, AIIC 2014, 8-12 July, Azores, Portugal Proceedings, Vol.3
ASSOCIATION BETWEEN TOXOPLASMA GONDII INFECTION IN WOMEN AND THE PRESENCE OF CARDIOLIPIN AND PHOSPHOLIPID ANTIBODIES.......................................................................................................................190 Noaman N. A'aiz Baqur A. Sultan Sabah M. Al-Fatlawi Abdulkareem A. Mahmood GROWTH STIMULATING EFFECTS OF ASPILIA AFRICANA FED TO FEMALE PSEUDO-RUMINANT HERBIVORES (RABBITS) AT DIFFERENT PHYSIOLOGICAL STATES.............................................................................................194 NseAbasi N. Etim Edem E. A. Offiong M. E. Williams SCREENING OF GASTRO-INTESTINAL TRACT’S MALIGNANT NEOPLASMS.......................................................................................................................200 Olga Tashtemirova Tolebay Rakhypbekov Kamal Tashtemiro Gulzhanat Dzhakova Sabit Zhusupov ANTERIOR RECURRENT EPISTAXIS FROM KIESSELBACH'S AREA...............205 Neven Skitarelić Željko Čulina Ivan Bačić Nataša Skitarelić EARLY DEVELOPMENT OF CORONARY ARTERY DISEASE AT A YOUNG WOMAN...............................................................................................................................209 G.D. Abilmazhinova A.M. Mussin M.I. Madiyeva QUALITY OF LIFE FOLLOWING CANCER TREATMENT.....................................216 Dr. Ferdous Ara Islam THE EFFECT OF PSEUDOMONAS AERUGINOSA SIGNAL QUINOLONE ON THE RHAMNOLIPIDS BIOSYNTHESIS AND RHAMNOSYLTRANSFERASE 2 ACTIVITY............................................................................................................................223 N.B. Galkin Mukhlis Abedalabas E.Yu. Pachomova T.O. Filipova

2nd Annual International Interdisciplinary Conference, AIIC 2014, 8-12 July, Azores, Portugal Proceedings, Vol.3
BIOLOGICAL RESPONSE OF COWPEA BRUCHID, CALLOSOBRUCHUS MACULATUS (FAB.) (COLEOPTERA: BRUCHIDAE) TO COUMARIN EXTRACTS..........................................................................................................................229 Ismail, I. A. S. E. El-Gengaihi A. Affifi STUDY OF THE CONTAMINATING MICROBIOTA OF OLD PAPER SUPPORTS..........................................................................................................................237 Simona Isabela Dunca Catalin Tanase Claudia Padurariu Tiberius Balaes Elena Ardelean Nicoleta Melniciuc Puica STUDY ON THE ANTIOXIDANT ACTIVITY DURING THE FORMULATION OF BIOLOGICAL ACTIVE INGREDIENT..........................................................................252 Zsófia Edit Pápay PharmD István Antal PharmD EMBRYONIC AND LARVAL DEVELOPMENT OF SILVER BARB (BARBODES GONIONOTUS) IN A MOBILE HATCHERY UNDER LABORATORY CONDITION........................................................................................................................258 Siddhwartha Kumar Basak Biplop Basak Nipa Gupta Mohammad Mahfujul Haque Md. Ruhul Amin COMPARATIVE TREND ANALYSIS IN COST OF PADDY CULTIVATION AND PROFITABILITY ACROSS THREE STATES OF INDIA............................................271 Chandra Guptha B Prabhakaran T. Raghu Aditi N. Kalaiselvan N.N. Arivudai Nambi V. A REGRESSION MODEL FOR THE TONS OF PRUNING PER HECTARE...........281 Ana María Martínez-Rodríguez Francisco Javier Gallego Julio Terrados Eulogio Castro MODELING AND FORECASTING OF BEEF, MUTTON, POULTRY MEAT AND TOTAL MEAT PRODUCTION OF PAKISTAN FOR YEAR 2020 BY USING TIME SERIES ARIMA MODELS................................................................................................285 Shakeel Nouman Masood Amjad khan

2nd Annual International Interdisciplinary Conference, AIIC 2014, 8-12 July, Azores, Portugal Proceedings, Vol.3
USING SHUTTLE RADAR TOPOGRAPHIC MISSION IMAGERY TO IDENTIFY INLAND VALLEY AREAS AND THE SOIL SUITABILITY STUDIES FOR VEGETABLE PRODUCTION IN AKURE SOUTH LOCAL GOVERNMENT AREA NIGERIA..............................................................................................................................297 Francis Omotayo Adekayode THE TEA TIME HAS CHANGED IN AZORES............................................................305 Por Mário Moura QUANTUM MODELING OF CAPACITOR ENERGY DENSITY..............................321 Adam G. Tournier RULE-BASED PREDICTION OF SHORT TERM ELECTRIC LOAD......................325 Petr Berka HEAT PUMPS AND COST OPTIMAL BUILDING PERFORMANCE......................330 Henrik Gjerkeš Marjana Šijanec Zavrl Gašper Stegnar APPLICATION OF STATISTICAL PROCESS CONTROL THEORY IN COAL AND GAS OUTBURST PREVENTION.....................................................................................340 Shaojie Hou Yuwei Zhang Yuanping Cheng TOPOLOGICAL INFLUENCE FROM DISTANT FIELDS ON TWO-DIMENSIONAL QUANTUM SYSTEMS.........................................................................348 Konstantinos Moulopoulos OPTICAL ILLUMINATION WATERMARKING USING DB WAVELET................364 Parvinder Singh Meenakshi Chhikara NEW MATERIALISM - THE TRANSFORMATION OF INTELLIGENT TEXTILES TOWARDS AN INTERACTIVE YOUSER GENERATED INTERFACE...................371 Bettina Schülke THE SYMMETRY AS INTERDISCIPLINARY FACTOR THROUGH ITS APPLICATION AND HISTORY.......................................................................................378 Helena Melo MATRICES THAT DEFINE SERIES OF PYTHAGOREAN TRIPLES THAT HAVE A TRIANGLE WITH ONE IRRATIONAL SIDE AS LIMIT........................................388 Martin William Bredenkamp CONTRIBUTION TO IMPULSIVE EQUATIONS.........................................................393 Berrabah Fatima Zohra

2nd Annual International Interdisciplinary Conference, AIIC 2014, 8-12 July, Azores, Portugal Proceedings, Vol.3
WHY CASTING OUT NINES?..........................................................................................398 Ana Paula Garrão Margarida Raposo Dias AN INNOVATIVE SERVICE FOR SUSTAINABILITY IN BRAZIL: THE PANTANAL BRAZIL WEB SITE CASE.........................................................................404 Beatriz Marcondes de Azevedo Rolf Hermann Erdmann Fred Leite Siqueira Campos Maria Augusta Graeff CONCEPTUAL VISION OF AIRPORT GEOGRAPHIC INFORMATION SYSTEM (AGIS)....................................................................................................................................417 Anwer Moayed Anwer Asma Thamir Ibraheem CLOUD COMPUTING AND SECURITY OF INFORMATION ASSETS..................428 Ing. Miloslav Macháček NUMERICAL APPLICATIONS OF THE METHOD OF HURWITZ-RADON MATRICES..........................................................................................................................436 Dariusz Jacek Jakóbczak TESTABILITY OF INFORMATION LEAK IN THE SOURCE CODE FOR INDEPENDENT TEST ORGANIZATION BY USING BACK PROPAGATION ALGORITHM......................................................................................................................447 Al-Khanjari, Z. Alani, A. SUSTAINABILITY IN INFORMATION SYSTEMS AUDITING................................458 Alifah Aida Binti Lope Abdul Rahman A.Al-Nemrat D.S. Preston EFFECTIVENESS OF OMALIZUMAB IN THE TREATMENT OF CHRONIC RHINOSINUSITIS WITH NASAL POLYPS: SYSTEMATIC REVIEW……………473 Tiago Soares Santos Vítor F Certal Paulo Gonçalves Carlos Carvalho
2nd Annual International Interdisciplinary Conference, AIIC 2014, 8-12 July, Azores, Portugal Proceedings, Vol.3
1
COMMUNICATION MANAGEMENT AMONG ATHLETE AND COACHES
Ezzeldin R. Aly, PhD Assistant Professor, of Health and Movement Science & Sport Manageemnt,
Graceland University
Abstract This study examines how managers and coaches manage communication with athletes in team and individual sports. Communication is a process that requires a wide range of skills. We develop verbal and non-verbal communication in various ways. Communication is a critical element in the relationship between coaches and athletes in team and individual sports, and also between managers, referees, scorers, and other officials, yet there is little extant research in sport management that involves direct measures of Development Communication Management (DCM). In this study the researcher is looking for the process of communication which makes message interpretation more reliable. The researcher surveyed over 200 athletes and 14 head coaches in the Wisconsin Intercollegiate Athletic Conference (WIAC) to find some foundations for DCM. To aid the development of communication management with team sports, individual sports, coaches, referees, scorers, and others to enhance the management performance of communication. We looked at ways in this study to increase and make progress in the DCM. The researcher found ways to improve the management of communication before, during and after the sport events. DCM needs to be organized inside the team, so the coaches and managers can communicate effectively with athletes, colleagues, referees, scorers and other officials. Data was collected using two questionnaires designed by the researcher – one for coaches and one for athletes -- that employed a 5.0 Likert scale. The researcher used MANOVA models to test for significant differences between coaches and athletes, between genders, team, and individual sports. The significance level was set at p^.05. This study found a significant difference between male and female athletes in terms of their use of special gestures or signs during games or competition. On average males were neutral to slightly in agreement regarding the use of special gestures or signs while females were in slight disagreement. With the results related to communication styles, on average female athletes indicated that visual communication is their fastest mode of communication. On the other hand, they indicate that they were in slight disagreement regarding the use of special gestures or signs. This apparent inconsistency was a potential opportunity for DCM. A natural recommendation is to increase the use of special signs and gestures for female athletes. The results from the present study indicate that there are marked differences in communication practices of coaches and athletes and between team and individual sports. The results suggest that to aid in the development of communication management within team sports, coaches and athletes should determine what the fastest mode of communication is. Rather than watching for a visual sign, an athlete may instead be listening for a verbal cue if their coach finds verbal communication to be faster than visual. In this way, the coaches and athletes can progress in DCM. Knowing the best time to communicate will lead to DCM as a coach or manager uses DCM whenever it is necessary and beneficial for the athletes to encourage and motivate the athlete to do their best during their event.
2nd Annual International Interdisciplinary Conference, AIIC 2014, 8-12 July, Azores, Portugal Proceedings, Vol.3
2
There is a significant difference between team and individual athletes in terms of who they communicate with most frequently (p-value < .001). Athletes of team sports agreed that they communicate most with their coaches while athletes of individual sports agreed that they communicate most with their teammates (Turman, Paul; D 2008). However, there are no significant differences between male and female athletes in terms of who they communicate with the most. The researcher found that knowing the best communication development, style and timing between managers and coaches with athletes and officials in the WIAC can serve as a foundation for DCM principles and recommendations and can help promote the NCAA Division 3 conference.
Keywords: Coaches, communication, management Introduction Communication is a process that requires a vast repertoire of skills. We develop verbal and non- verbal communications in various ways. It is a critical intermediary of performance between coaches and athletes in team and individual sports, yet there is little extant research in sports that involves direct measures of communication. In this study the researchers looking for the model of communication which perhaps makes message interpretation more reliable. This study investigated player-coach communication – specifically we were interested in the impact that coaches’ use of Development Communications Management (DCM) before, during, or after the game. We wanted to find out the most effective way that coaches communicate with players, and if coaches and players prefer the same kind of communication. Literature of review The processes involved in communications are listening, observing, questioning, analyzing, and evaluating. Therefore, that means through communication, cooperation may occur (Wark, M., 1997). This study explored a new theory of the Development of Communication Management (DCM) In order to know what style of communication is the most frequently used by coaches (Dale, G. A., Wrisberg, C.A. 1996). Winning teams communicate twice as many messages as losing teams (Smith, F., Ethigtion, and Li, 2005). In this study researchers investigated the athletes and coaches styles of communication. Specifically, we were interested in the impact of coaches’ uses of DCM which occur before, during, and/or after the game. We were also interested in determining the best style for coaches to use to communicate with their athletes, so the athletes would understand their coaches and increase performance. The participants were college undergraduate students who had competed in the Wisconsin Intercollegiate Athletic Conference (WIAC). The students completed a questionnaire related to development of communication, communication styles, and communication timing. The researchers measured the differences between the team and individual athletes and coaches. Results of the questionnaire were used to describe the best communication styles used between athletes and coaches. While DCM has allowed better understanding of actual and preferred coaching behaviors across a number of sports settings, the process nature of communication between between coaches and athletes has remained largely overlooked. How coaches communicate with their players is similar to how players communicate with their coaches from the perspective of training and motivating their teams to high performance. Turner and Schrodt (2004) stated that “instilling and appreciation for organized
2nd Annual International Interdisciplinary Conference, AIIC 2014, 8-12 July, Azores, Portugal Proceedings, Vol.3
3
team activities, sportsmanship and a sense of satisfaction in their athletes through communication are goals equally worthy of coaching (p. 131). They investigate the relationship between coaches’ leadership behaviors and athletes’ affective learning. (Bain & Wendt, 1983; Chelladwai, Kuga & O’Bryant, 1999; Turman, 2001, 2003). By studying how coaches communicate with their players the potential exists to identify how coaches can adapt their communication in order to be more effective, given that how coaches communicate has a direct influence on how players perform and behave (Horn, 2002). Smith, Fry, Ethrington and Li (2005) found that when coaches provide positive feeback to their players, the players are more willing to work harder and sacrifice for the team, while negative feedback was related to less teamwork amongst the players on the team. Positive and supportive feedback from coaches also leads to greater player self-efficacy, intrinsic motivation, and teach cohesion (Horn, 1985, 2002). These findings provide support to the claim by Bain and Wendt (1983) and Haselwood et al. (2005) that communications skills are the most important skills for coaches to possess. The purpose of this study is to indicate development of communication, the communication style, and communication timing, of coaches and athletes in both team and individual sports to guide the principles for DCM that can lead to success. DCM needs to be organized inside the team, so the coaches can communicate effectively with their athletes. Several previous studies related to communication in sports focused on attitudes and perceptions between coaches and athletes for team sports. On one hand, for individual events, the previous research focused on the athletes as individuals and overlooked the importance of teamwork and intra-team communication. However, in this current study the results show that in an individual sport, swimmers rely on their teammates more often than on their coaches. The coaches’ styles of communication were similar to those of the athletes. However, coaches and athletes differed in their perception of training and motivation. It has been reported by Mensch, J., Crews, C., Mitchell, M. (2005) and Schubiger, (1993) that college and high school athletes perceived their coaches to use significantly more social support and training. (Hastie, 1993) found no effects of athletes’ satisfaction with communication, and Schliesman, (1987) found athletes’ perceptions of democratic and social support behaviors to contribute to significant variance, while Chelladureir, (1984) identified perceptions of training and instruction and positive feedback to be significant predictors of satisfaction among athletes. Gardner, L., Light B., and Bostrom (1996) and Westre and Weiss (1991) similarly concluded that teams with high level of cohesion or consistency were likely to perceive their coaches as using relatively high levels of training and instruction. No significant differences in athletes’ perceptions were found when comparing male and female athletes (Eichas, 1993) male and female coaches (Tastie, 1993), type of sport (Lpnmorot, 2002) or nationality. To explore coaches self-perceptions of their styles of communication (Bennett & Manne Val, 1988); (Dwyer, Fisher, 1988, 1990; Lam 1995) male coaches saw themselves using more positive feedback while coaching male teams than when coaching female teams (Mondello ,J. 2001). While communication has allowed better understanding of actual and preferred coaching behaviors across team and individual sports settings, the process nature of communication between coaches and athletes has remained largely overlooked Hastie, (1993). Methods and procedures To assist in the collection of data, we had the approval from the Internal Review Board at the University of La Crosse, on December 22nd, 2008. The coaches filled out a questionnaire related to the coach’s development of communication, the communication style, and communication timing. Each coach conducted an initial meeting with their athletes

2nd Annual International Interdisciplinary Conference, AIIC 2014, 8-12 July, Azores, Portugal Proceedings, Vol.3
4
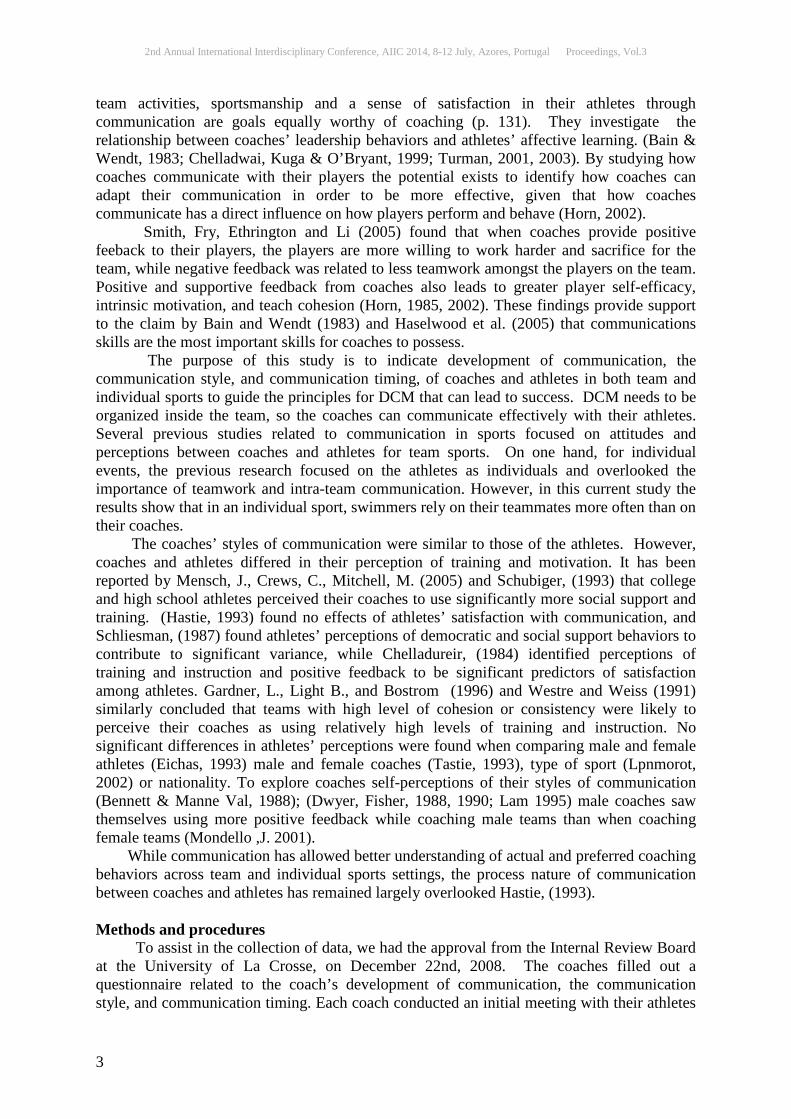
to describe the purpose and rationale for this study. Those athletes who agreed to participate were asked to return a parental consent statement signed by a legal guardian. Athletes completed the questionnaire one time during their season. Questionnaires were enclosed in envelopes, which were sealed to ensure confidentiality for the athletes. The athletes were then asked to return the questionnaire to their coaches. A 28 item questionnaire was completed by 14 coaches. (See Appendix A) The coaches included nine males and five females; eight coaches of team sports and six coaches of individual sports. A similar 27-item questionnaire was completed by 208 student athletes. (See Appendix B)This sample included 110 male and 98 female athletes; 106 team athletes and 102 individual athletes. All questionnaire responses were given on a 5.0 Likert scale with 1 = strongly disagree, 2 = disagree, 3 = neutral, 4 = agree, and 5 = strongly agree. The male team athletes were from football teams, the female athletes were from volleyball teams, and the individual athletes were swimmers. The items on the questionnaire given to the athletes and the coaches fall into three categories: development of communication, communication style, and communication timing. Statistical Method and analyze the data, Multivariate analysis of variance (MANOVA) models were used to test for differences between types of sport (team and individual), genders, and roles (coach and athlete). A separate MANOVA model was applied to each subset of questionnaire items – those related to the development of communication, communication styles, and communication timing. The MANOVA models included the questionnaire responses as dependent variables. The questionnaire items related to communication styles and communication timing were common to both coach and athlete questionnaires, so the MANOVA models applied to these items included gender, type of sport, and role (coach or athlete) as independent variables. The questionnaire items related to the development of communication were different for coaches and athletes, so separate MANOVA models were applied to the coach and athlete responses with gender and type of sport treated as independent variables. The models tested for main effects and for two-way interactions. Results Development of Communication There is a significant difference between team and individual athletes in terms of who they communicate with most frequently (p-value < .001). Athletes of team sports agreed that they communicate most with their coaches while athletes of individual sports agreed that they communicate most with their teammates Turman, Paul; D (2008). However, there are no significant differences between male and female athletes in terms of who they communicate with the most. Athletes of both types of sports, team and individual, and both genders agreed on average that communication enhances performance (p-value = .879). There is a significant difference between male and female athletes in terms of their communication with the scoring table or referee. On average, females tend to agree that they communicate most with the scoring table or referee while males tend to disagree slightly on average (p-value < .001). Both males and females disagree on average that communication affects winning or losing, however females tend to disagree significantly more strongly (p-value = .011). There is a significant difference between male and female athletes in their use of special signs and gestures. Males agree slightly on average that they use special signs while females disagree slightly on average (p-value < .001). There are no significant differences in average responses between male and female coaches on questionnaire responses that deal with development of communication (p-values > .073). There is a significant difference between coaches of individual and team sports in
2nd Annual International Interdisciplinary Conference, AIIC 2014, 8-12 July, Azores, Portugal Proceedings, Vol.3
5
tracking of communication and in beliefs that communication enhances performance. Coaches of individual sports agree that they track communication during competition while coaches of team sports tend to slightly disagree (p-value = .011). Coaches of team sports agree that communication enhances performance and coaches of individual sports are more neutral (p-value = .006). All coaches agree on average that their communication at away games is effective, that their communication is different depending on whether they are calm or nervous, that they use special signs, and that they would rather communicate with one athlete during competition. All coaches are neutral or in slight agreement that they would rather communicate with the whole team during competition.
Figure 3 Average level of agreement for athletes to DCM questionnaire items related to the development of communication.
Figure 3 Average level of agreement for coaches to DCM questionnaire items related to the development of communication.
0
1
2
3
4
5
Coaches-Development of Communication
Team
Individual
2nd Annual International Interdisciplinary Conference, AIIC 2014, 8-12 July, Azores, Portugal Proceedings, Vol.3
6
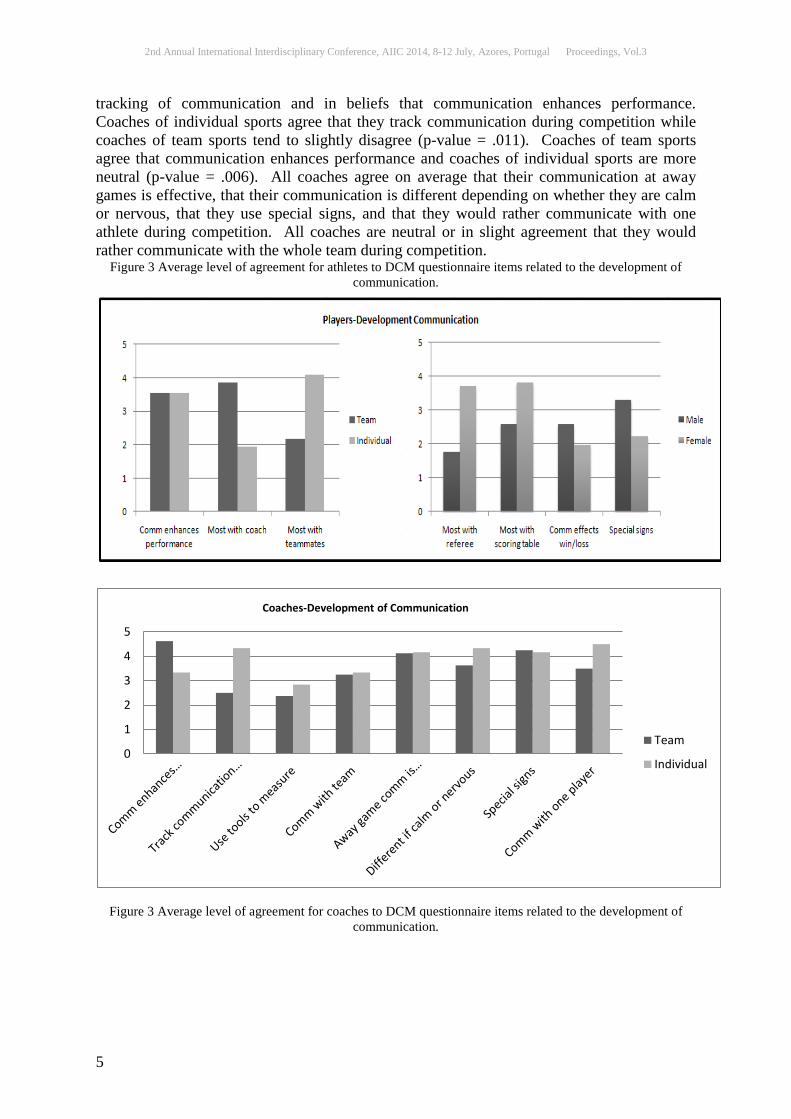
Communication Styles Regarding communication styles, there are some significant differences between males and females and between coaches and athletes. However, no significant differences were detected between team and individual sports. Athletes and coaches on average agreed that their communication styles were visual and verbal. There is a significant interaction between gender and role (coach or athlete) in terms of nonverbal communication. On average, male coaches disagreed that their communication style is non-verbal, while female coaches and athletes of both genders were more neutral regarding non-verbal communication (p = .026). All groups agreed that they used more than one communication style during competition (p-value = .163). Regarding the fastest mode of communication during competition, coaches showed a preference for verbal communication, followed by visual or non-verbal. Male athletes showed equal preference for visual and verbal communication as being the fastest mode over non-verbal communication. Female athletes preferred visual communication as fastest, followed by verbal and non-verbal communication. This difference in preferences for males and females is statistically significant (p-value < .001).
Figure 4 Average level of agreement for male coaches and athletes to DCM questionnaire items related to
communication styles.
Figure 5 Average level of agreement for female coaches and athletes to DCM questionnaire items related to
communication styles.
1
2
3
4
5
Aver
age
Leve
l of A
gree
men
t
Questionnaire Items
Player
Coach
1
2
3
4
5
Aver
age
Leve
l of A
gree
men
t
Questionnaire Items
Player
Coach
2nd Annual International Interdisciplinary Conference, AIIC 2014, 8-12 July, Azores, Portugal Proceedings, Vol.3
7
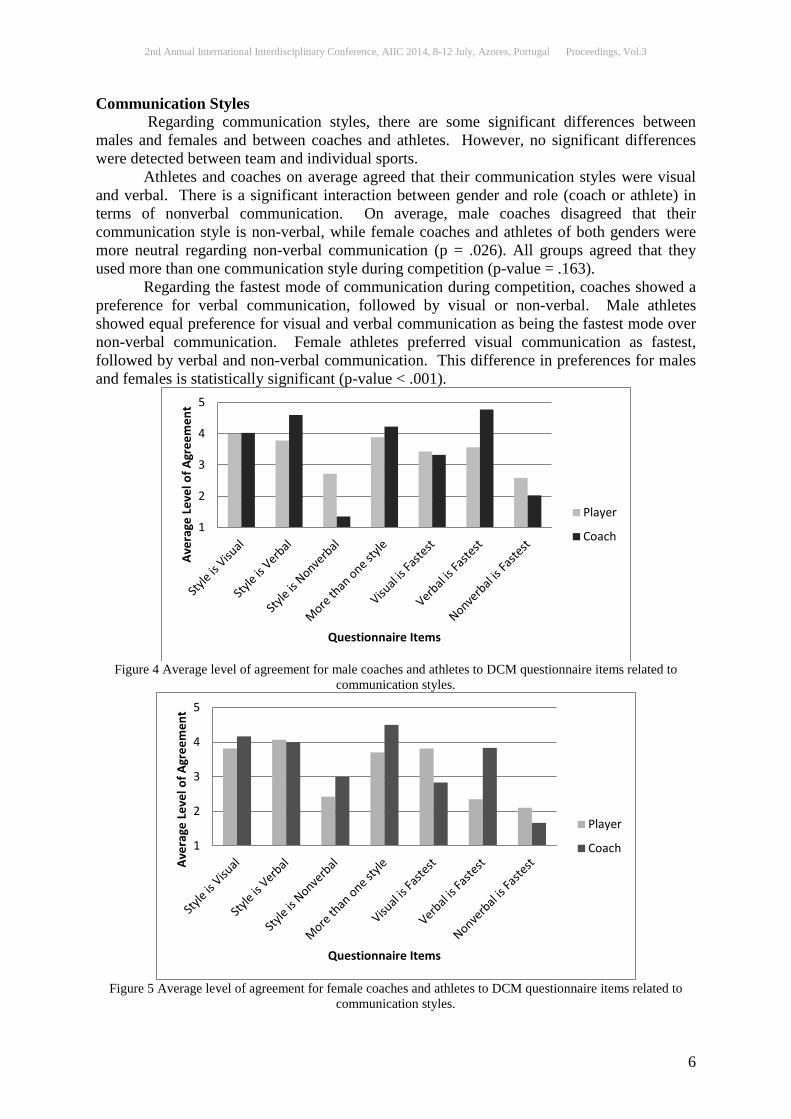
Communication Timing On average coaches agreed significantly greater than athletes regarding the focus of their communication both before (p-value < .001) and after (p-value = .023) competition. On average, athletes and coaches of both team and individual sports were in slight agreement that they increased communication when winning. However, there is a significant difference between coaches of team and individual sports in terms of their use of communication when losing. When losing, coaches of team sports on average agreed slightly that they increase communication while coaches of individual sports disagreed slightly (p-value = .002). There is a significant interaction between team role and type of sport with regard to coaches and athletes contacting one another after competition. Athletes of both team and individual sports agreed on average that they contacted their coach after competition. The coaches of team sports agreed that they contacted their athletes after competition while coaches of individual sports disagreed (p-value = 0.043).
Figure 6 Average level of agreement for team coaches and athletes to DCM questionnaire items related to
communication timing.
Figure 7 Average level of agreement for individual coaches and athletes to DCM questionnaire items related to
communication timing.
1
2
3
4
5
Aver
age
Leve
l of A
gree
men
t
Questionnaire Item
Athlete
Coach
1
2
3
4
5
Aver
age
Leve
l of A
gree
men
t
Questionnaire Item
Athlete
Coach
2nd Annual International Interdisciplinary Conference, AIIC 2014, 8-12 July, Azores, Portugal Proceedings, Vol.3
8
Discussion Development of communication The study found that there was a significant difference between team and individual athletes in terms of who they communicate with most often during competitions. Team athletes agreed that they communicated most with their coaches rather than teammates, while individual athletes agreed that they communicated most with their teammates rather than their coaches (Donohue, Brad et al., 2007), (Weiss, Maureen R.; Fretwell, Susan D. 2005). Within team sports, the team had a plan set by the coach going into the game. It was not in the best interest of the team for athletes to discuss or change the plan set by the coach in the midst of competition. This structure promotes communication occurring primarily with coaches rather than between athletes in team sports. However, individual athletes had minimal contact with their coaches during competition. Communication between coaches and athletes in individual sports usually occurs well before competition rather than immediately before the competition. Thus individual athletes tended to rely on their teammates for encouragement and cheering as they went into competition. This present study found a significant difference between male and female athletes in terms of their use of special gestures or signs during games (or competition). On average males were neutral to slightly agreeing regarding the use of special gestures or signs while females were in slight disagreement. Within the results related to communication styles, on average female athletes indicated that visual communication is their fastest mode of communication. On the other hand, they indicated that they were in slight disagreement regarding the use of special gestures or signs. This apparent inconsistency was a potential opportunity for DCM. A natural recommendation is to increase the use of special signs and gestures for female athletes. Communication styles According to the statistical results, of the present study there are some significant differences in communication styles between males and females and between coaches and athletes. However, no significant differences were detected between team and individual sports. This study indicated that athletes and coaches on average agreed that their communication styles were visual and verbal. Male coaches indicated that they did not use non-verbal communication, while all other groups were neutral regarding the use of non-verbal communication. (Canal-Bruland, Rouwen; Strauss, Bernd 2007), (Haselwood, Joyner, Burke, Geyerman, Czech, Munkasy, Zwald, 2005), (Antonini Philippe, Roberta; Seiler, Roland 2006) The statistical analysis of the questionnaire indicates that all groups agreed that they used more than one communication style. Regarding the fastest mode of communication, coaches showed a preference for verbal communication. Male athletes showed equal preference for visual and verbal communication as fastest, while female athletes preferred visual communication over verbal as being the fastest. Chand, V. (2005) Communication Timing Coaches are more focused in their communication before and after competition than athletes Carter, Adam D.; Bloom, Gordon A. (2009) When winning, all coaches are in slight agreement that they increase communication. When losing, coaches of team sports tended to increase communication. In individual sports (such as swimming), there is not an opportunity to increase communication when losing (physically coaches and athletes are not near each other, swimming events short in duration so hard to have a “come-back”). (Antonini Philippe 2006).

2nd Annual International Interdisciplinary Conference, AIIC 2014, 8-12 July, Azores, Portugal Proceedings, Vol.3
9
The questionnaire suggested that athletes of both team and individual sports agreed that on average they contacted their coaches after competition. The coaches of team sports agreed that they contacted their athletes after competition while coaches of individual sports disagreed that they contacted their athletes after competition. Practical Implications Development of communication, Communication styles, Communication Timing The results from this study indicate that there are marked differences in the communication practices of coaches and athletes and between team and individual sports. The results suggest that to aid in the development of communication within team sports, coaches and athletes should determine what the fastest mode of communication is. Rather than watching for a visual sign, an athlete may instead be listening for a verbal cue if their coach finds verbal communication to be faster than visual. In this way, the coaches and athletes can progress in DCM. What is best time to communicate? Knowing the best time to communicate will lead to DCM to communicate as a coach whenever it is necessary and beneficial for the athletes to encourage and motivate the athletes to do their best during their event. Limitations and Future Research While this research did provide many useful insights, it is not without limitations. The study included coaches and athletes from a relatively small geographic region, Division III athletes from the state of Wisconsin. Results of this study are limited to this population. Additionally, the team athletes in the study were volleyball (female) and football (male) teams and the individual athletes were all swimmers. Further research is necessary to determine if our results generalize to other types of sports such as soccer, golf or diving. The number of coaches who completed surveys for the study was somewhat small (n = 14). More insight could be gained with a larger sample of coaches in a future study. Despite these limitations, the study is strong in that the coaches and athletes participating in the study from the WIAC may benefit from the recommendations for DCM. The current study provided many insights regarding communication between coaches and athletes that serve as a foundation for DCM principles and recommendations. References: Agne, R. R., & White, C.H. (2009) Communication practices of coaches during mediator training Addressing issues of knowledge and enactment. Conflict Resolution Quarterly, Vol. 27 Issue 1, p. 83-105. Antonini, P., R., Seiler, R. (2006). Closeness, co-orientation and complementarity in coach–athlete relationships what male swimmers say about their male coaches.Psychology of Sport & Exercise, Vol. 7 Issue 2, p159-171. Bekiari, A., Patsiaouras, A., Kokaridas, D., Sakellariou, K. (2006) Verbal Aggressiveness and State Anxiety of Volleyball Athletes and Coaches. Psychological Reports, Vol. 99 Issue 2, p.630-634. Bennett, G., & Maneval, M. (1998). Leadership styles of elite Dixie Youth baseball coaches. Perceptual and Motor Skills, Vol. 87 Issue 3, p754-768. Canal, B., Rouwen, S. B. (2007). Guiding visual attention verbal instructions vs. flicker cueing. Journal of Sport & Exercise Psychology, Vol. 29, pS58-S58. Carter, A., Bloom, G. A. (2009). Coaching Knowledge and Success Going Beyond Athletic Experiences. Journal of Sport Behavior, Vol. 32 Issue 4, p419-437. Chand, V. (2005). Gender and Communication Communication Strategies for Athletes. Current Anthropology, Vol. 46 Issue 4, p499-499.

2nd Annual International Interdisciplinary Conference, AIIC 2014, 8-12 July, Azores, Portugal Proceedings, Vol.3
10
Chelladurai, P. (1984). Discrepancy between preferences and perceptions of leadership behavior and satisfaction of athletes in varying sports. Journal of Sport Psychology, Issue 6, p27-41. Cumming, S. Smoll, F. L ., Smith, R. E.; Grossbard, J. R. (2007) Is Winning Everything? The Relative Contributions of Motivational Climate and Won-Lost percentage in Youth Sports. Journal of Applied Sport Psychology, Vol. 19 Issue 3, p322-336. Dale, G. A., Wrisberg, C. (1996). The Use of a Performance Profiling Technique in a Team Setting Getting the Athletes and Coach on the "Same Page" Sport Psychologist, Vol. 10 Issue 3, p261-277. Donohue, B., Miller, A., Crammer, L., Cross, C., Covassin, T. (2007). A Standardized Method of Assessing Sport Specific Problems in the Relationships of Athletes with Their Coaches, Teammates, Family, and Peers. Journal of Sport Behavior, Vol. 30 Issue 4, p375-397. Dwyer, J.M., Fisher, D. G. (1988). Leadership style of wrestling coaches. Perceptual and Motor Skills, Vol. 67, p706-720. Dwyer, J.M., Fisher, D. G. (1990). Wrestlers’ perceptions of coaches’ Leadership as predictors of satisfaction with leadership. Perceptual and Motor Skills, Vol. 71, p511-517. Eichas, T. M. (1993). Relationships among perceived Leadership styles, member satisfaction and team cohesion in high school basketball teams. Unpublished master’s thesis, Bowling Green State University, Bowling Green, Ohio. Frederick, C. M.; Morrison, C. S. (1999) Collegiate Coaches An Examination of Motivational Style and its Relationship to Decision Making and Personality. Journal of Sport Behavior, Vol. 22 Issue 2, p221-233. Gardner, D. E., Light-Shields, D. L., Light- Bredemeier, B. J., & Bostrom, A. (1996). The relationship between perceived coaching behaviors and team cohesion among baseball and softball players. Sport Psychologists, Vol. 10 Issue 4, p367-381 Gould, D., Collins, K., Lauer, L., Chung, Y. (2007) The influence of Athlete Sex, context , and Performance on High School Basketball Coaches’ Use of Regret Messages During Competition. Communication Education, Vol. 56 Issue 3, p333-353. Haselwood, D.M., Joyner, A. B., Burke, K. L., Geyerman, C. B., Czech, D. R., Munkasy, B. A., Zwald, A. D. (2005) Female Athletes' Perceptions of Head Coaches' Communication Competence. Journal of Sport Behavior, Vol. 28 Issue 3, p216-230. Hastie, P. A. (1993). Coaching preferences of high school girl volleyball players. Perceptual and Motor Skills, Vol. 77, p1309-1310. Jin W., Li C., Jian C. J. (2004) Athletes’ Perceptions on Coaches’ Behaviors and Competitive Situations at Collegiate Level. International Sports Journal, Vol. 8 Issue 2, p1-14. Martin, M., Rocca, K. A., Cayanus, Jacob L.; Weber, K. (2009) Relationship between Coaches' use of Behavior Alteration Techniques and Verbal Aggression on Athletes’ Motivation and Affect. Journal of Sport Behavior, Vol. 32 Issue 2, p227-241. Mensch, J., Crews, C., Mitchell, M. (2005) Competing perspectives during organizational socialization on the role of certified athletic trainers in high school settings. Journal of Athletic Training, Vol. 40 Issue 4, p333-340. Mondello, M. J., Janelle, C.M. (2001). A comparison of leadership styles of head coaches and assistant coaches at a successful Division I athletic program. International Sports Journal, Vol. 5 Issue 2, p40-49. Schliesman, E. S. (1987). Relationship between the congruence of preferred and actual leader behavior and subordinate satisfaction with leadership. Journal of Sport Behavior, Vol. 10, p157-166. Schrof, J. M. (1996) Team chemistry sets. U.S. News & World Report, Vol. 121 Issue 5, p53, 4p, 6.

2nd Annual International Interdisciplinary Conference, AIIC 2014, 8-12 July, Azores, Portugal Proceedings, Vol.3
11
Schubiger, S. P. (1993). Perceived and preferred coach leader behaviors of high school and college football players. Unpublished master’s thesis, Springfield College, Sprigfeild, Massachusetts. Short, S.E.; Short, M. W. (2004) Coaches’ assessment of their coaching efficacy compared to athletes’ perceptions. Perceptual & Motor Skills, Vol. 99 Issue 2, p729-736. Sullivan,P.A. (1993) Communication skills training for interactive sports. The sport Psychologist, Vol. 7 Issue 1, p.79-91. Turman, P. D. (2008) Coaches’ immediacy behaviors as predictors of athletes perceptions of satisfaction and team cohesion. Western Journal of Communication, Vol. 72 Issue 2, p162-179. Turman, P.D.(2003)Talent Development in Elite Junior Tennis: Perceptions of Players, Parents, and Athletic coaching from an Instructional communication perspective the influence of coach experience on high school wrestles’ preferences and perceptions of coaching behaviors across a season. Communication Education, Vol. 52 Issue 2, p73-86. Weiss, M.R., Fretwell, S. D. (2005). The parent-coach/child-athlete relationship in youth sport cordial, contentious, or conundrum? Research Quarterly for Exercise & Sport, Vol. 76 Issue 3, p286-305 Westre, K. R.,Weiss, M. R. (1991). The relationship between perceived coaching behaviors and group cohesion in high school football teams. Sport Psychologist, Vol. 5 Issue 1, p41-54. Wolfenden, L. E.; Holt, N. L. (2005) Academic JournalTalent development in lite junior tennis perceptions of athletes, parents, and coaches. Journal of Applied Sport Psychology, Vol. 17 Issue 2, p. 108-126. Appendix A Communication Management Questionnaire Dear Coaches, The purpose of this study is to indicate and observe the communication relationship between the players and coaches (P&C), coaches and referees (C&R), coaches and electronic recording(C&ER) to better understand the principals for Development Communication Management (DCM) for team and individual sports that could lead to enhance performance. Please supply the demographic information requested below. In addition, please respond to the following statements as an individual by circling the appropriate number indicating the extent to which you agree or disagree using the scale below (1 through 5). There is no right or wrong answers. We are simply interested in your personal opinions. Thank you.

2nd Annual International Interdisciplinary Conference, AIIC 2014, 8-12 July, Azores, Portugal Proceedings, Vol.3
12
Demographic Information: 1- Your gender (circle): Male Female 2- Number of years of experience:
Key
1 Strongly disagree
2 Somewhat disagree
3 No opinion
4 Somewhat agree
5 Strongly
agree 1. My communication style is visual. 1 2 3 4 5 2. My communication style is verbal. 1 2 3 4 5
3. My communication style is none-verbal. 1 2 3 4 5 4. I track communication during an event. 1 2 3 4 5
5. I used tools or equipment to measure communication. 1 2 3 4 5 6. My communication with the team for away games is effective. 1 2 3 4 5
7. When I communicate with the team right before a competition I am nervous. 1 2 3 4 5 8. I appear calm during communication right before a competition. 1 2 3 4 5
9. My communication right before a competition is focused. 1 2 3 4 5 10. When I communicate with the team right after a competition I am nervous. 1 2 3 4 5
11. I appear calm during communication right after the competition 1 2 3 4 5 12. My communication right after a competition is focused. 1 2 3 4 5
13. I increase communication during a competition when winning. 1 2 3 4 5 14. I increase communication during a competition when losing. 1 2 3 4 5
15. Communication during competition enhances athlete performance. 1 2 3 4 5 16. I contact other players after a competition. 1 2 3 4 5 17. I contact the referee before a competition. 1 2 3 4 5 18. I contact the referee after a competition. 1 2 3 4 5
19. I contact with the electronic time/ scoring table before a competition. 1 2 3 4 5 20. I contact with the electronic time/ scoring table after a competition. 1 2 3 4 5
21. I use more than one style to communicate during a competition. 1 2 3 4 5 22. My fastest way to communicate is visual. 1 2 3 4 5 23. My fastest way to communicate is verbal. 1 2 3 4 5
24. My fastest way to communicate is none-verbal. 1 2 3 4 5 25. The way I communicate is different depending on whether I am calm or nervous. 1 2 3 4 5 26. I have special signs, gestures, posture and body language for my communication. 1 2 3 4 5
27. I would rather to communicate with one player during competition. 1 2 3 4 5 28. I would rather to communicate with the team during competition. 1 2 3 4 5
Open-ended Questions
1. What tools and equipment you use when communicating with your team? 2. What is your personal opinion of special signs, gestures, posture and body language
as a way of your communication? 3. Who do you rely on for communication during a competition?
Appendix B Communication Management Questionnaire Dear players / swimmers The purpose of this study is to indicate and observe the communication relationship between the players and coaches (P&C), coaches and referees (C&R), coaches and electronic recording(C&ER) to better understand the principles for Development Communication Management (DCM) for team and individual sports that could lead to enhanced performance.

2nd Annual International Interdisciplinary Conference, AIIC 2014, 8-12 July, Azores, Portugal Proceedings, Vol.3
13
Please supply the demographic information requested below. In addition, please respond to the following statements by circling the appropriate number indicating the extent to which you agree or disagree using the scale below (1 through 5). There is no right or wrong answers. We are simply interested in your personal opinions. Thank you. Demographic Information: Your gender (circle): Male Female Number of years of experience:
Key
1 Strongly disagree
2 Somewhat disagree
3 No opinion
4 Somewhat agree
5 Strongly
agree 1. My communication style is visual. 1 2 3 4 5 2. My communication style is verbal. 1 2 3 4 5
3. My communication style is non-verbal. 1 2 3 4 5 4. My communication right before a competition is focused. 1 2 3 4 5 5. My communication right after a competition is focused. 1 2 3 4 5
6. I increase communication during a competition when winning. 1 2 3 4 5 7. I increase the communication during a competition when losing. 1 2 3 4 5 8. Communication during competition enhances my performance. 1 2 3 4 5 9. Most communications during the game will be with- my coach. 1 2 3 4 5
10. Most communications during the game will be with my teammates. 1 2 3 4 5 11. Most communications during the game will be with the referee. 1 2 3 4 5
12. Most communications during the game will be with the electronic time / scoring table. 1 2 3 4 5
13. I contact the coach before a competition. 1 2 3 4 5 14. I contact the coach after a competition. 1 2 3 4 5
15. I contact other players before a competition. 1 2 3 4 5 16. I contact other players after a competition. 1 2 3 4 5 17. I contact the referee before a competition. 1 2 3 4 5 18. I contact the referee after a competition. 1 2 3 4 5
19. I contact the electronic time/ scoring table before a competition. 1 2 3 4 5 20. I contact with the electronic time/ scoring table after a competition. 1 2 3 4 5
21. I use more than one style to communicate during a competition. 1 2 3 4 5 22. My styles of communication depend on my performance at a
competition. 1 2 3 4 5
23. My fastest way to communicate is visual. 1 2 3 4 5 24. My fastest way to communicate is verbal. 1 2 3 4 5
25. My fastest way to communicate is none-verbal. 1 2 3 4 5 26. The way I communicate effects on winning or losing of an event /game, etc. 1 2 3 4 5
27. I have special signs, gestures, posture and body language that I use in my communication with others. 1 2 3 4 5
Open- ended Question
1. What is your personal opinion of the best signs you use, is it gestures, posture, body language or another way communication that can help you winning?
2. Who do you rely on most for communication during a competition?

2nd Annual International Interdisciplinary Conference, AIIC 2014, 8-12 July, Azores, Portugal Proceedings, Vol.3
14
TRENDS IN THE AD/HD EPIDEMIC IN NORWAY (1992–2011)
Bjørg Mari Hannås, Associate Prof., PhD, Faculty of Professional Studies, University of Nordland, Norway
Abstract At the heart of many debates about AD/HD in Norway lies the question whether too many or too few individuals are currently diagnosed with AD/HD or treated with AD/HD medications. Such debates often make use of figures that are not particularly significant when treated and handled in isolation from a meaningful context. The purpose of this article is to present a form of epidemiological picture of how the AD/HD concept has developed in Norway. The plan is to account for relevant figures, concepts and tendencies, so that they can be applied, commented on and assessed in relation to various questions and relevant discussions. Distinctive trends in the development are discussed and analysed with the help of models and perspectives from relevant sociological theories. A main argument put forward is that the AD/HD epidemic is a part of an increased medicalisation in society in general.
Keywords: Attention Deficit Hyperactivity Disorder (AD/HD), diagnostics, medication, epidemic, trends Introduction AD/HD – a controversial diagnosis Attention Deficit Hyperactivity Disorder (AD/HD) was described in 1988 in the official American diagnostic manual Diagnostic and Statistic Manual of Mental Disorders (DSM III R). Since that time, the occurrence of the AD/HD diagnosis has increased significantly both in terms of spreading to new areas (globalisation) and in terms of incidence (the number of registered cases) in the population. In Norway, the development over the past couple of decades has seen the same tendency. Norway uses the World Health Organisation’s diagnostic manual, International Classification of Mental Disorders (ICD 10) as its official classification system. In this manual, the diagnosis has been given the name Hyperkinetic disorders and the classification F90. Amongst the general public, the term AD/HD is nevertheless the most familiar – and the term is also used in many contexts by professionals. During the period in question, certain structural changes were made in respect of the diagnosis which may perhaps be observable in the data material presented in this article. Firstly, it was resolved (by consensus) in 1995 that AD/HD is a lifelong condition. As a result, the criteria were changed such that adults could also be given the diagnosis – as opposed to only children and youngsters under the age of 18, as had been the case previously. This extension of the diagnosis was not, however, followed by any changes in the description of the diagnostic symptoms, which are still primarily associated with the state and daily life of children (particularly boys). Secondly, in 2005, adults received the same access as children and young people to medical treatment with psychostimulants, which presumably has contributed to both examination and diagnosis becoming more readily meaningful to adults. In the same year, 2005, the first edition of the Norwegian-language guide Veileder i diagnostikk og behandling av AD/HD was also issued. By means of this publication,
2nd Annual International Interdisciplinary Conference, AIIC 2014, 8-12 July, Azores, Portugal Proceedings, Vol.3
15
diagnostic experts addressed themselves – via the highest professional political authority in Norway – primarily to specialists, patients and their families. The authors point out that both AD/HD interest groups, nursery and school staff, employees in the public authorities dealing with children, young people and families, the health service and the public work and welfare sectors, as well as government bodies and politicians, may find the guide useful (Sh-dir.2006). Despite its substantial growth, however, AD/HD remains relatively controversial, both as a diagnosis and as a condition. The diagnosis itself is established on the basis of registering certain clinical symptoms. In the manuals, these are defined and represented by descriptions of in all 18 different clinical signs of the three core symptoms: hyperactivity, impulsiveness and failure of concentration. The clinical signs consist of 18 concrete descriptions of different types of behaviour. In other words, the registering of clinical signs will to some extent always be based on subjective assessments. With reference to the strong growth, critical questions are constantly being asked in various quarters about the etiology and existence of the diagnosis and condition. Critics point to the lack of clear and objective diagnostic symptoms, with the consequent risk of over or under-diagnosing. As an extension of this, criticism arises of possible damaging long-term effects of the medicinal treatment with psychostimulants. As early as 2006, Gisela Wieser, an AD/HD-medicines specialist from INCB, which is the UN’s Narcotics Control Board, made the following statement to the Norwegian television channel TV 2:
“We were earlier worried about developments in the USA, because they had the highest level of use. We now see that Norway is the country in Europe which most clearly follows the American trend in the use of methylphenidates [e.g. Ritalin and Concerta, authors comment] in the treatment of AD/HD. And this concerns us.” 1
What makes the above quotation particularly interesting in this context is that it describes developments in Norway and justifies the UN’s concerns about them by making a comparison with an equivalent development in another country (the USA). In other contexts, it is a common feature of similar debates about AD/HD that different figures and measures are referred to and commented quite divorced from any context that might contribute to more meaningful assessments and analyses. In 2011, for instance, altogether 30 525 users of AD/HD medicines were registered in Norway2. The figure 30 525 quite simply expresses a quantity (in this case, users of AD/HD medicines) which in itself cannot be described as especially high or low. One of the purposes of this presentation is therefore to present a collected and systematic overview of actual quantities and tendencies – based on available data – as a basis for future discussion about how this can be explained and understood. Medicalisation in society In a historical perspective, the AD/HD diagnosis can be regarded as typical of social development in the period in question, rather than as a curiosity. A comparison of the editions of the diagnostic manual shows, for instance, that the number of alternative diagnoses rose from 106 when the first edition came out in 1952 to nearly 400 in the most recent edition, from the year 2000 (Hannås, 2010). What is perhaps the most substantial criticism that has been levelled against the AD/HD diagnosis, and against the dominant medical perspective on
1 See also “FN bekymret over AD/HD-medisinering” on: http://pub.tv2.no/TV2/magasiner/dokument2: accessed 26.02.06. In addition, David Coven noted that the same trend, to a varying extent, was apparent in Canada, Australia, New Zealand, Switzerland, Sweden, Denmark, the UK, Germany, the Netherlands, Israel, Spain and Taiwan. He also noted that both France and Italy, where there has traditionally been a greater resistance against treating children with psychostimulants, also appeared to be following (Stead, et al., 2006). There are also indications that the same diagnostic practice is in the course of spreading in Africa (Aase, 2007). 2 See Nasjonalt reseptbasert legemiddelregister (Prescriptions Register), http://www.reseptregisteret.no
2nd Annual International Interdisciplinary Conference, AIIC 2014, 8-12 July, Azores, Portugal Proceedings, Vol.3
16
which it is based, springs from a more generalised criticism of the broader social development. In the professional literature this is often described as the theory of medicalisation in society. The term “medicalisation” indicates that there has been, and still is, an apparent tendency to constantly identify new forms of human behaviour and conditions that are defined as deviant or sick, and which thereby are primarily understood and treated as medical issues (Conrad, 1975). Within the theory of medicalisation, this is regard as a consequence of the fact that medicine, in competition with and at the expense of other subjects, has succeeded in expanding the boundaries of its own field’s domain and jurisdiction (Conrad & Potter, 2000). An implication of this development is that many people today are prescribed treatment with medicines or other forms of medical intervention in relation to problems that, according to the theory of medicalisation, are not inherently medical, but which rather can be attributed to issues that are external to the individual concerned. In the case of psychiatric diagnoses, AD/HD included, the main purpose of treatment is to modify challenging – but normal – variants of human behaviour and human conditions. In research and in the literature, the AD/HD diagnosis is often used as a concrete example of the medicalisation in society. It reflects the fact that AD/HD has distinguished itself over a long period as that diagnosis that has attained the most rapid growth and the greatest recruitment in terms of the number of diagnosed persons (Brante, 2006). The theory of medicalisation describes psychiatric and medical diagnoses as a product of social and historical conditions. In this connection, the significance of the activities of specific interest groups is particularly emphasised. New diagnoses rarely arise as a result of new scientific discoveries. Studies have shown that various agencies such as self-help groups and other groups of various types of interests, social movements, health-related organisations, pharmaceutical companies, researchers and clinicians have all played a central role in the formation of new diagnoses. Similarly, the same factors are apparent and influential in connection with expanding or disseminating an already-existing diagnostic category (Conrad & Potter, 2000). The diagnoses have an interactive function in society. They are influenced by, but also influence, the society of which they are a part. At the same time as the AD/HD diagnosis can be regarded as, amongst other things, an expression of the position of medicine and the state of knowledge at a given point in time, it will also itself affect the general perception of where the boundaries should be drawn for what is to be regarded as normal, reasonable and acceptable behaviour. By this means, diagnoses function as a formula that contribute to the classification and structuring of our perception of reality, and thus also affect the interaction of a number of every-day relationships and situations (Bowker & Star, 1999). An interesting point regarding the general function of diagnoses, pointed out by Bowker and Star amongst others, is that at the same time as the categories (diagnoses) help focus on distinct aspects of the condition that they describe, they also inevitably contribute to placing other aspects of the same condition in the shadow of those that are highlighted: “Each standard and each category valorizes some point of view and silences another.” (ibid:5). With the help of Bruno Latour’s Actor-Network-Theory (ANT), the function of diagnosis as an independent social force can perhaps be illuminated and further highlighted (Latour, 1987). In this theory, the function of actor is not exclusively reserved for people; nor is it necessarily limited to any form of physical materiality. Actors that themselves cannot play the role of subjects – with a personal or independent intention – are termed either actors or actants by Latour. Because the AD/HD diagnosis functions in such a way as to affect our understanding of, and thus also change our behaviour within, the world, the diagnosis can within this perspective be termed an actor or an actant. One of the questions with which Latour was particularly concerned, and which the ANT model in this connection may also be
2nd Annual International Interdisciplinary Conference, AIIC 2014, 8-12 July, Azores, Portugal Proceedings, Vol.3
17
suited to illuminate, is how new knowledge is constantly confirmed and disseminated through a form of social network. When knowledge of a phenomenon is confirmed and disseminated, the network simultaneously grows such that it presently encompasses more agents or spokesmen for that particular type of knowledge. New agents are constantly recruiting new spokesmen and a specific understanding of a specific phenomenon is thereby disseminated through both local, regional and global networks. The ANT model also encompasses forces of resistance. If the latter win, the development of the networks that otherwise could have reinforced and further disseminated the relevant knowledge is hindered. The theory does not draw a complete picture or a firmly locked understanding of an eternal truth in respect of the phenomenon in question. On the contrary, each new reinforcement of a phenomenon contains a (potential) modification of the knowledge in question. Based on this theory, each new case that is identified as AD/HD can be regarded as a new reinforcement of the relevant knowledge of the diagnosis, which acts as a stage in a process that contributes to the dissemination of both the knowledge and the diagnosis to further individuals. Ian Hacking (2004) is one of those who have studied and described the interactive function in society of various diagnoses. He points out that the diagnoses and conditions not only confirm each other, but that they also have a tendency to mutually reinforce one another. Hacking’s work includes individual studies of the interaction between classifications and the people who are classified. On the basis of these studies he has described an interactive effect that he has called “the looping effect of classifying human beings” (2004:279). With the help of this, he shows how, as a result of the classification, people are first changed themselves before this in turn causes a modification of the very classification system that changed them. He points out that there is a dialectic relationship between classification systems and people. As a result of this dialectic – and dynamic – process, constantly new forms of groups or categories of people are created or formed. Research questions and methodological approach On the basis of the above introduction, we will now investigate, discuss and analyse the following three questions more closely:
- How many people in Norway have the diagnosis AD/HD? - What developmental trends can be seen in the period 1992 to 2011? - How can the results that emerge (quantities and tendencies) be explained?
The method employed in this article can be termed a meta-synthetic study based on earlier surveys and a data register. In order to highlight relevant aspects of the development prior to the establishment of a relevant data register, we refer to the results of a survey by Reigstad et al. (2004) covering the period 1992–2002. To examine the development during the following period, in other words 2004 to 2011 inclusive, we use statistics from the Reseptregisteret (the prescription-based medications register of the Norwegian national public-health institute). In discussing relevant alternative explanations for the tendencies that are presented, we will also refer to and use information from individual findings in a qualitative survey carried out in connection with an earlier doctoral project concerning AD/HD (Hannås, 2010). Significant results from the survey will be discussed and analysed with the help of the sociological theories and models mentioned in the introduction above. A study of developments in norway from 1992 to 2011 This section addresses the question of what appear to be the characteristics of the development in terms of the extent and regularity of the diagnosis in Norway from 1992 to the present day. The presentation is divided into two sub-sections; the first dealing with the period 1992–2002 and the second with developments in the period 2004–2011.
2nd Annual International Interdisciplinary Conference, AIIC 2014, 8-12 July, Azores, Portugal Proceedings, Vol.3
18
Development characteristics in the period 1992–2002 To gain an impression of the relevant development trends before 2004, when the current data registration began, we will start by presenting relevant results from an investigation that has surveyed the background for referrals and requests for assessments by child and youth psychiatry agencies in Norway between 1992 and 2002. The authors of the 2004 study (Reigstad et al.) investigated all referrals that were prompted by a suspicion of hyperactivity/attention difficulties. Firstly, they found that there is a statistically high correlation between referral category (reason) and subsequent diagnosis. Furthermore, they found that the number of referrals prompted by hyperactivity/attention difficulties rose from 1.2% to 13.6% from 1992 to 2002. Similarly, they document that there occurred at the same time an equivalent reduction in the use of other referral categories. The study has also charted the number of media references and other public publications that focus on the theme of hyperactivity/attention difficulties and related topics, such as the positive effect of medicinal treatment. This survey concludes that the marked increase in the number of referrals/diagnoses related to AD/HD may be partly explained by a greater focus on hyperactivity/attention difficulties both in the media and by the referring bodies. The most significant point in this connection, however, is that there actually was a significant increase in the number of referrals prompted by suspicion of AD/HD during the years 1992–2002. The proportion of referrals in this category, measured in relation to the total number of referrals to by child and youth psychiatry agencies, grew by as much as 12.4% between 1992 and 2002. A high correlation between referral category and diagnosis makes a more-or-less similar increase in the number of diagnoses seem likely. The survey describes a development that affected children and young people. The developmental trends amongst adults in the same period was probably affected by other factors. Development characteristics in the period 2004–2011 There are no registers that show how many people have the diagnosis AD/HD in Norway. What is registered, however, is how many individuals are treated with AD/HD medications. This is recorded in the Reseptregisteret (the prescription-based medications register of the Norwegian national public-health institute, which we will refer to here as the “prescriptions register”). 3 In this database, “AD/HD medications” include the psychostimulants methylphenidate (i.e. the products Ritalin and Concerta), dextroamphetamine and amphetamine, as well as atomoxetine (i.e. the product Strattera). The latter is the only one of these medications that cannot be regarded as a psychostimulant. Entries to the database begin in 2004. By comparing corresponding figures from year to year, data from the prescriptions register can give a certain impression of any pronounced developments during the period 2004–2011. In the tables and figures presented in this sub-section, figures from the prescriptions register are used to calculate and illustrate some of the most pronounced trends. The register includes all users of AD/HD medications. Research suggests that about 77% of patients under the age of 18 (and probably a lower number of adults) have a positive response to, and are treated with, AD/HD medications (SINTEF, 2004:129)4. In other words, the number of users of AD/HD medications should not be confused with the number of persons with the diagnosis AD/HD. 3 http://www.reseptregisteret.no 4 The number of children and young people with the diagnosis can thus be estimated as “number of users” plus about “23% of the population” in the respective age categories.
2nd Annual International Interdisciplinary Conference, AIIC 2014, 8-12 July, Azores, Portugal Proceedings, Vol.3
19
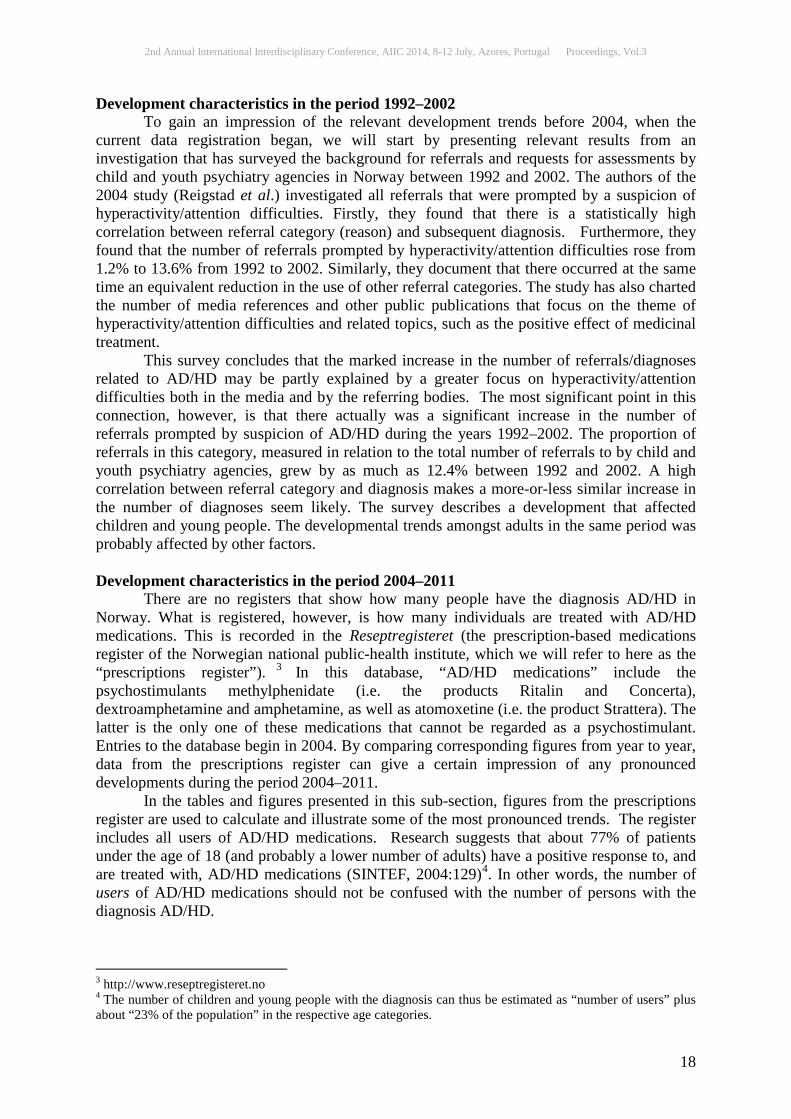
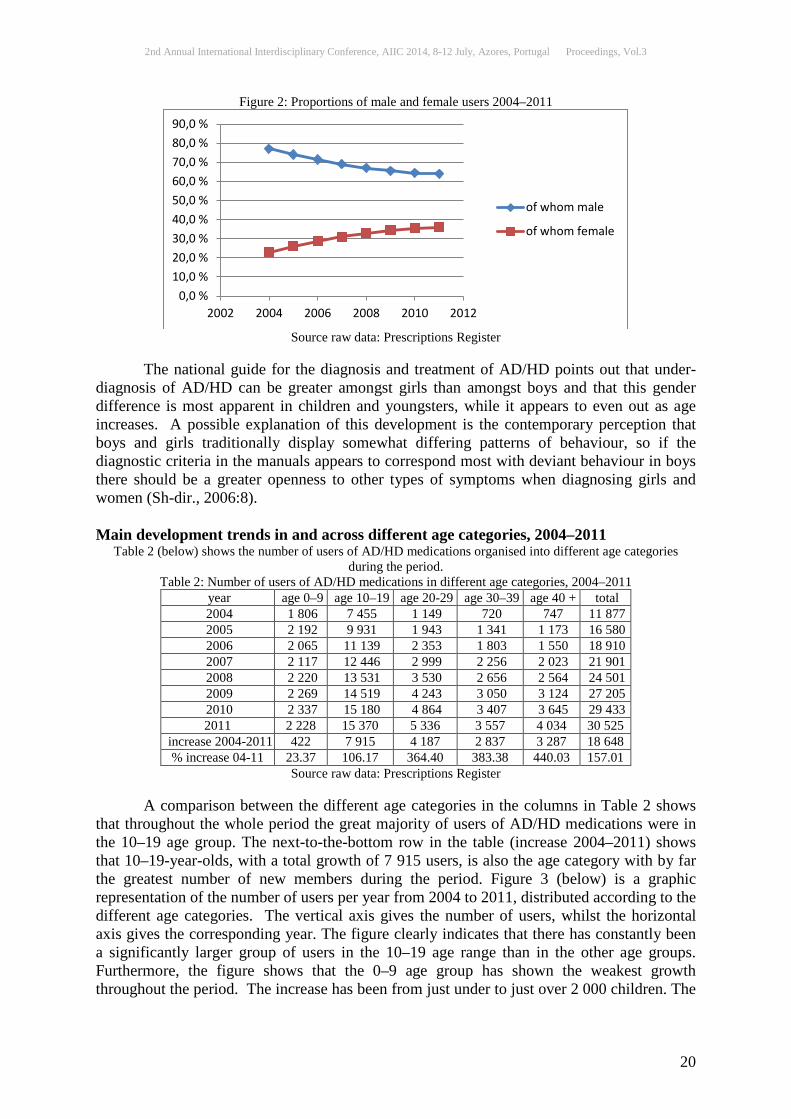
Main trends in distribution between men and women 2004–2011 Table 1(below) shows the number of users of AD/HD medications for the whole country and the gender distribution during the years 2004–2011.
Table 1: Users of AD/HD medications, gender distributed, 2004–2011 year users of whom male of whom female Increase from previous year 2004 11 877 9 155 (77.1%) 2 722 (22.9%) 2005 16 580 12 261 (73.9%) 4 319 (26.1%) 4 703 (39.6%) 2006 18 910 13 503 (71.4%) 5 407 (28.6%) 2 330 (14.1%) 2007 21 901 15 119 (69.0%) 6 782 (31.0%) 2 991 (15.8%) 2008 24 501 16 416 (67.0%) 8 085 (32.9%) 2 600 (11.9%) 2009 27 205 17 817 (65.5%) 9 388 (34.5%) 2 704 (11.0%) 2010 29 433 18 966 (64.4%) 10 467 (35.6%) 2 228 ( 8.2%) 2011 30 525 19 515 (63.9%) 11 010 (36.1%) 1 089 ( 3.7%)
Source raw data: Prescriptions Register From the second column from the left in Table 1 it emerges that in 2004 the total number of users of AD/HD medications in Norway was 11 877. In 2005 the number has increased to 16 580. In other words, the number of users has increased by 4 703 individuals, which represents an increase of 39.6% (as seen in the far-right column) from 2004 to 2005. From 2005 to 2006 the total number of users has increased by 2 330 individuals, which represents an increase of 14.1%. From 2006 to 2007 the total number of users has increased by 2 991 individuals, which represents an increase of 15.8%, whilst the following years show an equivalent increase of 11.9%, 11.0%, 8.2% and 3.7% respectively. The number of users shows a steady climb through the whole period. Even though the figures are not corrected for the general population growth, we can assume that they reflect a genuine growth in the proportion of individuals with the diagnosis over the period in question. The table also shows that the growth is significantly weaker in the years after 2005 than between 2004 and 2005. Despite a weak increase from 2006 to 2007, the growth in total users seems to fall off somewhat as the years pass. In 2010 and 2011, the figures show a growth in the number of users of 8.2% and 3.7% respectively. Even though the number is still growing, the trend nevertheless seems to indicate a significantly weaker growth in total users now than was the case previously; a point that is also illustrated in Figure 1 (below):
Figure 1: Total users of AD/HD medications, gender distributed, 2004–2011
Source raw data: Prescriptions Register
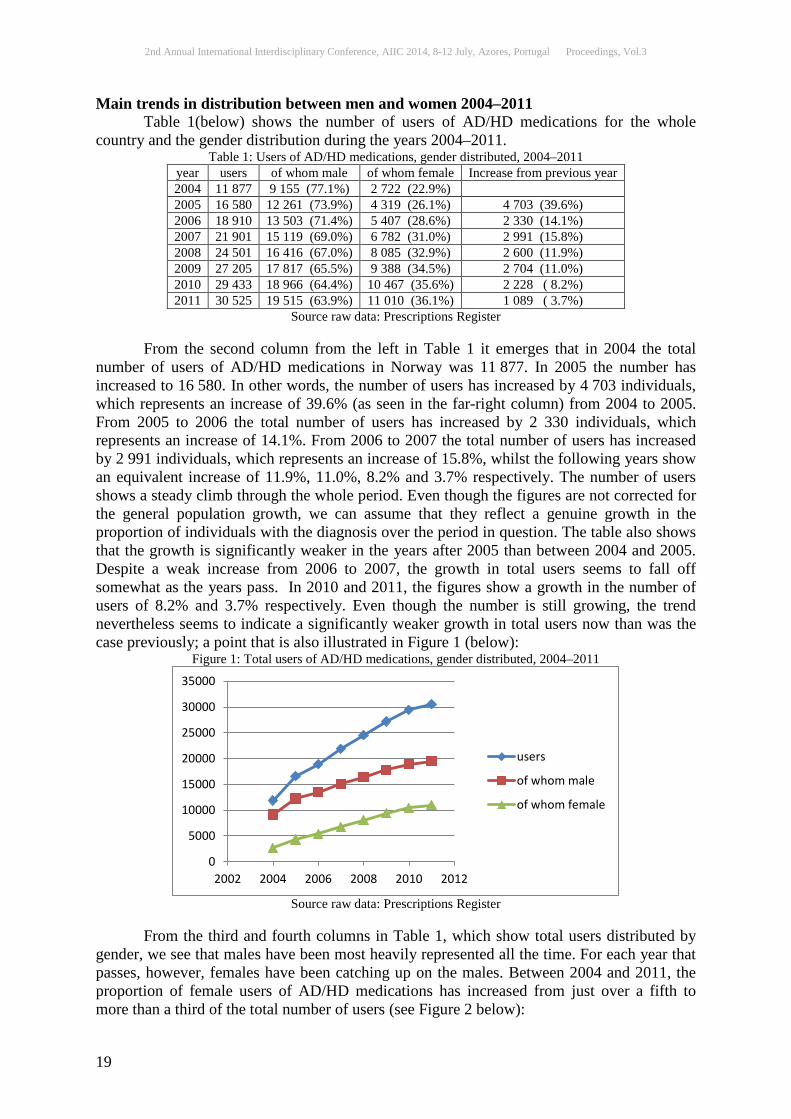
From the third and fourth columns in Table 1, which show total users distributed by gender, we see that males have been most heavily represented all the time. For each year that passes, however, females have been catching up on the males. Between 2004 and 2011, the proportion of female users of AD/HD medications has increased from just over a fifth to more than a third of the total number of users (see Figure 2 below):
0
5000
10000
15000
20000
25000
30000
35000
2002 2004 2006 2008 2010 2012
users
of whom male
of whom female
2nd Annual International Interdisciplinary Conference, AIIC 2014, 8-12 July, Azores, Portugal Proceedings, Vol.3
20
Figure 2: Proportions of male and female users 2004–2011
Source raw data: Prescriptions Register
The national guide for the diagnosis and treatment of AD/HD points out that under-diagnosis of AD/HD can be greater amongst girls than amongst boys and that this gender difference is most apparent in children and youngsters, while it appears to even out as age increases. A possible explanation of this development is the contemporary perception that boys and girls traditionally display somewhat differing patterns of behaviour, so if the diagnostic criteria in the manuals appears to correspond most with deviant behaviour in boys there should be a greater openness to other types of symptoms when diagnosing girls and women (Sh-dir., 2006:8). Main development trends in and across different age categories, 2004–2011
Table 2 (below) shows the number of users of AD/HD medications organised into different age categories during the period.
Table 2: Number of users of AD/HD medications in different age categories, 2004–2011 year age 0–9 age 10–19 age 20-29 age 30–39 age 40 + total 2004 1 806 7 455 1 149 720 747 11 877 2005 2 192 9 931 1 943 1 341 1 173 16 580 2006 2 065 11 139 2 353 1 803 1 550 18 910 2007 2 117 12 446 2 999 2 256 2 023 21 901 2008 2 220 13 531 3 530 2 656 2 564 24 501 2009 2 269 14 519 4 243 3 050 3 124 27 205 2010 2 337 15 180 4 864 3 407 3 645 29 433 2011 2 228 15 370 5 336 3 557 4 034 30 525
increase 2004-2011 422 7 915 4 187 2 837 3 287 18 648 % increase 04-11 23.37 106.17 364.40 383.38 440.03 157.01
Source raw data: Prescriptions Register A comparison between the different age categories in the columns in Table 2 shows that throughout the whole period the great majority of users of AD/HD medications were in the 10–19 age group. The next-to-the-bottom row in the table (increase 2004–2011) shows that 10–19-year-olds, with a total growth of 7 915 users, is also the age category with by far the greatest number of new members during the period. Figure 3 (below) is a graphic representation of the number of users per year from 2004 to 2011, distributed according to the different age categories. The vertical axis gives the number of users, whilst the horizontal axis gives the corresponding year. The figure clearly indicates that there has constantly been a significantly larger group of users in the 10–19 age range than in the other age groups. Furthermore, the figure shows that the 0–9 age group has shown the weakest growth throughout the period. The increase has been from just under to just over 2 000 children. The
0,0 %10,0 %20,0 %30,0 %40,0 %50,0 %60,0 %70,0 %80,0 %90,0 %
2002 2004 2006 2008 2010 2012
of whom male
of whom female
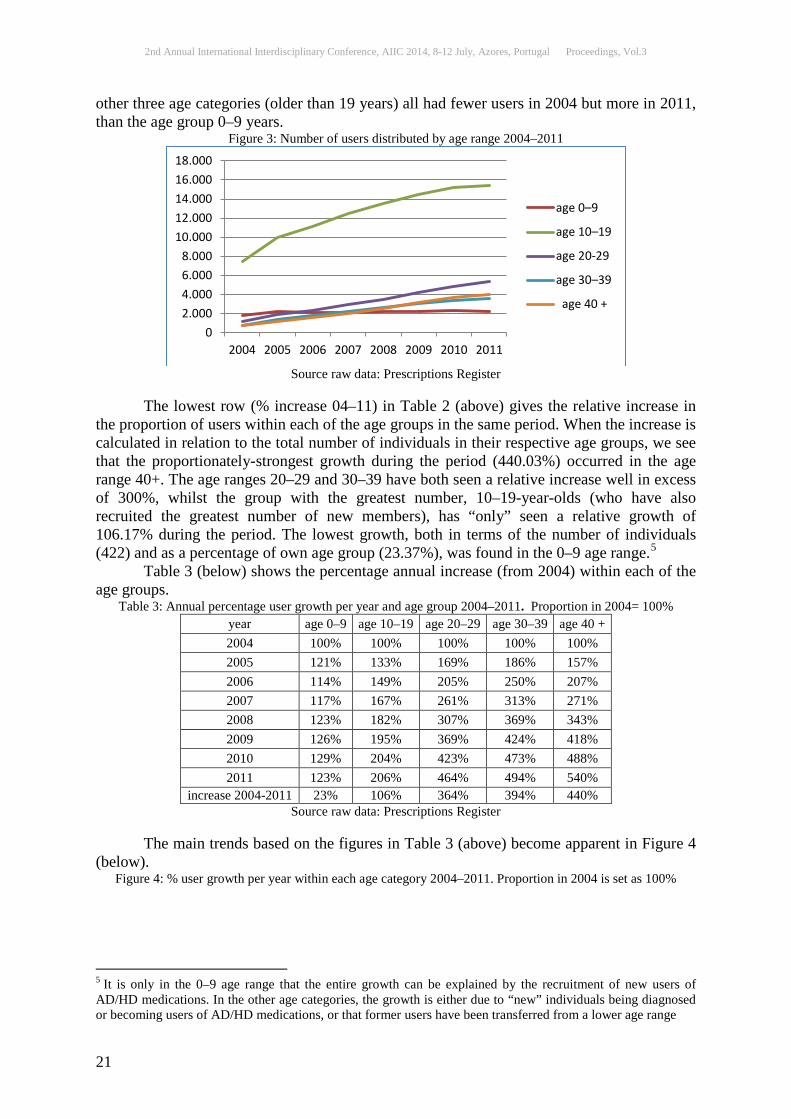
2nd Annual International Interdisciplinary Conference, AIIC 2014, 8-12 July, Azores, Portugal Proceedings, Vol.3
21
other three age categories (older than 19 years) all had fewer users in 2004 but more in 2011, than the age group 0–9 years.
Figure 3: Number of users distributed by age range 2004–2011
Source raw data: Prescriptions Register
The lowest row (% increase 04–11) in Table 2 (above) gives the relative increase in the proportion of users within each of the age groups in the same period. When the increase is calculated in relation to the total number of individuals in their respective age groups, we see that the proportionately-strongest growth during the period (440.03%) occurred in the age range 40+. The age ranges 20–29 and 30–39 have both seen a relative increase well in excess of 300%, whilst the group with the greatest number, 10–19-year-olds (who have also recruited the greatest number of new members), has “only” seen a relative growth of 106.17% during the period. The lowest growth, both in terms of the number of individuals (422) and as a percentage of own age group (23.37%), was found in the 0–9 age range.5 Table 3 (below) shows the percentage annual increase (from 2004) within each of the age groups.
Table 3: Annual percentage user growth per year and age group 2004–2011. Proportion in 2004= 100% year age 0–9 age 10–19 age 20–29 age 30–39 age 40 + 2004 100% 100% 100% 100% 100% 2005 121% 133% 169% 186% 157% 2006 114% 149% 205% 250% 207% 2007 117% 167% 261% 313% 271% 2008 123% 182% 307% 369% 343% 2009 126% 195% 369% 424% 418% 2010 129% 204% 423% 473% 488% 2011 123% 206% 464% 494% 540%
increase 2004-2011 23% 106% 364% 394% 440% Source raw data: Prescriptions Register
The main trends based on the figures in Table 3 (above) become apparent in Figure 4 (below).
Figure 4: % user growth per year within each age category 2004–2011. Proportion in 2004 is set as 100%
5 It is only in the 0–9 age range that the entire growth can be explained by the recruitment of new users of AD/HD medications. In the other age categories, the growth is either due to “new” individuals being diagnosed or becoming users of AD/HD medications, or that former users have been transferred from a lower age range
02.0004.0006.0008.000
10.00012.00014.00016.00018.000
2004 2005 2006 2007 2008 2009 2010 2011
age 0–9
age 10–19
age 20-29
age 30–39
age 40 +
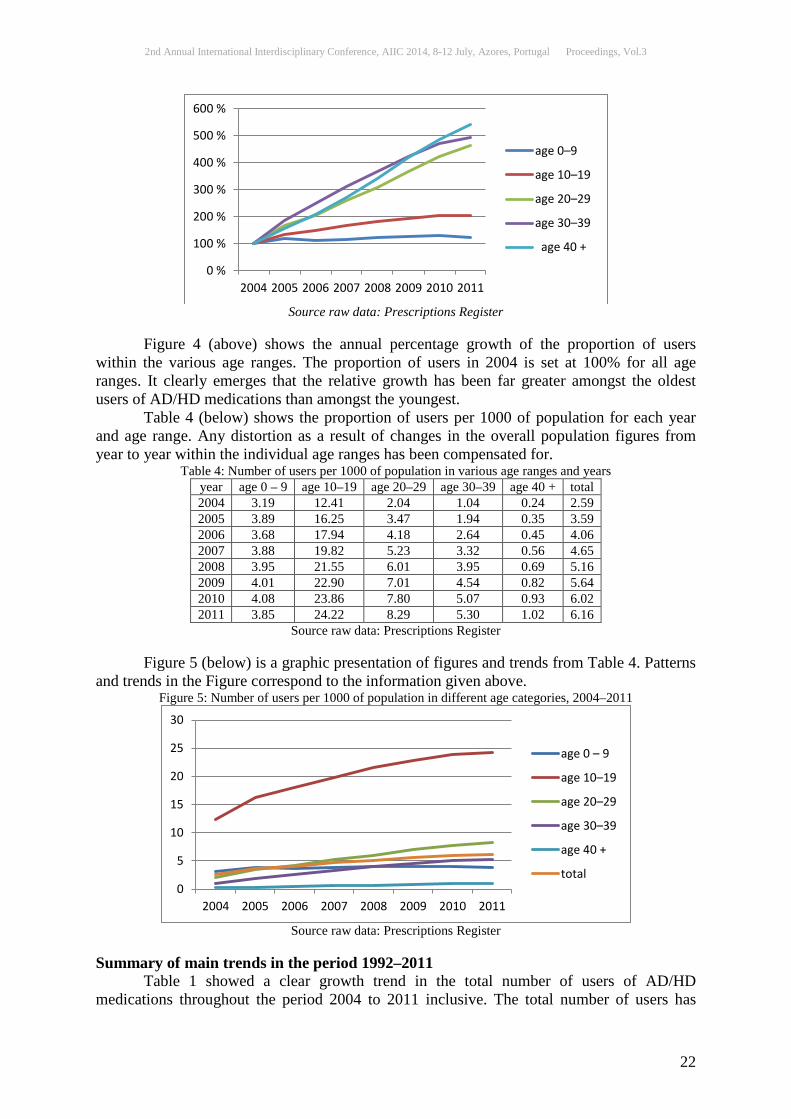
2nd Annual International Interdisciplinary Conference, AIIC 2014, 8-12 July, Azores, Portugal Proceedings, Vol.3
22
Source raw data: Prescriptions Register
Figure 4 (above) shows the annual percentage growth of the proportion of users within the various age ranges. The proportion of users in 2004 is set at 100% for all age ranges. It clearly emerges that the relative growth has been far greater amongst the oldest users of AD/HD medications than amongst the youngest. Table 4 (below) shows the proportion of users per 1000 of population for each year and age range. Any distortion as a result of changes in the overall population figures from year to year within the individual age ranges has been compensated for.
Table 4: Number of users per 1000 of population in various age ranges and years year age 0 – 9 age 10–19 age 20–29 age 30–39 age 40 + total 2004 3.19 12.41 2.04 1.04 0.24 2.59 2005 3.89 16.25 3.47 1.94 0.35 3.59 2006 3.68 17.94 4.18 2.64 0.45 4.06 2007 3.88 19.82 5.23 3.32 0.56 4.65 2008 3.95 21.55 6.01 3.95 0.69 5.16 2009 4.01 22.90 7.01 4.54 0.82 5.64 2010 4.08 23.86 7.80 5.07 0.93 6.02 2011 3.85 24.22 8.29 5.30 1.02 6.16
Source raw data: Prescriptions Register Figure 5 (below) is a graphic presentation of figures and trends from Table 4. Patterns and trends in the Figure correspond to the information given above.
Figure 5: Number of users per 1000 of population in different age categories, 2004–2011
Source raw data: Prescriptions Register
Summary of main trends in the period 1992–2011 Table 1 showed a clear growth trend in the total number of users of AD/HD medications throughout the period 2004 to 2011 inclusive. The total number of users has
0 %
100 %
200 %
300 %
400 %
500 %
600 %
2004 2005 2006 2007 2008 2009 2010 2011
age 0–9
age 10–19
age 20–29
age 30–39
age 40 +
0
5
10
15
20
25
30
2004 2005 2006 2007 2008 2009 2010 2011
age 0 – 9
age 10–19
age 20–29
age 30–39
age 40 +
total
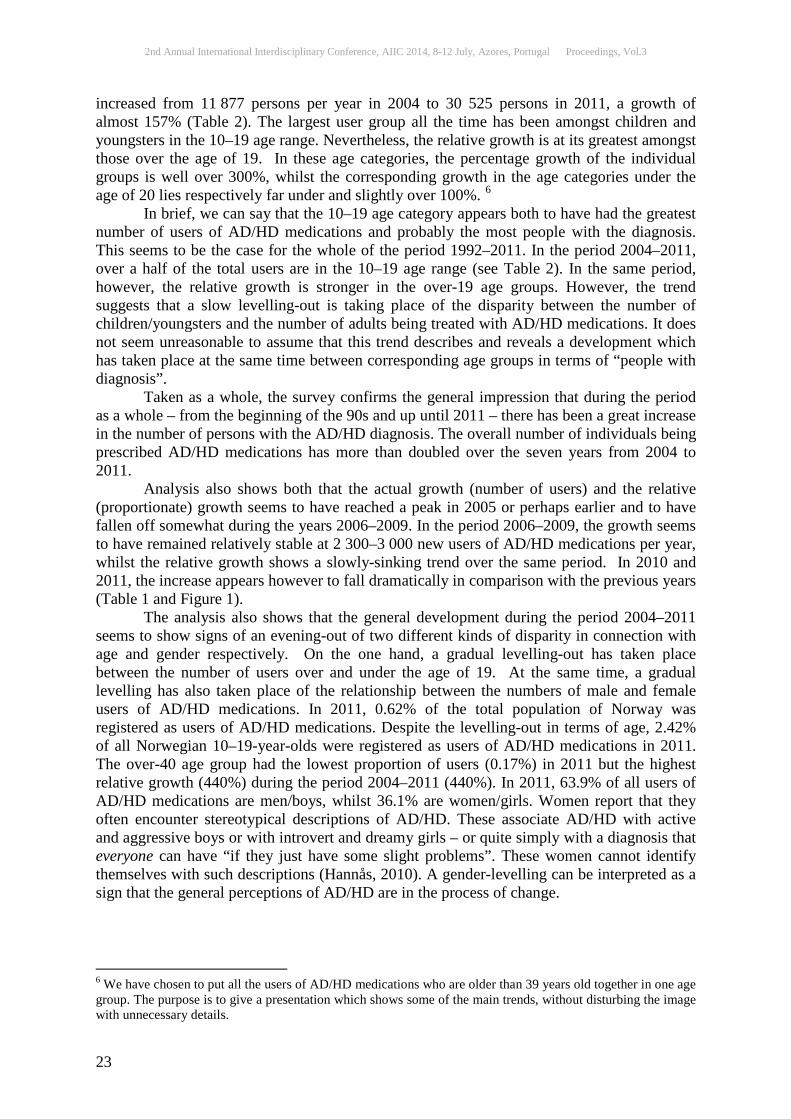
2nd Annual International Interdisciplinary Conference, AIIC 2014, 8-12 July, Azores, Portugal Proceedings, Vol.3
23
increased from 11 877 persons per year in 2004 to 30 525 persons in 2011, a growth of almost 157% (Table 2). The largest user group all the time has been amongst children and youngsters in the 10–19 age range. Nevertheless, the relative growth is at its greatest amongst those over the age of 19. In these age categories, the percentage growth of the individual groups is well over 300%, whilst the corresponding growth in the age categories under the age of 20 lies respectively far under and slightly over 100%. 6 In brief, we can say that the 10–19 age category appears both to have had the greatest number of users of AD/HD medications and probably the most people with the diagnosis. This seems to be the case for the whole of the period 1992–2011. In the period 2004–2011, over a half of the total users are in the 10–19 age range (see Table 2). In the same period, however, the relative growth is stronger in the over-19 age groups. However, the trend suggests that a slow levelling-out is taking place of the disparity between the number of children/youngsters and the number of adults being treated with AD/HD medications. It does not seem unreasonable to assume that this trend describes and reveals a development which has taken place at the same time between corresponding age groups in terms of “people with diagnosis”. Taken as a whole, the survey confirms the general impression that during the period as a whole – from the beginning of the 90s and up until 2011 – there has been a great increase in the number of persons with the AD/HD diagnosis. The overall number of individuals being prescribed AD/HD medications has more than doubled over the seven years from 2004 to 2011. Analysis also shows both that the actual growth (number of users) and the relative (proportionate) growth seems to have reached a peak in 2005 or perhaps earlier and to have fallen off somewhat during the years 2006–2009. In the period 2006–2009, the growth seems to have remained relatively stable at 2 300–3 000 new users of AD/HD medications per year, whilst the relative growth shows a slowly-sinking trend over the same period. In 2010 and 2011, the increase appears however to fall dramatically in comparison with the previous years (Table 1 and Figure 1). The analysis also shows that the general development during the period 2004–2011 seems to show signs of an evening-out of two different kinds of disparity in connection with age and gender respectively. On the one hand, a gradual levelling-out has taken place between the number of users over and under the age of 19. At the same time, a gradual levelling has also taken place of the relationship between the numbers of male and female users of AD/HD medications. In 2011, 0.62% of the total population of Norway was registered as users of AD/HD medications. Despite the levelling-out in terms of age, 2.42% of all Norwegian 10–19-year-olds were registered as users of AD/HD medications in 2011. The over-40 age group had the lowest proportion of users (0.17%) in 2011 but the highest relative growth (440%) during the period 2004–2011 (440%). In 2011, 63.9% of all users of AD/HD medications are men/boys, whilst 36.1% are women/girls. Women report that they often encounter stereotypical descriptions of AD/HD. These associate AD/HD with active and aggressive boys or with introvert and dreamy girls – or quite simply with a diagnosis that everyone can have “if they just have some slight problems”. These women cannot identify themselves with such descriptions (Hannås, 2010). A gender-levelling can be interpreted as a sign that the general perceptions of AD/HD are in the process of change. 6 We have chosen to put all the users of AD/HD medications who are older than 39 years old together in one age group. The purpose is to give a presentation which shows some of the main trends, without disturbing the image with unnecessary details.
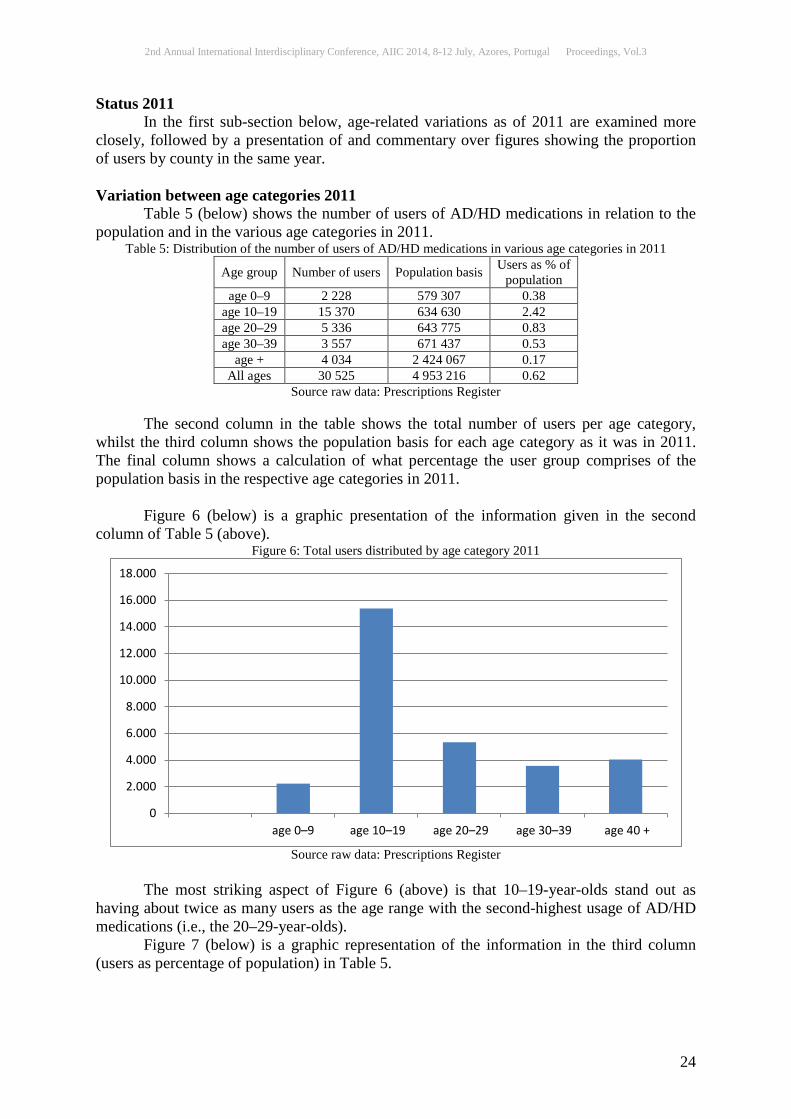
2nd Annual International Interdisciplinary Conference, AIIC 2014, 8-12 July, Azores, Portugal Proceedings, Vol.3
24
Status 2011 In the first sub-section below, age-related variations as of 2011 are examined more closely, followed by a presentation of and commentary over figures showing the proportion of users by county in the same year. Variation between age categories 2011 Table 5 (below) shows the number of users of AD/HD medications in relation to the population and in the various age categories in 2011.
Table 5: Distribution of the number of users of AD/HD medications in various age categories in 2011
Age group Number of users Population basis Users as % of population
age 0–9 2 228 579 307 0.38 age 10–19 15 370 634 630 2.42 age 20–29 5 336 643 775 0.83 age 30–39 3 557 671 437 0.53
age + 4 034 2 424 067 0.17 All ages 30 525 4 953 216 0.62
Source raw data: Prescriptions Register The second column in the table shows the total number of users per age category, whilst the third column shows the population basis for each age category as it was in 2011. The final column shows a calculation of what percentage the user group comprises of the population basis in the respective age categories in 2011. Figure 6 (below) is a graphic presentation of the information given in the second column of Table 5 (above).
Figure 6: Total users distributed by age category 2011
Source raw data: Prescriptions Register
The most striking aspect of Figure 6 (above) is that 10–19-year-olds stand out as having about twice as many users as the age range with the second-highest usage of AD/HD medications (i.e., the 20–29-year-olds). Figure 7 (below) is a graphic representation of the information in the third column (users as percentage of population) in Table 5.
0
2.000
4.000
6.000
8.000
10.000
12.000
14.000
16.000
18.000
age 0–9 age 10–19 age 20–29 age 30–39 age 40 +
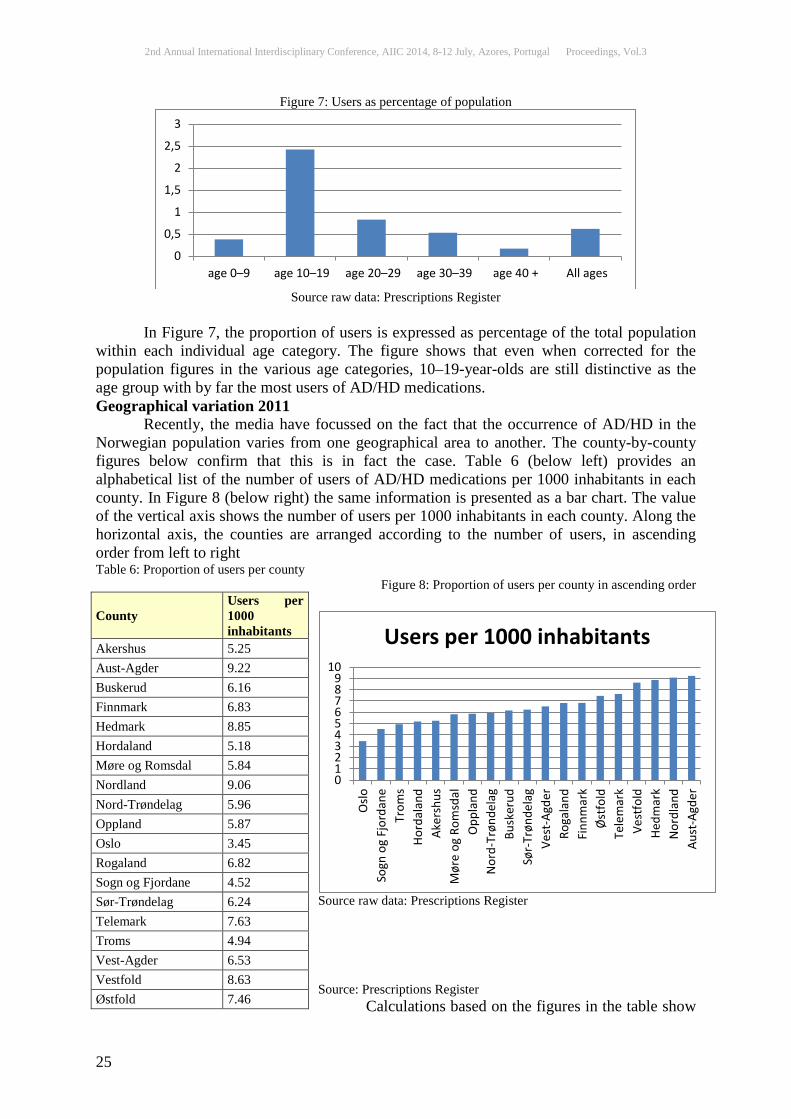
2nd Annual International Interdisciplinary Conference, AIIC 2014, 8-12 July, Azores, Portugal Proceedings, Vol.3
25
Figure 7: Users as percentage of population
Source raw data: Prescriptions Register
In Figure 7, the proportion of users is expressed as percentage of the total population within each individual age category. The figure shows that even when corrected for the population figures in the various age categories, 10–19-year-olds are still distinctive as the age group with by far the most users of AD/HD medications. Geographical variation 2011 Recently, the media have focussed on the fact that the occurrence of AD/HD in the Norwegian population varies from one geographical area to another. The county-by-county figures below confirm that this is in fact the case. Table 6 (below left) provides an alphabetical list of the number of users of AD/HD medications per 1000 inhabitants in each county. In Figure 8 (below right) the same information is presented as a bar chart. The value of the vertical axis shows the number of users per 1000 inhabitants in each county. Along the horizontal axis, the counties are arranged according to the number of users, in ascending order from left to right Table 6: Proportion of users per county
Figure 8: Proportion of users per county in ascending order
Source raw data: Prescriptions Register Source: Prescriptions Register Calculations based on the figures in the table show
0
0,5
1
1,5
2
2,5
3
age 0–9 age 10–19 age 20–29 age 30–39 age 40 + All ages
0123456789
10
Oslo
Sogn
og
Fjor
dane
Trom
sHo
rdal
and
Aker
shus
Mør
e og
Rom
sdal
Opp
land
Nor
d-Tr
ønde
lag
Busk
erud
Sør-
Trøn
dela
gVe
st-A
gder
Roga
land
Finn
mar
kØ
stfo
ldTe
lem
ark
Vest
fold
Hedm
ark
Nor
dlan
dAu
st-A
gder
Users per 1000 inhabitants County
Users per 1000 inhabitants
Akershus 5.25 Aust-Agder 9.22 Buskerud 6.16 Finnmark 6.83 Hedmark 8.85 Hordaland 5.18 Møre og Romsdal 5.84 Nordland 9.06 Nord-Trøndelag 5.96 Oppland 5.87 Oslo 3.45 Rogaland 6.82 Sogn og Fjordane 4.52 Sør-Trøndelag 6.24 Telemark 7.63 Troms 4.94 Vest-Agder 6.53 Vestfold 8.63 Østfold 7.46
2nd Annual International Interdisciplinary Conference, AIIC 2014, 8-12 July, Azores, Portugal Proceedings, Vol.3
26
a national average of 6.55 users per 1000 inhabitants. The proportion varies from 3.45 in Oslo, the lowest, to 9.22 in Aust-Agder, the highest proportion of users. Taking the population into consideration there is in other words almost three times the proportion of users of AD/HD medications in Aust-Agder as in Oslo. Summary and reflections around the status in 2011 The preceding figures show that 10–19-year-olds are clearly distinct as the age range with by far the highest number of users of AD/HD medications. It can therefore be particularly interesting to look more closely at this age group in connection with the question of whether too many people are given the AD/HD diagnosis today. We will look at this more closely in the discussion in the next section. An interesting question is whether the high number of users of AD/HD medications will be transplanted into new age categories as the current users in the 10–19 age range become older. Such a development will at least contribute to a levelling out of the age-related difference between user levels. This, however, is dependent on today’s 10–19-year-old users neither discarding the diagnosis nor choosing to stop the medicinal treatment. A qualitative survey shows that in certain youth environments, especially at academic institutions, there seems to be a widespread perception amongst youngsters that they should stop using AD/HD medications as soon as they have completed their education (Loe & Cuttino, 2008). Another study shows that some young people for one reason or another had stopped or planned to stop taking the AD/HD medications, whilst others had discarded or planned to discard the diagnosis itself (Hannås, 2010). These, however, are matters that we cannot investigate further in this article. In addition to the age-related and gender-related variations described above, the county-based presentation of the proportion of users of AD/HD medications suggests that some form of geographically-based variation is also apparent. In other words, the likelihood of being diagnosed with AD/HD seems to vary from county to county. There is no obvious explanation for this variation. Assuming that it does not reflect any genuine disparity in terms of the distribution of the AD/HD condition, there are several factors which could conceivably contribute to it in various ways. Several of these are connected to questions relating to the availability of relevant diagnostic skills. We will return to this matter in the next main section. Discussion We will now discuss alternative explanations of the most distinctive results from the study with regard to the main trends between 1992 and 2011 and the status in 2011, as presented in the two previous sections. How many individuals have been diagnosed with AD/HD? In considering such questions, we can find a reasonable norm or standard with which to compare relevant figures and proportions in the official Veileder for behandling og diagnostikk av AD/HD (Guide to Diagnostics and Treatment of AD/HD) published by the former Norwegian Directorate for Health and Social Affairs (Sh-dir.2006).7 This publication refers to surveys which conclude that the probable general occurrence of AD/HD is 1–3% based on the criteria for hyperkinesis (see ICD-10) and an occurrence of 4–8% based on the criteria for AD/HD (see DSM IV). One explanation of the discrepancy between the two manuals is that although the diagnostic symptoms are (more or less) identical, the criteria that
7 Following a reorganisation, the directorate in question has been renamed The Norwegian Directorate of Health.
2nd Annual International Interdisciplinary Conference, AIIC 2014, 8-12 July, Azores, Portugal Proceedings, Vol.3
27
are to be met are stricter in ICD-10 (the WHO manual) than in DSM IV (the American manual). Since it is ICD-10 that is the official manual in Norway, it is correct in this connection to compare the different figures and proportions with an assumption of a general occurrence of 1–3%. It is also appropriate to note that the expression general occurrence includes both “users of AD/HD medications”, “individuals with a diagnosis who are not users of AD/HD medications” and “individuals with undiagnosed AD/HD”. In relation to the health authorities’ estimate of a 1–3% occurrence of AD/HD in the population, it is probably not unreasonable to characterise a 2.42% proportion of users of AD/HD medications (in the case of 10–19-year-olds) as high. The average proportion of users for all the age categories that were investigated lies at under 1% and for the population as a whole the proportion of users is 0.62%. In terms of the question whether the condition may be under-diagnosed or over-diagnosed, we see that an assessment of this would vary according to which age group we are referring to. The variation that emerges between the different age groups can probably be largely explained with the help of public initiatives and structural changes.8 It is natural to envisage a continuation of the levelling-out of younger and older age groups of users of AD/HD medications, and the trends indicated in this survey support this idea. Nevertheless there may be reason to focus a little more on the possible (underlying) explanations as to why the 10–19 age category is not only clearly distinct from the others but that the proportion of users in this category seems in fact to be extremely high compared with the authorities’ estimate of the occurrence of AD/HD in the population. In the face of this issue, specialists in the diagnosis and treatment of AD/HD have in various connections pointed out that the teenage years may represent the most vulnerable period in a person’s life and that medicinal treatment may therefore be extra-important precisely during this phase. In youth environments with relatively many and close relationships featuring a high degree of openness, youngsters with the diagnosis can function as good ambassadors and effective agents for AD/HD. They thus contribute to the spread of the diagnosis to others. In a qualitative survey, some young people tell that they were motivated to be assessed because it was “perfectly normal” since so many others already had the diagnosis and they thought that they had a great deal in common with friends who had already been diagnosed (Hannås, 2010). It is not unthinkable that a form of communal medical practice spreads through the same networks in an equivalent manner. One question that is still to be investigated more closely is what happens when the young people become older. Will they continue the medicinal treatment in order to tackle the challenges that will confront them in adult life, will they not need it any more, or will they find alternative ways to handle any difficulties? How can the geographical variations be explained? In Norway it is the case that the AD/HD diagnosis is conferred by the specialist health service. A county-based variation can therefore be due to a disparity in availability as a result of varied geographical distance to specialists. Similarly, the level of coverage, in other words the number of specialists in relation to the population, may vary from one region to another. These factors, however, do not appear to explain the geographical disparities between the counties in Figure 8. For instance, people living in Oslo, which has the lowest proportion of users, have a greater number of available specialists within a shorter distance than the inhabitants of Nordland and Hedemark counties – which nevertheless have up to three times as many users of AD/HD medications as Oslo.
8 In 1994, the criteria were changed such that adults (over 18 years of age) could also receive the diagnosis. In 2005, adults received the same access to medicinal treatment with psychostimulants.

2nd Annual International Interdisciplinary Conference, AIIC 2014, 8-12 July, Azores, Portugal Proceedings, Vol.3
28
Another factor that could be regarded as contributing to this type of variation is that clinical discretion in practice is exercised differently in different areas within the specialist health services. Even though such factors may be thought to contribute in various ways to a geographical variation in the proportion of users of AD/HD medications, it is not possible here to determine whether, or what, influence they have in reality on the variations that emerge in Table 6 and Figure 8 (above). There is another interesting type of explanation also related to the question of accessibility. Unlike the above factors, which are concerned with access to diagnostic skills, this is concerned with the availability of what may be termed referral skills. Receiving an assessment for AD/HD requires a referral from a GP. The individual referral processes often involve representatives from different specialist areas and professions such as school, nursery, an educational psychologist or the primary health service. These representatives, on the basis of their own assessments, can advise or motivate individuals to request a referral from their own GP. Together with the GP, these representatives form what may be termed the formal or official referral system. The referral skills of the system will depend, amongst other things, on the individuals’ knowledge of the AD/HD diagnosis. If this is inadequate it may result in fewer referrals. Qualitative surveys suggest however that more informal systems often have a significant influence on the individual processes of youngsters and adults prior to an assessment for AD/HD (Hannås, 2010) (Andersen, 2009). In these cases, the accessibility of significant others with the diagnosis and their descriptions of the personal experiences with AD/HD seem to play a far more important role than the accessibility of the official referral system. Proximity to others and to their experiences of the diagnosis seems to represent both someone (a person) and something (an alternative description of AD/HD) with which many people find it easier to identify than the official definition of AD/HD. On the part of adult women, for instance, their own children with the diagnosis most often function as significant others, whilst for teenage boys, friends generally function in the role of significant others. In short, it is often family members or close acquaintances that play the role of the significant other in the informal referral systems. However, both specialists in the official referral system and lay people in the informal referral system function as spokesmen and agents for the AD/HD diagnosis. As such they each contribute in their own ways to reinforcing and spreading the diagnosis of AD/HD. In other words, geographical variations in terms of the occurrence of the diagnosis and the proportion of users of AD/HD medications can be related to how well developed and effective the informal networks and agents for the diagnosis are in the different counties. Summary comments to the discussion The aforementioned changes to the formal criteria in respect of access to diagnosis (1994) and treatment for adults (2005) have probably contributed in their respective ways to the increase that was registered in the actual number of adults with the AD/HD diagnosis. In addition, the official guide for diagnosis and treatment (Sh-dir., 2006), which has been issued in several revised versions with a focus that includes both under-diagnosis and increased availability of diagnostic skills, has probably also contributed to a development in which we see that more and more individuals are being diagnosed with AD/HD. Several possible explanations can also be envisaged for the different developmental trends indicated above. Reigstad et al. (2004) points out amongst other things a connection between the general focus on the AD/HD phenomenon and the number of registered cases of the diagnosis. Ian Hacking (2004), who has been concerned with the interactive function of the diagnosis within society, has shown that one explanation of the growth in the number of

2nd Annual International Interdisciplinary Conference, AIIC 2014, 8-12 July, Azores, Portugal Proceedings, Vol.3
29
registered cases of the AD/HD diagnosis is as a consequence of a continuous dynamic and dialectic process between the categories and individuals in a society. In addition, Bruno Latour (1987) has described how a category, AD/HD, is changed and extended as a result of new groups and individuals being included as members in it. This dynamic can help explain the various historical and culturally-mediated changes both in the diagnosis and in public perceptions about it, as seen in narratives by young people and adults about their own lives. People who have received the diagnosis as adults describe how as children they were regarded as quite “normal” and that any digressions or problems were given explanations other than AD/HD (Hannås, 2010). According to the theory, another consequence of the process described above is that the boundaries for a category have gradually become so fluid that one diagnosis becomes split into several separate diagnoses. Several of the explanations described above are related to a question of accessibility, although this has no relationship to the geographical distance to diagnostic assessment and treatment facilities. There is much to suggest that informal networks and relationships are at least as important as the official referral systems for attaining an effective recruitment and registration of new AD/HD cases. Concluding reflections As an extension of this study there are certain questions that it could be particularly interesting to follow up on over the coming years. Naturally enough, the survey had to round off with the last registrations in the Prescriptions Register from 2011. The analysis suggests, however, that a relatively stable growth in the number of users of AD/HD medications over the past years may just now be in the process of flattening off. The figures that are registered for the past two years, both for the population as a whole and for the age group with the most users (10–19-year-olds), can suggest that a marked change is under way. In this case, there are several different questions that it could be interesting to investigate more closely in the coming period. All of these are concerned with shedding light on different aspects of the development that is taking place. One of the questions is whether young users appear to stop the medicinal treatment after passing the “vulnerable phase”. Another is whether fewer new cases of AD/HD will be identified than previously and whether an equivalent growth will take place in new cases of other diagnoses. In addition it could be interesting to investigate any changes in the perceived significance of the label or in the official definition or criteria for the AD/HD diagnosis, as well as any changes in people’s subjective experiences of their own symptoms or of the public perception of AD/HD in society. References: Andersen, M. Lundemark. Former for ability: Hvilke betydninger tillægges en AD/HD diagnose i forhold til selvforståelse, intersubjektive og institusjonelle positioner. [Forms of Ability]. Ph.d. dissertation, Institut for Sociologi, Socialt arbejde og Organisation, Aalborg University, Denmark, 2009. Brante, T. Den nya psykiatrin: exemplet AD/HD. [The new Psychiatry: The Example AD/HD]. In: G. Hallerstedt (ed.), Diagnosens makt. Om kunnskap, pengar och lidande. (The Power of the Diagnoses. About Knowledge, Money and Suffering). Göteborg. Sweden, 2006. Bowker, G. C. & Star, S. L. Sorting things out: classification and its consequences. Cambridge, Mass.: MIT Press, 1999. Conrad, P. The discovery of hyperkinesis: notes on the medicalization of deviant behavior. In: Social Problems, 23 (1), 12-21, 1975. Conrad, P. & Potter, D. From hyperactive children to AD/HD adults: Observations on the expansion of medical categories. In: Social Problems, 47 (4), 559-582, 2000.

2nd Annual International Interdisciplinary Conference, AIIC 2014, 8-12 July, Azores, Portugal Proceedings, Vol.3
30
Hacking, I. Between Michel Foucault and Erving Goffman: Between discourse in the abstract and face-to-face interaction. In: Economy and Society, 33(3), 277-302, 2004. Hannås, B. Den urolige kroppen. Unge og voksnes hverdagsliv og selvforståelse før og etter den diagnostiske utredningen av AD/HD. [The restless Body]. PhD sosiologi Nr. 4-2010, Høgskolen i Bodø, Norway, 2010. Latour, B. Science in action: how to follow scientists and engineers through society. Milton Keynes: Open University Press, 1987. Loe, M., & Cuttino, L. Grappling with the medicated self: The case of AD/HD college students. In: Symbolic Interaction, 31(3), 303-323, 2008. Nasjonalt folkehelseinstitutt, Reseptregisteret: http://www.reseptregisteret.no Reigstad, B., Jørgensen, K., & Wichstrøm, L. Changes in referrals to child and adolescent psychiatric services in Norway 1992-2001. In: Social Psychiatry and Psychiatric Epidemiology, 39(10), 818-827, 2004. Sh-dir. IS- 1224: "Veileder i diagnostikk og behandling av AD/HD. Diagnostikk og behandling av hyperkinetisk forstyrrelse/attention deficit hyperactivity disorder (AD/HD) hos barn, ungdom og voksne" [Guide to Diagnostics and Treatment of AD/HD], 2006. SINTEF. "Nasjonal kartlegging av tilbud om diagnostisering og helhetlig behandling av barn og ungdom med hyperkinetisk forstyrrelse/AD/HD", Rapportnr. STF78 A045012, 2004. Stead, J., Cohen, D., & Lloyd, G. Critical new perspectives on AD/HD. London: Routledge, 2006. Aase, Heidi. Altered Reinforcement Mechanisms in Children with Attention-Deficit/Hyperactivity disorder (AD/HD). PhD. Department of Psychology, Faculty of Social Sciences, University of Oslo, Norway, 2007.
2nd Annual International Interdisciplinary Conference, AIIC 2014, 8-12 July, Azores, Portugal Proceedings, Vol.3
31
EMERGENCY TROLLEYS: AVAILABLE AND MAINTAINED, BUT ARE THEIR LOCATIONS KNOWN? –
CLOSING THE LOOP
Ahmed A. Kolkailah Medical Student, Ain Shams University, Cairo, Egypt
Sawsan Ghonaimy MBBCH, Primary FFA, MSC, Victoria Infirmary, Glasgow, UK
Naomi Cassells Junior Trainee, CT 2, Victoria Infirmary, Glasgow, UK
Allan Gillespie FRCA, Consultant Anaesthetist, Victoria Infirmary, Glasgow, UK
Abstract Emergency trolleys are developed and placed in strategic locations to improve the efficiency of the medical teams’ response to emergencies. In order to close the loop on a previous audit, conducted a year earlier, a second survey was performed to assess the team of Anaesthetists’ knowledge on the presence and location of those trolleys at the Victoria Ambulatory Care Hospital in Glasgow, Scotland. The results highlighted a considerable deficiency in the knowledge of those trolleys’ locations, in both surveys. We suggest that similar surveys should be conducted as part of regular audits in all units and should include all staff involved in such emergencies. We also propose new approaches to tackle the problem and help improve the staff knowledge for quick and easy access; thus avoiding delays in critical care management.
Keywords: Emergency trolleys, difficult airway trolley, cardiac resuscitation trolley Introduction There are a number of emergency trolleys put together for easy access of specialist equipment in case of emergencies.1 The trolleys are developed through national guidelines and local multidisciplinary team discussions. They have named individuals and a clear schedule that ensures they are maintained. Most medical units regularly audit those practices.2 The location of those trolleys has to be known by the teams using it. We conducted a second survey to check the change – over the previous year – in percentage of Anaesthetists who know about the emergency trolleys and their locations. The study was performed in the Ambulatory Care Hospital (ACH) at the Glasgow Victoria Infirmary. The doctors surveyed included Anaesthetist Consultants, Senior and Junior Trainees – all in the Anaesthetics department. Objectives The study objectives were to determine the percentage of Anaesthetists who know about the different trolleys at the ACH, as well as their exact locations. A similar survey was previously conducted a year ago and this was meant to close the loop on the previous results and monitor the change in feedback throughout the past year. Anaesthetists were
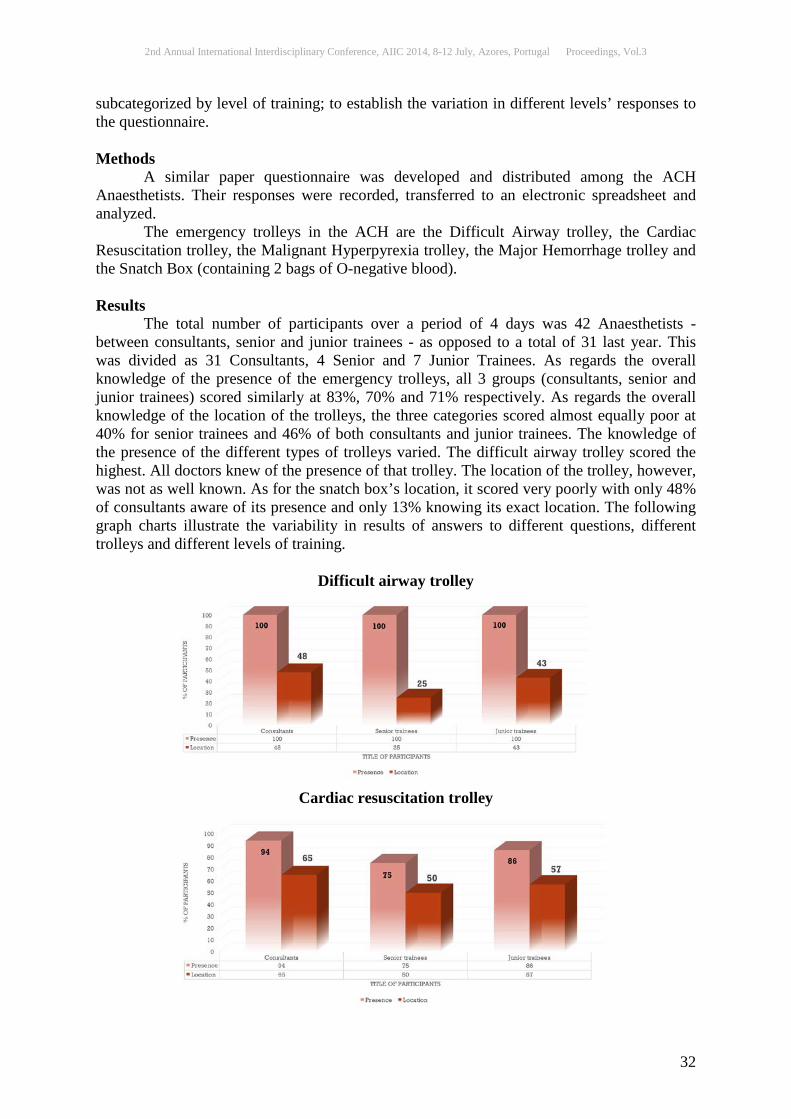
2nd Annual International Interdisciplinary Conference, AIIC 2014, 8-12 July, Azores, Portugal Proceedings, Vol.3
32
subcategorized by level of training; to establish the variation in different levels’ responses to the questionnaire. Methods A similar paper questionnaire was developed and distributed among the ACH Anaesthetists. Their responses were recorded, transferred to an electronic spreadsheet and analyzed. The emergency trolleys in the ACH are the Difficult Airway trolley, the Cardiac Resuscitation trolley, the Malignant Hyperpyrexia trolley, the Major Hemorrhage trolley and the Snatch Box (containing 2 bags of O-negative blood). Results The total number of participants over a period of 4 days was 42 Anaesthetists - between consultants, senior and junior trainees - as opposed to a total of 31 last year. This was divided as 31 Consultants, 4 Senior and 7 Junior Trainees. As regards the overall knowledge of the presence of the emergency trolleys, all 3 groups (consultants, senior and junior trainees) scored similarly at 83%, 70% and 71% respectively. As regards the overall knowledge of the location of the trolleys, the three categories scored almost equally poor at 40% for senior trainees and 46% of both consultants and junior trainees. The knowledge of the presence of the different types of trolleys varied. The difficult airway trolley scored the highest. All doctors knew of the presence of that trolley. The location of the trolley, however, was not as well known. As for the snatch box’s location, it scored very poorly with only 48% of consultants aware of its presence and only 13% knowing its exact location. The following graph charts illustrate the variability in results of answers to different questions, different trolleys and different levels of training.
Difficult airway trolley
Cardiac resuscitation trolley
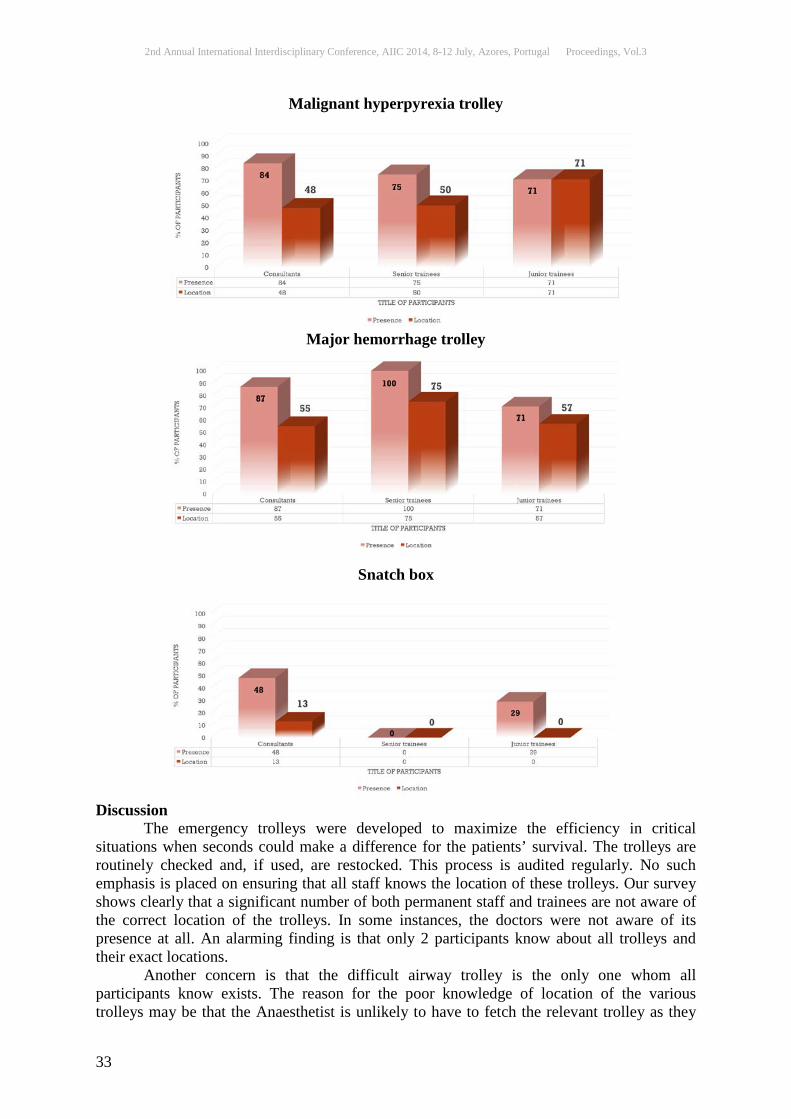
2nd Annual International Interdisciplinary Conference, AIIC 2014, 8-12 July, Azores, Portugal Proceedings, Vol.3
33
Malignant hyperpyrexia trolley
Major hemorrhage trolley
Snatch box Discussion The emergency trolleys were developed to maximize the efficiency in critical situations when seconds could make a difference for the patients’ survival. The trolleys are routinely checked and, if used, are restocked. This process is audited regularly. No such emphasis is placed on ensuring that all staff knows the location of these trolleys. Our survey shows clearly that a significant number of both permanent staff and trainees are not aware of the correct location of the trolleys. In some instances, the doctors were not aware of its presence at all. An alarming finding is that only 2 participants know about all trolleys and their exact locations. Another concern is that the difficult airway trolley is the only one whom all participants know exists. The reason for the poor knowledge of location of the various trolleys may be that the Anaesthetist is unlikely to have to fetch the relevant trolley as they
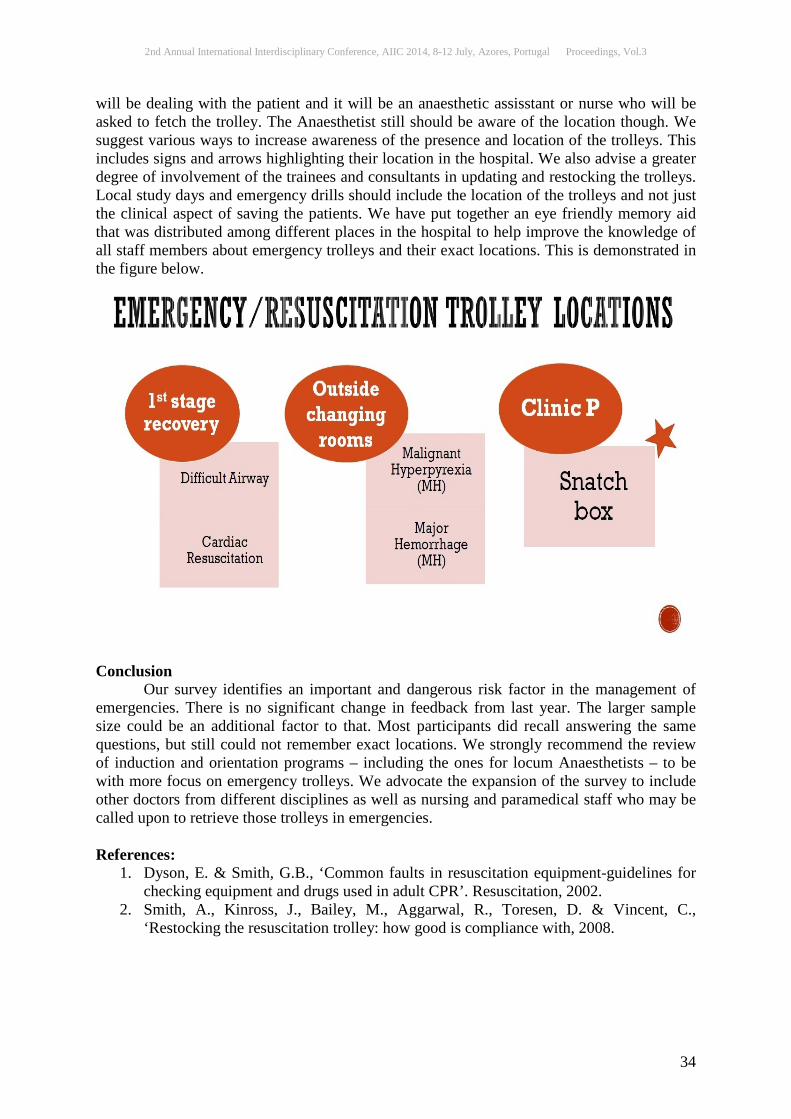
2nd Annual International Interdisciplinary Conference, AIIC 2014, 8-12 July, Azores, Portugal Proceedings, Vol.3
34
will be dealing with the patient and it will be an anaesthetic assisstant or nurse who will be asked to fetch the trolley. The Anaesthetist still should be aware of the location though. We suggest various ways to increase awareness of the presence and location of the trolleys. This includes signs and arrows highlighting their location in the hospital. We also advise a greater degree of involvement of the trainees and consultants in updating and restocking the trolleys. Local study days and emergency drills should include the location of the trolleys and not just the clinical aspect of saving the patients. We have put together an eye friendly memory aid that was distributed among different places in the hospital to help improve the knowledge of all staff members about emergency trolleys and their exact locations. This is demonstrated in the figure below.
Conclusion Our survey identifies an important and dangerous risk factor in the management of emergencies. There is no significant change in feedback from last year. The larger sample size could be an additional factor to that. Most participants did recall answering the same questions, but still could not remember exact locations. We strongly recommend the review of induction and orientation programs – including the ones for locum Anaesthetists – to be with more focus on emergency trolleys. We advocate the expansion of the survey to include other doctors from different disciplines as well as nursing and paramedical staff who may be called upon to retrieve those trolleys in emergencies. References:
1. Dyson, E. & Smith, G.B., ‘Common faults in resuscitation equipment-guidelines for checking equipment and drugs used in adult CPR’. Resuscitation, 2002.
2. Smith, A., Kinross, J., Bailey, M., Aggarwal, R., Toresen, D. & Vincent, C., ‘Restocking the resuscitation trolley: how good is compliance with, 2008.
2nd Annual International Interdisciplinary Conference, AIIC 2014, 8-12 July, Azores, Portugal Proceedings, Vol.3
35
UTILIZATION OF DILATED EYE EXAMS AMONG ADULTS WITH DIABETES
DeLawnia Comer-HaGans, PhD Ning Lu, PhD
Zo Ramamonjiarivelo, PhD Governors State University, USA
Abstract Purpose: The purpose of this study is to determine the utilization rate of dilated eye exams among adults with diabetes, and to examine the differences in receiving dilated eye exams by predisposing, need, and enabling factors. Methods: National survey data from the 2010 Behavioral Risk Factor Surveillance System. Univariate, weighted bivariate, and logistic regression analyses were performed. Independent variables include demographic information. The dependent variable is the receipt of a dilated eye exam. Results: Some characteristics of individuals who were more likely to receive a dilated eye exam include adults 65 or older, non-Hispanic Blacks, individuals with a health plan, individuals who had a physical exam within the past year, individuals with some type of formal diabetes education, and individuals earning at least $50,000 annually. Conclusion: The Andersen Behavior Model that predisposing, need, and enabling factors are positively associated to the receipt of a dilated eye examination was supported. All enabling factors used in our study are strong predictors of receiving a dilated eye examination. Developing effective recommendations and guidelines for dilated eye exam utilization targeting at-risk adults with diabetes may be beneficial for increasing the number of adults with diabetes who receive annual dilated eye exams.
Keywords: Dilated eye exams, diabetes, diabetic retinopathy, diabetic complications Introduction Diabetes is one of the fastest growing causes of morbidity and mortality in the United States. In 2012, approximately 7% of the population in the United States had diabetes [1, 2]. According to the American Diabetes Association, in 2007, diabetes was listed as the underlying cause of 71,382 deaths and was listed as a contributing factor in an additional 160,022 deaths. By the year 2020, 44% of the world’s population will have diabetes. By 2030, most diabetes cases are projected to develop in the United States, China and India. As diabetes increases, so does the concern for its disabling complications, such as diabetic retinopathy that results in vision loss [3-5]. Preventive measures such as the receipt of a dilated eye exam have been shown effective for preventing vision loss by early detection and timely treatment of diabetic retinopathy. I. Of all microvascular l complications, diabetic retinopathy is the most common. It is a complication from both Type 1 and Type 2 diabetes and accounts for about 10,000 new blindness cases every year in the United States [6, 7]. Diabetes statistics published by the American Diabetes Association indicated that diabetes is the leading cause of new cases of
2nd Annual International Interdisciplinary Conference, AIIC 2014, 8-12 July, Azores, Portugal Proceedings, Vol.3
36
blindness among adults aged 20-74 years. Between 2005 and 2008, 4.2 million (28.5%) people with diabetes aged 40 years or older had diabetic retinopathy, and of those, almost 4.4% had advanced diabetic retinopathy that could lead to severe vision loss. By the year 2020, the number of individuals who experience diabetic retinopathy is anticipated to be 7.2 million and 1.6 million will experience vision-threatening diabetic retinopathy [5, 8]. Dilated eye examinations have been found to be more effective than non-dilated examinations to determine eye health. A dilated eye exam is a procedure whereby an individual’s eyes are dilated so that a clear picture of the inner surface is easily viewable with an ophthalmoscope [9]. Previous research has shown that individuals with diabetes often develop retinopathy within a period of five years of diagnosis. The dilated eye exam can detect retinopathy at an early stage and timely treatment can prevent the occurrence of blindness in 90% of at-risk individuals [10]. Several organizations including the American Diabetes Association (ADA), the American Optometric Association (AOA), and the American Academy of Ophthalmology (AAO) have suggested that adults with diabetes receive a dilated eye exam annually [11]. Previous studies have focused on the prevalence and risk factors of eye diseases and visual impairment among adults 40 years and older with diabetes [12, 13], annual eye care and eye care utilization among adults 40 years and older [14, 15], and vision health disparities [16, 17]. This study differs from others in that it applies the Andersen Behavioral Model theory to help explain the contributing factors of dilated eye exam utilization to enhance the current body of knowledge on using dilated eye exams among adults with diabetes. Specifically, the study is to:
1. Determine the utilization rate of dilated eye exams among adults with diabetes; 2. Examine the differences in receiving dilated eye exams by predisposing, need, and
enabling factors. To answer the research questions set forth, the study used the Andersen Behavior Model as a guide, in which healthcare services utilization is determined by predisposing, need, and enabling factors [18]. Predisposing factors consist of the conditions that increase the likelihood that an individual uses services. In this study the predisposing factors include age, race/ethnicity, gender, and socioeconomic status (SES). Need factors relate to the circumstances that prompt an individual to seek medical attention. In this study the need factors are general health status and specific eye health status. Enabling factors relate to the availability of means and access to healthcare services. In this study the enabling factors are health insurance status, socioeconomic status, use of health care, and diabetes education. Methods Data and Sample The study used the Behavioral Risk Factor Surveillance System (BRFSS) data for the year 2010. The BRFSS is an annual telephone survey of a random sample of non-institutionalized U.S. adults aged 18 years and older. The survey inquires about an individual’s general physical, and mental health status, access to preventive health services with respect to chronic diseases, infectious diseases and injuries, and behavioral risk factors such as tobacco use and alcohol consumption. The Centers for Disease Control and Prevention (CDC) developed and administered the survey with the collaboration of the health departments of the 50 states, the District of Columbia, Puerto Rico, Guam, and the Virgin Islands [19]. The survey instrument has three components: (1) the core component that contains a standard set of questions used by all states, (2) optional CDC modules that consist of a set of questions related to a specific health condition such as diabetes and (3) state- added questions which are not under the control of the CDC [19]. In 2010, 35 states, the District of Columbia,
2nd Annual International Interdisciplinary Conference, AIIC 2014, 8-12 July, Azores, Portugal Proceedings, Vol.3
37
Puerto Rico, and the Virgin Islands participated in the diabetes module and are included in our study. Measurements The following variables based on the Andersen-Aday theoretical framework were included in the study: Dependent variable: The receipt of a dilated eye exam was the dependent variable in the study. It was measured by a survey question asking if an individual received a dilated eye exam within the past year. Independent variables: The independent variables consisted of the need factors, enabling factors and predisposing factors. Need factors were measured by two variables including general health status and eye health measured by the presence or absence of diabetic retinopathy. General health status was measured by self-rated health status and categorized as “good” if individuals perceived their health as “excellent”, “very good”, or “good” and as “not good” for individuals who perceived their health as “fair” or “poor”. The presence or absence of diabetic retinopathy was measured by a survey question asking if an individual had ever been told by a medical provider that diabetes had affected his/her eyes or had retinopathy. Enabling factors included access to health care variables. Many studies have demonstrated that having health insurance and a usual source of care indicated by a routine physical checkup and doctor visit are strong indicators of access to care. Thus, in this study health insurance status, physical checkup, and doctor visit for diabetes are used as indicators of access to care. Health insurance status was measured by whether an individual has any kind of health insurance. Physical checkup was measured by whether an individual visited a doctor for a general physical exam within the past year. Doctor visit for diabetes was measured by whether an individual has ever seen a doctor, nurse or health professional for diabetes reasons during the past 12 months. Diabetes education was also used as an enabling factor in the study. It was measured by whether an individual has ever taken a course or class on diabetes management. Predisposing factors were measured by demographic variables including age, gender, race, and socioeconomic status including individual educational level, employment status and income. Race was categorized as Non-Hispanic White, Non-Hispanic Black, and “Other” that include Hispanic, Asian, Hawaiian, American Indian, Native Alaskan, multiracial, and other races. Hispanic and all other races are grouped together due to the concern that the small number in each individual race category would not allow reliable and meaningful analysis. Education was measured by an individual’s highest educational level completed and grouped as elementary education if an individual completed up to an elementary education; high school education if an individual had some high school education, a high school graduate or had a GED; and college education if an individual had some college education, college graduate, or post-college education. Employment status was measured by the individual’s current employment situation and was categorized as employed including self-employed (full time or part-time); unemployed; retired, and other, including those who are not currently looking for a job, homemakers, students, and those who are unable to work. Income was measured by an annual household income and grouped as less than $25,000, between $25,000 and less than $50,000, and $50,000 or greater. Socioeconomic factors are also considered as enabling factors in the study.
2nd Annual International Interdisciplinary Conference, AIIC 2014, 8-12 July, Azores, Portugal Proceedings, Vol.3
38
Statistical analyses The total number of respondents to the 2010 BRFSS survey was 451,075, among which 15 states (AR, CA, CO, KS, ME, MD, MI, MO, NE, NJ, NY, OK, RI, TX, and WA) did not participate in the diabetes module of BRFSS and thus were excluded from the study (n= 163,472). In addition, individuals of the participating states and territories who did not have diabetes (n=250,041) were excluded from the data analysis. As a result, a total of 37,562 individuals who were diagnosed with diabetes constitute the sample and are included in the data analysis. Using the data provided by the participating states and territories a bivariate analysis was performed to determine the diabetes rate and the utilization of dilated eye exams for each state. Univariate analysis was performed on each variable to provide a description of the sample, followed by weighted bivariate analyses and a series of logistic regression analyses. Chi-square tests were performed to determine the significant difference in receiving a dilated eye exam between each independent variable and dependent variable in the bivariate analysis for categorical data. Finally, a series of weighted logistic regressions were performed to calculate odds ratios (ORs) of receiving a dilated eye exam adjusted for various covariates. Since BRFSS data is comprised of telephone surveys, and telephone coverage varies despite the fact that 95% of US households have telephones, post-stratification weights were used to partially correct for any sampling bias due to non-telephone coverage. The weights adjusted for discrepancies in probability of selection, nonresponse, and non-telephone coverage [19]. In this study, using STATA 11.0 [20], the weight variable was included in the logistic regressions using the final weight of each respondent available in BRFSS 2010 data. A detailed description of BRFSS sample design, data collection and weight calculations can be found elsewhere [19]. All significant tests were two tailed and performed at the 0.05 level of significance. Results Diabetes Rate and Utilization of Dilated Eye Exams among Adults with Diabetes by State The diabetes rate and the rate of receiving a dilated eye exam by state are presented in Table 1. On average, the diabetes rate is 13.06% among participating states and territories, ranging from 20.58% (Puerto Rico) to 6.82% (Alaska). Among adults with diabetes (n=37,562) the average rate of receiving a dilated eye exam is about 70% ranging from 59.49% (Kentucky) to 79.32% (Washington DC). States with a higher diabetes rate tend to have a lower rate of dilated eye exam utilization. For example, states and territories that have a diabetes rate greater than 15%, (Alabama, Kentucky, Mississippi, South Carolina, Tennessee, and Puerto Rico) had a dilated eye exam utilization rate less than 70%.
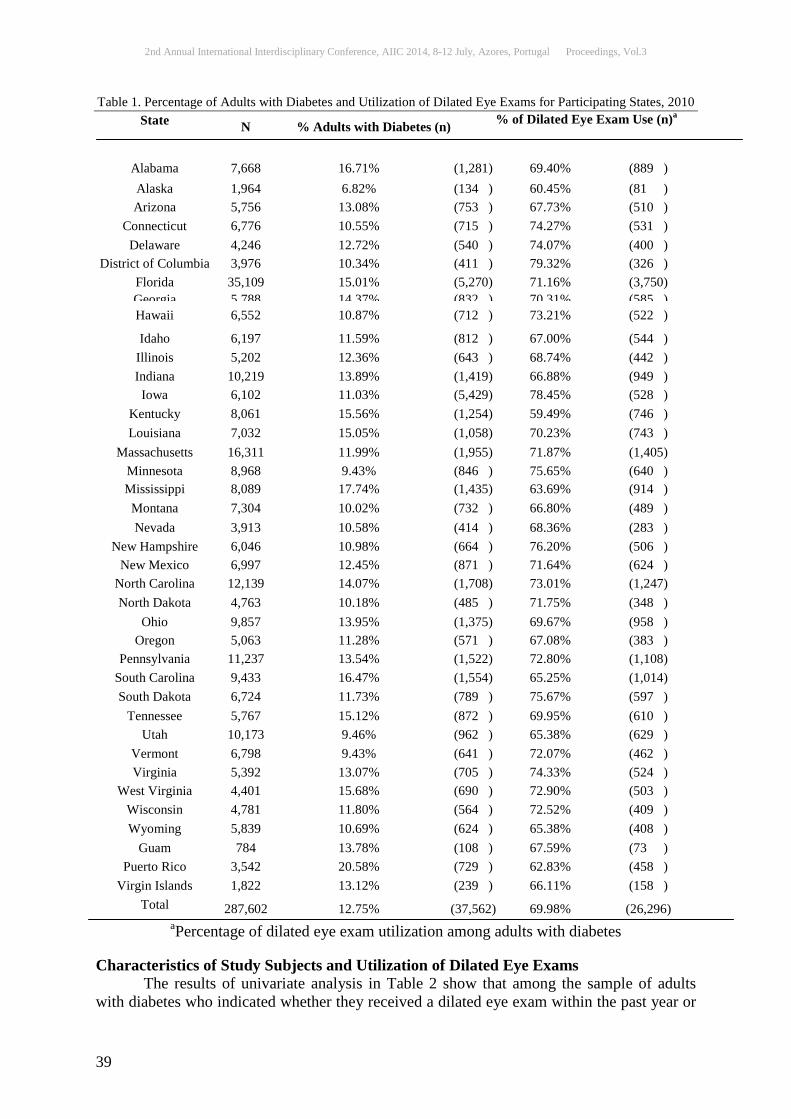
2nd Annual International Interdisciplinary Conference, AIIC 2014, 8-12 July, Azores, Portugal Proceedings, Vol.3
39
Table 1. Percentage of Adults with Diabetes and Utilization of Dilated Eye Exams for Participating States, 2010 State N % Adults with Diabetes (n) % of Dilated Eye Exam Use (n)a
Alabama 7,668 16.71% (1,281) 69.40% (889 ) Alaska 1,964 6.82% (134 ) 60.45% (81 ) Arizona 5,756 13.08% (753 ) 67.73% (510 )
Connecticut 6,776 10.55% (715 ) 74.27% (531 ) Delaware 4,246 12.72% (540 ) 74.07% (400 )
District of Columbia 3,976 10.34% (411 ) 79.32% (326 ) Florida 35,109 15.01% (5,270) 71.16% (3,750) Georgia 5 788 14 37% (832 ) 70 31% (585 ) Hawaii 6,552 10.87% (712 ) 73.21% (522 )
Idaho 6,197 11.59% (812 ) 67.00% (544 ) Illinois 5,202 12.36% (643 ) 68.74% (442 ) Indiana 10,219 13.89% (1,419) 66.88% (949 ) Iowa 6,102 11.03% (5,429) 78.45% (528 )
Kentucky 8,061 15.56% (1,254) 59.49% (746 ) Louisiana 7,032 15.05% (1,058) 70.23% (743 )
Massachusetts 16,311 11.99% (1,955) 71.87% (1,405) Minnesota 8,968 9.43% (846 ) 75.65% (640 ) Mississippi 8,089 17.74% (1,435) 63.69% (914 )
Montana 7,304 10.02% (732 ) 66.80% (489 ) Nevada 3,913 10.58% (414 ) 68.36% (283 )
New Hampshire 6,046 10.98% (664 ) 76.20% (506 ) New Mexico 6,997 12.45% (871 ) 71.64% (624 )
North Carolina 12,139 14.07% (1,708) 73.01% (1,247) North Dakota 4,763 10.18% (485 ) 71.75% (348 )
Ohio 9,857 13.95% (1,375) 69.67% (958 ) Oregon 5,063 11.28% (571 ) 67.08% (383 )
Pennsylvania 11,237 13.54% (1,522) 72.80% (1,108) South Carolina 9,433 16.47% (1,554) 65.25% (1,014) South Dakota 6,724 11.73% (789 ) 75.67% (597 )
Tennessee 5,767 15.12% (872 ) 69.95% (610 ) Utah 10,173 9.46% (962 ) 65.38% (629 )
Vermont 6,798 9.43% (641 ) 72.07% (462 ) Virginia 5,392 13.07% (705 ) 74.33% (524 )
West Virginia 4,401 15.68% (690 ) 72.90% (503 ) Wisconsin 4,781 11.80% (564 ) 72.52% (409 ) Wyoming 5,839 10.69% (624 ) 65.38% (408 )
Guam 784 13.78% (108 ) 67.59% (73 ) Puerto Rico 3,542 20.58% (729 ) 62.83% (458 )
Virgin Islands 1,822 13.12% (239 ) 66.11% (158 ) Total 287,602 12.75% (37,562) 69.98% (26,296)
aPercentage of dilated eye exam utilization among adults with diabetes Characteristics of Study Subjects and Utilization of Dilated Eye Exams The results of univariate analysis in Table 2 show that among the sample of adults with diabetes who indicated whether they received a dilated eye exam within the past year or

2nd Annual International Interdisciplinary Conference, AIIC 2014, 8-12 July, Azores, Portugal Proceedings, Vol.3
40
not (n=36,731), more than half (52%) were 65 or older, about 60% were women, and more than two-thirds (72%) were non-Hispanic White. Non-Hispanic Blacks and other races including Hispanics constituted about 15% and 13% of the sample, respectively. Approximately 94% of the study subjects obtained at least some high school education, and 48% had a college or post college education. However, nearly half (48%) of individuals in the sample had an annual household income of less than $25,000. Less than one-fourth (24%) of the individuals in the study had an annual income of $50,000 or greater. Approximately 20% of the adults with diabetes indicated that they were told by a medical provider that they had diabetic retinopathy or their eyes were affected. To answer the research questions, bivariate analysis was used to determine the utilization rate of dilated eye exams and to examine the relationship between dilated eye exam utilization and independent variables. The results from the chi-square tests are shown in Table 2. The overall utilization of a dilated eye exam among adults with diabetes used in the study was 70%. Those who received a dilated eye exam within the past year and those who did not differed significantly by predisposing, need, and enabling factors.
Table 2. Descriptive Characteristics of Individuals Utilizing/Not Utilizing Dilated Eye Examsa Variable Dilated Eye Exam
Totalb Yes No N=37,562 70% (n=26,296) 28% (n=10,435)
Predisposing Factors Age*** 18-44 6% (2,317) 5% (1,284) 10% (1,033) 45-64 42% (15,189) 39% (10,086) 49% (5,103)
65 or older 52% (18,930) 56% (14,690) 41% (4,240) Race***
Non-Hispanic White 72% (26,026) 72% (18,639) 72% (7,387) Non-Hispanic Black 15% (5,243) 15% (3,836) 14% (1,407)
Hispanic and other races 13% (4,777) 13% (3,327) 14% (1,450) Education level***
Elementary 6% (2,368) 6% (1,657) 8% (801) High school 46% (16,763) 44% (11,670) 49% (5,093)
College 48% (17,504) 50% (12,991) 43% (4,513) Income*** < $25,000 48% (14,784) 45% (9,930) 54% (4,854)
Between $25,000 and <$50,000 28% (8,678) 29% (6,397) 25% (2,281) $50,000 or greater 24% (7,577) 26% (5,690) 21% (1,887)
Employment status*** Unemployed 5% (1,865) 4% (1,115) 7% (750)
Employed 26% (9,655) 25% (6,572) 30% (3,083) Not currently looking for a job 24% (8,774) 22% (5,807) 29% (2,967)
Retired 45% (16,292) 49% (12,701) 35% (3,591) Gender Male 40% (14,548) 40% (10,421) 40% (4,127)
Female 60% (22,183) 60%(15,875) 60% (6,308) Need Factors
General health status*** Good 52% (19,132) 54% (14,217) 47% (4,915)
Not good 48% (17,417) 46% (11,948) 53% (5,469) Presence of diabetic retinopathy***
Yes 20% (7,171) 21% (5,497) 16% (1,674)

2nd Annual International Interdisciplinary Conference, AIIC 2014, 8-12 July, Azores, Portugal Proceedings, Vol.3
41
*p<0.05, **p<0.01, ***p < 0.001. P values indicate the significance of differences in
distribution between those who received a dilated eye exam and those who did not, by χ2 analysis aPercentage of the total may not add up to 100% due to rounding.
bNumber of individuals who did not answer to the dilated eye exam (n=831; 2%) Significant Difference in Dilated Eye Exam Utilization To answer the research question about the differences in receiving a dilated eye exam by independent variables, a series of logistic regression analysis was conducted to examine the receipt of a dilated eye exam in relation to predisposing, need, and enabling factors while controlling confounding factors. The results of the final logistic regression model are reported in Table 3. With regard to the predisposing factors, the results indicated that older individuals were more likely than their younger counterparts to receive a dilated eye exam. Compared to individuals aged between 18 and 44 years, the likelihood of receiving a dilated eye exam was 35% greater (OR = 1.35, 95% CI = 1.12-1.62, p < 0.05) for individuals aged between 45 and 64, and more than two times greater for individuals aged 65 and older (OR = 2.07, 95% CI =1.67 - 2.55, p < 0.001). With respect to race, findings indicated that non-Hispanic Blacks were slightly more likely than non-Hispanic Whites to receive a dilated eye exam (OR = 1.22, 95% CI =1.05-1.41, p <0.01). There was no statistically significant difference in the likelihood of receiving dilated eye exams between non-Hispanic Whites and other races including Hispanics. The results of the logistic regression reveal that need factors were significantly associated with receiving a dilated eye exam. With respect to general health status the results indicated that healthier individuals, those who reported health status as being “good”, were 15% more likely to receive a dilated eye exam than individuals reporting health status as not being good (OR = 1.15, 95% CI =1.03-1.28, p < 0.05). Compared to individuals with no diabetic retinopathy, those with diabetic retinopathy were 34 % more likely to receive a dilated eye exam (OR = 1.34, 95% CI = 1.17-1.54, p< 0.001). As expected, the enabling factors used in the study were positively associated with receiving a dilated eye exam. Compared to individuals without a health plan, those with a health plan were 77% more likely to receive a dilated eye exam (OR = 1.77, 95% CI =1.46 - 2.15, p < 0.001). In addition, having a physical exam within the past year indicated a more than two times likelihood in receiving a dilated eye exam (OR = 2.16, 95% CI =1.85-2.53, p < 0.001). Furthermore, those who reported a visit to a healthcare provider for diabetes
No 80% (29,095) 79% (20,461) 84% (8, 634) Enabling Factors
Having health insurance*** Yes 92% (33,805) 95% (24,812) 86% (8,993) No 8% (2,849) 5% (1,424) 14% (1,425)
Doctor visit for general physical exam*** Yes 88% (32,018) 91% (23,708) 80% (8,310) No 12% (4,333) 9% (2,319) 20% (2,014)
Variable
Dilated Eye Exam Total Yes No
Doctor visit for diabetes*** Yes 89% (31,361) 90% (22,948) 84% (8,413) No 12% (4,075) 10% (2,428) 16% (1,647)
Diabetes education*** Yes 54% (19,783) 57% (15,027) 46% (4,756) No 46% (16,836) 43% (11,193) 54% (5,643)

2nd Annual International Interdisciplinary Conference, AIIC 2014, 8-12 July, Azores, Portugal Proceedings, Vol.3
42
reasons were 44% more likely to receive a dilated eye exam (OR = 1.44, 95% CI = 1.24-1.68, p < 0.001). The odds of receiving a dilated eye exam for individuals who had some type of formal diabetes education were 55% greater than the odds of those who did not have some type of formal diabetes education (OR =1.55, 95% CI =1.40-1.72, p < 0.001). The odds of receiving a dilated eye exam were positively associated with annual income, which is also an enabling factor in the study. Individuals earning at least $50,000 annually had 38% greater odds of receiving a dilated eye exam (OR = 1.38, CI =1.18-1.63, p < 0.001) compared to individuals earning less than $25,000 annually.
Table 3. Factors Associated with the Odds of Receiving a Dilated Eye Exam among Adults with Diabetes Independent Variable (Reference Category) Adjusted Odds Ratio (95% CI)a
Predisposing Factors Age (18-44)
45-64 1.35 (1.12 - 1.62)** 65 or older 2.07 (1.67 - 2.55)***
Race (Non-Hispanic White) Non-Hispanic Black 1.22 (1.05 - 1.41)**
Hispanic and other races 0.96 (0.80 - 1.15) Education level (Elementary)
High school 1.14 (0.87 -1.50) College 1.25 (0.94 - 1.66)
Income (< $25,000) $25,000 and < $50,000 1.10 (0.97 - 1.26)
$50,000 or greater 1.38 (1.18 - 1.63)*** Employment (Unemployed) Employed or self-employed 0.97 (0.75 - 1.25)
Not looking for a job 1.05 (0.81 - 1.35) Retired 1.25 (0.97 - 1.61)
Need Factors General health status (Not good)
Good 1.15 (1.03 - 1.28)* Diabetic Retinopathy (No)
Yes 1.34 (1.17 - 1.54)*** Enabling Factors Health Plan (No)
Yes 1.77 (1.46 - 2.15)*** Physical exam (No)
Yes 2.16 (1.85 - 2.53)*** Diabetes doctor (No)
Yes 1.44 (1.24 - 1.68)*** Diabetes education (No)
Yes 1.55 (1.40 - 1.72)***
aCI =Confidence Interval * p < 0.05 ** p < 0.01 ***p < .001 Variable gender is dropped in logistic regression for insignificance in bivariate analysis.
Discussion The purpose of this study is to determine the proportion of adults with diabetes who received a dilated eye exam within the past year and to examine how the predisposing factors, need factors, and enabling factors are associated with receiving a dilated eye exam. Our study shows that the percentage of adults who received a dilated eye exam within the past year is 70% which is a significant increase from 54.3% in 2008 [21]. In addition, all states included in the study have met the target value of 58.7% of Healthy People 2020 (HP2020). The study supported the Andersen Behavior Model that predisposing, need, and enabling factors are positively associated with the receipt of a dilated eye examination. For example, all enabling factors used in the study are strong predictors of receiving a dilated eye examination. The literature also suggested that other factors indicative of individuals
2nd Annual International Interdisciplinary Conference, AIIC 2014, 8-12 July, Azores, Portugal Proceedings, Vol.3
43
receiving needed services are continuity of care, affordability, and advice from a physician [17]. Due to the limitation of BRFSS data, the study was unable to examine the relationship between these factors and the receipt of a dilated eye examination. Contrary to a previous study that showed Blacks suffering from diabetes were less likely to receive an annual dilated exam than Whites [22], this study found that the proportion of non-Hispanic Blacks who received a dilated eye exam within the past year is slightly higher than that of non-Hispanic Whites (73% vs. 72%). The study also indicates that there is no significant difference in receiving an annual dilated eye examination between non-Hispanic Whites and other races including Hispanics. The fact that Hispanics and other minority races were lumped together as one group may have caused the detailed differences between races to be lost. Due to the small numbers of each minority group in the data, a meaningful statistical analysis for each individual race could not be performed. The study findings suggested that younger adults aged 18-64 years, individuals with less education, less income, who had no health insurance or no regular source of care indicated by having an annual physical examination, who visited a doctor for diabetes reasons, and who did not have any formal diabetes management education, are less likely to receive a dilated eye exam. These findings are consistent with previous studies [17, 23]. This study has several limitations. First, the estimated proportion of receiving a dilated eye examination may not be comparable with the statistics reported in HP 2020 due to the use of a different data set. In addition, even though the definition of receiving a dilated eye exam is the same across different data sets, the results could be different using different data. For example, data from the 2000 Medical Expenditure Panel Survey (MEPS) shows that more than 90% of adults with diabetes reported receiving a dilated eye exam within the past year [24]. Based on the National Health and Nutrition Examination Survey (NHANES) III study the same rate is between 60%-70% for adults with Type 2 diabetes [24]. The differences in the proportion of adults receiving an annual dilated eye exam from different studies may stem from the different population included in the study and using different years of standard population for age-adjusted data or without an age-adjustment. For example, in this study, fifteen states are excluded due to nonparticipation in the diabetes module in the year 2010. Thus, caution should be exercised when generalizing study findings to populations beyond study states and territories. A second limitation of the study concerns the validity and reliability of self-reported measures. Even though BRFSS data has been previously evaluated for validity and reliability, there is a limitation in self-reported data [15]. If respondents of different socioeconomic status assess their need factors and reported their receipt of a dilated eye examination systematically differently due to perception bias or recall bias, the odds of receiving a dilated eye exam by independent factors would be inappropriately estimated. Nonetheless, the validity and reliability of self-rated health related measures in BRFSS has been well documented [25]. Another limitation is related to the way adults with diabetes were categorized into each race/ethnicity group. Due to the insufficient number of adults with diabetes in more refined race/ethnicity groups, racially or ethnically heterogeneous individuals were grouped together in one group labeled as “other.” The dilated eye exam estimate for this group thus has limited practical meaning. Conclusion
The study found that adults with diabetes who are older, in poor health, have low income, have no health insurance, and who are without formal diabetes education, are less likely to receive a dilated eye exam compared to their counterparts. Unfortunately, our study indicated that these adults with diabetes who are at the greatest risk of developing diabetic

2nd Annual International Interdisciplinary Conference, AIIC 2014, 8-12 July, Azores, Portugal Proceedings, Vol.3
44
retinopathy, who need the annual dilated eye exam the most, are those who are least likely to have one. This study suggests that more effective policies and programs to promote and aid the utilization of a dilated eye exam among this at-risk and vulnerable subset population with diabetes are needed. Developing effective recommendations and guidelines for dilated eye exam utilization targeting at-risk adults with diabetes may be beneficial for increasing the number of adults with diabetes to receive annual dilated eye exams.
References: Engelgau MM, Geiss LS, Saaddine JB, et al. The evolving diabetes burden in the United States. Ann Intern Med. 2004;140(11):945-950. American Diabetes Association (ADA). Economic costs of diabetes in the U.S. in 2012. Diabetes Care. 2013;36(4):1033-1046. Narayan KM, Boyle JP, Thompson TJ, Sorensen SW, Williamson DF. Lifetime risk for diabetes mellitus in the United States. JAMA. 2003;290(14):1884-1890. Wild S, Roglic G, Green A, Sicree R, King H. Global prevalence of diabetes: estimates for the year 2000 and projections for 2030. Diabetes Care. 2004;27(5):1047-1053. Kempen JH, O’Colmain BJ, Leske MC, et al. The prevalence of diabetic retinopathy among adults in the United States. Arch Ophthalmol. 2004;122(4):552-563. Fong DS, Aiello LP, Gardner TW, et al. Retinopathy in diabetes. Diabetes Care. 2004;27(Suppl 1):S84-S87. Fong, DS, Aiello LP, Ferris FL, Klein R. Diabetic Retinopathy. Diabetes Care. 2004;27(10):2540-2553. Centers for Disease Control and Prevention. Diabetes Public Health Resource. 2011 National Diabetes Fact Sheet. Available at: http://www.cdc.gov/diabetes/pubs/estimates11.htm. Accessed September 26, 2013. Chew EY, Ferris FL, Csaky KG, et al. The long-term effects of laser photocoagulation treatment in patients with diabetic retinopathy: the early treatment diabetic retinopathy follow-up study. Ophthalmology. 2003;110(9):1683-1689. American Academy of Ophthalmology Retina Panel. Preferred Practice Panel Guidelines. Diabetic Retinopathy. Available at: http://one.aao.org/preferred-practice-pattern/diabetic- retinopathy-ppp--september-2008-4th-print. Accessed January 5, 2013. American Diabetes Association. Standards of medical care in diabetes – 2007. Diabetes Care. 2007;30(Suppl 1): S4-S41. Zhang X, Saaddine JB, Chou C-F, et al. Prevalence of diabetic retinopathy in the United States, 2005-2008. JAMA. 2010; 304(6):649-656. Ryskulova A, Turczyn K, Makuc DM, et al. Self-reported age-related eye diseases and visual impairment in the United States: results of the 2002 national health interview survey. AJPH. 2007; 98(3):454-461. Chou C-F, Barker LE, Crews JE; et al. Disparities in eye care utilization among the United States adults with visual impairment: findings from the behavioural risk factor surveillance system 2006-2009. Am J Ophthalmol. 2012;154(Suppl 6):S45-S52. McGwin G, Khoury R, Cross J, Owsley C. Vision impairment and eye care utilization among Americans 50 and older. Curr Eye Res. 2010;35(6):451-458. Zambelli-Weiner A, Crews JE, Friedman DS. Disparities in adult vision health in the United States. Am J Ophthalmol. 2012;154(Suppl 6):S23-S30. Zhang X, Cotch MF, Ryskulova A, et al. Vision health disparities in the United States by race/ethnicity, education, and economic status: findings from two nationally representative surveys. Am J Ophthalmol. 2012;154(Suppl 6):S53-S62. Aday LA, Andersen R. A framework for the study of access to medical care. Health Serv Res. 1974;9(3):208-220.

2nd Annual International Interdisciplinary Conference, AIIC 2014, 8-12 July, Azores, Portugal Proceedings, Vol.3
45
Centers for Disease Control and Prevention. Behavioral Risk Factor Surveillance System Survey Data 2010. Available at: http://www.cdc.gov/brfss/annual_data/annual_2010.htm. Accessed September 17, 2012. StataCorp. Stata statistical software. Version 11. College Station: StataCorp; 2009. U.S. Department of Health and Human Services. Healthy People 2020. Available at: http://www.healthypeople.gov/2020/Data/SearchResult.aspx?topicid=8topic =Diabetes&objective=D-10&anchor=350. Accessed September 30, 2013. Nsiah-Kumi, P, Ortmeier, SR, Brown AE. Disparities in diabetic retinopathy screening and disease for racial and ethnic minority populations – a literature review. J Natl Med Assoc. 2009;101(5):430-437. Schwartz K, Schwartz T. Uninsured young adults: a profile and overview of coverage options. Issue Paper, Washington DC: The Henry J. Kaiser Family Foundation. The Kaiser Commission on Medicaid and the Uninsured, 2008. Available at: http://kaiserfamilyfoundation.files.wordpress.com/2013/01/7785.pdf. Accessed on November 2, 2012. Lee JA, Liu CF, Sales, AE. Racial and ethnic differences in diabetes care and health care use and costs. Prev Chronic Dis. 2006;3(3):A85. Nelson DE, Holtzman D, Bolen J, Mack CA, Stanwyck KA. Reliability and validity of measures from the behavioral risk factor surveillance system. Soz Praventivmed. 2001;46(Suppl 1):S3-42.
2nd Annual International Interdisciplinary Conference, AIIC 2014, 8-12 July, Azores, Portugal Proceedings, Vol.3
46
STUDY THE ROLE OF MASS SPORTS AND PHYSICAL ACTIVITY IN A HEALTHY EGYPTIAN SOCIETY
Ezzeldin R. Aly, PhD Assistant Professor, of Health and Movement Science & Sport Manageemnt,
Graceland University
Abstract
‘’A healthy society is a state of complete physical, mental and social well-being and not merely the absence of disease or infirmity. The enjoyment of highest attainable standard of health in one of the fundamental rights of every human being without distinction of race, political belief, economic or social condition” Constitution of the World Health Organization (WHO), 1946. The United Nations Development Program (UNDP) has provided a definition of development as "development of the people for the people by the people" (UNDP, 1993). Egypt has been long considered as one of the most attractive countries to visit because of its historical treasures. Egypt instituted several sport-for-all initiatives in its post-colonial modernization. These included a government sports council in the 1960s and the establishment of a Ministry of Youth and Sports (MYS) in 1999. The MYS oversees national parks and seaside areas as well as a large-scale fitness mobilization walk/jog events. A major goal of MYS was to develop and maintain youth centers in all of Egypt's metropolitan areas that would service young people's needs in mass sport and physical activities(e.g., basketball, soccer, volleyball).With Egyptian population up to 80 million there are projects related to sport- for- all, events, and or organized programs (cooperative or competitive ) for large groups , including the general population participating in clubs, on playing fields, in gymnasiums , community centers and community recreation programs around Egypt. These were enough for the future of mass sport participation in a great nation with a great history in sport. The International Sport Management Questionnaire (ISMQ), created by Waters (1996), in order to determine the status of sport development in Egypt it was necessary that the ISMQ be translated in to Arabic. This would ensure that Egyptian’s mass sport and activities leaders- all of whom speak Arabic as their “mother tongue”- would have every opportunity to completely understand each of the 51 question as posed specifically for mass sport and activities (and its development) and answer with accuracy, confidence, and reliability. The translation of the ISMQ was carried out by Aly& Elmahdy who are associated with this present study, then distributed to 66 Egyptian mass sport and activities leaders at different youth centers, clubs, recreation departments, in 24 out of 26 cities in Egypt. Raters were asked to provide answers to closed- and open – ended questions (n=51) on the ISMQ, which ultimately resulted in scoring. (Maximum=33 points) of eight factor components: objectives, legislation, organization, implementation, physical resources, human resources, research and evaluation, and contribution to healthy nation building. Analysis of data was through descriptive statistics (frequency distribution using a histogram graph that shows the frequency distribution of variable to evaluate the mass sport and physical activities distribution). The results showed that Egyptians practice recreation, mass sports and physical activities as a tool to promote health and prevent disease. Running, soccer, and team sports are mostly practiced in the southern part of Egypt while in the north west of the country people mostly practice aquatic sports such as beach volleyball, swimming, surfing, speed boating , fishing ,rowing, scuba diving, sailing, etc. Because of population increases over the
2nd Annual International Interdisciplinary Conference, AIIC 2014, 8-12 July, Azores, Portugal Proceedings, Vol.3
47
last decade facilities like parks, schools, clubs, beaches, water facilities, and youth centers are insufficient to meet the needs of the population. In addition, poor access to private clubs doesn’t help Egypt’s middle class to participate in mass sports programs and activities as long as those clubs have annual membership fees. Most of the facilities for mass sport and physical activities are located in the suburban areas cities such as Cairo, Alexandria, and Ismailia. Further south there are fewer mass sport programs and physical activities and opportunities for the Egyptian population.
Keywords: Mass sport or sport- for- all, Cross Culture, Assessment Introduction In Egypt most of the mass sport legislation falls under the ministry of youth control, running, soccer, game sport mostly would be practice by the south part of Egypt while the north west of the country people manly practice aquatic sports. Municipal life, which comes closer to the lives of the people than is possible for a central administration, was known in ancient Egypt. Each city had its prefect, a sort of mayor whose business it was to provide the necessary for the civic needs of the inhabitants. The prefect, whose scarlet robes were emblematic of his office, was assisted by a judge and by a scribe. One of his functions was to regulate labor and employment. Craftsmen and artisans were strictly prohibited from changing over from one trade to another. Skilled handwork does not appear to have enjoyed an open market. Most craftsmen were attached in a more or less permanent capacity to the establishments of nobles or high officials. It follows, therefore, that there cannot have been a large or independent middle class in ancient Egypt. There was the official or ruling class, the class of the priests and, below these, the masses employed in work of every kind. Since members of what are now known as the learned professions were mostly members of the priesthood there was apparently no transitional or middle class as we know it today, not until the Middle Kingdom did the ever-swelling numbers of bureaucrats constitute a class which, without owning land and without performing manual labor, nevertheless worked for its living and became a "purchase class". In Egypt most of the facilities for mass sport or sport activities are located in the cities such as Cairo, Alexandria, Ismailia, and as we go south to the countryside they are fewer recreational facilities and opportunities, the important of issues that deal with the economy and rights of the disadvantaged population have emerged (Elmahdy S., DiRocco P., Aly E., 2011). This study focuses on the development of the Egypt’s mass sport, wellness, and physical activities. It analysis all the different areas and cities in Egypt by its different groups including the general population participating in private clubs, playing fields, gymnasiums, community centers, and community recreation programs. Culture and government in Egypt starts from the capital city Cairo and extends to the rest of the major cities in Egypt. Most of the cities in Egypt are close to the river Nile river, and many are close to Cairo. While the major cities in Egypt get most of the attention, the authors of this study are concerned about the health of all Egyptians, including those who live far away from the centers of population. With the variety of locations, history, facilities, populations , and their advantages and disadvantages, the researchers found it important to analyze the role of mass sports, physical activities and wellness programs which are crucial to a healthy Egyptian society. Review of Literature The playful atmosphere during the mid-70’s led to the first step of Sport for All movement in Egypt that help people of all ages to participate in games and sports. (Efstathios C. 2009). The sport for All Movement helped people to revive traditional games and sports
2nd Annual International Interdisciplinary Conference, AIIC 2014, 8-12 July, Azores, Portugal Proceedings, Vol.3
48
(Kartakoullis, 2002). In Hungary regular physical activities (PA) are not widely favored and practiced. Hungarian students at both levels rank the cultural elements cultural, socio-demographic and environmental factors these support earlier findings (Olvasztóné, Huszár & Konczos, 2007). Comparing between the Hungarian and the Austrian students the Austrian primary school students seem to have a more positive attitude to physical values than their Hungarian peers, which results higher measures of quality of life (Tibor, P., et al 2009). All these demonstrate that socio-cultural aspects do have a significant contribution to PA (Keresztes, Pluhár, Vass and Pikó, 2004). Opportunities and environmental factors for sport and physical activities are clearly important contributors to quality of life. This piece of information is also along the line of previous research (Dunn, Brown, & McGuigan 1994). It was reported by Jerzy Kosiewicz (2009) that the role of sport in the production, reproduction, and transformation of culture with the growth of sport as facilitated by the mass media, the influence of sport on the content elements of culture by the press, through television.According to J. Kosiewicz (2007), European Countries (Leska D. /ed./, Comenius University in Bratislava, Bratislava 2007), (d), and movement recreation for all, Kosiewicz J. Warszawa (2007), and (e) Kosiewicz J. &Warszawa (2007) consolidation that may lead to further unification of research on the sociology of sport and sport- for- all movement. Klügl, M. et al (2010) studied the effects of injuries on participating in physical activity and the prevention in the U.S. It mentions that physical activities which are associated with several health benefits including primary and secondary prevention of diseases and mortality rate reduction. It noted that both the American College of Sports Medicine and the American Heart Association advocate endurance training for all healthy adults. In a recent study by Roohafza, H. et al (2009) they investigate the association between lifestyle and socioeconomic factors and coping strategies in a community sample in Iran. The results showed the influence of socioeconomic status and lifestyles factors or sports participation programs aimed at improving healthy life-styles and increasing socioeconomic status could increase physical activities and sports participation. Methodology
The International Sport Management Questionnaire (ISMQ), created by Waters (1996), in order to determine the status of sport development in Egypt it was necessary that the ISMQ be translated in to Arabic. This would ensure that Egyptian’s mass sport and activities leaders- all of whom speak Arabic as their “mother tongue”- would have every opportunity to completely understand each of the 51 question as posed specifically for mass sport and activities (and its development) and answer with accuracy, confidence, and reliability. Then survey was distributed to 66 Egyptian mass sport and activities leaders at different youth centers, clubs, recreation departments, in 24 out of 26 cities in Egypt. Raters were asked to provide answers to closed- and open – ended questions (n=51) on the ISMQ, which ultimately resulted in scoring. (Maximum=33 points) of eight factor components: objectives, legislation, organization, implementation, physical resources, human resources, research and evaluation, and contribution to healthy nation building. Analysis of data was through descriptive statistics (frequency distribution using a histogram graph that shows the frequency distribution of variable to evaluate the mass sport and physical activities distribution) Appendix- A. Participants in this study were the mangers of sport –for- all Organizations in different cities in Egypt. They were asked to provide answers to closed- and open-ended questions (n=51) on the ISMQ, which ultimately resulted in scoring (maximum=33 points) of eight factor components: objectives, legislation, organization, implementation, physical resources, human resources, research and evaluation, and contribution to healthy nation building (Attached appendix B).Analysis of data was through

2nd Annual International Interdisciplinary Conference, AIIC 2014, 8-12 July, Azores, Portugal Proceedings, Vol.3
49
descriptive statistics highlighting Egyptian mass sport factor components that are effectively being developed and managed. Results Insert Mass Sport Score Histogram Here, (Appendix-A)
The role of mass sport is critical for the enhancement of health and wellness in Egyptian society. With responses from 19 out of 24 cities around Egypt researcher found: Objectives of the national goals for mass sport or sport- for- all 74% of the subjects agreed that healthy lifestyle is one of the main reasons to prevent chronic diseases like the ones that relate to smoking and drugs they indicate we should have women more involved in sports. They believe we should discover the talented children and work with them to help them get to the elite level. We should use the leisure time to improve attitudes about sports, and the energy of youth into positive activity. Insure daily participant in sport and different physical activities, and organize different events and activities in parallel with different age groups and gender at the national level to improve the healthy lifestyle within Egyptian Society. Manage mass sport for the nation 78% of the subjects agreed about the need to improve of the management process for sport- for- All programs through the role of all the departments that are responsible about mass sport in Egypt, such as departments of program and sport development, departments of physical education program, central department of sport activities and the Egyptian Sport- for- all Federation. Mass sport as a national project 83% of the subjects agreed about adding more national projects to improve mass sport such as , youth projects, national camp and recreation program, retirement activities, school sport activities day, national celebrations, social activities, country side activities, cities activities, special need activities for people of all ages with disabilities .Mass sport from the facilities& federal fund subjects prospective ,92% agreed that 87% of the cities must require using more federal and state funds to improve mass sport facilities for the outdoor and indoor facilities, swimming pools, public libraries, recreational centers, especially in eastern and Sothern Egypt. Mass sport as structure and leadership, 97% of the subjects agreed that Egypt needs a sector or structures that would be responsible for mass sport or sport- for- all within Egyptian society. This structure would be a national body with leadership in this area over all cities and manage mass sports programs and all youth activities. This body should have specific and special skills and experience with leadership in the field of mass sport at the national level. This resent study found the most important mass sport activities include walking, swimming, running, fishing, exercise, hunting, sports club activities national celebrations, public sports tournaments, religious celebrations, historical celebrations, The present study regarding mass sport implications found, with the lack of government support from the economic and political side, mass sport is a need for a lot of meetings, work shop, conferences, and research to discuss the need for mass sport in Egypt. Mass sport will lead to a decrease in crimes rate, fewer diseases, lower hospitals costs and better performance for workers. Discussion
The recent study found that sport- for- all programs are important to improve the physical activities and health for people of all ages and genders within Egyptian society. In a recent study by Dimitriou, et al, (2011). Greek community sport skills learning programs helped children to achieve daily physical activities. In Egyptian social life it is important to increase sports- for- all and the education of healthy lifestyle. In a study by Richard, et al (2012) they found that one potential educational strategy rests on the idea that knowledge is not fixed but fluid and, therefore, critical education is less about the transmission of knowledge and more about equipping students with skills so that they can critically engage with uncertainty and negotiate the complexities of social life. In addition a study by Collins,
2nd Annual International Interdisciplinary Conference, AIIC 2014, 8-12 July, Azores, Portugal Proceedings, Vol.3
50
D. et al, (2012) investigated the purpose a multidimensional approach to lifelong sport and activity participation as a theoretically justified basis for research and intervention design as a new direction in participant development in sport and physical activity. This present study showed that 74% of the subjects agreed that a healthy lifestyle within Egyptian society is one of the main ways to prevent the chronic diseases, while 78% of the subjects considered that improving the management for sport- for- all programs would help in the development of the healthy lifestyles for the Egyptians. 83% of the subjects reported that adding more national and international projects can improve mass sport. 92% agreed that 87% of the cities must require using more federal and state fund to improve mass sport. 97% agreed that Egypt needs a sector or structures that would be responsible for mass sport or sport- for- all within Egyptian society. Conclusion
The results showed that people practice sport for health and or recreation. Most of the mass sport legislation falls under the Egyptian Ministry of Youth control. According to the results, people practice sports that are popular in their city. For example running, soccer, team sports are mostly practiced by people in the southern part of Egypt, while the north west of the country practices manly aquatic sports. Poor access to private clubs does not help middle class families to participate in sports because of expenses that are required for the annual membership fees. Not only that, but also the location for the organization for sport- for-all presents problem. Most of the facilities are located in cities such as Cairo, Alexandria, Ismailia, and as we go south Egypt has fewer wellness opportunities for the populations. Moreover, the facilities like parks, schools, clubs, beaches, Nile River, deserts, and youth centers are not enough for the population percentages in Egypt. Practical Implications
The results contribute very will to the understanding of the whole phenomena of mass sport or sport-for-all. In addition, it indicates that the Egyptian society holds analogous corresponded to the ISMQ. Participants favored practicing sport- for- all whenever possible. The opportunities for the countryside are not as good as for the suburban area. The researchers believe the advocacy strategy of working for legislation to advance accessibility within the Egyptian society by elimination of economic and financial barriers and programming restrictions would be successful in Egypt, and strongly supported by the Egyptian Ministry of Youth.
Limitations and future Research
As frequently occurs in studies involving 27 states we received responses from 19 states only. The efforts and time we put in to receive the responses was too much. In addition to data collected it took one year to get the response of the survey back by the ISMQ; it would be interesting if similar studies can use multiple to help in the development of the mass sport and sport-for-all. Recommendations
The authors strongly recommend future studies for the future improvement and development in deficient mass sport areas and sport-for-all, not only in Egypt but in other countries. There is a need to increase research about media and mass sport, and the importance of mass sport or sport-for-all and physical activities for Egyptian citizens to ensure a healthy lifestyle, demographic research for mass sport or sport-for-all in some specific cities especially in south Egypt.

2nd Annual International Interdisciplinary Conference, AIIC 2014, 8-12 July, Azores, Portugal Proceedings, Vol.3
51
Appendix –A The mass sport survey scores for the 66 mass sport leaders observed in the study ranged from a minimum of 22.1 to a maximum of 24.7 with a mean score of 23.2. With Std. Dev = 0.581 References Bucher, C A., & Krotee, ML. (2006). Management of Physical Education and Sport 13th ed. St. Louis, McGraw-Hill Companies. Dave C., Richard B.,Paul F., et al (2012). Three Worlds: New Directions in Participant Development in Sport and Physical Activity.Sport, Education & Society, Mar2012, Vol. 17 Issue 2, p225-243, 19p. Elmahdy S., Dirocco P., Aly E. (2011). Egyptian and U.S. Parent Attitudes Regarding Adapted Physical Activities (APA) for Children with Disabilities. The International Journal Of Health Wellness &Society Vol.1 Number 2, 2011. Efstathios C. (2009). Changes In Society, Changes In Sport: The Case Of Cyprus Semmelweis University, Faculty of Physical Education and Sport Sciences, International Quarterly of Sport Science. Fu, Q. (2001). The assessment of delivery system for support in Unpublished Master’s thesis, Nanyang Technological University, Singapore. Hamidreza R., Masoumeh S., Shahin S., et al (2009). Association of Socioeconomic Status and Life-Style Factors with Coping Strategies in Isfahan Healthy Heart Program, Iran. ByCroatian Medical Journal, Aug 2009, Vol. 50 Issue 4, p380-386, 7p, 2 Charts.

2nd Annual International Interdisciplinary Conference, AIIC 2014, 8-12 July, Azores, Portugal Proceedings, Vol.3
52
Jerzy K. (2009). Sociology Of Sport in Europe Historical And Research Perspective. International Quarterly of Sport Science 2009. Jerzy K. (2007). Sociology of Sport in EuropeRzeszów Social Dimensions of Sport and Recreation Development in Central European Countries International Quarterly of Sport Science. Kartakoullis, L. N. (2002). Cyprus: In Search of the Right Measure for Sport for All in Dacosta Lamartin P. and Miragaya A. Worldwide experiences and trends in Sport for All.Oxford:Meyer and Meyer. Klügl M., Shrier I., McBain K., et al (2010).The Prevention of Sport Injury: Ann Analysis of 12000 published Manuscripts, Clinical Journal of Sport Medicine, Nov 2010, Vol. 20 Issue 6, p407-412, 6p, 4 Charts. Martina D., Maria M., Vassilios G. et al (2011). Participation in community-based sport skills learning programmes, physical activity recommendations and health-related fitness for children in Greece.Sport Sciences for Health, Jul 2011, Vol. 6 Issue 2/3, p93-101, 9p. Olvasztóné, B. Zs., Huszár, A. & Konczos, Cs. (2007).Az egészségkulturális magatartás és értelmezése, (Health conscious behavior and its meaning). Kalokagathia, 1-2, 111-124. Pikó, B., Pluhár, Zs. & Keresztes, N. (2004). Külső kényszer vagy belső hajtóerő? Serdülők fizikai aktivitásának motívációs tényezői. [External force or internal power: children’s andpubescent’s motivational resources of physical activity. In Hungarian]. Applied Psychology,6(3), 40-54. Riordan, J. (1986). State and sport in developing societies. International Review for Sociology of Sport, 21(4), 287-303. Pringle R. & Pringle D. (2012). Competing Obesity Discourses and Critical Challenges for Health and Physical Educators. Sport, Education & Society, Mar 2012, Vol. 17 Issue 2, p143-161, 19p. Tibor Polgár1, Balázs Fügedi1, Csaba Konczos2, József Bognár3, Júlia Ábrahám3 (2009). Values of Lifestyle Across Sport and P.E. As PredictingQuality Of Life: Comparison Of The Austrian And Hungarian Case Study, International Quarterly of Sport Science. United Nations Development Program (UNDP). (1993). Hunan development report, 1993. New York: Oxford University Press. Waters, DJ. (1996). A comparative study of the role of sport in nation building in developed and developing countries. Unpublished doctoral dissertation, University of Minnesota, USA. Waters, DJ. (1998 Fall). Status of sport development in Singapore. Journal of the International Council for Health, Physical Education, Recreation, Sport and Dance, XXXV,(1),17-23. Waters, DJ. & Kritee, ML. (1998). the status of African sport development: A 14- nation perspective. African Journal for Physical, Health Education, Recreation and Dance, 4 (2), 67-79. Retrieved February, 10,2010, from http://people.csail.mit.edu/hanna/Egypt/index18.html, Retrieved February 2010 Retrieved April 20, 2010, from http://www.lincomrealestate.com/egypt/204/, Retrieved April 2010. Retrieved April 20, 2010, from http://eb.tbicl.org/egypt/, Retrieved April 2010. Retrieved May 2, 2010, from http://hurghadareviews.com/about-hurghada, Retrieved May 2010. Retrieved May 2, 2010, http://www.ismailiafilmfest.com/ismailiafilmfest/index.php/en/ismailia-history, Retrieved May 2010.

2nd Annual International Interdisciplinary Conference, AIIC 2014, 8-12 July, Azores, Portugal Proceedings, Vol.3
53
Retrieved May 2, 2010, from http://www.egypttravelsearch.net/Cities/El-Mahalla_El-Kubra.html, Retrieved May 2010. Retrieved May 27, 2010, from http://www.egypttravelsearch.net/Cities/Zagazig.html, Retrieved May 2010.

2nd Annual International Interdisciplinary Conference, AIIC 2014, 8-12 July, Azores, Portugal Proceedings, Vol.3
54

2nd Annual International Interdisciplinary Conference, AIIC 2014, 8-12 July, Azores, Portugal Proceedings, Vol.3
55

2nd Annual International Interdisciplinary Conference, AIIC 2014, 8-12 July, Azores, Portugal Proceedings, Vol.3
56

2nd Annual International Interdisciplinary Conference, AIIC 2014, 8-12 July, Azores, Portugal Proceedings, Vol.3
57

2nd Annual International Interdisciplinary Conference, AIIC 2014, 8-12 July, Azores, Portugal Proceedings, Vol.3
58
2nd Annual International Interdisciplinary Conference, AIIC 2014, 8-12 July, Azores, Portugal Proceedings, Vol.3
59
HOW INTERPRETING BUSINESS PRINCIPLES THROUGH THE LENS OF “NEW SCIENCE” CAN HELP SOCIAL
ORGANIZATIONS RESPOND TO GLOBAL AND LOCAL THREATS AND OPPORTUNITIES WHILE PROTECTING
THEIR GOALS AND VALUES: A HEALTH CARE EXAMPLE OF SCIENTIFIC HUMANISM, COMPLEXITY, AND
IMPLICATE ORDER
Dr. Paul Becker, P. Eng., MBA, PhD Kwantlen Polytechnic University, Chief Operating Officer (Facilities),
Fraser Health Authority, Vancouver, BC, Canada
Abstract Canadian governments and their publically-funded health authorities are under increasing pressure to provide timely and quality services to a growing and aging population. They are also expected to use business principles and tools to make the health care system more efficient and to reduce costs through innovation and change. Business principles such as strategic planning, process re-engineering and improvement, balanced scorecards for performance measuring and reporting, and systems design and optimization are based on scientific concepts that can be traced back through Taylorism of the early 1900s to the Industrial Revolution to early discoveries in mathematics and physics. As well as employing science-based business practices in order to increase the efficiency of the health care system, health care leaders must also employ social values in order to be patient-centered. These social constructs are based on humanistic versus mechanistic principles. How, then, can the health care system achieve its social goals if the business principles it has come to rely on may actually be contrary to its patient-centered values? Viewing health care leadership and management through the lens of “New Science” can help reconcile these seemingly contrary philosophies. “New Science” takes scientific management concepts beyond Newton, Taylor, and Einstein and employs a systems and ecological view of life in health care organizations. “New Science” goes beyond quantum mechanics and includes uncertainty and unpredictability, complementarity, semantic and chaotic infinite complexity, non-linear adaptive feedback networks, and wholeness and implicate order.
Keywords: “New Science” Business Healthcare Introduction
The purpose of this paper is to use “New Science” as a lens through which to view the business principles required for meeting the innovation and change challenges in Canadian health care and to determine in what ways “New Science” can help make sense of these challenges. These challenges are in response to new realities, to new knowledge, and to increasing demands for improvements from the organization’s internal and external environments. The paper includes literature on organizational theory and its scientific beginnings and literature explaining “New Science” theory, complexity theory, and chaos theory. The review then addresses literature on the organizational elements of “New Science” including complementarity, uncertainty, and wholeness and implicate order.

2nd Annual International Interdisciplinary Conference, AIIC 2014, 8-12 July, Azores, Portugal Proceedings, Vol.3
60
Organizational theory and science Capra (1982) described how science and Sir Isaac Newton’s theory of the universe
and the belief in the rational approach to human problems in the eighteenth century were central to the “Age of Enlightenment” (p. 68). The logically empirical and linear solutions provided by Newton’s science found their way into the scientific management of many different types of organizations, including many business and management practices used daily by Canadian health administrators. Promoters of the science of administration claimed to have found a rational basis for human decision-making and a value-free technology for increasing the effectiveness and efficiency of organizations (Greenfield, 1986). The challenge for Canadian health care organizations and administrators is to determine how to apply science-based business principles as they strive for productivuty improvement through innovation and change while protecting their patient-centered social principles upon which their missions, visions, and values are based.
Science has now progressed well beyond Sir Isaac Newton. The discovery of evolution in biology forced scientists to abandon the “Cartesian” (Capra, 1982, p. 57) conception of the world as a machine. Instead, the universe had to be viewed as an evolving and ever-changing system in which complex structures developed from simpler life forms. Evolutionary concepts also emerged in physics. However, whereas in biology evolution meant a movement toward increasing order and complexity, in physics it came to mean just the opposite – a movement toward increasing disorder; something the laws of thermodynamics addressed with the concept of entropy.
Although physicists debated when they replaced Newton’s concepts of gravity with Einstein’s principles of relativity, physics may now be converging on what the science refers to as a “unified field theory of everything” (Greene, 2003, p. 16). This area of science is called “New Science”. “New Science” includes the concepts of quantum mechanics, complexity theory and chaos theory, uncertainty and probability, order and disorder, indeterminacy and unpredictability, complementarity and relationships, string theory, multi-dimensions, and interconnectedness. Complex, uncertain, and unpredictable and relying on complementary and interconnected relationships describes well the Canadian health care environment.
The science of Copernicus, Descartes, Locke, Bacon, and Newton were applied to management and administrative theories by authors and practitioners such as Taylor, Simon, and Halpin (Greenfield, 1986). Similarly, the philosophies of the “New Science” can be used to help discover how organizations work, how organizations can change, and how organizations can be simplified (Wheatley & Kellner-Rogers, 1996). The metaphors provided by the philosophy of “New Science” can help one understand both resistance to change and the novel new order that can emerge through chaos and unpredictability. Few public sector, or, indeed, private sector organizations are under pressure to change and to use mechanistic business principles to produce efficiencies and cost savings as are health care organizations.
Defense of a New Science
Canadian health care has as its primary purpose the care and health of people and the community. Despite this humanistic mandate, health authority administrators are required to use evidence- and objective-based scientific management and business methodologies and tools on a daily basis. Much has been written against the use of these modernist, positivist, and scientific management concepts in administration (Dolmage, 1992; Greenfield, 1993; Kendell & Byrne, 1977). “New Science”, however, may suggest ways in which new scientific metaphors might address some of the scientism and humanism concerns raised by authors of critical theory and postmodernism, which may help inform the “business” of health care.
2nd Annual International Interdisciplinary Conference, AIIC 2014, 8-12 July, Azores, Portugal Proceedings, Vol.3
61
When describing the evolution of the philosophy of science, and how post-Enlightenment scientism and modernism has created many concerns about the human condition, postmodernists used a definition of science limited to Newtonian-based linear mechanisms. It is this apparent conflict between the mechanistic business principles that drive certain aspects of health care administration and the fundamental humanistic raison dètre of health care that can be reconciled with “New Science”.
“New Science” includes the concepts of quantum theory and beyond. Bohm (1980) argued that quantum theory is the most basic way available in physics for understanding the fundamental and universal laws relating to matter and its movement. It must be given serious consideration in an attempt to develop an overall worldview. In quantum theory, there is no consistent notion at all of what the reality may be that underlies the universal constitution and structure of matter. If we try to use the prevailing worldview based on the notion of particles, we discover that the particles, such as electrons, can also manifest as waves, that they can move discontinuously, that there were no laws at all that apply in detail to the actual movements of individual particles and that only statistical predictions can be made about large aggregates of such particles. If, on the other hand, we apply the worldview in which the universe is regarded as a continuous field, we find that this field must also be discontinuous, as well as particle-like, and that it is undermined in its actual behavior as is required in the particle perspective of relation as a whole (Bohm).
“New science” and complexity theory
Health care organizations are large and complex organizations. Biggiero (2001) distinguished between difficulty and complexity in organizations. Difficult problems are those which require time, hard work, dedication, skills, information, and effort. Complex problems, according to Biggiero, are different. Biggiero’s different types of “observed irreducible complexity” (p. 3) are summarized in the following table:
Classifications of observed irreducible complexity Trans-Computational Infinite Logical
Quantitative (syntaxical) Computational Chaotic Logical
Qualitative (semantic) Intuitive, spiritual knowledge and the meaning of words Relational
Chaotic complexity can be observed, quantified, and ordered; intuitive, spiritual, and semantic complexity can not be, it is subjective and contextual (Biggiero). Health care organizations must strategically, managerially, and administratively deal with all forms of complexity. The science of complexity studies the fundamental properties of non-linear feedback networks and complex adaptive networks (Stacey, 1996b). Complex adaptive systems consist of a number of components, or agents, that interact with each other according to sets of rules that require them to examine, and to respond to, each other’s behavior in order to improve their behavior and the behavior of the system they comprise. Stacey argued that such systems operate in a manner that constitutes learning. Because those learning systems operate environments and consist mainly of other learning systems, it follows that together they form co-evolving supra-systems that create and learn their way into the future (Stacey). Lessons for Complex Change
Complex health care organizations are in a constant state of chaotic change as they strive continually for efficiencies and service improvements through innovation and process re-engineering supported by business concepts such as key performance measurement, return on investment analysis, and business planning. Organizations change when logical

2nd Annual International Interdisciplinary Conference, AIIC 2014, 8-12 July, Azores, Portugal Proceedings, Vol.3
62
instrumental-technology rationality rules slowly make room for subjectivism and hope (Kincheloe & McLaren, 2000). Fullan (1999) stated that organizational change is complex and that theories of change and theories of education need each other. Understanding the meaning of operating on the edge of chaos is critical to understanding change, and emotional intelligence is both anxiety provoking and anxiety containing (Fullan). Complexity Theory and Moral Purpose
There are few organizations that are as complex or that have a higher moral purpose than a health care authority caring for ill patients and the wellness of their communities. Fullan (1999) provided insights into complexity combined with moral purpose that included complexity and the change process; the deep meaning of inside and outside collaboration; the complexities of transferability; and intellectual, political, and spiritual fusion. The new science of complexity claims that the link between cause and effect is difficult to trace. Change, planned and otherwise, unfolds in non-linear ways. Paradoxes and contributions abound and creative solutions arise out of interaction under conditions of uncertainty, diversity, and instability (Fullan).
Health care organizations are expected to adapt to internal and external threats and opportunities in order to improve service and health outcomes and to slow the increase in costs. According to complexity theory, adaptation is most effective in systems that are only partially connected. The argument is that too much structure creates gridlock, while too little structure creates unbounded chaos. Brown and Eisenhardt (1998) argued that “complexity theory began with an interest in how order springs from chaos” (p. 14). Health authorities need to determine how to live on this chaos boundary: unbounded chaos may impact patients negatively while too much structure would be seen as public sector bureaucracy and inefficiency.
“New science” and chaos theory
Health care administrators must understand the chaotic and complex nature of their organizations. Wheatley (1999) described chaos containing order as an essential, nourishing element of systems that fall apart. The layers of complexity and the sense of things being beyond our control and out of control are but signals of our failure to understand a deeper reality of organizational life and of life in general (Wheatley).
Chaos theory has shaken science to its foundations with the realization that very simple dynamic rules can give rise to extraordinarily intricate behavior (Waldrop, 1992). Complex systems can acquire the ability to bring order and chaos into a special kind of balance.
The balance point, often called the edge of chaos (Fullan, 1999; Waldrop, 1992) is where the components of a system never quite lock into place, and yet never quite dissolve into turbulence either. The edge of chaos is where new ideas and innovative genotypes are forever nibbling away at the edges of the status quo and where even the most entrenched old guard will eventually be overthrown (Fullan). The edge of chaos is the constantly shifting battle zone between stagnation and anarchy, the one place where a complex system can be spontaneous, adaptive, and alive.
Sullivan (1999) described chaos theory and the change process that can transform an organization into a new order. Health care organizations need intuitively to feel the simple small changes within them and to apply gentle creative action in the appropriate places to effect change. Chaos theory tells us that the obvious or expected place to attack a problem may not always be the most effective (Sullivan). The art of instigating organizational change becomes not the heavy-handed directive approach. Rather, change in an organization can be
2nd Annual International Interdisciplinary Conference, AIIC 2014, 8-12 July, Azores, Portugal Proceedings, Vol.3
63
implemented by studying the self-renewing and the self-transcending dynamics that are operating on particular aspects of the organization.
Chaos theory and its application to organizational complexity can be an important theory for health care organizational and business leadership and for bounding chaotic disorder and unpredictable change forces in health care organizations. Chaos Theory and Leadership
Many aspects of health care leadership are based on traditional business concepts grounded in cause-and-effect and objective science. “New Science” suggests a new approach to health care leadership. Rost (1991) described how the construct of leadership is illuminated by chaos theory. Leadership is not limited to the leadership behaviors of a key position holder or team of top people. Leadership is conducted throughout the organization, through all its agents. Leadership is broadly conducted precisely because in chaotic systems, all agents have potential access to vital information from the environment. Though leadership is broadly distributed, it is specific in function.
Therefore, organizational leaders should not focus on operational, objective, and day-to-day problems (Burns, 2002). Burns argued that transporting the values underpinning “New Science” philosophical foundations throughout an organization via language and listening ought to be the prime purpose of these leaders. Indeed, the leadership function, as a defined functional box on an organizational chart, should disappear. Ordering disorder and simplifying semiotic, semantic, relational, and chaotic complexity (Biggiero, 2001) can happen throughout the organization. Centralized and top-down management is not required (Burns). This requires a new approach to leadership in health care organizations. “New science” organizational elements
“New Science” has developed from new descriptions and interpretations of quantum mechanics. Quantum principles require us to fundamentally change our relationship to measurement and observation (Wheatley, 1999). If quantum matter develops a relationship with the observer and changes to meet his or her expectations, then how can there be scientific objectivity? If one structures an experiment to study wave properties, matter behaves as a wave. If the experimenter wants to study particles, matter obliges and shows up in particle form. The act of observation causes the potentiality of the wave packet to collapse into one or the other aspect. One potential becomes realized while the other instantly disappears. Before the observer acts, an endless profusion of possibilities continues to be available. Once the observer chooses what to perceive, the effect of perception is immediate and dramatic. All the wave functions representing the observed system collapses, except the one part, which actualizes into reality (Zukav, 1979).
The quantum theories of waves and particles and of the perceptions and impact of the observer or the participant are explained in a few fundamental “New Science” concepts. These concepts are complementarity and uncertainty, organizational fields and forces, and wholeness and implicate order. Complementarity and Uncertainty
“New Science” includes the important quantum principles of complementarity and uncertainty. Matter can appear as particles (specific points in space) or it can show up in waves (energy dispersed over a finite area) (Bohm, 1980; Heisenberg, 1999; Wheatley, 1999). Matter’s total identity includes the potential for both forms – particles and waves. This is Bohr’s “Principle of Complementarity” (p. 36). Wheatley described “Heisenberg’s Uncertainty Principle” (p. 37) where one can measure the particle aspect or the wave aspect of matter – either location or movement. One can never measure both at the same time. Thus,

2nd Annual International Interdisciplinary Conference, AIIC 2014, 8-12 July, Azores, Portugal Proceedings, Vol.3
64
while one can measure wave properties, or particle properties, the exact properties of the duality itself must always elude any measurement one may hope to make.
Wheatley (1999) argued that a quantum perspective provides one powerful explanation of Newtonian empirical and linear beliefs. If there is no objective reality out there, then the environment and our future remain uncreated until we engage with the present. We must interact with the world in order to see what we might create. Through engagement in the moment, we evoke our futures. To live in a quantum world, to weave here and there with ease and grace, we need to change what we do (Wheatley). Change and innovation designed to produce efficiencies and improved health outcomes define current Canadian health care.
Wholeness and Implicate Order
Unbroken wholeness in organizations is “implicate or enfolded order” (Bohm, 1980, p. 188). Bohm used the term “implicate” (p. 188) to describe the intimate and entangled connections between people in organizations. Intimate and entangled relationships describe well the health care environment. In the enfolded order, space and time are no longer the dominant factors determining the relationships of independence or dependence of different elements. Rather an entirely different sort of basic connection of elements is possible from which our ordinary notions of space and time, along with those of separately distinct material particles, are extracted as forms derived from the deeper order. These ordinary notions in fact appear in what is called the explicit or unfolded order, which is a special and distinguishable form contained within the general totality of all the implicate orders (Bohm). Implicate order describes how randomness and instability in organizations can become ordered through the intimate, entangled, and enfolded relationships and connections between the people within it.
What is needed in organizations is an act of understanding in which we see the totality as an actual process that, when carried out properly, tends to bring about a harmonious and orderly overall action in which analysis of parts has no meaning (Bohm, 1980). In quantum physics, a homologous process is described as relational holism where the whole systems were created by their relationships among subatomic particles. Bohm argued that in this process, the parts do not remain as parts, they are drawn together by a process of internal connectedness. It is not difficult to recognize ourselves as electrons in organizations, moving, merging with others, forming new wholes, being forever changed in the process (Bohm). Quantum Change Forces
Canadian health care authorities are under pressure to innovate and change in order to reduce costs while reducing service times and improving health outcomes. Change management is a prime focus for all leaders in health care organizations. Wheatley (1999) stated that we think we were being helpful to others when we manage change so carefully because we believe that people do not like change. We have not thought that we might work with the forces of change and keep it under control every cautious step of the way (Wheatley). It is a particular characteristic of the human species to resist change, even though we were surrounded by tens of millions of other species that demonstrate wonderful capacities to grow, to adapt, and to change.
“New Science” is filled with tantalizing and hopeful processes that foster change (Wheatley, 1999). New science and quantum theory suggest that we must learn to look past an object or thing into the invisible level of dynamic processes. Wheatley suggested that we should lay aside the machine metaphor with its static mechanisms and separated parts. Yet health care organizations are expected to use machine-like business principles to analyze and improve their operations on a continual basis.
2nd Annual International Interdisciplinary Conference, AIIC 2014, 8-12 July, Azores, Portugal Proceedings, Vol.3
65
A system must develop greater self-knowledge in three critical areas (Wheatley, 1999). People need to be connected to the fundamental identity of their organization or community. Who were we? Who do we aspire to become? How should we be together? People need to be connected to new information. What else do we need to know? Where is this new information to be found? And people need to be able to reach past traditional boundaries and develop relationships with people anywhere in this system. Who else needs to be here to do this work with us? This is critical in a health care environment.
Conclusion
Newtonian science has been used to develop logically empirical, mechanistic, and scientifically-focused organizational and business management theories where one can attempt to reduce health care organizations to numbers, objective parts, and measurement and to construct them in a positivistic manner. Critical theory and postmodern organizational paradigms, which support a patient-centered health care model, do not agree with these views of organizations.
If business schools and management theories, including the ones utilized by Canadian health care authorities, base their purpose and teachings on the basis of scientific fact then they must now reshape these theories and practices based on the principles of “New Science”. “New Science” uses uncertainty, complementarity, interconnectedness, relationships, wholeness, and implicate order to help address the qualitative, subjective, and humanistic nature of innovation and change needed in Canadian health care organizations. References: Biggiero, L. (2001). Sources of complexity in human systems. Nonlinear Dynamics, Psychology, and Life Sciences, 5(1), 3-19. Bohm, D. (1980). Wholeness and the implicate order. London: Routledge. Brown, S., & Eisenhardt, K. (1998). Competing on the edge. Boston: Harvard Business School Press. Burns, J. S. (2002). Chaos theory and leadership studies: Exploring uncharted seas. Journal of leadership & organizational studies, 9(2), 42-57. Capra, F. (1982). The turning point: Science, society, and the rising culture. New York: Bantam. Dolmage, R. (1992). The quest for understanding in Educational Administration: A Habermasian perspective on the 'Griffiths-Greenfield Debate". The Journal of Educational Thought, 26(2), 89-113. Fullan, M. (1999). Change forces: The sequel. Philadelphia, PA: George H. Buchanan. Greene, B. (2003). The elegant universe. New York: Random House. Greenfield, T. (1993). Greenfield on educational administration: towards a humane science / Thomas Greenfield and Peter Ribbins. New York: Routledge. Greenfield, T. (1986). The decline and fall of science in educational administration. Interchange, 17(2), 57-80. Heisenberg, W. (1999). Physics and philosophy: The revolution in modern science. Amherst, NY: Prometheus. Kendell, R., & Byrne, D. (1977). Thinking about the Greenfield-Griffiths debate. UCEA Review, 19(1), 6-16. Kincheloe, J., & McLaren, P. (2000). Rethinking critical theory and qualitative research. In N. Denzin & Y. Lincoln (Eds.), Handbook of qualitative research (2 ed., pp. 279-313). London: Sage. Rost, J. (1991). Leadership for the twenty-first century. New York: Praeger.

2nd Annual International Interdisciplinary Conference, AIIC 2014, 8-12 July, Azores, Portugal Proceedings, Vol.3
66
Stacey, R. (1996b). Complexity and creativity in organisations. San Francisco: Berrett-Koehler. Sullivan, T. (1999). Leading people in a chaotic world. Journal of Educational Administration, 37(5), 408-423. Waldrop, M. (1992). Complexity: The emerging science at the edge of order and chaos. New York: Simon and Schuster. Wheatley, M. (1999). Leadership and the new science: Discovering order in a chaotic world (2 ed.). San Francisco: Berret-Koehler. Wheatley, M., & Kellner-Rogers, M. (1996). A simpler way. San Francisco: Berret-Koehler. Zukav, G. (1979). The dancing Wu Li masters. New York: William Morrow and Company Inc.
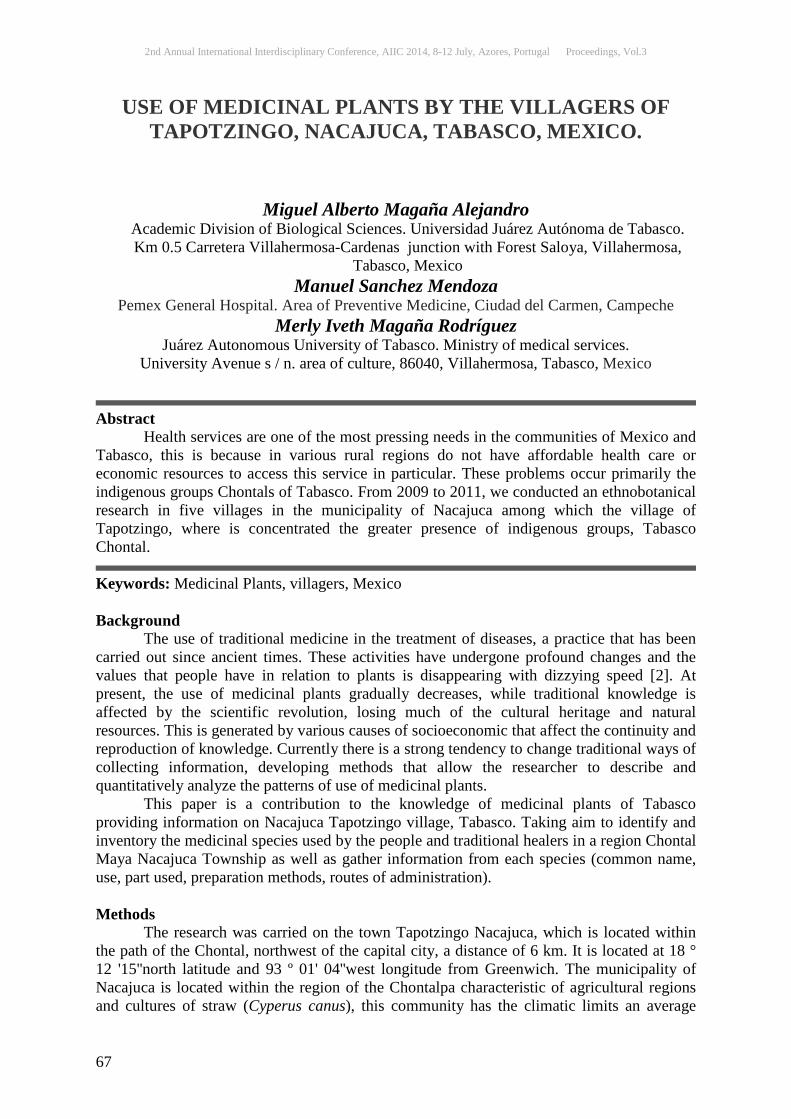
2nd Annual International Interdisciplinary Conference, AIIC 2014, 8-12 July, Azores, Portugal Proceedings, Vol.3
67
USE OF MEDICINAL PLANTS BY THE VILLAGERS OF TAPOTZINGO, NACAJUCA, TABASCO, MEXICO.
Miguel Alberto Magaña Alejandro Academic Division of Biological Sciences. Universidad Juárez Autónoma de Tabasco. Km 0.5 Carretera Villahermosa-Cardenas junction with Forest Saloya, Villahermosa,
Tabasco, Mexico Manuel Sanchez Mendoza
Pemex General Hospital. Area of Preventive Medicine, Ciudad del Carmen, Campeche Merly Iveth Magaña Rodríguez
Juárez Autonomous University of Tabasco. Ministry of medical services. University Avenue s / n. area of culture, 86040, Villahermosa, Tabasco, Mexico
Abstract Health services are one of the most pressing needs in the communities of Mexico and Tabasco, this is because in various rural regions do not have affordable health care or economic resources to access this service in particular. These problems occur primarily the indigenous groups Chontals of Tabasco. From 2009 to 2011, we conducted an ethnobotanical research in five villages in the municipality of Nacajuca among which the village of Tapotzingo, where is concentrated the greater presence of indigenous groups, Tabasco Chontal.
Keywords: Medicinal Plants, villagers, Mexico Background The use of traditional medicine in the treatment of diseases, a practice that has been carried out since ancient times. These activities have undergone profound changes and the values that people have in relation to plants is disappearing with dizzying speed [2]. At present, the use of medicinal plants gradually decreases, while traditional knowledge is affected by the scientific revolution, losing much of the cultural heritage and natural resources. This is generated by various causes of socioeconomic that affect the continuity and reproduction of knowledge. Currently there is a strong tendency to change traditional ways of collecting information, developing methods that allow the researcher to describe and quantitatively analyze the patterns of use of medicinal plants. This paper is a contribution to the knowledge of medicinal plants of Tabasco providing information on Nacajuca Tapotzingo village, Tabasco. Taking aim to identify and inventory the medicinal species used by the people and traditional healers in a region Chontal Maya Nacajuca Township as well as gather information from each species (common name, use, part used, preparation methods, routes of administration). Methods The research was carried on the town Tapotzingo Nacajuca, which is located within the path of the Chontal, northwest of the capital city, a distance of 6 km. It is located at 18 ° 12 '15''north latitude and 93 º 01' 04''west longitude from Greenwich. The municipality of Nacajuca is located within the region of the Chontalpa characteristic of agricultural regions and cultures of straw (Cyperus canus), this community has the climatic limits an average

2nd Annual International Interdisciplinary Conference, AIIC 2014, 8-12 July, Azores, Portugal Proceedings, Vol.3
68
temperature of about between 30 and 64 ° C, an average annual rainfall of 1800 to 2000 mm per year and recorded an altitude 10 m. msn [7]. In Tapotzingo there is a wide variety of fruit trees, high quality timber and medicinal plants which are a huge potential in the region.
Figure 1. Location of the study area A) Sample selection To carry out this research related to knowledge and traditional use of medicinal plants by the Chontal Maya, it was necessary to analyze the state of Tabasco municipalities had the largest presence of ethnic groups who spoke the Chontal language, using as criteria are the people who may have more knowledge about medicinal plants. Then he began to select informants with whom we worked through the snowball technique [6], which consists of selecting an initial sample of individuals or basic in every interview and establish what new people in the study population must meet in order to integrate the full sample. The methodology applied is a model of Ethnobotany method, which consists of the population get more information from its active participation in data collection stage. B) Fieldwork The first step was the initial introduction to the community to establish contact with the informants of the population and give reasons for our presence at the scene explaining the purpose and duration of work. Were selected and interviewed persons recommended only for their knowledge in the use of medicinal plants for maximum quality and reliability of knowledge. The first talks with informants was developed according to the proposed by Gimenez [5], where the interest was approaching the sense that they have observed actions in an attempt to approach the interpretations do people every day. Interviews were conducted open type, closed or directed interview using a questionnaire as a guide where biological data are presented both as an ethnobotanical.

2nd Annual International Interdisciplinary Conference, AIIC 2014, 8-12 July, Azores, Portugal Proceedings, Vol.3
69
The collection of plant material was performed with the company of at least one of the informants to identify the medicinal plants he knew, all the information referred to each was recorded and completed the interviews. Results and discussion This study found that both men and women differ in their knowledge about the use of plants, since in talks conducted with the interviewees mentioned that people Tapotzingo most frequently used medicinal plants their diseases are women. However, men provided more information in relation to medicinal plants, suggesting a knowledge linked to their daily activities, something that agrees with [1] and [4]. The lack of medical care at night in Tapotzingo, high costs thereof, the side effects of chemical drugs and natural tendency to make the community come to medicinal plants and continue to believe in folk medicine. According [8], as they grow older fans of the popular alternative treatments, revealing limited access to health services for people who do this to be affordable for your pocket, or the massive response those who distrust conventional medicine. We identified a total of 106 plant species, grouped into 50 families, the most important according to the number of genera and species: Asteraceae, Euphorbiaceae, Fabaceae, Lamiaceae and Rutaceae among others. The best represented genera are Citrus (3 spp.) Cassia (2 spp.) Cucurbita (2 spp.) Kalanchoe (2 spp.) Lippia (2 spp.) Tagetes (2 spp.) Tradescantia(2spp.). Interestingly, the best represented families are also consistent with the most important of the so-called ‘‘Weeds’’ (10) which indicates that many of the species found thrive in disturbed areas. This is logical if we consider that the habitat in which they were collected has precisely these characteristics. 35% belong to this group, 49% are domesticated or encouraged, and the rest 16% is species that are purchased in the market because they are not in the area. Esto coincide con lo que menciona [3] en su informe sobre la biodiversidad. Recorded flora of the Asteraceae family was predominant it is not surprising as this is the largest family of vascular plants in the number of genera and species are concerned [9] and are the predominant element of a large number of secondary communities also known secondary metabolites present in a large number of species in this family. a) Classification of species according to their medicinal use Information was obtained on the medicinal uses of species, the same that are used in 93 conditions, among which are cough, diabetes, ofiadura, heating, headache, diarrhea, headache, stomach pain, nervousness, rheumatism and bad air as the most common in the village. Graph 1 displays the number of species for each disease category being among most common species cough, Plecthranthus amboinicus, Cassia occidentalis and Epaltes mexicana among others. For heating head Hybanthus attenuatus, Hampea macrocarpa and Ocimum basilicum. For diarrhea Annona muricata, Psidium guajaba Guazuma ulmifolia and Diabetes Cecropia obtusifolia, Tabebuia rosea and Citrus sinensis.
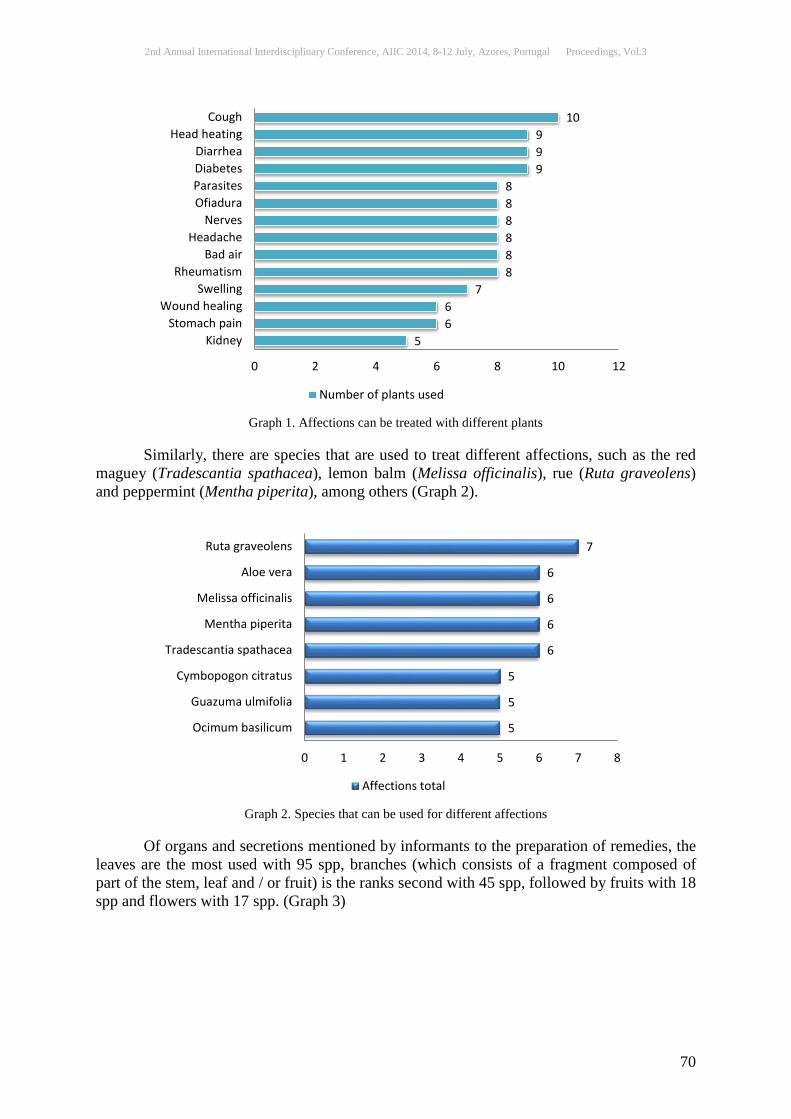
2nd Annual International Interdisciplinary Conference, AIIC 2014, 8-12 July, Azores, Portugal Proceedings, Vol.3
70
Graph 1. Affections can be treated with different plants
Similarly, there are species that are used to treat different affections, such as the red maguey (Tradescantia spathacea), lemon balm (Melissa officinalis), rue (Ruta graveolens) and peppermint (Mentha piperita), among others (Graph 2).
Graph 2. Species that can be used for different affections
Of organs and secretions mentioned by informants to the preparation of remedies, the leaves are the most used with 95 spp, branches (which consists of a fragment composed of part of the stem, leaf and / or fruit) is the ranks second with 45 spp, followed by fruits with 18 spp and flowers with 17 spp. (Graph 3)
5 6 6
7 8 8 8 8 8 8
9 9 9
10
0 2 4 6 8 10 12
KidneyStomach pain
Wound healingSwelling
RheumatismBad air
HeadacheNerves
OfiaduraParasitesDiabetesDiarrhea
Head heatingCough
Number of plants used
5
5
5
6
6
6
6
7
0 1 2 3 4 5 6 7 8
Ocimum basilicum
Guazuma ulmifolia
Cymbopogon citratus
Tradescantia spathacea
Mentha piperita
Melissa officinalis
Aloe vera
Ruta graveolens
Affections total
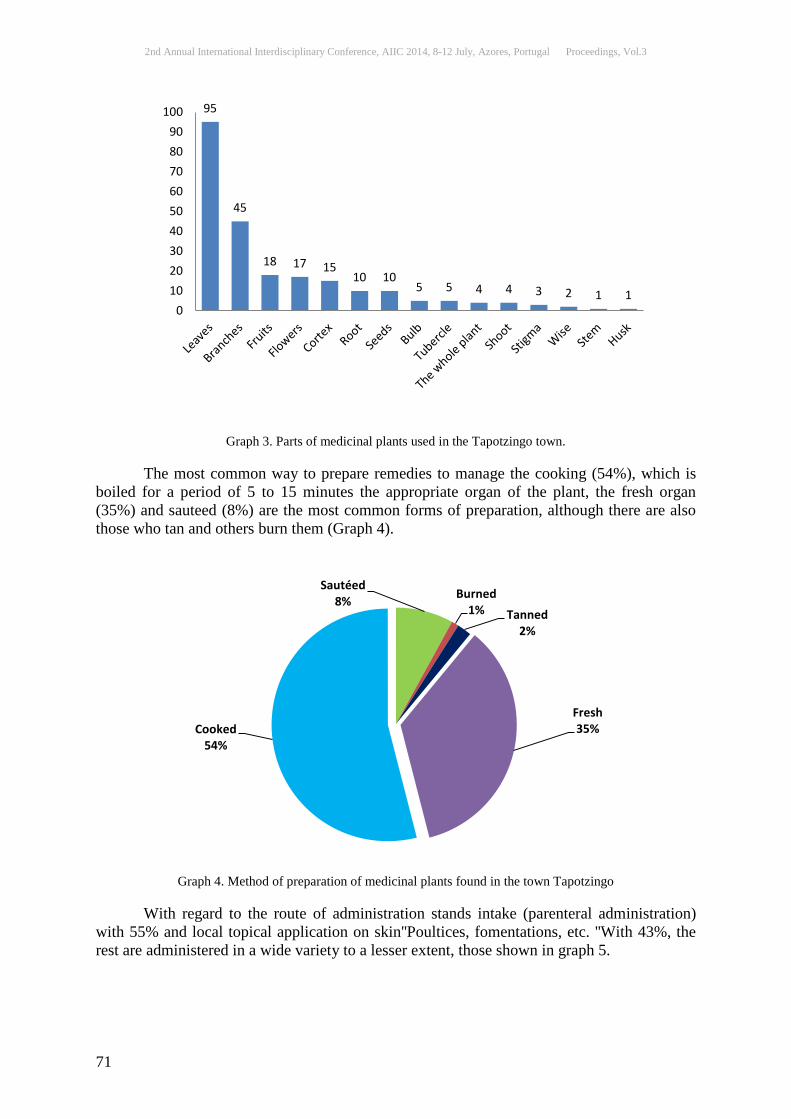
2nd Annual International Interdisciplinary Conference, AIIC 2014, 8-12 July, Azores, Portugal Proceedings, Vol.3
71
Graph 3. Parts of medicinal plants used in the Tapotzingo town. The most common way to prepare remedies to manage the cooking (54%), which is boiled for a period of 5 to 15 minutes the appropriate organ of the plant, the fresh organ (35%) and sauteed (8%) are the most common forms of preparation, although there are also those who tan and others burn them (Graph 4).
Graph 4. Method of preparation of medicinal plants found in the town Tapotzingo
With regard to the route of administration stands intake (parenteral administration) with 55% and local topical application on skin''Poultices, fomentations, etc. ''With 43%, the rest are administered in a wide variety to a lesser extent, those shown in graph 5.
95
45
18 17 15 10 10
5 5 4 4 3 2 1 1 0
102030405060708090
100
Sautéed 8% Burned
1% Tanned 2%
Fresh 35% Cooked
54%
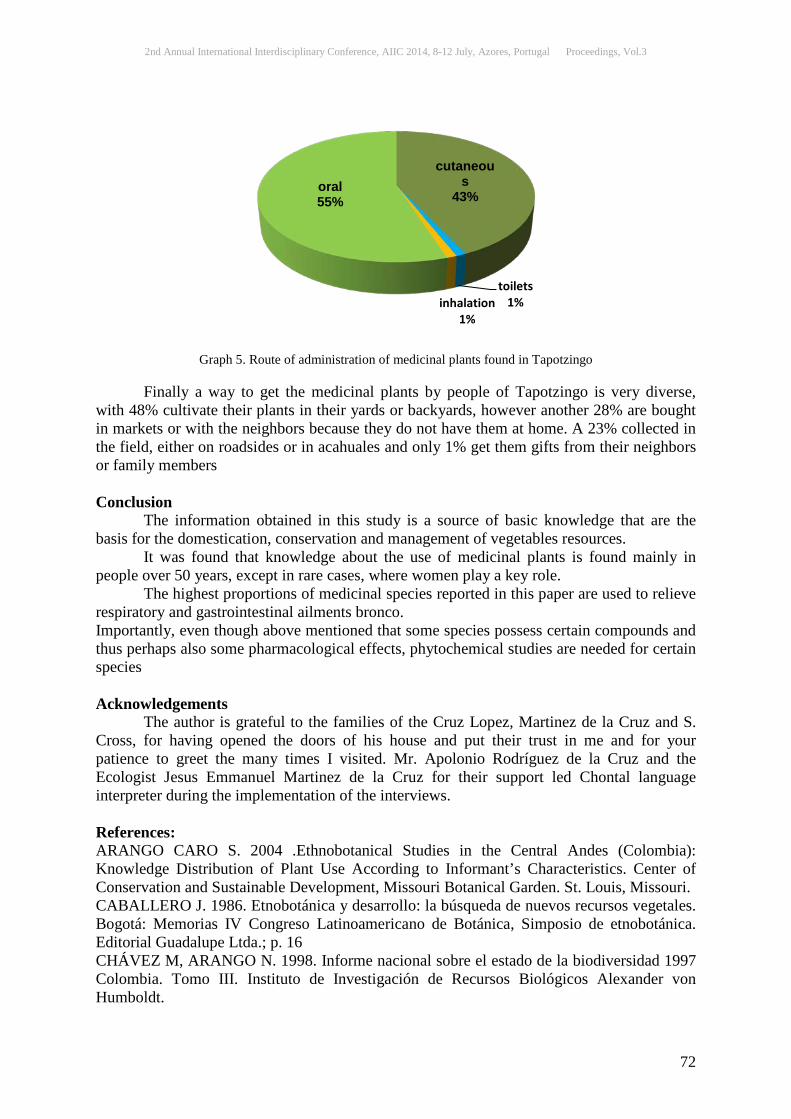
2nd Annual International Interdisciplinary Conference, AIIC 2014, 8-12 July, Azores, Portugal Proceedings, Vol.3
72
Graph 5. Route of administration of medicinal plants found in Tapotzingo Finally a way to get the medicinal plants by people of Tapotzingo is very diverse, with 48% cultivate their plants in their yards or backyards, however another 28% are bought in markets or with the neighbors because they do not have them at home. A 23% collected in the field, either on roadsides or in acahuales and only 1% get them gifts from their neighbors or family members Conclusion The information obtained in this study is a source of basic knowledge that are the basis for the domestication, conservation and management of vegetables resources. It was found that knowledge about the use of medicinal plants is found mainly in people over 50 years, except in rare cases, where women play a key role. The highest proportions of medicinal species reported in this paper are used to relieve respiratory and gastrointestinal ailments bronco. Importantly, even though above mentioned that some species possess certain compounds and thus perhaps also some pharmacological effects, phytochemical studies are needed for certain species Acknowledgements The author is grateful to the families of the Cruz Lopez, Martinez de la Cruz and S. Cross, for having opened the doors of his house and put their trust in me and for your patience to greet the many times I visited. Mr. Apolonio Rodríguez de la Cruz and the Ecologist Jesus Emmanuel Martinez de la Cruz for their support led Chontal language interpreter during the implementation of the interviews. References: ARANGO CARO S. 2004 .Ethnobotanical Studies in the Central Andes (Colombia): Knowledge Distribution of Plant Use According to Informant’s Characteristics. Center of Conservation and Sustainable Development, Missouri Botanical Garden. St. Louis, Missouri. CABALLERO J. 1986. Etnobotánica y desarrollo: la búsqueda de nuevos recursos vegetales. Bogotá: Memorias IV Congreso Latinoamericano de Botánica, Simposio de etnobotánica. Editorial Guadalupe Ltda.; p. 16 CHÁVEZ M, ARANGO N. 1998. Informe nacional sobre el estado de la biodiversidad 1997 Colombia. Tomo III. Instituto de Investigación de Recursos Biológicos Alexander von Humboldt.
cutaneous
43%
toilets 1% inhalation
1%
oral 55%

2nd Annual International Interdisciplinary Conference, AIIC 2014, 8-12 July, Azores, Portugal Proceedings, Vol.3
73
COTTON C. 1996. Ethnobotany. Principles and Applications, 2a de. Baffins Lane, Chichester, West Sussex; John Wiley & Sons. GIMÉNEZ, G. 1994. La teoría y el análisis de la cultura. Problemas teóricos y metodológicos. En: González, J. y J. Galindo Cáceres (Coords.) Metodología y cultura. Comisión Nacional para la Cultura y las Artes. México. Pp.36-66. GOODMAN, L.A. 1961. Muestreo en bola de nieve. Annals of mathematical Statistics, Vol. 32. Universidad de Chicago. INEGI. 2005. XII Censo General de Población y Vivienda. Rojas, P.N.P. 2008. Uso y Manejo de las plantas medicinales por los curanderos en el poblado de Tapijulapa, Municipio de Tacotalpa, Tabasco. Tesina UJ.AT División Académica de Ciencias Biológicas, Villahermosa, Tabasco. 89 p. RZEDOWSKI, J., 1993. ‘‘El papel de la familia Asteraceae en la flora sinantrópica de México’’. Fragm. Flor. Geobot. Suppl., 2(1): 123-138. 10.- VILLEGAS Y DE G., M., 1969. Estudio florístico y ecológico de las plantas arvenses de la parte meridional de cuenca de México. Tesis de licenciatura. Escuela Nacional de Ciencias Biológicas. IPN. 97 pp.

2nd Annual International Interdisciplinary Conference, AIIC 2014, 8-12 July, Azores, Portugal Proceedings, Vol.3
74
INSECURITY AND RIGHT TO HEALTH OF NIGERIANS: CHALLENGES AND SOLUTIONS
Prof. N.G. Egbue Nwankwo, Ignatius Uuche, PhD
Department Of Sociology Anthropology, Nnamdi Azikiwe University, Awka
Abstract The worsening state of insecurity of lives and property in Nigeria is a major source of concern to both Nigerians and the international community. The effects of insecurity on socio-economic activities, psyche and overall functioning of Nigerians are tremendous. This review paper critically examines how insecurity affects right to health of Nigerians. Right to health is defined in terms of ease of access to acceptable and affordable health service, at fully equipped, well staffed, and functional public health institutions sited close to the doorsteps of individuals. Anchored on functionalism and structural strain theories, the paper argues that insecurity negatively undermines pursuit of right to health of Nigerians. It recommended the use of dialogue to check rising threats to lives and property across Nigeria. Strengthening of economic empowerment and social re-orientation programmes by the government was also canvassed to calm aggrieved unemployed youths. The paper concluded that it is only in an atmosphere of peace and security that right to health of Nigerians will be fully realized.
Keywords: Right to Health, Insecurity, Reform, Policy Introduction
The need to safeguard right to health of individuals has over the years been a subject of interest to scholars and international organizations. This concern becomes more crucial as societies across the globe experience reforms in various facets of their life through organized strategies and new approaches deliberately instituted to fast-track socio-political and economic development. Furthermore, the new dimension to challenges of nationhood in Nigeria, characterized by serious threats to lives and properties occasioned by intra and inter communal clashes, activities of Boko Haram Sect and various forms of militancy raises questions as to what becomes of rights to health of Nigerians under the tense atmosphere.
More than half a century ago, United Nations Universal Declaration of Human Rights (1948) concluded that everyone has right to a standard of living that is adequate for health and well being of himself and his family. This position was reinforced by Article 12 of the International Covenant on Economic, Social and Cultural Rights in 1976. The Covenant considered by Minelli (2005) as the most important mention of ‘right to health’ in the annals of history drew attention to the right of everyone to enjoy the highest standard of physical and mental health. On her part, the World Health Organization (WHO, 1978) stressed that ‘health’ is a fundamental human right. She emphasized that the attainment of the highest level of health is an important social goal whose realization require co-operation between inter-related sectors of society. In the light of this, the organization consistently pursues her objectives and the protection of right to health of individuals around the world through ‘health for all’ strategy. This strategy is anchored on primary health care (PHC) approach. Mahler (1978) notes that

2nd Annual International Interdisciplinary Conference, AIIC 2014, 8-12 July, Azores, Portugal Proceedings, Vol.3
75
primary health care aims at bringing health to the reach of everyone irrespective of urban or rural residence, and in total disregard to socio-economic differentials. In addition to international conventions and the policy thrust of World Health Organization as highlighted, many social groups have ranked health very high in their hierarchy of social values and norms. Such optimal value of health has been a significant cultural universal across societies, Nigeria inclusive. There is however differences in the level of commitment of each society or nation towards implementing health policies and safeguarding right to health of her members.
Often times, as a nation-state simultaneously pursue reforms and encounter challenges of nation building (like current security threats in Nigeria), health services may lose their appeal because they may no longer reflect aspirations and set goals. In such instances, high premium on good health which is a dominant feature of the value system is contradicted by poor sanitation, increase in injuries, disease and hunger which exist in reality.
Problems of poor implementation of health policies and reforms experienced in parts of Nigeria are thus compounded by heightened level of insecurity. Also worrisome is the character of political leadership at this period of insecurity. Effective political leadership is a central issue in positive transformation and protection of rights to health of members of society regardless of physical terrain and socio-cultural climate. In the case of Nigeria where leadership obligations are largely unfulfilled, whereas low level of access to health rights have remained regular features of the social system even at peace times; tremendous anxiety is thus generated that right to health of citizens could be completely eroded in the light of deepening severe security challenges. This will worsen the not too impressive national health indices. This review paper therefore examines the concept of ‘right to health’ in the context of contemporary Nigerian society against the backdrop of security difficulties. Our core objective is to reflect on how right to health is affected as the nation encounters serious security challenges particularly from the Boko Haram sect. The paper particularly accounts for problems of safeguarding right to health in the current circumstances and suggests measures that will brighten the prospects of unhindered access to quality health to Nigerians despite the security situation.. The Concept of ‘Right to Health’ Clarified
Right to health is not considered as right to remain ever healthy and never ill. No individual, government or organization has power to guarantee such. It is also not right to uninterrupted provision of health services. Rather, right to health means that health should be considered as a human right. In this context, institutional and other bottlenecks ought to be dismantled to ensure that individuals’ access health with ease. Right to health requires both individual and government commitments for its actualization. It embodies freedoms and entitlements that are aimed protecting health of individuals. Right to health and right to health services are inter-related, complimentary and interchangeable concepts for the purpose of this paper. This position is to ensure that most considerations of human rights bothering on health are included. Such components of rights to health are listed below: • Right of individuals in a state to be healthy through personal and collective efforts
with support from state and other agencies • Right to control ones health and body (including sexual and reproductive freedom) • Right to availability of health services that meet the level of technology and cultural
background of the people. • Right of access to well distributed medical care • Right to be free from torture and non consensual medical treatment.

2nd Annual International Interdisciplinary Conference, AIIC 2014, 8-12 July, Azores, Portugal Proceedings, Vol.3
76
• Right to a system of health protection which guarantee equitable distribution of opportunities to all members of a state irrespective of class, education, religion etc
• Right to benefit from the role of the state in maintenance or restoration of efficient health services.
• Right to other human rights and entitlements necessary for attainment of state of complete well being of individuals
• Right to safe and potable water, adequate sanitation; adequate supply of safe food and housing,
• Right to hazard-free occupational and environmental conditions • Right to access education and information relevant to health From the above list, it could be deduced that right to health is an inclusive right extending to prompt and appropriate health care and health related services (see Oranye 2001, Minelli, 2005). It is perhaps on the strength of inclusive nature of health rights that Miles (1991) summed up the subject as bothering on total condition of people’s well being. Indeed, the idea of right to health is consistent with the objectives of Millennium Development Goals and other international and national conventions on health. The Interface between Social/Health Values and Right to Health Health values constitute a core subset of the general social values and norms of a social group. Health values are ideas, beliefs or feelings shared by members of a society about what is good, right and desirable about their health. Health values can also be viewed in terms of collective conceptions of a group about what is bad, undesirable and improper towards their health. Igbo (2003:89) defines values (health values inclusive) as conception widely held by people in society about what is important to the well-being, survival and identity of the group. He notes that values influence social behaviour through their incorporation into the content of norms. Aarva (2007) observes that health values are reflections of the dominant health ideology and the prevailing health thinking of society. For Schaefer and Lamm (1997:42), values on health, love and democracy rather than being specific are more general in many societies. They argued that although values of a culture may change overtime, socially shared and intensely felt values (whether on health or other subjects) remain fundamental part of social life. The concepts of health values as used in this text emphasize values that are pro-health in nature. Few examples of health values in Nigeria include: • Health is valued as wealth • Health is conceived as first among other equally important considerations in life • Instrumental value of health as means to reach other desired things (health certificate
for job placement, strong healthy persons used for advertising / marketing of cosmetics, clothes, drugs, etc)
• Progress (expressed in the hope of better health of the people and improved health facilities)
• Emphasis on goodness (equality, effectiveness of health system) • Equality of all human beings (expressed in the need for equitable distribution of
opportunities or access to health services). The above listed examples of health values in Nigeria buttress the extent to which Nigerians cherish health. They also underscore the need to protect their rights to health given high premium placed on sound state of health by the value system. The link or interface between health values and right to health is that they are mutually inclusive and complimentary.

2nd Annual International Interdisciplinary Conference, AIIC 2014, 8-12 July, Azores, Portugal Proceedings, Vol.3
77
Didactic Relationship between Health Policy and Right to Health Health policy is a body of resolutions on several health issues, social welfare and sundry benefits reached by government working in concert with the people and other agencies. The policy document of a nation sets priorities, strategies and objectives of component schemes within the health system in order to achieve satisfactory service delivery. The ideal relationship between health policies and right to health is that health policies should mirror the rights and expectations of the people. Rights to health form powerful imperatives which health policies seek to meet. In other words, health policies and health reform agenda should focus on entities that give considerable concern to protection of rights to health of the populace. Therefore, health policy planning and implementation are grossly related to issues that bother on right to health and both influence each other in a didactic format. There are however instances where health policies and commitment to protection of rights to health are discordant and dissenting in nature. One of such situations is where individuals or organizations abuse rights to health and such disposition is negatively affecting the well being of the group, thus creating the need for a counter policy (often unpalatable and inclusive limiting access to services ) that is intended to positively address the problem. Another situation is where health reformers and policy makers misunderstand prevailing demands for right to health and in their confusion put in place health policies that contradict (rather than protect) people’s right to health. There is also a third scenario where policy formulation and implementation are deliberately skewed away from safeguarding right to health. In such situations the policy may serve the interest of few individuals and does not accord desired priority to health and well being of the masses. Such scenario is exemplified by situations where politicians and technocrats derail health policies through fraudulent practices as often experienced in parts of Nigeria.
Given benefits of mutually complimentary relationship between health policies and rights to health, the need to safeguard such rights even in the face of daunting security challenges cannot be over-emphasized. This task should form part of the preoccupation of new policies and health reform documents. Theoretical Thrust The first theoretical perspective for this discourse is the functionalist framework. The origin of functionalist theory could be traced to the works of evolutionary scholars such as Auguste Comte and Herbert Spencer who developed it, while Talcot Parson refined it. Two basic assumptions underlie functionalism. One is the idea that social life resembles biological life. The second is the notion that the social structure is a system which maintains its existence through functional unity and interdependence. Society is conceived by functionalists as a system of inter-dependent parts which ought to work co-operatively for the attainment of overall functions of the entire system. Problem in one aspect of society ultimately affect effective functioning of the whole. In Nigeria, the quality of political leadership over the years, leave little to be desired. Hence, as Igun (2006) observed, Nigeria is so rich, yet so poor. Leadership in Nigeria has failed to harvest her abundant human and material resources to advantage. This failure of political authority has affected other socio-economic arrangements. The health system being part of the Nigeria nation is therefore not left out. The current security challenges in the country is not unconnected to failure of leadership to provide education, employment, and equitable distribution of national resources. Militancy, terrorist tendencies, communal clashes and other forms security threats are manifestations of inadequacies in social services and economic empowerment in Nigeria. They are revelations of the magnitude of structural strain to which Nigerians are exposed. The realty of numerous strains that characterize the

2nd Annual International Interdisciplinary Conference, AIIC 2014, 8-12 July, Azores, Portugal Proceedings, Vol.3
78
social structure informs the adoption of the structural strain theory to complement functionalism as the theoretical thrust of this paper. To further compound the problems, the political will to move health programmes forward are either totally lacking or lukewarm in character. Consequently, Nigeria’s health sector continues to experience limited progress which contributes to why right to health is threatened particularly at periods of insecurity. Effects of Insecurity on Right to Health in Nigeria The state of right to health in Nigeria has remained pitiable over the years. The situation is further compounded by current security challenges in the following ways: (a) Security challenges diverts attention of government at all levels away from health matters (b) It increases demand for health services due to increased number of casualties arising from insecurity and violence related occurrences including flood disasters (c) Damages to health infrastructure through bombs and other explosives (d) Fear and feeling of insecurity on the part of health workers which affect their concentration and attitude to work. (e) Destruction or loss of vital heath records due to conflicts/violence (f) Flight of health personnel away from insecure areas resulting in unavailability of services and shortage of skilled manpower in trouble prone areas (g) Dangers of disease epidemics and other health problems are higher during violence than under peace situations, In addition to observations above, Lucas (2000) cried out that Nigeria’s health sector is crisis infested. Adinma (2003) notes that the country parade one of the worst health indices in the world. Worse still, less than three years to 2015 deadline for attainment of Millennium Development Goals (MDGs), Nigeria’s former minister for health, Dr. Adenike Grange laments that national health indicators are still poor and unacceptable (Nzeshi, 2007). Some of these health and social indicators are shown below
(a) Table 1: Nigeria Health Indicators
Source: World Development Indicators (cited in Obiajulu, 2007) (b) Highlights of Global Monitoring Report (2005) on Nigeria;
• Environmental sustainability is elusive in Nigeria because of increasing poverty and culture of poverty.
• About 70 percent of Nigerians live on an income of less than one United States dollar a day
(c) Other Health Indicators published by National Planning Commission (2004); • Only 10% of Nigerians had access to essential drugs • There are fewer than 30 physicians per 100,000 people • Only half of the total population had access to safe drinking water • Maternal mortality is about 704 per 100,000 live births • Among children under five, almost 30 percent were underweight • Only 17 percent of children were fully immunized (down from 30 percent in 1990)
and almost 40 percent had never been immunized. • More than 70 percent of Nigerians lived in poverty.
Brain drain compounds Nigeria’s ugly situation. Adebowale (2007) informs us that about 21,000 Nigerian doctors work in USA alone. Against the above background, Grange
Indicators Year 2005 Population total (in millions) 141.4
Life expectancy at birth, total (years) 46.6 Infant mortality (per 1000 live births) 100.0
Prevalence of HIV, total (% of population ages 15-49) 3.9

2nd Annual International Interdisciplinary Conference, AIIC 2014, 8-12 July, Azores, Portugal Proceedings, Vol.3
79
(2007) remarks that Nigeria is one of the countries considered not to be on track towards meeting Millennium Development Goals (MDGs). Security Related and other Obstacles to Right to Health in Nigeria The Nigerian nation is experiencing an unprecedented level of security challenges that even her corporate existence as a nation is threatened. Lives and properties are lost almost on daily basis through bomb blasts, communal conflicts, ethno-religious crisis, extra judicial killings and other forms of violence. There is the Boko Haram insurgence particularly in the North; communal clashes in Plateau state, militancy in the Niger Delta area etc The problem list is enormous and the casualty toll keeps rising. Only recently, about 25 students of Federal Polytechnic Mubi, were killed in cold blood by yet to be identified gun men( NTA,2012).
In addition to these challenges, Lucas (2000) also recounts shortage of drugs, breakdown of equipment, irregular supply of water and electricity, as well as low morale of professionals in the health care industry. These problems, he noted, have turned health centers and hospitals to shadows of their former selves. Adinma (2003) locates the problem around poor premium attached to health by past administrations. He frowned that the health sector was poorly financed. This gave rise to poor infrastructure and poor manpower development initiatives, which occasioned decline in work ethics and productivity.
Expectations that primary health care will turn around the system have been fluke. Dabiri (2004) observes that primary health care (PHC) suffered many setbacks particularly from the mid-1990s in Nigeria. She was embittered that the referral system broke down, that workers still had inadequate skills and that work supervision, monitoring and evaluation mechanisms weakened considerably. Similarly community participation in PHC also witnessed dwindling fortunes which affected quality of service and patronage. (Uzochukwu, Akpala, and Onwujekwe, 2004). Spiraling cost and inequitable distribution of health services constitute other major problems which particularly affect or disadvantage the poor and rural dwellers. Maudara and Renne (2001) found that despite better obstetric options, women in Zaria area of Nigeria still give birth at home on account of economic hardship. Another worrisome bottleneck to the task of safeguarding health values and right to health in Nigeria is the issue of grossly defective ratio of health service providers to the population. For instance, there are less than 20 physicians for 100,000 people in Nigeria (Obiajulu, 2007). Also, whereas W.H.O ratio for Environmental Health officers to the population is 1:500 the actual ratio in Nigeria is above 1:20,000 (Obianyo, 2004). Mismanagement of funds is another serious antecedent that has wrongly shaped the Nigerian health system over the years. Nzeshi (2007) quotes Nigeria’s former minister of health, Dr. Adenike Grange as saying that huge investment of government, development partners and donors to the health sector over the past four years has not yielded positive turn around in Nigerian’s health status. This raises questions about whether those funds were actually used for the purposes they were meant for. The above problem list is invariably worsened by the disastrous security situation in the country. Nigeria requires an efficient and formidable health system to cope with additional demands arising from security problems. Indeed, problems of security should constitute a key reason for which the health care delivery system is strengthened and repositioned to be more responsive and proactive to health needs and protection of rights to health of the people. To explain a defective health service or colossal infringement of peoples’ right to health on the basis of insecurity will not only be unjust, but will also put Nigerians through a painful oddity of not having security and health simultaneously. Prospects of Overcoming Security Challenges and Safeguarding Right to Health in Nigeria:

2nd Annual International Interdisciplinary Conference, AIIC 2014, 8-12 July, Azores, Portugal Proceedings, Vol.3
80
There are high prospects of safeguarding optimal levels of right to health despite the security challenges especially if the following measures are put in place:- (a) Establishment of new peace initiatives and expansion of tentacles of existing ones This is to fully harness benefits of dialogue as a viable tool for conflict resolution. In this regard, government should intensify effort to find out the leaders of Boko Haram group and commence the process of dialogue with them Their grievances, demands and interests should be interrogated. (b) Creation of employment opportunities This is crucial for the youths and others who lack stable economic support. This will make them less prone to vices or constituting themselves into security threats which jeopardizes efforts to safeguard rights to health. (c) Aggressive re-orientation programme should be pursued to enlighten people on the benefits of peaceful co-existence. The role of peace in stimulating development and promoting rights of individuals (including rights to health) should also be disseminated. (d) Sincere commitment to reforms that have human face. The country must avoid bandwagon approach to the serious issue of introducing socio-political and economic reforms that will benefit the masses. Each reform proposal must be carefully examined in terms of overall benefits achievable. Reforms must be people oriented and not targeted at enriching few cabals. There must be sincere commitment to implementation of reforms. The practice where the mass media sing praises of health reforms, electoral reforms, energy sector reforms when in actual fact, there is nothing on the ground must be avoided. The effort to consolidate on gains in the area of right to health should be prosecuted with sincerity of purpose. (e) Involvement of interest groups in reform packaging: - Reforms in society must carry all interested stakeholders along from planning stage to execution. Lucas (2000) advises that reforms especially in the health sector must take cognizance of 5Ps-people, public sector, private sector, professions and partners (traditional, religious, alternative medicine). In this way, such reforms cannot be at variance with the values and expectations of the people. They will not also generate or aggravate conflict situations. (f) The role of labour and civil society: Labour and the whole gamut of civil society have roles to play to safeguard right to health of Nigerians. Citizens’ vigilance is vital to prevent potential abuse of rights to health by political leaders even at periods of insecurity as is currently being experienced in Nigeria. The interest of labour, professional and human rights bodies such as Nigeria Bar Association (NBA), Academic Staff Union of Universities (ASUU), National Association of Nigerian Students (NANS), Nigerian Labour Congress (NLC), Civil liberty organizations etc are crucial for sustainable institutional reforms that will guarantee right to health to Nigerians. (g) Dismantling corruption in private and public life: One of the predicaments of the health sector in Nigeria is the issue of corruption. Funds are not utilized for purpose they were meant, while free drugs find their way to the markets. The present anti-corruption crusade should go beyond playing to the gallery. Concrete steps should be taken to eradicate corruption in private and public life of Nigerians. Only when this is done could investments toward safeguarding right to health bear appreciable results. (h) Strengthening the health management body: The ministry of health is a crucial institutional guard towards the quest for right to health of Nigerians. She should be strengthened with adequate fund, right caliber of manpower, and technology, consistent with what is obtainable elsewhere. Such arrangement will enable the ministry to discharge her supervision and health management duties creditably. (i) Periodic Retreat: There should be periodic retreat between all stakeholders in the health sector to review activities, take stock and put in place new initiatives to improve general health conditions and right to health of Nigerians..

2nd Annual International Interdisciplinary Conference, AIIC 2014, 8-12 July, Azores, Portugal Proceedings, Vol.3
81
Concluding Remarks The people of Nigeria have several resources, policies and reform packages that could form strong platforms for right to health of the citizenry to be adequately safeguarded. Unfortunately, as the country initiate and implement various reforms programmes, other problems of social existence emerge and sometimes threaten attainment set goals. Particularly worrisome is the security challenges which not only destabilize the socio-economic life of Nigerians but also make it impossible for the required synergy between health investment and right to health to be obtained. Consequently, citizens’ right to health is threatened while the state of health infrastructure tends toward deplorable dispositions. This paper has argued that possible decay of the health system and infringement of right to health of Nigerians arising from insecurity could be arrested if recommendations put forward are implemented. They will be very helpful in enhancing security of lives and properties and protect right to health of Nigerians. References: Aarva , P. (2007) . “Social health values – reflections of the dominant thinking in society” http//www.wikipedia.org accessed 25/5/07. Adebowale, A. (2007). One World UK: In-depth country Guides: Nigeria. Adinma J.I.B (2003). “Address on the occasion of state workshop on the community health system and health care financing scheme, Anambra Health News Vol. 1. No.1 pp 5. Dabiri, D. (2004). “Logistic Support for Community Health System and Healthcare financing scheme” An unpublished paper presented at a workshop on community health system and health care financing scheme, Nnewi, 2nd July. Giacomini . M, Hurley J, Gold. Smith P, Abelson, and I .J, (2004), The policy Analysis of value talk: lessons from Canadian Health Reform. Health Policy 67:15-24 Grange, A. (2007). Cited in Nzeshi .O, This Day Newspaper, 13th Sept. Global monitoring Report (2005), From consensus to momentum, World Bank Publication. Igbo, E.M (2003). Basic Sociology, Enugu: CIDJAP Press Igun, U.A (2006). Governance and National Development, Distinguished Annual lecture of the Faculty of Social Sciences, Nnamdi Azikiwe University, Awka. International Covenant on Economic, Social and Cultural Rights (1976), Cited in Minelli E. http://www.gfmerch/TMCAM/WHO- Minelli:/P2-3.htm Accessed 18/3/05 Lucas, A.O (2000). “Public Health: The spirit of the Alma-Ata Declaration” Archives of Ibadan Medicine, Vol. 1, No. 2 Supplement 1, pp 6-9 Mahler, H. (1978). Cited in Minelli E. http://www.gfmerich /TMCAM/WHO- Minelli/ P2-3 htm, Accessed 18/3/05 Maudara, M.U and Renne, E.P (2001) “Where women deliver: Rivalry in obstetric care in Zaira, Nigeria” Archives of Ibadan Medicine, Vol 2, No 1 pp 8. Mills, A. (1991) Women, Health and Medicine, Copen Philadelphia: Open University Press. Minelli, E. (2005), The mandate of a specialized agency of the United Nations, http://www.gfmer.ch / TMCAM/ WHO- Minelli / P2-3 htm Accessed 18/3/05 National planning Commission (2004), National Economic Empowerment and Development Strategy (NEEDS), Abuja: The NEEDS secretariat, NPC. Nzeshi, O (2007), National Health Indicators still poor-Grange: This Day Newspaper, 13th Sept. Obiajulu A.O (2007), “Problems and prospects of Democratic Consolidation in Nigeria”. An Unpublished Paper

2nd Annual International Interdisciplinary Conference, AIIC 2014, 8-12 July, Azores, Portugal Proceedings, Vol.3
82
Presented at a conference organized by Nigeria Sociological/ Anthropological Students Association, Nnamdi Azikiwe University, Awka, 25th May. Obianyo, P. (2004). Welcome Address Presented at the opening of a 3- Day Seminar on “Environmental sanitation for sustainable Development in the New Millennium”. Held at Awka, 8th-13th. Schaefer, R.T and Lamm R.P (1997), Sociology: A Brief Introduction, 2nd Edition, New York: The MCGraw-Hill Companies Inc. Uzochukwu B.S.C, Akpala C.O, and Onwujekwe O.E (2004) “How do health workers and community members perceive and practice community participation in the Bamako Initiative Programme in Nigeria: A case study of Oji River Local Government Area” Social Science and Medicine, 59 pp 157- 159. World Health Organization (WHO), 1978), The Alma Atta Declaration. Geneva: WHO Publication.
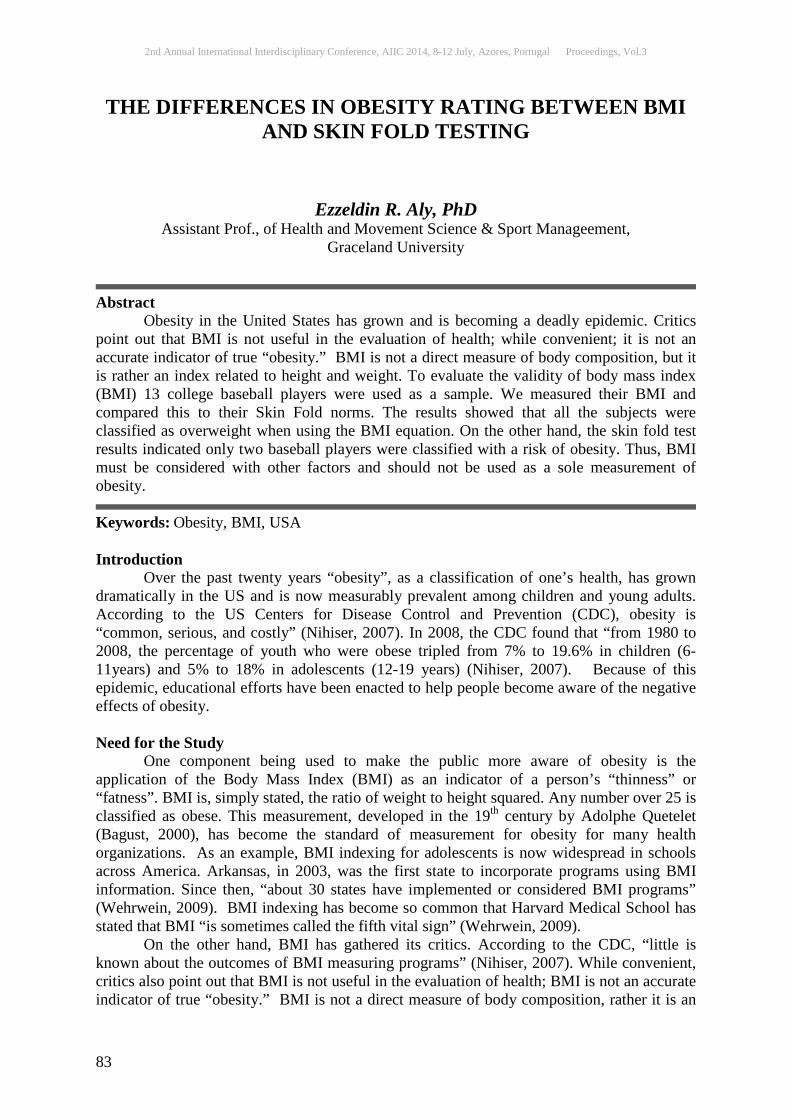
2nd Annual International Interdisciplinary Conference, AIIC 2014, 8-12 July, Azores, Portugal Proceedings, Vol.3
83
THE DIFFERENCES IN OBESITY RATING BETWEEN BMI AND SKIN FOLD TESTING
Ezzeldin R. Aly, PhD Assistant Prof., of Health and Movement Science & Sport Manageement,
Graceland University
Abstract Obesity in the United States has grown and is becoming a deadly epidemic. Critics point out that BMI is not useful in the evaluation of health; while convenient; it is not an accurate indicator of true “obesity.” BMI is not a direct measure of body composition, but it is rather an index related to height and weight. To evaluate the validity of body mass index (BMI) 13 college baseball players were used as a sample. We measured their BMI and compared this to their Skin Fold norms. The results showed that all the subjects were classified as overweight when using the BMI equation. On the other hand, the skin fold test results indicated only two baseball players were classified with a risk of obesity. Thus, BMI must be considered with other factors and should not be used as a sole measurement of obesity.
Keywords: Obesity, BMI, USA Introduction Over the past twenty years “obesity”, as a classification of one’s health, has grown dramatically in the US and is now measurably prevalent among children and young adults. According to the US Centers for Disease Control and Prevention (CDC), obesity is “common, serious, and costly” (Nihiser, 2007). In 2008, the CDC found that “from 1980 to 2008, the percentage of youth who were obese tripled from 7% to 19.6% in children (6-11years) and 5% to 18% in adolescents (12-19 years) (Nihiser, 2007). Because of this epidemic, educational efforts have been enacted to help people become aware of the negative effects of obesity. Need for the Study One component being used to make the public more aware of obesity is the application of the Body Mass Index (BMI) as an indicator of a person’s “thinness” or “fatness”. BMI is, simply stated, the ratio of weight to height squared. Any number over 25 is classified as obese. This measurement, developed in the 19th century by Adolphe Quetelet (Bagust, 2000), has become the standard of measurement for obesity for many health organizations. As an example, BMI indexing for adolescents is now widespread in schools across America. Arkansas, in 2003, was the first state to incorporate programs using BMI information. Since then, “about 30 states have implemented or considered BMI programs” (Wehrwein, 2009). BMI indexing has become so common that Harvard Medical School has stated that BMI “is sometimes called the fifth vital sign” (Wehrwein, 2009). On the other hand, BMI has gathered its critics. According to the CDC, “little is known about the outcomes of BMI measuring programs” (Nihiser, 2007). While convenient, critics also point out that BMI is not useful in the evaluation of health; BMI is not an accurate indicator of true “obesity.” BMI is not a direct measure of body composition, rather it is an
2nd Annual International Interdisciplinary Conference, AIIC 2014, 8-12 July, Azores, Portugal Proceedings, Vol.3
84
index related to height and weight. Purpose of the Study Is BMI a single, accurate indicator of health, or is BMI a better measure of physical fitness and health when used with other measurements to provide an overall assessment of an adolescent’s “healthiness”? The purpose of this study is to examine whether BMI testing within a collegiate athletic environment is a justifiable standard as the sole indicator of a person’s obesity. Hypothesis There will be a difference in obesity ratings among Graceland University baseball players when comparing BMI and the skin fold test results. Basic Assumptions of the study Participants will be volunteers from Graceland University’s men’s varsity baseball team. Height and weight measurements will be accurate. Measurements and calculations of body composition testing will be accurate. Limitations Only baseball players will be used. Review of Literature According to V.P. Wickramasinghe’s research, the worldwide incidence of non-communicable disease is increasing. This is attributed to the increase in the prevalence of obesity (Wickramasinghe, 2009). But how is one classified as obese? There are many field tests and measurements to gain information that can distinguish someone as obese. BMI has been used frequently to determine whether a person can be recognized as obese. It has become the mainstream way to determine obesity because of the ease of obtaining measurements (height and weight) and the easy calculation without any prior training required. History of the Body Mass Index (BMI) The Body Mass Index, or BMI, was created by Adolphe Quetelet in the 19th century. It was, in his vision, a simple way to gauge a person’s body weight. The components of the equation weighed an individual’s height and overall body mass to generate an index number indicating whether a person was under, over or at the appropriate weight level based on those components. According to A. Bagust, “The BMI is based on Quetelet’s original 19th century empirical observation that weight tends to vary with the square of standing height” (Bagust, 2000). Over time, little has changed. The BMI has remained in effect as a primary metric to determine an individual’s level of obesity, if any. Its simplicity and low expense have made it an attractive and consistent measure. To say it has become an almost universal tool would be an understatement in terms of its use for health organizations around the US and the world. Even the American Academy of Pediatrics recommends “that BMI should be calculated and plotted annually on all youth as part of normal health supervision with the child’s medical home” (Nihiser, 2007). Also, in the “Childhood Body Composition in Relation to Body Mass Index”, Maynard found that BMI values have become simple to use because the values can be “easily tracked over time” (Maynard, 2001). The chart below illustrates the four major classes and the seven sub-groups that comprise the rating scale used with Body Mass Index.
2nd Annual International Interdisciplinary Conference, AIIC 2014, 8-12 July, Azores, Portugal Proceedings, Vol.3
85
Table 1 The International Classification of Adult Underweight, Overweight and Obesity according to BMI
Classification BMI(kg/m2)
Principal cut-off points Additional cut-off points
Underweight <18.50 <18.50 Severe thinness <16.00 <16.00
Moderate thinness 16.00 - 16.99 16.00 - 16.99 Mild thinness 17.00 - 18.49 17.00 - 18.49
Normal range 18.50 - 24.99 18.50 - 22.99 23.00 - 24.99
Overweight ≥25.00 ≥25.00
Pre-obese 25.00 - 29.99 25.00 - 27.49 27.50 - 29.99
Obese ≥30.00 ≥30.00
Obese class I 30.00 - 34.99 30.00 - 32.49 32.50 - 34.99
Obese class II 35.00 - 39.99 35.00 - 37.49 37.50 - 39.99
Obese class III ≥40.00 ≥40.00 Source: Adapted from WHO, 1995, WHO, 2000 and WHO 2004.
As shown in the chart, the index offers a tiered set of diagnostic measures to classify
an individual’s weight status. The BMI measurements are divided into four categories ranging from “Underweight” to “Obese” based on scores obtained by dividing weight by the square of the individual’s height (kg/m²). Within each category there are sub-classifications that address specific ranges of the index scores. In this way a person can determine where they are rated based on the BMI. Before the adoption of BMI as a tool to gauge obesity, the United States used simple height/weight tables developed by insurance institutions. According to the 2009 Harvard Health Letter, “The old Metropolitan Life Insurance tables listed ‘desirable’ weight ranges for a given height” (Wehrwein, 2009). These charts included “an (elbow measurement) for medium frame to try to compensate for the differences between peoples body shapes and skeletal muscle mass” (Pai, 2000). It still was difficult for people to use, but this “desirable weight would indicate those persons with the lowest mortality rates” (Pai, 2000).
BMI is considered to be a screening tool to determine obesity levels for children, adolescents and adults. Is it an optimal tool? Probably not, but it is, at the very least, a good first indicator that something may not be right in terms of a person’s weight. If used in conjunction with skinfold measurement or waist circumference measurement, BMI could be used as an additional factor to determine obesity, but should not be used alone. Other ways to measure body composition
Waist circumference Waist circumference is the “metabolically active fat that collects around the organs in our abdomens” (Wehrwein, 2009). According to the Harvard Health Letter, the definition of waist circumference among many researchers is the measure using the top of the hipbone as a landmark with the tape measure going over the navel. Men with a circumference over 40 inches (102cm) and women over 35 inches (88 cm) are at a high health risk and considered obese. Waist-to-hip ratio The waist-to-hip ratio is waist circumference divided by hip circumference. According to Harvard’s definition the “hips are usually measured at the widest circumference, around the buttocks” (Wehrwein, 2009). There are increased health risks for men that have a ratio over 0.9-1.00 and women with the ratio over 0.85.
2nd Annual International Interdisciplinary Conference, AIIC 2014, 8-12 July, Azores, Portugal Proceedings, Vol.3
86
Skinfold Himes states in his “Screening for Obesity” research that “a skinfold thickness is the double layer of skin and subcutaneous fat (panniculus adiposus) lifted as a fold and measured with standardized calipers and methodology at specific sites on the body” (Himes, 2009). Also, the skinfold is measured with a caliper on males at three sites (triceps, subscapular, and abdominal) and females at four sites (triceps, subscapular, abdominal, and thigh) (Hetzler, 2006). The question remains – Is the BMI measure the optimal way to gauge obesity or is it a measure of convenience? As with any discussion or review of a topic there are at least two arguments to be made on either a pro or con basis. The issue of BMI as the sole indicator of obesity is not any different. The use of BMI as the sole discriminator is an improper use of the measure. While it is likely an adequate indicator of obesity, BMI alone can unfairly cast an individual into an undeserved category that can impact their social imagery, self-esteem and future finances (health, life insurance coverage, etc.). The fact that “obese” is a multi-factored categorization of an individual must be recognized. Several key groups feel that using BMI is an accurate measure as a sole indication of obesity. For example, in 2005, the US Preventive Services Task Force (USPSTF) found “BMI (calculated as weight in kilograms divided by height in meters squared) percentiles for age and gender is the preferred measure for detecting overweight children and adolescents. The index is feasible, reliable and is consistent with adult obesity standards” (USPSTF, 2010).
In addition, John Himes, a PhD from the University of Minnesota, Division of emiology, found in his 2009 research that “There is little evidence that other measures of body fat such as skin folds, waist circumference, or bioelectrical impedance are sufficiently practicable, or provide appreciable added information to be used in the identification of children and adolescents who are overweight or obese” (Himes, 2009).
Giovanna Turconi and several of her colleagues from the University of Pavia, in Pavia, Italy in a 2005 paper to the European Journal of Health, agree to the use of BMI in their research. They found that “correlations that emerged from their work show that BMI is a good adiposity index also in adolescents, it acts as an indicator of cardiovascular risk conditions” (Turconi, 2010). Other researchers have found that BMI must be taken in consideration with other factors. According to a 2009 research study conducted by David Freedman and Bettylou Sherry for the Centers for Disease Control in Atlanta, GA, “BMI cannot distinguish between body fatness, muscle mass, and skeletal mass and its use can result in large errors in the estimation of body fatness” (Freedman, 2009). Further they find that BMI is “almost useless as an estimator of percentage of body fat in normal-weight children” (Freedman, 2009). The difference between lean muscle mass and bone from body fat are large determinants in classifying obesity. Another example illustrating how BMI is too vague a measure is noted by Tufts University in their Health News Letter. They have concluded that “BMI can definitely be left aside as a clinical and epidemiological measure of cardiovascular risk for both primary and secondary prevention BMI is not a good measure of visceral fat, the key determinant of metabolic abnormalities that contribute to cardiovascular risk” (Tufts, 2006).
Other factors that should be considered when measuring BMI are race and gender. According to Dr. Stephen Daniel’s research centering on the utility of BMI and the consideration of race and gender, “When BMI is used in a research or clinical setting to evaluate body fatness, the maturation stage, race, gender, and distribution of fat should be considered in the interpretation of the results” (Daniels, 1997). This research found that BMI cannot be “used as an equivalent measure of fatness in girls and boys or in blacks and whites” (Daniels, 1997). The results of the study show there is a difference in gender body composition and race body composition. Gender and body composition should not be
2nd Annual International Interdisciplinary Conference, AIIC 2014, 8-12 July, Azores, Portugal Proceedings, Vol.3
87
considered similar in any way. Not everyone is the same. All bodies are not created equally and using the BMI equation as a sole measurement is saying everyone is the same. Similarly, Kerry Welch and Chris Craggs, from the University of Nottingham, submit in their abstract of the Learning Disability Practice magazine for nursing, that their research supports a multi-factor approach to measuring obesity. They have determined that “BMI should not be used exclusively but as a part of a range of methods that are designed to diagnose and predict conditions” (Welch, 2010). A third argument for the consideration of other factors is reflected in an article submitted by A. Bagust. In examining the article, “An Alternative to Body Mass Index for Standardizing Body Weight for Stature”, Bagust found that “according to BMI, female predominance is strongly associated with height, whereas male prevalence were not” (Bagust, 2000). Since all these factors are not included in the BMI equation, which only includes height and weight, the perception of the obesity epidemic has the potential to be skewed in a negative direction.
Critics are beginning to doubt that using BMI is the best gauge to predict health risks in children. One study done by Michael Schmidt in the International Journal for Obesity found “waist circumference was the best predictor of metabolic health,” which included risk factors of “excess abdominal fat, plus high blood pressure, blood sugar and cholesterol, and can up the chances of diabetes and heart disease” (Schmidt, 2010). Agreeing with this study is a study done in 2004, which found that waist circumference explains obesity-related health risks, not BMI. This research, conducted by Ian Janssen, found that “for a given waist circumference value, overweight and obese persons have a health risk that is comparable with that of normal-weight persons. Such an expansion of waist circumference risk strata could have important implications” (Janssen, 2004). Skinfold measurements are one of the most practical methods to use to “determine body fat” (Riebe, 1996). It has a standard error of 3% (Riebe, 1996) and training and practice are essential in obtaining accurate skinfold measurements. This emphasis on training and practice is important to ensure accurate results. A study done by Creighton University found results indicated “skinfold measurements most accurately estimated the percentage of body fat” (Riebe, 1996, p. 66-69). Whitehead’s research in the Physical Educator agrees with the skinfold accuracy and even clarifies “the inexpensive plastic Fat Control calipers gave measurements that were not different than laboratory calipers” (Whitehead, 1993). This makes skinfold measurement inexpensive, but a qualified person is still necessary to obtain the results. One downfall is the caliper cannot measure the morbidly obese, but this is only a small percentage of the people.
The controversy remains. BMI is popular, simple, and touted as accurate in determining health and obesity rates (Mathews, 2008). Skin fold measurements, while requiring some simple equipment and a practiced person to perform the measurements, may more directly measure body fat. If both methods are accurate, then results for individual subjects should be the same. Methodology Subjects Subject sample comprised of approximately 13 males, age 18-25, who are members of the Graceland University varsity baseball team. Procedure
A meeting was held after an afternoon baseball practice to recruit volunteers. At the meeting, attendees were given and informed consent form (Appendix A) explaining the purpose of the study, what would be asked of them, and possible benefits and risks. Subjects

2nd Annual International Interdisciplinary Conference, AIIC 2014, 8-12 July, Azores, Portugal Proceedings, Vol.3
88
wishing to see their body composition data could do so by notifying the researcher at the start of the data collection process. Those agreeing to participate were asked to report one time for measurements. Volunteers met in the Multipurpose Room in the Hampton Center at 02:30PM on November 5, 2010 to fill out “Subject Profile Form” (Appendix B). Each subject was then assigned a subject number to be used on the Subject Profile Form (Appendix B). Only the researcher had access to the list of subject names as they correlate to subject numbers. (This will only be retained in order to provide each subject body composition data if desired.) All reporting of data will use only subject numbers. First, the researcher measured and recorded height and weight. These measurements were then entered into a BMI equation and equated to a body composition category. Next got assistant from (Men’s Trainer) as a certify athletic trainer took skin fold measurements on each subject; up to three measurements at each of three sites (Thigh, Abdominal, and Chest sites) were taken. Measurements for each site were recorded on the data collection sheet (Appendix B). Later the researcher used those numbers with the equation to determine body composition (percent of fat). Once all subjects were measured and body composition has been calculated using each of the two tests, the Researcher did a comparative analysis of the results between methods for each subject. The equation is as follows: Body Density = BD B D = 1.1093800 - 0.0008267*(sum of three skinfolds) + 0.0000016*(sum of three skinfolds)2 0.0002574*(age) Results
Table 2
*This chart shows all of the 13 subjects and their measurements and classifications for both BMI and skin fold.
STUDY RESULTS
Subject Physical Traits
Subject #BMI
IndexBMI
ClassificationSkinfold
Rating %Skinfold
Classification Age Height (inches)
Weight(lbs)
Gender
MK 01 28.6 Overweight 22.4 Moderate risk 20 72 211 MALE
MK 02 24.4 Normal 8.5 Lean 23 74 190 MALE
MK 03 26.2 Overweight 13.4 Fitness 22 77 221 MALE
MK 04 27.2 Overweight 9.8 Lean 20 68.5 182 MALE
MK 05 28.0 Overweight 18.5 Healthy 18 67 179 MALE
MK 06 27.6 Overweight 24.0 Moderate risk 21 73.5 212 MALE
MK 07 21.9 Normal 8.0 Lean 18 71 157 MALE
MK 08 27.2 Overweight 13.4 Fitness 21 65.5 167 MALE
MK 09 26.8 Overweight 12.5 Fitness 21 69 182 MALE
MK 10 26.0 Overweight 11.6 Fitness 21 65.5 159 MALE
MK 11 29.3 Overweight 19.0 Healthy 24 75 235 MALE
MK 12 25.7 Overweight 8.9 Lean 21 67 164 MALE
MK 13 24.2 Normal 8.9 Lean 19 74.5 191 MALE

2nd Annual International Interdisciplinary Conference, AIIC 2014, 8-12 July, Azores, Portugal Proceedings, Vol.3
89
Table 3
*The chart above illustrates all of the subjects classification of overweight vs. normal weight from the BMI norms.
Table 4
*The chart above illustrates all of the subjects classification of risk of obesity vs. no risk from the skin fold norms. Table 5
*The chart above illustrates the comparison of BMI overweight vs. normal weight classifications and skin fold
risk vs. no risk classifications of all subjects.
77%
23%
BMI Overweight vs. Normal (N=13)
Overweight
Normal
15%
85%
Skinfold Risk vs. No Risk of Obesity (N=13)
Moderate Risk
No Risk
Overweight
Healthy / Lean0%
20%
40%
60%
80%
100%
BMI RatingSkinfoldRating
Overweight
Healthy / Lean
Comparison BMI vs. Skinfold
2nd Annual International Interdisciplinary Conference, AIIC 2014, 8-12 July, Azores, Portugal Proceedings, Vol.3
90
Conclusion Out of all the study subjects using the BMI equation, ten of the fifteen were classified as overweight, compared to the skin fold test, where only two were classified with a risk of obesity. The margin of difference is very substantial when looking at these two tests. The results show the BMI equation should not be used as a single indicator of obesity and is not reliable enough when measuring body composition by itself. Knowing that the BMI equation may not be a reliable indicator when used alone could have implications on the classification of the overall population being obese or overweight. The results do not claim the entire population is wrongfully of being overweight or obese, but the numbers would be more accurate if other measurements or tests were applied. Time and precision would be a factor when “remeasuring” the population, but it would give true results without any false pretenses. Study in 2007, by The Department of Kinesiology, Epidemiology, and Physical Medicine and Rehabilitation, at Michigan State University, tested the relationship between BMI and percentage of fat to also determine the accuracy of BMI as a measure of percentage of fat in college athletes and non-college athletes. The results of their study showed that “BMI is not an accurate measure of fatness in college athletes and non-athletes” (Ode, 2007, p. 403-09). The results that they had gathered proved that “BMI misclassifies normal fat individuals a large percent of the time” (Ode, 2007). This study, on a much larger scale, supports the results the researcher have founded by showing that collegiate athletes, along with non-collegiate athletes do not conform to the BMI standards. Another study in 2008, done by the Health, Physical Education, and Recreation Department at Utah State University, studied “Eighty-five National Collegiate Athletic Association (NCAA) Division 1 football players” (Mathews, 2008, p. 33-37), and their BMI classification of “overweightness” and/or obesity. The study they conducted also showed that “BMI alone is not a valid indicator of overweight and obesity in a strength-trained athletic population. However, some collegiate football players… meet multiple criteria for obesity” (Mathews, 2008, p. 33-37). This study, which was mainly focused on collegiate athletes, is fairly compareble to the study we had performed. In our study a fair number of subjects did not fit the BMI standards but were exceptional with the skin fold measurements. On a proportionate basis, the skin fold results in our study appear to provide a more accurate analysis of the athlete’s health status. This would be confirmed even on a simple visual assessment of the test subjects versus the BMI judgments. If there were to be a continuance of this study, we suggest adding two of three different ways to measure body fat and compare all of the different tests next to BMI and see which would ultimately be the “most accurate”. Another recommendation for further research would be to test both male and female collegiate and non-collegiate athletes. Having a wide variety of subject would give a good perspective on the overall classification of obesity in the United States. References: Bagust, A., & Walley, T. (2000). An Alternative to Body Mass Index for Standardizing Body Weight for Stature. Q J Med, 93, 589-596. Daniels, S. R., Khoury, P. & Morrison, J. (1997). The Utility of Body Mass Index as a Measure of Body Fatness in Children and Adolescents: Differences by Race and Gender. Pediatrics, 99, 804-807. Freedman, David S. and Bettylou Sherry. “The Validity of BMI as an Indicator of Body Fatness and Risk Among Children.” Pediatrics 124 (2009): S23-S34. Hetzler, R., et al. (2006). A Comparison of Bioelectrical Impedance and Skinfold Measurements in Determining Minimum Wrestling Weights in High School Wrestlers. Journal of Athletic Training, 41, 46-51.

2nd Annual International Interdisciplinary Conference, AIIC 2014, 8-12 July, Azores, Portugal Proceedings, Vol.3
91
Himes, J. H. (2009). Challenges of Accurately Measuring and Using BMI and Other Indicators of Obesity in Children. Pediatrics, 124, S3-S22. Janssen, I., Katzmarzyk P., & Ross R. (2004). Waist Circumference and not Body Mass Index Explains Obesity-Related Health Risk. The American Journal of Clinical Nutrition, 79, 379-84. Mathews, E. M., & Wagner D. (2008). Prevalence of Overweight and Obesity in Collegiate American Football Players, by Position. Journal of American College Health, 57, 33-37. Maynard, L. M., et al. (2001). Childhood Body Composition in Relation to Body Mass Index. Pediatrics, 107, 344-349. Nihiser, AJ. et al. (2007). Body Mass Index Measurement in Schools. Journal of School Health, 651-671. Ode, J. J. (2007). Body Mass Index as a Predictor of Percent Fat in College Athletes and Nonathletes. Medicine & Science in Sports & Exercise, 39, 403-409. Pai, M.P., & Paloucek F.P. (2000) The Origin of the ‘Ideal’ Body Weight Equations. Annals of Pharmacology, 34, 1066-69. Riebe, D., & Hingerty R. (1996). Measuring Up. American Fitness, 66-69. Schmidt, M.D. et al. (2010). Predictive Associations Between Alternative Measures of Childhood Adiposity and Adult Cardio-Metabolic Health. International Journal of Obesity, 10, 1038+. Tufts University. (2006). BMI Faulted as Obesity Gauge. Health and Nutrition Letter, 24, 13. Turconi,G.et al. (2010). BMI Values and other Anthropometric and Functional Measurements as Predictors of Obesity in a Selected Group of Adolescents. Pediatrics, 125, 361-367. US Preventive Services Task Force. (2010). Screening for Obesity in Children and Adolescents. Pediatrics, 125, 361-367. Wehrwein, P., ed. (2009). Measuring How Fat We Are. Harvard Health Letter, 34,1-3. Welch, K., & Craggs C. Body Mass Index and Alternative Approaches to Taking Measurements. Learning Disability Practice, 13, 30-37. Whitehead, J. R., & Parker M. A. (1993). Teaching Concepts of Body Fatness While Skinfold Testing: An Experimental Test of Different Methods. Physical Educator, 187-93. WHO. (2000). Global Database on Body Mass Index. Wickramasinghe, V. P. et al. (2009). Validity of Currently Used Cutoff Values of Body Mass Index as a Measure of Obesity in Sri Lankan Children. Ceylon Medical Journal, 54, 114-120.

2nd Annual International Interdisciplinary Conference, AIIC 2014, 8-12 July, Azores, Portugal Proceedings, Vol.3
92
Appendix A Informed Consent Dear Graceland University Participant: You are being asked to participate in a study on The differences in obesity rating between BMI and skin fold testing by participating in the various body composition tests. You will be asked to report one time for approximately fifteen minutes to complete testing. Testing will be done on Friday at 11:00am. Possible benefits of participation include improving the body of knowledge related to body composition testing and its accuracy among athletes. Additionally, you will be able to receive your body composition data for personal use. Please let the Researcher know if you would like to receive your individual results. Possible risks of participation are not greater than activities of daily living. You may experience minor pinching from the skin fold calipers. During the study you will be asked to participate in two body composition tests. 1. During the skin fold testing you may experience minor pinching from the calipers necessary for testing. You will be asked to not have participated in any sort of physical activity approximately 4 hours prior to testing. 2. For the BMI testing you will be asked to step on a scale to gain your weight and
stand against the wall for accurate height measurement. The results of testing will be kept confidential. Although the findings may be published, your name will not be used, and no one reading the results of the research will be able to identify you. Your participation in this study is voluntary. You may discontinue your participation at any point without penalty. Attending and participating in testing indicates your understanding of this information and consent to participate. Appendix B Subject Profile Form Last Name _____________________ First Name _____________________ Weight ____________ pounds Height _____________inches 5ft = 60 inches 6ft = 72 inches Age _______________ Gender M F (circle one) Skin Fold Sites Abdomen_______________ Thigh____________ Chest____________ Subject testing number: _______
2nd Annual International Interdisciplinary Conference, AIIC 2014, 8-12 July, Azores, Portugal Proceedings, Vol.3
93
DETERMINANTS OF CHILD IMMUNIZATION AND MEASURMENT OF GENDER BIAS
Poulami Chatterjee, Research Scholar Economics, CSRD, SSS Jawaharlal Nehru University (JNU) New Delhi, India
Abstract This paper attempts to analyse the role of some socio-economic and demographic variables on the likelihood of being fully immunised in Indian scenario . Six childhood vaccinations are being considered for the children of the age between one to two years in India. The data used in this paper are from the India Human Development Survey (IHDS), which was conducted in 2004-05 by the University of Maryland in collaboration with the National Council of Applied Economic Research, New Delhi between November 2004 and October 2005.The nationally representative data covers 1504 villages and 971 urban areas across33 states and union territories of India. The paper also tries to decompose the gender gap in full immunisation among children of age one to two years and tries to quantify the gender discrimination with regard to childhood immunisation.
Keywords: Child Immunisation, UIP, Gender discrimination, Fairlie Decomposition Introduction Despite the growing awareness, the childhood immunisation rate in India is not yet satisfactory. Measure of children’s immunizationagainst several childhood diseases gives an indicationof how much priority the children’s health is given in household. It is important to determine the factors which play crucial role in children’s welfare. Though childhood vaccinations are available free of cost in India, but the population of children not fully immunised is worrisome. Immunisation programme is the essential interventions for protection of children from life threatening diseases. The immunisation programme in India was launched in 1978 as Expanded Programme on Immunisation (EPI). With Universal Immunisation Programme (UIP), It gained momentum in 1985 and was carried out in phased manner to cover all districts in the country by 1989-90 (MoHFW 2006-07: 58). More than 90 million pregnant women and 83 million infants were targeted to be immunised over a five year period under the UIP. UIP became a part of the Child Survival and State Motherhood (CSSM) Programme in 1992 (MoHFW 2002-03: 176). Since 1997, immunisation activities have been an essential part of the National Reproductive and Child Health (RCH) Programme (MoHFW 2005-06: 54). In India, under the UIP, vaccines for six vaccine-preventable diseases (Tuberculosis, Diphtheria, Pertussis (whooping cough), Tetanus, Poliomyelitis, and Measles) are available free of cost to all. This programme faces many supply side and demand side bottlenecks. In India, healthcare budget is meagre which the fact for many developing countries is. But there are problems in demand side of immunisation. Some socio economic and demographic factors play crucial role in shaping the demand for full vaccination of a child in a household. This paper focuses on demand side problem of immunisation.
2nd Annual International Interdisciplinary Conference, AIIC 2014, 8-12 July, Azores, Portugal Proceedings, Vol.3
94
Vaccine-preventable diseases have socio-economic outcomes. Children suffering from diseases have poor attendance in school and may even drop out eventually. These diseases have effect on morbidity and mortality. Also, the parents have to bear the cost of children’s ill health through hospitalisation, doctor’s fees, and medicines etc. These diseases have negative impact on individual as well as society. A sick child can suffer from chronic diseases in his adult life also and may have lesser productivity in professional front. Health status of population determines state’s human capital. Health of population is a product of society and has an indispensable contribution to economic growth and political stability. UIP is often cited as ‘the most cost-effective route to child’s better health’ (WHO 1998). ‘Universal immunisation of children … is crucial to reducing infant and child mortality’ (IIPS 2007: 227). Literature Review There are studies which indicate the gender discrimination against girl children aged between 1 to 2 years compared to the boys of same age group in the area of full immunisation (Borooah, 2004). Other researchers have also noted such discriminating behaviour of families against girl children (Choi et al 2006 (in rural areas only); Das Gupta 1987; Gatchell et al 2008, Islam et al 1996; Lloyd 1993; Rajeshwari 1996). However, Hill et al (1995) showedthat although there are significant variations in immunisation coverage between genders, the median difference across all countries is very close to zero. Borooah,2004 has also showed that this bias declines with mother’s education. Such a positive effect of maternal education is also hypothesised by Akmatov et al 2007, Desai et al 1998, Gage et al 1997, Gatchell et al 2008, Islam et al 1996, Lee 2005. Higher immunisation coverage in urban areas is confirmed by many researchers (Padhi, 2001; Pebley et al 1996). But, after controlling for other variables, the rural-urban disparity is not statistically significant. Objective This paper tries to assess influence of somedemographic and socio-economic variables on full immunisation coverage of children, aged between 1-2 years. The immunisation helps to prevent six vaccine-preventable diseases covered under Universal Immunisation Programme (UIP). The paper also tries to decompose the gender gap in full immunisation among children of age one to two years. I want to quantify the amount of discriminating behaviour contributing to this gap in immunisation between two genders. Data The data used in this paper are from the India Human Development Survey (IHDS), which was conducted in 2004-05 by the University of Maryland in collaboration with the National Council of Applied Economic Research, New Delhi between November 2004 and October 2005. The nationally representative data covers 1504 villages and 971 urban areas across 33 states and union territories of India. The survey covering 41,554 households was carried out through face-to-face interviews by pairs of male and female enumerators in local languages. The respondents included a person who was knowledgeable about the household economic situation (usually the male head of the household) and an ever-married woman aged 15-49. The 12-23 month age group was taken for analysis because as per international and GoI guidelines children should be fully immunized by one year of birth. I have used Household file, Birth-history file and Village file to collect the information related to children and their mothers, household etc.

2nd Annual International Interdisciplinary Conference, AIIC 2014, 8-12 July, Azores, Portugal Proceedings, Vol.3
95
Data on immunisation is based on vaccination card for each living child or on mother’s report in case of non availability of the card. According to World Health Organisation guideline, children who received BCG, measles, and three doses each of DPT, and Polio (excluding Polio 0) are considered to be fully vaccinated. For, explanatory variables, I have three categories – Individual specific, household specific and village specific. Indicators used in my analysis are listed in next table. I have taken mother’s membership at Mahila Mandal as proxy for women empowerment. Variables used in Logistic regression
The dependent variable is full immunisation that says whether a particular child is fully immunised or not. Methodology I have used logistic regression to determine significant variables for childhood immunisation. The binary variableRi is defined as:Ri = 1 if the child was fully immunised, in the sense he/ she has received the all the eight vaccination doses , otherwise Ri = 0. The probabilities of a child being fully immunised is estimated separately for boys and for girls, as logit models:
where: xik is the values of the kth determinant forthe ith child I have estimated logistic regression equations for pooled as well as for boys and girls separately. In Table 4, I have reported the results for all three equations. To analyse gender discrimination I have used Fairlie Decomposition. This is extension of popular Blinder-Oaxaca decomposition analysis.
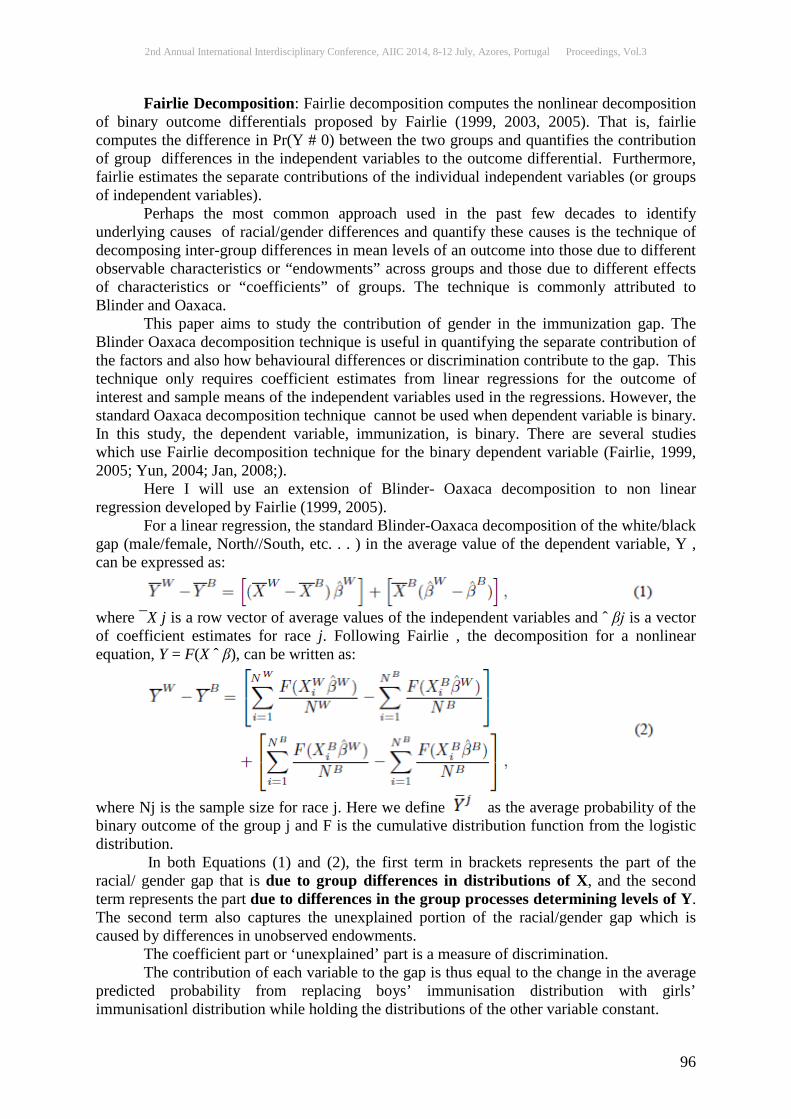
2nd Annual International Interdisciplinary Conference, AIIC 2014, 8-12 July, Azores, Portugal Proceedings, Vol.3
96
Fairlie Decomposition: Fairlie decomposition computes the nonlinear decomposition of binary outcome differentials proposed by Fairlie (1999, 2003, 2005). That is, fairlie computes the difference in Pr(Y # 0) between the two groups and quantifies the contribution of group differences in the independent variables to the outcome differential. Furthermore, fairlie estimates the separate contributions of the individual independent variables (or groups of independent variables). Perhaps the most common approach used in the past few decades to identify underlying causes of racial/gender differences and quantify these causes is the technique of decomposing inter-group differences in mean levels of an outcome into those due to different observable characteristics or “endowments” across groups and those due to different effects of characteristics or “coefficients” of groups. The technique is commonly attributed to Blinder and Oaxaca. This paper aims to study the contribution of gender in the immunization gap. The Blinder Oaxaca decomposition technique is useful in quantifying the separate contribution of the factors and also how behavioural differences or discrimination contribute to the gap. This technique only requires coefficient estimates from linear regressions for the outcome of interest and sample means of the independent variables used in the regressions. However, the standard Oaxaca decomposition technique cannot be used when dependent variable is binary. In this study, the dependent variable, immunization, is binary. There are several studies which use Fairlie decomposition technique for the binary dependent variable (Fairlie, 1999, 2005; Yun, 2004; Jan, 2008;). Here I will use an extension of Blinder- Oaxaca decomposition to non linear regression developed by Fairlie (1999, 2005). For a linear regression, the standard Blinder-Oaxaca decomposition of the white/black gap (male/female, North//South, etc. . . ) in the average value of the dependent variable, Y , can be expressed as:
where ¯X j is a row vector of average values of the independent variables and ˆ βj is a vector of coefficient estimates for race j. Following Fairlie , the decomposition for a nonlinear equation, Y = F(X ˆ β), can be written as:
where Nj is the sample size for race j. Here we define as the average probability of the binary outcome of the group j and F is the cumulative distribution function from the logistic distribution. In both Equations (1) and (2), the first term in brackets represents the part of the racial/ gender gap that is due to group differences in distributions of X, and the second term represents the part due to differences in the group processes determining levels of Y. The second term also captures the unexplained portion of the racial/gender gap which is caused by differences in unobserved endowments. The coefficient part or ‘unexplained’ part is a measure of discrimination. The contribution of each variable to the gap is thus equal to the change in the average predicted probability from replacing boys’ immunisation distribution with girls’ immunisationl distribution while holding the distributions of the other variable constant.
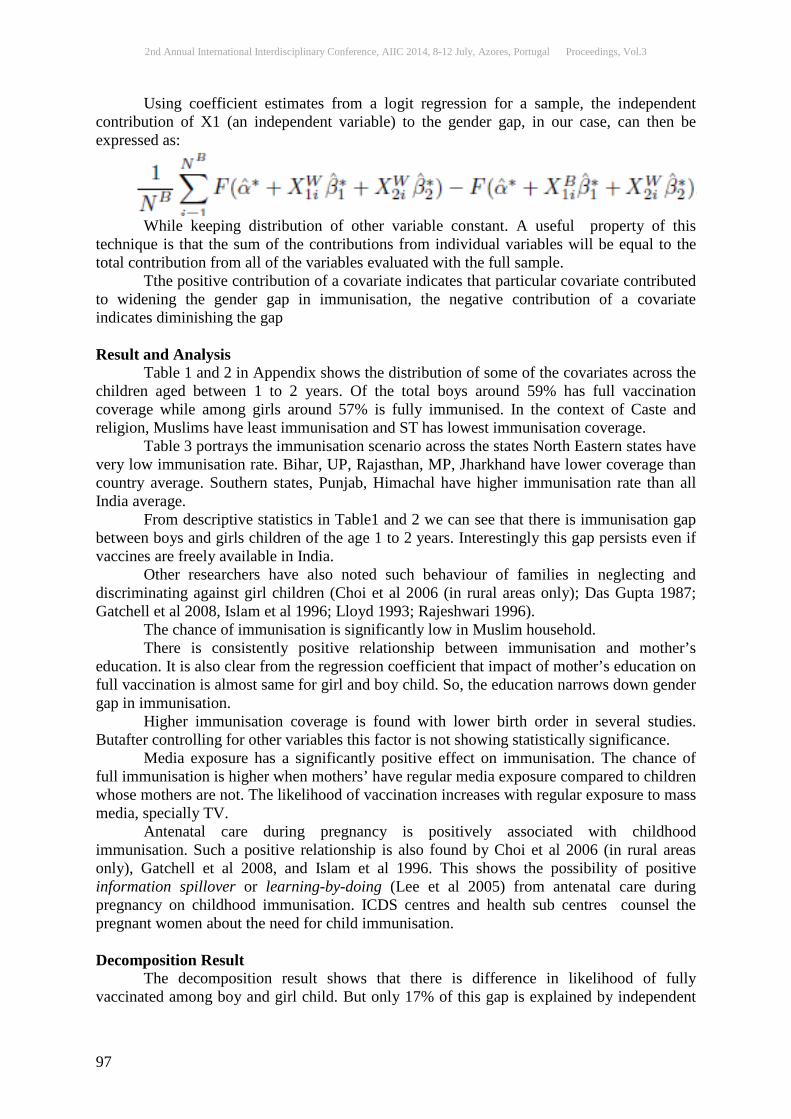
2nd Annual International Interdisciplinary Conference, AIIC 2014, 8-12 July, Azores, Portugal Proceedings, Vol.3
97
Using coefficient estimates from a logit regression for a sample, the independent contribution of X1 (an independent variable) to the gender gap, in our case, can then be expressed as:
While keeping distribution of other variable constant. A useful property of this technique is that the sum of the contributions from individual variables will be equal to the total contribution from all of the variables evaluated with the full sample. Tthe positive contribution of a covariate indicates that particular covariate contributed to widening the gender gap in immunisation, the negative contribution of a covariate indicates diminishing the gap Result and Analysis Table 1 and 2 in Appendix shows the distribution of some of the covariates across the children aged between 1 to 2 years. Of the total boys around 59% has full vaccination coverage while among girls around 57% is fully immunised. In the context of Caste and religion, Muslims have least immunisation and ST has lowest immunisation coverage. Table 3 portrays the immunisation scenario across the states North Eastern states have very low immunisation rate. Bihar, UP, Rajasthan, MP, Jharkhand have lower coverage than country average. Southern states, Punjab, Himachal have higher immunisation rate than all India average. From descriptive statistics in Table1 and 2 we can see that there is immunisation gap between boys and girls children of the age 1 to 2 years. Interestingly this gap persists even if vaccines are freely available in India. Other researchers have also noted such behaviour of families in neglecting and discriminating against girl children (Choi et al 2006 (in rural areas only); Das Gupta 1987; Gatchell et al 2008, Islam et al 1996; Lloyd 1993; Rajeshwari 1996). The chance of immunisation is significantly low in Muslim household. There is consistently positive relationship between immunisation and mother’s education. It is also clear from the regression coefficient that impact of mother’s education on full vaccination is almost same for girl and boy child. So, the education narrows down gender gap in immunisation. Higher immunisation coverage is found with lower birth order in several studies. Butafter controlling for other variables this factor is not showing statistically significance. Media exposure has a significantly positive effect on immunisation. The chance of full immunisation is higher when mothers’ have regular media exposure compared to children whose mothers are not. The likelihood of vaccination increases with regular exposure to mass media, specially TV. Antenatal care during pregnancy is positively associated with childhood immunisation. Such a positive relationship is also found by Choi et al 2006 (in rural areas only), Gatchell et al 2008, and Islam et al 1996. This shows the possibility of positive information spillover or learning-by-doing (Lee et al 2005) from antenatal care during pregnancy on childhood immunisation. ICDS centres and health sub centres counsel the pregnant women about the need for child immunisation. Decomposition Result The decomposition result shows that there is difference in likelihood of fully vaccinated among boy and girl child. But only 17% of this gap is explained by independent

2nd Annual International Interdisciplinary Conference, AIIC 2014, 8-12 July, Azores, Portugal Proceedings, Vol.3
98
variables. Rest 83% difference remains unexplained. Although the decomposition technique distinguishes between explained and unexplained portions of the total gender difference, it does not give any signal as to what might clarify the unexplained gap.Usually, we can consider unexplained part as a measure of discrimination. This result indicates towards the discrimination against girl child. Unexplained part is simply the difference between average probability of the girls being fully immunised, had they been treated as boys and sample proportion of fully immunised girls. While doing decomposition I have used Boys as reference and have used the coefficient of boy’s regression equation as weight. Results of the paper are listed down in brief
• Mother’s education level increases the probability of child being fully immunised. • Only 13% of the immunisation gap between boys and girls could be explained by the
fact that girls are born in the families with different familial circumstances (endowment factor). Rest 87% of the immunisation gap is accounted for different treatment for girls which is unexplained/ unmeasured. The underlying cause may be the discrimination against girl child.
• Among the religious groups, Muslim children are least likely to be Immunized • Some antenatal care during pregnancy raises immunization chances significantly. This
increases possibility to meet health personnel who help mothers to raise awareness by disseminating information regarding immunization.
• The persistence of considerable gender differentials suggest the failure of social and health policies to ensure equitable health progress for all population groups .
• The results suggest that in addition to strengthening MCH programmes in rural areas, substantial efforts must also be made to improve women empowerment and female education
Conclusion While the state is committed to well-being of children, it seems that some social factors have retarding effect which limit some children’s access to health services. The presence of inequities among genders,religions, caste,poor strategies for the targeting of basic needs by the state,inadequate information systems have created scenarios thathave potentially negative implications for children’s health care. Though state’s interventionis essential for improving the welfare of children, the ultimateresponsibility for accessing such services lies with the households. Policies and programmes in other sectors such aseducation, welfare, industry, labour, information, environment, etc. shouldalso take the public health into considerations(Gopalan, 1994). To achieve the goal of UIP in India, the policy makersshould also give more importance in female education through Education for All. Also building better infrastructure to provide antenatal care, increasingmass awareness regarding vaccinationthrough electronic mass media will be also effective for improving immunisation coverage
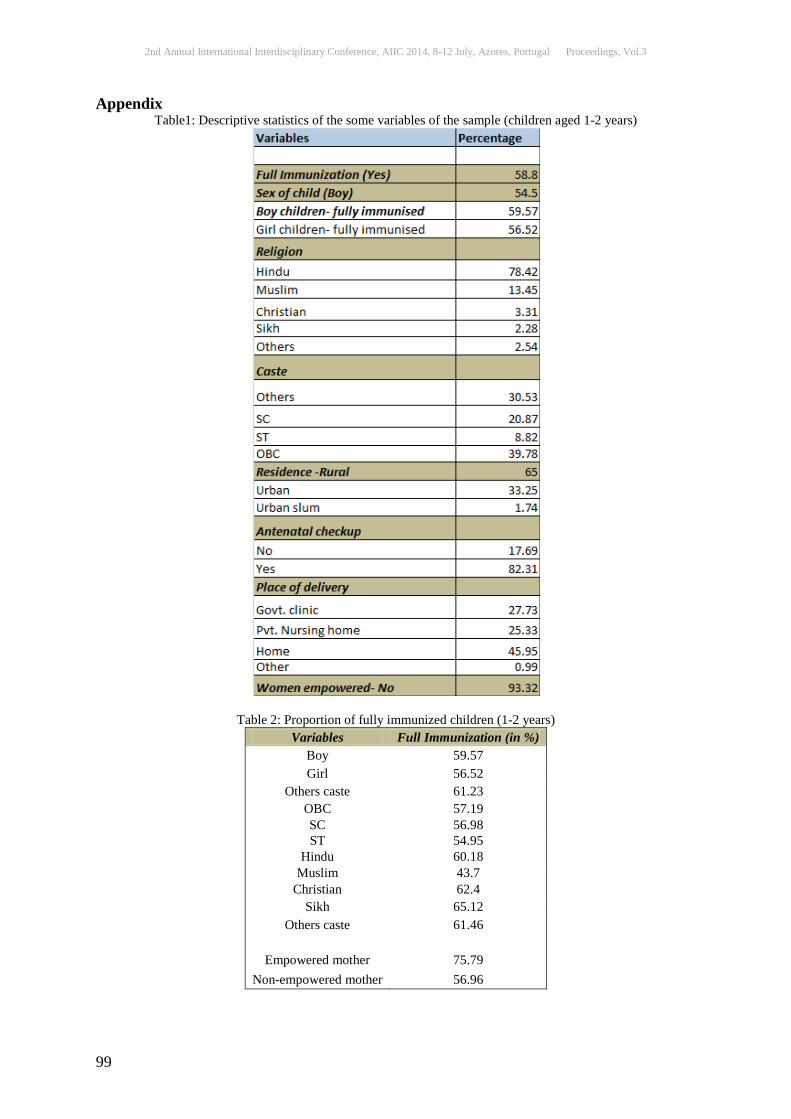
2nd Annual International Interdisciplinary Conference, AIIC 2014, 8-12 July, Azores, Portugal Proceedings, Vol.3
99
Appendix Table1: Descriptive statistics of the some variables of the sample (children aged 1-2 years)
Table 2: Proportion of fully immunized children (1-2 years) Variables Full Immunization (in %)
Boy 59.57 Girl 56.52
Others caste 61.23 OBC 57.19 SC 56.98 ST 54.95
Hindu 60.18 Muslim 43.7
Christian 62.4 Sikh 65.12
Others caste 61.46
Empowered mother 75.79
Non-empowered mother 56.96
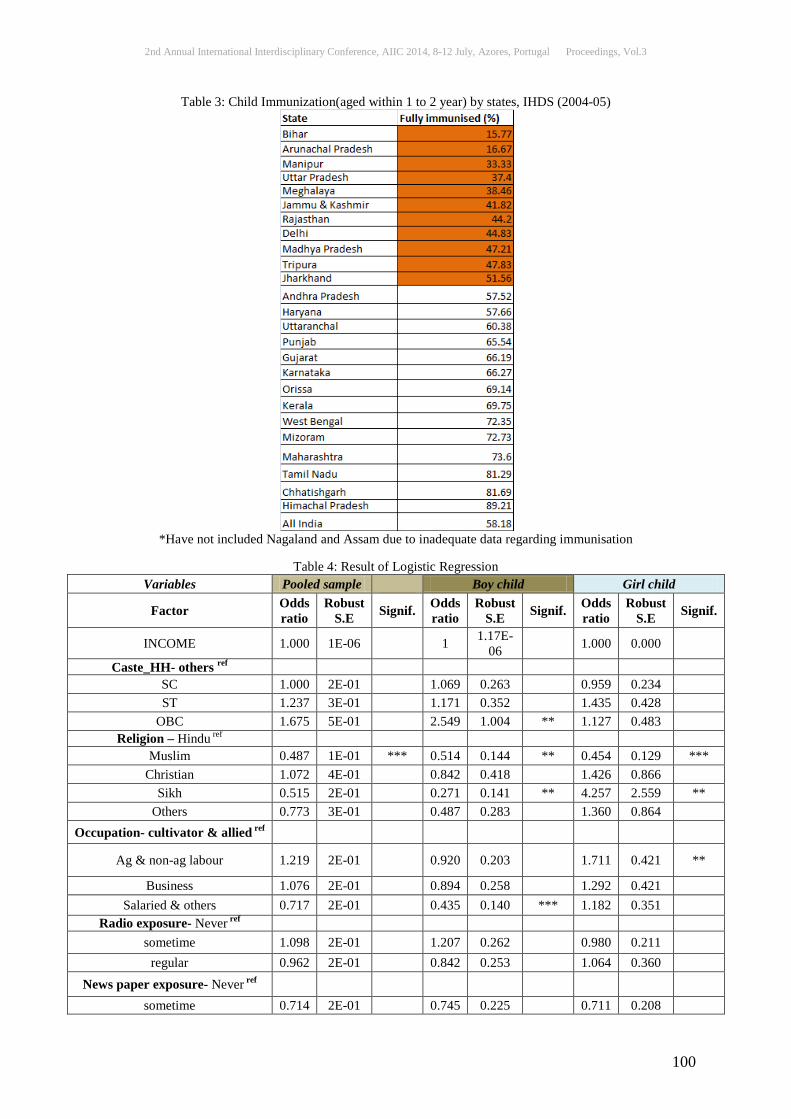
2nd Annual International Interdisciplinary Conference, AIIC 2014, 8-12 July, Azores, Portugal Proceedings, Vol.3
100
Table 3: Child Immunization(aged within 1 to 2 year) by states, IHDS (2004-05)
*Have not included Nagaland and Assam due to inadequate data regarding immunisation
Table 4: Result of Logistic Regression
Variables Pooled sample Boy child Girl child
Factor Odds ratio
Robust S.E Signif. Odds
ratio Robust
S.E Signif. Odds ratio
Robust S.E Signif.
INCOME 1.000 1E-06 1 1.17E-06 1.000 0.000
Caste_HH- others ref SC 1.000 2E-01 1.069 0.263 0.959 0.234 ST 1.237 3E-01 1.171 0.352 1.435 0.428
OBC 1.675 5E-01 2.549 1.004 ** 1.127 0.483 Religion – Hindu ref
Muslim 0.487 1E-01 *** 0.514 0.144 ** 0.454 0.129 *** Christian 1.072 4E-01 0.842 0.418 1.426 0.866
Sikh 0.515 2E-01 0.271 0.141 ** 4.257 2.559 ** Others 0.773 3E-01 0.487 0.283 1.360 0.864
Occupation- cultivator & allied ref Ag & non-ag labour 1.219 2E-01 0.920 0.203 1.711 0.421 **
Business 1.076 2E-01 0.894 0.258 1.292 0.421 Salaried & others 0.717 2E-01 0.435 0.140 *** 1.182 0.351
Radio exposure- Never ref sometime 1.098 2E-01 1.207 0.262 0.980 0.211
regular 0.962 2E-01 0.842 0.253 1.064 0.360 News paper exposure- Never ref
sometime 0.714 2E-01 0.745 0.225 0.711 0.208

2nd Annual International Interdisciplinary Conference, AIIC 2014, 8-12 July, Azores, Portugal Proceedings, Vol.3
101
regular 0.532 2E-01 ** 0.842 0.394 0.324 0.140 TV exposure- Never ref
sometime 1.691 3E-01 *** 1.707 0.389 ** 1.644 0.390 regular 1.938 4E-01 *** 1.569 0.464 2.545 0.691 ***
Mahilamandal member- yes 1.326 4E-01 1.299 0.487 1.392 0.572
Mother's age 0.997 2E-02 0.965 0.020 * 1.033 0.024 Mother's education 1.135 2E-02 *** 1.131 0.032 *** 1.133 0.032 ***
No. of children 0.944 6E-02 1.020 0.083 0.861 0.079 Antenatal checkup- No ref 4.386 8E-01 *** 4.229 1.005 *** 4.885 1.392 ***
Place of delivery- Govt. clinic ref Pvt. Nursing home 0.931 2E-01 0.978 0.302 0.811 0.260
Variables Pooled sample Boy child Girl child
Factor Odds ratio
Robust S.E Signif. Odds
ratio Robust
S.E Signif. Odds ratio
Robust S.E Signif.
Home 1.080 2E-01 0.978 0.240 1.046 0.260
Others 1.413 7E-01 0.911 0.604 2.252 1.535
Post natal checkup- never ref For mother 1.424 5E-01 1.753 0.779 1.112 0.589
for baby 0.988 2E-01 0.789 0.248 1.284 0.394 for both 1.435 3E-01 1.482 0.392 1.266 0.415
Anganwadi centre # 0.978 2E-02 1.000 0.025 0.955 0.023 *
Immunisation camp # 1.003 4E-02 1.016 0.051 0.977 0.048 Note: *** p< 0.01, ** p< 0.05
Table 5: Decomposition of gender gap in child immunisation

2nd Annual International Interdisciplinary Conference, AIIC 2014, 8-12 July, Azores, Portugal Proceedings, Vol.3
102
Table 6: Aggregate Fairlie decomposition result[Y refers to full immunization]
References: Bose, Ashish (2001): “Health for All by 2000: Broken Promises”, Economic and Political Weekly, Mar 17, pp-905-7. Desai, S. and Alva, S. (1998): “Maternal Education and Child Health: Is There a Strong Causal Relationship?”, Demography, Vol-35, No.-1, pp-71-81. Fairlie, Robert W. (2005):“An extension of the Blinder-Oaxaca decomposition technique to logit and probit models”, Journal of Economic and Social Measurement 30: 305-316. Gage, A.J., Sommerfelt, E. and Piani, A. (1997): “Household Structure and Childhood Immunization in Niger and Nigeria”, Demography, Vol-34, No.-2, pp-295-309. Islam, S.M.S. and Islam, M.M. (1996): “Influences of Selected Socio-economic and Demographic Factors on Child Immunization in a Rural Area of Bangladesh”, Demography India, Vol-25, No.-2. Lee (2004): “Demand for Immunization, Parental Selection, and Child Survival”, Working paper Pande, Rohini P. and Yazbeck, A.S. (2003): ‘What’s in a Country Average? Wealth, Gender, and Regional Inequalities in Immunisation in India’, Social Science and Medicine, Vol.-57, pp-2075-88. Patra, Nilanjan (2008a): ‘A Probe into the Ways to Stimulate Childhood Immunisation in India: Findings from NFHS-III’. Available at SSRN: http://ssrn.com/abstract=1117614 Pebley, A.R., Goldman, N. and Rodriguez, G. (1996): “Prenatal and Delivery Care and Childhood Immunization in Guatemala: Do Family and Community Matter?”, Demography, Vol-33, No.-2 Rajeshwari (1996): “Gender Bias in Utilization of Health Care Facilities in Rural Haryana”, Economic and Political Weekly, Feb 24. R.W. Fairlie(1999):“The Absence of the African-American Owned Business: An Analysis of the Dynamics of Self-Employment”, Journal of Labor Economics 17(1). Sokhey, Jotna (1988): National Immunisation Programme (National Health Programme Series 1), MoHFW, National Institute of Health and Family Welfare, New Delhi. Steele, F., Diamod, I. and Amin, S. (1996): ‘Immunisation Uptake in Rural Bangladesh: A Multilevel Analysis’, Journal of Royal Statistical Society, Vol-159, Part-2, pp-289-99.
2nd Annual International Interdisciplinary Conference, AIIC 2014, 8-12 July, Azores, Portugal Proceedings, Vol.3
103
HOW TO ALLOW FOR USER-CENTERED INNOVATION OVER AN ESTABLISHED INFORMATION
INFRASTRUCTURE WITHIN AN INSTITUTIONALIZED CONTEXT
Synnøve Thomassen Andersen, PhD UiT, The Arctic University of Norway, Norway
Abstract This paper describes a user-centered innovation process within psychiatric services for children and adolescents, implementing a new decentralized model in rural areas in Norway by using mobile phone technology. We apply theory of information infrastructures as a frame of reference for analysing what enables or constrain user-centered innovation processes within a complex organizational context. We illustrates what roles the various levels of an information infrastructure and its installed base can play in innovation processes, implying a complex interplay between technical, organizational and institutional factors. We argue that as a result of this user-centered innovation, the new model emerged with a larger potential for creating a new innovation path than would have been the case if it had been linked to the existing structures. The aim of this paper is thus to contribute to the understanding of how to allow for user-centered innovation over an established information infrastructure within an institutionalized context.
Keywords: Infrastructures, installed base, user-centered innovation, health care Introduction Like many other innovations, innovation in the health sector is based on a technological perspective. From a technological perspective, the idea is that ICT will solve many of the major challenges facing the health sector by making it more efficient and citizen-oriented (Blix et al., 2012). Such a perspective often seems to be an expert-driven, top-down development, where neither citizens nor healthcare professionals are involved to any significant extent. In this context it is important to emphasize that health care is not primarily a question of technology. Decisive factors for achieving better health care is working closely with health professionals and collaboration between health professionals and patients. This study focuses on the interplay between mobile technologies, information infrastructures and innovative processes involving the users in the development processes. The development of a mobile communication solution is highlighted as an important part of introducing a new treatment model in distributed, local health care provision. Through user-centered innovation, a new treatment model designed according to a variant of Parent Management Training – Oregon (PMT-O) 9 was implemented. By focusing on information infrastructure and innovation processes involving the users as active participants, this article describes the interplay between installed base and the innovation processes. The study highlight how an installed base either may enable or constrain the innovation processes, illustrating the inter- relationship between technical solutions, the organizational and institutional, legal
9 PMTO is a treatment and prevention program for families with children with antisocial behaviour.

2nd Annual International Interdisciplinary Conference, AIIC 2014, 8-12 July, Azores, Portugal Proceedings, Vol.3
104
components, users and their uses. Two perspectives that are especially relevant for this article are: i)How to explain to what extent a potential for user innovation exist within an existing information infrastructure and its installed base; ii)How to explain the dynamic of change by using the concepts of path creation and path dependencies (Garud and Karnøe, 2001) and Zittrain’s (2006) concept of generativity. Based on this the central research question in this article is: How to allow for user-centered innovation over an established information infrastructure within an institutionalized context? More specifically, this study show how various elements in an infrastructure influence user-centered innovation. Structure of the paper This article is structured as follows: first, a presentation of the theoretical basis (section 2), and thereafter, a presentation of the case in section 3. Section 4 present the method and empirical basis, while analysis and discussion of the findings are presented in section 5, followed by a summary of the article. Theory This article combines the theoretical perspective of information infrastructure, user innovation, path creation and generativity. Literature of information infrastructure (II) is used in understanding II to include technological, organizational, institutional and legal elements (Hanseth and Monteiro 1996; Star and Ruhleder, 1996; Hanseth, 2002; Ciborra et al. 2000; Hanseth and Lyytinen, 2010). Innovation is fundamentally tied to social practice (Tuomi, 2002), and in the existing literature on infrastructure (Star and Ruhleder, 1996; Hanseth and Monteiro, 1998; Hanseth, 2000) and user-centered innovation (Von Hippel, 1988, 2005), this perspective is generally deemed to be problematic. According to Bygstad (2010) there is a need for more research on “the causal structure of innovation in information infrastructures, and how this is linked to the growth of the installed base” (p.4). In the next four sections we will present in detail the key concepts. Information infrastructures Information infrastructures are described as heterogeneous collections of components (Hanseth and Monteiro, 1996). Hanseth and Lyytinen (2010) present a more precise definition of II “as a shared, open (and unbounded), heterogeneous and evolving socio-technical system (which we call installed base) consisting of a set of IT capabilities and their user, operations and design communities” (p.4). II is described as heterogeneous, by including several different types of components; both technical and non-technical, including people and organizations, and socio-cultural components (Hanseth and Monteiro, 1998; Hanseth, 2002). Based on this the installed base can be described as a heterogeneous «network» of technical and social-technical components, including network nodes: equipment and software, protocols, standards etc., but also procedures, routines, work practices, knowledge, competence, experience etc. Thus, organizational and institutional structures are also important parts of the installed base. According to Ciborra et al., (2000), cannot an existing installed base be eliminated or replaced and Hanseth (2000), point out that it have a significant impact on how the new one will be designed. Hanseth (2000) claim that new information infrastructures are designed and developed over time as expansions or extensions, along with improvements, of the existing infrastructures, they are never developed from scratch (p.60). Unintended and undesirable effects that are difficult to
2nd Annual International Interdisciplinary Conference, AIIC 2014, 8-12 July, Azores, Portugal Proceedings, Vol.3
105
anticipate make the building of infrastructures by using traditional strategy complicated. Several empirical studies propose applying more step-wise, evolutionary approaches (Ciborra et al., 2000; Hanseth, 2010; Hanseth and Lyttinen, 2010), including drift and cultivating (Hanseth and Aanestad, 2003). According to Hanseth and Aanestad (2003), such gradual, trial-oriented approaches will make it possible to detect such effects before they entail larger consequences. User-centered innovation Innovation covers both invention, the process of creating something new and the result this process gets in the market, e.g. an entirely new product, the launch of an existing product in a new market, or using new production methods. The general understanding of innovation is more or less the same, although the definitions differ slightly. A general definition of innovation is: “the introduction of something new, a new idea, method, or device”, (Webster dictionary, online10:) or a similar definition “the introduction of novelties; the alteration of what is established by the introduction of new elements or forms” (Oxford English Dictionary, online11). It has long been recognized that the sources of knowledge and innovation are both inside and outside of organizations (von Hippel, 1995). Tuomi (2002) points out that social driver of innovation are important (p.23-25). Tuomi (2002) describe that users have a central role in shaping innovation processes, as they have strong influence on the social side of innovations, modifying and improving the products, helping to shape technology in all its phases (p.4). von Hippel (1988) present the terms «user-centred innovation» and «lead users» in studies on «the democratization of innovation» (von Hippel 2005). The so-called «lead users» with special competence and interest assume an active role themselves in developing technology or work methods for their own use. According to Tuomi (2002), technology exists as technology-in-use in the context of a specific practice, and that the starting point for innovation studies therefore must be on the social practical level (p.21). Innovation can also be regarded as a process in which organizations seldom innovate alone, but rather in collaboration with other enterprises, networks, formal knowledge-generating organizations (research institutes, universities), legal systems and regulatory statutes (Tuomi, 2002). According to Chesbrough (2003), «open innovation» revolves around how one can access others' creativity and knowledge. Van de Ven et al., (1999) describe that innovation often does not consist of sequential actions, but rather of an interplay of several concurrent processes. Von Hippel (1988, 1995, 2005) claim that user-centered innovation entails the users' being active in the development itself («user innovations») or the developers ‘having a new understanding of the users' needs through observation and dialogue («lead users»). Path dependency and path creation By discussing the concept path dependence, David (1985) and Arthur (1989) brought a dynamic systems view to technology innovation studies. According to David (1985) the concept of path dependence can help explaining that history is important in understanding how technological innovations are adopted. However, entrepreneurs are embedded in structures from which they attempt to depart. In contrast to path dependence, Garud and Karnøe (2001, 2003), present path creation as a process whereby innovators seek to deviate from existing thinking. Path dependence and path creation thus present different perspectives on innovation processes. Henfridsson et al. (2009) points to the reciprocal nature of path creation and path dependencies that are reflected in actors’ ongoing enactment of existing structures. This article seeks to illustrate how path dependency was linked to the existing way
10 http://oxforddictionaries.com/definition/american_english/innovate 2013-03-20 11 http://public.oed.com/?post_type=page&s=innovation, 2011-06-20
2nd Annual International Interdisciplinary Conference, AIIC 2014, 8-12 July, Azores, Portugal Proceedings, Vol.3
106
of providing health services through the information infrastructure, while path creation originated through the break with that socio-technical structure and thereby contributing to the development of a new way of providing health services on an alternative technical platform. Generative technology The term generativity can be characterized as the ability of an infrastructure to generate or produce new behavior, structure, or output without the direct involvement of the originator of the system. Zittrain (2006) present the principle of "generativity" in technology: the capacity of some technology to allow its users to make new things out of it, things the designer never anticipated. Zittrain (2006) define generativity as a technology’s capacity for leverage across a range of tasks, adaptability to a range of different tasks, ease of mastery, and accessibility. (p.1981).This article seeks to discuss how generative technologies can enable or constrain user-centered innovation processes and the properties of such generative technologies can make them highly applicable for users in innovation processes. The case This research describes health care services in a rural, sparsely populated area in the north of Norway, which entails a number of challenges, not least in the field of psychiatric care. Health care is not primarily a matter of technology, and close collaboration with health care providers and between health professionals and patients is essential for achieving better health care. The mobilization of patients’ own resources, as well as family and community resources can contribute significantly to the healing process (Brennan and Safran, 2003; Ball and Lillis, 2001). In particular, patients should be provided with adequate care and support in order to manage their health problems to the greatest extent possible. The main empirical base in my research is the introduction of a health program in Finnmark 12 where one reorganized from a central to a decentralized treatment model model. The treatment model which was chosen was based on the Parent Management Training-Oregon (PMT-O) model13. This is a treatment and prevention program for families with children displaying antisocial behaviour. An important part of this project has been the development and implementation of an appropriate technical solution based on mobile phones, which can help the care providers as well as the patients in their communication and information handling routines supporting the treatment. Users in this study represented a large, composite group of different individuals in terms of gender, age, competence, experience, geographical origins and culture, etc. This entailed that the “users” were health workers, team members and psychiatric specialists, in addition to parents, adolescents and children. These users contributed in the innovation by choosing the framework which in turn laid the premises for the chosen solution and were furthermore involved in the development and testing of prototypes. The result has been the development of a new technical solution along with organizational changes required to support the implementation of the PMT-O treatment model. In this development project, the author had roles as both researcher and project leader. These double role provided access to a wide range of information, such as documents, meetings, interviews, e-mail, all of which are
12 Finnmark is the northernmost and largest county in Norway, although with a population of fewer than 73,000 citizens 13 PMT-O is based on “social interaction learning theory”, developed by Patterson and co-workers at Oregon Social Learning Center. PMT-O is a detailed program designed to improve parenting practices and indirectly reduce antisocial behaviour in the children.
2nd Annual International Interdisciplinary Conference, AIIC 2014, 8-12 July, Azores, Portugal Proceedings, Vol.3
107
the basis for the study. Through the study of a user-centered innovation process, the focus is on how an installed base may enable or constrain the development of an information infrastructure. This gain insight into the generative properties of a technology, and how it influences the innovative processes, in particular the mechanisms of path creation and path dependencies. These experiences can therefore provide us with better understandings of the complexities in developing and maintaining a new infrastructure, and in particular how to succeed in creating an ICT-based architecture for interaction and collaboration in the provision of health services. Research method The research method used in this research is case study in the interpretative tradition and within a larger action research project. Use of qualitative research methods are used to understand and explain the social phenomena related to the II and information system innovations. This research approach enabled the author to describe and understand personal meaning, social phenomena and the experiences from people through data collecting methods such as interviews and observations in its natural environments (Thagaard, 2004). By focusing complexity within human understanding according to the development of the situation, Walsham (2002) claim that you may not define the dependent or/and independent variables in the first place. According to Mathiassen (2002), the weakness of practice studies such as case studies, surveys and interviews is that it separates research from practice. An important part in the methodological approach in this study, is the double role where author active participating as project manager, while at the same time having the role as researcher. Based on the active role and strong user involvement, the present research is an action-based approach, and the research can be defined as action research. The action research approach in this project helps to strengthen this link between research and practice. Action research (AR) is characterized by the researcher's participation in order to change or develop the field along with those who are a part of it. Greenwood and Levin (1998, p.75) claim that “action research aims to solve pertinent problems in a given context through a democratic inquiry where professional researchers collaborate with participants in the effort to seek and enact solutions to problems of major importance to the local”. However, the action-based approach is complemented with qualitative methods such as case studies, interviews, observations and document analysis, to establish a more complete and solid foundation for producing rigorous research results (Mathiassen, 2002, p.6). According to Mathiassen (2002), action research can be used as the basic form to establish a close relation to practice and to ensure the relevance of the research, supplemented with methods which support systematic collection of data and application of suitable methods of interpretation. In this research use of qualitative methods enabled us to reflect deeper on the experiences from the project and to systematize the insights that were gained during the process. The empirical material emerges from qualitative data sources such as individual interviews, observations and document reviews (see table 1). Repstad (1998) underlines that a combination of different methods may offer a broader groundwork for data, and thus a more reliable basis for interpretation. The project was traditionally organized; with a steering group, a project group and a reference group. In addition, a technology group was established. In the various groups there were representatives from CYP, mobile teams, families, supplier and the health trust.
2nd Annual International Interdisciplinary Conference, AIIC 2014, 8-12 July, Azores, Portugal Proceedings, Vol.3
108
Methods
Type of activities Total 2006 2007 2008
Observation (during
participation in meetings and user courses)
3 project teams 7 steering groups
7 project teams 3 steering groups
5 contractors 3 user courses
4 project teams 3 steering
groups 5 techno groups
23 other
meetings
63
Interview
12 CYP representatives
(2 questionnaires were used by CYP representatives for
the families)
4 user representatives 16
Document analysis project documents meeting notes,
emails and reports
user-training notes,
workshop documentation
> 100
Table 1 Data collection methods used Documents Document analysis is one of several qualitative research approaches in the interpretative tradition of IS research (Myers, 1997; Myers and Avison, 2002; Walsham, 1993). Documentary sources in this research were used to provide background information and an understanding of Finnmark Hospital Trust structure, functions, working routines, and background for the reorganization of the children and youth psychiatric services. When analyzing the documents, there were made continuous evaluations and considerations on whether and in what manner the information in the document had relevance to the project, the project issues, the research question, and if and how the information was relevant to the installed base and the II. When reading the documents, the information were divided into two categories: - Information that was relevant to the project.
- Information that referred to Finnmark Hospital Trust authority as a whole, and was part of a larger regional and national initiative or strategy.
Information relevant to the project was systematized in relation to the project domain area, but also in terms of information infrastructure and installed base. This included working practices, knowledge, technology, system solutions etc. The information was systematized by distinguishing between different types of decisions that were taken in terms of strategy, technology, design, delimitation, partner strategy and such. Interviews Collection of data through interviews appears to have been an appropriate tool in this study. The use of interview as a technique in data collection enabled the role as a researcher to get physically and psychologically close to the users/informants - and vice versa. Such a reflective posture is essential in order to provide the empirical data with an analytical interpretation. Thagaard (2002) points out that it is essential that you are able to see the importance of your own role in the interaction with users/informants, empirical data and theoretical perspective. In addition, perspectives and the theoretical basis in relation to the researcher’s education and interests are required (Malterud, 2001, p.484). According to Walsham (1993, p.14) “case studies provides the main vehicle for research in the interpretive tradition”. In total, 16 interviews with 16 informants were conducted (see table 1). The informants were CYP representatives and user representatives within the county, in hierarchical positions (from operational, administrative or strategic levels), and situated in
2nd Annual International Interdisciplinary Conference, AIIC 2014, 8-12 July, Azores, Portugal Proceedings, Vol.3
109
different geographical locations. The interviews were informal and unstructured in the sense that the author as a researcher had a small list of a few basic key words (old and new treatment model, mobile technology, and user-centered) to guide the interviewing and most of them were conducted by phone. All interviews lasted for 20-40 minutes, and were transcribed afterwards. In order to make sure that the author as a researcher had understood the informant correctly, they would review and verify the notes afterwards. Use of this strategy provided a useful way to avoid misunderstandings. The objective in using interviews was to receive rich and extensive information on how people in the domain area experienced their own situation. The administrative health care workers in the community experienced the use of Sami language and mobile phone as necessary to get the job done. One of them had this reflection:
“We use mobile phones on a daily basis for SMS and other messages, and all of the messages are written in Sami language. I think mobile phones have been used in Sámi areas since the mobile was introduced. It is natural to use it as a tool because of the long distances. A lot of the citizens in the community are spread all over the large community area, in the mountains, in the small villages. Therefore, we must organize for our citizens!”
During the initial interviews, the focus was on understanding the organizational context and the ambulant teams or therapists’ daily work practices. The interviews were primarily semi-structured and open-ended. One of the ambulant teams/clinics was particularly interesting as it provided rich descriptions of their participation and collaboration activities. As one user representative/ responder said;
If you have to use technology as a part of the treatment, it has to be easy to use. It has to be a generally and self-explanatory application etc., otherwise it won’t be used.”
One of the responders in the ambulant team made the following reflections: “(…) The process of discussing behaviour and linking it to points written down on a form on the mobile phone is more important than the points themselves.”
The perspective on interviews is that the information provided to the author as a researcher is created when it is provided, depending upon the relationship between the responder and the author as the researcher. The qualitative interviews were conducted like conversations between the author as the researcher and the responder, which were led by the themes about which the researcher required information (Thagaard, 2004). According to Kvale (1997), the analysis of data is a continuous process that starts in the interview situation and continues with the independent review back at the office. Observing The aim of using observation techniques was to gain knowledge and obtain data on the interplay between the installed bases and innovation processes. By observing the users as active participants, we want to explore the tension for user-centered innovation and the existing installed base of the II. There were done 3 observations in 2006, 7 observations in 2007 and 4 observations in 2008 during participation in meetings with the project team. In the same period, 7 observations were done in 2006, 3 observations in 2007 and 3 observations in 2008 during participation in meetings with the steering group. 5 observations were done in 2007 of the contractors, and 5 observations in 2008 of the techno groups. In 2008, 3 observations were done during user courses, and there were observed 4 other meetings in 2007 where the ambulant teams and health care workers from different communities participated. In total, there were done 70 observations in meetings and courses. Observation of meetings was very important during the data collection. In action research, the continuous planning, execution and discussion of key observations is central (Tiller, 1999). Following the project activities closely for three years made it possible to study the interplay between
2nd Annual International Interdisciplinary Conference, AIIC 2014, 8-12 July, Azores, Portugal Proceedings, Vol.3
110
the installed base and innovation processes. Analysis of information from observations enabled the revealing of different aspects of the II. Thagaard (2004) describes how the relationship between the researcher and informant determines the quality of the empirical material. The following is an example from the research notes, describing the use of video conferencing in a meeting where members discussed new technology, interface and changes of platform:
“All team members are sitting at a round table, in a half circle, with the possibility to look at each other and at the video screen. The member at the video screen can see everyone in the room. Materials are spread out all over the table in no particular order. After a formal presentation, reading aloud the project description, followed by a discussion about the aim and strategy, the group starts a lively discussion about mobile phones and computers, and the standards graphical user interface.”
Observations of the interaction between the various user groups were made to clarify the challenges of existing and new working practices, the use and selection of technology solutions to both existing and new. The data material (notes) were systematized in relation to the start, conduct and final phase of the project. The notes contained information about date, time, used time and place of the observations. The notes also contained information concerning who participated in the situation, as well as a description of the behavior in the situation. Breaks in the observations were also recorded. On the basis of this information, users' participation and influence in the innovation process was uncovered. The analysis has been part of the action research process throughout the project. Postholm (2005, p.99) claims that "the analysis starts as soon as the researcher enters the field of research and continues throughout the research process". Analysis and discussion We consider the II as heterogeneous, modular and layered, where the user applications and surrounding organizational and legal context are important parts of its installed base. In this study, the development process included technical aspects, usability requirements and organisational elements. The analysis of the innovation processes is done at three levels, as illustrated in table 2 below:
Analytic level Focus in the analysis Critical factors/processes
Organizational level: health
service provision etc.
Understanding [identifying] the organizational changes processes and reform(s) in the psychiatric health service
provisions that have taken place, including changes in work patterns, relations between professionals and the user, and
furthermore, institutional and professional interests and conflicts.
Context: Institutional variables
Changes in organizations Important (actors)
stakeholders and power structures
Professional interests and conflicts
The application development and
user level
Identifying and understanding all phases in the system development process and how they involved various user groups which had different background/experience and
interests in the SU work
System development approach(es) and phases
Different actors and roles in System development
Information Infrastructure level
Understanding the specific characteristics of the two (old and new) II and IB, how they influenced the change
processes in the technical [and organizational] innovation: More specifically: what made it possible to move from old
to new II?
Characteristics of the two II/IB
Technical platform, standards, basic functions
services, dynamics, type of applications typical users
Table 2: Research framework The organizational level addresses the organisational and institutional aspects of providing health services. Change processes have taken place in the provision of psychiatric

2nd Annual International Interdisciplinary Conference, AIIC 2014, 8-12 July, Azores, Portugal Proceedings, Vol.3
111
health service, including changes in professional work, in relations between professionals and users, as well as institutional and professional conflicts. Critical factors are the institutional context, changes in the organization, important actors’ stakeholders and power structures etc. The middle application development level addresses the application development and users involved, with a view to understand the different phases in the system development process and how they involved various user groups having different background/experience, roles and interests, and how it was possible to solve the potential conflicts in this work. Other factors may be the different actors, their functions and roles and, finally, conflicting interests. The information infrastructure level addresses the specific characteristics of the existing and the new installed bases, and in particular how it influenced the change process related to the technical and organisational innovations. Furthermore, we have identified the critical factors and processes such as basic function services, types of applications, typical users etc. This user-oriented innovation was thus based on strong socio-technical orientation, which involved the different user groups within all project phases, in line with Jansen and Nielsen (2005). Table 3 present a multi-level framework for understanding how the development and implementation work involved innovations at three levels: technical platform, application and organization, which can be illustrated in the following way:
Model
Level
Old regime/technical and organizational model
New regime: technical and organizational model
Old organisational structure
Old system devel-opment model
New organisational structure
New system devel-opment model
Changes in organization and
health service provision
Centralized treatment model Traditional SU
Methodology: Top-down, expert
driven Organised at NCT (Norwegian Centre for Telemedicine )
PMT-O – decen-tralized
Local, user- oriented, ,
incremental and experimental system
development Local Project group
(techno-group) Local health
personnel + users
Development of the applications
Application based on PC &
Videoconferences
Application based on Mobile Phone
Information Infrastructure
II/IB: based on Broadband Norw. Health Network
Mobile telephone network.
Establishment of local techno group
Table 3 Illustration of changes from the old to the new regime/technical and organisational We claim that user involvement was made possible by the specific character of this decentralised reform process. It was rooted in the local health care organisation and driven by local psychiatric specialists in close cooperation with their clients (the families), and using standard technology. Thus, we claim that different factors were:
i. the acceptance of the adoption and adaptation of the decentralized treatment model (PMT-O). This included the reconciling potential professional and social conflicts.
ii. the establishment of a local development organization with a strong focus on user involvement.
iii. the decision to use the mobile phones and the existing infrastructure, where the users were already part of the installed base, thus to build the application on a technology with which the users were already familiar.
iv. a development approach based on a user-oriented, bottom-up strategy and implementation in a decentralized environment.
According to Hazeltine and Bull (1999) these experiences conform to similar efforts in technology transfer, using an appropriate technology adapted to the local technical, organisational and cultural context. While the project from the outset was strongly linked to a rather centralised organisation and technical platform, being rather strongly institutionalised,
2nd Annual International Interdisciplinary Conference, AIIC 2014, 8-12 July, Azores, Portugal Proceedings, Vol.3
112
the break with these structures cleared the way for a decentralised and simple, but appropriate technical and organisation solution. How can the different elements of an infrastructure influence innovation? The information infrastructure level focuses on technology, platforms, various networks, and so forth. According to Ciborra et al. (2000), the different parts of an infrastructure will be under the control of various stakeholders. We illustrate this by the fact that both the Norwegian Centre for Integrated Care and Telemedicine (NST) and Northern Norway Regional Health Authority (NNRHA) are influenced by various parts of the infrastructure. The project participants decision moving from the secure Norwegian Health Net (NHN) including different technology equipment, to an open mobile platform, led to creating new paths by innovation on mobile telephone technology. When the project participants decided to create new paths by innovation on mobile telephone technology, this path entailed moving from the secure Norwegian Health Net (NHN) including video conference technology, broadband, laptop PCs, etc., to an open mobile platform. Hanseth (2000) claim that development and change are significantly impacted by the way a new infrastructure is designed. Innovation in the technical level contributed towards the implementation of mobile technology, and an application on mobile phones. Tuomi (2002) claims that innovations emerge and become articulated when they are taken into meaningful use in social practice. This ca be defined in the study as the mobile network was in use outside the health service, and the different element in the new technical solution, was developed as simply as possible for the individual user group. Information infrastructures should always be easy and flexible in a way so that it can be shared by many different users, as well as be a resource for the users by making it possible for them to use it as they want, at the same time (Rolland, 2003). The CYP network became an expansion of the mobile phone infrastructure through the rapid building of an installed base through the innovative processes, were various layers and gateways were used. This describe how the new infrastructure was built on the mobile infrastructure. The user groups, by changing the technical platform and work practices, were also able to free themselves of both the technical and organizational frameworks associated with the previously existing platform (NHN). The new installed base in which the users were already integrated thereby became an enabler, since it opened for new generative, technical solutions; it also became easier to integrate add new user groups and to establish a new organizational solutions. This was a stimulant for both a technical and an organizational innovation. This description, illustrate that the role of the installed base corresponds with what Hanseth (2000) and Star and Ruhleder (1996) claim, namely that IIs grow gradually, built/developed on what already exists. The user application level addresses applications, development groups, suppliers, methodology, and techniques for development, standardization, and so forth. Since the installed base is defined as heterogeneous, the user-centered innovation is linked to both social and technical elements. Use of applications, type of technology, new techniques, iterative development, and so forth, based on the user groups' preferences and decisions were important factors in the implementation. Through organizational changes and development of new applications for the mobile solution, users were given a central role in the user development process. This is in line with von Hippel (1988) description of users in innovation processes. The earlier strategy was based on a top-down approach, controlled by the health enterprise management and experts from NCT, which again entailed that it was of an expert-driven nature. However, in the innovation project, the users' co-determination came as a result of the individual users' efforts and the interaction between the users in the organization. Such bottom-up -perspective on innovation is in line with von Hippel, who claims that a new understanding of the users will also happen with observation and
2nd Annual International Interdisciplinary Conference, AIIC 2014, 8-12 July, Azores, Portugal Proceedings, Vol.3
113
communication (1988, 2005). According to Tuomi (2002, p. 10) “(…) if new knowledge has no impact on anyone’s way of doing things – in other words, if it doesn’t make any difference – it is not knowledge. Only when the way things are done change, an innovation emerges (…)”. The organizational level focuses on work practices, services, treatment models, decentralized solutions, people, norms, regulations, statutes, political guidelines and responsibilities. Both the individual user and the decisions and actions of the user groups offered the ability to think in new ways, and to accept new thinking in order to create change. According to Tuomi (2002, p.23) users “develop new uses for existing technological artifacts, at the same time changing both characteristics of these technologies and their own practices”. According to Tuomi (2002) users are central in the social practices, and von Hippel (1988) argues that users are both linked to the organization's environment as well as to important sources of innovation. Use of generative theory shows that user-integrated and iterative development gained widespread acceptance because the users during participatory design were able to design the product and service they desired. This was because the technology was conducive and open to user-centered innovation, and the analysis illustrates that technology seem to have characteristics traits in common with generative technology, since these enable innovation. The focus on users corresponds with von Hippel (2001, p.256), who focuses on the fact that the users often design solutions themselves. Von Hippel (2005, p 21) claims “that the user’s ability to innovate is improving radically and rapidly as a result of the steadily improving quality of computer software and hardware, improved access to easy-to-use tools and components for innovation, and access to steadily richer innovation commons”. And further, this concept illustrates the term ‘user-centred innovation’ and ‘lead users’ in the democratization of innovation (Von Hippel, 2005). Strong user co-determination in the development of the new mobile solution facilitated the new treatment model becoming a part of the installed base. Star and Ruhleder (1996, p.113) claim that any information infrastructures is embedded in a wider social context and has “links with conventions of practice”. This was not a new II, as a mobile network which was used as a basis for this new usage already were in use. Star and Ruhleder (1996, p.113), claim that “Change takes time and negotiation, and adjustment with other aspects of the systems involved. Nobody is really in charge of infrastructure “. Here, the different elements such as the mobile platform, the work practices, the organizational structures, etc., influenced each other, corroborating Ciborra et al., (2000) who emphasized that distribution of responsibility, power and governance in an organization is an important part of the installed base. Star and Ruhleder (1996, p. 4) point out their understanding of and II as a fundamentally relational concept that becomes an infrastructure in relation to organized practice. How can generative technologies help to break with existing organisational and institutional barriers? By thinking simply, small-scale and bottom-up and by taking the user’s needs and premises as a point of departure rather than focusing on advanced technology, an imple-mentation process was made possible. The project became independent in choosing and shaping the new solution. We claim that the new model emerged with a larger potential for creating a new innovation path than would have been the case if it had been linked to the existing structures. Further, it illustrates how user-centered innovation can break with existing power structures through a focus on different layers in the change processes. Mobile technologies, being part of the Sami community infrastructure, allowed the project team and users to bypass organisational and institutional barriers. Based on the first of Zittrain’s aspects of generativity, leveraging of tasks, the existing communication network could only
2nd Annual International Interdisciplinary Conference, AIIC 2014, 8-12 July, Azores, Portugal Proceedings, Vol.3
114
leverage communication only for a limited number of users and for the traditional set of communication technologies. For all practical purposes we can regard the existing NHN as closed for innovation, and thus not particularly generative. The aspect of ease of mastery is also difficult to assess since there was no practical openness to interact with the infrastructure. While it would be available for use by the CYP specialists, it would not be available for technical modifications and tinkering. Even if it had been open for use the adaptations required would have been technically complicated and would have required assistance from technically skilled personnel. The security aspects motivated a cautious progress in these kinds of use areas. When these factors are coupled with a stronger focus on regional and national standardization and centralization of ICT initiatives, we may see that there are internal barriers to innovation initiatives. The lack of openness, flexibility and enabling factors led to an alternative development strategy. It was the fact that the IT department relinquished control and withdrew from the project that left the space wide open for the users’ participation and impact on shaping the solution. The process of development led to the users’ significant role in defining the solution. For instance, the choice of mobile telephones rather than computers as the basic tool enabled user participation. This again led to a technically non-complex application with intuitive usage patterns. The interplay between person and machine in the IT sector, in which the user's perceptions of the technology are emphasized, has long been a subject of discussion (Suchman, 2006). According to Zittrain (2006), there is a need for open systems to ensure the best conditions for development. Through traits of generative technology, solutions are achieved that include openness and thus cater to innovation. By mobilization of the families (patients) own resources, including the network's resources clearly contributed towards better treatment, which also is in line with arguments made by Brennan and Safran, (2003) and Ball and Lillis (2001). The selected mobile telephone technology is shown to have all traits of generativity (Zittrain, 2006). It had accessibility in the way that the teams report that all families were quickly able to use the mobile application, because everyone was already familiar with using a mobile phone. Secondly, the mobile phone technology is easy to use for families who are active in the primary industries, such as in fishing, rendering, and agriculture. It has adaptability since the mobile technology was easily modified for new purposes. The ease of use of the mobile phone technology in the project was high. There were no technical problems. All the participating families were able to use the specially designed application to fill in the schema with the points for behavior. The leverage of the mobile phone technology was limited by the centralized model of NHN. The mobile solution stands outside the existing infrastructure and has worked well during the test period. In terms of leverage, however, the solution needs to be integrated in the existing infrastructures, including NHN, if healthcare workers and their organisations want to develop and implement new tasks with this technology. The criterion of transferable, the result of skilled users’ adaptations can be easily conveyed to others less-skilled. The five characteristics of a generative technology do not, ask specific questions about the ‘cultural infrastructure’ and how this affects the accessibility, adaptability, ease of mastery, leveraging of a technology its transferability. This is in line with Zittrain’s (2006) characteristics of generativity. Tuomi (2002) argues that by viewing the users as active participants in the innovation process rather than to regard them as passive consumers of the process, you get a different focus. Christensen and Bower point out that innovation involves changes in technology (1996). The choice to develop a separate application as support for a variant of the PMT-O method was made on the basis of the existing method's paper schema. This is in line with Church and Whitten (2009), who describe how users enable technology conductive to their own utilization. The new solution is planned to include a Sámi interface. The generativity of the mobile technology was not only affected by the invisibility of culture
2nd Annual International Interdisciplinary Conference, AIIC 2014, 8-12 July, Azores, Portugal Proceedings, Vol.3
115
in the current technology design. The effects of that invisibility continue in the new iteration of the technology design. In this, particular choices, in this case the lack of Sami language interface, may have effects that will continue to influence the generativity of the new version of the mobile technology, even if the interface now will be available in both Norwegian and Sami. How can generative technologies help building open and enabling Information Infrastructures? In both the technical, organizational and institutional contexts, there's a variety of stakeholders, resources and interests. One does not always have full control over what is needed for a user-centered innovation in the health sector to succeed in areas such as technology and organization, because knowledge and relations within the area often lie outside the health sector's sphere of activity. The inclusion of users through participation in projects is an innovative way to conceive of further development of services (Andersen & Jansen 2012). Miller and Morris (1999), acknowledge an appreciation of knowledge as part of the process of creating new products and processes. von Hippel (1998) introduces the term “sticky information” to describe information that is expensive to obtain, transmit and employ in another location than where it originated. Damsgaard et al. (1994), points out that technological innovations show that they must be understood as networks and are socially constructed. They must not be regarded as if they occur in homogeneous and socially stable or included in independent samples. Path dependence and path creation thus present different perspectives on innovation processes. The analysis below addresses the challenge of overcoming existing thinking (path dependency), and thereby trigger of new thinking (path creation). Path dependency in the present study is associated with existing ways by which to offer health services through the NHN infrastructure. By using the path creation perspective, a certain type of development was generated that represented a break with this socio-technical structure and thereby contributed to creating an alternative technical platform and a new way by which to offer health services. Based on this, path creation processes can be seen as proactive innovation. This is consistent with Garud and Karnøe (2001, p.2) who claim that: “In our view, entrepreneurs meaningfully navigate a flow of events even as they constitute them. Rather than exist as passive observers within a stream of events, entrepreneurs are knowledgeable agents with capacity to reflect and act in ways other than those prescribed by existing social rules and taken-for-granted technological artefacts”. Henfridsson et al. (2009) points to the reciprocal nature of path creation and path dependencies that are reflected in actors’ ongoing enactment of existing structures. Use of a multi-layered perspective contributes to new understanding of user-centered innovation and may help in understanding the innovation processes leading to the development of a new technical solution, and corresponding organizational change processes in health care provision. Hanseth and Lundberg (2001), introduce “work oriented infrastructures”, which in this study are the strategy in user involvement by handling the installed base as socio-technical and heterogeneous. According to Hanseth (2002) an installed base is likely to be resistant to change because of the routinized and embedded social practice and technical systems. In my case, the existing installed base and the suggestion to use videoconference facilities was linked to a specific type of organization. Hanseth (2002, p.7) points out that “When an infrastructure is changed or improved, each new feature added to it, or each new version of a component replacing an existing one, has to fit with the infrastructure as it is at that moment. Related to this study, the innovation process reveals the different socio-technical elements in the already existing structures, which include different organizational structures, work practices, formal procedures for the employees in the health organization, people (health care workers, families etc., competences) etc.

2nd Annual International Interdisciplinary Conference, AIIC 2014, 8-12 July, Azores, Portugal Proceedings, Vol.3
116
Summary The aim of this paper has been to give a deeper understanding of the connection between infrastructures and user-centered innovation. By examine what roles the various level of an information infrastructure play in the innovation processes, implying a complex interplay between technical, organizational and institutional factors. Theory of information infrastructures is used as a frame of reference for analysing what enables or constrains user-driven innovation processes within a complex organizational context. With concepts of path creation and generativity, this study aims at understanding the interaction between technical, organizational and institutional factors in user-centered development processes. By applying a multilayer perspective in the analysis of the innovation process, the analysis shows how various elements in the installed base can influence the innovation process in a complex organizational context. The analysis shows how an installed base either may enable or constrain the innovation processes, illustrating the interrelationship between technical solutions, the organizational and institutional, legal components, users and their uses. The study shows thus that user-centered innovation can be a rational driving force for meeting the challenges faced by organizations in the change processes, and that the strategic foundation of radically new ways by which to deliver health services can be robust. References: Andersen, S.T. & Riise, R. 2012:Hvilken IKTkompetanse bør en helsearbeider ha? Blix, Anderssen & Størdal (red) Helse.Digital,Cappelen Damm AS, ISBN 978-82-02-35020-8 s.66–93 Andersen, S.T. and Jansen, A. (2012).Installed base as a facilitator for user-driven innovation? How user innovation can challenge existing institutional barriers. International Journal of Telemedicine and Applications. ISSN 1687-6415. 2012. doi: 10.1155/2012/673731 Arthur, B.W.(1989). Competing Technologies, Increasing Returns, and Lock-In by Historical Events. The Economic Journal, 99(394), 116-131.doi:10.2307/2234208. Ball, M., and Lillis, J. (2001). E- health: transforming the position/patient relationship. International Journal of Medical Informatics 61: 1 - 10. Brennan, P., and Safran, C. (2003). Report of conference track 3: patient empowerment. International Journal of Medical Informatics 69: 301-304. Bygstad, B. (2010). Generative mechanisms for innovation in information infrastructures. Journal Information and Organization, Volume 20, Issue 3-4, July, 2010. Chesbrough, H. (2003). Open Innovation: The New Imperative for Creating and Profiting from Technology, Boston, Harvard Business School Press. Christensen, C. M., and Bower, J. L. (1996). Customer power, strategic investment, and the failure of leading firms. Strategic Management Journal,17, 197–218. Church, L. and Whitten, A. (2009). Generative Usability: Security and User Centered Design beyond the Appliance, in NSPW Proceedings 2009. Available at http://www.nspw.org/papers/2009/nspw2009- church.pdf, accessed 10 Januar, 2009. Ciborra, C. et al (2000). From Control to Drift: The Dynamics of Corporate Information Infrastructures. Oxford University Press: Oxford. Damsgaard, J., Rogaczewski, A. and. Lyytinen, K (1994). How Information Technologies Penetrate Organisations. An Analysis of Four Alternative Models. I Levine (red.) Diffusion,transfer and Implementation of Information Technology North Holland, 1994. David, Paul A. (1985). Clio and the Economics of QWERTY. American Economic Review,75(2): 332-337.

2nd Annual International Interdisciplinary Conference, AIIC 2014, 8-12 July, Azores, Portugal Proceedings, Vol.3
117
Garud, R., and Karnøe, P. (2001). Path Creation as a Process of Mindful Deviation. R. Garud, P. Karnøe, (Eds). Path Dependence and Creation. Lawrence Erlbaum Associates, Mahwah, New Jersey, 1-38. Garud, R., and Karnøe, P. (2003). Bricolage versus Breakthrough: Distributed and Embedded Agency in Technology Entrepreneurship. Research Policy 32(2) 277-300. Greenwood, D. J. and Levin, M. (1998) Introduction to Action Research: social research for social change, Thousand Oaks, Sage Publications. Greenwood, D. J. and Levin, M. (2007) The praxis of educating action researchers: The possibilities and obstacles in higher education, Action Research, 2007; 5; 219, DOI: 10.1177/1476750307081014. Hanseth, O. (2000). The Economics of Standards. C. Ciborra, K. Braa, A. Cordella, B. Dahlbom, Failla, O. Hanseth, O., Monteiro, E. and Hatling, M. (1996). Developing information infrastructure: the tension between standardization and flexibility. Science, Technology and Human Values, 21,pp.407- 426. Hanseth, O., and Monteiro, E. (1998). Understanding Information Infrastructure. Manuscript. Available at URL: http://heim.ifi.uio.no/~oleha/publications/bok.pdf (Accessed February 2009). Hanseth, O. and Monteiro, E.,(1996). Navigating future reseach: judging the relevance of information systems development reseach. Accounting, Management and Information Technologies. 6(1/2):77 - 85. Hanseth, O. and Lundberg. N. (2001). “Designing Work Oriented Infrastructures”. Computer Supported Cooperative Work (CSCW), vol. 10, nr. 3-4, s. 347-372. Hanseth, O. (2002). From systems and tools to networks and infrastructures - from design to cultivation.Towards a theory of ICT solutions and its design methodology implications. Working paper, University of Oslo. Hanseth, O. and Aanestad, M. (2003). Bootstrapping networks, communities and infrastructures: On the evolution of ICT solutions in healthcare: Methods of Information in Medicine, 42, 385-391. Hanseth, O. and Lyytinen, K. (2010). Design theory for dynamic complexity in Information Infrastructures: The case of building Internet”, Journal of Information Technology, vol. 25, nr. 1, s. 1-19. Hanseth, O (2010). From Systems and Tools to Networks and Infrastructures - from Design to Cultivation:Towards a design Theory of Information Infrastructures., In Jonny Holmstrøm (ed.), Industrial Informatics design, Use and Innovation.. IGI Global. ISBN 978-1-61520-692-6. 11. s 122 – 156. Hazeltine, B., and Bull, C., (1999), Appropriate technology: Tools, choices, and implications. San Diego, CA: Academic Press. Henfridsson, O., Yoo, Y. and Svahn, F. (2009). Path Creation in Digital Innovation: A Multi-Layered Dialectics Perspective, Viktoria Institute, Sweden . Sprouts:Working Papers on Information Systems, 9(20). http://sprouts.aisnet.org/9-20, Jansen, A. and P. Nielsen (2005). Theorizing convergence: Co-evolution of information infrastructures. Scandinavian Journal of Information systems Vol 17:1 ISSN 0905-0167. pp. 67–100. Kvale, S., (1997). Det kvalitative forskningsintervju. Ad Notam Gyldendal. Malterud, K., (2001). Qualitative research: Standards, challenges, and guidelines. Lancet 2001; 358: 483–88 ISI Mathiassen, L., (2002). Collaborative Practice Research. Information, Technology & People, Vol. 15, No. 4, 2002. pp. 321-345 Copyright © MCB University Press ISSN 0959-3845.

2nd Annual International Interdisciplinary Conference, AIIC 2014, 8-12 July, Azores, Portugal Proceedings, Vol.3
118
Miller, W.,L and Morris, L.(1999). Fourth Generation R & D: Managing Knowledge, Technology and Innovation, John Wiley & Sons, Inc., Canada, 1999. Myers, M. D. (1997b). Interpretive research methods in information systems. In J. Mingers & F. Stowell (Eds), Information Systems: An Emerging Discipline (pp. 239–66). London: McGraw-Hill. Myers, M. D. and Avison, D. E. (2002). An Introduction to Qualitative Research in Information Systems, Sage, ss.3-12. Postholm, M.B. (2005) Kvalitativ metode [Qualitative methodology]. Oslo. Norway. Universitetsforlaget Repstad, P. (1998). Mellom nærhet og distanse: kvalitative metoder i samfunnsfag. Oslo, Universitetsforlaget Rolland, KH. (2003).Re-inventing Information Infrastructures in Situated Practices of Use: An interpretive Case Study of Information Technology and Work Transformation in a Global Company, PhD Thesis, University of Oslo. Star, S.L. and Ruhleder, K. (1996). Steps Toward an Ecology of Infrastructure: Design and Access for Large Information Spaces. Information systems research, 7 (1):111-134. Suchman, L. (2006). Wajcman confronts cyberfeminism. Social Studies of Science. Tiller, T., (1999). Aksjonslæring - forskende partnerskap i skolen. Kristiansand, Høyskoleforlaget. Tiller, T., (2004). Aksjonsforskning i skole og utdanning. HøyskoleForlaget, Kristiansand, Norway, Norwegian Academic Press. Thagaard, T. (2004). Systematikk og innlevelse. En innføring i kvalitativ metode, 2 ed, Fagbokforlaget. Tuomi, I (2002). Networks of Innovation – Change and meaning in the Age og the Internet, Oxford University Press, 2002. Van de Ven, A. H., Polley, D. E., Garud, R., and Venkataraman, S. (1999). The Innovation Journey. Oxford: Oxford University Press. Von Hippel, E. (1988). Sources of Innovation, Oxford, Oxford University Press. von Hippel, E. (2001). User Toolkits for Innovation. New Journal of Product Innovation Management 18(4):p247-257. Von Hippell, E. (2005). Democratizing Innovation: http://web.mit.edu/evhippel/www/books.htm von Hippel, E., and Tyre, M. J. (1995). How learning by doing is done: problem identification in novel process equipment. Research Policy, 24(1), 1-12. doi: 10.1016/0048-7333(93)00747-H . Walsham, G. (1993). Interpreting Information Systems in Organizations. Chichester: Wiley and Sons, New York, USA. Walsham, G. (2002).Interpretive Case Studies in IS Research: Nature and Method, Sage, ss. 101–113. Zittrain, J. (2006). The Generative Internet. Harward Law Review, 119 (May).Downloaded from: http://eecs.harvard.edu/qr48/jzgenerativity.pdf on November 4th, 2007.
2nd Annual International Interdisciplinary Conference, AIIC 2014, 8-12 July, Azores, Portugal Proceedings, Vol.3
119
TECHNOLOGY ADOPTION USING MEDICAL IMAGE PROCESSING TOOLS IN GLOBAL HEALTH SECTOR
DEVELOPMENT
Dr. Venkatesh Jaganathan Associate Prof., Anna University, Regional Centre Coimbatore, Tamilnadu, India
Thenmozhi Srinivasan Gnanamani College of Technology, AK Samuthiram, Pachal, Tamilnadu, India
Dr. Balasubramanie Palanisamy Kongu Engineering College, Perundurai, Tamilnadu, India
Priyesh Cherurveettil Part Time Research Scholar, Anna University, Regional Centre Coimbatore, India
Aarthy Chellasamy Full Time Research Scholar, Anna University, Regional Centre Coimbatore, India
Dr. T. Suganthalakshmi Assistant Professor, Anna University, Regional Centre Coimbatore, Tamilnadu, India
Abstract Medical Imaging is a major development in the field of medicine for past 100 years. The tool helps the physicians not only to detect the diseases but also the intensity of the disease can be captured. The paper discusses about the prevailing health system and insurance schemes, the treatment facilities for disease like cancer. The availability of medical imaging tools like x-ray, mammogram, ultrasound, CT and MRI scans and its innovations for the public health diagnosis the diseases in various methods with the aid of modern machines and techniques. The techniques vary in terms of cost, methodology in detecting the diseases and even the accuracy. The people could not continue the treatment because of high cost and sometimes scarcity of medicines. As the treatment are costlier irrespective of various classes of people approach the social security organizations and because of continuous usage the equipments worn out. Though these tools are considered as boon in the field of medical imaging each has its own drawback. The result of the paper states that the physicians can detect the early stage of disease with the aid of these tools and can come up with treatment that will avoid serious health issues or sometimes death. Also the government of concern country is responsible for all the public and seek opportunity for developing health sector often.
Keywords: Medical imaging, insurance, refurbishing products, image intensity, global health sector Introduction In this world everyone wish to lead a happy, contented and healthy life. The Ministry of health is responsible for all the public and private sector activities related to health, but many countries differs from one other by combining the medical education with ministry of health. Because of this integration there arise many disputes and still the arguments for integration remain unsolved. Though there is chaos the people in the country are well protected under health insurance system. Various insurers (Fig.1) like social security

2nd Annual International Interdisciplinary Conference, AIIC 2014, 8-12 July, Azores, Portugal Proceedings, Vol.3
120
organizations, medical service insurance organizations, military personnel insurance organizations, benefit the employees of private sector, public sector, military and uninsured poor respectively. Latest survey of WHO states that cancer is the third deadly disease after cardiovascular diseases and unintended accidents and it is also the pervasive disease. The most widespread cancers in are gastric cancer in men and breast cancer in women [14]. Countries has their own cancer curing centre’s and the government offer grant for its healing, but rapid growth of this disease and increasing cost in other hand has made governmental support futile, particularly because of the inflation treatment system of these centers and hindered their development [13]. Technology offers many equipments and services and medical imaging tool is one such field which diagnosis and give early treatment to the patients. The story of medical imaging started while Wilhelm Rontgen finds out x-ray which paved the way for number of medical imaging applications and various innovators in this field. In 1895, Wilhelm Rontgen was testing with ejection of electrical current in ‘Crookes’ tube, he noticed that barium platinocyanide screen was glowing though it is placed inside the cardboard. During the experiment he observed that strange rays passed through his hand and captured outline of his bones in the screen [8].
Fig. 1 Types of Insurers Medical Imaging is the method and procedure used to produce images of the human body for medical procedures in quest to disclose, analyze, or scan ailment to afford treatment. The major tests that are used in medical imaging are MRI (Magnetic Resonance Imaging), CT (Computed Tomography) scans, ultrasound, mammography, x-rays, and nuclear medicine studies [2]. The usage of technical computer aided equipments for the purpose of observation, documentation and early precautions are vital features that are recognized for day to day activities in the hospitals. These equipments and various tests support the hospitals for diagnosing the patients and for appropriate medication. The CT scans, MRI’s, ultrasound, mammography, x-rays are the different testing techniques used for the diagnosis of patients. The scanning is a method of testing that combines with x-ray devices and computers to capture multiple images of the body for diagnosing and treatment. These scans produce cross sectional view of the organs and blood vessels that are for study. So once the tests are finished the images can be printed or stored in a CD. A small controlled amount of X-ray is being passed through the body and thus various parts absorb the radiation at various rates and the image of the body is captured when film rays are exposed to absorb these rays. Methods/Various Medical Imaging Tools X-Rays The X-rays are two dimensional images that are widely used to spot early stage of cancer in chest or lungs or other areas of the ribs. These are also called as radiographs and many techniques came in advance with modern techniques and equipments. Mammography In recent days many women come across the deadly breast cancer and mammogram is a technique used to diagnose the tumors in such areas. The mammography technique is capable enough to detect the changes before a patient or doctor suspects for cancer or any
Social security Organization
Medical service Insurance Organization
Military Personnel Organization
Emdade-Emam Organization
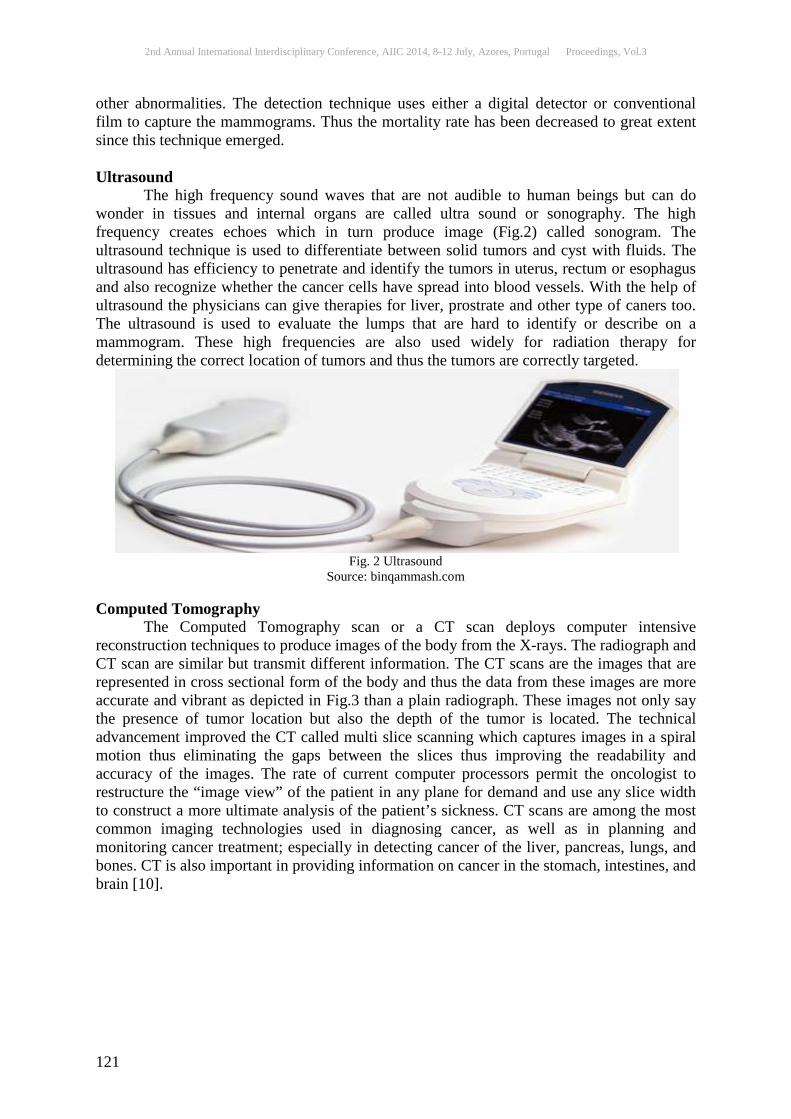
2nd Annual International Interdisciplinary Conference, AIIC 2014, 8-12 July, Azores, Portugal Proceedings, Vol.3
121
other abnormalities. The detection technique uses either a digital detector or conventional film to capture the mammograms. Thus the mortality rate has been decreased to great extent since this technique emerged. Ultrasound The high frequency sound waves that are not audible to human beings but can do wonder in tissues and internal organs are called ultra sound or sonography. The high frequency creates echoes which in turn produce image (Fig.2) called sonogram. The ultrasound technique is used to differentiate between solid tumors and cyst with fluids. The ultrasound has efficiency to penetrate and identify the tumors in uterus, rectum or esophagus and also recognize whether the cancer cells have spread into blood vessels. With the help of ultrasound the physicians can give therapies for liver, prostrate and other type of caners too. The ultrasound is used to evaluate the lumps that are hard to identify or describe on a mammogram. These high frequencies are also used widely for radiation therapy for determining the correct location of tumors and thus the tumors are correctly targeted.
Fig. 2 Ultrasound
Source: binqammash.com Computed Tomography The Computed Tomography scan or a CT scan deploys computer intensive reconstruction techniques to produce images of the body from the X-rays. The radiograph and CT scan are similar but transmit different information. The CT scans are the images that are represented in cross sectional form of the body and thus the data from these images are more accurate and vibrant as depicted in Fig.3 than a plain radiograph. These images not only say the presence of tumor location but also the depth of the tumor is located. The technical advancement improved the CT called multi slice scanning which captures images in a spiral motion thus eliminating the gaps between the slices thus improving the readability and accuracy of the images. The rate of current computer processors permit the oncologist to restructure the “image view” of the patient in any plane for demand and use any slice width to construct a more ultimate analysis of the patient’s sickness. CT scans are among the most common imaging technologies used in diagnosing cancer, as well as in planning and monitoring cancer treatment; especially in detecting cancer of the liver, pancreas, lungs, and bones. CT is also important in providing information on cancer in the stomach, intestines, and brain [10].

2nd Annual International Interdisciplinary Conference, AIIC 2014, 8-12 July, Azores, Portugal Proceedings, Vol.3
122
Fig. 3 Computer Tomography
Source: BatteryPark.Tv Magnetic Resonance Imaging Magnetic Resonance Imaging (MRI) uses radio frequency (rf) waves where the strong magnetic field is passed through the MRI machine where the patient lies thus the tissues emit the radio waves of their own with the help of the radio frequency. Based on their chemical composition the tissues and tumors emit signals and thus the pictures of the organs can be restructured and displayed. The functioning of MRI and CT scans is similar but the MRI scans differentiates well about the structure of soft tissues. The MRI detects the caner well in the area of head, neck, bone and muscles [1] and it is also useful for determining the status of tumor and the response of the patient for treatment can be evaluated [9]. The sample image is shown in Fig.4.
Fig. 4 Magnetic Resonance Imaging
Source: howstuffworks.com Results and Discussions The study reveals some unexpected results that majority of the patients stop the treatment in the middle because they couldn’t bare such cost of treatment. They also face both psychological and financial problems and even they were in debt. Though government helps the patients with insurance policies many not cover all the medicine schemes and sometimes lack of purchase of the medicines became scarce in the market. As the costs of medicines are high the patients do not prefer to go for private centre’s and due to this the centre’s are closed mostly [13]. So majority of the people irrespective of high/low/middle class approach the social work centre’s creating huge crowd leading to lag of medicines. Also the physicians who work all through the day to manage the crowd are much worried about the overloading of machines [13]. The separate rooms for radiotherapy were built with high cost now remains as store room for the worn out devices and purchase of new devices are
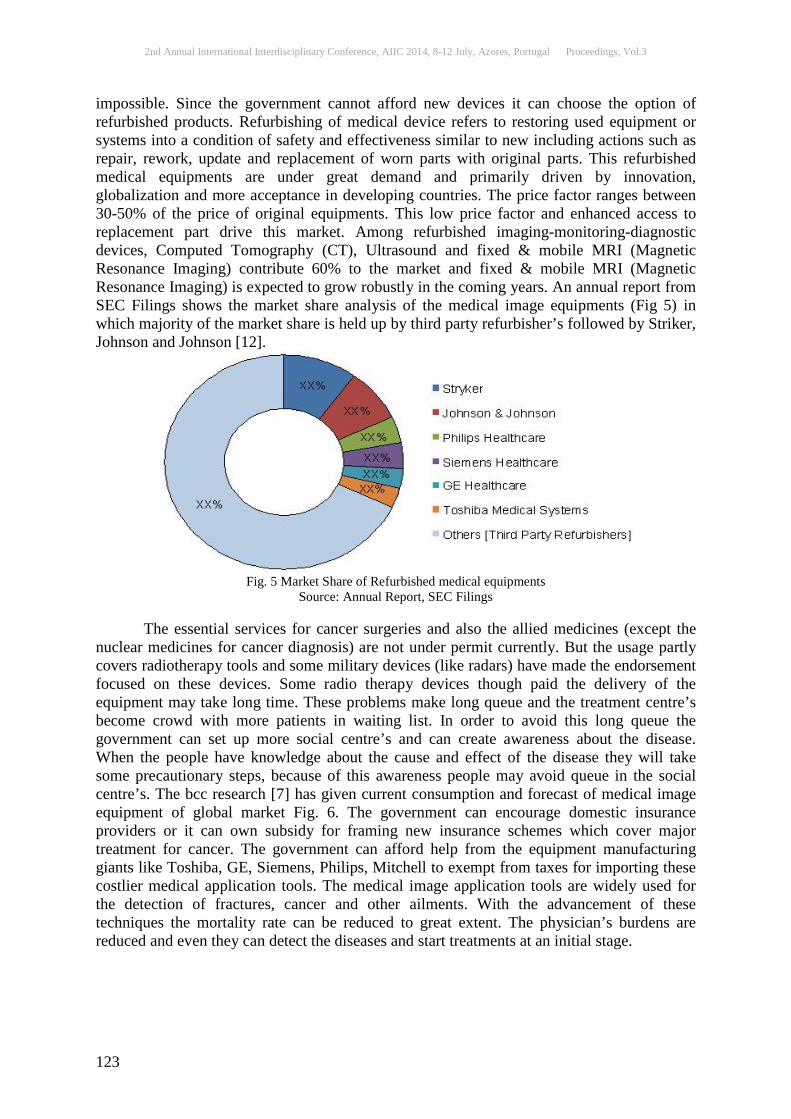
2nd Annual International Interdisciplinary Conference, AIIC 2014, 8-12 July, Azores, Portugal Proceedings, Vol.3
123
impossible. Since the government cannot afford new devices it can choose the option of refurbished products. Refurbishing of medical device refers to restoring used equipment or systems into a condition of safety and effectiveness similar to new including actions such as repair, rework, update and replacement of worn parts with original parts. This refurbished medical equipments are under great demand and primarily driven by innovation, globalization and more acceptance in developing countries. The price factor ranges between 30-50% of the price of original equipments. This low price factor and enhanced access to replacement part drive this market. Among refurbished imaging-monitoring-diagnostic devices, Computed Tomography (CT), Ultrasound and fixed & mobile MRI (Magnetic Resonance Imaging) contribute 60% to the market and fixed & mobile MRI (Magnetic Resonance Imaging) is expected to grow robustly in the coming years. An annual report from SEC Filings shows the market share analysis of the medical image equipments (Fig 5) in which majority of the market share is held up by third party refurbisher’s followed by Striker, Johnson and Johnson [12].
Fig. 5 Market Share of Refurbished medical equipments
Source: Annual Report, SEC Filings The essential services for cancer surgeries and also the allied medicines (except the nuclear medicines for cancer diagnosis) are not under permit currently. But the usage partly covers radiotherapy tools and some military devices (like radars) have made the endorsement focused on these devices. Some radio therapy devices though paid the delivery of the equipment may take long time. These problems make long queue and the treatment centre’s become crowd with more patients in waiting list. In order to avoid this long queue the government can set up more social centre’s and can create awareness about the disease. When the people have knowledge about the cause and effect of the disease they will take some precautionary steps, because of this awareness people may avoid queue in the social centre’s. The bcc research [7] has given current consumption and forecast of medical image equipment of global market Fig. 6. The government can encourage domestic insurance providers or it can own subsidy for framing new insurance schemes which cover major treatment for cancer. The government can afford help from the equipment manufacturing giants like Toshiba, GE, Siemens, Philips, Mitchell to exempt from taxes for importing these costlier medical application tools. The medical image application tools are widely used for the detection of fractures, cancer and other ailments. With the advancement of these techniques the mortality rate can be reduced to great extent. The physician’s burdens are reduced and even they can detect the diseases and start treatments at an initial stage.
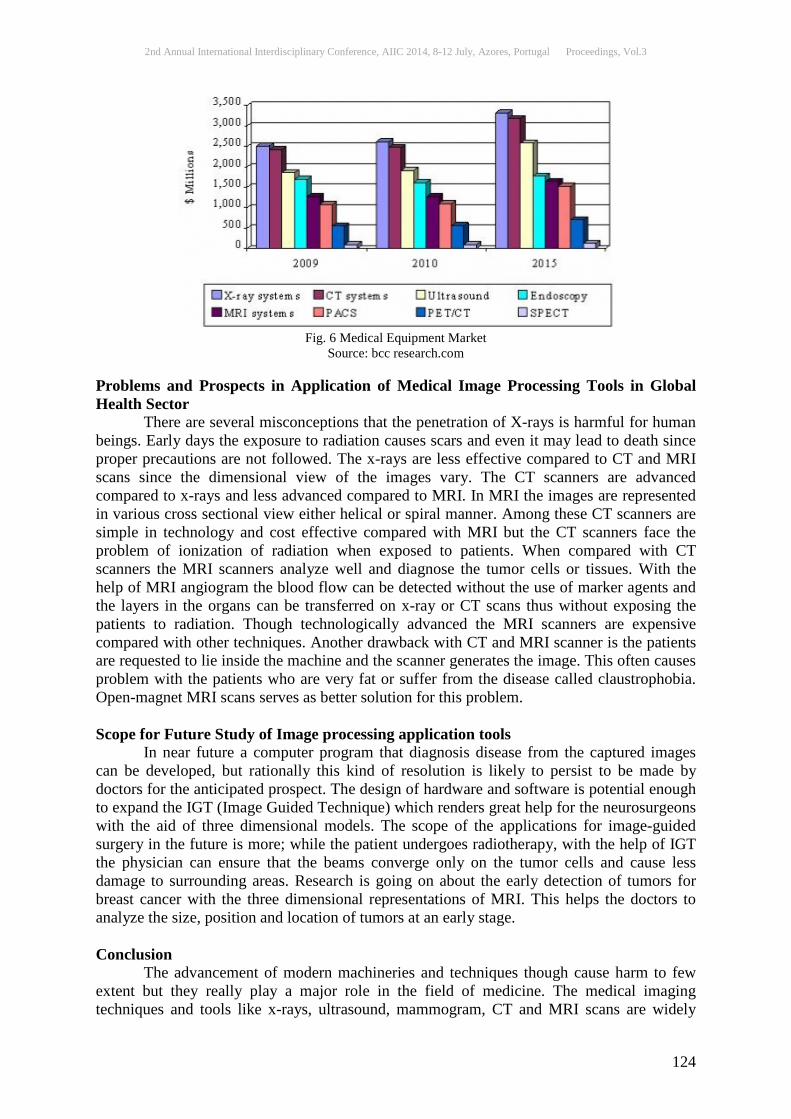
2nd Annual International Interdisciplinary Conference, AIIC 2014, 8-12 July, Azores, Portugal Proceedings, Vol.3
124
Fig. 6 Medical Equipment Market
Source: bcc research.com Problems and Prospects in Application of Medical Image Processing Tools in Global Health Sector There are several misconceptions that the penetration of X-rays is harmful for human beings. Early days the exposure to radiation causes scars and even it may lead to death since proper precautions are not followed. The x-rays are less effective compared to CT and MRI scans since the dimensional view of the images vary. The CT scanners are advanced compared to x-rays and less advanced compared to MRI. In MRI the images are represented in various cross sectional view either helical or spiral manner. Among these CT scanners are simple in technology and cost effective compared with MRI but the CT scanners face the problem of ionization of radiation when exposed to patients. When compared with CT scanners the MRI scanners analyze well and diagnose the tumor cells or tissues. With the help of MRI angiogram the blood flow can be detected without the use of marker agents and the layers in the organs can be transferred on x-ray or CT scans thus without exposing the patients to radiation. Though technologically advanced the MRI scanners are expensive compared with other techniques. Another drawback with CT and MRI scanner is the patients are requested to lie inside the machine and the scanner generates the image. This often causes problem with the patients who are very fat or suffer from the disease called claustrophobia. Open-magnet MRI scans serves as better solution for this problem. Scope for Future Study of Image processing application tools In near future a computer program that diagnosis disease from the captured images can be developed, but rationally this kind of resolution is likely to persist to be made by doctors for the anticipated prospect. The design of hardware and software is potential enough to expand the IGT (Image Guided Technique) which renders great help for the neurosurgeons with the aid of three dimensional models. The scope of the applications for image-guided surgery in the future is more; while the patient undergoes radiotherapy, with the help of IGT the physician can ensure that the beams converge only on the tumor cells and cause less damage to surrounding areas. Research is going on about the early detection of tumors for breast cancer with the three dimensional representations of MRI. This helps the doctors to analyze the size, position and location of tumors at an early stage. Conclusion The advancement of modern machineries and techniques though cause harm to few extent but they really play a major role in the field of medicine. The medical imaging techniques and tools like x-rays, ultrasound, mammogram, CT and MRI scans are widely

2nd Annual International Interdisciplinary Conference, AIIC 2014, 8-12 July, Azores, Portugal Proceedings, Vol.3
125
used for detection of cancer cells and diseases related to bones, brain, lungs, pancreas and other internal organs. These medical imaging tools has both positive and negative effect as ionizing of radiation are of great harm to other cells of the body. These treatment with the aid of these techniques are little costlier but it saves lives if the detection of disease is at early stage. The paper concludes by stating that it is in the hand of government to take necessary steps to fill the need for this image application equipment by adopting refurbishment method also the people can be best served with various insurance schemes which cover medical services for costlier medicine and at the same time the need for creating awareness among public is also must which will greatly reduce the effect of disease with this medical image application equipments. References: American Cancer Society, Available from <http:// www.cancer.org/doctoot/PED/content/PED_2_3X_Imaging_Radiology_Tests.asp?siteare=PED> , 2006. Center for Imagig Sciencce, Available form< http://www.cis.rit.edu/htbooks/mri/inside.html>. Eric,Grimson, Kikinis, Jolesz, Black, Image Guided Surgery, Scientific American Article, 1999. http://www.imaginis.net/ct-scan. http://www.eos.ncsu.edu/bae/research/blanchard/www/465/textbook/imaging/projects/MRI/. http://www.starfighter.acornarcade.com/mysite/articles/aiessay.html. http://www.bccresearch.com/market-research/healthcare/imaging-oncology-diagnostics-hlc074a.html. Medical Imaging in Cancer Care: Charting the Progress, report by US oncology, Available from<http://www.healthcare.philips.com/pwc_hc/us_en/about/Reimbursement/assets/docs/cancer_white_paper.pdf> 2006. MD Prados. Primary Central Nervous System Tumors: Advances in Knowledge and Treatment. CA-A Cancer Journal for Clinicians1998; 48: 331-360, 2008. Marc Liebeskind, The Park Avenue Radiologist: The Right Medical Imaging for your Cancer, Partk Avenue Radiologist. Available from <http://www.parkavenueradiologists.com/blog/park-avenue-radiologists-the-right-medical-imaging-for-your-cancer.aspx>, 2013. Ramin Mehardad, Health system in Iran. JMAJ 52 (1): 69-73, 2009. Refurbished Medical Equipments & Devices Market: Global Trends & Forecasts to 2017 marketsandmarkets.com. Available from <http://www.marketsandmarkets.com/Market-Reports/refurbished-medical-devices-market-770.html>, 2012. The Impact of Sanctions on the Iranian People’s Healthcare System, A report by International Institute for Peace, Justice and Human rights. Available from: <http://www.globalresearch.ca/the-impact-of-sanctions-on-the-iranian-peoples-healthcare-system/5354773>, 2013. WHO Statistical Information System (WHOIS) report. Available from: <http://www.who.int/whosis/en/>, 2011.
2nd Annual International Interdisciplinary Conference, AIIC 2014, 8-12 July, Azores, Portugal Proceedings, Vol.3
126
CHILDHOOD OBESITY IN THE UNITED STATES OF AMERICA
Ezzeldin R. Aly, PhD Assistant Professor, of Health and Movement Science & Sport Manageemnt .
Graceland University
Abstract
Obesity in the U.S. is a problem that is beginning to grow large in our children’s lives. The solution to this problem is centered in three areas; the help of the community, health education, and consumer education. The two main factors casing childhood obesity is eating high fat, high protein foods along with a serious sedentary lifestyle.
Keywords: Obesity, US
Introduction Childhood obesity in the United State is a rising epidemic, a serious health crisis, and is steadily increasing because it seems that people refuse to change for the good of the nation. Since the last decade the percentage of children being obese has increased steadily. The cause of this is a poor nutrition and physical activity and the plan is to get back to how it used to be, if not better. Children in the U.S. are eating more processed foods at home and there is less physical activity and sports at school. While children are developing bad habits when they are young, they are likely to turn into an adult who is obese and has bad habits. This is a serious issue that needs the attentions of everyone, including government, researchers, media, schools, public health officials, and parents. Literature Review Excellence is something strived for and the obesity epidemic in the U.S. is not the right example for it but according to Lavizzo-Mourey (2004) whose decision is it for someone being sick, the people within a system or the people running the system? Obesity of children is not a program but it is becoming such a problem that actions need to be made soon for the next generation to have a chance. The lifestyle of our culture has a huge effects on us without us knowing so we have to watch diligently what we are consuming and promoting as a nation. When a child cannot run and play along with other activities it is because the government is cutting it out of schools here in the U.S. This is happening in grades kindergarten to fifth grade. It seems like when a nation stops physical activity that helps the obesity epidemic causing the child develop inefficiently. Role playing at recess is effective in developing a child’s ability to be social, and develop mentally and physically. In correlation to the mind body and spirit we all need the fuel which is food to keep moving. According to Wallingtion (2010) the farms that keep the cattle and feed it to us meat eaters so we can get the proper nutrition such as protein and minerals we need for our bodies has been tampered with. U.S. calorie intake has nearly doubled and tripled from 1985 to 2000; and the worst part about all of it is that the USDA knows Americans are consuming too much but will not stop it because of the money that is being made from it farms aren’t what they use to be many are factory owned nowadays and the real farmers are retiring early because the government gives

2nd Annual International Interdisciplinary Conference, AIIC 2014, 8-12 July, Azores, Portugal Proceedings, Vol.3
127
them that much money to do so. It has been stated that the USDA is starting up programs to help the fight against the obesity epidemic. According to Hawkins & Linvill (2010) teenagers in the U.S. in 2005 compared to 1979 have increased the childhood obesity rate by 300%. The parents are working more hours than ever before trying to make ends meet, and through that process children are not getting appropriate nutrition they need in order to be successful. Health care problems are on the high because of pure lifestyle from the children who are suffering from being obese. Their sedentary way of living six to seven hours of activities watching television, playing video games, and being victim to the food product commercials that they show during the commercial breaks. This lifestyle they are involved with does not help with the pressure of their peers who supposed to engage them with encouragement but instead for the most part they talk down to the overweight or obese individual. So educators need to encourage diet and exercise which hopefully will build this persons self-confidence to the point where they can influence others to do the same. Encouraging someone who does not have great self-esteem or cannot move as well will take them a while before they will have a nice mind set along with the body, but eventually they will feel comfortable with the person they know they are inside. According to David (2007) we all need to exercise and diet to beat obesity, but for the most part if an adult is overweight or obese their children will be more than likely over weight and obese. Meaning our country is getting fatter and sicker the older this country gets without proper diet and physical activity. Some people do not want to indulge in physical activity because they feel embarrassed working out in a gym with a bunch of people that could be potentially watching them. Now if you were in the weight room or aerobics room for the first time and no one is trying to help you for the most part you will get down and not want to ever work out at all. When this is happens people get depressed and they normally create bad habits and problems that evolve from there change. According to Adams (2010) all we need to do is take some deep breaths and do what we all normally do which is walk. This can be done by children and adults. If we all walk every day for an additional hour or two this would make a difference in our everyday giving us energy back that we lost. And staying from junk foods is something that we need to do also. It always go back to the same thing: if you want to change something such as being overweight we must change our diets and their physical activity. Watching T.V. and playing video games is ok for a small amount of time as an activity for you to do, however, we cannot let the future leaders of this country b victimized to the television set. The U.S. is at a dilemma the research shows we have a lot of things we can do to stop obesity to our offspring, but the question is will that be profitable? So the government is not going to shut down things that can help us to be fit because there is a money tie that they do not want to break. Instead of breaking that means for the people in the U.S. the government would rather keep their money. These things happen we just need to make sure what is going on with the demographics. According to Yvette (2008) the U.S. has made a dramatic increase in childhood obesity in the past twenty years. And in more details the two ethnic groups that is the highest on obesity would be African American children and Hispanic children. While white kids and Asian kids are at the low end of being overweight and or obese they have a leg up because of the environment they live in which is more than likely for the minorities to be high income instead of low income. The status where you are at can make you more likely to be stressed out having hypertension, diabetes and sleep apnea living in a low-income area within the U.S. The researcher shows that the food availability for high quality foods is not found in bulks in low-income neighborhoods. So foods that are needed for the nourishment of the body are found at high prices in stores for families who cannot afford it go for something that will not help the body instead harm in the long run. But they cannot help that because that is the cards they were dealt supposedly. According to Singh, Siahpush & Kogan (2003 and 2007) the capabilities of doing a physical activity is at large and to get people to workout

2nd Annual International Interdisciplinary Conference, AIIC 2014, 8-12 July, Azores, Portugal Proceedings, Vol.3
128
has become asking a little child to eat their vegetables at the dinner table. Research expresses about how childhood obesity is in America and the children are being hit hard by the parents because the kids feel as though their parents cannot be wrong. In congruence to this, parents need to accept the challenge and grasp some parental education when it comes to healthy eating and physical activity. Social inequalities always play a part with everything. Where do live, what do you do? How much money do you make? These social inequalities play a part into how the U.S. will end up, whether we will stay in the rising obese category or not. According to Kotz (2010) there is a situation in which is the BMI (Body Mass Index) is sky rocketing but if we start right now to do two hours of physical activity a day and eat the healthiest foods we can find that will solve childhood obesity. According to Deckelbaum & Williams (2001) the obesity epidemic has turned into an obese pediatric population in the U.S. This should show everyone globally and here that if you ignore an issue it can blow up in your face or space like an atomic boom, and take your money right from under your nose. This epidemic has become so bad all types of heart risk diseases are caused from this obesity epidemic. Children in America do not have to be affected by the obesity epidemic from birth if babies drink breast milk instead of the normal baby formala they will be better off. According to Anderson (2000) is if we have children that are obese or overweight within our nation we need to limit them to what that can do. We need to limit the activities such as T.V. limit to one hour and make them eat certain foods with a certain amount of portions, and make up some two hour or more program of vigorous physical activity. Taking it to an extreme measurement sometimes is the route you need to take in order to get our overweight children and obese children off the couch and into something that will benefit them instead of waist them. The stress is not really on the educators of the school or anybody outside the walls of the home or the family who is raising the child. The ones who are raising the child are guilty because they are teaching right from wrong what to do and what not to do. According to Koplan, Liverman & Kraak (2005) children maybe be influenced by family values for the most part but regardless they need to be eating something that can give them an energy balance. The thing is you do not want to give the kid a sugar rush because that will kill their drive and the energy balance will. Normally the children are always around a commercial environment so it is a challenge trying to keep the children from eating junk because it taste good versus a bland taste that can for all reasons be great for your body and enhance, boost your immune system trying to compete with different advertising that kids see every day while they watch T.V. and be outside. The ultimate prevention would be to let child running around just because it is fun for them to do. When kids mindlessly run around the way it seems they are getting the exercise they need without even knowing it. According to Cawley (2010) sugar intake shifted because the shipping trying to get it over here cost too much for the U.S. to pay for it. So like the U.S. looked for a cheaper source that could replace sugar which was high fructose corn syrup. Now research states that this is one of the reasons that obesity shot through the roof because scientifically sugar didn’t latch on and turn into fat but fructose on the hand has that sort of effect on the fat tissues within our bodies. The amazing thing about fructose is that so many foods in the U.S. use it as an ingredient. It is enough to make your head spin, and this is one of the reasons why people call this moment in our lives the epidemic of childhood obesity. According to Trasande, Liu, Fryer, & Weitzman (1999-2005) this epidemic has led to the largest number of hospitalizations this nation has ever seen. It impacted the health so much that the money making industry wasn’t Wall Street at this time, it was the hospitals and in a weird way it still is making a lot of that money still. If you get on the ambulance truck you get charged for getting picked up and then depending on how they bill you it could go up some more. Hospitals and obesity somebody has to take care of the sick people at this time of a nation’s epidemic of sickness. Research says whenever the people decide enough is enough is when it’ll all change around. Everyone will

2nd Annual International Interdisciplinary Conference, AIIC 2014, 8-12 July, Azores, Portugal Proceedings, Vol.3
129
change their habits and want to change for the best. According to Samples (2010), schools can possibly help us through the teachers and everybody else on staff helping the children avoid the obesity. But also the school system could not take into consideration other people’s children and just mind their own business and only tend to their issues, duties as a teacher. According to Dietz & Gortmaker (1984) nutritious value is in the environment of the U.S. it is just all on where you are at the factors of the social area you are at might have what you need or you may have to settle for less. The orbit of the sensational tension of this top ranging as it grows from obese to super obesity. On the other hand children who are obese didn’t wake up that way we have parents and or guardian’s people that influence that person to be how they are. Methodology Collecting data for this research was conducted through forms of articles, magazines, books, editorials, periodicals. The data forms from all the different types of research came together and spoke loudly about childhood obesity in the U.S. The common thread that was growing profusely in this research were three things: community, health, and economy. Those were the most eye-popping key words that kept coming up; and those issues within this epidemic of childhood obesity needs to be taken care of as soon as possible. The studies have shown in their own ways how obesity within a child can affect children’s well-being in such areas as social life, physical activity, articulation of their own mental state; and it also plays a huge role in confidence, and self-esteem. These studies from all the articles and periodicals have shown how important childhood obesity is in the U.S. and how it needs to be taken care of from the research that has been done so far. This data was at the limits of 50 to 60 articles but the most important ones made it in this paper which was at a limit of 20 articles. Even though there was not that much quantity within the articles there was a lot of quality within those 20 articles. Results Community; Home is where for the most part children learn how to be who they are as they get older so if their being educated under a sedentary lifestyle then they probably will have issues with being an obese child. Television, the processed foods, the high carbohydrate and protein diets are all against the wellbeing of the community the best thing needed for a child to grow up in a community. Health: Being healthy is one thing that has been said but not utilized to its full potential here in the U.S. A healthy person child in this case needs to be able to run and play utilizes their body through physical activity so they can have better energy levels for music, English, math and science. In order to be that way they need to eat fruits, vegetables drink water and lean meats so they may become successful instead of obese from not being healthy. Economy: The best thing about the U.S. use to be our economy but now sense the rate of deaths in this country is Obesity beating out cancer from smoke is a serious issue that needs to be looked at accordingly. This issue is making the cost of hospital visits and medical insurance go up because it is more children and adults coming in with this issue than ever before. And the sad part is most of them do not have the money so the tax dollars are spent on children and adults whom are considered obese. Prevention: Most of childhood obesity can be solved for the ones who just need a simple lifestyle change from sedentary to healthy active body eating, drinking stimulating the body the way it should. Today there are hundreds of programs in the states to help children who are obese but most of them are not main stream like others are but from looking at all the research that was conducted all those programs will be used soon and change the way the youth looks here in the next 20 to 30 years.

2nd Annual International Interdisciplinary Conference, AIIC 2014, 8-12 July, Azores, Portugal Proceedings, Vol.3
130
Statistics: Ranging from how many children were back in the 1980’s or further back the children’s obesity rate was not as high as today, why? Because the kids had their parents at home and were able to supervise their activities watching what they are eating or what physical activities they are doing. At the present time mom and dad has to work a tremendous amount of hours and this makes the kids unstable leading them into a sedentary lifestyle with an absence of supervision and care children think it is ok to watch T.V. all day and eat unhealthy just because mom and dad are not there. Nation: This nation usually is formed from whatever people are saying. In the U. S. right now people are saying that nothing will change it is just going to get worse to the point that people just start dying normal from being obese. But researchers from here in the states believe that sense right now there are a lot of people here who can teach the right things to eat and teach how to work out properly that in the next 10-20 years the obesity rate will drop. Government; Researchers believe the government can easily make laws and regulations tending to how the schools should conduct themselves so this childhood obesity issue would not be a problem but the schools now are dropping physical activity so they have the power to do it but will they. Discussion The beginnings of childhood obesity is an unknown thought and or origin but as of in this millennium according to S. Kimm and E. Obarcanek (2002) there has been an increase in lazy activities and a major decrease in daily active movement. Another main reason why childhood obesity is a factor in the U.S. according to Cawley (2010) is that employment for full time mothers increased in 1975 to 1994 and the percent rate for obese children went from 11% to 35% in 1994. Mothers that stayed at home actually are benefiting their children’s development growing up as a child. The meals were probably conducted better and the amount of play from the kids kept them physically active and that helping preventing obesity. Neighborhoods and people in the community should show and expand the options for kids so they can learn how to balance physical activity and eating according to Koplan, Liverman, Kraak (2005). For children to grow up and have eating habits along with a sense of direction to do with themselves comes from where the spend the bulk of their time which is at home or within the neighborhood family friends all together sharing great knowledge about how to eat and exercise.
Studies of children being obese show that we as a nation the U.S. is being weakened. According to S. Kimm and E. Obarcanek (2002) across this country shows growth and expansion in steady years to come if we do not eliminate this problem. The most talked about childhood issue globally and in the U.S. of America is childhood obesity according to S. Kimm and E. Obarcanek (2002). According to S. Kimm and E. Obarcanek (2002) if those two options did not work then they had nothing else for you to do. But now the latest greatest option that they give to you is be involved with some type physical activity and develop better eating habits. See when people run out of options to give you this is when you take matters into your own hands and you become the best researcher for yourself so you can help yourself out. There is a common connection between sweet drinks and obese children need to have healthier choices at the schools according to Sample (2010). Can sweet drinks get you fatter from the consumption of it excessively? Researchers say yes because of the facts that in those drinks are a lot of products in the drink that are additives. And those things within the drinks make it fatty and too much of it without adequate exercise can make children or adults be overweight and or obese. Some ingredients that are in our drinks could be reason for some of our epidemic nationwide issues according to Cawley (2010) Once you form a habit breaking it is very hard this is why it is so important to train a child into a way it needs to be and societies, communities, families all over need to change but especially right here in the
2nd Annual International Interdisciplinary Conference, AIIC 2014, 8-12 July, Azores, Portugal Proceedings, Vol.3
131
U.S. The NFL now has a program where they target to help kids encouraging them to work out 60 minutes a day according to Rowe (2010). The biggest sport in America is lending a hand to help out the childhood obesity crisis by saying workout 60 minutes a day I think it will work and has been working. For the most part all kids play football growing up and they watch the NFL players so I believe this will work continuously. Obesity is out ranking smoking, tobacco in the top causes of death in this country according to Lavizzo-Mourey (2004) In Delaware the child care center encourages the children kids to snack only on fruits and vegetables according to Deborah (2010). Childhood obesity is a heavy issue and it primarily can be stopped through prevention of kids to becoming overweight or obese. Farmers are the allies in helping fight the problem of childhood obesity according to Wallinga (2010). Childhood obesity is on personal level bases of junk food and less physical activity some researchers believe. Children in this society are victims to the social environments in the U.S. fast food culture according to Hawkins and Linvill (2010). Childhood obesity at all cost needs to be addressed through by encouraging habits that include eating drinking healthy things and physical activity according to Ludwig (2007) those children on Medicare who have obesity issues have a harder time than those who have private or self-pay insurance, from the studies of Eneli, Keast, Rappley, and Camargo, Jr (2008) because trying to get medical assistance on cheap insurance is hard trying to get the doctor or physician to look at you. A chronic disease is a great risk for a kid that is faced with obesity. There are different types of behaviors mental and biochemical functions that can be created from being an obese child according to Deckelbaum and Williams (2001). Money from our own pockets sometimes have to pay the cost for medical expenses when it comes to childhood obesity according to Transde, Liu, Fryer, and Weitzman (1999 – 2005) charges in hospitals increased obesity by 66.3 %. We as a society in this country have to focus on our everyday decisions because one action could cause something else wrong with this economy according to Transde, Liu, Fryer, and Weitzman (1999 – 2005) “obesity related hospitalizations cost Medicaid 118.1 million in 2005 up from 53.6 million in 2001”. The policy also will help programs be formed so we can decrease the childhood obesity issue at hand. When the economics of a food pricing changes, depending what it is the people will be affected from either more or less according to Cawley (2010) This obesity issue is making people dig deep into their pockets to the point where we might not have any savings left in our accounts or banks. The question is how much time is needed for children to exercise and the answer is simply 60 minutes according to Samples (2010). The magnification of time during exercise for kids is just an estimate because for some children those 60 minutes Samples was referring to could be a starting block for some but also for the children who are already active could be a schedule easier time to get it whenever you can. Today the number is increasing, children being a couch potato has gone up and the study by Sample (2010) shows their needs to be a serious decrease in daily T.V., video games, computers, and also for each commercial that is shown nine out of ten for those commercials are foods and or drinks that lack nutrients and are very high in fats and sodium. Children who do not take after the physical activity are the ones who let being a couch potato look really bad. Those are the children who are obese, overweight and probably also the ones who are anti-social and depressed. Children who form healthy habits through proper development so that can carry over into adult hood. These are the children who will be successful in the future they have the upper hand overall especially compared to a kid who is overweight or obese. More playgrounds and recreational centers within a safe environment is needed to be for this moment to keep them healthy, studies from Rowe (2010). All of these things can keep a kid charged through physical activity without the child even knowing that through the playing is something great for you that you are doing. The U.S. school system should provide classes that model to show students our youth how to

2nd Annual International Interdisciplinary Conference, AIIC 2014, 8-12 July, Azores, Portugal Proceedings, Vol.3
132
be healthier according to Rowe (2010). Once everyone notices that we are all one unit, meaning we cannot do anything without our neighbor or friend, having a bond with everyone with the neighborhood. Until that time this nation will have some bad days ahead for sure. The support of the government should provide more private or public programs that help families see the overall importance of being healthy according to Koplan, Liverman, Kraak (2005). Conclusion
The best way to describe this research as a whole is accountability meaning counting on one to do the right thing over and over again to show that person how to do it. Eating the right things as a professor, teacher, student, family member or friend will show others around you its ok and the same applies with being involved with activities. After a while it becomes a chain reaction and everyone is doing it. From the researchers’ point of view one day later down the line childhood obesity situation will be shortened by a significant amount compared to where it is now. References: Adams, C. (2010). Healthy Kids. Retrieved from http://eb.ebscohost.com/ehost/detail?hid=1 Andersen, R.E. (2000). The spread of the childhood obesity epidemic. Canadian Medical Association. Retrieved from http://www.cmaj.ca/cgi/reprint/1631/11/1461 Cawley, J. (2010). The Economics of Children Obesity. Health Affairs, 29(3), 364-371. doi: 10.1377/hlthaff.2009.0721 Deckelbaum, R.J. & Williams, C.L. (2001). Childhood Obesity: The Health Issue. Obesity Research (2001) 9, S239-S243. doi: 10.1038/oby.2001.125 Dietz, W.H. & Gortmaker, S.L. (1984) Factor within the physical environment associated with childhood obesity. Original Research Communications-surveys. Retrieved from http://www.ajcn.org Eneli, I.U., Keast, D.R., Rappley, M.D. & Camargo Jr, C.A. (2008). Adequacy of two ambulatory care surveillance systems for tracking childhood obesity practice patterns. Public Health (2008) 122, 700-707. doi: 10.1016/j.puhe.2007.10.001 Evangeline, Y. (Dec 2010). Childhood Obesity. American Fitness. Retrieved from http://web.ebsochost.com/ehost/detail?hid=1 Green, G, Reese, S. (Fall 2006). Childhood Obesity: A growing Phenomenon for Physical Educators. Retrieved from http://web.ebscohost.com/ehost/detail?hid=1 Hawkins, K.W., Linwill, D.L.(2010). Public Health Framing of News Regarding Childhood Obesity in the U.S.. Health Communication, 25, 709-717. doi: 10.1080/10410236.2010.521913 Kimm, S.Y.S. & Obarzanek, E. (2002). Childhood Obesity: A New Pandemic of the New Millennium. Official Journal of the American Academy of Pediatrics, 110, 1003-1007. doi: 10.1542/peds.110.5.1003 Koplan, J.P., Liverman, C.T. & Kraak, V.I.(2011) Preventing Childhood Obesity. Issues in Science & Technology. Retrieved from http://web.ebsochost.com/ehost/detail?hid=1 Kotz, D. (May,2010). Can She End Obesity? 5 Key Steps. Retrieved from http://web.ebscohost.com/ehost/detail?hid=1 Lavizzo-Mourey, R. (April 15, 2004). Childhood Obesity. Retrieved from http://web.ebscohost.com/ehost/delivery?hid=12&sid=ab04f204-ff6d-47c9-bba2-84a5ad374 Ludwig, D.S. (2007). Childhood Obesity, the Shape of Things to Come. New England Journal of Medicine, 2325-2327 Ramstetter, C. (November 2010). The Crucial Role of Recess in Schools. Retrieved from http://web.ebscohost.com/ehost/delivery?hid=122&sid=5db898d3-c0a5-446a-aa11-e15dc52

2nd Annual International Interdisciplinary Conference, AIIC 2014, 8-12 July, Azores, Portugal Proceedings, Vol.3
133
Rowe, A. (December 2010). No Nation Is Healthier Than Its Children. Retrieved from http://web.ebscohost.com/ehost/delivery?hid=122&sid=c794c6a5-3fla-4178-a1b1-8442e33 Sealy, Y.M. (2010). Parents’ Perceptions of Food Availability: Implications for Childhood Obesity. Social Work in Health Care, 49, 565-580. doi: 10.1080/00981381003635353 Singh, G.K., Siahpush, M. & Kogan, M. (2010). Rising Social Inequalities in US Childhood Obesity, 2003-2007. U.S. Department of Health and Human Services, 20, 40-52. doi: 10.1016/j.annepidem Trasande, L., Liu, T., Fryer, G. & Weltzman, M. (2009). Effects of Childhood Obesity on Hospital Care and Costs, 1999-2005. Health Issue, W751-W760. doi: 10.1377/hlthaff.28 Wallinga, D. (2010). Agricultural Policy and Childhood Obesity: A Food Systems and Public Health Commentary. Health Affairs 29(3) doi: 10.137/hlthaff.201.0102 Appendix – a
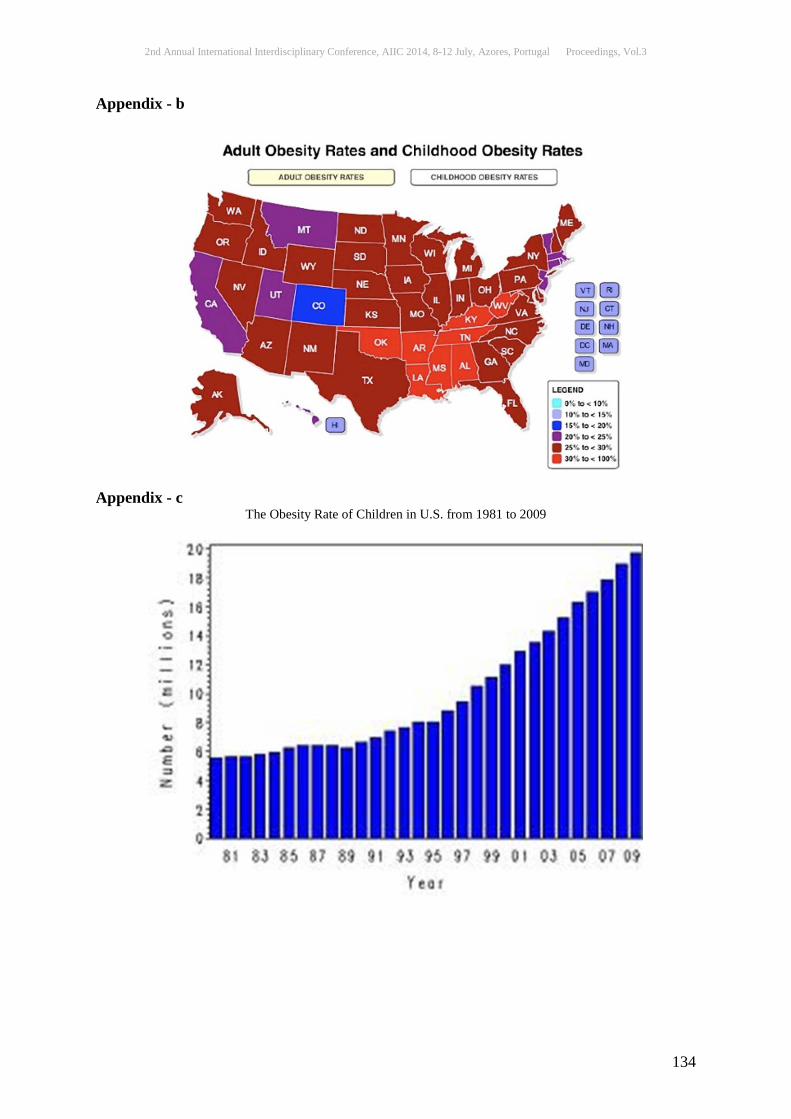
2nd Annual International Interdisciplinary Conference, AIIC 2014, 8-12 July, Azores, Portugal Proceedings, Vol.3
134
Appendix - b
Appendix - c
The Obesity Rate of Children in U.S. from 1981 to 2009
2nd Annual International Interdisciplinary Conference, AIIC 2014, 8-12 July, Azores, Portugal Proceedings, Vol.3
135
ASSESSMENT OF FOOD AND NUTRIENT INTAKE OF COMMUNITIES ACROSS THREE AGRO-BIODIVERSITY
HOTSPOTS IN INDIA
Prabhakaran T. Raghu, M.Sc. Senior Economist, M.S.Swaminathan Research Foundation, Chennai, Tamil Nadu, India
Kalaiselvan N.N., M.Sc. Research Economist, M.S.Swaminathan Research Foundation, Chennai, Tamil Nadu, India
Arivudai Nambi V., Ph.D. Director, Biodiversity, M.S.Swaminathan Research Foundation, Chennai, Tamil Nadu, India
Chandra Guptha B., B.Sc, PDM Agronomist, M.S.Swaminathan Research Foundation, Chennai, Tamil Nadu, India
Mahana R.K., Ph.D. Social Scientist, M.S.Swaminathan Research Foundation, Jeypore, Odisha, India
Venkatesan.G., M.A. Social Scientist, M.S.Swaminathan Research Foundation, Kolli Hills, Tamil Nadu, India
Arunraj R., M.A. Social Scientist, M.S.Swaminathan Research Foundation, Wayanad, Kerala, India
Maria Philip P.I., MSW. Social Scientist, M.S.Swaminathan Research Foundation, Chennai, Tamil Nadu, India
Abstract Balanced and adequate nutrition is important in improving the health of the community in general and of vulnerable groups in particular. Assessment of the nutritional status of a community is important for development of implementation strategies and suitable policies. Dietary assessment indicates whether intake of macro and micro nutrient are adequate. Anthropometric measurements and comparisons of nutrient intakes with reference values are easy and non-invasive, economical and sufficiently reliable methods for the determination of nutritional status. The present study uses micro-level data drawn from 24 hours recall diet survey to calculate the mean food and nutrient intake by communities in three agro-biodiversity hotspots. The 24 hours recall diet survey was carried out among households in three study locations during June to November 2013 among the project intervention and non-intervention groups. Information on age, sex, physiological status, physical activity of the household members who took meals during the previous 24 hours was collected for computing consumption unit. The result shows that cereals are the chief source of energy in the study locations contributing 70-80% of the daily energy intake. Mean intake of green leafy vegetable are negligible in the study locations. The intake of sugar and jaggery among the intervention group of Meenangadi is 48% higher than recommended dietary intake, while in the non-intervention group it is 28% higher; and 20% higher among the non-intervention group in the Kolli Hills. The intake of vitamin A is the lowest among other nutrients across the internvention and non-intervention groups in the study locations.
Keywords: Food and Nutrient Intake, 24 Hours Recall, Agro-biodiversity Hotspots, India
2nd Annual International Interdisciplinary Conference, AIIC 2014, 8-12 July, Azores, Portugal Proceedings, Vol.3
136
Introduction Alleviating food insecurity and malnutrition continue to be major developmental challenges. The nutritional status of humans is entwined in complex relationships determined by a chain of events from food production to consumption and set against the backdrop of cultures and nations (Kataki and Babu, 2002). Deficiencies of minerals and vitamins results in several biochemical and physiological defects. Micronutients such as minerals and vitamins have a major role to play in the proper utilization of macro nutrients. Optimal nutrition can protect humans against many diseases/disorders resulting from nutrient deficiencies or excess (Aberoumand 2011). Balanced and adequate nutrition is therfore important in improving the health of communities in general and of groups at risk in particular. The dietary assessment of the community indicates if the intake of the macro and micro nutrient are adquate. Nutritional status of the community can be assessed by direct indicators based on anthropometric measurements, as well as indirect indicators such as food and nutrient intakes compared to recommended levels. These approaches are easy, non-invasive, economical and sufficiently reliable for the determination of nutritional status (McMahan and Bistrain, 1991). Assessment of the nutritional staus of a community is important for policy making and development and implementation of intervention strategies. The present study is a part of the research project, “Alleviating Poverty and Malnutrition in Agro-biodiversity Hotspots (APM)’’ implemented jointly by the M.S.Swaminathan Research Foundation (MSSRF), Chennai, India and the University of Alberta (U of A), Edmonton, Canada, in three agrobiodiversity hotspots of India: Kundra block in the Koraput district of Odisha, Meenangadi panchayat in the Wayanad district of Kerala and Kolli Hills in the Namakkal district of Tamil Nadu. Enhancing nutrition through improving agricultural productivity, diversifying household diets based on kitchen gardens are some of the primary pathways adopted by the APM project. The baseline nutritional assessement information was collected using three survey instruments: Food frequency survey, 24 hours recall diet survey and Anthropometric assessment survey. These surveys were carried out among both the intervention and non-intervention groups. In the intervention group, activities are being carried out by the project to enhance overall nutritional status of the community. The non-intervention group serves as control, where no such interventions are being implemented, to enable comparison of the endline results. The present paper uses micro-level data of the 24 hours recall diet survey to calculate the average daily food and nutrient intake by the communities in three agro-biodiversity hotspots. While a single 24 hours recall is not considered to be representative of habitual diet at an individual level, but adequate for a survey of intake across a large group and for estimating mean intakes of community (Raina 2013). Most existing literature on nutrition make use of secondary data generated by the Demographic and Health Survey (DHS) and National Family Health Survey (NFHS) of the Government of India. In addition, the National Nutrition Monitoring Bureau (NNMB) and the National Sample Survey Organisation (NSSO) carries out diet and nutrition surveys routinely once in 5 years. The present study makes use of micro-level primary data generated in the study locations, which happens to be a poorly accessed location and therefore likely to contribute to available literature. Study area India is one of twelve mega-diverse countries in the world and is considered as a major center of domestication of crop plants. In 2007, the Protection of Plant Varieties & Farmers’ Rights Authority (PPV&FRA) of the Government of India (GoI) constituted a task force to characterize, demarcate and list the agrobiodiversity hotspots in India. The task force identified 22 hotspots across India, based on a listing of species of botanical and agricultural
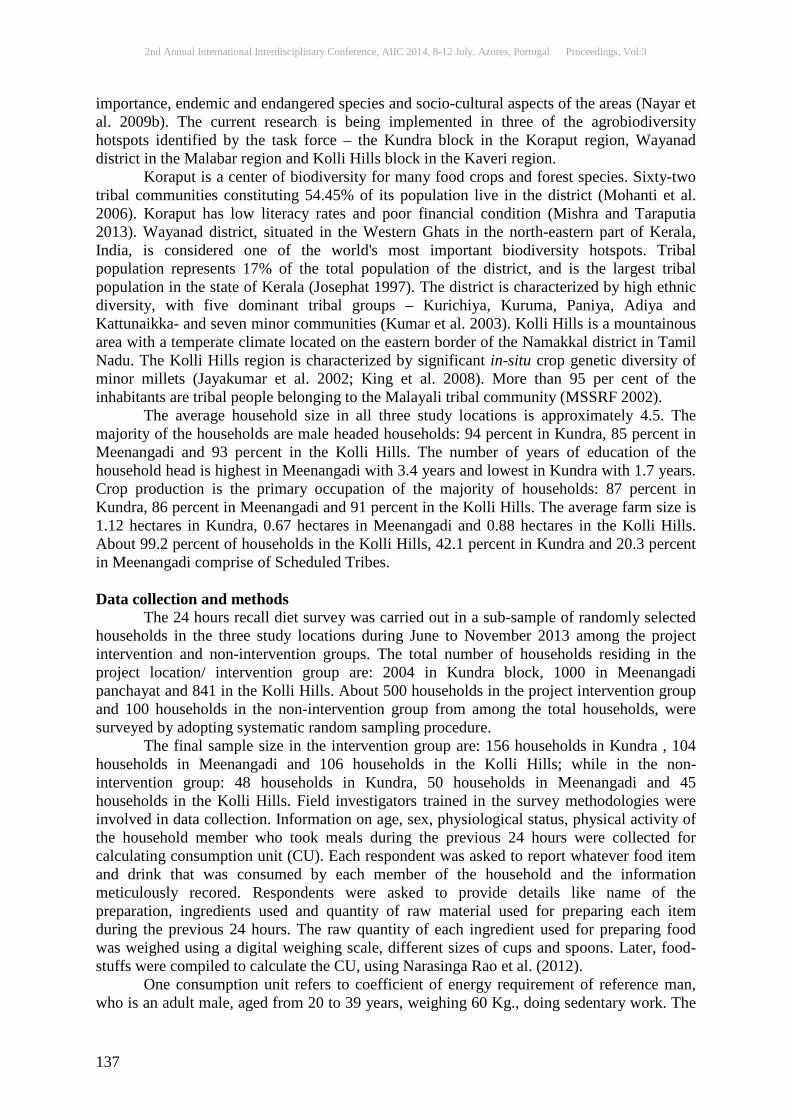
2nd Annual International Interdisciplinary Conference, AIIC 2014, 8-12 July, Azores, Portugal Proceedings, Vol.3
137
importance, endemic and endangered species and socio-cultural aspects of the areas (Nayar et al. 2009b). The current research is being implemented in three of the agrobiodiversity hotspots identified by the task force – the Kundra block in the Koraput region, Wayanad district in the Malabar region and Kolli Hills block in the Kaveri region. Koraput is a center of biodiversity for many food crops and forest species. Sixty-two tribal communities constituting 54.45% of its population live in the district (Mohanti et al. 2006). Koraput has low literacy rates and poor financial condition (Mishra and Taraputia 2013). Wayanad district, situated in the Western Ghats in the north-eastern part of Kerala, India, is considered one of the world's most important biodiversity hotspots. Tribal population represents 17% of the total population of the district, and is the largest tribal population in the state of Kerala (Josephat 1997). The district is characterized by high ethnic diversity, with five dominant tribal groups – Kurichiya, Kuruma, Paniya, Adiya and Kattunaikka- and seven minor communities (Kumar et al. 2003). Kolli Hills is a mountainous area with a temperate climate located on the eastern border of the Namakkal district in Tamil Nadu. The Kolli Hills region is characterized by significant in-situ crop genetic diversity of minor millets (Jayakumar et al. 2002; King et al. 2008). More than 95 per cent of the inhabitants are tribal people belonging to the Malayali tribal community (MSSRF 2002). The average household size in all three study locations is approximately 4.5. The majority of the households are male headed households: 94 percent in Kundra, 85 percent in Meenangadi and 93 percent in the Kolli Hills. The number of years of education of the household head is highest in Meenangadi with 3.4 years and lowest in Kundra with 1.7 years. Crop production is the primary occupation of the majority of households: 87 percent in Kundra, 86 percent in Meenangadi and 91 percent in the Kolli Hills. The average farm size is 1.12 hectares in Kundra, 0.67 hectares in Meenangadi and 0.88 hectares in the Kolli Hills. About 99.2 percent of households in the Kolli Hills, 42.1 percent in Kundra and 20.3 percent in Meenangadi comprise of Scheduled Tribes. Data collection and methods The 24 hours recall diet survey was carried out in a sub-sample of randomly selected households in the three study locations during June to November 2013 among the project intervention and non-intervention groups. The total number of households residing in the project location/ intervention group are: 2004 in Kundra block, 1000 in Meenangadi panchayat and 841 in the Kolli Hills. About 500 households in the project intervention group and 100 households in the non-intervention group from among the total households, were surveyed by adopting systematic random sampling procedure. The final sample size in the intervention group are: 156 households in Kundra , 104 households in Meenangadi and 106 households in the Kolli Hills; while in the non-intervention group: 48 households in Kundra, 50 households in Meenangadi and 45 households in the Kolli Hills. Field investigators trained in the survey methodologies were involved in data collection. Information on age, sex, physiological status, physical activity of the household member who took meals during the previous 24 hours were collected for calculating consumption unit (CU). Each respondent was asked to report whatever food item and drink that was consumed by each member of the household and the information meticulously recored. Respondents were asked to provide details like name of the preparation, ingredients used and quantity of raw material used for preparing each item during the previous 24 hours. The raw quantity of each ingredient used for preparing food was weighed using a digital weighing scale, different sizes of cups and spoons. Later, food-stuffs were compiled to calculate the CU, using Narasinga Rao et al. (2012). One consumption unit refers to coefficient of energy requirement of reference man, who is an adult male, aged from 20 to 39 years, weighing 60 Kg., doing sedentary work. The
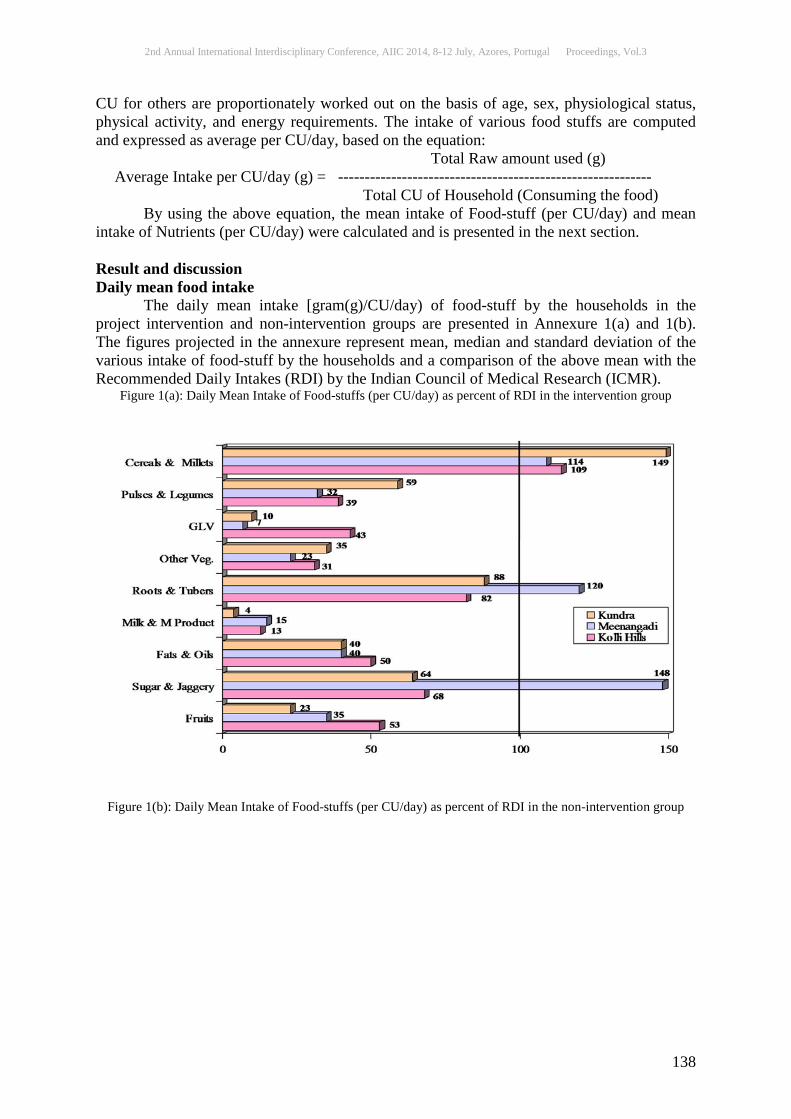
2nd Annual International Interdisciplinary Conference, AIIC 2014, 8-12 July, Azores, Portugal Proceedings, Vol.3
138
CU for others are proportionately worked out on the basis of age, sex, physiological status, physical activity, and energy requirements. The intake of various food stuffs are computed and expressed as average per CU/day, based on the equation:
Total Raw amount used (g) Average Intake per CU/day (g) = -----------------------------------------------------------
Total CU of Household (Consuming the food) By using the above equation, the mean intake of Food-stuff (per CU/day) and mean intake of Nutrients (per CU/day) were calculated and is presented in the next section. Result and discussion Daily mean food intake The daily mean intake [gram(g)/CU/day) of food-stuff by the households in the project intervention and non-intervention groups are presented in Annexure 1(a) and 1(b). The figures projected in the annexure represent mean, median and standard deviation of the various intake of food-stuff by the households and a comparison of the above mean with the Recommended Daily Intakes (RDI) by the Indian Council of Medical Research (ICMR).
Figure 1(a): Daily Mean Intake of Food-stuffs (per CU/day) as percent of RDI in the intervention group
Figure 1(b): Daily Mean Intake of Food-stuffs (per CU/day) as percent of RDI in the non-intervention group
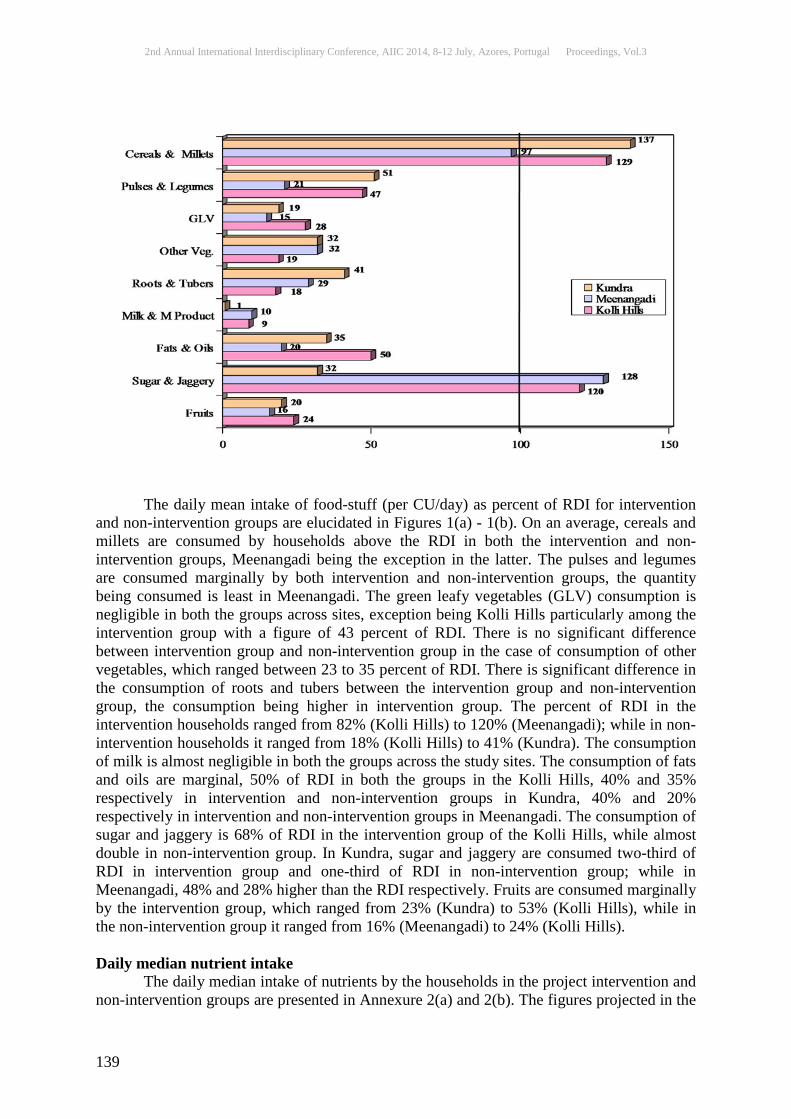
2nd Annual International Interdisciplinary Conference, AIIC 2014, 8-12 July, Azores, Portugal Proceedings, Vol.3
139
The daily mean intake of food-stuff (per CU/day) as percent of RDI for intervention and non-intervention groups are elucidated in Figures 1(a) - 1(b). On an average, cereals and millets are consumed by households above the RDI in both the intervention and non-intervention groups, Meenangadi being the exception in the latter. The pulses and legumes are consumed marginally by both intervention and non-intervention groups, the quantity being consumed is least in Meenangadi. The green leafy vegetables (GLV) consumption is negligible in both the groups across sites, exception being Kolli Hills particularly among the intervention group with a figure of 43 percent of RDI. There is no significant difference between intervention group and non-intervention group in the case of consumption of other vegetables, which ranged between 23 to 35 percent of RDI. There is significant difference in the consumption of roots and tubers between the intervention group and non-intervention group, the consumption being higher in intervention group. The percent of RDI in the intervention households ranged from 82% (Kolli Hills) to 120% (Meenangadi); while in non-intervention households it ranged from 18% (Kolli Hills) to 41% (Kundra). The consumption of milk is almost negligible in both the groups across the study sites. The consumption of fats and oils are marginal, 50% of RDI in both the groups in the Kolli Hills, 40% and 35% respectively in intervention and non-intervention groups in Kundra, 40% and 20% respectively in intervention and non-intervention groups in Meenangadi. The consumption of sugar and jaggery is 68% of RDI in the intervention group of the Kolli Hills, while almost double in non-intervention group. In Kundra, sugar and jaggery are consumed two-third of RDI in intervention group and one-third of RDI in non-intervention group; while in Meenangadi, 48% and 28% higher than the RDI respectively. Fruits are consumed marginally by the intervention group, which ranged from 23% (Kundra) to 53% (Kolli Hills), while in the non-intervention group it ranged from 16% (Meenangadi) to 24% (Kolli Hills). Daily median nutrient intake The daily median intake of nutrients by the households in the project intervention and non-intervention groups are presented in Annexure 2(a) and 2(b). The figures projected in the
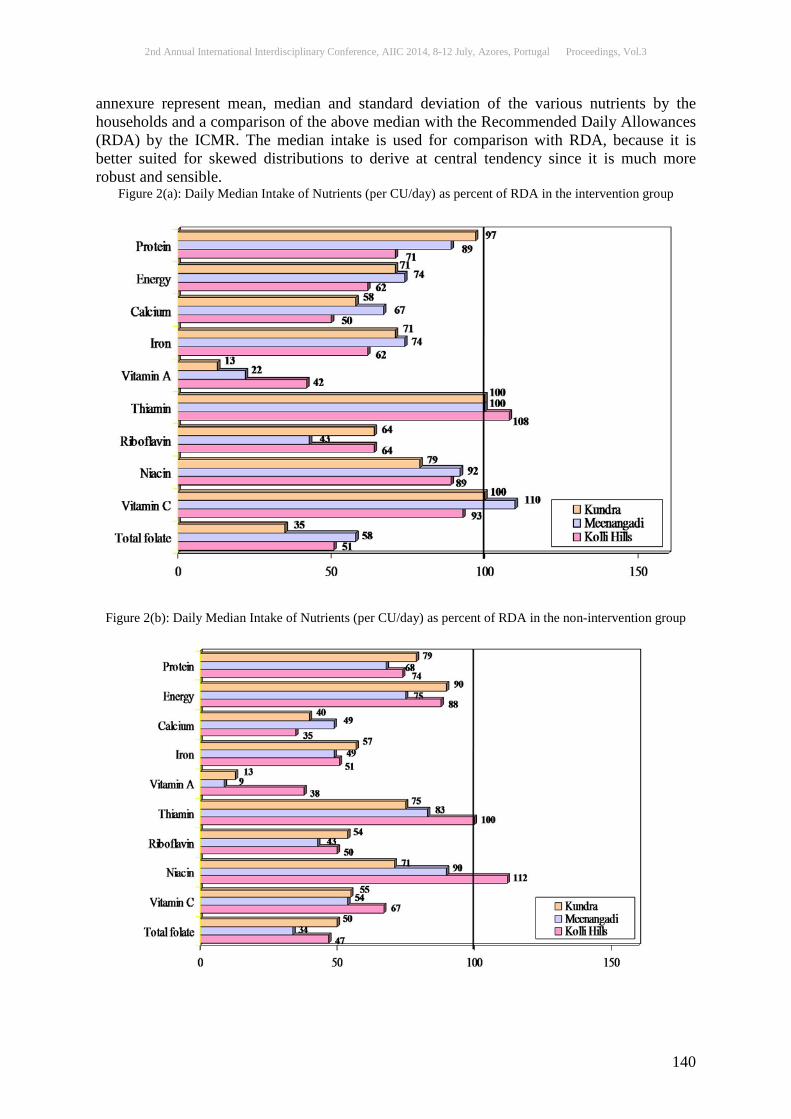
2nd Annual International Interdisciplinary Conference, AIIC 2014, 8-12 July, Azores, Portugal Proceedings, Vol.3
140
annexure represent mean, median and standard deviation of the various nutrients by the households and a comparison of the above median with the Recommended Daily Allowances (RDA) by the ICMR. The median intake is used for comparison with RDA, because it is better suited for skewed distributions to derive at central tendency since it is much more robust and sensible.
Figure 2(a): Daily Median Intake of Nutrients (per CU/day) as percent of RDA in the intervention group
Figure 2(b): Daily Median Intake of Nutrients (per CU/day) as percent of RDA in the non-intervention group
2nd Annual International Interdisciplinary Conference, AIIC 2014, 8-12 July, Azores, Portugal Proceedings, Vol.3
141
The daily median intake of nutrients (per CU/day) as percent of RDA for intervention and non-intervention groups are presented in Figures 2(a) - 2(b). The median intake of protein is higher in intervention group compared to non-intervention group across the study areas except in the Kolli Hills. The energy intake of RDA is higher in non-intervention groups of the Kolli Hills (88%), Kundra (90%) and Meenangadi (75%) compared to intervention groups of the Kolli Hills (62%), Kundra (71%) and Meenangadi (74%). The calcium intake is higher in intervention group across the study area by 15-18% than the non-intervention group. Iron intake is also higher in the intervention group compared to non-intervention group, by around 12% - 13% in the Kolli Hills and Kundra, and 25% in Meenangadi. Vitamin A intake is low in Kundra and Meenangadi, and marginal in the Kolli Hills both among intervention and non-intervention groups. Thiamine intake in the Kolli Hills fulfills the RDA among both groups; while it fulfills the intervention groups in Kundra and Meenangadi. Riboflavin intake is marginal among both groups across the study areas. Niacin intake among intervention group ranged from 79% of RDA in Kundra and 92% in Meenangadi, whereas in non-intervention group this ranged from 71% in Kundra and 112% in the Kolli Hills. Vitamin C intake also fulfils the RDA in the intervention groups but marginal in the non-intervention group. Total folate intake is marginal among the both groups across study areas. Limitation of the study The nutrient values for the following items were not available and hence could not be included in the analysis. 1. Nutrient values of a few (traditional) food items collected from commons. 2. Nutrient values of some packed foods like biscuit, rusks, etc. 3. A large number of households were using packed (eg. Chilli powder) masala packets.
For which nutrient values were not available. Conclusion The present study is developed from a 24 hour recall diet survey, aimed to create a baseline indicator for the project, “Alleviating Poverty and Malnutrition in Agro-biodiversity Hotspots (APM)’’. The results shows that cereals are the chief source of energy in the study locations contributing to 70-80% of the daily energy intake. Mean intake of GLV are negligible in the study locations. It is advisable to include atleast 50 gram of GLV daily in one’s diet. The GLV are a rich source of calcium, iron, β-carotene, vitamin C, riboflavin and folic acid. The intake of sugar and jaggery among the intervention group of Meenangadi is 48% higher than RDI, while in the non-intervention group it is 28% higher; and 20% higher among the non-intervention group in the Kolli Hills. Such an excess consumption may lead to diabetics (Jenkins et al. 1978) and heart diseases respectively (Gurr 1987) among adults and dental carries in children. The intake of vitamin A is the lowest among other nutrients across the internvention and non-intervention groups in the study locations. Lack of vitamin A leads to night blindness and other ailments and can be easily overcome by increasing use of animal foods including liver oils of some fishes. The second lowest nutrient intake is total folate, which may lead to loss of appetite and weight loss. Additional signs are weakness, sore tongue, headaches, heart palpitations, irritability, and behavioural disorders (Haslam and Probert, 1998). In adults, anemia can be a sign of advanced folate deficiency. In infants and children, folate deficiency can slow growth rate. Women with folate deficiency who become pregnant are more likely to give birth to low birth weight premature infants, and infants with neural tube defects. Folate is present both in animal and plant food. To enhance nutrition in the study locations, APM project implemented different set of activities. For instance activities which would increase nutritional intake and food security like introduction of
2nd Annual International Interdisciplinary Conference, AIIC 2014, 8-12 July, Azores, Portugal Proceedings, Vol.3
142
structured and unstructured kitchen gardens, enhancement of already existing kitchen gardens, crop yield enhancement measures in cereals and pulses, aiding back yard poultry, community fish farming, mushroom cultivation, providing saplings of nutritious trees like drumstick, papaya, guava, etc. Apart from physical activities many nutritional awareness programmes and trainings have also been provided to the communities especially women and adolescent girls. The impact of the project is to be studied in the near future. Acknowledgement This dataset was compiled to establish an understanding of daily food consumption by individuals in the three sites included in the MSSRF – U of A project on “Alleviating Poverty and Malnutrition in Agro-biodiversity Hotspots.” The International Development Research Centre (IDRC) and the Department of Foreign Affairs, Trade and Development (DFADT) of Canada funded this research for development project through the Canadian International Food Security Research Fund (CIFSRF). The questionnaire was developed during May 2013. The survey was implemented in Kundra block in the Koraput district of Odisha, Meenangadi panchayat in the Wayanad district of Kerala and the Kolli Hills in the Namakkal district of Tamil Nadu. The authors thank Drs. Ellen W. Goddard and Anna Farmer, Associate Professors, University of Alberta for providing specific inputs and comments on the questionnaire. The authors are also grateful to a large number of households who patiently answered a large number of our queries and co-principal investigators, social scientists, survey enumerators, data entry operators and others involved from APM project sites. References: Aberoumand, A. (2011). Assessment of Dietary Intake and Nutritional Status of Students in the Ramin University of Iran. Ind. J. Nytr. Dietet. 48, 478-482. Gurr, M. (1984). Role of Fats in Food and Nutrition. London and New York, Elsevier Applied Science Publisher. Haslam, N. and Probert, C.S. (1998). An audit of the investigation and treatment of folic acid deficiency. Journal of the Royal Society of Medicine. 91(2): 72–3 Jayakumar, S., Arockiasamy, D.I. and Britto, S.J. (2002). Conserving forests in the Eastern Ghats through remote sensing and GIS: a case study in Kolli Hills. Current Science. 82(10), 1259-1267 Jenkins, C. et al. (1978). Deitary fibre; fibre analogous and glucose tolerance importance of viscostity. Brit. Med. J., 1, 1392-1394. Josephat, M. (1997). Wayanad - District Handbooks of Kerala, India. In: Natarajan L., I.A.S., (Eds.), Department of Public Relations, Government of Kerala, India. Kataki, P.K. and Babu, S.C. (2002). Food Systems for Improved Human Nutrition: An Introduction. (Eds.), Kataki, P.K. and Babu, S.C., Food Systems for Improved Human Nutrition: Linking Agriculture, Nutrition, and Productivity. The Haworth Press, Inc. New York, London, Oxford. King, E.D.I.O., Nambi, V.A. and Nagarajan, L. (2008). Integrated approaches in small millet conservation: a case from Kolli Hills, India, in: Jaenicke, H., Ganry. J., Hoeschle- Zeledon, I. and Kahane R. (Eds.), Proceedings of the International Symposium on Underutilized Plants for Food Safety, Nutrition, Income and Sustainability Development: Vol. 1: International Society for Horticultural Sciences. Kumar, A., Girigan, G. and Venugopal, R. (2003). A report on agri-export zone: prospects of Wayanad District, Kerala, India, in: Wayanad Agriculture Development Committee and Community Agrobiodiversity Centre, M.S.Swaminathan Research Foundation, India.

2nd Annual International Interdisciplinary Conference, AIIC 2014, 8-12 July, Azores, Portugal Proceedings, Vol.3
143
McMahan, M. and Bistrain, B.R. (1991). Anthropometric assessment of nutritional status in hospitalised patients. In: Himes, J.H. (Eds.) Anthropometric assessment of nutritional status New York, NY: Jhon Willey and Sons Inc. 365-381. Mishra C.S. and Taraputia, T. (2013). Customized Row Markers: An Innovation Enhancing Food Security and Reducing Drudgery in Tribal Communities of Koraput Tract, Odisha. International Journal of Sustainable Development. 6(1), 77-82. Mohanti, K.K., Mohapatro, P.C. and Samal, J. (2006). Tribes of Koraput. Council of Analytical Tribal Studies, Koraput, Orissa, India.Total pages 538. MSSRF, FAO. (2002). Rural and Tribal Women in Agrobiodiversity Conservation. M.S. Swaminathan Research Foundation at Chennai, India & Food and Agriculture Organization for Asia and Pacific at Bangkok, Thailand. Narasinga Rao, B.S., Deosthale, Y.G. and Pant, K.C. (2012). Nutritive Value of Indian Foods. In: Gopalan, C., Rama Sastri, B.V. and Balasubramanian, S.C. (Eds.). National Institute of Nutrition, Indian Council of Medical Research (ICMR), Hyderabad, India. Total pages 161. Nayar, M.P., Singh, A.K. and Nair, K.N. (2009b). Agrobiodiversity Hotspots in India: Conservation and Benefit Sharing. Vol. (II), i-xii + total pages 309. Raina, S.K. (2013). Limitations of 24-hour Recall Method: Micronutrient Intake and the Presence of the Metabolic Syndrome. North American Journal of Medical Sciences. 5(8), 498.

2nd Annual International Interdisciplinary Conference, AIIC 2014, 8-12 July, Azores, Portugal Proceedings, Vol.3
144

2nd Annual International Interdisciplinary Conference, AIIC 2014, 8-12 July, Azores, Portugal Proceedings, Vol.3
145

2nd Annual International Interdisciplinary Conference, AIIC 2014, 8-12 July, Azores, Portugal Proceedings, Vol.3
146

2nd Annual International Interdisciplinary Conference, AIIC 2014, 8-12 July, Azores, Portugal Proceedings, Vol.3
147
2nd Annual International Interdisciplinary Conference, AIIC 2014, 8-12 July, Azores, Portugal Proceedings, Vol.3
148
EYE TRACKING AND AUTONOMIC NERVOUS SYSTEM REACTIVITY DURING PERCEPTION OF VISUAL
ENVIRONMENTS OF DIFFERENT COMFORT
Zvyagina Natalya, PhD Sokolova Lyudmila, Prof.
Morozova Lyudmila, Prof. Lukina Svetlana, PhD Cherkasova Anna, Ass.
Northern (Arctic) Federal University named after M.V. Lomonosov, Arkhangelsk, Russia
Abstract Participants included 50 individuals of age 20.5. Oculo-motor reactions and sympathetic skin response (SSR) have been monitored during perception of visual stimuli of different comfort. The research is unique in that sympathetic skin response registration is realized at the same time with eye tracking, giving thus an opportunity of analyzing cognitive visual-motor activity while viewing images and related physiological parameters, which reflect the autonomic nervous system (ANS) functional status. Activation of the ergotropic brain system has been found during uncomfortable stimuli perception that is to provide vegetative mobilizationof organizm. When comfort visual stimuli were presented to participants the trophotropic brain system was activated, indicating relaxing influence of the stimuli. An eye tracking analysis revealed an increase of dynamic and static parameters during uncomfortable images perception. This increase characterizes high tension of visual functional system. A correlational analysis has revealed diverse and significant relations between eye tracking and SSR measures in comfort stimuli perception. This relies upon consensual functioning of the ANS and oculo-motor system, providing optimal mode of visual analyzer.
Keywords: Eye tracking, visual perception, autonomic nervous system, visual environment of different comfort, sympathetic skin response Introduction
The visual system plays an enormous role in perception of the environment, surrounding us. Due to vision capacity a human being receives from 80% to 90% information about outward things. Eye movements are the necessary and important part in complete work of visual system. The eye is the most active sensory organ, it never stops working but moves constantly relative to head posture (Hubel 1990). When we look at any objects our eyes move continuously for images cannot be detected by fully immobile retina (Adam 1983, Irie et al. 2002, Filimonov 2003, Schraa-Tam et al. 2008).
Objects viewing is always accompanied with saccades (characterized by dynamic oculo-motor parameters) they are jumbled up with fixations (characterized by static oculo-motor parameters). In order to differentiate symbols we stare at things for a while. Duration of such ocular fixations depends on stimulus complexity as well as on individual distinctions.

2nd Annual International Interdisciplinary Conference, AIIC 2014, 8-12 July, Azores, Portugal Proceedings, Vol.3
149
There is no perception at the very moment of saccade and consequently image viewing appears to be a set of successive fixations. During fixation individual processes visual information, this action is connected with thinking. Longer fixation time is usually associated with hard and more intensive cognitive process. Just and Carpenter (1980) conceived an idea of the Strong Eye-Mind Hypothesis and they assert that there is a distinct lack of time delay between what has been fixed and what has been processed. The study made by Filin (2002, 2006) show that the more difficult activity causes the larger intervals between both voluntary and involuntary saccades. At the time of saccade visual perception is blocked by reflectory way. In biological terms this reflex is explained by the fact that its activity leads to the attention switch for a new object appeared in the visual field (Filin 2002, 2006-a). Thus, oculo-motor activity is an essential component in mental processes, related to obtaining, transformation and use of visual information, and state and activity of human being as well (Barabanschikov, Milad 1994).
The whole visual environment can be figuratively divided into two parts: natural and artificial. The natural one corresponds with physiological norms of vision, as nature “has sculptured” the human eye for its own purposes. The artificial environment is quite the different. “Aggressiveness” of modern visual human impact is determined by its fundamental difference from the natural one. Depending on comfort level, influence on organism and visual system homogeneous, aggressive and comfortable visual environments can be distinguished (Filin 2006-a-b).
Homogeneous visual environment has no visible elements or their number is reduced dramatically. In nature, such an environment is represented by the illimitable snowy spaces of the Arctic and the Antarctic regions (Filin 2006-a-b). Nowadays many homogeneous visible fields, created of bare gable facades are appearing in urban environment. Besides, often there is asphalt covering in front of buildings, which is also an example of homogeneous environment. Architectural use of large size windows seems to be an equal adversity. Building face and asphalt covering are empty visual field. Having appeared in such a zone, one is surrounded by homogeneous fields with no opportunity for an eye to stare at something since elements for fixation are missing. Amplitude of eye movements increases by 3 – 5 times (saccadic automatism switches to a search mode), visual mechanisms cannot work adequately. All this leads to evident psychological discomfort (Rappoport 1990, Filin 1990).
Aggressive visual environment is created by surface appearance of contemporary city architecture in most cases. It is common for all high-rise buildings with plenty of windows. Looking at such a surface is rather unpleasant thing as it is difficult to piece images obtained by left and right eyes together. Hence adequate work of binocular eye apparatus is impossible. Eyes cannot catch on a concrete window, minimize the amplitude of saccades, fix an image and the brain is overloaded with the same information (Filin 2006-a-b). The number of aggressive fields is multiplied by wide use of tile for walls, diverse grids, corrugated aluminum sheeting and flagstoned pavements (Filin 2002).
Comfortable visual environment is distinct in presence of curves having different widths and contrasts, acute angles (especially on the top part of visible field) forming shapes, variable color grade, condensation and rarefaction of elements and their remoteness. For sure nature in all its diversity - forests, mountains, rivers, seas etc. - can be referred to comfortable visual environment. Nature has so large variety of elements that eye may switch from one to another for hours. Moreover, all vision mechanisms function in an optimal mode in comfortable visual environment (Filin 2006-a).
Since visual perception as any other function requires participation of others systems to a significant extent activated and coordinated by the ANS it is evidently that different tension of the ANS might be observed during different visual environments influence. It is
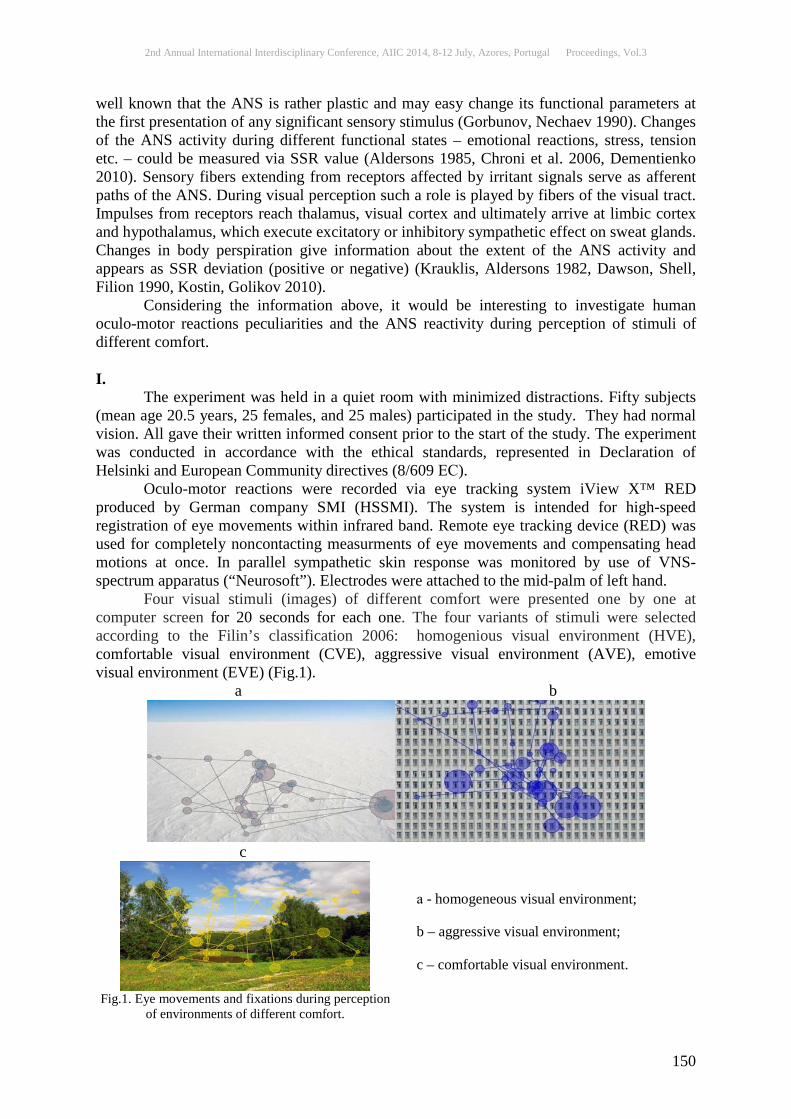
2nd Annual International Interdisciplinary Conference, AIIC 2014, 8-12 July, Azores, Portugal Proceedings, Vol.3
150
well known that the ANS is rather plastic and may easy change its functional parameters at the first presentation of any significant sensory stimulus (Gorbunov, Nechaev 1990). Changes of the ANS activity during different functional states – emotional reactions, stress, tension etc. – could be measured via SSR value (Aldersons 1985, Chroni et al. 2006, Dementienko 2010). Sensory fibers extending from receptors affected by irritant signals serve as afferent paths of the ANS. During visual perception such a role is played by fibers of the visual tract. Impulses from receptors reach thalamus, visual cortex and ultimately arrive at limbic cortex and hypothalamus, which execute excitatory or inhibitory sympathetic effect on sweat glands. Changes in body perspiration give information about the extent of the ANS activity and appears as SSR deviation (positive or negative) (Krauklis, Aldersons 1982, Dawson, Shell, Filion 1990, Kostin, Golikov 2010).
Considering the information above, it would be interesting to investigate human oculo-motor reactions peculiarities and the ANS reactivity during perception of stimuli of different comfort. I.
The experiment was held in a quiet room with minimized distractions. Fifty subjects (mean age 20.5 years, 25 females, and 25 males) participated in the study. They had normal vision. All gave their written informed consent prior to the start of the study. The experiment was conducted in accordance with the ethical standards, represented in Declaration of Helsinki and European Community directives (8/609 ЕС).
Oculo-motor reactions were recorded via eye tracking system iView X™ RED produced by German company SMI (HSSMI). The system is intended for high-speed registration of eye movements within infrared band. Remote eye tracking device (RED) was used for completely noncontacting measurments of eye movements and compensating head motions at once. In parallel sympathetic skin response was monitored by use of VNS-spectrum apparatus (“Neurosoft”). Electrodes were attached to the mid-palm of left hand. Four visual stimuli (images) of different comfort were presented one by one at computer screen for 20 seconds for each one. The four variants of stimuli were selected according to the Filin’s classification 2006: homogenious visual environment (HVE), comfortable visual environment (CVE), aggressive visual environment (AVE), emotive visual environment (EVE) (Fig.1).
a b
c
Fig.1. Eye movements and fixations during perception
of environments of different comfort.
а - homogeneous visual environment;
b – aggressive visual environment;
c – comfortable visual environment.
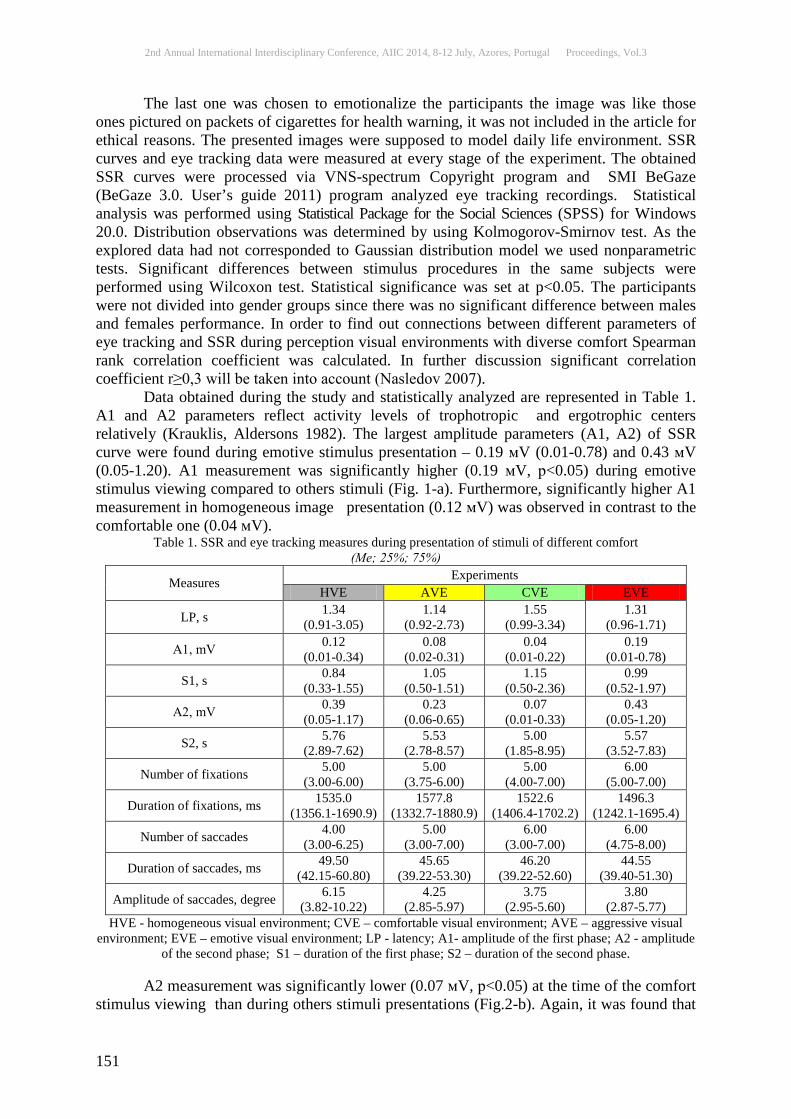
2nd Annual International Interdisciplinary Conference, AIIC 2014, 8-12 July, Azores, Portugal Proceedings, Vol.3
151
The last one was chosen to emotionalize the participants the image was like those ones pictured on packets of cigarettes for health warning, it was not included in the article for ethical reasons. The presented images were supposed to model daily life environment. SSR curves and eye tracking data were measured at every stage of the experiment. The obtained SSR curves were processed via VNS-spectrum Copyright program and SMI BeGaze (BeGaze 3.0. User’s guide 2011) program analyzed eye tracking recordings. Statistical analysis was performed using Statistical Package for the Social Sciences (SPSS) for Windows 20.0. Distribution observations was determined by using Kolmogorov-Smirnov test. As the explored data had not corresponded to Gaussian distribution model we used nonparametric tests. Significant differences between stimulus procedures in the same subjects were performed using Wilcoxon test. Statistical significance was set at p<0.05. The participants were not divided into gender groups since there was no significant difference between males and females performance. In order to find out connections between different parameters of eye tracking and SSR during perception visual environments with diverse comfort Spearman rank correlation coefficient was calculated. In further discussion significant correlation coefficient r≥0,3 will be taken into account (Nasledov 2007).
Data obtained during the study and statistically analyzed are represented in Table 1. A1 and A2 parameters reflect activity levels of trophotropic and ergotrophic centers relatively (Krauklis, Aldersons 1982). The largest amplitude parameters (A1, A2) of SSR curve were found during emotive stimulus presentation – 0.19 мV (0.01-0.78) and 0.43 мV (0.05-1.20). A1 measurement was significantly higher (0.19 мV, р<0.05) during emotive stimulus viewing compared to others stimuli (Fig. 1-a). Furthermore, significantly higher A1 measurement in homogeneous image presentation (0.12 мV) was observed in contrast to the comfortable one (0.04 мV).
Table 1. SSR and eye tracking measures during presentation of stimuli of different comfort (Ме; 25%; 75%)
Measures Experiments HVE AVE CVE EVE
LP, s 1.34 (0.91-3.05)
1.14 (0.92-2.73)
1.55 (0.99-3.34)
1.31 (0.96-1.71)
А1, mV 0.12 (0.01-0.34)
0.08 (0.02-0.31)
0.04 (0.01-0.22)
0.19 (0.01-0.78)
S1, s 0.84 (0.33-1.55)
1.05 (0.50-1.51)
1.15 (0.50-2.36)
0.99 (0.52-1.97)
А2, mV 0.39 (0.05-1.17)
0.23 (0.06-0.65)
0.07 (0.01-0.33)
0.43 (0.05-1.20)
S2, s 5.76 (2.89-7.62)
5.53 (2.78-8.57)
5.00 (1.85-8.95)
5.57 (3.52-7.83)
Number of fixations 5.00 (3.00-6.00)
5.00 (3.75-6.00)
5.00 (4.00-7.00)
6.00 (5.00-7.00)
Duration of fixations, ms 1535.0 (1356.1-1690.9)
1577.8 (1332.7-1880.9)
1522.6 (1406.4-1702.2)
1496.3 (1242.1-1695.4)
Number of saccades 4.00 (3.00-6.25)
5.00 (3.00-7.00)
6.00 (3.00-7.00)
6.00 (4.75-8.00)
Duration of saccades, ms 49.50 (42.15-60.80)
45.65 (39.22-53.30)
46.20 (39.22-52.60)
44.55 (39.40-51.30)
Amplitude of saccades, degree 6.15 (3.82-10.22)
4.25 (2.85-5.97)
3.75 (2.95-5.60)
3.80 (2.87-5.77)
HVE - homogeneous visual environment; CVE – comfortable visual environment; AVE – aggressive visual environment; EVE – emotive visual environment; LP - latency; A1- amplitude of the first phase; А2 - amplitude
of the second phase; S1 – duration of the first phase; S2 – duration of the second phase.
A2 measurement was significantly lower (0.07 мV, р<0.05) at the time of the comfort stimulus viewing than during others stimuli presentations (Fig.2-b). Again, it was found that
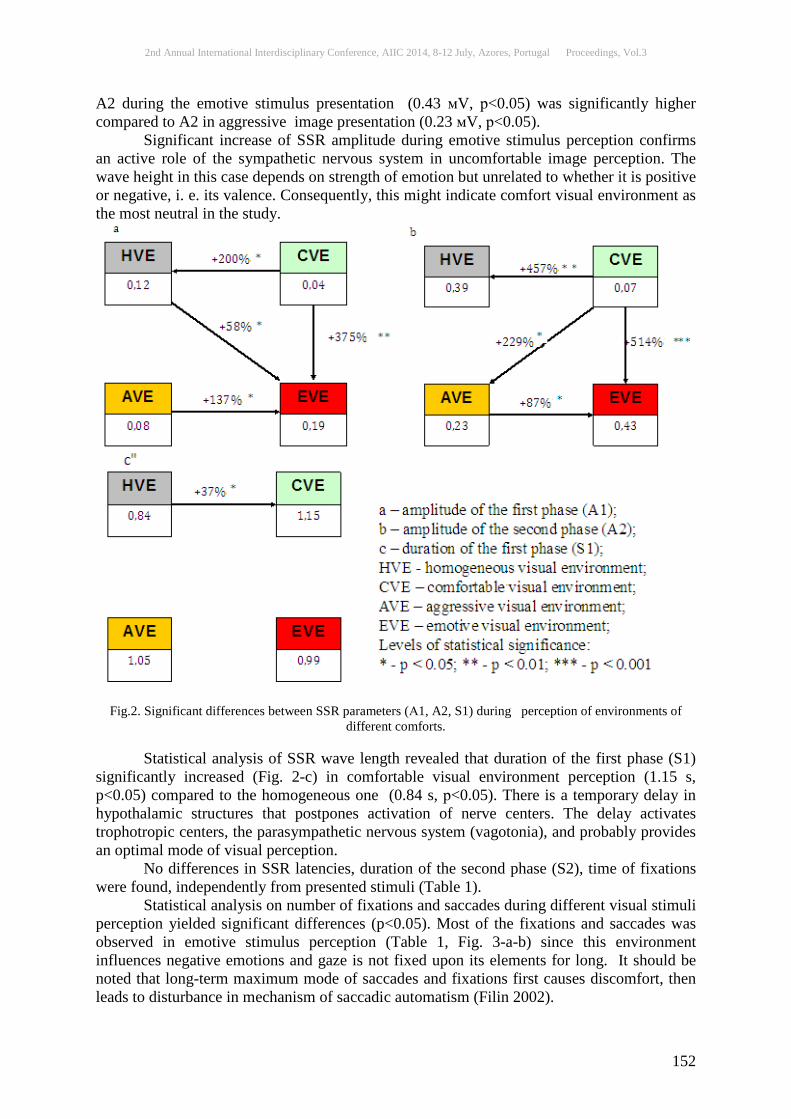
2nd Annual International Interdisciplinary Conference, AIIC 2014, 8-12 July, Azores, Portugal Proceedings, Vol.3
152
A2 during the emotive stimulus presentation (0.43 мV, р<0.05) was significantly higher compared to A2 in aggressive image presentation (0.23 мV, р<0.05).
Significant increase of SSR amplitude during emotive stimulus perception confirms an active role of the sympathetic nervous system in uncomfortable image perception. The wave height in this case depends on strength of emotion but unrelated to whether it is positive or negative, i. e. its valence. Consequently, this might indicate comfort visual environment as the most neutral in the study.
Fig.2. Significant differences between SSR parameters (А1, A2, S1) during perception of environments of
different comforts.
Statistical analysis of SSR wave length revealed that duration of the first phase (S1) significantly increased (Fig. 2-c) in comfortable visual environment perception (1.15 s, p<0.05) compared to the homogeneous one (0.84 s, р<0.05). There is a temporary delay in hypothalamic structures that postpones activation of nerve centers. The delay activates trophotropic centers, the parasympathetic nervous system (vagotonia), and probably provides an optimal mode of visual perception.
No differences in SSR latencies, duration of the second phase (S2), time of fixations were found, independently from presented stimuli (Table 1).
Statistical analysis on number of fixations and saccades during different visual stimuli perception yielded significant differences (p<0.05). Most of the fixations and saccades was observed in emotive stimulus perception (Table 1, Fig. 3-a-b) since this environment influences negative emotions and gaze is not fixed upon its elements for long. It should be noted that long-term maximum mode of saccades and fixations first causes discomfort, then leads to disturbance in mechanism of saccadic automatism (Filin 2002).
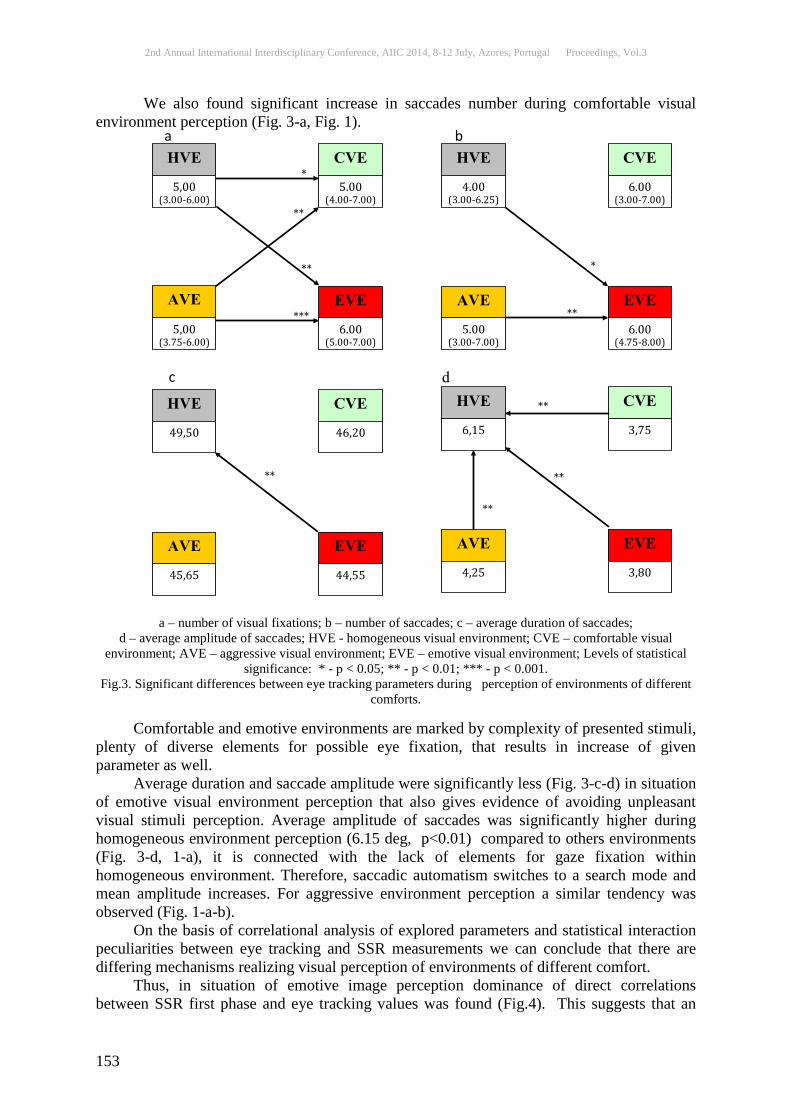
2nd Annual International Interdisciplinary Conference, AIIC 2014, 8-12 July, Azores, Portugal Proceedings, Vol.3
153
We also found significant increase in saccades number during comfortable visual environment perception (Fig. 3-a, Fig. 1).
a – number of visual fixations; b – number of saccades; c – average duration of saccades; d – average amplitude of saccades; HVE - homogeneous visual environment; CVE – comfortable visual
environment; AVE – aggressive visual environment; EVE – emotive visual environment; Levels of statistical significance: * - р < 0.05; ** - p < 0.01; *** - p < 0.001.
Fig.3. Significant differences between eye tracking parameters during perception of environments of different comforts.
Comfortable and emotive environments are marked by complexity of presented stimuli,
plenty of diverse elements for possible eye fixation, that results in increase of given parameter as well.
Average duration and saccade amplitude were significantly less (Fig. 3-c-d) in situation of emotive visual environment perception that also gives evidence of avoiding unpleasant visual stimuli perception. Average amplitude of saccades was significantly higher during homogeneous environment perception (6.15 deg, p<0.01) compared to others environments (Fig. 3-d, 1-a), it is connected with the lack of elements for gaze fixation within homogeneous environment. Therefore, saccadic automatism switches to a search mode and mean amplitude increases. For aggressive environment perception a similar tendency was observed (Fig. 1-a-b).
On the basis of correlational analysis of explored parameters and statistical interaction peculiarities between eye tracking and SSR measurements we can conclude that there are differing mechanisms realizing visual perception of environments of different comfort.
Thus, in situation of emotive image perception dominance of direct correlations between SSR first phase and eye tracking values was found (Fig.4). This suggests that an
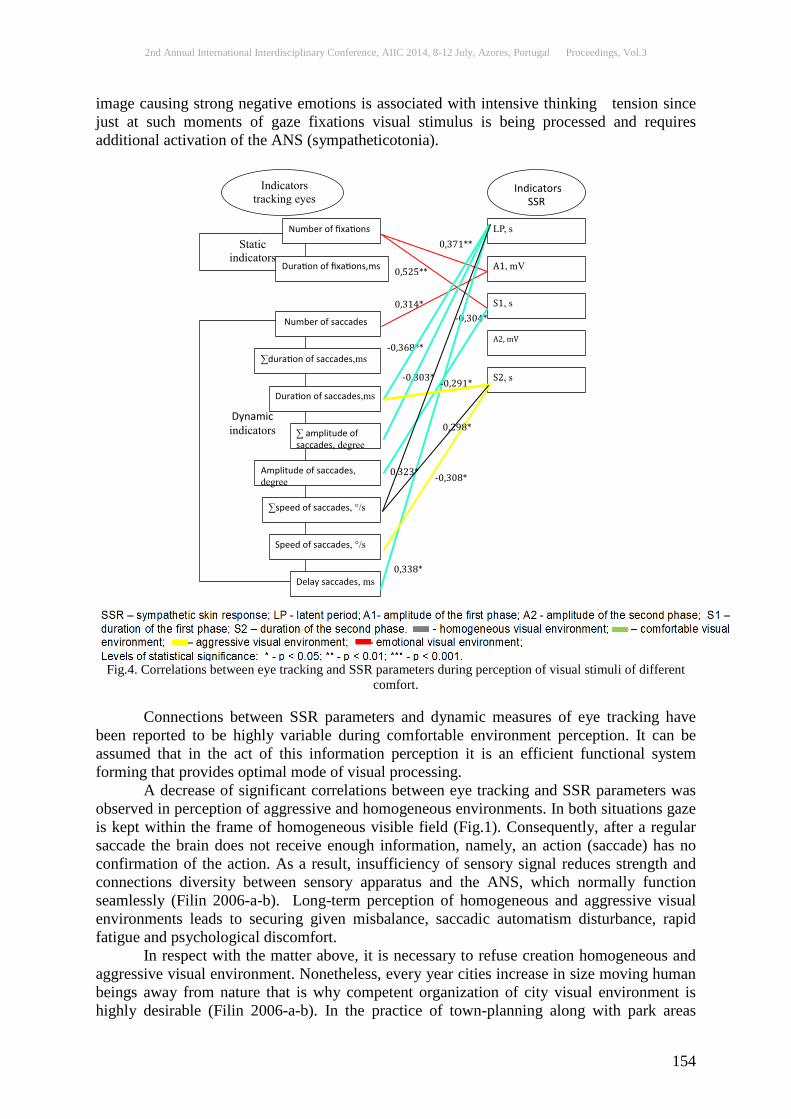
2nd Annual International Interdisciplinary Conference, AIIC 2014, 8-12 July, Azores, Portugal Proceedings, Vol.3
154
image causing strong negative emotions is associated with intensive thinking tension since just at such moments of gaze fixations visual stimulus is being processed and requires additional activation of the ANS (sympatheticotonia).
Fig.4. Correlations between eye tracking and SSR parameters during perception of visual stimuli of different
comfort.
Connections between SSR parameters and dynamic measures of eye tracking have been reported to be highly variable during comfortable environment perception. It can be assumed that in the act of this information perception it is an efficient functional system forming that provides optimal mode of visual processing.
A decrease of significant correlations between eye tracking and SSR parameters was observed in perception of aggressive and homogeneous environments. In both situations gaze is kept within the frame of homogeneous visible field (Fig.1). Consequently, after a regular saccade the brain does not receive enough information, namely, an action (saccade) has no confirmation of the action. As a result, insufficiency of sensory signal reduces strength and connections diversity between sensory apparatus and the ANS, which normally function seamlessly (Filin 2006-a-b). Long-term perception of homogeneous and aggressive visual environments leads to securing given misbalance, saccadic automatism disturbance, rapid fatigue and psychological discomfort.
In respect with the matter above, it is necessary to refuse creation homogeneous and aggressive visual environment. Nonetheless, every year cities increase in size moving human beings away from nature that is why competent organization of city visual environment is highly desirable (Filin 2006-a-b). In the practice of town-planning along with park areas
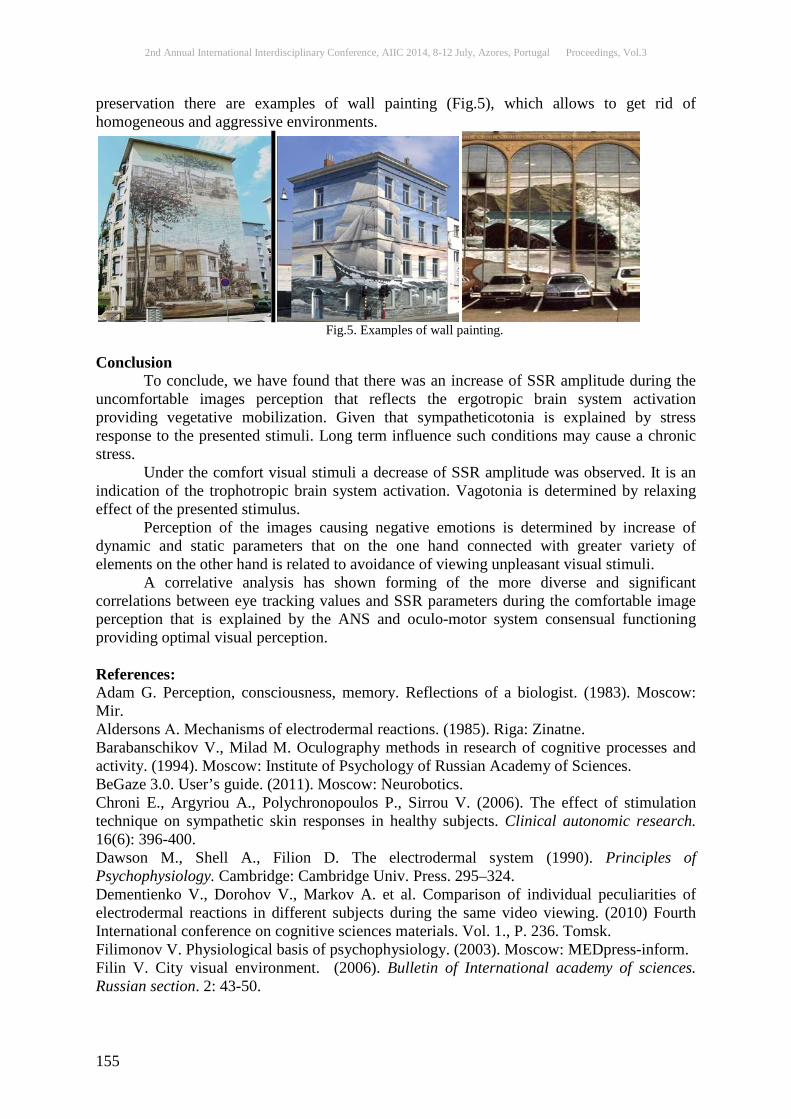
2nd Annual International Interdisciplinary Conference, AIIC 2014, 8-12 July, Azores, Portugal Proceedings, Vol.3
155
preservation there are examples of wall painting (Fig.5), which allows to get rid of homogeneous and aggressive environments.
Fig.5. Examples of wall painting.
Conclusion
To conclude, we have found that there was an increase of SSR amplitude during the uncomfortable images perception that reflects the ergotropic brain system activation providing vegetative mobilization. Given that sympatheticotonia is explained by stress response to the presented stimuli. Long term influence such conditions may cause a chronic stress.
Under the comfort visual stimuli a decrease of SSR amplitude was observed. It is an indication of the trophotropic brain system activation. Vagotonia is determined by relaxing effect of the presented stimulus.
Perception of the images causing negative emotions is determined by increase of dynamic and static parameters that on the one hand connected with greater variety of elements on the other hand is related to avoidance of viewing unpleasant visual stimuli.
A correlative analysis has shown forming of the more diverse and significant correlations between eye tracking values and SSR parameters during the comfortable image perception that is explained by the ANS and oculo-motor system consensual functioning providing optimal visual perception. References: Adam G. Perception, consciousness, memory. Reflections of a biologist. (1983). Moscow: Mir. Aldersons А. Mechanisms of electrodermal reactions. (1985). Riga: Zinatne. Barabanschikov V., Milad М. Oculography methods in research of cognitive processes and activity. (1994). Moscow: Institute of Psychology of Russian Academy of Sciences. BeGaze 3.0. User’s guide. (2011). Moscow: Neurobotics. Chroni E., Argyriou A., Polychronopoulos P., Sirrou V. (2006). The effect of stimulation technique on sympathetic skin responses in healthy subjects. Clinical autonomic research. 16(6): 396-400. Dawson M., Shell A., Filion D. The electrodermal system (1990). Principles of Psychophysiology. Cambridge: Cambridge Univ. Press. 295–324. Dementienko V., Dorohov V., Markov A. et al. Comparison of individual peculiarities of electrodermal reactions in different subjects during the same video viewing. (2010) Fourth International conference on cognitive sciences materials. Vol. 1., P. 236. Tomsk. Filimonov V. Physiological basis of psychophysiology. (2003). Moscow: MEDpress-inform. Filin V. City visual environment. (2006). Bulletin of International academy of sciences. Russian section. 2: 43-50.

2nd Annual International Interdisciplinary Conference, AIIC 2014, 8-12 July, Azores, Portugal Proceedings, Vol.3
156
Filin V. Colour environment of city as ecological factor. (1990). City colouristics (International workshop materials). Moscow. Vol. 1: 55-60. Filin V. Saccadic automatism. (2002). Мoscow: MSU. Filin V. Videoecology. What is good for the eye and what is bad. (2006). Moscow: MC«Videoecology». Gorbunov A., Nechaev N. Pecularities of changes of some vegetative and psychological parameters during visual recognizing trainings. (1990). Human physiology. 6. Hubel D. Eye, brain, and vision. (1990). US: Scientific American Library/Scientific American Books. Irie K., Wilson B., Jones R. (2002). A laser-based eye-tracking system. Behavior Research Methods, Instruments, & Computers. 34(4): 561-572. Kostin A., Golikov Yu. Conceptual basis for a combined analysis of EOG and galvanic skin response in psychic regulation of functional states research. (2010). Experimental psychology in Russia: traditions and perspectives. 515-519. Krauklis А., Aldersons А. Conditions for appearance of galvanic skin response and its dynamic regularity. (1982). Human physiology. 8(6):910–918. Nasledov A. SPSS: Data computer analysis in psychology and social sciences. (2007). Saint-Petersburg: Piter. Rappoport A. Urban environment: existing problems. (1990). Moscow: VNIITAG. 157-178. Schraa-Tam C., Broekhoven Ph., van der Geest J. et al. (2008). Cortical and cerebellar activation induced by reflexive and voluntary saccades. Experimental brain research. 192(2): 175-187. Wall painting. URL: http://sfw.so/1148906353-nastennaya-zhivopis-trompe-loeil.html (Date: 03.06.2014)
2nd Annual International Interdisciplinary Conference, AIIC 2014, 8-12 July, Azores, Portugal Proceedings, Vol.3
157
THE ANALYSIS OF BLOOD DEFECTION AND ITS COMPONENTS IN SYSTEM OF MEASURES FOR THE
PREVENTION OF INFECTION WITH TRANSFUSION AND TRANSMISSIBLE INFECTIONS
Kamal Tashtemirov Sagit Imangazinov Olga Tashtemirova
Saule Imangazinova Semey State Medical University, Semey, JSC «Medical University of Astana», Astana,
Kazakhstan
Abstract When carrying out a monitoring of defection of a donor blood it is established that absolute defection of a blood and its components was enlarged by 3,9 times. Thus paid donors make 7,6%, and gratuitous 92,4% of total number of absolute defection. The share of infections in structure of absolute defection averages 47,6%. Frequency of occurrence of transfusion and transmissible infections among donors makes 0,6%. Antibodies of HCV, HBS Ag, Luis in 10 times more often are taped at primary donors, than at the repeated.
Keywords: Donor, blood donation, transfusion - transmissible infections Relevance Questions of safety injections of components of a donor blood to recipients are one of the most difficult in transfusiology. In recent years the problem bounds to significant increase in frequency of occurrence of HIV infection and virus hepatitises B and C at donors of a blood and plasma 1,2,3,4 was taped. According to the World Health Organization (WHO), in 2011 in the world total number of the people living with HIV, makes 34,2 million people. In Kazakhstan, according to the AIDS Republican center (RCAIDS), in 2012 2015 cases of HIV infection are registered, the indicator on 100 thousand of population made 12,0 (in 2011 of-2006 cases, an indicator –12,2), in comparison with the similar period of last year , noted the growth on 9 cases. In Kazakhstan, according to the AIDS Republican center, the epidemiological situation on HIV infection as a result of systematic antiepidemic actions is in recent years stabilized and is at the concentrated stage. Level of diffusion of an infection among the population doesn't exceed 0,2% that several times below the average level in the region of Eastern Europe and Central Asia. In 2012, 2015 cases of HIV infection are registered, the indicator on 100 thousand of population made 12,0 5. In structure of the HIV-infected donors 97% - the gratuitous donors, more than 90% - persons of risky behavior – consumers of the injecting drugs released from jails and having sexual contacts of raised risk 6,7. Among the infected people, amount of people from 20 to 39 years old is 72,3%. The number of sick women to 42% was enlarged. Unemployed citizens make the taped cases of HIV infection of 63%. Among the registered HIV-infected in 38,2% cases infection was the result of injection consumption of narcotics, 57,8% - share of a sexual way of transfer. Despite high level of modern methods of preparation, processing, conservation and storage, immune serologic diagnostics and testing of a blood of donors on virus and bacterial agents,
2nd Annual International Interdisciplinary Conference, AIIC 2014, 8-12 July, Azores, Portugal Proceedings, Vol.3
158
to completely exclude the risk of immunologic post transfusion reactions and complications development, and also a transfer of transfusion and transmissible infections (hepatitises B, C, HIV, cytomegaloviruses) at transfusions of a donor blood isn't represented as possible 8,9,10,11,12. Thereby recipients of components and blood preparations were insufficiently protected from transfusion and transmissible infections 13,14,15. The majority of researchers consider asymptomatic carriers as the main source of transfer of infections, which can be potential donors with lack of any implications of disease 16,17,18. It leads to fast diffusion of these infections in groups of high risk. The high risk of infection is characteristic for patients with a narcomania, the persons, having casual sexual communications, homosexuals, for persons with the hemotransfusionic anamnesis, and also some categories of medical workers from departments of a hemodialysis, a hematology, hemotransfusion stations. Thus the main mechanism of transfer of originators is parenteral19,20. For the first time the taped and again arising infectious diseases frame threat to all world community and put parts of the population of a planet serious humanitarian, economic and social injury 21,22. Some authors bind diffusion of infectious diseases to questions of global safety 23: In some countries of Central Asia prevalence of parenteral infections among donors almost the same, as among the population as a whole ,which testifies to an incompetence of system of attraction and selection of donors, including a stage of laboratory screening on existence of infections. For example, prevalence of hepatitis C among donors of a blood is estimated at 3% that practically corresponds to its prevalence among the population as a whole24,25. The augmentation of a share of donor blood defection because of its infection not only leads to rising of cost of blood services , but also has an adverse effect on security donor blood 26. We have carried out a monitoring of donor blood defection before donations and after donations. Research material and methods The object of the research is- donors who have addressed in the Center of a blood of the Pavlodar region (PRBC) during 2008-2012. The collecting of epidemiological donors data was carried out during the using the standard questionnaire approved by the order MH RK No.332 from 08.07.2009. Questionnaires were filled in on all donors who were handing over a blood or its components in stationary and visiting conditions. Social "portrait" of donors was analyzed according to the following characteristics: sex; age; became the donor for the first time, repeatedly; social status; place of residence (city, village). Besides, the ratio of "paid" and "gratuitous" donors in the Pavlodar region was studied. The materials of study also were: - annual reports on PRBC work from 2008 for 2012; - log-books of laboratory results of research on HIV, virus hepatitises B and C, a lues; - log-books of laboratory blood analyses and urine, biochemical blood analyses (protein and albuminous fractions of blood, bilirubin and hepatic assays, thymol turbidity test, bacteriological researches of materials etc.); At a stage of laboratory screening, for IFA of HIV diagnostics of an infection (HIV), virus hepatitises In (HBsAg) and C (HCV), a lues (Luis) carried out on test system хanti-HiV "Murеx HIV-1.2.0" the producer (Murex Biotech Limited, the USA), anti-HCV "Murexanti-HCV.Version 4.0" the producer (Murex Biotech Limited, the USA), HBsAg "Murex HBsAg. Version 3" producer (Murex Biotech Limited, USA), anti-Luis "ISE * Syphilis" producer (Murex Biotech Limited, USA). Inside laboratory quality control was carried out daily when using PCR. To identify VHC RNA and DNA of HBV the following commercial sets of
2nd Annual International Interdisciplinary Conference, AIIC 2014, 8-12 July, Azores, Portugal Proceedings, Vol.3
159
production of Center Scientific-Research Institute of Epidemiologywere used: in a format of real time: Amplisens HCV-FRT (qualitative test for VHC RNA), Amplisens of HBV-FRT (qualitative test for DNA of HBV), Amplisens of HCV-Monitor-FRT (quantitative test for VHC RNA), Amplisens of HBV-Monitor-FRT (quantitative test for DNA of HBV). In a format of electrophoretic detection: Amplisens hbv-470/770-BKO (qualitative test for DNA of HBV), Amplisens of HCV-240/440-BKO (qualitative test for VHC RNA, Ampli-Sens-50-RHCV-genotip" (definition of genotypes of VHC). The declared analytical sensitivity of test systems makes for Amplisens of HCV-FRT - 100 ME/ml, for Amplisens of HCV-240/440-BKO – 1000 ME/ml, for Amplisens of HBV-FRT – 100 repetitions/ml, for Amplisens of HBV-470/770-BKO - 1000 repetitions/ml. Linear range of measurement of test system of Amplisens of HCV-Monitor-FRT - 500–50 million. ME/ml, Amplisens of HBV-Monitor-FRT - 300–100 million repetitions/ml. Results of the research On the average 3420 people (22,4%) aren't allowed to donations, 66,1% from them are denied by the doctor 19,3% according to results of primary laboratory research , 11,6% are the share of data of the uniform donor information center (UDIC) and 3% for other reasons. Data are presented in table 1.
Table 1 - Monitoring of data on removal of donors before donations Year 2008 2009 2010 2011 2012
1 2 3 4 5 6 Population of the area 742,9 748,8 748,8 748,8 748,8
Total addresses 13 139
15 347
16 130
16 389
15 418
Taken away the addresses at a stage before donation of a blood and its components, total 3 349 3 437 3 488 3 461 3 365
Discharge share at a stage before donation of a blood and its components (%) 25,5% 22,4% 22% 21% 22%
from them, according to UDIC 504 490 246 372 366 Discharge share according to UDIC from total number of
detached (%) 15,0% 14,3% 7,1% 10,7% 10,9%
from them, by the doctor on appointment 2 170 2 486 2 655 2 299 1 699 Share of discharge by the doctor on appointment from total
number of detached (%) 64,8% 72,3% 76,1% 66,4% 50,5%
from them, by results of primary laboratory inspection 499 398 585 790 1 022 Discharge share by results of primary laboratory inspection
from total number of detached (%) 14,9% 11,6% 16,8% 22,8% 30,4%
from them, for other reasons 176 63 2 0 278
According to the table 1 it is visible that the number of the donors who haven't been allowed before donations according to UDIC, decreases every year and the last two years of observation are made by 10,8%. Whereas the share discharged by results of primary laboratory analysis was enlarged from 14,9% in 2008 to 30,4% for 2012. This situation speaks about imperfect system of UDIC. The share of donors discharged after an appointment also decreases, but remains rather high. This fact can be correlated to that the larger percent of 71,6% is made by age group from 18 to 39 years from which workers 51% fall to the share that shows low level of preventive examinations.
After a blood sampling at the allowed donors to donation testing of components of a blood for transfusion-transmissible infections in the conditions of PRBC laboratory is held. Allocate absolute defection and relative defection of a donor blood and its components. Dynamics of indicators of absolute defections in five years is presented in picture1.
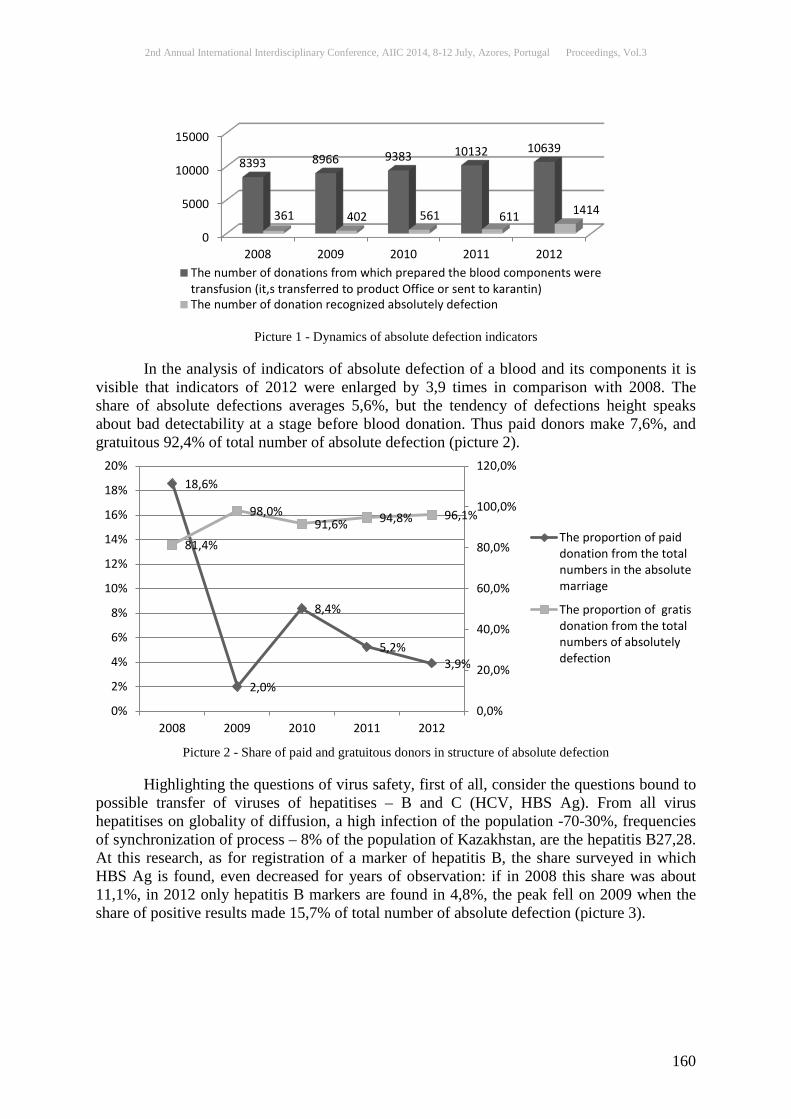
2nd Annual International Interdisciplinary Conference, AIIC 2014, 8-12 July, Azores, Portugal Proceedings, Vol.3
160
Picture 1 - Dynamics of absolute defection indicators
In the analysis of indicators of absolute defection of a blood and its components it is visible that indicators of 2012 were enlarged by 3,9 times in comparison with 2008. The share of absolute defections averages 5,6%, but the tendency of defections height speaks about bad detectability at a stage before blood donation. Thus paid donors make 7,6%, and gratuitous 92,4% of total number of absolute defection (picture 2).
Picture 2 - Share of paid and gratuitous donors in structure of absolute defection
Highlighting the questions of virus safety, first of all, consider the questions bound to possible transfer of viruses of hepatitises – B and C (HCV, HBS Ag). From all virus hepatitises on globality of diffusion, a high infection of the population -70-30%, frequencies of synchronization of process – 8% of the population of Kazakhstan, are the hepatitis B27,28. At this research, as for registration of a marker of hepatitis B, the share surveyed in which HBS Ag is found, even decreased for years of observation: if in 2008 this share was about 11,1%, in 2012 only hepatitis B markers are found in 4,8%, the peak fell on 2009 when the share of positive results made 15,7% of total number of absolute defection (picture 3).
0
5000
10000
15000
2008 2009 2010 2011 2012
8393 8966 9383 10132 10639
361 402 561 611 1414
The number of donations from which prepared the blood components weretransfusion (it,s transferred to product Office or sent to karantin)The number of donation recognized absolutely defection
18,6%
2,0%
8,4%
5,2% 3,9%
81,4%
98,0% 91,6% 94,8% 96,1%
0,0%
20,0%
40,0%
60,0%
80,0%
100,0%
120,0%
0%
2%
4%
6%
8%
10%
12%
14%
16%
18%
20%
2008 2009 2010 2011 2012
The proportion of paiddonation from the totalnumbers in the absolutemarriage
The proportion of gratisdonation from the totalnumbers of absolutelydefection
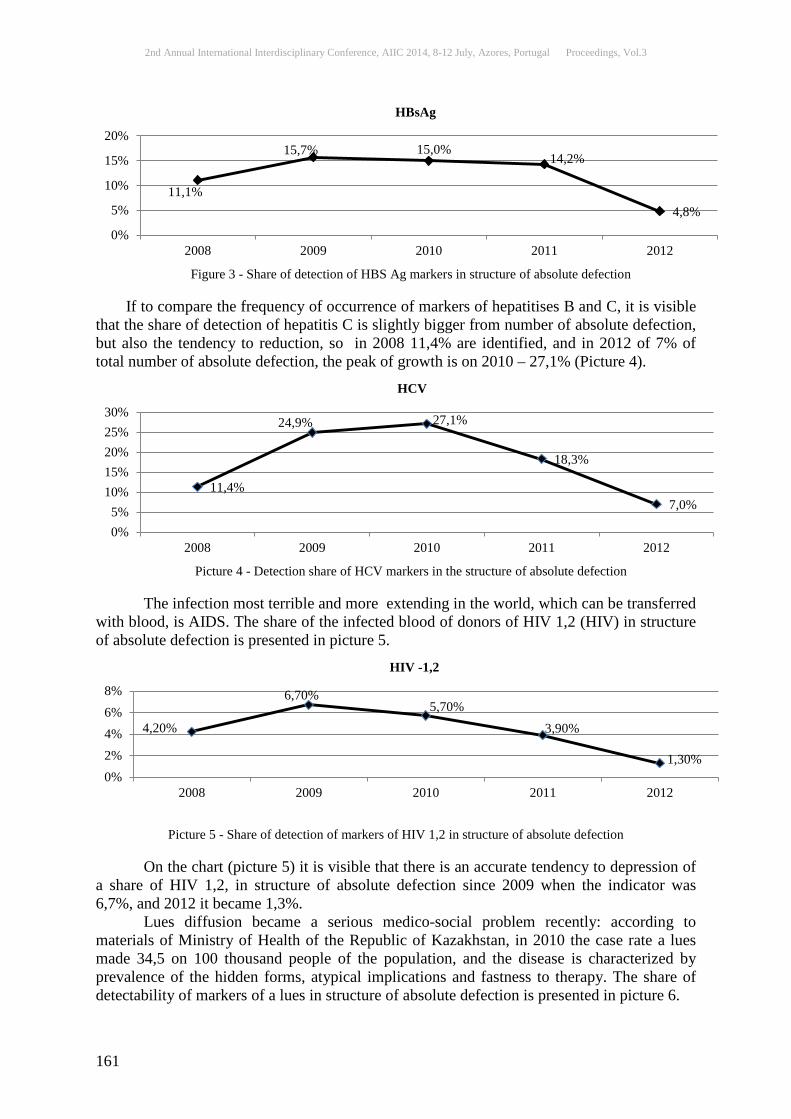
2nd Annual International Interdisciplinary Conference, AIIC 2014, 8-12 July, Azores, Portugal Proceedings, Vol.3
161
Figure 3 - Share of detection of HBS Ag markers in structure of absolute defection
If to compare the frequency of occurrence of markers of hepatitises B and C, it is visible
that the share of detection of hepatitis C is slightly bigger from number of absolute defection, but also the tendency to reduction, so in 2008 11,4% are identified, and in 2012 of 7% of total number of absolute defection, the peak of growth is on 2010 – 27,1% (Picture 4).
Picture 4 - Detection share of HCV markers in the structure of absolute defection
The infection most terrible and more extending in the world, which can be transferred
with blood, is AIDS. The share of the infected blood of donors of HIV 1,2 (HIV) in structure of absolute defection is presented in picture 5.
Picture 5 - Share of detection of markers of HIV 1,2 in structure of absolute defection
On the chart (picture 5) it is visible that there is an accurate tendency to depression of a share of HIV 1,2, in structure of absolute defection since 2009 when the indicator was 6,7%, and 2012 it became 1,3%.
Lues diffusion became a serious medico-social problem recently: according to materials of Ministry of Health of the Republic of Kazakhstan, in 2010 the case rate a lues made 34,5 on 100 thousand people of the population, and the disease is characterized by prevalence of the hidden forms, atypical implications and fastness to therapy. The share of detectability of markers of a lues in structure of absolute defection is presented in picture 6.
11,1%
15,7% 15,0% 14,2%
4,8%
0%
5%
10%
15%
20%
2008 2009 2010 2011 2012
HBsAg
11,4%
24,9% 27,1%
18,3%
7,0%
0%5%
10%15%20%25%30%
2008 2009 2010 2011 2012
HCV
4,20%
6,70% 5,70%
3,90%
1,30% 0%2%4%6%8%
2008 2009 2010 2011 2012
HIV -1,2
2nd Annual International Interdisciplinary Conference, AIIC 2014, 8-12 July, Azores, Portugal Proceedings, Vol.3
162
Picture 6 - Share of detection of lues markers in structure of absolute defection In this case, as there is a depression of a share of an infection by a lues in structure of absolute defection since 2009 when the peak reached 22,9% to 4,7% of positive results in 2012 (picture 6). Thus, the share of infections in structure of absolute defection averages 47,6%. Thus, the share of infections in structure of absolute defection averages 47,6%. The peak of growth identification of transfusion and transmissible infections after donations falls on 2009-2010 (picture 7).
Picture 7 - Share of infections in structure of absolute defection
During research, from 2008 to 2012, prevalence of markers of transfusion and transmissible infections among donors of the Pavlodar region as a whole the tendency to depression of number of the infections which peak fell on 2009-2012 is observed. HCV markers are identified more often, then follow HBS Ag, Luis , and here markers of HIV are defined 2-4 times less often (picture 8).
Picture 8 - Frequency of occurrence of transfusion and transmissible infections among donors of the Pavlodar
region
14,1%
22,9%
12,8% 11,9%
4,7% 0%
10%
20%
30%
2008 2009 2010 2011 2012
Luis
0%
20%
40%
60%
80%
2008 2009 2010 2011 2012
40,7%
70,1% 60,60%
48,40%
18%
0,4% 0,5%
0,7%
0,7%
0,6%
0,6%
0,4%
0,8%
1,2%
0,9%
0,8%
0,8%
0,5%
0,8%
0,6%
0,6%
0,6%
0,6%
0,2%
0,2%
0,3%
0,2%
0,2%
0,2%
0,0% 0,2% 0,4% 0,6% 0,8% 1,0% 1,2% 1,4%
2008
2009
2010
2011
2012
HIV-1,2 Luis HCV HBsAg
2nd Annual International Interdisciplinary Conference, AIIC 2014, 8-12 July, Azores, Portugal Proceedings, Vol.3
163
Blood of donors on transfusion and transmissible infections are investigated twice, all initially positive results are sent for repeated research. Data of the repeated research of a donor blood are provided in table 2.
Table 2 - Data of repeated research of a donor blood and its components on transfusion and transmissible infections
Year 2008 2009 2010 2011 2012 Number of donations of a blood and its components 9790 11910 12642 12928 12053
Initially positive (or "a gray zone") HIV-1,2 15 27 32 24 19 from them, it is confirmed with HIV-1,2 1 2 3 3 2
Initially positive (or "a gray zone") HBsAg 40 63 84 87 68 from them, HBsAg is confirmed 40 57 77 68 54
Initially positive (or "a gray zone") HCV 41 100 152 112 99 from them, HCV is confirmed 41 97 106 86 92
Initially positive (or "a gray zone") on a lues 51 92 72 73 67 from them, it is confirmed on a lues 50 88 60 59 51
By data given in table 2 it is visible that the greatest number of confirmations of an
infection of donors becomes perceptible HCV, HBS Ag, Luis. HIV is more rare. The share of the confirmed results on existence in a blood of donors of markers of HCV averaged 87,3%, HBsAg - 87,9%, Luis of 86,8% and HIV-1,2 – 9,3% (figure 9).
Picture 9 - Share of the confirmed results on transfusion and transmissible infections among donors of the
Pavlodar region One of the factors of the increased risk of transfer of transfusion and transmissible infections according to the series of authors 29, are primary donors - as a rule, people of younger age. We studied detectability of markers of transfusion and transmissible infections at the active donors who are constantly handing over a blood of 5-6 times a year, and for the first time come to hand over a blood. Data are provided in table 3.
Table 3 - Data of inspections of donors on existence of antibodies to transfusion and transmissible infections
Mar
ker
s
Year 2008 2009 2010 2011 2012 Total amount of donors, n n=9790 n=11910 n=12642 n=12928 n=12053
HIV
1,2
Primary donors
abs. 14 25 29 24 19 % 0,14% 0,21% 0,23% 0,19% 0,16%
Repeated donors
abs. 1 2 3 0 0 % 0,01% 0,02% 0,02% 0 0
HB
sAg Primary
donors abs. 36 57 76 78 61 % 0,37% 0,48% 0,60% 0,60% 0,51%
Repeated donors
abs. 4 6 8 9 7 % 0,04% 0,05% 0,06% 0,07% 0,06%
HC
V Primary
donors abs. 37 90 137 101 89 % 0,38% 0,76% 1,08% 0,78% 0,74%
Repeated abs. 4 10 15 11 10
0%
50%
100%
confirmed HIV -1.2
confirmed byHBsAg
confirmed HCV confirmed byLuis
9,30%
87,90% 87,30% 86,80%
2nd Annual International Interdisciplinary Conference, AIIC 2014, 8-12 July, Azores, Portugal Proceedings, Vol.3
164
donors % 0,04% 0,08% 0,12% 0,09% 0,08%
Lui
s
Primary donors
abs. 46 83 65 66 61 % 0,47% 0,70% 0,51% 0,51% 0,51%
Repeated donors
abs. 5 9 7 7 6 % 0,05% 0,08% 0,06% 0,05% 0,05%
From data of table 3 it is visible that antibodies of HCV, HBS Ag, Luis in 10 times more often are taped at primary donors, than at the repeated ones. According to research, 0,75% of primary donors are infected with hepatitis C, further on detectability of antibodies to transfusion and transmissible infections are a lues – 0,54% of primary donors and hepatitis B – 0,51% of primary donors. Wasn't an exception and identification of antibodies to HIV: in most cases they were taped only at initially surveyed donors in 0,19% of cases. Our results confirm the opinion, that primary donors are a factor of the increased risk of transfer of transfusion and transmissible infections. Conclusion Therefore, an absolute defection of blood and its components was enlarged by 3,9 times in comparison with 2008. Thus paid donors make 7,6%, and gratuitous 92,4% of total number of absolute defection. The share of infections in structure of absolute defections averages 47,6%. The peak of identification growth of transfusion and transmissible infections after donations falls on 2009-2010. Frequency of occurrence of transfusion and transmissible infections among donors makes 0,6%. HCV markers – 0,8% are identified more often, then goes HBS Ag, Luis – 0,6% , and here markers of HIV are defined 2-4 times less often – 0,2%. The share of the confirmed results on existence in a blood of donors of markers of HCV made 87,3%, HBsAg - 87,9%, Luis of 86,8% and HIV of-1,2 - 9,3%. Antibodies of HCV, HBS Ag, Luis in 10 times more often are identified at primary donors, than at the repeated ones. References: Golosova T.V. Bondarenko I.A. Transfusion infections: epidemiology, diagnostics in blood service//the Messenger of service of a blood, 2007; 1; 16-21 . Shakhgildyan I.V. Mikhaylov M. I. Onishchenko G.G. Parenteral virus hepatitises (epidemiology, diagnostics, prophylaxis). - M.: VUNMTS MZ RF Public Educational Institution, 2003; 384 . Prati D. Transmission of hepatitis With virus by blood transfusions and other medical procedures: A global review//Journal of Hepatology, 2006; V.45; 607-616 . Cherepanova E.A. Shoykhet T.Yu. Elykomov V.A. Ways of depression of defection of a donor blood on hepatitises at the expense of augmentation of frequency rate donor blood donation//Transfusiology in Siberia, the collection of scientific and practical articles. Barnaul, 2003; 54-55 Bionomics and health: Information release, 2013 Matros O. I.Clinical-epidemiological characteristic of mikst-hepatitises in comparison with mono - hepatitises A, B and C in the Altai territory. Autoref. yew. . edging. medical sciences, Novosibirsk, 2006; 10-12 . Shakhgildyan I.V. Epidemiological features of virus hepatitises B and C//Voyen. - medical magazine. 2004:T.323; 12-20 Kuznetsova H.H, Bondarenko I.A. The comparative analysis of frequency of diffusion of markers of the virus infections transmitted with a blood among the donorosposobny population//New in transfusiology, 2001:Issue. 9; 45-48 .
2nd Annual International Interdisciplinary Conference, AIIC 2014, 8-12 July, Azores, Portugal Proceedings, Vol.3
165
Kudinov V.G ; Kudinova E.V. About a virussafety of a donor blood in the Samara region//the Messenger of Interregional Association "Health Care of the Volga Region". Samara, 2004: No. 12; 57-58 . Golosova T.V.haemo transmissible infections: risk factors, laboratory diagnostics, virus safety of hemotransfusions/M: Medical news agency, 2003; 192 . Vasilyev N. I. Algorithm of ensuring infectious safety of components of a blood//Messenger of service of a blood of Russia, 2007:№4; 15-19 . Yershov O. N. modern implications of epidemic process of hepatitis C, activity of natural ways of transfer and improvement of prophylaxis of this infection: Autoref. yew. . Dr.s of medical sciences: M, 2006; 3-6 Savchenko V. G., Paravichnikov E.N. Treatment of acute leukoses/M: Medical press inform, 2004; 349-356 . Bush M.P. Closing the windows on viral transmission by blood transfusion. In: Stramer SL. editor. Blood safety in the new millennium.//Bethesda, MD: American Assosiation of Blood Banks; 2001; 33-54 . Planitzer C. Modrof J. Kreil T.R. West Nile Virus Neutralization by US plasma-derived Immunoglobulin Products.//TheJournalofInfectiousDiseases, 2007 Aug 1:V. 196(3); 435-440 . Kasyanova.D. Ryzhkovat.V. Chechetkina A.V. Improvement of virus safety of haemo component therapy at donors//the Medical immunology, 2007: No. 2-3; 227-228 . Kosov A.I. Frequency of identification of markers of virus infections by the IFA method at gratuitous donors//hematology and hemotransfusion Problems, 2001: No. 3; 55 . Lutz G. Guerti Virus safety of human blood, plazma and derivated products.//TrombosisReasearch, 2002:V. 31(1); River 39-45. Vorobyov A.I. Gorodetsky V. M. Methodical references according to the laboratory prevention of transfer of HIV//the Hematology and transfusiology, 2007: No. 6; 7-10 . Melnikova V. N., Kiryanov G. Yu. Filippova of O. I. Karantinization of leuco filtered donor erythrocytes is an important link in ensuring infectious and immunologic safety of hemotransfusions//Transfusiology, 2007: No. 1-24; 63-64 . Fauci S. "Infectious Diseases: Considerations for the 21st Century, "//Clinical Infectious Diseases, 2001: V. 32; 675–85 . WHO document: Macroeconomics and Health: Investing in Health for Economic Development (Geneva: WHO Commission on Macroeconomics and Health, 2001). Cecchine G. and Moore M. Infectious Disease and National Security: Strategic Information Needs//Santa Monica, CA: RAND Corporation, 2006. Luby S et al. "Evaluation of Blood Bank Practices in Karachi, Pakistan, and the Government’s Response"//Health Policy and Planning, 2000:V.15 (2); 217-222 . Cruz J. R. et al. Safety of Blood Supply in the Caribbean Countries: Role of Screening Blood Donors for Markers of Hepatitis B and C Virus//Journal of Clinical Virology, 2005:V.34 (2); 95-98 . Glynn, S.A. et al. "Trends in incidence and prevalence of major transfusion-transmissible viral infections in US blood donors, 1991 to 1996"//JAMA, 2000:V.284; 229-235 . Shuratov I.KH. Modern problems of virus hepatitises in the conditions of Kazakhstan//Hygiene, epidy. Immune biology 1999: No. 1; Page 25-28. Idrisova R. S. Virus hepatitises - the situation review in Kazakhstan//Theses congr. hepatologists of Kazakhstan, Alma-Ata, 2000; 1-2 . Shevchenko YU.L. Zhiburt E.B. Safe transfusion of blood.//St. Petersburg, 2000; 154-155:173-174,186 .
2nd Annual International Interdisciplinary Conference, AIIC 2014, 8-12 July, Azores, Portugal Proceedings, Vol.3
166
EVALUATION OF THE EFFECTIVENESS OF PHYSIOTHERAPY BASED ON THE LOCATION THE JOINT
CHANGES IN RHEUMATOID ARTHRITIS
Agnieszka Krawczyk-Wasielewska Chair of Rheumatology and Rehabilitation Poznan University of Medical Science, Poland
Ewa Mojs Railway Spa Hospital, Ciechocinek, Poland
Roksana Malak Chair of Rheumatology and Rehabilitation Poznan University of Medical Science, Poland
Przemysław Keczmer Chair of Rheumatology and Rehabilitation Poznan University of Medical Science, Poland
Piotr Kalmus Department of Psychology, Poznan University of Medical Science, Poland
Dariusz Łucka Chair of Rheumatology and Rehabilitation Poznan University of Medical Science, Poland
Włodzimierz Samborski Chair of Rheumatology and Rehabilitation Poznan University of Medical Science, Poland
Abstract Rheumatoid arthritis (RA) is a chronic connective tissue disease. Typical first signs of
diseases are pain and edemas of small hand and foot joint, but sometimes first symptoms regard less typical place like one big joint. Pain became the barrier for normal functioning patients with RA, therefore wide range of physical therapy is needed. The aim of this study was evaluation of pain reduction in physical therapy on diseases changed joint. The study involved 50 patients with RA, where mean of age was 47,5. In this group fallowing physical therapy techniques were used: cryotherapy, ultrasound therapy, laser therapy, electrical stimulation TENS, iontophoresis, diadynamic and magnetic therapy. In studied group first signs of diseases were similar like in literature. The presented results indicate pain reduction on all treatment filled join. Used physical therapy techniques were more effective on hand joints then on foot joints.
Keywords: Rheumatoid arthritis, physical therapy, pain. Rheumatoid arthritis (RA) is a chronic, progressive inflammatory process that leads to the destruction of joint tissues, distortion and dysfunction of joints. The disease has the form of remission and exacerbation. The changes are irreversible and deepen during subsequent episodes, leading to disability and dependence on the help of others. The process always begins within synovial joints (hypertrophy, inflammatory infiltration), which is the inner layer of the joint capsule, that produces the synovial fluid for painless movement of the articular surfaces against each other. The disease may result in changes in many organs and systems [1]. The first symptoms of RA are usually developed between the ages of 30 and 50. Despite this, the excessive lengths of the disease, cause that the consequences of the disease

2nd Annual International Interdisciplinary Conference, AIIC 2014, 8-12 July, Azores, Portugal Proceedings, Vol.3
167
are observed frequently in the elderly. It is believed that more than 5 % of women over 75 years of age are afflicted with this disease. The frequency in women (three times more often) is explained by the influence of the sex hormones. Typical symptoms for early rheumatoid arthritis are pain and swelling of joints symmetrical metacarpophalangeal and proximal interphalangeal phalangeal, often metatarsophalangeal joints. Threading the joint pain, accompanied by morning stiffness (that takes more than an hour) are typical. Inflamed joints may be swollen. A characteristic feature of RA is symmetrical joint involvement. RA can start as less typical changes on a large joints (usually the knee). As the disease progresses changes concern the increasing number of joints in the direction from the periphery to the center line of the body [2]. Most patients with synovial changes has also systemic symptoms, which are determinants of the inflammatory reaction (grade fever, night sweats, loss of appetite, fatigue, malaise, weight loss). In about 10-15 % of cases, the beginning is acute. Although the disease is associated with a history of infection, trauma or stress, psychosocial well motivated, symptoms occur suddenly, without obvious cause. During the course of the disease produced RA distortion characteristic resulting from the destruction of the hands articular stabilization of disorders of joints and tendons displacements [3]. The basis of the procedure with the patient is taking medications that inhibit disease or drug therapy. Rehabilitation is a supplement to pharmacotherapy and should be applied consistently. This type of therapy is to restore the patient efficiency in everyday life. Even taking the treatment, up to 7% of patients after five years is invalided, and after ten years it concerns already 50% of patients, most of them are not able to take work [4]. That is why it is very important to take rehabilitation as early as possible, to help patients adapt to already occurred and prevent further distortion. In rheumatoid arthritis, are used both physical treatments, as well as treatment of motion (kinetic therapy). Physiotherapy is recommended for patients with RA include thermotherapy, laser bio-stimulation, ultrasound, TENS electrostimulation [5]. Aim of the study Evaluation of the impact number of occupied arthritis and the type of joint on the effectiveness of physiotherapy Material and method
The research material was a group of 50 patients (36 women and 14 men) diagnosed with rheumatoid arthritis (based on diagnostic criteria proposed by the American College of Reumatology). The criterion for determining membership in the patient group were subacute phase or phase remission and age between 20 - 75 years of age (mean age 47.5 years). Patients were covered by treatment group, in which in addition to physical therapy continuously used pharmacotherapy.
Respondents were asked to complete the questionnaire before treatment and after two weeks of hospitalization. The survey concerned the place and the way the onset of symptoms, the existing changes and distortions, painful joints and the same physical therapy.
Patients were used from 2 to 4 physiotherapy methods (cryotherapy, ultrasound, laser, TENS, iontophoresis, diadynamic and the magnetic field) in the series corresponding to the diagnosis and general condition of the patient. Results The inflammatory process in 19 (38%) patients started in one group of joints such as the knees or just hand joints, other patients the first symptoms of the disease appeared in at least two joints. In all cases, the joints were occupied symmetrically. Changes related to joint

2nd Annual International Interdisciplinary Conference, AIIC 2014, 8-12 July, Azores, Portugal Proceedings, Vol.3
168
hands: 18 respondents (36%) joints of the thumb, and 21 (42%) joints of the fingers II - V; 9 patients (18%) wrists, elbows - 2 patients (4%), shoulder joints in 14 patients (28%), cervical spine - 4 people (8%), 6 (12%) hips, 16 (32% ) knees, ankle joints 10 (20%), the joints of the toes 5 (10%). Hand joints were the place of the first appearance of symptoms in 30 patients (60%), and foot joints in 31 patients (62%) The exact distribution of the onset of symptoms shows a table 1
Table 1 Place occurrence of the first symptoms 1 inflamed joint 2 and more inflamed joints thumb joint 1 upper limb 10
joints of the fingers II - V 0 lower limb 0
wrists joint 1 Upper and lower limb 14
shoulder joint 4 Spine and limbs 2 elbow joint 0
cervical spine joint 2 hip joint 2 knee joint 10 ankle joint 3 foot joints 1
Before taking the treatment as joints provide the most pain indicated: the joints of the
thumb 15 people (30%), joints of fingers 2-5 of 20 people (40%), shoulder joints of 18 people (36%), cervical spine 15 (30%), knee joints in 24 patients (48%), 15 patients ankles (30%). After treatment joints that provide the most pain were the joints of the thumb 12 people (24%), joints of fingers 2-5 of 12 people (24%), shoulder joints of 18 people (36%), cervical spine 15 (30%), knee joints in 14 patients (28%). To treatment resulted in reduction of pain in all patients in all joints. It should be noted that some of the patients reported as the most painful one joint, but the majority of cases, the most painful subjects found 2-4 joints simultaneously. The relationships between the most painful joints before and after treatment shows a table 2.
Table 2 Joints provide the most pain
Number of reviews evaluate joint as the most painful
Before
treatment After
treatment thumb joint 15 12
joints of the fingers II - V 20 12 wrists joint 9 6
shoulder joint 18 14 elbow joint 4 2
cervical spine joint 15 8 hip joint 10 8
knee joint 24 21 ankle joint 15 4 foot joints 5 4
In the study group observed a very weak (r=0,18; p>0,05) relationship between the
number of affected joints and the effectiveness of therapy in the reduction of pain. In the study group observed a very weak (r=0,23; p>0,05) relationship between the number of affected joints and the degree of disability in HAQ. The more the affected joints patient had, the higher degree of disability was observed.

2nd Annual International Interdisciplinary Conference, AIIC 2014, 8-12 July, Azores, Portugal Proceedings, Vol.3
169
Discussion According to Zimmermann- Górska location of the primary inflammatory changes are
metacarpophalangeal joints phalanges, proximal interphalangeal joints of hands and wrists. Much less are occupied at the beginning of the foot joints and large joints [1]. Infested joints at the beginning of the disease by Bruckl it in 39% are hand joints, 16% of the wrists, elbows 2%, 7% joints of shoulder, cervical spine 4%, 2% hip joints, knee joint 15%, 7% feet joints [6]. Filipowicz-Sosnowska and common. given that the first symptoms appear in 35-40% of the joints of fingers 2-5, 25-30% in the joints of thumb, in 12-18% in wrist, in the knee joint and ankle joints in 10-15% cases, the joints of the big toe and shoulder in 6-10% in the cervical spine in 3-4% and degrees elbows in 2-3% of cases [7]. The study showed a greater share of large joints in early disease, than serve other sources. This difference may be due to the fact that some of the respondents gave as a place of appearance of the first symptoms more than one joint. You can also assume that the pre-existing complaints from the small joints were not so troublesome to the respondents considered them as the first symptom of the disease and the appearance of inflammation in the large joints had a violent course.
The first symptoms in 24 cases appeared in one joint, in 10 patients with 2 or more joints of the upper limbs, in 14 respondents in two or more joints of the upper limb and lower at the same time, in 2 cases the changes occurred in the extremities and spine. The conducted research shows that inflammation often begins with the hands and wrists, than from the feet and ankles, which agrees with data from the literature [6, 1]. In the later stages of the disease are almost all affected joints. Free from the disease are interphalangeal joints further, thoracic and lumbar spine [1]. Research shows that among respondents significantly more frequent changes in the hip joint, shoulder and ankle than the literature. Can’t be excluded that in the group there are also changes of a degenerative arthritis and degradation associated with age. Conclusion The inflammatory process often begins with the hands and wrists, than from the feet and ankles, which agrees with data from the literature. Applied physical therapy to decrease pain in all joints treated. Top react to the applied treatment was in ankle, joints of the fingers and joints of the cervical spine, the lowest joints of the toes, hips and elbows. Hand joints responded better to the applied physical therapy than the foot joints. References: Zimmermann-Górska I. Choroby reumatyczne. PZWL Warszawa 2004, 23-24, 39-40, 88-105, 114-159. Rosławski A. Reumatologia praktyczna. Wrocław 1998, 7-14. Rosławski A. Podstawy fizjoterapii w chorobach reumatycznych. Wrocław 1998, 5-28. Leigh J.P, Fries J.F, Parikh N. Severity of disability and duration of disease in rheumatoid arthritis. Journal of Reumatology 1992; 19: 1906-1911. Kuncewicz E, Gajewska E, Atarowska M, Sobieska M, Samborski W. Postępowanie fizjoterapeutyczne w reumatoidalnym zapaleniu stawów. Nowiny lekarskie 2005; 74, 2: 199-203. Brückle W. Reumatoidalne zapalenie stawów rozpoznanie, przebieg, leczenie. Warszawa 2000, 13-31. Filipowicz-Sosnowska A, Przygodzka M. Wczesne reumatoidalne zapalenie stawów – implikacje kliniczne. Terapia 2001, 6; 108: www.terapia.com.pl
2nd Annual International Interdisciplinary Conference, AIIC 2014, 8-12 July, Azores, Portugal Proceedings, Vol.3
170
SACROILIAC JOINT SYNDROME – DESCRIPTION OF PAIN ETIOLOGY
Agnieszka Krawczyk-Wasielewska
Chair of Rheumatology and Rehabilitation, Poznan University of Medical Science, Poland Elżbieta Skorupska
Chair of Rheumatology and Rehabilitation, Poznan University of Medical Science, Poland Ewa Mojs
Department of psychology, Poznan University of Medical Science, Poland Roksana Malak
Chair of Rheumatology and Rehabilitation, Poznan University of Medical Science, Poland Przemysław Keczmer
Chair of Rheumatology and Rehabilitation, Poznan University of Medical Science, Poland Piotr Kalmus
Railway Spa Hospital, Ciechocinek, Poland Włodzimierz Samborski
Chair of Rheumatology and Rehabilitation, Poznan University of Medical Science, Poland
Abstract Numerous clinical studies have supported the thesis that sacroiliac (SI) joints constitute one of the causes of spinal pain radiating to the lower limb. The pathology of SI joint has been variously defined. The majority of definitions refer to the joint structure as the potential source of pain. As far as the etiology of SI joint dysfunction is concerned, it has not been disambiguated yet. Among the main causative factors, injuries and strains of the structures surrounding the joint are noted. Joint pathology usually manifests itself by pain occurring within the area of the joint. The causes of pain may be divided into two categories: intra-articular and extra-articular. Pain caused by the SI joint may be nociceptive or neural in nature, whereas pain pattern characteristic of the joint correlates with its innervation (S2 dorsal rami) and is consistent with the localisation of radicular pain to a large extent.
Keywords: Sacroiliac joint, pain pattern, pathomechanism, lumbosacral spine pain
Clinical studies confirm the thesis indicating again the importance of the sacroiliac joints (SI) as one of the causes of back pain, proving that this joint dysfunction can cause symptoms similar to sciatica [1,2]. According to various authors, the SI joints can cause discomfort and in the case of 16% -30% of patients with pain lumbosacral spine [3,4]. Increasingly, researchers are dealing with issues of pain episode LS with radiation to the lower limb state that the majority of respondents are patients with radicular component and pseudo radicular. Dysfunction of the various structures may overlap and together cause symptoms in specific regions of the spine, and even radiation in the same area [5].
In the terminology of pain syndromes, which the source is sacroiliac joint following terms are used: SI joint dysfunction, SI joint syndrome, SI joint blockage, inflammation of the SI joint, SI joint pain [6]. It is understood that the term sacroiliac joint pain, is the presence of pain in the joint, which are the direct cause of the structure of the joint, while the

2nd Annual International Interdisciplinary Conference, AIIC 2014, 8-12 July, Azores, Portugal Proceedings, Vol.3
171
SI joint dysfunction is incorrect position or movement of the joint structures, which may, but not need cause pain [6].
Joint dysfunction is defined as a state of mechanical changes, characterized by the deviation from the expected norm (the increase or decrease) and the occurrence of abnormal movements within the joint [7]. Blocking or locking joint is called dysfunction in a joint with limited or excessive mobility of motion segment [8].
Diagnostic criteria dysfunction sacroiliac joints were developed by the International Association Society for the Study of Pain (IASP) in 1994 [9]. IASP diagnostic criteria:
1. Presence of pain around the sacroiliac joint. 2. Pain in provocation test. 3. Intraarticular injection of analgesic drug which will reduce or abolish pain
[3,6]. The etiology of the pathology of the sacroiliac joint is still not entirely clear. There are
many factors involved in the formation within the joint dysfunction. As the main source of pathology sacroiliac joint show:
1. injuries - 44% of cases (motorcycle accidents, fall on the buttocks) 2. multiple overloading the structures surrounding joint - 21% of the cases:
(lifting the slope positions torsional overload associated with pregnancy), 3. unknown factor - 35% of cases [1,10]
Direct cause of a pain around the sacroiliac joint, and in accordance with the characteristic pattern for joint pain can be divided into:
1. Intra-articular (osteoarthritis, inflammation) 2. extra- articular (change in tension of the ligaments, myofascial pain)
Joint pain originating from SI may be of nociceptive or neurogenic. Nociceptive pain is produced by irritation of pain receptors in the joint or surrounding tissues, and as a result of irritation of neurogenic nerve endings within the spinal nerve [11]. Character nociceptive pain may have its origin in the structure both inside and outside the joint [12,13], and neurogenic pain in outside joint [14].
Sacroiliac innervated with dorsal branches of spinal nerves L4-S3, with the largest share of area S1-S2 [1,15,16]. This area is also a characteristic innervation of the sciatic nerve (L4-S3), hence pathology within the joint is considered as the main cause of pain pseudo radicular (sciatica like syndrome). Pain associated with a pond SI may be transferred i.e. nature of pain may be felt at a location remote from the original source of the pain. The causes of the phenomenon described by the theory of convergence, whose inventors show that the afferent impulses from different regions converge in the same second order neuron in the central nervous system. The brain may not be able to differentiate between pain impulses transported the same way neural and having the same sensory neurons, and from various sources [17]. This can cause pain projection to the corresponding regions of the body of convergent innervation [18], in the case of the sacroiliac joint will be pain along the lower limb, hence the problems in differentiating the pain of the pain of a root. In addition, histological analysis of the bundles of nerve innervating the pond SI shows the presence of myelinated fibers and without the myelin sheath [12], indicating that both the sensory stimuli and pain can be transported from the sacroiliac joint [19]. Studies of sensory neurons within the intervertebral disc SIJ and demonstrate an increased pain sensitivity sacroiliac joints [16]. This may suggest that the pain of the joint will be indicated by the patient as more severe, and the situation surrounding the pain of both the patient give the sacroiliac joint as dominant. Intra-articular pathomechnism of pain
Among the factors affecting the occurrence of pain of intra-articular origin from increasing of mutual compression load on joint structure and inflammation are noted. Clinical studies have pointed to the dependence of lumbar spine stiffness and the SI joint. In
2nd Annual International Interdisciplinary Conference, AIIC 2014, 8-12 July, Azores, Portugal Proceedings, Vol.3
172
patients after the surgical treatment of disc herniation with lumbar spine fusion, the hypermobility of SIJ and the increase in compression load on joint structure have been observed. Load within the joint depended on the spinal area, which had been surgically immobilised [20]. Another factor that may cause mechanical strain is anatomic shortening of the lower limb. The shortening may result in the increased friction within the joint, which may lead to its pathology and pain, particularly that subchondral structure of SIJ shows great sensitivity to compressive forces [1].
The importance of the inflammatory factor, in turn, has been proven by immunohistochemical studies confirming the existence of nociceptors in the superficial layers of sacrum cartilage. The receptors react to inflammatory factors (i.e. substance P and CGRP protein), which shows that as the inflammation is initiated, SIJ structures may cause pain [13]. Suri proved that degenerative joint changes may increase nociceptor expression in cartilage [21]. Moreover, it has been noted that synovial fluid may occur beyond the joint area and, if it contains substance P, it may cause nerve irritation within the spinal area L4-S2 resulting in pain radiation into the lower limb [12,19]. Some authors claim that nociceptors are present also at the surface of both the sacroiliac and interosseous ligament [15,22]. If the inflammatory fluid finds itself beyond the area of the joint, pain receptors in the surrounding ligaments may be activated, which will become the direct cause of pain within the joint [12,19]. Extra-articular pathomechnism of pain
Among the extra-articular factors the ones the most frequently numbered are changes in ligament tension, inflammation of the ligaments and articular capsule damage [1,20,23]. Among the factors outside of the joint, usually lists the voltage changes or damage to the ligaments of the joint capsule [1,20,23]. One of the factors affecting the change in static structures of the sacroiliac joint is the period of pregnancy and childbirth. Anteversion of the sacrum during pregnancy with hormonal changes can lead to changes in mobility in the sacroiliac joints, the over-compression and shear forces [24,25]. The release of female hormones that enable relaxation of the body tissues, especially the pelvic ligament increases the range of motion and instability of the joints SI [1,26]. Irritation of the ligaments are stabilizing the sacrum: ilio-lumbar ligament, sacroiliac, cross-tumors [27]. Static disorders of the joints AI is considered to be one of the main causes of pain in the lumbosacral during pregnancy and after birth [1,6,26].
According to Pool-Goudzwaard et al. improper tension in the area of the iliolumbar ligament may lead to the limitation of the mobility of the SI joint in the sagittal plane, especially during nutation [23]. The term nutation describes the anterior-inferior motion of the sacrum against the ilium that occurs during gait. Limited nutation increases the pressure on the posterior side of the sacrum and the compression of joints [28]. How the iliolumbar ligament influences the mobility of the SIJ depend greatly on the position of the fifth lumbar vertebra. Side bending and twisting of the lumbar spine limit the mobility of the SIJ and increase the tension of the ligament at the side of the bending or at both sides during twisting. Hence, the tension is transferred to other ligaments and may result, in consequence, in pain caused by the ligaments themselves and their insertions [23]. The said pain may be referred pain, as many structures in this area have innervations convergent (the same level of the spinal cord) with the innervations of the iliolumbar ligament. For this reason, according to sensory neuron convergence, pain impulses may be transferred to these structures [29]. Iliolumbar ligament irritation may cause pain in the area of the lumbosacral spine, as well as refer pain to the trochanteric region, groin and medial side of the thigh on the same side [30].
Anatomical and clinical studies have shown that long posterior sacroiliac ligament plays important role in pseudoradicular pain generation in the area of buttocks. The correlation between the said ligament and lateral branches of the dorsal sacral rami of S2

2nd Annual International Interdisciplinary Conference, AIIC 2014, 8-12 July, Azores, Portugal Proceedings, Vol.3
173
(middle cluneal nerve), which may lead to neuropathy and result in pain in the given area, has been observed [31,32]. The erectors spinae aponeurosis, the gluteal aponeurosis and deep layer fascial together with the medial part of the sacroiliac ligament create a tunnel for the middle cluneal nerve. Changes in the tension in both gluteus maximus and gluteus medius muscle (caused by fall or injury) or erectors spinae are transferred to the ligament and cause the pressure of these structures on the nerve [28]. The pressure on the middle cluneal nerve leads to neuropathy and pain below the posterior superior iliac spine [1,4,14].
Conclusion: The pathology of the sacroiliac joint is considered as the main cause of non-specific
back pain (sciatica like syndrome). A great deal of convergence between SIJ syndrome and sciatica syndrome makes the diagnosis and differentiation of these two disease entities becomes very difficult. Therefore, it becomes important to know the exact pathomechanism, etiology and causes pain for both dysfunctions. A broad and well-established knowledge in this area would allow for clarification of a list of criteria differentiating. Hence seem reasonable further research and the advancement of knowledge in this field. References: Cohen SP. Sacroiliac joint pain: A comprehensive review of anatomy, diagnosis and treatment. Anesth Analg 2005; 101: 1440-1453. DePalma MJ, Ketchum JM, Saullo T. What is the source of Chronic Low Back Pain and does age Play a Role? Pain Med 2011; 12: 224-233. Vanelderen P, Szadek K, Cohen SP, et al. Sacroiliac Joint Pain. Pain Practice 2010; 10(5): 470–478. McGrath MC. Clinical considerations of sacroiliac join anatomy: a review of function, motion and pain. J of Osteopath Med 2004; 7(1): 16-24. Gajraj NM. Selective nerve root blocks for low back pain and radiculopathy. Reg Anesth Pain Med 2004; 29: 243-256. Laslett M. Evidence-Based Diagnosis and Treatment of the Painful Sacroiliac Joint. J. Manual Manipulative Ther. 2008; 16(3): 142-152. Huijbregts P. Sacroiliac Joint Dysfunction: Evidence-Based Diagnosis. Reh Med 2004; 8(1): 14-37. Lewit K. Terapia manualna w rehabilitacji narządu ruchu. Wydawnictwo ZŁ "Natura", Kielce 2001. Merskey H, Bogduk N. Classification of Chronic Pain: Pain Syndromes and Definition of Pain Terms. Second Edition. IASP Press, Seattle 1996. Slipman CW, Patel RK, Whyte WS. Diagnosing and managing sacroiliac pain. J Musculoskel Med 2001; 18: 325-332. Dobrogowski J, Wordliczek J. Medycyna bólu. PZWL, Warszawa 2005. Fortin JD, Vilensky JA, Merkel GJ. Can the Sacroiliac Joint Cause Sciatica? Pain Physician 2003; 6: 269-271. Szadek KM, Hoogland PVJM, Zuurmond WWA, et al. Possible Nociceptive Structures in the Sacroiliac Joint Cartilage: An Immunohistochemical Study. Clin Anat 2010; 23: 192–198. McGrath C, Nicholson H, Hurst P. The long posterior sacroiliac lingament: A histological study of morphological relations in the posterior sacroiliac region. Join Bone Spine 2009; 79: 57-62. Slimon CW, Jackson HB, Lipetz JS, et al. Sacroiliac Joint Pain Referral Zones. Arch Phys Med Rehabil 2000; 81: 334-338. Hansen HC, McKenzie-Brown AM, Cohen SP, et al. Sacroiliac Joint Interventions: A Systematic Review. Pain Physician 2007; 10: 165-184
2nd Annual International Interdisciplinary Conference, AIIC 2014, 8-12 July, Azores, Portugal Proceedings, Vol.3
174
Sembrano JN, Polly DW. How ofen is low back pain not coming from the back? Spine 2009; 31(1): 27-32. Jinkins JR. The anatomic and physiologic basis of local, referred and radiating lumbosacral pain syndromes related to disease of the spine. J Neuroradiol 2004; 31(3): 163-180 Vilensky JA, O’Connor BL, Fortin JD. Histologic analysis of neural elements in the human sacroiliac joint. Spine 2002; 27: 1202-1207 McGrath C, Nicholson H, Hurst P. The long posterior sacroiliac lingament: A histological study of morphological relations in the posterior sacroiliac region. Join Bone Spine 2009; 79: 57-62. Ivanom AA, Kiapour A, Ebraheim NA, et al. Lumbag fusion leeds to increases in angular morion and stress cross saroiliac joint. Spine 2009; 34(5): 162-169. Szadek KM, Hoogland PV, Zuurmond WW, et al. Nociceptive Nerve Fibers in the Sacroiliac Joint in Humans. Reg Anesth Pain Med 2008, 33(1): 36–43. Pool-Goudzwaard A, Van Dijke GH, Mulder P, et al. The iliolumbar lingament: its influence on stability of the sacroiliac joint. Clin. Biomech. 2003; 18: 99-105. Olsson C, Nilsson-Wikmar L. Health-related quality of life and physical ability among pregnant women with and without back pain in late pregnancy. Acta Obstet Gynecol Scand 2004; 83: 351-357. Ansari N, Hasson S, Naghdi S. Low back pain during pregnancy in Iranian women: Prevalence and risk factors. Physiother Theory Pract 2010; 26: 40-48. Albert H, Godskesen M, Westergaard J. Prognosis in four syndromes of pregnancy-related pelvic pain. Acta Obstet Gynecol Scand 2001; 80: 505–510. Majchrzycki M, Mrozikiewicz PM, Kocur P i wsp. Dolegliwości bólowe dolnego odcinka kręgosłupa u kobiet w ciąży, Ginekol Pol. 2010; 81: 851-855 Vleeming A, Albert HB, Ostgaard HC, et al. European guidelines for the diagnosis and treatment of pelvic girdle pain. Eur Spine J 2008; 17: 794–819. Freynhagen R, Rolke R, Baron R, et al. Pseudoradicular and radicular low back pain a diseases continuum rather then different entities? Answers from quantitative sensory testing. Pain 2008; 135(1-2): 65-74. Dumas G, Leger A, Plamondon A. Fatigability of back extensor muscles and low back pain during pregnancy. Clin Biomech 2010; 25: 1-5. Vleming A, De Vries HJ, Mens JM. Possible role of the long dorsal sacroiliac lingament in women with peripartum pelvic pain. Acta Obstet Gynecol Scand 2002; 8: 430-436. McGrath MC, Zhang M. Lateral branches of dorsal sacral nerve plexus and the long posterior sacroiliac lingament. Surg Radiol Anat 2005; 27: 327-330.

2nd Annual International Interdisciplinary Conference, AIIC 2014, 8-12 July, Azores, Portugal Proceedings, Vol.3
175
SCREENING FOR IODINE DEFICIENCY – MORE THAN A MEDICAL APPROACH
Carmen Vulpoi, MD, PhD Professor of Endocrinology, University of Medicine and Pharmacy “Grigore T.Popa” Iasi,
Romania Maria-Christina Ungureanu, MD, PhD
Lecturer of Endocrinology, University of Medicine and Pharmacy “Grigore T.Popa” Iasi, Romania
Doina Azoicai, MD, PhD Professor of Epidemiology, University of Medicine and Pharmacy “Grigore T.Popa” Iasi,
Romania Iuliana Vulpoi-Naghel
Professor of Physics, Deputy Director, National College, Iasi Mihaela Cristina Anton, MD
Endocrinologist, County Hospital Bacau, Romania Cristina Preda, MD, PhD
Associated Professor of Endocrinology, University of Medicine and Pharmacy “Grigore T.Popa” Iasi, Romania
Abstract Working as a team began more and more important in many fields, including medicine. After an era of fragmentation, when the need of deepen the knowledge led to supra-specialization, we witness now the reassembly of these distinct parts, in order to obtain a comprehensive view. This is true not only for research, but also for the clinical practice. We present the building of a team who started with a screening and continued with other evaluations in a city from the eastern part of Romania. The goal of the study was to evaluate the iodine status in a former iodine deficient area. Two parameters were necessary, evaluation of thyroid volume and urinary iodine in a representative group of children. The initial pure endocrinological team increased by adopting new members: medical (nurses, epidemiologist, biochemist) and non-medical (schoolteachers). The results induced new studies and the team had growth and proved the utility of interdisciplinarity.
Keywords: Iodine deficiency, interdisciplinarity, children evaluation
No man is an Iland, intire of itselfe; every man is a peece of the Continent, a part of the maine.
MEDITATION XVII, John Donne Introduction
The huge amount of knowledge, in all science fields, led to division in numerous sub-specialties. These (limited) domains permitted a detailed examination of specific problems. However, this approach has two main limitations. First of all, a single, isolated discipline may distinguish the details but cannot offer a global image of the investigated problems. On the other hand, not every problem has its one “appropriate discipline”, and their complexity
2nd Annual International Interdisciplinary Conference, AIIC 2014, 8-12 July, Azores, Portugal Proceedings, Vol.3
176
makes necessary a complex approach, from several subspecialties, sometimes even from specialties of different fields of knowledge (Lingnan, 2011). Interdisciplinarity means more than putting together different disciplines which keep their one point of view, as in pluridisciplinarity, it presumes a true connexion of different methodologies, an integration of particular aspects of knowledge (Zaman&Goschin, 2010).
Medicine is one of the best models of the necessity of interdisciplinarity and even transdiciplinarity, especially in research and politic of health fields. National health programs are an example of application of epidemiological, clinical, social, and economic data in order to solve or at least diminish a general problem of health. We present our self experience of screening for an endemic problem in the eastern part of Romania. Moldavia. Study presentation
On the last decade of the 20th century iodine deficiency was not yet solved in Europe. From the last WHO, UNICEF, and ICCIDD settlements a region is considered iodine deficient if more than 5% of the population have goiter (or thyroid volume more than 97 percentile) and median urinary iodine (good marker for iodine intake) is less than 10 µg/dL. At that time, reevaluation of iodine status had shown that, in spite of salt iodination, iodine deficiency (IDD) was controlled in only 5 European countries, persisting, from minor to severe, in the rest of the continent. Starting from these data, a project named ThyroMobil evaluated iodine deficiency in 12 countries, including Romania (Delange, 1997). However, none of the 3 investigated Romanian zones was in Moldavia. We decided to evaluate the iodine supply in some Moldavian regions, starting with the main city (Iasi), previously considered with minor to moderate IDD, and to compare the results with data from other Romanian and European regions
According to WHO definition, goiter prevalence and urinary iodine are the best parameter to evaluate IDD. Goiter prevalence is nowadays appreciated by ultrasonography, most accurate than palpation, being a quantitative and not qualitative method. Urinary iodine offers an image of recent dietary iodine intake. It is considered the choice index for evaluating and correcting iodine deficiency (Preda, 2014). As well as ThyroMobil study, our study also was performed in schoolchildren. Schoolchildren are considered one of the best target groups, both because their thyroid vulnerable to iodine deficiency, offer a better image of the iodine status, and the selection and survey of a children group is more practical (Zygmunt, 2012). The initial team was composed by of few enthusiastic endocrinologists.
Establishing the study design, some unexpected problems arrived. First, we needed to choose a representative sample. Iasi is a city of 300,000 stable inhabitants, with 13.5% children between 5 and 18 years old, with an equal sex distribution. However, the problem was not the number of children, but their family environment, since alimentary habits were important for our research. We asked the help of an epidemiologist who selected schools with a representative variety of children. After selecting the schools, we needed the informed consent of children tutors (family and school), so we had to discuss with the teacher and to explain our goals. On the initiative of a young team of schoolteachers, there were established meetings with the parents, where we did explain the procedures and the goals of our studies. There were no invasive methods and practically all the parents permitted their children to enter in the study.
We have examined 914 children (466 boys and 448 girls) with a mean of 9.76±4.04 years of age. The including criteria were residency in the Iasi city and the absence of any known thyroid disease or capable to influence nutrition status and/or thyroid function. The study protocol included general examination, with evaluation of height, weight (by a nurse), and puberty stage (by a physician), thyroid ultrasonography, and urinary sample (taken by a
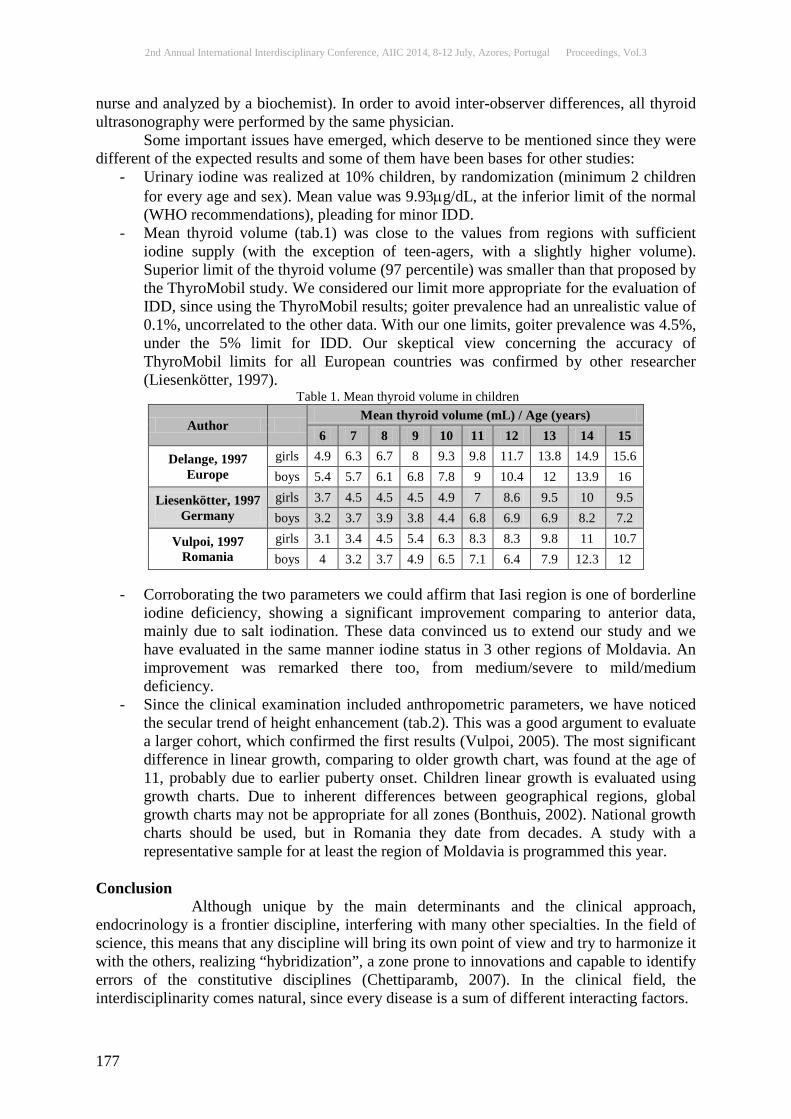
2nd Annual International Interdisciplinary Conference, AIIC 2014, 8-12 July, Azores, Portugal Proceedings, Vol.3
177
nurse and analyzed by a biochemist). In order to avoid inter-observer differences, all thyroid ultrasonography were performed by the same physician.
Some important issues have emerged, which deserve to be mentioned since they were different of the expected results and some of them have been bases for other studies:
- Urinary iodine was realized at 10% children, by randomization (minimum 2 children for every age and sex). Mean value was 9.93µg/dL, at the inferior limit of the normal (WHO recommendations), pleading for minor IDD.
- Mean thyroid volume (tab.1) was close to the values from regions with sufficient iodine supply (with the exception of teen-agers, with a slightly higher volume). Superior limit of the thyroid volume (97 percentile) was smaller than that proposed by the ThyroMobil study. We considered our limit more appropriate for the evaluation of IDD, since using the ThyroMobil results; goiter prevalence had an unrealistic value of 0.1%, uncorrelated to the other data. With our one limits, goiter prevalence was 4.5%, under the 5% limit for IDD. Our skeptical view concerning the accuracy of ThyroMobil limits for all European countries was confirmed by other researcher (Liesenkötter, 1997).
Table 1. Mean thyroid volume in children
Author Mean thyroid volume (mL) / Age (years)
6 7 8 9 10 11 12 13 14 15
Delange, 1997 Europe
girls 4.9 6.3 6.7 8 9.3 9.8 11.7 13.8 14.9 15.6 boys 5.4 5.7 6.1 6.8 7.8 9 10.4 12 13.9 16
Liesenkötter, 1997 Germany
girls 3.7 4.5 4.5 4.5 4.9 7 8.6 9.5 10 9.5 boys 3.2 3.7 3.9 3.8 4.4 6.8 6.9 6.9 8.2 7.2
Vulpoi, 1997 Romania
girls 3.1 3.4 4.5 5.4 6.3 8.3 8.3 9.8 11 10.7 boys 4 3.2 3.7 4.9 6.5 7.1 6.4 7.9 12.3 12
- Corroborating the two parameters we could affirm that Iasi region is one of borderline
iodine deficiency, showing a significant improvement comparing to anterior data, mainly due to salt iodination. These data convinced us to extend our study and we have evaluated in the same manner iodine status in 3 other regions of Moldavia. An improvement was remarked there too, from medium/severe to mild/medium deficiency.
- Since the clinical examination included anthropometric parameters, we have noticed the secular trend of height enhancement (tab.2). This was a good argument to evaluate a larger cohort, which confirmed the first results (Vulpoi, 2005). The most significant difference in linear growth, comparing to older growth chart, was found at the age of 11, probably due to earlier puberty onset. Children linear growth is evaluated using growth charts. Due to inherent differences between geographical regions, global growth charts may not be appropriate for all zones (Bonthuis, 2002). National growth charts should be used, but in Romania they date from decades. A study with a representative sample for at least the region of Moldavia is programmed this year.
Conclusion Although unique by the main determinants and the clinical approach, endocrinology is a frontier discipline, interfering with many other specialties. In the field of science, this means that any discipline will bring its own point of view and try to harmonize it with the others, realizing “hybridization”, a zone prone to innovations and capable to identify errors of the constitutive disciplines (Chettiparamb, 2007). In the clinical field, the interdisciplinarity comes natural, since every disease is a sum of different interacting factors.
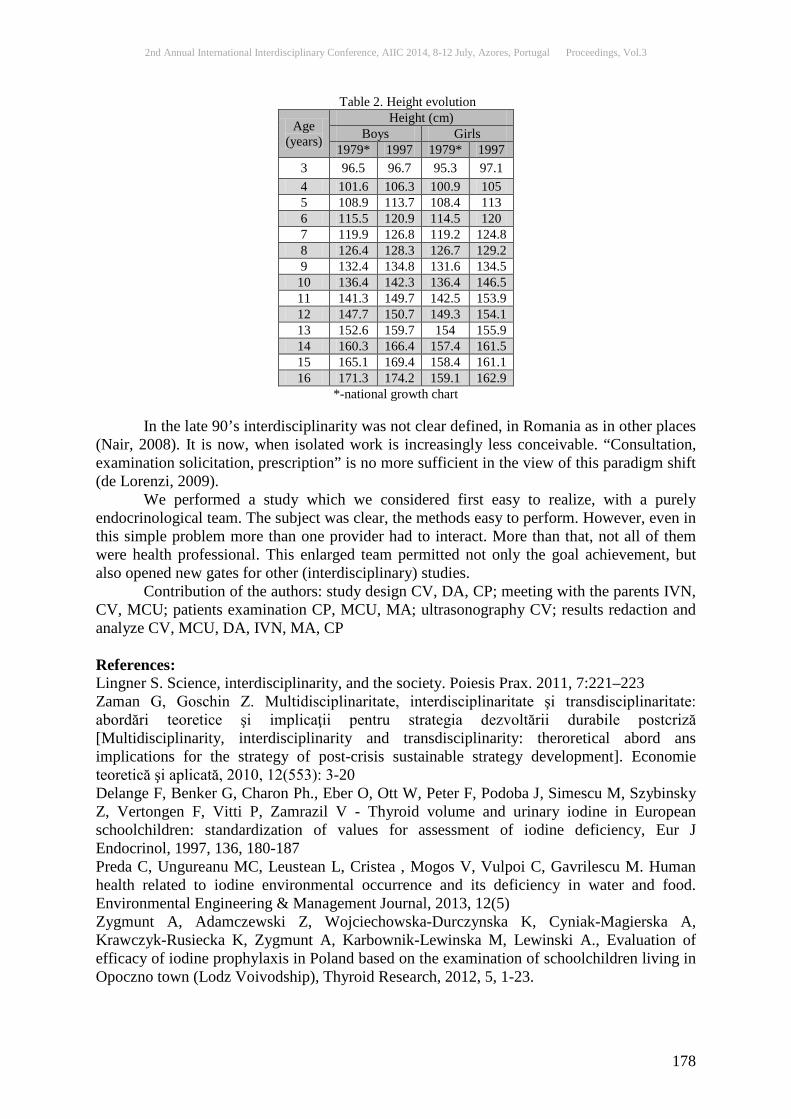
2nd Annual International Interdisciplinary Conference, AIIC 2014, 8-12 July, Azores, Portugal Proceedings, Vol.3
178
Table 2. Height evolution
Age (years)
Height (cm) Boys Girls
1979* 1997 1979* 1997 3 96.5 96.7 95.3 97.1 4 101.6 106.3 100.9 105 5 108.9 113.7 108.4 113 6 115.5 120.9 114.5 120 7 119.9 126.8 119.2 124.8 8 126.4 128.3 126.7 129.2 9 132.4 134.8 131.6 134.5
10 136.4 142.3 136.4 146.5 11 141.3 149.7 142.5 153.9 12 147.7 150.7 149.3 154.1 13 152.6 159.7 154 155.9 14 160.3 166.4 157.4 161.5 15 165.1 169.4 158.4 161.1 16 171.3 174.2 159.1 162.9
*-national growth chart In the late 90’s interdisciplinarity was not clear defined, in Romania as in other places
(Nair, 2008). It is now, when isolated work is increasingly less conceivable. “Consultation, examination solicitation, prescription” is no more sufficient in the view of this paradigm shift (de Lorenzi, 2009).
We performed a study which we considered first easy to realize, with a purely endocrinological team. The subject was clear, the methods easy to perform. However, even in this simple problem more than one provider had to interact. More than that, not all of them were health professional. This enlarged team permitted not only the goal achievement, but also opened new gates for other (interdisciplinary) studies. Contribution of the authors: study design CV, DA, CP; meeting with the parents IVN, CV, MCU; patients examination CP, MCU, MA; ultrasonography CV; results redaction and analyze CV, MCU, DA, IVN, MA, CP References: Lingner S. Science, interdisciplinarity, and the society. Poiesis Prax. 2011, 7:221–223 Zaman G, Goschin Z. Multidisciplinaritate, interdisciplinaritate şi transdisciplinaritate: abordări teoretice şi implicaţii pentru strategia dezvoltării durabile postcriză [Multidisciplinarity, interdisciplinarity and transdisciplinarity: theroretical abord ans implications for the strategy of post-crisis sustainable strategy development]. Economie teoretică şi aplicată, 2010, 12(553): 3-20 Delange F, Benker G, Charon Ph., Eber O, Ott W, Peter F, Podoba J, Simescu M, Szybinsky Z, Vertongen F, Vitti P, Zamrazil V - Thyroid volume and urinary iodine in European schoolchildren: standardization of values for assessment of iodine deficiency, Eur J Endocrinol, 1997, 136, 180-187 Preda C, Ungureanu MC, Leustean L, Cristea , Mogos V, Vulpoi C, Gavrilescu M. Human health related to iodine environmental occurrence and its deficiency in water and food. Environmental Engineering & Management Journal, 2013, 12(5) Zygmunt A, Adamczewski Z, Wojciechowska-Durczynska K, Cyniak-Magierska A, Krawczyk-Rusiecka K, Zygmunt A, Karbownik-Lewinska M, Lewinski A., Evaluation of efficacy of iodine prophylaxis in Poland based on the examination of schoolchildren living in Opoczno town (Lodz Voivodship), Thyroid Research, 2012, 5, 1-23.

2nd Annual International Interdisciplinary Conference, AIIC 2014, 8-12 July, Azores, Portugal Proceedings, Vol.3
179
Liesenkötter KP, Kiebler A, Stach B, Willgerodt H, Grüters A. Small thyroid volumes and normal iodine excretion in Berlin schoolchildren indicate full normalization of iodine supply, Exp.Clin.Endocrinol. Diabetes, 1997, 105 (suppl.4), 46-50 Vulpoi C, Preda C, Cristea C, Ungureanu MC, Zbranca E. Secular trends in height and weight of children in Romania. ECE 2005, 3-7 Sept 2005, Gotebog, Sweden, Abstract book, 239, P2-269 Bonthuis M, van Stralen KJ, Verrina E, Edefonti A, Molchanova EA, Hokken-Koelega AC, Schaefer F, Jager KJ. Use of national and international growth charts for studying height in European children: development of up-to-date European height-for-age charts. PLoS One. 2012;7(8) Chettiparamb A. interdisciplinarity: a literature review. 2007, The Interdisciplinary Teaching and Learning Group, Subject Centre for Languages, Linguistics and Area Studies, School of Humanities, University of Southampton, SO17 1BJ Nair KM, Dolovich L, Brazil K, Raina P. It's all about relationships: A qualitative study of health researchers' perspectives of conducting interdisciplinary health research. BMC Health Services Research 2008, 8:110 De Lorenzi DRS, Catan LB, Moreira K, Artico GR. Assistência à mulher climatérica: novos paradigmas [Assistance to the climacteric woman: new paradigms]. Rev Bras Enferm, Brasília 2009; 62(2): 287-93
2nd Annual International Interdisciplinary Conference, AIIC 2014, 8-12 July, Azores, Portugal Proceedings, Vol.3
180
ANTERIOR RECURRENT EPISTAXIS FROM KIESSELBACH'S AREA
Neven Skitarelić, MD, PhD Department of Otorhinolaryngology, General Hospital Zadar,
Department of Health Studies Zadar, Croatia Željko Čulina, MD
Department of Internal medicine, General Hospital Zadar, Croatia Ivan Bačić
MD PhD, Department of Surgery, General Hospital Zadar, Department of Health Studies Zadar, Croatia
Nataša Skitarelić MD MSc, Department of Pediatrics, General Hospital Zadar,
Department of Health Studies Zadar, Croatia
Abstract Vascular diseases are a major threat to human health nowadays. Hypertension, cardiovascular disease and varicose vain disease including hemorrhoids, are now increasingly recognized as inflammatory diseases. The role of inflammation cytokines in the pathogenesis of these diseases is very important. The lamina propria in the nasal mucosa is rich in blood vessels and humoral mediators. Recurrent epistaxis from Kiesselbach’s area syndrome (REKAS) was first mentioned as early as 1985. It has been found that 90% of patients suffering from recurrent epistaxis from Kiesselbach area syndrome simultaneously suffered from hemorrhoids. Clinical observations suggest a possible mutual pathophysiologic relationship between Kiesselbach’s and anorectal venous plexus. This relationship is also suggested in the reverse direction: significantly more than two thirds of primarily hemorrhoidal patients (83.01%) showed simultaneous vascular dilatations within their Kiesselbach plexuses, but none of these patients had ever have recurrent nose bleeds. There is one more thing they did not have (contrary to REKAS group) - anterior septal deformity. Furthermore, REKAS and hemorrhoidal disease, despite being different clinical entities, frequently appear in the primarily REKAS patients or their closest relatives (more than 90% out of all!). At the same time, all of REKAS patients did have a certain degree of the anterior septal deformity, which primarily hemorrhoidal patients did not have at all. Therefore we consider that Kiesselbach’s vascular plexus in the Little’s area of the nasal septum belongs to the same group as anorectal venous plexus does (others of this group are brain, esophagus, and lower leg venous system). We also consider that the anterior septal deformity is a crucial factor for the onset of the inflammation of the nasal vestibule skin (vestibulitis nasi), while vestibulitis nasi precipitates the onset of typical recurrent nose bleeds from the Kiesselbach’s plexus.
Keywords: Nasal septum , recurrent epistaxis Introduction Vascular diseases are a major threat to human health nowadays.

2nd Annual International Interdisciplinary Conference, AIIC 2014, 8-12 July, Azores, Portugal Proceedings, Vol.3
181
Cardiovascular diseases, including coronary heart disease and a stroke, are the leading cause of death in the United States and Europe.Several risk factors (i.e. stressful life, overweight, physical inactivity, smoking, hypertension, and diabetes mellitus, high levels of cholesterol and lipids) are associated with the development of cardiovascular disease. Hypertension and cardiovascular disease, including atherosclerosis, cardiac hypertrophy, and ischemic disease, nowadays have been increasingly recognized as inflammatory diseases. In recent years, this hypothesis has lead to heightened interest in studying the role of inflammation cytokines in the pathogenesis of these diseases [1]. Like artery, the veins are also a part of vascular system and have their own pathology Varicose veins are tortuous, twisted, or lengthened veins. The theory that varicose veins result from failure of valves in the superficial veins leading to venous reflux and vein dilatation has been superseded by the hypothesis that valve incompetence follows rather than precedes a change in the vein wall [2]. Thus, the vein wall is inherently weak in varicose veins, which leads to dilatation and separation of valve cusps so that they become incompetent. Risk factors for varicose veins include increasing age and parity and occupations that require a lot of standing. Hemorrhoids are a very widespread disease causing pain by thrombosis, fear by bleeding and be a burden by weeping and itching. Hemorrhoids occur when the external hemorrhoidal veins become varicose (enlarged and swollen), which causes itching, burning, painful swellings at the anus, dyschezia (painful bowel movements), and bleeding. Pain with bowel movements and bleeding are often the first signs of hemorrhoids. Taweevisit et al. propose that mast cells have a multidimensional role in the pathogenesis of hemorrhoids, through the actions of the chemical mediators and cytokines released from mast cell granules [3]. Some investigation focuses on caliber and flow changes of the terminal branches of the superior rectal artery supplying the corpus cavernosum recti in patients with hemorrhoids [4]. This fact implicates the unity of the vascular system and its pathophysiology. Some pathophysiological aspects of the nasal blood vessels The lamina propria in the nasal mucosa is rich in blood vessels.The arterioles are conspicuous by an absence of internal elastic membrane. Porosity of the endothelial basement membrane had been described as characteristic of nasal blood vessels. As a result of these structural characteristic, the subendothelial musculature of these vessels may be influenced more easily by agents, such as mediator substances, hormones and drugs, circulating in the blood stream. The capillaries just below the surface epithelium and those surrounding the glands are of the fenestrated type. These capillaries are well suited for rapid movement of fluid through the vascular wall [5]. This will allow water to escape into the airway lumen and to vaporize to take place in conditioning the inspired air. Large venous cavernous sinusoids, mainly localized in the inferior turbinate, are characteristic of nasal mucous membrane. They are normally found in a semi-contracted condition as a result of the influence of the sympathetic nerve-mediated smooth muscle tonicity. The cavernous sinusoids are regarded as specialized vessels adapted to the functional demands of the nasal airway with respect to heating and humidification of inhaled air. When they distend by blood, the nasal mucosa becomes swollen and tends to block the airway lumen, either in part (which is normal) or completely (in nose disease). The extravasation of plasma through the walls of postcapillary venules takes place during inflammation of the mucosa. The process runs through the gaps in the intercellular junctions between the endothelial cells. This leads to an increase of the interstitial liquid

2nd Annual International Interdisciplinary Conference, AIIC 2014, 8-12 July, Azores, Portugal Proceedings, Vol.3
182
volume and pressure, which, in addition, tends to force transfer of plasma-like liquid as an exudate. The humoral mediators that cause extravasation of plasma are many, and include histamine, bradykinin, various prostaglandins, and sensory nerve neuropeptides such as substance P [5]. Recurrent epistaxis from Kiesselbach’s area and anorectal venous plexus: do they have anything in common? Epistaxis, whether spontaneous or otherwise, is experienced by up to 60% of people in their lifetime, with 6% requiring medical attention [6]. The etiology of epistaxis can be divided into local and general causes, however most (80–90%) are actually of unknown etiology [7]. Kiesselbach's plexus, which lies in Kiesselbach's area, or Little's area, is a region in the anteroinferior part of the nasal septum where four arteries anastomoses to form a vascular plexus of that name. Recurrent epistaxis from Kiesselbach’s area syndrome (REKAS) was first mentioned as early as 1985 [8]. This syndrome was found to be the result of a simultaneous interaction between the following four constant factors: (a) specific anterior septal deformity; (b) dilated vessels of Kiesselbach venous plexus; (c) infection of the nasal vestibule skin, and (d) heredity. Clinical observations suggested also a possible mutual pathophysiologic relationship between Kiesselbach and anorectal venous plexus. He also found a high correlation of REKAS nose bleeds and the incidence of lower leg venous system disorders (varices cruris, for instance) [8]. Regarding hemorrhoidal disorders, a large number of REKAS patients, i.e. 90% of them, were found to suffer from hemorrhoids [8]. Local chronic infection was suggested to be a causative factor for both hemorrhoids and REKAS patients [9,10]. Furthermore, the symptoms of hemorrhoidal diseases (and also of varices cruris, cerebral strokes) were found in the closest relatives of 90% of REKAS patients or even in themselves, strongly suggesting a hereditary predisposition for venous plexus disorders [8], as is the case with hemorrhoids [11]. Finally, dilated vessels and direct arteriovenous communications are a usual finding in both hemorrhoidal [12] and REKAS patients [13]. A pathophysiologic relationship between Kiesselbach and anorectal venous plexus in REKAS patients is suggested by the high incidence of REKAS patients or their closest relatives suffering from hemorrhoidal problems. According to our previous results [14], this relationship is also suggested in the reverse direction: more than two thirds of primarily hemorrhoidal patients showed simultaneous vascular dilatations within Kiesselbach plexus of the nasal vestibule (83.01%). Surprisingly, none of these patients had recurrent nosebleeds [14]. This suggests that vascular dilatations within Kiesselbach venous plexus are not per se an exclusive, crucial factor for the onset of the REKAS. Thus, the question arises here about which factors exactly were missing as to produce the onset of REKAS also in our primarily hemorrhoidal patients: anterior septal deformity, or vestibular infection, or perhaps both? Anterior septal deformity exhibited a very low incidence (7.5%), whereas the signs of a slight vestibular infection were also very seldom seen (3.8%) [14]. Since neither vestibular infection nor REKAS appeared in primarily hemorrhoidal patients despite dilated vessels in their Kiesselbach venous plexuses and a positive hereditary factor, we believe that this situation was due to absence of the anterior septal deformity in these patients at the first place. The septal deformity has been generally recognized as a provocative factor in epistaxis [7]. As we mentioned before, inflammation also play a role in the pathogenesis of arterial and venous vascular diseases [1,3].

2nd Annual International Interdisciplinary Conference, AIIC 2014, 8-12 July, Azores, Portugal Proceedings, Vol.3
183
Conclusion Kiesselbach’s vascular plexus in the Little’s area of the nasal septum belongs to the same group as anorectal venous plexus does. The anterior septal deformity is a crucial factor for the onset of the inflammation of the nasal vestibule skin (vestibulitis nasi), while vestibulitis nasi precipitates the onset of typical recurrent nose bleeds from the Kiesselbach’s plexus. References: Murao K, Imachi H, Yu X, et al. The transcriptional factor PREB mediates MCP-1 transcription induced by cytokines in human vascular endothelial cells. Atherosclerosis 2009; doi:10.1016/j.atherosclerosis.2009.03.051. London NJM, Nash R. Varicose veins. BMJ 2000;320:1391–4. Taweevisit M, Wisadeopas N, Phumsuk U, Thorner PS. Increased mast cell density in haemorrhoids venous blood vessels suggest a role in pathogenesis. Singapore Med J 2008;49:977–9. Aigner F, Bodner G, Gruber H, et al. The vascular nature of hemorrhoids. J Gastrointest Surg 2006;10:1044–50. Cauna N. The fine structure of the arteriovenous anastomosis and its nerve supply in the human nasal respiratory tract. Anat Rec 1970;168:9–21. Petruson B, Rudin R. The frequency of epistaxis in a male population sample. Rhinology 1975;13:129–33. Pope LER, Hobbs CGL. Epistaxis: an update on current management. Postgraduate Med 2005;81:309–14. Mladina R. REKAS (recurrent epistaxis from Kiesselbach’s area syndrome). Chir Maxillofac Plast 1985;15:91–5. McGivney J. A re-evaluation of etiologic factors of hemorrhoidal disease. Arizona Med 1967;24:333–6. Nesselrod JP. Hemorrhoids (letter). Arch Surg 1974;109:45. Loder PB, Kamm MA, Nicholls RJ, Phillips RKS. Hemorrhoids: pathology, pathophysiology and aetiology. Br J Surg 1994;81:946–54. Thompson WHF. The nature of hemorrhoids. Br J Surg 1975;62:542–52. Kirchner JA, Yanagisawa E, Crelin ES. Surgical anatomy of the ethmoidal arteries. Arch Otolaryngol 1961;74:382–6. Mladina R, Cavcic J, Šubaric´ M. Recurrent epistaxis from Kiesselbach’s area syndrome in patients suffering from hemorrhoids: fact or fiction. Arch Med Res 2002;33:193–4.
2nd Annual International Interdisciplinary Conference, AIIC 2014, 8-12 July, Azores, Portugal Proceedings, Vol.3
184
RECOMMENDATIONS OF THE ALZHEIMER'S DISEASE INTERNATIONAL CONCERNING THE CARE OF PATIENTS
WITH DEMENTIA AND THE SITUATION IN POLAND
Agnieszka Krawczyk-Wasielewska PhD
Chair of Rheumatology and Rehabilitation, Poznan University of Medical Science, Poland Orthopedicand Rehabilitation ClinicalHospitalin Poznan, Poland
Roksana Malak PhD
Chair of Rheumatology and Rehabilitation, Poznan University of Medical Science, Poland Orthopedicand Rehabilitation ClinicalHospitalin Poznan, Poland
Ewa Mojs Ph
Department ofpsychology, Poznan University of Medical Science, Poland Prof. Włodzimierz Samborski PhD,MD
Chair of Rheumatology and Rehabilitation, Poznan University of Medical Science, Poland José C. Millán-Calenti PhD
Research, Development and Innovation Department, Gerontological Complex La Milagrosa, Provincial Association of Pensioners and Retired People from ACoruña, Spain
Gerontology Research Group, Department of Medicine, Faculty of Health Sciences, Universidade da Coruña, Spain
Ana Maseda PhD
Research, Development and Innovation Department, Gerontological Complex La Milagrosa, Provincial Association of Pensioners and Retired People from ACoruña, Spain
Gerontology Research Group, Department of Medicine, Faculty of Health Sciences, Universidade da Coruña, Spain
Rikke Gregersen PhD
Centre for Research in Aging and Dementia Faculty of Health Sciences, Denmark Kirsten Maibom PhD
Centre for Research in Aging and Dementia Faculty of Health Sciences, Denmark
Abstract
According to data of WHO research, there are an estimated 36,5 million people with dementia worldwide. They need long-term care. The nature of this care depends on economic situation of the country - the higher developed it is, the bigger participation of institutions specialized in long-term care and smaller participation of home care. In high income countries around one-third to one-half of people with dementia are cared for in care homes. Alzheimer's Disease International (ADI) predicts that by 2030 number of patients with dementia will double and triple by 2050. This prognosis requires advanced planning, monitoring and coordination actions to improve system of long-term care. To achieve this goal, ADI recommends: promoting broad public awareness of dementia and combating stigma, identifying dementia capable support services at all stages of the disease, assessing and improving the quality of health care, social care and long-term care support and services, assessing availability and access to diagnostic services, promotion of brain health. Caregivers should be valued by society for they demanding and difficult work. Also patients should keep their autonomy and choice. 92% of suffering from dementia patents in Poland are cared at home since beginning of
2nd Annual International Interdisciplinary Conference, AIIC 2014, 8-12 July, Azores, Portugal Proceedings, Vol.3
185
disease until their death. Other 8% stays at different types of home cares. There are also short-term care, daily care and ambulatory care available. The reasons of small participation of those institutions are: maladjusted to growing number of patients with dementia system of care, complicated administrative procedures, lack of money to cover up costs of care and lack of knowledge about dementia in society.
Keywords: Dementia, long-term care, Alzheimer's disease
Alzheimer's disease is the most common causeof dementia andaccounts for approximately70percentof the disease. 24·3 million people have dementia today, with 4·6 million new cases of dementia every year (one new case every 7 seconds). The number of people affected will double every 20 years to 81·1 million by 2040. Most people with dementia live in developing countries (60% in 2001, rising to 71% by 2040). Rates of increase are not uniform; numbers in developed countries are forecast to increase by 100% between 2001 and 2040, but by more than 300% in India, China, and their south Asian and western Pacific neighbours [1].
The worldwide number of persons with dementia in 2000 was estimated at about 25 million persons. Almost half of the demented persons (46%) lived in Asia, 30% in Europe, and 12% in North America. Fifty‐two percent lived in less developed regions. About 6.1% of the population 65 years of age and older suffered from dementia (about 0.5% of the worldwide population) and 59% were female. The number of new cases of dementia in 2000 was estimated to be 4.6 million. The forecast indicated a considerable increase in the number of demented elderly from 25 million in the year 2000 to 63 million in 2030 (41 million in less developed regions) and to 114 million in 2050 (84 million in less developed regions). In conclusion, the majority of demented elders live in less developed regions, and this proportion will increase considerably in the future [2].
An estimated 5.2 million Americans have Alzheimer's disease in 2014, including approximately 200,000 individuals younger than age 65 who have younger-onset Alzheimer's. Almost two-thirds of American seniors living with Alzheimer's are women. Of the 5 million people age 65 and older with Alzheimer's in the United States, 3.2 million are women and 1.8 million are men. The number of Americans with Alzheimer's disease and other dementias will escalate rapidly in coming years as the baby boom generation ages. By 2050, the number of people age 65 and older with Alzheimer's disease may nearly triple, from 5 million to as many as 16 million, barring the development of medical breakthroughs to prevent, slow or stop the disease [3].
Report drawn upin the UKforpeople with dementia shows that greater susceptibility to early disease (a gebelow65 years) are characterized bythe men, and lateronsetdisease occurs more oftenin women. Alzheimer's diseaseis the predominanttype ofdementia, especially among the elderlyand women. 11,392peopleamong blackpeople andethnic minorities sufferfrom dementia.What is interestingin this circleis a6.2%incidenceofearly-onset where the entire population ofthe UKonly 2.2% are gettingless than 65 years. Approximately 10% of death in menover the age of65 years and15% of deathover 65 yearsin women canbe attributed todementia.59.685deathper yearcould be preventedifdementiadid not existin society.Statisticallymore or lessoneach patient,a mancarries 2sick women [4]. The reportalsopointed outanother problem-lonelines sandsocial isolationof peoplewith dementia. Invariably,in 2013and 2012as the thir dpopulation of England, Wales and Northern Ireland, says thatdoes not play wellwith dementia.33% of patients said that she losther friendsafter exposurediagnosis. Althoughonly a quarter of patient sadmitpublicly thatshe feltlonely inthe last month, conducte danonymous surveys indicateas many as 40% of patients declaringa

2nd Annual International Interdisciplinary Conference, AIIC 2014, 8-12 July, Azores, Portugal Proceedings, Vol.3
186
sense ofloneliness.And62% of those patients who continue to beindependent andlive on the irconfirme dexperiencingfeelings of loneliness [5].
Around half of all people with dementia need personal care (and the others will develop such needs over time). The traditional system of “informal” care by family, friends, and community will require much greater support. Globally, 13% of people aged 60 or over require long-term care. Between 2010 and 2050, the total number of older people with care needs will nearly treble from 101 to 277 million. Long-term care is mainly about care for people with dementia; around half of all older people who need personal care have dementia, and 80% of older people in nursing homes are living with dementia [6,7].
People with dementia have special needs for care, starting early in the disease course, and evolving constantly over time, requiring advanced planning, monitoring, and coordination. It is inevitable that numbers of dependent older people will increase markedly in the coming decades particularly in middle income countries. All caregivers of people with Alzheimer's – both women and men – face a devastating toll. Due to the physical and emotional burden of caregiving, Alzheimer's and dementia caregivers had $9.3 billion in additional health care costs of their own in 2013. Nearly 60 percent of Alzheimer's and dementia caregivers rate the emotional stress of caregiving as high or very high, and more than one-third report symptoms of depression. Not only are women more likely to have Alzheimer's, they are also more likely to be caregivers of those with Alzheimer's. More than 3 in 5 unpaid Alzheimer's caregivers are women – and there are 2.5 more women than men who provide 24-hour care for someone with Alzheimer's. Because of caregiving duties, women are likely to experience adverse consequences in the workplace. Nearly 19 percent of women Alzheimer's caregivers had to quit work either to become a caregiver or because their caregiving duties became too burdensome [3].
A comprehensive system of long-term care for people with dementia comprises both health and social care services.Care in care homes is a preferred option for a significant minority of older people, particularly when presented with a scenario of dementia with complex intensive needs for care.Societal costs of care in care homes and care at home are similar, when an appropriate cost/ value is attached to the unpaid inputs of family carers. Care in care homes is, and will remain, an important component of the long-term care system for people with dementia. Currently around one-third to one-half of people with dementia in high income countries, and around 6% of those in low and middle income countries are cared for in care homes. Caregiver multicomponent interventions (comprising education, training, support and respite) maintain caregiver mood and morale, and reduce caregiver strain [8].
Quality of care can be measured through structures (available resources), process (the care that is delivered), and outcomes. No two families are alike in their needs for care and support, and we need to find ways to make care more person-centred, and care packages more flexible and individualised. Accessible information regarding the quality of care provided by services, assessed using person-centred outcomes as well as inspection data, should inform choice and encourage competition based upon driving up standards. Quality of life, and satisfaction with services are person-centred holistic outcome indicators that summarise the impact of all relevant structure and care process issues. While good quality dementia care can be both complex and resource intensive, the systems and services must be made as simple, seamless, transparent and accessible as possible. Case management should also facilitate coordination of care, helping clients to use services more efficiently. Family carers and paid caregivers share much in common. They all carry out difficult, demanding and socially useful roles, with minimal training and preparation. All caregivers, paid or unpaid, should be valued and recognised by society for the essential, difficult and demanding work that they carry out, and recompensed appropriately [6-9].

2nd Annual International Interdisciplinary Conference, AIIC 2014, 8-12 July, Azores, Portugal Proceedings, Vol.3
187
Recommendations from World Alzheimer Report for the care ofpatientswith dementia:
• All governments should make dementia a priority. This should be signified by developing National Dementia Plans to ensure that health and social care systems are adequately structured and funded to provide high-quality care and support to people throughout the dementia journey
• All governments should initiate national debates regarding the future of long-term care, with all stakeholders and an informed public. For future generations of older people, the numbers of older people requiring long-term care, and their profile of needs is already predictable within narrow limits of uncertainty.
• Governments should ensure there are systems in place to measure and monitor the quality of dementia care and support in all settings.
• Health and social care systems should be better integrated so that there are co- ordinated care pathways that meet people’s needs.
• Governments and providers of care should ensure that healthcare proffessionals and the dementia care workforce are adequately trained to provide person-centred care.
• Governments and other stakeholders should ensure that autonomy and choice is promoted at all stages of the dementia journey.
• Care in care homes is, and will remain, an important component of the long-term caresector, and should be valued as such [8]. In Poland suffers from dementia more than 200,000 people, but the data are
incomplete, because the diagnosis has received only about 20 percent. In Poland,the care of peoplewith dementiaexercises inthe operation of thedifferentstructures,underthe Ministry of Health.Careservices are available designed forolder people, but there is specific servicesfor people withdementia. Taking care ofpatientswith dementiaoccurs inthe home,care and treatment, nursing and care institutions, nursing homes, daypsychogeriatricwards, twenty-four hourpsychogeriatricwards, municipalsocial assistance centers andnursing homes[10] and the privatenursing homes.It is possible tohire ababysitter replacementdealing withpatientsat home.Helpin the care ofpatientswith dementia arealsoclinicsandthe Alzheimer's Association and support groups.
In Poland,the registrydoes not leadtofamily caregivers, notso you candetermine thedetailed data onthe number, the more the socio-economicsituation[11]. Nearly92% of patients with dementiain Poland,staying homefromonsetuntil death[12].It follows that thecare ofpatientswith dementia care giversrestsmainly derived fromfamilyor engagedby the family.The largest group of caregiver sarespousesin Poland, which is close tothe age ofpatients (≥ 65 years).Such person sfrequentlyare disabled and tiredof life.Large sharein the care of childrenare alsosick. In Poland, asin the world,a greater shareofthose caring for patientswith dementiaare women[12].
Patientswith dementiain Polandcan staypermanentlyora longer periodin the follow ingtypes of institutions: nursing homes, care and treatment, nursing and care institutions and privatenursing homes. Depending onthe financial capacity ofthe patient andcaregiverscan choose froma variety of possibilities: fromprivate residences, institutions, thechurch organization sand charities [13].
One form ofcare for patients with dementiain Poland is part time care, day carean dshort-term care. Outpatient service caring mostlytakes place with the participation oftrained nurseorcaregiver/babysitter. Their assistanceis primarily for thedaily careandwound care. In Polandcare agencie scooperating with the social welfare centersthat employcare givers.Whenit become snecessaryto organizea need forcare at home, should bereported toa social workersocial welfare center [13].
2nd Annual International Interdisciplinary Conference, AIIC 2014, 8-12 July, Azores, Portugal Proceedings, Vol.3
188
The objectives ofthe functioning of Alzheimerassociations and foundationsare: the popularization and dissemination of knowledge aboutdementia, especially Alzheimer's disease, the organization of variousforms of assistance topatients and their families, information exchange and training ofcaringfor the sick, cooperation with national and internationalcentersfor the exchangeof experiences, create support groups(self-help caregivers) [12], as well as taking andsupport efforts todevelopdiagnostic and methods for treatingdementia syndromes (especially Alzheimer's disease) and development activities research[13].
In 2013, University of Medical Sciences and Orthopaedics and Rehabilitation Hospital Clinical them. W. Dega joined the international research project AAL UnderstAid - a platform that supports and helps to understand and assist caregivers in the care of a relative with dementia. The aim of the project is to look UnderstAid knowledge-based solutions that serve caregivers of the elderly and disabled, developing solutions that facilitate patient care. Such actions are aimed at providing carers significant educational support that will be individualized, based on modern models of e-learning. The tools developed will provide support to form a guide for caregivers, answer the questions and problems faced by carers. Conclusion
In Poland, as in most countriesworld, the availability of care services forpeople with dementiais insufficient. In contrast todeveloped countries, carefor patients with dementi amainlycare giverburden, and the share ofstructuresdesignatedby the government tocare for patientsis negligible. For all of the secaregiver sof patient swith dementiacertainly would be helpfulonline platformthat combines people struggling with the dailycare ofa relative.This couldbe asource of know ledgeabout the disease, as well as a placeto exchange valuable information, tips and experiences with peoplein a similar situation. References: FerriCP, Prince M,BrayneC: Global prevalence of dementia: a Delphi consensus study, The Lancet 2005, 366 (9503): 2112 – 2117. Alzheimer Disease & Associated Disorders: April 2003, 17 (2): 63–67. 2014 Alzheimer's Disease Facts and Figures report quick facts: http://www.alz.org/documents_custom/2014_facts_figures_fact_sheet.pdf Dementia UK. Alzheimer’s Society 2007. http://www.alzheimers.org.uk/dementia2013 World Alzheimer Report 2013 -Executive Summary http://www.alz.co.uk/research/WorldAlzheimerReport2013ExecutiveSummary.pdf The Global Impact of Dementia 2013–2050 http://www.alz.co.uk/research/GlobalImpactDementia2013.pdf World Alzheimer Report 2013 http://www.alz.co.uk/research/WorldAlzheimerReport2013.pdf WHO report: Dementia: a public health priority http://apps.who.int/iris/bitstream/10665/75263/1/9789241564458_eng.pdf?ua=1 Jarkiewicz J., Kotapka-Minc S., Parnowski T. Opieka nad chorymi z chorobą Alzheimera w Polsce — ocena aktualnego stanu. W: Schwarz G.: Choroba Alzheimera. Objawy, leczenie, opieka, pomoc. Wydawnictwo Lekarskie PZWL, Warszawa 2002: 91–94 Bień B., Doroszkiewicz H. Opieka długoterminowa w geriatrii: dom czy zakład opieki? Przewodnik Lekarza 2006; 10: 48–57. www.alzheimer.pl Durda M. Care arrangements for people with dementia in Poland and developed and developing countries. Gerontol. Pol. 2010; 18, 2: 76–85.

2nd Annual International Interdisciplinary Conference, AIIC 2014, 8-12 July, Azores, Portugal Proceedings, Vol.3
189
The article written as part of the research grant: UnderstAID – a platform that help informal caregivers to understand and aid their demented relatives.
2nd Annual International Interdisciplinary Conference, AIIC 2014, 8-12 July, Azores, Portugal Proceedings, Vol.3
190
ASSOCIATION BETWEEN TOXOPLASMA GONDII INFECTION IN WOMEN AND THE PRESENCE OF
CARDIOLIPIN AND PHOSPHOLIPID ANTIBODIES
Noaman N. A'aiz Dept. of Microbiology, College of Vet. Medicine , Univ. of Al-Qadissiya.
Baqur A. Sultan Dept. of Microbiology, College of Medicine, Univ. of Kufa.Iraq
Sabah M. Al-Fatlawi Dept. of Clinical Immunology, Al-Sadar teaching hospital, Najaf.
Abdulkareem A. Mahmood Dept of Community Medicine ,college of medicine ,Univ. of Kufa
Abstract IgG and IgM cardiolipin and phospholipid antibodies were measured, by an ELISA technique, in the sera of patients with toxoplasmosis. Immunological methods for autoantibodies had been applied by ELISA. Regarding Anti-cardiolipin it was revealed that 24.7% of toxoplasmosis cases versus 0% of control group showed significant positive result (P=0.0412) . Whereas, 12.5% of toxoplasmosis patients and 12% of healthy controls had anti-cardiolipin antibodies, with no significant differences (P=0.554) between these two groups.
Keywords: Toxoplasma gondii , cardiolipin, phospholipid antibodies Introduction There are several causes for triggering of autoimmune diseases and the infectious agents are one of these important causes (1). The relationship between infections and autoimmune disease has been studied extensively over many years and described the association between microbiological infection (bacterial, viral and parasite) and development of autoimmunity (2, 16). The identification of microbial peptides that similar to self- tissue by molecular mimicry is a true factor that inducing or promoting autoimmune diseases triggering by certain infections (2).According to these association between the infectious agents and autoimmune triggering ,this study suggests to identify if there is a correlation between T. gondii infection and autoimmune response throughout investigate the presence of anti-cardiolipin (aCL) and anti-phospholipid (aPL) ) antibodies, in the sera of toxoplasmosis patients. Materials and methods Fifty four and thirty two sera of women were diagnosed with toxoplasmosis were investigated for IgM and IgG anti-cardiolipin and anti-phospholipid antibodies tests respectively, in addition to 14 and 10 sera from healthy women as control groups randomly selected to compare the presence of these antibodies respectively . All these sera were collected from women who attended to the hospitals in AL-Najaf and AL-Qadissyha provinces in Iraq, from September 2008 to February 2009.

2nd Annual International Interdisciplinary Conference, AIIC 2014, 8-12 July, Azores, Portugal Proceedings, Vol.3
191
Results 1-Anti- cardiolipin Antibody (aCL) By ELISA, 13 (24.7%) of 54 toxoplasmosis cases showed positive anti-cardiolipin (concentration ≥ 7 u/ml), while no one (0%) of 14 healthy women showed positive result(P = 0.0412) (Table 1).
Table (1): Anti-cardiolipin Seropositivity in Toxoplasmosis Cases and Controls. Anti-cardiolipin
Groups No. Positive (≥ 7 u/ml) % Negative
< 7u/ml %
Toxoplasmosis cases 54 13 24.7 41 75.3 controls 14 0 0 14 100
X² = 4.17 p= 0.0412 2- Anti- Phospholipid Antibody (aPL) By ELISA, 4 (12.5%) of 32 toxoplasmosis cases showed positive aPL (concentration ≥ 10 u/ml), versus 2 (20%) of 10 healthy women (Table 2).
Table (2): Anti- Phospholipid Seropositivity in Toxoplasmosis Cases and Controls Anti- Phospholipid
Groups No. Positive ( ≥ 10 u/ml) % Negative
(< 10u/ml) %
Toxoplasmosis cases 32 4 12.5 28 87.5 controls 10 2 20 8 80
X² = 0.35 P= 0.554 Discussion Infection agent continues to be among the leading cause of morbidity and mortality worldwide. In addition, they are also implicated in the pathogenesis of indirect consequences such as induction of the autoimmune diseases (7, 11, 12). In the present study, two markers were examined to determine the autoimmune response in toxoplasmosis patients. 1- Anti- Cardiolipin Antibody (aCL) By ELISA, the study revealed that 13(24.7%) of 54 sera of toxoplasmosis patients showed positive aCL, while no one (0%) of 14 sera from healthy women showed positive aCL. There is significant difference (P<0.05) in the frequency of seropositive aCL between patients group and healthy control group. This result revealed a positive correlation between the disease and aCL. This result corresponding to the result of (10) in France and (1) in Italy, they recorded that, the levels of anticardiolipin (IgG & IgM) antibodies among those with toxoplasmosis were 29.3% and 27.4% respectively. The explanation of this correlation is attributed firstly, to the mechanism of molecular mimicry, i.e. immunological cross-reactivity between the parasite and components of host tissues (8, 13), and secondly , Because aCL are strongly associated with recurrent pregnancy loss (3, 4); therefore, common abortions in patients with toxoplasmosis may be partially attributed to the presence of aCL. In the present study there is no one (0%) of healthy control group had positive aCL and this result is disagreement with the finding of (9) who recorded that 10% of 100 healthy adults had positive aCL. This low aCL ratio in the current study may be due to the decrease number of tested healthy women.

2nd Annual International Interdisciplinary Conference, AIIC 2014, 8-12 July, Azores, Portugal Proceedings, Vol.3
192
2- Anti- Phospholipid (aPL) The seropositivity of aPL antibodies were evaluated for 32 toxoplasmosis cases and 10 healthy women by ELISA technique. Four (12.5%) toxoplasmosis cases and two (20%) healthy woman showed positive aPL, but with no significant difference (P>0.05) between them. This result is compatible with the result of (15); who showed that, the aPL antibodies in Leishmaniasis was revealed significant difference when compared with toxoplasmosis and malaria patients. While the current study is incompatible with (17); who estimated the prevalence of IgG and IgM antibodies to T. gondii in patients with antiphospholipid syndrome and found a significantly high prevalence of IgM antibodies only. But (5) confirmed that, the rising of IgM antibodies in antiphospholipid syndrome patient was false positive. The difference in results of aPLseropositivity in toxoplasmosis patients may be attributed to genetic factors (6), environmental factors or presence of other co-infectious agents (14) and performance of ELISA kit which used in each study . References: Barrile, A.; Quattrocchi, P.; Bonanno, D.; Crisafe, A.; et al., (1992). Presence and significance of anticardiolipin antibodies in infectious diseases. Recenti. Prog. Med. 83(6):350-353. Berlin ,T.,Zandman-Goddard,G., Blank,M., Shoenfeld,Y. (2007). Autoantibodies in non autoimmune individuals during infections. Ann N. Y. Acad. Sci., 1108:584-593. Buchanan, R.R.C., Wardlow,J.R., Riglar,A.G., Little John,G.O., and ,M.H.(1989). Anti-phospholipid antibodies in connective tissue diseases : The relation to anti –phosphlipid syndrome and forme frusta disease .J. of Rheumatol. 16:757-761. Bustos, D.; Moret, A.; Tambutti, M.; Gogorza, S.; Testa, R.; Ascione, A. and Prigoshin, N. (2006). Autoantibodies in Aigintine women with recurrent pregnancy loss. Americ. J. Repord. Immunol., 55:201-207. De-Carolis, S.; Botta, A.; Santocci, S.; Garofalo, S.; Martino, C.; Perrelli, A.; Salvi, S,; Ferrazzani, S.; Caforio, L. and Scambia, G. (2009). Clin. Rev. allergy Immunol [Epub ahead of print]. Dighiero, G., and Rose, N.R.(1999). Critical self- epitopes are key to the understanding of self- tolerance and autoimmunity. Immunol. Today; 20:423-428. Gill S.R., Pop M., Deboy R.T.(2006).Metagenomic analysis of human distalgut microbiome.Scince.,312 :1355-1359. Kalra, S.; Tuli, A.; Goyal, U.; Choudhary, R. and Raheja, S. (2002). Correlation of anticardiolipin antibody IgM with first trimester recurrent abortions. J. Anat. Soc. India., 51(10): 10-13. Klok, A. M.; Geertzen, R.; Rothova, A.; Baarsma, G. S. and Kijlstra, A. (1992). Anticardiolip in antibodies in uvieitis. Curr. Eye. Res.; 11(1):209-13. Lafeuillade, A.; Delbeke, E.; Chaffanjon, P.; Aubert, L.; Dhiver, C.; Gastaut, J. A. and Quilichini, R. (1990). Value of anticardiolipin antibody assay in human immunodeficiency virus infection. Presse med. 19(26):1225-1227. Lederberg ,J.(2000).Infectious history .Science;288:287-293. Ley,R.E., Peterson,D.A., and Gordon,J.I..(2006).Ecological and evolutionary forces shaping microbial diversity in the human intestine.Cell.,124 :837- Norberg,R., Nived,O., and Sturfelt,G.(1987).Anticardiolipin and complement activation :relation to clinical symptums. J.Rheumatol.,14:149. Sherer, Y., Blank, M. and Shoenfeld, Y.(2007).Antiphospholipid syndrome (APS): where does it come from ? Best Practice and Research Clinical Rheumotology, 21(6):1071-1078.

2nd Annual International Interdisciplinary Conference, AIIC 2014, 8-12 July, Azores, Portugal Proceedings, Vol.3
193
Skouri, H., Gandouz, R., Kraiem, I., Harrabi, L. and Bensaid, M.(2008). Antibodies to anionic phospholipid and co- factor in Kala-azar .Coparative study with malaria,toxoplasmosis and autoimmune diseases. Clinic.Exp. Rheumatol., 26(5):894-902. Zandman, G., Berkun, Y., Barzilai, O., Boaz, M., Ram, M., Anaya, J.M., and Shoenfeld, Y. (2008). Neuropsychiatric lupus and infectious triggers . Lupus , 17:380-384 . Zinger, H.; Sherer, Y.; Goddard, G.; Berkun, Y.; Brazilai, O.; Agmon- Levin, N.; Ram, M.; Blank, A.; Tincani, B.; Rozman, B.; Cervera, R. and Shoenfeld, Y. (2009). Common infections against prevalence in antiphosphplipid syndrome, Lupus, 18: 1149-1153.
2nd Annual International Interdisciplinary Conference, AIIC 2014, 8-12 July, Azores, Portugal Proceedings, Vol.3
194
GROWTH STIMULATING EFFECTS OF ASPILIA AFRICANA FED TO FEMALE PSEUDO-RUMINANT HERBIVORES (RABBITS) AT DIFFERENT PHYSIOLOGICAL STATES
NseAbasi N. Etim Edem E. A. Offiong
M. E. Williams Department of Animal Science, Faculty of Agriculture, Akwa Ibom State University,
Obio Akpa Campus, Akwa Ibom State, Nigeria
Abstract Background: In recent times, there has been a significant short fall between the production and supply of animal protein to meet the ever increasing population. To meet the increasing demand for animal protein, there is need to focus attention on the production of livestock whose nutritional requirement does not put much strain on the limited sources of feed ingredients to which men subscribe. An example of such livestock is rabbit. Rabbit is a pseudo-ruminant herbivore which utilizes much undigested and unabsorbed feed materials as sources of nutrient for maintenance and production. Thus, this study was conducted to investigate the effects of feeding Aspilia africana as forage on the growth rates of female pseudo-ruminant herbivores (rabbits) at different physiological states. Method: Thirty (30) dutch breed rabbit does of 5 – 6 months of age were used for the experiment which was conducted in a completely randomized design for a period of four (4) months. The rabbits were divided into three treatment groups, ten (10) does per treatment group; which consisted of mixed forages (Centrosema pubescens (200g), Panicum maximum (200g) and Ipomea batatas leaves (100g) without Aspilia africana (T1; control), fresh Aspilia africana (500g/doe/day) (T2) and wilted Aspilia africana (500g/doe/day) (T3). Rabbits in all treatment groups received the same concentrate (300g/animal/day) throughout the period of the study and mixed forages from the commencement of the experiment till the does kindled. After parturition, fresh and wilted Aspilia africana were introduced in treatments 2 and 3 respectively, whereas the control group continued on mixed forages throughout the study. Conclusion: The result of the study revealed that the initial average body weight of the rabbit does was 1.74kg. At mating and gestation periods, the body weights of the does in T2 was significantly higher (P<0.05) than the rest. There were no significant differences (P<0.05) in the body weights of does at kindling between the various treatment groups. During the physiological states of lactation, weaning and re-mating, the control group (T1) had significantly lower body weight than those of the treated groups (T2 and T3). Furthermore, T2 had significantly higher body weight than T3. The study revealed that Aspilia africana; particularly the fresh leaves have greater growth stimulating effects when fed to pseudo-ruminants (rabbits), thereby enhancing body weights of does during lactation and weaning.
Keywords: Aspilia africana, Pseudo-Ruminant Herbivores, hysiological Introduction In recent times, there has been a significant short fall between the production and supply of animal protein to feed the ever increasing population (Akpan et al., 2009; Etim et al., 2014). To meet the increasing demand for animal protein, emphasis needs to be given to
2nd Annual International Interdisciplinary Conference, AIIC 2014, 8-12 July, Azores, Portugal Proceedings, Vol.3
195
non-conventional sources as against the conventional sources such as cattle, sheep, goat, pig and poultry that would require more capital, space and time (Yusuf et al., 2009). There is need to focus attention on the production of livestock whose nutritional requirement does not put much strains on the limited sources of feed ingredients to which men also subscribe. An example of such livestock is rabbit.
Rabbit (Oryctolagus cunniculus) is a pseudo-ruminant herbivore which utilizes much undigested and unabsorbed feed materials as sources of nutrient for maintenance and production. According to Dada-Joel (2010), rabbit has been described as a pseudo-ruminant scavenger capable of coproprophagy with high feed conversion efficiency. Rabbits are known to supply animal protein and provide a cheap source of meat to the Nigerian populace (Hassan and Owolabi, 1996; Amaefule et al., 2005; Henry et al., 2009). Rabbit provides inexpensive source of meat that is low in cholesterol and fat, high in protein compared with beef, mutton and pork (Ensminger, 1991; Oguike and Oheja, 2009). There is evident in the widespread of small scale rabbitary in backyards in Nigerian cities (Henry et al., 2009). Inspite of the numerous advantages of rabbit over other classes of livestock, feed cost and scarcity still limit profitable rabbit production in the country (Ozuo and Anigbogu, 2009). High cost of feed ingredients and other costs associated with production had accounted for the failure of the various plans and policies formulated at one time or the other to combat shortage of animal protein supply (Adedeji et al., 2010). According to Osagie (1998) increasing demand and subsequent high cost of conventional animal feed ingredients in the tropics and the competition between humans and farm animals on the available food sources have created the need for sustainable alternatives.
One of such alternatives is roughages and one of the roughages suitable for feeding rabbit is forages (Etim et al., 2013). According to Iyeghe-Erakpotobor et al. (2009) competition between humans and rabbits for grain is low because rabbits can be raised on roughages. Rabbits can convert roughages with high fibre content to meat efficiently without the deterioration of the quality of meat. Oguike and Ojaha (2009) documented that traditionally, rabbits are managed with forage based diets as the principal feed sources and rabbits have the ability to thrive on forages which cannot be consumed directly by man. To ensure better performance, rabbits are fed with both concentrates and forages (Onyimonyi and Ene, 2003). Studies have shown that rabbits can thrive on a number of tropical forages supplemented with concentrates (Odeyinka and Ijiyemi, 1997; Shiawoya and Musa, 2003). Such forages are cheap, abundant and available in many parts of Nigeria (Yusuf et al., 2009). One of such forages is Aspilia africana (Etim et al., 2013).
Study conducted by Richardson (2003) revealed that bodyweight of does at first mating influences future body development and performance. Yamani et al. (1992) reported that rabbit does mated 10 days post-partum recorded higher weights than those mated 5 days post-partum. Female animals gain weight during pregnancy. Iyeghe-Erakpotobor et al. (2005) reported that weight gain increased as pregnancy progressed. Xiccato (1996) documented that rabbit does experience severe energy deficit and weight loss during first lactation. Rabbit does gain greater weight with reduction in lactation load. Richardson (2003) reported that does tend to lose weight after weaning their first litter. This weight loss is attributable to the high energy demand on the doe by the litter prior to weaning.
According to Adisa and Oladoja (2008) intensifying efforts in encouraging and motivating rabbit keepers to increase their stock and adapt more innovations, will undoubtably increase rabbit production and ensure adequate nutrition for every household. Animal breeders are interested in getting their animal to a standard weight at any stage of their life since over-weight or under-weight of animals do not perform optimally. Under-weight could be a manifestation of poor health and/or malnutrition. The body weight of an animal is influenced by such factors as age, health status, breed, nutrition, physiological

2nd Annual International Interdisciplinary Conference, AIIC 2014, 8-12 July, Azores, Portugal Proceedings, Vol.3
196
status among others. The health and nutritional status of an animal could be determined using the body weight.
The aim of the study was to investigate the potentials of Aspilia africana as forage for rabbit does at various physiological states. Materials and methods Experimental Location The study was conducted at the Rabbitry Unit of the Teaching and Research Farm of College of Animal Science and Animal Production, Michael Okpara University of Agriculture, Umudike, Abia State, Nigeria. Umudike is located within the tropical rainforest zone and the environment is characterized by an annual rainfall of 2177mm. Experimental Animals and Management The study was conducted using thirty (30) sexually mature nulliparous dutch breed rabbit does and four (4) dutch bucks aged 5 to 6 months sourced from Akwa Ibom State, Nigeria. The rabbits were certified healthy and were identified with plastic ear-tags. They were housed singly in pens in rabbit hutches. The hutches were made of wooden frames and wire mesh. The animals were fed 300g of concentrate daily, each of 18.5% crude protein and 2620Kcal/kg of metabolizable energy (Table 1) and mixed forages which comprised Panicum maximum 200g, Ipomea batatas leaves 100g and Centrosema pubescens 200g until after kindling. Clean water was also supplied ad libitum. After two weeks of commencement of the experiment, the does were taken to the bucks’ pen for mating. The mating ratio was 1 buck : 10 does. The does were all mated within an interval of 3 days. The does were palpated after 14 days of mating to confirm pregnancy. Following parturition, Aspilia africana forage was introduced as the experimental diet at the rate of 500g per doe per day. Experimental Design and Data Collection The experiment was in a completely randomized design with three (3) treatments. The treatments consisted of mixed forages (Panicum maximum (200g/per animal/day), Ipomea batatas leaves (100g/per animal/day) and Centrosema pubescens leaves (200g/per animal/day) without Aspilia africana (Control; T1), fresh Aspilia africana (500g/animal/day) (T2) and wilted Aspilia africana (T3). Ten (10) does were randomly assigned to each treatment. Each treatment was replicated 5 times with 2 does per replicate. Data were collected on the weights of the does at the beginning of the experiment, prior to mating, during pregnancy, at parturition, during lactation, at weaning and prior to re-mating. Weight measurements were taken using weighing balance. Data Analysis The data generated were analyzed using Analysis of Variance (ANOVA). Significant means were separated using Fisher’s Least Significant Different (LSD) according to the methods of Steel and Torrie (1980) and Akindele (2004). Results and discussion The result of the body weight of the does at different physiological states are presented in Table 2 and Fig. 1. The mean body weight of the does at the commencement of the experiment was 1.74kg. The body weight of the does at mating and gestation period revealed significant differences (P<0.05) with does in T3 having significantly lower value than T2, while T1 and T2 showed no significant differences among each other. Weights of does at kindling revealed significant differences (P>0.05) between the various treatment groups. However, T3 maintained lower weight values during the gestation period although
2nd Annual International Interdisciplinary Conference, AIIC 2014, 8-12 July, Azores, Portugal Proceedings, Vol.3
197
there were no significant differences. The lower weight of T3 during gestation and kindling could be attributed to the weights of does in this group at the time of mating. It was observed that body weight of does in T2 slightly decreased at kindling while those of T1 and T3 showed slight increase. The study revealed significant differences (P<0.05) between the body weights of does in the different treatments during the physiological states of lactation, weaning and re-mating. At these physiological states, T2 had the highest significant values followed by T3, while T1 (control) had the least value (Table 2 and Fig. 1). The higher body weights of the treated groups (T2 and T3) could be due to the Aspilia africana forage fed to these groups following kindling. It was observed that the body weight of the does in T1 and T2 treatments at weaning was higher than their weights at the other physiological states. The T3 group was an exception with the body weight at re-mating showing highest weight than in the rest of the physiological states. The higher weights at weaning observed in the present study is contrary to the reports of Xicatto (1996) who documented that rabbit does experience severe energy depletion during lactation and also at variance with the findings of Richardson (2003) who reported that does tend to lose weight after weaning their first litter until kindling of the second litter. The contrary result of the present study suggested that Aspilia africana is a good source of nutrients and energy and balances the expected energy deficit during lactation and weaning. In other words, the significant higher means of the does in the treated groups (T2 and T3) corroborates the findings of Okwu and Josiah (2006) who analyzed Aspilia africana and found that it is a good source of Ca, P, K, Mg, Fe and Zinc ions. The result of this study is also consistent with the findings of Okwuonu et al. (2008) who reported that the phytochemical analysis of Aspilia africana revealed its richness in saponins, crude proteins, sterols and tarpenes all of which could have led to the significant increase in body weights of weaning of the treated groups (T2 and T3) who received fresh and wilted Aspilia africana respectively. The slight decrease in body weights of does fed wilted Aspilia africana compared with the does fed the fresh Aspilia africana forage might be due to loss of moisture from the wilted plant which might have led to decline in vital minerals and/or palatability. Conclusion The body weights of does fed Aspilia africana was consistently higher than the weights of does in the control group which did not receive the experimental forage showing that Aspilia africana is a potential growth promoter. It could therefore be recommended for finishing and fattening rabbits. References: Adedeji, O. S., Amo, S. R., Ameen, S. A., Olayemi, T. B., Ojedapo, L. O., Aandiran, T. A. (2010). Effects of graded levels of wild sunflower meal on growth and blood parameters of weaned rabbits. Proc. of the 44th Annual Conf. of ASN, pp. 737-740. Adisa, B. O. and Oladoja, M. A. (2003). Factors associated with adoption of improved rabbit management practices and its implication on household food and nutrition security in Osun State. African Journal of Livestock Extension, 2:1-2. Akpan, I. A., Iwogar, G. S., Effiong, O. O., Akpanenua, E. J. (2009). Growth performance of grasscutters fed diets treated with urea and urine solutions. Proc. of 34th Annual Conf. of Nig. Soc. for Anim. Prod., Calabar, 163-164. Amaefule, K. U., Iheukwuemere, F. C. and Nwaokoro, C. C. (2005). A note on the growth performance and carcass characteristics of rabbits fed graded levels of boiled pigeon pea (Cajanus cajanus). Livestock Research for Rural Development, 17(5):1-6. Dada-Joel, O. T. (2010). Performance of growing rabbit fed graded levels of dried rumen ingesta (D.R.I). Proc. of the 44th Annual Conf. of Agric. Soc. of Nig., “LAUTECH 2010”, Ogbomoso, Oyo State, Nigeria, pp. 654.

2nd Annual International Interdisciplinary Conference, AIIC 2014, 8-12 July, Azores, Portugal Proceedings, Vol.3
198
Ensminger, M. E. (1991). Animal Science, 9th ed. Insterstate Publisher Inc. Danville, U.S.A., pp. 391-402. Etim, N. N., Ekpo, J. S. and Enyenihi, G. E. (2014). Dietary influences of Aspilia africana on litter traits of breeding female rabbit. American Journal of Experimental Agriculture. Science Domain International, Vol. 4, Issue 2, pp. Hassan, W. A. and Owolabi, R. O. (1996). Reproductive performance of breeder rabbits fed diets with different fibre sources. Proc. 34th Annual Conf. of Nig. Soc. for Anim. Prod., Calabar, March 18 – 21, pp. 37-40. Henry, A. J., Udoh, A. E., Effiong, O. O. (2009). Reproductive performance of the New Zealand white rabbit in humid tropics. Nig. J. Anim. Prod., 18:61-65. Iyeghe-Erakpotobor, G. T., Yakubu, S. T. and Esievo, L. O. (2009). Effect of substitution of concentrate with lablab forage meal on performance of growing rabbits. Proc. of 34th Annual Conf. of Nig. Soc. for Animal Production, Calabar, March 18 – 21, pp. 159-161. Odeyinka, S. M. and Ijiyemi, O. C. (1997). Performance of rabbits fed Lecaena leucocephala and concentrate between 9th and 25th weeks of age. Nig. Journal of Anim. Prod., 24(1):5153. Oguike, M. A. and Ohaja, A. (2009). Effect of different protein sources on the reproductive performance of rabbit does. Proc. 34th Annual Conf. of Nig. Soc. for Anim. Prod., Calabar, 192-193. Onyimonyi, A. E. and Ene, J. C. (2003). Performance of growing rabbits fed Panicum maximum with graded levels of a concentrate diet. Proc. of 8th Annual Conf. of Anim. Sci. Assoc. of Nigeria (ASAN), September, 16 – 18, pp. 73-75. Osagie, A. U. (1998). Anti-nutritional factors. In A. U. Osagie and O. U. Eke (Eds.) Nutritional Quality of Plant Foods. Post Harvest Research Unit, Dept. of Biochemistry, University of Benin, Nigeria. Steel, R. G. S. and Torrie, J. H. (1980). Principles and procedures of statistics. A biometric approach, 2nd ed. McGraw Hill Book Co. Inc. New York. Yusuf, A. M., Garba, M. H., Olafedehan, O. A., Okafor, C. I. (2009). Evaluation of the feeding potentials of Vitelleria paradoxum, Naucleau latifolia and Terminalia macroptera forage as supplements to concentrate feed for weaner rabbits. Proc. 34th Annual Conf. of Nig. Soc. for Anim. Prod., Calabar, 117-119.
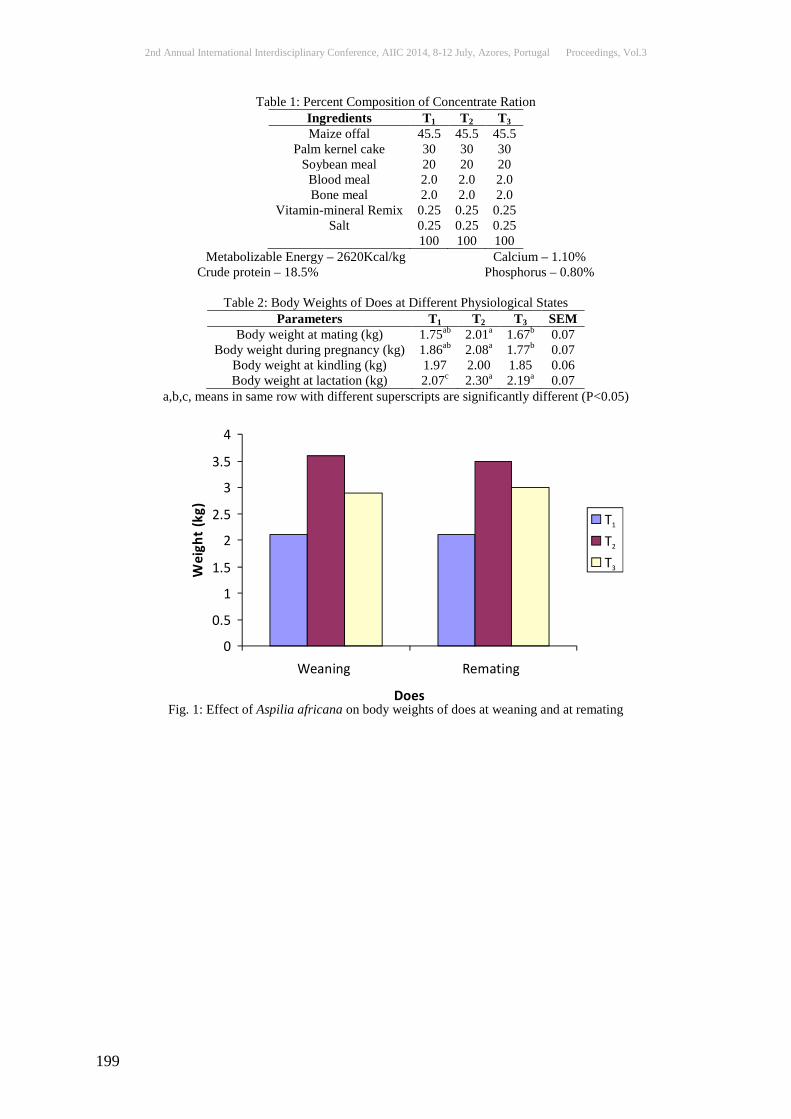
2nd Annual International Interdisciplinary Conference, AIIC 2014, 8-12 July, Azores, Portugal Proceedings, Vol.3
199
Table 1: Percent Composition of Concentrate Ration Ingredients T1 T2 T3 Maize offal 45.5 45.5 45.5
Palm kernel cake 30 30 30 Soybean meal 20 20 20
Blood meal 2.0 2.0 2.0 Bone meal 2.0 2.0 2.0
Vitamin-mineral Remix 0.25 0.25 0.25 Salt 0.25 0.25 0.25
100 100 100 Metabolizable Energy – 2620Kcal/kg Calcium – 1.10%
Crude protein – 18.5% Phosphorus – 0.80%
Table 2: Body Weights of Does at Different Physiological States Parameters T1 T2 T3 SEM
Body weight at mating (kg) 1.75ab 2.01a 1.67b 0.07 Body weight during pregnancy (kg) 1.86ab 2.08a 1.77b 0.07
Body weight at kindling (kg) 1.97 2.00 1.85 0.06 Body weight at lactation (kg) 2.07c 2.30a 2.19a 0.07
a,b,c, means in same row with different superscripts are significantly different (P<0.05)
Fig. 1: Effect of Aspilia africana on body weights of does at weaning and at remating
0
0.5
1
1.5
2
2.5
3
3.5
4
Weaning Remating
Does
Wei
ght
(kg) T1
T2
T3
2nd Annual International Interdisciplinary Conference, AIIC 2014, 8-12 July, Azores, Portugal Proceedings, Vol.3
200
SCREENING OF GASTRO-INTESTINAL TRACT’S MALIGNANT NEOPLASMS
Olga Tashtemirova Tolebay Rakhypbekov
Kamal Tashtemiro Gulzhanat Dzhakova
Sabit Zhusupov Semey State Medical University, Semey, Kazakhstan
Abstract Screening of oncologic pathology of gastro-intestinal tract by means of multicenter endoscopic examination has shown that phylactic esophagogastroduodenoscopy, сolonofiberscopy can be recommended as an obligatory component during planned examination.
Keywords: Screening, endoscopy, oncology Relevance Despite all the achievements of modern medicine , the entry of new methods of diagnosis and healing, the disease incidence and death rate due to oncologic diseases has been constantly increasing in the world. It is well-known , that cancer is the second leading reason of death after cardiovascular system diseases death. If to summarize the cancer frequency of all organs of gastro-intestinal tract, it will take the first place (more than 50%), powering past larynx cancer, breast cancer, and prostate cancer1. Therewith disease and death rate are the cancer of approximately all digestive systems 2. Numerous research proves, that disease prognosis mainly depends on oncology diagnose promptness, which gives much meaning to the earlier diagnosis. Unfortunately, 60–80% patients with for the first time oncology diagnose already have III–IV stages of disease2. Potential causes of such late diagnose are late application of patients, erased clinical performance, and also deficient oncological suspicion of doctors with primary stage of healthcare. In recent times in all well-developed countries fast disease growth of segmented intestine cancer is noticed 3. Approximately 85% cases of colorectal cancer (CRC)are on the age older than 55. CRC is of rare occurrence with people under the age of 30 , the disease sharply rises with the age increase, reaching the maximum after 70 years old. The disease rate of colorectal cancer in industrially developed countries comparing with developing is significantly higher. Its early diagnose usually is possible on preclinical stage, which requires special laboratory-instrumental screening survey. Nowadays in the USA and well-developed Western countries the screening programs are intruded, based on identification of implicate blood in fecal matter, however they are not specified enough, and the amount of false-negative results are quite large and equal to from 30 to 70% 4. For screening diagnosis of colorectal cancer , digital investigation has not lost its significance. However, despite the accessibility of the method, the great amount of oncology still are identified on incurable stages5.

2nd Annual International Interdisciplinary Conference, AIIC 2014, 8-12 July, Azores, Portugal Proceedings, Vol.3
201
Endoscopic research is still a «Golden Standard» of diagnosis. The analysis of literature resources shows the efficiency of multicenter endoscopic investigation, which is one of the most leading methods on the finishing stage of examination for patients to identify oncological pathology[6. The high level of informative value, simplicity and respective safety of endoscopic methods let use them in stationery conditions as well as in ambulatory conditions to resolve issues of cancer disease diagnosis, and also supervision of people, related to the groups of high risk of cancer7 We have done the analysis of screening diagnosis of oncological pathology of gastro-intestinal tract by means of multicenter endoscopic survey. Research material and methods The materials of the analysis were results of investigation of endoscopic survey, carried out in regional hospital named G. Sultanov , period from 2008 to 2011. The diagnose varied on the basis of morphologic investigations and endoscopic picture of gastro- intestinal tract's organs. The methods, used are: esophagogastroduodenoscopy (EGD), colonofiberscopy, rectosigmoidoscopy (RRS), fiber-optic bronchoscopy The obtained results were exposed to statistical analysis. Results of the research For the period from 2008 to 2011 in regional hospital named G. Sultanov there were 15067 endoscopic surveys, taken 2699 (17,91%) biopsies, and found out 107 (3,96%) cases with oncological pathology, confirmed by morphological investigation. Most of investigations are oriented to EGD 89,89% (13543 patients), least fiber-optic bronchoscopy – 2,26% (340 patients) Data is represented in the table 1.
Table1- Amount of endoscopic investigations from 2008 to 2011
№ Type of Investigation Biopsies Biopsies Oncopathology Pat. % Pat. % Pat. %
1 EGD 13543 89,89 2373 17,52 78 3,29 2 Colonofiberscopy 588 3,90 305 51,87 15 4,92 3 RRS 596 3,96 7 1,17 3 42,86 4 Fiber-optic bronchoscopy 340 2,26 14 4,12 11 78,57
Total: 15067 2699 17,91 107 3,96 How it can be seen from the table 1, most of oncologic diseases, exposed to morphological investigations, is noted in fiber-optic bronchoscopy, from 14 biopsies in 78,57% (11 cases) verified oncopathology. The goes the investigation of straight intestine - RRS, from 7 cases- three of them 42,86%)positive. Therewith the amount of carried fiber-optic bronchoscopies for four is 2,26% (340 patients), and RRS – 3,96% (596 patients) from total number of endoscopic investigations. Patients, being examined RGD are 89,89% (13543 people) from them 17,52% (2373 people) were taken a biopsy , the results of which 78 (3,29%) people have oncological diseases. Colonofiberscopy was carried to 588 (3,90%) patients, from them 51,87% (305 people) were taken a biopsy and only 15 (4,92%) people have oncopathology. While morphological investigation of biopsy materials , taken during endoscopy, the most frequent cancer is a gastric cancer, the results of morphological investigation are shown in the table 2.
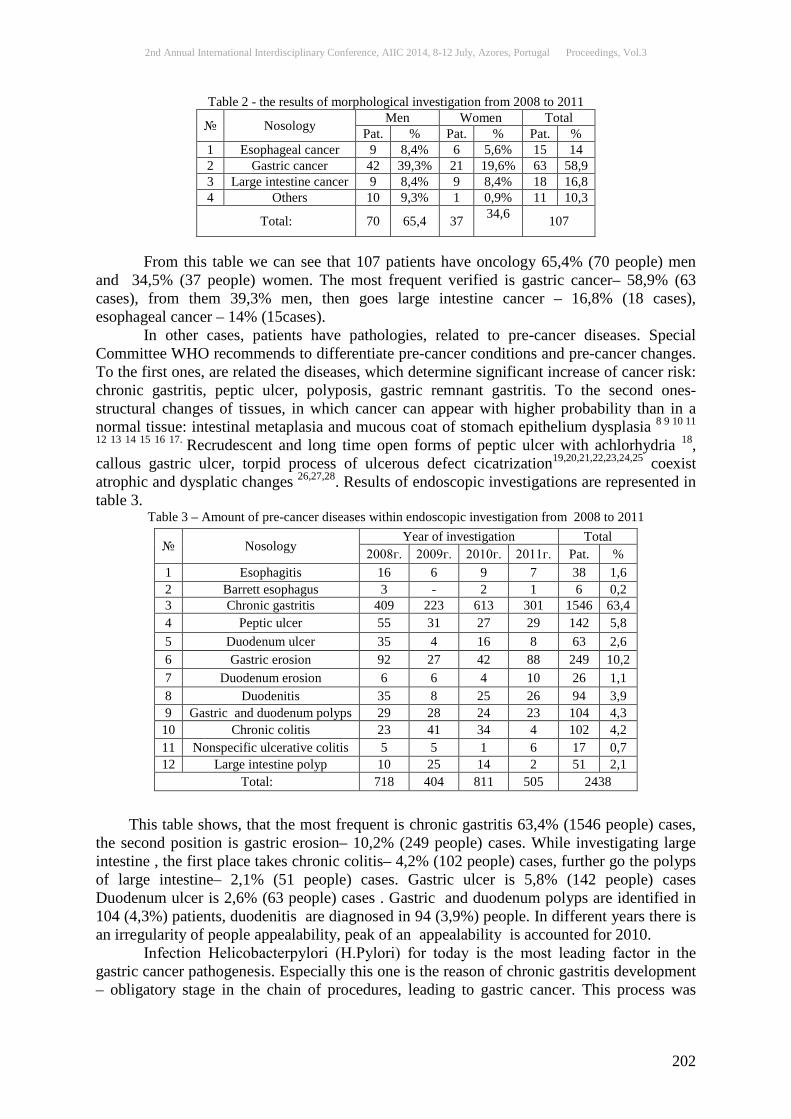
2nd Annual International Interdisciplinary Conference, AIIC 2014, 8-12 July, Azores, Portugal Proceedings, Vol.3
202
Table 2 - the results of morphological investigation from 2008 to 2011
№ Nosology Men Women Total Pat. % Pat. % Pat. %
1 Esophageal cancer 9 8,4% 6 5,6% 15 14 2 Gastric cancer 42 39,3% 21 19,6% 63 58,9 3 Large intestine cancer 9 8,4% 9 8,4% 18 16,8 4 Others 10 9,3% 1 0,9% 11 10,3
Total: 70 65,4 37 34,6 107
From this table we can see that 107 patients have oncology 65,4% (70 people) men and 34,5% (37 people) women. The most frequent verified is gastric cancer– 58,9% (63 cases), from them 39,3% men, then goes large intestine cancer – 16,8% (18 cases), esophageal cancer – 14% (15cases). In other cases, patients have pathologies, related to pre-cancer diseases. Special Committee WHO recommends to differentiate pre-cancer conditions and pre-cancer changes. To the first ones, are related the diseases, which determine significant increase of cancer risk: chronic gastritis, peptic ulcer, polyposis, gastric remnant gastritis. To the second ones- structural changes of tissues, in which cancer can appear with higher probability than in a normal tissue: intestinal metaplasia and mucous coat of stomach epithelium dysplasia 8 9 10 11
12 13 14 15 16 17. Recrudescent and long time open forms of peptic ulcer with achlorhydria 18, callous gastric ulcer, torpid process of ulcerous defect cicatrization19,20,21,22,23,24,25 coexist atrophic and dysplatic changes 26,27,28. Results of endoscopic investigations are represented in table 3.
Table 3 – Amount of pre-cancer diseases within endoscopic investigation from 2008 to 2011 This table shows, that the most frequent is chronic gastritis 63,4% (1546 people) cases, the second position is gastric erosion– 10,2% (249 people) cases. While investigating large intestine , the first place takes chronic colitis– 4,2% (102 people) cases, further go the polyps of large intestine– 2,1% (51 people) cases. Gastric ulcer is 5,8% (142 people) cases Duodenum ulcer is 2,6% (63 people) cases . Gastric and duodenum polyps are identified in 104 (4,3%) patients, duodenitis are diagnosed in 94 (3,9%) people. In different years there is an irregularity of people appealability, peak of an appealability is accounted for 2010. Infection Helicobacterpylori (H.Рylori) for today is the most leading factor in the gastric cancer pathogenesis. Especially this one is the reason of chronic gastritis development – obligatory stage in the chain of procedures, leading to gastric cancer. This process was
№ Nosology Year of investigation Total
2008г. 2009г. 2010г. 2011г. Pat. % 1 Esophagitis 16 6 9 7 38 1,6 2 Barrett esophagus 3 - 2 1 6 0,2 3 Chronic gastritis 409 223 613 301 1546 63,4 4 Peptic ulcer 55 31 27 29 142 5,8 5 Duodenum ulcer 35 4 16 8 63 2,6 6 Gastric erosion 92 27 42 88 249 10,2 7 Duodenum erosion 6 6 4 10 26 1,1 8 Duodenitis 35 8 25 26 94 3,9 9 Gastric and duodenum polyps 29 28 24 23 104 4,3 10 Chronic colitis 23 41 34 4 102 4,2 11 Nonspecific ulcerative colitis 5 5 1 6 17 0,7 12 Large intestine polyp 10 25 14 2 51 2,1
Total: 718 404 811 505 2438
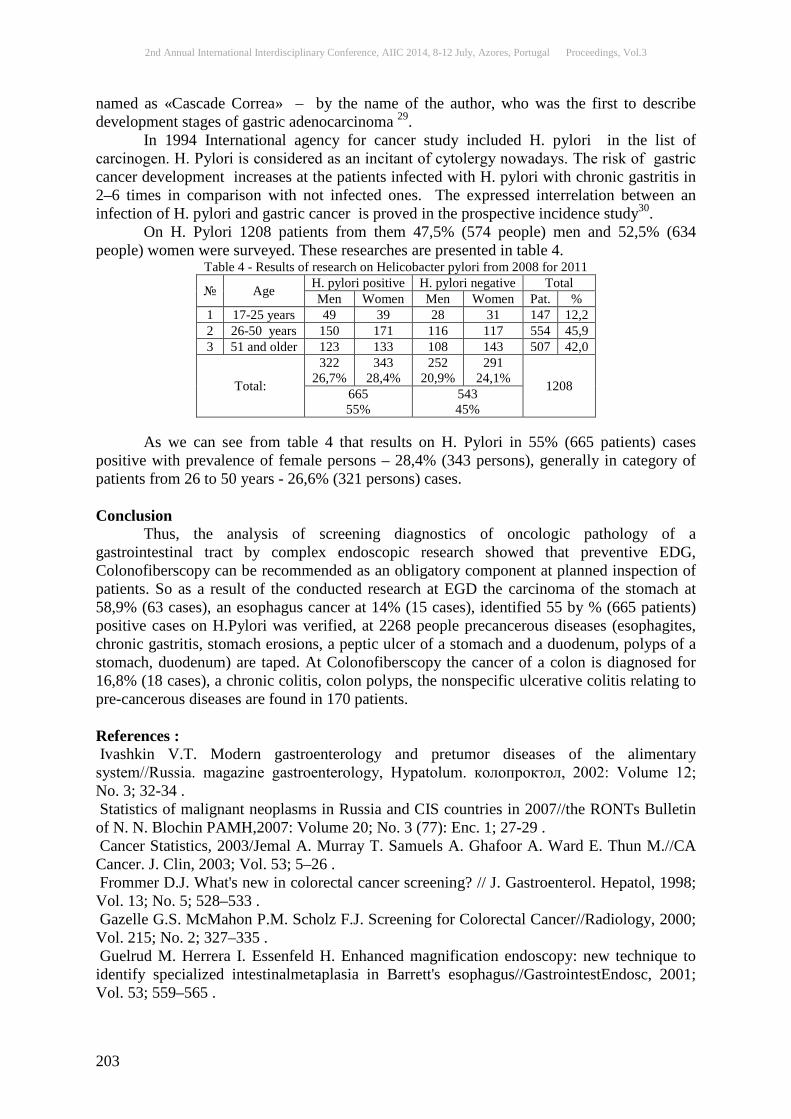
2nd Annual International Interdisciplinary Conference, AIIC 2014, 8-12 July, Azores, Portugal Proceedings, Vol.3
203
named as «Cascade Correa» – by the name of the author, who was the first to describe development stages of gastric adenocarcinoma 29. In 1994 International agency for cancer study included H. pylori in the list of carcinogen. H. Рylori is considered as an incitant of cytolergy nowadays. The risk of gastric cancer development increases at the patients infected with H. pylori with chronic gastritis in 2–6 times in comparison with not infected ones. The expressed interrelation between an infection of H. pylori and gastric cancer is proved in the prospective incidence study30. On H. Pylori 1208 patients from them 47,5% (574 people) men and 52,5% (634 people) women were surveyed. These researches are presented in table 4.
Table 4 - Results of research on Helicobacter pylori from 2008 for 2011
№ Age H. pylori positive H. pylori negative Total Men Women Men Women Pat. %
1 17-25 years 49 39 28 31 147 12,2 2 26-50 years 150 171 116 117 554 45,9 3 51 and older 123 133 108 143 507 42,0
Total:
322 26,7%
343 28,4%
252 20,9%
291 24,1% 1208 665
55% 543 45%
As we can see from table 4 that results on H. Pylori in 55% (665 patients) cases positive with prevalence of female persons – 28,4% (343 persons), generally in category of patients from 26 to 50 years - 26,6% (321 persons) cases. Conclusion Thus, the analysis of screening diagnostics of oncologic pathology of a gastrointestinal tract by complex endoscopic research showed that preventive EDG, Colonofiberscopy can be recommended as an obligatory component at planned inspection of patients. So as a result of the conducted research at EGD the carcinoma of the stomach at 58,9% (63 cases), an esophagus cancer at 14% (15 cases), identified 55 by % (665 patients) positive cases on H.Pylori was verified, at 2268 people precancerous diseases (esophagites, chronic gastritis, stomach erosions, a peptic ulcer of a stomach and a duodenum, polyps of a stomach, duodenum) are taped. At Colonofiberscopy the cancer of a colon is diagnosed for 16,8% (18 cases), a chronic colitis, colon polyps, the nonspecific ulcerative colitis relating to pre-cancerous diseases are found in 170 patients. References : Ivashkin V.T. Modern gastroenterology and pretumor diseases of the alimentary system//Russia. magazine gastroenterology, Hypatolum. колопроктол, 2002: Volume 12; No. 3; 32-34 . Statistics of malignant neoplasms in Russia and CIS countries in 2007//the RONTs Bulletin of N. N. Blochin PAMH,2007: Volume 20; No. 3 (77): Enc. 1; 27-29 . Cancer Statistics, 2003/Jemal A. Murray T. Samuels A. Ghafoor A. Ward E. Thun M.//CA Cancer. J. Clin, 2003; Vol. 53; 5–26 . Frommer D.J. What's new in colorectal cancer screening? // J. Gastroenterol. Hepatol, 1998; Vol. 13; No. 5; 528–533 . Gazelle G.S. McMahon P.M. Scholz F.J. Screening for Colorectal Cancer//Radiology, 2000; Vol. 215; No. 2; 327–335 . Guelrud M. Herrera I. Essenfeld H. Enhanced magnification endoscopy: new technique to identify specialized intestinalmetaplasia in Barrett's esophagus//GastrointestEndosc, 2001; Vol. 53; 559–565 .
2nd Annual International Interdisciplinary Conference, AIIC 2014, 8-12 July, Azores, Portugal Proceedings, Vol.3
204
Mayev I.V. Melnikova E.V. etc. New methods of serologic and endoscopic diagnostics of chronic atrophic gastritis and early carcinoma of the stomach//Clinical prospects gastroenterology Hypatolum, 2009; No. 6; 30–34 . Baronskaya, E.K. Klinichesky a range of precancerous pathology of a stomach//Rus. gastroenterology magazine, 2002; No. 3; 7-14 . Kogan, E.A. molecular and genetic bases of a carcinogenesis//Rus. gastroenterology magazine, 2002; No. 3; 32-36 . Lukasheva, I.V. diagnostics and a current of a peptic ulcer at teenage and youthful age//All-Union congress of the gastroenterologists, the 1st: Theses of reports, 1973:1; 118-119 . Portnoy, JI.M. Modern radiodiagnosis in gastroenterology and a gastroenteroncology: Vidar-M, 2001; 218 . Association Helicobacterpylori-Herpesviridae in an etiopathogenesis of neoplastic lesions of a stomach. Modern aspects of studying//Anala of Mechnikovsky Institute, 2005; No. 1; 48-65 Shmak, A.I Carcinoma of the stomach: risk factors, prophylaxis, diagnostics and treatment: method, grant: Minsk, 2007; 12 . Age at acquisition of Helicobacter pylori infection: Comparison of two areas with contrasting risk of gastric cancer//Helicobacter, 2004; Vol. 9; P.262-270. Increased risk of noncardia gastric cancer associated with proinflammatory cytokine gene polymorphisms//Gastroenterology, 2003; Vol.124; 1193-1201 . Rising incidence of adenocarcinoma of the esophagus and gastric cardia//JAMA, 1991; Vol. 235; 1287-1289 . . Take S. The effect of eradicating Helicobacter pylori on the development of gastric cancer in patients with peptic ulcer disease//American Journal of Gastroenterology, 2005; Vol. 100; No. 5; 1037-1042 . Kononov A.V. Atrophic gastritis, an intestinal metaplasia and a dysplasia - whether exists consecutive dependence? // Workshop materials: "Chronic gastritis. Treatment of a banal disease or kantserprevention way? ": M, 2008; 8 . Kanonov A.V. lnflammation as a basis of the Helicobacterpylori-associated illnesses//Arkh. pathol. 2006; No. 5; 3-10 . Mayev I.V. Samsonov A.A. Peptic ulcer: M.: Miklosh, 2009; 9-90 . Pasechnikov V.D., Chukov S. Z. H proofs. the pylori-associated gastric carcinogenesis and development of strategy of prophylaxis of a carcinoma of the stomach//Rus. magazine. gastroenterology. Hypatolum. koloprotocol. 2006; No. 5; 82 . Suvorov A.N. Simanenko V. I. Helicobacterpylori as originator of diseases of a gastrointestinal tract//Manual, 2006; 1-10 . Zimmerman Ya.S. Actual problems of clinical gastroenterology: clinical sketches: Perm, 2008; 168 . Malfertheiner P. Megraud F. O´Morain C. et al. / Current concepts in the management of Helicobacter pylori infection//The Maastricht 2-2000 consensus report. Aliment. Pharmacol. Ther. 2002; Vol. 16; 167-180 . Baranovsky A.Yu. Nazarenko L.I. Adverse options of a current of a peptic ulcer: St.-Petersburg: SPB, 2006; 22-68 . Chissov V. I. Starinsky V. V., Sotnikova E.N. early diagnostics of oncologic diseases: M.: Literra, 1994; 82 . Figueiredo C. Helicobacter pylori and interleukin 1 genotyping: an opportunity to identify high-risk individuals for gastric carcinoma//Journal of the National Cancer Institute, 2002; Vol. 94; No. 22; 1680-1687 . Correa P. Chronic gastritis as a cancer precursor//Scand. J. Gastroenterol, 1984; Vol. 104; River 131–136. Parkin D. PisaniP. Ferlay J. Global cancer statistics//Cancer J Clin. 1999; Vol. 49; P. 33–64 .
2nd Annual International Interdisciplinary Conference, AIIC 2014, 8-12 July, Azores, Portugal Proceedings, Vol.3
205
ANTERIOR RECURRENT EPISTAXIS FROM KIESSELBACH'S AREA
Neven Skitarelić, MD, PhD Department of Otorhinolaryngology, General Hospital Zadar,
Department of Health Studies Zadar, Croatia Željko Čulina, MD
Department of Internal medicine, General Hospital Zadar, Croatia Ivan Bačić, MD, PhD
Department of Surgery, General Hospital Zadar, Department of Health Studies Zadar, Croatia Nataša Skitarelić, MD, MSc
Department of Pediatrics, General Hospital Zadar, Department of Health Studies Zadar, Croatia
Abstract Vascular diseases are a major threat to human health nowadays. Hypertension, cardiovascular disease and varicose vain disease including hemorrhoids, are now increasingly recognized as inflammatory diseases. The role of inflammation cytokines in the pathogenesis of these diseases is very important. The lamina propria in the nasal mucosa is rich in blood vessels and humoral mediators. Recurrent epistaxis from Kiesselbach’s area syndrome (REKAS) was first mentioned as early as 1985. It has been found that 90% of patients suffering from recurrent epistaxis from Kiesselbach area syndrome simultaneously suffered from hemorrhoids. Clinical observations suggest a possible mutual pathophysiologic relationship between Kiesselbach’s and anorectal venous plexus. This relationship is also suggested in the reverse direction: significantly more than two thirds of primarily hemorrhoidal patients (83.01%) showed simultaneous vascular dilatations within their Kiesselbach plexuses, but none of these patients had ever have recurrent nose bleeds. There is one more thing they did not have (contrary to REKAS group) - anterior septal deformity. Furthermore, REKAS and hemorrhoidal disease, despite being different clinical entities, frequently appear in the primarily REKAS patients or their closest relatives (more than 90% out of all!). At the same time, all of REKAS patients did have a certain degree of the anterior septal deformity, which primarily hemorrhoidal patients did not have at all. Therefore we consider that Kiesselbach’s vascular plexus in the Little’s area of the nasal septum belongs to the same group as anorectal venous plexus does (others of this group are brain, esophagus, and lower leg venous system). We also consider that the anterior septal deformity is a crucial factor for the onset of the inflammation of the nasal vestibule skin (vestibulitis nasi), while vestibulitis nasi precipitates the onset of typical recurrent nose bleeds from the Kiesselbach’s plexus.
Keywords: Nasal septum, recurrent epistaxis Introduction Vascular diseases are a major threat to human health nowadays. Cardiovascular diseases, including coronary heart disease and a stroke, are the leading cause of death in the United States and Europe.Several risk factors (i.e. stressful life,

2nd Annual International Interdisciplinary Conference, AIIC 2014, 8-12 July, Azores, Portugal Proceedings, Vol.3
206
overweight, physical inactivity, smoking, hypertension, and diabetes mellitus, high levels of cholesterol and lipids) are associated with the development of cardiovascular disease. Hypertension and cardiovascular disease, including atherosclerosis, cardiac hypertrophy, and ischemic disease, nowadays have been increasingly recognized as inflammatory diseases. In recent years, this hypothesis has lead to heightened interest in studying the role of inflammation cytokines in the pathogenesis of these diseases [1]. Like artery, the veins are also a part of vascular system and have their own pathology. Varicose veins are tortuous, twisted, or lengthened veins. The theory that varicose veins result from failure of valves in the superficial veins leading to venous reflux and vein dilatation has been superseded by the hypothesis that valve incompetence follows rather than precedes a change in the vein wall [2]. Thus, the vein wall is inherently weak in varicose veins, which leads to dilatation and separation of valve cusps so that they become incompetent. Risk factors for varicose veins include increasing age and parity and occupations that require a lot of standing. Hemorrhoids are a very widespread disease causing pain by thrombosis, fear by bleeding and be a burden by weeping and itching. Hemorrhoids occur when the external hemorrhoidal veins become varicose (enlarged and swollen), which causes itching, burning, painful swellings at the anus, dyschezia (painful bowel movements), and bleeding. Pain with bowel movements and bleeding are often the first signs of hemorrhoids. Taweevisit et al. propose that mast cells have a multidimensional role in the pathogenesis of hemorrhoids, through the actions of the chemical mediators and cytokines released from mast cell granules [3]. Some investigation focuses on caliber and flow changes of the terminal branches of the superior rectal artery supplying the corpus cavernosum recti in patients with hemorrhoids [4]. This fact implicates the unity of the vascular system and its pathophysiology. Some pathophysiological aspects of the nasal blood vessels The lamina propria in the nasal mucosa is rich in blood vessels.The arterioles are conspicuous by an absence of internal elastic membrane. Porosity of the endothelial basement membrane had been described as characteristic of nasal blood vessels. As a result of these structural characteristic, the subendothelial musculature of these vessels may be influenced more easily by agents, such as mediator substances, hormones and drugs, circulating in the blood stream. The capillaries just below the surface epithelium and those surrounding the glands are of the fenestrated type. These capillaries are well suited for rapid movement of fluid through the vascular wall [5]. This will allow water to escape into the airway lumen and to vaporize to take place in conditioning the inspired air. Large venous cavernous sinusoids, mainly localized in the inferior turbinate, are characteristic of nasal mucous membrane. They are normally found in a semi-contracted condition as a result of the influence of the sympathetic nerve-mediated smooth muscle tonicity. The cavernous sinusoids are regarded as specialized vessels adapted to the functional demands of the nasal airway with respect to heating and humidification of inhaled air. When they distend by blood, the nasal mucosa becomes swollen and tends to block the airway lumen, either in part (which is normal) or completely (in nose disease). The extravasation of plasma through the walls of postcapillary venules takes place during inflammation of the mucosa. The process runs through the gaps in the intercellular junctions between the endothelial cells. This leads to an increase of the interstitial liquid volume and pressure, which, in addition, tends to force transfer of plasma-like liquid as an exudate. The humoral mediators that cause extravasation of plasma are many, and include

2nd Annual International Interdisciplinary Conference, AIIC 2014, 8-12 July, Azores, Portugal Proceedings, Vol.3
207
histamine, bradykinin, various prostaglandins, and sensory nerve neuropeptides such as substance P [5]. Recurrent epistaxis from Kiesselbach’s area and anorectal venous plexus: do they have anything in common? Epistaxis, whether spontaneous or otherwise, is experienced by up to 60% of people in their lifetime, with 6% requiring medical attention [6]. The etiology of epistaxis can be divided into local and general causes, however most (80–90%) are actually of unknown etiology [7]. Kiesselbach's plexus, which lies in Kiesselbach's area, or Little's area, is a region in the anteroinferior part of the nasal septum where four arteries anastomoses to form a vascular plexus of that name. Recurrent epistaxis from Kiesselbach’s area syndrome (REKAS) was first mentioned as early as 1985 [8]. This syndrome was found to be the result of a simultaneous interaction between the following four constant factors: (a) specific anterior septal deformity; (b) dilated vessels of Kiesselbach venous plexus; (c) infection of the nasal vestibule skin, and (d) heredity. Clinical observations suggested also a possible mutual pathophysiologic relationship between Kiesselbach and anorectal venous plexus. He also found a high correlation of REKAS nose bleeds and the incidence of lower leg venous system disorders (varices cruris, for instance) [8]. Regarding hemorrhoidal disorders, a large number of REKAS patients, i.e. 90% of them, were found to suffer from hemorrhoids [8]. Local chronic infection was suggested to be a causative factor for both hemorrhoids and REKAS patients [9,10]. Furthermore, the symptoms of hemorrhoidal diseases (and also of varices cruris, cerebral strokes) were found in the closest relatives of 90% of REKAS patients or even in themselves, strongly suggesting a hereditary predisposition for venous plexus disorders [8], as is the case with hemorrhoids [11]. Finally, dilated vessels and direct arteriovenous communications are a usual finding in both hemorrhoidal [12] and REKAS patients [13]. A pathophysiologic relationship between Kiesselbach and anorectal venous plexus in REKAS patients is suggested by the high incidence of REKAS patients or their closest relatives suffering from hemorrhoidal problems. According to our previous results [14], this relationship is also suggested in the reverse direction: more than two thirds of primarily hemorrhoidal patients showed simultaneous vascular dilatations within Kiesselbach plexus of the nasal vestibule (83.01%). Surprisingly, none of these patients had recurrent nosebleeds [14]. This suggests that vascular dilatations within Kiesselbach venous plexus are not per se an exclusive, crucial factor for the onset of the REKAS. Thus, the question arises here about which factors exactly were missing as to produce the onset of REKAS also in our primarily hemorrhoidal patients: anterior septal deformity, or vestibular infection, or perhaps both? Anterior septal deformity exhibited a very low incidence (7.5%), whereas the signs of a slight vestibular infection were also very seldom seen (3.8%) [14]. Since neither vestibular infection nor REKAS appeared in primarily hemorrhoidal patients despite dilated vessels in their Kiesselbach venous plexuses and a positive hereditary factor, we believe that this situation was due to absence of the anterior septal deformity in these patients at the first place. The septal deformity has been generally recognized as a provocative factor in epistaxis [7]. As we mentioned before, inflammation also play a role in the pathogenesis of arterial and venous vascular diseases [1,3].

2nd Annual International Interdisciplinary Conference, AIIC 2014, 8-12 July, Azores, Portugal Proceedings, Vol.3
208
Conclusion Kiesselbach’s vascular plexus in the Little’s area of the nasal septum belongs to the same group as anorectal venous plexus does. The anterior septal deformity is a crucial factor for the onset of the inflammation of the nasal vestibule skin (vestibulitis nasi), while vestibulitis nasi precipitates the onset of typical recurrent nose bleeds from the Kiesselbach’s plexus. References: Murao K, Imachi H, Yu X, et al. The transcriptional factor PREB mediates MCP-1 transcription induced by cytokines in human vascular endothelial cells. Atherosclerosis 2009; doi:10.1016/j.atherosclerosis.2009.03.051. London NJM, Nash R. Varicose veins. BMJ 2000;320:1391–4. Taweevisit M, Wisadeopas N, Phumsuk U, Thorner PS. Increased mast cell density in haemorrhoids venous blood vessels suggest a role in pathogenesis. Singapore Med J 2008;49:977–9. Aigner F, Bodner G, Gruber H, et al. The vascular nature of hemorrhoids. J Gastrointest Surg 2006;10:1044–50. Cauna N. The fine structure of the arteriovenous anastomosis and its nerve supply in the human nasal respiratory tract. Anat Rec 1970;168:9–21. [6] Petruson B, Rudin R. The frequency of epistaxis in a male population sample. Rhinology 1975;13:129–33. Pope LER, Hobbs CGL. Epistaxis: an update on current management. Postgraduate Med 2005;81:309–14. Mladina R. REKAS (recurrent epistaxis from Kiesselbach’s area syndrome). Chir Maxillofac Plast 1985;15:91–5. McGivney J. A re-evaluation of etiologic factors of hemorrhoidal disease. Arizona Med 1967;24:333–6. Nesselrod JP. Hemorrhoids (letter). Arch Surg 1974;109:45. Loder PB, Kamm MA, Nicholls RJ, Phillips RKS. Hemorrhoids: pathology, pathophysiology and aetiology. Br J Surg 1994;81:946–54. Thompson WHF. The nature of hemorrhoids. Br J Surg 1975;62:542–52. Kirchner JA, Yanagisawa E, Crelin ES. Surgical anatomy of the ethmoidal arteries. Arch Otolaryngol 1961;74:382–6. Mladina R, Cavcic J, Šubaric M. Recurrent epistaxis from Kiesselbach’s area syndrome in patients suffering from hemorrhoids: fact or fiction. Arch Med Res 2002;33:193–4.
2nd Annual International Interdisciplinary Conference, AIIC 2014, 8-12 July, Azores, Portugal Proceedings, Vol.3
209
EARLY DEVELOPMENT OF CORONARY ARTERY DISEASE AT A YOUNG WOMAN
G.D. Abilmazhinova Cand.Sc. (Medicine) A.M. Mussin, Cand.Sc. (Medicine)
M.I. Madiyeva, MD.
Abstract The authors described a case of myocardial infarction at a young woman, which shows the influence of traditional risk factors and metabolic syndrome on the early development of coronary artery disease.
Keywords: Coronary heart disease, myocardial infarction, risk factors, women of young age Introduction Indicators of morbidity, disability and mortality due to major diseases of the circulatory system (DCS) tend to steady growth throughout the world, including Kazakhstan. Out of the total deaths worldwide DCS occupy leading positions. So according to the World Health Organization (WHO) more than 55 % of deaths and disability are caused by heart diseases. Every year the world's 17.3 million people die of cardiovascular disease, which is a leading cause of mortality among men and women. The number of deaths is projected to increase in 2030 to 23.3 million cases. Estimated at 8.6 million, including fatal cases of coronary heart disease today are women. Women under 50 who have experienced a heart attack of coronary nature are twice as likely to die than men of this age group. Women who have had a seizure at the age of 65 are more likely to die than men within a year after hospitalization: 42% versus 24%. [1] Traditionally, the prevalence of coronary heart disease with women has been underestimated because of high rates of the disease in men at a young age. [2] The generally accepted view was that at women IHD starts later than at men when the “estrogen protection" factor disappears. Estrogens increase HDL and lower LDL and progesterone has the opposite effect. Estrogen deficiency is also accompanied by a worsening of vasospastic reactions and platelet aggregation. Estrogens increase HDL by 20-30%, as well as HDL2 fraction. This effect is mediated through increased production of apolipoprotein AI and a decrease in the rate of its clearance. Estrogens reduce LDL cholesterol by 10-20% through enhanced LDL receptor elimination by the liver cells. LDL inhibit vascular endothelium relaxation. Reduced estrogen levels leads to a decrease in the bioavailability of NO, which also leads to vasoconstriction. However, against the background of treatment with estrogen elevated triglycerides (TG) were detected. [7, 25, 26] Thus, under the influence of estrogen the change in the qualitative composition and reducing of the size of LDL is observed, but the concentration of C-reactive protein (CRP) increases. Recently it was found that CRP is not only a predictor of cardiovascular events, but the indicator of progression of atherosclerosis. CRP level stands in direct correlation with the severity of coronary artery disease at women [30, 31]. According to studies by HERS, ERA and WHI the hormone replacement therapy when used for tracking the dynamics of coronary atherosclerosis, despite favorable changes in blood lipid spectrum, resulted in no significant differences in the placebo group by
2nd Annual International Interdisciplinary Conference, AIIC 2014, 8-12 July, Azores, Portugal Proceedings, Vol.3
210
angiographic indicators such as the minimum diameter of stenotic arteries, the number of new stenoses at patients with atherosclerosis progression or regression [7, 28, 29]. Statistics of recent years show that currently the widely accepted «estrogen» protection of women “does not preclude” CHD. Recent studies have shown that women have special, specific risk factors, peculiar only to females. This dysfunction of sex hormones is associated with their central disregulation or genital diseases, multiple endocrinopathies. These disorders can lead to the development of pathological menopause and lead to the early development of CVD, particularly coronary artery disease. It should be noted that at relatively young women with surgical menopause possibility of myocardial infarction increases dramatically(9-10 times). [1, 2, 22]. In addition, conditions such as gestational diabetes and preeclampsia during pregnancy, polycystic ovaries greatly increase the chances of ischemia [1, 20].
It should be taken into consideration that the prevalence of traditional risk factors (RF) of coronary heart disease (CHD) at women in recent decades has steadily increased. In connection with the emancipation women are being more frequently exposed to multiple stresses, therefore, the female population has growing incidence of diabetes mellitus (DM), hypertension (HT), dyslipidemia (DLP) and obesity. Other urgent problems are inactivity, malnutrition and smoking. [2] According to researchers at the Ohio State University, overweight increases the risk of coronary heart disease at women by 64%, whereas at men only 46% [1]. Women are more common with dyslipidemia and glucose metabolism, and elevated levels of total cholesterol (TC) than men, the risk of cardiovascular disease at women has increased to a great extent. The relationship between the level of HDL-cholesterol and coronary heart disease is more pronounced in women than in men. [4, 7, 16] Raising HDL cholesterol by 1 mg/dL is accompanied by a reduced risk of CHD in men by 2%, and for women - 3%. Women have greater prognostic value decrease in HDL cholesterol and increase in triglycerides (TG). [ 2, 3, 7, 16-17] According to the Framingham study, despite lower triglyceride levels in women than men, the regression coefficient between this index and the risk of coronary heart disease was 5 times more than men. [5, 16, 17] The frequency of hypertension in women with coronary heart disease is twice higher than in men with coronary artery disease. [7] Women who smoked more than 35 cigarettes per day, the risk is 20- times higher than in non-smoking women. [7] In general, the incidence of acute myocardial at young women- smokers (under 60) 15 years ago was 2-3%, today - 7 - 8 %. [8] Sedentary lifestyle also increases the risk of developing this disease by three times. [1] In the last 10-15 years much attention is paid to the metabolic syndrome (MS), which includes tissue insulin resistance, hyperinsulinemia, hypertension, atherogenic dyslipidemia, abdominal obesity, impaired carbohydrate tolerance or type 2 diabetes (G.M.Reaven, 1988). The clinical significance of MS is the presence of complex risk factors that create the preconditions for the development of atherosclerosis and its complications. Increase for several times the summation of individual cardiovascular risk by combining components of MS determines its basic medical and social significance. MS patients 10 times more likely to develop MI. Overall mortality is increased by 2.4 times. [23, 24] Materials and Methods: the patient M. of 28 was examined. The patient came in December 2013 to Pavlodar city hospital # 2 with complaints of retrosternal pain of pressing nature radiating to the left arm and accompanied by a feeling of lack of air, breathlessness, sweating at walking within 100m and at rest, the pain lasted for 5 - 30 minutes, the pain ceased by itself at rest, also she had headaches, rises in blood pressure (BP) to 180 /90 mm Hg., palpitations, weakness, fatigue. From history: considers herself a patient since June 2013, when for the first time she began to mark rises in blood pressure to 180/100 mm Hg. She consulted the local therapist and according to the recommendations she had regularly tab.of indapamid 2.5mg 1 time per day, tab.of berlipril 10mg 1 time per day. In mid-November 2013 she suffered from the pressing retrosternal pain radiating to the left arm,

2nd Annual International Interdisciplinary Conference, AIIC 2014, 8-12 July, Azores, Portugal Proceedings, Vol.3
211
feeling short of breath, wheezing while walking, pain lasted for about 5 minutes, the pain ceased by itself at rest. On having appealed to the clinic, she was diagnosed with hypertension of the 2 stage and 3 risk, cervicothoracic osteochondrosis. Within a week she had had anti-inflammatory and metabolic therapy. Effect of treatment was not observed, retrosternal pain became more prolonged, she again consulted the therapist then her electrocardiogram (ECG) was taken down, which registered - sinus rhythm, right, CHSS89 min, normal position EOS, QS V1-V3, ST elevation V1-V3, (+ -) T V1-V3, (-) T V4-V6 (Fig. 1). In an emergency order she was sent to the urgent clinic, hospitalized with acute coronary syndrome. History of life: Smokes for 10 years by 12sigaret a day, does not drink alcohol. Heredity is burdened by arterial hypertension (AH) and coronary heart disease (CHD), coronary diseases and death at a young age with her relatives are not noted. During the last 2 years 20kg weight gain. Features of gynecological history: Menstruation since the age of 13, regular, moderate, with a cycle of 28 days. Married for 3 years. Pregnancies and births did not occur, did not use contraception . Objective: The general condition is relatively satisfactory. Height – 153cm, weight 88kg, BMI (body mass index) is 37 kg/m2. Obesity of the 2 stage. Waist measurement (WM) - 115cm, measurement round the hips (HM) - 121cm, Attitude FROM / ON - 0.95. Skin of normal color, normal humidity. Shape of the chest: hypersthenic. Percussion sound over lungs: pulmonary. Auscultation: vesicular breathing, no wheezing. NPV - 17 min. Boundaries of the relative and absolute dullness of the heart within the age norm. Cardiac sounds are muffled, regular rhythm. Heart rate is 80 beats / min , PS 80 beats/min, satisfactory filling. Blood pressure of 150 /90 mm. Hg. on both hands. Abdominal palpation is soft, increased in volume due to subcutaneous fat, palpation is painless. Liver edge is of the costal arch. The spleen is not enlarged. Physiological functions are not violated. No peripheral edema. According to laboratory studies on admission:
Total blood from 06.12.2013: Нв, g/l
ER., х 1012/L CI HT,
% L., х 109/L RNC,% N,% E,% М,% L,
% Tr, х 109/L
ESR, mm/h
136 4.86 0.83 40 7.0 1 42 2 7 48 348 23
Biochemical Blood Analysis dated 06.12.2013: TP, g/l Blood urea, mole/l creatinine mc.mole/l glucose mole/l ALT, u/l AST, еu/l CRP
60 3,5 69,2 4,9 24,5 22,7 negative
Lipid spectrum dated 06.12.2013: Cholesterol, mole/l HDL, mole/l LDL, mole/l TG, mmole/l Index of atherogenicity
4,1 0,78 2,54 2,7 4,2 Troponin T at admission was - 0.2, while the second study after 6 hours troponin T - 0.15. In the ovulatory phase of the cycle study was conducted following hormones showed a reduction in the level of luteinizing hormone - 10.5 IU / L (normal 24 - 150), a decrease in prolactin levels of 68 ng / mL (normal, 4-23), a slight decrease in FSH 5.32 IU/l (normal 5.8 - 21). According to instrumental studies: The primary conducted echocardiography ( echocardiography ) revealed: ejection fraction (EF) of the left ventricle (LV) was 47%. Signs of left ventricular hypertrophy was detected. Hypokinesis of the apical, anterior- septal LV segments was observed. Mitral regurgitation of the 1st stage was fixed. Tricuspid regurgitation of the 1st was detected. The electrocardiography (ECG) at hospitalization fixed sinus rhythm of the heart, right, CHSS89 min, normal position EOS, QS V1 - V3, lifting ST V1-V3, (+ -) T V1-

2nd Annual International Interdisciplinary Conference, AIIC 2014, 8-12 July, Azores, Portugal Proceedings, Vol.3
212
V3, (-) T V4-V6 ) - anterior myocardial infarction, septal area, the top of the left ventricle ( Figure 1).
Fig.1 : The ECG of the patient M of 28, at hospitalization.
By results of daily ECG monitoring the average heart rate ( HR) was 72 beats/min. Minimum heart rate was 46 beats/min at 2:29 AM. Maximum heart rate was 138 beats/min 10:57 AM. No changes were detected using the apparatus pauses > 1.5 sec. 38 episodes of tachycardia were fixed, tachycardia episode duration was 43 min. 37 seconds. Episodes of bradycardia were not detected. Three PVCs (VES), 6 atrial extrasystoles ( PES) were observed. There was no evidence of arrhythmia episodes absolute. In accordance with a coronary angiography (Figure 2a, b): the type of circulation is balanced, Left main - with equal contour passable along the entire length. LAD is with a rough outline, in the middle segment extended 99% stenosis. At the mouth of stenosis 30 %. CF is with a smooth contour and passable along the entire length. RCA is with a smooth contour and passable along the entire length.
LAD stenting was made with a stent eluted by the drug - Medtronic Resolute Integrity 2.75mm x 14mm. Satisfactory results after stenting were observed. (Figure 2a and b).

2nd Annual International Interdisciplinary Conference, AIIC 2014, 8-12 July, Azores, Portugal Proceedings, Vol.3
213
Based on the above mentioned the patient was diagnosed: CHD, myocardial infarction with ST elevation of anterior septum area, apex of the left ventricle. Single-vessel coronary lesions: stenosis of middle LAD Segment by 99%, after stenting the condition of LAD is the 1 class heart failure by Killip, Hypertension 2 risk 4. For the time spent in hospital for ongoing background antianginal therapy the patient’s health considerably improved, anginal pains were not present, though rare discomforts in the heart remained, shortness of breath was not observed, hemodynamic parameters were stable, the patient was dismissed from hospital in a satisfactory condition. Conclusion: The presented clinical case presents interests for myocardial infarction with ST elevation occurred at a young 28 year old woman, when CHD direct myocardial infarction, has traditionally been viewed as a disease of middle aged and elderly men. The presence of risk factors such as obesity of the 2nd stage, dyslipidemia, smoking, family history, symptoms of hypoestrogenemy may have led to early atherosclerosis of coronary vessels with the development of myocardial infarction. According to the recent research the increase in the incidence of myocardial infarction and mortality from myocardial infarction at young women becomes more frequent [1, 7, 8]. Experts attribute this fact to the delay in diagnosis. Noted fact is as well connected with misinterpretation of ST segment elevation on
2nd Annual International Interdisciplinary Conference, AIIC 2014, 8-12 July, Azores, Portugal Proceedings, Vol.3
214
ECG of young women, due to lack of recognition of the increasing incidence of coronary heart disease at this group of patients [8]. Any patient, regardless of age and gender with complaints of a typical or atypical chest pain, should record electrocardiogram. Electrocardiographic signs of myocardial ischemia must be diagnosed regardless of sex and age of the patient. References: Coronary Artery Disease in Women: A 2013 Update - Global Heart, June 2013. S.N.Tereshchenko, T.M. Usach, I.V. Kositsina and others //Cardiology – 2005. – # 1. – P. 98–104. Bush T.L., Miller V.T. // Miеnopause physiology and pharmacology. – New York.: Year Book Medical Publishers Inc., 1987. – P. 187–208. Gordou D.J., Probstfield J.L., Garrison R.J. et al. // Circulation. – 1989. – Vol. 79. – P. 8–15. Сметник В.П. // Рус. мед. журнал. – 2001. – Т. 9, № 9 (128). – С. 354–358. S.A.Boitsov, A.V. Susekov, D.M.Aronov and others. Actual issues of the satin therapy in clinical practice. Expert Council Meeting. // Atherosclerosis and Dislipidemy — 2011. — #1. — P. 65-66. А.А Lyaishev Peculiarities of IHD at women – Medical Encyclopedia. – Medical Articles. – Cardiology. - 2007. Jaimison M, ST Elevation Myocardial Infarction is Underdiagnosed and Undertreated in Women, ACLS certification Institute. - May 2013 Berger JS, Elliott L, Gallup D, Roe M, Granger CB, Armstrong PW, Simes RJ, White HD, VandeWerf F, Topol EJ, Hochman JS, Newby LK, Harrington RA, Califf RM, Becker RC, Douglas PS. Sex differences in mortality following acute coronary syndromes. JAMA. 2009.-302. - 874–882 Gulati M., Leslee J. Shaw, C. Noel Bairey Merz, Myocardial Ischemia in Women - Lessons from the NHLBI WISE Study, Clin Cardiol. 2012 March. -35(3). – Р.- 141–148. Kochaneck KD, Xu J, Murphy SL, Minino AM, Kung H-C. Deaths: Preliminary Data for 2009. National Vital Statistics Reports. 2011. – 59. – Р. - 1–51. Roger VL, Go AS, Lloyd-Jones DM, et al. Heart disease and stroke statistics--2011 update: a report from the American Heart Association. Circulation. 2011. – 123. - 18–209. Smilowitz NR, Sampson BA, Abrecht CR, Siegfried JS, Hochman JS, Reynolds HR. Women have less severe and extensive coronary atherosclerosis in fatal cases of ischemic heart disease: an autopsy study. American heart journal. 2011. – 161. - 681–8. Reynolds HR, Srichai MB, Iqbal SN, et al. Mechanisms of myocardial infarction in women without angiographically obstructive coronary artery disease. Circulation.2011. – 124. - 1414–25. Mokdad AH, Ford ES, Bowman BA, et al. Prevalence of obesity, diabetes, and obesity-related health risk factors, 2001. JAMA : the journal of the American Medical Association. 2003. – 289. - 76–9. Lerner DJ, Kannel WB. Patterns of coronary heart disease morbidity and mortality in the sexes: a 26-year follow-up of the Framingham population. Am Heart J. 1986.–111. -383–90. Hokanson JE, Austin MA. Plasma triglyceride level is a risk factor for cardiovascular disease independent of high-density lipoprotein cholesterol level: a meta-analysis of population-based prospective studies. J Cardiovasc Risk.1996. – 3. - 213–9. Spencer EA, Pirie KL, Stevens RJ, et al. Diabetes and modifiable risk factors for cardiovascular disease:the prospective Million Women Study.Eur J Epidemiol.2008–23. -793–9.

2nd Annual International Interdisciplinary Conference, AIIC 2014, 8-12 July, Azores, Portugal Proceedings, Vol.3
215
Bairey Merz CN, Johnson BD, Sharaf BL, et al. Hypoestrogenemia of hypothalamic origin and coronary artery disease in premenopausal women: a report from the NHLBI-sponsored WISE study. Journal of the American College of Cardiology. 2003. -41. - 413–9. Bellamy L, Casas JP, Hingorani AD, Williams DJ. Pre-eclampsia and risk of cardiovascular disease and cancer in later life: systematic review and meta-analysis.Bmj. 2007. – 335. - 974. Mehta PK, Goykhman P, Thomson LE, et al. Ranolazine improves angina in women with evidence of myocardial ischemia but no obstructive coronary artery disease. JACC Cardiovasc Imaging. 2011. – 4. - 514–22. Kennedy JW, Killip T, Fisher LD et al. The clinical spectrum of coronary artery disease and its surgical and medical managment: the Coronary Artery Surgery Study.// Circulation. 1982;66 (5 Pt 2): 11116 Prasad A., Stone G., Stuckey T. et al. Impact of diabetes mellitus on myocardial perfusion after primary angioplasty in patients with acute myocardial infarction // J. Am. Col. Cardiol. 2005. - 45. - 508-514. Yoshioka M., Doucet E., St.-Pierre S. et al. Impact of high-intensity exercise on energy expenditure, lipid oxidation and body fatness // Int. J. Obes. 2001. - 25. – Р.- 332-339. Nabulsi A.A. et al. // New Engl. J. Med. 1993. V.- 328. P.- 1069–1075. Soma M. et al. // Lancet. 1991. V. -337. -P. -612. Климов А.Н., Нагорнев В.А., Денисенко А.Д. // Мед. академ. журнал. – 2005. – Т. 5. - № 2.– P.- 18–32. Signorelli S.S., Neri S., Sciacchitano S. et al. // Maturitas. – 2001. – Vol. 39. – P. 39–42. Rosano G.M.C., Cerquetani E., Gebara O. et al. // Eur. Heart J. – 2002. – Vol. 23. – P. 592. Tataru M.C., Heinrich L. et al. // Eur. Heart J. – 2002. – Vol. 21. – P. 1000–1008. Van ger Meer I.M., Moniek P.M. C-reactive protein predicts progression of atherosclerosis measured at various sites in the arterial tree. – 2002.
2nd Annual International Interdisciplinary Conference, AIIC 2014, 8-12 July, Azores, Portugal Proceedings, Vol.3
216
QUALITY OF LIFE FOLLOWING CANCER TREATMENT
Dr. Ferdous Ara Islam Medical Officer, Department of Neurosurgery, Bangladesh
Abstract This cross sectional study was carried out among 301 cancer patients attending Dhaka Medical College Hospital, Bangladesh in the Department of Radiotherapy to observe the quality of life following cancer treatment. A semi structured questionnaire was used to collect the data. The quality of life (QOL) in case of pain, ability to self care, able to play role activity in family & society can take part in family and leisure activities were improved. Whereas in case of loss of household asset the situation was worsen. The best scores improved in the different indicators before & after Radiotherapy such as: pain from 27.77% to 30.15%, ability to self care 75.39% to 84.12%, ability to play role activity in family & society 69.84% to 75.39%, can take part in family and leisure activities 74.60% to 79.36%. The Best scores for Chemotherapy: pain from 23.0% to 30.24% ability to self care from 61.97% to 77.46%, ability to play role activity in family & society 63.38% to 74.64%, can take part in family and leisure activities 63.38% to 69.01% and the Best scores for both Radiotherapy & Chemotherapy were improved in the same way. However, the Best scores deteriorated in case of Radiotherapy were 84.61% to 89.42%, Chemotherapy 70.42 % to 42.25% and for both Radiotherapy & Chemotherapy 84.61% to 89.42% for loss of household asset. The quality of life (QOL) of the respondents improved following treatment but at the same time they lost their household asset. The Best scores for quality of life improved following Radiotherapy, Chemotherapy and combined therapy (Radiotherapy and Chemotherapy) which was significant. With relation to loss of household assets the best scores deteriorated in all the three groups of treatment which was also found significant.
Keywords: Life quality, cancer, treatment Introduction Cancer is the world’s second biggest killer after cardiovascular disease; Cancer killed 7.6 million people in 2005, three quarters of whom were in low and middle income countries. By 2015, that number is expected to rise to 9 million and increase further to 11.5 million in 2030. Up to 40% of all cancer deaths can be avoided by reducing tobacco use, improving diets and physical activity, lowering alcohol consumption, eliminating workplace carcinogens and immunizing against Hepatitis B virus and the Human papilloma virus. Among females the most common cancer at the global level is breast cancer. Cervix uteri cancer is the number one cause of cancer deaths in the South-East Asia region and the African region.1 Incidence of Cancer increased in Bangladesh for last two-three decades. In the light of the statistics available from the World Health Organization, cancer incidence, prevalence and mortality can be estimated approximately as 2,00,000, 8,00,000 and 1,50,000 respectively for the 130 million people of Bangladesh. The new cancer cases in Bangladesh have been estimated at 167 per 1, 00, 000 population.2 The economic impact of cancer treatment goes beyond the costs to health services. The resource allocation is not adequate for the treatment of the cancer patients. The different treatment modalities are required like surgery,
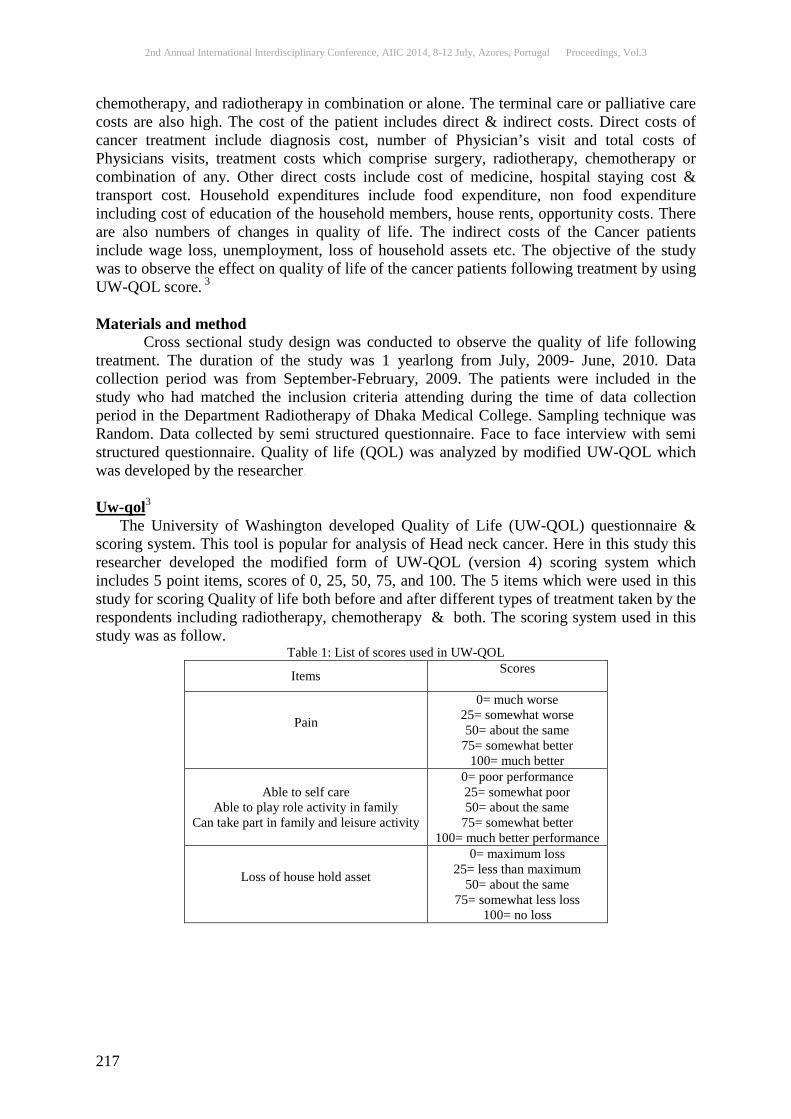
2nd Annual International Interdisciplinary Conference, AIIC 2014, 8-12 July, Azores, Portugal Proceedings, Vol.3
217
chemotherapy, and radiotherapy in combination or alone. The terminal care or palliative care costs are also high. The cost of the patient includes direct & indirect costs. Direct costs of cancer treatment include diagnosis cost, number of Physician’s visit and total costs of Physicians visits, treatment costs which comprise surgery, radiotherapy, chemotherapy or combination of any. Other direct costs include cost of medicine, hospital staying cost & transport cost. Household expenditures include food expenditure, non food expenditure including cost of education of the household members, house rents, opportunity costs. There are also numbers of changes in quality of life. The indirect costs of the Cancer patients include wage loss, unemployment, loss of household assets etc. The objective of the study was to observe the effect on quality of life of the cancer patients following treatment by using UW-QOL score. 3
Materials and method Cross sectional study design was conducted to observe the quality of life following treatment. The duration of the study was 1 yearlong from July, 2009- June, 2010. Data collection period was from September-February, 2009. The patients were included in the study who had matched the inclusion criteria attending during the time of data collection period in the Department Radiotherapy of Dhaka Medical College. Sampling technique was Random. Data collected by semi structured questionnaire. Face to face interview with semi structured questionnaire. Quality of life (QOL) was analyzed by modified UW-QOL which was developed by the researcher. Uw-qol3 The University of Washington developed Quality of Life (UW-QOL) questionnaire & scoring system. This tool is popular for analysis of Head neck cancer. Here in this study this researcher developed the modified form of UW-QOL (version 4) scoring system which includes 5 point items, scores of 0, 25, 50, 75, and 100. The 5 items which were used in this study for scoring Quality of life both before and after different types of treatment taken by the respondents including radiotherapy, chemotherapy & both. The scoring system used in this study was as follow.
Table 1: List of scores used in UW-QOL
Items Scores
Pain
0= much worse 25= somewhat worse 50= about the same
75= somewhat better 100= much better
Able to self care Able to play role activity in family
Can take part in family and leisure activity
0= poor performance 25= somewhat poor 50= about the same
75= somewhat better 100= much better performance
Loss of house hold asset
0= maximum loss 25= less than maximum
50= about the same 75= somewhat less loss
100= no loss
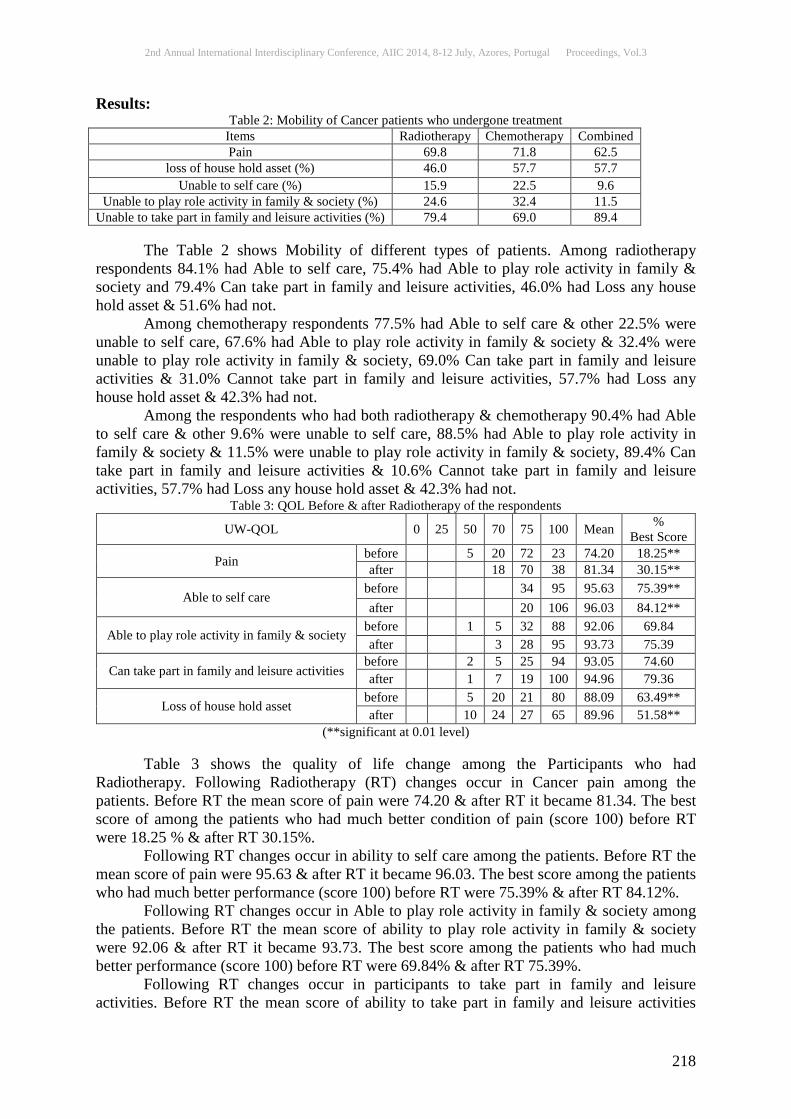
2nd Annual International Interdisciplinary Conference, AIIC 2014, 8-12 July, Azores, Portugal Proceedings, Vol.3
218
Results: Table 2: Mobility of Cancer patients who undergone treatment
Items Radiotherapy Chemotherapy Combined Pain 69.8 71.8 62.5
loss of house hold asset (%) 46.0 57.7 57.7 Unable to self care (%) 15.9 22.5 9.6
Unable to play role activity in family & society (%) 24.6 32.4 11.5 Unable to take part in family and leisure activities (%) 79.4 69.0 89.4 The Table 2 shows Mobility of different types of patients. Among radiotherapy respondents 84.1% had Able to self care, 75.4% had Able to play role activity in family & society and 79.4% Can take part in family and leisure activities, 46.0% had Loss any house hold asset & 51.6% had not.
Among chemotherapy respondents 77.5% had Able to self care & other 22.5% were unable to self care, 67.6% had Able to play role activity in family & society & 32.4% were unable to play role activity in family & society, 69.0% Can take part in family and leisure activities & 31.0% Cannot take part in family and leisure activities, 57.7% had Loss any house hold asset & 42.3% had not.
Among the respondents who had both radiotherapy & chemotherapy 90.4% had Able to self care & other 9.6% were unable to self care, 88.5% had Able to play role activity in family & society & 11.5% were unable to play role activity in family & society, 89.4% Can take part in family and leisure activities & 10.6% Cannot take part in family and leisure activities, 57.7% had Loss any house hold asset & 42.3% had not.
Table 3: QOL Before & after Radiotherapy of the respondents
UW-QOL 0 25 50 70 75 100 Mean % Best Score
Pain before 5 20 72 23 74.20 18.25** after 18 70 38 81.34 30.15**
Able to self care before 34 95 95.63 75.39** after 20 106 96.03 84.12**
Able to play role activity in family & society before 1 5 32 88 92.06 69.84 after 3 28 95 93.73 75.39
Can take part in family and leisure activities before 2 5 25 94 93.05 74.60 after 1 7 19 100 94.96 79.36
Loss of house hold asset before 5 20 21 80 88.09 63.49** after 10 24 27 65 89.96 51.58**
(**significant at 0.01 level) Table 3 shows the quality of life change among the Participants who had Radiotherapy. Following Radiotherapy (RT) changes occur in Cancer pain among the patients. Before RT the mean score of pain were 74.20 & after RT it became 81.34. The best score of among the patients who had much better condition of pain (score 100) before RT were 18.25 % & after RT 30.15%. Following RT changes occur in ability to self care among the patients. Before RT the mean score of pain were 95.63 & after RT it became 96.03. The best score among the patients who had much better performance (score 100) before RT were 75.39% & after RT 84.12%. Following RT changes occur in Able to play role activity in family & society among the patients. Before RT the mean score of ability to play role activity in family & society were 92.06 & after RT it became 93.73. The best score among the patients who had much better performance (score 100) before RT were 69.84% & after RT 75.39%. Following RT changes occur in participants to take part in family and leisure activities. Before RT the mean score of ability to take part in family and leisure activities
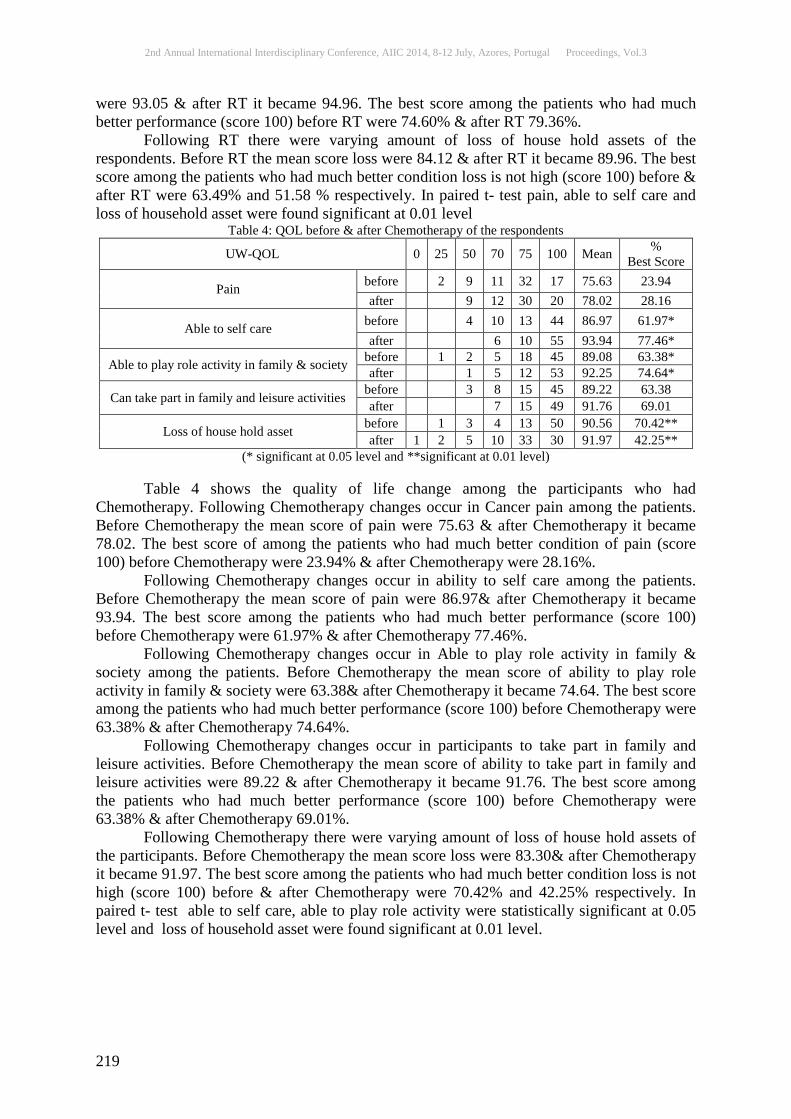
2nd Annual International Interdisciplinary Conference, AIIC 2014, 8-12 July, Azores, Portugal Proceedings, Vol.3
219
were 93.05 & after RT it became 94.96. The best score among the patients who had much better performance (score 100) before RT were 74.60% & after RT 79.36%. Following RT there were varying amount of loss of house hold assets of the respondents. Before RT the mean score loss were 84.12 & after RT it became 89.96. The best score among the patients who had much better condition loss is not high (score 100) before & after RT were 63.49% and 51.58 % respectively. In paired t- test pain, able to self care and loss of household asset were found significant at 0.01 level
Table 4: QOL before & after Chemotherapy of the respondents
UW-QOL 0 25 50 70 75 100 Mean % Best Score
Pain before 2 9 11 32 17 75.63 23.94 after 9 12 30 20 78.02 28.16
Able to self care before 4 10 13 44 86.97 61.97* after 6 10 55 93.94 77.46*
Able to play role activity in family & society before 1 2 5 18 45 89.08 63.38* after 1 5 12 53 92.25 74.64*
Can take part in family and leisure activities before 3 8 15 45 89.22 63.38 after 7 15 49 91.76 69.01
Loss of house hold asset before 1 3 4 13 50 90.56 70.42** after 1 2 5 10 33 30 91.97 42.25**
(* significant at 0.05 level and **significant at 0.01 level) Table 4 shows the quality of life change among the participants who had Chemotherapy. Following Chemotherapy changes occur in Cancer pain among the patients. Before Chemotherapy the mean score of pain were 75.63 & after Chemotherapy it became 78.02. The best score of among the patients who had much better condition of pain (score 100) before Chemotherapy were 23.94% & after Chemotherapy were 28.16%. Following Chemotherapy changes occur in ability to self care among the patients. Before Chemotherapy the mean score of pain were 86.97& after Chemotherapy it became 93.94. The best score among the patients who had much better performance (score 100) before Chemotherapy were 61.97% & after Chemotherapy 77.46%. Following Chemotherapy changes occur in Able to play role activity in family & society among the patients. Before Chemotherapy the mean score of ability to play role activity in family & society were 63.38& after Chemotherapy it became 74.64. The best score among the patients who had much better performance (score 100) before Chemotherapy were 63.38% & after Chemotherapy 74.64%. Following Chemotherapy changes occur in participants to take part in family and leisure activities. Before Chemotherapy the mean score of ability to take part in family and leisure activities were 89.22 & after Chemotherapy it became 91.76. The best score among the patients who had much better performance (score 100) before Chemotherapy were 63.38% & after Chemotherapy 69.01%. Following Chemotherapy there were varying amount of loss of house hold assets of the participants. Before Chemotherapy the mean score loss were 83.30& after Chemotherapy it became 91.97. The best score among the patients who had much better condition loss is not high (score 100) before & after Chemotherapy were 70.42% and 42.25% respectively. In paired t- test able to self care, able to play role activity were statistically significant at 0.05 level and loss of household asset were found significant at 0.01 level.

2nd Annual International Interdisciplinary Conference, AIIC 2014, 8-12 July, Azores, Portugal Proceedings, Vol.3
220
Table 5: QOL before & after the treatment combined therapy (Radiotherapy & Chemotherapy) of the respondents
UW-QOL 0 25 50 70 75 100 Mean % Best Score
Pain before 1 9 29 33 32 78.65 30.76* after 30 35 39 82.93 37.50*
Able to self care before 5 4 5 90 95.24 86.53 after 4 6 94 97.04 90.38
Able to play role activity in family & society before 6 4 5 89 94.75 85.57 after 6 6 92 96.82 88.76
Can take part in family and leisure activities before 5 4 6 88 94.03 84.61* after 3 8 93 97.21 89.42*
Loss of house hold asset before 24 60 88.46 57.89** after 24 36 44 84.42 42.30**
(* significant at 0.05 level and **significant at 0.01 level) Table 5 shows the quality of life change among the Participants who had both Radiotherapy & Chemotherapy. Following both Radiotherapy & Chemotherapy change occurred in Cancer pain among the patients. Before both Radiotherapy & Chemotherapy the mean score of pain were 78.65 & after both Radiotherapy & Chemotherapy it became 82.93. The best score of among the patients who had much better condition of pain (score 100) before both Radiotherapy & Chemotherapy were 30.76 & after both Radiotherapy & Chemotherapy 37.50. Following both Radiotherapy & Chemotherapy changes occur in ability to self care among the patients. Before both Radiotherapy & Chemotherapy the mean score of pain were 95.24& after both Radiotherapy & Chemotherapy it became 97.04. The best score among the patients who had much better performance (score 100) before both Radiotherapy & Chemotherapy were 86.53% & after both Radiotherapy &Chemotherapy 90.38%. Following both Radiotherapy & Chemotherapy changes occur in Able to play role activity in family & society among the patients. Before both Radiotherapy & Chemotherapy the mean score of ability to play role activity in family & society were 94.75 & after both Radiotherapy & Chemotherapy it became 96.82. The best score among the patients who had much better performance (score 100) before both Radiotherapy & Chemotherapy were 85.57% & after both Radiotherapy & Chemotherapy 88.76%. Following both Radiotherapy & Chemotherapy changes occur in participants to take part in family and leisure activities. Before both Radiotherapy & Chemotherapy the mean score of ability to take part in family and leisure activities were 94.03& after both Radiotherapy & Chemotherapy it became 97.21. The best score among the patients who had much better performance (score 100) before both Radiotherapy & Chemotherapy were 84.61% & after both Radiotherapy & Chemotherapy 89.42%. Following both Radiotherapy & Chemotherapy the varying amount of loss of house hold asset of the participants. Before both Radiotherapy & Chemotherapy the mean score loss were 88.22& after both Radiotherapy & Chemotherapy it became 84.42. The best score among the patients who had much better condition loss was not high (score 100) before & after both Radiotherapy & Chemotherapy were 57.89 and 42.30% respectively. In paired t- test pain, can take part in family and leisure activity were statistically significant at .05 level and loss of household asset were found significant at 0.01 level.
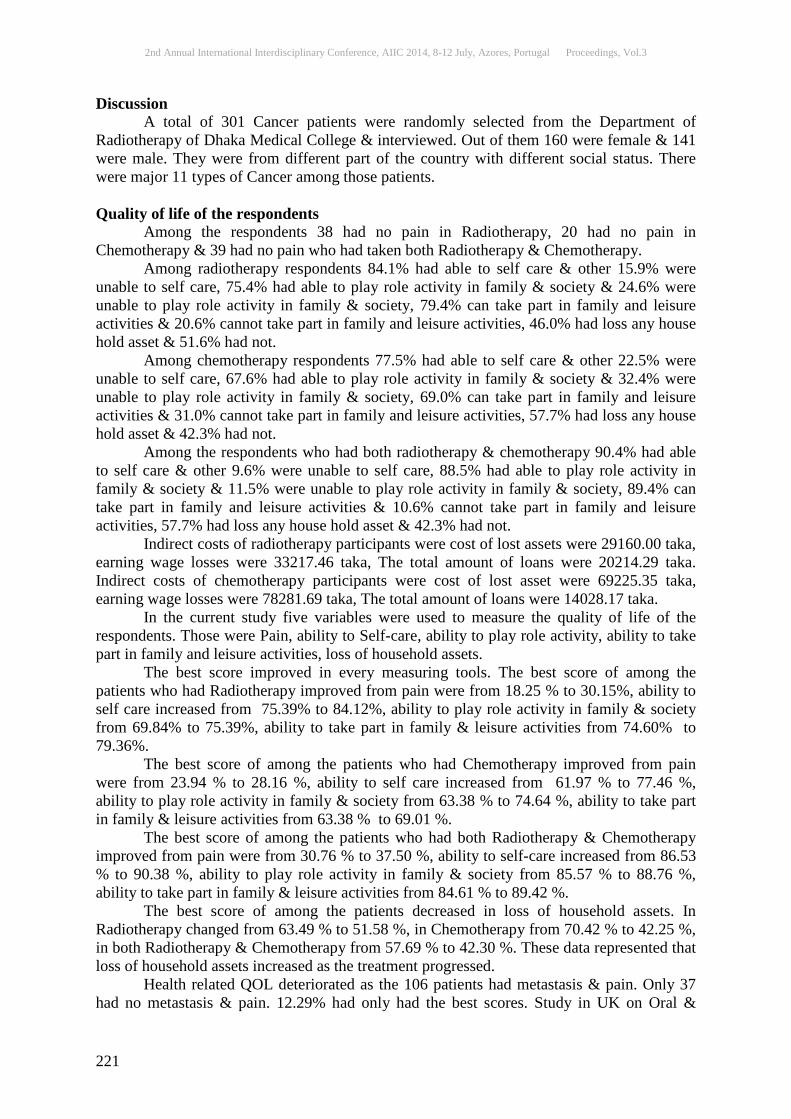
2nd Annual International Interdisciplinary Conference, AIIC 2014, 8-12 July, Azores, Portugal Proceedings, Vol.3
221
Discussion A total of 301 Cancer patients were randomly selected from the Department of Radiotherapy of Dhaka Medical College & interviewed. Out of them 160 were female & 141 were male. They were from different part of the country with different social status. There were major 11 types of Cancer among those patients. Quality of life of the respondents Among the respondents 38 had no pain in Radiotherapy, 20 had no pain in Chemotherapy & 39 had no pain who had taken both Radiotherapy & Chemotherapy.
Among radiotherapy respondents 84.1% had able to self care & other 15.9% were unable to self care, 75.4% had able to play role activity in family & society & 24.6% were unable to play role activity in family & society, 79.4% can take part in family and leisure activities & 20.6% cannot take part in family and leisure activities, 46.0% had loss any house hold asset & 51.6% had not.
Among chemotherapy respondents 77.5% had able to self care & other 22.5% were unable to self care, 67.6% had able to play role activity in family & society & 32.4% were unable to play role activity in family & society, 69.0% can take part in family and leisure activities & 31.0% cannot take part in family and leisure activities, 57.7% had loss any house hold asset & 42.3% had not.
Among the respondents who had both radiotherapy & chemotherapy 90.4% had able to self care & other 9.6% were unable to self care, 88.5% had able to play role activity in family & society & 11.5% were unable to play role activity in family & society, 89.4% can take part in family and leisure activities & 10.6% cannot take part in family and leisure activities, 57.7% had loss any house hold asset & 42.3% had not.
Indirect costs of radiotherapy participants were cost of lost assets were 29160.00 taka, earning wage losses were 33217.46 taka, The total amount of loans were 20214.29 taka. Indirect costs of chemotherapy participants were cost of lost asset were 69225.35 taka, earning wage losses were 78281.69 taka, The total amount of loans were 14028.17 taka.
In the current study five variables were used to measure the quality of life of the respondents. Those were Pain, ability to Self-care, ability to play role activity, ability to take part in family and leisure activities, loss of household assets.
The best score improved in every measuring tools. The best score of among the patients who had Radiotherapy improved from pain were from 18.25 % to 30.15%, ability to self care increased from 75.39% to 84.12%, ability to play role activity in family & society from 69.84% to 75.39%, ability to take part in family & leisure activities from 74.60% to 79.36%.
The best score of among the patients who had Chemotherapy improved from pain were from 23.94 % to 28.16 %, ability to self care increased from 61.97 % to 77.46 %, ability to play role activity in family & society from 63.38 % to 74.64 %, ability to take part in family & leisure activities from 63.38 % to 69.01 %.
The best score of among the patients who had both Radiotherapy & Chemotherapy improved from pain were from 30.76 % to 37.50 %, ability to self-care increased from 86.53 % to 90.38 %, ability to play role activity in family & society from 85.57 % to 88.76 %, ability to take part in family & leisure activities from 84.61 % to 89.42 %.
The best score of among the patients decreased in loss of household assets. In Radiotherapy changed from 63.49 % to 51.58 %, in Chemotherapy from 70.42 % to 42.25 %, in both Radiotherapy & Chemotherapy from 57.69 % to 42.30 %. These data represented that loss of household assets increased as the treatment progressed.
Health related QOL deteriorated as the 106 patients had metastasis & pain. Only 37 had no metastasis & pain. 12.29% had only had the best scores. Study in UK on Oral &
2nd Annual International Interdisciplinary Conference, AIIC 2014, 8-12 July, Azores, Portugal Proceedings, Vol.3
222
Oropharyngeal cancer where UW-QOL version 4 was used showed the deterioration of Quality of life after of the cancer patients following 1 year of surgery. The study carried out from 1995 to 2002 & there were baseline key differences in anxiety, pain, swallowing, chewing, and mood. At 1year there were big differences in all domains with deterioration in the oral cancer group. The difference was least notable in pain, mood and anxiety.4 In other study in China 118 patients were divided in a partial-laryngectomy group (n=81; excluding cordectomy) and a total-laryngectomy group (n=37). The composite QOL scores of the partial-laryngectomy group (692.3±127.9) were higher than those of total-laryngectomy group (636.4±140.0), showing a statistically significant difference (P<0.05). The partial-laryngectomy group (74.3±23.8; 80.9±20.3) was better than the total-laryngectomy group (40.3±25.8; 69.6±27.1) in speech and appearance (P<0.001; P<0.05); but the total-laryngectomy group (92.6±13.0) was superior to the partial-laryngectomy group (83.0±20.5) in pain (P<0.01).5 Conclusion The quality of life (QOL) of the respondents improved following treatment but at the same time they lost their household asset. The Best scores for quality of life improved following Radiotherapy, Chemotherapy and combined therapy (Radiotherapy and Chemotherapy) which was significant. With relation to loss of household assets the best scores deteriorated in all the three groups of treatment which was also found significant. Reference: World Health Organization.2004. Global burden of disease. Part 2.Cause of Death. WHO Press, Geneva, Switzerland. Available at: http://www.who.int/entity/healthinfo/global_burden_disease/GBD_report_2004 updte_part2.pdf); Access on: 30 April, 2009 Ahmed.ZU. 2006. Banglpedia. National encyclopedia of Bangladesh. Banglapedia. Bangla Academy. Dhaka. Available at: http://www.banglapedia.org/httpdocs/HT/C_0033.HTM Access on: 10 January, 2010 University of Washington. QOL Questionnaire. Available at: http://www.headandneckcancer.co.uk/File.ashx?id=10285 Access on: 10 January, 2010 Rogers SN, O'donnell JP, Williams-Hewitt S, Christensen JC, Lowe D. 2006.Oral Oncol;42(3):281-7. Ghaffar A, Reddy KS, Singhi M. 2004. Burden of non-communicable diseases in South Asia. BMJ; 328:807–10. Available at: http://www.bmj.com/cgi/content/full/328/7443/807.Access on: 30 April, 2009
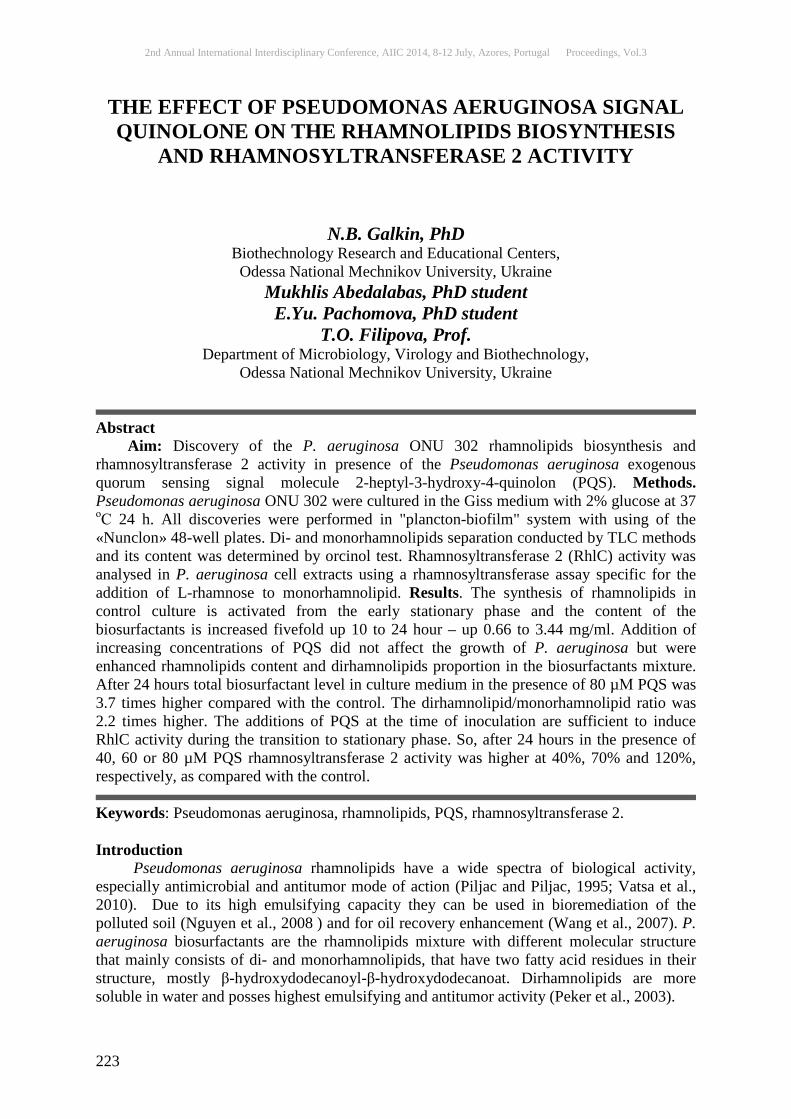
2nd Annual International Interdisciplinary Conference, AIIC 2014, 8-12 July, Azores, Portugal Proceedings, Vol.3
223
THE EFFECT OF PSEUDOMONAS AERUGINOSA SIGNAL QUINOLONE ON THE RHAMNOLIPIDS BIOSYNTHESIS
AND RHAMNOSYLTRANSFERASE 2 ACTIVITY
N.B. Galkin, PhD Biothechnology Research and Educational Centers, Odessa National Mechnіkov University, Ukraine
Mukhlis Abedalabas, PhD student E.Yu. Pachomova, PhD student
T.O. Filipova, Prof. Department of Microbiology, Virology and Biothechnology,
Odessa National Mechnіkov University, Ukraine
Abstract Aim: Discovery of the P. aeruginosa ONU 302 rhamnolipids biosynthesis and rhamnosyltransferase 2 activity in presence of the Pseudomonas aeruginosa exogenous quorum sensing signal molecule 2-heptyl-3-hydroxy-4-quinolon (PQS). Methods. Pseudomonas aeruginosa ONU 302 were cultured in the Giss medium with 2% glucose at 37
оС 24 h. All discoveries were performed in "plancton-biofilm" system with using of the «Nunclon» 48-well plates. Di- and monorhamnolipids separation conducted by TLC methods and its content was determined by orcinol test. Rhamnosyltransferase 2 (RhlC) activity was analysed in P. aeruginosa cell extracts using a rhamnosyltransferase assay specific for the addition of L-rhamnose to monorhamnolipid. Results. The synthesis of rhamnolipids in control culture is activated from the early stationary phase and the content of the biosurfactants is increased fivefold up 10 to 24 hour – up 0.66 to 3.44 mg/ml. Addition of increasing concentrations of PQS did not affect the growth of P. aeruginosa but were enhanced rhamnolipids content and dirhamnolipids proportion in the biosurfactants mixture. After 24 hours total biosurfactant level in culture medium in the presence of 80 µМ PQS was 3.7 times higher compared with the control. The dirhamnolipid/monorhamnolipid ratio was 2.2 times higher. The additions of PQS at the time of inoculation are sufficient to induce RhlC activity during the transition to stationary phase. So, after 24 hours in the presence of 40, 60 or 80 µМ PQS rhamnosyltransferase 2 activity was higher at 40%, 70% and 120%, respectively, as compared with the control.
Keywords: Pseudomonas aeruginosa, rhamnolipids, PQS, rhamnosyltransferase 2. Introduction
Pseudomonas aeruginosa rhamnolipids have a wide spectra of biological activity, especially antimicrobial and antitumor mode of action (Piljac and Piljac, 1995; Vatsa et al., 2010). Due to its high emulsifying capacity they can be used in bioremediation of the polluted soil (Nguyen et al., 2008 ) and for oil recovery enhancement (Wang et al., 2007). P. aeruginosa biosurfactants are the rhamnolipids mixture with different molecular structure that mainly consists of di- and monorhamnolipids, that have two fatty acid residues in their structure, mostly β-hydroxydodecanoyl-β-hydroxydodecanoat. Dirhamnolipids are more soluble in water and posses highest emulsifying and antitumor activity (Peker et al., 2003).
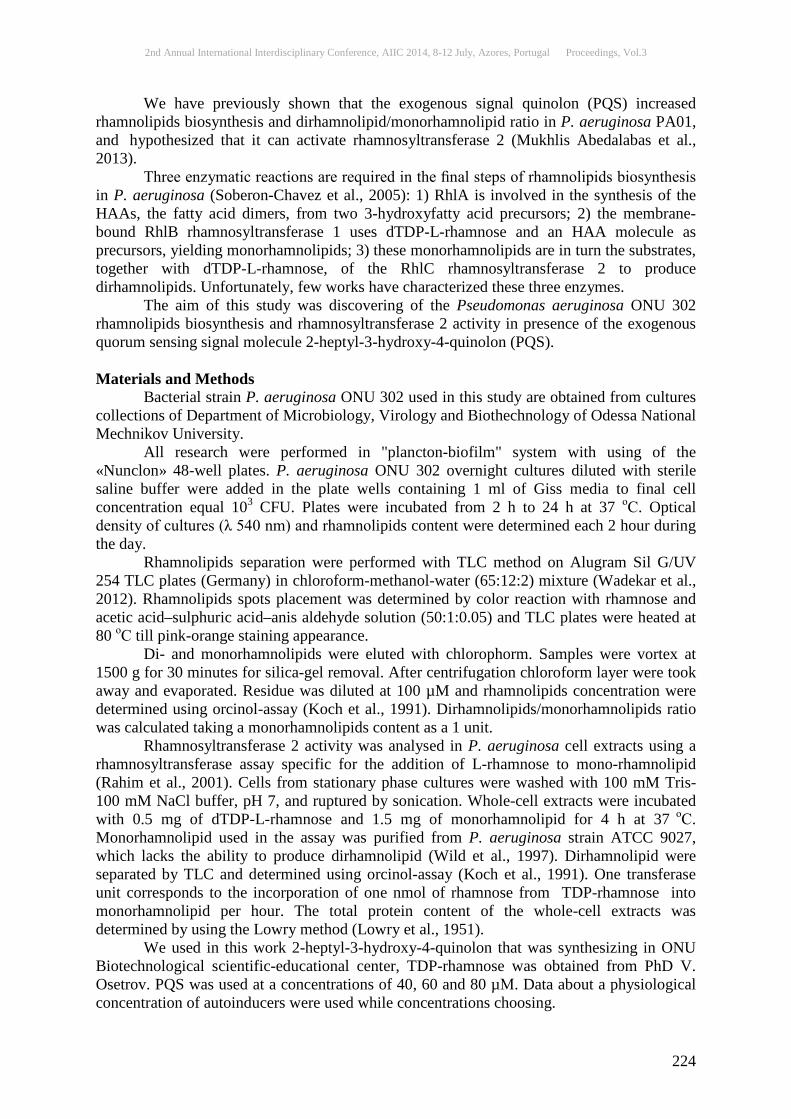
2nd Annual International Interdisciplinary Conference, AIIC 2014, 8-12 July, Azores, Portugal Proceedings, Vol.3
224
We have previously shown that the exogenous signal quinolon (PQS) increased rhamnolipids biosynthesis and dirhamnolipid/monorhamnolipid ratio in P. aeruginosa PA01, and hypothesized that it can activate rhamnosyltransferase 2 (Mukhlis Abedalabas et al., 2013).
Three enzymatic reactions are required in the final steps of rhamnolipids biosynthesis in P. aeruginosa (Soberon-Chavez et al., 2005): 1) RhlA is involved in the synthesis of the HAAs, the fatty acid dimers, from two 3-hydroxyfatty acid precursors; 2) the membrane-bound RhlB rhamnosyltransferase 1 uses dTDP-L-rhamnose and an HAA molecule as precursors, yielding monorhamnolipids; 3) these monorhamnolipids are in turn the substrates, together with dTDP-L-rhamnose, of the RhlC rhamnosyltransferase 2 to produce dirhamnolipids. Unfortunately, few works have characterized these three enzymes.
The aim of this study was discovering of the Pseudomonas aeruginosa ONU 302 rhamnolipids biosynthesis and rhamnosyltransferase 2 activity in presence of the exogenous quorum sensing signal molecule 2-heptyl-3-hydroxy-4-quinolon (PQS).
Materials and Methods
Bacterial strain P. aeruginosa ONU 302 used in this study are obtained from cultures collections of Department of Microbiology, Virology and Biothechnology of Odessa National Mechnіkov University. All research were performed in "plancton-biofilm" system with using of the «Nunclon» 48-well plates. P. aeruginosa ONU 302 overnight cultures diluted with sterile saline buffer were added in the plate wells containing 1 ml of Giss media to final cell concentration equal 103 CFU. Plates were incubated from 2 h to 24 h at 37 оС. Optical density of cultures (λ 540 nm) and rhamnolipids content were determined each 2 hour during the day.
Rhamnolipids separation were performed with TLC method on Alugram Sil G/UV 254 TLC plates (Germany) in chloroform-methanol-water (65:12:2) mixture (Wadekar et al., 2012). Rhamnolipids spots placement was determined by color reaction with rhamnose and acetic acid–sulphuric acid–anis aldehyde solution (50:1:0.05) and TLC plates were heated at 80 оС till pink-orange staining appearance.
Di- and monorhamnolipids were eluted with chlorophorm. Samples were vortex at 1500 g for 30 minutes for silica-gel removal. After centrifugation chloroform layer were took away and evaporated. Residue was diluted at 100 µM and rhamnolipids concentration were determined using orcinol-assay (Koch et al., 1991). Dirhamnolipids/monorhamnolipids ratio was calculated taking a monorhamnolipids content as a 1 unit.
Rhamnosyltransferase 2 activity was analysed in P. aeruginosa cell extracts using a rhamnosyltransferase assay specific for the addition of L-rhamnose to mono-rhamnolipid (Rahim et al., 2001). Cells from stationary phase cultures were washed with 100 mM Tris-100 mM NaCl buffer, pH 7, and ruptured by sonication. Whole-cell extracts were incubated with 0.5 mg of dTDP-L-rhamnose and 1.5 mg of monorhamnolipid for 4 h at 37 оС. Monorhamnolipid used in the assay was purified from P. aeruginosa strain ATCC 9027, which lacks the ability to produce dirhamnolipid (Wild et al., 1997). Dirhamnolipid were separated by TLC and determined using orcinol-assay (Koch et al., 1991). One transferase unit corresponds to the incorporation of one nmol of rhamnose from TDP-rhamnose into monorhamnolipid per hour. The total protein content of the whole-cell extracts was determined by using the Lowry method (Lowry et al., 1951).
We used in this work 2-heptyl-3-hydroxy-4-quinolon that was synthesizing in ONU Biotechnological scientific-educational center, TDP-rhamnose was obtained from PhD V. Osetrov. PQS was used at a concentrations of 40, 60 and 80 µМ. Data about a physiological concentration of autoinducers were used while concentrations choosing.
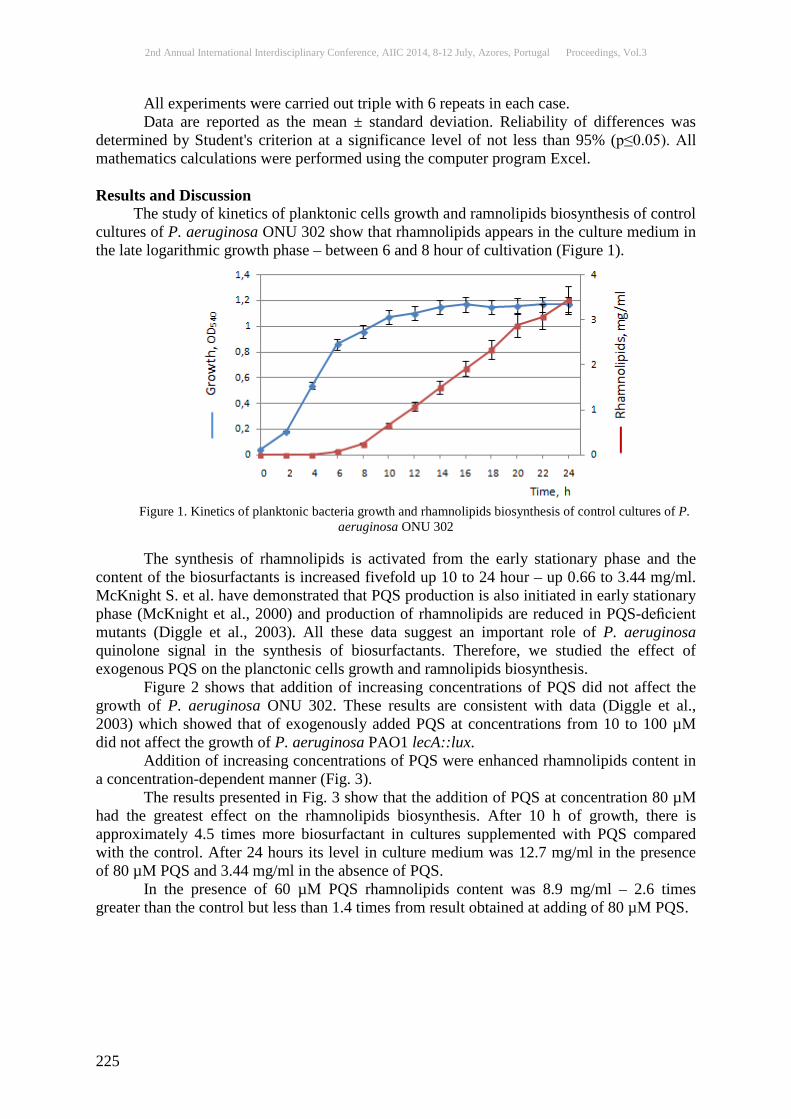
2nd Annual International Interdisciplinary Conference, AIIC 2014, 8-12 July, Azores, Portugal Proceedings, Vol.3
225
All experiments were carried out triple with 6 repeats in each case. Data are reported as the mean ± standard deviation. Reliability of differences was
determined by Student's criterion at a significance level of not less than 95% (р≤0.05). All mathematics calculations were performed using the computer program Excel.
Results and Discussion
The study of kinetics of planktonic cells growth and ramnolipids biosynthesis of control cultures of P. aeruginosa ONU 302 show that rhamnolipids appears in the culture medium in the late logarithmic growth phase – between 6 and 8 hour of cultivation (Figure 1).
Figure 1. Kinetics of planktonic bacteria growth and rhamnolipids biosynthesis of control cultures of P.
aeruginosa ONU 302 The synthesis of rhamnolipids is activated from the early stationary phase and the
content of the biosurfactants is increased fivefold up 10 to 24 hour – up 0.66 to 3.44 mg/ml. McKnight S. et al. have demonstrated that PQS production is also initiated in early stationary phase (McKnight et al., 2000) and production of rhamnolipids are reduced in PQS-deficient mutants (Diggle et al., 2003). All these data suggest an important role of P. aeruginosa quinolone signal in the synthesis of biosurfactants. Therefore, we studied the effect of exogenous PQS on the planctonic cells growth and ramnolipids biosynthesis.
Figure 2 shows that addition of increasing concentrations of PQS did not affect the growth of P. aeruginosa ONU 302. These results are consistent with data (Diggle et al., 2003) which showed that of exogenously added PQS at concentrations from 10 to 100 µМ did not affect the growth of P. aeruginosa PAO1 lecA::lux.
Addition of increasing concentrations of PQS were enhanced rhamnolipids content in a concentration-dependent manner (Fig. 3).
The results presented in Fig. 3 show that the addition of PQS at concentration 80 µМ had the greatest effect on the rhamnolipids biosynthesis. After 10 h of growth, there is approximately 4.5 times more biosurfactant in cultures supplemented with PQS compared with the control. After 24 hours its level in culture medium was 12.7 mg/ml in the presence of 80 µМ PQS and 3.44 mg/ml in the absence of PQS.
In the presence of 60 µМ PQS rhamnolipids content was 8.9 mg/ml – 2.6 times greater than the control but less than 1.4 times from result obtained at adding of 80 µМ PQS.
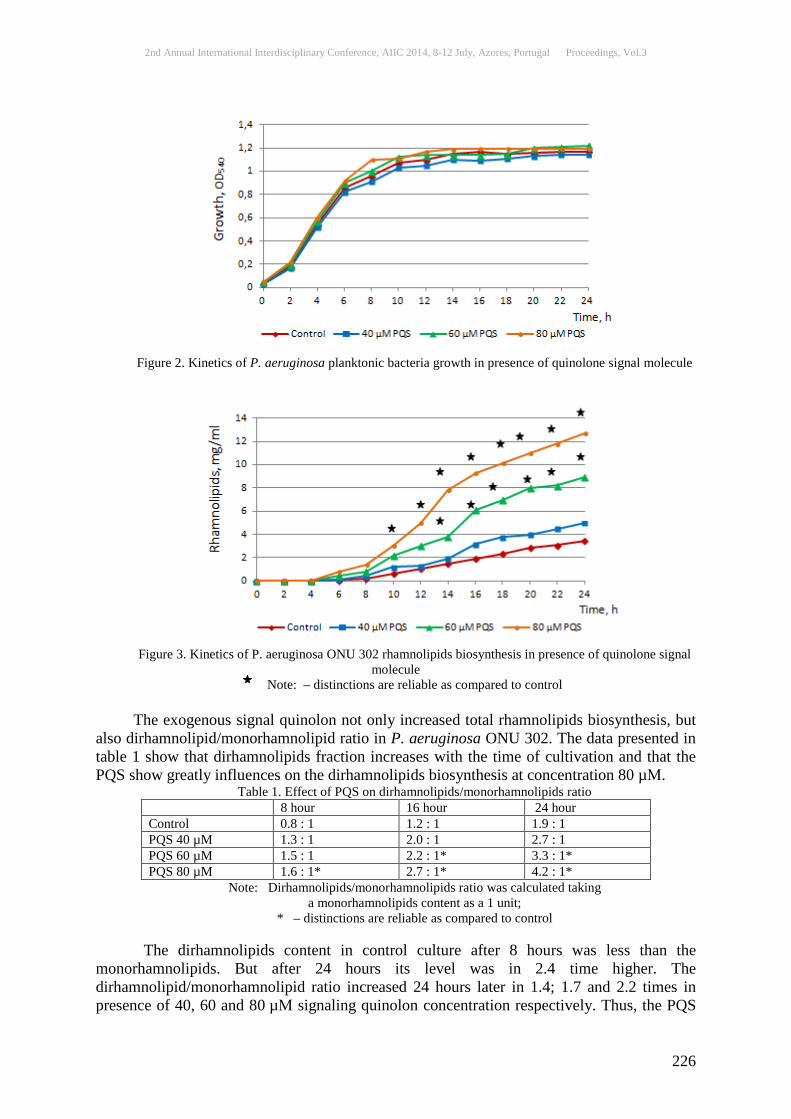
2nd Annual International Interdisciplinary Conference, AIIC 2014, 8-12 July, Azores, Portugal Proceedings, Vol.3
226
Figure 2. Kinetics of P. aeruginosa planktonic bacteria growth in presence of quinolone signal molecule
Figure 3. Kinetics of P. aeruginosa ONU 302 rhamnolipids biosynthesis in presence of quinolone signal
molecule Note: – distinctions are reliable as compared to control
The exogenous signal quinolon not only increased total rhamnolipids biosynthesis, but
also dirhamnolipid/monorhamnolipid ratio in P. aeruginosa ONU 302. The data presented in table 1 show that dirhamnolipids fraction increases with the time of cultivation and that the PQS show greatly influences on the dirhamnolipids biosynthesis at concentration 80 µМ.
Table 1. Effect of PQS on dirhamnolipids/monorhamnolipids ratio 8 hour 16 hour 24 hour Control 0.8 : 1 1.2 : 1 1.9 : 1 PQS 40 µM 1.3 : 1 2.0 : 1 2.7 : 1 PQS 60 µM 1.5 : 1 2.2 : 1* 3.3 : 1* PQS 80 µM 1.6 : 1* 2.7 : 1* 4.2 : 1*
Note: Dirhamnolipids/monorhamnolipids ratio was calculated taking a monorhamnolipids content as a 1 unit;
* – distinctions are reliable as compared to control The dirhamnolipids content in control culture after 8 hours was less than the
monorhamnolipids. But after 24 hours its level was in 2.4 time higher. The dirhamnolipid/monorhamnolipid ratio increased 24 hours later in 1.4; 1.7 and 2.2 times in presence of 40, 60 and 80 µМ signaling quinolon concentration respectively. Thus, the PQS

2nd Annual International Interdisciplinary Conference, AIIC 2014, 8-12 July, Azores, Portugal Proceedings, Vol.3
227
increases the proportion of dirhamnolipids in the total biosurfactants mixture which is synthesized by P. aeruginosa ONU 302.
Further analysis was performed activity of rhamnosyltransferase 2 (RhlC), which catalyses the addition of dTDP-L-rhamnose to the monorhamnolipid-accepting molecule (Burger et al., 1963). The study was conducted via 8, 16 and 24 hours (Table 2).
Table 2. Effect of PQS on rhamnosyltransferase 2 activity in Pseudomonas aeruginosa ONU 302 (units/mg protein)
8 hour 16 hour 24 hour Control 3.6 ± 1.5 6.6 ± 1.6 8.7 ± 2.8
PQS 40 µM 5.0 ± 2.0 8.8 ± 2.3 14.1 ± 2.6 PQS 60 µM 6.3 ± 1.8 11.7 ± 2.7 15.9 ± 3.7* PQS 80 µM 6.9 ± 2.6* 14.6 ± 3.5* 18.3 ± 4.1*
Note: * – distinctions are reliable as compared to control The results indicate that the activity of RhlC increases in control cells 2.4 times
during cultivation from 8 to 24 hours. This increase in activity was not associated with increased cell contents (Figure 2) and due to enhanced expression of rhlC gene that encodes rhamnosyltransferase 2. The additions of PQS at the time of inoculation are sufficient to induce RhlC activity during the transition to stationary phase. So, after eight hours in the presence of 40, 60 or 80 µМ PQS rhamnosyltransferase 2 activity was higher at 40%, 75% and 92%, respectively. After 24 hours this enzymatic activity was 1.6, 1.8 and 2.1 times higher as compared with the control.
Аs is known P. aeruginosa regulates the transcription of an array of genes by quorum sensing (Rahim et al., 2001). In the case of rhamnolipids biosynthesis, the product of RhlI is the signal butanoyl-homoserine lactone, C4-HSL, which acts as the activating ligand of the transcriptional regulator RhlR. The RhlR/C4-HSL complex then binds to a specific sequence in the rhlAB regulatory region to activate the transcription. The level of expression of rhlAB is thus dependent on the local environmental concentration of this signal. The expression of the second rhamnosyltransferase, encoded by rhlC, is coordinately regulated with rhlAB by the same quorum sensing regulatory pathway. As has been shown previously, addition of increasing concentrations of exogenous PQS enhanced C4-HSL levels (3.5 times more C4-HSL in the presence of 60 µM PQS compared with the control) and the transcription of certain genes in a concentration-dependent manner (Diggle et al., 2003).
Therefore, PQS controls production of rhamnolipids by stimulating the RhlR/C4-HSL quorum sensing system. Additionally, PQS act as inducing ligands of PqsR regulator and PqsE which upregulates rhlAB transcription (Abdel-Mawgoud et al., 2011).
Conclusion
It is concluded that, Pseudomonas aeruginosa quorum sensing signal molecule 2-heptyl-3-hydroxy-4-quinolon (PQS) can be used in biothechnology to increase the yield of biosurfactants and enrich them with dirhamnolipids Acknowledgement
Authors are thankful to Ministry of Education and Science of Ukraine for their financial support/ References: Abdel-Mawgoud A.M., Hausmann R., Lépine F., Müller M.M., Déziel E. (2011). Rhamnolipids: Detection, Analysis, Biosynthesis, Genetic Regulation, and Bioengineering of Production / In: G. Soberoґn‐Chaґvez (ed.), Biosurfactants. From Genes to Application // Springer-Verlag Berlin Heidelberg, 2011,VIII: 13–55.

2nd Annual International Interdisciplinary Conference, AIIC 2014, 8-12 July, Azores, Portugal Proceedings, Vol.3
228
Burger M.M., Glaser L., Burton R.M. (1963). The enzymatic synthesis of a rhamnose-containing glycolipid by extracts of Pseudomonas aeruginosa. J. Biol. Chem. 238: 2595–2602. Diggle S.P., Winzer K., Chhabra S.R., Worrall K.E., Camara M., Williams P. (2003). The Pseudomonas aeruginosa quinolone signal molecule overcomes the cell density-dependency of the quorum sensing hierarchy, regulates rhl-dependent genes at the onset of stationary phase and can be produced in the absence of LasR. Mol. Microbiol. 50: 29–43. Koch A. K., Kappeli O., Fiechter A., Reiser J. (1991). Hydrocarbon assimilation and biosurfactant production in Pseudomonas aeruginosa mutants. J. Bacteriol. 173: 4212–4219. Lowry O.H., Rosebrough N.J., Farr A.L., Randall R.J. (1951). Protein measurement with the Folin phenol reagent. J. Biol. Chem. 193: 265–275. McKnight S.L., Iglewski B.H., Pesci E.C. (2000). The Pseudomonas quinolone signal regulates rhl quorum-sensing in Pseudomonas aeruginosa. J. Bacteriol. 182: 2702–2708. Mukhlis Abedalabas, Galkin N.B., Pachomova E.Yu., Filipova T.O. (2013). Influence of the exogenous quorum sensing autoinducers on Pseudomonas aeruginosa rhamnolipids biosynthesis. Microbiology & Biotechnology. 4(24): 38–45. Nguyen T.T., Youssef N.H., McInerney M.J., Sabatini D.A. (2008). Rhamnolipid biosurfactant mixtures for environmental remediation. Water Research. 42: 1735–1743. Peker S., Helvaci S. S., Özdemir G. (2003). Interface-subphase interactions of rhamnolipids in aqueous rhamnose solutions. Langmuir. 19: 5838–5845. Piljac G., Piljac V. (1995). Pharmaceutical preparation based on rhamnolipid. USA Patent № 5455232, 3 Oct. 1995. Rahim R., Ochsner U.A., Olvera C., Graninger M., Messner P., Joseph S. Lam J.S., Soberon-Chavez G. (2001). Cloning and functional characterization of the Pseudomonas aeruginosa rhlC gene that encodes rhamnosyltransferase 2, an enzyme responsible for di-rhamnolipid biosynthesis. Molecular Microbiology. 40(3): 708–718. Soberon-Chavez G., Lepine F., Deziel E. (2005). Production of rhamnolipids by Pseudomonas aeruginosa. Appl Microbiol Biotechnol. 68: 718–725. Vatsa P., Sanchez L., Clement C., Baillieul F., Dorey S. (2010). Rhamnolipid biosurfactants as new players in animal and plant defense against microbes. Int. J. Molecular Sci. 11: 5095–5108. Wadekar S.D., Kale S.B., Lali A.M., Bhowmick D.N., Pratap A.P. (2012). Microbial synthesis of rhamnolipids by Pseudomonas aeruginosa (ATCC 10145) on waste frying oil as low cost carbon source. Preparative Biochemistry & Biotechnology. 42: 249–266. Wang Q.H., Fang X.D., Bai B.J., Liang X.L., Shuler P.J., Goddard W.A., Tang Y.C. (2007). Engineering bacteria for production of rhamnolipid as an agent for enhanced oil recovery. Biotech. Bioeng. 98: 842–853. Wild M., Caro A.D., Miller R.M., Soberon-Chavez G. (1997). Selection and partial characterization of a Pseudomonas aeruginosa mono-rhamnolipid deficient mutant. FEMS Microbiol. Lett. 153: 279–285.
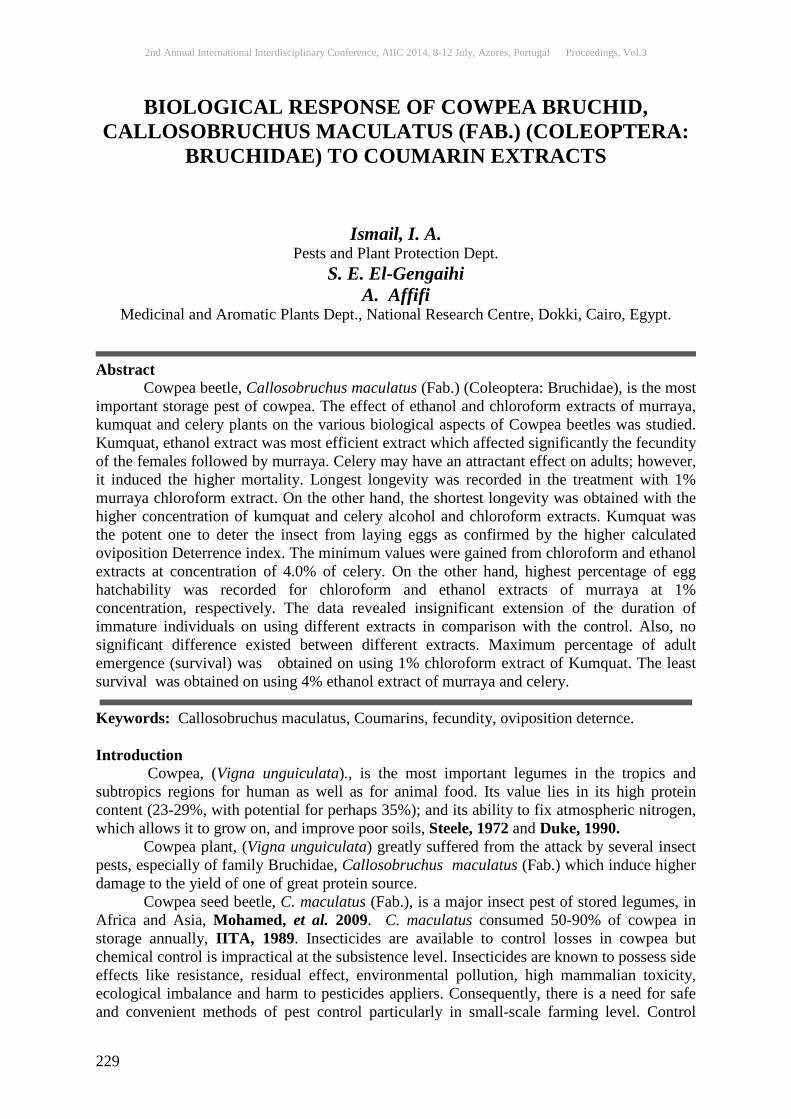
2nd Annual International Interdisciplinary Conference, AIIC 2014, 8-12 July, Azores, Portugal Proceedings, Vol.3
229
BIOLOGICAL RESPONSE OF COWPEA BRUCHID, CALLOSOBRUCHUS MACULATUS (FAB.) (COLEOPTERA:
BRUCHIDAE) TO COUMARIN EXTRACTS
Ismail, I. A. Pests and Plant Protection Dept.
S. E. El-Gengaihi A. Affifi
Medicinal and Aromatic Plants Dept., National Research Centre, Dokki, Cairo, Egypt.
Abstract Cowpea beetle, Callosobruchus maculatus (Fab.) (Coleoptera: Bruchidae), is the most important storage pest of cowpea. The effect of ethanol and chloroform extracts of murraya, kumquat and celery plants on the various biological aspects of Cowpea beetles was studied. Kumquat, ethanol extract was most efficient extract which affected significantly the fecundity of the females followed by murraya. Celery may have an attractant effect on adults; however, it induced the higher mortality. Longest longevity was recorded in the treatment with 1% murraya chloroform extract. On the other hand, the shortest longevity was obtained with the higher concentration of kumquat and celery alcohol and chloroform extracts. Kumquat was the potent one to deter the insect from laying eggs as confirmed by the higher calculated oviposition Deterrence index. The minimum values were gained from chloroform and ethanol extracts at concentration of 4.0% of celery. On the other hand, highest percentage of egg hatchability was recorded for chloroform and ethanol extracts of murraya at 1% concentration, respectively. The data revealed insignificant extension of the duration of immature individuals on using different extracts in comparison with the control. Also, no significant difference existed between different extracts. Maximum percentage of adult emergence (survival) was obtained on using 1% chloroform extract of Kumquat. The least survival was obtained on using 4% ethanol extract of murraya and celery.
Keywords: Callosobruchus maculatus, Coumarins, fecundity, oviposition deternce. Introduction Cowpea, (Vigna unguiculata)., is the most important legumes in the tropics and subtropics regions for human as well as for animal food. Its value lies in its high protein content (23-29%, with potential for perhaps 35%); and its ability to fix atmospheric nitrogen, which allows it to grow on, and improve poor soils, Steele, 1972 and Duke, 1990.
Cowpea plant, (Vigna unguiculata) greatly suffered from the attack by several insect pests, especially of family Bruchidae, Callosobruchus maculatus (Fab.) which induce higher damage to the yield of one of great protein source. Cowpea seed beetle, C. maculatus (Fab.), is a major insect pest of stored legumes, in Africa and Asia, Mohamed, et al. 2009. C. maculatus consumed 50-90% of cowpea in storage annually, IITA, 1989. Insecticides are available to control losses in cowpea but chemical control is impractical at the subsistence level. Insecticides are known to possess side effects like resistance, residual effect, environmental pollution, high mammalian toxicity, ecological imbalance and harm to pesticides appliers. Consequently, there is a need for safe and convenient methods of pest control particularly in small-scale farming level. Control
2nd Annual International Interdisciplinary Conference, AIIC 2014, 8-12 July, Azores, Portugal Proceedings, Vol.3
230
methods should also be inexpensive. Protection of stored products by means of plant materials is one of the oldest traditional methods in Africa, and plant derivatives were used for insect pest control before the synthetic insecticides. There are many plants in the tropics with potential for insect such as murraya, kumquat and celery belonging to Rutaceae and Apiaceae known to contain coumarins were chosen to elucidate their anti-feedant and protectant against cowpea beetles (Callosobruchus maculatus) that destroy cowpea seeds. To achieve this goal, biological tests were conducted on the ethanol and chloroform extracts of these plants on the Callosobruchus maculatus during its immature and adult stage. Materials and methods The stock culture of C. maculatus Fab. (Coleoptera, Bruchidae) was collected from infested cowpea (Vigna unguiculata) seeds. Newly emerged adults were kept in glass jars of 1-liter capacity and each containing about 100 grams of cowpeas seeds covered with muslin. The stock culture and bioassay tests were carried out under laboratory conditions (30±1oC and 70±5 % R.H.). To study the effect of different extracts on the various biological aspects of C. maculatus, two pairs of the newly emerged beetles were taken from the stock culture and kept in cups containing 10 grams cowpea seeds treated with different plant extracts and covered with muslin under laboratory conditions, (30±1oC and 70±5 % R.H.). The beetles were left for mating and laying eggs. The fecundity and longevity of the adults were observed. To evaluate the efficiency of different extracts on oviposition preference by C. maculatus females, two pairs of the newly emerged beetles were introduced in middle of an arena (a petri-dish 20 cm in diameter 3cm in barrier. The barrier was cut in the middle to allow the beetles to move freely in the arena. On half had 10 gm of untreated seeds and the other contained the same amount of treated seeds with the different concentrations (1%, 2% and 4%) of the tested extracts. The seeds were fixed in the arena using melted paraffin wax. The beetles were left to lay eggs for 24hours, and then the eggs laid were counted on the surface of the both seeds. Each experiment was repeated three times. An analysis of oviposition deterrence was conducted by counting the number of eggs laid on untreated and treated seeds after 24 hours. The oviposition deterrence of the tested extracts on C. maculatus adults, the oviposition was calculated using the following equation (Lundgren, 1975) ODI = B-A / A+B X 100. Where: ODI = oviposition deterrence index A = the number of eggs laid on treated V. unguiculata seeds. B = the number of eggs laid on untreated V. unguiculata seeds. According to the above mentioned equation, one hundred percent means complete deterrence whereas zero percent means an equal number of egg deposited on treated and untreated seeds. To study the effect of extracts on egg stage, the seeds with eggs on them were collected from stock culture, in new plastic cups and kept at laboratory conditions previously described. The incubation periods as well as the percentage of hatching were calculated by counting the empty egg shells on the surface of the seeds.
The development of the larval and pupal stages was followed up and the duration of larval and pupal stages was recorded from the time of egg hatching until emergence of adults. Also, the percentages of adult's survival were recorded. Data were statistically analyzed by ANOVA using the Instat V2.03 computer programme test and mean values were separated by the least significant differences (LSD) procedure (Snedecor and Cochran, 1980) at probability = 5%.
2nd Annual International Interdisciplinary Conference, AIIC 2014, 8-12 July, Azores, Portugal Proceedings, Vol.3
231
Results and discussion Effect of the tested plant extracts (ethanol and chloroform) on the fecundity of C. maculates: The fecundity of the adult female as affected by the two extracts were studied by calculating the eggs deposited in the different concentrations of both ethanol and chloroform extracts. The results obtained are shown in table (1). It is obviously clear that the fecundity of C. maculatus females was highly affected by ethanol extracts of all the tested plants at all concentrations used. Compared with the chloroform extracts. Generally speaking the higher the concentration used the higher effect on fecundity obtained. Adult females offered seeds treated with ethanol extract of murraya at concentration of 4% of the extract laid the least number of eggs (3.16) versus (8.66) with kumquat at the same concentration. Oppositely the adult laid higher eggs with higher concentration of celery ethanol extract which was nearly like that laid by control insects (53.1) at 1% concentration. In conclusion, kumquat, ethanol extract was most efficient extract which affected significantly the fecundity of the females followed by murraya. Celery may have an attractant effect on adults; however, it induced the higher mortality. Females given seeds treated with chloroform extract were influenced by different plants at various concentrations. Murraya has the effective role followed by celery and finally kumquat. With the extracts of the three plants the higher concentrations caused the higher effects. These results are in good agreement with those obtained by Abbass, (1993) who indicated that seeds treated with different extracts had rather various effects on the fecundity of B. incarnatus females during its whole life. He, also, added that water extract of the different leguminous tested seeds was superior to all other extracts tested as it reduced the fecundity of the females drastically at all the concentration tested. El-Sayed and Abdel-Razik, (1987) stated that cowpea seeds (Vigna unguiculata) treated with oil extracted from the outer peel of grape fruit, naval or sweet orange and offered to C. maculatus adults. These treatment decreased the number of egg laid or inhibited deposition of viable eggs according to the concentration of the oil used. Chander and Ahmed, (1986) assayed the role of oils and extracts from five medicinal plants against C. chinensis L. infestation cowpea seeds. They found that fecundity of insect female was significantly reduced when oils and extracts from Acorus calamus, Curcuma amada , Carum copticum and Bassia longifolia were applied at dose of 0.25 and 0.50 ml/kg seeds. Pandy et al., (1986) checked several plant extracts against C. chinensis and found that petroleum ether extracts of neem leaves when mixed with seeds of green gramat 0.5, 1.0 and 1.5 parts / 100 parts seeds inhibited oviposition of C. chinensis female. El-Ghar and El-Sheikh, (1987) observed that petroleum ether extracts of four plant species collected from Egypt reduced the fecundity of C. chinensis adults. Verma and pandey, (1988) indicated that oviposition of C. maculatus was completely inhibited when seeds treated with coconut and mustard oils. Lale and Abdulrahman, (1999) studied the effect of neem seed oil and neem powder on the oviposition of C. maculatus on cowpea treated with different dosages of neem oils. They found that egg-laying was significantly reduced s the dosage of neem seed oil increased. However, but the different between 75.1 mg and 150mg oil / 10 gm cowpea was not significant. Ileke, et al. 2013 found that methanol, ethanol, acetone, petroleum ether and n-hexane extracts of A. boonei stem bark were effective in controlling C. maculatus and could serve as an alternative to synthetic insecticides for the protection of stored cowpeas against bruchids.
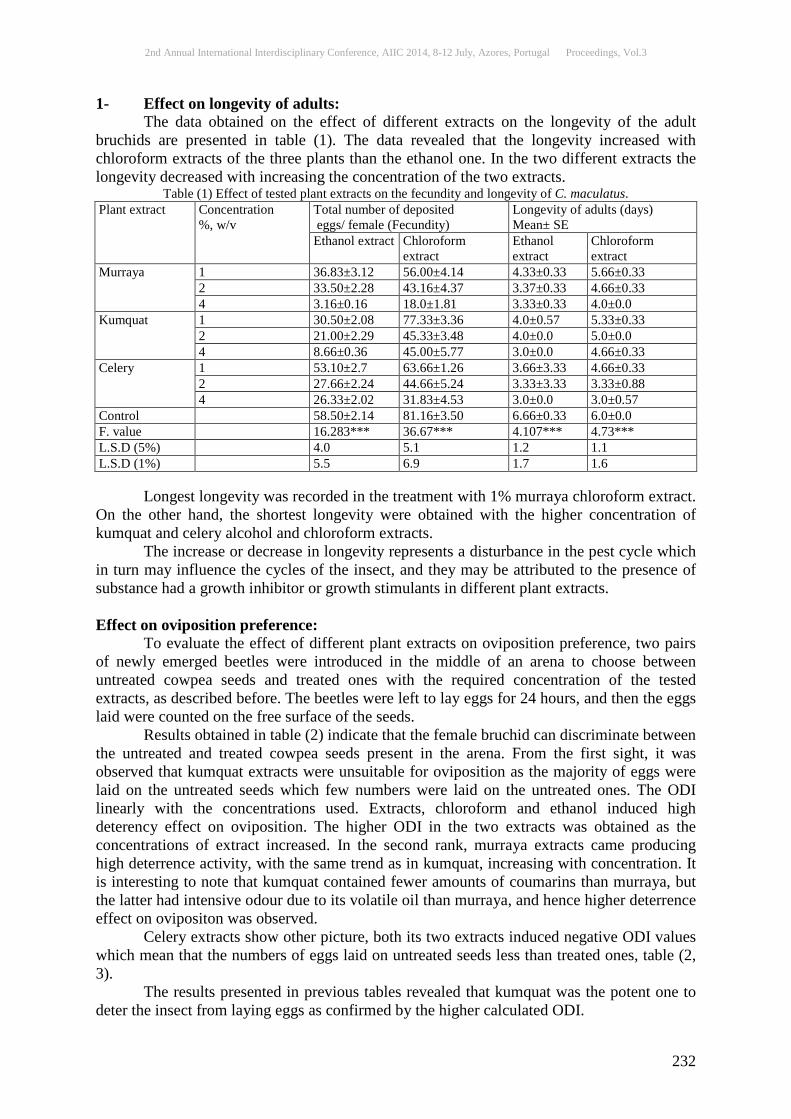
2nd Annual International Interdisciplinary Conference, AIIC 2014, 8-12 July, Azores, Portugal Proceedings, Vol.3
232
1- Effect on longevity of adults: The data obtained on the effect of different extracts on the longevity of the adult bruchids are presented in table (1). The data revealed that the longevity increased with chloroform extracts of the three plants than the ethanol one. In the two different extracts the longevity decreased with increasing the concentration of the two extracts.
Table (1) Effect of tested plant extracts on the fecundity and longevity of C. maculatus. Plant extract Concentration
%, w/v Total number of deposited eggs/ female (Fecundity)
Longevity of adults (days) Mean± SE
Ethanol extract Chloroform extract
Ethanol extract
Chloroform extract
Murraya 1 36.83±3.12 56.00±4.14 4.33±0.33 5.66±0.33 2 33.50±2.28 43.16±4.37 3.37±0.33 4.66±0.33 4 3.16±0.16 18.0±1.81 3.33±0.33 4.0±0.0
Kumquat 1 30.50±2.08 77.33±3.36 4.0±0.57 5.33±0.33 2 21.00±2.29 45.33±3.48 4.0±0.0 5.0±0.0 4 8.66±0.36 45.00±5.77 3.0±0.0 4.66±0.33
Celery 1 53.10±2.7 63.66±1.26 3.66±3.33 4.66±0.33 2 27.66±2.24 44.66±5.24 3.33±3.33 3.33±0.88 4 26.33±2.02 31.83±4.53 3.0±0.0 3.0±0.57
Control 58.50±2.14 81.16±3.50 6.66±0.33 6.0±0.0 F. value 16.283*** 36.67*** 4.107*** 4.73*** L.S.D (5%) 4.0 5.1 1.2 1.1 L.S.D (1%) 5.5 6.9 1.7 1.6 Longest longevity was recorded in the treatment with 1% murraya chloroform extract. On the other hand, the shortest longevity were obtained with the higher concentration of kumquat and celery alcohol and chloroform extracts. The increase or decrease in longevity represents a disturbance in the pest cycle which in turn may influence the cycles of the insect, and they may be attributed to the presence of substance had a growth inhibitor or growth stimulants in different plant extracts. Effect on oviposition preference: To evaluate the effect of different plant extracts on oviposition preference, two pairs of newly emerged beetles were introduced in the middle of an arena to choose between untreated cowpea seeds and treated ones with the required concentration of the tested extracts, as described before. The beetles were left to lay eggs for 24 hours, and then the eggs laid were counted on the free surface of the seeds. Results obtained in table (2) indicate that the female bruchid can discriminate between the untreated and treated cowpea seeds present in the arena. From the first sight, it was observed that kumquat extracts were unsuitable for oviposition as the majority of eggs were laid on the untreated seeds which few numbers were laid on the untreated ones. The ODI linearly with the concentrations used. Extracts, chloroform and ethanol induced high deterency effect on oviposition. The higher ODI in the two extracts was obtained as the concentrations of extract increased. In the second rank, murraya extracts came producing high deterrence activity, with the same trend as in kumquat, increasing with concentration. It is interesting to note that kumquat contained fewer amounts of coumarins than murraya, but the latter had intensive odour due to its volatile oil than murraya, and hence higher deterrence effect on ovipositon was observed. Celery extracts show other picture, both its two extracts induced negative ODI values which mean that the numbers of eggs laid on untreated seeds less than treated ones, table (2, 3). The results presented in previous tables revealed that kumquat was the potent one to deter the insect from laying eggs as confirmed by the higher calculated ODI.

2nd Annual International Interdisciplinary Conference, AIIC 2014, 8-12 July, Azores, Portugal Proceedings, Vol.3
233
These results agreed with those obtained by Wassermann, (1981), Fitzner et al., (1985) and Abass, (1993) who found that the extend of oviposition of C. maculatus was known to be influenced by the surface area, and the kind of treatments on seeds. Bhaduri et al. (1985) indicated that some plant extracts were significantly efficient in reducing the population of C. maculatus. Whereas the extract of Tiridaxc procumbens in petroleum ether was most effective treatment. Pandey et al., (1986) and El-Ghar and El-Sheikh, (1987) indicated that some plant extracts had ovipositional deterrence against C. chinensis. Ashamo, et al. (2013) Evaluation of protectant ability of Newbouldia laevis (Seem.) extracts, wood ash, leaf, stem and root bark against infestation by Callosobruchus maculatus in cowpea, Vigna unguiculata L. (Walp.) in the laboratory at different concentrations of 0, 1, 2, 3, 4 and 5%. All the extracts significantly (p < 0.05) reduced oviposition and adult emergence of C. maculatus when compared with the controls although the reduction was higher at 5% concentration than others. Adult beetle emergence was completely prevented at higher concentrations (4 and 5%) except in wood ash.
Table (2) Effect of chloroform extracts of tested plants on the oviposition preference of C. maculatus.
Plant extract Concentration %, w/v Number of eggs laid / female /day.
Mean±S.E Control Treated seeds ODI*
Murraya 1 10.67±1.40 5.665±1.85 30.62 2 16.50±1.15 7.50±1.157 37.51 4 17.67±2.00 6.50±2.11 46.20
Kumquat 1 8.50±1.15 2.67±1.2 52.27 2 9.17±0.88 2.83±0.88 52.77 4 6.17±1.20 1.67±0.88 57.47
Celery 1 11.33±1.6 16.33±1.45 -18.0766 2 5.33±1.15 11.50±1.16 -36.660 4 5.33±1.67 11.67±0.88 -37.275
*ODI refers to oviposition Deternce index.
Table (3) Effect of ethanol extracts of tested plants on the oviposition preference of C. maculatus.
Plant extract Concentration %, w/v Number of eggs laid / female /day.
Mean±S.E Control Treated seeds ODI*
Murraya 1 13.33±2.19 9.83±1.763 15.112 2 10.33±1.85 6.0±1.54 26.515 4 16.5±2.31 6.50±2.11 38.481
Kumquat 1 12.83±4.67 9.0±2.1 17.545 2 11.16±1.45 5.83±1.763 31.93 4 14.83±1.76 3.65±2.02 60.51
Celery 1 14.165±0.53 14.5±0.3 -1.168 2 15.5±1.73 20.5±1.543 -13.888 4 15.5±1.73 21.0±1.52 -15.068
*ODI refers to oviposition Deternce index. Effect on egg stage
Data obtained in table (4) showed that the both extracts of the three plants had inconsiderable effect on the incubation period of Callosobruchus maculatus (Fab.) eggs. A slight increase in the incubation period of eggs to 7.66 and 7.5 days while was 6.66 days in control of the extracts of the different plants over control, these increases was no significant. As regards to the percentage of egg hatchability, the minimum values were gained from chloroform (7.31%) and ethanol (8.81%) extracts at concentration of 4.0% of celery.
On the other hand, highest percentage of egg hatchability was record (84.59% and 69.96%) for chloroform and ethanol extracts of murraya at 1% concentration, respectively.
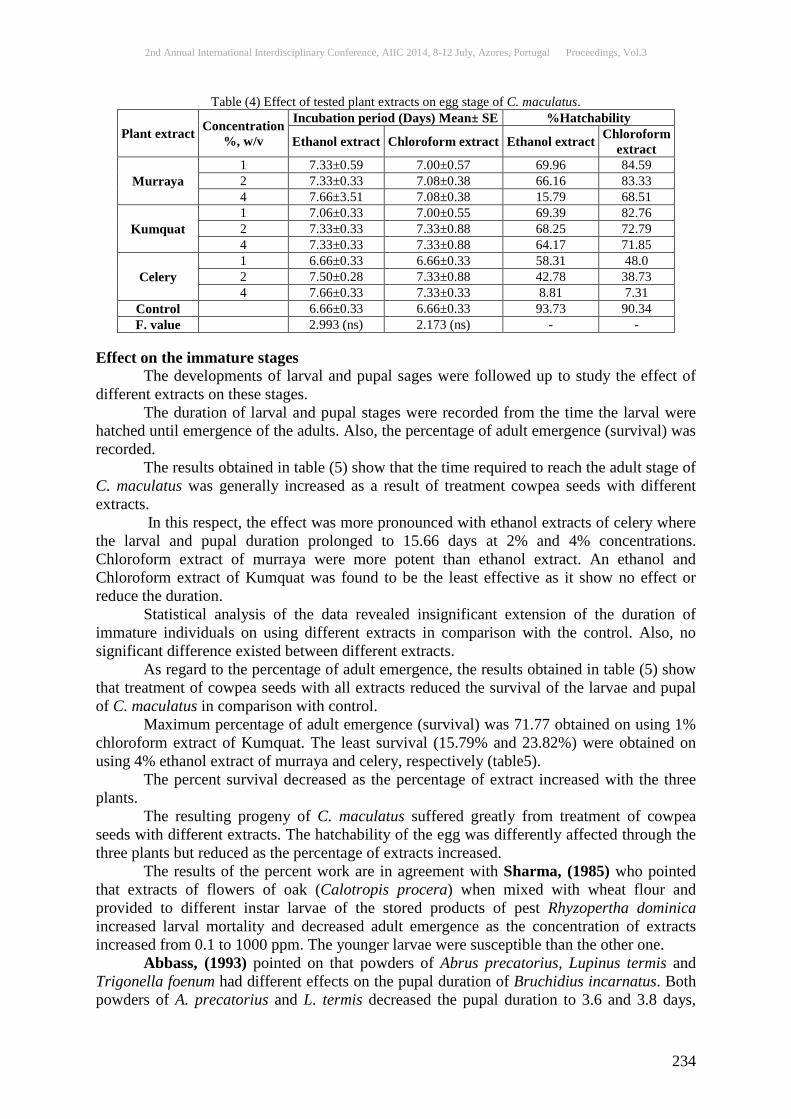
2nd Annual International Interdisciplinary Conference, AIIC 2014, 8-12 July, Azores, Portugal Proceedings, Vol.3
234
Table (4) Effect of tested plant extracts on egg stage of C. maculatus.
Plant extract Concentration %, w/v
Incubation period (Days) Mean± SE %Hatchability
Ethanol extract Chloroform extract Ethanol extract Chloroform extract
Murraya 1 7.33±0.59 7.00±0.57 69.96 84.59 2 7.33±0.33 7.08±0.38 66.16 83.33 4 7.66±3.51 7.08±0.38 15.79 68.51
Kumquat 1 7.06±0.33 7.00±0.55 69.39 82.76 2 7.33±0.33 7.33±0.88 68.25 72.79 4 7.33±0.33 7.33±0.88 64.17 71.85
Celery 1 6.66±0.33 6.66±0.33 58.31 48.0 2 7.50±0.28 7.33±0.88 42.78 38.73 4 7.66±0.33 7.33±0.33 8.81 7.31
Control 6.66±0.33 6.66±0.33 93.73 90.34 F. value 2.993 (ns) 2.173 (ns) - -
Effect on the immature stages
The developments of larval and pupal sages were followed up to study the effect of different extracts on these stages.
The duration of larval and pupal stages were recorded from the time the larval were hatched until emergence of the adults. Also, the percentage of adult emergence (survival) was recorded.
The results obtained in table (5) show that the time required to reach the adult stage of C. maculatus was generally increased as a result of treatment cowpea seeds with different extracts.
In this respect, the effect was more pronounced with ethanol extracts of celery where the larval and pupal duration prolonged to 15.66 days at 2% and 4% concentrations. Chloroform extract of murraya were more potent than ethanol extract. An ethanol and Chloroform extract of Kumquat was found to be the least effective as it show no effect or reduce the duration.
Statistical analysis of the data revealed insignificant extension of the duration of immature individuals on using different extracts in comparison with the control. Also, no significant difference existed between different extracts.
As regard to the percentage of adult emergence, the results obtained in table (5) show that treatment of cowpea seeds with all extracts reduced the survival of the larvae and pupal of C. maculatus in comparison with control.
Maximum percentage of adult emergence (survival) was 71.77 obtained on using 1% chloroform extract of Kumquat. The least survival (15.79% and 23.82%) were obtained on using 4% ethanol extract of murraya and celery, respectively (table5).
The percent survival decreased as the percentage of extract increased with the three plants.
The resulting progeny of C. maculatus suffered greatly from treatment of cowpea seeds with different extracts. The hatchability of the egg was differently affected through the three plants but reduced as the percentage of extracts increased.
The results of the percent work are in agreement with Sharma, (1985) who pointed that extracts of flowers of oak (Calotropis procera) when mixed with wheat flour and provided to different instar larvae of the stored products of pest Rhyzopertha dominica increased larval mortality and decreased adult emergence as the concentration of extracts increased from 0.1 to 1000 ppm. The younger larvae were susceptible than the other one.
Abbass, (1993) pointed on that powders of Abrus precatorius, Lupinus termis and Trigonella foenum had different effects on the pupal duration of Bruchidius incarnatus. Both powders of A. precatorius and L. termis decreased the pupal duration to 3.6 and 3.8 days,

2nd Annual International Interdisciplinary Conference, AIIC 2014, 8-12 July, Azores, Portugal Proceedings, Vol.3
235
respectively using concentration of 5%, meanwhile T. foenum at the same concentration prolonged duration of the resulting pupae to 6.6 days. Table (5) Effect of tested plant extracts on the duration period of immature stages (larval and pupal stages) of C.
maculatus.
Plant extract Concentration %, w/v
Larval and pupal duration ( in days)
Mean± SE
Adult's emergence (%) (Survival)
Ethanol extract Chloroform extract Ethanol extract Chloroform extract
Murraya 1 14.66±4.34 14.66±0.33 60.64 62.55 2 14.66±0.66 15.33±0.66 44.77 58.51 4 15.00±0.57 15.66±0.66 15.79 44.44
Kumquat 1 12.33±0.33 12.33±0.33 69.84 71.77 2 13.33±0.33 13.66±0.66 53.55 58.82 4 13.33±0.33 13.66±0.33 43.41 52.59
Celery 1 15.33±0.88 13.33±0.33 62.65 71.12 2 15.66±0.33 13.33±0.33 61.44 67.12 4 15.66±1.20 13.33±0.33 23.82 52.88
Control 13.33±0.33 13.63±0.33 91.73 92.34 F. value 2.054 (ns) 1.95 (ns) - -
Conclusion
According to the obtained results, it could be stated that the tested compounds played an important role in controlling the bruchid C. maculatus. These compounds may be used as components in (IPM) programmes for controlling this insect pest and to avoid pollution of environment and hazards to man or animals.
Acknowledgement The authors are pleased to express our deepest thanks to Dr. Abdel-Rahman, R.S. for his assistance in completing this work. References: Abass, M.H. (1993). Biological studies on Bruchidus incarnatus Schm. And the control using plant extracts Ms. Thesis, Faculty of Science, Cairo University. Ashamo, M. O.; O. O. Odeyemi and O. C. Ogungbite (2013). Protection of cowpea, Vigna unguiculata L. (Walp.) with Newbouldia laevis (Seem.) extracts against infestation by Callosobruchus maculatus (Fabricius) Archives of Phytopathology and Plant Protection, 46 (11): 1295-1306. Bhaduri, N.; Ram, S. and Patil, B.D. (1985). Evalution of some plant extracts as protectants against the pulse beetle, Callosobruchus maculatus (Fabricius) infesting cowpea seeds. J. Ent. Res., 9(2): 183-187. Chander, H. and Ahmed, S.M. (1986). Efficiency of oils from medical the pulse beetle Callosobruchus chinensis. Entomol, 11(1): 21-25. Duke, J. A. (1990): Introduction to food legumes. In Singh, S R (ed.), Insect Pests of Tropical Food Legumes. Chinchester. John Wiley & Sons, pp 1-42. El-Ghar, G.S.A. and El-Sheikh, A.E. (1987). Effectiveness of some plant extracts as surface protectants of cowpea seeds against the pulse beetle Callosobruchus chinensis. Phytoparasitica, 15(2): 109-113. El-Sayed, F. M.A. and Abdel-Razik, M. (1987). Effect of three plant oils as protectants of three legumes against infestation by cowpea weevil, Agric. Res. Rev., 65(1):53-59. Fitzner, M.S.; Hagtrum, d.w.; Knauft, D.A.; Bhur, K.L. and Mchlaughlin, J.R. (1985). Genotypic diversity in the suitability of cowpea (Rosales: Leguminosae) pods and seeds for

2nd Annual International Interdisciplinary Conference, AIIC 2014, 8-12 July, Azores, Portugal Proceedings, Vol.3
236
cowpea weevil (Coleoptera: Bruchidae) oviposition and development. J. Econ. Entomol. 78: 806-810. IITA (International Institute of Tropical Agriculture) (1989): Annual Report 1988/89. Ibadan, Nigeria. Ileke, K.D.; O.O. Odeyemi and M.O. Ashamo (2013). Response of cowpea bruchid, Callosobruchus maculatus (Fab.) (Coleoptera: Chrysomelidae) to cheese wood, Alstonia boonei De Wild stem bark oil extracted with different solvents Archives of Phytopathology and Plant Protection 46(11): 1359-1370. Lale, N. E. S. and Abdulrahman, H.T. (1999). Evolution of neem (Azadriachta indica A. Juss) seed oil obtained by different methods and neem powder for the management of Callosobruchus maculatus (F.) (Coleoptera, Bruchidae) in stored cowpea. J. stored products research, 35: 135-143. Lundgren, L. (1975). Natural plant chemicals activity as oviposition deterrents on cabbage butterflies (Pieris brassicae L.) P. rapae L. and Pieris napi L.). Zool. Sci.4: 253-258. Mohamed, H.A.; O.A. El-Sebai and S.F. Hafez (2009). Effect of lufenuron and methylamine avermectin on growth , development and reproductive performance of Callosobruchus maculatus (F.) (Coleoptera, Bruchidae). Bull. ent. Soc. Egypt, Econ. Ser., 35:75-90. Pandey, N.D.; Mathur, K.K.; Pandey, S. and Tripathi, R. A. (1986). Effect of some plant extracts against pulse beetle, Callosobruchus chinensis Linensis. Indian .J.Ent., 48 (1): 85-90. Sharma, Y. (1985). A new indigenous plant antifeedant against Rhyzopertha dominica Fab. Bull. Grain Technol., 21(3):223-225. Snedecor, G.W.; Cochran, W.G. (1980). Statistical method. 7th ed. Ames (IA): lowa State University Press; USA. p. 507. Steele, W. M. (1972): Cowpea in Africa. Ph.D. thesis, University of Reading, United Kingdom. Verma, B. K. and Pandey, G.P. (1988). Treatment of stored green grain seed with edible oils for protection from Callosobruchus maculatus,(Fab.) Indain Agric. Sci., 48(2): 72-75. Wassermann, S. (1981). Host–induced oviposition preferences and oviposition markers in the cowpea weevil Callosobruchus maculatus. Ann. Ent. Soc. An. 74:242-245.
2nd Annual International Interdisciplinary Conference, AIIC 2014, 8-12 July, Azores, Portugal Proceedings, Vol.3
237
STUDY OF THE CONTAMINATING MICROBIOTA OF OLD PAPER SUPPORTS
Simona Isabela Dunca, Associate Prof. PhD Catalin Tanase, Prof. PhD Claudia Padurariu, PhD
Tiberius Balaes, PhD Faculty of Biology, “Alexandru Ioan Cuza” University of Iasi, Romania
Elena Ardelean, Lecturer PhD Nicoleta Melniciuc Puica, Prof. PhD
Faculty of Orthodox Theology, “Alexandru Ioan Cuza” University of Iasi, Romania
Abstract Biodeterioration has drawn the attention of different specialists who started to cooperate and to understand the need of joint research to have a picture as comprehensive as possible of the degradation agents and the measures that can be taken to salvage the heritage assets. This paper contains a description of the microbiota identified in two types of old paper supports part of a private collection from North Moldavia (Romania), namely a church book from the end of the 19th century for which the paper was obtained manually from textile fibres, and a book from 1870 with paper from cellulose pulp derived from wood. To the purpose of identifying the types of bacteria and fungi present on the supports examined, several comments were made related to the morphology of the colonies developed on the growth medium, which provided important indications for the determination based on the microscopical examination as well. Bacterial contamination (of the genera Bacillus, Clostridium, Pseudomonas and Micrococcus) was detected in most samples collected. The diversity of the fungi isolated from the paper supports (the genera Penicillium, Alternaria) is the result of the fact that since they are highly hygroscopic materials, they have the capability to retain water more easily, which stimulates fungal growth. The investigations made to determine the presence of microorganisms responsible for degradation and their identification allowed the discovery and acertainment of the real and justified need to find ways to prevent biodeterioration or to inactivate and destroy biodeteriogens by non-invasive, eco-friendly chemical and physical treatments.
Keywords: Old book, contamination, microbiota, bacteria, fungi Introduction
Since biodeterioration is the result of either the combined or separate activity of several organisms on different substrates and under varied ecological conditions, the understanding and stoppage of its effects require the concurrence of the different branches of biology, biochemistry, chemistry, physics-chemistry, etc. Paper is mainly made of cellulose and secondary substances such as lignin, hemicellulose, pectin, waxes, tannins, proteins and mineral constituents. In time, paper undergoes processes of deterioration, which cause the scission of macromolecular chains, an irreversible process called „paper ageing”. The chemical, physical or microbial deteriorations can affect the cellulose fibers of the chemical composition of paper, depending on the raw material and the manufacturing procedure used.
2nd Annual International Interdisciplinary Conference, AIIC 2014, 8-12 July, Azores, Portugal Proceedings, Vol.3
238
The chemical destructions are principally caused by the oxidation of the cellulose chains. Generation of free carbonyl groups and redox reactions can involve all paper constituents. The ink, glue and impurities as well as other organic or inorganic matters can negatively alter the process of paper ageing. Most often, the physical deterioration caused by light, temperature, humidity can enhance the biodegradation processes. The chemical hydrolysis of cellulose can stimulate the attack of microorganisms (Michaelsen et al., 2010). Paper microbial deterioration leads to different types of losses/destructions depending on the organism involved (Michaelsen et al., 2010). Of the varied range of biological agents, three main categories can be distinguished: filamentous fungi, cellulolytic bacteria and insects. The literature estimates there are over 200 species of fungi and bacteria causing paper degradation. Some of these are found in the raw materials, while others contaminate paper when coming into contact with air. Degradation caused by microbial growth occurs in general as: chromatic alterations in the form of stains in a wide variety of colours (e.g. purple, yellow, brown, black, red etc.), shape and size due to the presence of a pigmented mycelium, of spores or, in certain circumstances, pigments produced by bacteria or fungi; structural alterations of the main components caused by enzymes (e.g. cellulases, proteases etc.) produced by different types of microorganisms, which ultimately lead to paper embrittlement or even its partial destruction; alterations to the essential added components (e.g. adhesives, plasticisers, antioxidants etc.) due to the attack of microorganisms (Pasquariello et al., 2005). The presence of bacteria is indicated by appearance of isolated spots of different colours of low intensity at first. Once the attack begins, such spots acquire bigger sizes and deep hues: red, brown, black etc., depending on the species, pH value and so on. Fungi can colonize and degrade an extensive range of heritage assets. They secrete destructive acids and are able to depolymerize cellulose fibers. Many widely-spread species, such as Aspergillus sp., Alternaria sp., Chaetomium sp., Penicillium sp. can degrade cellulose and are often associated with the holdings of libraries (Konkol et al., 2009). The appearance of foxing (an extensively studied phenomenon lately) also was attributed to the species belonging to the Bacillus genera, as the causing agent (De Paolis and Lippim, 2008), even though this degradation process is described as being triggered by the fungal attack as well. Species of actinomycetes and bacteria secreting strong, staining pigments and organic acids causing destruction – foxing (Strzelczyk et al., 2004) were identified. Still from foxing stains, Michaelsen et al. (2010) isolated cellulolytic bacteria, namely Bacillus sp., Acinetobacter sp., Kochuria sp., Stenotrophomanas maltophilia, Clostridium colinum. Rakotonirainy et al. (2007) managed to isolate from foxing stains species of fungi belonging to the following genera: Aspergillus, Bjerkandera, Chaetomium, Gloeotinia, Penicillium, Polyporus, Saccharicola, Trichoderma and Ulocladium. Some species were detected only in 1-2 spots, while others (i.e. Penicillium minioluteum, Gloeotinia tenulenta) were very frequently encountered. Species of Myrothecium verrucaria, Aspergillus sp. and Penicillium sp. can grow also at a relative humidity of 62-65%. Most often, the first affected are book bindings since they take up air humidity. Some filamentous fungi frequently associated with paper degradation are able to hydrolyze cellulose fibers owing to their cellulolytic enzymatic system. Moreover, they can discolour ink by means of the tannases or produce paper-staining pigments and organic acids, which may induce discolouration and damages to the material. The stains may have different colours (e.g. red, purple, yellow, brown, black) due to the secretion of pigments and metabolic products. Among the pigment-producing species the following can be indicated: Penicillium notatum, which exudes a yellow pigment; Alternaria solani, which exudes a black pigment; Fusarium oxysporum, which exudes a pink pigment (i.e. fusarubin) penetrating paper; Chaetomium globosum, which exudes a yellow pigment that subsequently turns brown (Szczepanowska and Lovett, 1992). Biodeterioration can be diminished or inhibited by means of ecological mechanisms acting, in particular, in the
2nd Annual International Interdisciplinary Conference, AIIC 2014, 8-12 July, Azores, Portugal Proceedings, Vol.3
239
abiotic environment. The course of action for using eco-friendly mechanisms to prevent and stop biodeterioration includes the alteration, denaturation or intoxication of the living environment of the biodeterioration agents (Oprea, 2006). The usual techniques applied for treating paper to the purpose of inactivating fungi are based on the use of disinfectant chemical agents or the use of various types of radiations, which frequently have a negative impact on paper. The current research studies on the preservation of paper items focus on the finding of methods that are ecological, less damaging, efficient and can be widely applied (Ioanid et al., 2010).
The purpose of this study was the identification of the microbiota and the assessment of the extent of contamination of two old paper supports with the aim of applying effective, eco-friendly and non-invasive decontamination treatments. Materials and methods
In the biological investigation of heritage assets, the analytical tests aim at the following: detection of a real process of biodeterioration and establishing whether such process is active (viable), passive (latent) or inactive (extinct); identification of the causing agent or group of agents involved in the biodegradation process examined; determination or description of the effects of the biodeterioration agents on the items subjected to examination and assessment of their extent; ascertainment and determination of the real and justified need for biocide treatments (i.e. disinfection, pest control), finding alternative ways to prevent biodeterioration or to inactivate and destroy biodeterioration agents; testing of the resistance to biodeterioration of materials and substances used for restoration and contingently, identification of means to enhance biological resistance to the degradation factors; prevention of the outset of any deterioration process during the preservation and restoration stages (Oprea, 2006). The samples to be examined were collected from two types of old paper supports part of a private collection from North Moldavia (Romania), namely a Church book from the end of the 19th century for which the paper was obtained manually from textile fibres, with red and black printing ink, and a book from 1870 with paper from cellulose pulp derived from wood and black printing ink. Sample collection
One of the main difficulties in reaching the biological diagnosis for items of heritage importance is the non-invasive collection of samples, which must be performed in a manner that does not change the items in question, especially when such items are small. A sample collected inadequately or placed in inappropriate, uncontrolled conditions can easily and rapidly modify its microbial composition (Oprea, 2006). The method used in this study was the impression one, consisting in pressing sterile 1 cm2 test specimens of filter paper (impregnated with sterile distilled water) onto the attacked parts, so that the spores and mycelial fragments would adhere to the surface of the test specimens, which were subsequently transferred to culture media. Examination and identification of bacteria
The incubation of the samples inoculated on the nutrient agar medium at 370C for 24 hours was followed by the examination of the growth of bacterial cultures on/around the test specimens was examined. After the preparation of pure cultures (containing a single species or microbial strain), the bacteria were identified based on a complex set of features, namely colony and cell morphology, mobility, sporulation, tinctorial properties, type of respiration, growth particularities (i.e. growth and development in liquid culture media and on solid media). The microscopic evaluation involved the examination of bacterial smears fixed and stained according to Gram’s method (Dunca et al., 2007). The evaluation can be carried out in numerous ways, from visual inspection with the naked eye or using a magnifying glass to the use of an optical microscope or electron microscope (TEM, SEM) (Oprea, 2006). The
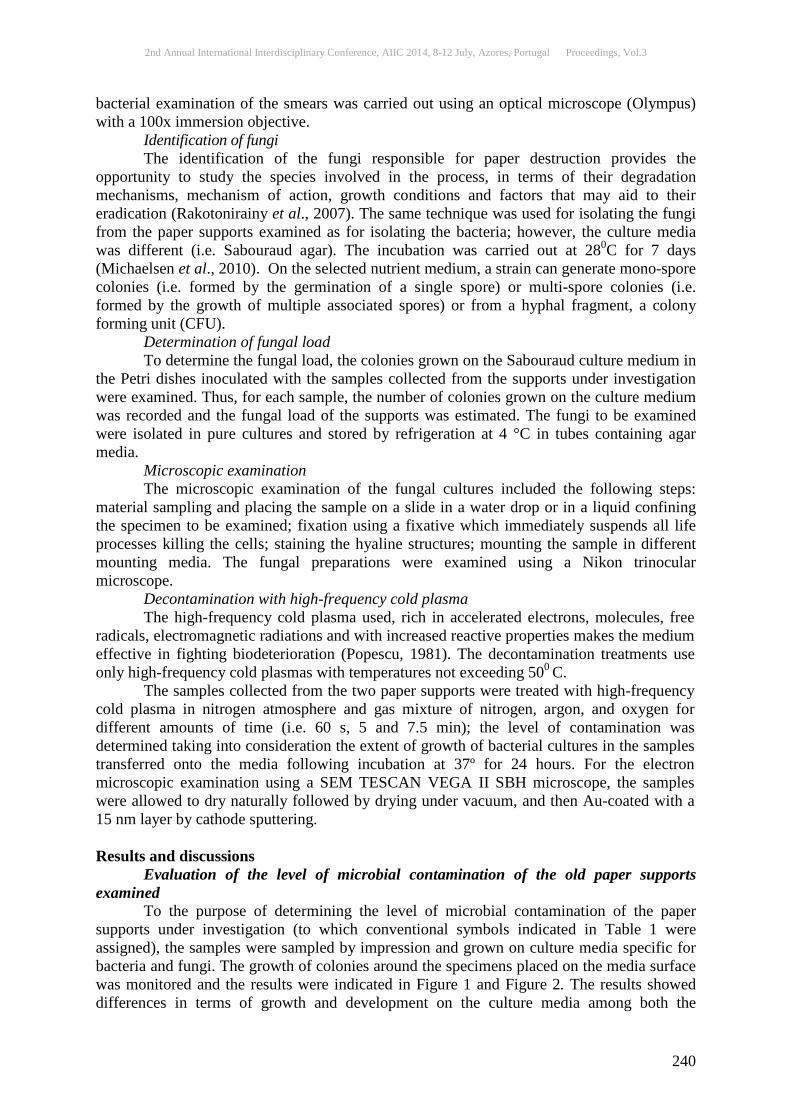
2nd Annual International Interdisciplinary Conference, AIIC 2014, 8-12 July, Azores, Portugal Proceedings, Vol.3
240
bacterial examination of the smears was carried out using an optical microscope (Olympus) with a 100x immersion objective. Identification of fungi
The identification of the fungi responsible for paper destruction provides the opportunity to study the species involved in the process, in terms of their degradation mechanisms, mechanism of action, growth conditions and factors that may aid to their eradication (Rakotonirainy et al., 2007). The same technique was used for isolating the fungi from the paper supports examined as for isolating the bacteria; however, the culture media was different (i.e. Sabouraud agar). The incubation was carried out at 280C for 7 days (Michaelsen et al., 2010). On the selected nutrient medium, a strain can generate mono-spore colonies (i.e. formed by the germination of a single spore) or multi-spore colonies (i.e. formed by the growth of multiple associated spores) or from a hyphal fragment, a colony forming unit (CFU). Determination of fungal load
To determine the fungal load, the colonies grown on the Sabouraud culture medium in the Petri dishes inoculated with the samples collected from the supports under investigation were examined. Thus, for each sample, the number of colonies grown on the culture medium was recorded and the fungal load of the supports was estimated. The fungi to be examined were isolated in pure cultures and stored by refrigeration at 4 °C in tubes containing agar media. Microscopic examination The microscopic examination of the fungal cultures included the following steps: material sampling and placing the sample on a slide in a water drop or in a liquid confining the specimen to be examined; fixation using a fixative which immediately suspends all life processes killing the cells; staining the hyaline structures; mounting the sample in different mounting media. The fungal preparations were examined using a Nikon trinocular microscope. Decontamination with high-frequency cold plasma
The high-frequency cold plasma used, rich in accelerated electrons, molecules, free radicals, electromagnetic radiations and with increased reactive properties makes the medium effective in fighting biodeterioration (Popescu, 1981). The decontamination treatments use only high-frequency cold plasmas with temperatures not exceeding 500 C.
The samples collected from the two paper supports were treated with high-frequency cold plasma in nitrogen atmosphere and gas mixture of nitrogen, argon, and oxygen for different amounts of time (i.e. 60 s, 5 and 7.5 min); the level of contamination was determined taking into consideration the extent of growth of bacterial cultures in the samples transferred onto the media following incubation at 37º for 24 hours. For the electron microscopic examination using a SEM TESCAN VEGA II SBH microscope, the samples were allowed to dry naturally followed by drying under vacuum, and then Au-coated with a 15 nm layer by cathode sputtering. Results and discussions Evaluation of the level of microbial contamination of the old paper supports examined To the purpose of determining the level of microbial contamination of the paper supports under investigation (to which conventional symbols indicated in Table 1 were assigned), the samples were sampled by impression and grown on culture media specific for bacteria and fungi. The growth of colonies around the specimens placed on the media surface was monitored and the results were indicated in Figure 1 and Figure 2. The results showed differences in terms of growth and development on the culture media among both the

2nd Annual International Interdisciplinary Conference, AIIC 2014, 8-12 July, Azores, Portugal Proceedings, Vol.3
241
organisms investigated: i.e. bacteria (Figure 3 and Figure 4) and fungi (Figure 5 and Figure 6) and the samples examined. Morphology of the bacterial cultures When cultivated on solid media, bacteria grow as individual or merging colonies on the surface of or within the media. Their formation on solid media can be explained by the lack of Brownian motion and reduced bacterial motility, which allows the cells resulted from repeated division aggregate in a limited area.
Table 1. Assignment of conventional symbols to the samples examined No. Symbol assigned Name of sample examined Sampling points 1. IA
Church book left page, bottom left corner 2. IB Church book left page, bottom right corner 3. Ic Church book right page, bottom left corner 4. ID Church book right page, top right corner 5. IIA Church book middle of fascicle: upper part 6. IIB Church book middle of fascicle: median part 7. IIC Church book middle of fascicle: lower part 8. IID Church book bottom right corner 9. IIIA Church book outside left margin: grey-purple stains
10. IIIB Church book middle of fascicle: top 11. IIIC Church book middle of fascicle: bottom 12. IIID Church book right page, bottom right corner 13. IVA Church book book binding string 14. IVB Church book book binding – middle – piece of string 15. IVC Church book colour imprint (1/2 upper) 16. IVD Church book colour imprint (1/2 lower) 17. VA Church book bottom left (purple stains) 18. VB Church book left page, top right side 19. VC Church book top right 20. VD Church book bottom right 21. VIA Book from 1870 (printed in Paris) page 112 – top left corner (brown stain) 22. VIB Book from 1870 (printed in Paris) page 112 – top right 23. VIC Book from 1870 (printed in Paris) page 112 – bottom left (stains) 24. VID Book from 1870 (printed in Paris) page 113 – inside margin, median part 25. VIIA Book from 1870 (printed in Paris) foxing – page 288 – top left 26. VIIB Book from 1870 (printed in Paris) foxing – page 288 – top right 27. VIIC Book from 1870 (printed in Paris) foxing – page 288 - bottom left 28. VIID Book from 1870 (printed in Paris) foxing – page 288 - bottom right
The structure and appearance of the colonies are determined by the morphology of the
constituting cells, their grouping, and the characteristics of the culture medium under the influence of physicochemical factors. The bacterial cultures (visible to the naked eye for most bacteria after 18 to 24 hours) differ in terms of size (small, medium, large), margins (irregular, lobate, rhizoid etc.), surface (shiny, dull, granular etc.), opacity (opaque, translucent, transparent), elevation (flat, raised, umbonate etc.), colour (pigment-containing, lack of pigment), consistency (viscid, mucoid etc.), adhesion (adherent, non-adherent).

2nd Annual International Interdisciplinary Conference, AIIC 2014, 8-12 July, Azores, Portugal Proceedings, Vol.3
242
Figure 1. Points for collecting the samples (VA -VD)
from the Church book (19th century)
Figure 2. Points for collecting the samples (VIIA-VIID)
from the book printed in Paris (1870)
Figure 3. Appearance of the bacterial colonies grown on nutrient agar: samples VA, VB, VC, VD (the Church
book)
Figure 4. Appearance of the bacterial colonies grown on nutrient agar: samples VIIA, VIIB, VIIC, VIID (the
book from 1870)
Figure 5. Appearance of the fungal colonies grown on Sabouraud agar: samples VA, VB, VC, VD (the Church
book)
Figure 6. Appearance of the fungal colonies grown on Sabouraud agar: samples VIIA, VIIB, VIIC, VIID (the
book from 1870)
VB
VA VD
VC VIIA
VIIB
VIIC
VIID
VB VA
VD VC
VA VB
VC VD
VIIA VIIB
VIIC VIID
VIIA VIIB
VIIC VIID

2nd Annual International Interdisciplinary Conference, AIIC 2014, 8-12 July, Azores, Portugal Proceedings, Vol.3
243
The microbial contamination of the paper supports examined is shown concisely in Table 2.
Table 2. Level of microbial load in the samples examined No. Sample Sample description No. of fungal colonies No. of bacterial colonies 1. I – imprints A-D 7 5 2. II – imprints A-D 2 6 3. III – imprints A-D 4 4 4. IV – imprints A-D 6 4 5. V – imprints A-D 7 4 6. VI – imprints A-D 1 0 7. VII – imprints A-D 9 4
The microscopic examination of the organisms isolated in pure cultures resulted in the
identification of the following bacterial cellular morphologies (Figure 7 – Figure 10): Gram-negative rods, single or in pairs (as diplo), sporulating (with central and
subterminal non-deforming spores): strains IB, IC, ID, IVD2; Gram-positive rods single, sporulating (with central and subterminal deforming
spores): strains VA, VC, VD, VIID; Gram-positive rods, single, sporulating (with central and subterminal non-deforming
spores): strain IIA; Gram-positive rods, single, sporulating (with central and subterminal non-deforming
spores and mass of spores): strains IIB, IIC, IIIA, IIIB, IIIC, IVA, IVB, IVC; Gram-positive rods single, sporulating (with central, subterminal and terminal non-
deforming spores and mass of spores): strain IIID; Gram-positive rods, single, sporulating (with subterminal and terminal deforming
spores and mass of spores): strain VIIC; Gram-positive rods, single, sporulating (with subterminal and terminal non-deforming
spores): strain IID; Gram-negative rods, single or grouped in short chains, non-sporulating: strains IA,
IVD1; Gram-negative rods, single, in pairs and short chains, non-sporulating: strain VIIB; Gram-positive cocci, single and in pairs, non-sporulating: strain VIIA absence of growth: strains VIA, VIB, VIC, VID.
Identification of the main genera of bacteria
The examination of the macromorphological and micromorphological features led to the identification of the following prevailing genera in the items examined (Church book – 19th century and printed book -1870): Bacillus (62 % of the isolated strains), Clostridium (21 %), Pseudomonas (13 %) and Micrococcus (4 %). The taxonomic classification of the bacteria identified is shown in Table 3.

2nd Annual International Interdisciplinary Conference, AIIC 2014, 8-12 July, Azores, Portugal Proceedings, Vol.3
244
Figure 7. Microscopic appearance of the Bacillus sp. strain (1000x)
Figure 8. Microscopic appearance of the Micrococcus sp. strain (1000x)
Figure 9. Microscopic appearance of the Clostridium sp. strain (1000x)
Figure 10. Microscopic appearance of the Pseudomonas sp. strain (1000x)
Table 3. Taxonomic classification of the bacterial strains isolated from the paper supports examined Strain Kingdom Division Section Family Genus
IB,IC, ID,IIA, IIB,IIC, IID,IIIA,
IIIB,IIIC, IIID,IVA, IVB,IVC, IVD2
Prokaryotae II. Firmicutes
13 – Endospore forming Gram - Positive Rods
and Cocci
Bacillaceae Bacillus
VA,VC, VD,VIIC, VIID Prokaryotae II.
Firmicutes
13 – Endospore forming Gram - Positive Rods
and Cocci
Bacillaceae Clostridium
VIIA, Prokaryotae II.Firmicutes 12 – Gram -Positive Cocci Micrococcaceae Micrococcus
IA, IVD1, VIIB Prokaryotae I. Gracilicutes
4- Gram-Negative Aerobic Rods and Cocci
Pseudomonadaceae Pseudomonas
Identification of the main genera of fungi
To the purpose of identifying the main genera of fungi found on the supports investigated, the morphology of the colonies grown on the culture medium was examined; morphology examination provides important aspects for the subsequent determination based also on microscopy. The investigation of the different microscopic structures (i.e. hyphae, conidiophores, conidia etc.) by microscopy led to the identification of the principal fungal genera (Table 4).

2nd Annual International Interdisciplinary Conference, AIIC 2014, 8-12 July, Azores, Portugal Proceedings, Vol.3
245
Table 4. Systematic classification of the genera of fungi identified on the paper supports examined Kingdom Phylum Class Order Family Genus Strain
FUNGI
Ascomycota Eurotiomycetes Eurotiales Trichocomaceae Penicillium IA, ID, IIA, IIIB, IVD, VD, VIA, VIIc
Dothideomycetes Pleosporales Pleosporaceae Alternaria VB
Penicillium Link, Magazin Ges. naturf. Freunde, Berlin 3: 16 (1809) Penicillium sp. 1 – strains IA, ID, IIA, IIIB, IVD, VD (Figure 11 and Figure 12). The
colony attained 3.7 cm in diameter 6 days after inoculation on Sabouraud medium at 25 °C. The surface of the colony was initially white, velvety, then turned pulverulent, yellow in the centre, subsequently green and finally bluish-green towards the margins. The colony margins were fimbriate. The reverse was yellow and smooth in the centre after 6 days. No secretion of exudates was observed. The conidiophores were branched, bi and ter-verticillate with 5-8 x 2.5-3 μm cylindrical or fusiform phialides. The phialospores were spherical, smooth, slightly yellow, of 3.5-4 μm.
Figure 11. Appearance of the Penicillium sp.1 culture
Figure 12. Microscopic appearance of conidiophore
and conidia in Penicillium sp.1 (400x) Penicillium sp. 2. – strains VIA, VIIC (Figure 13 and Figure 14). The colony grew
moderately reaching 4 cm in diameter 6 days after inoculation on Sabouraud medium at 25 °C. The surface of the colony was initially white, velvety, then turned powdery, uniform – smooth, bluish-green, and finally green in the centre with white margins. The margins of the colony were relatively smooth. The reverse was yellowish-white, smooth. It showed no exudates. The conidiophores were branched, of 230-290 μm in size, bi- verticillate. The phialides were cylindrical and 5-6 x 2.5 μm in size. They formed chains of 2.2-2.8 μm spherical, hyaline, and smooth-surfaced phialospores.
Penicillium Link, Magazin Ges. naturf. Freunde, Berlin 3: 16 (1809) د Alternaria Nees, Syst. Pilze: 72 (1816) د

2nd Annual International Interdisciplinary Conference, AIIC 2014, 8-12 July, Azores, Portugal Proceedings, Vol.3
246
Figure 13. Appearance of the Penicillium sp.2 culture
Figure 14. Microscopic appearance of conidiophore and conidia in Penicillium sp.2 (400x)
Alternaria Nees, Syst. Pilze: 72 (1816) Alternaria sp., strain VB (Figure 15 and Figure 16). The colony reached 7.5 cm in
diameter in 6 days on Sabouraud medium, at 25 °C. The surface of the colony was initially downy, white, then turned brown in the middle, with irregular areas of different shades of brown towards the margins. The margins of the colony were fibriate, irregular. After 6 days, the reverse was pigmented, with concentric circles of different hues from cream-coloured to dark brown, and smooth. The colony was covered by colourless exudates early on. In submerged conditions, the mycelium exhibited hyphae with numerous chamydospores forming chains, slightly pigmented, refractive, thick-walled. In addition, highly pigmented, reddish brown or dark brown hyphae were found; such hyphae break and produce arthrospores. The aerial mycelium exhibited short, septate, often geniculate conidiophores with a length of up to 62 μm. Sometimes, several conidiophores arose on the same hypha; they were slightly pigmented and moderately thick-walled. The conidia were arranged in chains and were usually knob-like, pear-shaped, oval to linear-fusiform, septate, and frequently muriform. The conidia were pigmented and thick-walled (15-55 x 12-25 μm).
The diversity of the bacteria and fungi isolated from the old paper supports are shown in Figure 17 and Figure 18. The findings show that paper degradation may come in different forms, from the appearance of small stains and yellowing to heavy staining, printed picture discolouration or even paper embrittlement and disintegration. The most commonly seen form is foxing, when small, circular, reddish-brown-yellow stains appear on the paper, disseminated throughout its surface.
Figure 15. Appearance of the Alternaria sp.culture
Figura 16. Microscopic appearance of
conidiophore and conidia in Alternaria sp. (400x)
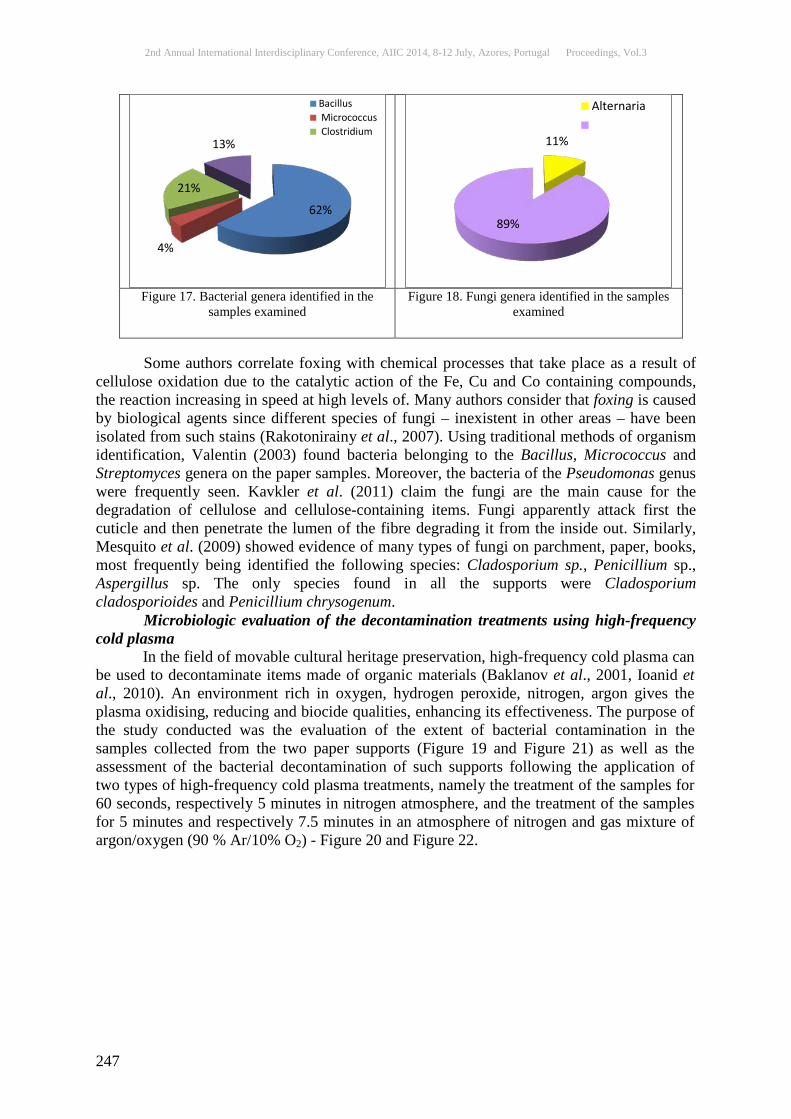
2nd Annual International Interdisciplinary Conference, AIIC 2014, 8-12 July, Azores, Portugal Proceedings, Vol.3
247
Figure 17. Bacterial genera identified in the
samples examined Figure 18. Fungi genera identified in the samples
examined
Some authors correlate foxing with chemical processes that take place as a result of
cellulose oxidation due to the catalytic action of the Fe, Cu and Co containing compounds, the reaction increasing in speed at high levels of. Many authors consider that foxing is caused by biological agents since different species of fungi – inexistent in other areas – have been isolated from such stains (Rakotonirainy et al., 2007). Using traditional methods of organism identification, Valentin (2003) found bacteria belonging to the Bacillus, Micrococcus and Streptomyces genera on the paper samples. Moreover, the bacteria of the Pseudomonas genus were frequently seen. Kavkler et al. (2011) claim the fungi are the main cause for the degradation of cellulose and cellulose-containing items. Fungi apparently attack first the cuticle and then penetrate the lumen of the fibre degrading it from the inside out. Similarly, Mesquito et al. (2009) showed evidence of many types of fungi on parchment, paper, books, most frequently being identified the following species: Cladosporium sp., Penicillium sp., Aspergillus sp. The only species found in all the supports were Cladosporium cladosporioides and Penicillium chrysogenum. Microbiologic evaluation of the decontamination treatments using high-frequency cold plasma
In the field of movable cultural heritage preservation, high-frequency cold plasma can be used to decontaminate items made of organic materials (Baklanov et al., 2001, Ioanid et al., 2010). An environment rich in oxygen, hydrogen peroxide, nitrogen, argon gives the plasma oxidising, reducing and biocide qualities, enhancing its effectiveness. The purpose of the study conducted was the evaluation of the extent of bacterial contamination in the samples collected from the two paper supports (Figure 19 and Figure 21) as well as the assessment of the bacterial decontamination of such supports following the application of two types of high-frequency cold plasma treatments, namely the treatment of the samples for 60 seconds, respectively 5 minutes in nitrogen atmosphere, and the treatment of the samples for 5 minutes and respectively 7.5 minutes in an atmosphere of nitrogen and gas mixture of argon/oxygen (90 % Ar/10% O2) - Figure 20 and Figure 22.
62%
4%
21%
13%
Bacillus Micrococcus Clostridium
11%
89%
Alternaria
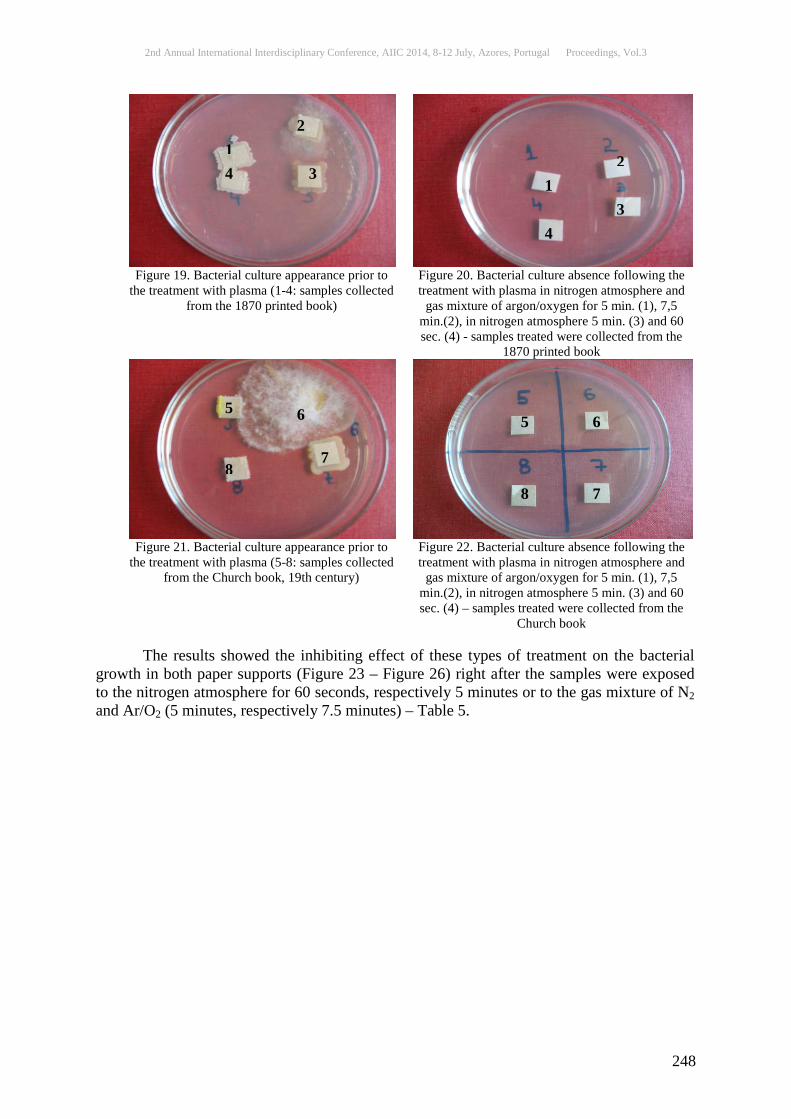
2nd Annual International Interdisciplinary Conference, AIIC 2014, 8-12 July, Azores, Portugal Proceedings, Vol.3
248
Figure 19. Bacterial culture appearance prior to the treatment with plasma (1-4: samples collected
from the 1870 printed book)
Figure 20. Bacterial culture absence following the treatment with plasma in nitrogen atmosphere and
gas mixture of argon/oxygen for 5 min. (1), 7,5 min.(2), in nitrogen atmosphere 5 min. (3) and 60 sec. (4) - samples treated were collected from the
1870 printed book
Figure 21. Bacterial culture appearance prior to the treatment with plasma (5-8: samples collected
from the Church book, 19th century)
Figure 22. Bacterial culture absence following the treatment with plasma in nitrogen atmosphere and
gas mixture of argon/oxygen for 5 min. (1), 7,5 min.(2), in nitrogen atmosphere 5 min. (3) and 60 sec. (4) – samples treated were collected from the
Church book The results showed the inhibiting effect of these types of treatment on the bacterial
growth in both paper supports (Figure 23 – Figure 26) right after the samples were exposed to the nitrogen atmosphere for 60 seconds, respectively 5 minutes or to the gas mixture of N2 and Ar/O2 (5 minutes, respectively 7.5 minutes) – Table 5.
1
2
4 3 1
2
3
4
5 6
8 7
5
8
6
7

2nd Annual International Interdisciplinary Conference, AIIC 2014, 8-12 July, Azores, Portugal Proceedings, Vol.3
249
Figure 23. Scanning electron micrograph (SEM) showing microbial load of the paper support (the
1870 printed book) prior to the treatment with plasma
Figure 24. Scanning electron micrograph (SEM) showing absence of microbial load of the paper support (the 1870 printed book) following the
treatment with plasma (N2 atmosphere, 60 seconds)
Figure 25. Scanning electron micrograph (SEM)
showing microbial load of the paper support (19th century Church book) prior to the
treatment with plasma
Figure 26. Scanning electron micrograph (SEM) showing absence of microbial load of the paper
support (19th century Church book) following the treatment with plasma (N2 atmosphere, 60
seconds)
Table 5. Level of bacterial contamination in the old paper supports before and after the treatment with plasma
Sample Growth of bacterial cultures prior to treatment Type of treatment Growth of bacterial cultures
following treatment
1. + + - N2 (5 minute) + Ar/O2 (5 minute) - - -
2. + + + N2 (7,5 minute) + Ar/O2 (7,5 minute) - - -
3. + + - N2 (5 minute) - - - 4. + + - N2 (60 seconds) - - -
5. + - - N2 (5 minute) + Ar/O2 (5 minute) - - -
6. + + + N2 (7,5 minute) + Ar/O2 (7,5 minute) - - -
7. + + - N2 (5 minute) - - - 8. + - - N2 (60 seconds) - - - Legend: 1-4: samples collected from the printed book (1870), 5-8: samples collected from the Church book
(19th century), +++: very well growth; ++-: well growth; +--: weak growth; ---: absence of growth.

2nd Annual International Interdisciplinary Conference, AIIC 2014, 8-12 July, Azores, Portugal Proceedings, Vol.3
250
Conclusions 1. Degradation caused by the presence of bacteria manifests by chromatic changes, i.e. stains in a wide range of colours (e.g. purple, yellow, brown, black, red, etc.) and structural modifications to the main components due to enzymes (cellulases, proteases etc.), which induce paper embrittlement or even its partial destruction. 2. A number of 24 bacterial strains belonging to the following genera were isolated to pure cultures: Bacillus (15 strains), Clostridium (5 strains), Pseudomonas (3 strains) and Micrococcus (1 strain). 3. Bacterial contamination was found in most samples collected from the Church book (19th century) and the printed book (Paris, 1870), particularly in the foxing spots, the level of contamination varying according to the type of microorganism and the conditions in which such microorganism is active. 4. Among biological factors involved in paper degradation, the most significant are the cellulolytic fungi, which destroy paper by secreting extracellular cellulases, organic acids and pigments. 5. A considerable fungal load was found in all the specimens examined, the identified fungi pertaining mainly to the Penicillium and Alternaria genera. 6. The wide diversity of the fungi isolated from the paper supports is the result of the ability of the paper support to readily attract and retain water (being a highly hygroscopic material), which stimulates fungal growth and development. 7. The comparative assessment of the two types of treatment with high-frequency cold plasma (in N2 atmosphere or in gas mixture of N2 and Ar/O2) shows the effectiveness of both in bacterial decontamination, their inhibitory effect being easily perceived even after the short 60-second application of the N2 treatment. Acknowledgements
This work was financially supported by a grant from the Ministry of National Education of Romania (PN-II-PT-PCCA-2011-3.2-1281, Grant No. 221/2012: Developing Non-conventional Materials and Cold Plasma Technique for Sustainable Solutions in Paper Heritage Conservation), which is gratefully acknowledged. References: Baklanov, M.R., Shamiryan, D.G., Tökei, Zs., Beyer, G.P., Conard, T., Vanhaelemeersch, S., and Maex, K. Characterization of Cu surface cleaning by hydrogen plasma. J. Vac. Sci. Technol., B 19.4: 1201-1211, 2001. De Paolis, M. R., and Lippim, D. Use of metabolic and molecular methods for the identification of a Bacillus strain isolated from paper affected by foxing. Microbiological Research, 163:121-131, 2008. Dunca, S., Ailiesei, O., Nimitan, E., and Stefan, M. Microbiologie aplicată, Casa Editorială Demiurg, Iasi, 74-76, 2007. Kavkler, K., Smit, Z., Jezersek, D., Eichert, D., and Demsar, A. Investigation of biodeteriorated historical textiles by conventional and synchrotron radiation FTIR spectroscopy. Polymer Degradation and Stability, 96: 1081-1086, 2011. Konkol, N., McNamara, C.J., and Mitchell, R. Fluorometric detection and estimation of fungal biomass on cultural heritage materials. Journal of Microbiological Methods, 80: 178–182, 2009. Mesquito, N., Portugal, A., Videira, S., Rodríguez-Echeverría, S., Bandeira, A.M.L., Santos, M.J.A., and Freitas, H. Fungal diversity in ancient documents. A case study on the Archive of the University of Coimbra. International Biodeterioration & Biodegradation, 63: 626–629, 2009.

2nd Annual International Interdisciplinary Conference, AIIC 2014, 8-12 July, Azores, Portugal Proceedings, Vol.3
251
Michaelsen, A., Piñar, G., and Pinzari, F.A. Molecular and Microscopical Investigation of the Microflora Inhabiting a Deteriorated Italian Manuscript Dated from the Thirteenth Century. Microb. Ecol., 60: 69–80, 2010. Oprea, F., Biologie pentru conservarea şi restaurarea patrimoniului cultural, Ed. Maiko, Bucureşti, 418-428, 2006. Pasquariello, G., Velenti, P., Maggi, O., and Persiani, A. M.. Paper, In Plant Biology for Cultural Heritage: Biodeterioration and Conservation (Ed. Giulia Caneva, Maria Pia Nuggari, Ornella Salvadori), 108-110, 2005. Popescu, I., Iancu, I., and Toader, E. Fizica plasmei si aplicatii. Ed. Stiintifica si Enciclopedica, Bucuresti, 75-94, 1981. Rakotonirainy, M.S., Heude, E., and Lavédrine, B. Isolation and attempts of biomolecular characterization of fungal strains associated to foxing on a 19th century book. Journal of Cultural Heritage, 8(2): 126–133, 2007. Strzelczyk, A.B. Observations on aesthetic and structural changes induced in Polish historic objects by microorganisms. International Biodeterioration & Biodegradation, 53: 151 – 156, 2004. Szczepanowska, H., and Lovett, C.M. A study of the removal and prevention of fungal stains on paper. Journal of American Institute of Conservation, 31, 2: 147-160, 1992. Valentin, N.. Microbial contamination in museum collections: Organic materials, In Molecular Biology and Cultural Heritage (Ed. Saiz-Jimenez), Swets & Zeitlinger, Lisse, 85-87, 2003.
2nd Annual International Interdisciplinary Conference, AIIC 2014, 8-12 July, Azores, Portugal Proceedings, Vol.3
252
STUDY ON THE ANTIOXIDANT ACTIVITY DURING THE FORMULATION OF BIOLOGICAL ACTIVE INGREDIENT
Zsófia Edit Pápay, PharmD, István Antal, PharmD.,PhD
Department of Pharmaceutics, Semmelweis University, Budapest, Hungary
Abstract Background & Aims: This study examined the antioxidant activity of different extract of parsley (Petroselinum crispum) with DPPH method. This assay is one of the most commonly used because of its simplicity and efficiency. Parsley is a widely known culinary plant and herbal medicine in Europe since ancient times. It is easy to grow and many biological activities are attributed to the flavonoids in the leaf. Biological active herbal medicines have an advantage over drugs because they are safer and cheaper. Methods: The antioxidant activities of the main flavonoid and its glycosides were measured. With previously optimized extraction procedure, the effect of particle size and extraction temperature were tested regarding the radical scavenging activity and drug content with spectrophotometric and HPLC-UV method. The antioxidant capacity of the extracts for 7 days were also investigated. Results: The aglicon possesses bigger antioxidant activity over the glycosidic forms. The scavenging activity was decreased with smaller the particle size of the dried leaves and higher temperature, but the flavonoid content was increased. Conclusion: The use of medicinal plants in the therapy is emerging. The exact dose and mode of action of the medicinal plants are still an unfolding area therefore the study on the main mode of action - the antioxidant activity – influenced by the formulation is important.
Keywords: Parsley, Petroselinum crispum, flavonoids, antioxidant activity, DPPH assay Introduction
Reactive oxygen species are generated in the body as a result of the cellular metabolism and eliminated by defensive ezymes like superoxide dismutase (SOD). When the cellular production of ROS is increased or the endogen antioxidant capacity is decreased, oxidative stress can occur (Thannickal and Fanburg 2000, Ray, Huang et al. 2012). Several malfunctions and diseases are related to this mechanism e.g. diabetes and neurodegeration (Simonian and Coyle 1996, Schaffer, Jong et al. 2012). It has proven to be involved in cardiovascular diseases like artherosclerosis (Li, Horke et al. 2013) and even in the development of cancer (Chiang, Wang et al.). The ROS can damage proteins, lipids and DNA; downstream signaling molecules and trigger cellular death by apoptotic pathways in the cell. They have also been identified as key factors in drug and toxin induced organ pathophysiology (Rashid, Sinha et al. 2013).
In the recent years, the medicinal plants have drawn interest against oxidative stress. The presence of various, natural antioxidants in herbs are well known. Phenolic compounds, especially flavonoids, can donate hydrogen to the harmful free radicals to prevent the oxidative damage at the first initiation step. They are not only scavenging radicals, but inhibiting their genesis (Nijveldt, van Nood et al. 2001). Parsley (Petroselinum crispum) is a widely known culinary plant and herbal medicine in Europe since ancient times. It is easy to grow and many biological activities are attributed
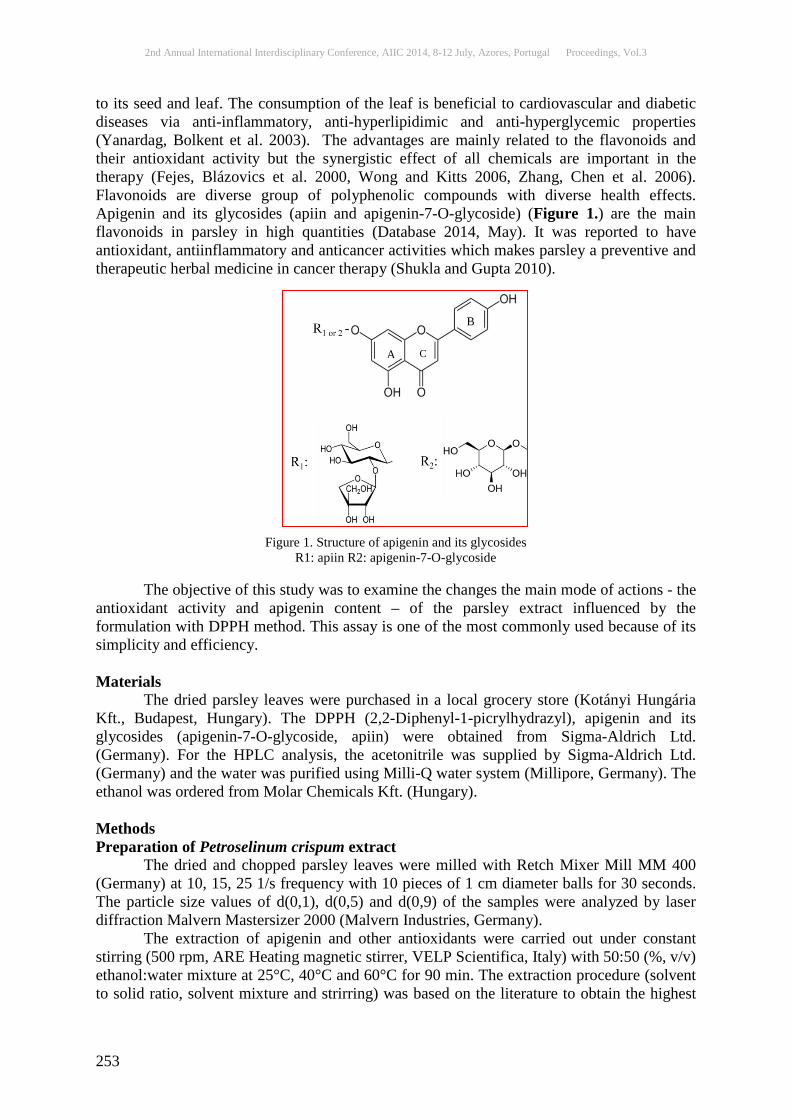
2nd Annual International Interdisciplinary Conference, AIIC 2014, 8-12 July, Azores, Portugal Proceedings, Vol.3
253
to its seed and leaf. The consumption of the leaf is beneficial to cardiovascular and diabetic diseases via anti-inflammatory, anti-hyperlipidimic and anti-hyperglycemic properties (Yanardag, Bolkent et al. 2003). The advantages are mainly related to the flavonoids and their antioxidant activity but the synergistic effect of all chemicals are important in the therapy (Fejes, Blázovics et al. 2000, Wong and Kitts 2006, Zhang, Chen et al. 2006). Flavonoids are diverse group of polyphenolic compounds with diverse health effects. Apigenin and its glycosides (apiin and apigenin-7-O-glycoside) (Figure 1.) are the main flavonoids in parsley in high quantities (Database 2014, May). It was reported to have antioxidant, antiinflammatory and anticancer activities which makes parsley a preventive and therapeutic herbal medicine in cancer therapy (Shukla and Gupta 2010).
Figure 1. Structure of apigenin and its glycosides R1: apiin R2: apigenin-7-O-glycoside
The objective of this study was to examine the changes the main mode of actions - the
antioxidant activity and apigenin content – of the parsley extract influenced by the formulation with DPPH method. This assay is one of the most commonly used because of its simplicity and efficiency. Materials The dried parsley leaves were purchased in a local grocery store (Kotányi Hungária Kft., Budapest, Hungary). The DPPH (2,2-Diphenyl-1-picrylhydrazyl), apigenin and its glycosides (apigenin-7-O-glycoside, apiin) were obtained from Sigma-Aldrich Ltd. (Germany). For the HPLC analysis, the acetonitrile was supplied by Sigma-Aldrich Ltd. (Germany) and the water was purified using Milli-Q water system (Millipore, Germany). The ethanol was ordered from Molar Chemicals Kft. (Hungary). Methods Preparation of Petroselinum crispum extract
The dried and chopped parsley leaves were milled with Retch Mixer Mill MM 400 (Germany) at 10, 15, 25 1/s frequency with 10 pieces of 1 cm diameter balls for 30 seconds. The particle size values of d(0,1), d(0,5) and d(0,9) of the samples were analyzed by laser diffraction Malvern Mastersizer 2000 (Malvern Industries, Germany).
The extraction of apigenin and other antioxidants were carried out under constant stirring (500 rpm, ARE Heating magnetic stirrer, VELP Scientifica, Italy) with 50:50 (%, v/v) ethanol:water mixture at 25°C, 40°C and 60°C for 90 min. The extraction procedure (solvent to solid ratio, solvent mixture and strirring) was based on the literature to obtain the highest
C A
B
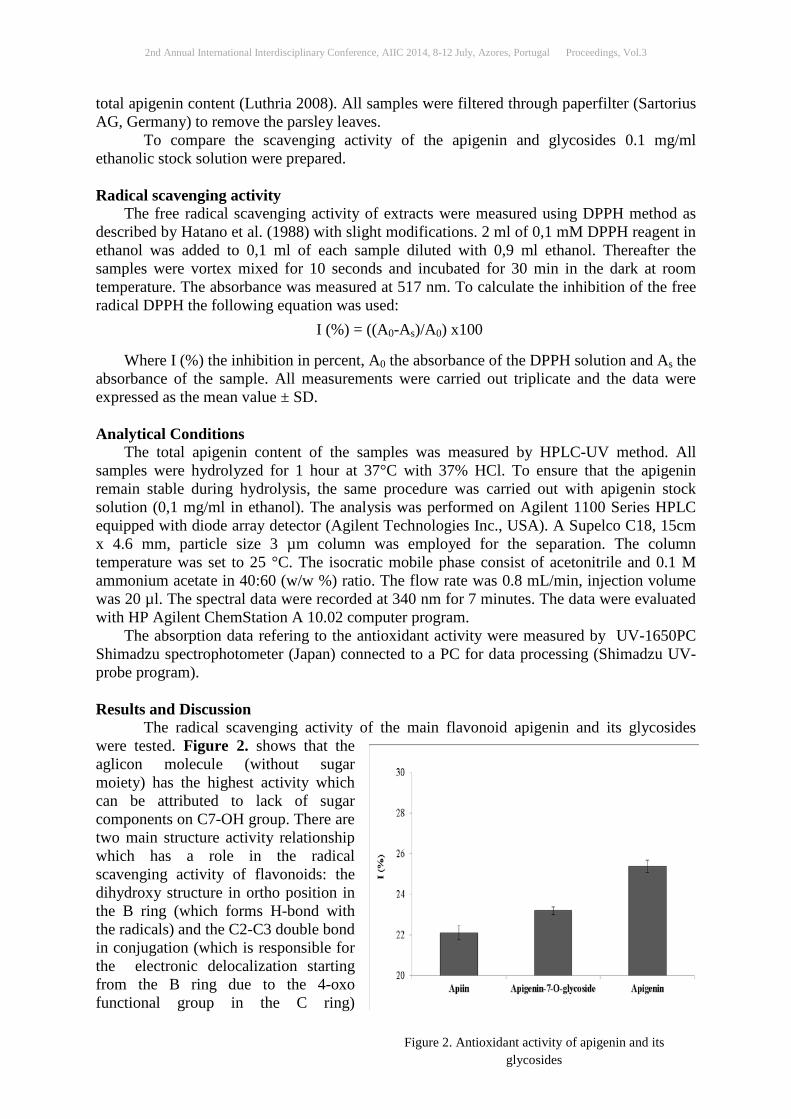
2nd Annual International Interdisciplinary Conference, AIIC 2014, 8-12 July, Azores, Portugal Proceedings, Vol.3
254
total apigenin content (Luthria 2008). All samples were filtered through paperfilter (Sartorius AG, Germany) to remove the parsley leaves.
To compare the scavenging activity of the apigenin and glycosides 0.1 mg/ml ethanolic stock solution were prepared. Radical scavenging activity
The free radical scavenging activity of extracts were measured using DPPH method as described by Hatano et al. (1988) with slight modifications. 2 ml of 0,1 mM DPPH reagent in ethanol was added to 0,1 ml of each sample diluted with 0,9 ml ethanol. Thereafter the samples were vortex mixed for 10 seconds and incubated for 30 min in the dark at room temperature. The absorbance was measured at 517 nm. To calculate the inhibition of the free radical DPPH the following equation was used:
Where I (%) the inhibition in percent, A0 the absorbance of the DPPH solution and As the
absorbance of the sample. All measurements were carried out triplicate and the data were expressed as the mean value ± SD. Analytical Conditions
The total apigenin content of the samples was measured by HPLC-UV method. All samples were hydrolyzed for 1 hour at 37°C with 37% HCl. To ensure that the apigenin remain stable during hydrolysis, the same procedure was carried out with apigenin stock solution (0,1 mg/ml in ethanol). The analysis was performed on Agilent 1100 Series HPLC equipped with diode array detector (Agilent Technologies Inc., USA). A Supelco C18, 15cm x 4.6 mm, particle size 3 µm column was employed for the separation. The column temperature was set to 25 °C. The isocratic mobile phase consist of acetonitrile and 0.1 M ammonium acetate in 40:60 (w/w %) ratio. The flow rate was 0.8 mL/min, injection volume was 20 µl. The spectral data were recorded at 340 nm for 7 minutes. The data were evaluated with HP Agilent ChemStation A 10.02 computer program.
The absorption data refering to the antioxidant activity were measured by UV-1650PC Shimadzu spectrophotometer (Japan) connected to a PC for data processing (Shimadzu UV-probe program). Results and Discussion
The radical scavenging activity of the main flavonoid apigenin and its glycosides were tested. Figure 2. shows that the aglicon molecule (without sugar moiety) has the highest activity which can be attributed to lack of sugar components on C7-OH group. There are two main structure activity relationship which has a role in the radical scavenging activity of flavonoids: the dihydroxy structure in ortho position in the B ring (which forms H-bond with the radicals) and the C2-C3 double bond in conjugation (which is responsible for the electronic delocalization starting from the B ring due to the 4-oxo functional group in the C ring)
I (%) = ((A0-As)/A0) x100
Figure 2. Antioxidant activity of apigenin and its glycosides
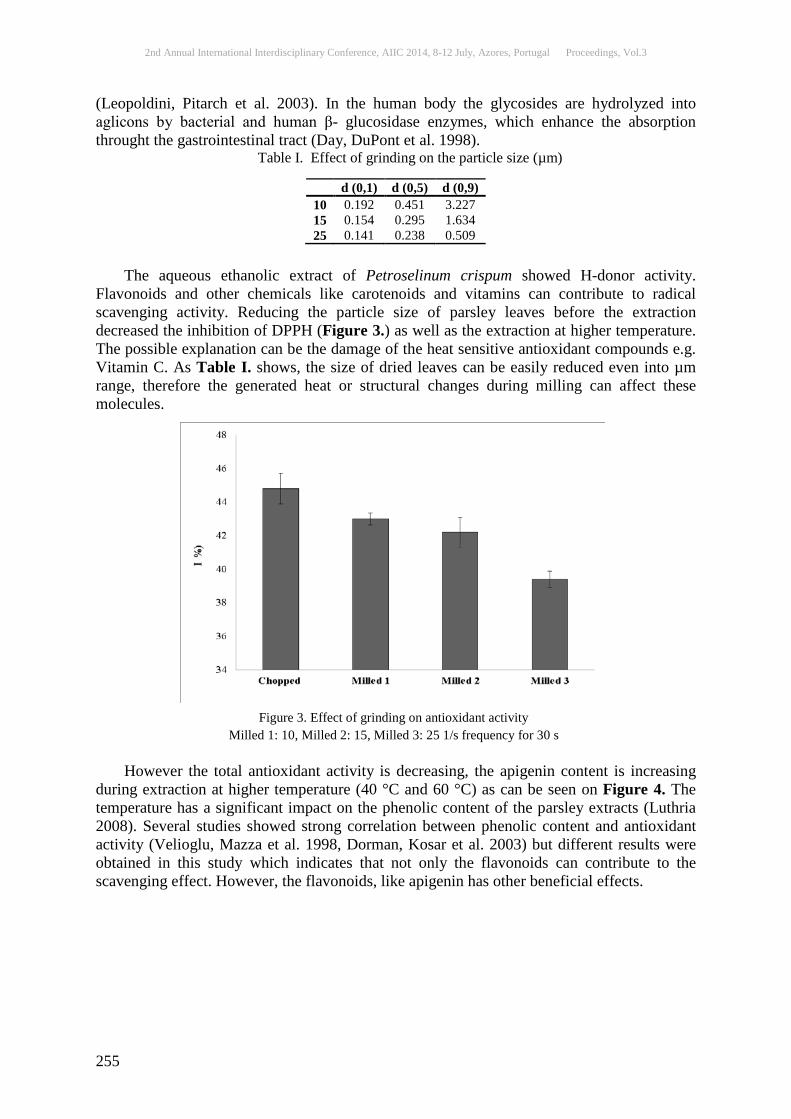
2nd Annual International Interdisciplinary Conference, AIIC 2014, 8-12 July, Azores, Portugal Proceedings, Vol.3
255
(Leopoldini, Pitarch et al. 2003). In the human body the glycosides are hydrolyzed into aglicons by bacterial and human β- glucosidase enzymes, which enhance the absorption throught the gastrointestinal tract (Day, DuPont et al. 1998).
Table I. Effect of grinding on the particle size (µm)
The aqueous ethanolic extract of Petroselinum crispum showed H-donor activity.
Flavonoids and other chemicals like carotenoids and vitamins can contribute to radical scavenging activity. Reducing the particle size of parsley leaves before the extraction decreased the inhibition of DPPH (Figure 3.) as well as the extraction at higher temperature. The possible explanation can be the damage of the heat sensitive antioxidant compounds e.g. Vitamin C. As Table I. shows, the size of dried leaves can be easily reduced even into µm range, therefore the generated heat or structural changes during milling can affect these molecules.
However the total antioxidant activity is decreasing, the apigenin content is increasing
during extraction at higher temperature (40 °C and 60 °C) as can be seen on Figure 4. The temperature has a significant impact on the phenolic content of the parsley extracts (Luthria 2008). Several studies showed strong correlation between phenolic content and antioxidant activity (Velioglu, Mazza et al. 1998, Dorman, Kosar et al. 2003) but different results were obtained in this study which indicates that not only the flavonoids can contribute to the scavenging effect. However, the flavonoids, like apigenin has other beneficial effects.
d (0,1) d (0,5) d (0,9) 10 0.192 0.451 3.227 15 0.154 0.295 1.634 25 0.141 0.238 0.509
Figure 3. Effect of grinding on antioxidant activity Milled 1: 10, Milled 2: 15, Milled 3: 25 1/s frequency for 30 s
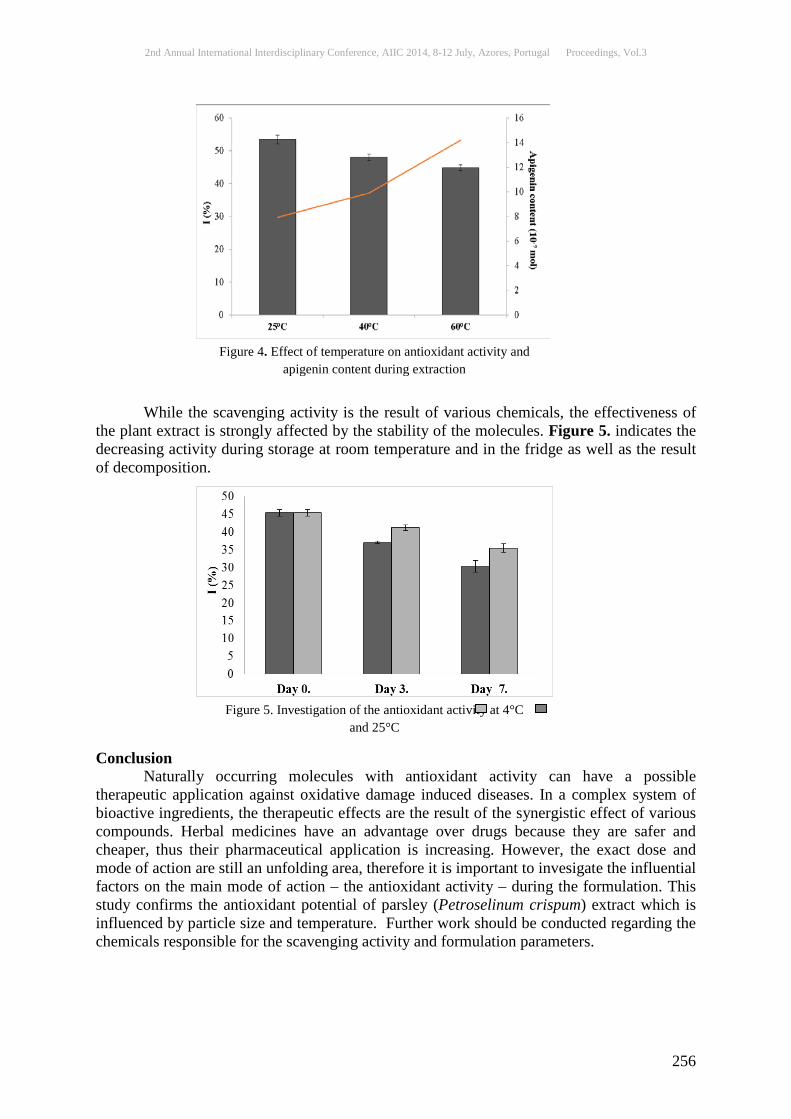
2nd Annual International Interdisciplinary Conference, AIIC 2014, 8-12 July, Azores, Portugal Proceedings, Vol.3
256
While the scavenging activity is the result of various chemicals, the effectiveness of
the plant extract is strongly affected by the stability of the molecules. Figure 5. indicates the decreasing activity during storage at room temperature and in the fridge as well as the result of decomposition. Conclusion
Naturally occurring molecules with antioxidant activity can have a possible therapeutic application against oxidative damage induced diseases. In a complex system of bioactive ingredients, the therapeutic effects are the result of the synergistic effect of various compounds. Herbal medicines have an advantage over drugs because they are safer and cheaper, thus their pharmaceutical application is increasing. However, the exact dose and mode of action are still an unfolding area, therefore it is important to invesigate the influential factors on the main mode of action – the antioxidant activity – during the formulation. This study confirms the antioxidant potential of parsley (Petroselinum crispum) extract which is influenced by particle size and temperature. Further work should be conducted regarding the chemicals responsible for the scavenging activity and formulation parameters.
Figure 4. Effect of temperature on antioxidant activity and apigenin content during extraction
Figure 5. Investigation of the antioxidant activity at 4°C and 25°C

2nd Annual International Interdisciplinary Conference, AIIC 2014, 8-12 July, Azores, Portugal Proceedings, Vol.3
257
References: Chiang, F.-F., H.-M. Wang, Y.-C. Lan, M.-H. Yang, S.-C. Huang and Y.-C. Huang "High homocysteine is associated with increased risk of colorectal cancer independently of oxidative stress and antioxidant capacities." Clinical Nutrition(0). Database, U. (2014, May). "USDA Database for the Flavonoid Content of Selected Foods, Release 3.1." Day, A. J., M. S. DuPont, S. Ridley, M. Rhodes, M. J. Rhodes, M. R. Morgan and G. Williamson (1998). "Deglycosylation of flavonoid and isoflavonoid glycosides by human small intestine and liver beta-glucosidase activity." FEBS Lett 436(1): 71-75. Dorman, H. J., M. Kosar, K. Kahlos, Y. Holm and R. Hiltunen (2003). "Antioxidant properties and composition of aqueous extracts from Mentha species, hybrids, varieties, and cultivars." J Agric Food Chem 51(16): 4563-4569. Fejes, S., A. Blázovics, É. Lemberkovics, G. Petri, É. Szöke and Á. Kéry (2000). "Free radical scavenging and membrane protective effects of methanol extracts fromAnthriscus cerefolium L. (Hoffm.) andPetroselinum crispum (Mill.) Nym. ex A. W. Hill." Phytotherapy Research 14(5): 362-365. Leopoldini, M., I. P. Pitarch, N. Russo and M. Toscano (2003). "Structure, Conformation, and Electronic Properties of Apigenin, Luteolin, and Taxifolin Antioxidants. A First Principle Theoretical Study." The Journal of Physical Chemistry A 108(1): 92-96. Li, H., S. Horke and U. Förstermann (2013). "Oxidative stress in vascular disease and its pharmacological prevention." Trends in Pharmacological Sciences 34(6): 313-319. Luthria, D. L. (2008). "Influence of experimental conditions on the extraction of phenolic compounds from parsley (Petroselinum crispum) flakes using a pressurized liquid extractor." Food Chemistry 107(2): 745-752. Nijveldt, R. J., E. van Nood, D. E. van Hoorn, P. G. Boelens, K. van Norren and P. A. van Leeuwen (2001). "Flavonoids: a review of probable mechanisms of action and potential applications." Am J Clin Nutr 74(4): 418-425. Ray, P. D., B.-W. Huang and Y. Tsuji (2012). "Reactive oxygen species (ROS) homeostasis and redox regulation in cellular signaling." Cellular Signalling 24(5): 981-990. Schaffer, S. W., C. J. Jong and M. Mozaffari (2012). "Role of oxidative stress in diabetes-mediated vascular dysfunction: Unifying hypothesis of diabetes revisited." Vascular Pharmacology 57(5–6): 139-149. Shukla, S. and S. Gupta (2010). "Apigenin: a promising molecule for cancer prevention." Pharm Res 27(6): 962-978. Simonian, N. A. and J. T. Coyle (1996). "Oxidative stress in neurodegenerative diseases." Annu Rev Pharmacol Toxicol 36: 83-106. Thannickal, V. J. and B. L. Fanburg (2000). "Reactive oxygen species in cell signaling." Am J Physiol Lung Cell Mol Physiol 279(6): L1005-1028. Velioglu, Y. S., G. Mazza, L. Gao and B. D. Oomah (1998). "Antioxidant Activity and Total Phenolics in Selected Fruits, Vegetables, and Grain Products." Journal of Agricultural and Food Chemistry 46(10): 4113-4117. Wong, P. Y. Y. and D. D. Kitts (2006). "Studies on the dual antioxidant and antibacterial properties of parsley (Petroselinum crispum) and cilantro (Coriandrum sativum) extracts." Food Chemistry 97(3): 505-515. Yanardag, R., S. Bolkent, A. Tabakoglu-Oguz and O. Ozsoy-Sacan (2003). "Effects of Petroselinum crispum extract on pancreatic B cells and blood glucose of streptozotocin-induced diabetic rats." Biol Pharm Bull 26(8): 1206-1210. Zhang, H., F. Chen, X. Wang and H.-Y. Yao (2006). "Evaluation of antioxidant activity of parsley (Petroselinum crispum) essential oil and identification of its antioxidant constituents." Food Research International 39(8): 833-839.
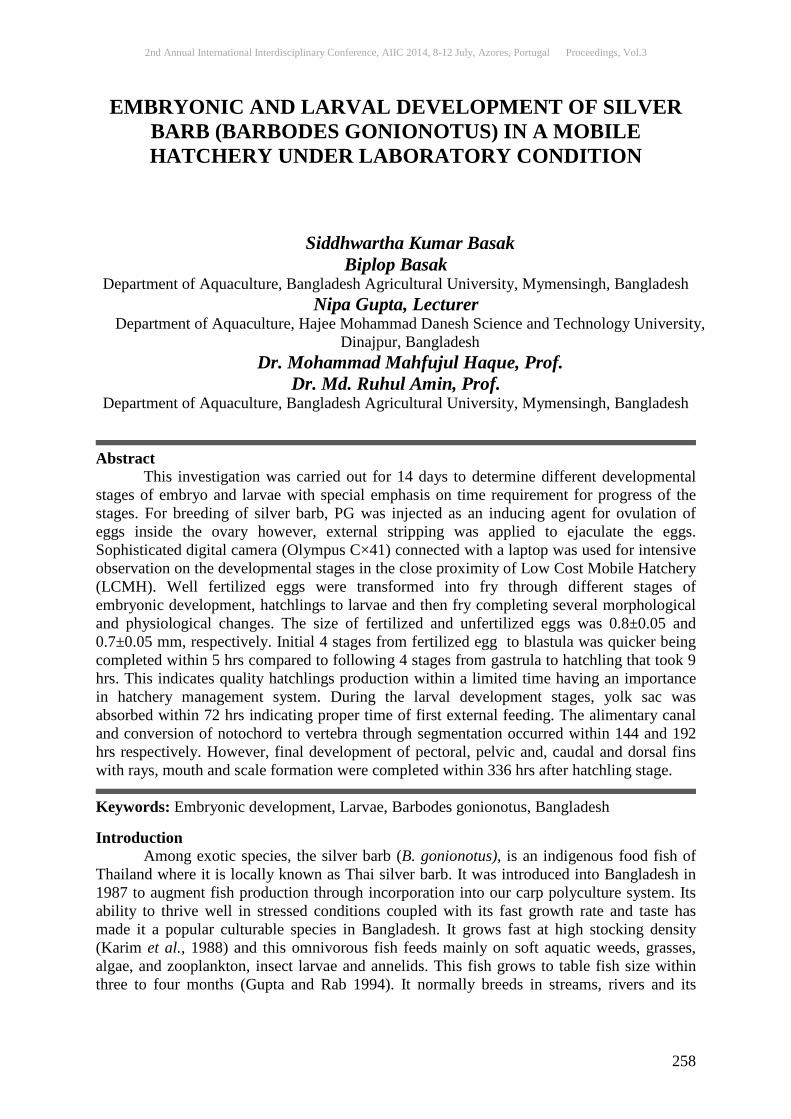
2nd Annual International Interdisciplinary Conference, AIIC 2014, 8-12 July, Azores, Portugal Proceedings, Vol.3
258
EMBRYONIC AND LARVAL DEVELOPMENT OF SILVER BARB (BARBODES GONIONOTUS) IN A MOBILE HATCHERY UNDER LABORATORY CONDITION
Siddhwartha Kumar Basak Biplop Basak
Department of Aquaculture, Bangladesh Agricultural University, Mymensingh, Bangladesh Nipa Gupta, Lecturer
Department of Aquaculture, Hajee Mohammad Danesh Science and Technology University, Dinajpur, Bangladesh
Dr. Mohammad Mahfujul Haque, Prof. Dr. Md. Ruhul Amin, Prof.
Department of Aquaculture, Bangladesh Agricultural University, Mymensingh, Bangladesh
Abstract This investigation was carried out for 14 days to determine different developmental stages of embryo and larvae with special emphasis on time requirement for progress of the stages. For breeding of silver barb, PG was injected as an inducing agent for ovulation of eggs inside the ovary however, external stripping was applied to ejaculate the eggs. Sophisticated digital camera (Olympus C×41) connected with a laptop was used for intensive observation on the developmental stages in the close proximity of Low Cost Mobile Hatchery (LCMH). Well fertilized eggs were transformed into fry through different stages of embryonic development, hatchlings to larvae and then fry completing several morphological and physiological changes. The size of fertilized and unfertilized eggs was 0.8±0.05 and 0.7±0.05 mm, respectively. Initial 4 stages from fertilized egg to blastula was quicker being completed within 5 hrs compared to following 4 stages from gastrula to hatchling that took 9 hrs. This indicates quality hatchlings production within a limited time having an importance in hatchery management system. During the larval development stages, yolk sac was absorbed within 72 hrs indicating proper time of first external feeding. The alimentary canal and conversion of notochord to vertebra through segmentation occurred within 144 and 192 hrs respectively. However, final development of pectoral, pelvic and, caudal and dorsal fins with rays, mouth and scale formation were completed within 336 hrs after hatchling stage.
Keywords: Embryonic development, Larvae, Barbodes gonionotus, Bangladesh Introduction Among exotic species, the silver barb (B. gonionotus), is an indigenous food fish of Thailand where it is locally known as Thai silver barb. It was introduced into Bangladesh in 1987 to augment fish production through incorporation into our carp polyculture system. Its ability to thrive well in stressed conditions coupled with its fast growth rate and taste has made it a popular culturable species in Bangladesh. It grows fast at high stocking density (Karim et al., 1988) and this omnivorous fish feeds mainly on soft aquatic weeds, grasses, algae, and zooplankton, insect larvae and annelids. This fish grows to table fish size within three to four months (Gupta and Rab 1994). It normally breeds in streams, rivers and its
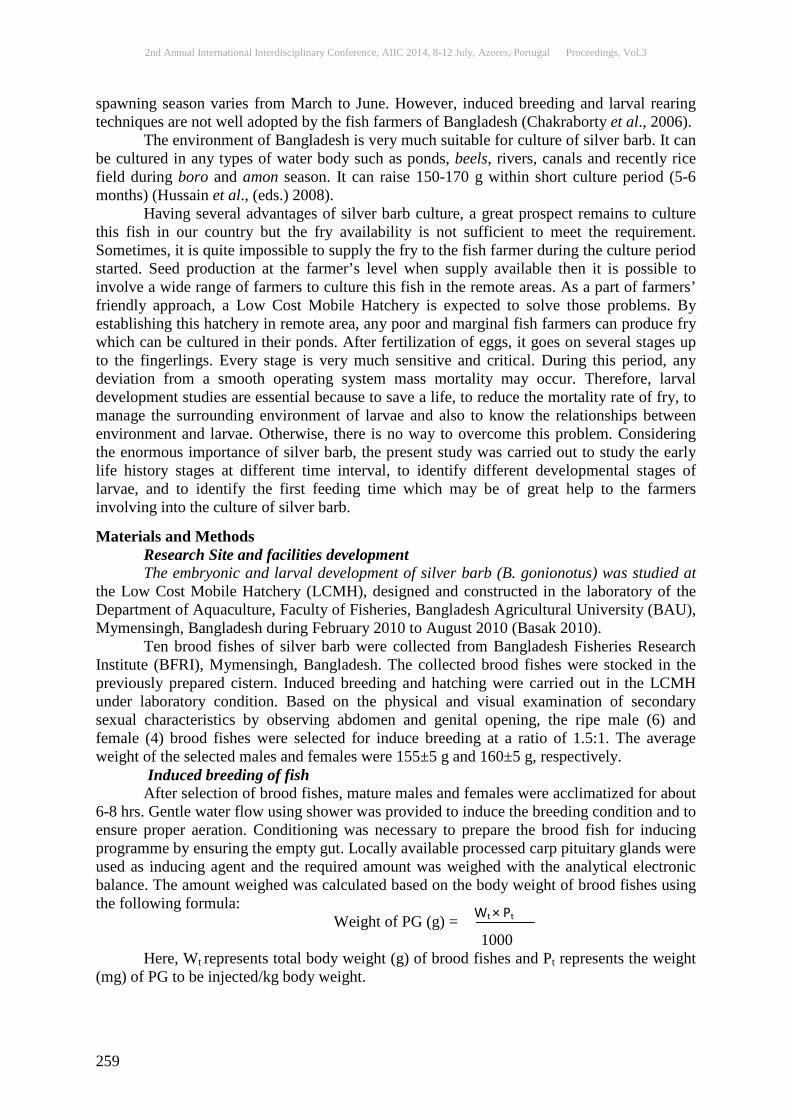
2nd Annual International Interdisciplinary Conference, AIIC 2014, 8-12 July, Azores, Portugal Proceedings, Vol.3
259
spawning season varies from March to June. However, induced breeding and larval rearing techniques are not well adopted by the fish farmers of Bangladesh (Chakraborty et al., 2006). The environment of Bangladesh is very much suitable for culture of silver barb. It can be cultured in any types of water body such as ponds, beels, rivers, canals and recently rice field during boro and amon season. It can raise 150-170 g within short culture period (5-6 months) (Hussain et al., (eds.) 2008). Having several advantages of silver barb culture, a great prospect remains to culture this fish in our country but the fry availability is not sufficient to meet the requirement. Sometimes, it is quite impossible to supply the fry to the fish farmer during the culture period started. Seed production at the farmer’s level when supply available then it is possible to involve a wide range of farmers to culture this fish in the remote areas. As a part of farmers’ friendly approach, a Low Cost Mobile Hatchery is expected to solve those problems. By establishing this hatchery in remote area, any poor and marginal fish farmers can produce fry which can be cultured in their ponds. After fertilization of eggs, it goes on several stages up to the fingerlings. Every stage is very much sensitive and critical. During this period, any deviation from a smooth operating system mass mortality may occur. Therefore, larval development studies are essential because to save a life, to reduce the mortality rate of fry, to manage the surrounding environment of larvae and also to know the relationships between environment and larvae. Otherwise, there is no way to overcome this problem. Considering the enormous importance of silver barb, the present study was carried out to study the early life history stages at different time interval, to identify different developmental stages of larvae, and to identify the first feeding time which may be of great help to the farmers involving into the culture of silver barb.
Materials and Methods Research Site and facilities development The embryonic and larval development of silver barb (B. gonionotus) was studied at the Low Cost Mobile Hatchery (LCMH), designed and constructed in the laboratory of the Department of Aquaculture, Faculty of Fisheries, Bangladesh Agricultural University (BAU), Mymensingh, Bangladesh during February 2010 to August 2010 (Basak 2010). Ten brood fishes of silver barb were collected from Bangladesh Fisheries Research Institute (BFRI), Mymensingh, Bangladesh. The collected brood fishes were stocked in the previously prepared cistern. Induced breeding and hatching were carried out in the LCMH under laboratory condition. Based on the physical and visual examination of secondary sexual characteristics by observing abdomen and genital opening, the ripe male (6) and female (4) brood fishes were selected for induce breeding at a ratio of 1.5:1. The average weight of the selected males and females were 155±5 g and 160±5 g, respectively. Induced breeding of fish After selection of brood fishes, mature males and females were acclimatized for about 6-8 hrs. Gentle water flow using shower was provided to induce the breeding condition and to ensure proper aeration. Conditioning was necessary to prepare the brood fish for inducing programme by ensuring the empty gut. Locally available processed carp pituitary glands were used as inducing agent and the required amount was weighed with the analytical electronic balance. The amount weighed was calculated based on the body weight of brood fishes using the following formula:
Weight of PG (g) = 1000
Here, Wt represents total body weight (g) of brood fishes and Pt represents the weight (mg) of PG to be injected/kg body weight.
Wt × Pt
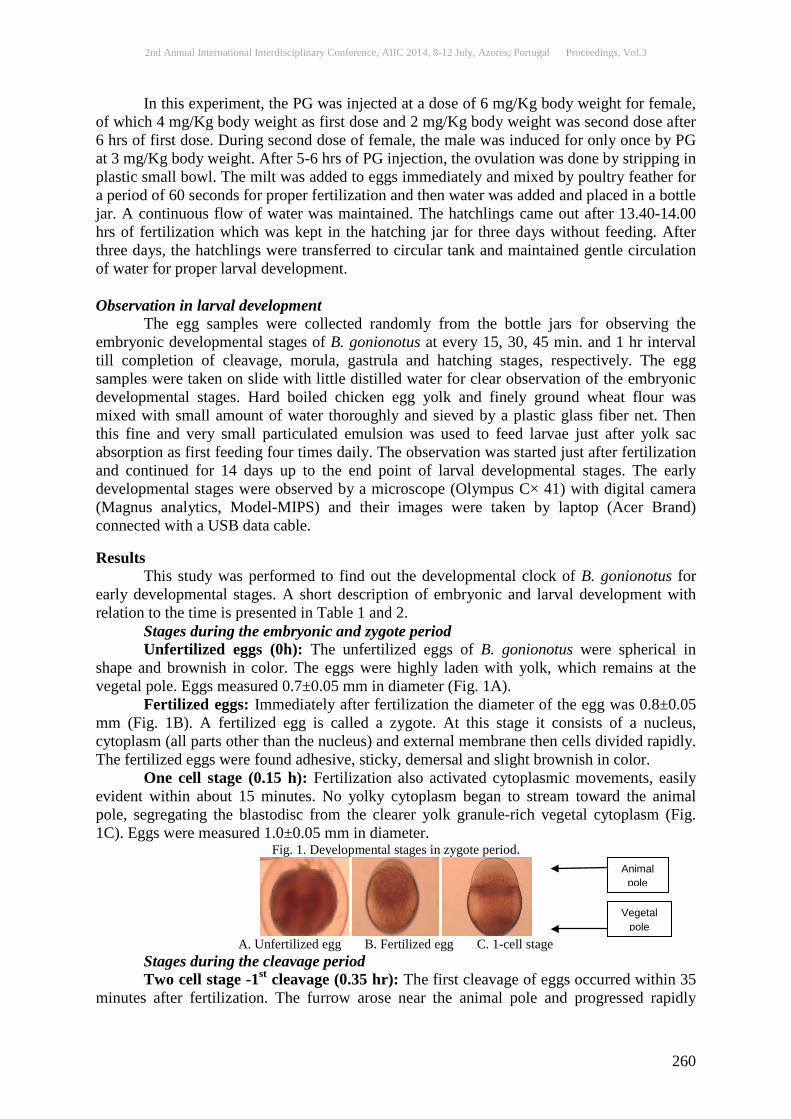
2nd Annual International Interdisciplinary Conference, AIIC 2014, 8-12 July, Azores, Portugal Proceedings, Vol.3
260
In this experiment, the PG was injected at a dose of 6 mg/Kg body weight for female, of which 4 mg/Kg body weight as first dose and 2 mg/Kg body weight was second dose after 6 hrs of first dose. During second dose of female, the male was induced for only once by PG at 3 mg/Kg body weight. After 5-6 hrs of PG injection, the ovulation was done by stripping in plastic small bowl. The milt was added to eggs immediately and mixed by poultry feather for a period of 60 seconds for proper fertilization and then water was added and placed in a bottle jar. A continuous flow of water was maintained. The hatchlings came out after 13.40-14.00 hrs of fertilization which was kept in the hatching jar for three days without feeding. After three days, the hatchlings were transferred to circular tank and maintained gentle circulation of water for proper larval development. Observation in larval development The egg samples were collected randomly from the bottle jars for observing the embryonic developmental stages of B. gonionotus at every 15, 30, 45 min. and 1 hr interval till completion of cleavage, morula, gastrula and hatching stages, respectively. The egg samples were taken on slide with little distilled water for clear observation of the embryonic developmental stages. Hard boiled chicken egg yolk and finely ground wheat flour was mixed with small amount of water thoroughly and sieved by a plastic glass fiber net. Then this fine and very small particulated emulsion was used to feed larvae just after yolk sac absorption as first feeding four times daily. The observation was started just after fertilization and continued for 14 days up to the end point of larval developmental stages. The early developmental stages were observed by a microscope (Olympus C× 41) with digital camera (Magnus analytics, Model-MIPS) and their images were taken by laptop (Acer Brand) connected with a USB data cable. Results This study was performed to find out the developmental clock of B. gonionotus for early developmental stages. A short description of embryonic and larval development with relation to the time is presented in Table 1 and 2. Stages during the embryonic and zygote period Unfertilized eggs (0h): The unfertilized eggs of B. gonionotus were spherical in shape and brownish in color. The eggs were highly laden with yolk, which remains at the vegetal pole. Eggs measured 0.7±0.05 mm in diameter (Fig. 1A). Fertilized eggs: Immediately after fertilization the diameter of the egg was 0.8±0.05 mm (Fig. 1B). A fertilized egg is called a zygote. At this stage it consists of a nucleus, cytoplasm (all parts other than the nucleus) and external membrane then cells divided rapidly. The fertilized eggs were found adhesive, sticky, demersal and slight brownish in color. One cell stage (0.15 h): Fertilization also activated cytoplasmic movements, easily evident within about 15 minutes. No yolky cytoplasm began to stream toward the animal pole, segregating the blastodisc from the clearer yolk granule-rich vegetal cytoplasm (Fig. 1C). Eggs were measured 1.0±0.05 mm in diameter.
Fig. 1. Developmental stages in zygote period.
A. Unfertilized egg B. Fertilized egg C. 1-cell stage
Stages during the cleavage period Two cell stage -1st cleavage (0.35 hr): The first cleavage of eggs occurred within 35 minutes after fertilization. The furrow arose near the animal pole and progressed rapidly
Animal pole
Vegetal pole

2nd Annual International Interdisciplinary Conference, AIIC 2014, 8-12 July, Azores, Portugal Proceedings, Vol.3
261
toward the vegetal pole, passing only through the blastodisc but not the yolky region of the egg. The blastodisc was divided into 2 distinct equal size cells by vertical cleavage (Fig. 2A). Eggs were measured 1.1±0.05 mm in diameter. Four cell stage-2nd cleavage (0.50 hr): Four cells stage was observed within 50 minutes. Hence, cycle 3 begins with four blastomeres in a 2 × 2 array. The diameter of the egg was 1.3±0.05 mm (Fig. 2B). Eight cell stage-3rd cleavage (1.00 hr): This stage was observed within 1.00 hr. Cleavages ending cycle 3, still incomplete, occur in two separate planes, parallel to the first one, and on either side of it. They cut the blastodisc into a 2 × 4 array of blastomeres (Fig. 2C). The diameter of the egg was 1.5±0.05 mm. Sixteen cell stage-4th cleavage (1.20-1.40 hrs): The fourth cleavage i.e. sixteen cells stage was observed within 1.20-1.40 hrs. The egg diameter was 1.7±0.05 mm (Fig. 2D). The fourth set of cleavages also occurred along two planes, parallel to and on either side of the second one, and produces 4 × 4 array of cells. Thirty-two cell stage-5th cleavage (2.00 hrs): The thirty-two cell stage was observed within 2.00 hrs. Frequently the 32 blastomeres of this stage were present in 4 × 8 array. The egg diameter was 1.8±0.05 mm (Fig. 2E).
Fig. 2. Developmental stages at cleavage stage.
A. 2-cell B. 4-cell C. 8-cell D. 16-cell E. 32-cell Stages during the morula period Early morula-64 cell stage (2.20-2.30 hrs): The blastomeres were decreased in size and the morula stage was reached between 2.20-2.30 hrs. At this stage the crown of the blastoderm started to cover about the yolk in the form of a thin layer. Eggs were measured 2.0±0.05 mm in diameter (Fig. 3A). Late morula-128-256 cell stage (3.00-3.30 hrs): The blastodermal cells (128-256 blastomeres) were smaller than those of the previous stage and the number of marginal cells was increased. This stage called late morula stage was observed between 3.00-3.30 hrs. The egg diameter was 2.1±0.05 mm (Fig. 3B-C).
Fig. 3. Developmental stages at morula stage.
A. 64-cell stage B. 128-cell stage C. 256-cell stage Stages during the blastula period High stage (4.00 hrs): The blastoderm was still high (thick) as in the late morula stage, although its inner cells were smaller. The blastodisc was migrated in the direction of the vegetal pole to envelop the major part of the yolk. The egg diameter was 2.1±0.05 mm (Fig. 4A). This stage was observed within 4.00 hrs. Sphere stage (4.20 hrs): Continued shortening along the animal-vegetal axis and approximately spherical shape. In this stage some blastomeres was begun to cleave asynchronously and to migrate several rows of periblast nuclei were visible around the blastoderm. The egg diameter was 2.2±0.05 mm (Fig. 4B). This stage was recorded within 4.20 hrs. Dome formation (4.35-4.45 hrs): This stage was recorded within 4.35-4.45 hrs. The blastoderm was flattened down onto the yolk sphere resulting a dome shape structure (Fig.

2nd Annual International Interdisciplinary Conference, AIIC 2014, 8-12 July, Azores, Portugal Proceedings, Vol.3
262
4C). The egg diameter was observed at 2.3±0.05 mm. This prominent and rapidly occurring change in the interface between the yolk cell and the blastodisc represented the first sure sign that epiboly was began. In this stage, the cell layers were slightly thicker on one side. 30%-epiboly formation (5.00 hrs): Epiboly, including doming of the yolk cell, produced a blastoderm, nearly uniform thickness. The embryonic shield was arisen as a thickened margin of the blastoderm at 30% of the entire distance between the animal and vegetal poles (Fig. 4D). The egg diameter was observed at 2.3±0.05 mm. This stage was recorded within 5.00 hrs.
Fig. 4. Devel opmental stages during blastula period.
A. High stage B. Sphere stage C. Dome formation D. 30%-epiboly Stages during the gastrula period 50%-epiboly stage (5.20 hrs): Epiboly displaced the blastoderm margin to 50% of the distance between the animal and vegetal pole (Fig. 5A). At this 50%-epiboly stage radial intercalations have produced a blastoderm that was very uniform in thickness. The egg diameter was 2.4±0.05 mm at 28.0°C. This stage was recorded within 5.20 hrs. Germ ring formation (5.30 hrs): The germ ring appeared nearly uniform in structure around the entire circumference of the blastoderm. The yolk cell remained about half covered by the blastoderm (Fig. 5B). The middle of the embryonic shield projecting into the germ ring area. It was measured 2.4±0.05 mm. This stage was observed within 5.30 hrs. Shield stage (6.00 hrs): The embryonic shield became more clearly visible as a narrow steak. An animal polar view most easily revealed the embryonic shield, as well as the germ ring. Epiboly exists at 50% until late shield stage, when the yolk cell could be judged to be more than half covered by the blastoderm (Fig. 5C). It was measured 2.4±0.05 mm. This stage was observed within 6.00 hrs. 75%-epiboly stage (6.15-6.25 hrs): As epiboly continued the shape of the embryo itself became more along the animal-vegetal axis (Fig. 5D). A side view showed that the blastoderm was thinner than elsewhere on the ventral side, above the margin. This stage was observed within 6.15-6.25 hrs. The egg diameter was 2.5±0.05 mm. 90%-epiboly stage (6.30 hrs): This stage was observed within 6.30 hrs. In this stage, the yolk sphere was nearly covered (90% of the yolk) by thin blastoderm leaving small area around the vegetal pole (yolk plug) exposed (Fig. 5E). The earliest post-mitotic cells were present, including cells that will form the notochord, axial somite-derived muscles and specific neurons in the hindbrain. The egg diameter was 2.5±0.05 mm. Bud formation (6.40 hrs): Epiboly came to a close as the blastoderm completely covered the yolk plug, defining 100%-epiboly. The brain and nerve cord was developed as a solid rod of cells in this stage. Along the dorsal side, anterior to the tail bud, the neural plate is now thickened along the entire embryonic axis; its more posterior cells would contribute to trunk spinal cord (Fig. 5F). The egg diameter was 2.5±0.05 mm at 28.5°C. This stage was observed within 6.40 hrs.
Fig. 5. Developmental stages in gastrula period.
A. 50%-epiboly B. germ ring C. Shield stage
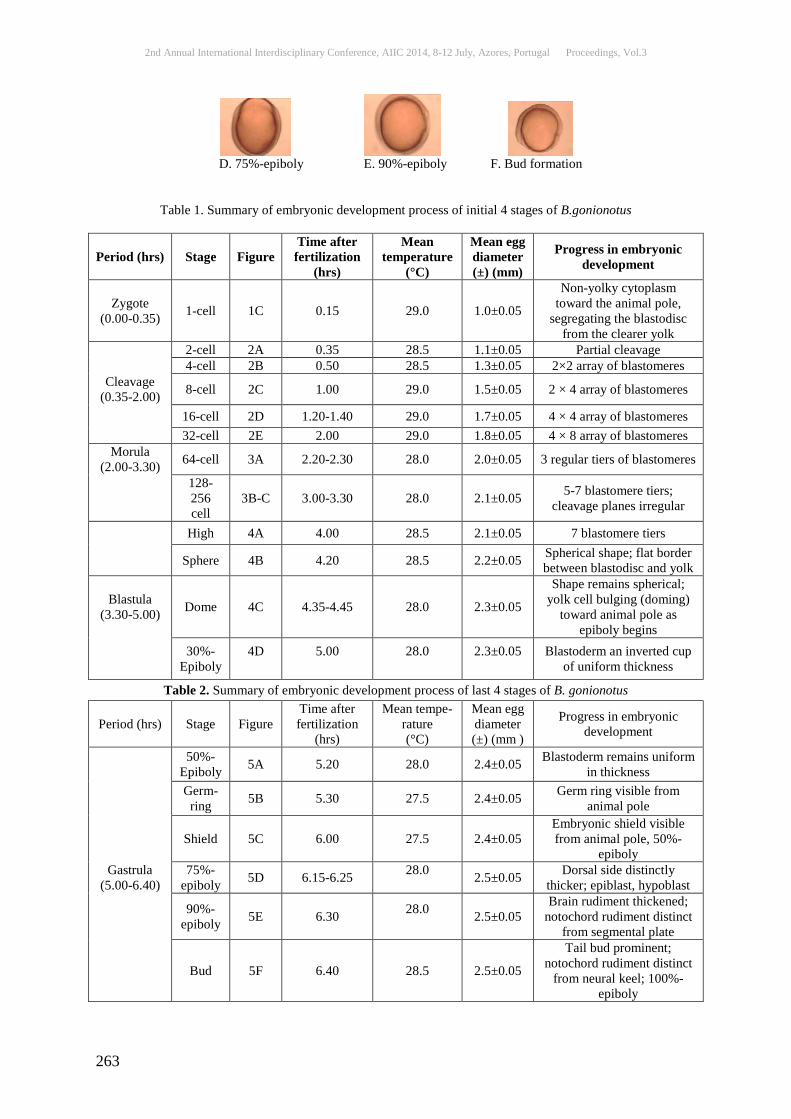
2nd Annual International Interdisciplinary Conference, AIIC 2014, 8-12 July, Azores, Portugal Proceedings, Vol.3
263
D. 75%-epiboly E. 90%-epiboly F. Bud formation
Table 1. Summary of embryonic development process of initial 4 stages of B.gonionotus
Period (hrs) Stage Figure Time after fertilization
(hrs)
Mean temperature
(°C)
Mean egg diameter (±) (mm)
Progress in embryonic development
Zygote (0.00-0.35) 1-cell 1C 0.15 29.0 1.0±0.05
Non-yolky cytoplasm toward the animal pole,
segregating the blastodisc from the clearer yolk
2-cell 2A 0.35 28.5 1.1±0.05 Partial cleavage 4-cell 2B 0.50 28.5 1.3±0.05 2×2 array of blastomeres
Cleavage (0.35-2.00) 8-cell 2C 1.00 29.0 1.5±0.05 2 × 4 array of blastomeres
16-cell 2D 1.20-1.40 29.0 1.7±0.05 4 × 4 array of blastomeres 32-cell 2E 2.00 29.0 1.8±0.05 4 × 8 array of blastomeres
Morula (2.00-3.30) 64-cell 3A 2.20-2.30 28.0 2.0±0.05 3 regular tiers of blastomeres
128-256 cell
3B-C 3.00-3.30 28.0 2.1±0.05 5-7 blastomere tiers; cleavage planes irregular
High 4A 4.00 28.5 2.1±0.05 7 blastomere tiers Sphere 4B 4.20 28.5 2.2±0.05 Spherical shape; flat border
between blastodisc and yolk
Blastula (3.30-5.00) Dome 4C 4.35-4.45 28.0 2.3±0.05
Shape remains spherical; yolk cell bulging (doming)
toward animal pole as epiboly begins
30%- Epiboly
4D
5.00
28.0
2.3±0.05
Blastoderm an inverted cup of uniform thickness
Table 2. Summary of embryonic development process of last 4 stages of B. gonionotus
Period (hrs) Stage Figure Time after fertilization
(hrs)
Mean tempe-rature (°C)
Mean egg diameter (±) (mm )
Progress in embryonic development
50%- Epiboly 5A 5.20 28.0 2.4±0.05 Blastoderm remains uniform
in thickness
Germ-ring 5B 5.30 27.5 2.4±0.05 Germ ring visible from
animal pole
Shield 5C 6.00 27.5 2.4±0.05 Embryonic shield visible from animal pole, 50%-
epiboly Gastrula
(5.00-6.40) 75%-
epiboly 5D 6.15-6.25 28.0 2.5±0.05 Dorsal side distinctly
thicker; epiblast, hypoblast
90%- epiboly 5E 6.30 28.0
2.5±0.05 Brain rudiment thickened;
notochord rudiment distinct from segmental plate
Bud 5F 6.40 28.5 2.5±0.05
Tail bud prominent; notochord rudiment distinct
from neural keel; 100%-epiboly

2nd Annual International Interdisciplinary Conference, AIIC 2014, 8-12 July, Azores, Portugal Proceedings, Vol.3
264
1-2 somite 6A 7.00 28.5 2.6±0.05 First somite furrow
5-9 somite 6B-C 7.30 28.5
2.6±0.05 Brain and vesicle formation, appearance of heart tubular
Segmenta- tion
(6.40-10.00)
10-14 somite 6D-E 8.15-8.30 29.0 2.7±0.05
Tail rudiment begins subdivisions of the brain
spherical optic lenses
15-19 somite 6F 8.30-8.50 29.0 2.7±0.05
Vitello-caudal vein were still incomplete, blood was pumped from the heart
20+ Somite 6G 9.30-10.00
29.5
2.8±0.05
Start of heart beating, pectoral fin buds, otocysts
and gill rudiment
Prim-5 7A 11.00-11.15 29.5 2.9±0.05
Heart is visible as a cone- shaped, pericardial sac,
notochord was completely to the end of
the tail
Prim-15 7B 11.45-12.00 29.5 2.9±0.05 Blood circulation pectoral,
pelvic fins, head and the viscera duct
Pharyngula (10.00-13.10)
Prim-25 7C 12.30-12.45 30.0 3.0±0.05 The development of heart
and formation of the pericardial cavity
High-pec 7D 13.00-13.10 30.0 3.0±0.05
Spleen was recognized. Developed caudal fin rays,
gall bladder. Both eyes were moved actively at same time
along with movement of mouth and pectoral fins
Hatchling (13.10-14.00)
Long-pec 8 13.40-14.00 30.5 3.1±0.05
Hatchling was started. Twisting movement and separated from the yolk
mass. The embryos ruptured the egg shell by the
continuous movement Stages during the segmentation period One-two somite stage (7.00 hrs): The first somatic furrow formed usually after both completion of epiboly and the initial appearance of the tail bud (Fig. 6A). This furrow marked the boundary between what would become the first and second somites. The egg diameter was 2.6±0.05 mm. This stage was observed within 7.00 hrs. Five-nine somite stage (7.30 hrs): These stages were recorded within 7.30 hrs. The brain primordium has now distinctively thickened into the neural keel and beginning at the five-nine somite stage one can first distinguish the optic primordium from a side view. In nine somatic stages, tubular heart was appeared underneath the head from the posterior end of the mid-brain to the anterior end of the hind-brain (Fig. 6B-C). Neural keel formation occurred in the anterior trunk between the six-nine somite stages. The egg diameter was 2.6±0.05 mm. Ten-fourteen somite stage (8.15-8.30 hrs): In 12 somite stage, a pair of semi-circular blood vessels and the vitello-caudal vein were begun to form on the yolk sphere. At the end of these stages, spherical optic lenses were prominent (Fig. 6D-E). These stages were observed within 8.15-8.30 hrs. It was measured 2.7±0.05 mm.

2nd Annual International Interdisciplinary Conference, AIIC 2014, 8-12 July, Azores, Portugal Proceedings, Vol.3
265
Fifteen-nineteen somite stage (8.30-8.50 hrs): Semi-circular blood vessels and vitello-caudal vein were still incomplete at the beginning of the stage. Blood circulation began and blood was pumped from the heart. In 19 somite stage, the tail bud now began to protrude away from the body of the embryo (Fig. 6F). It was measured 2.7±0.05 mm. This stage was seen within 8.30-8.50 hrs.
Fig. 6. Developmental stages in segmentation period.
A. 2-somite stage B. 6-somite stage C. 8-somite stage D. 10-somite stage
E. 14-somite stage F. 18-somite stage G. 25-somite stage
Above 20-somite stage (9.30-10.00 hrs): Pectoral fin was appeared and membranous fins were also seen in the tail region. The head and tail end of the embryo were differentiated. The beating heart was visible. Pectoral fin buds, otocysts and gill rudiment appeared one by one (Fig. 6G). Blood circulation was seen in the gill arches. It was measured 2.8±0.05 mm. This stage was seen within 9.30-10.00 hrs. Stages during the pharyngula period Prim-5 stage (11.00-11.15 hrs): At the prim-5 stage, the heart was visible as a cone-shaped tube deep to the brain, seemingly more dorsal than its later location and prominently occupying a pericardial sac on the anterior region of the yolk. Distinct kidneys were laid in contact with bilateral sides of the notochord in the first somite. Notochord was completely reached the end of the tail (Fig. 7A). This stage was observed within 11.00-11.15 hrs. It was measured 2.9±0.05 mm. Prim-15 stage (11.45-12.00 hrs): The caudal fin had several melanophores and developed the eye. Blood circulation was appeared in pectoral and pelvic fins, which was frequently moved. Blood circulation was begun through the internal tissues of the head and the viscera duct (Fig.7B). It was measured 2.9±0.05 mm. Prim-25 stage (12.30-12.45 hrs): These stages were recorded within 12.30-12.45 hrs. It was measured 3.0±0.05 mm. At this stage, the development of heart and formation of the pericardial cavity occurred. Pericardial cavity (cardiac sac) surrounding the heart was easily observed (Fig. 7C). High-pec stage (13.00-13.10 hrs): At the high-pec stage, the spleen was recognized as a small reddish globule and the tail was extended beyond the otic vesicle and the rudiments of the caudal fin rays could be seen within the round membranous. A large well-developed gall bladder could be identified by its yellow or yellowish brown tint. Both eyes were moved actively at same time along with movement of mouth and pectoral fins (Fig. 7D). These stages were recorded within 13.00-13.10 hrs. It was measured 3.0±0.05 mm
Fig. 7. Developmental stages in pharyngula period.
A. Prim-5 stage B. Prim-15 stage C. Prim-25 stage D. High-pec stage

2nd Annual International Interdisciplinary Conference, AIIC 2014, 8-12 July, Azores, Portugal Proceedings, Vol.3
266
Stage during the hatchling period Hatching was started from 13.40 and completed within 14.00 hrs after fertilization. This stage is called long-pec stage. In this stage, the tail gradually becomes separated from the yolk mass. Embryo started occasional twisting movement. The pectoral fin buds were quite elongated. The vigorous beat of the heart was easily showed. The embryo ruptured the egg shell by the continuous movement. After hatching, the internal wall of the swim bladder was expanded remarkably and then cells of the hatching gland had disappeared. The heart was prominent, beating strongly and full of circulating blood (Fig. 8). It was measured 3.1±0.05 mm.
Fig. 8. Long- pec stage in hatching period.
Larval and post larval development The monitoring of larval development process of B. gonionotus at different stages was given below: Newly post hatching larvae (14.00 hrs): Newly hatched larvae were slender, transparent, straight and tapering to the tail. At this stage of development they have no swim bladder, mouth opening or vent. They breathe by absorbing oxygen through the fine blood capillaries that surround the yolk sac, which were still attached to the gut (Fig. 9A). The mean length of hatchling was 2.2±0.05 mm. Six hours old larvae (20.00 hrs): Melanophores were prominent on head. The brain was clearly visible. Prominent notochord was found. Two chromatophores were present on the front side of the body (Fig. 9B). Optic lobe was slightly formed. The length of larvae measured averagely 2.5±0.05 mm. Twelve hours old larvae (26.00 hrs): Vertical melanophore bands became very prominent. Chromatophores were seen in the eye only and increased in number. The pectoral fin bud and mouth cleft had formed. Some melanophore observed on the head region (Fig. 9C). The average length of larvae was measured to be 2.9±0.05 mm. One day old larvae (38.00 hrs): After one day, the hatchlings showed free movement and operculum appeared but did not extend over gills. Dark eyes pigmented and myomeres were partially visible. Pectoral, anal fold and air bladder were become prominent and also distinct. The supply of yolk was diminished gradually and the snout was protruded in front of the yolk mass (Fig. 9D). At this stage, the average length of the larvae was 3.2±0.05 mm. Two days old larvae (62.00 hrs): Opercula fold was appeared at this stage. The yolk sac was gradually reduced at the anterior region. A few black chromatophores were visible of the caudal fin. The nearly alimentary canal was distinct. The brain formation was completed. The heartbeat was at the rate of 145-150/min. At the end of the second day mouth was fully formed. The alimentary canal became well develops. Air bladder was round, small and silvery white in color. Pelvic fin was visible (Fig. 9E). At this stage, the average length of the larvae was 3.4±0.05 mm. Three days old larvae (86.00 hrs): At this stage, the average length of the larvae was 3.6±0.05 mm. After 3 days of hatching, the yolk sac was completely absorbed and the larvae started exogenous feeding and was fed with supplementary feed of previously prepare egg yolk emulsion as first feeding. The mouth gap was quite large. The larva was silver-blackish in color (Fig. 9F).
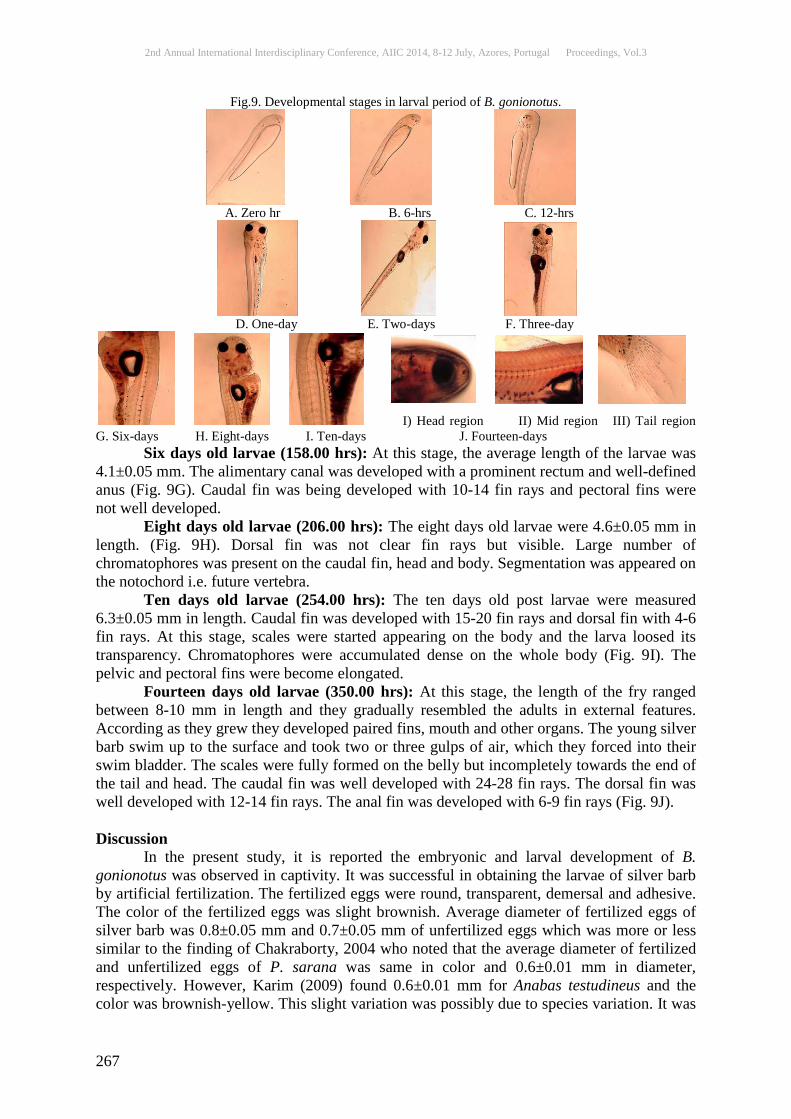
2nd Annual International Interdisciplinary Conference, AIIC 2014, 8-12 July, Azores, Portugal Proceedings, Vol.3
267
Fig.9. Developmental stages in larval period of B. gonionotus.
A. Zero hr B. 6-hrs C. 12-hrs
D. One-day E. Two-days F. Three-day
I) Head region II) Mid region III) Tail region G. Six-days H. Eight-days I. Ten-days J. Fourteen-days Six days old larvae (158.00 hrs): At this stage, the average length of the larvae was 4.1±0.05 mm. The alimentary canal was developed with a prominent rectum and well-defined anus (Fig. 9G). Caudal fin was being developed with 10-14 fin rays and pectoral fins were not well developed. Eight days old larvae (206.00 hrs): The eight days old larvae were 4.6±0.05 mm in length. (Fig. 9H). Dorsal fin was not clear fin rays but visible. Large number of chromatophores was present on the caudal fin, head and body. Segmentation was appeared on the notochord i.e. future vertebra. Ten days old larvae (254.00 hrs): The ten days old post larvae were measured 6.3±0.05 mm in length. Caudal fin was developed with 15-20 fin rays and dorsal fin with 4-6 fin rays. At this stage, scales were started appearing on the body and the larva loosed its transparency. Chromatophores were accumulated dense on the whole body (Fig. 9I). The pelvic and pectoral fins were become elongated. Fourteen days old larvae (350.00 hrs): At this stage, the length of the fry ranged between 8-10 mm in length and they gradually resembled the adults in external features. According as they grew they developed paired fins, mouth and other organs. The young silver barb swim up to the surface and took two or three gulps of air, which they forced into their swim bladder. The scales were fully formed on the belly but incompletely towards the end of the tail and head. The caudal fin was well developed with 24-28 fin rays. The dorsal fin was well developed with 12-14 fin rays. The anal fin was developed with 6-9 fin rays (Fig. 9J). Discussion In the present study, it is reported the embryonic and larval development of B. gonionotus was observed in captivity. It was successful in obtaining the larvae of silver barb by artificial fertilization. The fertilized eggs were round, transparent, demersal and adhesive. The color of the fertilized eggs was slight brownish. Average diameter of fertilized eggs of silver barb was 0.8±0.05 mm and 0.7±0.05 mm of unfertilized eggs which was more or less similar to the finding of Chakraborty, 2004 who noted that the average diameter of fertilized and unfertilized eggs of P. sarana was same in color and 0.6±0.01 mm in diameter, respectively. However, Karim (2009) found 0.6±0.01 mm for Anabas testudineus and the color was brownish-yellow. This slight variation was possibly due to species variation. It was
2nd Annual International Interdisciplinary Conference, AIIC 2014, 8-12 July, Azores, Portugal Proceedings, Vol.3
268
found that the average diameter of eggs immediately after fertilization was increased from 0.7±0.05 to 0.8±0.05 mm. While according to Chakraborty (2004), the diameter of eggs of P. sarana was increased from 0.6±0.01 to 0.8±0.01 mm, whereas Chakraborty and Murty (1972) reported that the diameter of eggs of L. rohita ranged between 4.1 to 4.8 mm with an average 4.4 mm. The two-cell stage, four-cell stage, eight-cell stage and sixteen-cell stage and multiple (64) cell stage of B. gonionotus were observed within 0.35, 0.50, 1.00, 1.20-1.40, 2.20-2.30 hrs after fertilization, respectively where Chakraborty (2004), were found within 0.35, 0.45, 1.10, 1.35, 2.15 hrs after fertilization, respectively in case of P. sarana which has similarity with the finding of the present experiment. Mookerjee (1945) also found the similar results in the case of L. rohita. Morula stage was found 2.0-3.3 hrs after fertilization. According to Chakraborty (2004) observed the same stage at 4 hrs after fertilization in the case of P. sarana, whereas Mookerjee (1945) observed the same stage at 5.45 hrs after fertilization in the case of L. rohita. This variation was due to the temperature and species. The gastrula stage was found in B. gonionotus 5.00 to 6.40 hrs after fertilization at a water temperature of 28.0°C. Chakraborty (2004) observed gastrulation at 8.0 to 10.40 hrs after fertilization of egg at the temperature of 27.0±0.02°C in P. sarana. The present study revealed that heart beat was observed at 9.30-10.00 hrs after fertilization, whereas Chakraborty (2004) observed the same at 14.00-15.30 hrs in case of P. sarana. In the present experiment, optic bud and pericardial cavity formation were observed at 6.40 and 12.30-12.45 hrs after fertilization, respectively. Whereas Galman and Avtalion (1989) observed the same stage at 52 and 65 hrs in the case of O. niloticus. This variation might be due to the species differences. The hatching period in B. gonionotus was found from 13.20 to 14.00 hrs after fertilization at a water temperature of 30.5°C. Chakraborty (2004) observed that the hatching period in P. sarana at 18.00 to 20.00 hrs after fertilization. The development of embryo and hatching time in fertilized egg of most of the fishes are generally influenced by the temperature of water (Jhingran, 1983). This variation might be due to the species difference. The length of the newly hatched larvae of B. gonionotus was found to be 2.2±0.05 mm. But Chakraborty (2004) found that the length of newly hatched larvae of P. sarana to be 2.4±0.05 mm which has close similarity with the present findings. In larval stage, after hatching the development of pectoral fin bud of B. gonionotus appeared at 12 hrs which was similar to P. sarana (Chakraborty, 2004) and Cirrhinus mrigala (Khan, 1943). At larval stage, operculum appeared 24 hrs after hatching but did not extend over gills, pectoral fin was prominent and air bladder was visible which were similar to P. sarana (Chakraborty, 2004) and Cirrhinus mrigala (Khan, 1943). The yolk sac of the silver barb was completely disappeared 72 hrs after hatching at a water temperature of 30.5°C, whereas Chakraborty (2004) found these developments in P. sarana within 66 hrs and Chakraborty and Murty (1972) found same developments in C. mrigala within 72 hrs which has the similarity with the findings of this experiment. The larvae started feeding before completion of yolk sac absorption. The same phenomena of starting external feeding keeping apart of internal food in the yolk sac were reported by Das (1995) for Carassius auratus larvae. The timing of starting first feeding have evolutionary values and depends on the availability of the natural food. The synchronized activity of dependable community in nature is important. The rate of larval development of the larvae varied from one species to another. This variation is thought to be temperature dependent, the higher the temperature the quicker were the development (Hoar and Randal, 1969). The embryonic and larval developments of B. gonionotus were studied at an ambient temperature of 27.5 to 30.5°C. Considering all the facts and findings of the present experiment, the present work provided information’s on the early developmental stages of B.

2nd Annual International Interdisciplinary Conference, AIIC 2014, 8-12 July, Azores, Portugal Proceedings, Vol.3
269
gonionotus. Basically the present work generated some information on the early life history, developmental stages and commencement of first feeding time for larval rearing. This study helped to enrich the knowledge of breeding techniques of silver barb at a mobile hatchery level, which may contribute to production of quality fish seed at the farmers’ level. Conclusion The present work generated some information on the early life history, developmental stages and commencement of first feeding time for larval rearing. This study would help the hatchery operators in understanding the breeding biology of that fish which may have contribution in further development of aquaculture at farmers’ level by transferring of that technology. The knowledge generated from this study could be suggested at the hatchery operator’s level through an action research. Thus the productivity of a hatchery could be increased. Acknowledgement The authors are grateful to Bangladesh Agricultural University, Mymensingh, Bangladesh for logistic and infrastructural support. Thanks are also due to their respective teachers Dr. Mohammad Mahfujul Haque, Dr. Md. Ruhul Amin and Dr. Mohammad Harunur Rashid, Bangladesh Agricultural University, Mymensingh, Bangladesh for providing necessary facilities, continuous support and encouragement. References: Basak, B. 2010. Design and construction of a low cost mobile hatchery: an understanding on technical and economic efficiency. MS Thesis. Department of Aquaculture, Bangladesh Agricultural University, Mymensingh, Bangladesh. 50 pp. Chakraborty, B.K. 2004. Studies on the artificial propagation, larval rearing and culture of local sarpunti (Puntius sarana). PhD Thesis. Department of Fisheries Management, Bangladesh Agricultural University, Mymensingh. 321 pp. Chakraborty, B.K., M.I. Miah, M.J.A. Mirja and M.A.B. 2006. Habib. Induction of gynogenesis in endangered sarpunti, Puntius sarana (Hamilton) and evidence for female homogamety. Aquaculture; 258: 312-320. Chakraborty, R.D. and D.S. Murty. 1972. Life history of Indian major carps Cirrhinus Mrigala (Hamilton), Catla catla (Hamilton) and Labeo rohita (Hamilton). J. Inland Fish. Soc., India, 4: 132-161. Das, M. 1995. The energetic of stress tolerance in the early life stages of the gold fish,Carassius auratus L. PhD Thesis. Institute of Aquaculture, University of Stirling, Scotland, UK. 210 pp. Galman, O.R. and R.R. Avtalion. 1989. Further study of the embryonic development of Oreochromis niloticus (Cichidae, Teleostei) using scanning electron microscopy. J. Fish. Biol., 1989; 34: 653-664. Gupta, M.V. and A. Rab. 1994. Adoption and economics of silver barb (Puntius gonionotus) culture in seasonal waters in Bangladesh. Published by ICLARM, Metro Manila, Philippines, with financial assistance from USAID, Baridhara, Dhaka, Bangladesh. Hoar, W.S. and D.J. Randal. 1969. Fish physiology, Vol. III, Accademic Press, New York, USA, 485 pp. Hussain et al., (eds.) 2008. A guide book on aquaculture technologies. Bangladesh Fisheries Research Institute, Ministry of Fisheries & Livestock. 96 pp. Jhingran, V.G. 1983. Fish and Fisheries of India. Hindustan Publicating corporation, New Delhi. 666 pp.

2nd Annual International Interdisciplinary Conference, AIIC 2014, 8-12 July, Azores, Portugal Proceedings, Vol.3
270
Karim, K.A.T.A., S. Dewan and M.G. Hossain. 1988. Length weight relationship and condition factor of Puntius gonionotus (Bleeker). Bangladesh J. Aquaculture, 10: 49-54. Karim, M.R. 2009. Embryonic and larval development of climbing perch (Anabas testudineus) bred in captivity. MS Thesis. Department of Fisheries Management, Bangladesh Agricultural University, Mymensingh. 57 pp. Khan, H. 1943. On the breeding habit and development of an Indian carp, Cirrhinus mrigala (Hamilton). Proceedings of the Indian Academy of Science, 18B (1): 1-13. Mookerjee, H.K. 1945 Life history of some major carps of Bengal. Sci. Cult.,10 (9): 400-402.
2nd Annual International Interdisciplinary Conference, AIIC 2014, 8-12 July, Azores, Portugal Proceedings, Vol.3
271
COMPARATIVE TREND ANALYSIS IN COST OF PADDY CULTIVATION AND PROFITABILITY ACROSS THREE
STATES OF INDIA
Chandra Guptha B., B.Sc., PDM Agronomist, M.S.Swaminathan Research Foundation, Chennai, Tamil Nadu, India
Prabhakaran T. Raghu, M.Sc. Senior Economist, M.S.Swaminathan Research Foundation, Chennai, Tamil Nadu, India
Aditi N., M.A. Research Intern, M.S.Swaminathan Research Foundation, Chennai, Tamil Nadu, India
Kalaiselvan N.N., M.Sc. Research Economist, M.S.Swaminathan Research Foundation, Chennai, Tamil Nadu, India
Arivudai Nambi V., Ph.D. Director, Biodiversity, M.S.Swaminathan Research Foundation, Chennai, Tamil Nadu, India
Abstract Agriculture has seen tremendous changes in the past century, with agricultural research investments paving the way for productivity gains leading to reduction in production costs and capacity to carter larger population. The contribution of agriculture to the GDP is on the decline and so does profitability. Farmer suicides were not a common phenomenon in India before 1990, but more than two lakh farmers committed suicides between 1990 and 2010. The underlying causes for failure in agriculture could be many including climate change, reduction in profitability and fragmentation of land. This article explores the trends in the cost of cultivation of paddy and its profitability in three Indian states of Kerala, Odisha and Tamil Nadu during the period 1999-2011. It is observed that the factors like hired machine and human labor, fertilizer, are all growing in varying proportions leading to an increase in the cost of cultivation. In the years showing profits, Profitability seemed to be averaging around ten percent and while in most of the years loss was reported. Over the years, the increase in cost of cultivation seems to be stable in contrast with the increase in value of paddy produced by farmers. The APM project has appropriately addressed issues of increasing cost of manures through introduction of vermicomposting. Other appropriate techniques and technologies have also been demonstrated for increased profitability. Efforts need to be taken to create an enabling environment to ensure a commensurate income to farmers for a dignified life.
Keywords: Indian Agriculture, Profitability, Cost of Cultivation, Value of Produce, Paddy Introduction Agriculture in the past century has seen many changes (Kropff et al., 2013). It has fed billions of people which seemed impossible earlier. This has been possible through investment in agricultural research and development (R&D), creating an enabling environment for extension, large scale technology adoption by farmers, immense production and good distribution of the produce. Indian agriculture has achieved tremendous growth in production and productivity of crops. Tyagi (2012) classifies agriculture in India into eras based on a historical perspective as: i) Pre independence – era of famines between 1900 to
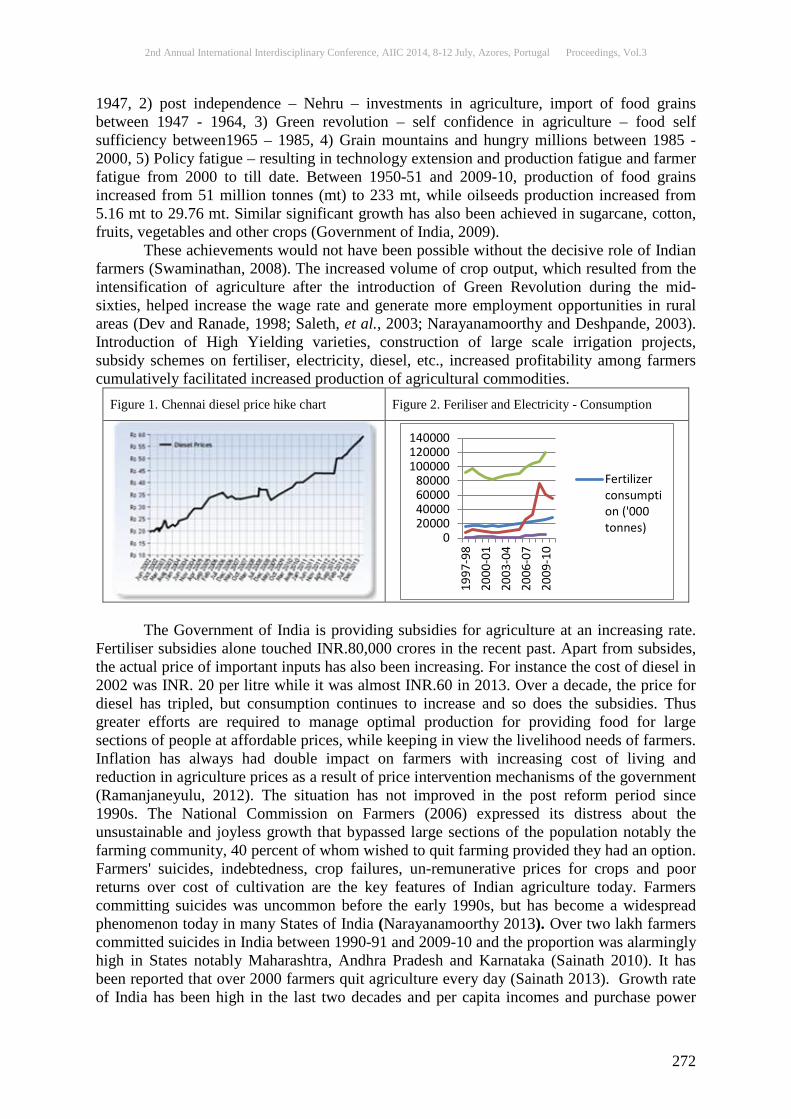
2nd Annual International Interdisciplinary Conference, AIIC 2014, 8-12 July, Azores, Portugal Proceedings, Vol.3
272
1947, 2) post independence – Nehru – investments in agriculture, import of food grains between 1947 - 1964, 3) Green revolution – self confidence in agriculture – food self sufficiency between1965 – 1985, 4) Grain mountains and hungry millions between 1985 - 2000, 5) Policy fatigue – resulting in technology extension and production fatigue and farmer fatigue from 2000 to till date. Between 1950-51 and 2009-10, production of food grains increased from 51 million tonnes (mt) to 233 mt, while oilseeds production increased from 5.16 mt to 29.76 mt. Similar significant growth has also been achieved in sugarcane, cotton, fruits, vegetables and other crops (Government of India, 2009). These achievements would not have been possible without the decisive role of Indian farmers (Swaminathan, 2008). The increased volume of crop output, which resulted from the intensification of agriculture after the introduction of Green Revolution during the mid-sixties, helped increase the wage rate and generate more employment opportunities in rural areas (Dev and Ranade, 1998; Saleth, et al., 2003; Narayanamoorthy and Deshpande, 2003). Introduction of High Yielding varieties, construction of large scale irrigation projects, subsidy schemes on fertiliser, electricity, diesel, etc., increased profitability among farmers cumulatively facilitated increased production of agricultural commodities.
Figure 1. Chennai diesel price hike chart Figure 2. Feriliser and Electricity - Consumption
The Government of India is providing subsidies for agriculture at an increasing rate. Fertiliser subsidies alone touched INR.80,000 crores in the recent past. Apart from subsides, the actual price of important inputs has also been increasing. For instance the cost of diesel in 2002 was INR. 20 per litre while it was almost INR.60 in 2013. Over a decade, the price for diesel has tripled, but consumption continues to increase and so does the subsidies. Thus greater efforts are required to manage optimal production for providing food for large sections of people at affordable prices, while keeping in view the livelihood needs of farmers. Inflation has always had double impact on farmers with increasing cost of living and reduction in agriculture prices as a result of price intervention mechanisms of the government (Ramanjaneyulu, 2012). The situation has not improved in the post reform period since 1990s. The National Commission on Farmers (2006) expressed its distress about the unsustainable and joyless growth that bypassed large sections of the population notably the farming community, 40 percent of whom wished to quit farming provided they had an option. Farmers' suicides, indebtedness, crop failures, un-remunerative prices for crops and poor returns over cost of cultivation are the key features of Indian agriculture today. Farmers committing suicides was uncommon before the early 1990s, but has become a widespread phenomenon today in many States of India (Narayanamoorthy 2013). Over two lakh farmers committed suicides in India between 1990-91 and 2009-10 and the proportion was alarmingly high in States notably Maharashtra, Andhra Pradesh and Karnataka (Sainath 2010). It has been reported that over 2000 farmers quit agriculture every day (Sainath 2013). Growth rate of India has been high in the last two decades and per capita incomes and purchase power
020000400006000080000
100000120000140000
1997
-98
2000
-01
2003
-04
2006
-07
2009
-10
Fertilizerconsumption ('000tonnes)
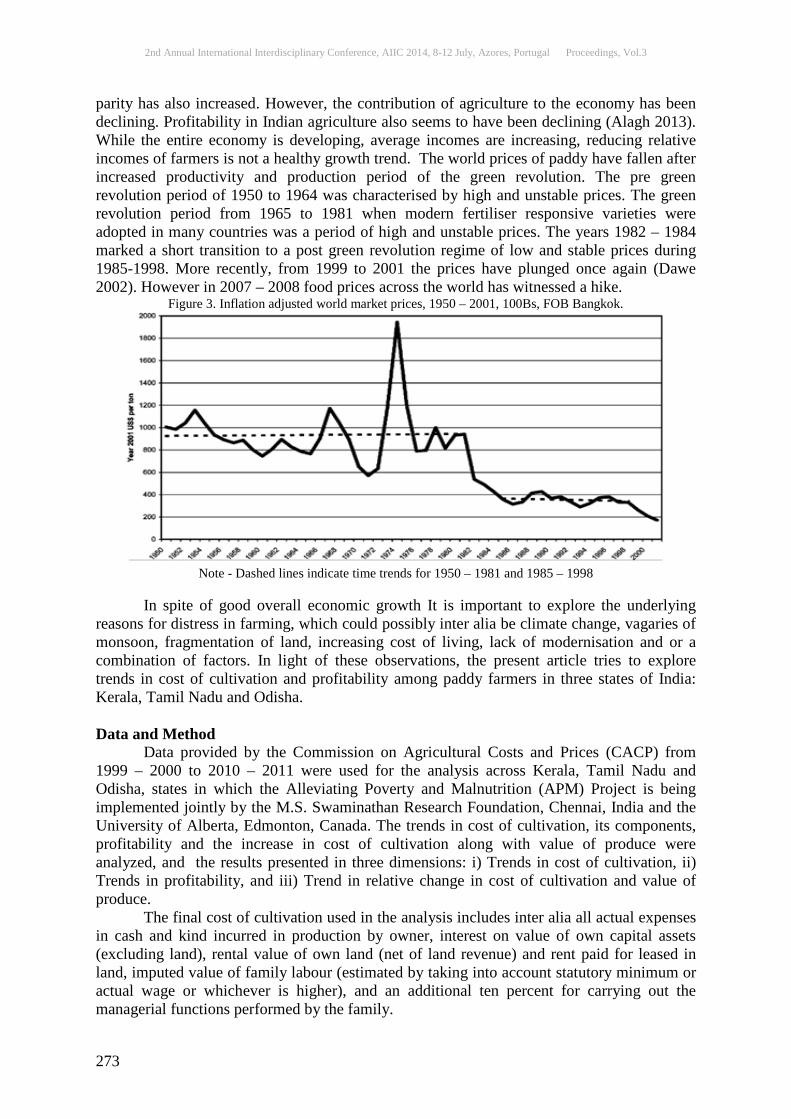
2nd Annual International Interdisciplinary Conference, AIIC 2014, 8-12 July, Azores, Portugal Proceedings, Vol.3
273
parity has also increased. However, the contribution of agriculture to the economy has been declining. Profitability in Indian agriculture also seems to have been declining (Alagh 2013). While the entire economy is developing, average incomes are increasing, reducing relative incomes of farmers is not a healthy growth trend. The world prices of paddy have fallen after increased productivity and production period of the green revolution. The pre green revolution period of 1950 to 1964 was characterised by high and unstable prices. The green revolution period from 1965 to 1981 when modern fertiliser responsive varieties were adopted in many countries was a period of high and unstable prices. The years 1982 – 1984 marked a short transition to a post green revolution regime of low and stable prices during 1985-1998. More recently, from 1999 to 2001 the prices have plunged once again (Dawe 2002). However in 2007 – 2008 food prices across the world has witnessed a hike.
Figure 3. Inflation adjusted world market prices, 1950 – 2001, 100Bs, FOB Bangkok.
Note - Dashed lines indicate time trends for 1950 – 1981 and 1985 – 1998
In spite of good overall economic growth It is important to explore the underlying reasons for distress in farming, which could possibly inter alia be climate change, vagaries of monsoon, fragmentation of land, increasing cost of living, lack of modernisation and or a combination of factors. In light of these observations, the present article tries to explore trends in cost of cultivation and profitability among paddy farmers in three states of India: Kerala, Tamil Nadu and Odisha. Data and Method Data provided by the Commission on Agricultural Costs and Prices (CACP) from 1999 – 2000 to 2010 – 2011 were used for the analysis across Kerala, Tamil Nadu and Odisha, states in which the Alleviating Poverty and Malnutrition (APM) Project is being implemented jointly by the M.S. Swaminathan Research Foundation, Chennai, India and the University of Alberta, Edmonton, Canada. The trends in cost of cultivation, its components, profitability and the increase in cost of cultivation along with value of produce were analyzed, and the results presented in three dimensions: i) Trends in cost of cultivation, ii) Trends in profitability, and iii) Trend in relative change in cost of cultivation and value of produce. The final cost of cultivation used in the analysis includes inter alia all actual expenses in cash and kind incurred in production by owner, interest on value of own capital assets (excluding land), rental value of own land (net of land revenue) and rent paid for leased in land, imputed value of family labour (estimated by taking into account statutory minimum or actual wage or whichever is higher), and an additional ten percent for carrying out the managerial functions performed by the family.
2nd Annual International Interdisciplinary Conference, AIIC 2014, 8-12 July, Azores, Portugal Proceedings, Vol.3
274
In order to analyze the trends in the cost of cultivation, the major contributing factors notably hired human labour, hired machine labour, fertilizer, manure, insecticides and interest on working capital were identified. These major contributing factors were compared to the cost of cultivation in terms of (i) actual values and changes over the years and (ii) percentage to cost of cultivation. Profitability was analyzed as percentage of profit or loss made over the cost by the formula: [{(Value of Produce/ Cost of Cultivation)-1}*100]. In order to compare the increase in cost of cultivation and value of produce, the percentage change of both were calculated across the years. Relative change in increase in value of produce in comparison to cost of cultivation was calculated using the formula: (Percentage (%) change in value of produce over previous year) – (Percentage (%) change in cost of cultivation over previous year) Baseline crop production data generated by the APM project field level surveys were compared with State Level average. In addition, field level yield data on agronomic trials in paddy in project sites were also compared with state averages. For purposes of smoothening abnormal values in data has been excluded from the analysis. Result and Discussion Trends in cost of cultivation across three states of India Cost of Cultivation (CC): Trend in CC for three states of Kerala, Odisha and Tamil Nadu during the period 1999 – 2000 to 2010 – 11 indicate that hired human labor, hired machine labor, fertilizer, seeds, pesticides, interest on working capital are the major contributing factors among others to CC. It is lowest in Odisha and highest in Kerala, and has been increasing over the period. Excepting the years 2001and 2003 for the state of Odisha, CC has increased over the previous years’ CC across the three states in all other years. The increase in CC over previous years averaged at INR.2055, INR.1570 and INR.2162 per hectare (all INR. values mentioned represent per hectare unless otherwise mentioned) for Kerala, Odisha and Tamil Nadu respectively (KOTR). The highest increase was observed in the year 2010 at INR.7389 for Tamil Nadu and the least increase was observed in at INR.24 for Odisha in 2005. CC increased by a factor of 1.85, 2.04 and 1.74 for Kerala, Odisha and Tamil Nadu respectively during the period. The overall trend indicates that CC would continue to increase consistently in all the three states. Hired Human Labour : Trend in cost on hired human labour indicate that it has largely increased over the years, The increase in cost for hired human labour averaged at INR.350, INR.435 and INR.394 for Kerala, Odisha and Tamil Nadu respectively. The maximum increase over previous year was recorded for Tamil Nadu during the year 2011 by INR.1864, while the least increase recorded for Odisha in 2006 by INR.4. An example of maximum reduction was seen for Kerala during the year 2006 by INR. 539. Excepting, 2001, 2002, 2005, 2006, 2009 for Kerala and 2003, 2004, 2005 for Tamil Nadu, all other years have shown an increase in cost for hired human labour over previous year. Cost on hired human labour increased by a factor of 1.33, 2.87 and 1.67 for Kerala, Odisha and Tamil Nadu respectively. The percentage contribution of cost on hired human labour to CC has reduced from 43% in 2000 to 31% in 2011 for Kerala, and has increased from 15% in 2000 to 22% in 2011 for Odisha and has relatively been constant at around 20% for Tamil Nadu. Hired Machine Labour: Trend in cost on hired machine labour indicate that it has predominantly increased over the previous years, however there are instances where the cost incurred for hired labour has reduced over previous year. The increase in cost for hired machine labour averaged at INR.618, INR.59 and INR.428 for KOTR. The maximum increase over previous year was recorded for Kerala in the year 2009 by INR.2656, while least increase was recorded for Odisha in 2008 by INR.4 and maximum reduction was in Tamil Nadu for the year 2001 by INR.162. Excepting, 2003, 2005, 2008 for Kerala, 2002,
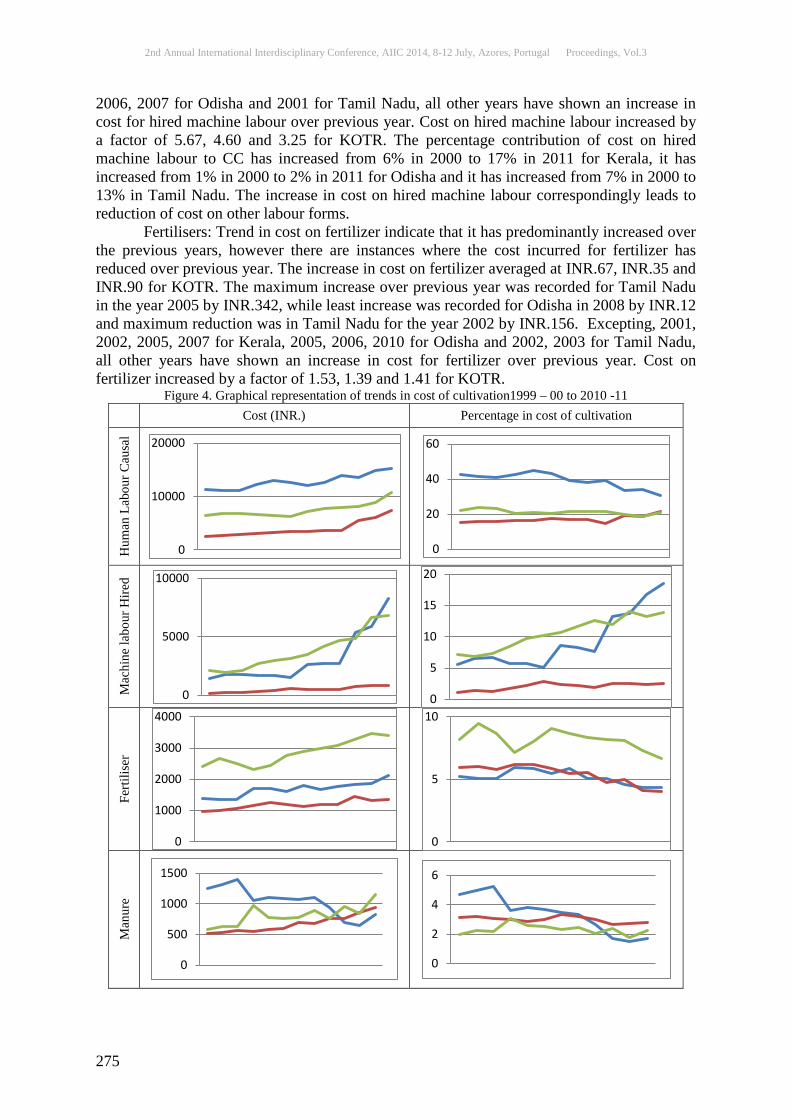
2nd Annual International Interdisciplinary Conference, AIIC 2014, 8-12 July, Azores, Portugal Proceedings, Vol.3
275
2006, 2007 for Odisha and 2001 for Tamil Nadu, all other years have shown an increase in cost for hired machine labour over previous year. Cost on hired machine labour increased by a factor of 5.67, 4.60 and 3.25 for KOTR. The percentage contribution of cost on hired machine labour to CC has increased from 6% in 2000 to 17% in 2011 for Kerala, it has increased from 1% in 2000 to 2% in 2011 for Odisha and it has increased from 7% in 2000 to 13% in Tamil Nadu. The increase in cost on hired machine labour correspondingly leads to reduction of cost on other labour forms. Fertilisers: Trend in cost on fertilizer indicate that it has predominantly increased over the previous years, however there are instances where the cost incurred for fertilizer has reduced over previous year. The increase in cost on fertilizer averaged at INR.67, INR.35 and INR.90 for KOTR. The maximum increase over previous year was recorded for Tamil Nadu in the year 2005 by INR.342, while least increase was recorded for Odisha in 2008 by INR.12 and maximum reduction was in Tamil Nadu for the year 2002 by INR.156. Excepting, 2001, 2002, 2005, 2007 for Kerala, 2005, 2006, 2010 for Odisha and 2002, 2003 for Tamil Nadu, all other years have shown an increase in cost for fertilizer over previous year. Cost on fertilizer increased by a factor of 1.53, 1.39 and 1.41 for KOTR.
Figure 4. Graphical representation of trends in cost of cultivation1999 – 00 to 2010 -11
Cost (INR.) Percentage in cost of cultivation
Hum
an L
abou
r Cau
sal
Mac
hine
labo
ur H
ired
Ferti
liser
Man
ure
0
10000
20000
0
20
40
60
0
5000
10000
0
5
10
15
20
0
1000
2000
3000
4000
0
5
10
0
500
1000
1500
0
2
4
6
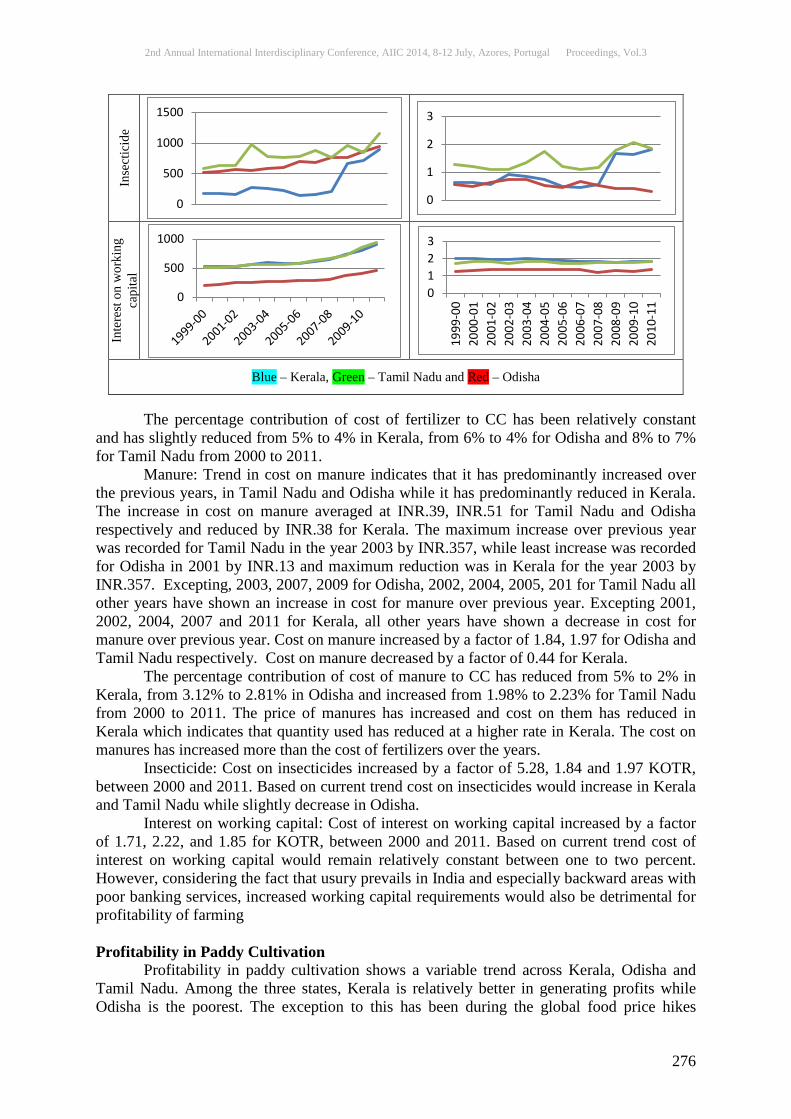
2nd Annual International Interdisciplinary Conference, AIIC 2014, 8-12 July, Azores, Portugal Proceedings, Vol.3
276
Inse
ctic
ide
Inte
rest
on
wor
king
ca
pita
l
Blue – Kerala, Green – Tamil Nadu and Red – Odisha
The percentage contribution of cost of fertilizer to CC has been relatively constant and has slightly reduced from 5% to 4% in Kerala, from 6% to 4% for Odisha and 8% to 7% for Tamil Nadu from 2000 to 2011. Manure: Trend in cost on manure indicates that it has predominantly increased over the previous years, in Tamil Nadu and Odisha while it has predominantly reduced in Kerala. The increase in cost on manure averaged at INR.39, INR.51 for Tamil Nadu and Odisha respectively and reduced by INR.38 for Kerala. The maximum increase over previous year was recorded for Tamil Nadu in the year 2003 by INR.357, while least increase was recorded for Odisha in 2001 by INR.13 and maximum reduction was in Kerala for the year 2003 by INR.357. Excepting, 2003, 2007, 2009 for Odisha, 2002, 2004, 2005, 201 for Tamil Nadu all other years have shown an increase in cost for manure over previous year. Excepting 2001, 2002, 2004, 2007 and 2011 for Kerala, all other years have shown a decrease in cost for manure over previous year. Cost on manure increased by a factor of 1.84, 1.97 for Odisha and Tamil Nadu respectively. Cost on manure decreased by a factor of 0.44 for Kerala. The percentage contribution of cost of manure to CC has reduced from 5% to 2% in Kerala, from 3.12% to 2.81% in Odisha and increased from 1.98% to 2.23% for Tamil Nadu from 2000 to 2011. The price of manures has increased and cost on them has reduced in Kerala which indicates that quantity used has reduced at a higher rate in Kerala. The cost on manures has increased more than the cost of fertilizers over the years. Insecticide: Cost on insecticides increased by a factor of 5.28, 1.84 and 1.97 KOTR, between 2000 and 2011. Based on current trend cost on insecticides would increase in Kerala and Tamil Nadu while slightly decrease in Odisha. Interest on working capital: Cost of interest on working capital increased by a factor of 1.71, 2.22, and 1.85 for KOTR, between 2000 and 2011. Based on current trend cost of interest on working capital would remain relatively constant between one to two percent. However, considering the fact that usury prevails in India and especially backward areas with poor banking services, increased working capital requirements would also be detrimental for profitability of farming Profitability in Paddy Cultivation Profitability in paddy cultivation shows a variable trend across Kerala, Odisha and Tamil Nadu. Among the three states, Kerala is relatively better in generating profits while Odisha is the poorest. The exception to this has been during the global food price hikes
0
500
1000
1500
0
1
2
3
0
500
1000
0123
1999
-00
2000
-01
2001
-02
2002
-03
2003
-04
2004
-05
2005
-06
2006
-07
2007
-08
2008
-09
2009
-10
2010
-11
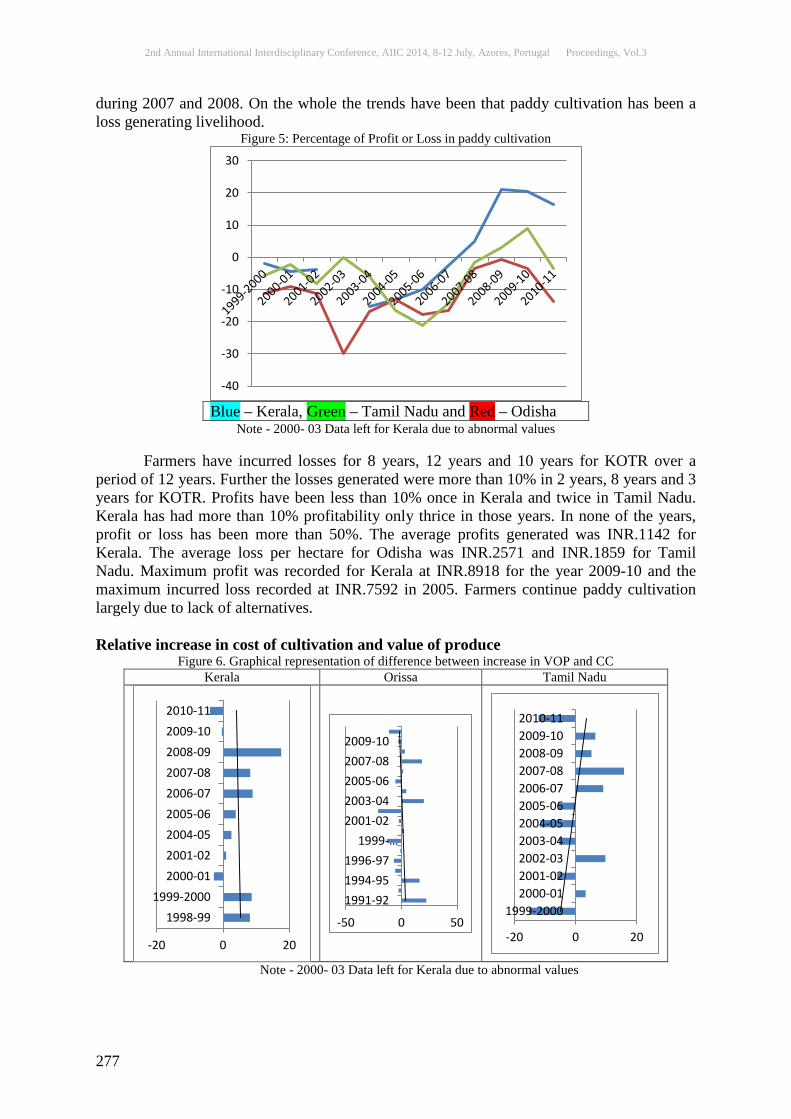
2nd Annual International Interdisciplinary Conference, AIIC 2014, 8-12 July, Azores, Portugal Proceedings, Vol.3
277
during 2007 and 2008. On the whole the trends have been that paddy cultivation has been a loss generating livelihood.
Figure 5: Percentage of Profit or Loss in paddy cultivation
Blue – Kerala, Green – Tamil Nadu and Red – Odisha
Note - 2000- 03 Data left for Kerala due to abnormal values Farmers have incurred losses for 8 years, 12 years and 10 years for KOTR over a period of 12 years. Further the losses generated were more than 10% in 2 years, 8 years and 3 years for KOTR. Profits have been less than 10% once in Kerala and twice in Tamil Nadu. Kerala has had more than 10% profitability only thrice in those years. In none of the years, profit or loss has been more than 50%. The average profits generated was INR.1142 for Kerala. The average loss per hectare for Odisha was INR.2571 and INR.1859 for Tamil Nadu. Maximum profit was recorded for Kerala at INR.8918 for the year 2009-10 and the maximum incurred loss recorded at INR.7592 in 2005. Farmers continue paddy cultivation largely due to lack of alternatives. Relative increase in cost of cultivation and value of produce
Figure 6. Graphical representation of difference between increase in VOP and CC Kerala Orissa Tamil Nadu
Note - 2000- 03 Data left for Kerala due to abnormal values
-40
-30
-20
-10
0
10
20
30
-20 0 20
1998-991999-2000
2000-012001-022004-052005-062006-072007-082008-092009-102010-11
-50 0 50
1991-921994-951996-97
1999-…2001-022003-042005-062007-082009-10
-20 0 20
1999-20002000-012001-022002-032003-042004-052005-062006-072007-082008-092009-102010-11
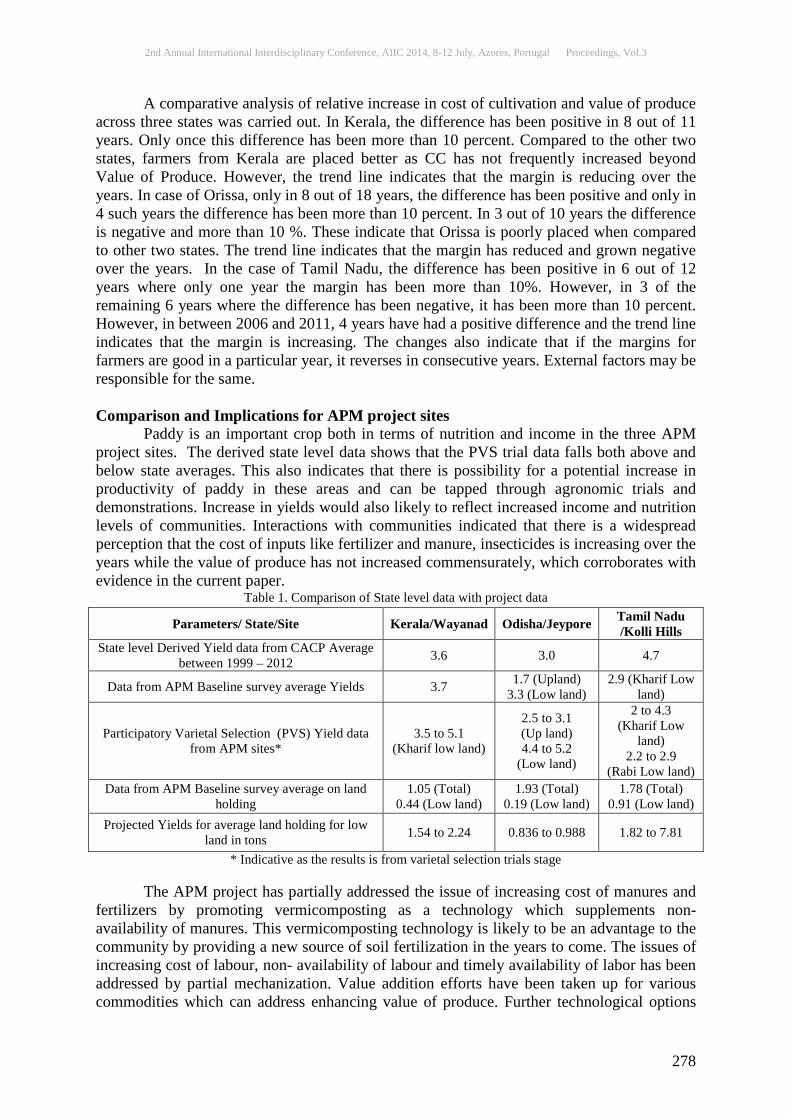
2nd Annual International Interdisciplinary Conference, AIIC 2014, 8-12 July, Azores, Portugal Proceedings, Vol.3
278
A comparative analysis of relative increase in cost of cultivation and value of produce across three states was carried out. In Kerala, the difference has been positive in 8 out of 11 years. Only once this difference has been more than 10 percent. Compared to the other two states, farmers from Kerala are placed better as CC has not frequently increased beyond Value of Produce. However, the trend line indicates that the margin is reducing over the years. In case of Orissa, only in 8 out of 18 years, the difference has been positive and only in 4 such years the difference has been more than 10 percent. In 3 out of 10 years the difference is negative and more than 10 %. These indicate that Orissa is poorly placed when compared to other two states. The trend line indicates that the margin has reduced and grown negative over the years. In the case of Tamil Nadu, the difference has been positive in 6 out of 12 years where only one year the margin has been more than 10%. However, in 3 of the remaining 6 years where the difference has been negative, it has been more than 10 percent. However, in between 2006 and 2011, 4 years have had a positive difference and the trend line indicates that the margin is increasing. The changes also indicate that if the margins for farmers are good in a particular year, it reverses in consecutive years. External factors may be responsible for the same. Comparison and Implications for APM project sites Paddy is an important crop both in terms of nutrition and income in the three APM project sites. The derived state level data shows that the PVS trial data falls both above and below state averages. This also indicates that there is possibility for a potential increase in productivity of paddy in these areas and can be tapped through agronomic trials and demonstrations. Increase in yields would also likely to reflect increased income and nutrition levels of communities. Interactions with communities indicated that there is a widespread perception that the cost of inputs like fertilizer and manure, insecticides is increasing over the years while the value of produce has not increased commensurately, which corroborates with evidence in the current paper.
Table 1. Comparison of State level data with project data
Parameters/ State/Site Kerala/Wayanad Odisha/Jeypore Tamil Nadu /Kolli Hills
State level Derived Yield data from CACP Average between 1999 – 2012 3.6 3.0 4.7
Data from APM Baseline survey average Yields 3.7 1.7 (Upland) 3.3 (Low land)
2.9 (Kharif Low land)
Participatory Varietal Selection (PVS) Yield data from APM sites*
3.5 to 5.1 (Kharif low land)
2.5 to 3.1 (Up land) 4.4 to 5.2
(Low land)
2 to 4.3 (Kharif Low
land) 2.2 to 2.9
(Rabi Low land) Data from APM Baseline survey average on land
holding 1.05 (Total)
0.44 (Low land) 1.93 (Total)
0.19 (Low land) 1.78 (Total)
0.91 (Low land) Projected Yields for average land holding for low
land in tons 1.54 to 2.24 0.836 to 0.988 1.82 to 7.81
* Indicative as the results is from varietal selection trials stage The APM project has partially addressed the issue of increasing cost of manures and fertilizers by promoting vermicomposting as a technology which supplements non-availability of manures. This vermicomposting technology is likely to be an advantage to the community by providing a new source of soil fertilization in the years to come. The issues of increasing cost of labour, non- availability of labour and timely availability of labor has been addressed by partial mechanization. Value addition efforts have been taken up for various commodities which can address enhancing value of produce. Further technological options
2nd Annual International Interdisciplinary Conference, AIIC 2014, 8-12 July, Azores, Portugal Proceedings, Vol.3
279
are required to be explored to concurrently enhance income and nutrition of communities in the project locations. Limitations The data available is limited to 12 years only. A longer time series analysis is likely to help draw conclusive results. While detailed categories of cost of cultivation were available, some data like the split up in cost accrued to diesel in hired machine labour were missing. While there are complex factors influencing profitability of agriculture, detailed information on impact of these factors are not available to enable projections. Since cost concepts were not deployed in project sites as part of the project efforts, there is a gap in field level information, hampering comparability with state level averages. Conclusion and way forward This study was carried out to enhance understanding on the cost of cultivation at the project sites and gain some insights for seeking pathways for action. Analysis of profitability of paddy cultivation over the years show that farmers have either received very little profit or have encountered losses. The cost of cultivation has been increasing over the years and at a higher rate than the increase in the value of produce. However, after the global food crisis and increase in food prices profitability seems to have marginally increased. In many years farmers face losses, not only because of lack of monsoons or drought but also due to overall decline in profits from farming. Appropriately, the APM project has attempted to address issues of increasing cost of inputs, non-availability of manure and labor, and increasing cost of cultivation through a set of technologies like vermicomposting, green manure and enhancement of soil health. In addition, efforts focused on increasing the value of produce of paddy or the prices realized by farmers are pathways of the future. It is the responsibility of the global society to create an enabling environment for farmers to be remunerated well and provide for a dignified life. Acknowledgement This manuscript was prepared for enhanced understanding of cost of cultivation and value of produce across the three states and sites of MSSRF – UoA project on Alleviating Poverty and malnutrition. “The International Development Research Centre (IDRC) and The Department of Foreign Affairs, Trade and Development (DFATD) of Canada funded this research for development project through the Canadian International Food Security Research Fund (CIFSRF). The space provided by the project communities is acknowledged. The efforts of agronomy team of the project in conducting trials and agriculture development activities headed by Dr. Girigan and Mr. Rajeesh at Wayanad, Dr. C.S. Mishra in Jeypore and Dr. Siddick in Kolli hills are acknowledged. References: Alagh, Y.K. (2013). The future of Indian Agriculture. National Book Trust, New Delhi, India. Total pp. 220. Dawe, D. (2002). The changing structure of the world rice market, 1950-2000. Food Policy, 27, 355-370. Dev, M. and Ranade, A. (1998). Raising Food Prices and Rural Poverty: Going Beyond Correlations. Economic and Political Weekly, 33(39), 2529-2536. Government of India (2009). Agricultural Statistics at a Glance: 2009, Directorate of Economics and Statistics, Ministry of Agriculture, Government of India, New Delhi. Kropff, M.J., Van Arendonk, J.A.M. and Loffler, H.J.M. (2013). Food for all Sustainable nutrition security. 95 years Wageningen University, pp. 9 and 13.

2nd Annual International Interdisciplinary Conference, AIIC 2014, 8-12 July, Azores, Portugal Proceedings, Vol.3
280
Narayanamoorthy, A. and Deshpande, R.S. (2003). Irrigation Development and Agricultural Wages: An Analysis Across States. Economic and Political Weekly, 38(35), 3716-3722. Narayanamoorthy, A. (2013). Profitability in Crops Cultivation in India: Some Evidence from Cost of Cultivation Survey Data. Indian Journal of Agricultural Economics, 68(1), 104-121. Ramanjaneyulu, G.V. (2012). What is wrong with the Pricing Policies in India- a case of Paddy in Andhra Pradesh. Indian Agrarian Crisis, February 26. Sainath, P. (2010). Farm Suicides - A 12 year Saga. The Hindu, January 25. Sainath, P. (2013). The mistaken notion that the 53 per cent of India’s population ‘depent on agriculture’ are all ‘farmers’ leads many to dismiss the massive farmers’ suicides as trivial. The Hindu, May 2. Saleth, M.R., Samad, M., Molden, D. and Hussain, I. (2003). Water, Poverty and Gender: A Review of Issues and Policies. Water Policy, 5 (5-6), 385-98. Swaminathan, M.S. (2008). Ending the Debt Trap and Attaining Food Security. The Hindu, March 3, pp. 12. The National Commission on Farmers. (2006). Serving Farmers and Saving Farming, Fifth and Final Report, 04 October 2006. Towards Faster and More Inclusive Growth of Farmer’s Welfare. Ministry of Agriculture, Government of India. Tyagi, V. (2012). India’s Agriculture: Challenges for Growth & Development in Present Scenario. International Journal of Physical and Social Sciences, 2(5), 116-128.

2nd Annual International Interdisciplinary Conference, AIIC 2014, 8-12 July, Azores, Portugal Proceedings, Vol.3
281
A REGRESSION MODEL FOR THE TONS OF PRUNING PER HECTARE
Ana María Martínez-Rodríguez PhD Francisco Javier Gallego PhD
Julio Terrados PhD Eulogio Castro PhD
University of Jáen , Spain
Abstract More than nine million hectares of olive trees are cultivated all over the world, but especially in the Mediterranean countries. As an essential operation, pruning of olive trees produces a huge amount of biomass which is lacking of industrial applications and must be eliminated from fields to prevent propagation of vegetal diseases. This work deals with the development of a regression model to be used in the estimation of the real biomass production from olive tree pruning.
Keywords: Regression model, Olive trees, Biomass production Introduction
More than nine million hectares of olive trees are cultivated all over the world, but especially in the Mediterranean countries. From the pruning operations carried out in the plantation a huge amount of biomass can be obtained (McKendry, 2002). These residues are usually eliminated by in-field burning or by grinding and scattering in order to prevent propagation of vegetal diseases so there is no an economic benefit (Askew and Holmes, 2001). As an alternative, the use of olive tree pruning biomass as raw material for ethanol and other chemicals production or as a source of energy has been proposed (Cara et al, 2008a, 2008b).
The quantification of the yearly available biomass is an issue that has not yet been properly established. The published reports estimate the production of biomass in a range as wide as between 1 and 5 tons per hectare.
This work deals with the development of a regression model for the number of tons per hectare a year that can be used in the estimation of the real biomass production from olive tree pruning.
The remainder of this work is structured as follows. In Methodology section the regression model development is described. The main regression coefficients are interpreted in Results and finally, some conclusions are drawn in Conclusions. Methodology In order to estimate the biomass production from olive tree pruning Jaén has been divided in six homogeneous agroclimatic areas of olives trees. These areas have been treated as strata in a stratified sampling. In fact, the considered areas are the areas of the Phytosanitary Alert and Information Network (RAIF) developed in Andalusia since 1996 in order to know the actual phytosanitary state of the main crops in the region. This RAIF areas where grouped according to the experience of the experts at RAIF network.
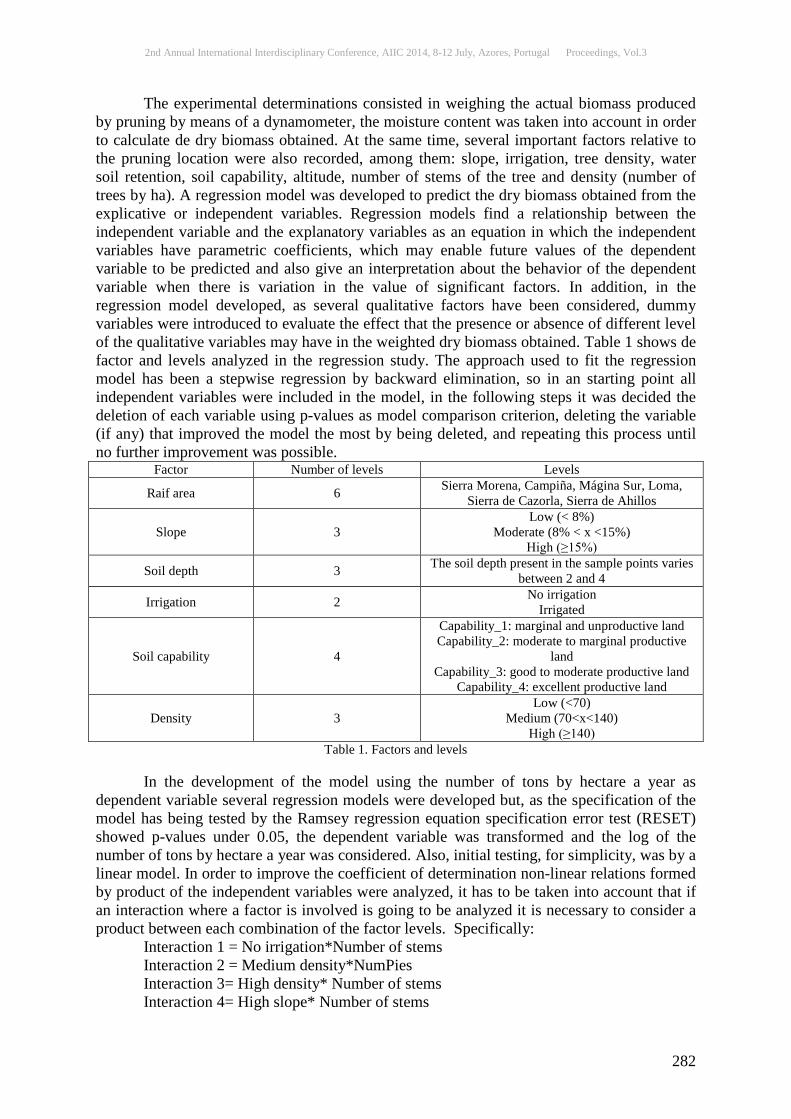
2nd Annual International Interdisciplinary Conference, AIIC 2014, 8-12 July, Azores, Portugal Proceedings, Vol.3
282
The experimental determinations consisted in weighing the actual biomass produced by pruning by means of a dynamometer, the moisture content was taken into account in order to calculate de dry biomass obtained. At the same time, several important factors relative to the pruning location were also recorded, among them: slope, irrigation, tree density, water soil retention, soil capability, altitude, number of stems of the tree and density (number of trees by ha). A regression model was developed to predict the dry biomass obtained from the explicative or independent variables. Regression models find a relationship between the independent variable and the explanatory variables as an equation in which the independent variables have parametric coefficients, which may enable future values of the dependent variable to be predicted and also give an interpretation about the behavior of the dependent variable when there is variation in the value of significant factors. In addition, in the regression model developed, as several qualitative factors have been considered, dummy variables were introduced to evaluate the effect that the presence or absence of different level of the qualitative variables may have in the weighted dry biomass obtained. Table 1 shows de factor and levels analyzed in the regression study. The approach used to fit the regression model has been a stepwise regression by backward elimination, so in an starting point all independent variables were included in the model, in the following steps it was decided the deletion of each variable using p-values as model comparison criterion, deleting the variable (if any) that improved the model the most by being deleted, and repeating this process until no further improvement was possible.
Factor Number of levels Levels
Raif area 6 Sierra Morena, Campiña, Mágina Sur, Loma, Sierra de Cazorla, Sierra de Ahillos
Slope 3 Low (< 8%)
Moderate (8% < x <15%) High (≥15%)
Soil depth 3 The soil depth present in the sample points varies between 2 and 4
Irrigation 2 No irrigation Irrigated
Soil capability 4
Capability_1: marginal and unproductive land Capability_2: moderate to marginal productive
land Capability_3: good to moderate productive land
Capability_4: excellent productive land
Density 3 Low (<70)
Medium (70<x<140) High (≥140)
Table 1. Factors and levels In the development of the model using the number of tons by hectare a year as
dependent variable several regression models were developed but, as the specification of the model has being tested by the Ramsey regression equation specification error test (RESET) showed p-values under 0.05, the dependent variable was transformed and the log of the number of tons by hectare a year was considered. Also, initial testing, for simplicity, was by a linear model. In order to improve the coefficient of determination non-linear relations formed by product of the independent variables were analyzed, it has to be taken into account that if an interaction where a factor is involved is going to be analyzed it is necessary to consider a product between each combination of the factor levels. Specifically:
Interaction 1 = No irrigation*Number of stems Interaction 2 = Medium density*NumPies Interaction 3= High density* Number of stems Interaction 4= High slope* Number of stems

2nd Annual International Interdisciplinary Conference, AIIC 2014, 8-12 July, Azores, Portugal Proceedings, Vol.3
283
Interaction 5= Moderate slope* Number of stems Interaction 6= altitude* Number of stems Interaction 7= Water oil retention* Number of stems After the regression model was fitted, the diagnosis of the model was performed
showing the presence of heteroscedasticity. For this reason, a model with the coefficients estimated under the presence of heteroscedaticity was fitted. The Table 2 shows the estimated coefficients of the significant variables and interactions. The characteristic parameters of the regression model calculated are shown in Table 3. The p-value in the ANOVA table is smaller than 0.01, so there is a statistically significant relationship among the variables of the model, with a 99% of confidence. The R2 of 0.67 indicates that the model explain approximately 67% of the variability in the log of the quantity of the dry biomass obtained. Also, normality has been tested with several normality tests and it cannot be rejected with a 5% of signification. Depedent variable: log t/ha
Coefficient Standard deviation t-statistic p-value constant 0.156795 0.36052 0.4349 0.66433
Loma -0.255239 0.0499084 -5.1141 <0.00001 *** Campiña -0.175203 0.0740684 -2.3654 0.01944 **
Mágina Sur -0.52876 0.0662442 -7.9820 <0.00001 *** Moderate 0.207764 0.0592541 3.5063 0.00062 ***
No_irrigation -0.803963 0.200794 -4.0039 0.00010 *** Soil_depth_2 -0.710603 0.311134 -2.2839 0.02395 ** Soil_depth_3 -1.12647 0.317666 -3.5461 0.00054 *** Interaction1 0.260033 0.0782257 3.3241 0.00114 *** Interaction2 0.122745 0.0251056 4.8892 <0.00001 *** Interaction3 0.25827 0.041314 6.2514 <0.00001 *** Interaction4 0.0809807 0.027494 2.9454 0.00380 ***
altitude 0.002006 0.000318249 6.3032 <0.00001 *** Interaction6 -0.00069321 0.000119523 -5.7998 <0.00001 *** Interaction7 0.00204773 0.000321622 6.3669 <0.00001 ***
Table 2. Estimated coefficients and p-values
R2 0.674127 R2 corrected 0.640080 F(14, 134) 19.80021 p-value (of F) 3.95e-26
Log-likelihood -270.7967 Akaike 571.5935 Schwarz 616.6527 Hannan-Quinn 589.9003
Table 3. Regression model characteristics
It should be pointed out that related to use of the developed regression model in prediction, as the dependet variable is the logarithm of the amout of pruning per hectare it is necessary make a correction multiplying by 𝑒𝑥𝑝 �𝜎
2
2�, that is, in this case:
𝑌� = exp �0.3943612
2� exp�𝑙𝑛𝑌� � = 1.0810exp (𝑙𝑛𝑌� )
Where 𝑙𝑛𝑌� is obtained by the regression model. Results
In this case, as the dependent variable is the logarithmic of the original variable, for the explanatory quantitative variables an increment of a unit in Xj represents an increment in the original variable of 100[𝑒𝛽𝑗 − 1]%. In this case, specifically:
2nd Annual International Interdisciplinary Conference, AIIC 2014, 8-12 July, Azores, Portugal Proceedings, Vol.3
284
As the level “Loma” of the factor RAIF has a coefficient -0.255239 that means that in La Loma the amount of pruning per ha. is a 22.53% less than in Sierra de Cazorla (that was the level considered as the base level).
As the level “Campiña” of the factor RAIF has a coefficient -0.175203 that means that in Campiña the amount of pruning per ha. is a 16.07% less than in Sierra de Cazorla.
As the level “Mágina Sur” of the factor RAIF has a coefficient -0.52876 that means that in La Loma the amount of pruning per ha. is a 41.1% less than in Mágina Sur.
As the level “No irrigation” has a coefficient -0.803963 that means that the amount of pruning per ha. is a 55.24% less than in irrigated lands.
The interaction coefficients show that the independent variable behavior in relation of one of the explanatory variables depends on the other variable considered in the interaction. For instance the behavior of the amount of pruning in relation to the altitude depends on the number of the stems of the tree.
Conclusion
The results show that the homogenous areas considered have influence on the quantity of biomass produced by pruning olive trees, in other words, there is a statistically significant difference in the weighted dry biomass obtained in the different areas of Jaén. Other significant factors are the age of the tree, height of the tree and the number of trunks and the tree density. Interesting conclusions can be obtained from the parameter estimates. In relation with the statistical significance of the model it should be pointed out that the p-value in the ANOVA table is smaller than 0.01, so there is statistical significant relationship among the dependent variable and the significant explanatory variables with a 99% level of confidence. Once the regression model has been fitted, the goodness of fit of the model has been checked by the diagnosis of the model showing that there are not violations of the statistical assumptions. Also, the specification of the model has being tested by the Ramsey regression equation specification error test (RESET). The p-values obtained are greater than 0.01 so there are not statistical reason to think that the model suffers from miss-specification. In this sense the regression model fitted is adequate to predict the dependent variable. Acknowledgements
This work was supported by the excellence project P09-TEP-5254 of the Plan Andaluz de Investigación, Desarrollo e Inovación of the Junta de Andalucía (Spain).
References: Askew M.F. and Holmes, C.A. The potential for biomass and energy crops in agriculture in Europe, in land use, policy and rural economic terms. International Sugar Journal (2002), 104(1247) 482-591. Cara, C., Ruiz, E., Oliva, J.M., Sáez, F. and Castro, E. Conversion of olive tree biomass into fermentable sugars by dilute acid pretreatment and enzymatic saccharification. Bioresource Technology, 2008, 99 (6), 1869-1876. Cara, C., Ruiz, E., Ballesteros, M., Manzanares, P., Negro, M.J. and Castro, E. Production of fuel ethanol from steam-explosion pretreated olive tree pruning. Fuel, 2008, 87 (6), 692-700. McKendry, P. Energy production from biomass. Overview of Biomass Bioresource Technology, 2002, 83 (1), 37-46. RAIF (2014), http://www.juntadeandalucia.es/agriculturaypesca/raif/.

2nd Annual International Interdisciplinary Conference, AIIC 2014, 8-12 July, Azores, Portugal Proceedings, Vol.3
285
MODELING AND FORECASTING OF BEEF, MUTTON, POULTRY MEAT AND TOTAL MEAT PRODUCTION OF
PAKISTAN FOR YEAR 2020 BY USING TIME SERIES ARIMA MODELS
Mr. Shakeel Nouman Assistant Chief, Planning & Development Department, Lahore
Prof. Masood Amjad khan Government College University, Lahore.
Abstract We use historical time-series data reported in data table to review trends in beef , mutton, poultry meat and total meat production. In this regard, first we use data from 1971-72 to 2007-08 to estimate a time trend for beef , mutton, poultry meat and total meat production. This time trend is estimated by employing an exponential function of the form Yf = cebt, where Yf is for meat production and t depicts the year. The estimated parameters are highly statistically significant, while the overall explanatory power of the model is very high since R2 = 0.99. These results indicate that annual growth rate of meat production from 1971-72 to 2007-08 is 5% over per annum. In 2020 the projected annual growth of total production of meat will be in Pakistan , China, India and Developed world is 1.6,2.9,2.8 and 0.7 per year respectively. Similarly the total productions of meat in Pakistan in 2020 are estimated to be 4.7 million metric tons. where in 2020, China, India and develop world will be 86, 8 and 121 respectively. In 2020the per capita production is forecasted to be 25.2 kg/annum in Pakistan, 60 kg in China, 6 kg in India and 87 kg in Developing World. If we look at the production of the Beef , mutton, Poultry and meat in Pakistan , the annual growth production rate of beef is 0.6%, mutton is high and poultry meat is 1.2% so the total meat is 0.7% . The total production through 1993 for Beef, Poultry and Meat had been 35,27 and 100 million metric tons respectively and will be increased till 2020. it will be 38 million metric ton for beef, 38 million metric ton for mutton, 36 for poultry and 121 for meat. The per capita production of beef, poultry meat and meat had been 26, 21and 78 kg/annum respectively in 1993 and expected to be 28 kg ,26 kg and 87 kg for beef , poultry and meat respectively till 2020.
Keywords: Meat production, time series arima models Introduction Pakistan is endowed with a large livestock population well adapted to the local environmental conditions. The national herd consists of 33.0 million heads of cattle, 29.9 million buffaloes, 27.4 million sheep, 58.3 million goats and 1.0 million camels. Livestock produce approximately 43.562 million tons of milk, making Pakistan the 3rd largest milk producer country in the world. Livestock also produce 1.601 million tons of beef, 0.590 million tons of mutton, 41.54 thousand tons of wool, 21.99 thousand tons of hair and 57.937 million skins and hides (Government of Pakistan, 2009). As we enter the next millennium, we need to have "2020 vision". What will be the numbers, production and demand for livestock in 20 years time? The world may be a very different place, especially in view of the growing pressure on natural resources. How accurately did we predict the state of the world
2nd Annual International Interdisciplinary Conference, AIIC 2014, 8-12 July, Azores, Portugal Proceedings, Vol.3
286
in the 1972s, for instance, from our knowledge of the 1920s? Punjab’s livestock resources hold considerable potential for increasing the production of meat. It has been estimated that about 5 million buffalo/cattle male calves are available for fattening in the Punjab province. But majority of these calves are sent to slaughter at 1-3 weeks of age. Some calves are raised to 60~80 kg on extremely poor and unbalanced diets. If we look at the production of the beef , mutton, poultry and meat in Pakistan , the annual growth production rate of beef is 0.6%, mutton is high and poultry meat is 1.2% so the total meat is 0.7% . The total production through 1993 for Beef, Poultry and Meat had been 35,27 and 100 million metric tons respectively and will be increased till 2020. it will be 38 million metric ton for beef, 38 million metric ton for mutton, 36 for poultry and 121 for meat. The per capita production of beef, poultry meat and meat had been 26, 21and 78 kg/annum respectively in 1993 and expected to be 28 kg ,26 kg and 87 kg for beef , poultry and meat respectively till 2020. Materials and methods The task facing the modern time series econometrician is to develop reasonable simple models capable of interpreting, forecasting, and testing hypotheses concerning the data. This challenge is growing over the passage of time; the original use of time series analysis was basically as an aid to forecasting. Through the following software (SPSS & Eviews) we obtain few tests for serial correlation, normality and heteroskedasticity also detect the outlier in the data in the residuals from the estimated equation. Also obtain correlogram and Q-statistics that can displays the autocorrelations and partial autocorrelations of the equation residuals up to the specified number of lags. Histogram and normality test can displays a histogram and descriptive statistics of the residuals, including the Jarque-bera / Kolmogorov-smirnov z statistic for testing normality. Serial correlation Lm test this test is an alternative to the q-statistics for testing serial correlation. White's heteroskedasticity test this is a test for heteroskedasticity in the residuals from a least squares regression specification and stability tests. Eviews software provides a number of test statistics that examine whether the parameters of the model are stable across various sub samples of data. Chow's breakpoint test the idea of the breakpoint chow test is to fit the equation separately for each sub sample and to see whether there are significant differences in the estimated equations a significant difference indicates a structural change in the relationship. Regression specification error test output from the test reports the test regression and the F-statistic and log likelihood ratio for testing the hypothesis that the coefficients on the powers of fitted values are all zero. The recursive residuals CUSUM test is based on the cumulative sum of the recursive residuals recursive coefficient estimates can enables us to trace the evolution of estimates for any coefficient as more and more of the sample data are used in the estimation. The view will provide a plot of selected coefficients in the equation for all feasible recursive estimations. Comparison of different models the different models can be compared with the wide availability of the forecast tests. Here we discuss and check those criterion. Linear Time Series Models
There are t21 y,,y,y observations. Unlike the regression models, however, a set of explanatory variables is not used for modeling. Instead, y is explained by relating it to its own past values and to a weighted sum of current and lagged random disturbances. Autoregressive Moving Average (ARMA/ARIMA) Models The ARMA(p,q). It is represented by the following model
qtqttptptt yyy −−−− −−−++++= εθεθεδφφ 1111

2nd Annual International Interdisciplinary Conference, AIIC 2014, 8-12 July, Azores, Portugal Proceedings, Vol.3
287
The variance, covariance and autocorrelation are solutions to difference equations pkpkkk −−− +++= γφγφγφγ 2211 1+≥ qk
pkpkkk −−− +++= γργργρρ 2211 1+≥ qk q is the memory of the moving average part of the time series, so that, for 1+≥ qk the autocorrelation function (and covariance) exhibits the properties of a purely autoregressive process. If the time series is homogenous stationary after differenced the series yt to produce
stationary series tw , we can model tw as an ARMA process. If td
t yw ∆= and tw is an ARMA(p,q) process, then it is said that yt is an integrated autoregressive moving average process of order (p,d,q), or simple ARIMA(p,d,q). ARIMA(p,d,q) using back shift operator is written as
where ( ) p
p BBBB φφφφ −−−−= 2211
is the autoregressive operator and
( ) qq BBBB θθθθ −−−−= 2
211 is the moving average operator. And when there is a differencing the ARMA model becomes ARIMA . The time series is called stationary, if the characteristics of the time series (stochastic process) do not change over time, i.e., variance mean, and covariance then the time series is called stationary Augmented Dickey-Fuller (ADF) Test If the process is started at some point, the variance of y increases steadily with time
and goes to infinity. If the absolute value of 1φ is greater than one, the series is explosive. Therefore, the hypothesis of a stationary series is evaluated by testing whether the absolute
value of 1φ is strictly less than one. Both the Phillips-Perron and the Dickey-Fuller (DF) (PP)
tests take the unit root as the null hypothesis: 1:H 1O =φ . As te explosive series does not make much economic sense, therefore null hypothesis is tested against the one-sided alternative.
1:H 11 <φ .
The test is carried out by estimating an equation with 1−ty subtracted from both sides of the equation.
ttt yy εγµ ++=∆ −1 Where 1−= ργ and the null and alternative hypotheses are
0:Ho =γ ,: 0:H 1 <γ If the series is correlated at higher order lags, the assumption of white noise disturbances is violated. The ADF and PP tests use different methods to control for higher order serial correlation in the series. The ADF test makes a parametric correction for higher order correlation by assuming that the y series follows an AR(p) process and adjusting the test methodology. The ADF approach controls for higher-order correlation by adding lagged difference terms of the dependent variable y to the right hand side of the regression
( ) ( ) ttd ByB εθδφ +=∆

2nd Annual International Interdisciplinary Conference, AIIC 2014, 8-12 July, Azores, Portugal Proceedings, Vol.3
288
tptptttt yyyyy εδδδγµ +∆++∆+∆++=∆ +−−−− 122111 This augmented specification is then used to test
0:Ho =γ , 0:H1 <γ During this it may appear that the test can be carried out by performing a t-test on the estimated γ , the t statistic under the null hypothesis of a unit root does not have the conventional t distribution. Fuller and Dickey (1979) showed that the distribution under the null hypothesis is nonstandard, and they simulated the critical values for selected sample sizes. MacKinnon (1991) more recently has implemented a much larger set of simulations than those tabulated by Fuller and Dickey. Durban Watson Test Statistic The Durbin-Watson statistic is a test for first order serial correlation. More formally, the DW statistic measures the linear association between adjacent residuals from a regression model. The Durbin-Watson is a test of the hypothesis 0=ρ in the specification
ttt ερµµ += −1 If there is no serial correlation, the DW statistic will be around 2. The DW statistic will fall below 2 if there is positive serial correlation. If there is negative correlation, the statistic will lie somewhere between 2 and 4.The statistic is computed as. Johnston and DiNardo (1997) Beef We have made comparison among four tentative models and we are going to choose one best model among these. We have used different criterion given above to select the best candidate model. We stressed main focus on DW,AIC,RMSE and Theil’s inequality to select the final model. RMSE and Theil’s inequality shows the closeness of actual and forecasted values. Smaller Theil inequality is the best index of good forecasts. So here we chose ARIMA(0,1,15) model. On the basis of RMSE AND THEIL’S Inequality we suggest that the best model among these is ARIMA (0, 1, 15 ). THE FORECASTS FROM THE ARIMA MODELS ARE GIVEN BELOW
ttt15-t 0.108B0.0129C0.0189POP0.656-0.394log ++−=∆ φtBF (in million)
Years
Buffaloes
Cattle
Beef Production
Human Population
1971-1972 9.80 14.60 0.35 64.56 1979-1980 11.60 15.60 0.42 80.13 1989-1990 17.40 17.80 0.73 105.35 1999-2000 22.70 22.00 0.99 134.51 2009-2010 30.71 35.25 1.78 173.86 2010-2011 31.61 36.65 1.90 178.41 2011-2012. 32.53 37.93 2.04 183.08 2012-2013 33.48 39.11 2.19 187.87 2013-2014 34.45 40.23 2.35 192.79 2014-2015 35.45 41.31 2.54 197.84 2015-2016 36.49 42.37 2.74 203.02 2016-2017 37.55 43.43 2.96 208.33 2017-2018 38.64 44.48 3.21 213.78 2018-2019 39.77 45.54 3.48 219.38

2nd Annual International Interdisciplinary Conference, AIIC 2014, 8-12 July, Azores, Portugal Proceedings, Vol.3
289
2019-2020 40.93 46.62 3.79 225.12
From the above graph we see some statistics. We know that Small bias proportion indicates that the forecasts track the mean of the actual series. Smaller bias proportion shows the best fit of the model. Larger covariance proportion indicates actual and forecasts are very close to each other Mutton We have made comparison among three tentative models and we are going to choose one best model among these. We have used different criterion given above to select the best candidate model. We stressed main focus on DW,AIC,RMSE and Theil’s inequality to select the final model. RMSE and Theil’s inequality shows the closeness of actual and forecasted values. Smaller Theil inequality is the best index of good forecasts. So here we chose ARIMA(0,1,1) model. On the basis of RMSE AND THEIL’S Inequality we suggest that the best model among these is ARIMA (0, 1, 1 ). The Forecasts From The ARIMA Models Are Given Below
ttt1-t S008.0G0135.0POP004.00.116-0.0960-log +++=∆ θtM Years
Goats
Sheep
Mutton
Production Human
Population 1971-1972 15.60 13.70 0.21 64.56 1979-1980 24.90 21.40 0.35 80.13 1989-1990 35.40 25.70 0.62 105.35 1999-2000 47.40 24.10 0.65 134.51 2009-2010 60.51 28.21 0.57 173.86 2010-2011 61.69 28.79 0.59 178.41 2011-2012. 62.86 29.37 0.61 183.08 2012-2013 64.04 29.97 0.64 187.87 2013-2014 65.22 30.58 0.68 192.79 2014-2015 66.39 31.20 0.73 197.84 2015-2016 67.57 31.83 0.79 203.02 2016-2017 68.74 32.48 0.87 208.33 2017-2018 69.92 33.14 0.96 213.78 2018-2019 71.10 33.81 1.08 219.38
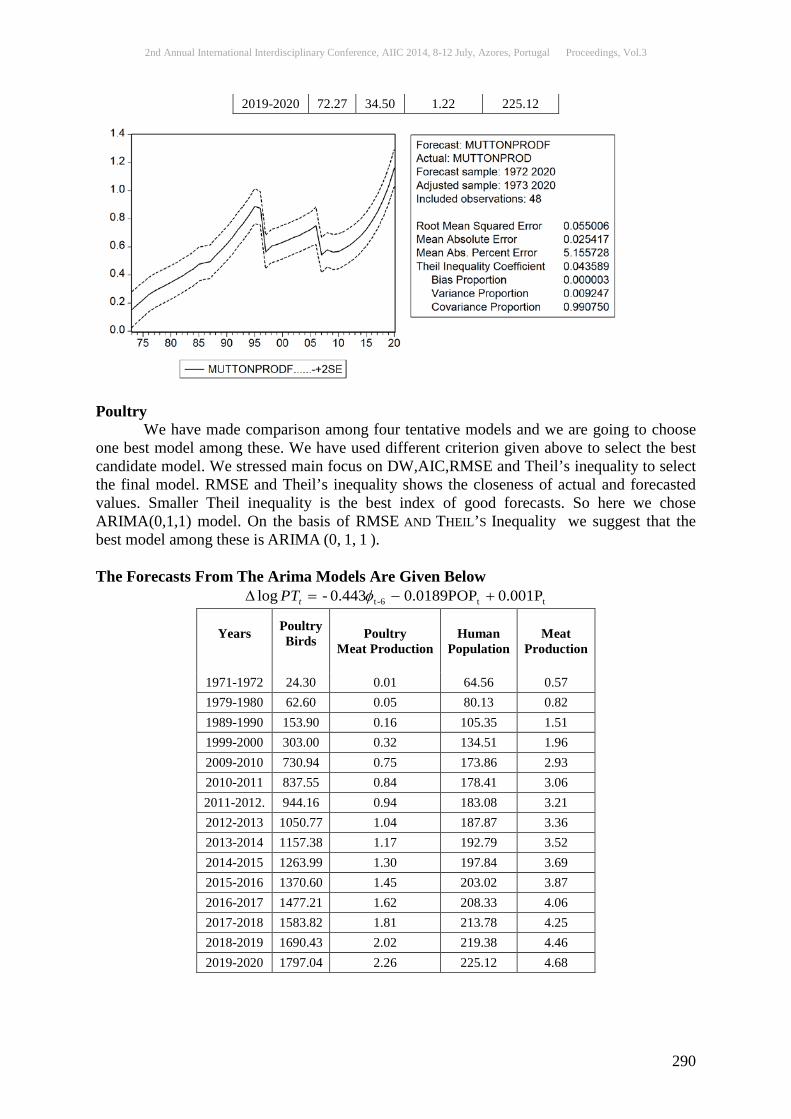
2nd Annual International Interdisciplinary Conference, AIIC 2014, 8-12 July, Azores, Portugal Proceedings, Vol.3
290
2019-2020 72.27 34.50 1.22 225.12
Poultry We have made comparison among four tentative models and we are going to choose one best model among these. We have used different criterion given above to select the best candidate model. We stressed main focus on DW,AIC,RMSE and Theil’s inequality to select the final model. RMSE and Theil’s inequality shows the closeness of actual and forecasted values. Smaller Theil inequality is the best index of good forecasts. So here we chose ARIMA(0,1,1) model. On the basis of RMSE AND THEIL’S Inequality we suggest that the best model among these is ARIMA (0, 1, 1 ). The Forecasts From The Arima Models Are Given Below
tt6-t 0.001P0.0189POP0.443-log +−=∆ φtPT
Years
Poultry Birds
Poultry Meat Production
Human Population
Meat Production
1971-1972 24.30 0.01 64.56 0.57 1979-1980 62.60 0.05 80.13 0.82 1989-1990 153.90 0.16 105.35 1.51 1999-2000 303.00 0.32 134.51 1.96 2009-2010 730.94 0.75 173.86 2.93 2010-2011 837.55 0.84 178.41 3.06 2011-2012. 944.16 0.94 183.08 3.21 2012-2013 1050.77 1.04 187.87 3.36 2013-2014 1157.38 1.17 192.79 3.52 2014-2015 1263.99 1.30 197.84 3.69 2015-2016 1370.60 1.45 203.02 3.87 2016-2017 1477.21 1.62 208.33 4.06 2017-2018 1583.82 1.81 213.78 4.25 2018-2019 1690.43 2.02 219.38 4.46 2019-2020 1797.04 2.26 225.12 4.68

2nd Annual International Interdisciplinary Conference, AIIC 2014, 8-12 July, Azores, Portugal Proceedings, Vol.3
291
Meat We have made comparison among four tentative models and we are going to choose one best model among these. We have used different criterion given above to select the best candidate model. We stressed main focus on DW,AIC,RMSE and Theil’s inequality to select the final model. RMSE and Theil’s inequality shows the closeness of actual and forecasted values. Smaller Theil inequality is the best index of good forecasts. So here we chose ARIMA(0,1,1) model. On the basis of RMSE AND THEIL’S Inequality we suggest that the best model among these is ARIMA (0, 1, 1 ). THE FORECASTS FROM THE ARIMA MODELS ARE GIVEN BELOW
t3-t2-t10-t 0.0189POP0.5460.4210.773-0.104log −−+=∆ φφθtMT
Years
Meat Production
Human Population
1971-1972 0.57 64.56 1979-1980 0.82 80.13 1989-1990 1.51 105.35 1999-2000 1.96 134.51 2009-2010 2.93 173.86 2010-2011 3.06 178.41 2011-2012. 3.21 183.08 2012-2013 3.36 187.87 2013-2014 3.52 192.79 2014-2015 3.69 197.84 2015-2016 3.87 203.02 2016-2017 4.06 208.33 2017-2018 4.25 213.78 2018-2019 4.46 219.38 2019-2020 4.68 225.12
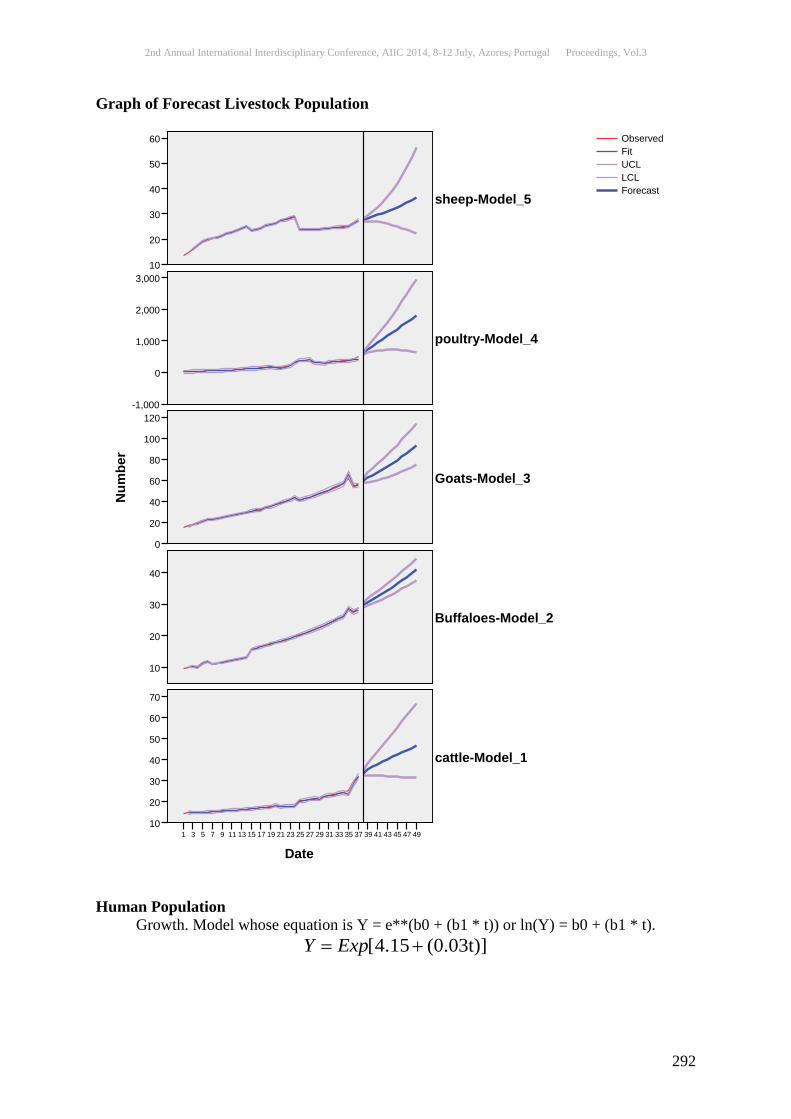
2nd Annual International Interdisciplinary Conference, AIIC 2014, 8-12 July, Azores, Portugal Proceedings, Vol.3
292
Graph of Forecast Livestock Population
Human Population
Growth. Model whose equation is Y = e**(b0 + (b1 * t)) or ln(Y) = b0 + (b1 * t). (0.03t)]4.15[ += ExpY
Num
ber
60
50
40
30
20
103,000
2,000
1,000
0
-1,000120
100
80
60
40
20
0
40
30
20
10
Date494745434139373533312927252321191715131197531
70
60
50
40
30
20
10
sheep-Model_5
poultry-Model_4
Goats-Model_3
Buffaloes-Model_2
cattle-Model_1
ForecastLCLUCLFitObserved
2nd Annual International Interdisciplinary Conference, AIIC 2014, 8-12 July, Azores, Portugal Proceedings, Vol.3
293
Conclusion As we enter the next millennium, we need to have "2020 vision". What will be the numbers, production and demand for livestock in 20 years time? The world may be a very different place, especially in view of the growing pressure on natural resources. How accurately did we predict the state of the world in the 1972s, for instance, from our knowledge of the 1920s? We use historical time-series data reported in data table to review trends in beef , mutton, poultry meat and total meat production. In this regard, first we use data from 1971-72 to 2007-08 to estimate a time trend for beef , mutton, poultry meat and total meat production. This time trend is estimated by employing an exponential function of the form Yf = cebt, where Yf is for meat production and t depicts the year. The estimated parameters are highly statistically significant, while the overall explanatory power of the model is very high since R2 = 0.99. These results indicate that annual growth rate of meat production from 1971-72 to 2007-08 is 5% over per annum. We present a comparison of the projections for meat production in Annexure K, which indicates that meat Production In 2020 the projected annual growth of total production of meat will be in Pakistan , China, India and Developed world is 1.6,2.9,2.8 and 0.7 per year respectively. Similarly the total productions of meat in Pakistan in 2020 are estimated to be 4.7 million metric tons. where in 2020, China, India and develop world will be 86, 8 and 121 respectively. In 2020the per capita production is forecasted to be 25.2 kg/annum in Pakistan, 60 kg in China, 6 kg in India and 87 kg in Developing World. The large increase in animal protein demand over the last few decades has been largely met by the worldwide growth in industrial production of poultry. This is expected to continue as real incomes grow in the emerging economies. If we look at the production of the Beef , mutton, Poultry and meat in Pakistan , the annual growth production rate of beef is 0.6%, mutton is hfgh and poultry meat is 1.2% so the total meat is 0.7% . The total production through 1993 for Beef, Poultry and Meat had been 35,27 and 100 million metric tons respectively and will be increased till 2020. it will be 38 million metric ton for beef, 38 million metric ton for mutton, 36 for poultry and 121 for meat. The per capita production of beef, poultry meat and meat had been 26, 21and 78 kg/annum respectively in 1993 and expected to be 28 kg ,26 kg and 87 kg for beef , poultry and meat respectively till 2020. to see the Developing and Developed world (beef, poultry, meat) see Annexure L. The traditional meat production systems in Pakistan are inefficient. Most of beef comes as by-product of dairy industry, end of career draft animals or emergency slaughtered animals. With a few exceptions, practically no commercial beef production/fattening activity is being carried out in Pakistan. Whereas the demand supply gap for mutton is increasing due to low productivity of small animals. Consequently the productive animals like female sheep/goat and young female stock are slaughtered indiscriminately to meet the demand. Punjab’s livestock resources hold considerable potential for increasing the production of meat. It has been estimated that about 5 million buffalo/cattle male calves are available for fattening in the Punjab province. But majority of these calves are sent to slaughter at 1-3 weeks of age. Some calves are raised to 60~80 kg on extremely poor and unbalanced diets. If these calves are saved and raised on balanced fattening diets based on crop residues and agro-industrial by-products to live-weights of 250-300kg it is estimated that total beef production could be doubled. Experiences so far, suggest that success of meat production/feedlot fattening is only possible if these animals are processed at a modern abattoir and their meat is processed for value addition and efficient utilization of the byproducts, which are being wasted in the present conventional slaughtering system.
2nd Annual International Interdisciplinary Conference, AIIC 2014, 8-12 July, Azores, Portugal Proceedings, Vol.3
294
Though livestock production is very fragmented and most farm units are small and only 10 percent of the farms in the Punjab hold from 10 to 20 buffalo cows and 5 percent over 20 heads each. Such units are often run by capable and business oriented farmers who seem to be open to change and eager to adopt improved production practices if these prove profitable. Thus if sufficient incentives and workable production programs are given, their response is quick and positive. In order to improve access to international markets and satisfy escalating concerns about food quality and safety among domestic consumers there is need to modernize meat production and processing systems. Unfortunately there is no value addition of meat products and wastage of valuable byproducts. The prevailing conditions result into uneconomical and low-quality meat production. Punjab possesses huge potential to export meat and earn good foreign exchange for the country but unhygienic slaughtering and poorly handled meat is causing hindrance to achieve this goal. On the other hand the meat producer is not getting the profit, which he deserves, and the consumer does not get the meat of his own choice because the meat grading system does not exist in the country. In coming years the demand for hygienic meat and value added products for local as well as international markets is expected to increase greatly, for a number of reasons. This necessitates establishment of state of the art meat processing/value addition system in the country. There is also a growing demand for Halal meat in the international markets. This requires establishment of modernized meat production and processing system in the country to meet local as well as international demand. Reference: Agricultural census organization, livestock census 1996, 2006- punjab, government of Pakistan, Lahore. Annual report 2007-2008, state bank of Pakistan. (http://www.sbp.org.pk). Anonymous 1998, cattle and buffalo development Punjab’, Pakistan – German technical co-operation, planning & evaluation directorate, Punjab livestock and dairy development department. Anonymous, Economic Survey Of Pakistan (2007-08), ministry of economic affairs, government of Pakistan. Anonymous. 2007-2008. Agricultural Statistics of Pakistan. Gop, MINFAL, Economic wing, Islamabad. Bourn, d., maitima, j., motsamai, b., blake, r.,nicholson, c. & sundstol, f. (2005). Livestock and the environment. In: owen e. A., kitalyi, n., jayasuriya t. Smith (eds): livestock and wealth creation: improving the husbandry of animals kept by resource-poor people in developing countries. Nottingham: nottingham university press. Economic research service. 1997b. World agriculture: trends and indicators: world and regional data. Http://mann77.Mannlib.cor nell.edu/data1. c. Seré & h. Steinfeld.. (1996). World livestock production systems: current status, issues and trends, by Fao Animal production and health paper 127. Rome: food and agriculture organization of the united nations. j. Bruinsma. . (2003). World agriculture: towards 2015/2030, an fao perspective, by FAO Rome and london: food and agriculture organization of the united nations and earthscan. H. Steinfeld, p. Gerber, t. Wassenaar, v. Castel, m. Rosales, c. De haan (2006a). Livestock’s long shadow: environmental issues and options, by by. FAO . Rome: fao. 390 pp. FAO agricultural statistics (2003 & 2004). At http://www.fao.org. Faostat (2003). Fao statistics database on the world wide web. Http://apps.fao.org/ (accessed february, 2003).

2nd Annual International Interdisciplinary Conference, AIIC 2014, 8-12 July, Azores, Portugal Proceedings, Vol.3
295
Food and agriculture organisation of the united nations (2002). World agriculture towards 2015/2030. Food and nutrition board, institute of medicine. Dietary reference intakes for energy, carbohydrate, fiber, fat, fatty acids, cholesterol, protein, and amino acids. Washington, dc: national academy press, 2002. Http://www.foodoutlook.org, June 2008.mht Http://Www.Nationmaster.Com/Graph/Agr_Agr_Gro-Agriculture-Gricultural-Growth Http://www.Pakissan.Com/English/Allabout/Livestock/Poultry/Birds.Breeds.Shtml Http://Www.Pndpunjab.Gov.Pk/Page.Asp?Id=30 Http://Www.Statpak.Gov.Pk/Depts/Aco/Index.Html Http://Www.UN.Org.Pk/Fao/ Http://www. USDA .org , food safety and inspection service. http://www.who.int/whosis/whostat/en/. Http:www.pakistan.gov.pk/divisions/food-division/media/asp_05-06_title.pdf Kazim hussain naqvi, syed muhammad (1999) analytical study of pakistani native red meats. Phd thesis, university of the punjab, lahore. Naqvi, syed muhammad kazim hussnain (1999) analytical study of pakistani native red meats. Phd thesis, university of the punjab, lahore. Research corporation (mrc). 1995. Identification of nutrient sources, reduction opportunities and treatment options for australian abattoirs and rendering plants. Project no. M.445. Prepared by rust ppk pty ltd and taylor consulting pty ltd. Usda (united states de partment of ag riculture). 1997a. Agricultural sta tistics. Wash ington, d.c.: united states gov ernment print ing of fice. Usda/fas. 2000. Meat and bone meal ban may induce south american soybean planting. United states department of agriculture: foreign agricultural service, (www.fas.usda.gov). Bibliography Bourn, d., wint, w., blench, r. & woolley, e. (1994) nigerian livestock resources survey. World animal review 78, 49-58. Rome: food and agriculture organization of the united nations (FAO). Livestock of Pakistan by H.U Hasnain and R.H. Usmani. Islamabad: Livestock Foundation,2006. Krystallis, a. & arvanitoyannis, i.s. 2006. Investigating the concept of meat quality from the consumers perspective: the case of greece. Meat science, 72:164–176. Processed meat consumption and stomach cancer risk a meta-analysis -- larsson et al_ 98 (15) 1078 -- jnci journal of the national cancer institute. Rosegrant, m.w., leach, n. & gerpacio, r.v. 1999. Meat or wheat for the next millennium? Alternative futures for world cereal and meat consumption. Proceedings of the nutrition society, 58: 219–234. The future for red meat in human diets herbert w. Ockerman, 2002 the ohio state university department of animal sciences, research and reviews beef, special circular 162-99, the future for red meat in human diets.mht Baxter, Marianne and Robert G. King (1999). “Measuring Business Cycles: Approximate Band-Pass Filters For Economic Time Series,” Review of Economics and Statistics, 81, 575–593. Bhargava, A. (1986). “On the Theory of Testing for Unit Roots in Observed Time Series,” Review of Economic Studies, 53, 369-384. Bowerman, Bruce L. and Richard T. O’Connell (1979). Time Series and Forecasting: An Applied Approach, New York: Duxbury Press. Box, George E. P. and Gwilym M. Jenkins (1976). Time Series Analysis: Forecasting and Control, Revised Edition, Oakland, CA: Holden-Day.

2nd Annual International Interdisciplinary Conference, AIIC 2014, 8-12 July, Azores, Portugal Proceedings, Vol.3
296
Box, George E. P. and D. A. Pierce (1970). “Distribution of Residual Autocorrelations in Autoregressive Integrated Moving Average Time Series Models,” Journal of the American Statistical Association, 65, 1509–1526. Dickey, D.A. and W.A. Fuller (1979). “Distribution of the Estimators for Autoregressive Time Series with a Unit Root,” Journal of the American Statistical Association, 74, 427–431. Harvey, Andrew C. (1989). Forecasting, Structural Time Series Models and the Kalman Filter, Cambridge: Cambridge University Press. Harvey, Andrew C. (1993). Time Series Models, 2nd edition, Cambridge, MA: MIT Press. Phillips, P.C.B. and P. Perron (1988). “Testing for a Unit Root in Time Series Regression,” Biometrika, 75, 335–346.
2nd Annual International Interdisciplinary Conference, AIIC 2014, 8-12 July, Azores, Portugal Proceedings, Vol.3
297
USING SHUTTLE RADAR TOPOGRAPHIC MISSION IMAGERY TO IDENTIFY INLAND VALLEY AREAS AND
THE SOIL SUITABILITY STUDIES FOR VEGETABLE PRODUCTION IN AKURE SOUTH LOCAL GOVERNMENT
AREA NIGERIA
Francis Omotayo Adekayode, PhD Department of Crop, Soil and Pest Management,
Federal University of Technology, Akure, Nigeria.
Abstract The Shuttle Radar Topographic Mission (SRTM) imagery was used in 2012 to identify stream courses in Akure South Local Government Area (AKSLGA) where Akure (Latitute 7015’N and Longitude 5015’E) the capital of Ondo State Nigeria which had witnessed a tremendous urban sprawl in the last twenty years was located. The cultivation of vegetable in the inland valley areas was a way to improve the income and diet of the city dwellers. The polygonized boundary of AKSLGA which was superimposed on SRTM image was extracted out while the focal statistics, the contour lines at an interval of 10 m and the stream courses were generated using the Spatial Analyst Tools in ArcMap. The streams were each buffered at a distance of 100 m to generate the inland valley areas using the Analysis/ Proximity/ Buffer Tools. The soils were generally sandy loam while the average bulk densities and gravel content values were 1.53 g/cm3 and 9% respectively. The nutrient concentration showed mean values of 1.02 %, 11.2 ppm, 0.25 cmol/kg, 3.77 cmol/kg, 1.66 cmol/kg and 3.32 % for nitrogen, phosphorus, potassium, calcium, magnesium and organic matter respectively which were suitable soil conditions for vegetable production.
Keywords: SRTM, inland valley soils, soil suitability, vegetable production Introduction The starch rich staple foods such as cassava, yam, rice and maize prepared in various recipes, dominated the diet of most Nigerians and several Africans for which therefore the consumption of indigenous vegetables would serve as cheap and important source of protein, vitamins, minerals and amino acids (Adekayode and Ogunkoya, 2011; Omara-Achong et al., 2012). The nutritive value of vegetables had also been documented in previous report (Bodroza-Solarov et al., 2008; Song et al., 2010). Fruits and vegetables had been confirmed to furnish valuable dietary nutrients and also contributed vital elements to chronic disease prevention for heart disease, hypertension, certain cancers, vision problems of aging and a reduction in the risk of developing Type 2 diabetes (Ogunlesi et al., 2010). The consumption of vegetables in diet had been reported to protect the human body from degenerative diseases as the main protective action of vegetables had been attributed to the antioxidant present in them (Stratil et al., 2006). The investigation carried out by Bressani et al. (1993) showed that amaranth protein was close to those of animal origin products while the high vitamin C content of amaranth had also been previously reported (Condes et al., 2009; Tironi and Anon, 2010).
2nd Annual International Interdisciplinary Conference, AIIC 2014, 8-12 July, Azores, Portugal Proceedings, Vol.3
298
The reports on the chemical composition of vegetables indicated orange and yellow vegetables and fruits including carrots, spinach, pumpkins and red peppers to be rich sources of beta-carotene while the dark green leafy vegetables were rich sources of lutein and zeaxanthin (Liu, 2013). The previous analysis result obtained in De-Lannoy (2001) on the composition of amaranth vegetable indicated one hundred grams to contain 3.6 to 4.6 g protein, 154 to 410 mg calcium, 2.9 to 8.9 mg iron, 5.7 to 6.5 mg beta-carotene, 23 to 64 mg vitamin C respectively. The previous reports had indicated the ideal topography for vegetable production to be nearly flat to slightly sloping, well drained and low areas because the efficacy of crop maintenance, irrigation and harvest operations would be greatly enhanced in fields with such topography (Udoh, 2005; Enete and Okon, 2010). The identification of such inland valley soils with the use of remote sensing and geographic information system technique had been reported in previous investigation (Ishaya and Mushi, 2008; Gumma et al. 2009). The generation of landscape configuration using Shuttle Radar Topographic Mission (SRTM) to display upland and valley areas was reported in Rodriguez et al. (2006) while the accuracy of vertical quality and the potential to derive terrain attributes from the digital elevation model obtained by contour lines from SRTM was reported on a digital soil mapping in Brazil (Neumann et al., 2012). The SRTM had been described to provide three-dimensional models with two spatial resolution of 1 arc-s (30 m) and 3 arc-s ( 90 m) with horizontal datum WGS84 and vertical datum WGS84/EGM96 with relative vertical accuracy on the order of 5 m (Smith and Sandwell, 2003) The use of buffering technique in assessing inland valley soils was described in Correll (2005) and the buffered zone included the stream bank and areas where the water table was near the surface. The high soil fertility status of inland valley soils which revealed the agricultural potential was discussed by Mustapha (2007) and Adigbo et al. (2011). The suitability of inland valley soils for increased okra production was reported in Nosiru et al. (2012) while Omara-Achong et al. (2012) in the investigative survey of indigenous vegetables species in parts of Cross River State, Nigeria, emphasized the availability of rich lowland soils as favourable factor in vegetable production. The inland valley areas in Nigeria which was popularly called fadama were identified as resource potential for food crop production and eight of such coordinating fadama areas identified and funded by the Federal Government of Nigeria were Sokoto Basin, Chad Basin, Middle Niger Basin, Southwestern Zone, South Central, South eastern and Basement Complex (Adigbo et al., 2011). The small holders who cultivated fadama inland valley soils used low input technology and were able to meet the needs of Nigeria for vegetables as importation of fresh vegetables were uncommon (Oladoja et al., 2005). The objectives of this research were to produce a contour map and generate stream courses in Akure South Local Government Area from SRTM imagery and buffer the identified streams as inland valley soils for vegetable production. Description of the Study Area The study area was the Akure Local Government Area which was one of the 774 Local Government Areas in Nigeria and where Akure (Latitute 7015’N and Longitude 5015’E) the capital of Ondo State Nigeria was located. The climate was tropical with rainy season of eight months (March to October) and a dry season of four months (November to February), a mean annual precipitation of 1000 to 1250 mm and a mean annual temperature of about 270C. The soil charactierisation as previously reported on soils of Southwest Nigeria by Smyth and Montgomery (1962) and updated in Periaswamy and Ashaye (1983) revealed soil type extensively occurring in Akure area to be Egbeda, Olorunda, Iwo, Ibadan, Balogun
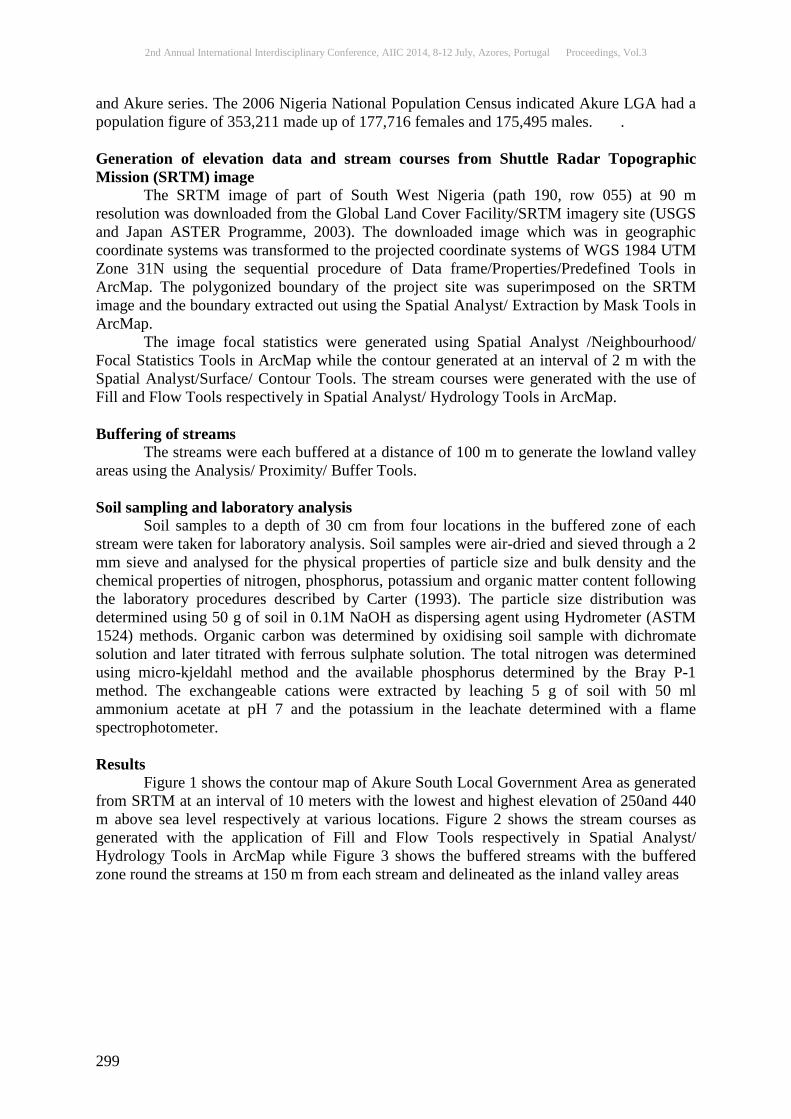
2nd Annual International Interdisciplinary Conference, AIIC 2014, 8-12 July, Azores, Portugal Proceedings, Vol.3
299
and Akure series. The 2006 Nigeria National Population Census indicated Akure LGA had a population figure of 353,211 made up of 177,716 females and 175,495 males. . Generation of elevation data and stream courses from Shuttle Radar Topographic Mission (SRTM) image The SRTM image of part of South West Nigeria (path 190, row 055) at 90 m resolution was downloaded from the Global Land Cover Facility/SRTM imagery site (USGS and Japan ASTER Programme, 2003). The downloaded image which was in geographic coordinate systems was transformed to the projected coordinate systems of WGS 1984 UTM Zone 31N using the sequential procedure of Data frame/Properties/Predefined Tools in ArcMap. The polygonized boundary of the project site was superimposed on the SRTM image and the boundary extracted out using the Spatial Analyst/ Extraction by Mask Tools in ArcMap. The image focal statistics were generated using Spatial Analyst /Neighbourhood/ Focal Statistics Tools in ArcMap while the contour generated at an interval of 2 m with the Spatial Analyst/Surface/ Contour Tools. The stream courses were generated with the use of Fill and Flow Tools respectively in Spatial Analyst/ Hydrology Tools in ArcMap. Buffering of streams The streams were each buffered at a distance of 100 m to generate the lowland valley areas using the Analysis/ Proximity/ Buffer Tools. Soil sampling and laboratory analysis Soil samples to a depth of 30 cm from four locations in the buffered zone of each stream were taken for laboratory analysis. Soil samples were air-dried and sieved through a 2 mm sieve and analysed for the physical properties of particle size and bulk density and the chemical properties of nitrogen, phosphorus, potassium and organic matter content following the laboratory procedures described by Carter (1993). The particle size distribution was determined using 50 g of soil in 0.1M NaOH as dispersing agent using Hydrometer (ASTM 1524) methods. Organic carbon was determined by oxidising soil sample with dichromate solution and later titrated with ferrous sulphate solution. The total nitrogen was determined using micro-kjeldahl method and the available phosphorus determined by the Bray P-1 method. The exchangeable cations were extracted by leaching 5 g of soil with 50 ml ammonium acetate at pH 7 and the potassium in the leachate determined with a flame spectrophotometer. Results Figure 1 shows the contour map of Akure South Local Government Area as generated from SRTM at an interval of 10 meters with the lowest and highest elevation of 250and 440 m above sea level respectively at various locations. Figure 2 shows the stream courses as generated with the application of Fill and Flow Tools respectively in Spatial Analyst/ Hydrology Tools in ArcMap while Figure 3 shows the buffered streams with the buffered zone round the streams at 150 m from each stream and delineated as the inland valley areas
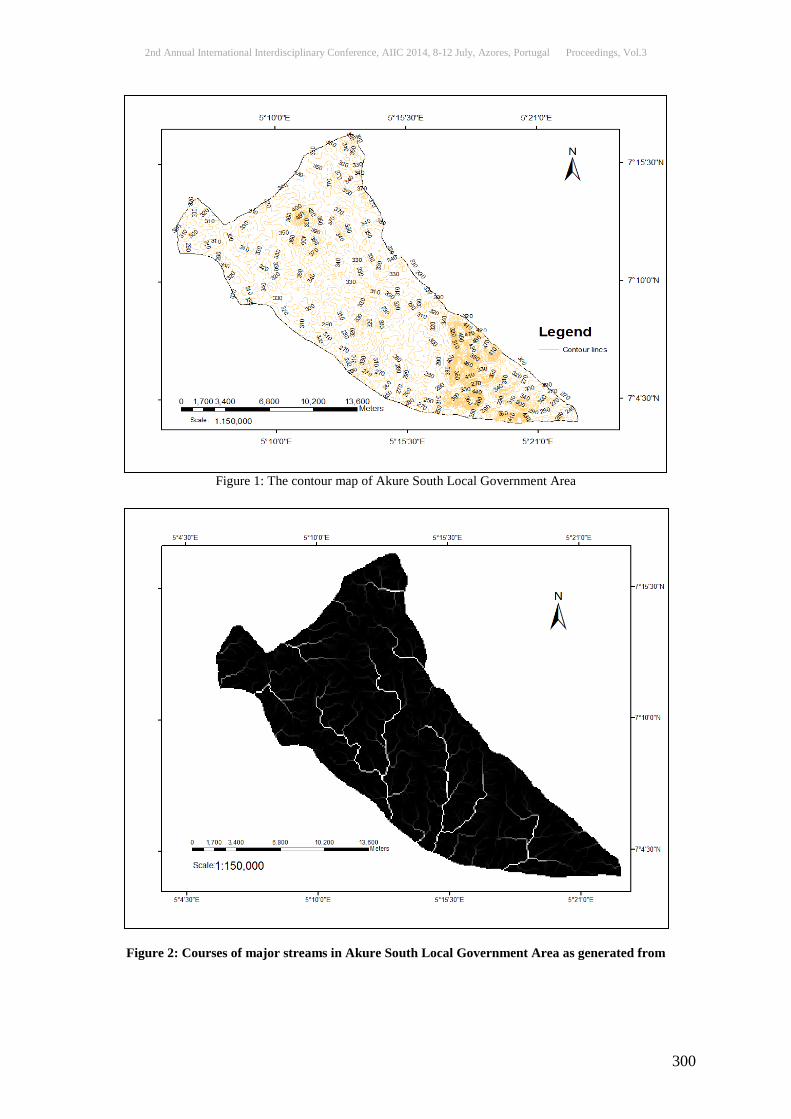
2nd Annual International Interdisciplinary Conference, AIIC 2014, 8-12 July, Azores, Portugal Proceedings, Vol.3
300
Figure 1: The contour map of Akure South Local Government Area
Figure 2: Courses of major streams in Akure South Local Government Area as generated from

2nd Annual International Interdisciplinary Conference, AIIC 2014, 8-12 July, Azores, Portugal Proceedings, Vol.3
301
SRTM
Figure 3: The streams buffered at 150 m to create the inland valley areas
Table 1 shows the physical and chemical properties of soil samples taken at twenty seven locations and made into nine composite. The soils were generally sandy loam while the bulk densities ranged from 1.52 to 1.54 g/cm3 with an average value of 1.53 g/cm3. The average gravel content was 9 % and ranged from 8 to 10 %. The pH range of 5.8 to 6.5 indicated the soil to be of medium to slight acidity. The nutrient concentration showed mean values of 1.02 %, 11.2 ppm, 0.25 cmol/kg, 3.77 cmol/kg, 1.66 cmol/kg and 3.32 % for nitrogen, phosphorus, potassium, calcium, magnesium and organic matter respectively.
Table 1: The physical properties of the soil
Sampling Points Sand %) Clay (%) Silt (%) BD (g/cm3) Gravel (%)
1 75 13 12 1.54 9 2 69 12 19 1.54 10 3 72 12 16 1.54 9 4 74 13 13 1.54 10 5 76 13 11 1.54 9 6 71 14 15 1.54 8 7 65 13 22 1.52 9 8 68 13 18 1.52 8 9 70 14 16 1.52 8
Table 2: Chemical properties of the soils
Sampling Point pH Organic Matter (%) N (%) P (ppm) K (cmol/kg) Ca (cmol/kg) Mg (cmol/kg)
1 5.8 3.17 0.96 10.40 0.23 3.50 1.59 2 6.2 3.39 1.03 11.13 0.25 3.75 1.70 3 5.9 3.23 0.98 10.61 0.23 3.57 1.62 4 6.1 3.36 1.02 11.02 0.24 3.71 1.69 5 6.0 3.27 0.99 10.71 0.24 3.61 1.64 6 6.1 3.24 1.02 11.20 0.25 3.80 1.62 7 6.5 3.47 1.09 11.98 0.27 4.07 1.73 8 6.2 3.30 1.04 11.42 0.26 3.88 1.65 9 6.5 3.43 1.08 11.87 0.27 4.03 1.72
2nd Annual International Interdisciplinary Conference, AIIC 2014, 8-12 July, Azores, Portugal Proceedings, Vol.3
302
Discussion The contour lines generated with the Spatial Analyst tool in ArcMap followed the explanation in Rabus et al. (2003) and Javis et al. (2008) on the generation of contour from SRTM data. The method which produced more accurate contour lines than the traditional approach of digitizing an existing topographic map enabled the varying of contour intervals for a more detailed outlook of the landscape configuration. The contour lines were produced as shape file from SRTM data through a conversion via the contour tool in the ArcGIS Spatial Analyst extension. Nag et al. (2013) in the previous study of the hydrological modeling of watershed used the contour map generated from SRTM image to generate the topography of the Wochhu river basin in Bhutan. The hydrological modeling that produced the stream courses in Figure 2 corroborated the procedures on watershed delineation and parameterizations carried out using cartographic DEM derived from digital topography and SRTM elevation data (Akbari et al., 2012). The generation of the stream courses followed the procedures in the application of spatial analyst tool in ArcGIS (ESRI, 2004). The previous investigation with similar hydrological observation was the use of SRTM data and ArcGIS 10 spatial analyst tools in the morphometric analysis of stream order and stream length in the Kosasthalaiyar sub basin in the Chennai basin in India (Nayar and Natarajan, 2013). The hydrology tool in the spatial analyst toolsets was used to model the flow of water to create a stream network across the surface (ESRI, 2014). The buffering as performed using the Analysis/ Proximity/ Buffer Tools corroborated the previous procedures adopted in the use of line-based road network buffers (Oliver et al., 2007) and the classification of buffered zone along stream courses as fadama soils (Adekayode and Ogunkoya, 2009). The soil nutrient concentration with average values of 1.02 %, 11.2 ppm, 0.25 cmol/kg, 3.77 cmol/kg, 1.66 cmol/kg and 3.32 % for nitrogen, phosphorus, potassium, calcium, magnesium and organic matter respectively indicated soil nutrient level to be of medium productivity which with the application of manure will be highly productive as Fadama soils. Previous investigation reported by Lawal et al. (2010) on the fertility status of inland valley soils discussed the improvement of soil fertility of fadama soils through the incorporation of manure while the adoption of “Sawah” farming system in inland valley soils characterized by nutrient replenishing mechanism was also discussed in Buri et al. (2012). Conclusion The contour map generated from SRTM indicated elevation ranges of 250and 440 m above sea level respectively at various locations. The total area of 3, 487.2 hectares generated as buffered zones round the identified streams constituted the inland valley areas and the potential areas for the production of vegetables and other dry season crops. References: Adekayode, F.O. and Ogunkoya, M.O. The use of Geographic Information Systems (GIS) in estimating a potential fadama land area for inland farming: The buffering technique. Journal of Food, Agriculture and Environment (JFAE), Volume 7 (3&4): 705 – 709, 2009. Adekayode, F.O. and Ogunkoya, M.O. Comparative effects of organic compost and NPK fertilizer on soil fertility, yield and quality of Amaranth in southwest Nigeria. International Journal of Biological and Chemical Sciences, 5(2):490-499, 2011. Adigbo, S.O., Wakatsuki, T., Odedina, J.N., Fabunmi, T.O. and Adigbo, V.B. Exploiting the Potentials of Inland Valleys of Nigeria for Poverty Alleviation. Proceedings of the Environmental Management Conference held at the Federal University of Agriculture, Abeokuta, Nigeria, pp. 465 – 478, 2011. http://www.unaab.edu.ng
2nd Annual International Interdisciplinary Conference, AIIC 2014, 8-12 July, Azores, Portugal Proceedings, Vol.3
303
Akbari, A., Samah, A.A. and Othman, F. Integration of SRTM and TRMM data into the GIS-based hydrological model for the purpose of flood modeling. Hydrology and Earth System Sciences Discussions, 9: 4747-4775, 2012. Bodroza-Solarov, M., Filipcev, B., Kevrezan, Z., Mandic, A. and Simurina, O. Quality of bread supplemented with popped Amaranthus cruentus grain. Journal of Food Process Engineering, 31:602-618, 2008. Bressani, R., De-Martell, E.C.M. and De Godinez, C.M. Protein quality evaluation of amaranth in adult humans. Plant Foods for Human Nutrition, 43(2): 123-143, 1993. Buri, M.M., Issaka, R.N., Wakatsuki, T. and Kawano, N. Improving the productivity of lowland soils for rice cultivation in Ghana: The role of the ‘Sawah’ system. Journal of Soil Science and Environmental Management, volume 3(3): 56-62, 2012. Carter, M. R. Soil Sampling and Methods of Soil Analysis. Canadian Society of Soil Science.Lewis Publishers, London.823pp, 1993. Condes, M.C., Scilingo, A.A. and Anon, M.C. Characterization of amaranth proteins modified by trypsin proteolysis structural and functional changes. Food Science and Technology, 42(5):963-970, 2009. Correll, D.L. Principles of planning and establishment of buffer zones. Ecological Engineering, 24: 433-439, 2005 De-Lannoy, G. Leaf Vegetables. Raemaekers RH (ed). Goekint Graphics nv: Belgium, 1540pp, 2001. Enete, A.A. and Okon, U.E. Economics of Waterleaf (Talinum triangulare) Production in Akwa Ibom State, Nigeria. Field Actions Science Reporting, Volume 4.factsreports.revues.org/438 2010. ESRI.ArcGIS Spatial Analyst.Advanced Raster Spatial Analysis, 2004. www.esri.com/library/brochures/pdfs/spatialanalystbro.pdf ESRI.ArcGIS Spatial Analyst Overview, 2014. www.esri.com/software/arcgis/extension/spatialanalyst Gumma, M., Thankabail, P.S., Fujii, H. and Namara, R. Spatial Models for Selecting the most suitable areas of rice cultivation in the Inland Valley wetlands of Ghana using Remote Sensing and Geographic Information Systems. Journal of Applied Remote Sensing, Volume 3, 033537: pp. 1-21, 2009. Ishaya, S. and Mashi, S.A. Using GIS to map fadama areas in the Central Abuja, Nigeria. Journal of Sustainable Development in Agriculture and Environment, 3(2): 110-118, 2008. Javis, A., Reuter, H.I., Nelson, A. and Guevara, E. Hole-filled SRTM for the globe, Version 4, CGIAR-CSI SRTM 90m Database, 2008.http://srtm.csi.cgiar.org Lawal, A.F., Omotesho, O.A. and Adewumi, M.O. Land use pattern and sustainability of food crop production in the Fadama of Southern Guinea Savanna of Nigeria. African Journal of Agricultural Research. Volume 5 (3): 178-187, 2010. Liu, R.H. Health Promoting Components of Fruits and Vegetables in the Diet. Advances in Nutrition, 4: 3845 – 3925, 2013. Mustapha, S. Fertility status of Fadama Soils in Dass Local Government Area of Bauchi State, Nigeria.Journal of Sustainable Development in Agriculture and Environment.Volume 3; 104 – 111, 2007. Nag, A., Penjor, K., Tobgay, S. and Jamtsho, C. Hydrological modeling of watershed using HEC-HMS software and ArcGIS. International Journal of Advanced Scientific and Technical Research, 2(3): 313-319, 2013. Nayar, V. and Natarajan, K. Quantitative Morphometric Analysis of Kosasthalaiyar sub basin using Remote Sensing (SRTM) data and GIS technique. International Journal of Geomatics and Geosciences, volume 4(1): 89-102, 2013.
2nd Annual International Interdisciplinary Conference, AIIC 2014, 8-12 July, Azores, Portugal Proceedings, Vol.3
304
Neumann, M.R.B., Roig, H.L. and de Souza, A.L.F. Digital elevation models obtained by contour lines and SRTM/Topodata for digital soil mapping. Journal of Soil Science and Environmental Management, 3(5): 104-109, 2012. Nosiru, M.O., Banjo, J.O.S. and Adedeji, T.O. Determinants of Improved Productivity of Okra (Abelmoschus esculentus) by Farmers in Lowland Areas of Ogun State, Nigeria. Amerivan-Eurasian Journal of Agriculture and Environmental Science, 12(12): 1572 – 1578, 2012. Ogunlesi, M., Okiei, W., Azeez, L., Obakachi, V., Osunsanmi, S. and Nkenchor, G. Vitamin C contents of Tropical Vegetables and Foods Determined by Voltametric and Titrimetric methods and their relevance to the medicinal uses of the plants. International Journal of Electrochemical Science, 5:105-115, 2010. Oladoja, M. A, Akinbile, L. A and Adisa, B. O. Assessment of the environmental related problems and prospects of vegetable products in peri-urban areas of Lagos State, Nigeria. Nigerian Journal of Environmental Extensions volume (5): 18-24, 2005. Oliver, L. N, Schuurman, N and Hall, A. W. Comparing Circular and Network Buffers to Examine the Influence of Land Use on Walking for Leisure and Errands. International Journal of Health Geographics. Vol 6:41, 2007. http://www.ncbi.nlm.nih.gov/pmc/articles/pmc2034381. Omara-Achong, T.E., Edwin-Wosu, N.L., Edu, E.A. and Nkang, A.E. Survey of indigenous vegetables species in parts of Ogoja and calabar, Cross River State, Nigeria. European Journal of Experimental Biology, 2(4): 1289 – 1301, 2012. Periaswamy, S.P. and Ashaye, T.I. Updated Classification of some Southwestern Nigeria Soils. Ife Journal of Agriculture 4(1&2), 25 – 41, 1982. Rabus, B., Eineder, M., Roth, A., & Bamler, R.The shuttle radar topography mission.A new class of digital elevation models acquired by spaceborne radar. ISPRS J. Photogram. Remote Sensing, 57, 241- 262, 2003. Rodríguez, E., C.Morris, and E.Belz, 2006: A global assessment of the SRTM performance. Photogramm.Eng. Remote Sens., 72, 249–260, 2006. Smith, B, and Sandwell, D. Accuracy and resolution of shuttle radar topography mission data. Geophysical Research.Letters., 30(9): 1467-1470, 2003. Smyth, A. J. Montgomery, R. F. Soils and Land use in Central Western Nigeria, Ibadan Government Printer, pp 265, 1962. Song, W., Derito, C.M., Liu, K.M., Liu, H.X., Dong, M. and Liu, R.H. Cellular antioxidant activity of common vegetables. Journal of Agriculture and Food Chemistry, 58: 6621 – 6629, 2010. Stratil, P., Klejdus, B. and Kubán, V. Determination of total content of phenolic compounds and their antioxidant activity in vegetables--evaluation of spectrophotometric methods. J Agric Food Chem. 8:54 (3):607-616, 2006. Tironi, V.A. and Anon, M.C. Amaranth proteins as a source of antioxidant peptides: Effect of proteolysis. Food Research International, 43(1): 315-322, 2010. Udoh, E.J. Technical Inefficiency of Vegetable Farms of Humid Region: Analysis of Dry Season Vegetable Farming of Urban Women in South South Zone, Nigeria. Journal of Agriculture and Social Sciences, 1: 80 – 85, 2005. USGS and Japan ASTER Programme, ASTER, 2003. Scene AST_LIB_003_06262000100635,1B,ASGS,SiouxFALLS,6/26/2001.
2nd Annual International Interdisciplinary Conference, AIIC 2014, 8-12 July, Azores, Portugal Proceedings, Vol.3
305
THE TEA TIME HAS CHANGED IN AZORES
O tempo que mudou o chá dos Açores O terceiro tempo: Do aprender ao primeiro arranque (1878-1879)
Por Mário Moura University of Azores- Portugal
Aabstract This article focuses in the azorean third tea period (1878-1879), time to learn and the first move towards tea industry. This time is made up of two periods: First, time to collect and make tea (March to July 1878); Second, time to collect and make tea (April to July 1879). With the hiring of two Chinese tea technicians, Lau-a-Pan (the master) and Lau-a-Teng (the interpreter) by the local agricultural society, locals rapidly acquired two things: how to grow and make tea and the value of his tea. Tea industry brought together first and second generation SPAM members, who, to cope with wine and orange crises, among other products, invested in tea. Industry mainly developed in Saint Michaels’s Island.
Keywords: Lau-a-Pan; Lau-a-Teng; Chá; Sociedade Promotora da Agricultura SPAM; Chinas; José do Canto, Ernesto do Canto, Caetano Andrade de Albuquerque, Rafael de Almeida
Resumo Este artigo centra-se no tempo que mudou o chá dos Açores, o terceiro, do aprender ao primeiro arranque (1878-1879). Tempo dividido em duas temporadas: Primeira apanha e fabrico de chá (Março a Julho de 1878); Segunda apanha e fabrico de chá (de Abril a Julho de 1879). Com a contratação de dois técnicos oriundos de Macau, Lau-a-Pan (mestre) e Lau-a-Teng (interprete e ajudante), pela Sociedade Promotora da Agricultura Michaelense, os micaelenses aprenderam rapidamente: Primeiro, a cultivar e a produzir chá; segundo, que o seu chá era propício. O projecto juntou a primeira e a segunda gerações de sócios, que, para encontrar uma saída, face às crises da laranja e do vinho, apostaram no chá, tal como em outras culturas agro-industriais. A indústria do chá desenvolveu-se essencialmente na ilha de São Miguel.
Palavras-chave: Lau-a-Pan, Lau-a-Teng; Chá; Sociedade Promotora da Agricultura SPAM; Chinas; José do Canto, Ernesto do Canto, Caetano Andrade de Albuquerque, Rafael de Almeida. Introdução ‘(…) Fizemo-lo, Senhor! (…).’ Em janeiro de 1879, Caetano Andrade de Albuquerque, Presidente da Sociedade Promotora da Agricultura Micaelense [SPAM], dirigia-se nestes termos ao rei D. Luís. Dizia isso porque em dez meses apenas ‘os ensaios já realizados [do chá] levam-nos a crer que no futuro poderá este Distrito [Ponta Delgada] contar com uma importante fonte de riqueza (…).’

2nd Annual International Interdisciplinary Conference, AIIC 2014, 8-12 July, Azores, Portugal Proceedings, Vol.3
306
Sem esconder a vaidade, colocava o feito ‘(…) entre os cometimentos ousados que esta sociedade [SPAM] tem empreendido figura talvez, como o principal a sua iniciativa em ensaiar e introduzir neste Distrito [Ponta Delgada] a cultura e preparação do chá14.’ Afinal, que sucedera?15 Para responder à pergunta, vamos concentrar a nossa atenção, de uma maneira geral, entre a terça-feira, dia 5 de Março de 1878, dia em que os chineses Lau-a-Pan e Lau-a-Teng chegaram a Ponta Delgada vindos de Macau16 no navio Luso17, e, sexta-feira, dia 18 de Julho de 1879, quando partiram de volta a Macau no Açor18. A documentação compulsada, confirma-nos que foram dezasseis meses decisivos, vividos intensamente, mobilizadores de recursos, humanos e financeiros, como só até então, possivelmente, fora, tanto quanto se sabe, o caso da aposta prosélita e didáctica da SPAM no jornal o Agricultor Michaelense. [Vide Nota 1] Mais precisamente, vamos analisar o essencial do tempo de viragem na cultura e manipulação do chá nos Açores19: o terceiro tempo (1878-79) 20. [Vide Nota 2] Naquele terceiro tempo, aprendeu-se rapidamente a manipular o chá e comprovou-se a qualidade do chá produzido e o valor das plantas de chá locais. Foi o primeiro passo para transformar o chá, de simples planta com possibilidades económicas, em planta com real
14 Cf. Sociedade Promotora da Agricultura Micaelense (SPAM), Atas da Direção de 1873-1887, Livro nº 6, Sessão de 29 de Janeiro de 1879, Fls. 58-61, in Biblioteca Pública e Arquivo Regional de Ponta Delgada (BARPD). 15 Para começar a entrar nos temas da SPAM, vide, entre outros: Carlos Enes, Sociedade Promotora da Agricultura Micaelense, http://www.culturacores.azores.gov.pt/ea/pesquisa/default.aspx?id=10194; Margarida Machado, A Sociedade Promotora da Agricultura Micaelense: a intervenção associativa das elites sociais no mundo económico das ilhas, [s.d: depois de 2007]; PT/BPARPD/ASS/SPAM: Descrição do Fundo da SPAM, Sociedade Promotora da Agricultura Micaelense. 16 Cf. Francisco Maria Supico, As Escavações, Instituto Cultural de Ponta Delgada, vol. III, 1995, p. 1025: ‘Em 5 de Março [terça-feira] de 1878 chegaram a Ponta Delgada dois chineses, Lan Pan e Lan Teng, contratados pela Sociedade de Agricultura para ensinarem a manipulação do chá.’ 17 Cf jornal Açoriano Oriental, Ponta Delgada, 7 de Março de 1878. 18 Cf. jornal A Persuasão, Ponta Delgada, n.º 908, 11 de Janeiro de 1879, e vide Francisco Maria Supico: op. cit., p.p. 10278: Partida dos chineses que haviam chegado a 5 de Março de 1878 a [18 de Julho de 1879] ‘Chinos. Sexta-feira passado no Açor saíram com destino para sua pátria, Macau, os operários chineses mandados vir para ensinar aqui a preparação do chá. Foi uma arrojada tentativa da sociedade de agricultura que esperamos ver coroada de bom êxito’. 19 Para iniciar o conhecimento no chá dos Açores, vide Joaquim Machado (2001), Chá: http://www.culturacores.azores.gov.pt/ea/pesquisa/default.aspx?id=1682; Isabel Albergaria, Umna coltivazione esotica alle Azzores: il te di São Miguel [s.s] [no prelo]; Margarida Machado, The Culture of the tea in São Miguel island as a connection bridge to the east, in actas do 1.º international interdisciplinary conference on Macao studies: intelectual exchanges between east and west, 2009, no prelo; Duarte Melo, AAVV, Chá em S. Miguel. Cultura e Vivências. Museu Carlos Machado, 2012. 20 Em abril passado, propuseram-se onze tempos para ordenar os tempos do chá nos Açores entre 1801 e 2014. 1801: ano em que o Capitão Geral dos Açores, D. Antão de Almada deu conta ao rei da existência da planta de chá na ilha Terceira e recomendava-lhe o seu aproveitamento económico, cf. Arquivo dos Açores, vol. XIII, Ponta Delgada, 1983, pp.515-516. 2014: ano em que, após anos de declínio da indústria do chá, se espera uma continuada retoma. Mário Moura, Onze tempos do chá nos Açores (Proposta de esboço), Congresso de Lusofonias, Porto Formoso, Abril de 2014. Para arrumar aqueles tempos, cruzaram-se várias fontes: textos jornalísticos, de arquivo, livros, folhetos, anúncios publicitários, imagens e literatura técnica auxiliar dos primeiros passos do chá nos Açores. Porém, sendo a cronologia uma ferramenta basilar do conhecimento, toda e qualquer cronologia é, além de discutível, provisória. Ei-los: 1.º Tempo: Da espontaneidade às primeiras tentativas de produzir chá (1801-1873); 2.º Tempo: De quem soubesse ensinar (1873-1878); 3.º Tempo: Do aprender ao primeiro arranque (1878-1879); 4.º Tempo: Do segundo arranque (1879-1882); 5.º Tempo: De arranque individual (1882-1891); 6.º Tempo: De aceleração (1891-1913); 7.º Tempo: De balanço: entre a euforia e o medo (1913-1932); 8.º Tempo: Do medo à expansão (1932 – 1960); 9.º Tempo: Dos avisos ao declínio (1960-1984); 10.ºTempo: De recuperação e esperança (1984-2000); 11.º Tempo: Tempo do chá faz bem à saúde.

2nd Annual International Interdisciplinary Conference, AIIC 2014, 8-12 July, Azores, Portugal Proceedings, Vol.3
307
potencial económico. [Vide nota 3] Algo que só começará em força no sexto tempo (1891-1913). Mas disto não se tratará aqui. A nossa tese é basicamente a que se segue: aprende-se rapidamente a cultivar e a transformar chá na ilha de São Miguel. Ainda antes de findar a primeira temporada de colheita (Março a Julho de 1878). A área por excelência de cultura e transformação do chá dentro da ilha de São Miguel fica definida desde o início: a Ribeira Grande. O projeto é uma parceria, partilha quase sem delimitação de esferas, entre sócios e associação. Com apoio parcial dos poderes públicos. Sobrevoo ao Primeiro Tempo do chá (1801-1873): Da espontaneidade às primeiras tentativas de produzir chá Para melhor apreender o sentido do terceiro tempo do chá em S. Miguel, entremos ao de leve no final do primeiro tempo, que termina a 30 de Novembro de 1873 com a deliberação da Assembleia-Geral da Sociedade Promotora da Agricultura Micaelense em recorrer a técnicos de fora21. Este primeiro tempo do chá (1801-1873) é caracterizado pelo desconhecimento inicial do chá e pela procura final de um ‘método preciso para o fazer chegar à sua última perfeição’. No final deste período, antes da vinda dos dois primeiros chineses, havia quem cultivasse e tentasse produzir chá nos Açores: ‘(…) metiam em frascos algumas folhas tenras, e quando bem murchas com elas faziam chá. Por muito acre não se podia tomar22.’ Em 1873, chegou-se á conclusão que era tempo de experimentar a sério. De passar da iniciativa individual à iniciativa associativa. Conhecem-se várias versões explicativas da introdução do chá na ilha de S. Miguel ao longo deste 1.º Tempo23, porém, nenhuma nos parece tão segura como a que documenta os esforços de José do Canto (1820-1898).24 21 Cf. Sociedade Promotora da Agricultura Micaelense (SPAM), das Assembleias-Gerais da SPAM, 1851-1887, Acta de 30 de Novembro de 1873, fls. 35 v-36, BPARPD, SPAM: Este 1.º Tempo vai dos períodos da espontaneidade às primeiras tentativas de utilização conhecidas (1801-1873). Para compreender este primeiro tempo, melhor será dividi-lo em três momentos. Um primeiro, supostamente longo, anterior a 1801, do qual pouco ou nada sabemos; outro, que irá de 1801 a cerca 1820, durante o qual torna-viagens do Brasil ou de outras partes do Império Colonial Ultramarino português ou de outra potência europeia, não se sabe ao certo, trouxeram para os Açores, não se sabe para que ilhas, sementes e estacas; ainda outro, que partirá de cerca de 1820 a 1873, em que vieram sementes e estacas do Brasil e de outras partes. Neste último período, houve tentativas, por parte de alguns cultivadores, de produzir chá. Neles, inclui-se, entre outros pouco ou mal conhecidos, José do Canto. 22 Cf. Francisco Maria Supico, op. cit, vol. III, ICPD, 1995, p. 1031. 23 Idem, vol. III, 1995, p. 1024. A este respeito vide também A Persuasão, 15 de Abril de 1874: ‘(…) Trazida do Rio de Janeiro, por Jacinto Leite Pacheco (…) por 1820 (…)’; Francisco Maria Supico, As Escavações, vol. III, ICPD, 1995, p. 1031: ‘Depois de impresso o nosso último trabalho tratando do chá, tivemos um agradabilíssimo encontro com o primoroso cavalheiro Sr. José Maria da Câmara Coutinho, que nos informou [Francisco Maria Supico] (…) morgado João Soares dos Pinheiros, que um homem que fora seu criado trouxera do Brasil a semente da camélia do chá, para o presentear com ela, e a semeara nas suas propriedades de Santo António, deste Concelho, de onde algumas plantas passaram para a grande propriedade das Capelas de António Lopes Soeiro de Amorim (…) Só de uma vez, para o Dr. Ernesto do Canto semear do Pico do Cedro, lhe proporcionou das Capelas uns dois alqueires de semente o Sr. José Maria da Câmara. E foram as sementes que por cá tínhamos, que mais valeram para a posterior multiplicação. As que vieram com os chinos perderam-se muito em razão do estrago que lhes causou a longa viagem. Também não resistiram aos acidentes da viagem as plantas mandadas vir para aromatizar o chá. Mas não faziam falta, pois que tínhamos cá a principal. Porém nunca se usou para tal fim.’ 24Haverá certamente outros que tentaram fazer o que José do Canto fez, mas, até ao momento nada encontrámos de tão seguro como o que se encontra no arquivo daquele. José do Canto nasceu a 20 de dezembro de 1820 em S. Pedro, na cidade de Ponta Delgada, e faleceu a 10 de Junho de 1898. Foi Presidente da Junta Geral do Distrito de Ponta Delgada e uma das personalidades mais eminentes do seu tempo na ilha de S. Miguel, que lhe ficou devendo assinalados serviços na agricultura e na indústria. Foi também notável bibliófilo e, como tal, autor da
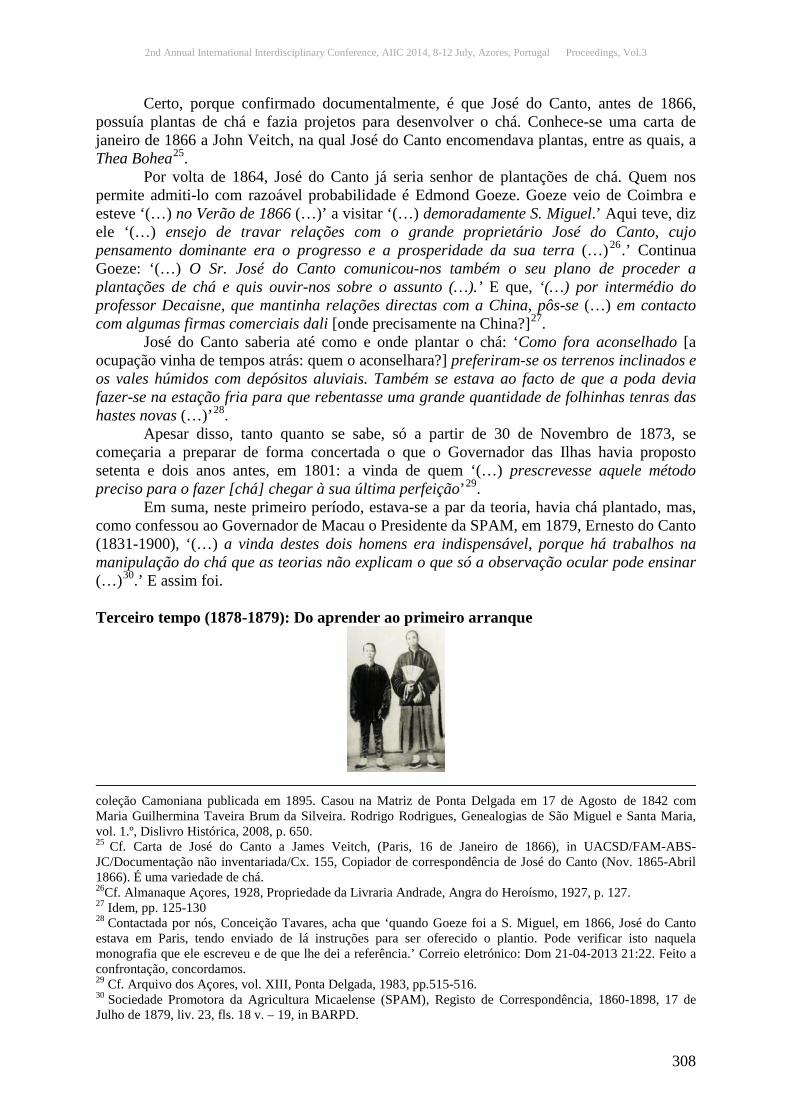
2nd Annual International Interdisciplinary Conference, AIIC 2014, 8-12 July, Azores, Portugal Proceedings, Vol.3
308
Certo, porque confirmado documentalmente, é que José do Canto, antes de 1866, possuía plantas de chá e fazia projetos para desenvolver o chá. Conhece-se uma carta de janeiro de 1866 a John Veitch, na qual José do Canto encomendava plantas, entre as quais, a Thea Bohea25. Por volta de 1864, José do Canto já seria senhor de plantações de chá. Quem nos permite admiti-lo com razoável probabilidade é Edmond Goeze. Goeze veio de Coimbra e esteve ‘(…) no Verão de 1866 (…)’ a visitar ‘(…) demoradamente S. Miguel.’ Aqui teve, diz ele ‘(…) ensejo de travar relações com o grande proprietário José do Canto, cujo pensamento dominante era o progresso e a prosperidade da sua terra (…)26.’ Continua Goeze: ‘(…) O Sr. José do Canto comunicou-nos também o seu plano de proceder a plantações de chá e quis ouvir-nos sobre o assunto (…).’ E que, ‘(…) por intermédio do professor Decaisne, que mantinha relações directas com a China, pôs-se (…) em contacto com algumas firmas comerciais dali [onde precisamente na China?]27. José do Canto saberia até como e onde plantar o chá: ‘Como fora aconselhado [a ocupação vinha de tempos atrás: quem o aconselhara?] preferiram-se os terrenos inclinados e os vales húmidos com depósitos aluviais. Também se estava ao facto de que a poda devia fazer-se na estação fria para que rebentasse uma grande quantidade de folhinhas tenras das hastes novas (…)’28. Apesar disso, tanto quanto se sabe, só a partir de 30 de Novembro de 1873, se começaria a preparar de forma concertada o que o Governador das Ilhas havia proposto setenta e dois anos antes, em 1801: a vinda de quem ‘(…) prescrevesse aquele método preciso para o fazer [chá] chegar à sua última perfeição’29. Em suma, neste primeiro período, estava-se a par da teoria, havia chá plantado, mas, como confessou ao Governador de Macau o Presidente da SPAM, em 1879, Ernesto do Canto (1831-1900), ‘(…) a vinda destes dois homens era indispensável, porque há trabalhos na manipulação do chá que as teorias não explicam o que só a observação ocular pode ensinar (…)30.’ E assim foi. Terceiro tempo (1878-1879): Do aprender ao primeiro arranque
coleção Camoniana publicada em 1895. Casou na Matriz de Ponta Delgada em 17 de Agosto de 1842 com Maria Guilhermina Taveira Brum da Silveira. Rodrigo Rodrigues, Genealogias de São Miguel e Santa Maria, vol. 1.º, Dislivro Histórica, 2008, p. 650. 25 Cf. Carta de José do Canto a James Veitch, (Paris, 16 de Janeiro de 1866), in UACSD/FAM-ABS-JC/Documentação não inventariada/Cx. 155, Copiador de correspondência de José do Canto (Nov. 1865-Abril 1866). É uma variedade de chá. 26Cf. Almanaque Açores, 1928, Propriedade da Livraria Andrade, Angra do Heroísmo, 1927, p. 127. 27 Idem, pp. 125-130 28 Contactada por nós, Conceição Tavares, acha que ‘quando Goeze foi a S. Miguel, em 1866, José do Canto estava em Paris, tendo enviado de lá instruções para ser oferecido o plantio. Pode verificar isto naquela monografia que ele escreveu e de que lhe dei a referência.’ Correio eletrónico: Dom 21-04-2013 21:22. Feito a confrontação, concordamos. 29 Cf. Arquivo dos Açores, vol. XIII, Ponta Delgada, 1983, pp.515-516. 30 Sociedade Promotora da Agricultura Micaelense (SPAM), Registo de Correspondência, 1860-1898, 17 de Julho de 1879, liv. 23, fls. 18 v. – 19, in BARPD.

2nd Annual International Interdisciplinary Conference, AIIC 2014, 8-12 July, Azores, Portugal Proceedings, Vol.3
309
Vamos, pois, focar a nossa atenção num período (1878-1879), o terceiro, que encerra duas temporadas de colheitas e fabrico de chá (Primeira, em 1878, e segunda, em 1879). Nele, a SPAM pretende continuar a aliar a teoria à prática. César Supico, irmão de Francisco Supico, dono e redator do jornal micaelense A Persuasão, intermediário na contratação dos dois técnicos chineses que haveriam de chegar, escreve de Macau ao irmão a comunicar-lhe que estes já haviam partido e que ‘haviam (prestado) provas de aptidão em um exame que lhes foi feito por três mestres de fábricas (…)31.’ Eram Lau-a-Pan e Lau-a-Teng, eram casados e residiam em Macau32. Lau-a-Pan era o mestre e recebia ‘24$000’ por mês em S. Miguel enquanto a família em Macau recebia outra metade 33 . O ajudante, Lau-a-Teng, que se destinava a ser intérprete e, por não ser suficientemente bom, foi contratado Rafael de Almeida, secretário da SPAM34, que ganhava ‘15$000’ nas mesmas condições35. Ambos recebiam para ‘géneros alimentícios 6$72036.’ Fora isso, recebiam quase sempre ‘1$780’ para arroz37.’ Não pagavam renda, tinham roupa lavada38 e direito a medicamentos39. Para os motivar, ou por serviços fora do contratado, como feitura de objectos, viriam a receber gratificações extras40. Rafael de Almeida, secretário da SPAM, que os acompanhou e serviu de intérprete, diz-nos que eram ‘pouco tratáveis’. Lau-a-Pan era ‘folgazão, cheio de crenças fabulosas e adorador (do) sol (…).’ Era diferente do ajudante, ‘(…) não só pela estatura (….)’, era mais alto, mas também porque ‘não entend(ia) senão o seu idioma (…).’ O ajudante era ‘(…) mais intérprete (do) que entendedor no fabrico do chá e cultura, (…).’ Era ‘pouco tratável.’ E, ‘além do seu idioma natal, fala(va) o inglês (…). Chama-se António, por ter abandonado o de Lau-a-Teng, abraçando a religião católica (…) Ambos ‘trajam costumes chineses e portugueses, não lhe faltando o seu principal luxo o rabicho. O mestre tem-no de metro e meio e o coadjutor (Lau-a-teng) de 90 centímetros (…) o seu mais favorito prazer é o ópio.’41 A Direcção da SPAM, na pessoa do seu vice-presidente, o Barão de Fonte Bela, conhecedor de que os chineses vinham a caminho, logo a 7 de janeiro, dá início ao lançamento das bases da aprendizagem pelos locais do que faltava saber para produzir chá na terra. Em primeiro lugar, convida ‘os cultores de chá (da) ilha a mandarem declarar (naquela) sociedade (…) o número e preparação de plantas de chá que possuem em condições de aproveitarem os trabalhos e experiencias dos chinas conforme a missão para 31 Cf. carta de Augusto César Supico a Francisco Maria Supico, Macau, 13 de Novembro de 1877, in BPARD, EC, corr/1027. 32 Cf. Tabelionato, Ponta Delgada, Tabelião Luís Maria de Morais Jr., liv.2475-2477, fls 32 v.-33, in BPARPD. 33 Cf. Sociedade Promotora da Agricultura Micaelense (SPAM), contas da Direcção, 1878-1879, 22 de Março de 1879, liv. 12, fls. 38-39, in Biblioteca Pública e Arquivo Regional de Ponta Delgada (BARPD). 34 Cf. Genealogias das ilhas de São Miguel e Santa Maria, Rodrigo Rodrigues, Sociedade Afonso de Chaves, Ponta Delgada, vol. IV, 1998, p. 2513: Rafael de Almeida – Filho natural de Miguel Ângelo Marfim Pereira, conhecido por Miguel de Almeida, e de Jacinta de Jesus. Nasceu em Ponta Delgada a 31.10.1857. Era irmão de Gabriel de Almeida. 35 Sociedade Promotora da Agricultura Micaelense, As contas da Direcção. Op. Cit., 22 de Março de 1879, liv. 12, fl. 39. 36 Idem, 22 de Março de 1879, liv. 12, fl. 39. 37 Ibidem, 6 de Abril de 1878, liv. 12, fl. 9. 38 Sociedade Promotora da Agricultura Micaelense (SPAM), As contas da Direcção em Conta Corrente com a Sociedade, 1878-1901, 8 de Junho de 1878, liv. 13, fl. 12, in BPARPD. 39Sociedade Promotora da Agricultura Micaelense (SPAM), As contas da Direcção: op. Cit, 12 de Outubro de 1878, liv. 12, fl. 25. 40 Idem, 19 de Outubro de 1878, liv. 12, fl. 25. 41 Cf. Rafael de Almeida, O Chá, os Chins da Sociedade Promotora da Agricultura Micaelense, suas crenças e costumes, o fumar o ópio, alegrais opiadas, o amor à sua pátria e a cega obediência às suas leis, Ponta Delgada, Janeiro de 1879, in. A Persuasão, n.º 908, 11 de Junho de 1879, pp. 1-2.

2nd Annual International Interdisciplinary Conference, AIIC 2014, 8-12 July, Azores, Portugal Proceedings, Vol.3
310
que vem contratados.’ Em seguida, recomendava ‘(…) a conveniência de cada um proceder a podas imediatas das plantas de chá (…) a fim de que na próxima primavera, à chegada dos chinas a esta ilha, se achem em estado favorável de desenvolvida e formada vegetação para o estudo e ensaios que se pretendem (…).’ Por último, anunciava-se aos ‘(…) sócios, ou outras quaisquer pessoas que pretende(ssem) sementes de plantas deste arbusto, as podem reclamar na sede (…)42.’ Já estando os dois chineses na ilha há treze dias, a 18 de Março, sob a presidência do Dr. Caetano d’Andrade Albuquerque, reúne-se a Direção. Nesta reunião, ‘sob proposta (de) José do Canto foi nomeada uma comissão (…) para dirigir os trabalhos de manipulação e preparo do chá43.’ Era composta por Caetano de Andrade Albuquerque, Ernesto do Canto, relator da comissão, Manuel Botelho de Gusmão, José Maria da Coutinho e José Maria Raposo d’Amaral Júnior. Além do intérprete, Rafael de Almeida, secretário da SPAM, os membros da comissão iriam acompanhar de perto as experiências. Não havia tempo a perder - mestre Lau-a-Pan e o ajudante Lau-a-Teng, traziam na bagagem sementes do arbusto e modelos de todas as ferramentas e utensílios precisos para o trabalho. Primeira temporada de colheitas e fabrico de chá (7 de Março de 1878 a 22 de Julho de 1878)44 A experiência do chá inicia-se na Ribeira Grande, mais precisamente na Mãe de Água, vai ao Pico da Pedra, Porto Formoso e às Capelas45. A primeira apanha, com produção de chá, decorreu durante os meses de Março, Abril, Maio, Junho e Julho. Em Março, trabalhou-se nos dias ‘15, 19, 25.’ Em Abril, nos dias: ‘5, 16, 23, 24.’ Em Maio, nos dias: ‘5, 6, 7, 8, 9, 10.’ Em Junho: ‘19, 23.’ E Julho: ‘15 e 22.’ Foram dezassete dias em cinco meses, que renderam: ‘(…) Aproximadamente oito quilos d chá preto e 10 quilos de chá verde46.’ Lau-a-Pan e Lau-a-Teng chegaram na terça e na quinta, ‘dia 7 [de Março foram] à Mãe d’Agua da Ribeira Grande ver um plantio de chá, que o Exmo. José do Canto ali possui, e que tinha admirado profundamente o desenvolvimento das plantas (…).’ Trouxeram folhas para a sede em Ponta Delgada, onde se estava a instalar a fábrica de chá: ‘(…) que preparam no dia [sexta, dia 8 de Março] imediato com este chá (…).’ Todavia, esta primeira experiência foi um fracasso: ‘(…) depois de concluído o preparo, fizeram-se alguns ensaios mas de que nada se pôde colher (…).’ Insucesso que se deveu, segundo se concluiu: ‘(…) por estar ainda [o chá] muito novo 47 .’ Visitaram, segundo o relatório da SPAM, diversas propriedades de distintos sócios, não sabemos quem exactamente, igualmente sem sucesso, porque ‘as folhas começavam a vegetar, e que só mais tarde teriam folhas novas e tenras únicas convenientes para a fabricação.’48 O relatório da comissão da SPAM, mais tarde refere o dia 14: ‘No dia 14 de Março colheram-se as primeiras folhas, nas propriedades do nosso consócio Sr. José do Canto, e no
42 BPARPD, SPAM Atas da Assembleia-Geral, 27 Fevereiro 1851 – 1882, Livro nº 2, Sessão de 7 de Janeiro de 1878, Fls. 63-64v. 43 Sociedade Promotora da Agricultura Micaelense (SPAM), Atas da Direção de 1873-1887, Livro nº 6, Sessão de 18 de Março de 1878, fls. 50v-51v, in BPARPD. 44 CF. Frei Leandro do Sacramento, Memória Económica sobre a Preparação do Chá, Precedida do relatório feito pela Comissão nomeada pela Sociedade Promotora da Agricultura Micaelense para assistir à Manipulação do chá em Ponta Delgada, 1879, p. IV. 45 Idem, p. IV. Neste trabalho refere Ribeira Grande, Pico da Pedra, Porto Formoso e Capelas. Porém, nas contas da SPAM, não há despesas com idas ao Porto Formoso. Porque razão? Foram ao Porto Formosa, mas a ida não gerou despesas? 46 Ibidem, p. IV. 47 Cf. Sociedade Promotora da Agricultura Micaelense (SPAM), Atas da Direção de 1873-1887, Livro nº 6, Sessão de 18 de Março de 1878, fls. 50v-51v, in BPARPD. 48 Frei Leandro do Sacramento, Op. Cit., p. III.

2nd Annual International Interdisciplinary Conference, AIIC 2014, 8-12 July, Azores, Portugal Proceedings, Vol.3
311
imediato foram manipuladas na sede da Sociedade, na casa de antemão preparada com a fornalha e outros aprestes indispensáveis.’49 Uma nota de despesa da SPAM de 6 de Abril de 1878, dá-nos conta de uma outra ida à Ribeira Grande, não já à Mãe de Água (Matriz), mas à Caldeira Velha (Conceição): ‘Por frete a 3 burros pela condução dos Chinas, da Ribeira Grande ao mato da Caldeira Velha, a colherem folhas de chá do prédio que lá possui o (…) sócio José do Canto (…)50.’ Com a mesma data, deu-se uma ida ao Pico da Pedra: ‘(…) por frete de um carro por conduzir os Chinas ao lugar do Pico da Pedra (…)51.’ Estava-se, apesar de não se dizer explicitamente, à procura do melhor chá. Para transformar a folha verde em chá pronto a ser usado como bebida, foi necessário continuar a equipar, já com a orientação do técnico chinês, deve supor-se, a fábrica/oficina que começara a ser montada nas antigas instalações do convento da Conceição, em Ponta Delgada, ainda antes da chegada dos dois chineses: ‘(…) Por compra de pedra, cal, barro, e féria aos pedreiros em arranjar a fábrica para o chá (…)52.’ Urgia reunir a Direcção. Era necessário acompanhar de perto as experiências. Daí a reunião de 15 de abril de 1878, sob a presidência de Caetano de Andrade Albuquerque na presença de todos os membros. A vinda dos dois chineses provocou de imediato ondas de interesse, a começar por outros quererem experimentar o mesmo, assim a Sociedade de Agricultura da Ilha Terceira pedia ‘(…) algumas plantas de chá para ensaios naquela Ilha.’ Porém, ‘ (…) visto o número de plantas (…) ser muito limitadas não lhe é possível presentemente satisfazer o seu pedido o que fará logo que possa.’ Provocou a reação de funcionários da SPAM que se viam a braços com mais trabalho ganhando muito menos que os dois chineses: o ‘(…) escriturário da Sociedade Rafael de Almeida pedindo aumento de ordenado visto terem aumentado consideravelmente as suas atribuições com a vinda dos Chinas e outro do cobrador Manuel Machado dizendo que havia sido contractado exclusivamente para o serviço da cobrança e que era com tudo empregado (…).’ Entretanto, por muito que o chá ocupasse a SPAM, e ocupava, pensa-se também no ananás: ‘foi deliberado mais anunciar aos cultivadores de ananases que a Sociedade tenciona expor alguns frutos na exposição de Paris53.’ Continuava-se na primeira temporada de colheitas e de manipulação do chá, começada logo a 7 de Março, mas com os primeiros sinais de êxito apenas a partir de 14 de Março. Desde os primórdios que o denominado mato da Ribeira Grande, que deve corresponder à Caldeira Velha, hoje conhecido como mato de José do Canto, se torna num local de eleição: ‘Por frete a 4 burros de conduzir os Chins e aprestes para a manipulação do chá no mato da Ribeira Grande (…)54.’ Aliás, seria naquele local que José do Canto viria a construir a primeira fábrica de raiz já na década de noventa. Ainda mal começara a primeira temporada de colheitas e de manipulação do chá, em abril de 1878, a direção da SPAM já dava novos passos rumo ao futuro da nova cultura agro-industrial. A Spam abria as portas do ‘ensino [do chá] não só às pessoas que voluntariamente
49 Cf. Frei Leandro do Sacramento, Op. Cit, p. III. 50 Cf. Sociedade Promotora da Agricultura Micaelense (SPAM), As contas da Direcção em Conta Corrente com a Sociedade, 1878-1901, 6 de Abril de 1878, liv. 13, fl. 8, in BPARPD. 51 Idem, fl. 7. 52Cf. Sociedade Promotora da Agricultura Micaelense (SPAM), As contas da Direcção, 1878-1879, 6 de Abril de 1878, liv. 12, fl. 9, in BARPD. 53 Cf. Sociedade Promotora da Agricultura Micaelense (SPAM), Atas da Direção de 1873-1887, Livro nº 6, Sessão de 15 d’Abril de 1878, fls. 52-55, in BPARPD. 54 Cf. Sociedade Promotora da Agricultura Micaelense (SPAM), As contas da Direcção, op. Cit., 25 de Maio de 1878, liv. 12, fl. 13, in BARPD.
2nd Annual International Interdisciplinary Conference, AIIC 2014, 8-12 July, Azores, Portugal Proceedings, Vol.3
312
deseja(ssem) aprender os processos práticos deste trabalho, como também a alguns trabalhadores a quem se pag(asse) para esta aprendizagem.’ A intenção era clara: pretendia-se formar um grupo de técnicos locais que dessem continuidade ao trabalho dos técnicos contratados. Na mesma reunião, José do Canto, sempre atento e actualizado, apresentou a terceira edição de um livro saído naquele mesmo ano de 1878 intitulado ‘(…) The Cultivation and Manufacture of Tea.’ O seu autor era o Tenente-Coronel Edward Money. Alegava José do Canto que aquela obra trazia ‘(…) importantes esclarecimentos para a simplificação dos processos da manipulação do chá.’ A Direcção resolveu ‘(…) fazer encomenda (…)’ porque ‘(…) acrescentar(ia) bastante (a)o que já sabíamos pela [obra] de Samuel Ball (…).’ Pretendia-se, ‘(…) nas próximas experiências ensaiar’ os sistemas que Money aconselhava55. Assembleia-Geral de 3 de Junho de 1878: 1.º Momento de balanço Além da Direcção, a Assembleia-Geral precisava igualmente de reunir para tomar decisões de fundo. Dois meses depois da reunião de abril, a 3 de junho de 1878, reunia-se novamente a Assembleia-Geral da SPAM. O sentimento geral era de que, muito embora os resultados não fossem ainda totalmente favoráveis, se deveria esperar até Novembro para tomar quaisquer decisões. Os sócios, apesar de não estarem conformados com a situação, adotavam uma atitude de prudência. Havia problemas a gerir com os dois contratados. Hesitavam quando e se deveriam mesmo renovar contrato com eles. Equacionaram mesmo a hipótese de conseguirem novos técnicos. É no intuito de tirar o melhor partido dos conhecimentos técnicos de Lau-a-Pan, que se compreende a proposta de Ernesto do Canto, relator da comissão de acompanhamento do chá. Ernesto do Canto reconhecia que dois meses não eram suficientes para se avaliar a qualidade técnica de Lau-a-Pan (Lau-a-Teng era ajudante e pouco sabia de chá). Dar-se-iam mais cinco meses, até à ‘Assembleia-Geral (…) de Novembro para se poder formar juízo dos produtos por eles manipulados.’ O irmão, José do Canto, era da mesma opinião: ‘como argumento apresentava ‘as razões (…) colhidas do tratado de Samuel Ball56.’ Todavia, não era só o pouco tempo de colheita, já que os técnicos chineses não estavam reconhecidamente a trabalhar com o empenho que se esperava deles. Ernesto do Canto notava que era preciso encontrar uma forma de ‘(…) obrigar os Chins a manipular o chá como devem57.’ Para tal fim, pedia autorização à Assembleia-Geral para que a Comissão, da qual ele era relator, pudesse ‘faze-los cumprir à risca o contracto’ por duas formas: 1- ‘restringindo-se a Sociedade a cumprir exclusivamente o contratado; 2- ou ‘prometendo-lhes uma gratificação que os anime a cumprir o dito contracto58.’ Era a conjugação de dois tipos de persuasão: reforço de estímulo e força59. A comissão do chá ficou mandatada a fazer o que entendesse oportuno. A renovação do contrato dependeria do ‘(…) comportamento dos Chinas.’ E, ‘(…) no caso de renovação estabelecer as condições que julgar convenientes60.’ Na senda das intenções da Direção, de formar gente da terra na manipulação do chá, a Assembleia-Geral era de opinião de que os sócios pudessem assistir à manipulação do chá. Estava-se em tempo de balanço, haviam decorrido apenas três meses sobre a chegada de Lau-a-Pan, mas, entretanto, muito já acontecera. Uma proposta aceite: ‘(…) (do sócio) Manuel
55Cf. Sociedade Promotora da Agricultura Micaelense (SPAM), Actas da Direcção, sessão de 28 de Abril de 1879, fls. 62v-63 e 63v-64v, in BPARPD. 56 Idem, fls. 66v-68v. 57 Ibidem. 58 Ibidem. 59 Cf. Frei Leandro do Sacramento, op. cit, p. IV. 60Cf. Sociedade Promotora da Agricultura Micaelense (SPAM), Atas da Assembleia-Geral, 27 Fevereiro 1851 – 1882, Livro nº 2, Sessão de 3 de Junho de 1878, Fls. 66v-68v., in BPARPD.

2nd Annual International Interdisciplinary Conference, AIIC 2014, 8-12 July, Azores, Portugal Proceedings, Vol.3
313
Botelho de Gusmão’ para que fosse ‘(…) permitida a entrada na oficina a todo e qualquer sócio que desej(asse) assistir à manipulação e preparo do chá61,’ revela o interesse em aprender a manipular o chá corretamente vendo fazê-lo a quem sabia. Debatida e assente os termos da questão da renovação do contrato, tratada a questão da aprendizagem dos sócios, era preciso ampliar conhecimentos e alcançar apoios. Primeiro, ponderou-se obter informações sobre a cultura e a manipulação do chá através do governo na pessoa dos cônsules. Proposta que ‘foi aprovada com a alteração de em vez de serem pedidas as informações por intervenção do Governo serem pelo Director Geral dos Consulados.’ O que pretendiam saber era se no país em que estava aquele determinado cônsul: ‘1º (…) se cultiva o chá; se a cultura e fabrico do chá tem prosperado; 3º Qual a qualidade se produz; 4º Que quantidade se produz; 5º Qual o valor deles; 6º Se (era) possível contratar algum habitante a preparar e ensinar a manipulação; 7º Em que condições pecuniárias se podiam contratar; 8º Se o produto é de boa qualidade mas não se tem desenvolvido a cultura por não ser remuneradora62.’ E, como os encargos eram muitos e onerosos, ‘pedir subsídios ao Governo para fazer face às despesas de cultura e manipulação do chá fazendo ver os benefícios que dali podem resultar directa ou indirectamente á fazenda publica 63 .’ Foi aprovado. O problema da produção não se situava apenas no pouco ou muito empenho de Lau-a-Tan, ou até na qualidade das plantas, ou na altura do ano da colheita, situava-se também, na qualidade da fábrica/oficina de transformação do chá. Assim, pretendendo-se obter o melhor produto possível, a nota de despesa de 15 de junho de 1878, confirma-nos a introdução de melhorias na fábrica/oficina de chá da SPAM. Data deste dia o pagamento de: ‘(…) um pedreiro e um rapaz na chaminé da fábrica de chá (…)64.’ Se para transformar a folha de chá de forma correcta era preciso uma fábrica/oficina em condições, para conseguir uma folha de chá melhor, era preciso encontrar as melhores plantações possíveis. A fábrica/oficina ficava localizada em Ponta Delgada, como se poderá ver da nota de pagamento de 6 de julho de 1878: ‘Por caiar, raspar e remendar o muro desta Sociedade, com frente para a rua pública e loja da fábrica de chá, incluindo a compra de cal em pó e em pedra, barro (…)65.’Já a 29 de junho de 1878, surgia uma ordem de pagamento de frete ‘(…) a 4 burros com os Chins e aprestes para manipulação de chá na mata da Ribeira Grande (…)66.’ É, pois, admissível, pela insistência na Ribeira Grande, Caldeira Velha, que o melhor chá fosse aí cultivado. Posteriormente, seria nesta área e na área contígua da Barrosa que se cultivaria mais chá. Parece ainda ser possível deduzir que a estratégia da SPAM para reverter a seu favor a situação, até então, pouco satisfatória, centrou-se em: primeiro, satisfazer ou pôr na ordem os dois chineses, melhorar a fábrica em Ponta Delgada e escolher a Caldeira Velha, na Ribeira Grande, não só como a melhor plantação de chá, mas também como local onde se poderia eventualmente produzir chá. Continua-se, assim, a entender, nova nota de pagamento, datada de 20 de Julho de 1878: ‘Por frete a 4 burros por conduzir os Chins e aprestes do fabrico de chá para a Caldeira Velha da Ribeira Grande (…)67.’ Em outra nota, do mesmo dia, mas inscrita em 61 Cf. Sociedade Promotora da Agricultura Micaelense (SPAM), Atas da Assembleia-Geral, 27 Fevereiro 1851 – 1882, Livro nº 2, Sessão de 3 de Junho de 1878, Fls. 66v-68v., in BPARPD. 62 Cf. Sociedade Promotora da Agricultura Micaelense (SPAM), Atas da Assembleia-geral, 27 Fevereiro 1851 – 1882, Livro nº 2, Sessão de 3 de Junho de 1878, Fls. 66v-68v., in BPARPD. 63 Idem. 64 Cf. Sociedade Promotora da Agricultura Micaelense (SPAM), As contas da Direcção, 1878-1879, 15 de Junho de 1878, liv. 12, fl. 15, BPARPD. 65 Ibidem, 6 de Julho de 1878, liv. 12, fl. 17. 66 Idem, 29 de Junho de 1878, liv.12, fl. 16. 67 Ibidem, 20 de Julho de 1878, liv. 12, fl. 18.

2nd Annual International Interdisciplinary Conference, AIIC 2014, 8-12 July, Azores, Portugal Proceedings, Vol.3
314
outro livro, fortalece-se a ideia de que não só se apanhava chá para transportar para a fábrica/oficina em Ponta Delgada, onde era manipulado, como igualmente se produzia chá na Caldeira Velha: ‘Por frete de 2 carros por conduzir os Chinas à Ribeira Grande, a manipulações de chá, sendo um do dia 25 do passado e outro de 18 do corrente (…)68.’ A nota diz respeito a dois dias distintos, prova de que o trabalho se intensificara, não só por ser época favorável, 25 de junho e 18 de julho, mas talvez, porque se conseguira, de qualquer forma, ameaça ou gratificação, um maior empenho dos chineses. Uma nota seguinte é de 20 de julho ‘2 carros para irem os Chins à Ribeira Grande’; ainda uma outra de 25 de Julho. A 27, uma nota refere o Pico da Pedra: ‘Por frete de um macho ao Pico da Pedra com aprestes necessários para o fabrico de chá (…)69.’ O que pode querer dizer que no Pico da Pedra também se manipularia chá. Numa nota datada do dia 8 de agosto, atente-se ao pormenor, fala-se em chá verde: ‘frete de 4 burros ao Pico Arde com os Chins manipulação de chá verde (…)70.’ E, na mesma nota, logo a seguir: ‘Por frete a 4 burros por conduzirem os Chins ao Pico Arde, incluindo o que levou os aprestes para uma manipulação de chá verde (…)71.’ Mais uma prova de que o chá poderia ter sido produzido junto às plantações onde era colhido no Pico Arde: ‘Por compra de lenha e carvão para manipulação de chá (…)72.’ Ainda na primavera ou já no verão de 1878, a zona central da Ribeira, talvez por ter um solo e um clima propícios ao desenvolvimento do chá, ou por estar mais disponível, era aquela a que mais se recorria. É bom precisar várias áreas iniciais na parte central da Ribeira Grande: Mãe de Água, onde ocorreu a primeira experiência falhada, Caldeira Velha, primeira bem sucedida e Pico Arde. Seriam locais de propriedades de José do Canto? A Caldeira Velha e a mata da Ribeira Grande ficam numa cota mais alta e em terrenos perto de uma ribeira de água quente. A Mãe de Água, como o nome indica, era o açude dos moinhos da Ribeira Grande. O Pico Arde, apesar de ficar a uma cota mais baixa, situa-se por cima de um lençol de água quente. Encomenda de utensílios e de sementes à China. Para particulares e para a SPAM Depois da última Assembleia-Geral, das duas, uma: ou as experiências de manipulação de chá haviam melhorado, ou, apesar de não terem melhorado, haviam resultado o suficiente ao ponto de se querer mais sementes e de se pretender utensílios para aperfeiçoar a fábrica/oficina da SPAM, ou até mesmo para quem pretendesse montar a sua própria fábrica/oficina. Outra conclusão não se poderá tirar da reunião da direcção da SPAM, de 28 de Agosto de 1878, sob a presidência de Caetano de Andrade de Albuquerque. Aí se resolveu: ‘(…) fazer brevemente para a China encomendas de sementes de chá se incumbe de fazer juntamente para particulares não só a sementes que designarem as quaisquer utensílios de preparar e manipulação (…)73.’ Como as despesas não diminuíssem, havia compromissos a cumprir quanto a salários, alimentação e outros encargos, ficou ‘resolvido [pedir] um subsídio para fazer face às despesas de ensaio de cultura e preparo do chá.’ E, mais um sinal de que a experiência, 68 Cf. Sociedade Promotora da Agricultura Micaelense (SPAM), As contas da Direcção em Conta Corrente com a Sociedade, 1878-1901, 20 de Julho de 1878, liv. 13, fl. 15, in BPARPD. 69 Cf. Sociedade Promotora da Agricultura Micaelense (SPAM), As contas da Direcção, Op. Cit, 27 de Julho de 1878, liv. 12, fl. 19. 70 Idem, 3 de Agosto de 1878, liv. 12, fl. 19-20. 71 Ibidem. 72 Ibidem. 73 Cf. Sociedade Promotora da Agricultura Micaelense (SPAM), Atas da Direção de 1873-1887, Livro nº 6, Sessão de 28 d’Agosto de 1878, fls. 56-56v., BPARPD.

2nd Annual International Interdisciplinary Conference, AIIC 2014, 8-12 July, Azores, Portugal Proceedings, Vol.3
315
afinal, resultava, acompanhado por ‘(…) amostras do chá manipulado74.’ Além do mais, demonstra que não se envergonhavam do chá que produziam. Prova indesmentível de que o entusiasmo pelo chá crescia, é-nos dada na sessão da Direcção de 16 de Novembro de 1878, ainda sob a presidência de Caetano de Andrade Albuquerque. Ficou resolvido ‘a venda de plantas [de chá]’ a 30 réis cada. Além da encomenda ‘para a China uma porção de semente de chá igual à que (fora) remetida à Sociedade por ocasião da vinda dos dois preparadores de chá75.’ É também por esta altura que o chá micaelense é servido de forma sub-reptícia aos sócios dos clubes Micaelense, em Ponta Delgada, e do Club Lisbonense, em Lisboa. No dia 22 de Novembro de 1878. Reclamações? Não constaram. Apenas houve quem achasse o chá mais forte do que o habitual. Todavia, a opinião geral mostrou-se favorável ao chá da ilha. No mesmo mês, por iniciativa de Manuel Botelho de Gusmão, foi servido chá no Club Lisbonense: sendo o resultado igualmente satisfatório76. Para obter apoios e aquilatar a valia do chá da ilha, os sócios membros da direcção da SPAM, Manuel Botelho de Gusmão, José do Canto e o Barão da Fonte Bela, haviam enviado amostras para diversos locais e entidades. Na reunião do dia 29 de janeiro de 1879, ainda sob a presidência de Caetano de Andrade Albuquerque, o sócio ‘(…) Manuel Botelho de Gusmão (…) havia mandado (a) Pedro Jácome Correia duas latas com chá dizendo-lhe que delas fizesse o uso que intendesse a fim de obter do Governo um subsidio para esta Sociedade (…).’ José do Canto remetera ‘3 latas com chá, sendo uma para os Jardins da Kew, - outra para o Sr. Bruno & Silva, a fim de este mandar analisar por pessoa competente, que marque o seu valor; e a outra para o Fouquet, para proceder à análise química e comparação com o chá da China.’ E o Barão da Fonte Bela ‘enviara uma lata de chá ao Exmo. Dr. Thomaz de Carvalho para igual fim77.’ Balanço da primeira temporada e preparação da segunda A questão central da reunião de 29 de janeiro de 1879 girou em torno da desesperada necessidade em conseguir apoios financeiros do Estado. Considerando-se o chá como ‘uma questão vital’ para o distrito de Ponta Delgada, é elaborada uma petição dirigida ‘ao Governo de (Sua) Majestade.’ A Direcção da Sociedade era, então, composta por Caetano de Andrade Albuquerque; José do Canto; Jacinto Pacheco de Almeida; Barão de Fonte Bela; Manuel Botelho de Gusmão e José Maria Raposo de Amaral Jr. Pede-se ao monarca ‘a (…) protecção valiosa aos ensaios d’esta Sociedade, até esta fazer vingar a empresa da introdução definitiva do fabrico do chá entre nós.’ E isto porque ‘a nossa pequena reserva filha de economias anteriores, acha-se esgotada, e com a sua extinção está prestes a morrer esta empresa generosa e utilíssima78.’ Face à crise geral que o distrito vivia, entendera a SPAM ‘(…) atendendo à maneira como aqui vegeta a planta do chá (…) ensaiar em maior escala a sua cultura bem como os processos de sua manipulação a fim de verificar se seria exequível a definitiva adopção desta industria no nosso solo depreciado.’
74 Idem. 75 Ibidem, Livro nº 6, Sessão de 16 de Novembro de 1878, fl. 57. 76 Cf. Frei Leandro do Sacramento, op. Cit., pp. I-VI: Aí se detalha tudo no relatório de Ernesto do Canto, vide também Margarida Vaz do Rego Machado, A cultura do chá na ilha de S. Miguel como ponte de ligação ao Oriente, (artigo não publicado mas apresentado em Macau no âmbito de organização da Fundação Oriente), p. 16. 77 Cf. Sociedade Promotora da Agricultura Micaelense (SPAM), Atas da Direção de 1873-1887, Livro nº 6, Sessão de 29 de Janeiro de 1879, fls. 58-61, in BPARPD. 78 Idem.

2nd Annual International Interdisciplinary Conference, AIIC 2014, 8-12 July, Azores, Portugal Proceedings, Vol.3
316
Só por si, pelas quotas dos associados e pelo produto da venda de produtos, a SPAM seria incapaz de satisfazer as suas obrigações. Pedem apoio, mas pedem-no como parceiros no desenvolvimento, porque o seu esforço contribuía ‘(…) directa e indirectamente (para) a Fazenda Publica, evitando a depreciação da nossa propriedade e garantindo a manutenção das contribuições que ela lhe pagar79.’ Foi lida, discutida, aprovada e enviada a Sua Majestade. Assembleia-Geral de 5 de Fevereiro de 1879: Impulso da fabricação do chá por sócios Entretanto, enquanto esperavam pela resposta de Sua Majestade, a Assembleia-Geral reuniu a 5 de fevereiro de 1879. No essencial, decidiu-se continuar a promover a partilha de conhecimentos sobre o cultivo e produção do chá. Assim se compreende que se reedite a obra de Frei Leandro, que se dê à estampa o relatório da comissão de acompanhamento do chá, que se reduza de 30 para 20 réis o preço de venda de plantas de chá e que se dê, sempre que seja possível, amostras de chá aos sócios que as requisitem80. Nesta reunião, o relator da Comissão do Chá, Ernesto do Canto, apresentou à Assembleia-Geral, sendo seu Presidente em exercício o Vice-Presidente o seu irmão José do Canto, o resultado das ‘(…) experiencias que se fizeram durante a colheita do ano findo.’ Foi aprovado o relatório, decidido mandá-lo ‘publicar nos jornais mais importantes desta Ilha,’ e imprimido 81 ‘(…) como introdução à reimpressão (…) do folheto sobre colheita e manipulação de chá publicado no Rio de Janeiro em 1824, por Frei Leandro do Sacramento 82.’ Se bem que não totalmente, a experiência estava a resultar. No entanto, Rafael de Almeida, que escreve, em janeiro de 1879, mas cujo trabalho só sai em Junho, a experiência resultara largamente, pois havia ‘(…) várias qualidades de chá, de óptima aparência e magnífico odor.’83 Presidência de Ernesto do Canto: Impulso à produção de chá por locais Na reunião da direcção de 19 de fevereiro de 1879, Ernesto do Canto sucedera a Caetano de Andrade Albuquerque na direcção da SPAM. O novo Presidente dá continuidade à encomenda de utensílios para a preparação do chá e a sementes de chá84. Também deu seguimento ao trabalho dos dois chineses85. A 28 de abril de 1879, Ernesto do Canto dá conta à direcção, ‘dos ofícios que dirigiu aos Deputados deste Distrito pedindo-lhes para obterem do Governo de Sua Majestade, passagem gratuita em navios nacionais dos objectos encomendados para a China (…).’
79 Ibidem. 80 Cf. Sociedade Promotora da Agricultura Micaelense (SPAM), Atas da Assembleia-Geral, 27 Fevereiro 1851 – 1882, Livro nº 2, Sessão de 5 de Fevereiro de 1879, fls. 68v-69v., in BPARPD. 81 Cf. Frei Leandro do Sacramento, op. cit, pp. I-IV e o jornal A Persuasão, 26 de Fevereiro de 1879, pp. 1-2. 82 Cf. Sociedade Promotora da Agricultura Micaelense (SPAM), Atas da Assembleia-Geral, 27 Fevereiro 1851 – 1882, Livro nº 2, Sessão de 5 de Fevereiro de 1879, fls. 68v-69v., BPARPD. 83 CF. Rafael de Almeida, op. cit, p. 2. 84Cf. Sociedade Promotora da Agricultura Micaelense (SPAM), Atas da Direção de 1873-1887, Livro nº 6, Sessão de 19 de Fevereiro de 1879, Fls. 61-62v., in BPARPD: ‘Que se encomendassem já por ofício dirigido ao Governador de Macau, (…) Visconde de Passo d’Arcos, 120$000 reis de sementes com expressa recomendação de serem sementes novas e que só partem de lá em qualquer transporte do Estado que saia daqueles portes do primeiro de Outubro até ao fim de Janeiro que igual pedido se faça dos utensílios idênticos que já vieram mas em quadruplicado e mais 12 tachos (…) no mesmo ofício (…) se pedia ao Governador de Sua Majestade por intervenção dos nossos Deputados o transporte gratuito dos objectos encomendados, no vapor África.’ 85 Idem: ‘(…) que renove o pagamento da metade dos vencimentos do ordenado dos operários chineses ás suas famílias na China, em prestações mensais, até nova ordem, e a rasão de 20 patacas por mês á família do mestre Lau-a-pan e 12 ½ á do ajudante Lau-a-teng, para o que bem como para o montante das encomendas, poderá o mesmo Exmo. Governador sacar sobre a Agencia do Banco de Portugal em S. Miguel (…).’

2nd Annual International Interdisciplinary Conference, AIIC 2014, 8-12 July, Azores, Portugal Proceedings, Vol.3
317
Continuando a difundir a cultura e a produção locais, os jornais micaelenses noticiam a venda de literatura de apoio: ‘Na Sociedade de Agricultura Micaelense, vende-se um folheto tratando da manipulação do chá pelo preço de 120 réis86.’ Segunda temporada de colheitas e fabrico de chá (Abril de 1879 a depois de 18 de Julho de 1879) Sabe-se menos acerca da segunda temporada do que da primeira, pois, ao invés daquela primeira, não se conhece nem relatório nem testemunhos para esta segunda. A segunda temporada terá começado pouco antes de 10 de Maio, talvez ainda em abril e prolongou-se para além da saída dos dois chineses a 18 de julho de 1879. Já só com a supervisão de locais. A segunda temporada de colheitas prepara-se, como se pode depreender pela leitura da nota de pagamento de 10 de Maio, com a construção de novos equipamentos ou o conserto de equipamentos da primeira campanha. Leia-se na íntegra: ‘Por 2 dias a um pedreiro e servente em fazer duas fornalhas para secar chá e compra de tijolo, cal e barro, 22, 3$56087.’ Ou ainda no mesmo dia, ‘Por conserto de uma mesa para enrolamento de chá, como da ordem 22, 1$44088.’ Uma nota de pagamento datada de 24 de Maio de 1879, leva-nos à segunda temporada: ‘(…) 3 bilhetes para os chineses irem à Ribeira Grande (…)’, ou ainda, ‘por idem de 3 bilhetes do omnibus para a Ribeira Grande com os Chinas (…) 89 .’ Como incentivo, repare-se na nota de pagamento de 7 de junho, gratificam-se agora não só os chineses mas também quem os acompanha: ‘Gratificação a quem acompanhou os chineses’ (…) com utensílios de fabrico do chá.’ E ‘por idem ao empregado que acompanhou os Chins à Ribeira Grande, 5 dias (…)90.’ Sublinhe-se: ‘com utensílios de fabrico do chá.’ Já se fizera chá na Ribeira Grande na primeira apanha em 1878 e voltava-se de novo a fazê-lo na segunda em 1879. E, num local predilecto: no mato da Ribeira Grande91. Os chineses pernoitavam na Ribeira Grande, como se depreende pela nota de 7 de julho: ‘Por estada na Ribeira Grande de uma noite dos Chins e ceia (…)92.’ Uma outra nota, mas agora de 14 de junho de 1879, no claro prosseguimento da linha estratégica de aliar a observação à teoria, a SPAM publica um tratado sobre chá verde. Este chá era, precisamente, o que menos sucesso obtivera na colheita de 1878. Esta parece ser a razão principal da publicação do folheto: ‘(…) venda de 6 folhetos, reimpressão de um tratado sobre chá verde (…)93.’ As deslocações às plantações de chá da Ribeira Grande continuam, como o confirma a nota de 14 de junho referente a 2 do mesmo mês: ‘Por frete de um carro com os Chins para a Ribeira Grande, no dia 2 de Junho corrente, incluindo gorjeta ao bolieiro (…)94.’
86 Cf. o jornal A Persuasão, Ponta Delgada, 30 de Abril de 1879, p. 4. 87 Cf. Sociedade Promotora da Agricultura Micaelense (SPAM), As contas da Direcção, 1878-1879,10 de Maio de 1879, liv. 12, fl. 43., in BPARPD. 88 Idem. 89 Ibidem, 24 de Maio de 1879, liv. 12, fl. 44. 90 Cf. Sociedade Promotora da Agricultura Micaelense (SPAM), As contas da Direcção em Conta Corrente com a Sociedade, 1878-1879, 7 de Junho de 1879, liv. 12, fl. 45., in BPARPD. 91 Idem: ‘Com utensílios de fabrico do chá ‘Por frete de uma carroça à Ribeira Grande, cerca do mato, com utensílios do fabrico do chá, como da ordem 26, 1 $440.’ 92 Ibidem. 93 Ibidem, 14de Junho de 1879, liv. 12, fl. 45 v. 94 Cf. Sociedade Promotora da Agricultura Micaelense (SPAM), As contas da Direcção em Conta Corrente com a Sociedade, 1878-1879, 14 de Junho de 1879, liv. 12, fl. 46., in BPARPD.
2nd Annual International Interdisciplinary Conference, AIIC 2014, 8-12 July, Azores, Portugal Proceedings, Vol.3
318
Onde, segundo outra nota, de 12 de julho de 1879, sabemos que se continuava a produzir chá: ‘Por frete de uma carroça e bestas para a Caldeira Velha com utensílios do fabrico do chá (…)95.’ Conclusão Resumindo, a política da SPAM dera frutos em pouco tempo. Era opinião de alguns sócios de que, pelo menos, já a 13 de julho de 1879, havia na terra quem produzisse chá tão bem, ou melhor ainda, que o produzido por Lau-a-Pan: ‘(…) em vista d’alguns kilos de chá (…) apresentados (…) manipulados por indivíduos desta terra que ela mandou habilitar e que em nada o achou inferior, antes pelo contrario julga-o superior ao chá feito pelos Chins (…)96.’ Chega-se, entretanto, a acordo para rescisão com Lau-a-pan e Lau-a-Teng. Isto fica-se a saber na reunião da Assembleia-Geral de 13 de julho de 1879. A 17 de julho de 1879, na véspera do dia em que os chineses embarcaram de regresso a Macau, Ernesto do Canto, em carta ao Governador de Macau, dizia-lhe que: ‘(…) a indústria da cultura e manipulação do chá está(va) plenamente implantada entre nós (…).’ Para que não restassem quaisquer dúvidas, acrescentava: ‘(…) já alguns filhos desta terra apresentam produtos em nada inferiores ao chá manipulado pelos dois Chins (…).’ Para suspender este trabalho, voltamos a usar as palavras de Ernesto do Canto: ‘ (…) a vinda destes dois homens era indispensável, porque há trabalhos na manipulação do chá que as teorias não explicam o que só a observação ocular pode ensinar97.’ Missão cumprida. Era pois tempo de passar à produção local? Sim, mas antes que fosse possível continuar o caminho traçado, a dívida de perto de ‘3 contos de réis’ contraída para o cometimento do chá, obrigaria a SPAM a abrandar o passo98. Era preciso primeiro saldar as contas. NOTAS Nota 1 Apesar do chá crescer de forma espontânea na ilha Terceira e em outras ilhas dos Açores antes de 1801, apesar de, em janeiro de 1878, a curta distância do arranque da experimentação do chá em São Miguel, a Associação Agrícola da Terceira ter pedido sementes de chá à sua congénere de São Miguel99, apesar de ter existido cultivo e produção na ilha do Faial, apesar ainda de, segundo Aníbal Cabido, ter havido cultivo em todo o distrito de Ponta Delgada, a partir da segunda metade do século XIX, o chá é essencialmente uma produção da Ilha de São Miguel100. E, em rigor, quase uma produção do concelho da Ribeira Grande 101. As plantações do período experimental de Lau-a-Pan (1878-79), com
95 Cf. Sociedade Promotora da Agricultura Micaelense (SPAM), As contas da Direcção, 1878-1879, 12 de Julho de 1879, liv. 12, fl. 48., in BPARPD. 96Cf. Sociedade Promotora da Agricultura Micaelense (SPAM), Atas da Assembleia-Geral, 27 Fevereiro 1851 – 1882, Livro nº 2, Sessão de 13 de Julho de 1879, Fls. 64v-65v., in BPARPD. 97Cf. Sociedade Promotora da Agricultura Micaelense (SPAM), Registo de Correspondência, 1860-1898, 17 de Julho de 1879, liv. 23, fls. 18 v. – 19., in BARPD. 98 Idem, 31 de Dezembro de 1879, liv. 23, fls. 21-21 v. 99 Cf. Sociedade Promotora da Agricultura Micaelense (SPAM), Atas da Direção de 1873-1887, Livro nº 6, Sessão de 15 d’Abril de 1878, fls. 52-55., in BPARPD. 100 Cf. Cf. Charlotte Alice Baker, A summer in the Azores with a glimpse of Madeira, Boston, Lee and Shepard, 1882, p. 35; Aníbal Gomes Ferreira Cabido, A indústria do chá nos Açores, Boletim do trabalho industrial, n.º 88, Direcção Geral do Comércio e Indústria, Coimbra, 1913. 101 Para melhor desenvolvimento vide: Mário Moura, Esboço geográfico de fábricas, de áreas de cultivo e de produtores de chá de São Miguel (subsídio para o seu estudo), trabalho apresentado no Doutoramento de História do Atlântico, sob a coordenação da Professora Susana Costa, no Seminário de História Comparada das ilhas e arquipélagos atlânticos, Ribeira Grande, 24 de Junho de 2013.

2nd Annual International Interdisciplinary Conference, AIIC 2014, 8-12 July, Azores, Portugal Proceedings, Vol.3
319
exceção das das Capelas, situavam-se no concelho da Ribeira Grande (Pico da Pedra, Conceição e Matriz). Nota 2 Além do ananás, do tabaco, do álcool de beterraba e do açúcar, o chá foi um dos produtos agro-industriais de sucesso introduzidos nos Açores na segunda metade do século XIX. Se, no caso do ananás e do tabaco, o seu incremento industrial foi anterior à eclosão dos mais graves episódios das crises derivadas dos problemas do vinho e da laranja, pela doença e concorrência de outros mercados, com as crises, aqueles produtos e o chá, potenciavam-se economicamente. Contudo, a experiência do chá, bem como das demais agro-industriais, insere-se numa longa história de experiências de aclimatação de plantas no espaço insular. Vem ainda antes do tempo dos pais dos fundadores (1843) da Sociedade Promotora da Agricultura Michaelense, ainda dos tempos dos chamados Os Antigos Modernos102. Nota 3 A Sociedade Promotora da Agricultura Micaelense (SPAM) foi fundada em 1843 e é geralmente considerada a primeira associação do género em Portugal. Começou por ser apenas uma associação privada, até à década de setenta foi uma associação privada e pública, a partir daquela data, readquire oficialmente o seu carácter privado inicial. Era mista quando iniciou o processo de contratação dos técnicos para a manipulação do chá, sendo já só privada quando a experiência se realizou. Até 1873, a experiência do chá é um assunto privado/individual, no entanto, a partir de 1873, prolongando-se até 1883-1884, transforma-se num empreendimento misto. Pelo que se conhece, depois de 1883-84, transforma-se num empreendimento essencialmente privado/individual de sócios e de não sócios. Os custos da experiência do chá seriam incomportáveis para serem assumidos individualmente: a SPAM cumprira o seu objectivo de saber como cultivar e transformar o chá. A fase seguinte pertencia a cada um. Embora a fábrica ou oficina de chá fosse montada em um espaço da sede da Sociedade Promotora da Agricultura Micaelense (SPAM), em São José, Ponta Delgada, em anexos do antigo convento de Nossa Senhora da Conceição, foi também produzido chá na Caldeira Velha da Ribeira Grande e no Pico da Pedra. Por ser o mais conhecido, referindo o caso da Caldeira Velha na Ribeira Grande, trata-se de uma parceria entre José do Canto, sócio e dirigente da SPAM, dono da plantação e da terra, e a SPAM, entidade que contratara Lau-a-Pan e adquirira os instrumentos de manipulação do chá. O chá foi uma empresa que mobilizou diversos sócios, no entanto, entre eles, destacam-se, sobremaneira, os irmãos Canto, José e Ernesto, Vicente Faria e Maia, Pereira Botelho e Andrade de Albuquerque. José, como homem dos bastidores, como prático, experimentando chá antes da vinda dos chineses, poderá, eventualmente, ter tido um papel importante no lançamento da proposta feita pelo irmão: Ernesto seria o porta-voz de José? Mais tarde, já com responsabilidades na Junta Geral, proporia legislação de fomento e incentivo à nova cultura. Ainda mais tarde, seria ele o motor da viragem do chá, com nova vinda de novos dois chineses e com a introdução da primeira maquinaria introduzida numa fábrica construída de raiz: a da Caldeira Velha. Entre os que apostaram no chá, houve quem apostasse em outras experiências agroindustriais. Destes promotores, destacam-se entre outros: José Bensaúde, Ernesto do Canto, José Maria Raposo do Amaral, Jácome Correia pelo seu empenho e interesse.
102 Cf. Carlos Riley, Os antigos modernos [Texto policopiado]: o liberalismo nos Açores: uma abordagem geracional, Ponta Delgada: Universidade dos Açores, 2006.

2nd Annual International Interdisciplinary Conference, AIIC 2014, 8-12 July, Azores, Portugal Proceedings, Vol.3
320
Elaborada por Maria de Lurdes França – Francisco Veloso
De acordo: SDUAC, Arquivo Raposo do Amaral, livro de inscrição de sócios
contribuintes, 1878-1905. A evolução dos sócios ao longo deste período
Elaborada por Maria de Lurdes França- Francisco Veloso. De acordo: SDUAC, Arquivo Raposo do
Amaral, livro de inscrição de sócios contribuintes, 1878-1905.
-20
30
80
130
180
1879
1881
1883
1885
1887
1889
1891
1893
1895
1897
1899
1901
1903
1905

2nd Annual International Interdisciplinary Conference, AIIC 2014, 8-12 July, Azores, Portugal Proceedings, Vol.3
321
QUANTUM MODELING OF CAPACITOR ENERGY DENSITY
Adam G. Tournier, PhD Associate Professor of Physics, McKendree University, USA
Abstract Energy storage is necessary to power the technologies that sustain or global society. One of the devices utilized for the creation, storage, and delivery of electrical energy are capacitors. The basic physics of capacitors is discussed. The physical parts of the device are explained, and the separator film, which is the focus of this research, is modeled. By optimizing the polarization of the molecules in the separator film through quantum modeling of the electric displacement of the molecules, the dialectic constant of the material can be optimized. The dielectric constant is directly proportional to the energy stored in the capacitor. Increasing the dielectric constant will proportionally increase the energy stored in the capacitor, and increase the energy density of the device.
Keywords: Capacitors, Quantum Modeling, and Energy Density Introduction The energy needs of our global society are increasing. To effectively create, store, and deliver the energy needs of the future alternative materials must be found to augment the current methods and technologies utilized. Capacitors are one tool for the effective storage and delivery of energy to many technologies. To optimize current systems and support the creation of new technologies, higher density energy capacitors must be developed. Higher energy densities in capacitors allow fewer capacitors to be used, fewer recharging cycles for each device, and smaller size scale devises. Small size scale devices and longer capacitor life are keys to unlocking the energy needs of the future. This paper will examine one method for achieving increased energy density in film capacitors. I.
Energy is a measure of a system’s ability to do work. By finding new sources of energy, our society has developed technologies to improve the quality of our lives. The discovery of electricity and the delivery of this energy source created the increasing complexity we experience. These new technologies improve the quality of life, but have an ever increasing energy need. Our global society requires larger and more powerful energy sources to sustain current technologies foster the innovation required to discover new technologies, and industrialize the portions of our world that have not yet realized the gains of the twenty-first century.
The delivery of energy in an electronic system has two important factors. The first is how much energy a device can deliver. The total energy stored in a device is ultimately measured in Joules (J), but the industry standard is the Watt*Hour (Wh). A Watt (W) is a Joule per second (J/s), and a Wh is 3600 J. All electric storage devices have a limited number of Joules they can store and deliver. The larger the stored energy in a device the long the system will operate. The amount of stored energy per unit size is called the energy density of the device. An increase in energy density is the goal of this research. The second is the

2nd Annual International Interdisciplinary Conference, AIIC 2014, 8-12 July, Azores, Portugal Proceedings, Vol.3
322
rate at which the device can deliver its stored energy. This rate of energy delivery is measured in watts. Modern electronics are limited by the rate at which energy can be delivered from electric storage devices, and the limited energy density of the device.
The two main energy storage devices for electricity are capacitors and voltaic cells. Capacitors are the focus of this research. A capacitor is an arrangement of conductors separated by an insulator. This insulator is called a dielectric. In electronic circuits, the capacitor is usually two parallel conducting plates separated by a very thin film. Capacitance is a direct measure of the energy storage capacity of the device. The capacitance (C) of the device is given by 𝐶 = 𝜅𝐴𝜀 𝑑⁄ , where κ is the dielectric constant of the separator material, A is the cross sectional area of the plates, ε is the permittivity of free space, a constant, and d is the plate separation.
Despite the widespread use of polymer film capacitors in a large number of applications, this capacitor technology has not seen any major energy improvements over the past 40 years. Capacitors have not kept pace with the rapid advance in solid-state switching devices leading to a lowering of system efficiency while adding significant volume and weight to power electronics systems.
To optimize modern capacitors one of the three physical parameters of the device must be altered. The area of the device could be made larger, but the ultimate goal of modern electronic is to scale to smaller sizes. The physical size of capacitors needs to decrease. Decreasing plate separation will increase energy density, as the capacitance is inversely proportional to the plate separation, and the separation is the thickness of the dielectric. Engineering thinner films will increase energy density. The third option is to increase the dielectric constant. This is the focus of this research. Through quantum modeling of the physical characteristics of the dielectric film novel films can be designed to achieve higher dielectric constants, and maintain dimensional stability under large voltage and temperature ranges.
William Whewell coined the term dielectric from dia-electric in response to a request by Michael Faraday.Dielectric films in capacitors are insulators, which do not allow free electron movement in the material. All of the electrons in the material are associated with specific nuclei. This binding leads to unique properties of the material when an external electric field is applied to the dielectric. Capacitors function by building an electric field between the plates of the device as electrons delivered by current flow through the rest of the circuits build on one plate of the capacitor. These excess electrons drive electrons from the opposite plate of the capacitor, creating charge separation between the plates. The electric field applies force to the electrons bound in the dielectric material forcing them to polarize. This polarization is the ability of the molecules of the dielectric to distort and counteract the charge separation on the capacitor plates. Increasing the energy stored in the electric field inside the capacitor. The dielectric constant is a measurement of the ability of the material to

2nd Annual International Interdisciplinary Conference, AIIC 2014, 8-12 July, Azores, Portugal Proceedings, Vol.3
323
be polarized. The larger the dielectric constant the more polarization the molecules are capable of. This leads to larger capacitance and a higher energy density in the device.
Increasing dielectric constant of a material can be accomplished by increasing the
electric displacement of the molecules. As the electric field is applied to the dielectric the molecules are stretched, physically altered by the force of the electric filed. The orbits of the electrons in the material are altered creating a new distribution of the electron probability density for the molecule. The new distribution induces a polarized state for the molecule leading to the electrons spending more time by the positively charged plate of the capacitor. Analyzing the quantum states of the electrons in the molecule and determining how the field changes the probability density of their position will allow for the analytical calculation of the polarization of a single molecule of the dielectric material. Modeling the static dielectric constant for the material is the first step.
The second step of the process is to calculate the polarization of the molecule as a function of direction angle. As the material polarizes the orientation of the molecule can be changed. The vector direction of the molecular axis must be considered to derive a model for the dielectric constant of the molecule is three dimensions.The vector direction of the molecular axis may change as the field is applied leading to a contribution to the polarization separate from the changes to the electron probability density function. This three dimensional model must also consider how the molecules are bound to the rest of the bulk film and if there are any crystalline characteristics to the bulk film. Either of these factors will affect the orientation of the molecule with respect to the field, and in turn affect the polarization of the molecule.
The bulk film that is the real world material does not have the molecules oriented in a specific direction. An analysis of the orientation of the molecules of the bulk film must be considered. Using Transition Electron Microscopy (TEM) analysis a statistical model of the orientation of the molecule of the film can be created. By analyzing the bulk characteristics of the film a model can be created that will deliver an accurate calculation of the measurable dielectric constant of the film. Again, the inter-molecular forces due to coulomb forces or crystalline properties of the material must be considered in the statistical model of the bulk film.
Once an accurate statistical model for the bulk film of know materials is achieved, novel film design can be started. By utilizing the models of current films, new molecular orientations and compositions can be achieved and theoretically tested for increasing dielectric constant.
2nd Annual International Interdisciplinary Conference, AIIC 2014, 8-12 July, Azores, Portugal Proceedings, Vol.3
324
The most used film materials in capacitors are polypropylene (PP), with a market share of approximately 50%, and polyester (PE), with approximately 40% share. All other materials account for the remaining 10% share. This research will focus on initial models for PP and PE. Once accurate models are developed for these materials, novel film design can begin its theoretical stage. Followed by small-scale fabrication and experimentation of the novel films once stable molecular designs have been achieved. Conclusion
Understanding the molecular characteristics of dielectric materials allows for the calculation of the polarization of the molecule through a quantum analysis of the probability density of the electron positions in the molecule. Once an accurate model of the probability density exists the polarization of the molecule can be modeled in three dimensions. With an analytical model of the polarization vector for the molecule a statistical analysis of the bulk material is necessary for the real dielectric constant of the film to be calculated. The quantum modeling of the molecules will require the cooperation of our Computer Science faculty and students. Senior thesis work from our undergraduate students will be used to accomplish the computer modeled quantum behavior and statistical analysis. The completion of these theoretical models will enable the design of novel compounds, which will be designed and manufactured in collaboration with The University of Missouri and Indiana State University. References: Bateman, Cyril, Understanding Capacitors, Electronics World, 1998. Daintith, John, editor. Oxford Dictionary of Physics. New York: Oxford University Press, 2005. Jackson, John David, Classical Electrodynamics, New York: Wiley, 1998. Jacobs, F, Polypropylene Capacitor Film Resin, Passive component magazine, 2005. James, Frank, editor, The Correspondence of Michael Faraday, Volume 3, London: The Institution of Electrical Engineers, 1996. Von Hippel, Arthur, Dielectric Materials and Applications, New York: Technology Press of MIT, 1954.

2nd Annual International Interdisciplinary Conference, AIIC 2014, 8-12 July, Azores, Portugal Proceedings, Vol.3
325
RULE-BASED PREDICTION OF SHORT TERM ELECTRIC LOAD
Petr Berka, Prof, PhD University of Economics Prague & University of Finance and Administration Prague,
Czech Republic
Abstract In this study we discuss the possibility to apply symbolic data mining methods to the problem of prediction. We employ our original algorithm KEX that is used for extraction of classification or prediction rules from data. When new data is coming, the active rules (rules with a fulfilled left-hand side) from the rule base are applied to the data and their weights are composed by the inference mechanism to the resulting weight of a given prediction. The presented approach is applied to the problem of short-term electric load forecasting.
Keywords: Data mining, rule learning, electric load prediction Introduction One central insight of artificial intelligence (AI) is that expert performance requires domain-specific knowledge. Machine learning is the subfield of AI that studies the automated acquisition of such knowledge. The aim is to create intelligent systems that learn-that is, that improve their performance as the result of experience. The mainstream of machine learning techniques is inductive learning (also called similarity-based learning). Let us assume, that there is a set of examples which should be classified into some (small amount of) classes. In case of supervised learning, the examples are pre-classified by the expert (or the class membership can be directly observed from the data). In case of unsupervised learning, the machine learning algorithm does the grouping into classes itself. Based on this limited number of examples we then try to induce some kind of general description of each class. The underlying idea of this methodology is that there are some characteristics (usually values of attributes) of these examples such, that examples belonging to the same class have similar values of these attributes. Thus examples belonging to the same class create clusters in the attribute space. The various inductive machine learning algorithms differ in the way how the induced knowledge is represented (decision trees, decision rules, neural networks, Bayesian networks, support vectors, prototypical instances) and how it is used for decision support. Among the tasks solved by machine learning methods, classification and prediction play a key role. While classification can be understood as the task of assigning new (unseen) examples into one of the predefined class, prediction can be understood as the task of “computing” a next value of a variable that evolves in time. So for classification, methods that produce symbolic output are used while for prediction, methods that produce subsymbolic (numeric) output are preferred.
An interesting alternative to subsymbolic approach to prediction (and forecasting) represent methods based on application of the (symbolic) prediction rules. The rules can be specified by experts or can be extracted automatically from data. Following the steps in the data mining process, the original data (e.g. time series) are selected, preprocessed and transformed. The main aim is to build a specific set of categorial indicators which can influence the attribute to be predicted. This is the most crucial and difficult step, especially

2nd Annual International Interdisciplinary Conference, AIIC 2014, 8-12 July, Azores, Portugal Proceedings, Vol.3
326
when there is no apriori knowledge. The left-hand side (antecedent) of a prediction rule is the conjunction of the indicators and the right-hand side (succedent) is the categorial prediction goal, which can be easily specified in many practical situations.
In the paper we present our algorithm KEX, that learns weighted decision rules from data. This algorithm is used for the short-term electric load forecasting problem by using the daily data of average load and average temperature. Short Term Electric Load Prediction The Problem
Knowledge about the future behavior of the electric load is very important for power generation, control, transmission, etc. The prediction horizon varies from several minutes up to months and years. In our study we try to predict the daily averaged value of the electric load for the next day. The crucial question here is, whether the electric load of the next day will exceed the given limit and whether additional power units (generators) should be started.
The Data
The data that were available for the analysis consists of the values of the 963 daily average loads and daily average temperatures. Beside this, we also knew the weekday and whether this day was holiday or not. We turned this original data (as shown in Table 1) into following attributes:
LT “long trend”, coded to up/down by the comparing the load values from the two following weeks
ST “short trend”, coded to up/down by comparing the load values from the two following days
TT “temperature trend”, coded up/down by comparing the temperatures from the two following days
T1 “previous temperature trend”, it is the shifted “temperature trend” TYPEDAY type of the day to be predicted, (Mo: Monday, Tu: Tuesday,...,Su: Sunday) HOLIDAY holiday (yes/no) The prediction goal was set to “next load up” to predict the increase or decrease of the
today’s load. We used the data recorded for two consecutive years (first 730 days) for training and
the data for next January till September (next 233 days) for testing. day weekday holiday avg load avg temp.
1 6 0 5789 2 2 7 0 6193 0,5 3 1 0 7607 2,7 4 2 0 7856 4,6 5 3 0 7805 4,3 6 4 0 7784 4,4 7 5 0 7681 6,6 8 6 0 6609 4,3 9 7 0 6368 3,5
10 1 0 7695 3,6 . . .
Tab. 1: Example of original data

2nd Annual International Interdisciplinary Conference, AIIC 2014, 8-12 July, Azores, Portugal Proceedings, Vol.3
327
Fig. 1: Daily average load data
The Method
To find reasonable rules that will allow to predict the daily load for the next day, we used the KEX (Knowledge EXplorer) algorithm (Berka, Ivánek, 1994; Berka, 2012). KEX performs symbolic empirical multiple concept learning from examples, where the induced concept description is represented as weighted decision rules in the form
Ant ==> C(w) where: Ant is a combination (conjunction) of selectors, C is a single category (class), and weight w from the interval [0,1] expresses the uncertainty of the rule. During knowledge acquisition, KEX works in an iterative way, in each iteration
testing and expanding an implication Ant ==> C. This process starts with an „empty rule“ weighted with the relative frequency of the class C and stops after testing all implications created according to the user defined criteria. During testing, the validity (conditional probability P(C|Ant)) of an implication is computed. If this validity significantly differs from the composed weight (value obtained when composing weights of all subrules of the implication Ant ==> C, then this implication is added to the knowledge base. To test the difference between validity and composed weight, we use the chi-square goodness-of-fit test. The weight of this new rule is computed from the validity and from the composed weight using inverse composing function (Hájek, 1985). For composing weights we use a pseudobayesian (Prospector-like) combination function (Duda and Gashing, 1979):
x y xyxy x y⊕ =
⊕ − −( )( )1 1 . (1)
The Results Table 3 presents the found prediction rules. Each row in the table shows the number
of the rule, the number of examples covered by the left-hand side of the rule (frequency left), the number of examples covered by the right-hand side of the rule (frequency right), the number of examples covered by both left-hand and right-hand side of the rule (frequency both), the weight used when combining rules (weight) and the rule itself. Notice, that weights smaller than 0.5 denote rules that will predict the decrease of the load.
When using this set of rules for prediction, all applicable rules are found and their weights are combined using the formula (1). Thus the result of prediction is the weight assigned to the class “load up”. We can use these weights in following decision strategy:
if the weight of the prediction > α, then the next load will be UP, if the weight of the prediction < (1 - α ), then the next load will be DOWN,
0
2000
4000
6000
8000
10000
120001 28 55 82 109
136
163
190
217
244
271
298
325
352
379
406
433
460
487
514
541
568
595
622
649
676
703
730
757
784
811
838
865
892
919
946
Daily average load
Training period Testing period

2nd Annual International Interdisciplinary Conference, AIIC 2014, 8-12 July, Azores, Portugal Proceedings, Vol.3
328
if the weight is in the interval [1 - α, α], then we do not predict. Here α is a threshold that can be set by the user. Table 2 shows the impact of this parameter on the accuracy of our prediction model (in terms of percentage of correctly predicted testing days) and on the number of days for which no prediction is done. It can be seen, that when increasing the value of α, the percentage of correct prediction increases but the number of days, for which the model makes a decision decreases.
Tab. 2: Prediction performance of KEX on testing data for various values of α
Tab. 3: A rule base generated by KEX using 730 daily averaged electric load and temperature data. Conclusion
The problem of short-term electric load prediction (forecasting) can be treated by different machine learning approaches. Ceperic et al. (Ceperic et al., 2012) or Matijac et al.
α Correct predictions Wrong predictions no. of predictions prediction accuracy 0.5 206 27 233 88.0%
0.55 200 17 217 92.2% 0.6 197 15 212 92.9% 0.7 189 12 201 94.0% 0.8 159 8 167 95.2% 0.9 136 4 140 97.1%
RULE BASE Frequency
No. left right both weight rule ------------------------------------------------------------------------------------------------- 1. 730 325 325 0.4452 0 ==> load up 2. 405 325 132 0.3760 ST=down ==> load up 3. 333 325 167 0.5563 TT=down ==> load up 4. 325 325 193 0.6456 ST=up ==> load up 5. 324 325 162 0.5548 TT1=down & holiday=no ==> load up 6. 241 325 89 0.4219 TT1=up & TT=up ==> load up 7. 171 325 85 0.4033 ST=up & TT=up ==> load up 8. 105 325 1 0.0118 typeday=Sa ==> load up 9. 105 325 4 0.0470 typeday=Su ==> load up 10. 104 325 99 0.9610 typeday=Mo ==> load up 11. 104 325 94 0.9213 typeday=Tu ==> load up 12. 104 325 57 0.6018 typeday=We ==> load up 13. 104 325 18 0.2069 typeday=Fr ==> load up 14. 99 325 89 0.3420 typeday=Tu & ST=up ==> load up 15. 98 325 98 0.9082 typeday=Mo & holiday=no ==> load up 16. 95 325 47 0.4011 ST=up & LT=up & TT1=up ==> load up 17. 94 325 55 0.3896 typeday=We & ST=up ==> load up 18. 75 325 57 0.6334 ST=up & TT=down & LT=down ==> load up 19. 52 325 32 0.6660 typeday=Th & TT1=down ==> load up 20. 49 325 49 0.8915 typeday=Mo & LT=up & ST=down ==> load up 21. 48 325 34 0.7071 typeday=Th & TT=down ==> load up 22. 39 325 35 0.2606 typeday=Mo & TT=down ==> load up 23. 29 325 4 0.2146 typeday=Th & TT1=up & TT=up ==> load up 24. 18 325 1 0.1336 typeday=Fr & ST=up & TT1=up ==> load up 25. 17 325 2 0.1425 holiday=yes ==> load up 26. 6 325 1 0.0573 holiday=yes & typeday=Mo ==> load up

2nd Annual International Interdisciplinary Conference, AIIC 2014, 8-12 July, Azores, Portugal Proceedings, Vol.3
329
(Matijac et al., 2011) use support vector machines, Ling et. al. (Ling et al., 2003) use fuzzy-neural network, Gupta and Sarangi (Gupta and Saranagi, 2012) combine genetic algorithms and neural networks. In this paper we present an alternative method based on symbolic prediction rules. We see the advantage of our approach in the fact, that the learned rules can be better understood by the domain experts.
References: Berka, P.: Learning compositional decision rules using the KEX algorithm. Intelligent Data Analysis, Vol. 16, No. 4, 2012, 665-681. Berka, P. and Ivánek, J.: Automated Knowledge Acquisition for PROSPECTOR-like Expert Systems. In. (Bergadano, deRaedt eds.) Proc. ECML'94, Springer 1994. Ceperic, E., Ceperic, V. and Baric, A.: A Strategy for Short-Term Load Forecasting by Support Vector Regression Machines. IEEE Transactions on Power Systems, Vol. 28, No. 4, 2013, 4356 - 4364 Duda, R.O., and Gasching, J.E.: Model Design in the PROSPECTOR Consultant System for Mineral Exploration. In:Michie, D. (ed.), Expert Systems in the Micro Electronic Age, Edinburgh University Press, UK, 1979. Gupta, A. and . Sarangi, P.K.: Electrical Load Forecasting Using Genetic Algorithm based Back-propagation Method. ARPN Journal of Engineering and Applied Sciences, Vol. 7, No. 8, August 2012, 1017-1020 Hájek, P.: Combining Functions for Certainty Factors in Consulting Systems. Int.J. Man- Machine Studies 22, 1985, 59-76. Ling, S.H., Leung, F.H.F., Lam, H.K. and Tam, P.K.S.: Short-Term Electric Load Forecasting Based on a Neural Fuzzy Network. IEEE Transactions on Industrial Electronics, Vol. 50, No. 6, December 2003, 1305-1316 Matijac, M, Vukicevic, M. and Krajcar, V.: Supplier Short Term Load Forecasting Using Support Vector Regression And Exogenous Input. Journal of Electrical Engineering, Vol. 62, No. 5, 2011, 280–285

2nd Annual International Interdisciplinary Conference, AIIC 2014, 8-12 July, Azores, Portugal Proceedings, Vol.3
330
HEAT PUMPS AND COST OPTIMAL BUILDING PERFORMANCE
Henrik Gjerkeš, PhD University of Nova Gorica, Slovenia Marjana Šijanec Zavrl, PhD
Gašper Stegnar, MS Building and Civil Engineering Institute ZRMK, Ljubljana, Slovenia
Abstract Slovenia has established comparative methodology framework for the minimum
energy performance requirements on the basis of article 5 of the Directive EPBD – Recast (2010/31/EU) and in accordance with Annex III, differentiating between different categories of buildings. Choosing a single family house, energy performance of the buildings was calculated with IDA Indoor Climate and Energy as a whole year detailed and dynamic multi-zone simulation study of indoor climate and energy use. The minimum energy performance requirements are represented by the area of the cost curve that delivers the lowest cost for the end-user and society. The results demonstrate that the minimum requirements set for new single family houses in national building codes in force are more severe than the minimum requirements corresponding to the cost optimal level, mainly due to the national energy and climate policy targets in the building sector. Among systems, heat pumps proved to be important competitors in seeking the cost optimal building performance. It was shown, that heat pumps are environmentally acceptable and economically efficient way of heating with plausible positive social multiplied effects. Heat pumps have support of local economy and are based on well-established technology, their operational is efficient, reliable and are suitable for almost all buildings. In the future it is expected to reach higher coefficient of performance (COP), especially at lower temperatures. Higher COP, together with further increase of renewables share in national electrical power system is making heat pumps important foundation for further sustainable development in line with sustainable principles.
Keywords: Nearly zero energy buildings, Cost optimality, Renewable energy sources, Sustainability, Heat pump Introduction Directive EPBD – Recast (2010/31/EU) require very high energy performance for nearly zero energy buildings (nZEB) while nearly zero or very low energy demand must be covered to a very significant amount by energy from renewable energy sources (RES). By 2020 (by 2018 for public buildings) all new buildings will have to correspond to the national nZEB definition. The EU overview of the drafted nZEB regulation prepared under IEE CA EPBD III project showed that crucial question in formulation of nZEB criteria is how to define “nearly” zero energy demand (Maldonado, 2012). Nevertheless, the energy efficiency minimum requirements of the building codes must be based on cost effectiveness from the life-cycle perspective and the requirements may only go beyond the threshold of cost effectiveness.
2nd Annual International Interdisciplinary Conference, AIIC 2014, 8-12 July, Azores, Portugal Proceedings, Vol.3
331
Renewable energy is an integral part of fight against climate change and is crucial in sustainable growth, job creation and increase of local energy security, therefore plays at most important role in formulation of nZEB criteria. By 2020 renewable energy should account for 20% of the EU's final energy consumption. To meet this common target, each Member State (MS) needs to increase its production and use of renewable energy in electricity, heating and cooling and transport. The renewables targets are calculated as the share of renewable consumption to gross final energy consumption. Renewables consumption comprises the direct use of renewables (e.g. biomass, syngas, biofuels) and the part of electricity and heat that is produced from renewables (e.g. hydro, biomass cogeneration, solar power plants), while final energy consumption is the energy that households, industry, services, agriculture and the transport sector use. Slovenia started with 16 % in 2005 and has target to reach 25% utilization of RES in final energy consumption by 2020 (EC-Directorate General for Energy and Transport, 2008).
In Slovenia the potential of solid biomass is high, with over 55 % of land covered with forests. Secondary wood is used mainly for heating by firing in individual furnaces and is prevailing fuel in household sector. It is local RES and is relatively cheap fuel, but could have also side effects, especially emission of PM10 hard particles, which becomes significant problem for Slovenia. In looking for more appropriate energetic utilization of high potential of wooden biomass, the innovative technologies developing and some already emerging on market (e.g. gasification with poly-generation) seems to be right direction, having in mind district heating systems, local energy self-supply and increase of RES level in national electrical power system. Considering sustainability circumstances, together with regional resources, the potential of heat pumps in residential sector was analysed in context of cost optimal nZEB performance. Cost optimal building performance
Slovenia has implemented EPBD (European Commission, 2013) based minimum requirements for energy efficient buildings in the year 2002, and accepted two revisions in 2008 and 2010 building codes. The process of setting national minimum requirements was based on the advanced but market available technologies for energy efficient buildings and defined in accordance with the national targets and obligations set by the 20-20-20 policy.
Methodology allows the MS to complement the framework methodology in certain elements. Economic lifecycles of the building and building elements are assumed in line with findings of IEE LCC DATA project, national regulation on maintenance of buildings and building elements and EN 15459: 2007 (for energy systems). The comparison with related EU studies on LCC showed that the lifetime of building elements may differ in a significant range. The discount rates of 3% and 5% (required in the national procurement documentation) are taken in the consideration. The cost categories for LCC are based on the prEN 15643-4 (and standardization from CEN/TC 350) with consideration to the Annex I of methodology framework (i.e. disposal costs were excluded, the costs that are the same for all variants and costs that have no influence on energy performance of a building were also omitted). Primary energy factors are determined in the national regulation, i.e. building code PURES 2010. Energy performance is determined according to the national calculation methodology which is based on EN ISO 13790 and CEN EPBD standards (European Commission, 2013). The climate in central Slovenia may be considered relevant for the majority of settlements in the country, only the small coastal area has milder, Mediterranean climate (Šijanec Zavrl et al, 2013).
In order to investigate the cost optimality of minimum requirements in Slovenian building code the national study was initiated based on the EC comparative methodology framework for calculating cost optimal levels of minimum energy performance requirements
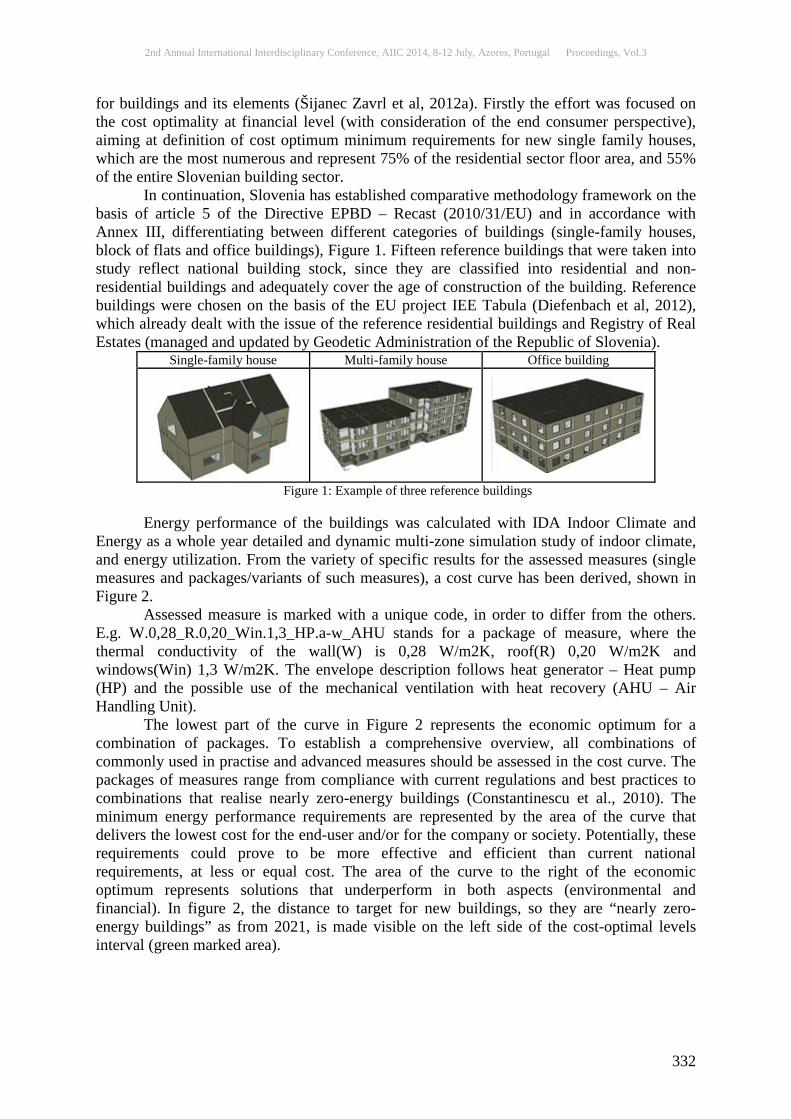
2nd Annual International Interdisciplinary Conference, AIIC 2014, 8-12 July, Azores, Portugal Proceedings, Vol.3
332
for buildings and its elements (Šijanec Zavrl et al, 2012a). Firstly the effort was focused on the cost optimality at financial level (with consideration of the end consumer perspective), aiming at definition of cost optimum minimum requirements for new single family houses, which are the most numerous and represent 75% of the residential sector floor area, and 55% of the entire Slovenian building sector.
In continuation, Slovenia has established comparative methodology framework on the basis of article 5 of the Directive EPBD – Recast (2010/31/EU) and in accordance with Annex III, differentiating between different categories of buildings (single-family houses, block of flats and office buildings), Figure 1. Fifteen reference buildings that were taken into study reflect national building stock, since they are classified into residential and non-residential buildings and adequately cover the age of construction of the building. Reference buildings were chosen on the basis of the EU project IEE Tabula (Diefenbach et al, 2012), which already dealt with the issue of the reference residential buildings and Registry of Real Estates (managed and updated by Geodetic Administration of the Republic of Slovenia).
Single-family house Multi-family house Office building
Figure 1: Example of three reference buildings Energy performance of the buildings was calculated with IDA Indoor Climate and
Energy as a whole year detailed and dynamic multi-zone simulation study of indoor climate, and energy utilization. From the variety of specific results for the assessed measures (single measures and packages/variants of such measures), a cost curve has been derived, shown in Figure 2.
Assessed measure is marked with a unique code, in order to differ from the others. E.g. W.0,28_R.0,20_Win.1,3_HP.a-w_AHU stands for a package of measure, where the thermal conductivity of the wall(W) is 0,28 W/m2K, roof(R) 0,20 W/m2K and windows(Win) 1,3 W/m2K. The envelope description follows heat generator – Heat pump (HP) and the possible use of the mechanical ventilation with heat recovery (AHU – Air Handling Unit).
The lowest part of the curve in Figure 2 represents the economic optimum for a combination of packages. To establish a comprehensive overview, all combinations of commonly used in practise and advanced measures should be assessed in the cost curve. The packages of measures range from compliance with current regulations and best practices to combinations that realise nearly zero-energy buildings (Constantinescu et al., 2010). The minimum energy performance requirements are represented by the area of the curve that delivers the lowest cost for the end-user and/or for the company or society. Potentially, these requirements could prove to be more effective and efficient than current national requirements, at less or equal cost. The area of the curve to the right of the economic optimum represents solutions that underperform in both aspects (environmental and financial). In figure 2, the distance to target for new buildings, so they are “nearly zero-energy buildings” as from 2021, is made visible on the left side of the cost-optimal levels interval (green marked area).
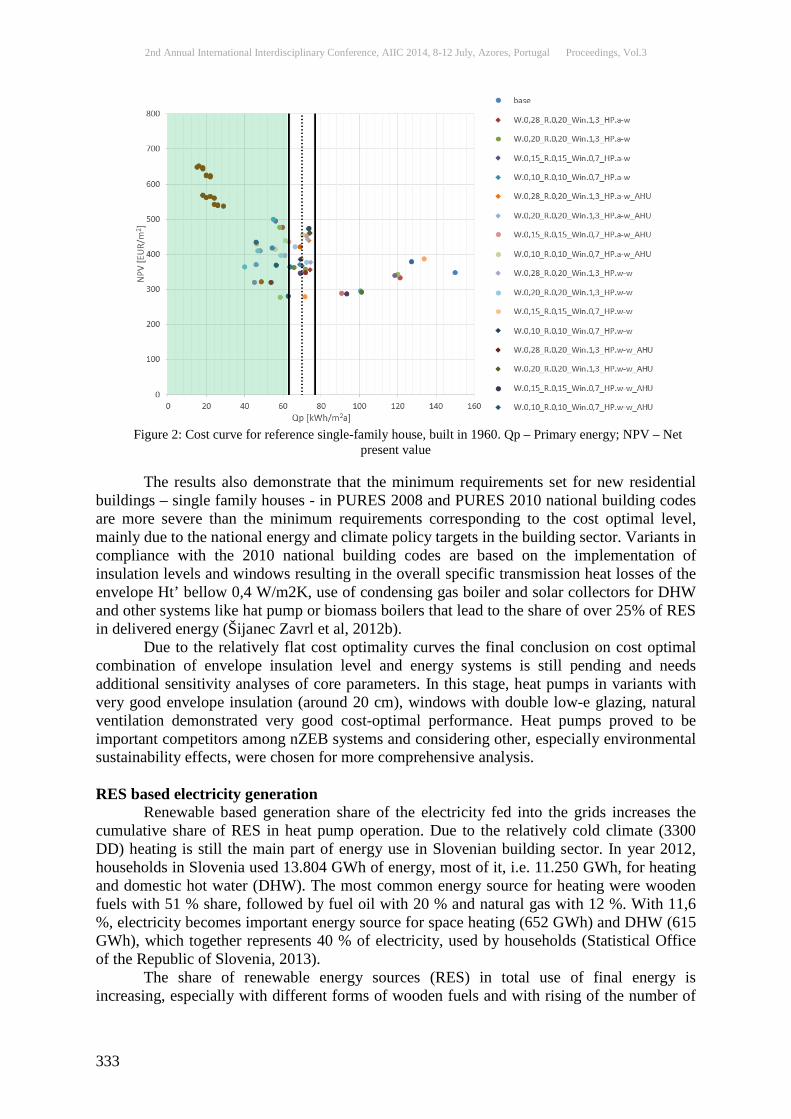
2nd Annual International Interdisciplinary Conference, AIIC 2014, 8-12 July, Azores, Portugal Proceedings, Vol.3
333
Figure 2: Cost curve for reference single-family house, built in 1960. Qp – Primary energy; NPV – Net
present value The results also demonstrate that the minimum requirements set for new residential
buildings – single family houses - in PURES 2008 and PURES 2010 national building codes are more severe than the minimum requirements corresponding to the cost optimal level, mainly due to the national energy and climate policy targets in the building sector. Variants in compliance with the 2010 national building codes are based on the implementation of insulation levels and windows resulting in the overall specific transmission heat losses of the envelope Ht’ bellow 0,4 W/m2K, use of condensing gas boiler and solar collectors for DHW and other systems like hat pump or biomass boilers that lead to the share of over 25% of RES in delivered energy (Šijanec Zavrl et al, 2012b).
Due to the relatively flat cost optimality curves the final conclusion on cost optimal combination of envelope insulation level and energy systems is still pending and needs additional sensitivity analyses of core parameters. In this stage, heat pumps in variants with very good envelope insulation (around 20 cm), windows with double low-e glazing, natural ventilation demonstrated very good cost-optimal performance. Heat pumps proved to be important competitors among nZEB systems and considering other, especially environmental sustainability effects, were chosen for more comprehensive analysis. RES based electricity generation Renewable based generation share of the electricity fed into the grids increases the cumulative share of RES in heat pump operation. Due to the relatively cold climate (3300 DD) heating is still the main part of energy use in Slovenian building sector. In year 2012, households in Slovenia used 13.804 GWh of energy, most of it, i.e. 11.250 GWh, for heating and domestic hot water (DHW). The most common energy source for heating were wooden fuels with 51 % share, followed by fuel oil with 20 % and natural gas with 12 %. With 11,6 %, electricity becomes important energy source for space heating (652 GWh) and DHW (615 GWh), which together represents 40 % of electricity, used by households (Statistical Office of the Republic of Slovenia, 2013). The share of renewable energy sources (RES) in total use of final energy is increasing, especially with different forms of wooden fuels and with rising of the number of
2nd Annual International Interdisciplinary Conference, AIIC 2014, 8-12 July, Azores, Portugal Proceedings, Vol.3
334
district heating systems. The role of heat pumps, which transform renewable energy from environment (sun, ground), is increasing and became important energy source in sector heating. Therefore, from the sustainability point of view, the trends of the share of RES in power generation on national level are very important for meeting the targets of nZEB and sustainable building. Renewable based generation accounted for 22,3% of the electricity fed into the grids of the European Union in 2012, a year-on-year increase of 7%. By the end of the decade renewables are predicted to be the second largest component of the EU energy mix, accounting for 34% of the total generation, Figure 3 (EURELECTRIC, 2013).
Figure 3: Electricity generation shares in the EU27 countries, 2012 and prediction for 2020.
Increase of RES based electricity generation share in energy mix from 2004 to 2012 is shown in Figure 4. The share of renewables in gross electricity consumption in Slovenia, which as a result of very favourable hydrological conditions in 2009 grew to more than a third, dropped substantially by 2011. In 2009 electricity from renewables accounted for 36.8% of total electricity generated in Slovenia (Eurostat, 2013). Even though the hydrological conditions were still relatively favourable, the share declined to 33,8 % in 2010 because of higher economic activity and hence higher electricity consumption. With much lower water levels of rivers and thus lower hydro-energy production in 2011, the share dropped to 30,8 %. However, it was still above the EU average (21,7 %), where in the past few years the share of renewables in electricity production has been gradually growing.
Figure 4: RES based electricity generation share in energy mix
0
5
10
15
20
25
30
35
40
2004 2005 2006 2007 2008 2009 2010 2011 2012
Elec
tric
ity g
ener
ated
from
rene
wab
le
sour
ces,
%
Year
EU (28countri…

2nd Annual International Interdisciplinary Conference, AIIC 2014, 8-12 July, Azores, Portugal Proceedings, Vol.3
335
With the increase in production in hydroelectric power plants and stagnation of gross electricity consumption, in 2012 the share of renewables in electricity production in Slovenia increased to 31,4 % (IMAD, 2013). Slovenia reached 28,50 % share of RES in reference year 2005 and the target in this sector is 39,30 % of RES in electric energy mix by year 2020, which will require more diversification of power generation from RES as well as improved management of electricity use. Cost and environmental efficiency of heat pumps Heat pumps are an attractive option for reducing GHG emissions caused by buildings. Heat pumps are based on well-established technology and nearly half a million systems have been installed worldwide. In Slovenia heat pumps have demonstrated that they can provide ample heat in the most challenging environment. Heat pumps exploit primarily the energy of sun, heating the air, but also from soil, as about 50% of solar energy that falls on the earth’s surface is absorbed by it and represent an energy reservoir. The technology of heat pumps is well developed and their operational is efficient, reliable and are less vulnerable to changes in weather than majority of other low-energy and renewable systems. Heat pumps use the refrigeration cycle to upgrade low-grade environmental energy collected from sources such as air, ground or ground water into energy for use in hot water supply, space heating or cooling. In Slovenia, an air-source heat pump (a/w) achieves a typical annual average coefficient of performance (COP) of 3,5, which means that 350 % the energy, put into the process in the form of electric energy, is generated as heating energy at appropriate temperature level for low-temperature heating systems in buildings. A soil/water (s/w) and water/water (w/w) heat pumps achieve in Slovenia an annual average coefficient of performance of 4,5 and 5, respectively (Gjerkeš et al., 2011). In assessment of economic effects of different heating sources, the already presented cost-optimum methodology represent the most comprehensive approach, but also a direct operational cost comparison could give a fast overview about the cost effectiveness of different energy sources for building heating. Operational cost comparison is shown in Figure 5 on the example of single family house with annual consumption of 18,3 MWh of final energy for space heating (Theating water = 35 °C) and domestic hot water (DHW, TDHW = 55 °C). For the analysed systems, typical efficiency data were taken, together with fuel and energy prices from the beginning of 2014. It is clearly shown, that comparing the various heating systems, the heat pumps outperforms other systems considerably from the operating cost point of view. Still widely used oil boiler is as much as 188 % more expensive to use as the most common air/water heat pump.

2nd Annual International Interdisciplinary Conference, AIIC 2014, 8-12 July, Azores, Portugal Proceedings, Vol.3
336
Figure 5: Annual fuel/energy costs for different heating systems in single family house with annual energy
demand of 18,3 MWh In assessment of environmental effects of different heating sources, the use of primary energy was compared and shown in Figure 6, and standard emission of CO2 in Figure 7 using the coefficients as determined in the national regulation, i.e. building code PURES 2010. These coefficient imply the actual share of RES in national electric energy mix.
Figure 6: Annual use of primary energy for different heating systems in single family house with annual energy
demand of 18,3 MWh Also in primary energy use and CO2 emission, the heat pumps outperform other systems, except system on wooden biomass, which on the other side in small individual boilers can cause already mentioned burning issue in Slovenia with emission of PM10 hard particles. Comprehensive estimation of effects therefore makes heat pump very competitive heating system also in environmental point of view. Their competitiveness will increase even more with higher COP, especially at lower temperatures, and with increase of the share of renewables in electricity production in Slovenia. The share of RES utilized by heat pump with COP = 3,5 is 71,4 %, if there is no RES based electricity generation (EE) share in national energy mix, and increases to 80 % with 30
2.617 2.157
1.348 1.024 1.200
523 582 748
0,00
500,00
1000,00
1500,00
2000,00
2500,00
3000,00
EUR/
a
45750
23682 21189
2153
20793
9150 10167 13071
0
5000
10000
15000
20000
25000
30000
35000
40000
45000
50000
kWh/
a
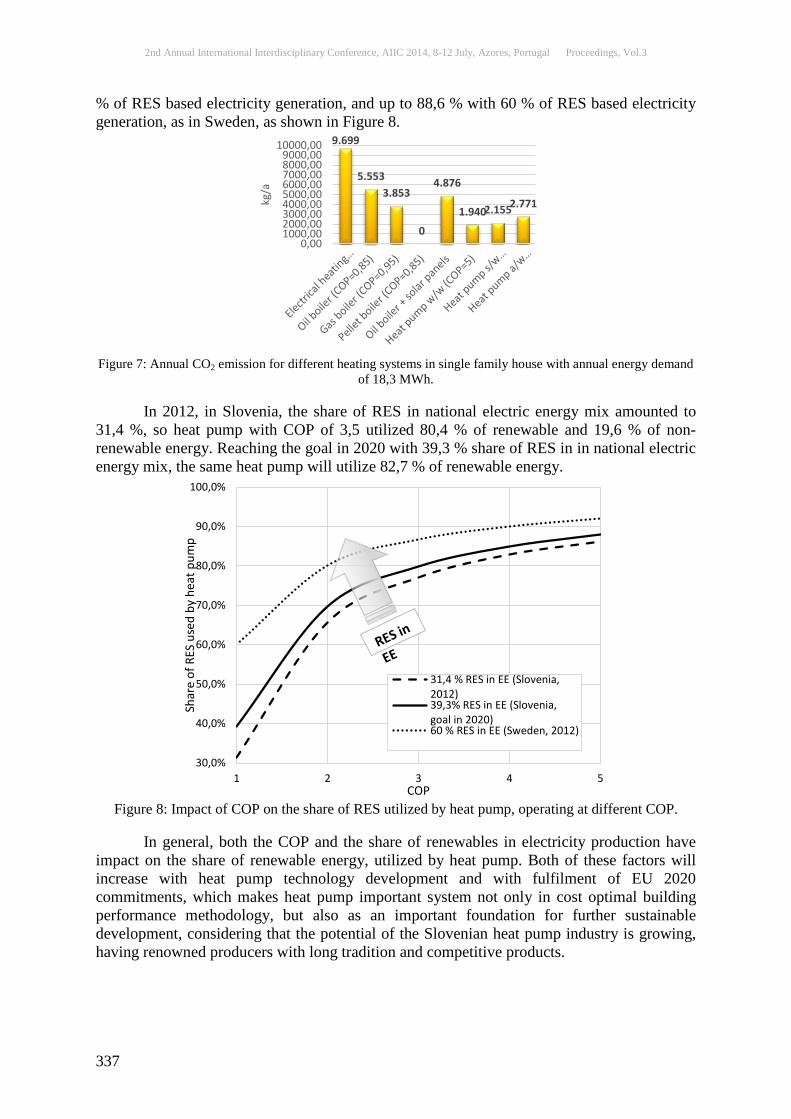
2nd Annual International Interdisciplinary Conference, AIIC 2014, 8-12 July, Azores, Portugal Proceedings, Vol.3
337
% of RES based electricity generation, and up to 88,6 % with 60 % of RES based electricity generation, as in Sweden, as shown in Figure 8.
Figure 7: Annual CO2 emission for different heating systems in single family house with annual energy demand
of 18,3 MWh. In 2012, in Slovenia, the share of RES in national electric energy mix amounted to 31,4 %, so heat pump with COP of 3,5 utilized 80,4 % of renewable and 19,6 % of non-renewable energy. Reaching the goal in 2020 with 39,3 % share of RES in in national electric energy mix, the same heat pump will utilize 82,7 % of renewable energy.
Figure 8: Impact of COP on the share of RES utilized by heat pump, operating at different COP.
In general, both the COP and the share of renewables in electricity production have impact on the share of renewable energy, utilized by heat pump. Both of these factors will increase with heat pump technology development and with fulfilment of EU 2020 commitments, which makes heat pump important system not only in cost optimal building performance methodology, but also as an important foundation for further sustainable development, considering that the potential of the Slovenian heat pump industry is growing, having renowned producers with long tradition and competitive products.
9.699
5.553 3.853
0
4.876
1.940 2.155 2.771
0,001000,002000,003000,004000,005000,006000,007000,008000,009000,00
10000,00
kg/a
30,0%
40,0%
50,0%
60,0%
70,0%
80,0%
90,0%
100,0%
1 2 3 4 5
Shar
e of
RES
use
d by
hea
t pum
p
COP
31,4 % RES in EE (Slovenia,2012)39,3% RES in EE (Slovenia,goal in 2020)60 % RES in EE (Sweden, 2012)
2nd Annual International Interdisciplinary Conference, AIIC 2014, 8-12 July, Azores, Portugal Proceedings, Vol.3
338
Conclusion Slovenia has established comparative methodology framework for the minimum
energy performance requirements on the basis of article 5 of the Directive EPBD – Recast (2010/31/EU) and in accordance with Annex III, differentiating between different categories of buildings. Choosing a single family house, energy performance of the buildings was calculated with IDA Indoor Climate and Energy as a whole year detailed and dynamic multi-zone simulation study of indoor climate, and utilization of energy. From the variety of specific results for the assessed measures (single measures and packages/variants of such measures), a cost curve has been derived. The minimum energy performance requirements are represented by the area of the curve that delivers the lowest cost for the end-user and/or for the company or society. Potentially, these requirements could prove to be more effective and efficient than current national requirements, at less or equal cost. The results demonstrate that the minimum requirements set for new single family houses in national building codes in force are more severe than the minimum requirements corresponding to the cost optimal level, mainly due to the national energy and climate policy targets in the building sector. Among systems, heat pumps proved to be important competitors in seeking the cost optimal building performance.
In Slovenia, the heat pumps in addition to wooden biomass (and potential waste) represent the greatest potential for sustainable increase of the renewables in the heating and cooling sector. It was shown, that heat pumps are environmentally acceptable and economically efficient way of heating with (potentially) positive social multiplied effects if the domestic manufacturers of equipment and systems will have appropriate conditions for further development. Heat pumps are based on well-established technology, their operational is efficient, reliable and are less vulnerable to changes in weather than majority of other low-energy and renewable systems, and are suitable for (almost) all buildings. Development continues and we can expect even higher COP, especially at lower temperatures. Higher COP, together with further increase of renewables share in the Slovenian electrical power system is making heat pumps important foundation for further sustainable development in line with sustainable principles.
References: Constantinescu Tudor et al.. Cost optimality – Discussing methodology and challenges within the recast Energy Performance of Buildings Directive. Brussels: BPIE, 2010. Diefenbach, N., Loga, T., Dascalaki, E., Balaras, C., Šijanec Zavrl, M., Rakušček, A., Corrado, V., Corgnati, S., Ballarini, I., Renders, N., Vimmr, T., B. Wittchen, K., Kragh, J., Application of Building Typologies for Modelling the Energy Balance of the Residential Building Stock – TABULA Thematic Report N° 2 – ISBN 978-3-941140-23-3, Februar 2012 EURELECTRIC - Union of the Electricity Industry, Power Statistics & Trends, Brussels, 2013 European Commission, Directorate General for Energy and Transport. Slovenia – Renewable Energy Fact Sheet, 2008 European Commission. Implementing Energy Performance of Buildings Directive (EPBD), (http://www.epbd-ca.eu/), 2013 Gjerkeš, Henrik, Papler, Drago, Šijanec-Zavrl, Marjana. Sustainable development of power generation in Slovenia. V: GOLOBIČ, Iztok (ur.), CIMERMAN, Franc (ur.). Development and implementation of enhanced technologies 2011 : proceedings of the 3rd AMES International Conference, Ljubljana, Slovenia, November 29th-30th, 2011. 1st ed. Ljubljana: Association of Mechanical Engineers of Slovenia - AMES, 2011 IMAD – Institute of Macroeconomic Analysis and Development, Development Report, Indicators of Slovenia’s development, 2013

2nd Annual International Interdisciplinary Conference, AIIC 2014, 8-12 July, Azores, Portugal Proceedings, Vol.3
339
Maldonado Eduardo. Member states approaches EPBD, World Sustainable Energy Days 2012, Nearly Zero Energy Buildings Conference, Wels, March 1, 2012 Statistical Office of the Republic of Slovenia, Energy consumption in households, Slovenia, 2012 - final data, http://www.stat.si/eng/novica_prikazi.aspx?id=5803, 2013 Šijanec-Zavrl, Marjana, Skubic, Marta, Rakušček, Andraž, Gjerkeš, Henrik, Potočar, Erik. Practical implementation of coast-optimal regulation for establishing national minimum requirements of Slovenia. V: World Sustainable Energy Days, Wels, 29 February - 2 March , 2012. Proceedings. Wels: [O. Ö. Energiesparverband, Linz], 2012a, [13] 3 pp. Šijanec-Zavrl, Marjana, Gjerkeš, Henrik, Tomšič, Miha. Integration of nearly zero energy buildings : a challenge for sustainable building stock. V: World Engineering Forum, 17-21 September 2012, Ljubljana, Slovenia. Sustainable construction for people. Ljubljana: Inženirska zbornica Slovenije, 2012b. Šijanec-Zavrl, Marjana, Gjerkeš, Henrik. Sustainable energy networks: a hub for nearly zero energy buildings : presented at 3rd International Exergy, Life Cycle Assessment, and Sustainability Workshop & Symposium (ELCAS-3), 07-09 July, 2013, Nisyros, Greece. Nisyros: ELCAS-3, 2013
2nd Annual International Interdisciplinary Conference, AIIC 2014, 8-12 July, Azores, Portugal Proceedings, Vol.3
340
APPLICATION OF STATISTICAL PROCESS CONTROL THEORY IN COAL AND GAS OUTBURST PREVENTION
Shaojie Hou
Computer Center, Hebei University of Economics and Business, Shijiazhuang, China Post-doctoral Scientific Research Workstation, Shanxi Coking Coal Group CO., LTD,
Taiyuan, China Yuwei Zhang
Computer Center, Hebei University of Economics and Business, Shijiazhuang, hina Shijiazhuang Vocational College of Finance Economics, Shijiazhuang, China
Yuanping Cheng
Key Laboratory of Gas and Fire Control for Coal Mine, China University of Mining & Technology, Xuzhou, China
Abstract With Chinese coal exploitation extending to depth rapidly, a large number of coal and gas outburst accidents happened and resulted in thousands of casualties in the last decade. Coal and gas outburst prevention project has become the prerequisite of underground coal mining, but its process control ability is especially poor. By integrating statistical process control theory into the process of coal and gas outburst prevention, three urgent problems were solved. First at all, data structure of the process inspection parameters was designed as vectors, which only consisted of principle elements and formed data series as time went by. Secondly, based on sample data of the experimental area, statistical characteristic of inspection parameters was gained and their X-Rs control charts were drawn. Finally, performance of process running statuses that might be in control or beyond control were analyzed in detail. When the process was in control, curves should slightly fluctuate around their center lines and between upper control limits and lower control limits. Otherwise, the process was beyond control, in which X control charts were used to identify anomalies of data value fluctuation and Rs control charts were used to identify anomalies of data fluctuation amplitudes. By the experimental application in Hexi colliery of China, the interdisciplinary research was proved to be helpful to improve process control ability and then prevent coal and gas outburst accidents.
Keywords: Coal and gas outburst, statistical process control, control chart, anomaly identification, coal mining Introduction With the rapid growth of Chinese economy, coal demand has been increasing sharply. In last ten years, coal output has soared up to 3.7 billion tons in 2013 from 1.8 billion tons in 2004. Meanwhile, coal exploitation depth of almost all Chinese underground collieries has exceeded 800m (Liu et al, 2010). The phenomenon of three high and two low, namely high geo-stresses, high gas, high inhomogeneous, low permeability and low coal mass strength, became more and more serious, which gave rise to a large number of coal and gas outburst accidents (Hou et al, 2013). Official accident statistical reports issued by China State Administration of Coal Mine Safety manifested annual casualties directly caused by coal and gas outburst accidents were continuously over 300 in last five years.
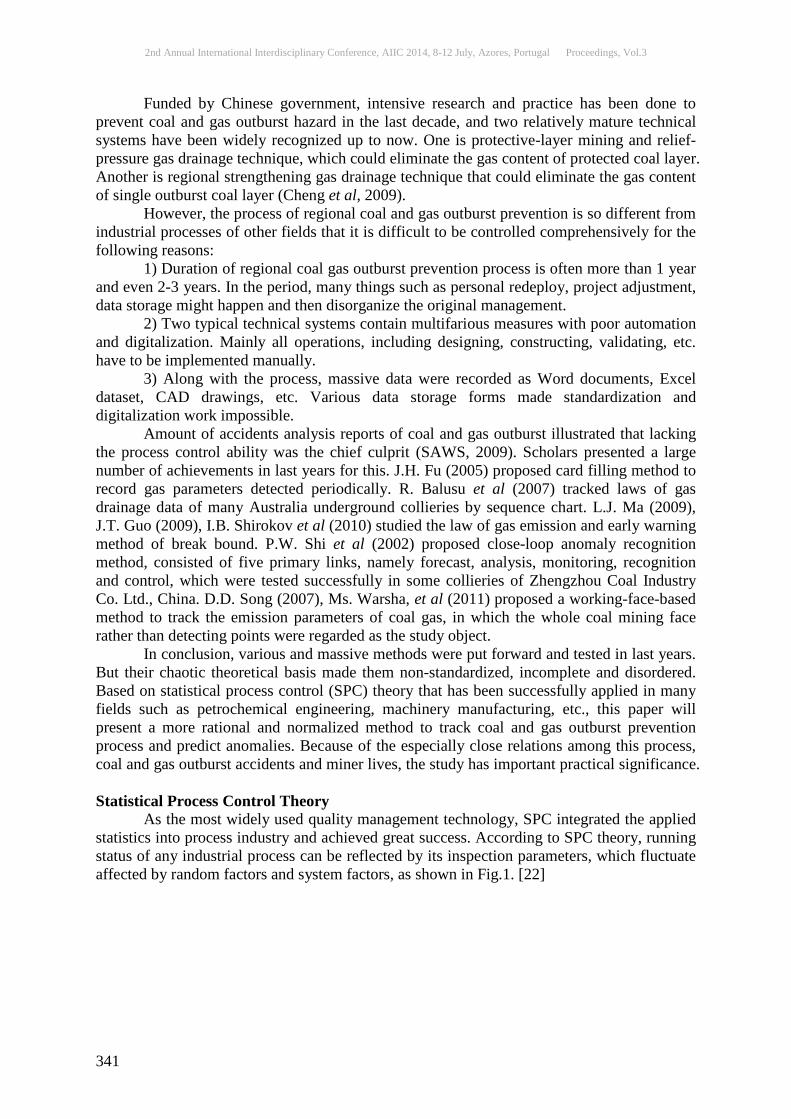
2nd Annual International Interdisciplinary Conference, AIIC 2014, 8-12 July, Azores, Portugal Proceedings, Vol.3
341
Funded by Chinese government, intensive research and practice has been done to prevent coal and gas outburst hazard in the last decade, and two relatively mature technical systems have been widely recognized up to now. One is protective-layer mining and relief-pressure gas drainage technique, which could eliminate the gas content of protected coal layer. Another is regional strengthening gas drainage technique that could eliminate the gas content of single outburst coal layer (Cheng et al, 2009).
However, the process of regional coal and gas outburst prevention is so different from industrial processes of other fields that it is difficult to be controlled comprehensively for the following reasons:
1) Duration of regional coal gas outburst prevention process is often more than 1 year and even 2-3 years. In the period, many things such as personal redeploy, project adjustment, data storage might happen and then disorganize the original management.
2) Two typical technical systems contain multifarious measures with poor automation and digitalization. Mainly all operations, including designing, constructing, validating, etc. have to be implemented manually.
3) Along with the process, massive data were recorded as Word documents, Excel dataset, CAD drawings, etc. Various data storage forms made standardization and digitalization work impossible.
Amount of accidents analysis reports of coal and gas outburst illustrated that lacking the process control ability was the chief culprit (SAWS, 2009). Scholars presented a large number of achievements in last years for this. J.H. Fu (2005) proposed card filling method to record gas parameters detected periodically. R. Balusu et al (2007) tracked laws of gas drainage data of many Australia underground collieries by sequence chart. L.J. Ma (2009), J.T. Guo (2009), I.B. Shirokov et al (2010) studied the law of gas emission and early warning method of break bound. P.W. Shi et al (2002) proposed close-loop anomaly recognition method, consisted of five primary links, namely forecast, analysis, monitoring, recognition and control, which were tested successfully in some collieries of Zhengzhou Coal Industry Co. Ltd., China. D.D. Song (2007), Ms. Warsha, et al (2011) proposed a working-face-based method to track the emission parameters of coal gas, in which the whole coal mining face rather than detecting points were regarded as the study object.
In conclusion, various and massive methods were put forward and tested in last years. But their chaotic theoretical basis made them non-standardized, incomplete and disordered. Based on statistical process control (SPC) theory that has been successfully applied in many fields such as petrochemical engineering, machinery manufacturing, etc., this paper will present a more rational and normalized method to track coal and gas outburst prevention process and predict anomalies. Because of the especially close relations among this process, coal and gas outburst accidents and miner lives, the study has important practical significance. Statistical Process Control Theory
As the most widely used quality management technology, SPC integrated the applied statistics into process industry and achieved great success. According to SPC theory, running status of any industrial process can be reflected by its inspection parameters, which fluctuate affected by random factors and system factors, as shown in Fig.1. [22]
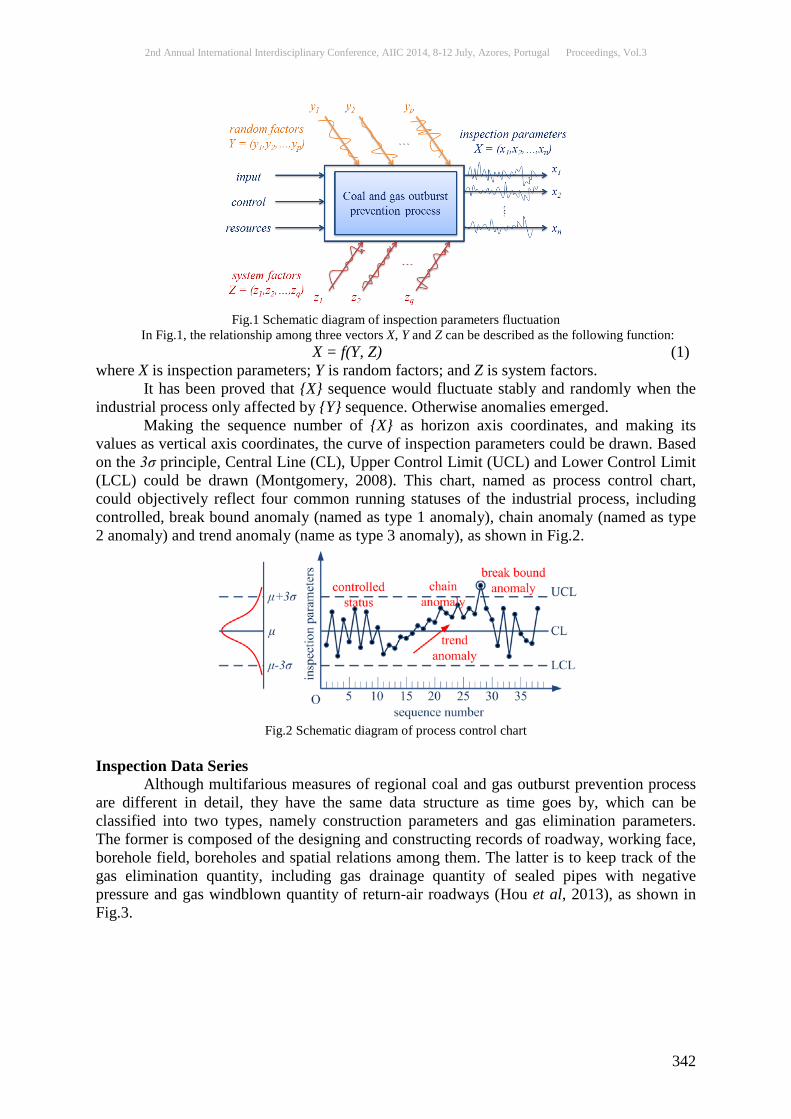
2nd Annual International Interdisciplinary Conference, AIIC 2014, 8-12 July, Azores, Portugal Proceedings, Vol.3
342
Fig.1 Schematic diagram of inspection parameters fluctuation
In Fig.1, the relationship among three vectors X, Y and Z can be described as the following function: X = f(Y, Z) (1)
where X is inspection parameters; Y is random factors; and Z is system factors. It has been proved that {X} sequence would fluctuate stably and randomly when the
industrial process only affected by {Y} sequence. Otherwise anomalies emerged. Making the sequence number of {X} as horizon axis coordinates, and making its
values as vertical axis coordinates, the curve of inspection parameters could be drawn. Based on the 3σ principle, Central Line (CL), Upper Control Limit (UCL) and Lower Control Limit (LCL) could be drawn (Montgomery, 2008). This chart, named as process control chart, could objectively reflect four common running statuses of the industrial process, including controlled, break bound anomaly (named as type 1 anomaly), chain anomaly (named as type 2 anomaly) and trend anomaly (name as type 3 anomaly), as shown in Fig.2.
Fig.2 Schematic diagram of process control chart
Inspection Data Series
Although multifarious measures of regional coal and gas outburst prevention process are different in detail, they have the same data structure as time goes by, which can be classified into two types, namely construction parameters and gas elimination parameters. The former is composed of the designing and constructing records of roadway, working face, borehole field, boreholes and spatial relations among them. The latter is to keep track of the gas elimination quantity, including gas drainage quantity of sealed pipes with negative pressure and gas windblown quantity of return-air roadways (Hou et al, 2013), as shown in Fig.3.

2nd Annual International Interdisciplinary Conference, AIIC 2014, 8-12 July, Azores, Portugal Proceedings, Vol.3
343
Fig.3 Data structure of regional coal gas outburst prevention process
Now construction parameters are often recorded in Excel or drawn in CAD manually, but gas elimination parameters can be directly exported from the gas monitoring system that has been installed in most Chinese collieries.
In view of construction parameters, our target is to keep consistent between designing and construction. Taking boreholes as an example, the designing parameters are defined as the following vector:
( , , , , , , , )B id x y z lα β φ=
(2) where B
is the designing vector; id is the identifier of borehole; x, y and z are the coordinate
of drilling position, /m; α is the azimuth angle of borehole, /°; β is the inclination angle of the borehole, /°; l is the borehole length, /m; ф is the cross-section diameter of the borehole, /mm.
In correspondence with (2), construction parameters can be defined as the vector: ( , , , , , , , , )B id x y z l tα β φ′ ′ ′ ′ ′ ′ ′ ′=
(3)
where B′
is the construction vector; t is the construction time and the rest elements have the same means as its design.
To describe the construction deviation from its design, we do difference transformation between B
and B′
, retaining element t, shown as the following vector:
( , , , , , , , , )B B B id x y z l tα β φ′∆ = − = ∆ ∆ ∆ ∆ ∆ ∆ ∆
(4) where B∆
is the deviation vector and t is the construction time.
Other construction parameters of coal roadways, rock roadways, working face, borehole fields and spatial relations can be expressed as the analogous vectors. In order to simplify the description, the other vectors were omitted in this paper.
Referring dataset explored from gas monitoring system, gas elimination parameters can be described as the following vector:
( )( )
, , ,
, , , ,d d d d
w w w w w
D q c k t
W s q c m t
=
=
(5)
where D
is the gas drainage vector, in which qd records the mixed gas drainage flow, /m3/s; cd records the gas concentration of sealed pipes , /%; kd records the instantaneous temperature, /degree; td records the testing time of gas drainage; W
is the gas windblown vector, in which
sw records the cross-sectional acreage of return-air roadway, /m2; qw records the mixed gas windblown flow, /m3/s; cw records the gas concentration of return-air roadway, /%; mw is the daily coal production of related working face, /ton; tw is the testing time of gas windblown.

2nd Annual International Interdisciplinary Conference, AIIC 2014, 8-12 July, Azores, Portugal Proceedings, Vol.3
344
Therefore, B∆
, D
, W
and those omitted vectors consist the inspection data series of coal and gas outburst prevention process. Data Tracking and Anomaly Identification
Hexi colliery, located in Liulin city, Shanxi province of China, has been authenticated continuously as the high gas mine in last five years. According to coal and gas outburst prevention regulations (SAWS, 2009) and gas drainage provisional regulations for collieries (SAWS, 2011), rational measures must be taken.
The NO.3312 working face is selected as the experimental area of this paper because related boreholes construction and gas drainage projects are under way now and their sample data are representative. This working face is to mine the NO.3 coal seam with gas outburst danger, which average thickness is 1.75m and average inclination is 6 degrees. It has been measured that the gas content is high, 8.42m3/t. Since Jan. 2013, hundreds of boreholes along coal seam has been constructed, sealed and connected into the global gas drainage system with negative pressure. Part of inspection data series { }B∆
were given in Table.1.
Table.1 Inspection sample data of coal and gas outburst prevention process id △x/m △y/m △z/m △α/° △β/° △l/m △ф/mm t
63# 0.00 0.00 0.00 -0.09 -0.21 1.37 0.00 2013/5/11 64# 0.00 0.00 0.00 0.54 -0.10 0.93 0.00 2013/5/11 65# 0.00 0.00 0.00 0.85 -0.20 2.13 0.00 2013/5/12 66# 0.00 0.00 0.00 1.47 -0.85 1.84 0.00 2013/5/12 67# 0.00 0.00 0.00 1.55 -0.24 1.44 0.00 2013/5/12 68# 0.00 0.00 0.00 2.07 -0.35 0.25 0.00 2013/5/13 69# 0.00 0.00 0.00 1.15 -1.52 1.34 0.00 2013/5/15 70# 0.00 0.00 0.00 1.11 -1.73 3.06 0.00 2013/5/16 71# 0.00 0.00 0.00 0.83 -1.01 1.74 0.00 2013/5/17 72# 0.00 0.00 0.00 0.82 -1.32 3.31 0.00 2013/5/17 73# 0.00 0.00 0.00 0.69 1.58 2.97 0.00 2013/5/18 74# 0.00 0.00 0.00 0.68 0.64 0.22 0.00 2013/5/18 75# 0.00 0.00 0.00 0.62 -0.28 0.49 0.00 2013/5/19 76# 0.00 0.00 0.00 0.52 2.98 0.98 0.00 2013/5/20 77# 0.00 0.00 0.00 0.47 -1.33 1.80 0.00 2013/5/20 78# 0.00 0.00 0.00 0.33 -0.62 2.70 0.00 2013/5/20 79# 0.00 0.00 0.00 1.34 -1.32 3.82 0.00 2013/5/21 80# 0.00 0.00 0.00 -0.29 1.33 4.97 0.00 2013/5/22 81# 0.00 0.00 0.00 3.60 0.28 0.39 0.00 2013/5/23 82# 0.00 0.00 0.00 0.55 1.08 -0.34 0.00 2013/5/24 83# 0.00 0.00 0.00 -0.97 0.48 4.71 0.00 2013/5/24 84# 0.00 0.00 0.00 0.90 -0.89 -0.26 0.00 2013/5/25 85# 0.00 0.00 0.00 0.43 2.24 4.80 0.00 2013/5/25 86# 0.00 0.00 0.00 -0.81 -1.76 3.87 0.00 2013/5/26 87# 0.00 0.00 0.00 0.28 -1.00 5.29 0.00 2013/5/27 88# 0.00 0.00 0.00 1.90 2.21 2.40 0.00 2013/5/28 89# 0.00 0.00 0.00 0.82 1.33 -2.82 0.00 2013/5/28 90# 0.00 0.00 0.00 -0.41 -5.98 -3.10 0.00 2013/5/29 91# 0.00 0.00 0.00 -0.16 0.73 3.73 0.00 2013/5/30 92# 0.00 0.00 0.00 -1.42 -1.11 -0.02 0.00 2013/5/30 93# 0.00 0.00 0.00 0.08 2.45 2.82 0.00 2013/5/31 94# 0.00 0.00 0.00 -1.23 3.01 5.82 0.00 2013/6/1 95# 0.00 0.00 0.00 1.05 -0.78 2.46 0.00 2013/6/1 96# 0.00 0.00 0.00 0.47 1.68 0.88 0.00 2013/6/2 97# 0.00 0.00 0.00 -1.81 1.38 -0.64 0.00 2013/6/3
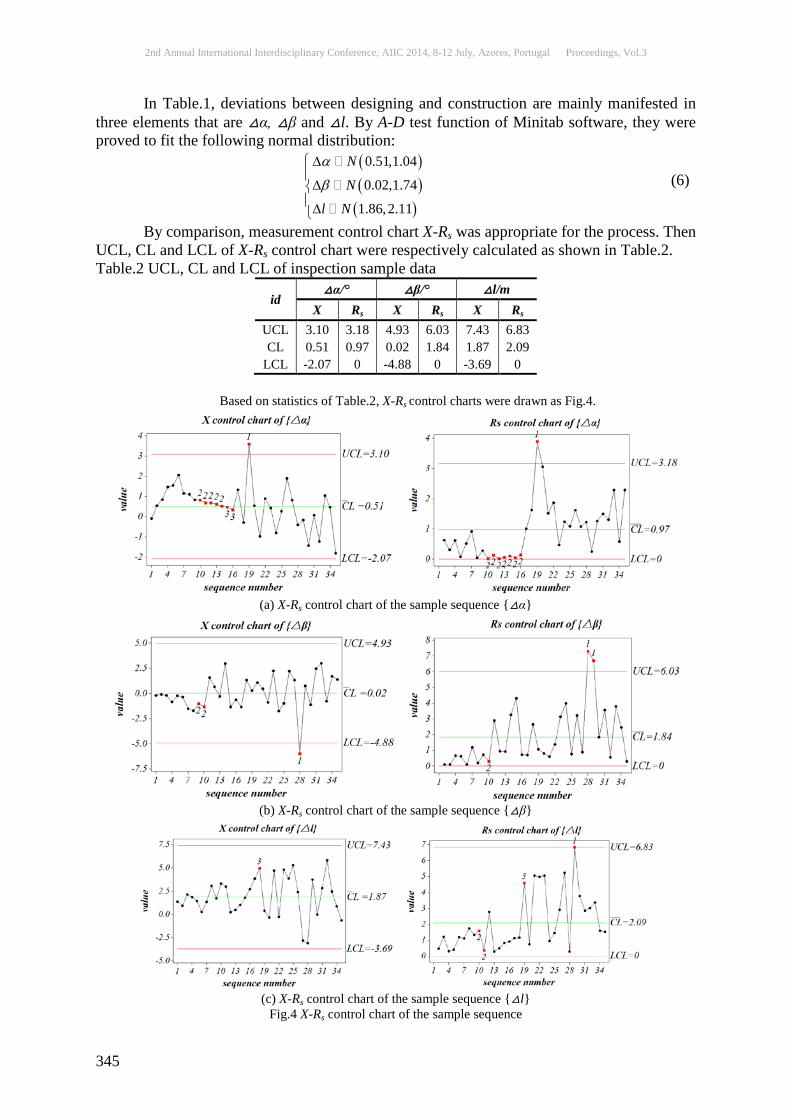
2nd Annual International Interdisciplinary Conference, AIIC 2014, 8-12 July, Azores, Portugal Proceedings, Vol.3
345
In Table.1, deviations between designing and construction are mainly manifested in three elements that are △α, △β and △l. By A-D test function of Minitab software, they were proved to fit the following normal distribution:
( )( )
( )
0.51,1.04
0.02,1.74
1.86,2.11
N
N
l N
α
β
∆
∆∆
(6)
By comparison, measurement control chart X-Rs was appropriate for the process. Then UCL, CL and LCL of X-Rs control chart were respectively calculated as shown in Table.2. Table.2 UCL, CL and LCL of inspection sample data
id △α/° △β/° △l/m
X Rs X Rs X Rs UCL 3.10 3.18 4.93 6.03 7.43 6.83 CL 0.51 0.97 0.02 1.84 1.87 2.09
LCL -2.07 0 -4.88 0 -3.69 0
Based on statistics of Table.2, X-Rs control charts were drawn as Fig.4.
(a) X-Rs control chart of the sample sequence {△α}
(b) X-Rs control chart of the sample sequence {△β}
(c) X-Rs control chart of the sample sequence {△l}
Fig.4 X-Rs control chart of the sample sequence
2nd Annual International Interdisciplinary Conference, AIIC 2014, 8-12 July, Azores, Portugal Proceedings, Vol.3
346
In Fig.4, red points mean anomalies. The NO.19 point of (a), the NO.28-29 points of (b) and the NO.29 point of (c) locate outside of UCL and LCL, and then warn break bound anomaly (type 1 anomaly). The NO.1-16 points of (a), the NO.1-10 points of (b) and the NO.1-10 points of (c) continuously locate in upside or downside of their CL, which forms chain anomaly (type 2 anomaly). The NO.6-16 points of (a) and the NO.12-19 points of (c) increasing monotonously means trend anomaly (type 3 anomaly).
When process status is in control, curve fluctuation should be random and slight around CL and between UCL and LCL. When three types of anomalies emerge, the process is beyond control. In view of above X control charts, break bound anomalies mean serious construction deviations from design, chain anomalies mean continuous construction deviations in the same direction from design, and trend anomalies indicate continuously increasing construction deviations in the same direction from design. In above Rs control charts break bound anomalies mean quick construction deviations from design, chain anomalies mean continuous too big or too small construction amplitude deviations in the same direction from design, and trend anomalies indicate continuously increasing construction deviation amplitude in the same direction from design.
Further on, we append those omitted inspection parameters into our research and track the process of coal and gas outburst prevention. An integrated and accurately quantized process control method, consisted of a series of control charts, was achieved. Conclusion
By integrating statistical process control theory into study field of coal and gas outburst prevention, the following work was finished:
1) Inspection data series of coal and gas outburst prevention process. Based on two typical and wide-recognized techniques of coal and gas outburst prevention, process inspection data was classified into two categories, construction parameters and gas elimination parameters, and then was designed as a number of vectors.
2) Control charts. Based on the 3σ principle of statistical process control theory, statistical distribution and related statistics of the sample data were analyzed and then a series of X-Rs control charts was drawn for the studied process, which consists of elements such as data curves, UCL, CL and LCL and reflects process running statuses quantitatively.
3) Anomaly identification. In control charts, three types of anomalies, including break bound anomaly, chain anomaly and trend anomaly indicate different process running statuses. By tracking characteristics of control charts, every anomaly could be identified timely.
Acknowledgement
The financial support by National Natural Sciences Foundation of China (Grant NO.51104052), and University Science and Technology Research Projects of Hebei Province (Grant NO.Y2012038) are deeply appreciated.
References: D.C. Montgomery. Statistical quality control: a modern introduction (6th ed.). John Wiley & Sons, 2008. D.D. Song, Z.H. Ren, Y.X. Gu. Design and implement of an intelligent coal mine monitoring System. 8th International Conference on Electronic Measurement & Instruments, Aug. 16-18, 2007, Xian, China. H.F. Wang, Y.P. Cheng, S.J. Hou, et al. Application of continuously pressure-relieving technology on long-distance upper protected seam of inclined coal seams. Journal of Mining & Safety Engineering, 2010, 27(2):210-214.

2nd Annual International Interdisciplinary Conference, AIIC 2014, 8-12 July, Azores, Portugal Proceedings, Vol.3
347
I.B. Shirokov, N.V. Koval, E.V. Koval. Microwave control system of state change of gaseous atmosphere in mines. 20th International Crimean Conference Microwave and Telecommunication Technology, Sep. 13, 2010, 1081-1082. J.H. Fu. Recent situation analysis of Chinese coal and gas disasters: theoretical study and engineering practice of coal and gas prevention and control. Xuzhou: China University of Mining and Technology Press, 2005. J.T. Guo. Monitoring and supervision system underground coal mine, Coal Technology, 2009, 28(6):97-99 J.Y. Jiang, Y.P. Cheng, H.F. Wang, et al. Effect of igneous intrusion on adsorption characteristics of coal to gas, 2012, 29(1): 118-123. L.J. Ma. Study on gas abnormal emission dynamic response mechanism and disaster control technology. Master’s Thesis of China Coal Research Institute, 2009.3. L. Liu, F.B. Zhou. A comprehensive hazard evaluation system for spontaneous combustion of coal in underground mining. International Journal of Coal Geology, 2010, 82: 27-36. Ms. Warsha, M. Choudhari. An intelligent coal mine security system using multi-view method. International Journal of Advanced Engineering Sciences and Technologies, 2011, 3(1): 15-19. P.W. Shi. Developing scientific monitoring system for prohibiting disastrous accidents in mine. Journal of China Coal Society, 2002, 27(3): 225-228. R. Balusu, P. Humphries, H. Guo, et al. Mine gas control technologies and practices in Australia. 2007 International Symposium on Coal Gas Control Technology, October 25-28, 2007, Huainan, Anhui, China, 106-120. S.J. Hou, Y.W. Zhang, Y.P. Cheng. A computer aided design and simulation system for upward cross-seam boreholes. Journal of Applied Sciences, 2013, 13: 2538-2543. DOI: 10.3923/JAS.2013.2538.2543. S.J. Hou, Y.W. Zhang. A novel algorithm for the coverage homogeneity analysis of along-seam boreholes in the coal gas drainage project. Energy Education Science and Technology Part A: Energy Science and Research, 2013, 31(3): 1803-1812. S.J. Hou, J.Y. Liu, Y.W. Zhang. Development of boreholes construction deviation tracking software system: BCDTracking. Information Technology Journal, 2013, 12(19): 4918-4924, doi: 10.3923/itj.2013.4918.4924. State Administration of Work Safety (SAWS). Coal and gas outburst prevention regulations, 2009. Available from: http://www.chinacourt.org/law/ detail/2009/05/id/136150.shtml. [Accessed May 10, 2014] State Administration of Work Safety. NO.(2011)163 instruction, Gas extraction provisional regulations for coal mine. Beijing: China coal industry publishing house; 2011. Y.P. Cheng, J.H. Fu, Q.X. Yu. Development of gas extraction technology in coal mines of China. Journal of Mining & Safety Engineering, 2009(26): 127-139. Y.P. Cheng, Q.X Yu. Development of regional gas control technology for Chinese coal mines. Journal of Mining & Safety Engineering, 2007, 24(4): 383-390.
2nd Annual International Interdisciplinary Conference, AIIC 2014, 8-12 July, Azores, Portugal Proceedings, Vol.3
348
TOPOLOGICAL INFLUENCE FROM DISTANT FIELDS ON TWO-DIMENSIONAL QUANTUM SYSTEMS
Konstantinos Moulopoulos, PhD University of Cyprus, Cyprus
Abstract A quantum system that lies nearby a magnetic or time-varying electric field region, and that is under periodic boundary conditions parallel to the interface, is shown to exhibit a hidden Aharonov-Bohm effect (magnetic or electric), caused by fluxes that are not enclosed by, but are merely neighboring to our system – its origin being the absence of magnetic monopoles in 3D space (with corresponding spacetime generalizations). Novel possibilities then arise, where a field-free system can be dramatically affected by manipulating fields in an adjacent or even distant land, provided that these nearby fluxes are not quantized (i.e. they are fractional or irrational parts of the flux quantum). Topological effects (such as Quantum Hall types of behaviors) can therefore be induced from outside our system (that is always field-free and can even reside in simply-connected space). Potential novel applications are outlined, and exotic consequences in solid state physics are pointed out (i.e. the violation of Bloch theorem in a field-free quantum periodic system), while formal analogies with certain high energy physics phenomena and with some rather unexplored areas in mechanics and thermodynamics are noted.
Keywords: Aharonov-Bohm, Gauge Transformations, Dirac monopoles, Quantum Hall Effect, Laughlin argument Introduction The well-known Aharonov-Bohm (AB) effect[1] occurs in systems with multiply-connected topology: the system under consideration always has to surround an enclosed and inaccessible (magnetic or spacetime-electric) flux. We here show (by providing specific physical examples) that it is possible for planar systems, with an apparently simply-connected topology, to exhibit a similar dynamic effect, but caused by nearby (rather than enclosed) or even distant (and inaccessible) fields (and corresponding fluxes), something with potential revolutionary applications – the behavior of the system not being determined by local physical laws, but mainly by nonlocal influences of fields imposed on a neighboring land. The above has a deep gauge character, as will be shown in this paper, and it has apparently been overlooked in numerous works on extended solid state systems with inhomogeneous magnetic fields (with either conventional (parabolic) or Dirac energy dispersions), possibly because it is plagued with a gauge ambiguity. The origin of this annoying feature (the ambiguity) is here explored in detail, and it is given a full mathematical and physical explanation. It is also suggested how it can be theoretically removed (by enforcing its elimination and studying its consequences), its removal leading to macroscopic quantizations and to certain well-known properties of a topological origin (Dirac quantized magnetic monopoles, integer quantum Hall effect, quantized magnetoelectric phenomena in topological insulator surfaces). The focus of this paper is, however, the demonstration that there may occur experimental conditions (clarified here) when the transformations leading to this gauge-proximity effect or remote influence of fields do not really suffer from any
2nd Annual International Interdisciplinary Conference, AIIC 2014, 8-12 July, Azores, Portugal Proceedings, Vol.3
349
ambiguity; this is due to real change in physics of a companion system in higher dimensionality that transfers momenta to our lower-dimensionality system, as will be shown with a singular gauge transformation argument (that will be different from the standard singular gauge transformation underlying the usual AB effect). Under such conditions, these proximity or remote effects are then real (experimentally realizable) and lead to the remarkable possibility of inducing topological phenomena from outside our system (which is always without fields and can even reside in simply-connected space). Specific procedures are then proposed to experimentally detect such types of nonlocal dynamical effects and exploit them for novel applications, while general consequences in solid state physics are pointed out (such as the first example of a planar field-free quantum periodic system that actually violates Bloch's theorem, this happening due to the hidden AB effect (i.e. the presence of an extra gauge field on our system that violates the standard Bloch theory) caused by the 3D companion). We also mention in passing some formal connections to certain high energy physics phenomena (θ-vacua, and some types of Gribov ambiguities), and similarities to some other, rather unexplored, areas that have attracted recent interest. A bit of Zooming on the results: The deep reason behind the above effects is shown to be the well-known absence of magnetic monopoles[2] in higher dimensionality (3D) and corresponding generalizations in Minkowski space (whenever time-dependent fluxes are involved). These effects are here rigorously shown to exist and to affect numerous results in the literature (mostly on extended solid state systems with piecewise-continuous fields) if quantum coherence parallel to the interfaces is taken into account (through the standard imposition of periodic boundary conditions, as usually done in solid state physics). The already noted gauge ambiguity in the plane is actually due to the richer physics of the companion system in 3D that reduces to our 2D system in an appropriate limit. Under such a limiting procedure (and under certain experimental conditions) there are cases, as already mentioned, when such ambiguity is not present an apparently innocent gauge transformation in the plane (that is responsible for the gauge ambiguity) actually corresponds to real change in physics, due to nonequivalent displacements of the 3D companion relative to our 2D system (but with all of these displacements producing the same result on our lower-dimensionality system in the proper limit). This is shown to be a singular gauge transformation in 3D, namely one with a multiply-valued gauge function (but, as noted, different from the standard AB one), and it involves the above noted physical momentum transfers to our remote lower-dimensionality system, with all the physical consequences of a genuine nonlocal effect. Such type of gauge-nonlocal influence can then have important applications to extended systems that reside nearby time-dependent electric fields, or even nearby adiabatically varying magnetic fields (varying in their intensity or in their placement and adiabatic movement in 3D space), with fractional or irrational fluxes. This leads to the possibility of manufacture of interesting quantum devices that exploit the above proximity effects (i.e. a distant influence of spacetime electric fluxes) in order to induce topological phenomena from outside the system the simplest example being an electric flux-driven charge pumping in a modification of the well-known Laughlin's gauge argument[3] that is usually invoked for the explanation of the Integer Quantum Hall Effect (IQHE). By analyzing the 3D companion system we show that the above proximity effects are not only real (i.e. they can be realized experimentally), but they can also serve as an easier experimental detection of AB effects (in a simply-connected system and without enclosed fluxes (hence with lesser magnetic leakage problems)), and they can also lead to already mentioned exotic possibilities. We propose specific ways through which an experimentalist can measure effects related to the above, hinting at expected behaviors not only in a conventional 2D solid state system (i.e. with parabolic energy spectrum), but also in graphene and topological insulator surfaces (examples of quantum systems with linear low-energy spectrum).

2nd Annual International Interdisciplinary Conference, AIIC 2014, 8-12 July, Azores, Portugal Proceedings, Vol.3
350
However, in a strict planar world, with complete lack of information on the 3D companion, the above mentioned ambiguity may indeed show up (actually reflecting our ignorance of the properties of the higher dimensional companion system). This ambiguity can then be theoretically removed when certain adjacent fluxes are forced to be properly quantized; this immediately suggests a natural way to eliminate the artificial effect for confined systems, and we propose this (enforcement of elimination of the ambiguity, through quantization of nearby fluxes) as a criterion of proper behavior. Although this is not the main focus of the present paper, we argue that this has direct applicability even to cases when (effective) magnetic monopoles are present; the same criterion then directly leads to the quantization of certain macroscopic quantities, and this in turn leads to topological quantization of charge and response functions in a wide range of systems of current interest without further gauge considerations. Examples include the already noted Dirac quantization of magnetic monopoles[2], and – by additionally invoking axion electrodynamics[4] – the integral quantization of Hall conductance in conventional 2D Quantum Hall systems, and also the half-quantization of the recently proposed quantized magnetoelectric phenomena in surface-gapped 3D time-reversal-symmetric topological insulators (basically reflecting the Witten effect[5]). Finally, connections are noted with certain high-energy physics phenomena that seem to have a formal similarity (the already noted θ-vacuum sectors, and some types of Gribov ambiguities), as well as with certain areas in mechanics and in thermodynamics that are still underexplored. It may also be of interest to solid state physics that a mapping is also possible to general spin-related phenomena, through boosts to properly moving frames, providing the possibility of studying nontrivial spin-physics by starting from purely orbital considerations – although a serious look at spin-related phenomena (including spin-orbit interactions) in this new framework is reserved for a future note. The simplest (static and magnetic) example Consider a flat rectangle (strip) of horizontal length in the ( )-plane with periodic boundary conditions along (in the -direction), that consists of two adjacent (up and down in the -direction) parts, again strips of length , the one on top being empty of fields or scalar potentials (the white area) and the one at the bottom penetrated by a perpendicular magnetic field (the dark area). Let us start with a static and uniform , and let us first consider a nonrelativistic quantum particle (of mass and charge ) that moves only inside the upper white area; i.e. we make sure that the two areas are separated by an appropriately infinite scalar potential wall, so that the lower dark (magnetic) area is totally inaccessible to the particle. Let us then set the origin at the bottom of the dark area (i.e. take at the bottom left corner of the dark (magnetic) strip), the separating wall being at , and the top of the white area being at (which, for simplicity, we also consider to be impenetrable). The particle is therefore confined in the -direction by the walls at and , with periodic boundary conditions (pbc) in the -direction, and feels no magnetic field the field being only in the adjacent dark forbidden area, that lies below the particle's white strip. The usual procedure to solve this rather trivial problem, especially for the case, would be to work in the gauge everywhere inside the white region: eigenfunctions are then of the form
(with and , and with being quantized as ( )), with the associated energies being

2nd Annual International Interdisciplinary Conference, AIIC 2014, 8-12 July, Azores, Portugal Proceedings, Vol.3
351
therefore

2nd Annual International Interdisciplinary Conference, AIIC 2014, 8-12 July, Azores, Portugal Proceedings, Vol.3
352
Indeed, by folding in the -direction in order to form a cylinder (by gluing the opposite vertical sides), the above gauge, now written in cylindrical coordinates, has only azimuthal component, and it is in the dark and in the white area, with always denoting the magnitude of the locally perpendicular field (at every point of the now dark folded strip) that has now become the radial component of a larger magnetic field in 3D space. It is crucial then to note that this gauge choice leads in 3D to the additional appearance of a nonzero (component of this larger field parallel to the cylinder's -axis) that is inhomogeneous (generally - and -dependent). Indeed, straightforward calculation of the total field produced by the above form of (see next
Section) leads to in the dark area, and in the white area. This inhomogeneous in all 3D space is exactly what is needed to give a flux (of this ) through the top (say at height ) and the bottom (say at height ) of any cylinder (of height ) that overall cancels out the radial flux (of ) that goes through its curved cylindrical side-surface (with this partly being and partly zero in the corresponding dark and white regions that now lie folded on the surface). And the flux of through the top is also identical to the value of a horizontal closed integral of the corresponding at height this way directly demonstrating that we now have the standard AB effect operating (since the -flux is now enclosed by the particle's region). What we see here is simply the well-known fact that the total flux passing through the entire closed cylindrical surface is indeed zero (as demanded by the volume integral of inside the whole cylinder). Hence, in the case of being in the white region, and (so that the flux-contribution from the bottom at is vanishing), the proximity field influence at height inside the white area is a hidden (or indirect) AB effect, due to the enclosed flux of
that is automatically created, which in turn is equal (up to a sign) to the dark flux, i.e. the flux of the radial through the entire dark folded strip, due to the above cancellation. This way the dark strip affects indirectly the adjacent white region (through the companion system in 3D, i.e. through the automatic formation of the appropriate 3D magnetic field that must satisfy all the above (and everything that follows, see next Section)).
Flux cancellations and physical explanation Let us first briefly confirm the above mathematical results and then provide a physical
understanding. Recall that

2nd Annual International Interdisciplinary Conference, AIIC 2014, 8-12 July, Azores, Portugal Proceedings, Vol.3
353
then consists of either (a) just a lower part of the dark strip or (b) the entire folded dark strip, together with a lower part of the white folded area. Then indeed, the flux of through the ceiling is if is inside the dark area, or (hence a constant) if lies inside the white area; and we see that, in either case, it indeed cancels out the radial -flux (which is in the dark area and the constant in the white area, either of which can also be determined by use of the proper as given above). And the flux of through the top is also identical to the value of a closed integral of the corresponding around the cylinder (which is or ) as expected, this way clearly demonstrating that the above cancellation is actually due to the standard AB effect (due to the -flux that is enclosed by the particle's region). After this mathematical confirmation, and in an attempt to provide a better physical understanding and also seek an experimental realization, let us momentarily turn to a slightly different gauge, namely in the dark area (a gauge discussed earlier[8], together with an actual realistic current distribution that produces it) and
in the white area (all this being compatible with our own gauge for the radius of the cylinder). This gauge, produced by a , can be shown to
lead to similar cancellations and a similar conclusion of influence of remote fields as with our initial choice. But, more importantly, in both gauges, the value of changes with the location of origin; i.e. in our first choice of gauge, a direct calculation as above (but with
shifted origin) now gives for in the dark area, and for in the white area, and the presence of the arbitrary constant in the results can be seen as the actual source of the gauge ambiguity noted earlier. It has to do with a different flux balance (in the overall cancellation) between the top, the bottom, and the side-surface of any considered cylinder, and this will generally give an origin-dependent flux through the top hence leading to a -dependent AB influence at height , and therefore a -dependent proximity influence in the initial flat system. Note that, in both 1st and 2nd choice of gauge, the point is always the point (height) where (or ) vanishes (see also ref.[9], fig.3, for a related (but simpler) system, where a similar , with a vanishing point, also shows up)
these observations being important for our later discussion (Section V) on a relevant experimental setup. In spite of the above peculiarity however (namely, the extra appearance in higher dimensionality of a that actually has a vanishing point with a completely arbitrary location), the crucial property to note is that, when the plane is flat (i.e. in the limit ), the above always goes to zero on the surface (for any finite ), because of its - dependence (whereas for the 2nd gauge it is exactly zero on the cylinder surface because of a delta function centered on the axis). Although is zero in the planar system, we see, however, that the memory of a finite enclosed flux in infinite 3D space remains, and it is this that actually causes the proximity field influence in the planar case. It is as if the cylinder axis has moved to infinity in such a way that through the infinite space gives the same flux as for the folded system, namely , but in such a way that their product is either
(dark area) or (white area), which, in fact, are the correct values of for our planar system, but now derived by a limiting procedure. It is also interesting to emphasize

2nd Annual International Interdisciplinary Conference, AIIC 2014, 8-12 July, Azores, Portugal Proceedings, Vol.3
354
that the nonlocal terms appearing in the gauge functions of the theory of refs [6,7] for 2D static magnetic cases confirm (or, better, contain) this type of proximity influence directly in flat 2D space, without the need of any folding (or unfolding) or other limiting considerations
a point of importance that we are planning to get back to in the near future. Regarding a possible connection of the above -ambiguity to real physics, note that, mathematically, a gauge transformation in the planar problem (upon displacement of the origin ) is an ordinary gauge transformation (the gauge function is (with
being the change of flux that corresponds to a change of vector potential , a quantity that will appear below to be involved in a momentum transfer) and is indeed a smooth single-valued function everywhere on the plane); when however we fold into a cylinder, the corresponding turns out to be , that is basically identical to the above planar , but is now multiply-valued (it has the usual discontinuity with respect to the azimuthal variable appearing in all magnetic AB types of phenomena in a cylindrically symmetric configuration). Hence in 3D the change of origin is not an ordinary gauge transformation but a singular one, and it is expected to reflect real physics (or, more accurately, a real change in physics between behaviors before and after the transformation, to be clarified below). The situation is similar to the standard AB effect (that introduces real difference in physics, compared to a particle free of potentials) but not identical here the effect is defined by the surface radial in the dark region (and by the choice in a more general gauge, see below) and there is no additional arbitrary flux allowed to pass through the empty space the one that appears in our problem (the flux of ) having shown up automatically due to the absence of magnetic monopoles in other words, and now mathematically speaking, in an otherwise legitimate choice of gauge etc., we have always used , hence not allowing the usual AB effect (i.e. not allowing an extra arbitrary magnetic flux that one could always add inside the cylinder without affecting the fields on the surface the point being that the effect we present here appears by itself due to the surface radial -field, and it is not caused by additional and arbitrary flux-insertions). Furthermore, and now physically speaking, the -freedom has to do with the different (infinite in number) arrangements of the total magnetic field (in 3D space) that all produce the same 2D values of fields on the side surface (namely the same radial field component, either zero or in the corresponding strips) and therefore produce the same physical field-arrangement of our initial planar system. Indeed, note that the formal appearance of in , actually reduces the above mentioned ambiguity to an ambiguity with respect to displacements of the point where vanishes. And note that there is a great arbitrariness in placing the point of vanishing somewhere in 3D space, although the 2D system does not know of all this freedom -- it only senses the radial field, which is always (for any of these -constructions) the same in our case it is in the dark area and zero in the white. And then, any such change of location of the vanishing point
involves relative displacements of the total -field in 3D space (relative to the cylinder), and this must be the source of momentum transfer to the particle on the surface. Indeed, such momentum transfer (integrated over infinite time) turns out to be equal to (as can be shown by following lines of reasoning similar to those of ref.[10]) and gives an explanation for the physical origin of the extra phases (of AB type) picked up by the particle's wavefunctions upon change of . Summarizing, the crucial element is that our original

2nd Annual International Interdisciplinary Conference, AIIC 2014, 8-12 July, Azores, Portugal Proceedings, Vol.3
355
planar system, with the pbc, is an effectively compact system (and can always be viewed as the limit of a compact cylinder), and due to the compactification, the gauge transformations are not so innocent (they are actually singular, and hide real physics), the nontrivial effects having as origin the above noted displacement of the -field in 3D space and the associated momentum transfers to our surface-particle. [Note also that, although in the planar system vanishes everywhere, the special point (or now ) has already been identified (as the unique point of local vanishing of in the 3D companion system) before taking the limit something that will be of relevance to the experimental discussion later in Section V.] Effects of the above type are actually implicit in carbon nanotubes[11] (with metallic nanotubes subject to the above pbc), and also have immediate applicability to planar graphene (with no curvature)[12], although the above ambiguity has not to our knowledge been discussed (or exploited) see however later below (Section VI) for our own suggestions on what to expect in such proximity measurements in graphene and topological insulator surfaces. Consequenses on other works and Generalization Let us first briefly point out some consequences of the above effects on previous works, and discuss certain important generalizations, together with issues of experimental relevance (on how i.e. these proximity influences could be detected in the laboratory). (A) The above types of effects seem to also appear in connection with the concept of effective scalar potential that has been extensively used in previous works (both on conventional systems[13,14] and on Dirac materials[15,16]) and in cases that the field is accessible to the particle (although this is not the focus of the present work the case of forbidden fields making our proximity effect more striking (or physically unexpected)). Indeed, the above noted gauge ambiguity shows up as a gauge-dependence of the effective scalar potential (that seems to have also escaped notice), and it seems to affect even the qualitative form of this potential in the white area (see i.e. fig. 1(b) of the first of ref.[13]) this form depending on the combination of and the sign of (see below) bringing about important changes in measurable quantities in either conventional or Dirac systems. All examples in the literature consist of systems with magnetic strips or barriers that have been discussed (for accessible fields) by matching methods. For parabolic energies the effective
potential turns out to be , and in the white area is a constant , whose value is -dependent, and it is matched with the form of as this comes
from inside the field at the interface; inside the field we have with , and it is clear that if is not an integral multiple of , then we have nontrivial consequences on the form of the potential (and therefore of the wavefunctions) outside the magnetic region (whereas if , with integer, then is quantized and there is no new effect). In the case of Dirac materials, by using the Dirac Hamiltonian (with the kinematic momentum) and with ansatz
(with denoting the components of a spinor) it turns out that for the white area we have to solve a system of Schrödinger-like equations, namely
2nd Annual International Interdisciplinary Conference, AIIC 2014, 8-12 July, Azores, Portugal Proceedings, Vol.3
356
again not equivalent to the case of flux-absence. Once again, at the bottom of this is phase-physics (and the phase-mismatch around the cylinder when is not quantized). And if we follow this method of effective scalar potential for our original striped system with the magnetic region being again inaccessible, then it turns out (in a quite different manner from what we did in the beginning of this paper) that the energy spectrum in the white area is
identical to eq.(1), with which is , in agreement with our gauge transformation mapping technique. Hence the use of the effective scalar potential method and the solution based on matching conditions in a direction transverse to the interface seems to lead to the same results as those of a phase-mismatch analysis parallel to the interface. In a similar vein, systems such as a striped one discussed in Zygelman's recent work[18] are also expected to be affected if we impose periodic boundary conditions parallel to the strip whenever the flux of the strip is not quantized (and it is easier to see this if we take the strip to be a delta function). A detailed solution will be given elsewhere[17] with the direct use of the concept of pseudomomentum and its generalization to inhomogeneous fields (and how it is affected across the interface from inside to outside the field for piecewise-continuous cases). However, note again that the focus of the present work is not on fields sensed by the particles, but on inaccessible fields, because it is these cases that may make the effect of nearby fluxes appear more unexpected. (B) It is also important to note that the above folding procedure of our dark-and-white system actually generalizes Laughlin's gauge argument on a cylinder[3], where, however, the automatic appearance of the above (upon folding) is, to our knowledge, rarely (if ever) discussed. And the addition of our white strip on the surface of the usual Laughlin cylinder gives nontrivial consequences whenever the outside magnetic flux is not quantized (see below, on effective pumping and IQHE conditions induced from the outside). In the standard Laughlin's argument, with a radial being present everywhere on the cylinder's curved cylindrical surface, one can actually understand the well-known translational symmetry breaking[19] where the equilibrium positions of the standard
Landau wavefunctions ( in planar language, with the magnetic length) become priviledged[19] by the special consideration of this additional created due to folding as we saw, the AB flux enclosed by a horizontal circle (lying on the cylindrical surface) around the axis depends on the height (due to the presence of the
), so that, if we want immediate wavefunction single-valuedness around the cylinder, we indeed need special 's so that the enclosed AB flux (at that height) is quantized (in integral multiples of ). It is straightforward to see that this requirement gives immediately the priviledged 's (or equivalently the above equilibrium positions 's for the standard flat Landau problem in the Landau gauge). But further than that, in our generalized system, with the area of interest (where the particle resides) being only a white strip on the cylindrical surface (with no field inside it), one finds that there are nontrivial consequences (due to remote field influence) on this white area, whenever the outside magnetic flux is not quantized. This we saw with inaccessible fields, but it seems to also occur for accessible ones as well, as we demonstrated above. In such case of non-quantized
outside our white area, the wavefunction single-valuedness (or pbc along ) in the white area is not automatically satisfied, and it is its enforcement that leads to a modification of physical properties, hence to the remote influence of the adjacent magnetic field that we
2nd Annual International Interdisciplinary Conference, AIIC 2014, 8-12 July, Azores, Portugal Proceedings, Vol.3
357
saw. A plausible question would then be: is there a remote (or proximity) influence of the IQHE type that might affect the particle, although this resides outside the field (hence, equivalently, a quantum Hall type of effect in zero-field)? There is a great deal that can be said on this i.e. in relation to magnetic edge states in the interface[20], snake states[21] etc. to be discussed in a more focused paper, the main conclusion for now being that we must have nontrivial dissipationless edge currents in the interface that, in any case, are expected, as the persistent currents associated with the hidden AB effect, being therefore proportional to
; but even without details, we will point out as certainly true that one can generate (or simulate) IQHE conditions on our system (always a white area, with no ) with a pulsed outside electric field rather than the static field case discussed in the beginning which, due to its time-dependence, can induce IQHE type of effects inside our field-free system (a case now involving remote electric fluxes in spacetime). An even simpler way is our original example of a magnetic field in the dark area, which however is not static but slowly (adiabatically) changing with time, or, alternatively, a fixed while our origin is being displaced slowly (and transversely to the interface) between two values that correspond to a change of flux in the dark area equal to (this would then define a cycle). This way one can achieve charge pumping (with slow variation of or of or proper combination of both) as in the case of Laughlin's cylinder[3], replacing the much harder to build externally applied varying enclosed AB flux. After a cycle, there must be an integer number of electrons transported from one side of the system to the other (along the -direction), a well-known topological quantum effect (the so-called adiabatic particle transport) due to Thouless[22]. Or one can use other more sophisticated types of procedures based on nonlocal terms in refs [6,7] involving general -dependent electric fields and electric scalar potentials. Summarizing, it seems that, in a number of different ways, one can induce conditions of, at least, topological (quantized) pumping of some quantity, resulting from manipulations from outside of our system, and, in fact, in ways that are expected to respect relativistic causality, as shown in detail in refs [6,7]. (C) One should note that all the phenomena predicted here should be observable, independent of our (or any other) analysis of the -ambiguity. One can give an absolute meaning (for a particular cylindrical system in the laboratory): it is the point in the 3D folded system at which the -component of the total 3D magnetic field (or its source, the current density ) vanishes. We can therefore determine this point in our 3D setup (see i.e. in fig.3 of ref.[9] the point where the magnetic lines are curved in opposite directions), and then be careful to place our system of interest (i.e. a strip with no field, exhibitting quantum coherence parallel to the interface with the dark magnetic region) in a manner so that its basis (namely the interface itself) is displaced (by a small distance ) with respect to . Then, if this distance is such that the outside magnetic flux is not quantized, then the above effects (a proximity influence of this flux on our white strip) should be present and measurable. [If they are not ever found, then something is wrong with standard quantum theory and/or (classical) electromagnetism.] And, as shown earlier by a limiting procedure, these proximity influences must survive even after the system becomes flat. However, a question arises about cases when we start with a strictly flat system, with no knowledge of the location of the -vanishing point of a corresponding 3D companion. For such cases, we will argue that we have two options to consider for the 1st, see next Section (where it is shown that a possibility still remains to have a nonlocal proximity effect with no
2nd Annual International Interdisciplinary Conference, AIIC 2014, 8-12 July, Azores, Portugal Proceedings, Vol.3
358
ambiguity), and the 2nd is the case of actually having the -ambiguity, which is now physically unacceptable, and then our criterion of proper behavior (noted earlier) must be enforced. This enforcement of elimination of the ambiguity then seems to lead to (a) topological physics (manifested as quantization of certain quantities, such as magnetic charge and response functions), as well as to (b) connections and formal analogies with other physics areas. Indeed, (a) recall that, in all the above, essential use was made of the nonexistence of magnetic monopoles in 3D (the law). But what if we had assumed that magnetic monopoles exist? Our simplest finding on this is that imposition of our criterion of proper behavior (forced elimination of the -ambiguity) leads to quantization of fluxes external to the white system, so that, in the limit that our white system shrinks to zero, the nonlocal term of [6,7] can serve as a probe of quantization of the flux through the outside magnetic regions; and the enforced quantization of the nonlocal term leads, in turn, to the quantization of magnetic charge according to the Dirac condition[2], and more generally, to the quantization of other macroscopic quantities, that are related to quantized magnetoelectric effects in an axion electrodynamical consideration[4] (see further below, Section VII). In particular, our above criterion seems to nicely complement the recent proof of the -periodicity of the axionic action[23] by providing a justification of the quantizations of certain separate 2D fluxes (one in 2D space and one in 1+1-D spacetime) that are crucial in the proof, justification that is not given in ref.[23]. (b) Apart from the above, there are much wider implications (mainly physical), but also relationships with other physics areas that one can see formal analogies with (see below brief discussion on axions, -vacuum sectors[24,25], Gribov copies[26], but also connections with certain open problems in mechanics[27] and in thermodynamics[28]), that certainly necessitate further investigation of an interdisciplinary character. How to measure nonlocality in a strictly planar system First, for a cylindrical arrangement, we have seen that the special vanishing- point ( ) is unique and identifiable, and survives in the limit, so that the remote influences that are the focus of the present work must survive even after the system becomes flat; and although in the completely planar system vanishes everywhere, we have already identified the absolute reference point (or ) before the limit (as the unique point of vanishing that existed in the companion 3D system). Hence, by using this , we can achieve (or measure) all the types of proximity effects discussed above in the same way (namely, by placing our white area in a properly displaced manner with respect to this ). However, for strictly planar system, when we have no knowledge of the -vanishing point of a corresponding 3D companion, we argued earlier that we have two options to consider, and here we focus on the first If we have a large-width ( ) magnetic area, it is quite possible that, generically, this would behave as if it were produced by a corresponding long cylinder (in the usual theoretical limit ) with its special vanishing- point ( ) being in the middle of its finite length; this is for symmetry reasons and due to the fact that all expressions of the fields used here (and in fact in the entire literature) are actually exact only in the case of infinite cylinders -- the middle of a long cylinder being therefore slightly preferred (as being the point that is more distant from both cylinder-ends, and also because, due to its symmetrical placement, it is a better representative of the infinite-cylinder theory). If this turns out to be correct, then this suggests an obvious experimental way on how to place our white area: can be taken to be in the middle of the
2nd Annual International Interdisciplinary Conference, AIIC 2014, 8-12 July, Azores, Portugal Proceedings, Vol.3
359
width of the flat dark area, and then our white system must be placed as described earlier. In fact, a slightly better experimental suggestion would be to have two systems of interest (white areas, i.e. they could be identical graphene samples), separated by the above (inaccessible) wide magnetic region, and then make measurements (i.e. of persistent current) in one system or the other; the point is that, no matter where is located, at least one of the two systems must be affected by proximity (if i.e. it happens that is at the edge of one area, giving no effect on it, then the same is necessarily displaced with respect to the 2nd area; so proximity influence on the 2nd system is guaranteed, if the intermediate flux is not quantized, and we can measure nontrivial effects in this 2nd system and it is interesting to note that, if is indeed in the middle of the magnetic region, as we hoped earlier, then now, in the present setup, both systems will be affected equally). If all this does not work (meaning that there is no memory of a unique , a remnant of the theoretical limit), then the lack of knowledge of a 3D companion is indeed complete, or equivalently this gives rise to the earlier discussed ambiguity. In such case, as already noted, our criterion of proper behavior must be imposed, and the consequences of this are briefly discussed in Section VII. Predictions on Graphene and Topological Insulator An outline of the simplest possible types of measurements (related to the gauge proximity effect presented in this work) in conventional systems has been given earlier in this paper (mostly on induction of IQHE-type of effects and charge pumping, all induced from outside the system). It should be stressed, as a generic feature (and as a prediction) that, even if our white area is almost empty (i.e. a single electron in empty space), we would at least expect (persistent) currents along the edge (interface between white and dark areas) this being valid for real solid state systems with both parabolic and Dirac electronic spectrum in AB configurations[29]. This was also noted for our own proximity configuration above (with the expectation that will be proportional to ). But beyond this, we here also provide our more detailed predictions of what one would expect on general grounds, if our white system is one of the two most popular nowadays topological materials, graphene or a topological insulator Graphene: proximity arrangement with a , would offer a controllable way (through changes of the outside or of ) to lift the orbital degeneracy that originates from the two valleys, with consequences on persistent currents (in -direction) and in conductance (i.e. some shifting of peaks), analogous to the ones of ref.[30]. In addition, giant magnetoresistance at room temperature is possible, due to the hidden AB interference[31]. Topological insulators: By way of an example, in the proximity to an HgTe quantum well one would expect to measure helical edge states, bound states and persistent currents (with Rashba spin-orbit coupling), that would generally be affected in a manner similar to the one described in ref.[32]. On all this, we plan to return with details (and experimental suggestions on each material) in a future note. Removal of the ambiguity Although not the focus of the present paper, let us briefly mention the manner in which topological physics shows up upon the enforced removal of the ambiguity, and let us first consider cases where (effective) magnetic monopoles are present. Note that, already in the case of the Laughlin cylinder discussed earlier with the usual in the literature practice of not any mention of the extra that originates from folding of the original flat system it is seen that the radial in 3D space must be a result of a linear magnetic monopole
2nd Annual International Interdisciplinary Conference, AIIC 2014, 8-12 July, Azores, Portugal Proceedings, Vol.3
360
distribution (along the -axis) since a purely radial field violates the law (as there is a nonzero net flux outwards and, therefore, magnetic monopoles must be invoked to justify it). And starting with an additionally placed extra narrow ( ) white strip (with no field) that goes around the axis on the cylindrical surface, and imposing our criterion of proper behavior (forced elimination of the gauge ambiguity) in the limit one obtains the well-known quantization of the -flux in the dark area, and from this it comes out that the monopole charge must also be quantized (see ref.[33] for quantitative details on how the Dirac's quantization condition comes out). By formally enforcing the elimination of this gauge ambiguity in a closed system, the nonlocal term (namely, the flux lying outside our system) can play the role of a probe of (or a detector of) quantization of macroscopic quantities (although, it should be noted, we are merely at the level of wavefunction phases). A plausible question then is: can such a type of argumentation be followed for other more complicated cases? We answer positively by working out some considerably more sophisticated examples (with topologically nontrivial systems), which, as has been shown recently[34,35], seem to need axion electrodynamics to describe their exotic magnetoelectric response properties. The reader is again referred to [33] that shows in detail that imposition of our criterion of proper behavior leads to quantization of the axionic current density ,
which in turn leads, for conventional IQHE systems to an integral multiple of , and for topological insulator surfaces that are in contact with a topologically trivial medium
(i.e. the vacuum) to an odd integral multiple of ; the same method also leads to their quantized magnetoelectric responses, in accordance with the Witten effect[5] (see [33] for details). Formal analogies with other areas The wider physical implications, and/or relationships with other physics areas have also been examined in [33], where formal connections have been noted, among others, (i) with recent considerations of Berry and Shukla[27] on curl forces that are spatially confined in classical systems (while the point of observation is outside, in curl-free regions), (ii) with not yet well-studied issues of irreversibility and vorticity in thermodynamics[28], (iii) with extensions to spin-physics[36], and (iv) with certain quite esoteric issues in high energy physics, such as -vacuum sectors[24,25] being formally analogous to our --sectors, and the so-called Gribov problem (or Gribov ambiguity[26]); for such a claimed connection see in particular refs [37] and [38] where the existence of the Gribov phenomenon is related to the existence of inequivalent quantizations (which in our simpler problem corresponds to different -sectors), and then Gribov copies are labeled through procedures that are formally similar to ours. Discussion and Conclusion Even without the above generalizations, however, the simplest outcome of the present theoretical work that it is in principle possible to have effects without fields, in the simply-connected plane, that are generated outside our system and that affect its physical properties is remarkable, and if true, extremely important in experimental work on fundamental physics as well as in practical applications. First, the most obvious use is for an easier experimental detection of AB effects, as already noted (with considerably lesser problems of leakage of magnetic lines, compared to typical enclosed-flux arrangements). Then, the already noted possibility of violation of Bloch theorem (especially if our white (no-field) system is periodic along the interface direction) is worth emphasizing. The violation is
2nd Annual International Interdisciplinary Conference, AIIC 2014, 8-12 July, Azores, Portugal Proceedings, Vol.3
361
due to the presence (on the system) of the extra vector potential (from proximity with the outside -field), and it leads to AB-type of modifications of the translation operators that are used in the standard proof of the Bloch theorem. [It should be noted that these modifications are not the same as the well-known modifications of Bloch theorem in an IQHE system (such as the ones studied i.e. in [39]) with the particle being inside a field in our case we always have on the particle.] We therefore eventually expect nontrivial modifications in the form of wavefunctions; in such a case, one can first gauge away the proximity-induced , with the consequence of the extra appearance in the boundary conditions of a crystal momentum (parallel to the strip). And then, by adiabatically changing the special point in a direction transverse to the strip by a cycle (meaning that the corresponding change of flux is equal to ), we can have the crystal momentum moving from one edge to the other of the (parallel) Brillouin zone, and hence induce new effects (or transitions) that can lead to interesting physics, especially if electron-electron interactions are taken into account. It is also interesting, and potentially useful experimentally, that, in cases when both electrons and holes are considered, the Berry phase picked up during such a cycle seems to contain not only an AB part (as derived by Berry in the transported rigid box around an AB flux[40]), but also a term directly related to the electric current, similarly to what happens in an AB ring[41,42]. Finally, a periodic (or even quasiperiodic, i.e. Fibonacci) arrangement of magnetic strips (on a cylinder, or in the plane with pbc parallel to the strips), each one containing a rational flux (with , integers, with ), would be an interesting system to consider, with new (in)commensurability effects expected (not of the Hofstadter type[43] where we have a nonzero -field), that will be a result of the interplay between the gauge proximity effects of the present work and the (quasi)periodicity of the structure behavioral patterns that will be possibly useful for novel applications in intelligent devices. Regarding all the above, it is for the experiment to give the verdict, but it is fair to say that we have provided in this work strong theoretical evidence (in fact a rigorous proof) for the existence of a proximity effect (or even remote influence of fields from a distance) that has a deeply gauge nature something remarkable, and important at least for novel applications. And although we have focused on orbital physics, there are well-defined steps (through boosts to properly moving frames) that lead to spin-physics as well although a generalization of the U(1) gauge character of the nonlocal effects proposed here to cases with a spin-orbit coupling (now with an SU(2) character) would have an additional importance for modern applications and, as already noted, deserves a separate note. This demonstrates that, if the above proximity effects turn out to be real, the experimental and application possibilities of exploiting them, as well as their generalizations, seem to be almost limitless. References: Aharonov, Y., Bohm, D.: Significance of Electromagnetic Potentials in the Quantum Theory. Phys. Rev. 115, 485-491 (1959) Dirac, P.A.M.: Quantised Singularities in the Electromagnetic Field. Proc. Royal Society London A 133, 60-72 (1931) Laughlin, R.B.: Quantized Hall conductivity in two dimensions. Phys. Rev. B 23, 5632-5633 (1981) Wilczek, F.: Two applications of axion electrodynamics. Phys. Rev. Lett. 58, 1799-1802 (1987) E. Witten, Physics Letters B 86, 283 (1979)

2nd Annual International Interdisciplinary Conference, AIIC 2014, 8-12 July, Azores, Portugal Proceedings, Vol.3
362
Moulopoulos, K.: Nonlocal phases of local quantum mechanical wavefunctions in static and time-dependent Aharonov--Bohm experiments. Journ. Phys. A 43, 354019 [32 pages] (2010) Moulopoulos, K.: Beyond the Dirac phase factor: Dynamical Quantum Phase-Nonlocalities in the Schrödinger Picture. Journ. Mod. Phys. 21, 1250-1271 (2011) Chryssomalakos, C. et al.: Spin-1/2 particle on a cylinder with radial magnetic field. Europ. Journ. Phys. 25, 489-502 (2004) Westerberg, E., Hansson, T.H.: Quantum mechanics on thin cylinders. Phys. Rev. B 47, 16554-16562 (1993) Semon, M.D., Taylor, J.R.: Thoughts on the magnetic vector potential. Amer. Journ. Phys. 64, 1361-1369 (1996) Jakubsky, V. et al.: arXiv:1306.2115 Agrawal, N. et al.: Electron Optics with Dirac Fermions: electron transport in monolayer and bilayer Graphene through magnetic barrier and their superlattices. Intern. Journ. Mod. Phys. B 27, 1341003 [63 pages] (2013) Peeters, F.M., Matulis, A.: Quantum structures created by nonhomogeneous magnetic fields. Phys. Rev. B 48, 15166-15174 (1993) Matoulis, A., Peeters, F.M., Vasilopoulos, P.: Wave-vector-dependent tunneling through magnetic barriers. Phys. Rev. Lett. 72, 1518-1521 (1994) Masir, M.R., Vasilopoulos, P., Peeters, F.M.: Kronig--Penney model of scalar and vector potentials in graphene. Journ. Phys.:Condens. Mat. 22, 465302 [10 pages] (2010) Wu, Z., Peeters, F.M., Chang, K.: Electron tunneling through double magnetic barriers on the surface of a topological insulator. Phys. Rev. B 82, 115211 [7 pages] (2010) Konstantinou, G., Kyriakou, K., Moulopoulos, K.: in preparation Zygelman, B.: Geometric gauge potentials and forces in low-dimensional scattering systems. Phys. Rev. A 86, 042704 [12 pages] (2012), Appendix B Jansen, S., Lieb, E.H., Seiler, R.: Symmetry Breaking in Laughlin's State on a Cylinder. Comm. Math. Phys. 285, 503-535 (2009) Hislop, P.D., Soccorsi, E.: arXiv:1307.5968 Muller, J.E.: Effect of a nonuniform magnetic field on a two-dimensional electron gas in the ballistic regime. Phys. Rev. Lett. 68, 385-388 (1992) Thouless, D.J.: Quantization of particle transport. Phys. Rev. B 27, 6083-6087 (1983) Vazifeh, M.M., Franz, M.: Quantization and periodicity of the axion action in topological insulators. Phys. Rev. B 82, 233103 [4 pages] (2010) Cao, C., van Caspel, M., Zhitnitsky, A.R., Topological Casimir effect in Maxwell electrodynamics on a compact manifold. Phys. Rev. D 87, 105012 [13 pages] (2013) Asorey, M., Esteve, J.G., Pacheco, A.F.: Planar rotor: The -vacuum structure, and some approximate methods in quantum mechanics. Phys. Rev. D 27, 1852-1868 (1983) Gribov, V.N.: Quantization of non-Abelian gauge theories. Nucl. Phys. B 139, 1-19 (1978) Berry, M.V., Shukla, P.: Classical dynamics with curl forces, and motion driven by time-dependent flux. Journ. Phys. A 45, 305201 [18 pages] (2012) See i.e. Shapiro, V.E.: arXiv:1305.5108 also unpublished work of Kiehn, R.M. on the web Sticlet, D. et al.: arXiv:1307.6964 Recher, P. et al.: Aharonov-Bohm effect and broken valley degeneracy in graphene rings. Phys. Rev. B 76, 235404 [6 pages] (2007) Nguyen, V.H. et al.: arXiv:1303.4946 Michetti, P., Recher, P.: Bound states and persistent currents in topological insulator rings. Phys. Rev. B 83, 125420 [11 pages] (2011) Moulopoulos, K.: arXiv:1308.6277v2 Qi, X.-L., Hughes, T.L., Zhang S.-C.: Topological field theory of time-reversal invariant

2nd Annual International Interdisciplinary Conference, AIIC 2014, 8-12 July, Azores, Portugal Proceedings, Vol.3
363
insulators. Phys. Rev. B 78, 195424 [43 pages] (2008) Essin, A.M., Moore, J.E., Vanderbilt, D.: Magnetoelectric Polarizability and Axion Electrodynamics in Crystalline Insulators. Phys. Rev. Lett. 102, 146805 [4 pages] (2009) Xu, L.L. et al.: Magnetoelectronics at Edges in Semiconductor Structures: Helical Aharonov-Casher Edge States. Integr. Ferroelectrics 131, 36-46 (2011) Langmann, E., Semenoff, G.W.: Gribov ambiguity and non-trivial vacuum structure of gauge theories on a cylinder. Phys. Lett. B 303, 303-307 (1993) Hetrick, J.E.: Gauge fixing and Gribov copies in pure Yang-Mills on a circle. Nucl. Phys. B Proceedings Suppl. 30, 228-231 (1993) Kohmoto, M.: Topological invariant and the quantization of the Hall conductance. Ann. Phys., 160, 343-354 (1985) Berry, M.V.: Quantal Phase Factors Accompanying Adiabatic Changes. Proc. Royal Soc. London A 392, 45-57 (1984) Moulopoulos, K., Constantinou, M.: Two interacting charged particles in an Aharonov-Bohm ring: Bound state transitions, symmetry breaking, persistent currents, and Berry's phase. Phys. Rev. B 70, 235327 [24 pages] (2004); Erratum: 76, 039902 (2007) Kyriakou, K., Moulopoulos, K., Ghazaryan, A.V. et al.: Arbitrary mixture of two charged interacting particles in a magnetic Aharonov--Bohm ring: persistent currents and Berry's phases. Journ. Phys. A 43, 354018 [11 pages] (2010) Hofstadter, D.R.: Energy levels and wave functions of Bloch electrons in rational and irrational magnetic fields. Phys. Rev. B 14, 2239-2249 (1976)
2nd Annual International Interdisciplinary Conference, AIIC 2014, 8-12 July, Azores, Portugal Proceedings, Vol.3
364
OPTICAL ILLUMINATION WATERMARKING USING DB WAVELET
Parvinder Singh Meenakshi Chhikara
Deenbandhu Chhotu Ram University of Science & Technology, Murthal, Haryana, India
Abstract We proposed a new technology with which real world object can be prevented from
illegal photographing. In optical illumination watermarking we have used Db10 wavelet to make the watermark pattern invisible to human eye and also to have 100% accuracy forreading out embedded data. Various different images have been used for generating watermark pattern of various pixel size viz. 2x2, 4x4, 8x8, 16x16. The result revealed that Db10 is effective technique to be used in optical illumination watermarking.
Keywords: Optical illumination watermarking, DB Wavelet Introduction
The protection of copyrights of digital data has been the main concern from the time the digital communication developed. The digital data is easily prone to attack including change of data or reproduction of data without the originators permission. Watermarking techniques have been widely recognized as methods of protecting the copyrights of image content [10]-[17].In order to prevent the data many watermarking technologies has been developed which protect the data from malicious handling [3]. The watermark is made invisible for the human visual system so that it can't be detected by the attacker or distributor and later on can be used by the authenticator to detect the authenticity of the data. Recently digital watermarking has also been used in printed images, where watermark is embedded in the digital data before it is printed [4],[5]. This is to prevent illegal use of images copied by digital cameras or scanners. However, printed images that have not been produced from digital data, eg pictures at museums that have been painted by artists, do not contain digital watermarking and thus photographs of these objects can be easily utilized without copyright. Various techniques have been proposed in the recent years to protect such non digital data from unauthorized use. These techniques are named as “optical illumination watermarking”,where the illumination contains watermark data.
Optical illumination watermarking is the technique where object is illuminated with the watermark. Thus any photograph of such object also contains the watermark data without the knowledge of photographer and hence the non digital data is protected. By digitalizing this photographic image, watermarking information can be extracted through various processes in the same way as the conventional watermarking technique. Many methods have been proposed in order to make watermark both robust and imperceptible to human visual system.The techniques such as DCT[5], WHT[7] and Haar DWT [8]have been used previously.
This paper proposes a new optical watermarking technique that makes watermark invisible to human. We have used Db DWT technique in order to make watermark more robust and invisible. We have used various block size to generate watermark pattern.

2nd Annual International Interdisciplinary Conference, AIIC 2014, 8-12 July, Azores, Portugal Proceedings, Vol.3
365
Procedure for producing optical watermark Fig.1 explains the procedure of producing watermark using DCT[5]. I-DCT is used to
produce watermark pattern. fi,j(x, y) = ∑ ∑ C(u)C(v)Fi,j(u, v) cos �(2x+1)uπ
2N�N−1
vN−1u cos �(2y+1)vπ
2N� (1)
where fi,j(x,y) is the watermarking image data for pixel (x,y) of the block (i, j), Fi,j(u,v) are the data for pixel (u, v) of block (i, j) in frequency space, N is the number of pixels of the block in the x and y directions.
Fig.1: Procedure for DCT
When 2D inverse WHT is used, the equation is expressed by
fi,j(x, y) = 1N∑ ∑ Fi,jN−1
v (u, v)wh(x, u)wh(v, y)N−1u (2)
Fig.2 illustrate procedure, when wavelet is used to produce watermark images[8].
Fig.2: Procedure for wavelet
The DC value is provided to entire LL plane, this gives the average brightness to the
entire watermarked area. The HC value for the HH component is provided to every component block which would give the information of watermark pattern. All components of HL and LH are given value 0.
We have used block Db wavelet technique in order to generate watermark pattern. Different block sizes viz. 2x2, 4x4,8x8,16x16have been used to generate different watermark pattern.

2nd Annual International Interdisciplinary Conference, AIIC 2014, 8-12 July, Azores, Portugal Proceedings, Vol.3
366
Experiment The key factor in optical illumination watermarking is to keep the watermark pattern
both invisible and readable when it contained in light and also when captured using camera. We carried out experiments to evaluate these characteristic in the performance of the proposed technique. Watermark Pattern
Various images were taken to work as the watermark pattern. Every image underwent the forward block db wavelet transformation, block haar transform and block DCT. All these transformation results various watermarking images. The block size taken was 2x2, 4x4, 8x8, 16x16 pixels per block.
The DC value was kept constant to 150 in the experiment, which gave the average brightness to the entire watermark pattern. The HC value was changed from 0 to 25. Equipment Used
The experiment utilized a digital projector to project watermark pattern on the object in order to have watermark through light. A digital camera was used to capture the images of object having illuminated watermarking. We have used a wall painting to be our object image in the experiment. Layout
Fig.3: Layout for experiment
Fig.3 explains the layout of the experiment. The projector was kept at approximately
150 cm away from the object to be watermarked. The digital camera was behind the projector in order to capture the images.
Evaluation of Readability
When block DCT was used watermark readability was evaluated by checking the phase of every block of the captured image. The phase was checked by computing forward block DCT of image and then checking the sign of (N-1,N-1) pixel of every block[7].When the wavelet was used for watermarking we got a multiresolution image and therefore DCT readability method cannot be used. For wavelet we took the HH component of the image by using forward block wavelet and then calculate the average of the every block of HH plane. The average value gave us the sign of the phase of that block. For negative average value we term the read out value as “0” and for positive average value we term the read out value to be “1”[8]
The accuracy of the detection of the watermark data read out from the image was evaluated on the basis that readout data gives the check board pattern when blocks with value 0 and 1 are alternatively placed in every technique.

2nd Annual International Interdisciplinary Conference, AIIC 2014, 8-12 July, Azores, Portugal Proceedings, Vol.3
367
Evaluation of Invisibility We evaluated the invisibility of test pattern with the subjective test. The watermarking
patterns were projected on the object and the viewers were asked to notice the projected image from more than 1m of distance. Under these conditions the viewers were asked to observe the pattern. The patterns with different HC values were projected randomly. Six viewers participated in the invisibility test and all were having correct eyesight. Result and Discussion
Fig. 4 gives some of the patterns which were projected for readability and invisibility. We have tested around 200 patterns for the experiment. The patterns generated were similar to the check board pattern. The size of every pattern was kept constant. A single painting was used to project different patterns. The patterns were cropped and zoomed in figure, showing only a part of the entire pattern. Readability
Table 1 gives the result of accuracy of the data readout from the watermarked images of the experiment. The accuracy is indicated by the percentage of the data to be read out correctly from the entire data. Invisibility
Table 2 summarises the result of invisibility of the projected watermark pattern. Six viewers took part in the visibility test. They were made to observe the object from a fairly distance. With the result it is clear that the pattern become invisible when db10 is used in any watermark pattern.
a) Db10 b)DCT c)Haar d) Db10
e)DCT f)Haar g)Db10 h)DCT
i)Haar
Fig.4. (a) to (c) block size 4, HC value 5, (d) to (f) block size 8, HC value15, (g) to (i) block size 16, HC value 25

2nd Annual International Interdisciplinary Conference, AIIC 2014, 8-12 July, Azores, Portugal Proceedings, Vol.3
368
Table 1 Accuracy of reading out watermarked data Experimental condition Accuracy(%)
Techniques DC HC 2x2 4x4 8x8 16x16
Db10
150
0 92 95 97 99 5 93 97 98 99
10 100 100 100 100 15 100 100 100 100 20 100 100 100 100 25 100 100 100 100
DCT 150
0 96 97 97.5 100 5 97 98 99 100
10 98 100 100 100 15 100 100 100 100 20 100 100 100 100 25 100 100 100 100
Haar 150
0 94 95 97 98 5 96 97 100 100
10 100 100 100 100 15 100 100 100 100 20 100 100 100 100 25 100 100 100 100
Table 2: Results of invisibility of projected watermarking pattern based on subjective test
Experimental condition Invisibility
Techniques DC HC 2x2
4x4
8x8
16x16
Db10
150
0 Y Y Y Y 5 Y Y Y Y
10 Y Y Y Y 15 Y Y Y Y 20 Y Y N Y 25 Y Y N Y
DCT
150
0 Y N N N 5 Y N N N
10 Y N N N 15 Y N N N 20 N Y Y Y 25 N Y Y Y
Haar 15
0
0 Y Y Y Y 5 Y Y Y Y
10 Y Y Y Y 15 Y Y Y Y 20 N N N N 25 N N N N
Watermarking Pattern
We have carried out histogram analysis in order to check the difference in the pattern generated. The analysis revealed that block Haar technique gives the same pattern irrespective of image and the experimental conditions. Thus we can conclude that Haar patterns are not robust and can be easily forged whereas Db10 and DCT gave fairly different patterns.
Peak Signal-to-Noise Ratio
We have used Peak Signal-to-Noise ratio for the objective evaluation. The PSNR was obtained from the original image i.e. image without watermark and watermarked image. The PSNR was calculated using (3).
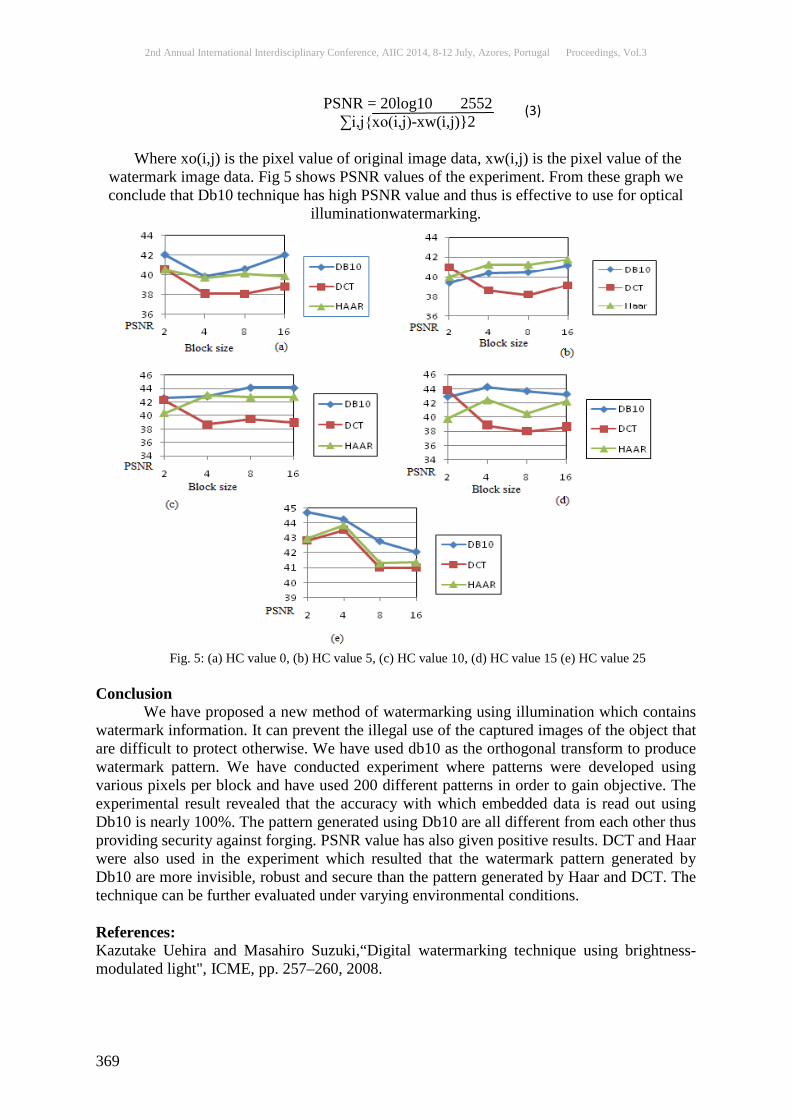
2nd Annual International Interdisciplinary Conference, AIIC 2014, 8-12 July, Azores, Portugal Proceedings, Vol.3
369
PSNR = 20log10 2552 ∑i,j{xo(i,j)-xw(i,j)}2
Where xo(i,j) is the pixel value of original image data, xw(i,j) is the pixel value of the
watermark image data. Fig 5 shows PSNR values of the experiment. From these graph we conclude that Db10 technique has high PSNR value and thus is effective to use for optical
illuminationwatermarking.
Fig. 5: (a) HC value 0, (b) HC value 5, (c) HC value 10, (d) HC value 15 (e) HC value 25
Conclusion
We have proposed a new method of watermarking using illumination which contains watermark information. It can prevent the illegal use of the captured images of the object that are difficult to protect otherwise. We have used db10 as the orthogonal transform to produce watermark pattern. We have conducted experiment where patterns were developed using various pixels per block and have used 200 different patterns in order to gain objective. The experimental result revealed that the accuracy with which embedded data is read out using Db10 is nearly 100%. The pattern generated using Db10 are all different from each other thus providing security against forging. PSNR value has also given positive results. DCT and Haar were also used in the experiment which resulted that the watermark pattern generated by Db10 are more invisible, robust and secure than the pattern generated by Haar and DCT. The technique can be further evaluated under varying environmental conditions.
References: Kazutake Uehira and Masahiro Suzuki,“Digital watermarking technique using brightness-modulated light", ICME, pp. 257–260, 2008.
(3)
2nd Annual International Interdisciplinary Conference, AIIC 2014, 8-12 July, Azores, Portugal Proceedings, Vol.3
370
T. Yi-zhou, L. Hai-bo, H. Shui-hua, S. Ben-jian, and P. Zhong-ming, “An Optical Watermarking Solution for Color Personal Identification Pictures,” Proceedings of the SPIE vol. 7512, pp. 1–6, 2009. D. Mistry, “Comparison of Digital Water Marking methods,” IJCSE, vol. 02, no. 09, pp. 2905–2909, 2010. T. Mizumoto and K. Matsui, “Robustness investigation of DCT digital watermark for printing and scanning”, Trans, IEICE (A), Vol.J85-A, No.4; pp.451-459 (2002). M.Ejima and A. Miyazaki, “Digital watermark technique for hard copy image” , Trans, IEICE (A), Vol. J82-A, No.7; pp.1156- 1159 (1999). V. Solachidis, I. Pitas, “Circularly Symmetric Watermark Embedding in 2-D DFT Domain,” Proceedings of the 1999 IEEE International Conference on Acoustics, Speech and Signal Processing (ICASSP 1999), Vol. 6, Phoenix, AZ, March 15-19, 3469-3472(1999). Y. Ishikawa, K. Uehira, and K. Yanaka, “Practical Evaluation Technique Using Orthogonal Transforms,” journal of display technology., vol. 6, no. 9, pp. 351–358, 2010. Y. Ishikawa, K. Uehira, and K. Yanaka, “Optimization of Size of Pixel Blocks for Orthogonal Transform in Optical Watermarking Technique,” J. Disp. Technol., vol. 8, no. 9, pp. 505–510, Sep. 2012. U. K., Komori Mizuho, “Optical watermarking technology for protecting portrait rights of three- dimensional shaped real objects using one-dimensional high-frequency patterns,” J. Electron. Imaging, Vol. 22(3),Jul.-Sep. 2013. J. Cox, J. Kilian, F. T. Leighton, and T. Shamoon, “Secure spread spectrum watermarking for multimedia,” IEEE Trans. Image Process., vol. 6, no. 12, pp. 1673–1687, Dec. 1997. M. D. Swanson, M. Kobayashi, and A. H. Tewfik, “Multimedia data- embedding and watermarking technologies,” Proc. IEEE, vol. 86, no. 6, pp. 1064–1087, Jun. 1998. M. Hartung and M. Kutter, “Multimedia watermarking techniques,” Proc IEEE, vol. 87, no. 7, pp. 1079–1107, Jul. 1999. G. C. Langelaar, I. Setyawan, and R. L. Lagendij, “Watermarking digital image and video data,” IEEE Signal Process. Mag., vol. 17, no. 5, pp. 20–46, 2000. Parvinder Singh, Sudhir Batra, HR Sharma, "Evaluating the Performance of Message Hidden in 1st and 2nd Bit Plane", WSEAS Transactions on Information Science and Applications, issue 8, vol 2, August 2005, pp 1220-1227. Jasvinder Kaur, Manoj Duhan, Ashok Kumar, Raj Kumar Yadav, Matrix Matching Method for Secret Communication using Image Steganography, Annals of Faculty Enginnering, Hunedoara, International Journal of Engineering, Tome X, Fascicule 3, pp. 45-48, 2012 Parvinder Singh, Sudhir Batra, H R Sharma, "Steganographic Methods Based on Digital Logic", 6th International Conference on Signal Processing, Dallas, USA, March 22-24,2007. K. Okihara, Y. Inazumi, and H. Kinoshita, “A watermark method that improve the relationship between of the number of embedded bits and image degradation,” J. IEIJ, vol. 58, no. 10, pp. 1465–1467,2004.
2nd Annual International Interdisciplinary Conference, AIIC 2014, 8-12 July, Azores, Portugal Proceedings, Vol.3
371
NEW MATERIALISM - THE TRANSFORMATION OF INTELLIGENT TEXTILES TOWARDS AN INTERACTIVE
YOUSER GENERATED INTERFACE
Bettina Schülke, PhD University of Lapland, Faculty of Art and Design, Finland
Abstract New materialism of smart or intelligent textiles represents the next generation of fibers. While textiles previously were responsible for several technological developments, today the rapid change of new technologies show their significant influence in the development of smart textile materials. As varying as their definitions are, are their applications. It is without any doubt that the most exciting developments today are taking place in the field of nanotechnology textiles. While lots of research in this area is connected with materialism research, there is a need of developing new models for creative applications and new design strategies. These novel materials generate new types of expressiveness and have the potential to transform craft and textile design into new types of artistic practice. Along with the shift from a passive functionality of static textiles towards mobility and active behavior, the users role itself is changing drastically. A multisensory and intermodal movement of thinking characterizes the intercourse with this new materialism of textiles.
Keywords: Smart-textiles, technology, interactive interface, consciousness Key-characteristics of these intelligent materials are their interactivity, functionality and ability to communicate, which consequently generate a new user behavior. While textiles and technology already have a longstanding common background on several levels, new technologies are able to transform textiles into intelligent interactive interfaces. This paper focuses on the shift from functionally passive and static fabrics to active behavior and dynamic expression of interactive interfaces towards a youser- generated content and change of consciousness. Introduction
The initial stage of development and exploration of smart textiles is already history. A wide range of possible expressions is already tested; their potential is explored and practical limits experienced. What will follow next? New developments, many of them based on a new materiality are happening continuously, but the basic principles don´t change drastically for now. However, what urgently is needed at this stage is to develop new design strategies for these novel materials. What and how can we design with smart textiles? How do they influence traditional design practices? What happens after the first hype and how can we shift these materials to the next level? What does it mean to design with smart textiles and how do they effect on our physical environment?
Lots of questions are still open and needs to be discussed. The material based research is one part, but at the same time it is equally important to take a closer look at the characteristics of this new materialism which comes along with a new methodological thinking which consequently leads to new design strategies. To explore the above-mentioned questions it is essential to develop a better understanding of the function and characteristics

2nd Annual International Interdisciplinary Conference, AIIC 2014, 8-12 July, Azores, Portugal Proceedings, Vol.3
372
of such materials and becoming aware of how they can create entirely new systems. We are not only talking about a piece of textile anymore, which is “just” smart, instead it is important to realize we are confronted with an active system which is embedded in an certain environmental context which is situated in space and time and develops its own life.
Many research projects in this area are based on material research and are closely linked with industrial applications (smart TEXBOOK). On the other hand it can be observed that there is still a huge gap between highly artistically inspired prototypes and commercially conducted industrial developments. At the same time designers have to realize that there is a need to re-think the material world, looking outside existing technologies and industries to anticipate future needs, desires and challenges. This implements shifting the existing boundaries and combine interdisciplinary research with an intermodal movement of thinking.Social, ecological, biological, technical, sustainable and functional solutions ask for a fresh approach, which moves beyond an appealing and pretty surface and request new visions for future materials. From passive to active Textiles
Smart textiles clearly introduce a shift from passive functionally and static fabrics to active behavior and dynamic expression. These new types of expressiveness transform craft, design, and artistic applications into new types of artistic practice. Consequently new ways of production, displaying and communicating artistic works emerge along with these developments.
Comparing traditional textile techniques with smart textiles clearly indicates a shift towards functionality and a more content-driven development of production and design. Textile design is not only reduced anymore exclusively to create an interesting and decorative surface. The design or content can move from the surface into the material itself (Dimitrescu, 2013).Decorative elements once applied on the fabric transform towards a content-driven functionality. Not the visual appearance is necessarily the main goal, but what the material can do or how it is reacting becomes essential (Hibbert, 2012).
What is hidden underneath or is embedded under the surface might not necessarily be visible at first glace, but can create a certain functionality of the material. This signifies what is first invisible can become visible through its function or is triggered by an interactive impulse initiated by a person or through the surrounding environment. Such characteristics clearly leads to a new user/viewer behavior compared to traditional textiles and initiates a new aesthetic approach.
This vibrant shift towards experimental crossroads of textile materials in combination with art, science and technology demands new concepts of the creative process (Nilson, Vallgarda, Worbin, 2011). The main focus of researchers and material developers has long been on advances in technology rather than creating new perspectives for applications and new design models. Designers working with intelligent materials must have a comprehensive understanding of the purpose, the interaction between the material and the user, as well as the context of use. Interaction Textile Design
The interactive element of textiles causes a new perspective of fabrics. This implements a different understanding for both, the creator and the user, compared to traditional textiles. While in the field of media art interactive works already moved into established Institutions and Museums, relatively few artists integrated intelligent fabrics so far into their interactive projects. Through my personal longstanding background of working with textiles I have experienced that textiles often generate an appealing desire for touch by
2nd Annual International Interdisciplinary Conference, AIIC 2014, 8-12 July, Azores, Portugal Proceedings, Vol.3
373
the viewer. These tactile and haptic characteristics of textiles could be used even more effectively in combination with intelligent and interactive applications.
ErkkiHuhtamo, Professor in Cultural History and media archaeologist, explains in his article on Touchscapes(Huhtamo, 2009)”how aesthetics in Western art is based on distance and as the doctrine goes, to contemplate the work, one has to step back to appreciate the harmonious blending of elements into an overall form. In the nineteenth century when the commercial art market began to emerge and the public gained access to museum institutions, art was intended as a delight for the eyes only, he explains.” 103
Interactive textiles or artworks initiated the process to redefine the relationship between the viewers and the work in a radical manner. Many of the interactive works explicitly ask for an active and continuous interaction with the viewer/user. Sometimes the physical presence can already initiate a process, but many other works invite the visitors to a tactile interaction through physically touching and experiencing the work. The fact that the viewer can immediately see the result of actions leads to a relatively new, user-generated behavior. Peter Weibel brings this tendency to the point, describing it in the following:
“The participation of the public in the creation of artworks in a museum is like a training field for the emancipation of the consumer. Visitors to these installations are in the center of attention; they are the emancipated consumers. YOU are the content of the world. As a participant, YOU the YOUser have the chance to change the world.”104
Shifting the youser into the center of the work is certainly also one of the key characteristics of smart textiles. Designers, artists and scientists who create such materials demand in many cases the active participation of the user. But does the user always know what to do with these materials without explicit instructions? It might be an essential difference for what purpose the material is developed. Commercially orientated products most likely will be promoted in a way to address the novel advantages of intelligent materials. But artists who are integrating such materials in their projects can´t always premise the visitor’s education.
Some projects might need instructions; others simply might work by intuition or by watching other users. However, new methods of information change the user behavior. A passive perception moves towards an active participation generated through interaction. On the other hand it has to be clearly distinguished if a concept is developed for a singular user or for a wider range of audience, which can lead in addition to a social interaction. If a common social interaction is taking place, different parameters will come into the picture (Schülke, Czegledy, 2009). Every form of interactivity is created through the discourse of input and output.
Sabine Seymoure (Fashionable Technology, 2008), expert when it comes to smart textiles and fashion, gave an excellent technical overview on possible solutions how such systems can be integrated in smart textiles. In the following I will provide an extended and supplemented form of examples for possibilities of integrating inputs, outputs and sensors in relation to smart textile applications. Input
• Person • Pressure, bend, motion, data • Sound, visuals, humidity, proximity
103Huhtamo Erkki. 2009. Interactive Art Research, Christa Sommerer and Laurent Mignonneau. Springer- Wien New York. p. 32 104Weibel Peter. 2009. Interactive Art Research, Christa Sommerer and Laurent Mignonneau. Springer- Wien New York. p.19
2nd Annual International Interdisciplinary Conference, AIIC 2014, 8-12 July, Azores, Portugal Proceedings, Vol.3
374
• Displacement, smell, acceleration • Environment • Light, humidity, sound, temperature, microprocessor, visual
Output
• Visual, LEDs, thermochronic ink, photochronic ink, display • Sound, speakers, buzzers • Touch • Conductive yarns or fibers, conductive fabric • Smell, scent capsules • Energy
Sensor
• Body sensing technologies (close to the body) • Motion sensors (proximity detection) • Data capture (humidity, light, temperature, sound)
Textiles that communicate
Interactivity, functionality and “communication” can be seen as the essence of smart textiles. This form of communication between a human being and a technically created system in combination with a textile material is able to create content, meaning and interaction. Despite that, there is much more happening than just “something” that is sent from one to the other. This something could be described as the author.
Roy Ascott, founding President of the Planetary Collegium and Director of the CAiiA-Hub (Centre for advanced Inquiry in Interactive Arts) describes such form of communication in telematics systems as “dispersed authorship”. This happens when the system may be the interaction itself, when the context includes artificial memory in a Telematics system. From my point of view I do see a close connection and similarity between intelligent materials such as smart textiles and Telematic-systems. Ascott refers in the same context to these systems as dealing with human interaction, language, meaning, and memory. He quotes from Humberto R. Maturana and Francisco J. Varela´s study on cognition:
“According to the metaphor of the tube, communication is something generated at a certain point. It is carried by a conduit (or tube) and is delivered to the receiver at the other end. Hence there is something that is communicated, and what is an integral part of that which travels in the tube. (…) According to our analyses, this metaphor is basically false. It presupposes a unity that is not determined structurally, where interactions are instructive, as though what happens to a system in art interaction is determined by the perturbing agent and not by its structural dynamics. It is evident, however, even in daily life, that such is not the case with communication: each person says what he says or hears according to his own structural determination….communication depends on not what is transmitted, but what happens to the person who receives it. And this is a very different matter from “transmitting information.” 105
Maturana and Varela analyze the importance on the individuality of what each person perceives in interactive systems, even when the main parameters stay the same. Consequently, interaction design can be seen as a very personal interpretation. According to the above-discussed parameters I will provide in the following two figures a visual graphic of
105Ascott Roy. 2003. Telmatic Embrace, Visionary Theories of Art, Technology, and Consciousness. University of California Press. p. 213
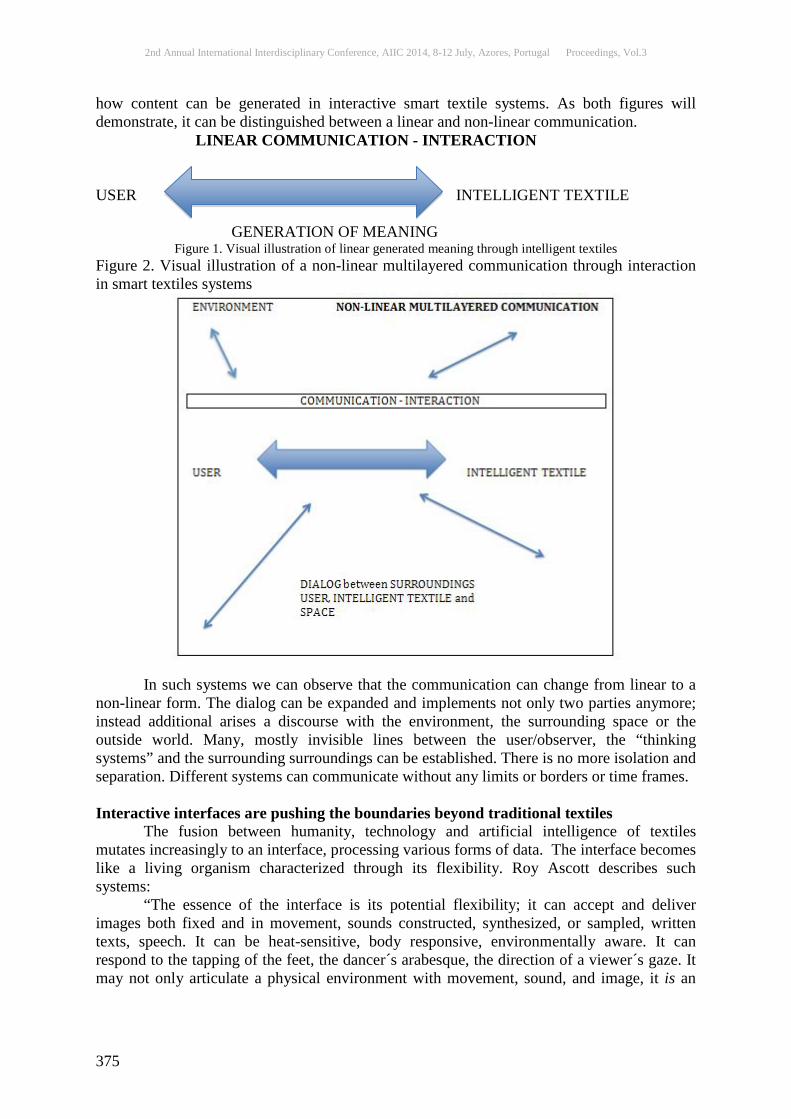
2nd Annual International Interdisciplinary Conference, AIIC 2014, 8-12 July, Azores, Portugal Proceedings, Vol.3
375
how content can be generated in interactive smart textile systems. As both figures will demonstrate, it can be distinguished between a linear and non-linear communication. LINEAR COMMUNICATION - INTERACTION USER INTELLIGENT TEXTILE GENERATION OF MEANING
Figure 1. Visual illustration of linear generated meaning through intelligent textiles Figure 2. Visual illustration of a non-linear multilayered communication through interaction in smart textiles systems
In such systems we can observe that the communication can change from linear to a
non-linear form. The dialog can be expanded and implements not only two parties anymore; instead additional arises a discourse with the environment, the surrounding space or the outside world. Many, mostly invisible lines between the user/observer, the “thinking systems” and the surrounding surroundings can be established. There is no more isolation and separation. Different systems can communicate without any limits or borders or time frames. Interactive interfaces are pushing the boundaries beyond traditional textiles
The fusion between humanity, technology and artificial intelligence of textiles mutates increasingly to an interface, processing various forms of data. The interface becomes like a living organism characterized through its flexibility. Roy Ascott describes such systems:
“The essence of the interface is its potential flexibility; it can accept and deliver images both fixed and in movement, sounds constructed, synthesized, or sampled, written texts, speech. It can be heat-sensitive, body responsive, environmentally aware. It can respond to the tapping of the feet, the dancer´s arabesque, the direction of a viewer´s gaze. It may not only articulate a physical environment with movement, sound, and image, it is an
2nd Annual International Interdisciplinary Conference, AIIC 2014, 8-12 July, Azores, Portugal Proceedings, Vol.3
376
environment in the sense that it actually constitutes an area of data space in which art comprising this human-computer symbiosis can be acted out.”106
Many of the smart textiles operate with data, which is an essential part of an entire system, the fabric, the viewer/user and the surrounding environment. All these various components together are producing meaning, mostly initiated by a process of transformation.
The meaning, which is produced through such systems, can be seen as interaction between the user and the system. The content often is embodied in data, which is primary pure electronic until it has been reconstituted at the interface. Accordingly to these analyses it can be said that smart textiles combine a material based with a non-material component and entirely new systems will be created based on future textiles.
Carole Collet, director of the Textiles Futures Research Center explains: “Designers will need to adapt and learn different tools to be able to understand how to work with these new living manufactures. They will have to grasp a brand new world where material and technology have effectively become one entity. The old fashioned concept of using a technology as a means to transform a material will be redundant. These new living materials are also the technology that shaped them. And if we think that the introduction of computing technologies has radically changed the design toolbox in the last two decades, imagine what these new living materials will lead to. Living technology is about to re-map the material and technological landscape as we know it. ”107
Carole Collet exemplified future visions on the relationship between textiles and technologies, which effectively leads to a fundamental transformation of one of the oldest materials of mankind. High tech fabrics, nano-textiles, new functionalities and applications will certainly change the use and characteristics of textiles, which essentially is altering people’s relationship with these novel materials. However, lots of research is already conducted, but still many questions remain unsolved which asks for further research. Conclusion
We are now witnessing a radical change of the material world. A new form of living technology will re-shape our material environment. We are just at the beginning of exploring the analog interaction between the human and entirely new living systems based on technology. This brings along a need to reconsider the ethics of the forthcoming where everything is reduced to programmable coding. Textiles can no longer been seen as “dead” material, instead they are mutating into complex systems interacting with the environment and the user. A shift from passive functionality to an active behavior characterizes these novel textile materials. The designer or artist is increasingly involved in designing context instead of transmitting content or expression. Within these new parameters the viewer/user is able to construct meaning and experience, consequently a radically different outcome emerges which urgently asks for new design strategies. References: Ascott, Roy, Telmatic Embrace, Visionary Theories of Art, Technology, and Consciousness. University of California Press,2003. Collet Carol, Textile Futures,Biofacture, A Quest for Future Suitable Fabrication, 2012. http://www.arts.ac.uk/media/arts/colleges/csm/courses/ma-textile-futures/documents/MA-Textile-Futures-Catalogue.pdf (Read 23. 06. 2014)
106Ascott, Roy. 2003. Telmatic Embrace, Visionary Theories of Art, Technology, and Consciousness. University of California Press. p. 225 107http://www.arts.ac.uk/media/arts/colleges/csm/courses/ma-textile-futures/documents/MA-Textile-Futures-Catalogue.pdf, p8

2nd Annual International Interdisciplinary Conference, AIIC 2014, 8-12 July, Azores, Portugal Proceedings, Vol.3
377
Dimitrescu Delia, Relational Textiles: Surface Expressions in Space Design, University of Boras, Studies in Artistic Research. Responstryck, 2013. HibbertRos, Textile Innovation: Interactive, Contemporary and Traditional Materials, in Textiles: Critical and Primary Sources, Volume 3, Science and Technology, edited by Catherine Harper, Berg, London, New York, 2012. Huhtamo Erkki, In Interactive Art Research, Christa Sommerer and Laurent Mignonneau. Springer- Wien New York, 2009. Nilsson Linnea, Vallgarda Anna, Worbin Linda, Designing with Smart Textiles: A new Research Program, The Swedish School of Textiles, University of Boras, Sweden, 2011. https://www.academia.edu/2991081/Designing_with_Smart_Textiles_a_new_research_program(Read 23. 06. 2014) Saymour Sabine, Fashionable Technology, Springer Verlag Wien, New York, 2008. smart TEXBOOK, http://www.texbook.eu (Read 23. 06. 2014) Schülke, Czegledy, 2009. Transaction as Interaction, Presentation at the ISEA 2009 (International Symposium on Electronic Art) Conference, Belfast (IE). Weibel Peter, In Interactive Art Research, Christa Sommerer and Laurent Mignonneau. Springer- Wien New York, 2009.
2nd Annual International Interdisciplinary Conference, AIIC 2014, 8-12 July, Azores, Portugal Proceedings, Vol.3
378
THE SYMMETRY AS INTERDISCIPLINARY FACTOR THROUGH ITS APPLICATION AND HISTORY
Helena Melo, PhD CMATI & Department of Mathematics, University of Azores, Portugal
Abstract The symmetry is used by human race in his achievements since the most primitive times. The human being following the permanent evolution of life could not fail to put the symmetry in his works, once his own outward appearance of almost every being symmetric. In the archaeological remains and even in her earliest art manifestations we checked this fact. All over the world and for all the historical, the symmetry is an inseparable companion of human creation and everything that surrounds him.
Keywords: Symmetry, symmetry groups, interdisciplinary Introdução A simetria é usada pelo homem nas suas realizações desde os tempos mais primitivos e, seguindo a cadeia de evolução permanente da vida, o ser humano não poderia deixar de colocar essa simetria nas suas obras, uma vez que o próprio formato exterior de quase todos os seres vivos é simétrico. Nos vestígios arqueológicos das suas ferramentas e até mesmo nas suas mais antigas manifestações de arte, evidenciamos esse facto. Através das épocas notamos a interdisciplinaridade que o tema “simetria” promove. Há simetrias coligadas às artes, à geologia, à química, à física, à biologia, à música, à literatura, à arquitetura, evidentemente à matemática, e a muitas outras áreas do conhecimento. Pelo desenrolar de várias épocas, desde os tempos mais remotos, evidenciamos e destacamos a aplicabilidade e existência de simetrias, quer por criação, quer por observação, bem como a classificação que lhe é atribuída de acordo com as suas características gerais, os denominados grupos de simetria. Desenvolvimento
A palavra simetria tem as suas raízes na filosofia e estética grega, onde era usada para expressar equilíbrio, proporção e também era sinónimo de harmonia. O termo simetria deriva da palavra grega συµµετρια (sin (com) e métron (medida)) e foi por muitas vezes traduzida como “comensurável” ou “proporção”, embora não haja, entre elas, uma correspondência de significado.
O termo simetria só entra no vocabulário das ciências no ano de 1830, com o começo do estudo da classe dos cristais, em que a sua análise se baseou na teoria dos grupos, introduzida pelo matemático francês Evariste Galois (18311-1832) num trabalho publicado em 1848.
Com o desenvolvimento das ciências naturais, tais como a cristalografia, a química, a física, entre outras, as estruturas simétricas tornaram-se uma importante área de estudo na geometria. Mas, não só nestes campos observamos a existência de simetria.
O primeiro estudo de simetria, realizado e registado historicamente, talvez tenha sido o existente no livro “I Ching” (livro das mutações), considerado o mais antigo da China.
2nd Annual International Interdisciplinary Conference, AIIC 2014, 8-12 July, Azores, Portugal Proceedings, Vol.3
379
Provavelmente foi escrito na dinastia Chu (1122 – 256 a.C.). Esse livro é uma espécie de oráculo que visa conhecer o futuro e passado através dos seus 64 hexagramas – trigramas duplicados. Os hexagramas, compostos pela super posição de 6 linhas (hsian), são denominados yang quando as linhas são contínuas, e de yin, quando essas são interrompidas. Os hexagramas são notáveis pela distribuição de simetrias. O matemático alemão Gottfried Wilhelm Leibniz (1646-1716), autor do sistema binário de numeração, reconheceu nos hexagramas o seu sistema.
A simetria teve, ao longo dos tempos, várias definições e conceitos. O escultor grego Fídias (c. 492-432 a.C.) define a simetria como “a devida disposição,
o equilíbrio e a correspondência adequada das “formas parciais” em qualquer totalidade formal”. Pela mesma altura, o historiador grego Heródoto (480-425 a.C.) fala da distribuição simétrica dos rios sobre a face da Terra, mostrando, assim, possuir conhecimentos de geologia, física e simetria. Também o filósofo, matemático e astrónomo grego Eudoxo de Cnido (c. 400-347 a.C.) formula a doutrina das esferas homocêntricas que suponha uma terra fixa e imóvel, e escreve uma “teoria das proporções”.
Desde o séc. VI a.C., sob a orientação do filósofo e matemático grego Pitágoras de Samos (569-475 a.C.), um grupo de matemáticos gregos, os pitagóricos, estuda pela primeira vez os poliedros regulares. O filósofo grego Platão (427-347 a.C.) também faz referências à simetria. Platão estuda os cinco sólidos regulares, designados posteriormente de sólidos platónicos, e associa cada um com um dos quatro elementos: terra, ar, fogo e água., chegando mesmo a afirmar que os átomos dos quatro elementos da ciência antiga tinham a forma destes poliedros. Pensava-se naquela altura, que os átomos da terra tinham a forma de cubos, os do ar a forma de octaedros, os do fogo, de tetraedros, os da água, de icosaedros e os do cosmos, de dodecaedros.
O arquiteto romano Marcus Lucius Vitruvius Pollio (c. 70-25 a. C.), por volta de 80 a.C., afirma que a proporção seria “a coordenação métrica, em toda obra, entre um módulo e o todo”, e define a simetria numa forma bem mais generalizada, como “a harmonia apro-priada que resulta dos membros da própria obra e a correspondência modular que resulta das partes separadas em relação à aparência de todo o corpo”.
O médico grego Cláudio Galeno (130-200) refere que “a beleza consta da simetria das partes, na proporção de um dedo em relação a outro, de todos os dedos em relação à mão …, em conclusão, de todas as partes em relação às demais”. Anos mais tarde, o filósofo neo-platónico romano Plotino (205-270) menciona que “praticamente toda gente afirma que a beleza visual é produzida pela simetria das partes em relação uma às outras e em relação ao todo”.
Na “idade das trevas”, um período da história compreendido entre os anos 400 e 800 que dá enfase aos estragos culturais e económicos que ocorreram na Europa em consequência do declínio do Império Romano, a simetria, devido a uma minimização das ideias, transformou-se na limitada noção de reflexão sobre um eixo ou plano, e o latim da linguagem arquitetónica que traduz a palavra grega como “proporção”, aumentou ainda mais a confusão. Por conseguinte, um prédio ou uma pintura podem ter proporções ideais e não serem, no en-tanto, simétricos.
A noção de simetria torna-se novamente ativa na Renascença. Inicialmente, o pintor florentino Cennino d’Andrea Cennini (1370-1440), um marco de uma transição entre os conceitos dos tempos medievais e do renascimento na arte, fala muito vagamente da simetria. Alguns anos depois, o retorno da simetria começa realmente com um génio de muitas habilidades: pintor, escultor, engenheiro, matemático, músico, geólogo, anatómico, cartógrafo, botânico, escritor e inventor, o italiano Leonardo da Vinci (1452-1519). Leonardo costumava determinar, de maneira sistemática, todas as simetrias possíveis dos edifícios e

2nd Annual International Interdisciplinary Conference, AIIC 2014, 8-12 July, Azores, Portugal Proceedings, Vol.3
380
monumentos com vista a projetar de maneira harmoniosa possíveis extensões e acrescentos, sem destruir a simetria da parte central.
Leonardo da Vinci, na sua época, estuda alguns grupos de simetria cíclica (rotativas), para além de fazer numerosos esquemas de objetos simétricos, como, por exemplo, o rolamento de esferas.
Albrecht Dürer (1471-1528), de origem alemã, inicia os seus estudos em pintura em 1486, contemporâneo de Leonardo, também é despertado para a matemática e a arquitetura, começando por ler “Os Elementos” de Euclides e o tratado “De architectura” de Vitruvius. Dürer publica, no ano da sua morte, um tratado que contém alguns aspetos sobre simetria.
No ano de 1595, o astrónomo e matemático alemão Johannes Kepler (1571-1630) escreve o Prodromus mysterium cosmographicum. Kepler reduz as distâncias do sistema planetário a corpos regulares inscritos e circunscritos em esferas e encontra outros sólidos quase regulares, para além do 13 sólidos descobertos por Arquimedes, anotando as suas simetrias.
A simetria começa a ressurgir com toda a sua adaptabilidade, tornando-se subentendida na noção de desenho a partir do Renascimento.
Tal como as primeiras manifestações de simetria, a história da arte ornamental começa por volta de dez milhões de anos antes de Cristo, em meados e finais do período Paleolítico, quando temos os primeiros exemplos de rosáceas, todos os 7 tipos de frisos, exemplos de ornamentos derivados da sobreposição dos frisos e todas as 5 redes planas de Bravais: a quadrada, a retangular simples, a retangular centrada, a oblíqua e a hexagonal. Auguste Bravais (1811-1863) foi um físico francês conhecido pelos seus trabalhos em cristalografia. Da arte ornamental do período Neolítico, temos exemplos de todos os 17 tipos de pavimentos que são conhecidos nos dias de hoje.
Apesar de termos vestígios destes conceitos desde os tempos pré-históricos, a teoria das simetrias e a arte ornamental tem as suas raízes na antiga Grécia.
A essência da teoria das simetrias, baseada na teoria dos grupos, é expressada em “Erlangem Program”, um trabalho do matemático alemão Félix Klein (1849-1925), datado de 1872, no qual caracteriza a teoria das simetrias como um universo aproximado para diferentes geometrias através dos seus grupos de transformações e das invariâncias desses grupos. O desenvolvimento da teoria das simetrias não pode ser separado da cristalografia e da teoria dos grupos.
Vários outros matemáticos desenvolveram estudos sobre cristalografia, uns com base na geometria, outros com base nas ciências sociais, salientando-se nos finais do século XIX, por exemplos, o cristalógrafo russo E. S. Federov (1853-1919), o matemático alemão Arthur Moritz Shoenflies (1853-1928), o físico inglês William Barlow (1812-1902), aluno de Klein, entre muitos outros. De modo independente, eles definiram e mostraram matematicamente que só pode haver 230 grupos de simetria interna nos cristais. Essa classificação, aliada aos trabalhos com raio-X desenvolvidos pelo professor de matemática e física na Universidade de Adelaide, o inglês William Henry Bragg (1853-1919), formado em física e química, juntamente com o seu filho, o físico australiano William Lawrence Bragg (1862-1942), constituem a base teórica da cristalografia moderna.
Em 1952, o estudo do matemático alemão Hermann Weyl (1885-1955) é um marco de retorno ao ideal grego. Weyl afirma, entre outras coisas, que a “dilatação” é a última extensão da simetria real e dá uma ideia da simetria como “a invariância de uma transformação na configuração de elementos submetida a um grupo de transformações auto mórficas”, servindo então para as transformações de crescimento.
Como vimos, a noção de simetria é muito importante nas artes, na matemática, em diversas ciências como a cristalografia, a física, a química, a biologia, entre outras. Há que

2nd Annual International Interdisciplinary Conference, AIIC 2014, 8-12 July, Azores, Portugal Proceedings, Vol.3
381
referenciar que no ano de 1866, o zoólogo e evolucionista alemão Ernst Haeckel (1834-1919) classificou pela primeira vez os animais quanto à sua simetria.
Por todos os dados apresentados, vamos expressar uma primeira definição de simetria. Simetria é por conseguinte a propriedade pela qual um objeto (figura ou forma) exibe
partes correspondentes quando submetida a uma operação específica. A simetria, portanto, é uma operação que mantém, através de uma determinada transformação, uma forma invariante. As operações específicas são denominadas operações de simetria, ou operadores simétricos. Assim, um objeto (figura ou forma) que possui simetria pode ser convertido nele próprio, a partir de uma de suas partes, ficando numa posição indistinta da outra.
A simetria, no conceito intuitivo tradicional, pode manter a amplitude dos ângulos, ou a forma, ou as distâncias, ou todas. Uma forma com simetria possui, por consequência, uma relação entre as partes de um todo, com o próprio todo, há uma certa regularidade no espaço. Isso tudo reunido dá a “proporção adequada” referenciada pelos gregos.
Os tipos de simetria são as isometrias, que preservam as distâncias, as simetrias semelhantes, que preservam a forma, e as simetrias conformes, que preservam apenas a amplitude dos ângulos, não preservando a forma ou a distância. Todos esses tipos são transformações, ou seja, aplicações bijetivas de um conjunto nele próprio, e em caso mais específico, aplicações dos pontos do plano Euclidiano nos pontos do plano Euclidiano, ou dos pontos do espaço Euclidiano nos pontos do espaço Euclidiano.
A isometria é a simetria baseada nos movimentos de objetos (figuras ou formas) tal que a distância entre quaisquer dois pontos, antes ou depois do movimento, permanece a mesma.
No plano Euclidiano distinguimos as seguintes transformações isométricas: reflexão em reta, ou simplesmente reflexão; translação; rotação e reflexão deslizante, ou translação refletida. Esse resultado, de 1831, também é conhecido por “Teorema da classificação das isometrias” e deve-se ao historiador e geómetra francês Michel Chasles (1793-1880), que desenvolveu trabalhos na área da geometria projetiva.
A transformação identidade é um caso particular da translação, quando o seu vetor associado é o vetor nulo, ou da rotação, quando o ângulo de rotação é nulo. Todas as transformações, distintas da identidade, são resultantes da composição de reflexões. Assim, cada isometria no plano, distinta da identidade, é a composição de no máximo três reflexões. Sendo a translação e a rotação, distintas da identidade, a composição de duas reflexões também distintas.
As isometrias no espaço Euclidiano classificam-se em: reflexão em plano (ou reflexão espacial); translação; rotação em torno de um eixo; reflexão deslizante (ou translação refletida); reflexão rotativa (ou rotorreflexão) e deslocamento helicoidal (ou parafuso), onde cada isometria pode ser representada como, no máximo, a composição de quatro reflexões em planos.
Assim, quer no plano, quer no espaço, temos as seguintes operações de simetria que preservam distâncias: transformação identidade – simetria que fixa todos os pontos de dado conjunto; reflexão – simetria bilateral obtida colocando-se um objeto (figura ou forma) diante de um espelho e considerando-se a forma e a sua imagem. Um objeto (figura ou forma) que possui simetria de reflexão tem, no espaço (plano), um plano (reta) imaginário(a) que o divide em duas partes idênticas, de natureza especular (enantiomorfas); rotação, conhecida como simetria cíclica ou como simetria rotatória – simetria em que a forma, depois de percorridos 360º em torno de um eixo, repete n vezes uma posição congruente no espaço. A rotação tanto pode ser para a direita, rotação dextrógira, como para a esquerda, rotação levógira, pois, do ponto de vista de sua simetria, são a mesma operação; translação – repetição da forma, possuindo dois elementos, o comprimento de translação, ou período, e o sentido; meia-volta no espaço – caso particular da rotação quando o ângulo de amplitude é

2nd Annual International Interdisciplinary Conference, AIIC 2014, 8-12 July, Azores, Portugal Proceedings, Vol.3
382
igual a 180º; inversão central – caracterizada por um ponto imaginário a partir do qual, em uma direção comum, mas em sentido opostos, encontram-se elementos geometricamente iguais; reflexão rotativa – composição da rotação e da reflexão numa mesma operação. Um outro nome dado a essa operação é rotorreflexão; inversão rotativa – uma operação combinada constituída por uma rotação própria seguida de uma inversão. Também conhecida como “rotoinversão”, ou reflexão rotativa. Assim, um eixo de inversão rotatória é um elemento composto que combina a rotação em redor de um eixo com a inversão em torno de um centro; rotação deslizante – combinação das operações de translação e rotação. Também conhecida como translato-rotação, ou deslocamento helicoidal. O operador é um eixo polarizador ou em parafuso (hélice); reflexão deslizante ou translação refletida – combinação de simetrias que conjuga a reflexão com uma translação paralela ao plano de reflexão.
O conjunto de todas as isometrias que aplicam o objeto (figura ou forma) sobre si, no espaço euclidiano, munido da operação composição, forma um grupo. O grupo de todas as isometrias que deixam o objeto (figura ou forma) fixo, no espaço Euclidiano, chama-se grupo de simetria do objeto. Se o grupo de simetria contiver apenas a transformação identidade, o objeto (figura ou forma) é denominado assimétrico.
Um grupo de transformações no espaço Euclidiano diz-se discreto se qualquer ponto do espaço possui um conjunto discreto de imagens pelas transformações do grupo. Os grupos discretos de isometrias do plano são os grupos de simetria de certas figuras ou padrões “regulares” do plano ou do espaço.
Toda a “teoria das simetrias” no plano pode generalizar-se no espaço tridimensional, basta considerar uma figura espacial como qualquer subconjunto do espaço Euclidiano e o seu grupo de simetria como sendo o conjunto de isometrias do espaço que a deixam invariante.
O interesse pelo estudo dos grupos discretos de isometrias do plano e do espaço foi motivado pela noção de cristal proposta por Bravais em 1850. Para Bravais a geometria dos cristais devia-se a uma disposição “regular” dos seus átomos no espaço.
Uma figura geométrica é simplesmente um conjunto de pontos do plano. Na geometria elementar, uma grande parte do estudo é dedicado a figuras como os ângulos, os triângulos, os quadriláteros, etc.
O termo lugar geométrico é muitas vezes utilizado como sinónimo de figura, quando essa figura é descrita através de uma condição que caracteriza os seus pontos. Umas figuras, conforme as propriedades que evidenciamos, são mais interessantes que outras. Por exemplo, se formos ver do ponto de vista das simetrias, um triângulo equilátero é mais interessante que um triângulo escaleno, por possui mais simetrias.
Designamos ornamento a um objeto (figura ou forma) do espaço Euclidiano cujo grupo de simetria é discreto. Ao grupo simétrico de um ornamento damos o nome de grupo ornamental. Dois ornamentos são equivalentes, se os seus grupos ornamentais contêm o mesmo tipo de isometrias. Evidentemente esse conceito de equivalência define uma relação de equivalência no conjunto dos ornamentos.
Distinguimos então os seguintes tipos de grupo discretos de isometrias: o grupo de rosácea; o grupo de friso e o grupo de papel de parede.
O grupo de rosácea, ou grupo finito, é um grupo discreto que não contém translações diferentes da identidade. Esse grupo também é denominado grupo cristalográfico de di-mensão (ou ordem) zero. Existem apenas dois grupos: o grupo cíclico, só com rotações, e o grupo diedral que possui para além das rotações, as reflexões. Os ornamentos correspondentes denominam-se rosáceas. A existência e completa classificação do grupo finito de simetria ou grupo de rosácea foram atribuídas a Leonardo da Vinci, que procurou verificar todas as isometrias que deixam um determinado ornamento invariante.

2nd Annual International Interdisciplinary Conference, AIIC 2014, 8-12 July, Azores, Portugal Proceedings, Vol.3
383
O grupo de friso é um grupo discreto que tem translações diferentes da identidade, mas apenas numa só direção. Esse grupo é também denominado grupo cristalográfico de dimensão (ou ordem) um. Os ornamentos correspondentes denominam-se frisos. Podemos construir 7 tipos de frisos distintos. Os 7 grupos de simetria discretos dos frisos foram deduzidos, independentemente, em 1924, pelo professor e pesquisador húngaro George Polya (1887-1985) e pelo mineralogista suíço Paul Niggli (1888-1953). No ano de 1927 foi deduzido pelo matemático e filósofo das ciências suíço Andreas Speiser (1885-1970).
O grupo de papel de parede, ou grupo de pavimento, é um grupo discreto que possui translações diferentes da identidade em duas direções distintas. Esse grupo é também denominado grupo cristalográfico de dimensão (ou ordem) dois. Os ornamentos correspondentes denominam-se papéis de parede, ou pavimentos. Podemos construir 17 tipos de papéis de parede distintos. A derivação dos 17 grupos de simetria dos papéis de parede foi dado incompleto por Camille Jordan (1838-1922) em 1868/69, que havia descrito 16 de tais grupos, deixando o grupo de simetria indicado por pgg ou W2
4. O professor alemão de física Leonhard Sohncke (1842-1897) descobre, em 1842, o conceito de grupo espacial, e em 1874, Sohncke encontra, como um resultado parcial da dedução dos 230 grupos espaciais, o 17.º grupo que estava em falta.
Entre 1885 e 1890, E. S. Fedorov, estudando cristalografia, encontrou certos grupos de isometrias que atuam sobre todo o plano. Ele demonstrou a existência de unicamente 17 grupos de simetria do plano. Em 1924, G. Pólya e P. Nigghi redescobriram os 17 grupos de Fedorov. Desde então, esses grupos têm sido estudados exaustivamente e aplicados não só à cristalografia, mas também em diversos aspetos de desenho, tais como: mosaicos; pinturas; esculturas; e igualmente na arquitetura.
Muitos trabalhos de arte em muitas culturas e épocas diversas descrevem muitos dos padrões dos papéis de parede. O holandês Maurits Cornelius Escher (1898-1972) é um dos artistas que se beneficiou da classificação matemática dos papéis de parede.
O grupo espacial é um grupo discreto que possui translações diferentes da identidade em três direções distintas. Esse grupo é também denominado grupo cristalográfico de dimensão (ou ordem) três. Os ornamentos correspondentes denominam-se cristais. Existem 230 grupos espaciais distintos e desses 230 grupos espaciais encontrados, os primeiros 65 grupos contém apenas isometrias próprias (grupos rotatórios no espaço) e foram classificados por C. Jordan, em 1869, e por L. Sohncke, em 1879. Desses 65 grupos, um está formado apenas por translações e 22 grupos se apresentam em 11 pares enantiomorfos – elementos com configuração idêntica mas que não podem sobrepor – segundo a torção. Os outros 165 grupos contêm, isometrias impróprias, reflexões em plano, reflexões rotatórias (rotorre-fexões) e reflexões deslizantes A classificação e a enumeração desses 165 grupos foram feitas, independentemente, por E. S. Fedorov na Rússia, em 1890, por A. Schoenflies na Alemanha, em 1891, e por W. Barlow na Inglaterra, em 1894. Os 230 grupos espaciais são obtidos pela combinação dos 32 grupos pontuais – grupos finitos de simetria – com os 14 reticulados espaciais denominados modos de Bravais. Esses reticulados espaciais são determinados pelas três direções e pelas distâncias ao longo das células unidade – unidades formadoras dos cristais, e resultam do arranjo de pontos idênticos no espaço, de modo que algum ponto fosse repetido em intervalos regulares ao longo de cada fileira do padrão do cristal.
C. Jordan, utilizando a teoria dos grupos, descreveu um método para definir todas as maneiras possíveis de repetir regularmente agrupamento idênticos de pontos. Fez uma lista de 174 tipos de grupos incluindo os grupos espaciais. Em 1873, Sohncke aplicou a teoria de Jordan para os espaços de dimensão dois e três, produzindo, de início, uma classificação incompleta.

2nd Annual International Interdisciplinary Conference, AIIC 2014, 8-12 July, Azores, Portugal Proceedings, Vol.3
384
Em 1880, Klein sugeriu ao seu aluno, Schoenflies, o problema de encontrar os grupos cristalográficos no espaço (grupos espaciais), e por volta de 1891, conseguiu a lista completa dos tais 230 grupos. A apresentação dos grupos espaciais foi feita em 1892 com a sua publicação onde usa aspetos da teoria dos grupos. Schoenflies correspondeu-se com Fedorov, que também tinha feito a classificação dos grupos espaciais, e corrigiu alguns erros menores em sua classificação, republicando sua classificação em 1923.
Para além dos ornamentos, como modelos visuais óbvios de grupos de simetria no plano, ou no espaço, são usados diagramas de Arthur Cayley (1821-1895) e tabelas de símbolos gráficos de elementos de simetria elaborados em cristalografia.
A “teoria reticular” de Bravais só foi experimentalmente confirmada em 1911 com a experiência de Max Von Laue (1879-1960), professor de física na Universidade de Munique, que passou um feixe estreito dos raios X através de um cristal de sulfato de cobre. Dois anos mais tarde, em 1913, William Henry Bragg e William Lawrence Bragg, determinam a primeira estrutura de cristal por técnicas de raio-X. As leis de difração de Bragg permitem hoje analisar a estrutura atómica da matéria (nomeadamente cristais) pelos padrões de difração de raio-X, possibilitando aos cristalógrafos reunirem dados para um melhor refinamento da estrutura do cristal. Em 1915, pai e filho receberam o Nobel de Física pelos seus trabalhos. A partir dos seus trabalhos, entre 1924 e 1937, passamos a dispor da possibilidade de desvendar a estrutura das substâncias cristalinas.
Embora do ponto de vista cristalográfico a teoria de Bravais não fosse mais do que pura hipótese, alguns dos seus trabalhos foram apresentados à Academia das Ciência de Paris pelo matemático Augustin Cauchy (1789-1857) tendo chamado a atenção de vários matemáticos da época.
A questão de procurar grupos cristalográficos em uma dimensão superior a três foi de certo modo relevante, motivando David Hilbert (1862-1943), um matemático importante em sua época, a lançar uma pergunta: “ Existe no espaço Euclidiano, de dimensão n, somente um número finito de grupos com uma região fundamental?”
Os casos de dimensão dois e três eram conhecidos, mas, nenhum caso de dimensão mais elevada o era. O alemão Ludwig Bieberbach (1886-1982) resolveu esse problema em 1910. Provou que, em toda dimensão, só havia um número finito de grupos. Não determinou realmente o número em nenhuma dimensão, apenas a questão de serem em número finito.
Passemos agora a transformação de simetria semelhante, ou similar. A ideia transmitida por H. Weyl, em 1952, foi desenvolvida por Aleksei Vasilevic Shunikov (1887-1970), em 1960, e por E. I. Galyarski e Alexander M. Zamorzaev (1927-1997), em 1963.
Existem, de modo geral, apenas três tipos de transformação de simetria semelhante: dilatação central, ou simplesmente dilatação, ou homotetia; dilatação rotativa e reflexão dilatória. Essas transformações são, em dada ordem, isomorfas com as seguintes isometrias existentes no espaço Euclidiano: translação; deslocamento helicoidal e reflexão deslizante.
O último tipo de simetria é a transformação de simetria conforme ou a transformação que preserva as circunferências do plano Euclidiano e as superfícies esféricas no espaço Eu-clidiano. Nessa transformação é preservada a propriedade de equiangularidade, ou seja, de conservação dos ângulos, mas não de equiformidade, que preserva as formas. Para esta simetria podemos utilizar um circunferência de inversão, para o plano Euclidiano, ou a su-perfície esférica, para o espaço Euclidiano, que são os elementos de transformação da simetria conforme. Por exemplo, considerando uma circunferência de inversão e uma reta secante a essa circunferência, a reta, pela inversão, tranforma-se numa circunferência que contém o centro da circunferência de inversão. Por outro lado, a transformada de uma circunferência qualquer, que não passe pelo centro da circunferência de inversão, é também uma circunferência distinta da inicial, caso está não seja ortogonal com a circunferência de inversão.

2nd Annual International Interdisciplinary Conference, AIIC 2014, 8-12 July, Azores, Portugal Proceedings, Vol.3
385
O grupo de simetria conforme é constituido pela pela isometria, pela transformação de simetria semelhante e pela transformação de simetria conforme.
Observamos que a reflexão no plano é um caso particular da inversão, quando consideramos a circunferência de inversão uma circunferência com o seu raio infinito. Também a reflexão no espaço é um caso particular da inversão quando consideramos a superfície esférica de inversão uma superfície esférica com o seu raio infinito.
Todas essas transformações ajudam na aplicação e observação de simetrias. Conclusão
Observamos que podemos encontrar simetrias relacionada com muitas ciências, tais como: na geociência, nomeadamente na cristalografia e na estratigrafia, entre muitos ramos; na biociência, particularmente na zoologia e na botânica; nas ciências ditas exatas como a matemática, a química e a física; na tecnologia; na arquitetura; na música; na literatura; na filosofia da arte e na estética; e em muitas outras áreas do saber.
Na cristalografia, os elementos de simetria mais encontrados nos cristais são: a simetria de translação, que é estrutural; a simetria de reflexão; a simetria de rotação e a simetria de inversão. Também há casos de simetria de inversão rotativa, dilatação, entre outras. Por isso, torna-se interessante o estudo da simetria cristalina, quer pelo aspeto da imensa diversidade de formas que os cristais apresentam, quer pela sua simetria, interna e externa. Na denominada cristalografia geométrica o interesse principal é a classificação de minerais através das suas formas, usando para isto os grupos finitos de isometrias e tendo em atenção a “restrição cristalográfica” segundo a qual só podemos ter rotações de ordem 1, 2, 3, 4 e 6.
A estratigrafia é um ramo da geociência que estuda e interpreta os estratos ou camadas das rochas, ocupando-se da identificação, descrição, sequência horizontal e vertical, mapeamento e conexão das unidades geológicas agrupadas segundo a sua composição físico-química, a sua formação, idade, coberturas, e todas as suas alterações. A simetria surge na estratigrafia quando esta analisa o problema da sucessão vertical dos estratos geológicos.
Na zoologia, apesar da enorme diversidade de formas animais, podemos classificá-las, de um modo geral, em alguns grupos de simetria, tais como: grupo esférico – o organismo tem uma forma esférica, com suas partes dispostas concentricamente ao redor do centro geométrico do animal; grupo radial – o corpo do animal possui a forma de um cilindro heteropolar ou modificações dele, em que o seu eixo principal é de ordem infinita ou muito elevada; grupo bilateral – os animais possuem apenas um plano de simetria que os divide em duas partes especulares. Esta simetria é a mais abundante nos animais superiores, nos mamíferos, répteis e aves. O homem também se inclui nessa simetria; grupo birradial – que apresenta dois planos de simetria perpendiculares entre si, por isso também chamada de dissimetria, em que cada um desses planos divide o animal em metades especulares diferentes entre si; grupo raro – os animais desse grupo possuem uma simetria muitíssimo rara e instável. A astéria (estrela do mar) é um belo exemplo dessa raridade, que possui um eixo de ordem 5, bem como as teias de aranhas que têm uma estrutura e simetria radiais.
Na botânica, a origem da simetria nos vegetais ainda não é conhecida, mas, já foram propostas várias explicações. Inclusive foram sugeridos genes que controlariam a forma e a simetria. É interessante notar que determinadas partes dos vegetais e, até mesmo, vegetais inteiros são, geometricamente, modificações anamórficas de outros vegetais. Nos vegetais superiores, tais como as ervas, arbusto e árvores, o desenvolvimento da simetria está associado a outros fenómenos. Os principais grupos de simetrias observados nos vegetais são: simetria bilateral – um tipo raro de simetria e pode ser encontrada nas algas; simetria de translação – também um tipo raro de simetria e podemos encontrá-la nas bactérias; simetria radial – que reúne o maior número de vegetais simétricos e muitas vezes há modificação

2nd Annual International Interdisciplinary Conference, AIIC 2014, 8-12 July, Azores, Portugal Proceedings, Vol.3
386
nessa simetria pela inclusão de eixos polarizados. Como exemplos temos: os cogumelos, os pinheiros, etc. Nos vegetais superiores, existe um eixo longitudinal raiz-caule que confere ao vegetal a polaridade necessária para enfrentar a desigualdade dos ambientes terrestre e atmosférico; simetria birradial – característica dos bacilos: simetria esférica – encontrada em bactérias e em outros vegetais inferiores. As bactérias podem se reunir, mudando então a sua forma geométrica, mas mantendo a sua simetria.
Na matemática encontramos, para além da área de geometria em que temos: a simetria axial, a simetria rotacional, a simetria pontual, a simetria de translação, muitos exemplos e aplicações de simetria. Os números capicuas são exemplos de simetria: 232, 4321234, etc. Vejamos agora algumas definições envolvendo esse conceito: simetria de uma relação binária – Dizemos que uma relação R no conjunto A é simétrica se, e somente se, quaisquer que sejam dois elementos, X e Y, do conjunto A, o par ordenado (X,Y) pertence a R, então o par ordenado (Y,X) também pertence a R; simétrico de um número – Dado um número ou uma expressão algébrica X, chama-se simétrico, ou oposto, o mesmo X, porém com sinal “trocado”; matriz simétrica – Dizemos que uma matriz é simétrica se é igual à sua transposta; jogo simétrico – Dizemos que um jogo é simétrico quando os dois jogadores, além de disputarem com as mesmas regras, têm a capacidade de usar as mesmas estratégias para vencer ou dominar o adversário.
Novamente na geometria, observamos que os 5 sólidos platónicos possuem todas as faces iguais, arestas iguais, todas as faces possuem o mesmo número de arestas, e todos os ângulos sólidos possuem o mesmo número de arestas.
Sendo a química a ciência que estuda os elementos químicos isolados ou em combinação, as reações, transformações, transmutações e interações de elementos químicos, há naturalmente numerosas conotações de simetria. Classificar as moléculas pelas suas propriedades é habitual mas também complexo. As moléculas, por exemplo, podem ser classificadas em simétricas e assimétricas. Há basicamente duas simetrias envolvidas: a reflexão em plano e a rotação sobre um eixo. Um grupo pontual de simetrias é um método de denotar a combinação de elementos simétricos que a molécula contém.
A física é o ramo das ciências que estuda a matéria e a energia. Dentro da imensa diversificação da física, desde a clássica até a nuclear, há diversas aplicações e deduções que se baseiam em simetrias das mais variadas maneiras. A “teoria da relatividade” e a “teoria quântica” envolvem noções de simetria em seu desenvolvimento. A aplicação da simetria na física conduz a importantes conclusões em determinadas leis físicas. Na física das partículas, considerações de simetria podem ser usadas nas leis de conservação. Observamos que todas as grandezas que se conservam na física são simétricas em relação ao tempo. Damos como exemplo a conservação do movimento linear, a conservação do momento angular, a con-servação da carga e da energia.
A tecnologia utilizada no fabrico de determinados objetos, quer pela indústria, quer pela engenharia mecânica, deve ser de fácil utilização, sendo simples e racionais. Em sua maioria, as partes de uma máquina consistem em formas geométricas específicas ou em combinações dessas formas. Um eixo muito bem trabalhado teria a simetria de um cilindro – corpo ideal geométrico, e o parafuso seria uma helicoidal geométrica exata. A facilidade de uso, a função e o custo, fazem com que todos os objetos fabricados pelo homem sejam simétricos.
Na arquitetura, a simetria utilizada pelos arquitetos nas suas construções visa atingir dois ideais: o primeiro deles é a organização do espaço de uma maneira funcional e o segundo, é a estética, em que a simetria visa buscar, de alguma maneira, o equilíbrio da composição arquitetónica. Da mesma maneira que os minerais, os animais e as plantas são reunidos em grupos que possuem a mesma simetria, os diversos estilos arquitetónicos também podem reunidos, temos assim: o grupo bilateral e o grupo rotatório. O grupo

2nd Annual International Interdisciplinary Conference, AIIC 2014, 8-12 July, Azores, Portugal Proceedings, Vol.3
387
bilateral, mais difundido tanto no tempo como no espaço, possui um plano de simetria que a divide em duas partes especulares, por exemplo o Pantheon, em Roma, e o grupo rotatório, quando o eixo de simetria tem ordem muito alta, aproxima-se da forma circular, como por exemplo o Pentágono, nos Estados Unidos da América, e a torre inclinada de Pisa, na Itália.
Na música, algumas peças, tais como as do compositor Bela Bartok, evidenciam sinais de simetria. Também encontramos na literatura, em alguns textos, ou frases, ilustram o conceito de simetria. Por exemplo: “A man, a plan, a canal, Panamá!” (A M A N A P L A N A C A N A L P A N A M A), ou “Amar tão bem é boa trama.” (A M A R T A O B E M E B O A T R A M A).
Na filosofia da arte e na estética, a simetria é um conceito importante, pois é um dos fatores determinantes da emoção estética, quando se trata de exteriores considerados como belos. A simetria já foi comparada ao ritmo de uma bela sucessão de sons, onde a simetria seria igual a um ritmo estável ou em repouso. Por isso, muitos referenciam a arquitetura como “música congelada”. No passado, as teorias idealistas de beleza, por exemplo, tentavam sempre associá-la às doutrinas de proporção e simetria. Por essa razão, os gregos fizeram tantas menções de números como originadores da beleza, do belo e do sublime. A beleza se tornou, com o passar do tempo, sinónimo de proporção ideal, surgindo o número de ouro, ou razão áurea de valor aproximado 1,618. Atrás dessa proporção viveram Vitruvius, Leonardo, Piero della Francesca, Dürer e tantos outros homens.
De um modo geral, o progresso científico, existente nas diversas áreas do conhecimento, é o resultado do trabalho de muitas pessoas, em muitos lugares e em muitas épocas, o que só vem despertar um interesse ainda maior pelo raciocínio e pela criatividade individual, elementos essenciais em todas as ciências, quer humanas, quer exatas, quer biológicas, entre outras. A procura e a aplicação da simetria contribuem para esse tão desejado progresso acompanhado pela ânsia do belo e do útil.
Referências: Darvas, Gyorgy. Symmetry. Birkhauser Verlang AG, Basel, Switzerland, 2007. Wade, Dave. Symmetry: The ordering Principle. Walker & Company, 2006. Farmer, David D. Grupos e Simetria. Gradiva Publicações, 1999. Armstrong, M. A.. Groups and Symmetry. Springer, England, 1988. Alsina, C. and Trillas, E.. Lecciones de Algebra y Geometria. Editora Gustavo Gili, Barcelona, 1984. Rohde, Geraldo M.. Simetria. Hemus editora limitada, 1982. Ghyka, Matila,. The Geometry of Art and Life. Dover Publications, 2 edition,1977. Pedoe, Dan. Geometry and the Visual Arts. Dover Publications, 2 edition,1976.

2nd Annual International Interdisciplinary Conference, AIIC 2014, 8-12 July, Azores, Portugal Proceedings, Vol.3
388
MATRICES THAT DEFINE SERIES OF PYTHAGOREAN TRIPLES THAT HAVE A TRIANGLE WITH ONE
IRRATIONAL SIDE AS LIMIT
Martin William Bredenkamp Assistant Prof. DSc, MSc, BSc Hons, BSc.,
Asia-Pacific International University, Thailand
Abstract Making use of the universal set of Pythagorean triples, series of triples are defined where triple n + 1 is obtained by multiplying triple n with a specific 3 × 3 matrix. In terms of Pythagorean triangles, the shape of the limiting triangle in these series is a triangle with one of its sides having an irrational ratio with respect to the other sides. These specific matrices may be directly associated with the square roots of uneven positive integers (that are not perfect squares), and also some of the even positive integers since the limit of the powers of these matrices, applied to any 3 × 1 matrix of real numbers leads to a specific right-angled triangle that contains that square root as one of its sides.
Keywords: Series of Pythagorean triples; 3 × 3 matrix operators; square roots as limits Introduction
All relatively prime Pythagorean triples have been defined (Bredenkamp-1, 2013) by indices i and j where i is an uneven positive integer and j is an even positive integer, i and j are relatively prime, and the three sides of the triangle are defined as follows:
u = i2 + ij e = j2/2 + ij h = i2 + ij + j2/2
where u and e are the uneven- and even-numbered legs of the primitive right-angled triangle respectively, and h represents the hypotenuse.
Using this two-dimensional matrix of triangles as a universal set, subsets may be found where, if the triangles are arranged from smallest to greatest, a series of triangles is defined where the limit of the infinite series is a right-angled triangle that has one side irrational with respect to the other two sides (Bredenkamp-2, 2013). The triangles in these series occur with geometric regularity (Bredenkamp-3, 2013), and therefore formulae have been developed that generate the next member of a series.
Berggren (1934) and Price (2008) have shown that there are 3 × 3 matrices that may be used to generate one Pythagorean triple from another. In this paper we will show how that the formulae developed for the series (Bredenkamp-2, 2013) may indeed be expressed as these 3 × 3 matrices, and that these matrices, raised to infinite power, produce the triangles with one side being irrational. The 45º Triangle
The subset of triangles that describes the series of the 45º triangle is A: A = {(i, j)| u = i2 + ij, e = j2/2 + ij, h2 = u2 + e2, and |e - u| = 1, where (i + 1)/2 and j/2 ∈ ℕ}

2nd Annual International Interdisciplinary Conference, AIIC 2014, 8-12 July, Azores, Portugal Proceedings, Vol.3
389
Arranging these triangles in a series that has the component numbers, u, e, h, i and j increasing as the series progresses, enables the next member of the series to be described by an algebraic formula:
For the series (i, j)n: (i, j)n+1 = (in + jn, 2in + jn) (1) Using the definition of u, e and h in terms of i and j, finding the next member of the
series may be described as follows: un+1 = 2ℎ𝑛 + 2𝑒𝑛 + 𝑢𝑛
en+1 = 2ℎ𝑛 + 𝑒𝑛 + 2𝑢𝑛 and hn+1 = 3ℎ𝑛 + 2𝑒𝑛 + 2𝑢𝑛
This may, indeed, be reformulated as a 3 × 3 matrix, retaining the order of (u, e, h) as ordered triplets in the matrix multiplication, and using the (3, 4, 5)-triangle as the first member of the series, which it is, the second triangle in the series is obtained (21, 20, 29):
(3 4 5)�1 2 22 1 22 2 3
� = �212029�
Applying the matrix to the second triangle produces the third (119, 120, 169):
(21 20 29)�1 2 22 1 22 2 3
� = �119120169
�
Therefore the third member of the series may be obtained by the square of the 3×3 matrix:
(3 4 5)�1 2 22 1 22 2 3
�2
= (3 4 5)�9 8 128 9 12
12 12 17� = �
119120169
�
We can therefore formulate a generalized equation for procuring series member n as follows:
(𝑢𝑛 𝑒𝑛 ℎ𝑛) = (3 4 5)�1 2 22 1 22 2 3
�𝑛−1
From there we have (Bredenkamp-2, 2013):
lim𝑛→∞
�ℎ𝑛𝑢𝑛� = √2 and lim
𝑛→∞�ℎ𝑛𝑒𝑛� = √2
The 30/60º Triangle
For the 30/60º triangle a similar course may be pursued: The subset of triangles that describes the series of the 30/60º triangle is B: B = {(i, j)| u = i2 + ij, e = j2/2 + ij, h2 = u2 + e2, and |h - 2u| = 1, where (i + 1)/2 and j/2 ∈ ℕ}
Arranging these triangles in a series as before, enables the next member of the series to be described as follows: For the series (i, j)n: (i, j)n+1 = (in + jn, 2in + 3jn) (2)
Finding the next member of the series may be described as follows: un+1 = 4ℎ𝑛 + 4𝑒𝑛 − 𝑢𝑛
en+1 = 8ℎ𝑛 + 7𝑒𝑛 − 4𝑢𝑛 and hn+1 = 9ℎ𝑛 + 8𝑒𝑛 − 4𝑢𝑛
This may also be reformulated as a 3 × 3 matrix, retaining the order of (u, e, h) as ordered triplets in the matrix multiplication, and starting with the (3, 4, 5)-triangle (n = 1) the second triangle in the series is obtained (33, 56, 65):
(3 4 5)�−1 −4 −44 7 84 8 9
� = �335665�

2nd Annual International Interdisciplinary Conference, AIIC 2014, 8-12 July, Azores, Portugal Proceedings, Vol.3
390
As before, we can formulate a generalized equation for procuring series member n as follows:
(𝑢𝑛 𝑒𝑛 ℎ𝑛) = (3 4 5)�−1 −4 −44 7 84 8 9
�𝑛−1
From there we have (Bredenkamp-2, 2013):
lim𝑛→∞
�𝑒𝑛𝑢𝑛� = √3
An alternative approach to triangles with the 30/60º triangle as limit is as follows (Bredenkamp-2, 2013):
(𝑢𝑛 𝑒𝑛 ℎ𝑛) = (15 8 17)�7 4 8−4 −1 −48 4 9
�𝑛−1
with
lim𝑛→∞
�𝑢𝑛𝑒𝑛� = √3
Other Series with Square Roots of Uneven Numbers as their Limits
Using as limit-triangles the right-angled triangles in the table below, which have the square root of any uneven number as the irrational leg, together with a rational other leg and a rational hypotenuse, new matrices are developed, together with series of rational numbers that have the respective irrational numbers as their limits: hypotenus
e 2 3 4 5 6 7 8 9 10 11 12 13 14 15 16 17
rational leg 1 2 3 4 5 6 7 8 9 10 11 1
2 13 14 15 16
irrational leg √3 √5 √7 3 √11 √13 √15 √17 √19 √21 √23 5 √27 √29 √31 √33
Here follows the starting triangles, matrices, and limit formulae of the first few of
these series, beginning with √5. Note that there are two sets of data for every number. It is also interesting to compare the matrices of these alternate sets:
root Initial triplet matrix Limit formula
√5
(3 4 5) �−9 −8 −128 9 12
12 12 17� lim
𝑛→∞�
2𝑒𝑛𝑢𝑛
� = √5
(3 4 5) �9 8 12−8 −9 −1212 12 17
� lim𝑛→∞
�2𝑢𝑛𝑒𝑛
� = √5
√7
(3 4 5) �−161 −144 −216144 127 192216 192 289
� lim𝑛→∞
�3𝑒𝑛𝑢𝑛
� = √7
(3 4 5) �127 144 192−144 −161 −216192 216 289
� lim𝑛→∞
�3𝑢𝑛𝑒𝑛
� = √7
√11
(15 8 17) �−449 −300 −540300 199 360540 360 649
� lim𝑛→∞
�5𝑒𝑛𝑢𝑛
� = √11
(3 4 5) �199 300 360−300 −449 −540360 540 649
� lim𝑛→∞
�5𝑢𝑛𝑒𝑛
� = √11
Clearly, the complementary matrices for each root have their first and second rows
interchanged, followed by their first and second columns. This is also reflected in the limit formula where the legs are interchanged (first and second rows/columns represent the legs).

2nd Annual International Interdisciplinary Conference, AIIC 2014, 8-12 July, Azores, Portugal Proceedings, Vol.3
391
Further Applications of the Matrices The choice of the initial triangle for a series is in a sense arbitrary. A limit is set on
the differences of the operational outcomes of the sides that are involved with the limit, which is less than or equal to one. When that limit is increased, more triangles qualify as the starting points of series of triangles, and as the triangles increase in size in the series, all these series have the same triangle as their limit. Even with 1 as the limit, some square roots have several series (Bredenkamp-2, 2013). As an example, using the 45º matrix, but beginning with the (5, 12, 13)-triangle, a series develops that still has the 45º triangle as its limit:
(5 12 13)�1 2 22 1 22 2 3
� = �554873�
The series then is: {(5, 12, 13); (55, 48, 73); (297, 304, 425); (1755, 1748, 2477); (10205, 10212, 14437); .....} Notice the difference between the legs is 7 throughout, which means as the triangles increase in size, so the difference of 7 between the legs becomes less significant, and the triangle approaches the shape of the 45º triangle.
It turns out that any numbers may be used as the initial 3 × 1 matrix, and the limit still is the 45º triangle. If negative numbers are incorporated in the matrix, the series of triangles may become triangles with negative sides, but the proportions of these negative sides still have the 45º triangle as the limit. Consider the following example, and notice that the difference in the “legs” remains 12 throughout: {(-10, 2, -4); (-14, -26, -28); (-122, -110, -164); (-670, -682, -956); (-3946, -3934, -5572); .....} Even irrational numbers may be used: {(√2, π, √7); (12.9889, 11.2615, 17.0489); (69.6097, 71.3371, 99.6474); (408.1239, 409.8513, 580.8358); (2389.4982, 2387.7708, 3378.4579); …..} Even here the “legs” remain within less than two from each other, and as the numbers increase, that difference becomes insignificant. Conclusion Matrices that Define Square Roots.
F or the series of triangles that have as their limit the 45º triangle, one of the three Berggren matrices (Berggren, 1934),
�1 2 22 1 22 2 3
�
is used to propagate the series, the initial triangle being the (3, 4, 5) triangle. It so happens that any real number may be used in the three slots of the initial 3 × 1 matrix [in the place of the triple for the (3, 4, 5) triangle], and the limit still becomes the 45º triangle (sometimes with negative sides). The ratio of the largest number to either of the smaller numbers has as its limit √2. The Berggren 3 × 3 matrix may therefore be associated with √2 and may even be called the √2 matrix.
In the same way, every uneven number that is not a perfect square has a matrix associated with its root. Some of the even numbers, by similar procedures, also have matrices associated with their roots, since by using other triangles these square roots are implicated (Bredenkamp-2, 2013). There is therefore an infinite number of 3 × 3 matrices that relate Pythagorean triples with each other, but these matrices may also be used to describe a series of 1 × 3 matrices that have as their limits ratios that describe the same irrational numbers, irrespective of the initial real numbered 1 × 3 matrix.

2nd Annual International Interdisciplinary Conference, AIIC 2014, 8-12 July, Azores, Portugal Proceedings, Vol.3
392
References: Berggren, B. Pytagoreiska trianglar (in Swedish), Tidskrift för elementär matematik, fysik och kemi, 1934, 17, 129-139. Bredenkamp-1, Martin W. Theorem on a Matrix of Right-Angled Triangles, Applied and Computational Mathematics, 2013, 2, 36-41. Bredenkamp-2, Martin W. Series of Primitive Right-Angled Triangles, Applied and Computational Mathematics, 2013, 2, 42-53. Bredenkamp-3, Martin W. Geometric Series of Numbers Approximating Positive Integers, Pure and Applied Mathematics Journal, 2013, 2, 79-93. Price, H.L. The Pythagorean Tree: A New Species, 2008, arXiv:0809.4324 [math.HO]. (http://en.wikipedia.org/wiki/Formulas_for_generating_Pythagorean_triples)

2nd Annual International Interdisciplinary Conference, AIIC 2014, 8-12 July, Azores, Portugal Proceedings, Vol.3
393
CONTRIBUTION TO IMPULSIVE EQUATIONS
Berrabah Fatima Zohra, MA University of sidi bel abbes/ Algeria
Abstract In this paper, we show the validity of the method of upper and lower solutions to obtain an existence result for a first order impulsive differential equations with variable moments.
Keywords: Impulsive differential equation, variable times, upper and lower solutions. Introduction
In this paper we will consider the following system of differential equations with impulses at variable times: I. The investigation of theory of impulsive differential equations with variable moments of time is more difficult than the impulsive differential equations with fixed moments. This paper concerns the existence of solutions for the functional differential equations with impulsive effects at variable times. We consider the first order initial value problem (IVP for short):
𝑦′(𝑡) = 𝑓�𝑡,𝑦(𝑡)� 𝑎. 𝑒 𝑡 ∈ [0,𝑇], 𝑡 ≠ 𝜏𝑘�𝑦(𝑡)�,𝑘 = 1, …𝑚 𝑦(𝑡+) = 𝐼𝑘�𝑦(𝑡)� 𝑡 = 𝜏𝑘�𝑦(𝑡)�, 𝑘 = 1, … ,𝑚 (1,1)
𝑦(𝑡) = 𝜑(𝑡) 𝑡 ∈ [−𝑟, 0] Here 𝑓: [0,𝑇) × 𝐷 → ℝ𝑛 is a given function. We let
𝐷 = {𝜓: [−𝑟, 0] → ℝ𝑛,𝜓 𝑖𝑠 𝑐𝑜𝑛𝑡𝑖𝑛𝑢𝑜𝑢𝑠 𝑒𝑣𝑒𝑟𝑦𝑤ℎ𝑒𝑟𝑒 𝑒𝑥𝑐𝑒𝑝𝑡 𝑓𝑜𝑟 𝑎 𝑓𝑖𝑛𝑖𝑡𝑒 𝑛𝑢𝑚𝑏𝑒𝑟 𝑜𝑓 𝑝𝑜𝑖𝑛𝑡𝑠 𝑡̅ 𝑎𝑡 𝑤ℎ𝑖𝑐ℎ 𝜓(𝑡)̅𝑎𝑛𝑑 𝜓(𝑡̅+) 𝑒𝑥𝑖𝑠𝑡,𝑎𝑛𝑑 𝜓(𝑡̅−) = 𝜓(𝑡̅)}
𝜑 ∈ 𝐷 ; 0 < 𝑟 < ∞, 𝜏𝑘:ℝ𝑛 → ℝ, 𝐼𝑘:ℝ𝑛 → ℝ𝑛,𝑘 = 1, … ,𝑚 are given functions satisfying some assumptions that will be specified later. Impulsive differential equations have been studied extensively in recent years. Such equations arise in many applications such as spacecraft control, impact mechanics, chemical engineering and inspection process in operations research. Especially in the area of impulsive differential equations and inclusions with fixed moments; see the monographs of Bainov and Simeonov, Lakshmikantham et al, and Samoilenko and Perestyuk, the papers of Benchohra et al and the references therein. The theory of impulsive differential equations with variable time is relatively less developed due to the difficulties created by the state-dependent impulses. Recently, some interesting extensions to impulsive differential equations with variable times have been done by Bajo and Liz, Frigon and O’Regan, Kaul et al, Kaul and Liu, Lakshmikantham et al, Liu and Ballinger and the references cited therein. Preliminaries Consider
Ωa = {y: [a − r, T] → ℝn, 𝑎 − 𝑟 < 𝑇,𝑦(𝑡) 𝑖𝑠 𝑐𝑜𝑛𝑡𝑖𝑛𝑢𝑜𝑢𝑠 𝑒𝑣𝑒𝑟𝑦𝑤ℎ𝑒𝑟𝑒 𝑒𝑥𝑐𝑒𝑝𝑡 𝑓𝑜𝑟 𝑠𝑜𝑚𝑒 𝑡𝑘𝑎𝑡 𝑤ℎ𝑖𝑐ℎ 𝑦(𝑡𝑘−)𝑎𝑛𝑑 𝑦(𝑡𝑘+),𝑘 = 1, … ,𝑚 𝑒𝑥𝑖𝑠𝑡 𝑎𝑛𝑑 𝑦(𝑡𝑘−) = 𝑦(𝑡𝑘)}

2nd Annual International Interdisciplinary Conference, AIIC 2014, 8-12 July, Azores, Portugal Proceedings, Vol.3
394
𝛺𝑎1 = { 𝑦 ∈ 𝛺𝑎, 𝑦 𝑖𝑠 𝑑𝑖𝑓𝑓𝑒𝑟𝑒𝑛𝑡𝑖𝑎𝑏𝑙𝑒 𝑎𝑙𝑚𝑜𝑠𝑡 𝑒𝑣𝑒𝑟𝑦𝑤ℎ𝑒𝑟𝑒 𝑜𝑛 [𝑎 − 𝑟,𝑇),𝑎𝑛𝑑 𝑦′ ∈ 𝐿𝑙𝑜𝑐1 [𝑎 − 𝑟,𝑇)}
𝐴𝐶𝑙𝑜𝑐([0,𝑇),ℝ𝑛) 𝑖𝑠 𝑡ℎ𝑒 𝑠𝑒𝑡 𝑜𝑓 𝑓𝑢𝑛𝑐𝑡𝑖𝑜𝑛𝑠 𝑦 ∈ 𝐶([0,𝑇),ℝ𝑛 𝑤ℎ𝑖𝑐ℎ 𝑎𝑟𝑒 𝑎𝑏𝑠𝑜𝑙𝑢𝑡𝑒𝑙𝑦 𝑐𝑜𝑛𝑡𝑖𝑛𝑢𝑜𝑢𝑠 𝑜𝑛 𝑒𝑣𝑒𝑟𝑦 𝑐𝑜𝑚𝑝𝑎𝑐𝑡 𝑠𝑢𝑏𝑠𝑒𝑡 𝑜𝑓 [0,𝑇)
Throughout this section we will assume that the following conditions hold: • H1) 𝑓: [0,𝑇) × 𝐷 → ℝ𝑛 is an 𝐿𝑙𝑜𝑐1 [0,𝑇) − 𝐶𝑎𝑟𝑎𝑡ℎé𝑜𝑑𝑜𝑟𝑦 function, by this we mean
a) The map 𝑡 → 𝑓(𝑡,𝑦) is measurable for all 𝑦 ∈ 𝐷 b) The map 𝑦 → 𝑓(𝑡,𝑦) is continuous almost all 𝑡 ∈ [0,𝑇)
c) Foe each 𝑟 > 0 there exists 𝜇𝑟 ∈ 𝐿𝑙𝑜𝑐1 [0,𝑇) such that |𝑦| < 𝑟 implies |𝑓(𝑡,𝑦)| ≤ 𝜇𝑟(𝑡) for almost all 𝑡 ∈ [0,𝑇)
• H2) the functions 𝜏𝑘 ∈ 𝐶1(ℝ𝑛,ℝ) for 𝑘 = 1, … ,𝑚. Moreover 0 < 𝜏1(𝑥) < 𝜏2(𝑥) < ⋯ < 𝜏𝑚(𝑥) < 𝑇 𝑓𝑜𝑟 𝑎𝑙𝑙 𝑥 ∈ ℝ𝑛
• H3) there exist constants 𝑐𝑘 such that |𝐼𝑘(𝑥)| ≤ 𝑐𝑘, 𝑘 = 1, … ,𝑚, for each 𝑥 ∈ ℝ𝑛. • H4) |𝑓(𝑡, 𝑦)| ≤ 𝑞(𝑡)𝜓(|𝑦|)
For almost all 𝑡 ∈ [0,𝑇) with 𝜓: [0,∞) → (0,∞) a Borel measurable function; 1
𝜓∈ 𝐿𝑙𝑜𝑐1 [0,∞) and
𝑞 ∈ 𝐿𝑙𝑜𝑐1 ([0,∞),ℝ+) and
� 𝑞(𝑠)𝑑𝑠𝑡∗
0< �
𝑑𝑢𝜓(𝑢)
∞
𝜑(0) 𝑓𝑜𝑟 𝑎𝑛𝑦 𝑡∗ < 𝑇 𝑎𝑛𝑑 𝜑(0) = 𝜑0
• H5) for all (𝑡, 𝑥) ∈ [0,𝑇] × ℝ𝑛 and for all 𝑦𝑡 ∈ 𝐷 ⟨𝜏′𝑘(𝑥),𝑓(𝑡,𝑦𝑡)⟩ ≠ 1 𝑓𝑜𝑟 𝑘 = 1, … ,𝑚
Where ⟨. , . ⟩ denotes the scalar product in ℝ𝑛. • H6) for all 𝑥 ∈ ℝ𝑛
𝜏𝑘�𝐼𝑘(𝑥)� ≤ 𝜏𝑘(𝑥) < 𝜏𝑘+1�𝐼𝑘(𝑥)� 𝑓𝑜𝑟 𝑘 = 1, … ,𝑚 Theorem 1 under the assumptions (H1)-(H6), the problem (1.1) has at least one solution on [0,T] Proof. The proof will be given in several steps; Step 1; Consider the problem
𝑦′(𝑡) = 𝑓(𝑡,𝑦𝑡) 𝑎. 𝑒 𝑡 ∈ [0,𝑇) 𝑦(𝑡) = 𝜑(𝑡) 𝑡 ∈ [−𝑟, 0] (1.2)
which will be needed when we examine the IDE (1.1) we use the Schauder-Tychonoff theorem to establish existence results of (1.2) for completeness we state the fixed point result. Theorem 2 Let 𝐾 be a closed convex subset of a locally convex linear topological space 𝐸 . Assume that 𝑓:𝐾 → 𝐾 is continuous and that 𝑓(𝐾) is relatively compact in 𝐸. Then 𝑓 has at least one fixed point in 𝐾. Transform the problem (1.2) into a fixed point problem. Consider the operator 𝑁:𝛺0 → 𝛺0 defined by
𝑁(𝑦)(𝑡) =
⎩⎨
⎧𝜑(𝑡) 𝑡 ∈ [−𝑟, 0]
𝜑(0) + � 𝑓(𝑠,𝑦𝑠)𝑑𝑠 𝑡 ∈ [0,𝑇]𝑡
0
Let 𝐾 = {𝑦 ∈ 𝛺0: |𝑦(𝑡)| ≤ 𝑏(𝑡), 𝑡 ∈ [0,𝑇)}

2nd Annual International Interdisciplinary Conference, AIIC 2014, 8-12 July, Azores, Portugal Proceedings, Vol.3
395
Where
𝑏(𝑡) = 𝐽−1 �� 𝑞(𝑥)𝑑𝑥𝑡
0�
𝐽(𝑧) = �𝑑𝑥𝜓(𝑥)
𝑧
𝜑0
Notice 𝐾 is a closed, convex, bounded subset of 𝛺0. We next claim that 𝑁 maps 𝐾 into 𝐾. To see this let 𝑦 ∈ 𝐾. Notice for 𝑡 < 𝑇 that
|𝑁𝑦(𝑡)| ≤ |𝜑0| + � 𝑞(𝑠)𝜓(|𝑦(𝑠)|)𝑑𝑠𝑡
0≤ |𝜑0| + � 𝑞(𝑠)𝜓�𝑏(𝑠)�𝑑𝑠
𝑡
0
= |𝜑0| + � 𝑏′(𝑠)𝑑𝑠𝑡
0= 𝑏(𝑡)
Thus, 𝑁𝑦 ∈ 𝐾 and so 𝑁:𝐾 → 𝐾. It remains to show that 𝑁:𝛺0 → 𝛺0 is continuous and completely continuous.
Claim I: is continuous
Claim II: maps bounded set into bounded set in 𝛺0
Claim III: maps bounded sets into equicontinuous sets of 𝛺0 As a consequence of Claims I to III together with the Arzela-Ascoli
theorem we can conclude that 𝑁:𝛺0 → Ω0 is completely continuous. The Schauder-Tychonoff theorem implies that 𝑁 has a fixed point in , i.e. (1.2) has a solution 𝑦 ∈ 𝛺0. denote this solution by 𝑦1. Define the function
𝑟𝑘,1(𝑡) = 𝜏𝑘�𝑦1(𝑡)� − 𝑡, 𝑡 ∈ [0,𝑇] (H2) implies that
𝑟𝑘,1(0) ≠ 0 𝑓𝑜𝑟 𝑘 = 1, … ,𝑚 If 𝑟𝑘,1 ≠ 0 on [0,𝑇], 𝑘 = 1, … ,𝑚; i,e. 𝑡 ≠ 𝜏𝑘(𝑦1(𝑡)) on [0,𝑇] and for 𝑘 = 1, … ,𝑚; then
𝑦1 is a solution of problem (1.1). It remains to consider the case when
𝑟1,1(𝑡) = 0 𝑓𝑜𝑟 𝑠𝑜𝑚𝑒 𝑡 ∈ [0,𝑇] Since 𝑟1,1(0) ≠ 0 and 𝑟1,1 is continuous, there exists 𝑡1 > 0 such that 𝑟1,1(𝑡1) = 0 and 𝑟1,1(𝑡) ≠ 0 for all 𝑡 ∈ [0, 𝑡1). Thus by (H2) we have 𝑟𝑘,1(𝑡) ≠ 0, for all 𝑡 ∈ [0, 𝑡1) and
𝑘 = 1, … ,𝑚.
Impulsive Functional Differential Equations In this section various existence results are established for the impulsive functional
differential equation 𝑦′(𝑡) = 𝑓(𝑡,𝑦𝑡) 𝑎. 𝑒 𝑡 ∈ [𝑡1,𝑇] 𝑦(𝑡1+) = 𝐼1�𝑦1(𝑡1)� (2.1) 𝑦(𝑡) = 𝑦1(𝑡) 𝑡 ∈ [𝑡1 − 𝑟, 𝑡1]
Transform problem (2.1) into a fixed point problem. Consider the operator 𝑁1:𝛺𝑡1 → 𝛺𝑡1 defined by
𝑁1(𝑦)(𝑡) =
⎩⎪⎨
⎪⎧ 𝑦1(𝑡) 𝑖𝑓 𝑡 ∈ [0, 𝑡1]
𝐼1�𝑦(𝑡1)� + � 𝑓(𝑠,𝑦𝑠)𝑑𝑠 𝑖𝑓 𝑡 ∈ (𝑡1,𝑇]𝑡
𝑡1

2nd Annual International Interdisciplinary Conference, AIIC 2014, 8-12 July, Azores, Portugal Proceedings, Vol.3
396
As in section 1, we can show that 𝑁1 is completely continuous. and the set 𝐾1 = {𝑦 ∈ 𝛺𝑡1 , |𝑦(𝑡)| ≤ 𝑏(𝑡), 𝑡 ∈ [𝑡1 − 𝑟,𝑇]}
is closed, convex, bounded subset of 𝛺𝑡1where
𝑏(𝑡) = 𝐽−1 �� 𝑞(𝑥)𝑑𝑥𝑡
𝑡1�
𝐽(𝑧) = �𝑑𝑥𝜓(𝑥)
𝑧
𝜑0
Thus 𝑁1:𝐾1 → 𝐾1. As a consequence of the Schauder-Tychonoff theorem, we deduce that 𝑁1 has a fixed point 𝑦 which is a solution to problem (2.1). Denote this solution by 𝑦2.
Define 𝑟𝑘,2(𝑡) = 𝜏𝑘�𝑦2(𝑡)� − 𝑡 𝑓𝑜𝑟 𝑡 ≥ 𝑡1
If 𝑟𝑘,2(𝑡) ≠ 0 𝑜𝑛 (𝑡1,𝑇], 𝑓𝑜𝑟 𝑎𝑙𝑙 𝑘 = 1, … ,𝑚
Then
𝑦(𝑡) = � 𝑦1(𝑡) 𝑖𝑓 𝑡 ∈ [0, 𝑡1],
𝑦2(𝑡) 𝑖𝑓 𝑡 ∈ (𝑡1,𝑇]
is a solution of problem (2.1). It remains to consider the case when there exists 𝑡 > 𝑡1 with
𝑟𝑘,2(𝑡) = 0, 𝑘 = 1, … ,𝑚 by (H6) we have
𝑟𝑘,2(𝑡1+) = 𝜏𝑘�𝑦2(𝑡1+)� − 𝑡1 = 𝜏𝑘 �𝐼1�𝑦1(𝑡1)�� − 𝑡1 > 𝜏𝑘−1�𝑦1(𝑡1)� − 𝑡1
≥ 𝜏1�𝑦1(𝑡1)� − 𝑡1 = 𝑟1,1(𝑡1) = 0 Since 𝑟𝑘,2 is continuous, there exists 𝑡2 > 𝑡1 such that
𝑟𝑘,2(𝑡2) = 0, 𝑟𝑘,2(𝑡) ≠ 0 𝑓𝑜𝑟 𝑎𝑙𝑙 𝑡 ∈ (𝑡1, 𝑡2) Suppose now that there is 𝑡∗ ∈ (𝑡1, 𝑡2) such that
𝑟1,2(𝑡∗) = 0 from (H6), it follows that
𝑟1,2(𝑡1+) = 𝜏1�𝑦2(𝑡1+)� − 𝑡1 = 𝜏1 �𝐼1�𝑦1(𝑡1)�� − 𝑡1 ≤ 𝜏1�𝑦1(𝑡1)� − 𝑡1 = 𝑟1,1(𝑡1) = 0
Thus the function 𝑟1,2 attains a nonnegative maximum at some point 𝑡1∗ ∈ (𝑡1,𝑇] . Since
𝑦′2(𝑡) = 𝑓(𝑡,𝑦2(𝑡)) Then
𝑟′1,2(𝑡1∗) = 𝜏′1�𝑦2(𝑡1∗)�𝑦′2(𝑡1∗) − 1 = 𝜏′1�𝑦2(𝑡1∗)�𝑓�𝑡1∗,𝑦2(𝑡1∗)� − 1 = 0 Therefore
⟨𝜏′1�𝑦2(𝑡1∗)�,𝑓(𝑡1∗,𝑦2(𝑡1∗))⟩ = 1 which is a contradiction by (H5).
Continue this process and the result of the theorem follows. Observe that if 𝑇 < ∞ the process will stop after a finite number of steps taking into account that 𝑦𝑚+1 ≔ 𝑦│[𝑡𝑚,𝑇] is a solution to the problem
𝑦′(𝑡) = 𝑓(𝑡,𝑦𝑡) 𝑎. 𝑒 𝑡 ∈ (𝑡𝑚,𝑇) 𝑦(𝑡𝑚+) = 𝐼𝑚�𝑦𝑚−1(𝑡𝑚)� (3.1) 𝑦(𝑡) = 𝑦𝑚−1(𝑡) 𝑡 ∈ [𝑡𝑚 − 𝑟, 𝑡𝑚]

2nd Annual International Interdisciplinary Conference, AIIC 2014, 8-12 July, Azores, Portugal Proceedings, Vol.3
397
The solution 𝑦 of the problem (1.1) is then defined by
𝑦(𝑡) = �
𝑦1(𝑡) 𝑖𝑓 𝑡 ∈ [−𝑟, 𝑡1]𝑦2(𝑡) 𝑖𝑓 𝑡 ∈ (𝑡1, 𝑡2]
⋮𝑦𝑚+1(𝑡) 𝑖𝑓 𝑡 ∈ (𝑡𝑚,𝑇]
References: Bainov D. D. & Dishliev A. B., Sufficient condition for absence of beating in systems of differential equations with impulse, Appl. Anal. 18 (1984), 67-73. Bainov D. D. & Dishliev A. B., Conditions for the absence of phenomenon beating for systems of impulse differential equations, bull. Inst. Math. Acad. Sinica. 13(1985), 237-256. Bainov D. D. & Simeonov P. S., Systems with Impulse Effect, Stability Theory and Applications. Ellis Horwood, Chichester (1989). Benchohra M., Henderson J., Ntouyas S. & Ouahab A., Impulsive Functional Differential Equations with Variable Times, Computers & Mathematics with Applications. 47(2004), no. 10-11, 1659-1665. Benchohra M., Henderson J., Ntouyas S. & Ouahab A., Impulsive functional dynamic equations on time scales with infinity delay, Dynam. Systems and Appl. 14(2005), no. 1-10. Franco D., Liz E. & Nieto J. J. A contribution to the study of functional differential equations with impulses, Math. Nachr. 28(2000), 49-60. Frigon M. & O'Regan D., Impulsive Differential Equations with Variable Times. Nonlinear Analysis: Theory, Methods & Applications, 26(12):1913-1922, 1996. Granas and J. Dugundji, Fixed Point Theory. SpringerMonographs inMathematics, Springer, New York, 2003. Lakshmikantham V., Bainov D. D. & Simeonov P. S., Theory of Impulsive Differential Equations. World Scientific Press, Singapore (1989). Samoilenko A. M. & Perestyuk, Impulsive Differential Equations. World Scientific, Singapore (1995). Vatsala A. S. & Sun Y., Periodic boundary value problem of impulsive differential equations, Applacable Analysis. 44(1992), no.3-4, 145-158.

2nd Annual International Interdisciplinary Conference, AIIC 2014, 8-12 July, Azores, Portugal Proceedings, Vol.3
398
WHY CASTING OUT NINES?
Ana Paula Garrão, PhD Universidade dos Açores,/Departamento de Matemática, Portugal
Margarida Raposo Dias, PhD Universidade dos Açores,/CMATI, Departamento de Matemática, Portugal
Abstract: In this paper our purpose is to answer questions like: Why casting out nines works? Why it fails? Why casting out nines and not, for example, “casting out elevens”? The casting out nines method was used to “check” the results of operations on positive integers. Although not currently taught in elementary school it hides mathematical concepts that will help to understand important current applications such as internet security. We present the mathematical concepts behind the casting out nines method: some tests for computing remainders and the congruence relation modulo n and its properties.
Keywords: Divisibility; Congruence relation modulo n; Remainder in integer division. Introduction Casting out nines method was a well known process since elementary school, used to “check” the results of operations on positive integers. Currently it is not used, but it hides many mathematical concepts such as divisibility, decimal decomposition of an integer number and congruences, used in important current applications such as internet security. In this paper our purpose is to answer questions like: Why casting out nines works? Why it fails? Why casting out nines and not, for example, “casting out elevens”? In section 2 we present the mathematical concepts behind the casting out nines method: the congruence relation modulo n and its properties and some tests of divisibility. The casting out nines method is a particular case of casting out n method, 𝑛 ∈ ℕ, described in section 3. In section 4 we try to answer why, traditionally, the preferred is n=9 (casting out nines). 2. Remainder in integer division
Tests for the correctness of operations on integers, as casting out nines, are based in finding the remainder in integer division. In this section we present the mathematical ideas behind those processes.
Proposition 2.1Let a and n be integer numbers, with 𝑛 ≠ 0. Then exists two integers q (quotient) and r (remainder), uniquely determined, such that
𝑎 = 𝑛𝑞 + 𝑟, with 0 ≤ 𝑟 < |𝑛|. Notice that in integer division of one number a by n, one can get the remainder
removing from a the largest multiple of the n lower than a. An integer number a is said to be divisible by an integer number 𝑛 ≠ 0 (or that n
divides a), and we denote this by 𝑛|𝑎, if the remainder, r, of the division of a by n is zero. The following properties are the mathematical justification of the technique used in
casting out n. Proposition 2.2 Let 𝑛 ≠ 0 be an integer number and 𝜌:ℤ → {0,1, … , 𝑛 − 1} the map
where 𝜌(𝑥) is the remainder of the division of x by n. Then:

2nd Annual International Interdisciplinary Conference, AIIC 2014, 8-12 July, Azores, Portugal Proceedings, Vol.3
399
(i) 𝜌(𝑥) = 𝜌(𝑦) if and only if 𝑛|(𝑥 − 𝑦); (ii) 𝜌(𝑥 ± 𝑦) = 𝜌�𝜌(𝑥) ± 𝜌(𝑦)�; (iii) 𝜌(𝑥𝑦) = 𝜌�𝜌(𝑥)𝜌(𝑦)�. Proof: Let 𝑥,𝑦 ∈ ℤ. By the division algorithm, we have 𝑥 = 𝑛𝑞1 + 𝜌(𝑥) and 𝑦 = 𝑛𝑞2 + 𝜌(𝑦), with 𝑞1, 𝑞2 ∈ ℤ. (i) Then 𝑥 − 𝑦 = 𝑛(𝑞1 − 𝑞2) + 𝜌(𝑥) − 𝜌(𝑦) (1) . If 𝜌(𝑥) = 𝜌(𝑦) from (1) we have 𝑛|(𝑥 − 𝑦). If 𝑛|(𝑥 − 𝑦), in (1) 𝜌(𝑥) − 𝜌(𝑦) = 0, thus 𝜌(𝑥) = 𝜌(𝑦). (ii) Then 𝑥 ± 𝑦 = 𝑛(𝑞1 ± 𝑞2) + 𝜌(𝑥) ± 𝜌(𝑦) (2) . If 𝜌(𝑥) ± 𝜌(𝑦) ≥ 𝑛 or 𝜌(𝑥) ± 𝜌(𝑦) < 0 then exists 𝑞3 ∈ ℤ such that 𝜌(𝑥) ± 𝜌(𝑦) = 𝑛𝑞3 + 𝜌(𝜌(𝑥) ± 𝜌(𝑦)). So we have from (2) 𝑥 ± 𝑦 = 𝑛(𝑞1 ± 𝑞2 + 𝑞3) + 𝜌(𝜌(𝑥) ± 𝜌(𝑦)) . Thus 𝜌(𝑥 ± 𝑦) = 𝜌�𝜌(𝑥) ± 𝜌(𝑦)�. (iii) Then 𝑥𝑦 = 𝑛𝑞′ + 𝜌(𝑥)𝜌(𝑦) with 𝑞′ = 𝑛𝑞1𝑞2 + 𝑞1𝜌(𝑦) + 𝑞2𝜌(𝑥). (3) If 𝜌(𝑥)𝜌(𝑦) ≥ 𝑛 then exists 𝑞3 ∈ ℤ such that 𝜌(𝑥)𝜌(𝑦) = 𝑛𝑞3 + 𝜌(𝜌(𝑥)𝜌(𝑦)). So we have from (3) 𝑥𝑦 = 𝑛(𝑞′ + 𝑞3) + 𝜌(𝜌(𝑥)𝜌(𝑦)) . Thus 𝜌(𝑥𝑦) = 𝜌�𝜌(𝑥)𝜌(𝑦)�.
Example 2.3 Let x=15 and y=23. 1. If n=6 then 𝜌(𝑥) = 3 , 𝜌(𝑦) = 5. We have 𝜌(𝑥 + 𝑦) = 𝜌(38) = 2 and 𝜌�𝜌(𝑥) + 𝜌(𝑦)� = 𝜌(8) = 2. 𝜌(𝑥 − 𝑦) = 𝜌(−8) = 4 and 𝜌�𝜌(𝑥) − 𝜌(𝑦)� = 𝜌(−2) = 4 . 𝜌(𝑥𝑦) = 𝜌(345) = 3 and 𝜌�𝜌(𝑥)𝜌(𝑦)� = 𝜌(15) = 3 . 2. If n=9 then 𝜌(𝑥) = 6 , 𝜌(𝑦) = 5. We have 𝜌(𝑥 + 𝑦) = 𝜌(38) = 2 and 𝜌�𝜌(𝑥) + 𝜌(𝑦)� = 𝜌(11) = 2. 𝜌(𝑥 − 𝑦) = 𝜌(−8) = 1 and 𝜌�𝜌(𝑥) − 𝜌(𝑦)� = 𝜌(1) = 1 . 𝜌(𝑥𝑦) = 𝜌(345) = 3 and 𝜌�𝜌(𝑥)𝜌(𝑦)� = 𝜌(30) = 3 . The operation of finding the remainder of the division between integer numbers can
be referred as the modulo operation. In this case the remainder of the division of a by a fixed positive integer number n, is denoted by 𝑎(𝑚𝑜𝑑 𝑛).
Furthermore if 𝑎(𝑚𝑜𝑑 𝑛) = 𝑏(𝑚𝑜𝑑 𝑛) we say that a is congruent to b modulo n, and it is denoted by 𝑎 ≡ 𝑏 (𝑚𝑜𝑑 𝑛).
For example, we have 24 ≡ 51 (𝑚𝑜𝑑 9) since, with n=9 , 𝜌(24) = 𝜌(51) = 6. Thus Proposition 2.2 can be expressed in terms of the congruence relation modulo n. In fact the congruence relation modulo n identifies two integers if and only if their
difference is a multiple of n , thus it may be regarded as an “equality” up to multiples of n . The items (ii) and (iii) can be expressed as: the modulo of a sum is the modulo of the sum of the modulos, as well as, the modulo of a product is the modulo of the product of modulos.
The congruence relation modulo n is an equivalence relation compatible with the operations of addition and multiplication. This congruence relation and its properties allow us to find the remainder in integer division without having to explicitly carry out the division.
Proposition 2.4 Let 𝑧 = 𝑎𝑛𝑎𝑛−1 … 𝑎1𝑎0, be an integer number written in base 10. The remainder of the division of z:
(i) by 9 (or by 3, respectively) is the remainder of the division of the sum of its digits by 9 (or by 3, respectively);
(ii) by 2 (or by 5, respectively) is the remainder of the division of its rightmost digit by 2 (or by 5, respectively);

2nd Annual International Interdisciplinary Conference, AIIC 2014, 8-12 July, Azores, Portugal Proceedings, Vol.3
400
(iii) by 4 (or by 25, respectively) is the remainder of the division of the number formed by its last two digits by 4 (or by 25, respectively);
(iv) by 11 is the remainder of the division of the sum of its digits taken with alternating signs, 𝑎0 − 𝑎1 + 𝑎2 − ⋯+ (−1)𝑛𝑎𝑛 , by 11.
Proof: (i) Let 𝑧 = 𝑎𝑛𝑎𝑛−1 … 𝑎1𝑎0, be an integer number written in base 10. Then 𝑧 = 𝑎𝑛. 10𝑛+𝑎𝑛−1. 10𝑛−1 + ⋯+ 𝑎1. 10 + 𝑎0 . Since 10𝑖 ≡ 1 (𝑚𝑜𝑑 9) , for all 𝑖 ∈ ℕ0 , we have 𝑧 ≡ 𝑎𝑛+𝑎𝑛−1 + ⋯+ 𝑎1 + 𝑎0 (𝑚𝑜𝑑 9). That is the remainder of the division of z by 9 is the remainder of the division of the sum of its digits by 9. Analogously, since 10𝑖 ≡ 1 (𝑚𝑜𝑑 3) , 𝑖 ∈ ℕ0, the remainder of the division of z by 3 is the remainder of the division of the sum of its digits by 3. (ii) Let 𝑧 = 𝑎𝑛𝑎𝑛−1 … 𝑎1𝑎0, be an integer number written in base 10. Then 𝑧 = 𝑎𝑛. 10𝑛+𝑎𝑛−1. 10𝑛−1 + ⋯+ 𝑎1. 10 + 𝑎0 . Since 10𝑖 ≡ 0 (𝑚𝑜𝑑 2) , for all 𝑖 ∈ ℕ, we have 𝑧 ≡ 𝑎0 (𝑚𝑜𝑑 2). That is the remainder of the division of z by 2 is the remainder of the division of its rightmost digit by 2. Analogously, since 10𝑖 ≡ 0 (𝑚𝑜𝑑 5) , 𝑖 ∈ ℕ, the remainder of the division of z by 5 is the remainder of the division of its rightmost digit by 5 . (iii) Let 𝑧 = 𝑎𝑛𝑎𝑛−1 … 𝑎1𝑎0, be an integer number written in base 10. Then 𝑧 = 𝑎𝑛. 10𝑛+𝑎𝑛−1. 10𝑛−1 + ⋯+ 𝑎2. 102 + 𝑎1. 10 + 𝑎0 . Since 10𝑖 ≡ 0 (𝑚𝑜𝑑 4), for all 𝑖 ∈ ℕ, with 𝑖 ≥ 2, we have 𝑧 ≡ 𝑎1. 10 + 𝑎0 (𝑚𝑜𝑑 4). That is the remainder of the division of z by 4 is the remainder of the division of the number formed by its last two digits by 4. Analogously, since 10𝑖 ≡ 0 (𝑚𝑜𝑑 25), for all 𝑖 ∈ ℕ, with 𝑖 ≥ 2, the remainder of the division of z by 25 is the remainder of the division of the number formed by its last two digits by 25. (iv) Let 𝑧 = 𝑎𝑛𝑎𝑛−1 … 𝑎1𝑎0, be an integer number written in base 10. Then 𝑧 = 𝑎𝑛. 10𝑛+𝑎𝑛−1. 10𝑛−1 + ⋯+ 𝑎1. 10 + 𝑎0 . Since 10 ≡ −1 (𝑚𝑜𝑑 11) , we have 102𝑖 ≡ 1 (𝑚𝑜𝑑 11) and 102𝑖+1 ≡ −1 (𝑚𝑜𝑑 11) , for all 𝑖 ∈ ℕ. Therefore
𝑧 ≡ 𝑎0 − 𝑎1 + 𝑎2 − ⋯+ (−1)𝑛𝑎𝑛(𝑚𝑜𝑑 11). That is the remainder of the division of z by 11 is the remainder of the division of the sum of its digits taken with alternating signs. The digital sum of a positive integer number 𝑧 = 𝑎𝑛𝑎𝑛−1 … 𝑎1𝑎0, written in base 10 is
the sum of its digits, 𝑎𝑛+𝑎𝑛−1 + ⋯+ 𝑎1 + 𝑎0. The digital root (or repeated digital sum) of a positive integer number z, denoted by dr(z), is obtained by an iterative process of summing digits, using, on each iteration, the result from the previous iteration. The process continues until a single-digit number is reached. For example, dr(1598)=5, because 1+5+9+8=23 and 2+3=5.
Extract the digital root of z is, essentially, get the remainder of the division of z by nine, with an exception when the number z is a multiple of nine, because the digital root of z is nine, but the remainder of the division for z by nine is zero.
When getting the remainder of the division of a positive integer by nine we might remove (“cast out”) any nines that appear as digits in the original number and also can remove together any digits that sum to 9, since 9 ≡ 0(mod 9) and the congruence relation modulo n is compatible with addition. This procedure can save time in the case of very large numbers.
Example 2.5 As we mentioned above, the digital root of 1598 is 5. It can be obtained removing the
digit 9 and the digits 8 and 1.

2nd Annual International Interdisciplinary Conference, AIIC 2014, 8-12 July, Azores, Portugal Proceedings, Vol.3
401
In fact 1598 ≡ 1 + 5 + 9 + 8 (𝑚𝑜𝑑 9) by Proposition 2.4 (i). Since 9 ≡ 0(mod 9)and the congruence relation is compatible with addition we obtain 1598 ≡ 5 (𝑚𝑜𝑑 9).
Casting out n method
We now give the steps of casting out n method, with 𝑛 ∈ ℕ, used to “check” the results of operations addition and multiplication, that relies on Proposition 2.2.
Let 𝑛 be a positive integer number and 𝜌:ℕ → {0,1, … ,𝑛 − 1} the map where 𝜌(𝑥) is the remainder of the division of x by n.
Addition: Suppose we add two positive integers 𝑥,𝑦, and find the result S. We want to
“check” its correctness. We act as follows: 1. Calculate 𝑥 + 𝑦 = 𝑆. 2. Determine 𝜌(𝑥) and 𝜌(𝑦). 3. Calculate 𝜌�𝜌(𝑥) + 𝜌(𝑦)�. 4. Calculate 𝜌(𝑆). The following scheme is a practical way to present the steps described above.
𝜌(𝑥) 𝜌�𝜌(𝑥) + 𝜌(𝑦)� 𝜌(𝑦) 𝜌(𝑆)
Multiplication: Suppose we multiply two positive integers 𝑥, 𝑦, and find the result P. We
want to “check” its correctness. We act as follows: 1. Calculate 𝑥 𝑦 = 𝑃 2. Determine 𝜌(𝑥) and 𝜌(𝑦). 3. Calculate 𝜌�𝜌(𝑥)𝜌(𝑦)�. 4. Calculate 𝜌(𝑃). The following scheme is a practical way to present the steps described above.
𝜌(𝑥) 𝜌�𝜌(𝑥)𝜌(𝑦)� 𝜌(𝑦) 𝜌(𝑃)
In both cases, if we get different numbers in steps 3 and 4, by Proposition 2.2, we are
sure to have made a mistake. If we get the same number in steps 3 and 4, the result found passed the test, but we are
not certain the operation was carried out correctly, we only deduce that the correct result and the one we found are congruent modulo n. This is the reason why casting out n sometimes fails since it doesn’t detect all errors.
Example 3.1: Suppose we add two positive integers, say 𝑥 = 149 ,𝑦 = 232, and find
the result 149+232=381. We want to “check” its correctness. We can use any value for n. Using 𝑛 = 9, we have the following scheme:
5 3 7 3
Using 𝑛 = 4, we have the following scheme: 1 1 0 1
In both cases, we are not certain the operation was carried out correctly. We only deduce that the correct result and the one we found are congruent modulo n.
If in this example we find the wrong result 371, we have

2nd Annual International Interdisciplinary Conference, AIIC 2014, 8-12 July, Azores, Portugal Proceedings, Vol.3
402
Using 𝑛 = 9 5 3 7 1
We are sure to have made a mistake. Note that, using, for example n=6, we also are sure to have made a mistake:
5 3 4 5
But, using, for example n=2, we would not notice the mistake: 1 1 0 1
In the first two cases the error is detected because 371(wrong result) and 381(right result) are not congruent modulo 9 neither modulo 6.
In the last case the error is not detected because 371 and 381 are congruent modulo 2.
Example 3.2: Suppose we multiply two positive integers, say 𝑥 = 15 ,𝑦 = 23, and find the result 15 × 23 = 345. We want to “check” its correctness. We can use any value for n.
Using 𝑛 = 9, we have the following scheme:
6 3 5 3
Using 𝑛 = 4, we have the following scheme: 3 1 3 1
In both cases, we are not certain the operation was carried out correctly. If in this example we find the wrong result 75, using 𝑛 = 9
6 3 5 3
we would not notice the mistake, because 345 and 75 are congruent modulo 9. However using 𝑛 = 4
3 1 3 3
we are sure to have made a mistake. In this case we detect the mistake since 345 and 75 are not congruent modulo 4.
Casting out nines versus casting out n
As we saw this procedure to “check” if the operation was carried out correctly can be used with any n >0. Let us now answer why, traditionally, the preferred is n=9 (casting out nines).
The method to compute the remainder of the division of a positive integer number by three is similar to that of nine (Proposition 2.4 (i)), why don’t we use casting out threes? Because a random answer to an arithmetic operation has probability 1 9� of passing the test of casting out nines while the corresponding probability is 1 3� for casting out threes.
Casting out nines method doesn’t detect all errors. One of them is when, accidentally, we write two adjacent digits in the wrong order. If we use casting out elevens, this kind of error is detected. In fact to compute the remainder of the division of a positive integer number by 11 we alternately add and subtract digits, starting from the right (Proposition 2.4 (iv)). For instance, to calculate the remainder of the division of 1537 by 11, we do 7-3+5-1 which is 8. If we change the adjacent digits 5 and 3 we get 1357 and we do 7-5+3-1 which is 4. When

2nd Annual International Interdisciplinary Conference, AIIC 2014, 8-12 July, Azores, Portugal Proceedings, Vol.3
403
we obtain a negative number we add 11. For example, to calculate the remainder of the division of 6213 by 11, we do 3-1+2-6 which is -2 ≡-2+11≡9 (mod 11), so the remainder is 9.
However compute the remainder of the division of one number by nine is more accessible and fast, reason why was preferred casting out nines.
On using casting out n method, the only difference is in the "shortcut" to compute the remainder in the integer division by n.
Once the test to compute the remainder in integer division by nine is the most accessible, and some way amusing, the casting out nines method is the preferred. Conclusion
The question “Why casting out nines?” can be completed this way: Why casting out nines works? Why casting out nines fails? Why casting out nines and not, for example, casting out elevens? Those questions were answered throughout the text.
But the original question can be seen in another sense: Why discuss casting out nines nowadays?
Indeed currently the casting out nines method is not used. One reason is the generalized use of electronic calculators and another is because it is not really a method to check the results of operations on integers.
In our opinion the richness of the mathematical ideas behind this method justifies its approach nowadays. In fact mathematical concepts such as divisibility and arithmetic modular are used in important current applications such as internet security.
References: Baldoni, M. W., Ciliberto, C., Piacentini Cattaneo, G.M. Elementary Number Theory, Cryptography and Codes. Springer, 2009 Fernandes, Rui L., Ricou, Manuel. Introdução à Álgebra. IST Press. Portugal, 2004 Benson, Donald C. The Moment of Proof: Mathematical Epiphanies; web site http://books.google.pt/books?id=8_vbuzxrpfIC&pg QED Infinity Web site http://www.qedinfinity.com/textbook/fundamentals-of-mathematics/2-techniques-of-numerical-calculations/

2nd Annual International Interdisciplinary Conference, AIIC 2014, 8-12 July, Azores, Portugal Proceedings, Vol.3
404
AN INNOVATIVE SERVICE FOR SUSTAINABILITY IN BRAZIL: THE PANTANAL BRAZIL
WEB SITE CASE
Beatriz Marcondes de Azevedo Santa Catarina Federal University, Brazil
Rolf Hermann Erdmann Santa Catarina Federal University, Brazil
Fred Leite Siqueira Campos Itajubá Federal University, Brazil
Maria Augusta Graeff M A G & Parceiros WEB, Brazil
Abstract The Pantanal BRAZIL ® Portal is a website aims to create sustainable value and shared in the process of interaction between people and organizations through information, products and services generated by the states the Pantanal: Mato Grosso and Mato Grosso do Sul. It a service organization that operates in the sector of Information Technology offering a platform for digital content distribution aimed at promoting commercial development, cultural and social development in the Pantanal region. Thus the Portal Pantanal Brazil wants to seize opportunities to encourage various sectors intensifying their shared value. Given the above, this article aims to propose a critical reflection on the process of design and operation of an innovative service by reporting the steps followed from the moment of conception until the moment the idea of his offering to the market. Furthermore, we evaluated the performance of the new service with the purpose of identifying your strengths and opportunities for improvement. Thus, in methodological terms, this is an exploratory-descriptive, in the form of a case study. Data were collected from the Google Analytics to a sample of Internet users who accessed the portal for the four years that it is operating. The results indicate that in terms of resources, the portal is considered a platform for synergistic action, acting as a channel for interactivity between the Region of Pantanal and the national and international market.
Keywords: Biodiversity; innovation; portal; information technology; sustainability. Introduction The PANTANAL BRASIL® Portal is a web site that aims at creating a sustainable and shared value to the process of interaction between people and organizations through information, products, and services generated in the states that are home to Pantanal: MT and MS. This is a service organization product that operates in the Information Technology sector, offering a platform to distribute digital content aimed at promoting economic, cultural, social, as well as environmental and scientific development in the Pantanal area. According to Souza et al (2014), throughout the last decades, the Internet has expanded continuously, both in terms of the technology used and its dimension, becoming an essential means for doing business. As a result of that growth, many information search and organization tools were created - a context that includes prominent Web Portals. To Lederer
2nd Annual International Interdisciplinary Conference, AIIC 2014, 8-12 July, Azores, Portugal Proceedings, Vol.3
405
et al (2000), the Web (World Wide Web), is the most popular service available on the Internet; a service comprised of a collection of servers that contain pages with hypertext and multimedia elements (texts, images, animations, sounds and videos). According to Zilber et al (2012), the so-called portals or websites are applications used to integrate information, assets and services from one or more companies and make them available through a unique access point, using the virtual space of the Internet as a means. Having that in mind, when one thinks of an organization that is designed to provide information, goods and services through a virtual channel, it is possible to categorize it as a member of the Information and Communications Technology (ICT) service sector. Daft (2010) further ads that such an endeavor may be focused on e-business, which is defined as any business that takes place through digital processes and over a computer network as opposed to the physical space. According to IBGE – Brazilian Institute of Geography and Statistics (2009), the ICT sector can be described as a combination of industrial, commercial and services operations that capture, transmit and broadcast data, as well as buy and sell equipment and products that are closely related to these processes. Regarding these computer-related products (goods and services), IBGE classifies the creation of web sites and portals for the Internet as a custom-made software development service. Based on the classification proposed by IBGE (2009), microcompany Mag e Parceiros Web, headquartered in Campo Grande/MS and creator of the PANTANAL BRASIL® Portal, may be considered an ICT sector service company and, even more so, a KIBS (Knowledge Intensive Business Services) company, since according to Freire's (2006) understanding, KIBS are organizations that operate within the following Economic Activity National Classification (CNAE): Computer-related activities (division 72 of CNAE), which includes among different classes, the Computer Software Development (7220) class.
Therefore, when we understand the PANTANAL BRASIL® Portal as a product – or as goods – and at the same time as service offered by Mag e Parceiros Web, it is possible to attribute it the concept of an innovative product, since it has been designed to offer diverse information translated to nine languages in one unique place. It is also relevant to point out that the concept of innovation used here is the one understood by Sundbo and Gallouj (1998) as a change in business by means of adding a new element, or by the combination of elements that results in processes being executed differently.
In view of the aforementioned, this article aims at proposing a critical view on the design and operations process of an innovative service, reporting the steps taken since the conception of the idea through its market launch. Additionally, we aim at assessing the development of the portal in order to identify its weak and strong points, as well as its improvement potential. On what concerns methodology, this is an explanatory descriptive research, in the form of a case study. Data was collected from entrepreneur records and results from Google Analytics daily reports.
The relevance of this work is based on the fact that the service sector, especially regarding those activities related to information technology, has shown significant growth in the country. However, research in the area materializes in significant lower number then industry research (IBGE, 2009). In addition to that, it has been verified that there is also a demand for studies focused on service innovation (NÄHLINDER, 2002; OSLO, 2004; KUBOTA, 2009).
Services feature some specificities that differentiate them for manufactured goods, such as intangibility, which is an aspect that prevents clients from seeing, touching or establishing any previous contact with services before consuming them; concurrence or inseparability, since services are created and consumed simultaneously; perishability, since

2nd Annual International Interdisciplinary Conference, AIIC 2014, 8-12 July, Azores, Portugal Proceedings, Vol.3
406
they cannot be stocked (FITZSIMMONS; FITZSIMMONS, 2005). Haukness (1998) and Corrêa; Cahon, 2002 add two more characteristics: ephemerality, which indicates that the service while being offered has temporary existence, which ends when services cease to be rendered; and the highly intense interaction between the producer/provider and consumers, something that requires intense customization.
Regarding the fact that the service is characterized by a highly intense interaction, Vargo; Lusch (2004) states that the need for a change in perspective is evident. Trade and economic processes with a focus on services aim at customizing the offer, which requires unique customer service and reveal the constant role taken up by the consumer as a co-creator. According to these authors, these relationships tend to be maximized in order to provide the best customization possible in view of the consumers' needs.
Fitzsimmons; Fitzsimmons (2005, p. 4) understand that: "service is a perishable and intangible experience, developed for a customer who plays the role of co-producer." In relation to the co-producer role taken by the consumer while making use of the service offered by an organization, Prahalad; Ramaswamy (2004) explain that co-production or co-creation is nothing but an intense participation of the consumer in the service, generating higher value through customization and therefore higher levels of satisfaction. In that sense, the essence of co-production in service is a search for the best way to add value to consumers, catering to their interests from an individual perspective, since satisfaction is derived from the perception of value generated by service quality and performance.
Lusch; Vargo (2006) point out that what is really relevant to consumers are not the physical characteristics of goods but the benefits they generate (service). Therefore, Bendapudi; Leone (2001) argue that in order to guarantee a successful business an organization needs to generate value to their product (goods and/or service), by building an image of quality that is proactive, continuous and consistent.
It is also important to point out that the idea of co-production can even help the improvement process in the production system of a specific service, as a way to help correct errors and/or leveraging improvement opportunities. However, according to Lusch; Vargo (2006), the co-creation process happens specifically in the moment in which the service is being rendered, and therefore requires previous and thorough investment in planning the way operations are supposed to happen in which deliverables are expected by the organization.
Planning the characteristics of a product (goods and/or services) and the flow of stages and resources needed to offer those products are closely related to the project of what is going to be offered in the market. According to Slack et al (2002), products are designed to satisfy customers and cater to their current and future needs while improving the organization's competitive edge in face of their competition. Therefore, it is necessary to elaborate a product project and a production process project (ERDMANN, 2007).
Mello Neto; Turrioni (2002) add that in order to manage a process it is necessary to first be able to visualize it. That can be achieved through process analysis techniques. That way, it is possible to detect errors and improvement opportunities, defining critical tasks and eliminating those that do not add value or that are duplicate, in an attempt to elevate the company to higher grounds, allowing it to stand out in the competition.
Mello (2005) offers a service development process model. The method is divided into four stages: Service construction project, service process project, service installation project, as well as assessment and improvement, as illustrated on figure 1.

2nd Annual International Interdisciplinary Conference, AIIC 2014, 8-12 July, Azores, Portugal Proceedings, Vol.3
407
Figure 1: Service development process model.
Source: Mello (2005) Based on figure 1, we understand that in stage 1 – the service construction project – a
research must be conducted to investigate the needs and expectations of customers (or the market) to create or improve the service that is able to cater to these needs and expectations. Having all that information, the ideas generated to cater to the needs and expectations verified can be selected and, with the support of a proper competition strategy for the current market situation, we can define the concept and service package that will be offered. A large part of the client expectations and needs verified at this stage can serve as criteria to define the specifications of the service project that is being designed, guaranteeing that all these expectations and needs are satisfied – and also creating a competitive edge.
Gianesi; Corrêa (2004) state that sometimes, as it may happen with certain services, what is being offered is not very clear from the beginning. That is why some companies define their concept of service with a brief statement, which allows their clients to draw a mental image of what the organization intends to offer. Johnston; Clark (2002) mention four points that must be included when drafting a service concept statement: aspects of the client's direct interaction with the service; the expected outputs of the process; how the service will be rendered; as well as aspects of potential benefits obtained by the client with the service.
On stage 2, which is called service process project, we identify and define the main processes and their respective activities needed to perform, deliver, or maintain the service. The processes and activities that integrate an operation are those essential for the service to happen, according to the specifications defined.
Stage 3, called service installation project, refers to the design of the tangible part of the service, such as the definition of physical installations (layout) in which the service will be delivered, as well as the attributes that are important according to a client's perception regarding quality of service – for both front-end and back-end activities, which in many cases are critical to the final delivery of the service.
On stage 4, which is called service assessment and improvement phase, we define a process that guarantees that the service designed actually satisfies what has been identified as a need on stage 1. This phase includes the definition of a system to assess the service designed and its future validation by the client. This stage also includes the definition of a system that guarantees recovery to those clients whose needs and expectations are not properly fulfilled. This improvement system can also cause a review of stages 1, 2 and 3 of the project and service development process.
Service innovation The innovation process is fundamental for the development of the service sector. However, most studies that approach this phenomenon tend to focus on the industry and therefore become a rather incomplete comprehension of the service innovation process (OSLO, 2004).
2nd Annual International Interdisciplinary Conference, AIIC 2014, 8-12 July, Azores, Portugal Proceedings, Vol.3
408
In view of the reality presented by Oslo (2004), we see it necessary to propose a reflection about the PANTANAL BRASIL® Portal, from the perspective that it is an innovative service related to the ICT sector. Therefore, bearing in mind the object of this article, and based on Sundbo; Gallouj (1998), we can list four types of service innovation: product, process, organization, and market innovation. Product innovation is related to providing a new service, such as for example a new content section for the portal. Organization innovation is related to the introduction of new management tools and models, such as the implementation of participatory management into production operations so as to constitute and consolidate a team that is competent and committed to the business. Process innovation is related to modifying prescribed procedures to elaborate/produce a service (back office) or in user/customer service information and delivery (front office) – an example of that is to have customer service delivered via chat and/or telephone. Finally, market innovation is related to the discovery of new markets by identifying niches in the same market or a shift in the behavior of an organization in its environment – as an example of that, we can consider the events market related to the Pantanal, their promotion and participation. Web Portals In the new 21st century economy, the speed in which we gain access to information as well as its diversity can be a decisive factor in people's lives as well as to organizations of different sizes and sectors. The overload of data and information spread around the web and from different sources (data banks, documents, printouts, e-mail messages) can make it difficult for people to access them. Also, intelligible data and information sometimes require a significant amount of time and access two different systems. Turban and King (2004) indicate that portals are a potential solution for those problems, since, according to the authors, portals channel the overload of information by means of a virtual environment that allows for the search and access of relevant data from different information technology systems and the Internet by using advanced search and indexation systems.
Almeida (2004) states that portals not only aim at being the first option for users in search of information but also a reference information goods and services. The author alerts to the fact that in spite of the commercial value they have, portals' definitions and classifications are still ongoing due to the infinite number of resources that are constantly being implemented.
According to Souza et al (2014), a portal can be considered the main door to a set of resources and services on the Internet. Angulo and Albertin (2000) also add that portals offer a variety of services in categories such as content, communication, community, electronic commerce. Therefore, regarding the different services offered, we can say that the PANTANAL BRASIL® Portal was designed to: offer periodic information on the Pantanal, free of charge and in nine languages: Portuguese, English, Spanish, German, Italian, French, Dutch, Japanese and Mandarin; offer products and services that are typical to the region, allowing for local development through E-commerce and tourist attractions; and as a crowd funding platform, working as an interface between those who offer products/ideas and their financing counterparts, leveraging collaborative financial support to social and environmental projects in the area. When reflecting upon the format of the aforementioned portal, and based on Zirpins et al (2001), we can classify it as being an industrial portal or a B2B (business-to-business) portal, since it provides a virtual environment for exchanging information and most importantly an environment that is suitable to facilitate commercial trades.

2nd Annual International Interdisciplinary Conference, AIIC 2014, 8-12 July, Azores, Portugal Proceedings, Vol.3
409
Still regarding its classification, the Pantanal Brasil® Portal can be characterized as a local portal, since according to Panfieti and Matsuda (2010), local portals are those that use online tools to provide users with better access to services, cultural events, news, tourism, leisure, among other subjects in their city or region. That the exclusive content allows information to be more accessible to the consumer public, generating a link and strengthening the relationship between site developers, users/local public, executives and business owners, at no cost to the user. Methodology The present investigation is characterized as an explanatory descriptive research, with a quantitative approach and shaped as a case study.
Data was collected by reviewing specialized bibliography – with a special focus on the service development process model proposed by Mello (2005) - document analysis (analytical reports), as well as interviews with the people responsible for the Portal. As for data organization, management and analysis, we applied the four stages described in the aforementioned model. Presentation and Discussion of Results The PANTANAL BRASIL® Portal design and operation process assessment was made by reviewing specialized bibliography and applying the service development process model proposed by Mello (2005). Therefore, in order to present and discuss the results, we decided to follow the four stages that comprise the aforementioned model, which are:
On stage 1, which is called service conception project, a research was made on the needs and expectations of clients (or the market) in order to create or improve a service that can cater to those needs and expectations. Having all that information, the ideas generated to satisfy those needs and expectations verified were selected, with the support of a proper competition strategy for the current market situation. After that, we defined the service concept and package options that would be offered.
Therefore, based on the analysis of the collected data, we can state that the idea of building an Internet portal called PANTANAL BRASIL® was born out of the understanding that the Pantanal destination in Brazil can offer unique potential in comparison to other prestigious destinations such as the northeastern, southeastern and, most recently, the southern Brazilian beaches. However, we understand that beautiful beaches can be found in a the different places around the world, and that the Pantanal biome, with its beauties and natural wealth, is unique – so much so that in 2000 UNESCO included the location as a World Heritage Site. In addition to that, when work began in 2008, the creators realized that the public with the highest interest in ecotourism were foreign tourists, which justifies the decision to develop a tool specially dedicated to that market. By researching public management organizations, we were able to define the origin of the visitors. Having that information, the eight most representative markets were then selected with the intention of offering them dedicated material in their own mother languages. The preliminary idea was to develop a tourist portal that would satisfy the basic information needs on the location, special care, proceedings and mainly a way to facilitate traveling and tourism operations.
However, in the very beginning organizers detected that the tourism sector needed investment and incentive, due to a serious deficiency in infrastructure and service options at the time. In 2010 public authorities started to encourage investments to bolster the development of the sector. In that sense, the intended portal, with its international reach required higher support from local services. However, local businesses were not in condition to finance the tool as it was originally intended.
2nd Annual International Interdisciplinary Conference, AIIC 2014, 8-12 July, Azores, Portugal Proceedings, Vol.3
410
At the same time, the acknowledgement of the economic potential of the States in which the Pantanal was inserted (Mato Grosso and Mato Grosso do Sul), with their farming and agricultural production, as well as the exploration of natural wealth, encouraged the initiative to broaden the themes included in the Portal (FACHIM, 2005).
Hence, the focus of the website remained on Tourism, influencing the content offered – which happened as a way to encourage and foster the activity and not as the main service offered in the Portal, which coincides with the perception of Angulo and Albertin, 2000.
From those experiences, the PANTANAL BRASIL® Portal started to be developed aiming at becoming a business portal, encouraging tourism and fostering the development of the Pantanal region. The portal promoted the economic and investment potential of the area, as well as its culture and biodiversity, bringing the stakeholders and suppliers closer. With a profile characterized by offering information from reliable sources to the market, a number of institutional partnerships were formed with public agencies (government departments, production sector associations, institutions and universities) to provide content. In order to take full advantage of the reach offered by having the content in different target-languages, partnerships were established with the German, Italian and Chinese Chambers of Commerce and Industry, as well as local and international portals. Currently the Portal's position is solid, ranking high on Google searches for: opportunities, business, biodiversity, fauna, flora, tourism, agribusiness, agro-energy, scientific promotion, culture, "in pantanal".
In terms of market segmentation, the Portal opted to attract two types of audiences: individuals and organizations that want to offer goods, services and projects through the portal and those who want to acquire them. So the potential audience for the Portal are organizations and individuals that search for unique products and that help promote the sustainable development of the Pantanal region. They are also consumers of exclusive cultural products and ecological services or simply those who want to associate their brand with local promotion initiatives through portal advertisement.
Based on information collected in the experience acquired throughout the development of the Portal, it's possible to say that the package and service offers are: the PANTANAL BRASIL® Portal is an innovative service that provides a platform for interactivity and a virtual experience, stimulating and facilitating business, sharing information and experiences, researches and projects in favor of the Pantanal biome and local sustainability.
Therefore, considering the service packages offered, it is possible to say that the mission of the Portal is to promote the region in which Pantanal is inserted as a way to foster communication and commercial relationships between people (C2C) and companies (B2B), as well as between companies and people (B2C), allowing for a virtual business environment, encouraging promotion and conservation of the region to generate shared value. And the business view is to become a world reference for subjects and products (goods and services) related to the Brazilian Pantanal.
On stage 2, which is called service process project, we identified and defined the main processes and their respective activities needed to perform, deliver, or maintain the service.
From the information obtained on stage 1, we defined that the PANTANAL BRASIL® Portal aims at creating sustainable and shared value in the interaction process between people and organizations through information, goods and services generated by the states that are home to the Pantanal (MT and MS). So, based on Panfieti and Matsuda (2010) and Brabham (2008), we understand that the main Portal's activities include: offering periodic information on the Pantanal; fostering local development through e-commerce and tourist attraction; serving as an interface between stakeholders interested in supporting and/or developing social and environmental projects in the region by means of a crowdfunding.

2nd Annual International Interdisciplinary Conference, AIIC 2014, 8-12 July, Azores, Portugal Proceedings, Vol.3
411
The Portal defined its business strategy has been recognized as the largest information channel for the Pantanal. In order to do that, it focuses on establishing partnerships in different areas to provide content and news, goods, services and environmental projects.
Stage 3, called service installation project, refers to the design of the tangible part of the service, such as the definition of physical installations (layout) in which the service will be delivered, as well as the attributes that are important according to a client's perception regarding quality of service – for both front-end and back-end activities, which in many cases are critical to the final delivery of the service.
In that sense, in order to fulfill the organizational goals, it is important to point out that the PANTANAL BRASIL® Portal started the research and development activities for the system structure in 2008 with the creation of the original platform and the first layout draft. At this point, the Portal has already been published on the web for over a year, with a number of partnerships established to access and generate content, which include: State Department of Environmental Issues, Planning, Science and Technology (SEMAC/MS), State Department of Agricultural, Production, Industry, Commerce and Tourism Development (SEPROTUR/MS), the Mato Grosso do Sul Tourism Foundation (FUNDTUR/MS), the MS Bioenergy Producers Association (BIOSUL), the MS Planted Forests Consumers and Producers Association (REFLORE-MS), the MS Pig Farmers Association (ASSUMAS), the MS Veal Beef Producers Association (ASPNP), Painel Florestal, and SEBRAE/MS.
The company provided includes information on the Pantanal in reference to its ecosystem, fauna, flora, curious information, access to the region, culture, music and arts, information on the productive and economic chain in the state of MS as well as tourist information.
In 2009 the Portal gained more visibility with the participation in regional trade shows such as the Tourism Trade Show and Business Rounds (FUNDTUR/MS). In that same year, the first version of the Business Plan was drafted based on a model provided by SEBRAE From that moment on, we began contacting external partners, such as the Italian-Brazilian Chamber of Commerce and Industry in RS (CCIRS).
In 2010 the Portal participated of a number of events, both national and international, including: VERONAFIERE/Italy; EXPODIRETO/RS; FEIRA DAS AMÉRICAS/RJ; BNT MERCOSUL/SC Tourism Trade Show; RIBAS FLORESTAL/MS Trade Show; the official release of the Senior Experten Service (a Program of the German Chamber of Commerce and Industry/AHK for MS, with the support of SEPROTUR/MS and FECOMERCIO/MS). In addition to that, it also develop the project alongside the MS Tourism Foundation, financed by BID and was represented in an event in China, where it had the opportunity to distribute informational material. It also established a partnership with an internationally-renowned photographer and others with TRIP LINHAS AÉREAS and the German-Brazilian Chamber of Commerce and Industry in RS (AHK).
In 2011, three years after its release, the Portal received some alterations as a way to update its layout (second version) include user instruction tools such as social networks (Facebook, Twitter, Flicker and Slide Share), strengthening partnerships and including the state of Mato Grosso in its scope, complementing the region known as the "Pantanal territory", a World Heritage Site (UNESCO, 2000). In that same year, portal representatives visited Expodireto/RS and established partnerships with translation companies. The Portal promoted, with the support of SEPROTUR, FUNDECT and NOVOTEL, an event to introduce the AHK in Campo Grande.
In 2012 many changes were scheduled, including a new positioning for the Portal and the management as a way to broaden its operations and allow for sustainable growth. In that same period, the Virtual Boutique was created as a new service option, connected to the

2nd Annual International Interdisciplinary Conference, AIIC 2014, 8-12 July, Azores, Portugal Proceedings, Vol.3
412
Incubation Projects for Joint Economic Endeavors of the Tourism Production Chain in Bonito and Serra da Bodoquena and Pantanal de Corumbá (IEESTUR). The Virtual Boutique operations (scheduled to 2013) will be regarded as the first step of the portal in the e-commerce market. As for the partnerships established, some of the highlights are the Federal Universities of MS and MT, to promote the results of the research performed in their research centers through the "Scientific Promotion" channel; the Chinese-Brazilian Chamber of Commerce and Industry (CCIBC); Italian Portals (Brazil Planet and ITALPLANET); the National Association of Producers of Red Ceramic (ANICER), that used the portal to promote the 41st Meeting of Red Ceramic Industry in Campo Grande (Dec. 08).
It is important to point out that since the beginning of 2012, motivated by Barnes; Vidgen (2000) ideas, the Portal has offered fixed content facilitating the purchase of tourist packages by means of an online form, video technology, images, sound, street view (360º), advertising space (publicity) and the conclusion of the e-commerce to platform that is ready to begin operations.
Regarding the advertising space, advertisers have different options to promote their products or services, which include banners, different sizes, pages (home page, internal page), preferred language and advertising time. Advertisers will have a complete report with the number of visits generated. The PANTANAL BRASIL® Portal banners include different visibility formats, customized according to the investments clients are ready to make, in these categories: 01 jaguar; 02 jaguars and 03 jaguars.
Based on the aforementioned, it is possible to say that in order to facilitate its main goals, the Portal designed the following strategies: Maintain the business focus by increasing the number of products (goods and services) offered; offer a wide variety of products through the electronic commerce platform, a medium variety of tourist packages and also a medium variety of projects on the crowdfunding platform; widen the number of tools for proactive communication (mailing, newsletters, social networks, blogs, opinion polls); provide content facilitated by the communication sectors of different partners and by creating our own content; and systematically maintain the content provided.
The PANTANAL BRASIL® Portal for a production and operational strategy that concentrates sales in lower quantities with a wide variety of products. We understand that this strategy allows for lower inventory and aggregation costs from different income sources due to the wide variety of items offered, such as advertisement, handcraft, project participation and collaborative financing, as well as tourist services and the participation in event promotion (SLACK et al, 2002).
As for the technology used, we aimed at developing a robust platform to provide instant content and products to different buyers. We understand that the platform is the central point of all operations and transactions that will be performed, and that it has to be robust in order to include two or more distinct groups (on the one side, product suppliers from a creative economy, and projects that will search for collaborative funding, tourist packages and advertising space; on the other side, organizations and final consumers that search for goods and services related to the Pantanal and its region). However, it is important to observe that in order for the relationship to unfold, local suppliers have to be prospected and mapped, to make sure they can fulfill the offer. In order to do that, since its foundation, the Portal has developed strategic partnerships to guarantee access to information. In the short term, we intend to provide e-commerce and crowdfunding still this year.
On stage 4, which is called service assessment and improvement phase, we defined a process that guarantees that the service designed actually satisfies what has been identified as a need on stage 1. In order to do that, redeveloped a system to assess the service designed and its future validation by the client.
2nd Annual International Interdisciplinary Conference, AIIC 2014, 8-12 July, Azores, Portugal Proceedings, Vol.3
413
On what regards serve as production control, one of the main tools used to monitor the Portal's performance is Google Analytics the, which offers daily reports. According to recent reports, the Portal has received over 20,000 visits monthly. It is currently the fourth most visited web site that offers information on a specific region in Brazil. The most sought after subjects are: Pantanal in Brazil, handicraft in Pantanal, fauna, flora, biodiversity in Pantanal, business opportunities (MT, MS), tourism (MT, MS), agribusiness, forests, agro-energy (in Pantanal as a whole).
However, in spite of being considered a portal visited by different countries, its rejection rate is still significant, around 50%. It is important to note that the rate is measured through a daily Google Analytics report and shows navigation restricted to the home page, indicating visitors that do now continue their browsing experience in the website. That rate allows us to infer that visitors enter the website motivated by a specific interest on the subject, but the content is not attractive enough to satisfy their needs. The lack of available content or outdated information can be explained by the fact at the capital for investment on the service infrastructure it is not yet at a minimum to provide for the sustainability of the Portal.
In order to deal with the problems detected on the analytical report analysis and find ways to attract users, the goal for the next years is to sell advertising space. Even though this is an existing service, it is not yet enough to guarantee the needs of the endeavor, due to the financial frailty of the Portal, which requires investment for continuous development of content that would facilitate promotional campaigns and thus acquiring commercial value.
On a more positive note, the recent recovery of the Brazilian economy is allowing tourism in Pantanal to grow. In addition to this reality representing new social and economic development perspectives (job and income generation), it has simultaneously generated worries with possible negative environmental and social impact in the area, regarding the lack of organization of activities in protected areas and the low levels of qualification to provide contemplative and adventure tourism options (ECOA, 2012). That is why the Portal decided to monitor current events and developments, planning and organizing to anticipate news that help minimize negative impact and facilitate actions that contribute to the region's sustainable development.
Aligned with the growth in tourism, travel agencies and business owners are growingly using the Internet as a tool for promotion an attraction of consumers in a globalized way. Thus, the Portal also intends to provide opportunities to encourage different sectors of the tourism production chain to intensify their shared value. With the platform, different options of sightseeing rides, hospitality and general information can be offered to support the tourists who visit the region – with options available for both the states of MT and MS. The Portal will welcome tourists through partnerships with companies specialize in offering a unique services, such as hospitality, transfers, information on sightseeing rides and travel insurance. The service is already available through our partner agencies, who provide assistance to incoming tourists.
In addition to that, the new phase of the PANTANAL BRASIL® Portal includes the implementation of a biweekly newsletter, intended to inform our partners and advertisers with the main news and information on the activities, projects, promotions and other events included in their channels. Flavián et al (2006) agree that the service aims at obtaining customer loyalty and stimulating interaction and co-participation of users to allow for the planning, programming and control of the services offered. Distribution will be made through a focused mailing system in order to avoid spamming.
As for e-commerce, the Portal is expected to operate through a distribution channel (DC) for the logistics and product storage. Headquarters are in Campo Grande/MS. In the
2nd Annual International Interdisciplinary Conference, AIIC 2014, 8-12 July, Azores, Portugal Proceedings, Vol.3
414
same location, products will be organized by categories and suppliers, as a way to control incoming goods, storage, transport and final product delivery. Conclusion The Portal provides updated content, aligned with the main demands surrounding the Pantanal biome, aiming at providing users with precise and reliable data. It aims at guaranteeing credibility and market positioning in a way that companies, organizations and the government both have opportunities to associate their brand with an internationally-renowned innovative initiative. In addition to that, the tool allows for users to have a general view of the Pantanal, with important cultural, environmental, economic and scientific information. The relevance of this innovative service relies on offering information and stimulating sustainability so as to give nature and economic interests the same priority. However, in order to achieve that goal many the changes are necessary, in a continuous evolutionary effort to qualify and improve the platform – in both its layout and its interactivity with users and content.
Based on the information discussed, it is possible to infer that the need for capital, sponsoring and/or investment, as well as a lack of public interest in funding the evolution of the Portal, directly influence the insufficient flow of information provided in the website, which has delayed the increase of its commercial value. A business plan that includes the modernization of the Portal was developed, and with some of the actions implemented has been consistently assessed in order to strengthen a continuous search for investments that would guarantee the sustainability of the tool.
In addition to that, it is important to observe that the knowledge acquired in the four years it took to develop the Portal has shown that it is necessary to create an institutional structure that subsidizes the development of projects that complement its business proposition. Thus, in order to cater to those demands the PANTANAL BRASIL Institute was created – a non-profit organization (OSCIP) that aims at analyzing and developing projects funded by public resources –, characterized as the Portal's social responsibility instrument. The alignment between information and product suppliers present in the Portal generate data that stimulate the creation of the Pantanal Sustainability Observatory. A project that goes over the national borders and includes areas of Pantanal in Paraguay and Bolivia, which is under study and may offer the Pantanal Biome better attention to issues related to sustainability. References: ALMEIDA, C. C. Portais verticais. In: TOMAÉL, M. I.; VALENTIM, M. L. P. (Orgs.). Avaliação de fontes de informação na Internet. Londrina: Eduel, p. 57-86, 2004. ANGULO, M. J.; ALBERTIN, A. Portais ou labirintos?. In: ENAMPAD, 2000, Rio de Janeiro. Anais... Rio de Janeiro: ANPAD, 2000. BARNES, S. J.; VIDGEN R. WebQual: an exploration of Web site quality. European Conference in Information Systems, Vienna, 2000. BENDAPUDI, N., LEONE, R. P. How to lose your star performer without losing customers. Harvard Business Review, p.104-112, 2001. BRABHAM, D. C. Crowdsourcing as a model for problem solving: an introduction and cases. Convergence: the International Journal of Research into New Media Technologies, 14 (1), p. 75-90, 2008. CORRÊA, H. L.; CAON, M.Gestão de serviços: lucratividade por meio de operações e satisfação dos clientes. São Paulo: Atlas, 2002. DAFT, R. L. Administração. São Paulo: Cengage Learning, 2010. ECOA, , Rios Vivos, 2012.

2nd Annual International Interdisciplinary Conference, AIIC 2014, 8-12 July, Azores, Portugal Proceedings, Vol.3
415
ERDMANN, R. H. Administração da produção: planejamento, programação e controle. Florianópolis: Papa-livro, 2007. FACHIM, E. Safeguarding the Pantanal Wetlands: threats and conservation iniciatives. Conservation Biology, 19 (3), p. 714-720, June, 2005. FLAVIÁN, C.; GUINALÍU, M.; GURREA, R. The role played by perceived usability, satisfaction and consumer trust on website loyalty. Information & Management, 43 (1), Jan., p. 1-14, 2006. FITZSIMMONS, J. A.; FITZSIMMONS, M. J. Administração de serviços: operações, estratégias e tecnologia de informação. Porto Alegre: Bookman, 2005. GIANESI, I. G. N.; CORRÊA, H. L. Administração estratégica de serviços. Operações para a satisfação do cliente. São Paulo: Editora Atlas, 2004. HAUKNES, J.Services in innovation: innovation in services. In: Services in innovation, innovation in services, 1998. Disponível em: http://www.step.no/si4s. Acesso em: março de 2003. IBGE. O setor de Tecnologia da Informação e Comunicação no Brasil: 2003-2006. Brasil, 2009. Disponível em: http://www.ibge.gov.br/home/estatistica/economia/stic/publicacao.pdf. Acesso em: maio de 2012. JOHNSTON, R.; CLARK, G. Administração de operações de serviços. São Paulo: Atlas, 2002. KUBOTA, L. C. As Kibs e a inovação tecnológica das firmas de serviços. Economia e Sociedade, Campinas, 18 (2), p. 349-369, ago, 2009. LEDERER, A. L.; MAUPIN, D. J.; SENA, M. P., ZHUANG, Y. The technology acceptance model and the World Wide Web. Decision Support Systems, 29, p. 269-282, 2000. MELLO, C. H. P. Modelo para projeto e desenvolvimento de serviços. Tese (Doutorado), 315f. Escola Politécnica da Universidade de São Paulo. Departamento de Engenharia de Produção, São Paulo, 2005. MELLO NETO, P. L. O. C.; TURRIONI, J. B. Padronização em serviços: três casos de hotéis no Estado de São Paulo. Anais do XXII Encontro Nacional de Engenharia de Produção (ENEGEP), 2002. NÄHLINDER, J. Innovation in knowledge intensive business services: state of the art and conceptualizations. Linköping: Linköping University, 2002. (Working paper). OSLO. MANUAL DE OSLO. Proposta de diretrizes para coleta e interpretação de dados sobre inovação tecnológica. Organização para Cooperação Econômica e Desenvolvimento, Departamento Estatístico da Comunidade Européia e FINEP- Financiadora de Estudos e Projetos, 2004. Disponível em: <http://www.finep.gov.br/imprensa/sala_imprensa/manual_de_oslo.pdf>. Acesso em: ago. 2012. PANFIETI, M. R. O.; MATSUDA, A. A. A criação do portal cultural da Amunop. Diálogo e interação, 4, 2010. PRAHALAD, C. K., RAMASWAMY, V. Co-creation experiences: the next practice in value creation”. Journal of Interactive Marketing, 18 (3), p.5-14, 2004. SLACK, N. et al. Administração da Produção. São Paulo: Atlas, 2002. Sousa, A.; Agante, P.; Gouveia, L. Communication Model for Sports Media Web Portals. 2014 AASRI Conference on Sports Engineering and Computer Science (SECS 2014). June 21-22, 2014, London, England, 2014. SUNDBO, J.; GALLOUJ, F. Innovation in services. SI4S Synthesis Paper, 1998. TURBAN, E.; KING, D. Comércio eletrônico: estratégia e gestão”. São Paulo: Pearson, 2004.

2nd Annual International Interdisciplinary Conference, AIIC 2014, 8-12 July, Azores, Portugal Proceedings, Vol.3
416
VARGO, S. L., LUSCH, R. F. Evolving to a new dominant logic for marketing. Journal of Marketing, 68, p. 1-17, 2004. ZILBER, S.; N.; FISCHER, N. C.; NOHARA, J. J. Portais corporativos como ferramenta para o relacionamento com o cliente. Revista de Administração e Inovação, São Paulo, 9 (1), p.231-256, jan./mar, 2012.
2nd Annual International Interdisciplinary Conference, AIIC 2014, 8-12 July, Azores, Portugal Proceedings, Vol.3
417
CONCEPTUAL VISION OF AIRPORT GEOGRAPHIC INFORMATION SYSTEM (AGIS)
Anwer Moayed Anwer, B.Sc Civil Engineering Department, College of Engineering, Al-Nahrain University,
Baghdad, Iraq Dr. Asma Thamir Ibraheem
Associate professor in Civil Engineering Department, College of Engineering, Al-Nahrain University, Baghdad, Iraq
Abstract GIS can providethe airport management staff with visual pavement information and powerful analysis tool. Mean while, the spatial information managed by GIS can ensure the accumulation of valid attribute data of airport pavement. Based on the principle and general implementation process of GIS and the characteristics of airport pavement management, this paper describes the implementation process of GIS in Iraqi Airport planning and design. To organize the spatial entities effectively, some layers are set according to the characteristics of spatial entities. The spatial database is established,and thenthe function design of the GIS software is presented including map exploring, map locating, spatial query, rendering style of map and output of map. In this paper the section on the ground was the case study, Representative the AGIS in building infrastructure layers of Baghdad international airport buildings and pavements. The results were two maps, the first include eleven layers and the other includes two layers, each layer hasinformation that describes the thickness of subsurface. In consequence of the above, comparative study for each type of pavement was made to find the most suitable pavement structure for Baghdad International Airport (BIAP).
Keywords: Airport, AGIS, GIS, Information Technology (IT), Pavement, Planning.
Introduction There are two major types of pavement utilized in the construction of runways, taxiways and aprons for airports handling the wide Varity of aircraft traffic of today. These types are classified generally as rigid pavement and flexible pavement, each involving a different approach of analysis, design and construction. Which one is used, depends upon local conditions, construction difficulties and economics. In consequence of the above, comparative study for each type of pavement shall be made to find the most suitable pavement structure for Baghdad International Airport (BIAP) (FOUGEROLLE and SPIE, 1978).
As the process of comparison, the following four types of pavement are studied, of which the first three types are considered as rigid pavement, and at last one being a flexible pavement: 1. Ordinary Portland cement concrete pavement with temperature reinforcement, hereafter
called “NC” pavement. 2. Continuously reinforced concrete pavement, hereafter called “CRC” pavement. 3. Pre-stressed concrete pavement, hereafter called “PC” pavement. 4. Flexible pavement, hereafter called “AC” pavement.

2nd Annual International Interdisciplinary Conference, AIIC 2014, 8-12 July, Azores, Portugal Proceedings, Vol.3
418
Airports are inherently spatial. From planning to maintenance to security, airport managers need to know where events are taking place. GIS adds spatial information and 3D modeling to the airport manager's toolkit to support efficient operations. For example, the ability to use 3D and elevation measurements in the GIS environment helps you visualize the location of flight path obstructions. GIS server technology serves maps and other information, such as noise monitoring results, to the public via the Internet.
Commercial, emergency, and defense-related airfields use GIS to: 1. Manage facilities, both air side and land side. 2. Model and monitor noise. 3. Track environmental compliance. 4. Manage construction and maintenance. 5. Plan traffic and capacity.
In the strictest sense, a GIS is a computer system capable of assembling, storing, manipulating, and displaying geographically referenced information (that is data identified according to their locations). Practitioners also regard the total GIS as including operating personnel and the data that go into the system (Science for Changing World, 2007). Airport Geographic Information System (AGIS) Geographic Information Systems (GIS) are increasingly being implemented by airport operators. Airport operators today face unprecedented challenges to provide greater safety and security for passengers, while still efficiently managing their facilities. Modern airports are finding an integrated geographic information system (GIS) that can help in to better management both air and ground side operations. Some of the applications can be classified into two groups follows as (Airport Technology, Esri, 2012): 2.1 In the air • Flight Tracking: commercial airlines and air traffic control regulators use GIS for
airspace planning and routing applications, integrated flight monitoring, and real time flight tracking. These applications facilitate greater airspace efficiencies, and support a number of security and public information programs, including noise monitoring and real time flight arrival information.
• Three Dimensional Analysis: Recent enhancements to three-dimensional GIS allow more advanced airspace modeling applications to be combined with geographic information from the surrounding communities, such as land use, building heights and modified terrain around the airport. These applications provide a better common operational picture around modern airports, and are used for security vulnerability, obstruction analysis and land use permitting.
• Navigation: Numerous aviation administrations have discovered the benefits of ArcGIS: a database driven aeronautical solution used to create Enroute charts for navigation. Because all the critical information is stored in the database, updates are easily made and seamlessly incorporated into the navigational charts.
2.2 On the ground Modern airports are some of the most intensively used facilities, and must remain at a high level of performance at all times of the year, sometimes under trying circumstances. To meet these challenges, airport managers are turning to GIS technology to support their efforts in planning, operation, maintenance, and security by adding spatial information and modeling capabilities. GIS provides them with unique information and analytical power not available in

2nd Annual International Interdisciplinary Conference, AIIC 2014, 8-12 July, Azores, Portugal Proceedings, Vol.3
419
other information systems. and most important of all, a comprehensive GIS can support a wide array of airport missions. • Planning and Design: many engineering firms have adopted GIS as a tool for expansion
studies and design reviews. Using mapping data from the local community, such as ground access, neighborhood constraints and environmental sensitivities, can significantly reduce the time spent analyzing significant land use issues, particularly for expansions of land locked facilities in large, densely populated urban areas .
GIS software can now provide a greater level of interoperability with other key software tools such as Computer Aided Design (CAD) systems and relational database management systems, allowing airport managers to better integrate their information technology environment. Users can now bring information captured in digital aerial photographs, environmental and design data into the same environment for analysis and planning.
• Operations: Significant growth in traffic has left many airport properties severely constrained for space. Airport managers must carefully balance security concerns with increasing revenue requirements. GIS can be integrated with property management applications, and used to effectively manage competing needs for revenue-generating facilities and readjust facilities for the ever-changing needs of their tenants.
• Maintenance: Airports have discovered the value of GIS in a modern maintenance management system. From pavement and runway lighting systems, to terminal side facilities, GIS can provide a powerful graphical component to the maintenance of an airport's critical infrastructure.
• Security: The security needs of airports have been significantly revised in recent years. GIS provides a powerful analytic capability for understanding vulnerability in existing facilities, and a way to integrate disparate security information into a single command environment. Airports have discovered that GIS is an integral part of a well designed security infrastructure, from perimeter control to terminal side access control and monitoring.
Airport Planning Studies Airport planning may be defined as the employment of an organized strategy for the future management of airport operations, facilities designs, airfield configurations, financial allocations and revenues, environmental impacts, and organizational structures. There are various types of airport planning studies, including: • Facilities planning: Which focuses on future needs for airfield infrastructure such as
runways, taxiways, aircraft parking facilities, associated lighting, communication and navigational systems, terminal buildings and facilities, parking lots, ground access infrastructure, and support facilities such as fuel farms, power plants, and no-aeronautical land uses such as office parks, hotels, restaurants, or rental car locations.
• Financial planning: Which is concerned with predicting future revenues and expenses, budgeting resources, and planning for financial assistance through grant programs, bond issues, or private investment?
• Economic planning: Which considers the future of economic activity, such as trade and commerce, and the activity of industries that exist on airport and off-airport property and are either a direct or indirect result of airport operations.
• Environmental planning: Which concentrates on maintaining or improving existing environmental conditions in the face of changes in future airport activity. Environmental planning includes land use planning, noise mitigation, wetland reclamation, and wildlife preservation.
2nd Annual International Interdisciplinary Conference, AIIC 2014, 8-12 July, Azores, Portugal Proceedings, Vol.3
420
• Organizational planning: Which entails the management of future labor requirements and organizational structures for the airport administration, staff, and associated labor force.
• Strategic planning: Which encompasses all other planning activities into a coordinated effort to maximize the future potential of the airport to the community. (Wells and Yung, 2004
Airport Development An airport is established at a particular situation, not as an individual unit but as part of anetwork for the entire region or the country so as to ensure integrated long range development. Before planning an airport, every detail has to be worked out in an orderly manner for a particular set of conditions such as potential air traffic originating in the vicinity, number and type of aircrafts which are likely to use the airport, its location with respect to nearby airport, whether it is going to be used for commercial, defuse or mixed traffic, actual need of the area for present as well as future anticipated requirement.
On the basis of the proposed development of the region, an area airport plan or a master plan is usually prepared and the establishment of new airports or extensions and improvements of the old ones goes on steadily accordingly depending upon the new needs. The master plan, which is a written and a graphic documentation of complete earlier, investigation, evaluation and location etc., includes information about: • The evaluation of existing airport facilities , • Anticipation of future facilities ,and • The relative urgency of the component parts so that only appropriate type of airport is
provided at any place. Airport Geographic Information System (AGIS) GIS is a computerized database management system that provides geographic access (capture, storage retrieval, analysis and display) to spatial data. GIS provides an excellent means for civil engineers to manipulate and examine the complex data usually required in the design and analysis processes. As a result, civil engineers deal with a voluminous amount of GIS allows civil engineers to manage and share data with easily understood reports and visualizations that can be analyzed and communicated to others. This data can be related to both project level and its broader geographic context.
GIS software provides civil engineers with the framework formaintaining and deploying critical data and applications across every aspect of the infrastructure project life cycleincluding planning and design, data collection and management, spatial analysis, construction, and operations management and maintenance. The provides the tools to assemble intelligent GIS applications and improve a project process by giving engineers, construction contractors, surveyors, and analysts a single data source from which to work. Centrally hosting applications and data makes it easy to manage, organize, and integrate geographic data, including CAD data, from existing databases to visualize, analyze, and make decisions. ArcGIS for Airport Application Arc GIS is a desktop geographic information system (GIS) from Environmental Systems Research Institute, Inc. (ESRI). A GIS is a database that links information to location (it connects what to the where), allowing you to see and analyze data in new and useful ways.
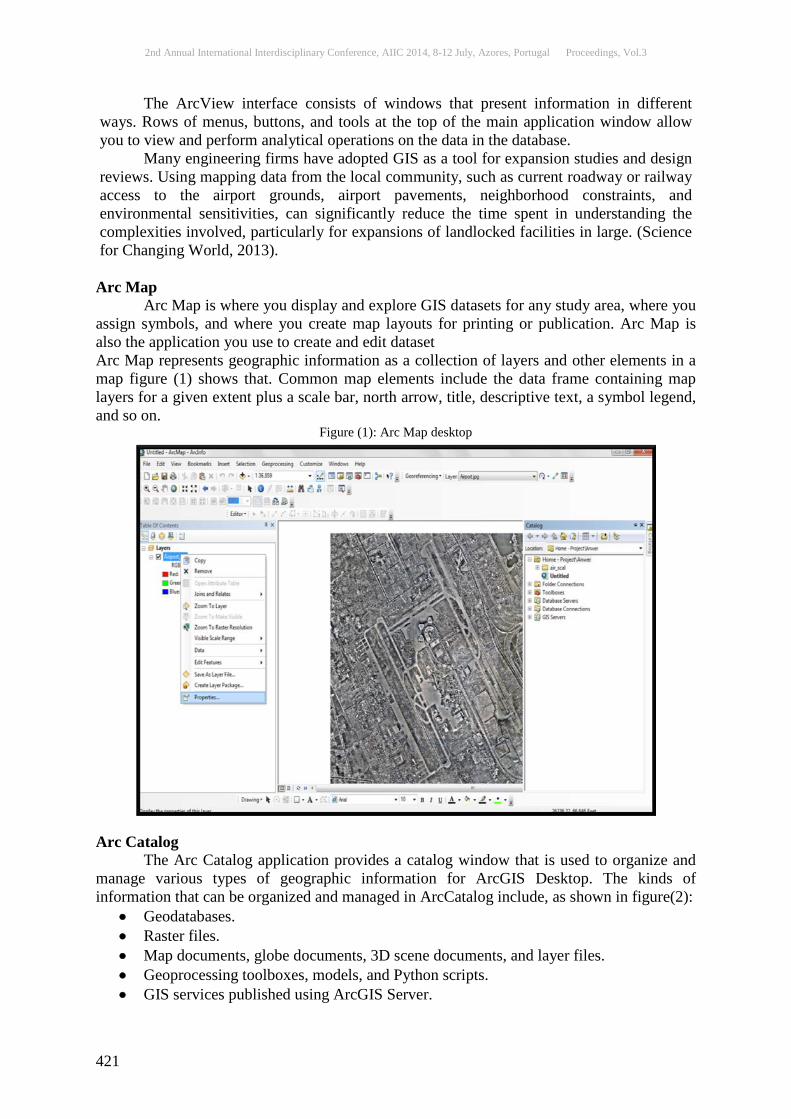
2nd Annual International Interdisciplinary Conference, AIIC 2014, 8-12 July, Azores, Portugal Proceedings, Vol.3
421
The ArcView interface consists of windows that present information in different ways. Rows of menus, buttons, and tools at the top of the main application window allow you to view and perform analytical operations on the data in the database. Many engineering firms have adopted GIS as a tool for expansion studies and design reviews. Using mapping data from the local community, such as current roadway or railway access to the airport grounds, airport pavements, neighborhood constraints, and environmental sensitivities, can significantly reduce the time spent in understanding the complexities involved, particularly for expansions of landlocked facilities in large. (Science for Changing World, 2013). Arc Map Arc Map is where you display and explore GIS datasets for any study area, where you assign symbols, and where you create map layouts for printing or publication. Arc Map is also the application you use to create and edit dataset Arc Map represents geographic information as a collection of layers and other elements in a map figure (1) shows that. Common map elements include the data frame containing map layers for a given extent plus a scale bar, north arrow, title, descriptive text, a symbol legend, and so on.
Figure (1): Arc Map desktop
Arc Catalog The Arc Catalog application provides a catalog window that is used to organize and manage various types of geographic information for ArcGIS Desktop. The kinds of information that can be organized and managed in ArcCatalog include, as shown in figure(2):
• Geodatabases. • Raster files. • Map documents, globe documents, 3D scene documents, and layer files. • Geoprocessing toolboxes, models, and Python scripts. • GIS services published using ArcGIS Server.
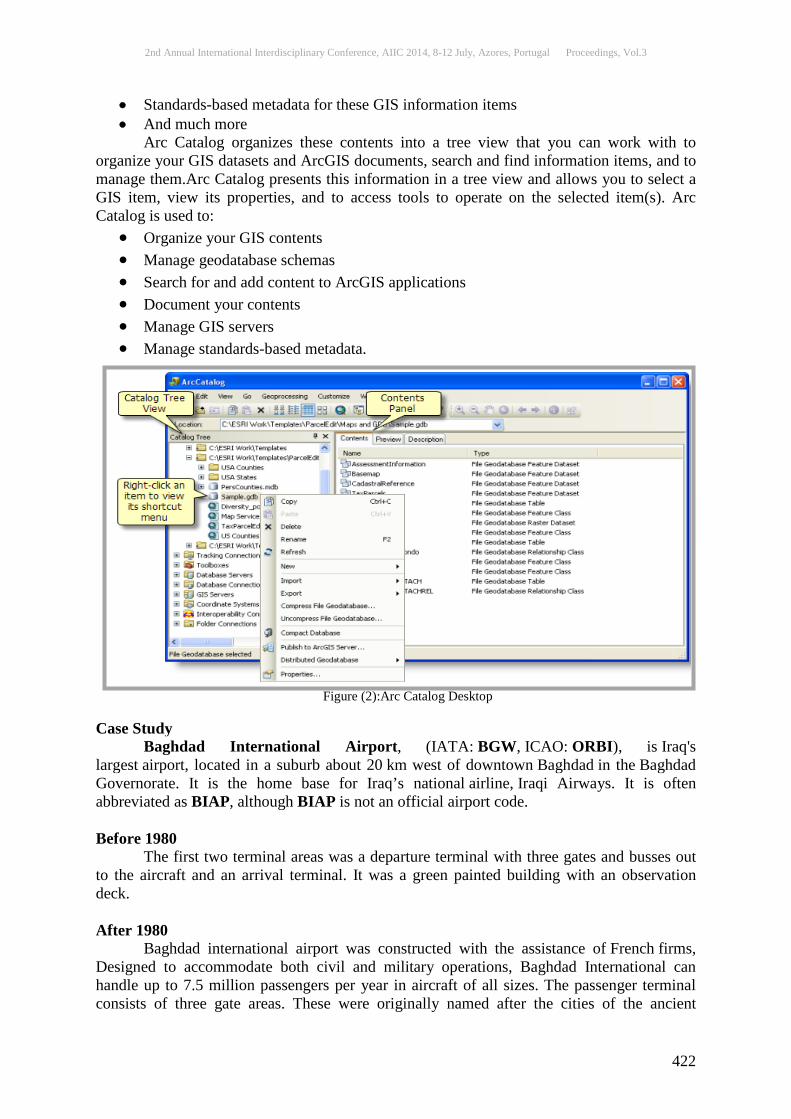
2nd Annual International Interdisciplinary Conference, AIIC 2014, 8-12 July, Azores, Portugal Proceedings, Vol.3
422
• Standards-based metadata for these GIS information items • And much more
Arc Catalog organizes these contents into a tree view that you can work with to organize your GIS datasets and ArcGIS documents, search and find information items, and to manage them.Arc Catalog presents this information in a tree view and allows you to select a GIS item, view its properties, and to access tools to operate on the selected item(s). Arc Catalog is used to:
• Organize your GIS contents • Manage geodatabase schemas • Search for and add content to ArcGIS applications • Document your contents • Manage GIS servers • Manage standards-based metadata.
Figure (2):Arc Catalog Desktop
Case Study Baghdad International Airport, (IATA: BGW, ICAO: ORBI), is Iraq's largest airport, located in a suburb about 20 km west of downtown Baghdad in the Baghdad Governorate. It is the home base for Iraq’s national airline, Iraqi Airways. It is often abbreviated as BIAP, although BIAP is not an official airport code. Before 1980 The first two terminal areas was a departure terminal with three gates and busses out to the aircraft and an arrival terminal. It was a green painted building with an observation deck. After 1980 Baghdad international airport was constructed with the assistance of French firms, Designed to accommodate both civil and military operations, Baghdad International can handle up to 7.5 million passengers per year in aircraft of all sizes. The passenger terminal consists of three gate areas. These were originally named after the cities of the ancient

2nd Annual International Interdisciplinary Conference, AIIC 2014, 8-12 July, Azores, Portugal Proceedings, Vol.3
423
empires that once existed in present-day Iraq: Babylon, Samarra, and Nineveh. They are now simply called B, C and D.
The airport also had its own VIP terminal, which had a luxuriously furnished and decorated lounge, conference room and bedroom. This terminal is a VIP terminal, to welcome foreign leaders and other significantly persons. Baghdad International Airport was once served by several international airlines. First Step: Building The Layers of Map
• Runways:In Baghdad airport there are two runways, first one has a length of 4000m and a width of 60 m, the second has a length of 3000m and a width of 45m, figure (4) shows the layers of runway.
• Runways Shoulder: For the different runway, the width of shoulders are 3.5 m for long runway and 7m for the other runway, these shoulders are using for the airfield lighting, band holes and cabling. Figure (5) shows the layers.
• Taxiways: Types of taxiways are parallel and connecting taxiway and its path of airplanes to the runway.
• Taxiways Shoulder: Area of flexible pavement in both side of taxiways used for airfield lighting and cabling.
• Blast Pads: Areas where it situated at the beginning and at the end of the runway. • Aprons:The portion of airport, in front of the terminal buildings or adjacent to
hangers, meant for parking, loading and unloading of the aircraft. • Apron Service Roads:Roads for serving the apron. • Public and Service Access Roads: Network of roads, using from the passenger to
assess the terminal buildings inside the airport and also for other services. • Roads Shoulder: Parts on the side of public roads. • VVIP Access And Airfield Service Roads: These types of roads are use only for a
VIP passenger and maintenance staff of airport. • Car parks:Place where the passengers and staff parks their cars.
Developing the Final Map Two final maps were developed, the first image as shown in figure (3)includes (BIAP Roads which represented in eleven layers, scale bar and compass direction), the second image as sown in figure(4) includes (BIAP pavement which represented in two layers, scale bar and compass direction).
Figure (3): BIAP Roads

2nd Annual International Interdisciplinary Conference, AIIC 2014, 8-12 July, Azores, Portugal Proceedings, Vol.3
424
Figure (4): BIAP Pavemen These two maps were produced according to the rules of drawing and production of maps and utilized from the Engineering Unit in Baghdad International Airport Second Step: Building The Database of Map At the beginning we must have a personal geodatabases containing the work; figure (5) shows the buildings of that.
Figure (5): Personal Geodatabase Then inside the geodatabase must create a new feature dataset as shown in figure (6), in order to collect the data of feature classes.
Figure (6): New Feature Dataset
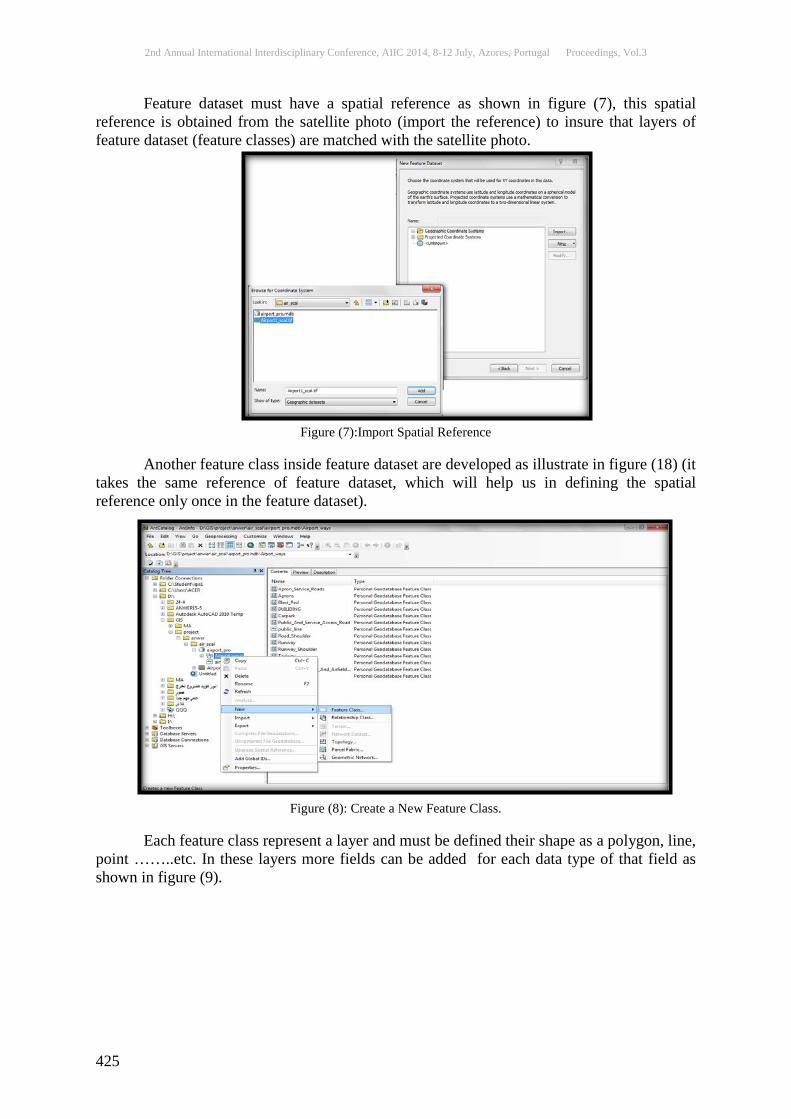
2nd Annual International Interdisciplinary Conference, AIIC 2014, 8-12 July, Azores, Portugal Proceedings, Vol.3
425
Feature dataset must have a spatial reference as shown in figure (7), this spatial reference is obtained from the satellite photo (import the reference) to insure that layers of feature dataset (feature classes) are matched with the satellite photo.
Figure (7):Import Spatial Reference Another feature class inside feature dataset are developed as illustrate in figure (18) (it
takes the same reference of feature dataset, which will help us in defining the spatial reference only once in the feature dataset).
Figure (8): Create a New Feature Class.
Each feature class represent a layer and must be defined their shape as a polygon, line,
point ……..etc. In these layers more fields can be added for each data type of that field as shown in figure (9).
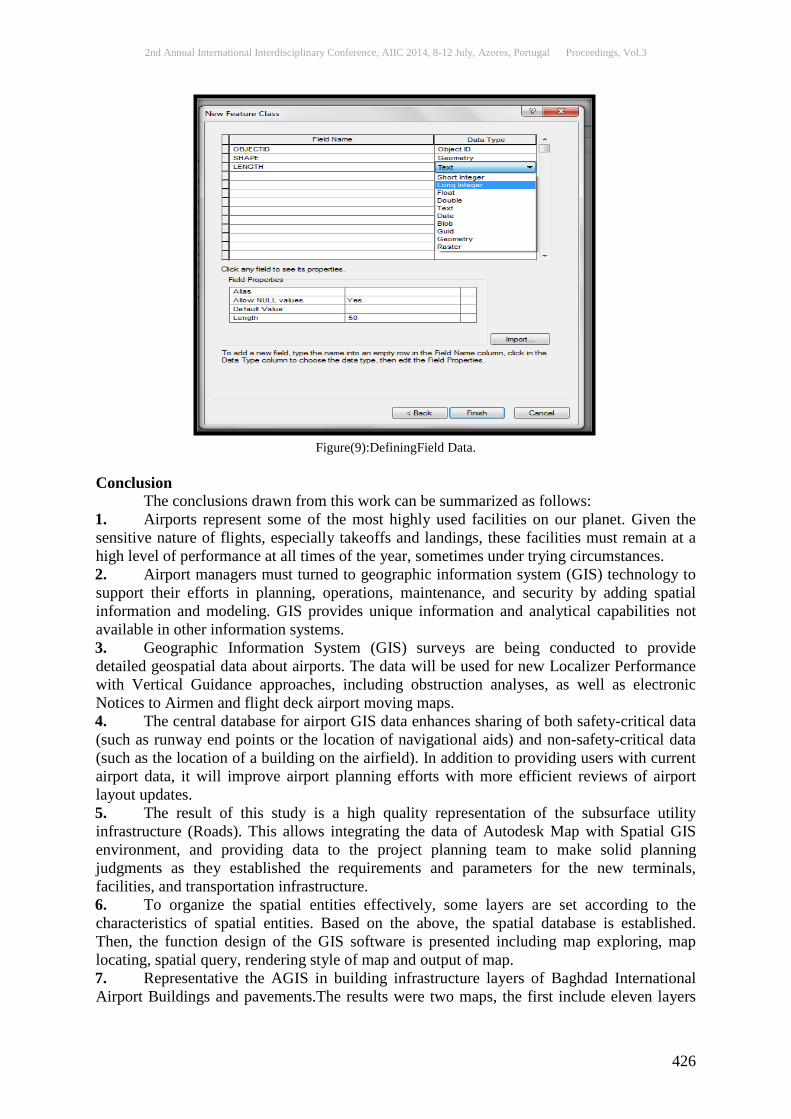
2nd Annual International Interdisciplinary Conference, AIIC 2014, 8-12 July, Azores, Portugal Proceedings, Vol.3
426
Figure(9):DefiningField Data. Conclusion The conclusions drawn from this work can be summarized as follows: 1. Airports represent some of the most highly used facilities on our planet. Given the sensitive nature of flights, especially takeoffs and landings, these facilities must remain at a high level of performance at all times of the year, sometimes under trying circumstances. 2. Airport managers must turned to geographic information system (GIS) technology to support their efforts in planning, operations, maintenance, and security by adding spatial information and modeling. GIS provides unique information and analytical capabilities not available in other information systems. 3. Geographic Information System (GIS) surveys are being conducted to provide detailed geospatial data about airports. The data will be used for new Localizer Performance with Vertical Guidance approaches, including obstruction analyses, as well as electronic Notices to Airmen and flight deck airport moving maps. 4. The central database for airport GIS data enhances sharing of both safety-critical data (such as runway end points or the location of navigational aids) and non-safety-critical data (such as the location of a building on the airfield). In addition to providing users with current airport data, it will improve airport planning efforts with more efficient reviews of airport layout updates. 5. The result of this study is a high quality representation of the subsurface utility infrastructure (Roads). This allows integrating the data of Autodesk Map with Spatial GIS environment, and providing data to the project planning team to make solid planning judgments as they established the requirements and parameters for the new terminals, facilities, and transportation infrastructure. 6. To organize the spatial entities effectively, some layers are set according to the characteristics of spatial entities. Based on the above, the spatial database is established. Then, the function design of the GIS software is presented including map exploring, map locating, spatial query, rendering style of map and output of map. 7. Representative the AGIS in building infrastructure layers of Baghdad International Airport Buildings and pavements.The results were two maps, the first include eleven layers

2nd Annual International Interdisciplinary Conference, AIIC 2014, 8-12 July, Azores, Portugal Proceedings, Vol.3
427
and the other includes two layers, each layer has information that describes the thickness of subsurface
Acknowledgement Its my pleasure to thank my supervisor which gave me all the support during the research, also the group of engineering in Baghdad International Airport whose help me in collecting the data. I participated in the 7th Scientific Sovereignty Conference hosted by the Ministry of Youth and Sport / Republic of Iraq in Baghdad and received 1st prize in this conference. References: AirportTechnology,Esri,(2012). http://www.airport-technology.com/features/feature760 Alexander T. Wells,and Seth B. Young, (2004),”Airport Planning and Management”, 5th Edition. Ashford Norman and Wright Paul, (1979), “Airport Engineering”. Federal Aviation Administration (FAA) https://airports-gis.faa.gov. FOUGEROLLE and SPIE – BATIGNOLLES, Sponsoring Company for Baghdad International Airport, Drawings, (1978), France. GIS Solutions for Airports and Aviation, ESRI, 380 New York Street Ibraheem A. Th. “The Application of Geographical Information System in Civil Engineering”, Integrating Teaching and Research with Community Service, Book No. 87, pp: 436-455, “The Application of Geographical Information System in Civil Engineering”,College of Engineering, University of Sharjah, United Arab Emirates. PP: 436-454, 2008. Kazda Antonin and Caves Robert E., (2000),” AIRPORT DESIGN AND OPERATION”,1st Edition. Kumar Virendra and Chandra Satish, (1999), “Air Transportation Planning and Design”, 1st Edition. Pacific Consultants International Mitsubishi Corporation, Consultant for Baghdad International Airport, Vol. 3, (1978), Tokyo, Japan. Redlands, California, 92373-8100, USA. Sehgal S. B. and Bhanot K. L., (1966),” Highway Engineering and Airports”,1st Edition, India. List of Abbreviations
BIAP Baghdad International Airport GIS Geographic information system
AGIS Airport Geographic Information System CBR California Bering Ratio
K Modulus of Subgrade Reaction NC Ordinary Portland cement concrete
CRC Continuously reinforced concrete PC Pre-stressed concrete AC Asphalt concrete

2nd Annual International Interdisciplinary Conference, AIIC 2014, 8-12 July, Azores, Portugal Proceedings, Vol.3
428
CLOUD COMPUTING AND SECURITY OF INFORMATION ASSETS
Ing. Miloslav Macháček, PhD University of Pardubice, Faculty of Electrical Engineering and Informatics
Department of Information Technology Czech Republic
Abstract This paper deals with cloud computing technology and the protection of information assets in the company. The tools and system for safety management of information assets is presented in the paper. The system design contains a detailed methodology. The use of this methodology will enable effective decision making.
Keywords: Assets, cloud computing, security and threat. Introduction
Many organizations and commercial companies do not know their assets and do not know they are the most valuable asset you own. Assets have huge value for organization or company.
Security and protection of information assets can be divided into two basic groups: - Protection against damage or loss due to natural disaster, equipment failure or human
error. The goal is not alienate or destroy data. - Protection against damage or loss inside in the Company's operations. Deliberately
damage HW or SW, illegally obtain, degrade or alter the information is the aim. Information security management system (ISMS) deals with access to information
security management. ISMS is a summary of the measures, policies, rules, uses standards and others.
Companies take decisions on the use of cloud computing technologies more and more often nowadays. Unfortunately, companies do not know the risks and opportunities of this technology.
Technology of Cloud Computing
Cloud computing layer separates servers from applications using visualization. The technology provides methods and means for centralizing services from data centers.
Cloud computing tools allow you to manage a data center efficiently. Data centers provide effective services to users of information systems.
Cloud computing involves a large group of technology solutions and opens up many problems. This includes operational reliability and also concerns the security of data which are stored in the public data center.
Cloud computing is moving slowly into the private data center. Suppliers of information systems operate these data centers.
Cloud computing offers three levels which are layered on each other. Levels: - Virtualization of infrastructure - Virtualization of platforms - Virtualization of services
2nd Annual International Interdisciplinary Conference, AIIC 2014, 8-12 July, Azores, Portugal Proceedings, Vol.3
429
Virtualization infrastructure builds a farm which consists of servers, disk array, network infrastructure and management tools for cloud computing. Suppliers of information systems implement virtual servers from ready-made templates in these virtual data centers.
Virtualization platform allows the unification of information systems. This allows reducing the cost of running the data center. Suppliers of information systems use a virtual application and database servers. Virtualization platform is advantageous for the implementation of all applications. The requirements of information systems can be reduced significantly. Qualified administrators managing platform can be shared.
Virtualization of services is the goal of technology Cloud Computing. Visualization services in private cloud computing is used mainly for large organizations. The parent organizations operate information systems of subordinated organizational units in its data center.
Category of Cloud Computing
Cloud computing can be divided by the type of service: - SaaS - Software as a Service. An application (use of software) is a service. The
service is available in the internet. It's like hosting software. - PaaS - Platform as a Service. The platform is the service. Customer will use the
provider's complete development environment and at the same time he creates and runs own applications in this environment.
- IaaS - Infrastructure as a Service. Infrastructure is the service. Customer rents for himself hardware and infrastructure. The customer uses a custom application in this case.
Cloud computing can be divided by the type of cloud: - Public cloud. The supplier provides all services. The client does not have its own
extensive capacity of ICT and software licenses. - Private Cloud. The company is the operator of the cloud. It's the owner ICT and
software. The Company uses the system in its entirety. The system is accessible only within the company. Only authorized persons can benefit cloud.
Cloud Computing and Gartner
Julian Arias Beltran features in [5] company Gartner. Gartner is the world's leading IT research and advisory company. They guide thousands of organizations in the right direction with insights into the technological world. One of the famous tools invented by Gartner is the Hype Cycle.
The Hype Cycle was introduced in 1995, and is used to show the interest or "hype" and resulting disappointment which usually happen after the introduction of a new technology.
The purpose of the Hype cycles is to show how and when technologies move beyond the "hype", which is used by companies to see whether certain technologies are worth investing in and if it’s ready for adoption within the business.
One example of this can be seen with cloud and Big Data. Although many companies have started to embrace the cloud, many companies, particularly small to medium sized business were holding back because of concerns. Security, privacy and legality were the main concerns for organizations moving to cloud (and still is a concern for several businesses). But now that the "Hype" is on the up slope of the Hype Cycle, these concerns are fading away while more and more businesses jump on the cloud bandwagon.
Gartner Hype Cycle is a graphic representation of the maturity, adoption and social application of specific technologies. There are five phases in the Hype cycle:
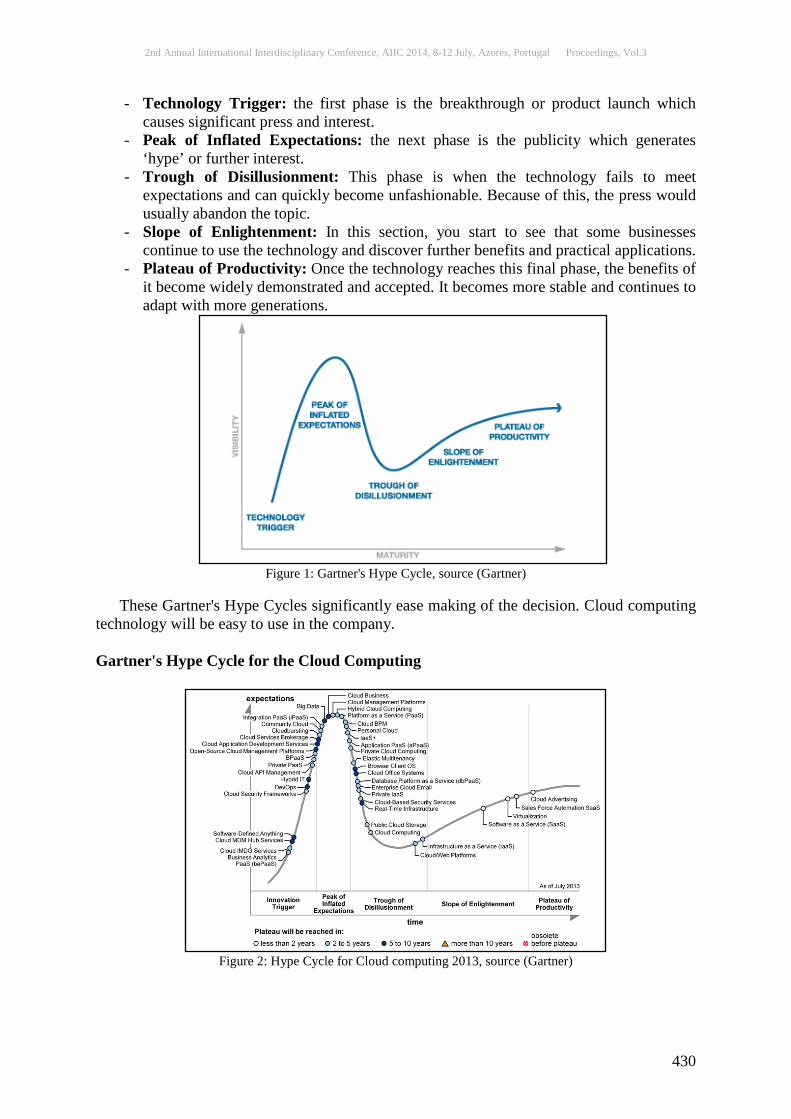
2nd Annual International Interdisciplinary Conference, AIIC 2014, 8-12 July, Azores, Portugal Proceedings, Vol.3
430
- Technology Trigger: the first phase is the breakthrough or product launch which causes significant press and interest.
- Peak of Inflated Expectations: the next phase is the publicity which generates ‘hype’ or further interest.
- Trough of Disillusionment: This phase is when the technology fails to meet expectations and can quickly become unfashionable. Because of this, the press would usually abandon the topic.
- Slope of Enlightenment: In this section, you start to see that some businesses continue to use the technology and discover further benefits and practical applications.
- Plateau of Productivity: Once the technology reaches this final phase, the benefits of it become widely demonstrated and accepted. It becomes more stable and continues to adapt with more generations.
Figure 1: Gartner's Hype Cycle, source (Gartner)
These Gartner's Hype Cycles significantly ease making of the decision. Cloud computing
technology will be easy to use in the company.
Gartner's Hype Cycle for the Cloud Computing
Figure 2: Hype Cycle for Cloud computing 2013, source (Gartner)
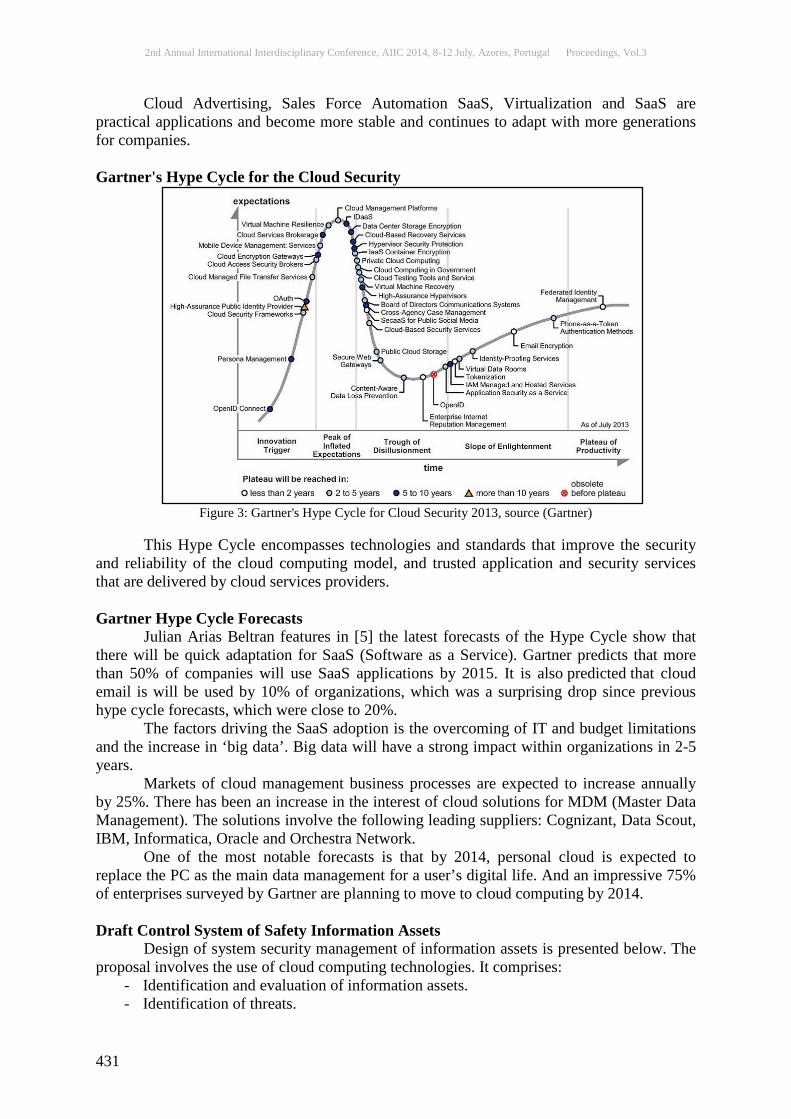
2nd Annual International Interdisciplinary Conference, AIIC 2014, 8-12 July, Azores, Portugal Proceedings, Vol.3
431
Cloud Advertising, Sales Force Automation SaaS, Virtualization and SaaS are practical applications and become more stable and continues to adapt with more generations for companies. Gartner's Hype Cycle for the Cloud Security
Figure 3: Gartner's Hype Cycle for Cloud Security 2013, source (Gartner)
This Hype Cycle encompasses technologies and standards that improve the security
and reliability of the cloud computing model, and trusted application and security services that are delivered by cloud services providers. Gartner Hype Cycle Forecasts
Julian Arias Beltran features in [5] the latest forecasts of the Hype Cycle show that there will be quick adaptation for SaaS (Software as a Service). Gartner predicts that more than 50% of companies will use SaaS applications by 2015. It is also predicted that cloud email is will be used by 10% of organizations, which was a surprising drop since previous hype cycle forecasts, which were close to 20%.
The factors driving the SaaS adoption is the overcoming of IT and budget limitations and the increase in ‘big data’. Big data will have a strong impact within organizations in 2-5 years.
Markets of cloud management business processes are expected to increase annually by 25%. There has been an increase in the interest of cloud solutions for MDM (Master Data Management). The solutions involve the following leading suppliers: Cognizant, Data Scout, IBM, Informatica, Oracle and Orchestra Network.
One of the most notable forecasts is that by 2014, personal cloud is expected to replace the PC as the main data management for a user’s digital life. And an impressive 75% of enterprises surveyed by Gartner are planning to move to cloud computing by 2014.
Draft Control System of Safety Information Assets
Design of system security management of information assets is presented below. The proposal involves the use of cloud computing technologies. It comprises:
- Identification and evaluation of information assets. - Identification of threats.
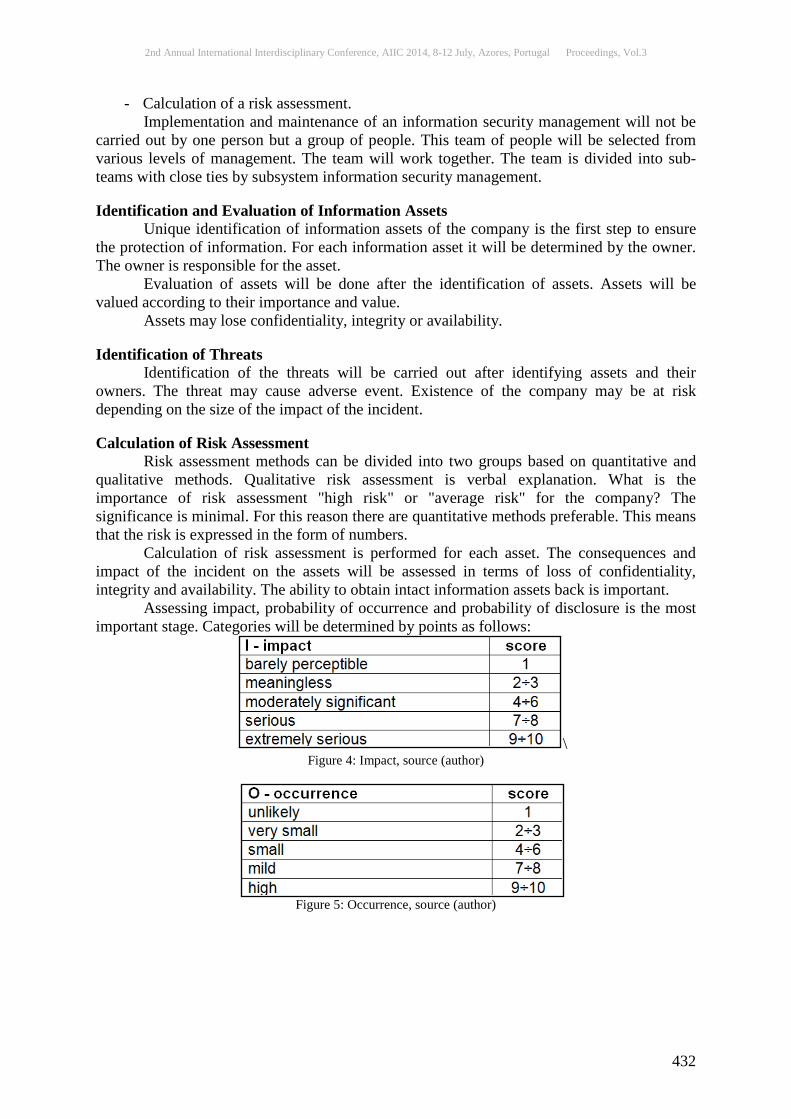
2nd Annual International Interdisciplinary Conference, AIIC 2014, 8-12 July, Azores, Portugal Proceedings, Vol.3
432
- Calculation of a risk assessment. Implementation and maintenance of an information security management will not be
carried out by one person but a group of people. This team of people will be selected from various levels of management. The team will work together. The team is divided into sub-teams with close ties by subsystem information security management.
Identification and Evaluation of Information Assets
Unique identification of information assets of the company is the first step to ensure the protection of information. For each information asset it will be determined by the owner. The owner is responsible for the asset.
Evaluation of assets will be done after the identification of assets. Assets will be valued according to their importance and value.
Assets may lose confidentiality, integrity or availability. Identification of Threats Identification of the threats will be carried out after identifying assets and their owners. The threat may cause adverse event. Existence of the company may be at risk depending on the size of the impact of the incident. Calculation of Risk Assessment
Risk assessment methods can be divided into two groups based on quantitative and qualitative methods. Qualitative risk assessment is verbal explanation. What is the importance of risk assessment "high risk" or "average risk" for the company? The significance is minimal. For this reason there are quantitative methods preferable. This means that the risk is expressed in the form of numbers.
Calculation of risk assessment is performed for each asset. The consequences and impact of the incident on the assets will be assessed in terms of loss of confidentiality, integrity and availability. The ability to obtain intact information assets back is important.
Assessing impact, probability of occurrence and probability of disclosure is the most important stage. Categories will be determined by points as follows:
\ Figure 4: Impact, source (author)
Figure 5: Occurrence, source (author)

2nd Annual International Interdisciplinary Conference, AIIC 2014, 8-12 July, Azores, Portugal Proceedings, Vol.3
433
Figure 6: Disclosure, source (author)
Risk Priority Number (RPN) is a crucial indicator of the risk assessment. RPN is a
multiple of impact, occurrence and disclosure. The following applies: RPN = I ∙ O ∙ D
RPN takes a value in the range 1 ÷ 1000. The severity of risk determines the size of
RPN. The high value of the RPN has a great importance of risk. The company management will determine the acceptable level of risk for each asset.
Unfortunately all risks can’t be eliminated. Risks with high RPN is necessary to eliminate or reduce to an acceptable level. The
company management will propose and implement measures to manage those risks. I recommend use this table for evaluation.
Figure 7: Table for evaluation, source (author)
Information assets are the most valuable for organizations and commercial
companies. Information are vital to the decisions and actions in the management process. Information have to be complete, timely delivery, updated, accessible and economically obtainable.
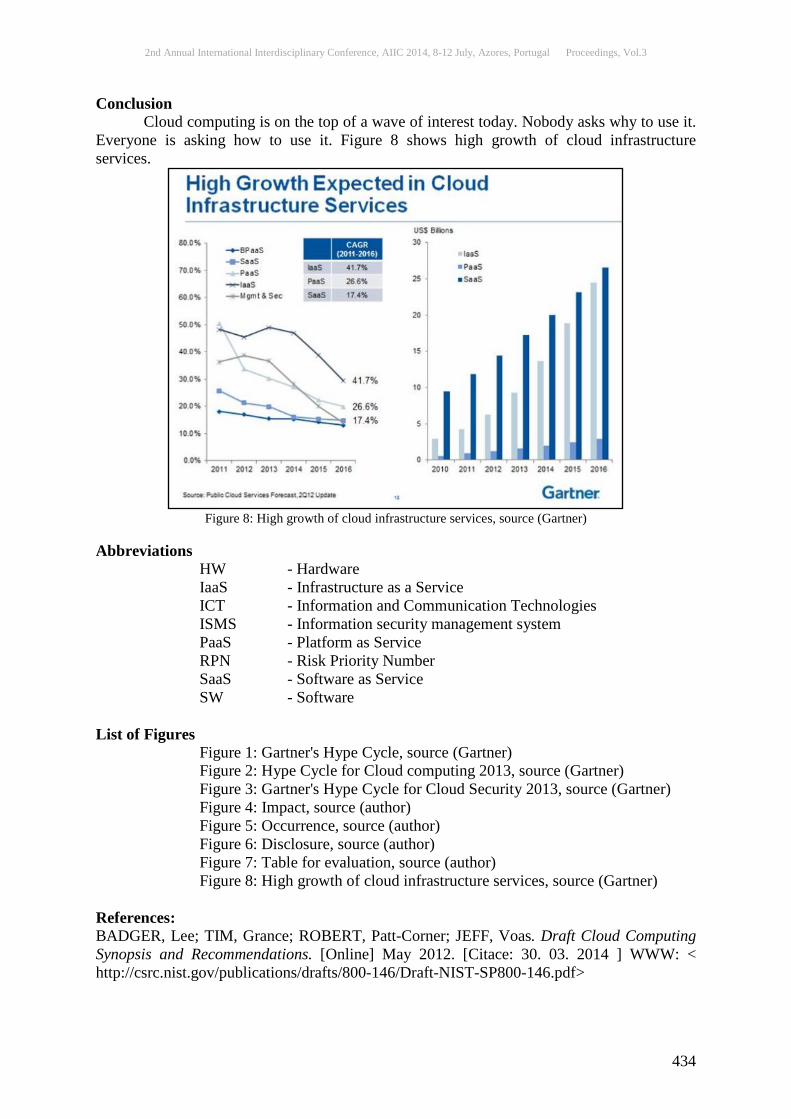
2nd Annual International Interdisciplinary Conference, AIIC 2014, 8-12 July, Azores, Portugal Proceedings, Vol.3
434
Conclusion Cloud computing is on the top of a wave of interest today. Nobody asks why to use it.
Everyone is asking how to use it. Figure 8 shows high growth of cloud infrastructure services.
Figure 8: High growth of cloud infrastructure services, source (Gartner)
Abbreviations
HW - Hardware IaaS - Infrastructure as a Service ICT - Information and Communication Technologies ISMS - Information security management system PaaS - Platform as Service RPN - Risk Priority Number SaaS - Software as Service SW - Software
List of Figures
Figure 1: Gartner's Hype Cycle, source (Gartner) Figure 2: Hype Cycle for Cloud computing 2013, source (Gartner) Figure 3: Gartner's Hype Cycle for Cloud Security 2013, source (Gartner) Figure 4: Impact, source (author) Figure 5: Occurrence, source (author) Figure 6: Disclosure, source (author) Figure 7: Table for evaluation, source (author) Figure 8: High growth of cloud infrastructure services, source (Gartner)
References: BADGER, Lee; TIM, Grance; ROBERT, Patt-Corner; JEFF, Voas. Draft Cloud Computing Synopsis and Recommendations. [Online] May 2012. [Citace: 30. 03. 2014 ] WWW: < http://csrc.nist.gov/publications/drafts/800-146/Draft-NIST-SP800-146.pdf>

2nd Annual International Interdisciplinary Conference, AIIC 2014, 8-12 July, Azores, Portugal Proceedings, Vol.3
435
BROUSELL, Lauren. CIOs are putting the cloud first. [Online] 14. june 2011. [Citace: 30. 03. 2014] WWW: <http://www.cio.com/article/684338/Survey_CIOs_Are_Putting_the_Cloud_First.> ČESKÝ NORMALIZAČNÍ INSTITUT. ČSN ISO/IEC 27000 Informační technologie - Bezpečnostní techniky - Systémy řízení bezpečnosti informací - Přehled a slovník. Praha, 2010. DOLEJŠOVÁ, Miroslava. Risks in the information systems and their evaluation. E+M Economics and Management. 4/2007, roč. 10, p. 118 - 122. ISSN 1212-3609. JULIAN ARIAS, Beltran. What is the Gartner Hype Cycle? [Online] May 2013. [Citace: 30. 03. 2014 ] WWW: < http://blog.firebrandtraining.co.uk/2013/05/what-is-gartner-hype-cycle-latest-hype.html> GARTNER. Methodologies Hype Cycles. [Online] 30. 03. 2014. [Citace: 30. 03. 2014] WWW: <http://www.gartner.com/technology/research/methodologies/hype-cycle.jsp> JOINT TASK FORCE TRANSFORMATION INITIATIVE. Information security. Computer Security Division, Information Technology Laboratory, National Institute of Standards and Technology. Gaithersburg, 2011. NIST Special Publication 800-39, 88 pages. MD 20899-8930. MACHÁČEK, Miloslav. The Informative Safeness in Practice. Collection of contribution X. Annual International Conference The internet, competitiveness and the organisational security. Tomas Bata University in Zlin, 26th March 2008. p. 39. ISBN 978-80-7318-548-0. MACHÁČEK, Miloslav; ŽÁK, David. Wireless data transmission and information security in the Czech Railways. Internet, Competitiveness and Organisational Security in Knowledge Society XI. Annual International Conference. Tomas Bata University in Zlin, 24 - 25th March 2009. p. 41. ISBN 978-80-7318-828-3. MELL, Peter; GRANCE, Timothy. The NIST Definition of Cloud Computing. [Online] september 2011. [Citace: 30. 03. 2014] WWW: < http://csrc.nist.gov/publications/nistpubs/800-145/SP800-145.pdf> PATTINSON, Fiona. Certifying Information Security Management Systems. CISSP, CSDP, Atsec information securitycorporation, RSA Conference, July 2007. 11 pages. THE DISTRIBUTED MANAGEMENT TASK FORCE. Cloud Management Initiative. [Online] 30. 03. 2014. [Citace: 30. 03. 2014] WWW: < http://dmtf.org/standards/cloud>
2nd Annual International Interdisciplinary Conference, AIIC 2014, 8-12 July, Azores, Portugal Proceedings, Vol.3
436
NUMERICAL APPLICATIONS OF THE METHOD OF HURWITZ-RADON MATRICES
Dariusz Jacek Jakóbczak, PhD Department of Computer Science and Management,
Technical University of Koszalin , Poland
Abstract Computer sciences need suitable methods for numerical calculations of interpolation, extrapolation, quadrature, derivative and solution of nonlinear equation. Classical methods, based on polynomial interpolation, have some negative features: they are useless to interpolate the function that fails to be differentiable at one point or differs from the shape of polynomial considerably, also the Runge’s phenomenon cannot be forgotten. To deal with numerical interpolation, extrapolation, integration and differentiation dedicated methods should be constructed. One of them, called by author the method of Hurwitz-Radon Matrices (MHR), can be used in reconstruction and interpolation of curves in the plane. This novel method is based on a family of Hurwitz-Radon (HR) matrices. The matrices are skew-symmetric and possess columns composed of orthogonal vectors. The operator of Hurwitz-Radon (OHR), built from that matrices, is described. It is shown how to create the orthogonal and discrete OHR and how to use it in a process of function interpolation and numerical differentiation. Created from the family of N-1 HR matrices and completed with the identical matrix, system of matrices is orthogonal only for dimensions N = 2, 4 or 8. Orthogonality of columns and rows is very significant for stability and high precision of calculations. MHR method is interpolating the function point by point without using any formula of function. Main features of MHR method are: accuracy of curve reconstruction depending on number of nodes and method of choosing nodes, interpolation of L points of the curve is connected with the computational cost of rank O(L), MHR interpolation is not a linear interpolation.
Keywords: Point extrapolation, zero of function, curve interpolation, numerical integration, numerical differentiation, MHR method Introduction Many applications of numerical methods don’t use the formula of function, but only finite set of the points (nodes). The following question is important in mathematics and computer sciences: is it possible to find a method of function interpolation and extrapolation, numerical integration and differentiation without building the interpolation polynomials or other functions? This paper aims at giving the positive answer to the question. Current methods for numerical calculation of derivatives are mainly based on classical polynomial interpolation: Newton, Lagrange or Hermite polynomials and spline curves which are piecewise polynomials (Dahlquist et al. 1974; Jankowska et al. 1981). Classical methods are useless to interpolate the function that fails to be differentiable at one point, for example the absolute value function f(x)=xat x = 0. If point (0;0) is one of the interpolation nodes, then precise polynomial interpolation of the absolute value function is impossible. Also when the graph of interpolated function differs from the shape of polynomial considerably, for example f(x)=1/x, interpolation is very hard because of existing local extrema and the roots of polynomial. We cannot forget about the Runge’s phenomenon: when nodes are equidistance

2nd Annual International Interdisciplinary Conference, AIIC 2014, 8-12 July, Azores, Portugal Proceedings, Vol.3
437
then high-order polynomial oscillates toward the end of the interval, for example close to -1 and 1 with function f(x)=1/(1+25x2) (Ralston 1965). This paper deals with the problem of interpolation (Kozera 2004; Jakóbczak 2009) and numerical differentiation without computing the polynomial or any fixed function. Coordinates of the nodes are used to build the orthogonal Hurwitz-Radon matrix operators (OHR) and a linear (convex) combinations of OHR operators lead to calculation of curve points. Main idea of MHR method is that the curve is interpolated point by point and computing the unknown coordinates of the points. The only significant factors in MHR method are choosing the interpolation nodes and fixing the dimension of HR matrices (N = 2, 4 or 8). Other characteristic features of function, such as shape or similarity to polynomials, derivative or Runge’s phenomenon, are not important in the process of MHR interpolation. The curve is parameterized for value α ∈ [0;1] in the range of two successive interpolation nodes. In this paper computational algorithm is considered and then we have to talk about time. Complexity of calculations for one unknown point in Lagrange or Newton interpolation based on n nodes is connected with the computational cost of rank O(n2). Complexity of calculations for L unknown points in MHR interpolation based on n nodes is connected with the computational cost of rank O(L). This is very important feature of MHR method. The method of Hurwitz-Radon Matrices (MHR)
Adolf Hurwitz (1859-1919) and Johann Radon (1887-1956) published the papers about specific class of matrices in 1923. Matrices Ai, i = 1,2…m satisfying
AjAk+AkAj = 0, Aj2 = -I for j ≠ k; j, k = 1,2...m (1)
are called a family of Hurwitz-Radon matrices. A family of HR matrices (1) has important features: HR matrices are skew-symmetric (Ai
T= - Ai) and reverse matrix Ai-1 = - Ai. Only for
dimension N = 2, 4 or 8 the family of Hurwitz-Radon matrices consists of N-1 matrices (Citko et al. 2005).
For N = 2 we have one matrix :
−
=0110
1A .
For N = 4 there are three matrices with integer entries:
−−
=
01001000
00010010
1A ,
−−
=
0010000110000100
2A,
−
−=
0001001001001000
3A .
For N = 8 we have seven matrices with elements 0, ±1 (Sieńko et al. 2004). Let’s assume there is given a finite set of points of the function, called further nodes (xi,yi)∈R2 such as:
1. nodes are settled at key points (for example local extrema: maximum or minimum) and at least one point between two successive key points;
2. there are five nodes or more. Assume that the nodes belong to a curve in the plane. How the whole curve could be reconstructed using this discrete set of nodes? Proposed method (Jakóbczak 2007; Jakóbczak et al. 2007) is based on local and orthogonal matrix operators. Values of nodes’ coordinates (xi,yi) are connected with HR matrices (Eckmann 1999) build on N dimensional vector space. It is important that HR matrices are skew-symmetric and only for dimension N = 2, 4 or 8 columns and rows of HR matrices are orthogonal (Lang 1970).
If the function is described by the set of nodes {(xi,yi), i = 1,2,…,n} then HR matrices combined with identity matrix are used to build an orthogonal Hurwitz-Radon Operator (OHR). For nodes (x1,y1), (x2,y2) OHR of dimension N = 2 is constructed:

2nd Annual International Interdisciplinary Conference, AIIC 2014, 8-12 July, Azores, Portugal Proceedings, Vol.3
438
−
−+
=12
21
12
212
22
1
1yyyy
xxxx
xxM . (2)
For nodes (x1,y1), (x2,y2), (x3,y3), (x4,y4) OHR of dimension N = 4 is constructed:
−−−−
−−
+++=
0123
1032
2301
3210
24
23
22
21
1
uuuuuuuu
uuuuuuuu
xxxxM (3)
where 443322110 yxyxyxyxu +++= , 344312211 yxyxyxyxu −++−= ,
241342312 yxyxyxyxu ++−−= , 142332413 yxyxyxyxu +−+−= . For nodes (x1,y1), (x2,y2), …, (x8,y8) OHR M of dimension N = 8 is built (Jakóbczak 2007) similarly as (3):
−−−−−−−−
−−−−−−−−
−−−−−−−−
−−−−
=
∑=
01234567
10325476
23016745
32107654
45670123
54761032
67452301
76543210
8
1
2
1
uuuuuuuuuuuuuuuu
uuuuuuuuuuuuuuuuuuuuuuuuuuuuuuuu
uuuuuuuuuuuuuuuu
xM
ii
(4)
where
⋅
−−−−−−−−
−−−−−−−−
−−−−−−−−
−−−−
=
8
7
6
5
4
3
2
1
12345678
21436587
34127856
43218765
56781234
65872143
78563412
87654321
xxxxxxxx
yyyyyyyyyyyyyyyyyyyyyyyyyyyyyyyy
yyyyyyyyyyyyyyyyyyyyyyyy
yyyyyyyy
u. (5)
The components of the vector u = (u0, u1,…, u7)T, appearing in the matrix M (4), are defined by (5) in the similar way to (2)-(3) but in terms of the coordinates of the above 8 nodes. Note that OHR operators (2)-(4) satisfy the condition of interpolation M⋅x = y (6) for x = (x1,x2…,xN) ∈ RN, x ≠ 0, y = (y1,y2…,yN) ∈ RN, N = 2, 4 or 8.
How can we compute coordinates of points settled between the interpolation nodes? On a segment of a line every number “c” situated between “a” and “b” is described by a linear (convex) combination c = α⋅a+(1-α)⋅b for
abcb
−−
=α ∈ [0;1]. (7)
Extrapolation is possible for α < 0 and α > 1. Average OHR operator M2 of dimension N = 2, 4 or 8 is constructed as follows:
102 )1( MMM ⋅−+⋅= αα (8) with the operator M0 built (2)-(4) by “odd” nodes (x1=a,y1), (x3,y3), …, (x2N-1,y2N-1) and M1 built (2)-(4) by “even” nodes (x2=b,y2), (x4,y4), …, (x2N,y2N). Notice that having the operator M2 for coordinates xi < xi+1 it is possible to reconstruct the second coordinates of points (x,y) in terms of the vector C defined with

2nd Annual International Interdisciplinary Conference, AIIC 2014, 8-12 July, Azores, Portugal Proceedings, Vol.3
439
ci = α⋅x2i-1+(1-α)⋅x2i for i = 1,2,…,N (9) as C = [c1, c2,…, cN]T. The required formula is adequate to (6):
CMCY ⋅= 2)( (10) in which components of vector Y(C) give the second coordinates of the points (x,y) corresponding to the first coordinates, given in terms of components (9) of the vector C. After computing (7)-(10) for any α ∈ [0;1], we have a half of reconstructed points (j = 1 in Algorithm 1). Now it is necessary to find second half of unknown coordinates (j = 2 in Algorithm 1) for
ci = α⋅x2i+(1-α)⋅x2i+1 , i = 1,2,…,N. (11) There is no need to build the OHR for nodes (x2=a,y2), (x4,y4), …, (x2N,y2N) because we just find M1. This operator will play as role as M0 in (8). New M1 must be computed for nodes (x3=b,y3), …, (x2N-1,y2N-1), (x2N+1,y2N+1). As we see the minimum number of interpolation nodes is n = 2N+1 = 5, 9 or 17 using OHR operators of dimension N = 2, 4 or 8 respectively. If there is more nodes than 2N+1, the same calculations (7)-(11) have to be done for next range(s) or last range of 2N+1 nodes. For example, if n = 9 then we can use OHR operators of dimension N=4 or OHR operators of dimension N = 2 for two subsets of nodes: {(x1,y1), …,(x5,y5)} and {(x5,y5), …,(x9,y9)}. We summarize this section in the following algorithm of points reconstruction for 2N+1 = 5, 9 or 17 successive nodes.
Algorithm 1: let j = 1. Input: Set of interpolation nodes {(xi,yi), i = 1,2,…,n; n = 5, 9 or 17}. Step 1. Determine the dimension N of OHR operators: N = 2 if n = 5, N = 4 if n = 9, N = 8 if n = 17. Step 2. Build M0 for nodes (x1=a,y1), (x3,y3), …, (x2N-1,y2N-1) and M1 for nodes (x2=b,y2), (x4,y4), …, (x2N,y2N) from (2)-(4). Step 3. Determine the number of points to be reconstructed Kj > 0 between two successive nodes (for example 9 or 99), let k = 1. Step 4. Compute α ∈ [0;1] from (7) for c1 = c = α⋅a+(1-α)⋅b. Step 5. Build M2 from (8). Step 6. Compute vector C = [c1, c2,…, cN]T from (9). Step 7. Compute unknown coordinates Y(C) from (10). Step 8. If k < Kj , set k = k+1 and go to Step 4. Otherwise if j = 1, set M0 = M1, a = x2, b = x3, build new M1 for nodes (x3,y3), (x5,y5), …, (x2N+1,y2N+1), let j = 2 and go to Step 3. Otherwise, stop.
The number of reconstructed points in Algorithm 1 is K = N(K1+K2). If there is more nodes than 2N+1 = 5, 9 or 17, Algorithm 1 has to be done for next range(s) or last range of 2N+1 nodes. Reconstruction of curve points using Algorithm 1 is called by author the method of Hurwitz-Radon Matrices (MHR).
MHR numerical applications In this section we consider the number of multiplications and divisions for MHR method during reconstruction of K = L - n points having n interpolation nodes of the curve consists of L points. First we present a formula for computing one unknown coordinate of a single point. Assume there are given four nodes (x1,y1), (x2,y2), (x3,y3) and (x4,y4). OHR operators of dimension N = 2 are built (2) as follows:
+−−+
+=
33111331
311333112
32
10
1yxyxyxyxyxyxyxyx
xxM
,
+−−+
+=
44222442
422444222
42
21
1yxyxyxyxyxyxyxyx
xxM .
Let first coordinate c1 of reconstructed point is situated between x1 and x2: c1 = α⋅x1+β⋅x2 for 0 ≤ β = 1 - α ≤ 1. (12)

2nd Annual International Interdisciplinary Conference, AIIC 2014, 8-12 July, Azores, Portugal Proceedings, Vol.3
440
Compute second coordinate of reconstructed point y(c1) for Y(C) = [y(c1), y(c2)]T from (10):
.)()()(
43
2110
2
1
⋅+⋅⋅+⋅
⋅⋅+⋅=
xxxx
MMcycy
βαβα
βα (13)
After calculation (13):
+−+++⋅
+⋅+⋅= )()( 34114333212123
21
22
12
1 yxxyxxyxxyxxxx
yycy βαβα
).( 43224344122124
22
yxxyxxyxxyxxxx
−+++⋅
+βα (14)
So each point of the curve P = (c1, y(c1)) settled between nodes (x1,y1) and (x2,y2) is parameterized by P(α) for (12), (14) and α ∈ [0;1]. If nodes (xi,yi) are equidistance in coordinate xi, then parameterization of unknown coordinate (14) is simpler. Let four successive nodes (x1,y1), (x2,y2), (x3,y3) and (x4,y4) are equidistance in coordinate xi and a = x1, h/2 = xi+1 - xi = const. Calculations (13) and (14) are done for c1 (12):
syycy αββα ++= 211 )( (15) and
)584
22244
2( 22422
22311
hahahyhyay
hahahyhyayhs
++++
−++++
= . (16)
As we can see in (15) and (16), MHR interpolation is not a linear interpolation. It is possible to estimate the interpolation error of MHR method (Algorithm 1) for the class of linear function f:
scyyycycf αββα =−+=− )()()( 12111 . (17) Notice that estimation (17) has the biggest value ¼s for β = α = ½, when c1 is situated in the middle between x1 and x2. The goal of this paper is not a reconstruction of single point, like for example (14) and (15), but interpolation of curve consists of L points. If we have n interpolation nodes, then there is K = L – n points to find using Algorithm 1 and MHR method. Now we consider the complexity of MHR calculations. Lemma 1. Let n = 5, 9 or 17 is the number of interpolation nodes, let MHR method (Algorithm 1) is done for reconstruction of the curve consists of L points. Then MHR method is connected with the computational cost of rank O(L). Proof. Using Algorithm 1 we have to reconstruct K = L – n points of unknown curve. Counting the number of multiplications and divisions D in Algorithm 1 here are the results: 1) D = 4L+7 for n = 5 and L = 2i + 5; 2) D = 6L+21 for n = 9 and L = 4i + 9; 3) D = 10L+73 for n = 17 and L = 8i + 17; i = 2,3,4...� The lowest computational costs appear in MHR method with five nodes and OHR operators of dimension N = 2. Therefore whole set of n nodes can be divided into subsets of five nodes. Then whole curve is to be reconstructed by Algorithm 1 with all subsets of five nodes: {(x1,y1),…,(x5,y5)},{(x5,y5),…,(x9,y9)},{(x9,y9), …, (x13,y13)}… If the last node (xn,yn) is indexed n ≠ 4i +1 then we have to use last five nodes {(xn-4,yn-4), …, (xn,yn)} in Algorithm 1. Function f(x) = 1/x is an example when the graph of interpolated function differs from the shape of polynomials considerably. Then classical interpolation is very hard because of existing local extrema and the roots of polynomial (Fig.2). Here is the application of Algorithm 1 for this function and five nodes.
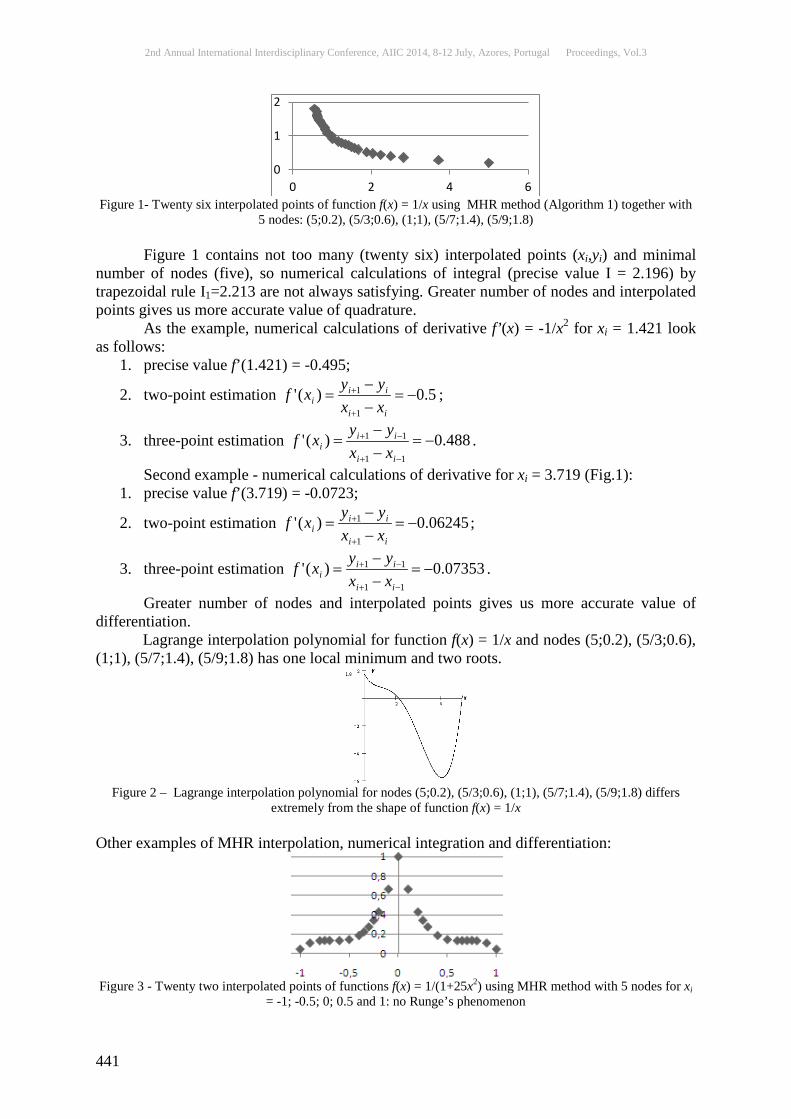
2nd Annual International Interdisciplinary Conference, AIIC 2014, 8-12 July, Azores, Portugal Proceedings, Vol.3
441
Figure 1- Twenty six interpolated points of function f(x) = 1/x using MHR method (Algorithm 1) together with
5 nodes: (5;0.2), (5/3;0.6), (1;1), (5/7;1.4), (5/9;1.8) Figure 1 contains not too many (twenty six) interpolated points (xi,yi) and minimal number of nodes (five), so numerical calculations of integral (precise value I = 2.196) by trapezoidal rule I1=2.213 are not always satisfying. Greater number of nodes and interpolated points gives us more accurate value of quadrature.
As the example, numerical calculations of derivative f’(x) = -1/x2 for xi = 1.421 look as follows:
1. precise value f’(1.421) = -0.495;
2. two-point estimation 5.0)('1
1 −=−−
=+
+
ii
iii xx
yyxf ;
3. three-point estimation 488.0)('11
11 −=−−
=−+
−+
ii
iii xx
yyxf .
Second example - numerical calculations of derivative for xi = 3.719 (Fig.1): 1. precise value f’(3.719) = -0.0723;
2. two-point estimation 06245.0)('1
1 −=−−
=+
+
ii
iii xx
yyxf ;
3. three-point estimation 07353.0)('11
11 −=−−
=−+
−+
ii
iii xx
yyxf .
Greater number of nodes and interpolated points gives us more accurate value of differentiation.
Lagrange interpolation polynomial for function f(x) = 1/x and nodes (5;0.2), (5/3;0.6), (1;1), (5/7;1.4), (5/9;1.8) has one local minimum and two roots.
Figure 2 – Lagrange interpolation polynomial for nodes (5;0.2), (5/3;0.6), (1;1), (5/7;1.4), (5/9;1.8) differs
extremely from the shape of function f(x) = 1/x Other examples of MHR interpolation, numerical integration and differentiation:
Figure 3 - Twenty two interpolated points of functions f(x) = 1/(1+25x2) using MHR method with 5 nodes for xi
= -1; -0.5; 0; 0.5 and 1: no Runge’s phenomenon
0
1
2
0 2 4 6

2nd Annual International Interdisciplinary Conference, AIIC 2014, 8-12 July, Azores, Portugal Proceedings, Vol.3
442
Figure 3 contains minimal number of nodes (five) and only twenty two interpolated points, so numerical calculations of integral (precise value I = 0.549) are not always satisfying:
a) trapezoid method: I1 = 0.534; b) Simpson’s rule: I2 = 0.538.
As the example, numerical calculations of derivative for xi = 0.0 look as follows: 1. precise value f’(0.0) = 0.0;
2. three-point estimation 0.0)('11
11 =−−
=−+
−+
ii
iii xx
yyxf .
Second example- numerical calculations of derivative for xi = -0.35 (Fig.3): 1. precise value f’(-0.35) = 1.06;
2. two-point estimation 04.1)('1
1 =−−
=+
+
ii
iii xx
yyxf ;
3. three-point estimation 9.0)('11
11 =−−
=−+
−+
ii
iii xx
yyxf .
Figure 4 - Thirty six interpolated points of functions f(x) = 1/(1+5x2) using MHR method with 5 nodes for xi = -
1; -0.5; 0; 0.5 and 1: no Runge’s phenomenon Figure 4 contains minimal number of nodes (five) and not too many interpolated points (thirty six), but numerical calculations of integral (precise value I = 1.029) are interesting:
a) trapezoid method: I1 = 1.000; b) Simpson’s rule: I2 = 0.999.
As the example, numerical calculations of derivative for xi = 0.0 look as follows: 1. precise value f’(0.0) = 0.0;
2. three-point estimation 0.0)('11
11 =−−
=−+
−+
ii
iii xx
yyxf .
Second example - numerical calculations of derivative for xi = 0.15 (Fig.4): 1. precise value f’(0.15) = -1.212;
2. two-point estimation 2.1)('1
1 −=−−
=+
+
ii
iii xx
yyxf ;
3. three-point estimation 23.1)('11
11 −=−−
=−+
−+
ii
iii xx
yyxf .
Here are the graphs of functions interpolated by MHR method with 5 nodes as MHR-2 (Fig.5,6,7,9) and 9 nodes as MHR-4 (Fig.8):

2nd Annual International Interdisciplinary Conference, AIIC 2014, 8-12 July, Azores, Portugal Proceedings, Vol.3
443
Figure 5 - Function f(x) = x3+x2-x+1 with 396 interpolated points using MHR method with 5 nodes: (-2;-1), (-
1.75; 0.453125), (-1.5;1.375), (-1.25;1.859375) and (-1;2) Solving the equation x3+x2-x+1 = 0 via MHR interpolation, we will search a root of the function only between nodes (-2;-1) and (-1.75;0.453125). Points calculated between other pairs of nodes are useless in the process of root approximation and they do not have to be computed. Considering points between nodes (-2;-1) and (-1.75;0.453125), coordinate y is near zero at (-1.835;0.00184). Solution of equation x3+x2-x+1 = 0 via MHR-2 method is approximated by x = -1.835. True value is x = -1.839. The same equation for nodes (-2;-1), (-1.95;-0.662), (-1.9;-0.349), (-1.85;-0.059) and (-1.8;0.208), solved by MHR-2 method, gives better result x = -1.839. So shorter distance between first and last node is of course very significant.
MHR calculations are done for function f(x) = x3+ln(7-x) with nodes: (-2;-5.803), (-1.75; -3.190), (-1.5;-1.235), (-1.25;0.1571) and (-1;1.0794). So a root of this function is situated between 3rd and 4th node. MHR-2 interpolation gives the graph of function (Fig.6):
Figure 6 - Function f(x) = x3+ln(7-x) with 396 interpolated points using MHR method with 5 nodes: (-2;-
5.803), (-1.75;-3.190), (-1.5;-1.235), (-1.25;0.1571) and (-1;1.0794) Considering points between nodes (-1.5;-1.235) and (-1.25;0.1571), coordinate y is near zero at (-1.2825;0.00194). Solution of equation x3+ln(7-x) = 0 via MHR method is approximated by x = -1.2825. True value is hardly approximated (even for MathCad) by x = -1.28347.
MHR calculations are done for function f(x) = x3+2x-1 with nodes: (0;-1), (0.25;-0.484), (0.5;0.125), (0.75;0.9219) and (1;2). So a zero of this function is situated between 2nd and 3rd node. MHR-2 interpolation gives the graph of function (Fig.7):
Figure 7 - Function f(x) = x3+2x-1 with 396 interpolated points using MHR-2 method with 5 nodes

2nd Annual International Interdisciplinary Conference, AIIC 2014, 8-12 July, Azores, Portugal Proceedings, Vol.3
444
Considering points between nodes (0.25;-0.484) and (0.5;0.125), coordinate y is near zero at (0.4625;0.00219). Solution of equation x3+2x-1 = 0 via MHR-2 method is approximated by x=0.4625. The only one real solution of this equation is x = 0.453.
Now MHR calculations are done for the same equation x3+2x-1 = 0 with seven nodes between (0;-1) and (1;2) for xi = 0; 0.125; 0.25; 0.375; 0.5; 0.625; 0.75; 0.875 and 1. The solution is approximated by MHR-4 method with nine nodes. MHR-4 interpolation gives the graph of function (Fig.8):
Figure 8 - Function f(x) = x3+2x-1 with 792 interpolated points using MHR method with 9 nodes for xi= 0;
0.125; 0.25; 0.375; 0.5; 0.625; 0.75; 0.875 and 1 Considering points between nodes (0.375;-0.197) and (0.5;0.125), coordinate y is near zero at (0.45625;0.00018). Solution of equation x3+2x-1 = 0 via MHR-4 method is approximated by x=0.45625. This is better result than MHR-2: greater number of nodes (with the same distance between first and last) means better approximation. And seventeen nodes in MHR-8 guarantee more precise results then MHR-4.
MHR calculations are done for equation 3-2x = 0 with nodes: (1;1), (1.2;0.7026), (1.4;0.361), (1.6;-0.031) and (1.8;-0.482). MHR-2 interpolation gives the graph of function (Fig.9):
Figure 9 - Function f(x) = 3-2x with 396 interpolated points using MHR method with 5 nodes: (1;1),
(1.2;0.7026), (1.4;0.361), (1.6;-0.031) and (1.8;-0.482) Considering points between nodes (1.4;0.361) and (1.6;-0.031), second coordinate is near zero at (1.586;-0.000311). Solution of equation 3-2x = 0 via MHR-2 method is approximated by x = 1.586. Precise solution x = log23 is approximated by 1.585.
Interpolated values, calculated by MHR method, are applied in the process of solving the nonlinear equations. Shorter distance between first and last node or greater number of nodes guarantee better approximation. Approximated solutions of nonlinear equations are used in many branches of science. MHR joins two important problems in computer sciences: interpolation of the function with the solution of nonlinear equation. After computing of K points for interpolated function (algorithm 1), it is possible to calculate the derivative via two-point or three-point estimation. Greater number of nodes and interpolated points gives us more accurate value of differentiation.

2nd Annual International Interdisciplinary Conference, AIIC 2014, 8-12 July, Azores, Portugal Proceedings, Vol.3
445
Conclusion The method of Hurwitz-Radon Matrices (MHR - Algorithm 1) leads to curve interpolation and extrapolation depending on the number of nodes and location of nodes. No characteristic features of curve are important in MHR method: failing to be differentiable at any point, the Runge’s phenomenon or differences from the shape of polynomials. These features are very significant for classical polynomial interpolations. MHR method gives the possibility of curve reconstruction and then numerical calculations of roots, quadratures and derivatives for interpolated function are possible. The only condition is to have a set of nodes according to assumptions in Algorithm 1. Curve modeling (Jakóbczak 2010) by MHR method is connected with possibility of changing the nodes coordinates and reconstruction of new curve for new set of nodes, no matter what shape of curve or function is to be reconstructed. Main features of MHR method are: 1) accuracy of curve modeling and reconstruction depending on number of nodes and method of choosing nodes; 2) reconstruction of curve consists of L points is connected with the computational cost of rank O(L); 3) Algorithm 1 is dealing with local operators: average OHR operator M2 (8) is built by successive 4, 8 or 16 nodes, what is connected with smaller computational costs then using all nodes. Future works are connected with: geometrical transformations of curve (translations, rotations, scaling)- only nodes are transformed and new curve (for example contour of the object) for new nodes is reconstructed; estimation of curve length (Jakóbczak 2010); possibility to apply MHR method to three-dimensional curves; object recognition (Jakóbczak 2011), shape representation (Jakóbczak 2010) and parameterization in image processing; curve extrapolation (Jakóbczak 2011).
References: Citko W., Jakóbczak D., Sieńko W.: On Hurwitz-Radon Matrices Based Signal Processing, Signal Processing’2005, Poznań, 19-24, 2005. Dahlquist G., Bjoerck A.: Numerical methods, Englewood Cliffs N. J., Prentice-Hall, 1974. Eckmann B.: Topology, algebra, analysis- relations and missing links, Notices of AMS, vol. 46(5), 520-527, 1999. Jakóbczak D.: 2D and 3D Image Modeling Using Hurwitz-Radon Matrices, Polish Journal of Environmental Studies, vol. 16(4A), 104-107, 2007. Jakóbczak D., Kosiński W.: Hurwitz-Radon Operator in Monochromatic Medical Image Reconstruction, Journal of Medical Informatics & Technologies, vol.11, 69-78, 2007. Jankowska J., Jankowski M.: Survey of numerical methods and algorithms (Part I), Wydawnictwa Naukowo-Techniczne, Warsaw, 1981 [in Polish]. Lang S:. Algebra, Addison-Wesley Publishing Company, 1970. Ralston A.: A first course in numerical analysis, McGraw-Hill Book Company, 1965. Sieńko W., Citko W., Jakóbczak D.: Learning and System Modeling via Hamiltonian Neural Networks, Lecture Notes on Artificial Intelligence, Springer-Verlag: Berlin Heidelberg, vol. 3070, 266-271, 2004. Kozera, R.: Curve Modeling via Interpolation Based on Multidimensional Reduced Data. Silesian University of Technology Press, Gliwice (2004) Jakóbczak, D.: Shape Representation and Shape Coefficients via Method of Hurwitz-Radon Matrices. Lecture Notes in Computer Science 6374 (Computer Vision and Graphics: Proc. ICCVG 2010, Part I), Springer-Verlag Berlin Heidelberg, 411-419 (2010) Jakóbczak, D.: Curve Interpolation Using Hurwitz-Radon Matrices. Polish Journal of Environmental Studies 3B(18), 126-130 (2009)

2nd Annual International Interdisciplinary Conference, AIIC 2014, 8-12 July, Azores, Portugal Proceedings, Vol.3
446
Jakóbczak, D.: Application of Hurwitz-Radon Matrices in Shape Representation. In: Banaszak, Z., Świć, A. (eds.) Applied Computer Science: Modelling of Production Processes 1(6), pp. 63-74. Lublin University of Technology Press, Lublin (2010) Jakóbczak, D.: Object Modeling Using Method of Hurwitz-Radon Matrices of Rank k. In: Wolski, W., Borawski, M. (eds.) Computer Graphics: Selected Issues, pp. 79-90. University of Szczecin Press, Szczecin (2010) Jakóbczak, D.: Implementation of Hurwitz-Radon Matrices in Shape Representation. In: Choraś, R.S. (ed.) Advances in Intelligent and Soft Computing 84, Image Processing and Communications: Challenges 2, pp. 39-50. Springer-Verlag, Berlin Heidelberg (2010) Jakóbczak, D.: Object Recognition via Contour Points Reconstruction Using Hurwitz-Radon Matrices. In: Józefczyk, J., Orski, D. (eds.) Knowledge-Based Intelligent System Advancements: Systemic and Cybernetic Approaches, pp. 87-107. IGI Global, Hershey PA, USA (2011) Jakóbczak, D.: Data Extrapolation and Decision Making via Method of Hurwitz-Radon Matrices. Lecture Notes in Computer Science/LNAI 6922 (Computational Collective Intelligence, Technologies and Applications: Proc. ICCCI 2011, Part 1), Springer-Verlag Berlin Heidelberg, 173-182 (2011) Jakóbczak, D.: Curve Parameterization and Curvature via Method of Hurwitz-Radon Matrices. Image Processing & Communications- An International Journal 1-2(16), 49-56 (2011)
2nd Annual International Interdisciplinary Conference, AIIC 2014, 8-12 July, Azores, Portugal Proceedings, Vol.3
447
TESTABILITY OF INFORMATION LEAK IN THE SOURCE CODE FOR INDEPENDENT TEST ORGANIZATION BY
USING BACK PROPAGATION ALGORITHM
Al-Khanjari, Z. Alani, A.
Department of Computer Science, College of Science, Sultan Qaboos University, Muscat, Oman
Abstract A strategy for software testing integrates the design of software test cases into a well-planned series of steps that results in a successful development of the software security. The strategy provides the secure source code test by Independent Test Organization (ITO) that describes the steps to be taken, when, and how much effort, time, and resources will be required. The strategy incorporates test planning, test case design, test execution, test result collection and test leak information and evaluation. In this work we speak about the testability of leak information in source code and how to detect and protect it inside the ITO. In this paper we present a privacy preserving algorithm for the neural network learning to detect and protect the leak information in source code between two parties the programmer (source code) and Independent Test Organization (Sensor). We show that our algorithm is very secure and the sensor inside Independent Test Organization is able to detect and protect all leaks information inside the source code. We demonstrate the efficiency of our algorithm by experiments on real world data. We present new technology for software Security using Back Propagation algorithm. That is embedded sensor to analyze the source code inside the ITO. By using embedded sensor we can detect and protect in real time all the attacks or leaks of information inside the source code. The connection between an Artificial Neural Networks and source code analysis inside Independent Test Organization is providing a great help for the software security.
Keywords: Software Security, Artificial Neural Networks, Back Propagation, Independent Test Organization, Testability Introduction
Building a secure channel in source code is one of the most challenging areas of research and development in modern communication for software security. Attacks on source code infrastructures and software computer are becoming an increasingly serious problem nowadays [1]. Therefore, several information security techniques are available today to protect information systems against unauthorized use, duplication, alteration, destruction and viruses attack. Vapnik [2] applied a supervised learning algorithm based on the pioneering work. Joachims [3] stated that statistical learning theory have been successfully applied in a number of classification problems. Ghosh [4] Applied machine learning algorithms in anomaly detection. This had also received considerable attention. Honig and colleagues [5] described Adaptive Model Generation (AMG) as a real-time architecture for implementing data-mining-based intrusion detection systems. AMG uses SVMs as one specific type of model-generation algorithms for anomaly detection. Mukkamala and colleagues [6] compared the performance of neural network-based and SVM-based systems for intrusion
2nd Annual International Interdisciplinary Conference, AIIC 2014, 8-12 July, Azores, Portugal Proceedings, Vol.3
448
detection using a set of DARPA benchmark data. If labeled data is available and used as input to a supervised network, an output representing the classes can be produced [7]. This type of system is limited to the classifications present in the training data. IDS rules are used as a basis for network anomaly detection reporting in the HISA algorithm [8]. Mohd and colleagues [9] provided a roadmap to industry personnel and researchers to assess, and preferably, quantify software testability in design phase. Li and colleagues [10] proposed an anomaly based network intrusion detection system based on Multilayer perceptron with a single hidden layer trained by Back Propagation learning algorithm. The system operation was divided into three stages: Input Data Collection and Preprocessing, Training, and Detection stage. The result for the proposed module was 95% detection rate. Agarwal and Agarwal [11] stated that the connection between an Artificial Neural Networks and cryptography is providing a great help for the security concerns. Singh and Ramkumar [12] presented a new technology for Security reasons. This is represented by Robots and embedded systems using Camera inside the devices. The authors of this paper used Back propagation algorithm to detect the face in a proper manner and a right direction without any errors and transferred images into memories in micro controller chip. Kemerlis and colleagues [13] suggested to employ system tracing facilities and data indexing services, and combine them in a novel way to detect data leaks. Chothia and Guha [14] presented a statistical test for detecting information leaks in systems with continuous outputs. Chothia and Guha also used continuous mutual information to detect the information leakage from trial runs of a probabilistic system. The main contributions of this paper are:
• show how to detect the leak information in source code which can be used to measure information leakage by using Back propagation Neural Network algorithm. • test for the presence of information leak and detect by the Independent Test Organization. • use this test to find, detect and fix any information leak in the source code from the programmers or use the trap door to remote access to the software.
In this paper, we use the supervisor learning in Back propagation Neural Network algorithm to find and detect information leak if any. The level of the error must be zero or less than 0.000001. The rest of the paper is organized as follows. Section 2 explains the work of Independent Test Organization (ITO) and what is the purpose of the ITO? What are the different approaches to keep test costs under control? Section 3 discusses the Artificial Neural Network (ANN), its design and usage. Also, this section explains the algorithm of Back propagation Neural Network and the procedure of learning. Section 4 discusses the development of a test for information leakage in source code. Section 5 provides concluding remarks of the work.
Independent Test Organization (ITO) An Independent Test Organization is an organization, a person, or a company that tests products, materials, software, etc, according to agreed requirements. The test organization can be affiliated with the government, universities or can be an independent testing laboratory. They are independent because they are not affiliated with the producer nor the user of the item being tested: no commercial bias is present. These "contract testing" facilities are sometimes called "third party" testing or evaluation facilities [15]. An Independent Test Organization might also be an organization that tests application according to standard requirements. Test organizations specialize in testing and are majorly independent of the supplier of application and the company that purchases the application. Testing is a very important aspect of any application to perform its functional and non-functional behavior and whether it behaves as per business objective. An unsuccessful testing, project

2nd Annual International Interdisciplinary Conference, AIIC 2014, 8-12 July, Azores, Portugal Proceedings, Vol.3
449
may allow a substandard application to go live. This might be the reputation of the organization [16]. Independent testing might have a variety of purposes, such as:
1. Verifying if the requirements of a specification, regulation, or contract are met. 2. Deciding if a new product development program is on track: Demonstrate proof of concept. 3. Providing standard data for other scientific, engineering, and quality assurance functions. 4. Validating suitability for end-use. 5. Providing a basis for technical communication. 6. Providing a technical means of comparison of several options. 7. Providing evidence in legal proceedings: forensics, product liability, patents, product claims, etc. 8. Solving problems with current products or services. 9. Identifying potential cost savings in products or services.
Software testability is the tendency of code to reveal existing faults or information leak. This paper proposes the use of a software testability to detect and protect the information leak inside ITO throughout the development process by using Back Propagation Algorithm. We further believe that software testability analysis to detect the leak of information in real time can play a crucial role in quantifying the likelihood that faults are not hiding after finishing the testing process, which does not result in any failures for the current version. Testability is one of the major factors determining the time and effort needed to test software system. It is costly to redesign a system during implementation or maintenance in order to overcome the lack of testability [17]. There are different approaches to keep test costs under control and to increase the quality of the product under test [18] as shown in Figure 1.
1. improve the software specification and documentation, 2. reduce or change functional requirements to ease testing, 3. use better testing techniques, 4. use better testing tools, 5. improve the testing process, 6. train people, and 7. improve the software design and implementation.
Figure 1: Steps for Increasing the Quality of the Product Under Test
3. Artificial Neural Network (ANN)

2nd Annual International Interdisciplinary Conference, AIIC 2014, 8-12 July, Azores, Portugal Proceedings, Vol.3
450
Biologists have studied biological neural networks for many years. The human brain looks like a network. Discovering how the brain works has been an ongoing effort that started more than 2000 years ago. Information about the function the brain was accumulated, a new technology emerged as the quest for an “Artificial Neural Network” start. The brain processes information super quickly and super accurately. It can be trained to recognize patterns and to identify incomplete patterns [19]. While designing ANN we should be concerned with the following:
1. Network topology 2. Number of layers in the network 3. Number of neurons or nodes 4. Learning algorithm to be adopted 5. Network performance 6. Degree of adaptability of the ANN (i.e. to what extent the ANN is able to adapt itself after training).
A Neural network’s ability to perform computations is based on the hope that we can reproduce some of the flexibility and power of the human brain by artificial means. Network computation is performed by a dense mesh of computing nodes and connections. They operate collectively and simultaneously on most or all data inputs. The basic processing elements of neural networks are called artificial neurons, or simply neurons [19]. Therefore, neural network is a system composed of many simple processing elements operating in parallel whose function is determined by network structure, connection strengths and processing performed at computing elements or nodes [20]. Back Propagation Neural Network An Artificial Neural Network (ANN) is an information processing paradigm that is inspired by the way biological nervous systems process information. It is configured for a specific application through a specific learning process. The most commonly used family of neural networks for pattern classification tasks is the feed-forward network, which includes multilayer perceptron and Radial-Basis Function (RBF) networks. Back Propagation is a feed forward supervised learning network. The general idea with the back propagation algorithm is to use gradient descent, to update the weights and to minimize the squared error between the network output values and the target output values. The update rules are derived by taking the partial derivative of the error function with respect to the weights to determine each weight’s contribution to the error. Then, each weight is adjusted. This process occurs iteratively for each layer of the network. The concept of the process is to start with the last set of weights, and work back towards the input layer. This concept is named as “Back Propagation”. The network is trained to perform its ability to respond correctly to the input patterns that are used for training. Also, to provide good response to input that are similar. Propagation analysis is the process concerned with determination of the probability that a forced change in an internal computational state causes a change in the program’s output. In other words, it is the probability that an error in the data state at a location causes an output error for a given input distribution. Propagation of a data state error occurs when the output is affected by the data state. Propagation analysis involves three things:
1. Obtaining a data state at a location in the code. 2. Perturbing the data state. 3. Executing the code to completion and examining the resulting output to see if the
perturbed data state has changed the output.

2nd Annual International Interdisciplinary Conference, AIIC 2014, 8-12 July, Azores, Portugal Proceedings, Vol.3
451
Propagation analysis is similar to a strong mutation testing in that the results at the end of the execution of the original program are compared with the results obtained when a data state is corrupted [21]. The algorithm Works as shown in Table 1 [22]:
Table 1: Back Propagation Neural Network Algorithm After choosing the weights of the network randomly, the back propagation algorithm is used to compute the necessary corrections. The algorithm can be decomposed in the following four steps:
1. Feed-forward computation 2. Back propagation to the output layer 3. Back propagation to the hidden layer 4. Weight updates
The algorithm is stopped when the value of the error function has become sufficiently small. Back propagating – Learning The network is first initialized by setting up all its weights to be small random numbers between –1 and +1. The input pattern is applied and the output calculated (this is called the forward pass). The calculation gives an output which is completely different to what you want (the Target), since all the weights are random. We then calculate the Error of each neuron, which is essentially: Target – Actual Output (i.e. what you want – What you actually get). This error is then used mathematically to change the weights in such a way that the error will get smaller. In other words, the Output of each neuron will get closer to its Target (this part is called the reverse pass). The process is repeated again and again until the error is minimal. Learning Procedure
1. Randomly assign weights (between +1 and -1) 2. Present inputs from training data, propagate to outputs
1. Apply the inputs to the network and work out the output – remember this initial output could be anything, as the initial weights were random numbers.
2. Work out the error for neuron B. The error is what you want? What you actually get? in other words: Error B = Output B*(1-Output B)*(Target B – Output B) The “Output*(1-Output)” term is necessary in the equation because of the Sigmoid Function – if we only were using a threshold neuron it would just be (Target –Output).
3. Change the weight. Let W+AB be the new (trained) weight and WAB be the initial weight. W+AB = WAB + (Error B x Output A) Notice that it is the output of the connecting neuron (neuron A) we use (not B). We update all the weights in the output layer in this way.
4. Calculate the Errors for the hidden layer neurons. Unlike the output layer we can’t calculate these directly because we don’t have a Target, so we Back Propagate them from the output layer. Hence the name of the algorithm. This is done by taking the Errors from the output neurons and running them back through the weights to get the hidden layer errors. For example if neuron A is connected to B and C then we take the errors from B and C to generate an error for A. Error A = Output A*(1 - Output A)*(Error B + Error C) Again, the factor “Output*(1 - Output)” is present because of the sigmoid squashing function.
5. Having obtained the Error for the hidden layer neurons now proceed as in stage three to change the hidden layer weights. By repeating this method we can train a network of any number of layers.

2nd Annual International Interdisciplinary Conference, AIIC 2014, 8-12 July, Azores, Portugal Proceedings, Vol.3
452
3. Compute outputs O; adjust weights according to the delta rule, back propagate the errors. The weights will be nudged closer so that the network learns to give the desired output. 4. Repeat; stop when no errors, or less than 0.000001.
Detect Leakage Information The concept of the brain as a computer has been part of the modern scientific. This path has led to new fields of research including artificial intelligence and neural networks. Connections between computation and the brain have been studied extensively using Artificial Neural Networks (ANN) and inspired by biological neural networks. One aspect of the complexity of nervous systems is their intricate morphology, particularly the interconnectivity of their neuronal processing elements. Synapses are the ends of the connections within the nervous system [23]. There are two types of synapses:
1. Chemical synapses, which use neurotransmitters, 2. Electrical synapses, which provide direct electrical coupling to the synapsed cell. Neurons are very polarized cells, with long and thin extensions.
ANNs consist of ‘neuron’ nodes connected by ‘synapses’ of variable strength. They can be trained to perform a given task through algorithmic modification of the synaptic weights. A desired input-output relationship can be generated for a known set of examples, after which the ANN can be used to process unknown inputs. In this paper we focus on source code as our measure of information leakage. We describe how it can be calculated and learned to detect the information leakage. There are two main obstacles to detecting the leak of information of a real system in the source code:
1. We must find random numbers assigned for weights that reflect the source code under test. In order to detect the leakage through present inputs from training data: propagate to outputs, compute outputs O, adjust weights according to the delta rule and back propagate the errors. The weights will be nudged closer so that the network learns to give the desired output 2. We must calculate the error when learning and stop it when the leakage is zero or less than 0.000001. This is the biggest challenge to discover the accuracy of information leaking in the source code. This works as embedded sensor inside the source code to detect the leakage of information. Figure 2 shows Weights of Network Back Propagation.
Figure 2: Weights of Network Back Propagation
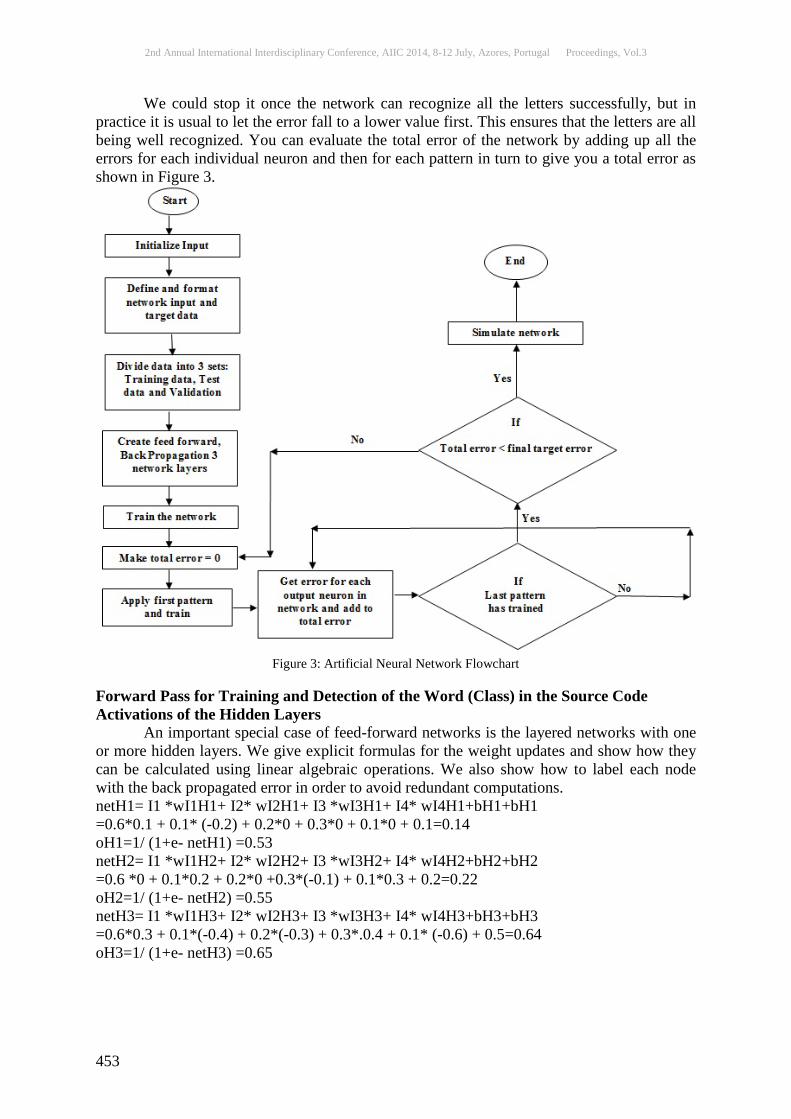
2nd Annual International Interdisciplinary Conference, AIIC 2014, 8-12 July, Azores, Portugal Proceedings, Vol.3
453
We could stop it once the network can recognize all the letters successfully, but in practice it is usual to let the error fall to a lower value first. This ensures that the letters are all being well recognized. You can evaluate the total error of the network by adding up all the errors for each individual neuron and then for each pattern in turn to give you a total error as shown in Figure 3.
Figure 3: Artificial Neural Network Flowchart
Forward Pass for Training and Detection of the Word (Class) in the Source Code Activations of the Hidden Layers An important special case of feed-forward networks is the layered networks with one or more hidden layers. We give explicit formulas for the weight updates and show how they can be calculated using linear algebraic operations. We also show how to label each node with the back propagated error in order to avoid redundant computations. netH1= I1 *wI1H1+ I2* wI2H1+ I3 *wI3H1+ I4* wI4H1+bH1+bH1 =0.6*0.1 + 0.1* (-0.2) + 0.2*0 + 0.3*0 + 0.1*0 + 0.1=0.14 oH1=1/ (1+e- netH1) =0.53 netH2= I1 *wI1H2+ I2* wI2H2+ I3 *wI3H2+ I4* wI4H2+bH2+bH2 =0.6 *0 + 0.1*0.2 + 0.2*0 +0.3*(-0.1) + 0.1*0.3 + 0.2=0.22 oH2=1/ (1+e- netH2) =0.55 netH3= I1 *wI1H3+ I2* wI2H3+ I3 *wI3H3+ I4* wI4H3+bH3+bH3 =0.6*0.3 + 0.1*(-0.4) + 0.2*(-0.3) + 0.3*.0.4 + 0.1* (-0.6) + 0.5=0.64 oH3=1/ (1+e- netH3) =0.65

2nd Annual International Interdisciplinary Conference, AIIC 2014, 8-12 July, Azores, Portugal Proceedings, Vol.3
454
Activations of the Output Layers It is important not to update any weights until all errors have been calculated. It is easy to forget this and if new weights were used while calculating errors, results would not be valid. Here, a quick second pass using new weights is needed to see if error has decreased. The vector O is presented to the network. The vectors O(1) and O(2) are computed and stored. The evaluated derivatives of the activation functions are also stored at each unit. netO1=oH1*wH1O1+ oH2*wH2O1 + oH3*wH3O1 +bO1 =0.53*(-0.4) + 0.55* 0.1 + 0.65* 0.6+ (-0.1) =0.13 oO1=1/ (1+e- netO1) =0.53 netO2=oH1*wH1O2+ oH2*wH2O2 + oH3*wH3O2 +bO2 =0.53*0.2+0.55*(-0.1) +0.65*(-0.2) +0.6=0.52 oO2=1/ (1+e- netO2) =0.63
Backward Pass for Detecting Word (Class) in the Source Code Calculate the Output Errors: errerO1 and errerO2 (note that doO1=1, doO2=0) Now errors have to be propagated from the hidden layer down to the input layer. This is a bit more complicated than propagating error from the output to the hidden layer. errerO1 = (doO1- oO1) * oO1 * (1- oO1) = (1-0.53)*0.53*(1-0.53) = 0.12 errerO2 = (doO2- oO2) * oO2 * (1- oO2) = (0-0.63)*0.63*(1-0.63) = -0.15 Calculate the New Weights Between the Hidden and Output Layers (η=0.1) It is important not to update any weights until all errors have been calculated. It is easy to forget this and if new weights were used while calculating errors, results would not be valid. Here, a quick second pass using new weights is needed to see if error has decreased. After computing all partial derivatives, the network weights are updated in the negative gradient direction. Learning constant defines the step length of the correction.
ΔwH1O1= η * errerO1 * oO1 = 0.1*0.12*0.53=0.006 wH1O1new = wH1O1old + ΔwH1O1 = -0.4+0.006= -0.394 ΔwH1O2= η * errerO2 * oO1 = 0.1*-0.15*0.53=-0.008 wH1O2new = wH1O2old + wH1O2 = 0.2-0.008=-0.19
Similarly for wH2O1new, wH2O2new, wH3O1 new and wH3O2 new For the biases bO1 and bO2 (remember: biases are weights with input 1):
ΔbO1= η * errerO1 * 1 = 0.1*0.12=0.012 bO1new = bO1old + ΔbO1 = -0.1+0.012=-0.012
Similarly for bO2 Calculate the Errors of the Hidden Layers: errerH1, errerH2 and errerH3 In the case of error > 1 input - output patterns, an extended network is used to compute the error function for each of them separately. The weight corrections are computed for each pattern and so we get the corrections errerH1 = oH1 * (1- oH1) * (wH1O1* errerO1 + wH1O2 * errerO2)
= 0.53*(1-0.53) (-0.4*0.12+0.2*(-0.15)) = -0.019 Similarly for errerH2 and errerH3 Calculate the New Weights Between the Input and Hidden Layers (η=0.1) We speak of batch or off-line updates when the weight corrections are made in this way. Often, however, the weight updates are made sequentially after each pattern presentation (this is called on-line training). In this case, the corrections do not exactly follow the negative gradient direction. However, if the training patterns are selected randomly the search direction oscillates around the exact gradient direction. On average, the algorithm

2nd Annual International Interdisciplinary Conference, AIIC 2014, 8-12 July, Azores, Portugal Proceedings, Vol.3
455
implements a form of descent in the error function. The rationale for using on-line training is that adding some noise to the gradient direction can help to avoid falling into shallow local minima of the error function. Also, when the training set consists of thousands of training patterns, it is very expensive to compute the exact gradient direction since each epoch (one round of presentation of all patterns to the network) consists of many feed-forward passes and on-line training becomes more efficient.
ΔwI1H1= η * errerH1 * I1 = 0.1*(-0.019)*0.6= -0.0011 wI1H1new = wI1H1old + ΔwI1H1 = 0.1-0.0011=0.0989
Similarly for: wI2H1new, wI3H1new, wI4H1new, wI5H1new, wI1H2new, wI2H2new, wI3H2new, wI4H2new, wI5H2new, wI1H3new, wI2H3new, wI3H3new, wI4H3new and wI5H3new; bH1, bH2 and bH3
Usefulness of Other Training Repeat the procedure for the other training to detect the information leak in the source code such as class, mail, web, URL etc. The back propagated error can be computed in the same way for any number of hidden layers and the expression for the partial derivatives of E keeps the same analytic form. Conclusion In this paper was designed a method to detect information leakage in the source code to help independent test organization to detect the trap door of leak information. The proposed system classifies an architecture based on learning using an enhanced resilient Back Propagation Neural Network algorithm. It is used to detect information leakage in the source code. The system is monitored by real time technology. It is able to extract leakage of information from the source code that designed with high detection, and accuracy and calculate the error when learning and stop it when the error is zero or less than 0.000001. The following points are concluded from the proposed system.
1. The excellent detection rate for information leakage is very encouraging. 2. The sensors after learning have been the simplest in the cases where they embedded
themselves in the source code and checked all attacks. 3. This detection of leak information can operate without any external components. 4. The prototype implemented is able to detect information leak. 5. Using automatic audit for detecting all information leakage provides high security to
the independent test organization without using any other protection programs. 6. The proposed method to detect the leak of information using Java language is very
flexible in dealing with any kind of operating systems. By using the real time technique, we can use our method to detect the information leak in the source code which deals with them without returning to the programmer or getting the help of the owner of the source code. References: Abraham, A., Grosan, C. & Chen, Y. (2006). Evolution of Intrusion Detection Systems. [Online] http://citeseerx.ist.psu.edu/viewdoc/summary?doi=10.1.1.16 [Accessed on 18 October 2011]. Vapnik, V. (1995). The Nature of Statistical Learning Theory. Springer, New York, USA. Joachims, T. (1998). Making large-scale support vector machine learning practical. In B. Scholkopf, C. Burges, and A. Smola, editors, Advances in Kernel Methods: Support Vector Machines. MIT Press, Cambridge, MA,USA.

2nd Annual International Interdisciplinary Conference, AIIC 2014, 8-12 July, Azores, Portugal Proceedings, Vol.3
456
Ghosh, A., Schwartzbard, A. & Schatz, M. (1999). Learning program behavior profiles for intrusion detection. In ID’99: Proceedings of the 1st conference on Workshop on Intrusion Detection and Network Monitoring. Honig, A., Howard, A., Eskin, E. & Stolfo, S. (2002). Adaptive model generation: An architecture for the deployment of data mining-based intrusion detection systems. Data Mining for Security Applications. Mukkamala, S. , Janoski, G. & Sung, A. (2002). Intrusion detection using neural networks and support vector machines. The Proceedings of the International Joint Conference on Neural Networks (IJCNN 2002), Vol. 2, pp. 1702 – 1707, Honolulu, HI. Khan, L., Awad, M., Thuraisingham, B. (2007). A new intrusion detection system using support vector machines and hierarchical clustering’, The VLDB Journal, Vol. 16, pp. 507-521, 2007. Vollmer, T. & Manic, M. (2009). Human Interface for Cyber Security Anomaly Detection Systems, HSI2009, 2nd International Conference on Human Systems Interactions, Catania Italy, May 28-30, 2009. Mohd, N., Khan, R. & Mustafa, K. (2010). Testability Estimation Framework, International Journal of Computer Applications (0975 – 8887), 2(5), pp. 9-14, June 2010. Li, J., Zhang, G. & Gu, U. (2004). The Research and Implementation of Intelligent Intrusion Detection System Based on Artificial Neural Network. Proceedings of the Third International Conference on Machine Laming and Cybernetics, pp. 26-29, Shanghai. Agarwal, N. & Agarwal, P. (2013). Use of Artificial Neural Network in the Field of Security, MIT International Journal of Computer Science & Information Technology, pp. 42–44 ISSN 2230-7621 ©MIT Publications, 3(1), January 2013. Singh, R. & Ramkumar, E. (2013). Embedded Systems and Robotics that Improving Security Model with 2D and 3D of Face -Recognition Access Control System Using Neural Networks International Journal of Soft Computing and Engineering (IJSCE) ISSN: 2231-2307, 2(6), pp. 197-200, January 2013. Kemerlis, V., Pappas, V., Portokalidis, G. & Keromytis, A. (2010). iLeak: A Lightweight System for Detecting Inadvertent Information Leaks, IEEE Conference Publications -Computer Network Defense (EC2ND), pp. 21 - 28, European Conference, 2010. Chothia, T. & Guha, A. (2011) Statistical Test for Information Leaks Using Continuous Mutual Information, Computer Security Foundations Symposium (CSF), IEEE 24th, pp. 177 – 190, 2011. Wikipedia (2014). Independent Test Organization [Online] http://en.wikipedia.org/wiki/Independent_test_organization [Accessed on: 12 January 2014]. The Mobile Guru (2014). Why Independent Testing & QA Makes Sense [Online] http://harshalkharod.blog.com/2011/03/02/independent-testing-outsource-testing/ [Accessed on: 20 January 2014]. Khatri, S., Chhillar, R. & Singh, V. (2011). Improving the Testability of Object-oriented Software during Testing and Debugging Processes, International Journal of Computer Applications, (0975 – 8887), 35(11), pp. 24-35, December, 2011. Jungmayr, S. (2002). Design for Testability, In Proceedings of CONQUEST 2002, pp. 57-64, September 18th-20th, 2002, Nuremberg, Germany,. Ranjana, R. & Aziz-ur-Rahman, M. (2006). Multivariable System Security Using ANN in the Libraries: Designing and Development, The 4th International Convention CALIBER-2006, INFLIBNET Centre, 2-4 February 2006, Gulbarga. Jojodia, S. & Kogan, B. (1990). Transaction Processing in Multilevel-Secure databases using Replicated Architecture, The Proceedings of the 1990 Symposium on Research in Security and Privacy, pp. 360-368, May 1990.

2nd Annual International Interdisciplinary Conference, AIIC 2014, 8-12 July, Azores, Portugal Proceedings, Vol.3
457
Al-Khanjari, Z.A. (2006). Partial Automation of Sensitivity Analysis by Mutant Schemata Approach, the International Arab Journal for Information Technology (IAJIT), 3(1), pp. 82-93, January, 2006. Rojas, R. (1996). Neural Networks, Springer-Verlag, Berlin, 1996. Thomas, A. & Kaltschmidt, C. (2014). Bio-inspired Neural Networks, Springer International Publishing Switzerland, 2014.
2nd Annual International Interdisciplinary Conference, AIIC 2014, 8-12 July, Azores, Portugal Proceedings, Vol.3
458
SUSTAINABILITY IN INFORMATION SYSTEMS AUDITING
Alifah Aida Binti Lope Abdul Rahman A.Al-Nemrat D.S. Preston
Abstract Auditing is a systematic process of obtaining and evaluating evidence of activities, events or transactions. Currently, audit practices have been revolutionized by the development of information technology and basically information systems auditing focuses on assessing proper implementation, operation and control of information systems resources within organisation. Several frameworks have been formulated for information systems auditing implementation to achieve improvement in auditing performance related to compliance requirements, internal controls evaluation and information systems success. However, sustainability dimensions in the information systems auditing practices and the development of appropriate framework are not enough discussed in the literature although sustainability is becoming significant in achieving certain organisation’s objective. Therefore, this study intends to analyse the relevant requirements by auditors and sustainability factors and use them to formulate IS audit by integrating sustainability in the auditing process. Thus, improve audit performance and enhanced accountability and integrity of auditors.
Keywords: Sustainability, Continuous Auditing, Information Systems Auditing Introduction The main purpose of IS auditing is to provide assurance that the information systems are functioning in an efficient and effective manner to achieve organisation’s objective. As IS are inter related, Sayana (2002, p. 2) suggested that information systems assessment should be carried out by implementing an integrated evaluation of all IS components. In general, the major elements consist of physical and environmental, systems and administration, application software, network security, business continuity and data integrity. Each element may have different priority, therefore the most significant elements may be selected for auditing. Hall and Singleton (2005, cited in Abdolmohammadi & Boss, 2011, p. 141) indicated that IS audits includes the assessment of controls, computer resources, operation and IS implementation. In addition, a number of audit techniques are used for gathering evidence such as reviewing documents, interviewing and data analysis by using automated programs According to AICPA, 2007, AU319.30, IS audit must be performed when;
a) The client utilizes complex business systems and relies extensively on IT controls b) The client has replaced or made any significant changes to its IT systems c) The client extensively shares data between systems internal organizational systems d) The client is involved in electronic commerce e) The client uses emerging technology
2nd Annual International Interdisciplinary Conference, AIIC 2014, 8-12 July, Azores, Portugal Proceedings, Vol.3
459
f) Significant amounts of required audit evidence are electronic. Another consideration of IS audit framework is proposed by the IIA Global Technology Auditing Guide. Juergens (2006, cited in Majdalawieh and Zaghloul , 2009, p.355) stated four aspects of IS audit universe from the Guide; a) IT Management, b) Technical Infrastructure, c) Applications and d) External connections. Under this context IT Management refers to the assessment of IT Governance and process, technical infrastructure is the evaluation of supporting systems such as network, database management systems and security. IS auditor is also required to evaluate the applications systems that are related to business processes such as processing controls, access controls and input and output controls. Going by this framework, external connections are related to audit activities within virtual business environment such as e-commerce and online transactions. Prior work on IS auditing has focused on the evaluation of controls and risks assessment. Wulandari (2003, cited in Majdalawieh & Zaghloul, 2009, p.353) stated that Information System audit is an assessment of system compliance to applicable policies, procedures, rules and regulations and gives assurance that data integrity, suitable system controls and value for money. Similarly, Mahzan &Veerankutty (2010, p.1557) also highlighted the IT auditing activities of public sector in Malaysia is focusing on the effectiveness of controls evaluation to ensure the policies, procedures, practices and organisational structures are complied with the rules and regulations. Amancei and Surcel (2010, p. 55) proposed systematic procedures in carrying risks assessment in organisations by focusing key IT audit activities, namely IT strategic plan, organisation and operation of IT department, IT systems and IT security. As the significant role of public sector auditors are to provide assurance that public assets are safeguarded, value for money for government’s investment and integrity, the nature of IS audit conducted is to evaluate the effectiveness of controls, systems are secured and functioned as intended, Petterson ( 2005, cited in Mahzan and Veerankutty, 2011,p.1552). According to ISACA, evaluation of the information systems covers a wide range of IT areas that would have significant impact on the electronic service delivery; it comprises controls assessment, IT investment, system reliability, software capability maturity model, managing information system, project management and information security management. In relation to information systems evaluation, COBIT specified a number of approach for performing IT audit such as the balance scorecard for IT/business alignment, maturity models for benchmarking, key goal indicators (KGI) for measuring the outcome and key performance indicators (KPI) for performance measurement. To date, sustainability issue has gained a significant amount of attention from several disciplines. The introduction of sustainability into business operation including government’s agendas has been the subject of many researchers. In response to this issue, a number of studies have examined sustainability, its definition, research framework, concept, approach, and its implementation (Afgan and Andre, 2006; Searcy et al. 2007; Fuchs, 2008 and Erek et al. 2009).The most widely recognised definition is given by the Brundtland Commission (World Commission on Environment and Development, 1987, p.24) which mentioned that sustainability is the progress that meets the needs of present without comprising the ability of future generations to meet their own needs. To date, the term sustainability refers to an integration of social, environmental and economic dimensions. Under this consideration, Shrivastava (1995a, cited in Carter and Rogers, 2008, p. 363) claimed that sustainability has the potential in minimising long term risks that associated with resource depletion, fluctuations in energy cost, product liabilities, pollution and waste management. Recent research has shown that in achieving sustainability values and competitive advantages, it needs an integration of strategy plans and goals that bring benefit and greater value to the organisation. Business continuity, resiliency and business endurance is also an
2nd Annual International Interdisciplinary Conference, AIIC 2014, 8-12 July, Azores, Portugal Proceedings, Vol.3
460
effort for sustainability in order to maintain competitiveness (Smith and Scharicz, 2011 cited in Smith, 2012, p.5 and Asif et al., 2008, p.423). Previous literatures have also identified influences on the process associated with sustainability to improve organisational performance while simultaneously preserving environmental system and safeguarding social benefit. Smith & Sharicz (2011, p.81) denoted that a systematic governance structure and effective leadership are the key components to adopt TBL sustainability. Millar et al. (2012, p.493) enhanced the views of Smith & Sharicz (2011) by investigating and analysing the organisational change for sustainability. Sustainability involves transformation in business structures and therefore, an effective communication and collaboration to every hierarchy is essential to implement new strategies. Sustainability is also perceived as a strategy for continuous improvement. Under this context, Prajog and Sohal (2004, cited in Jaca et al., 2012, p.143), indicated that sustainability is the ability of organisations to meet changes requirement in the business processes, applying contemporary best practice methods and remain competitive in market. Concerning continuous improvement, Jaca et al., (2012) analysed and measures several factors for achieving systematic management of improvement activities. Sustainability in information systems Wide review of studies has indicated that information systems play a role as a key element for sustainable development in health practices, supply chains, IS projects and information security governance (Kimaro and Nhampossa, 2007; Silvius and Nedeski, 2011; Piotrowicz and Cuthbertson, 2009). Korte et al.,(2012) and Silvius (2009) proposed sustainability to be incorporated into information systems evaluation and for ICT projects. Misund and Hioberg viewed sustainability in the context of information system (2003, quoted in Nurdin et al. 2012, p. 70) as a technology that is capable of being maintained over a long period of time. Kiggundu(1989 cited in Ali and Bailur, 2007) emphasised that sustainability is an operational simplicity, flexibility, maintainability, robustness, availability and capability of technical and managerial personnel. Similarly, Braa, Monteiro and Sahay (2004, cited in Nurdin et al., 2012) claimed that sustainability is about making information systems work over time. In conjunction with technology advancement, Oyomno (1996, quoted in Kimaro and Nhampossa, 2007, p.3) noted that sustainability of IT is actually dependent upon technology as the main role of IT is tosupport system utilization. Sustainability is also encompasses a set of process including design, development and implementation and also associated risks to the achievement of objectives. A review by Silvius et al., (2009, p.43) proposed a framework of performance indicators or criteria for sustainability in ICT projects by considering the triple P concept and the project life cycle. Indicators were categorised as people, planet and profit and the effect is actually depends on certain constraint such as cost, time and quality. Silvius and Nedeski (2011, p. 6) enhanced the sustainability principles into project management by developing a maturity model to monitor project performance. Bagheri and Hjorth (2007, quoted in Esquer et al., 2008, p. 1028) claimed that the concept of sustainability has been very challenging for many practitioners as it varies according to the interest, needs and values of different communities. In this sense, sustainability is necessary to consider the integration of both conceptual and practical dimensions which include the principle or values, specific actions, processes and strategies to achieve objectives. The term ‘Sustainability’ is a universal or macro concept that is being used to define entire system or infrastructure such as health system (Kimaro, 2006: Kimaro and Nhampossa, 2007), information system (Marcel et al., 2012) information (Todorov and Marinova, 2010) and economy (Majdalawieh et al., 2009). From the information systems viewpoint, it can be
2nd Annual International Interdisciplinary Conference, AIIC 2014, 8-12 July, Azores, Portugal Proceedings, Vol.3
461
observed that most of sustainability research pertaining to this area have extensively discussed environmental issues such as green information technology (green IT), green information system (green IS) or green IT investment which focuses on reduction of energy consumption or addresses issue on sustainability efforts on green supply (Erek et al., 2009; Harmon et al., 2010) Another consideration for sustainability literatures is sustainability for ICT development and five (5) main dimensions have been identified, namely; financial, social, institutional, technological and environmental. These five dimensions are crucial to be considered in planning and implementing ICT projects. Proenza, (2001 cited in Ali and Bailur, 2007) indicated that financial sustainability refers to the long term ability of ICT projects to generate monetary benefit for maintaining the obligations of the organisation. Technological sustainability is the ability for a technology to sustain and continuously available for a long period of time, Misund and Hoiberg (2003 quoted in Ali and Bailur, 2007). Social sustainability refers to user satisfactions by considering cultural differences, empowering marginalised groups, sharing and aligning goals with local people and adapting to evolving community needs (Gόmez and Casadiego, 2002; Harris et al., 2003; Stoll and Menou, 2003; Delgadillo, 2004 quoted in Ali and Bailur, 2007). Institutional sustainability refers to the long term ability of process and structures of organisation to perform their functions, Batchelor and Norrish (2003 cited in Ahmad Nawi et al., 2013, p. 696) In addition to sustainability dimensions of environmental, social and economy, recent literature has introduced sustainability from the hybrid systems perspective or systems of systems. Hessami et al., (2009,p.84) applied Weighted Factor Analysis methodology (WeFA) to examine the context, components, topology and the scope of sustainability from micro systems to macro systems. Systems sustainability framework was formulated from WeFA schema consisting of economy, environmental, social, technology, resource, uncertainty, rapid change in the domain of deployment and complexity. Sustainability measurement Having defined sustainability and issues to be considered, it is important to explore how to assess sustainability. Piotrowicz (2009, p.492) claimed that sustainability cannot be assessed by traditional performance measurement. As sustainability is a holistic concept which involves integration and interdependence among systems, the sustainability measurement has to be connected to economy, environment and social aspects. Sustainability can be measured by using a set of indicators or indexes. In addition to business’s Guidelines, Standards and Regulations to be complied, many organisations have developed their own mechanism as a sustainability performance indicators or sustainability metrics for assessing their sustainability performance. Previous studies have introduced several initiatives to measure sustainability. Delai and Takahashi (2011, p.440) denoted that sustainability measurement implementation needs to consider four (4) situations; 1) the sustainability measurement criteria, 2) theme and sub themes to be applied, 3) selection of groups in the measurement process and 4) sphere of the company impacts to be taken into account. It is reported by United Nation 2002, that sustainability refers to the effort of minimising negative impact on economy, environmental and social activity. The current practices of laws, policies and regulations may also have impact to the development of a good sustainability performance. According to Nicho and Cusack (2007), IT auditing is able to develop quality assurance, benchmarking and measurement. Prior sustainability literatures in information systems evaluation were mainly discussed the effective use of computing resources to meet business demands and to achieve sustainability objectives. However, less number of research
2nd Annual International Interdisciplinary Conference, AIIC 2014, 8-12 July, Azores, Portugal Proceedings, Vol.3
462
has examined the importance of information systems in the area of sustainable information systems auditing to collect audit evidence, analyse, execute audit work and report IS audit findings. Therefore, there is a need to construct the dimension of sustainability from IS auditing perspective. In this study, the author proposed a continuous auditing methodology to be adapted to measure sustainability in information systems. Identification of the important aspects of sustainability in conducting information systems auditing will be determined by the current literatures. The author engaged three phases to gain the objective of this study; includes 1) current IS audit, 2) developing IS audit criteria and objective, 3) IS audit method (continuous auditing). New requirements for improvised the current audit practice Auditors are required to investigate, collect and evaluate evidence to ensure the process of compliance and controls are effective for organisation to achieve its goal. To date, the current IS audit process is compliance oriented, as a result majority of IS audit findings are compliance based rather than value for money audit assessment. The main role of auditing is providing facts and reliable information, therefore the audit conclusion needs to be comprehensive, value added and reliable in producing facts and supporting audit evidence. In order to achieve this purpose, IS auditing activities need to be improvised, well defined process and consistent. The development of the sustainable IS auditing process will be taking into consideration IT Audit Management framework (Rosário et al., 2012, p. 2), sustainabilityobjective, CA methodology and IS audit management processes to integrate compliance and value for money audit assessment. Current IS audit processes Generally, IS auditing is performed according to four phases; planning, executing, reporting and follow up. Audit standards require audit work to be properly planned to ensure the effectiveness and the efficiency of audit performance. Planning audit work begins with the establishment of audit objective, determines audit scope and defines audit criteria. ISACA (1998) defined IT audit objective as a statement of the desired result or purpose to be achieved by implementing control procedures in a particular IT activity. Innovation of technology has affected the way auditing is conducted, however overall audit objectives are not change, Yang & Guan (2004, p.554). Audit criteria are described in a measurable way which includes policies, procedures and standards that should be complied by the organisations. At the execution phase, it consisting the assessment or evaluation of the IS process by following specific procedures, applying audit techniques and methodology to gather audit evidence. IS auditing also includes the use of CAATTs to support audit work for analysing the efficiency and the effectiveness of controls. At the end of the processes, audit findings will be documented into a formal report for distribution. Follow up audit will be performed on all audit issues subsequent to the issuance of audit reports by the Auditor General. Continuous auditing as IS audit method The concept of continuous auditing (CA) has been discussed for several years. The concept of continuous auditing has been studied by many researchers for example real time assessment on financial statements (Rezaee et al., 2001), investors perceptions of a firm risk (El-Masry and Reck, 2008) and later Majdalawieh et al., (2012) studied the integration of continuous auditing within an enterprise system environment. Rezaee et al., (2001, p. 151) defined CA as a systematic process of gathering electronic audit evidence as a reasonable basis to render an opinion on fair presentation of
2nd Annual International Interdisciplinary Conference, AIIC 2014, 8-12 July, Azores, Portugal Proceedings, Vol.3
463
financial statements prepared under the paperless, real-time accounting systems. They introduced CA as a concurrent audit technique to be used in extracting evidence as the application systems processing occurs. The emerging of technology has changed the audit approach form traditional manual process to a paperless. Under this consideration, Rezaee et al., (2002, p.160) defined CA as a comprehensive electronic audit process that enable auditors to provide some degree of assurance on continuous information simultaneously with, or shortly after, the disclosure of information. They proposed data warehouses and data marts to be created for separating audit evidence on a real time basis. Data captured by using CA application are held in data marts for testing and analysis. In relation to secured transmission, Onion (2003, cited in Majdalawieh et al., 2012, p. 310) proposed keystroke level data examination to monitor the integrity of the data by introducing the Extensible Continuous Auditing Language. According to ISACA (2011) continuous auditing is a methodology or framework that enables auditors to provide written results on the subject matter. The ability to report on events in a real time or near real time environment can provide significant benefits to the users of audit reports. The main differences between traditional audits and continuous auditing are the shortened time to release reports. Majority of literatures assumed that continuous audits are conducted online, however, it is important to note that continuous auditing may be performed either online or offline subjected to internal or external audit requirements (El- Masry and L. Reck, 2008, p.782) The most accepted CA definition given by CICA/AICPA research report) CICA/AICPA, (1999 cited in Majdalawieh and Zaghloul, 2009, p. 360) defined that CA is a methodology that enables auditors to provide written assurance on a subject matter using a series of auditor’s report issued simultaneously with or a short period of time after the occurrence of events underlying the subject matter. In this context, CA may have to rely on the current technology such as broad bandwidth, web application server technology, web scripting solutions and ubiquitous database management systems with standard connectivity (Sarva, 2006). Many studies addressing the feasibility of CA to reduce firm risks and increase investor’s confidence (El-Masry and Reck, 2008), capability to receive results of the audit procedures almost immediately after their occurrence (Rezaee et. al., (2001, p. 151), capable to test key controls on recurring basis by applying embedded audit modules software e.g ACL (Daigle et al., 2008). In terms of red flag detection, Debreceny et al., (2003 cited in Davidson et al., 2013, p. 45) suggested that sufficient understanding of business processes and controls risks are required to implement CA systems in order to ensure that appropriate red flags are generated. As processing systems becomes more complex due to the expansion of business and networks, the security of the system and of the system’s internal controls becomes more critical. Therefore, it is crucial for a continuous assessment for accuracy and reliability of the systems and CA allows auditors to examine internal controls structure in a whole, provides capability to perform audit more frequently and offers the ability to expand the scope and magnitude within critical areas of the organisation, ACL (2006, cited in Majdalawieh et al., 2012, p. 307). In this context, Chen (2004, cited in Moorthy et al., 2011, p. 3528) has explored the use of strategic systems approach in CA implementation as it offers continuous monitoring in a real time environment and capable to detect material errors in financial transactions. CA is also perceived to enhance corporate governance effectiveness (Warren and Parker, 2003 cited in Davidson et al., 2013, p. 45). With the implementation of the Sarbanese-Oxley (SOX) Act2002, many companies are now concern about the adequacy of internal controls over the systems that produced financial information. Vasarhelyi et al.,
2nd Annual International Interdisciplinary Conference, AIIC 2014, 8-12 July, Azores, Portugal Proceedings, Vol.3
464
(2004, cited in Brown et al., 2007,p. 3) claimed that CA and analytic monitoring techniques are capable to support the implementation of SOX (section 404) and Harrison (2005, cited in Brown et al., 2007,p. 3) believed that CA techniques are the only way to achieve compliance requirements of Federal regulations. In regards to SOX implementation, El-Masry and Reck, 2008 confirmed that CA has significant impact on investors’ perception of firm risk and the value of a firm. The result of their study confirms that CA has positive impacts on investor’s perceptions of firm risk and investor confidence in their investing decisions. In addition to investors’ concern, CA is also able to satisfy the external parties of organisation such as suppliers and the customer with real time information (Hao and Zhang, 2010, p.445) One of the greatest advantages of CA is continuous assessment and the ability to provide frequents report to decision makers (Hunton, et al., 2002 cited in Brown et al., 2007, p.1), timely detection of abnormalities, thus allowing the management to adapt the strategic planning process in order to deal with risks ( Ramaswamy & Leavins, 2007 cited in Charlton and Marx, 2009, p. 50) and improve audit quality as CA is able to examine financial and non financial information (Hao and Zhang, 2010, p.445). In addition, utilising CA provides auditors to use advanced network technology and therefore can test larger samples or even complete samples more efficient and effective than traditional audit. Under this consideration, Groomer (2006, cited in Davidson et al., 2013, p. 45) claimed that CA can eliminate statistical inferences. While, the automation of evidence gathering process enables the auditor to reduce the amount of time and cost in conducting examinations of transactions thus provides sufficient time for auditors to understanding business processes and evaluate internal control structures. In this sense, CA contributes to reduce audit risks (Rezaee et al., 2002, p. 151, Hao and Zhang, 2010,p. 445).Under CA, auditor needs to employ a control risk oriented audit plan which focus on the effectiveness and the sufficiency of internal controls activities, assess inherent and control risks and a detail set of audit tests to be performed (Rezaee et al., 2002, p. 151). Limitation of continuous auditing Despite early evidence of CA to improve audit practices by implementing real-time assessment, real-time auditing is not always efficient in terms of cost benefit (Shin et al., 2013,p. 596). According to Chan and Vasarhelyi, 2011, p. 154), the level of risk will determine the work of CA, if there is high risk of business processes, then CA is the most effective method. If the level of risks is lower, it will be more effective to conduct regular auditing. Chan and Vasarhelyi, (2011, p.155) claimed that the implementation of CA needs automation auditing procedures to test automated business processes, however, it is impossible to automate of all traditional audit procedures. Similarly, Shin et al., (2013,p.597) argued that some businesses processes may require manual auditing practices and professional judgment by the auditors. CA may be implemented by internal and external auditors, therefore there is a tendency for duplication of works. To be effective, Chan and Vasarhelyi (2011, p. 597) suggested that internal auditors focus on supervision and testing a large volume of data and external auditors high dimensional analyses, implement audit trail monitoring in the CA systems and check for fraud among managers. From continuous auditing to continuous monitoring According to Alles et al., (2006, p.138), continuous monitoring is the subset of continuous auditing known as continuous monitoring of business process controls (CMBPC) which is most relevant to the Section 404 of the Sarbanese/Oxley Act that require the
2nd Annual International Interdisciplinary Conference, AIIC 2014, 8-12 July, Azores, Portugal Proceedings, Vol.3
465
participation of managers and auditors to ensure the effectiveness and the efficiency of controls over the firm’s financial reporting processes. In this sense, Kogan et al., (1999, cited in Alles et al., 2006, p. 138) highlighted the problem of CA implementation, either it is a control oriented or data oriented as there are instances that process controls are not automated or their settings are not readily accessible. In such environment, CA is perceived to be data oriented where it works on automated substantive procedures and analytical procedures, and involve manual procedures for testing controls. Shin et al., (2013, p. 621), studied the implementation of the CA in the ERP-based environment which involve significant role of CM in enhancing the effectiveness and efficiency of auditing. They argued that CA system implementation can be divided into two stages; 1) extraction of CM scenario and 2) the implementation of risks monitoring systems. Framework: Integrating CA in the IS audit process In achieving sustainability values of information systems auditing and using CA as a tools, a systematic and conceptual framework of information systems auditing needs to be established. It is important to consider the element of public sector auditing in developing the framework therefore it was created based on the International Standards of Supreme Audit Institutions (ISSAI, 2007). In light of sustainability developments, this paper includes the concept of sustainability from the information systems perspective in conducting IS audit works. Under this context, the proposed framework is designed based on literatures from continuous auditing, sustainability and auditing related to information systems auditing.The framework contains of three essential factors; audit plan audit execution, audit reporting/follow up. Follow- up audit will be conducted on all audit issues subsequent to the issuance of audit reports. Basically, the audit processes are divided into 3 phases; 1) audit plan, 2) audit execution and 3) audit reporting/follow up. The audit plan phases start with the determination of audit approaches, either compliance oriented or performance oriented. This identification requires the sustainability mechanism where auditors need to take into account the concept and factors contributing for sustainability development. At the planning phases, the requirements of sustainability mechanisms need to be addressed with the establishment of audit objectives, audit criteria and audit scope, usually it is defined according to decision making level; specifically strategic, tactical and operational. At the strategic level, it involves top management to formulate audit objectives and identify strategies to accomplish those objectives. In setting audit plan, it comprises several activities such as understanding entity, determining business objectives, understanding the information systems of the entity, understanding the IT projects invested ( if any) conducting risk assessment to determine IT risks factors and business risk factors, isolate significant information systems that are supporting the business processes, selection audit topic, establishing audit schedule for conducting fieldwork to the preparation of audit report and lastly conform the plan with management. The tactical level refers to the implementation of strategic decisions. In this regards, the sustainability initiative is need to be embedded in the audit objectives in terms of structuring work flow, establishing audit criteria, defining audit techniques and procedures, acquisition of resources. The operational level refers to routine activities, decisions and responsibilities in managing resources and delivery services. At planning phase, the IS audit team needs to consider strategic and tactical design for embedding sustainability into the IS audit work.
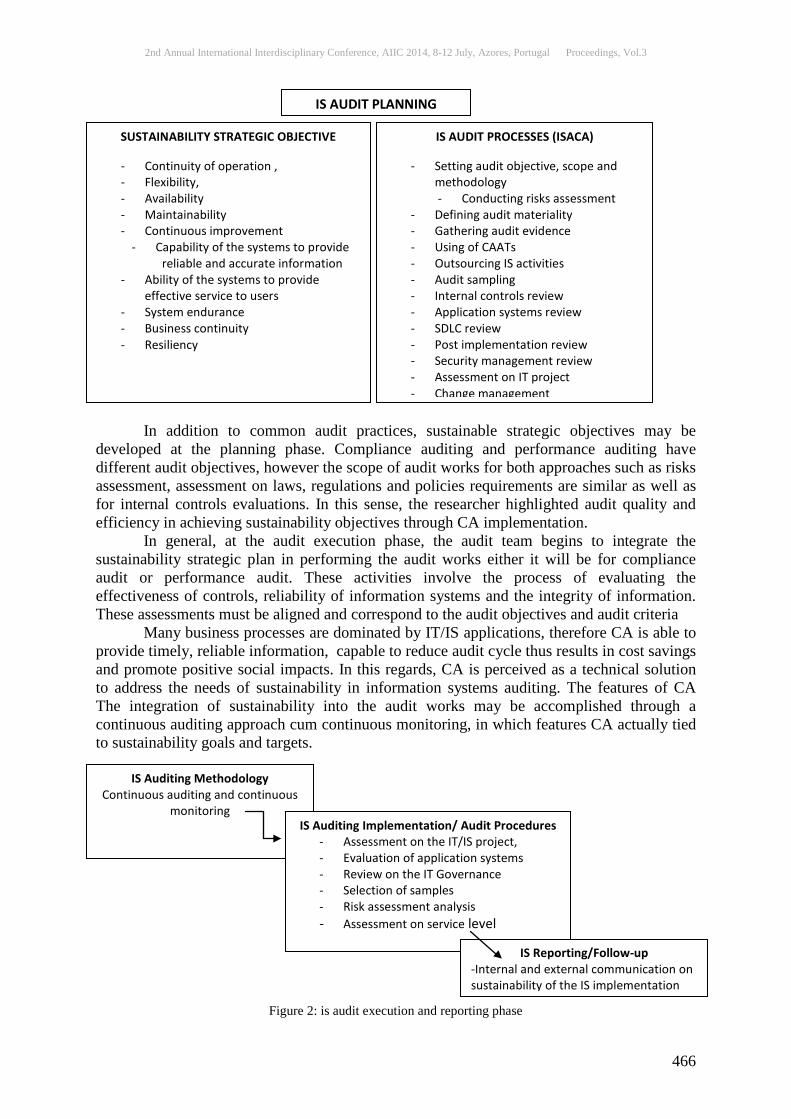
2nd Annual International Interdisciplinary Conference, AIIC 2014, 8-12 July, Azores, Portugal Proceedings, Vol.3
466
Figure: 1: IS Audit Planning Phase In addition to common audit practices, sustainable strategic objectives may be developed at the planning phase. Compliance auditing and performance auditing have different audit objectives, however the scope of audit works for both approaches such as risks assessment, assessment on laws, regulations and policies requirements are similar as well as for internal controls evaluations. In this sense, the researcher highlighted audit quality and efficiency in achieving sustainability objectives through CA implementation. In general, at the audit execution phase, the audit team begins to integrate the sustainability strategic plan in performing the audit works either it will be for compliance audit or performance audit. These activities involve the process of evaluating the effectiveness of controls, reliability of information systems and the integrity of information. These assessments must be aligned and correspond to the audit objectives and audit criteria Many business processes are dominated by IT/IS applications, therefore CA is able to provide timely, reliable information, capable to reduce audit cycle thus results in cost savings and promote positive social impacts. In this regards, CA is perceived as a technical solution to address the needs of sustainability in information systems auditing. The features of CA The integration of sustainability into the audit works may be accomplished through a continuous auditing approach cum continuous monitoring, in which features CA actually tied to sustainability goals and targets.
Figure 2: is audit execution and reporting phase
IS AUDIT PLANNING
SUSTAINABILITY STRATEGIC OBJECTIVE
- Continuity of operation , - Flexibility, - Availability - Maintainability - Continuous improvement
- Capability of the systems to provide reliable and accurate information
- Ability of the systems to provide effective service to users
- System endurance - Business continuity - Resiliency
IS AUDIT PROCESSES (ISACA)
- Setting audit objective, scope and methodology - Conducting risks assessment
- Defining audit materiality - Gathering audit evidence - Using of CAATs - Outsourcing IS activities - Audit sampling - Internal controls review - Application systems review - SDLC review - Post implementation review - Security management review - Assessment on IT project - Change management
IS Auditing Methodology Continuous auditing and continuous
monitoring IS Auditing Implementation/ Audit Procedures
- Assessment on the IT/IS project, - Evaluation of application systems - Review on the IT Governance - Selection of samples - Risk assessment analysis - Assessment on service level
IS Reporting/Follow-up -Internal and external communication on sustainability of the IS implementation

2nd Annual International Interdisciplinary Conference, AIIC 2014, 8-12 July, Azores, Portugal Proceedings, Vol.3
467
The final stage of the sustainability integration into IS auditing process are follow up activities. The purpose of follow up is to ensure the implementation of sustainability into IS projects or application system development or IT Governance is satisfactory.
Figure 3: Use of the CA/CM concept in defining and generating IS audit questions based on the sustainability objectives
(FOR COMPLIANCE AUDIT) IS Procedures
Figure 3: procedures flow diagrams by using ca/cm
(FOR PERFORMANCE AUDIT) IS Procedures
Audit objective To ensure the IS project implementation are value for money
Sustainability strategic objective
The IS project are planned and implemented according to 5 dimensions-financial, social, institutional, technological and environmental.
CA objective Continuous monitoring on the internal controls and the implementation of projects.
Potential CA methods: Continuous monitoring - Shin et al. (2013) Figure 4 : procedures flow diagrams by using ca/cm
Implication of study for the audit profession From the discussion and analysis, CA is an appropriate audit method in performing compliance audit and performance audit works. From the compliance audit perspective, CA is capable to detect unauthorised activity, reduce errors and produce timely report. In conjunction to sustainability requirement, CA has a technology that provides opportunity for the auditors to examine the ability of the system to provide service to users, the capability of the systems to provide accurate and reliable information to users and stakeholders and resiliency of the systems. From the performance audit viewpoint, CA allows manual procedures that require professional judgment by the auditor for example the evaluation of management estimates, (Chan and Vasarhelyi, 2011, p. 155). Performance audit objective is to assess whether the government’s activities/programmes/projects have been carried out in effective, efficient and economy manner to achieve their desired objectives. In relation to sustainability strategic objective, previous literatures has identified five (5) dimensions that need to be considered in planning and implementing ICT projects; namely financial, social, institutional, technological and environmental. Under this context, the continuous auditing cum continuous monitoring procedures provides the opportunity for auditors to fulfil the sustainability requirements such
Audit objective To ensure appropriate controls are in place for input, process and output. Sustainability strategic objective To ensure the continuity of IS operations
CA objective Transactions are generated timely and accurately.
Potential CA methods: Audit hooks, Continuous and intermittent simulation (CIS)
Personnel activated the application systems and
input data
The application systems process transactions/ input
The application systems reconcile transactions/input
The application systems generates output
The establishment of audit objectives for IS project: economy, efficiency andeffectiveness
Implementation of the IS project.
The assessment of the 3e by auditors:
economy, efficiency and effectiveness
2nd Annual International Interdisciplinary Conference, AIIC 2014, 8-12 July, Azores, Portugal Proceedings, Vol.3
468
as reducing the potential of IS project failure, cost overrun and project delayed. The adoption of CA and its techniques could enhance audit works by providing objective information to public. Conclusion This study has attempted to explore the use of CA techniques to provide advantage for IS auditing implementation. As sustainability is becoming important issue in many organisations, the integration of sustainability to IS audit work is crucial to produce reliable and objective report to public. The application of CA to achieve sustainability strategic objective in IS auditing is perceived to have advantage to auditors and have great impacts upon the process of IS auditing, implementing audit procedures and audit assurance as a whole. The current study has provided a brief views from the initial investigation. Further studies are necessary to explore how important of sustainability dimension in information systems evaluation and how views and perceptions expressed in applying CA as part of audit methods in compliance and performance auditing. References: Abdolmohammadi, M.J. and Boss, S. R. (2011) ‘Factors associated with IT audits by the internal function’, International Journal of Accounting Information Systems, 11, pp. 140–151 Afgan, H. N., Andre, P. and Carralho, G.M. (2006) ‘Sustainability: the management system property’ PICMET Proceedings, Istanbul, Turkey, 9 to 13 July 2006. Alles, M.G., Kogan, A. and Vasarhelyi, M.A. (2008) ‘Putting Continuous Auditing theory into practice: lesson from two pilot implementations’, Journal of Information Systems, 22 (2), pp.195-214 Ali, M. and Bailur, S. (2007) ‘The challenge of sustainability In ICT4D –Is bricolage The Answer?’ Proceedings of the 9th International Conference on Social Implications of Computers in Developing Countries, Sao Paulo, Brazil, May 2007 Amancei, C.and Surcel, T. (2010) ‘Increasing the efficiency of IT audit methodology by using the organizations tolerance to IT systems availability’, Informatica Ecomicá , 14(1), pp.49-56 Bierstaker, J.L., Burnaby, P. and Thibodeau, J. (2001) ‘The impact of information technology on the audit process: an assessment of the state of the art and implications for the future’, Managerial Auditing Journal, 16(3), pp. 159-164 Brown, C. E., Wong, J.A.andBaldwin, A.A. (2007) ‘Research streams in continuous audit: a review and analysis of the existing literature’, Journal of Emerging Technologies in Accounting, pp. 1-28 Burrowes, A. and Persson, M. (2000) ‘The Swedish management audit: a precedent for performance and value for money audits’, Managerial Auditing Journal, 15(3), pp. 85-96 Carter, C. R. and Rogers, D. S. (2008) ‘A framework of sustainable supply chain management: moving toward new theory’, International Journal of Physical Distribution & Logistics Management, 38( 5), pp. 360-387 Charlton, G. and Marx, B. (2009) ‘An investigation into the impact of continuous auditing on the external auditors of the four largest banks in South Africa’, South Africa Journal of Accounting Research, 23(1), pp.45-65 Chen, D.Q., Mocker, M., Preston, D.S. and Teubner, A. (2010) ‘Information system strategy: reconceptualization, measurement and implication’, MIS Quarterly, 34 (2), pp. 233-259

2nd Annual International Interdisciplinary Conference, AIIC 2014, 8-12 July, Azores, Portugal Proceedings, Vol.3
469
Daujotaitė, D. and Maĉerinskienė, I. (2008) ‘Development of performance audit in public sector’5th International Conference Business and Management, Vilnius, Lithuania, 16 to17 May 2008. Delone, W.H. and McLean, E.R. (2003) ‘The DeLone and McLean Model of information systems success: a ten-year update’, Journal of Information System, 19 (4), pp. 9-30. De Bu’rca, S., Fynes, B. and Brannick, T. (2006) ‘The moderating effects of information technology sophistication on services practice and performance’, International Journal of Operation & Production Management, 26(11), pp. 1240-1254 Davidson, I.B., Desai, N.K. and Gerard, G.J. (2013) ‘The effect of continuous auditing on the relationship between internal audit sourcing and the external auditor’s reliance on the internal audit function’, Journal Of Information Systems American Accounting Association, 27 (1) pp. 41–59 Delai I. and Takahashi S. (2011) ‘Sustainability measurement system: A reference model proposal’, Social Responsibility Journal, 7 (3), pp. 438-471 Dittenhofer, M. (2001) ‘Performance auditing in government’, Managerial Auditing Journal,16(8) pp. 438-442. Ebrahim, Z., Irani, Z. and Al Shawi, S. (2004) ‘A Strategic Framework for E-government Adoption in Public Sector Organisations’Proceeding of the Tenth Americas Conference on Information Systems, New York, August 2004. El-Masry, EHE., and L. Reck, J. (2008) ‘Continuous online auditing as a response to the Sarbanese Oxley Act’,Managerial Auditing Journal, 23(8), pp. 779-802. Erek, K., Schmidi, N-H., Zarnekow, R. and Kolbe, M. L. (2009) ‘Sustainability in information system assessment of current practices in information systems organisations’ Proceeding of the 15th American Conference on Information System, San Francisco, California, 6 to 9August2009. Esquer-Peralta, J., Velasquez, L. and Munguia, N. (2008) ‘Perceptions of core elements for sustainability management system (SMS)’, Management Decision, 46 (7), pp.1027-1038 Fuchs, C. (2006) ‘The implication of new information and communication technologies for sustainability’, Springer Science + Business Media B.V., pp.291-309 Gauld, R. (2007) ‘Public sector information system project failures: lessons from a New Zealand hospital organization’, Government Information Quarterly, 24 (2007), pp. 102-114. Goldfinch, S. (2007) ‘Pessimism, computer failures and information system development in the public sector’, Public Administration Review, Sept/Oct.2007, pp. 917-929. Goolsarran, S. A. (2007) ‘The evolving role of supreme audit institutions’, Journal of Government Financial Management, pp. 28-32 Griffiths, A. and Petrick, A.P. (2001)‘Corporate architecture for sustainability’, International Journal of Operations & Production Management, 21(12), pp.1573-1585 Grönlund, A., Svärdsten, F. and Öhman, P. (2011) ‘Value for money and the rule of law: the (new) performance audit in Sweden’,International Journal of Public Sector Management, 24(2), pp.107-121 Guan, Y. (2010) ‘A study on the internal control of accounting information system,’ IEEEInternational Conference on Computer and Communication Technologies in Agriculture Engineering, 2010, pp.203-206 Hao, Y. and Zhang, Y. (2010) ‘Innovation and value added’, IEEEThird International Symposium on Information Processing, 2010, pp.442-446 Harmon, R., Demirkan, H., Auseklis, N. and Reinoso, M. (2010) ‘From green computing to sustainable IT: developing a sustainable service orientation’IEEE, Proceedings of the 43rd Hawaii International Conference on System Sciences, 2010, pp. 1-10

2nd Annual International Interdisciplinary Conference, AIIC 2014, 8-12 July, Azores, Portugal Proceedings, Vol.3
470
Heine, M.L., Grover, and Malhotra, M.K. (2003) ‘The relationship between technology and performance: a meta-analysis of technology models’, The International Journal of Management Science, 31(3), pp. 189-204. ISACA Standards Board (2002), ‘Continuous Auditing: Is It Fantasy or Reality?,’ Information Systems Control Journal, 5, pp.1-4 ISACA White Paper (2011) ‘ Sustainability’, Information Systems Control Journal, pp.1-13 Jin’e, Y. and Dunjia, L. (1997) ‘Performance audit in the service of internal audit’, Managerial Auditing Journal, (12) 4, pp. 192-195 Jaca, C., Viles, E., Mateo, R. and Santos, J. (2012) ‘Component of sustainable improvement systems: theory and practice’, The TQM Journal, 24 (2), pp.142-154 Kimaro, H.C. and Nhampossa, J.L. (2007) ‘The challenges of sustainability of Health Information Systems in developing countries: comparative case studies of Mozambique and Tanzania’, Journal of Health Informatics in Developing Countries, 1(1), pp. 1-10 Kogan, A., Sudit, E. F. and Vasarhelyi, M.A. (1999) ‘Continuous online auditing: a program of research’, Journal of Information Systems, (13) 2, pp. 87–103 Korte, M., Lee, K. and Fung, C.C. (2012) ‘Sustainability in Information Systems: requirements and emerging technologies’, IEEE, 2012 International Conference on Innovation, Management and Technology Research (ICIMTR2012), Malacca, Malaysia, 21 to 22 May 2012, pp. 481-485 Leidner, D.E, Lo, J. and Preston, D. (2011) ‘An empirical investigation of the relationship of IS strategy with firm performance’, Journal of Strategic Information Systems, 20 (9), pp. 419-437 Lagsten, J. and Goldkuhl, G. (2008) ‘Interpretative IS evaluation: results and uses’, The Electronic Journal Information Systems Evaluation, 11(2), pp. 97- 108 Mahzan, N. and Veerankutty, F. (2011) ‘IT auditing activities of public auditors in Malaysia’. African Journal of Business Management, 5(5), pp.1551-1563. Marks, N. (2010) ‘Continuous auditing reexamined’, ISACA Journal, 1, pp. 1-5 Majdalawieh, M. and Zaghloul, I. (2008) ‘Paradigm shift in information systems auditing’, Managerial Auditing Journal, 24(4), pp. 352-367. Majdalawiedh, M., Sahraoui, S., Barkhi, R. (2012) ‘Intra/inter Process Continuous Auditing (IIPCA), Integrating CA Within an Enterprise System Environment’, Business Process Management Journal, 18(2), pp. 304-327. Mat Nayan, M., Badioze, Z.H. and Tengku Sembuk, T.M. (2010) ‘Defining information system failure in Malaysia: results from Delphi technique, 7(10), IEEE, pp.1616-1621 Mc Manus, J. and Harper, T.W. (Autumn 2007) ‘Understanding the sources of information systems project failure’, Management Services, 51(3), pp. 38-43 Melville, N.P. and Ross, S.M. (2010) ‘Information system innovation for environmental sustainability’, MIS Quarterly, 34(1), pp. 1-21. Millar, C., Hind, P. and Magala S. (2012) ‘Sustainability and need for change: organisational change and transformational vision’, Journal of Organizational Change Management’, 25(4), pp. 489-500 Moorthy, M. K., Seetharaman, A ., Mohamed, Z., Gopalan, M. and San L.H. (2011) ‘The impact of information technology on internal auditing’, African Journal of Business Management, 5(9), pp. 3523-3539 Nicho, M. and Cusack, B. (2007) ‘A metrics generation model for measuring the control objectives of information systems audit’ IEEEProceeding of the 40th Hawaii International Conference on System Science, 2007

2nd Annual International Interdisciplinary Conference, AIIC 2014, 8-12 July, Azores, Portugal Proceedings, Vol.3
471
Nurdin, N., Stockdale, R. and Scheepers H. (2012) ‘Organizational adaptation to sustain information technology: the case of e-government in developing countries’, Electronic Journal of e-Government, 10( 1), pp.70-83 Omoteso, K., Patel, A. and Scott,P. (2010) ‘Information communications technology & auditing: current implications and future directions’, International Journal of Auditing, 14, pp.147-162 Petter, S., DeLone, W. and McLean, R. E. (2012) ‘The past, present and future of information system success’, Journal of the Association for Information System, 13 (Special Issue), pp. 341-362 Piotrowicz, W. and Cuthbertson, R. (2008) ‘Sustainability- A new dimension in information system evaluation’, Journal of Enterprise Information Management, 22 (5), pp. 492-503 Plepys, A. (2002) ‘ The grey side of ICT’, Environmental Impact AssessmentReview, 509-523 Malaysian Administration Modernization Planning Unit (2010), Public Sector ICT Strategic Directions, Available at www.mampu.gov.my (Accessed: 10 September 2012) Rahman, N. and Akhter, S. (2010) ‘Incorporating sustainability into information technology management’, International Journal of Technology Management & Sustainable Development, 9 (2), pp.95-111 Raymond, H.A (1995) ‘Compliance auditing’, The Internal Auditor, 52 (6), pp.42 Rezaee, Z., Elam, R. and Sharbatoghlieet, A. (2001) ‘Continuous auditing: the audit of the future’, Managerial Auditing Journal. 16(3), pp. 150-158 Rezaee, Z., Sharbatoghlieet A., Elam, R. and McMickle P.L (2001) ‘Continuous auditing: building automated auditing capability, auditing: A Journal of Practice and Theory, 21( 1), pp.147-163 Sarva, S. (2006) ‘Continuous auditing through leveraging technology’, Information Systems Control Journal, 1,pp. 1-4 Sayana, A.S. (2002) ‘IS audit process’, Information Systems Control Journal, 1,pp. 1-4 Scheirer, M.A and Dearing J.W. (2011) ‘An agenda for research on the sustainability of public health programs’, American Journal of Public Health, 101(11), pp. 2059-2067 Searcy, C., Karapetrovic, S. and McCartney, D. (2007) ‘Application of a systems approach to sustainable development performance measurement’, International Journal of Productivity and Performance Management, 57(2), pp. 182-197 Shaikh, J.M. (2005) ‘E-commerce impact: emerging technology – electronic auditing’, Managerial Auditing Journal, 20 (4), pp. 408-421 Shin, Il, Lee, M. and Park, W. (2013) ‘Implementation of the continuous auditing system in the ERP-based environment’, Managerial Auditing Journal , 28(7),pp. 592-627 Silvius, A.J.G., van den Brink, J. and Smit, J. (2009) ‘Sustainability in information and communication technology project’, Communication of the IIMA, 9(2), pp. 33-44 Silvius, A.J.G. and Nedeski S. (2011) ‘Sustainability in IS project: a case study’, Communication of the IIMA, 11(4),pp.1-12 Swanson, L.A. and Zhang, D.D. (2012) ‘Perspective on corporate responsibility and sustainable development’, Management of Environment Quality, An International Journal, 23(6), pp. 630-639. Smith, P.A.C (2012) ‘The importance of organizational learning for organizational sustainability,’ The Learning Organization, 19(1), pp. 4-10. Smith, P.A.C and Scharicz C.(2012) ‘The shift needed for sustainability’, The Learning Organisation,18(1), pp.73-86 The International Standards of Supreme Audit Institutions \ (1997) ISSAI 1: The Lima Declaration. Available at: http/www.issai.org/media(622,1033)/ISSAI_1 (Accessed: 11 Jan 2013)

2nd Annual International Interdisciplinary Conference, AIIC 2014, 8-12 July, Azores, Portugal Proceedings, Vol.3
472
The International Standards of Supreme Audit Institutions \ (1997) ISSAI 3000: Standards and Guidelines for performance audit based on INTOSAI’s auditing standards and practical experienceAvailable at: http/www.intosai.org (Accessed: 20 Jan 2013) Todorov V. and Marinova D. (2010)‘Information Theory Perspective on Modelling Sustainability’, IEEE Proceedings of the 43rd Hawaii International Conference on System Sciences, 2010, pp.1-10 Wanyama, I. (2011) ‘Stakeholder perception of information systems development success in the public sector’, Management Science and Engineering, 5(2), pp.31-41 Yang, D.C. and Guan, L. (2004) ‘The evolution of it auditing and internal control standards in financial management audit’, Managerial Auditing Journal, 19 (4), pp. 544-555 Zheng, H., Chanaron, J.J., You, J. and Chen, X. (2009) ‘Designing a key performance indicator system for technological innovation audit at firm’s level: a framework and an empirical study’, IEEE, 8(9), pp.1-5
2nd Annual International Interdisciplinary Conference, AIIC 2014, 8-12 July, Azores, Portugal Proceedings, Vol.3
473
EFFECTIVENESS OF OMALIZUMAB IN THE TREATMENT OF CHRONIC RHINOSINUSITIS WITH NASAL POLYPS:
SYSTEMATIC REVIEW
Tiago Soares Santos, MD São Sebastião Hospital, Santa Maria da Feira, Portugal
Vítor F Certal, MD São Sebastião Hospital, Santa Maria da Feira, Portugal
Center for Research in Health Technologies and Information Systems, University of Porto, Portugal Paulo Gonçalves, MD Carlos Carvalho, MD
São Sebastião Hospital, Santa Maria da Feira, Portugal
Abstract BACKGROUND: Omalizumab is a monoclonal anti-IgE antibody which reduces serum and tissue IgE levels blocking the inflammatory cascade. To date this drug has authorization for treatment of moderate-to-severe allergic asthma. The chronic rhinosinusitis with Nasal Polyps (CRSwNP) is a chronic inflammatory disease whose exact pathogenesis remains unknown. In most Caucasian patients CRS is associated with eosinophilic inflammation and local production of IgE. The aim of this systematic review was to evaluate the existing evidence on the use of omalizumab in CRSwNP. MATERIALS AND METHODS: Searches were carried out in Medline, Scopus and Cochrane Library, followed by a detailed handsearch. The search was conducted from January 1990 to December 2013. Prospective and retrospective studies were included. RESULTS: Four studies met the inclusion criteria for this systematic review: two randomized controlled trials, a retrospective case-control study and a case series. Omalizumab appears to improve both endoscopic evaluation and sinonasal inflammation, with an acceptable safety profile. However, the evidence level is low. CONCLUSIONS: The evidence shows that the use of omalizumab may be an effective therapeutic alternative in CRSwNP, especially in patients with more aggressive forms of the disease, with surgical procedures history, and bronchial asthma. However, more randomized, placebo-controlled, double-blind studies with higher number of patients are still needed to determine the efficacy of anti-IgE treatment in CRSwNP.
Keywords: “Chronic Rhinosinusitis”, “Nasal Polyposis”, “Nasal Polyps”, “Omalizumab”, “Anti-IgE” Introduction
Chronic Rhinosinusitis with Nasal Polyps (CRSwNP) is an inflammatory disease, whose exact etiology remains unknown, with an estimated prevalence in Europe’s adult population between 2 and 4 %(1). Researchers suggested that, if after the activation of the inflammatory cascade this inflammation persists, the consolidation of the stromal oedema may occur resulting in the formation of nasal polyps(2). Recently it has been shown that, in most Caucasian patients, this nosological entity is characterized by local eosinophilic

2nd Annual International Interdisciplinary Conference, AIIC 2014, 8-12 July, Azores, Portugal Proceedings, Vol.3
474
inflammation with high production of immunoglobulin E (IgE), as well as interleukin-5 (IL-5) and eosinophilic cationic protein(3).
When medical treatment is ineffective, surgery is an option for CRSwNP. However, recurrence rate is high especially in patients with concomitant asthma, and from these, those who show acetylsalicylic acid intolerance present an even higher rate(1). The concomitant existence of asthma and CRSwNP indicates a more severe respiratory inflammation, as well as higher levels of localized IgE(4,5). As such, effective treatment is more complex in these patients.
Omalizumab (Novartis™) is a monoclonal antibody, available since 2003 that selectively binds to the Fc region of human IgE reducing free IgE, as well as producing extensive anti-inflammatory effects with eosinophil apoptosis induction. This effect was established in sputum samples and bronchial biopsies of asthma patients(6). Considering the pathological similarity between bronchial asthma and CRSwNP, with the presence of large eosinophilic infiltration, this drug has potential effectiveness in the treatment of CRSwNP.
Currently, omalizumab is approved for treatment of moderate-to-severe allergic asthma in patients six years-old or older(7). Besides, there are also some anecdotal reports(8,9) that mentioning omalizumab’s effectiveness in CRS with polyps treatment in patients with concomitant asthma.
The purpose of this review was to systematically evaluate the existing published evidence on omalizumab’s use in the treatment of CRSwNP. Methods Study Design
A systematic review of prospective and retrospective studies was performed in order to evaluate the effectiveness of omalizumab use in CRSwNP treatment.
The methodological approach included the definition of the search strategy and the articles quality evaluation.
Search Strategy
The method used to localize potentially eligible articles involved a search of literature in the following databases: Medline, Scopus and Cochrane Collaboration. The search included articles published since January 1st, 1990 (when the drug was registered in Food and Drug Administration - FDA) until December 31st, 2012. There was a language restriction on the articles which full text was written in Portuguese, English, Spanish, Italian and French, the key words being: “rhinosinusitis”, “nasal polyps”, “nasal polyposis”, “omalizumab”, “anti-IgE”; “IgE”, “treatment”.
An additional search was performed using the same strategy and including articles published until December 31st, 2013.
A review of the most important articles references was performed as well as a manual search of abstracts and contact with specialists developing research in this area. Study quality assessment
Titles and abstracts found in databases were examined by two reviewers e selected in terms of relevance. Posteriorly, both reviewers independently analyzed the full text of the articles initially selected. All disagreements were settled by consensus.
Studies were included (prospective or retrospective), in which the effectiveness of omalizumab’s use in CRSwNP treatment was objectively evaluated, through both nasal endoscopy or imaging exams, or subjectively by quality of life (QoL) evaluation tools.

2nd Annual International Interdisciplinary Conference, AIIC 2014, 8-12 July, Azores, Portugal Proceedings, Vol.3
475
Results Database search and article selection
All database research was accomplished until 31 of January 2014. A flow chart of identification and selection process of the studies is shown in figure 1.
In total, 2073 articles were identified using the aforementioned database research strategies. After evaluation of all titles and abstracts according to relevance, 2046 were excluded (exclusion reasons are mentioned in figure 1). The remaining 27 articles’ full texts were evaluated in a thorough manner. Of these, 22 articles(10-31) were excluded as they did not display any objective or subjective outcome that evaluated CRSwNP. One article(32) was excluded for being written in Japanese. As such, this review includes 4 articles(33-36).
Methodological Quality of the Included Articles
The main methodological features of the included articles are presented in table 1. Only two of the four articles were randomized controlled trials (RCT)(33,35), and the
remaining were a retrospective case-control study(34) and a series of cases(36). All the studies had a small sample size (8 to 24 patients), and in two of them(33,36) the selection criteria was not clearly defined. None of the RCT described any blinding strategies. Additionally, in two articles(33,36) the administered drug dosages were not clearly defined, and, in one of these(36), the treatment time was also not defined. The follow-up time varied between 5 and 28 months.
Due the limited number of patients, a meta-analysis of the results was not performed.
Analyzed Variables Nasal Polyps Endoscopic Score
All of the included articles evaluated the nasal polyps endoscopic score variation, both in pre and post omalizumab treatment. However, the staging system used was not the same in all studies (see table 1).
In three articles(33,34,36) there was a statistically significant reduction between the pre and post omalizumab treatment endoscopic scores. However, only Gevaert, et al(33) showed statistical significance when patients treated with omalizumab were compared with the ones of the placebo group.
The study of Pinto, et al(35) concluded that no significant differences exist in none of the studied groups, although these results are not clearly reported.
Staging by Computerized Tomography
Two(33,34) of the three articles that evaluated CT changes(33,34,35) used the Lund-Mackay score to measure sinus inflammation treatment changes. In the remaining article, a quantitative system was used to evaluate CT sinuses opacification level, before and after treatment(35).
In all studies there was a CT evaluation score reduction when the pre and post-treatment values of the treated groups were compared, but Penn, et al(34) did not report statistically relevant differences. Gevaert, et al(33) reported a significant reduction of the Lund-Mackay score when comparing both groups (omalizumab vs. placebo) at the 16 weeks of omalizumab treatment (p=0,04).
Quality of Life Evaluation Tools
Quality of life evaluation tools were used only in the RCT. The used tool for general evaluation was the same in both papers (Short-form Health Questionnaire - SF-36). However, the specific CRS evaluation questionnaires were different in the two articles. Gevaert, et al(33) used the Rhinosinusitis Outcome Measuring Instrument (RSOM-31), but Pinto, et al(35) used the Sinonasal Outcome Test (SNOT-20).
2nd Annual International Interdisciplinary Conference, AIIC 2014, 8-12 July, Azores, Portugal Proceedings, Vol.3
476
General evaluation showed antagonistic results. On one hand, Pinto, et al(35) report none significant score reduction of any survey’s dominions. On the other hand, Gevaert, et al(33) showed a significant score reduction before and after the omalizumab intervention on the treated group, but none on the placebo one.
In terms of the specific CRS evaluation surveys (RSOM-31 and SNOT-20), both studies reported statistically significant reductions in pre and post-treatment survey scores for the treated groups without any change in placebo ones.
Other Analyzed Variables
Pinto, et al(35) also evaluated the eosinophilic levels present in the nasal lavage, the peak inspiratory nasal flux, olfactometry and the necessity of adjuvant therapies during treatment. None of the analyzed variables displayed significant differences, even though there was a tendency for the intake of fewer antibiotic cycles, in treated patients.
Penn, et al(34) evaluated the total IgE serum levels: the average levels of total serum IgE were superior after the treatment cycle. This phenomenon is explained by the fact that the IgE-omalizumab complexes are excreted slower than free serum IgE(37).
Vennera, et al(36), studied the need of intranasal corticoid use before and after omalizumab treatment. They showed a significant reduction in the corticoids’ needs after the therapeutic cycle with omalizumab (95% vs. 42%, p=0,002).
Discussion
Even though the pathophysiology CRSwNP remains, at least partially, obscure, there is now evidence that eosinophils and IgE play a definitive role. Such evidence suggests a pathophysiological mechanism similar to bronchial asthma. This observation is enforced by the important epidemiological association between these two nosological entities. Besides the significant effect it has in patients’ quality of life and the social economic impact (38), there are some phenotypes of both diseases that are difficult to control using standard therapies.
In treatment of moderate-to-severe allergic asthma, omalizumab has a well-established role. However, its role in CRSwNP treatment is yet to be defined.
Evaluation of the variables analyzed in the studies included showed that nasal polyps endoscopic score results were not unanimous. Even though three of the articles showed significant improvements when comparing the pre and post treatment endoscopic scores, there was one(35) that did not mention any specific benefit. However, the study with the largest number of patients included(33), showed significant improvements, not only when comparing the omalizumab group pre and post treatment results, but also when results between the omalizumab and placebo groups were compared. If to these results we add the evidence from the other two studies(34,36), it can be concluded that the omalizumab treatment has a positive role in nasal polyps’ volume reduction. This observation is nevertheless limited by diverse staging criteria used in the different studies.
Another analyzed variable in this revision was the CRS with polyps’ CT staging (sinus inflammation marker). Omalizumab’s treated groups showed improvement in all studies(33,34,35), even though Penn, et al(34) did not achieve statistical significance. This suggests that omalizumab is effective, at least short-term, in sinonasal inflammation. Once again, these conclusions are partially limited by the fact that different staging protocols were used.
The analysis of studies where QoL evaluation tools were used(33,35) seemed to show some benefit from treatment with omalizumab, mainly in the specific CRS with polyps’ symptoms analysis.
One of the main limitations of both RCT is a reduced follow-up time (5 and 6 months). Given that CRS with polyps has a late relapse potential, this fact limits the
2nd Annual International Interdisciplinary Conference, AIIC 2014, 8-12 July, Azores, Portugal Proceedings, Vol.3
477
conclusions on omalizumab’s long-term effectiveness in the treatment of CRS with polyps. Another constrain refers to Gevaert, et al(33) study where patients did not continue usual chronic medical treatment. This limits, at least partially, the capacity to prove the superiority of omalizumab.
An issue that has been raising some concerns about omalizumab is its safety. Apart from flu (which is relatively frequent), there are two potential major side effects: anaphylaxis and malignant neoplasms. Post omalizumab treatment anaphylaxis is a rare, but potentially fatal side effect(39). However, it is recommended that patients remain monitored for hours after the treatment and this has significantly reduced occurrences outside of hospital environment(39). On the subject of neoplastic risk, a meta-analysis(40) did not find any association between omalizumab treatment and an augmented malignant neoplastic risk, suggesting that this link is highly unlikely.
There are already, to the extent of our knowledge, two classic revisions(41,42) on the theme discussed above. Yet, none of them actually thoroughly analyzes all of the articles included here or used this type of methodology. Conclusion
At the moment, evidence on omalizumab’s effectiveness in CRSwNP treatment is low. However, the available literature indicates that it could be an effective therapeutic alternative. In particularly aggressive forms of the disease, where one expects early relapses, either after medical or surgical treatment, omalizumab may be a valid therapeutical alternative. This is true especially for patients with concomitant asthma.
More RCT’s with bigger sample sizes, extended follow-up time and study design that allows enrolled patients to maintain chronic medical therapy are needed to unequivocally validate omalizumab’s proper role in CRSwNP treatment. Acknowledgments: Professor Catarina Pereira
References: Fokkens WJ, Lund V, Mullol J, et al. European Position Paper on Rhinosinusitis and Nasal Polyps group EP3OS 2012: European position paper on rhinosinusitis and nasal polyps 2012. Rhinology 2012; supplement 23:1-298. Norlander T, Westrin KM, Fukami M, Stierna P, Carlsöö B. Experimentally induced polyps in the sinus mucosa: A structural analysis in the initial stages. Laryngoscope 1996; 106:196-203. Bachert C, Gevaert P, Holtappels G, Johansson SG, van Cauwenberge P; Total and specific IgE in nasal polyps is related to local eosinophilic inflammation. J Allergy Clin Immunol 2001; 107:607-14. Lamblin C, Gosset P, Salez F, et al. Eosinophilic airway inflammation in nasal polyposis. J Allergy Clin Immunol 1999; 104:85-92. Bachert C, Zhang N, Holtappels G, et al. Presence of IL-5 protein and IgE antibodies to staphylococcal enterotoxins in nasal polyps is associated with comorbid asthma. J Allergy Clin Immunol 2010; 126:962-8, e1-6. Djukanovíc R, Wilson SJ, et al. Effects of treatment with anti-immunoglobulin E antibody omalizumab on airway inflammation in allergic asthma. Am J Respir Crit Care Med 2004; 170: 583-93. Prenner BM. Asthma 2008: Targeting immunoglobulin E to achieve disease control. J Asthma 2008; 45: 429-36.
2nd Annual International Interdisciplinary Conference, AIIC 2014, 8-12 July, Azores, Portugal Proceedings, Vol.3
478
Guglielmo M, Gulotta C, Mancini F, Sacchi M, Tarantini F. Recalcitrant Nasal Polyposis: Achievement of Total Remission Following Treatment With Omalizumab. J Investig Allergol Clin Immunol 2009; Vol. 19(2): 158-166. Grundmann SA, Hemfort PB, Luger TA, Brehler R. Anti-IgE (omalizumab): A new therapeutic approach for chronic rhinosinusitis. J Allergy Clin Immunol 2008 Jan; 121(1):257-8. Bardelas J, Figliomeni M, Kianifard F, Meng X. A 26-week, randomized, double-blind, placebo-controlled, multicenter study to evaluate the effect of omalizumab on asthma control in patients with persistent allergic asthma. J Asthma 2012 Mar; 49(2):144-52. Buhl, R, Hanf G, Solèr M, et al. The anti-IgE antibody omalizumab improves asthma-related quality of life in patients with allergic asthma. Eur Respir J. 2002 Nov; 20(5): 1088-94. Busse W, Corren J, Lanier BQ, et al. Omalizumab, anti-IgE recombinant humanized monoclonal antibody, for the treatment of severe allergic asthma. J Allergy Clin Immunol. 2001; 108: 184–190. Costello RW, Long DA, Gaine S, Mc Donnell T, Gilmartin JJ, Lane SJ. Therapy with omalizumab for patients with severe allergic asthma improves asthma control and reduces overall healthcare costs. Ir J Med Sci. 2011 Sep;180(3): 637-41. Domingo C, Moreno A, José Amengual M, Montón C, Suárez D, Pomares X. Omalizumab in the management of oral corticosteroid-dependent IGE-mediated asthma patients; Curr Med Res Opin. 2011 Jan; 27(1): 45-53. Finn A, Gross G, van Bavel J, et al. Omalizumab improves asthma-related quality of life in patients with severe allergic asthma. J Allergy Clin Immunol. 2003 Feb; 111(2): 278-84. Frew AJ; Effects of anti-IgE in asthmatic subjects; 1998 Thorax S52-57. Holgate ST, Chuchalin AG, Hébert J, et al. Efficacy and safety of a recombinant anti-immunoglobulin E antibody (omalizumab) in severe allergic asthma. Clin Exp Allergy. 2004 Apr; 34(4): 632-8. Korn S, Schumann C, Kropf C, et al. Effectiveness of omalizumab in patients 50 years and older with severe persistent allergic asthma. Ann Allergy Asthma Immunol. 2010 Oct; 105(4): 313-9. Lanier BQ, Corren J, Lumry W, Liu J, Fowler-Taylor A, Gupta N. Omalizumab is effective in the long-term control of severe allergic asthma. Ann Allergy Asthma Immunol. 2003 Aug; 91(2): 154-9. Milgrom H, Fick RB Jr, Su JQ, et al. Treatment of allergic asthma with monoclonal anti-IgE antibody. N Engl J Med. 1999 Dec; 341(26): 1966-73. Molimard M, de Blay F, Didier A, Le Gros V. Effectiveness of omalizumab (Xolair®) in the first patients treated in real-life practice in France. Respir Med. 2008 Jan; 102(1): 71-6. Nopp A, Johansson SG, Adédoyin J, Ankerst J, Palmqvist M, Oman H. After 6 years with Xolair: a 3-year withdrawal follow-up. Allergy. 2010 Jan;65(1):56-60. Ohta K, Yamamoto M, Sato N, Ikeda K, Miyamoto T. One year treatment with omalizumab is effective and well tolerated in Japanese Patients with moderate-to-severe persistent asthma. Allergol Int. 2010 Jun;59(2):167-74. Pace E, Ferraro M, Bruno A, Chiappara G, Bousquet J, Gjomarkaj M. Clinical benefits of 7 years of treatment with omalizumab in severe uncontrolled asthmatics. J Asthma. 2011 May;48(4):387-92. Pacheco-Galván A, Hinojosa-Macías M, Hurtado-Barbudo B, González-Cervera J, Sueiro-Bendito A. Analysis of asthma control and quality of life in severe allergic asthmatics under treatment with anti-IgE, omalizumab. Med Clin (Barc). 2009 Oct 3;133(12):460-3. Rottem M; Omalizumab reduces corticosteroid use in patients with severe allergic asthma: Real-life experience in Israel. J Asthma. 2012 Feb;49(1):78-82.

2nd Annual International Interdisciplinary Conference, AIIC 2014, 8-12 July, Azores, Portugal Proceedings, Vol.3
479
Salvi SS, Holgate ST; Anti-IgE antibody for the treatment of allergic asthma. Curr Allergy Asthma Rep. 2001 Mar;1(2):100-1. Solèr M, Matz J, Townley R, et al. The anti-IgE antibody omalizumab reduces exacerbations and steroid requirement in allergic asthmatics. Eur Respir J. 2001 Aug;18(2):254-61. Storms W, Bowdish MS, Farrar JR. Omalizumab and asthma control in patients with moderate-to-severe allergic asthma: a 6-year pragmatic data review. Allergy Asthma Proc. 2012 Mar-Apr; 33(2): 172-7. Tzortzaki EG, Georgiou A, Kampas D, et al. Long-term omalizumab treatment in severe allergic asthma: the South-Eastern Mediterranean "real-life" experience. Pulm Pharmacol Ther. 2012 Feb; 25(1): 77-82. Vennera Mdel C, Pérez De Llano L, Bardagí S, et al; Omalizumab therapy in severe asthma: Experience from the Spanish registry - Some new approaches. J Asthma. 2012 May;49(4):416-22. Ota Y, Yamada C, Takizawa K, Rikitake R. Four cases of eosinophilic sinusitis treated by omalizumab. Practica oto-rhino-laryngologica 2012; 105(11): 1101-1106. Gevaert P, Calus L, Van Zele T, et al; Omalizumab is effective in allergic and nonallergic patients with nasal polyps and asthma. J Allergy Clin Immunol. 2013 Jan;131(1):110-6.e1. Penn R; Mikula S; The role of anti-IgE immunoglobulin therapy in nasal polyposis: a pilot study. Am J Rhinol. 2007 Jul-Aug;21(4):428-32. Pinto JM, Mehta N, DiTineo M, Wang J, Baroody FM, Naclerio RM. A randomized, double-blind, placebo-controlled trial of anti-IgE for chronic rhinosinusitis. Rhinology. 2010 Sep;48(3):318-24. Vennera Mdel C, Picado C, Mullol J, Alobid I, Bernal-Sprekelsen M. Efficacy of omalizumab in the treatment of nasal polyps. Thorax. 2011 Sep;66(9):824-5. Poole J, Matangkasombut P, Rosenwasser L; Targeting the IgE molecule in allergic and asthmatic diseases: Review of the IgE molecule and clinical efficacy; J Allergy Clin Immuno 2005; 115: S376–S385. Gliklich RE, Metson R; Economic implications of chronic sinusitis. Otolaryngol Head Neck Surg 1998; 118:344-9. Kim H, Leigh R, Becker A. Omalizumab: Practical considerations regarding the risk of anaphylaxis. Allergy, Asthma & Clinical Immunology 2010; 6:32. Busse W, Buhl R, Vidaurre CF, et al; Omalizumab and the risk of malignancy: Results from a pooled analysis; J Allergy Clin Immunol. 2012 Apr; 129(4): 983-9.e6. Alobid I, Mullol J; Role of Medical Therapy in the Management of Nasal Polyps; Curr Allergy Asthma Rep 2012; 12: 144–153. Ben-Shoshan M; Omalizumab for Asthma: Indications, Off-Label Uses and Future Directions; Recent Patents on Inflammation & Allergy Drug Discovery 2010; 4, 183-192.


