Embed Size (px)
Citation preview
3
An Overview of Analytical Techniques Employed to Evidence Drug-DNA Interactions.
Applications to the Design of Genosensors
Víctor González-Ruiz1, Ana I. Olives1, M. Antonia Martín1
Pascual Ribelles2, M. Teresa Ramos2 and J. Carlos Menéndez2 1S. D. Química Analítica,
2D. Química Orgánica y Farmacéutica, Facultad de Farmacia, Universidad Complutense, 28040-Madrid,
Spain
1. Introduction
The demonstration of the existence of non-covalent bonding interactions between different
biomolecules (DNA, enzymes, proteins) and drugs or potentially mutagenic agents requires
sensitive analytical techniques. Technological advances in key techniques, together with the
miniaturization in fluorescence or surface plasmons resonance techniques, have allowed
obtaining information in real time concerning the nature, the localization and the strength of
drug-DNA interactions. The present chapter describes these analytical techniques and their
application to achieve two fundamental goals, namely a deeper knowledge of the nature of
the interactions and their application to the design of different devices (aptamers, molecular
beacons, DNA-arrays, genosensors) consisting of short single stranded oligonucleotides
produced in vitro by well-established methods (polymerase chain reaction, PCR; systematic
evolution of ligands by exponential enrichment, SELEX,...) that are capable to detect genetic
peculiarities and diseases, biological entities (micro-organisms, genetically modified seeds...)
and also genotoxic agents in the environment and in foodstuffs.
2. Chemical structure of DNA
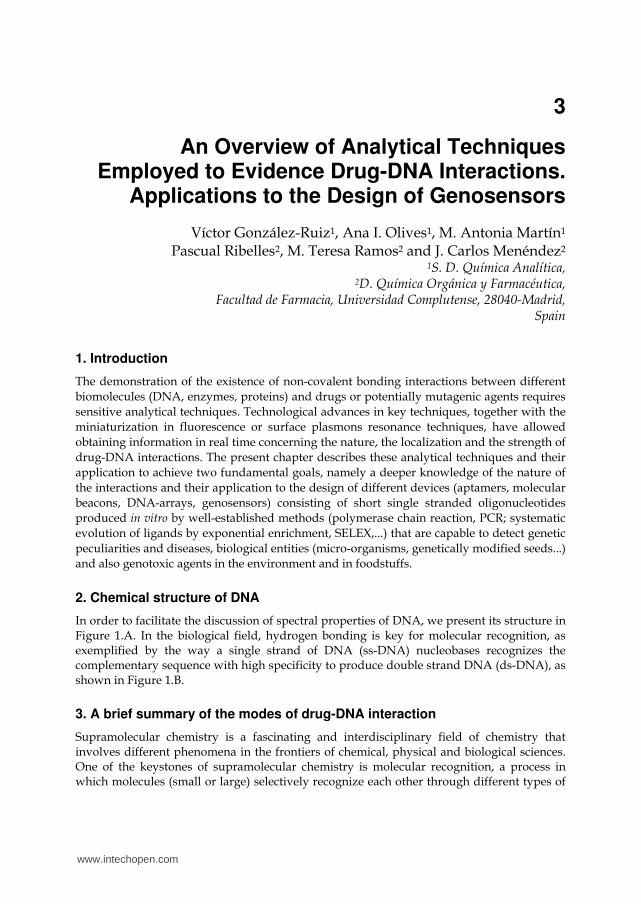
In order to facilitate the discussion of spectral properties of DNA, we present its structure in Figure 1.A. In the biological field, hydrogen bonding is key for molecular recognition, as exemplified by the way a single strand of DNA (ss-DNA) nucleobases recognizes the complementary sequence with high specificity to produce double strand DNA (ds-DNA), as shown in Figure 1.B.
3. A brief summary of the modes of drug-DNA interaction
Supramolecular chemistry is a fascinating and interdisciplinary field of chemistry that involves different phenomena in the frontiers of chemical, physical and biological sciences. One of the keystones of supramolecular chemistry is molecular recognition, a process in which molecules (small or large) selectively recognize each other through different types of
www.intechopen.com
Biomedical Engineering, Trends, Research and Technologies
66
Fig. 1. A. Structure of a DNA single strand. B. Watson-Crick pairing between purine and pyrimidine bases in complementary DNA strands.
molecular interactions, i.e., electrostatic, dipole-dipole, hydrogen bonding, π-π and van der Waals interactions, whose strength determines the stability of the resulting supramolecular complexes (Table 1). The main chemical driving forces for both the stability of ds-DNA and
DNA-drug recognition are hydrogen bonding interactions, electrostatic and π-π interactions between the aromatic rings of base pairs.
Type of Interaction Strength Distance at which it is effective
Electrostatic +++++ +++
Hydrogen bonding +++++ +++++
π -π stacking ++++ +++
Ion-dipole ++++ ++
Dipole-dipole +++ ++
Dipole-induced dipole ++ +
Van der Waals + +
Table 1. Types and main characteristics of non-covalent molecular interactions.
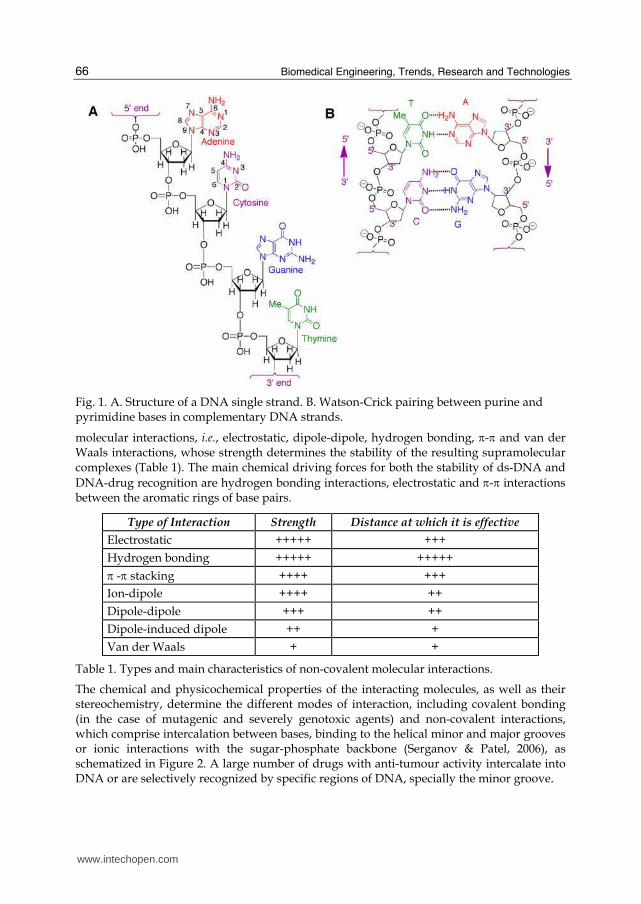
The chemical and physicochemical properties of the interacting molecules, as well as their stereochemistry, determine the different modes of interaction, including covalent bonding (in the case of mutagenic and severely genotoxic agents) and non-covalent interactions, which comprise intercalation between bases, binding to the helical minor and major grooves or ionic interactions with the sugar-phosphate backbone (Serganov & Patel, 2006), as schematized in Figure 2. A large number of drugs with anti-tumour activity intercalate into DNA or are selectively recognized by specific regions of DNA, specially the minor groove.
www.intechopen.com
An Overview of Analytical Techniques Employed to Evidence Drug-DNA Interactions. Applications to the Design of Genosensors
67
Fig. 2. Modes of non-covalent interaction of small molecules with DNA.
4. Analytical techniques to evidence drug-DNA interactions
The number and variety of techniques devoted to evidence drug-DNA interactions is continuously growing. From the classical UV-vis spectrophotometry or competition dialysis assay to the renewed gel mobility electrophoresis assay or the powerful tandem HPLC-MS or capillary electrophoresis-mass spectrometry, the number of new specific assays and methodologies is overwhelming (Tian et al., 2005). We will describe below some of the most useful techniques, with the exception of separation methods such as chromatography and conventional or capillary electrophoresis, which would require a whole chapter; for further information on this subject, see (Baba, 1999; Krylova et al., 2010; Kral et al., 2010; Koster et al., 2008; Araya et al., 2007; Su et al., 2007a; Su et al., 2007b).
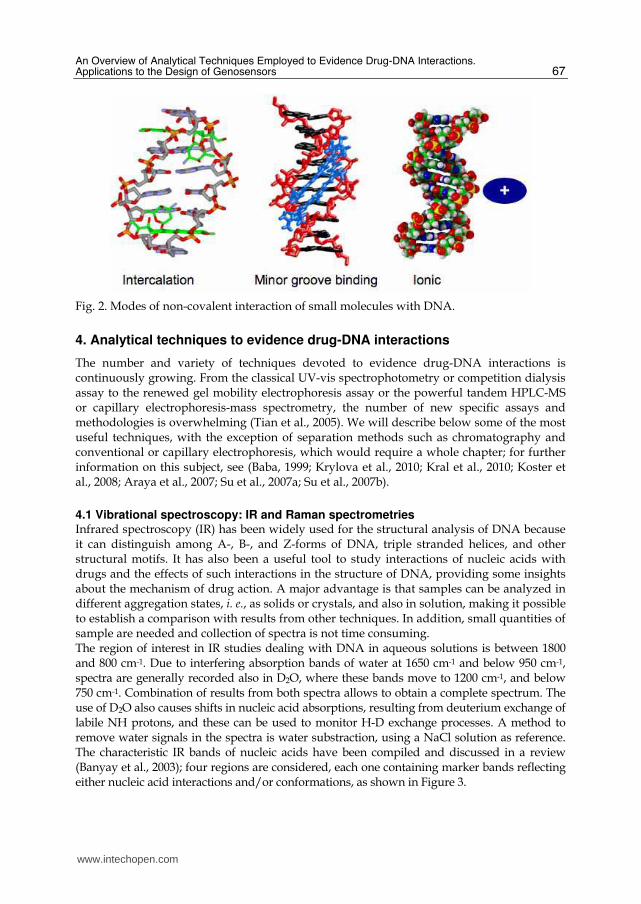
4.1 Vibrational spectroscopy: IR and Raman spectrometries Infrared spectroscopy (IR) has been widely used for the structural analysis of DNA because it can distinguish among A-, B-, and Z-forms of DNA, triple stranded helices, and other structural motifs. It has also been a useful tool to study interactions of nucleic acids with drugs and the effects of such interactions in the structure of DNA, providing some insights about the mechanism of drug action. A major advantage is that samples can be analyzed in different aggregation states, i. e., as solids or crystals, and also in solution, making it possible to establish a comparison with results from other techniques. In addition, small quantities of sample are needed and collection of spectra is not time consuming. The region of interest in IR studies dealing with DNA in aqueous solutions is between 1800 and 800 cm-1. Due to interfering absorption bands of water at 1650 cm-1 and below 950 cm-1, spectra are generally recorded also in D2O, where these bands move to 1200 cm-1, and below 750 cm-1. Combination of results from both spectra allows to obtain a complete spectrum. The use of D2O also causes shifts in nucleic acid absorptions, resulting from deuterium exchange of labile NH protons, and these can be used to monitor H-D exchange processes. A method to remove water signals in the spectra is water substraction, using a NaCl solution as reference. The characteristic IR bands of nucleic acids have been compiled and discussed in a review (Banyay et al., 2003); four regions are considered, each one containing marker bands reflecting either nucleic acid interactions and/or conformations, as shown in Figure 3.
www.intechopen.com
Biomedical Engineering, Trends, Research and Technologies
68
Fig. 3. Approximate position of IR bands of DNA and aqueous solvents. a) 1800-1500 cm-1 region, sensitive to effects of base pairing and base stacking. b) 1500-1250 cm-1 region, sensitive to glycosidic bond rotation, backbone conformation and sugar pucker. c) 1250-1000 cm-1 region, sensitive to backbone conformation. d) 1000-800 cm-1 region, sensitive to sugar conformation.
Fourier transform IR (FTIR) has been used alone or supporting other techniques to determine drug binding sites and sequence preference, as well as conformational changes due to drug-DNA interaction (Jangir et al., 2010; Mandeville et al., 2010; Neault & Tajmir-Riahi, 1996). Additional evidence for drug-DNA interaction can be obtained from observed changes (shift or intensity) in the bands of drug spectra upon DNA binding, and even groups involved in the complexation can be inferred. Raman spectroscopy also depends on the vibrational frequencies of characteristic groups and has been used sometimes in conjunction with infrared spectra to study DNA-drug interactions since it provides complementary information. An advantage of Raman is that water makes an ideal solvent (weak scattering properties and only one broad weak band around 3600 cm-1).
4.2 NMR spectroscopy Nuclear Magnetic Resonance (NMR) is based on the fact that atomic nuclei endowed with a property called nuclear spin will align with an applied magnetic field. The degree of this alignment depends not only on the strength of the magnetic field, but also on the type of nucleus and its chemical environment. Every nucleus with spin gives rise to a signal or peak which represents a transition between a ground and an excited state. Each magnetically active nucleus is characterized by different parameters such as chemical shift (the position or frequency of the spectral line), multiplicity (the fine structure observed on the spectral lines), J-couplings (the separations within a multiplet), relaxation data and Nuclear Overhauser Effect (NOE) connectivities that can be used to obtain detailed structural information about the molecule under study. Among the atomic nuclei available for the study of DNA (1H, 13C, 15N and 31P), 1H is the most common, but 31P NMR is especially useful for studying the effects of ligand binding on the phosphate groups of DNA. NMR experiments are very versatile and the information can be obtained at different temperatures, solvents, pH values, ionic strengths and dielectric constants. The typical chemical shift for 1H NMR spectra of nucleic acids at room temperature has previously been reported (Barber et al., 1993), and Table 2 summarizes the most representative values.
www.intechopen.com
An Overview of Analytical Techniques Employed to Evidence Drug-DNA Interactions. Applications to the Design of Genosensors
69
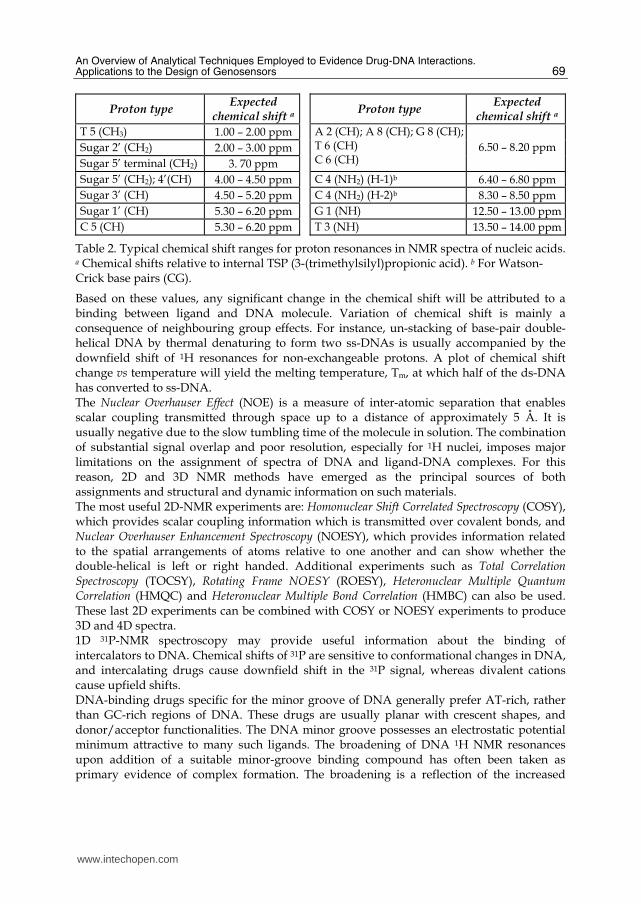
Proton type Expected
chemical shift aProton type
Expected chemical shift a
T 5 (CH3) 1.00 – 2.00 ppm Sugar 2’ (CH2) 2.00 – 3.00 ppm Sugar 5’ terminal (CH2) 3. 70 ppm
A 2 (CH); A 8 (CH); G 8 (CH);T 6 (CH) C 6 (CH)
6.50 – 8.20 ppm
Sugar 5’ (CH2); 4’(CH) 4.00 – 4.50 ppm C 4 (NH2) (H-1)b 6.40 – 6.80 ppm Sugar 3’ (CH) 4.50 – 5.20 ppm C 4 (NH2) (H-2)b 8.30 – 8.50 ppm Sugar 1’ (CH) 5.30 – 6.20 ppm G 1 (NH) 12.50 – 13.00 ppm C 5 (CH) 5.30 – 6.20 ppm T 3 (NH) 13.50 – 14.00 ppm
Table 2. Typical chemical shift ranges for proton resonances in NMR spectra of nucleic acids. a Chemical shifts relative to internal TSP (3-(trimethylsilyl)propionic acid). b For Watson-Crick base pairs (CG).
Based on these values, any significant change in the chemical shift will be attributed to a binding between ligand and DNA molecule. Variation of chemical shift is mainly a consequence of neighbouring group effects. For instance, un-stacking of base-pair double-helical DNA by thermal denaturing to form two ss-DNAs is usually accompanied by the downfield shift of 1H resonances for non-exchangeable protons. A plot of chemical shift change vs temperature will yield the melting temperature, Tm, at which half of the ds-DNA has converted to ss-DNA. The Nuclear Overhauser Effect (NOE) is a measure of inter-atomic separation that enables scalar coupling transmitted through space up to a distance of approximately 5 Å. It is usually negative due to the slow tumbling time of the molecule in solution. The combination of substantial signal overlap and poor resolution, especially for 1H nuclei, imposes major limitations on the assignment of spectra of DNA and ligand-DNA complexes. For this reason, 2D and 3D NMR methods have emerged as the principal sources of both assignments and structural and dynamic information on such materials. The most useful 2D-NMR experiments are: Homonuclear Shift Correlated Spectroscopy (COSY), which provides scalar coupling information which is transmitted over covalent bonds, and Nuclear Overhauser Enhancement Spectroscopy (NOESY), which provides information related to the spatial arrangements of atoms relative to one another and can show whether the double-helical is left or right handed. Additional experiments such as Total Correlation Spectroscopy (TOCSY), Rotating Frame NOESY (ROESY), Heteronuclear Multiple Quantum Correlation (HMQC) and Heteronuclear Multiple Bond Correlation (HMBC) can also be used. These last 2D experiments can be combined with COSY or NOESY experiments to produce 3D and 4D spectra. 1D 31P-NMR spectroscopy may provide useful information about the binding of intercalators to DNA. Chemical shifts of 31P are sensitive to conformational changes in DNA, and intercalating drugs cause downfield shift in the 31P signal, whereas divalent cations cause upfield shifts. DNA-binding drugs specific for the minor groove of DNA generally prefer AT-rich, rather than GC-rich regions of DNA. These drugs are usually planar with crescent shapes, and donor/acceptor functionalities. The DNA minor groove possesses an electrostatic potential minimum attractive to many such ligands. The broadening of DNA 1H NMR resonances upon addition of a suitable minor-groove binding compound has often been taken as primary evidence of complex formation. The broadening is a reflection of the increased
www.intechopen.com
Biomedical Engineering, Trends, Research and Technologies
70
rotational correlation time of the DNA with a ligand tightly bound to it. The 1H spectrum of a drug-DNA complex is dependent on its rate of dissociation; free ligands and ligand-bound oligonucleotides have clearly resolved signals when the ligand to oligonucleotide molar ratio is <1:1. Most of the contacts are between imino and adenine C-2 hydrogens and drug aromatic/NH hydrogens. Many anti-tumour drugs bind to the major groove, and they usually do it covalently through N-7 of guanine but their modes of interaction have been studied with techniques different from NMR.
4.3 UV-VIS absorption spectroscopy The drug-DNA interaction can be detected by UV-Vis absorption spectroscopy by measuring the changes in the absorption properties of the drug or the DNA molecules. The UV-Vis absorption spectrum of DNA exhibits a broad band (200-350 nm) in the UV region with a maximum placed at 260 nm. This maximum is a consequence of the chromophoric groups in purine and pyrimidine moieties responsible for the electronic transitions. The probability of these transitions is high and thus the molar absorptivity (ε) is of order of 104 M-1cm-1. The use of this versatile and simple technique allows estimating the molar concentration of DNA on the basis of the measurement of the absorbance value at 260 nm. In practice, the molar concentration of DNA is evaluated in terms of the concentration of pairs of bases. The absorbance ratios (A260/A280 and A260/A230) can also characterize the DNA molecules (Paul et al., 2010). Slight changes in the absorption maximum as well as the molar absorptivity can be appreciated with the variations in pH or ionic strength of the media. The ε values (λmax= 260 nm) of free oligonucleotides are higher than the ones corresponding to the same oligonucleotides in single strand DNA (ss-DNA) and double strand DNA (ds-DNA) because base-base stacking results in a hypochromic effect. This behaviour can be exploited to verify denaturalization of DNA by measuring its absorbance values before and after denaturing treatment. The hypochromic effect can also be employed to verify the existence of drug-DNA interactions, due to the fact that the monitoring of the absorbance values allows studying the melting behaviour of DNA. Melting temperature (Tm) is the temperature value corresponding to the conversion of 50 % of the double strands into single strands, according to the equilibrium shown in Equation (1).
ds DNA ss DNA− −q (1)
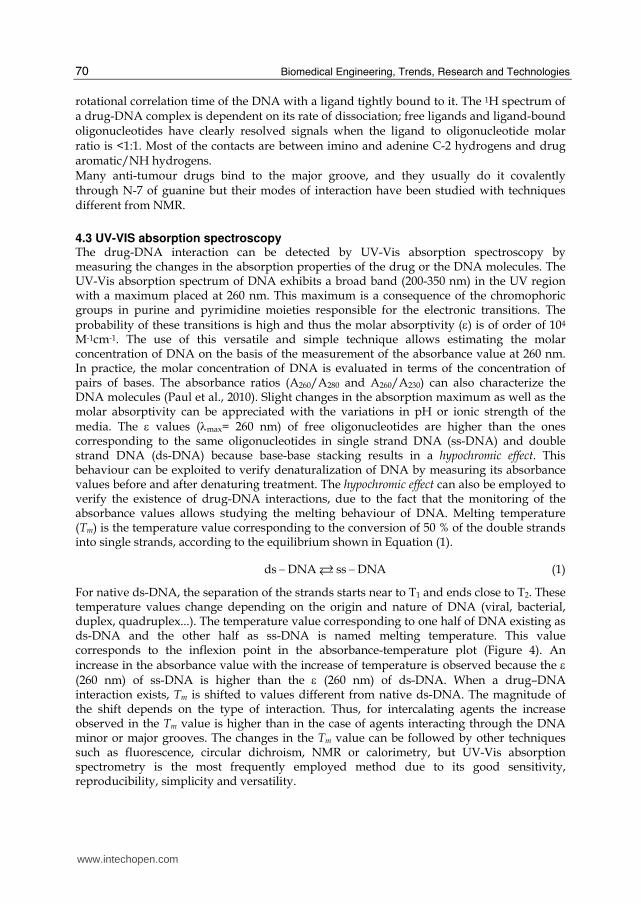
For native ds-DNA, the separation of the strands starts near to T1 and ends close to T2. These temperature values change depending on the origin and nature of DNA (viral, bacterial, duplex, quadruplex...). The temperature value corresponding to one half of DNA existing as ds-DNA and the other half as ss-DNA is named melting temperature. This value corresponds to the inflexion point in the absorbance-temperature plot (Figure 4). An increase in the absorbance value with the increase of temperature is observed because the ε (260 nm) of ss-DNA is higher than the ε (260 nm) of ds-DNA. When a drug–DNA interaction exists, Tm is shifted to values different from native ds-DNA. The magnitude of the shift depends on the type of interaction. Thus, for intercalating agents the increase observed in the Tm value is higher than in the case of agents interacting through the DNA minor or major grooves. The changes in the Tm value can be followed by other techniques such as fluorescence, circular dichroism, NMR or calorimetry, but UV-Vis absorption spectrometry is the most frequently employed method due to its good sensitivity, reproducibility, simplicity and versatility.
www.intechopen.com
An Overview of Analytical Techniques Employed to Evidence Drug-DNA Interactions. Applications to the Design of Genosensors
71
Fig. 4. Absorbance thermal melting profiles of native DNA (”) and the DNA-drug complex (y). A260: normalized absorbance values at 260 nm, T: temperature (Celsius).
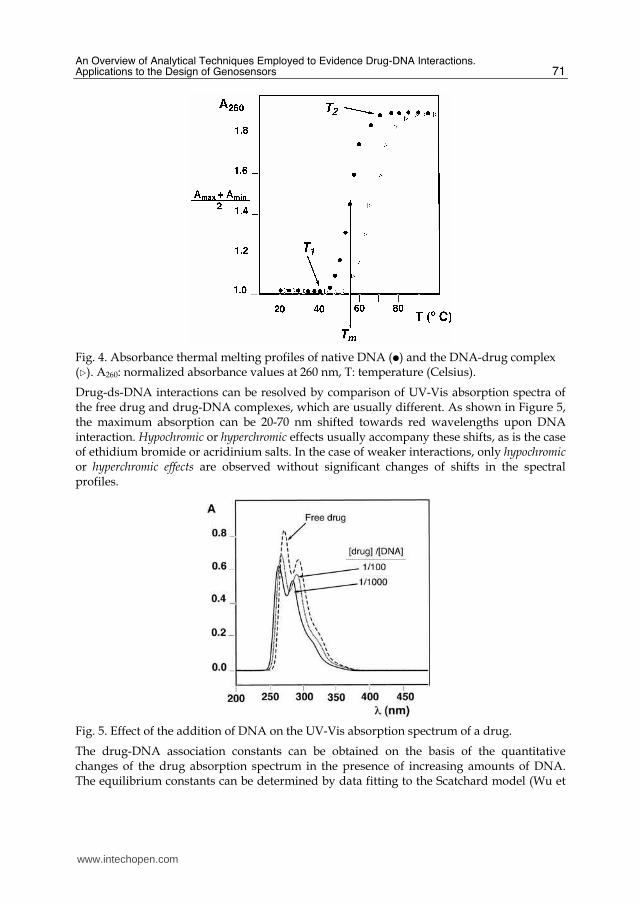
Drug-ds-DNA interactions can be resolved by comparison of UV-Vis absorption spectra of the free drug and drug-DNA complexes, which are usually different. As shown in Figure 5, the maximum absorption can be 20-70 nm shifted towards red wavelengths upon DNA interaction. Hypochromic or hyperchromic effects usually accompany these shifts, as is the case of ethidium bromide or acridinium salts. In the case of weaker interactions, only hypochromic or hyperchromic effects are observed without significant changes of shifts in the spectral profiles.
Fig. 5. Effect of the addition of DNA on the UV-Vis absorption spectrum of a drug.
The drug-DNA association constants can be obtained on the basis of the quantitative changes of the drug absorption spectrum in the presence of increasing amounts of DNA. The equilibrium constants can be determined by data fitting to the Scatchard model (Wu et
www.intechopen.com
Biomedical Engineering, Trends, Research and Technologies
72
al., 2009). Sometimes Scatchard plots reveal a non-cooperative binding and thus the use of McGhee-von Hippel treatment results more convenient (Islam et al., 2009).
4.4 Circular and linear dichroism Circular and linear dichroism spectroscopies are useful techniques to probe non-covalent drug-DNA interactions, which affect the electronic structure of the molecules and also alter their electronic spectroscopic behaviour. Polarized light spectroscopy allows to quickly characterize drug-DNA complexes using a small amount of sample. Linear dichroism (LD) provides structural information in terms of the relative orientation between the bound drug molecule and the DNA molecular long axis, and also about the effects of ligand binding on the host. Circular dichroism (CD) provides additional structural details of the complex. When electromagnetic radiation reaches DNA, the macromolecules present a certain degree of alineation in the direction of the electric field vector, and this molecular alignment is measured by the light polarised absorbance. When a drug binds to DNA, its spectrum will be modified if this binding causes changes in DNA conformation. Circular dichroism is defined as the difference in absorption of left and right circularly polarised light (Equation 2, where εl and εr are the molar absorptivities for the absorption of left and right circularly polarized light for the selected wavelength).
= −l rCD ε ε (2)
When a drug binds to DNA, an induced CD (ICD) spectrum is observed because of the interaction with DNA. This may result from either a geometric change in the drug or from coupling between its electronic transitions and those of the DNA. Similarly, DNA gets an ICD contribution to its CD spectrum from its interaction with the drug. Therefore, what is finally observed is a combination of DNA CD, DNA ICD, drug CD (which is zero for an non-chiral drug and nonzero for a chiral drug), and drug ICD. If an ICD signal is observed in the absorption band of a non-chiral ligand, this is evidence for interaction with DNA. In contrast to CD, which depends on both electric and magnetic interactions, LD only depends on the electric field vector. LD spectroscopy involves measuring the difference in absorption of two linear polarizations of light, which usually are parallel and perpendicular to a sample orientation direction. Small molecules that tumble freely in solution are not oriented and in contrast to DNA-bound molecules do not give any LD signal in their absorption region, so the presence of a detectable LD proves that the ligand is bound to the oriented DNA. Light that is polarised parallel to the transition moment has a high probability of absorption in the region of spectral interest, whereas if light is perpendicularly polarized to the transition moment, no absorption takes place. In practice, this means that intercalating agents that stack closely to base pairs have linear dichroism similar to the base pairs themselves. However, the dichroism of groove binders is frequently opposite to that of the base pairs, since they bind along the edge of the base pairs. Thus, LD is a useful spectroscopy for assessing the binding mode of a drug to DNA. In practice, the use of LD in combination with CD, particularly ICD, allows to distinguish among the different types of drug-DNA interactions. The principal modes of binding of small molecules to ds-DNA have been shown in Figure 2. All these interactions belong to the group of reversible interactions (non-covalent) whereas the covalent interactions mean an unbreakable bond formation between the two molecules.
www.intechopen.com
An Overview of Analytical Techniques Employed to Evidence Drug-DNA Interactions. Applications to the Design of Genosensors
73
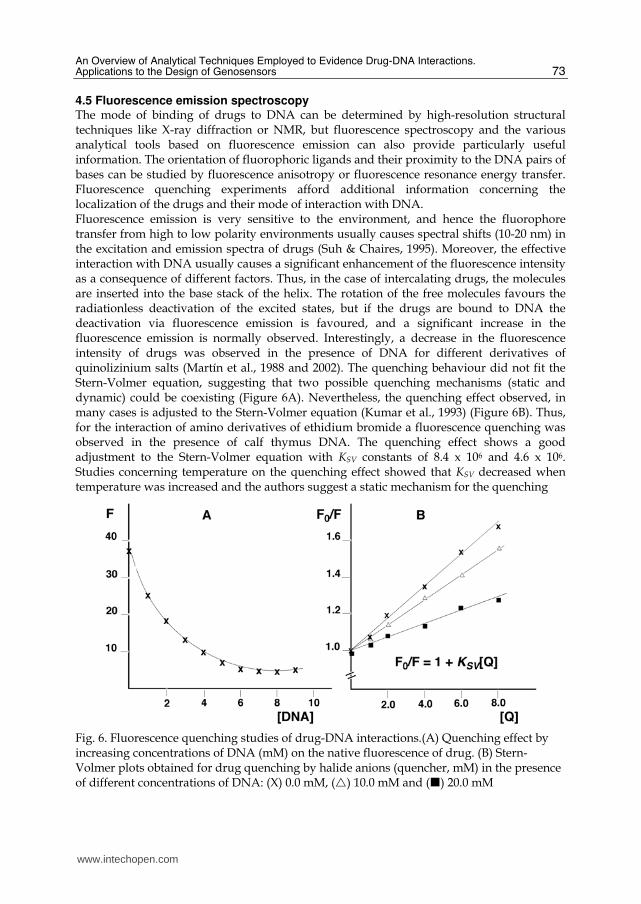
4.5 Fluorescence emission spectroscopy The mode of binding of drugs to DNA can be determined by high-resolution structural techniques like X-ray diffraction or NMR, but fluorescence spectroscopy and the various analytical tools based on fluorescence emission can also provide particularly useful information. The orientation of fluorophoric ligands and their proximity to the DNA pairs of bases can be studied by fluorescence anisotropy or fluorescence resonance energy transfer. Fluorescence quenching experiments afford additional information concerning the localization of the drugs and their mode of interaction with DNA. Fluorescence emission is very sensitive to the environment, and hence the fluorophore transfer from high to low polarity environments usually causes spectral shifts (10-20 nm) in the excitation and emission spectra of drugs (Suh & Chaires, 1995). Moreover, the effective interaction with DNA usually causes a significant enhancement of the fluorescence intensity as a consequence of different factors. Thus, in the case of intercalating drugs, the molecules are inserted into the base stack of the helix. The rotation of the free molecules favours the radiationless deactivation of the excited states, but if the drugs are bound to DNA the deactivation via fluorescence emission is favoured, and a significant increase in the fluorescence emission is normally observed. Interestingly, a decrease in the fluorescence intensity of drugs was observed in the presence of DNA for different derivatives of quinolizinium salts (Martín et al., 1988 and 2002). The quenching behaviour did not fit the Stern-Volmer equation, suggesting that two possible quenching mechanisms (static and dynamic) could be coexisting (Figure 6A). Nevertheless, the quenching effect observed, in many cases is adjusted to the Stern-Volmer equation (Kumar et al., 1993) (Figure 6B). Thus, for the interaction of amino derivatives of ethidium bromide a fluorescence quenching was observed in the presence of calf thymus DNA. The quenching effect shows a good adjustment to the Stern-Volmer equation with KSV constants of 8.4 x 10⁶ and 4.6 x 10⁶. Studies concerning temperature on the quenching effect showed that KSV decreased when temperature was increased and the authors suggest a static mechanism for the quenching
Fig. 6. Fluorescence quenching studies of drug-DNA interactions.(A) Quenching effect by increasing concentrations of DNA (mM) on the native fluorescence of drug. (B) Stern-Volmer plots obtained for drug quenching by halide anions (quencher, mM) in the presence of different concentrations of DNA: (X) 0.0 mM, (t) 10.0 mM and (̈) 20.0 mM
www.intechopen.com
Biomedical Engineering, Trends, Research and Technologies
74
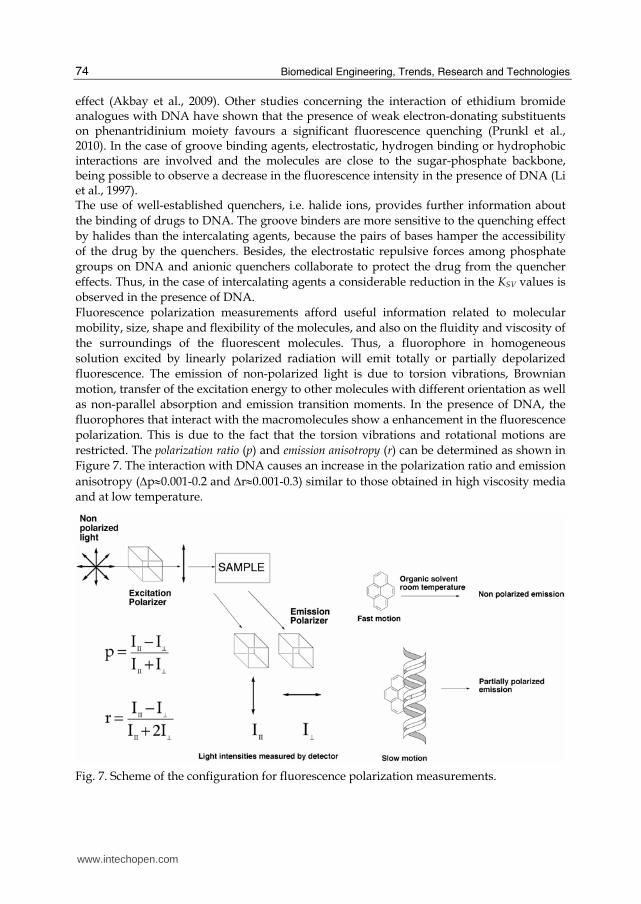
effect (Akbay et al., 2009). Other studies concerning the interaction of ethidium bromide analogues with DNA have shown that the presence of weak electron-donating substituents on phenantridinium moiety favours a significant fluorescence quenching (Prunkl et al., 2010). In the case of groove binding agents, electrostatic, hydrogen binding or hydrophobic interactions are involved and the molecules are close to the sugar-phosphate backbone, being possible to observe a decrease in the fluorescence intensity in the presence of DNA (Li et al., 1997). The use of well-established quenchers, i.e. halide ions, provides further information about the binding of drugs to DNA. The groove binders are more sensitive to the quenching effect by halides than the intercalating agents, because the pairs of bases hamper the accessibility of the drug by the quenchers. Besides, the electrostatic repulsive forces among phosphate groups on DNA and anionic quenchers collaborate to protect the drug from the quencher effects. Thus, in the case of intercalating agents a considerable reduction in the KSV values is observed in the presence of DNA. Fluorescence polarization measurements afford useful information related to molecular mobility, size, shape and flexibility of the molecules, and also on the fluidity and viscosity of the surroundings of the fluorescent molecules. Thus, a fluorophore in homogeneous solution excited by linearly polarized radiation will emit totally or partially depolarized fluorescence. The emission of non-polarized light is due to torsion vibrations, Brownian motion, transfer of the excitation energy to other molecules with different orientation as well as non-parallel absorption and emission transition moments. In the presence of DNA, the fluorophores that interact with the macromolecules show a enhancement in the fluorescence polarization. This is due to the fact that the torsion vibrations and rotational motions are restricted. The polarization ratio (p) and emission anisotropy (r) can be determined as shown in Figure 7. The interaction with DNA causes an increase in the polarization ratio and emission anisotropy (Δp≈0.001-0.2 and Δr≈0.001-0.3) similar to those obtained in high viscosity media and at low temperature.
Fig. 7. Scheme of the configuration for fluorescence polarization measurements.
www.intechopen.com
An Overview of Analytical Techniques Employed to Evidence Drug-DNA Interactions. Applications to the Design of Genosensors
75
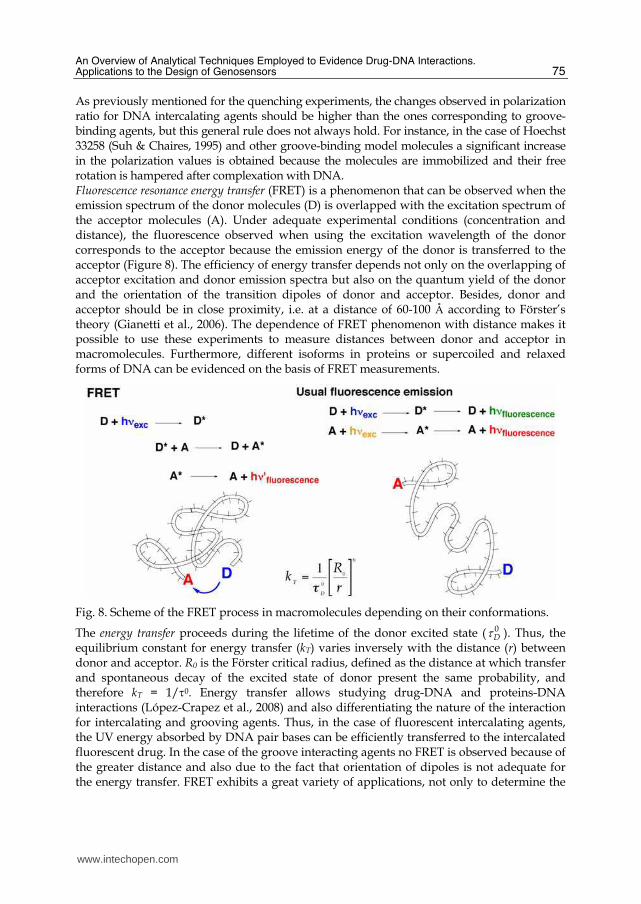
As previously mentioned for the quenching experiments, the changes observed in polarization ratio for DNA intercalating agents should be higher than the ones corresponding to groove-binding agents, but this general rule does not always hold. For instance, in the case of Hoechst 33258 (Suh & Chaires, 1995) and other groove-binding model molecules a significant increase in the polarization values is obtained because the molecules are immobilized and their free rotation is hampered after complexation with DNA. Fluorescence resonance energy transfer (FRET) is a phenomenon that can be observed when the emission spectrum of the donor molecules (D) is overlapped with the excitation spectrum of the acceptor molecules (A). Under adequate experimental conditions (concentration and distance), the fluorescence observed when using the excitation wavelength of the donor corresponds to the acceptor because the emission energy of the donor is transferred to the acceptor (Figure 8). The efficiency of energy transfer depends not only on the overlapping of acceptor excitation and donor emission spectra but also on the quantum yield of the donor and the orientation of the transition dipoles of donor and acceptor. Besides, donor and acceptor should be in close proximity, i.e. at a distance of 60-100 Å according to Förster’s theory (Gianetti et al., 2006). The dependence of FRET phenomenon with distance makes it possible to use these experiments to measure distances between donor and acceptor in macromolecules. Furthermore, different isoforms in proteins or supercoiled and relaxed forms of DNA can be evidenced on the basis of FRET measurements.
Fig. 8. Scheme of the FRET process in macromolecules depending on their conformations.
The energy transfer proceeds during the lifetime of the donor excited state ( 0Dτ ). Thus, the
equilibrium constant for energy transfer (kT) varies inversely with the distance (r) between donor and acceptor. R0 is the Förster critical radius, defined as the distance at which transfer and spontaneous decay of the excited state of donor present the same probability, and therefore kT = 1/τ0. Energy transfer allows studying drug-DNA and proteins-DNA interactions (López-Crapez et al., 2008) and also differentiating the nature of the interaction for intercalating and grooving agents. Thus, in the case of fluorescent intercalating agents, the UV energy absorbed by DNA pair bases can be efficiently transferred to the intercalated fluorescent drug. In the case of the groove interacting agents no FRET is observed because of the greater distance and also due to the fact that orientation of dipoles is not adequate for the energy transfer. FRET exhibits a great variety of applications, not only to determine the
www.intechopen.com
Biomedical Engineering, Trends, Research and Technologies
76
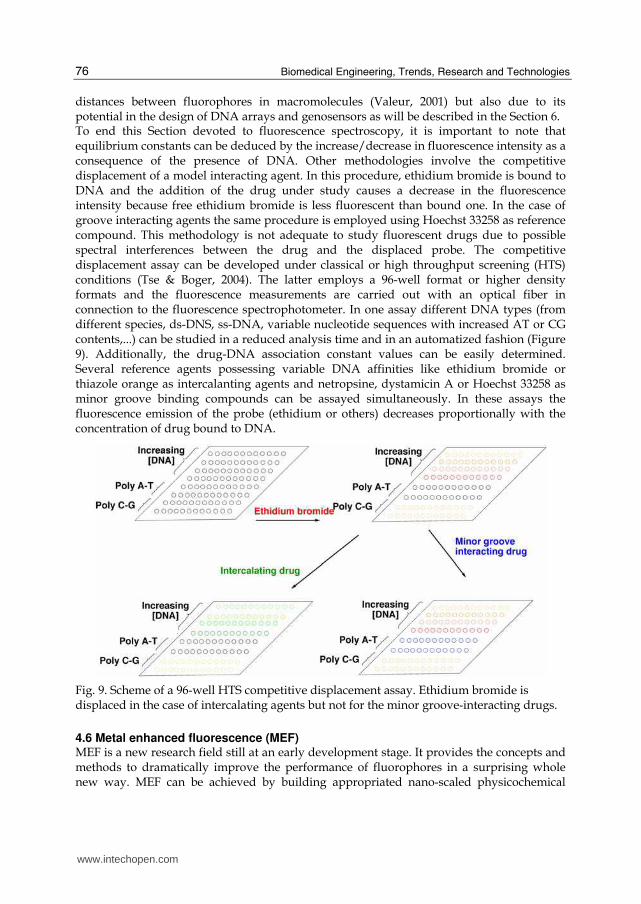
distances between fluorophores in macromolecules (Valeur, 2001) but also due to its potential in the design of DNA arrays and genosensors as will be described in the Section 6. To end this Section devoted to fluorescence spectroscopy, it is important to note that equilibrium constants can be deduced by the increase/decrease in fluorescence intensity as a consequence of the presence of DNA. Other methodologies involve the competitive displacement of a model interacting agent. In this procedure, ethidium bromide is bound to DNA and the addition of the drug under study causes a decrease in the fluorescence intensity because free ethidium bromide is less fluorescent than bound one. In the case of groove interacting agents the same procedure is employed using Hoechst 33258 as reference compound. This methodology is not adequate to study fluorescent drugs due to possible spectral interferences between the drug and the displaced probe. The competitive displacement assay can be developed under classical or high throughput screening (HTS) conditions (Tse & Boger, 2004). The latter employs a 96-well format or higher density formats and the fluorescence measurements are carried out with an optical fiber in connection to the fluorescence spectrophotometer. In one assay different DNA types (from different species, ds-DNS, ss-DNA, variable nucleotide sequences with increased AT or CG contents,...) can be studied in a reduced analysis time and in an automatized fashion (Figure 9). Additionally, the drug-DNA association constant values can be easily determined. Several reference agents possessing variable DNA affinities like ethidium bromide or thiazole orange as intercalanting agents and netropsine, dystamicin A or Hoechst 33258 as minor groove binding compounds can be assayed simultaneously. In these assays the fluorescence emission of the probe (ethidium or others) decreases proportionally with the concentration of drug bound to DNA.
Fig. 9. Scheme of a 96-well HTS competitive displacement assay. Ethidium bromide is displaced in the case of intercalating agents but not for the minor groove-interacting drugs.
4.6 Metal enhanced fluorescence (MEF) MEF is a new research field still at an early development stage. It provides the concepts and methods to dramatically improve the performance of fluorophores in a surprising whole new way. MEF can be achieved by building appropriated nano-scaled physicochemical
www.intechopen.com
An Overview of Analytical Techniques Employed to Evidence Drug-DNA Interactions. Applications to the Design of Genosensors
77
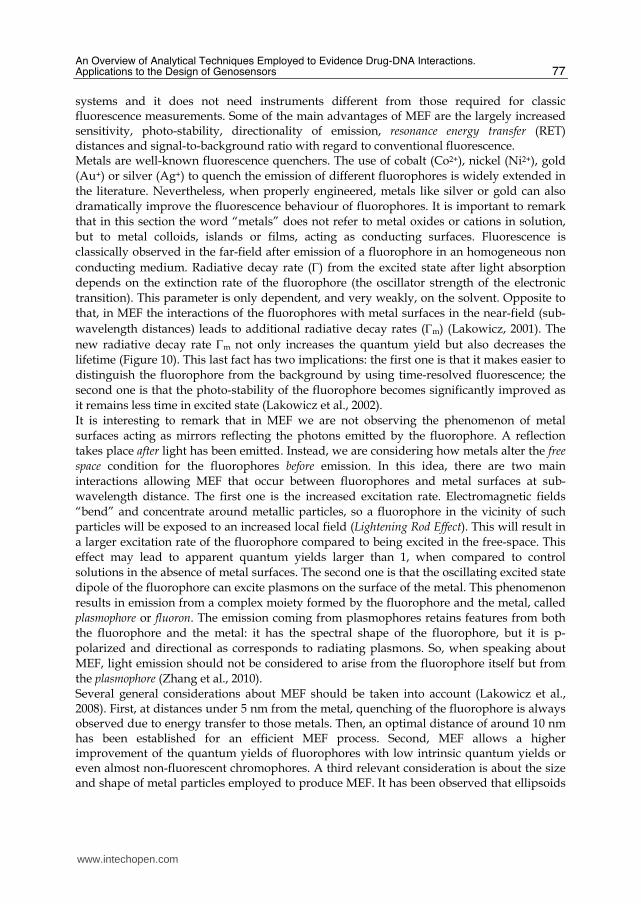
systems and it does not need instruments different from those required for classic fluorescence measurements. Some of the main advantages of MEF are the largely increased sensitivity, photo-stability, directionality of emission, resonance energy transfer (RET) distances and signal-to-background ratio with regard to conventional fluorescence. Metals are well-known fluorescence quenchers. The use of cobalt (Co2+), nickel (Ni2+), gold (Au+) or silver (Ag+) to quench the emission of different fluorophores is widely extended in the literature. Nevertheless, when properly engineered, metals like silver or gold can also dramatically improve the fluorescence behaviour of fluorophores. It is important to remark that in this section the word “metals” does not refer to metal oxides or cations in solution, but to metal colloids, islands or films, acting as conducting surfaces. Fluorescence is classically observed in the far-field after emission of a fluorophore in an homogeneous non conducting medium. Radiative decay rate (Γ) from the excited state after light absorption depends on the extinction rate of the fluorophore (the oscillator strength of the electronic transition). This parameter is only dependent, and very weakly, on the solvent. Opposite to that, in MEF the interactions of the fluorophores with metal surfaces in the near-field (sub-wavelength distances) leads to additional radiative decay rates (Γm) (Lakowicz, 2001). The new radiative decay rate Γm not only increases the quantum yield but also decreases the lifetime (Figure 10). This last fact has two implications: the first one is that it makes easier to distinguish the fluorophore from the background by using time-resolved fluorescence; the second one is that the photo-stability of the fluorophore becomes significantly improved as it remains less time in excited state (Lakowicz et al., 2002). It is interesting to remark that in MEF we are not observing the phenomenon of metal surfaces acting as mirrors reflecting the photons emitted by the fluorophore. A reflection takes place after light has been emitted. Instead, we are considering how metals alter the free
space condition for the fluorophores before emission. In this idea, there are two main interactions allowing MEF that occur between fluorophores and metal surfaces at sub-wavelength distance. The first one is the increased excitation rate. Electromagnetic fields “bend” and concentrate around metallic particles, so a fluorophore in the vicinity of such particles will be exposed to an increased local field (Lightening Rod Effect). This will result in a larger excitation rate of the fluorophore compared to being excited in the free-space. This effect may lead to apparent quantum yields larger than 1, when compared to control solutions in the absence of metal surfaces. The second one is that the oscillating excited state dipole of the fluorophore can excite plasmons on the surface of the metal. This phenomenon results in emission from a complex moiety formed by the fluorophore and the metal, called plasmophore or fluoron. The emission coming from plasmophores retains features from both the fluorophore and the metal: it has the spectral shape of the fluorophore, but it is p-polarized and directional as corresponds to radiating plasmons. So, when speaking about MEF, light emission should not be considered to arise from the fluorophore itself but from the plasmophore (Zhang et al., 2010). Several general considerations about MEF should be taken into account (Lakowicz et al., 2008). First, at distances under 5 nm from the metal, quenching of the fluorophore is always observed due to energy transfer to those metals. Then, an optimal distance of around 10 nm has been established for an efficient MEF process. Second, MEF allows a higher improvement of the quantum yields of fluorophores with low intrinsic quantum yields or even almost non-fluorescent chromophores. A third relevant consideration is about the size and shape of metal particles employed to produce MEF. It has been observed that ellipsoids
www.intechopen.com
Biomedical Engineering, Trends, Research and Technologies
78
with an aspect ratio of 1.75 yield the best results. The improvement of the fluorescence is also related to the orientation of the fluorophore relative to the metal particle. Parallel orientation will lead to the dipole in the metal particle to cancel the dipole in the fluorophore. A perpendicular orientation, instead, will cause both dipoles to add. Subwavelength features or patterns imprinted in metal layers can be used for Surface Plasmon-Coupled Emission (SPCE), a phenomenon which affords a highly directional fluorescence emission. One example is the use of silver nanogratings allowing a controlled separation of the emission angles for every wavelength coming from the fluorophore. Other example is the use of nanohole arrays, thick metal layers with nanoholes of a certain diameter
Fig. 10. Lightening Rod Effect on a metal particle. Energy transitions and radiative and non-radiative decay rates in absence and presence of metal surfaces.
and spacing. These arrays present a high transmission of a single wavelength in a narrow directional beam, thus monochromating and focusing emission in a very particular way. As the advantages provided by this kind of nanostructures come from the way in which plasmons propagate in them, these devices are said to produce plasmon controlled fluorescence (PCF) (Lakowicz et al., 2008). Recent applications of MEF in the field of detection of specific gene sequences include the development of easy-to-prepare arrays capable of selectively and “label-free” detect DNA sequences in concentrations lower than 100 pM before optimization of the system (Peng et al., 2009). It has recently been described that Au and Ag nanoparticles coated with silicon-carbon alloy layers allow real-time monitoring of the hybridization process of a specific DNA labeled oligonucleotide at concentrations down to 5 fM (Touahir et al., 2010).
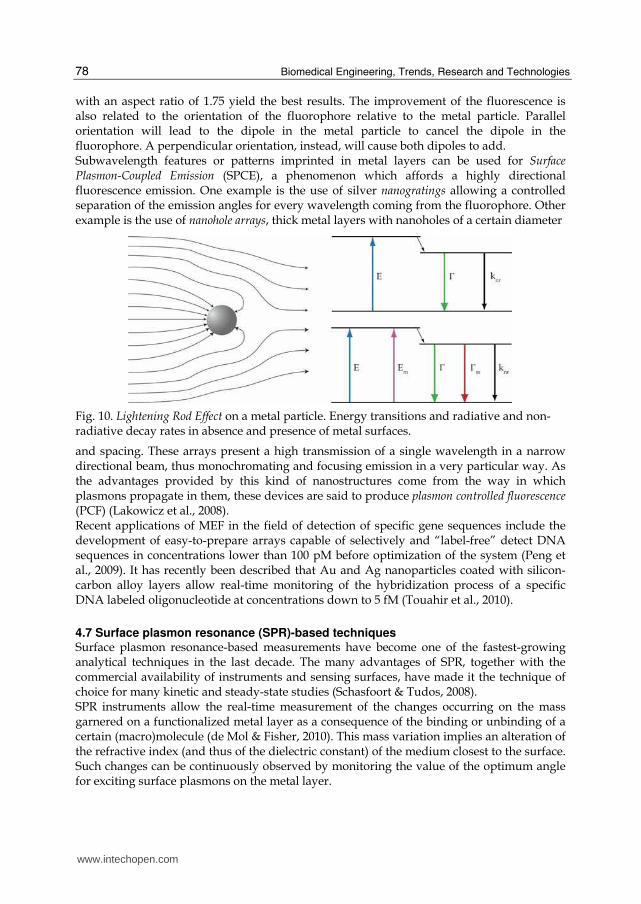
4.7 Surface plasmon resonance (SPR)-based techniques Surface plasmon resonance-based measurements have become one of the fastest-growing analytical techniques in the last decade. The many advantages of SPR, together with the commercial availability of instruments and sensing surfaces, have made it the technique of choice for many kinetic and steady-state studies (Schasfoort & Tudos, 2008). SPR instruments allow the real-time measurement of the changes occurring on the mass garnered on a functionalized metal layer as a consequence of the binding or unbinding of a certain (macro)molecule (de Mol & Fisher, 2010). This mass variation implies an alteration of the refractive index (and thus of the dielectric constant) of the medium closest to the surface. Such changes can be continuously observed by monitoring the value of the optimum angle for exciting surface plasmons on the metal layer.
www.intechopen.com
An Overview of Analytical Techniques Employed to Evidence Drug-DNA Interactions. Applications to the Design of Genosensors
79
Free electrons inside a conductor can be displaced away from a point by an incident electromagnetic field. The remaining electrons may be attracted by the unshielded positive background and thus create a region of increased negative charge density. Then, Coulomb repulsion will push these electrons back to restore the charge neutrality in the region. The resultant of these two forces will set up longitudinal oscillations of the free electrons plasma. A quantum of these oscillations is known as a plasmon. These plasmons are supported by metal-dielectric interfaces and then are referred to as surface plasmons. Direct light cannot excite surface plasmons at a metal-dielectric interface, because the propagation constant of surface plasmons in metal is greater than the one of the light wave in the dielectric medium (Sharma et al., 2007). To solve this problem, surface plasmons are generated by coupling them to an evanescent field. Most SPR systems are based on a Kretschmann-arranged coupling device. This consists on a prism coated with a very thin (~50 nm) gold layer on its base. On the other side of the gold layer is the aqueous medium where experiments are to be carried out (the dielectric). When a p-polarized light beam shines into the prism with an angle greater than the critical angle, attenuated total reflection occurs. A part of the energy of the light is reflected, but another part generates an evanescent wave on the prism-gold interface, radiating to the aqueous medium. The nature of this wave is able to excite surface plasmons on the gold surface. The more efficiently plasmons are excited, the less light is reflected. In addition, this evanescent field penetrates further (~200 nm) than the gold layer, and gets into the experimental medium being strongly affected by changes on its refractive index, or dielectric constant. There is a preferential incidence angle for the light beam at which most of the energy of the radiation is used to excite surface plasmons by means of the evanescent field. This angle can be measured because it is the angle at which least light is reflected due to the absorption of the plasmons. As changes on the dielectric constant of the experimental medium due to mass binding/unbinding will change the nature of the evanescent field, it will turn out in a change of the optimal angle of incidence of the excitation light, as shown by Equation 3:
m sp
m ssin
c cε εω ωε θ = ε + ε (3)
Where c is the velocity of light, ω is the frequency of incident light, ε are the dielectric constants and θ is the optimum incidence angle for surface plasmon resonance; subscripts refer to prism, metal, and working solution. SPR instruments are built up from three main parts (Schasfoort & Tudos, 2008): 1) optical system, or dry section, able to measure the SPR angle changes; 2) liquids handling unit, or wet section, in charge of buffers and samples delivery; 3) sensor chip, where the experiments take place, and which acts as a barrier between the wet and dry sections. The main component of the optical system is the coupling device. As mentioned above, it usually consists of a prism in Kretschmann arrangement (Figure 11), although other possibilities exist (grating couplers, fiber-optics and optical waveguides are less common). Most common setups use a diode array to detect the reflected intensities at different angles, but some systems have a mobile light source capable of scanning several degrees of excitation angles. Most advanced SPR imaging systems (SPRi) use CCD cameras and more complicated optics to simultaneously follow the events happening on hundreds of spots on an array, so many different experiments can be carried out in parallel mode (Steiner, 2004). With this concept, an array of oligonucleotide ligands can be “spotted” on the sensor
www.intechopen.com
Biomedical Engineering, Trends, Research and Technologies
80
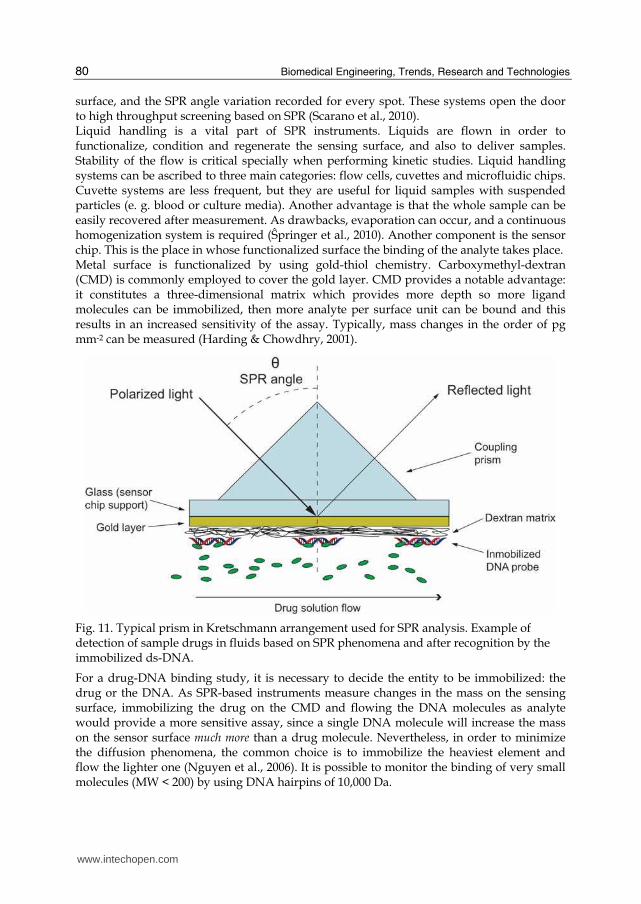
surface, and the SPR angle variation recorded for every spot. These systems open the door to high throughput screening based on SPR (Scarano et al., 2010). Liquid handling is a vital part of SPR instruments. Liquids are flown in order to functionalize, condition and regenerate the sensing surface, and also to deliver samples. Stability of the flow is critical specially when performing kinetic studies. Liquid handling systems can be ascribed to three main categories: flow cells, cuvettes and microfluidic chips. Cuvette systems are less frequent, but they are useful for liquid samples with suspended particles (e. g. blood or culture media). Another advantage is that the whole sample can be easily recovered after measurement. As drawbacks, evaporation can occur, and a continuous homogenization system is required (Ŝpringer et al., 2010). Another component is the sensor chip. This is the place in whose functionalized surface the binding of the analyte takes place. Metal surface is functionalized by using gold-thiol chemistry. Carboxymethyl-dextran (CMD) is commonly employed to cover the gold layer. CMD provides a notable advantage: it constitutes a three-dimensional matrix which provides more depth so more ligand molecules can be immobilized, then more analyte per surface unit can be bound and this results in an increased sensitivity of the assay. Typically, mass changes in the order of pg mm-2 can be measured (Harding & Chowdhry, 2001).
Fig. 11. Typical prism in Kretschmann arrangement used for SPR analysis. Example of detection of sample drugs in fluids based on SPR phenomena and after recognition by the immobilized ds-DNA.
For a drug-DNA binding study, it is necessary to decide the entity to be immobilized: the drug or the DNA. As SPR-based instruments measure changes in the mass on the sensing surface, immobilizing the drug on the CMD and flowing the DNA molecules as analyte would provide a more sensitive assay, since a single DNA molecule will increase the mass on the sensor surface much more than a drug molecule. Nevertheless, in order to minimize the diffusion phenomena, the common choice is to immobilize the heaviest element and flow the lighter one (Nguyen et al., 2006). It is possible to monitor the binding of very small molecules (MW < 200) by using DNA hairpins of 10,000 Da.
www.intechopen.com
An Overview of Analytical Techniques Employed to Evidence Drug-DNA Interactions. Applications to the Design of Genosensors
81
Injections of the analyte at different concentrations allow the calculation of the binding constant (Kass) and thus, the strength of the interaction between drugs and DNA sequences can be inferred. Determination of binding constant (Kass) through the CMD matrix will distort the results for association rates faster than 106 M-1 s-1. Because of this, limitations have to be considered when developing such experiments (Harding & Chowdhry, 2001). SPR experiments are not optimal for concentration assays, however it is possible to perform concentration measurements by generating calibration curves. Development of arrays allowing for multiple measurements to be carried at the same time should solve the problems relative to concentration assays and the long equilibration periods demanded. Recently, several applications of such techniques have proven that it is possible to detect the presence of specific gene sequences without the need for PCR amplification or labelling of the sample. Gold nano-particles on a sensor chip are able to detect specific DNA sequences in 4.1 x 10⁻²⁰ M concentration despite the presence of much higher amounts of interfering DNA (D’Agata et al., 2010).
5. Enzimatic methods: footprinting
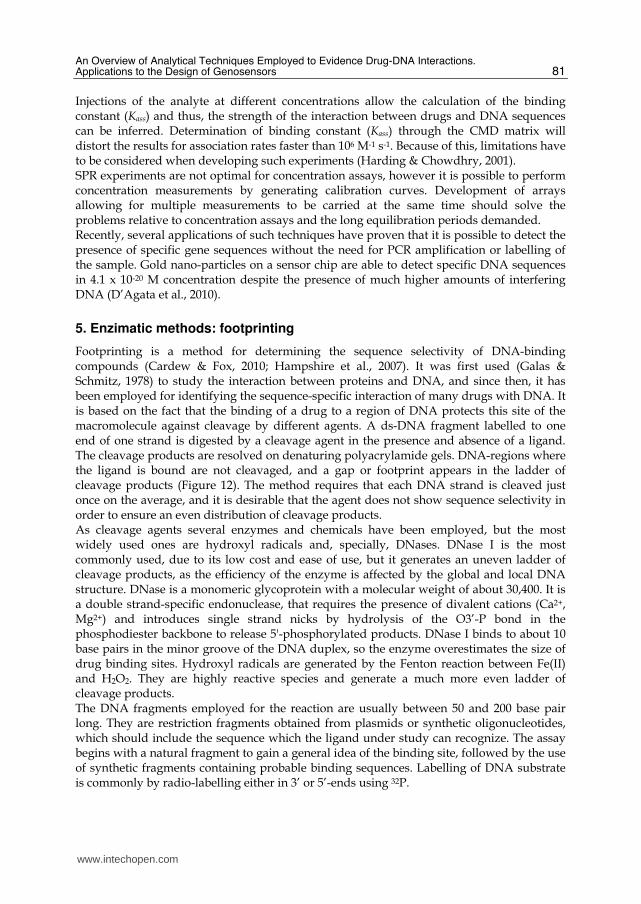
Footprinting is a method for determining the sequence selectivity of DNA-binding compounds (Cardew & Fox, 2010; Hampshire et al., 2007). It was first used (Galas & Schmitz, 1978) to study the interaction between proteins and DNA, and since then, it has been employed for identifying the sequence-specific interaction of many drugs with DNA. It is based on the fact that the binding of a drug to a region of DNA protects this site of the macromolecule against cleavage by different agents. A ds-DNA fragment labelled to one end of one strand is digested by a cleavage agent in the presence and absence of a ligand. The cleavage products are resolved on denaturing polyacrylamide gels. DNA-regions where the ligand is bound are not cleavaged, and a gap or footprint appears in the ladder of cleavage products (Figure 12). The method requires that each DNA strand is cleaved just once on the average, and it is desirable that the agent does not show sequence selectivity in order to ensure an even distribution of cleavage products. As cleavage agents several enzymes and chemicals have been employed, but the most widely used ones are hydroxyl radicals and, specially, DNases. DNase I is the most commonly used, due to its low cost and ease of use, but it generates an uneven ladder of cleavage products, as the efficiency of the enzyme is affected by the global and local DNA structure. DNase is a monomeric glycoprotein with a molecular weight of about 30,400. It is a double strand-specific endonuclease, that requires the presence of divalent cations (Ca2+, Mg2+) and introduces single strand nicks by hydrolysis of the O3’-P bond in the phosphodiester backbone to release 5'-phosphorylated products. DNase I binds to about 10 base pairs in the minor groove of the DNA duplex, so the enzyme overestimates the size of drug binding sites. Hydroxyl radicals are generated by the Fenton reaction between Fe(II) and H2O2. They are highly reactive species and generate a much more even ladder of cleavage products. The DNA fragments employed for the reaction are usually between 50 and 200 base pair long. They are restriction fragments obtained from plasmids or synthetic oligonucleotides, which should include the sequence which the ligand under study can recognize. The assay begins with a natural fragment to gain a general idea of the binding site, followed by the use of synthetic fragments containing probable binding sequences. Labelling of DNA substrate is commonly by radio-labelling either in 3’ or 5’-ends using 32P.
www.intechopen.com
Biomedical Engineering, Trends, Research and Technologies
82
Fig. 12. Scheme of footprinting experiment. DNase I can cleave labelled DNA molecules except for drug-bound sequence. The cleavage products of both samples are resolved on a denaturing polyacrylamide gel and missing fragments are the footprint of the drug corresponding to the protected DNA region.
6. Genosensors
A genosensor is any device capable for the selective and sensitive detection of a specific gene, or more specifically, a particular alele of a gene (Teles & Fonseca, 2008). This chapter has shown that many techniques provide a way to set up such a device, and currently optical methods and PCR-electrophoresis techniques are the most widely employed to reveal the detection of specific DNA sequences. Among optical methods, fluorescence-based techniques are by far the most common and versatile. Fluorescence, fluorescence quenching, RET or anisotropy are only a few examples of fluorescence related techniques widely used to reveal the presence of a specific DNA sequence by pairing them to electrophoresis, PCR, real-time/quantitative PCR, molecular beacons or DNA arrays. SPR and MEF-based methods are also promising tools readily pointing towards the target of the single molecule detection. Nevertheless, over the past few years the term genosensor has been narrowed to the field of electrochemical sensors intended to detect DNA presence or hybridization, or the binding of molecules to DNA. This section is devoted to describe different devices (biosensors, biochips, microarrays, molecular beacons, electrochemical DNA sensors) that use DNA as selective recognition element. The union with the complementary DNA chain causes a change in the optical or electrochemical properties to be measured, and thus the target to be detected can be analyzed.
6.1 Electrochemical genosensors DNA sensors are a class of electrochemical sensors in which the molecular recognition is achieved by using DNA oligomers. As the recognition is in charge of a biological molecule, they are classified as biosensors since the 1990 decade. The signal originated on the recognition surface is then transduced into an electrical signal. Both amperometric or potentiometric measurements can be carried out. In amperometric measurements, an external potential is applied to oxidize or reduce an electrochemically active compound at its intrinsic redox potential. The current produced in the process is monitored. In
www.intechopen.com
An Overview of Analytical Techniques Employed to Evidence Drug-DNA Interactions. Applications to the Design of Genosensors
83
potentiometric methods, an equilibrium is reached on the sensor surface without the need of an external potential. The membrane potential (potential generated between the electrode and the measured solution) is then recorded. In amperometric measurements, the choice of the working potential provides some selectivity to the method, as the potential can be set at the specific redox value of the analyte of interest. Nevertheless, interferences in the sample can share the same potential value with the analyte. As this selectivity is not enough, the surface of the electrode needs to be functionalized. For amperometric studies, Cottrel’s equation takes into account the mass transport restrictions in the solution, and if the system is kept under continuous stirring, the intensity of the current depends on the concentration of analyte as follows (Equation 4):
= DI nFA C
L (4)
Where A is the area of the electrode, D and C are the diffusion coefficient and concentration of the analyte and L is the thickness of the diffusion layer closest to the surface. This equation can be simplified as I = KC, and then it can be witnessed that the measured intensity is proportional to the concentration of the analyte in the solution. The electrode used as transducer element can be made up from different materials (Lucarelli et al., 2004). Platinum, gold, vitrified carbon or pyrolytic graphite are commonly employed. The use of composites (solid conductors dispersed into polymeric nonconducting matrices) is growing over the last years. As mentioned before, in electrochemical biosensors, the electrode is the transducer but a specific recognition step has been previously carried out by a biological macromolecule. Most extended electrochemical biosensors use enzimes or antibodies as recognizing molecules, but genosensors use DNA. DNA molecules afford two remarkable advantages over proteins: they are much more chemically stables and they can be easily synthesized with high purity. DNA can be immobilized on the electrode surface using different techniques. 1) Physical adsorption, 2) electrochemical adsorption, due to the phosphate backbone of DNA, 3) avidin (or streptavidin) / biotin to immobilize the DNA probes on the surface of the electrode, 4) covalent electrode-DNA binding. This method depends strongly on the nature of the electrode, 5) pyrrole or other monomers can be electropolymerized on the surface of an electrode. If this process is conducted in the presence of the DNA probe, the polymer constitutes a matrix that traps the DNA molecules binding them to the electrode. Once the DNA has been immobilized, the recognition step can take place. This event must result on an electrochemical phenomenon measurable by the electrode. Different strategies can be followed (Kerman et al., 2004). For the detection of electroactive DNA binding agents, non-specific double-stranded DNA can act as recognizing biomolecules. After the compound binds to the DNA, it can be oxidized or reduced at its redox potential and the current can be monitored. Any electroactive DNA binding molecule will be detected, the selectivity only determined by the different intrinsic redox potential of every substance. This method allows the estimation of drug-DNA binding mode and binding constants (Tian et al., 2008). For the detection of a specific DNA sequence, the most common approach is to immobilize the single-stranded DNA complementary sequence on the electrode. Then, the hybridization of the target sequence to the probe on the electrode’s surface can be monitored by two main
www.intechopen.com
Biomedical Engineering, Trends, Research and Technologies
84
ways. The most widely used is adding to the solution an electroactive substance which only binds to the hybrid dsDNA, but not to the ssDNA alone. Myriads of substances have been employed with this aim: cationic metal complexes like Co(phen)33+ and Co(bpy)33+ or intercalating organic molecules like antramines or daunomycin are only a few examples. Commercial systems exist based on this approach (Motorola’s eSensorTM and Toshiba’s GenelyzerTM). The second method to detect the hybridization is label free and relies on the redox properties of guanine. The intrinsic redox potential of this base on ssDNA (+1.03 V) decreases when hybridization to form dsDNA happens. This change can be monitored to detect hybridization of the probe and the target sequence. Nevertheless, this change is small and hard to detect, so more complex techniques are required. Furthermore, this method cannot be applied if the probe sequence itself posses guanine bases that would be quickly oxidized. To bypass this problem, probes with inosine instead of guanine can be synthesized. Inosine peak can be easily distinguished from guanine. It is also possible to use other labelling methods to detect the binding to the DNA probes such as metal nanoparticles or enzimes, but their uses are less frequent, although growing. For the last years, the use of nanostructured materials is spreading in the field of nanosensors. This class of materials such as metal nanoparticles, magnetic nanoparticles or carbon nanotubes possesses very attractive features. The high surface and very characteristic conducting properties make them of interest to achieve better response times, higher sensitivity and improved specificity (Abu-Salah et al., 2010). Aligned carbon nanotubes were recently employed to detect a DNA sequence characteristic for genetically modified organisms with sensitivity in the nanomolar range (Berti et al., 2009). A combination of magnetic beads for immunomagnetic separation and a later detection step using magnetic graphite-epoxy composite electrode has been recently employed for the detection of Salmonella in milk with limit of detection from 5 to 7.5 x 10³ CFU mL-1 in a short time (50 minutes) (Liébana et al., 2009).
6.2 Optical genosensors Microarray technology has been developed due to the necessity of accurate and sensitive methodologies to make use of knowledge afforded by the Human Genome Project. This configuration offers a massive parallel analysis platform for hybridization reactions. According to Leher (Leher et al., 2003) microarrays are ordered two-dimensional spatial arrangements of small structures (oligonucleotides) on a solid support. The oligonucleotides are bounded or adsorbed on the solid support as the selective recognition element. When the complementary sample sequence is recognized, the optical properties of the probe bound to DNA changes and this fact results in a sensitive response. Different optical responses can be processed i.e. UV-Vis absorption, or fluorescence emission properties, and other optical events in connection with plasmon resonance phenomena. Among the different alternatives, fluorescence techniques (emission, total or partial reflection fluorescence and scanning fluorescence techniques) offer advantageous features due to its sensitivity (about 10-8 M of the probe and sub-microliter volumes) joint to the fact that a large number of fluorescent probes are able to react with DNA. Thus, the contact of the sample DNA with the sensor microarray during the readout process allows monitoring the continuous binding of molecules present in the sample and, then, interacting with the genosensor surface. Another advantage of optical genosensors (microarrays, biochips) is the possibility of repeated cycles of hybridization and denaturation with a single genosensor
www.intechopen.com
An Overview of Analytical Techniques Employed to Evidence Drug-DNA Interactions. Applications to the Design of Genosensors
85
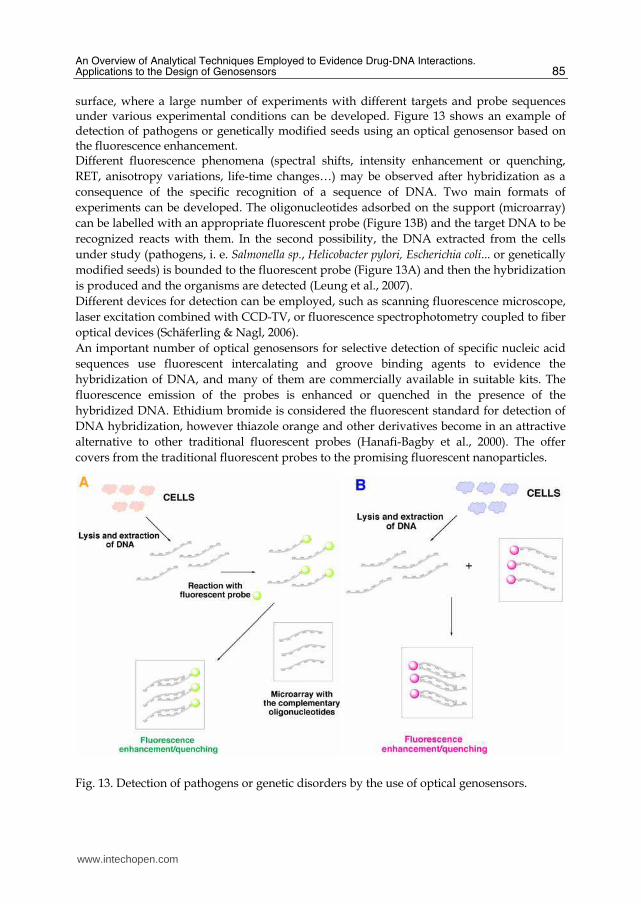
surface, where a large number of experiments with different targets and probe sequences under various experimental conditions can be developed. Figure 13 shows an example of detection of pathogens or genetically modified seeds using an optical genosensor based on the fluorescence enhancement. Different fluorescence phenomena (spectral shifts, intensity enhancement or quenching, RET, anisotropy variations, life-time changes…) may be observed after hybridization as a consequence of the specific recognition of a sequence of DNA. Two main formats of experiments can be developed. The oligonucleotides adsorbed on the support (microarray) can be labelled with an appropriate fluorescent probe (Figure 13B) and the target DNA to be recognized reacts with them. In the second possibility, the DNA extracted from the cells under study (pathogens, i. e. Salmonella sp., Helicobacter pylori, Escherichia coli... or genetically modified seeds) is bounded to the fluorescent probe (Figure 13A) and then the hybridization is produced and the organisms are detected (Leung et al., 2007). Different devices for detection can be employed, such as scanning fluorescence microscope, laser excitation combined with CCD-TV, or fluorescence spectrophotometry coupled to fiber optical devices (Schäferling & Nagl, 2006). An important number of optical genosensors for selective detection of specific nucleic acid sequences use fluorescent intercalating and groove binding agents to evidence the hybridization of DNA, and many of them are commercially available in suitable kits. The fluorescence emission of the probes is enhanced or quenched in the presence of the hybridized DNA. Ethidium bromide is considered the fluorescent standard for detection of DNA hybridization, however thiazole orange and other derivatives become in an attractive alternative to other traditional fluorescent probes (Hanafi-Bagby et al., 2000). The offer covers from the traditional fluorescent probes to the promising fluorescent nanoparticles.
Fig. 13. Detection of pathogens or genetic disorders by the use of optical genosensors.
www.intechopen.com
Biomedical Engineering, Trends, Research and Technologies
86
7. Conclusion
The study of the interaction of small molecules with DNA is a field of high topical interest, and we hope to have provided a clear, concise introduction to this fascinating area at the boundary between chemistry and biology. The detailed knowledge of these interactions can be used as the basis for the rational design of new DNA ligands with potential application in a variety of fields, e.g. as anticancer drugs and DNA probes allowing in vitro and in vivo monitoring of genetic diseases. Special relevance can be attached to the analysis of drugs, genetically modified organisms and environmentally toxic compounds capable to induce important DNA changes employing these innovative strategies. The design of suitable high throughput systems will improve the performance of these analytical challenges. This is a rapidly evolving topic, and devices able to recognize and bind to DNA are certain to find a host of additional applications in the near future.
8. Acknowledgements
Financial support from Ministerio de Ciencia e Innovación (Spain) through grants CTQ 2009-11312-BQU and CTQ 2009-12320-BQU, as well as from Grupos de Investigación UCM (920234), is gratefully acknowledged. The authors are also grateful to MEC for the award of a FPU research fellowship to V. González-Ruiz.
9. References
Abu-Salah, K. M.; Alrokyan, S. A.; Khan, M. N. & Ansari, A. A. (2010) Nanomaterials as Analytical Tools for Genosensors. Sensors, 10, 1, (January 2010), 963-993, 1424-8220
Akbay, N.; Seferoglu, Z. & Gök, E. (2009) Fluorescence Interaction and Determination of Calf Thymus DNA with Two Ethidium Derivatives, Journal of Fluorescence, 19, 6, (November 2009) 1045-1051, 1053-0509
Anker, J. N.; Hall, W. P.; Lyandres, O.; Shah, N. C.; Zhao, J. & Van Duyne, R. P. (2008). Biosensing with plasmonic nanosensors. Nature materials, 7, 6, (June 2008) 442-453, 1476-1122
Araya, F.; Huchet, G.; McGroarty, I.; Skellern, G.G.& Waigh R.D. (2007). Capillary electrophoresis for studying drug-DNA interactions. Methods, 42, 2, (June 2007) 141-149, 1046-2023.
Aslan, K.; Lakowicz, J. R.; Szmacinski, H. & Geddes, C. D. (2004). Metal-enhanced fluorescence solution-based sensing platform. Journal of Fluorescence, 14, 6, (November 2004) 677-679, 1053-0509
Baba, Y. (1999). Capillary affinity gel electrophoresis: new technique for specific recognition for DNA sequence and the mutation detection on DNA. Journal of biochemical and biophysical methods, 41, 2-3, (November 1999) 91-101, 0165-022X.
Banyay, M.; Sarkar, M. & Gräslund, A. (2003). A library of IR bands of nucleic acids in solution. Biophysical Chemistry, 104, 2, (June 2003) 477-488, 0303-4622.
Barber, J.; Cross, H. F. & Parkinson, J. A. (1993). High-Resolution NMR of DNA and Drug-DNA Interactions. In: Methods in Molecular Biology, Spectroscopic Methods and Analyses: NMR, Mass Spectrometry, and Metalloprotein Techniques, Vol 17, Jones, C.; Mulloy, B. & Thomas, A. H. (Eds.). Humana Press Inc, 978-1-59259-504-4, Totowa, NJ.
www.intechopen.com
An Overview of Analytical Techniques Employed to Evidence Drug-DNA Interactions. Applications to the Design of Genosensors
87
Berti, F.; Lozzi, L.; Palchetti, I.; Santucci, S. & Marrazza, G. (2009) Aligned carbon nanotube thin films for DNA electrochemical sensing. Electrochimica Acta, 54, 2, (September 2009), 5035-5041, 0013-4686
Blackburn, G. M.; Gait, M. J.; Loakes, D. & Williams, D. M. (2006) Nucleic Acids in Chemistry and Biology, The Royal Society of Chemistry, 978-0-85404-654-6, Cambridge.
Cardew, A. T. & Fox, K. R. (2010). DNase I Footprinting, In: Methods in Molecular Biology. Drug-DNA Interaction Protocols, K. R. Fox (ed.), 2nd Ed., Chapter 10, 153-172, Humana Press, 978-1-60327-417-3, Southampton.
D’Agata, R.; Corradini, R.; Ferretti, C.; Zanoli, L.; Gatti, M.; Marchelli, R. & Spoto, G. (2010). Ultrasensitive detection of non-amplified genomic DNA by nanoparticle-enhanced surface plasmon resonance imaging. Biosensors and Bioelectronics, 25, 9, (May 2010) 2095-2100, 0956-5663.
De Mol, N. J. & Fisher, M. J. E. (Eds.) (2010). Surface Plasmon Resonance Methods and Protocols, Humana Press / Springer Science+Business Media, 978-1-60761-669-6, New York.
Eriksson, M. & Nordén, B. (2001). Linear and Circular Dichroism of Drug-Nucleic Acid Complexes. In : Methods in Enzymology, Drug-Nucleic Acid Interactions, Vol. 340, Chaires, J. B. & Waring M. J. (Eds.). Academic Press, 0-12-182241-9, San Diego.
Galas, D. J. & Schmitz, A. (1978). DNAase footprinting- simple method for detection of protein-DNA binding specificity. Nucleic Acids Research, 5, 9, 3157-3170, 1362-4962.
Giannetti, A.; Citti, L.; Domenici, C.; Tedeschi, L.;Baldini, F.; Wabuyele, M. B. & Vo-Dinh, T. (2006) FRET-based protein-DNA binding Assay for Detection of Active NF-kB, Sensors and Actuators B: Chemical, 113, 2 (February 2006) 649-654, 0925-4005
Hampshire, A. J.; Rusling, D. A.; Broughton-Head, V. J. & Fox, K. R. (2007). Footprinting: A method for determining the sequence selectivity, affinity and kinetics of DNA-binding ligands. Methods, 42, 2, (June 2007) 128-140, 1046-2023.
Hanafi-Bagby, D.; Piunno, P. A. E.; Wust, C. C. & Krull, U. J. (2000) Concentration Dependence of a Thiazole Orange Derivative that is Used to Determine Nucleic Acid Hybridization by an Optical Biosensor, Analytica Chimica Acta, 411, 1-2, (May 2000) 19-30, 0003-2670
Harding, E. S. & Chowdhry, B. Z. (Eds.) (2001). Protein-ligand interactions: hydrodynamics and calorimetry, a practical approach, Oxford University Press, 0-19-963746-6, New York.
Islam, M. M.; Chowdhury, S. R. & Kumar, G. S. (2009) Spectroscopic and Calorimetric Studies on the Binding of Alkaloids Berberine, Palmatine and Coralyne to Double Stranded RNA Polynucleotides, Journal of Physical Chemistry B, 113, 4, (January 2009), 1210-1224, 1520-6106
Jangir, D.K.; Tyagi, G.; Mehrotra, R. & Kundu, S. (2010). Carboplatin interaction with calf-thymus DNA: A FTIR spectroscopic approach. Journal of Molecular Structure, 969, 1-3, (April 2010) 126-129, 0022-2860.
Kerman, K.; Kobayashi, M. & Tamiya, E. (2004) Recent trends in electrochemical DNA biosensor technology. Measurement Science and Technology, 15, 2, (February 2004) R1-R11, 0957-0233
Koster, D.A.; Czerwinski, F.; Halby, L.; Crut, A.; Vekhoff, P.; Palle, K.; Arimondo, P.B. & Dekker, N.H. (2008). Single-molecule observations of topotecan-mediated TopIB activity at a unique DNA sequence. Nucleic Acids Research, 36, 7, (April 2008) 2301-2310, 0305-1048
www.intechopen.com
Biomedical Engineering, Trends, Research and Technologies
88
Kral, T.; Leblond, J.; Hof, M.; Scherman, D.; Herscovici, J. & Mignet, N. (2010). Lipopolythiourea/DNA interaction: a biophysical study. Biophysical Chemistry, 148, 1-3, (May 2010) 68-73, 0301-4622
Krylova, S.M.; Wegman, D.W. & Krylov, S.N. (2010). Making DNA hibridization assays in capillary electrophoresis quantitative. Analytical Chemistry, 82, 11, (June 2010) 4428-4433, 0003-2700
Kumar, C. V.; Turner, R. S. & Asuncion, E. H. (1993) Groove Binding of a Styrylcyanine Dye to the DNA Double Helix: the Salt Effect, Journal of Photochemistry and Photobiology A: Chemistry, 74, 2-3, (September 1993) 231-238, 1010-6030
Lehr, H.-P.; Reimann, M.; Brandenburg, A.; Suiz, G. &Klapproth, H. (2003) Real Time Detection of Nucleic Acid Interactions by Total Internal Reflection Fluorescence, Analytical Chemistry, 75, 10, (May 2003) 2414-2420, 0003-2700
Lakowicz, J. R. (2001) Radiative decay engineering: biophysical and biomedical applications. Analytical Biochemistry, 301, 2, (February 2002) 261-277, 0003-2697
Lakowicz, J. R.; Shen, Y.; D'Auria, S.; Malicka, J.; Fang, J.; Gryczynski, Z. & Gryczynski, I. (2002) Radiative Decay Engineering 2: effects of silver island films on fluorescence intensity, lifetimes, and resonance energy transfer. Analytical Biochemistry, 298, 1, (November 2001) 1-24, 0003-2697
Lakowicz, J. R.; Ray, K.; Chowdhury, M.; Szmacinski, H.; Fu, Y.; Zhang, J. & Nowaczyk, K.; (2008) Plasmon-controlled fluorescence: a new paradigm in fluorescence spectroscopy. The Analyst, 133, 10, (October 2008) 1308-1346, 0003-2654
Lane, A. N. (2001). Nuclear Magnetic Resonance Studies of Drug-DNA Complexes in Solution. In : Methods in Enzymology, Drug-Nucleic Acid Interactions, Vol. 340, Chaires, J. B. & Waring M. J. (Eds.). Academic Press, 0-12-182241-9, San Diego, USA.
Leung, A.; Shankar, P. M. & Mutharasan, R. (2007) A Review of Fiber-Optic Biosensors, Sensors and Atuators B: Chemical, 125, 2 (August 2007) 688-703, 0925-4005
Li, W.-Y.; Xu, J.- G.; Guo, X.-Q.; Zhu, Q.-Z. & Zhao, Y. B. (1997) Study of the Interaction Between Rivanol and DNA and its Application to DNA Assay, Spectrochimica Acta A, 53, 5 (May 1997) 781-787, 1386-1425
Liébana, S.; Lermo, A.; Campoy, S.; Barbé, J.; Alegret, S. & Pividori, M. I. (2009) Magneto Immunoseparation of Pathogenic Bacteria and Electrochemical Magneto Genosensing of the Double-Tagged Amplicon, Analytical Chemistry, 81, 14, (July 2009), 5812-5820, 0003-2700
Lopez-Crapez, E.; Maligne, J.-M.; Gatchitch, F.; Casano, L.;Langlois, T.; Pugnière, M.; Roquet, F.; Mathis, G. & Bazin, H. (2008) A homogeneous Resonance Energy Transfer-Based Assay to Monitor MutS/DNA interactions, Analytical Biochemistry, 383, 12, (December 2008) 301-306, 0003-2697
Lucarelli, F.; Marrazza, G.; Turner, A. & Mascini, M. (2004) Carbon and gold electrodes as electrochemical transducers for DNA hybridisation sensors. Biosensors and Bioelectronics, 19, 6, (January 2004), 515-530, 0956-5663
Mandeville, J. S.; N’soukpoé-Kossi, C. N.; Neault, J. F. & Tajmir-Riahi, H. A. (2010). Structural analysis of DNA interaction with retinol and retinoic acid. Biochemistry Cell Biology, 88, 3, (June 2010) 469-477, 1208-6002.
www.intechopen.com
An Overview of Analytical Techniques Employed to Evidence Drug-DNA Interactions. Applications to the Design of Genosensors
89
Martín, M. A.; del Castillo, B. & Lerner, D. A. (1988) Study of the Luminescence Properties of a New Series of Quinolizinium Salts and Their Interaction with DNA, Analytica Chimica Acta., 205, 1-2, (February 1988) 105-115, 0003-2670
Martín, M. A.; Bouin, A. S.; Muñoz-Botella, S. & del Castillo, B. (2002) Study of the Interaction of Azaquinolizinium Salts with DNA, Polycyclic Aromatic Compounds, 22, 1, (February 2002) 37-53, 1040-6638
Neault, J. F. & Tajmir-Riahi, H. A. (1996). Diethylstilbestrol-DNA Interaction Studied by Fourier Transform Infrared and Raman Spectroscopy. Journal of Biological Chemistry, 271, 14, (April 1996) 8140-8143, 0021-9258
Nguyen B.; Tanious, F. A. & Wilson, W. D. (2007). Biosensor-surface plasmon resonance: Quantitative analysis of small molecule-nucleic acid interactions. Methods, 42, 2, (June 2007) 150-161, 1046-2023
Paul, P.; Hossain, M.; Yadav, R. C. & Kumar, G. S. (2010) Biophysical Studies on the Base Specificity and Energetics of the DNA Interaction of Photoactive Dye Thionine: Spectroscopic and Calorimetric Approach, Biophysical Chemistry, 148, 1-3 (May 2010), 93-103, 0301-4622
Peng, H. I.; Strohsahl, C. M., Leach, K. E.; Krauss, T. & Miller, B. L. (2009) Label-free DNA detection on nanostructured Ag surfaces. ACS nano, 3, 8, (August 2009) 2265-2273, 1936-0851
Prunkl, C.; Pichlmaier, M.; Winter, R.; Kharlanov, V.; Rettig, W. & Wagenknecht, H.-A. (2010) Optical, Redox and DNA-Binding Properties of Phenanthridinium Chromophores: Elucidating the Role of the Phenyl Substituent for Fluorescence Enhancement of Ethidium in the Presence of DNA, Chemistry - A European Journal, 16, 11 (March 2010), 3392-3402, 0947-6539
Rodger, A. (2010). Circular and Linear Dichroism of Drug-DNA Systems. In: Drug-DNA Interaction Protocols, Methods in Molecular Biology. Vol. 613 , Fox, K. R. (Ed.). Humana Press, 978-1-60327-417-3, Southampton.
Scarano, S.; Mascini, M., Turner, A. P. F. & Minunni, M. (2010). Surface plasmon resonance imaging for affinity-based biosensors. Biosensors and Bioelectronics, 25, 5, (January 2010) 957-966, 0956-5663
Schäferling, M. & Nagl, S. (2006) Optical Technologies for the Read out Quality Control of DNA and Protein Microarrays. Analytical and Bioanalytical Chemistry, 385, 2 (January 2006) 500-517, 1618-2642
Schasfoort, R. B. M. & Tudos, A. J. (Eds.) (2008). Handbook of Surface Plasmon Resonance, The Royal Society of Chemistry, 978-0-85404-267-8, Cambridge.
Serganov, A. & Patel, D. J. (2006). Structural Features of the Specific Interactions between Nucleic Acids and Small Organic Molecules, In: Sequence-Specific DNA Binding Agents, Waring, M. (Ed.), 233-252, The Royal Society of Chemistry, 978-0-085404-370-5, Cambridge.
Sharma A. K.; Jha, R. & Gupta, B. D. (2007). Fiber-Optic Sensors Based on Surface Plasmon Resonance: A comprehensive Review. IEEE Sensors Journal, 7, 8, (August 2007) 1118-1129, 1530-437X
Ŝpringer, T.; Piliarik, M. & Homola, J. (2010). Surface plasmon resonance sensor with dispersionless microfluidics for direct detection of nucleic acids at the low femtomole level. Sensors and Actuators B, 145, 1, (March 2010) 588-591, 0925-4005
www.intechopen.com
Biomedical Engineering, Trends, Research and Technologies
90
Steiner G. (2004). Surface plasmon resonance imaging. Analytical and Bioanalytical Chemistry, 379, 3, (June 2004) 328-331, 1618-2642
Su, X.; Kong, L.; Lei, X.; Hu, L.; Ye, M. & Zou, H. (2007a). Biological fingerprinting analysis of trditional Chinese medicines with targeting ADME/Tox property for screening of bioactive compounds by chromatographic and MS methods. Mini-Reviews in Medicinal Chemistry, 7, 1, (January 2007) 87-98, 1389-5575.
Su, X.; Qin, F.; Kong, L.; Ou, J.; Xie, C. & Zou, H. (2007b). Characterization of enantioselective binding of racemic natural tetrahydropalmatine to DNA by chromatographic methods. Journal of Chromatography B, 845, 1, (January 2007) 174-179, 1570-0232.
Suh, D. & Chaires, J. B. (1995). Criteria for the Mode of Binding of DNA Binding Agents, Biorganic and Medicinal Chemistry, 3, 6, (June 1995) 723-728, 0968-0896
Teles, F. R. R. & Fonseca, L. P. (2008) Trends in DNA biosensors. Talanta, 77, 2, (December 2008), 606-623, 0039-9140
Tian, R.; Xu, S.; Lei, X.; Jin, W.; Ye, M. & Zou, H. (2005). Characterization of Small-Molecule-Biomacromolecule Interactions: from Simple to Complex, Trends in Analytical Chemistry, 24, 9 (October 2005), 810-825, 0165-9936
Tian, X.; Song, Y.; Dong, H. & Ye, B. (2008) Interaction of anticancer herbal drug berberine with DNA immobilized on the glassy carbon electrode. Bioelectrochemistry, 73, 1, (June 2008), 18-22, 1567-5394
Touahir, L.; Galopin, E.; Boukherroub, R.; Gouget-Laemmel, A. C.; Chazalviel, J. N.; Ozanam, F. & Szunerits, S. (2010) Localized surface plasmon-enhanced fluorescence spectroscopy for highly-sensitive real-time detection of DNA hybridization. Biosensors and Bioelectronics, 25, 2, (August 2010) 2579-2585, 0956-5663
Tse, W. C. & Boger D. L. (2004). A Fluorescent Intercalator Displacement Assay for Establishing DNA Binding Selectivity and Affinity, Accounts of Chemical Research, 37, 1 (January 2004), 61-69, 0022-2313
Valeur, V. (2001). Resonance Energy Transfer and its Applications, In: Molecular Fluorescence Principles and Applications, Valeur, V., 247-272, Wiley-VCH, 3-527-29919-X, Weinheim
Wu, F.-Y.; Xiang Y.-L.; Wu, Y.-M. & Xie, F.-Y. (2009). Study of the Interaction of a Fluorescent Probe with DNA, Journal of Luminescence, 129, 11 (November 2009), 1286-1291, 0022-2313
Yang, B.; Lu, N.; Qi, D.; Ma, R.; Wu, Q.; Hao, J.; Liu, X.; Mu, Y.; Reboud, V.; Kehagias, N.; Sotomayor-Torres, C. M.; Boey, F. Y. C.; Chen, X. & Chi, L. (2010). Tuning the intensity of metal-enhanced fluorescence by engineering silver nanoparticle arrays. Small, 6, 9, (May 2010) 1038-1043, 1613-6829
Zhang, Y.; Padhyay, A.; Sevilleja, J. E.; Guerrant, R. L. & Geddes, C. D. (2010) Interactions of Fluorophores with Iron Nanoparticles: Metal-Enhanced Fluorescence. The Journal of Physical Chemistry C (May 2010) 114, 17, 7575-7581, 1932-7447
Zoriniants, G. & Barnes, W. L. (2008). Fluorescence enhancement through modified dye molecule absorption associated with the localized surface plasmon resonances of metallic dimers. New Journal of Physics, 10, 10, (October 2008) 105002-105013, 1367-2630
www.intechopen.com
Biomedical Engineering, Trends, Research and TechnologiesEdited by Dr. Sylwia Olsztynska
ISBN 978-953-307-514-3Hard cover, 644 pagesPublisher InTechPublished online 08, January, 2011Published in print edition January, 2011
InTech EuropeUniversity Campus STeP Ri Slavka Krautzeka 83/A 51000 Rijeka, Croatia Phone: +385 (51) 770 447 Fax: +385 (51) 686 166www.intechopen.com
InTech ChinaUnit 405, Office Block, Hotel Equatorial Shanghai No.65, Yan An Road (West), Shanghai, 200040, China
Phone: +86-21-62489820 Fax: +86-21-62489821
This book is addressed to scientists and professionals working in the wide area of biomedical engineering,from biochemistry and pharmacy to medicine and clinical engineering. The panorama of problems presentedin this volume may be of special interest for young scientists, looking for innovative technologies and newtrends in biomedical engineering.
How to referenceIn order to correctly reference this scholarly work, feel free to copy and paste the following:
Víctor González-Ruiz, Ana I. Olives, M. Antonia Martín, Pascual Ribelles, M. Teresa Ramos and J. CarlosMenéndez (2011). An Overview of Analytical Techniques Employed to Evidence Drug-DNA Interactions.Applications to the Design of Genosensors, Biomedical Engineering, Trends, Research and Technologies, Dr.Sylwia Olsztynska (Ed.), ISBN: 978-953-307-514-3, InTech, Available from:http://www.intechopen.com/books/biomedical-engineering-trends-research-and-technologies/an-overview-of-analytical-techniques-employed-to-evidence-drug-dna-interactions-applications-to-the-

© 2011 The Author(s). Licensee IntechOpen. This chapter is distributedunder the terms of the Creative Commons Attribution-NonCommercial-ShareAlike-3.0 License, which permits use, distribution and reproduction fornon-commercial purposes, provided the original is properly cited andderivative works building on this content are distributed under the samelicense.