Embed Size (px)
Citation preview

3D conformal planning using low segment multi-criteria
IMRT optimization
Fazal Khan and David Craft
Massachusetts General HospitalHarvard Medical School
Boston, MA
Abstract
Purpose: To evaluate automated multicriteria optimization (MCO) – de-signed for intensity modulated radiation therapy (IMRT), but invoked withlimited segmentation – to efficiently produce high quality 3D conformal treat-ment (3D-CRT) plans.Methods: Ten patients previously planned with 3D-CRT were replannedwith a low-segment inverse multicriteria optimized technique. The MCO-3D plans used the same number of beams, beam geometry and machineparameters of the corresponding 3D plans, but were limited to an energy of6 MV. The MCO-3D plans were optimized using a fluence-based MCO IMRTalgorithm and then, after MCO navigation, segmented with a low number ofsegments. The 3D and MCO-3D plans were compared by evaluating meandoses to individual organs at risk (OARs), mean doses to combined OARs,homogeneity indexes (HI), monitor units (MUs), physician preference, andqualitative assessments of planning time and plan customizability.Results: The MCO-3D plans significantly reduced the OAR mean doses andmonitor units while maintaining good coverage and homogeneity of targetvolumes. MCO allows for more streamlined plan customization. All MCO-3D plans were preferred by physicians over their corresponding 3D plans.Conclusion: High quality 3D plans can be produced using IMRT optimiza-tion technology, resulting in automated field-in-field type plans with goodmonitor unit efficiency. Adopting this technology in a clinic could streamlinetreatment plan production.
Keywords: 3D-CRT, MCO, Pareto, optimization, IMRT, segmentation
Preprint submitted to IJROBP February 3, 2014
arX
iv:1
401.
8196
v1 [
phys
ics.
med
-ph]
31
Jan
2014

1. Introduction
3D planning, also known as forward planning, is a standard approach fordelivering conformal radiotherapy to a variety of cancers. The simplicity,low cost, low maintenance and well documented outcomes of 3D planninghave made it the preferred choice for many disease sites. In 3D planning,dose distribution changes are made as a direct result of the planner manuallymodifying various treatment parameters such as field shapes, beam weights,beam modifiers, and dose normalization.
The 2000s saw a growing interest in intensity modulated radiation ther-apy (IMRT), a computer optimized method of delivering radiation [1] whichmodulates radiation from each field through the use of a multi-leaf collimator(MLC), permitting greater conformality and better OAR sparing. HoweverIMRT comes with its own challenges including greater susceptibility to mo-tion [2, 3], more complex dosimetry, potentially higher monitor units andtreatment time [4], increased quality assurance (QA) complexity and greatermachine wear-and-tear [5]. IMRT can cost anywhere from 1.5 to four timesthe amount of a 3D plan [6, 7, 8], and resistance from insurance companiesto reimburse for IMRT adds to the persistence of 3D conformal therapy inclinics worldwide (e.g. [9]). Some disease sites, notably prostate and head-and-neck, have moved to IMRT planning for the majority of their cases, butmany common sites such as breast and lung remain in the 3D planning realm.
Due to the manual manipulation required in 3D planning it can be time-consuming to find a desirable dose distribution. Also, once a plan is createdthere is no way of confirming whether the plan is fully optimized. By ‘fullyoptimized’ we refer to a plan where any improvement of one criteria – eg.homogeneity or OAR dose – must come at the expense of worsening anotherplanning criteria. This requirement is known as Pareto optimality. The setof Pareto optimal plans is called the Pareto surface and exploring this surfacehas become a valuable technique for IMRT planning [10, 11]. MCO for IMRTallows the planner to smoothly navigate through all the generated plans bymixing individual plan fluences, allowing for a quick exploration of possibleplans. Comparison studies of MCO and standard planning for IMRT haveshown MCO can significantly minimize the time needed to generate a plan,while producing plans preferred by the physicians [10].
Since Pareto navigation hinges on the ability to average multiple plans,IMRT (as well as intensity modulated proton therapy) is an ideal modalitysince fluence maps can be averaged, which leads to the averaging of dose dis-
2

tributions. Because common 3D conformal sites only require a small amountof intensity modulation, we hypothesized that using fluence map based MCOand a low number of segments would allow us to use the MCO-IMRT plan-ning technique to generate high quality 3D conformal plans. In this way,we get the best of the two worlds: the relative simplicity of 3D plans withthe power of numerical optimization that comes with IMRT. Empowered byan MCO Pareto surface, the planner and physician can rapidly explore dosetradeoffs. Lastly, because we are using low segments, no physical wedges,and an efficient optimizer, we reduce MUs, retain plan robustness, reducepatient treatment time and reduce the need for patient-specific QA.
2. Methods and materials
2.1. Case selection and structure definitions
Ten recently planned patients of various disease sites (breast, brain, lung,abdomen and pelvis) were selected from our institutional clinical database.These sites were chosen to show the technique across a wide range of 3Dplanned areas of the body.
The original physician-drawn target volumes and OARs as well as theoriginal dosimetrist-generated target expansion volumes were used to planand evaluate all plans. In the MCO-3D cases additional planning structureswere created to help guide the optimizer. Each MCO-3D plan containeda structure expanded from the PTV radially to the edge of the CT scanbut only 4cm superiorly and inferiorly, effectively creating a wide cylindricalvolume. This structure was termed ‘falloff’ and was used to promote doseconformality. Some MCO-3D plans used an additional 2-3cm wall expansionaround the PTV, called ‘PTVwall’, for additionally sharpening high-doseconformality.
For the breast cases, the physician-drawn targets include only the breastcontour and the seroma. For planning purposes, an artificial PTV was cre-ated by taking the breast contour and contracting it from the edge of the CTscan by 2mm. This was to prevent the optimizer from aggressively trying todeliver full dose near the patient’s skin.
For all patients we also created a structure called ‘total OAR’ which wasthe union of all the OARs, in order to evaluate the overall mean dose toOARs.
3

2.2. Planning Parameters
XiO (v4.4; Elekta, Stockholm, Sweden) was used to plan and calculateall original 3D plans. We selected recent plans from the clinical database,thus the planning strategy for the 3D conformal plans was our standardclinical procedure. RayStation (v2.5; RaySearch Laboratories, Stockholm,Sweden) was used to optimize and calculate all MCO-3D plans. The MCO-3D plans matched the original 3D plans in terms of machine (Varian orElekta), number of beams and beam geometry. The MCO-3D plans did notuse any beam modifiers (i.e. wedges), and were limited to an energy of 6MV. All MCO-3D plans followed the original 3D plan prescription dose andfractionation schemes.
Pareto surface-based MCO uses the classical optimization paradigm ofobjectives and constraints. Constraints are criteria which cannot be violatedwhile objectives are functions which are minimized or maximized subject tothe constraints. All OARS were assigned a ‘minimize the equivalent uniformdose (EUD)’ objective [12, 13]. EUD for an organ with n equi-sized voxels,each receiving di dose, is given by
EUD =
(1
n
∑i
dai
)1/a
, (1)
where a is a parameter generally chosen to be greater than or equal to 1. Ifa = 1, the EUD is the mean dose to the organ. As a is increased, the functionis weighted more heavily towards larger doses. In the limit of a → ∞, theEUD approaches the maximum dose of the organ. The EUD is a convexfunction which makes it appealing for optimization purposes. We use a = 2which is a standard approach to controlling both the mean dose and thehotspots.
For the falloff structure we use the ‘dose-falloff’ objective. This objectivepenalizes doses outside the target by specifying a desired dose falloff rate (asa function of distance to the target). Voxels which violate this dose falloffare penalized quadratically based on their deviation.
In the cases where the PTVwall structure was used, this structure wasgiven an EUD objective with an a value ranging from 20-30 to penalize highdoses. The target volume (PTV in all cases) was given both objectives andconstraints. The target objectives consisted of a minimum dose objective,which is a quadratic penalty on voxel underdosage, and a uniform dose ob-jective (the standard two-sided quadratic penalty), both at the prescription
4

dose. The target constraints included a dose-volume constraint of at least95% of the volume receiving the prescription dose as well as a minimum tar-get dose of 95% of the prescription. Lastly, a constraint was given on thefalloff volume as a max dose equal to 105% of the prescription dose. Thisserved to limit the global maximum dose of the plan.
Once the objectives and constraints are entered, RayStation computes aset of Pareto optimal plans. This begins with anchor plans, which optimizeeach objective individually, while respecting the constraints. Once all anchorplans are generated, RayStation creates plans where two or more objectivesare simultaneously optimized. These auxiliary plans help to enrich the Paretosurface for better navigation. The total number of plans computed is a user-defined parameter. In this study we used 4N plans for each Pareto surface,where N is the number of objectives defined. After navigation, RayStation’sdirect machine parameter optimization is invoked which creates a deliverableplan. In this step the system determines MLC segment shapes and weightsto best create the navigated-to dose.
2.3. Determination of number of segments
Since the IMRT module of RayStation does not support higher energiesor wedges, we opted to allow the MCO-3D plans a few additional segments toallow the MCO-3D plans to compete more fairly with the standard 3D con-formal plans, which utilize wedges, higher energies, and field-in-fields (FIFs).RayStation allows the planner to constrain the maximum number of segmentsused for the segmentation of a fluence optimized plan, and it automaticallydetermines which beams will have additional segments, with the stipulationthat each beam gets at least one segment. We determined the number ofsegments using the following:
1. One segment per unique beam angle in the original 3D plan
2. One segment per field-in-field used in the original 3D plan.
3. We add the number of fields using higher energies (HE) than 6 MV tothe number of wedges (W) used to get “HE+W”, then add additionalsegments to the MCO-3D plan based on the following.
• If the HE+W = 1-2, we add 1 additional segment
• If the HE+W = 3-5, we add 2 additional segments
• If the HE+W = 6+, we add 3 additional segments
5

2.4. Pareto surface navigation and final plan selection
Each MCO-3D plan was navigated to reduce OAR doses while meetingone of the following criteria:
• the plan met or exceeded the original 3D plan’s coverage at prescriptiondose
• 95% of the PTV volume received prescription dose (our clinical stan-dard).
After navigation and segmentation, normalization (scaling) was used to achievecoverage, if necessary.
2.5. Evaluation
Once all MCO-3D plans were completed they were evaluated for clinicalacceptability. We evaluated each plan by comparing individual OAR meandose, total OAR mean dose, MU and homogeneity indexes. The homogeneityindex (HI) is defined as:
HI =D5 −D95
Dp
where D5 is the dose to 5% of the PTV, D95 is the dose to 95% of the PTV,and Dp is the prescription dose. A perfectly homogeneous PTV dose wouldhave D5, which measures hotspots, equal to D95, which measures the coldspots. Therefore the best achievable value for HI is 0.
All dose computations were done with the in-use clinically commissionedsystems. The original 3D plans and the MCO-3D plans were exported toMimVista (Version 6.0, Cleveland, OH) for evaluation, in order to eliminateinherent differences in DVH computations by the two planning systems.
3. Results
3.1. Case descriptions
We describe each case in terms of the site, prescription, beam energiesand geometries, and techniques used in the original 3D plan. For each casewe state any significant difference between the original 3D plan and theMCO-3D plan regarding OAR sparing and homogeneity. We also indicateany significant difficulties encountered in the MCO-3D planning includinghotspots occurring outside of the PTV, dose streaking, and maintaining an
6

acceptable homogeneity index within the PTV. Dose and MU comparisondata for all cases are summarized in Table 1. We selected four of the casesto display the dose distribution and DVH comparisons. We selected these toshow a range of results (we did not select the cases which yielded the ‘best’results for the MCO-3D planning, we selected a representative set).
Brain casesCase 1 was a posterior fossa tumor prescribed to 20 Gy. A 4 field X-
shaped beam arrangement was used. The original 3D plan utilized all 10MV beams as well as four wedges and two FIFs. The only OARs drawn werethe cochleas. The MCO-3D spared both cochleas significantly more than theoriginal 3D plan and created a much steeper dose gradient outside the PTV.This OAR sparing came at the price of a reduction in homogeneity, with anHI of .07 compared to .03 for the original plan. The PTVwall structure washelpful in controlling hotspots outside the PTV volume.
Case 2 was a left parietal tumor prescribed to 60 Gy. A 5-field beamarrangement was used: four coplanar beams and one superior vertex beam.The original 3D plan used 6 MV for all coplanar beams and 10 MV forthe superior vertex beam. Three wedges were also used. The most notablesparing observed in the MCO-3D plan were in the chiasm, R. cochlea andR. optic nerve; each of their mean doses were lowered by a factor of three.There were very small increases in mean dose for the L. optic nerve and theL. cochlea. As in brain case 1, this significant OAR sparing came at theprice of a small increase in the homogeneity index, from .04 to .06. Thecomparison between the original 3D plan and the MCO-3D plan for braincase 2 is shown in Figure 1.
Breast casesCase 1 was a right sided breast to 50 Gy. This patient had a small
breast and the original 3D plan employed two open tangent 6 MV fields.The HE+W number was zero, thus the MCO-3D plan utilized only twosegments total (one segment for each field). The MCO-3D plan was able todrastically improve breast coverage at prescription dose (15% increase) whilesimultaneously reducing lung dose. Hotspots and the global maximum werekept nearly identical to the original 3D plan. The homogeneity index wasimproved from .31 to .18, due to the increase in coverage without an increasein hotspots.
Case 2 was a left sided breast, also to 50 Gy, which allowed us to testour technique with a case involving the whole heart, left ventricle and left
7

Original 3D
MCO-3D
Figure 1: Axial dose distribution and DVH comparison for brain case 2. The red arrowshighlight MCO-3D pushing low dose away from critical organs.
anterior descending (LAD) artery in addition to the lung. The original 3Dplan utilized two open tangents and two field-in-fields. 10 MV was usedon the medial side while 6 MV was used on the lateral side. The plan’sHE+W number was two, therefore we used one additional segment beyondthe original number of parent fields and FIFs, for a total of five segments.Similar to case 1, the MCO-3D demonstrated superior breast coverage whilesimultaneously lowering whole heart, left ventricle, LAD and lung dose. Onceagain, hotspots remained similar to the original 3D plan and the homogeneityindex improved from .43 to .21. The plan comparison is shown in Figure 2.
Thoracic casesCase 1, the most challenging of the ten cases, was a large lung volume with
a prescription dose of 42 Gy. The GTV was very extensive and branched intomany nodal chains throughout the thorax. The PTV volume was 957 cubiccentimeters. The original 3D plan used five coplanar fields – one anteriorand four obliques. 10 MV was used for all beams as well as four wedges.The MCO-3D reduced every OAR at the expense of a small decrease inhomogeneity. The plan comparison is shown in Figure 3.
8

Original 3D
MCO-3D
Figure 2: Axial dose distribution and DVH comparison for breast case 2.
Original 3D
MCO-3D
Figure 3: Axial dose distribution and DVH comparison for thoracic case 1. The circledregions indicate areas where MCO-3D clearly sculpts the dose distribution to conform tothe PTV.
9

Case 2 was an esophagus prescribed to 55 Gy. The original plan employeda four field posterio-lateral beam arrangement. Wedges and 10 MV beamswere used on all fields, leading to seven segments total for the MCO-3D plan.The MCO-3D lowered the mean dose of every OAR although not as signifi-cantly as in thoracic Case 1. There was no significant change in homogeneityhowever MCO-3D did encounter difficulties with high dose building up nearthe skin. A 2cm inner wall contour created from the external contour wasnecessary to help control this.
Abdomen casesCase 1 was a pancreas volume prescribed to a dose of 30 Gy. A 4-field
conformal beam arrangement was used. All beams were 15 MV and threewedges were used in the original plan. The MCO-3D plan lowered the meandose of most OARs. The small bowel and R. kidney were lowered moresignificantly while the spinal cord dose was increased. There was a smallhomogeneity index increase for the MCO-3D plan, from .06 to .07.
Case 2 was a larger pancreas volume prescribed to 45 Gy. The original3D plan used five beam angles, with 15 MV for all beams, and two wedges.The MCO-3D significantly lowered all OAR mean doses. The homogeneityindex rose from .05 to .08. Initially, some dose streaking was encountered inthe MCO-3D plan. This case successfully showed MCO-3D’s ability to treatlarger and deeper seated abdominal volumes.
Pelvis casesCase 1 was a standard four-field box prostate fossa prescribed to 64.8 Gy.
The original plan used 10 MV on all beams except the AP beam which used6 MV. The bladder and rectum were spared very well in the MCO-3D plan.Femoral head mean doses were also lower in the MCO-3D plan. Higher lat-eral entrances doses occurred with the MCO-3D plan. Homogeneity indexesremained the same as the original 3D plan. The comparison between theoriginal 3D plan and the MCO-3D plan for pelvis case 1 is shown in Figure4.
Case 2 was a three-field bladder prescribed to 39.6 Gy. The original 3Dplan used two oblique laterals and one right anterior oblique beam. 10 MVwas used for all three fields and two wedges were also used. The MCO-3Dplan was able to reduce the mean dose to all OARs, especially the femoralheads. No significant difficulties were encountered with the MCO-3D plan,however the homogeneity index increase in this plan was the greatest, from.05 to .09.
10
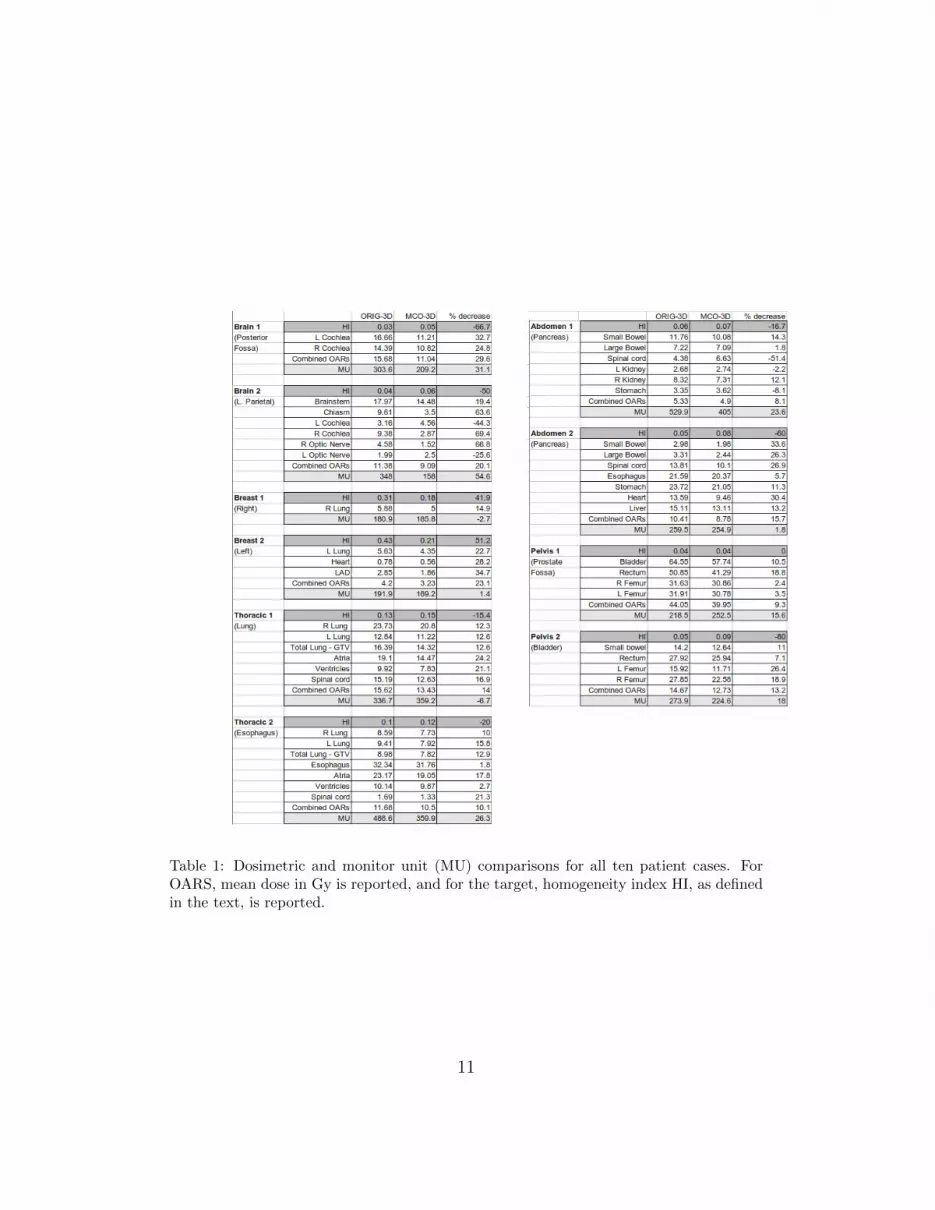
Table 1: Dosimetric and monitor unit (MU) comparisons for all ten patient cases. ForOARS, mean dose in Gy is reported, and for the target, homogeneity index HI, as definedin the text, is reported.
11

Original 3D
MCO-3D
Figure 4: Axial dose distribution and DVH comparison for pelvis case 1. The red arrowsshow that the MCO-3D plans are able to push dose out of the rectum.
3.2. Summary of plan comparisons: doses, MUs, physician preference, andplanning
In every MCO-3D plan, the majority of OAR mean doses were loweredcompared to the original 3D plan. In some cases the MCO-3D plan gave oneor two OARs a greater mean dose, however this slight increase was overcomeby lowering others OARs even more. In the cases where some OARs arelower while others are higher it can sometimes be difficult to evaluate whetherthere was an overall improvement in mean OAR dose. In order to quantifythe overall reduction of mean dose to organs, we evaluated the mean dose tothe total OAR structure. In each case the MCO-3D had a lower total OARmean dose, see Table 1.
After all the MCO-3D plans were generated they were coupled with theiroriginal 3D plan and sent back to the treating physician to ask which planthey preferred. In all ten cases the physicians selected the MCO-3D plansover the original 3D plans.
On average, fewer MUs were required by the MCO-3D plans. The averageMU of the original 3D plans was 313 while the average MU of the MCO-3Dplans was 259, a 17% decrease. This finding defeats the long held belief thatinverse planning necessarily produces greater MUs than forward 3D planning:it depends on the number of segments being used. The brain cases had the
12

most significant total reduction in MU, with a combined total of 284 fewerMUs for MCO-3D. The least change in MU were in the breast cases.
Treatment planning times for our MCO-3D plans were similar to tradi-tional 3D planning (although the bulk of the MCO-3D planning time wasused in computing Pareto surfaces, a process which has been improved inlater versions of RayStation, with more increases expected by moving to adistributed computing environment [14]). The use of higher energy beams inMCO-3D will also help the planning time by alleviating dose streaking andimproving homogeneity.
4. Discussion and Conclusions
Photon treatments are typically classified as either 3D conformal plansor IMRT plans. It is more useful for understanding treatment plan opti-mization to think of these modalities as lying along a continuous span oftreatment possibilities, from simple to complex [15]. Although somewhatcounterintuitive, IMRT treatment planning is sometimes easier than 3D con-formal since numerical optimization can be used to find optimal solutions,and planning software and computation power have improved dramaticallysince the early days of IMRT. Considering this, we speculated that if IMRToptimization was used – in particular MCO – we might be able to derivegood 3D solutions from the selected IMRT plan if that plan would naturallynot require too much intensity modulation. For example, IMRT optimizationapplied to a spherical tumor might yield relatively flat beam profiles whichcould then be delivered with open 3D conformal fields. In the ten cases weexamined, using the IMRT optimizer to produce 3D plans led to significantOAR sparing at the cost of a small decrease in target homogeneity, and thetreating physicians unanimously preferred the MCO-3D plans to the original3D plans.
A single treatment planning system used for both 3D conformal planningand IMRT planning would be beneficial from a training and quality assur-ance perspective. Fewer systems means an overall operation that is easier tomonitor and less prone to error [16, 17].
While this is not the place for a full discussion of the insurance andbilling differences between 3D and IMRT, which is related to the historicaldifficulty of planning and delivering IMRT and the fact that IMRT plans aretypically quality assured (QAed) by measuring the plan dose on a phantomwhile 3D plans are not, we suggest that clinics who adopt the MCO-3D
13
method presented herein discuss considering such plans as 3D. Our view onthis issue is that since there is a spectrum of plan complexity between 3Dconformal and IMRT, this spectrum should be realized more fully in theclinic: a plan should be as complex as necessary to achieve a desired levelof dose quality. QA procedures should be standardized, and should take theform of independent software – such as a Monte Carlo system – in order toautomatically verify all plans [18, 19], thus eliminating the QA distinctionbetween 3D and IMRT plans.
In modern clinics, IMRT has become the clinical standard for sites whichmost strongly benefit from being able to shape the dose distribution to avoidnearby OARs. However, all sites could benefit from some intensity mod-ulation, which is why 3D conformal therapy has evolved to include FIFs,wedges and higher energies. These advanced technologies provide dose con-trol similar to IMRT [20]. For all of the sites studied in this paper, IMRThas been explored [9, 21, 22, 23] and is often used, but 3D remains a com-mon modality for treatment. One likely reason for this is that IMRT mayoften seem overly complex, more costly and less efficient for the treatmentgoals in mind. Our technique on the other hand depends on the idea that alittle intensity modulation goes a long way, as brought to light by the manystudies which point out the vastly diminishing returns one gets from addingmore complexity (larger MU and more segments) to a plan [24, 25, 26, 27].Our planning method allows the customizeability and dosimetric benefits ofMCO-IMRT with the simple and robust delivery of 3D conformal therapy.
Acknowledgment: The authors thank Tarek Halabi, Thomas Bortfeld,and Stephen Zieminski for their valuable input during the preparation ofthis manuscript.
References
[1] S. Webb, The physical basis of IMRT and inverse planning, BritishJournal of Radiology 76 (2003) 678–689.
[2] C. Coolens, P. Evans, J. Seco, S. Webb, J. Blackall, E. Rietzel, G. Chen,The susceptibility of IMRT dose distributions to intrafraction organ
14

motion: An investigation into smoothing filters derived from four di-mensional computed tomography data, International Journal of MedicalPhysics and Research and Practice 33 (2006) 2809.
[3] D. Gierga, G. Chen, J. Kung, M. Betke, J. Lombardi, C. Willett, Quan-tification of respiration-induced abdominal tumor motion and its impacton IMRT dose distributions, Int. J. Radiation Oncology Biol. Phys. 58(2004) 1584–1595.
[4] J. Ruben, S. Davis, C. Evans, P. Jones, F. Gagliardi, M. Haynes,A. Hunter, The effect of intensity-modulated radiotherapy on radiation-induced second malignancies, Int. J. Radiation Oncology Biol. Phys. 70(2008) 1530–1536.
[5] J. Sutton, D. Kabiru, M. Neu, L. Turner, P. Balter, M. Palmer, Definebaseline levels of segments per beam for intensity-modulated radiationtherapy delivery for brain, head and neck, thoracic, abdominal, andprostate applications, Medical Dosimetry 37 (2012) 15–19.
[6] P. Nguyen, X. Gu, S. Lipsitz, T. Choueiri, W. Choi, Y. Lei, K. Hoffman,J. Hu, Cost implications of the rapid adoption of newer technologies fortreating prostate cancer, Journal of Clinical Oncology 29 (12) (2011)1517–1524.
[7] J. Strauss, S. Chen, A. Dickler, K. Griem, Cost effectiveness of wholebreast imrt for reduction of moist desquamation, J Clin Oncol 25 (2007)17004.
[8] S. Pearson, J. Ladapo, L. Prosser, Intensity modulated radiation therapy(imrt) for localized prostate cancer, Institute for Clinical and EconomicReview.
[9] B. Smith, I. Pan, Y. Shih, G. Smith, J. Harris, R. Punglia, L. Pierce,R. Jagsi, J. Hayman, S. Giordano, et al., Adoption of intensity-modulated radiation therapy for breast cancer in the united states, Jour-nal of the National Cancer Institute 103 (10) (2011) 798–809.
[10] D. Craft, T. Hong, H. Shih, T. Bortfeld, Improved planning time andplan quality through multicriteria optimization for intensity-modulatedradiotherapy, Int. J. Radiation Oncology Biol. Phys. 82 (1) (2012) e83–90.
15

[11] A. Fredriksson, R. Bokrantz, Deliverable navigation for multicriteriaintensity-modulated radiation therapy planning by combining sharedand individual apertures, Tech. rep., TRITA-MAT-2013-OS4, Depart-ment of Mathematics, Royal Institute of Technology, Stockholm, Sweden(2013).
[12] A. Niemierko, A generalized concept of equivalent uniform dose, MedicalPhysics 26 (1999) 1100.
[13] Q. Wu, D. Djajaputra, H. Liu, L. Dong, R. Mohan, Y. Wu, Dose sculpt-ing with generalized equivalent uniform dose, Medical Physics 32 (5)(2005) 1387–1396.
[14] R. Bokrantz, Distributed approximation of Pareto surfaces in multicri-teria radiation therapy treatment planning, Physics in Medicine andBiology 58 (11) (2013) 3501.
[15] B. Meng, L. Zhu, B. Widrow, S. Boyd, L. Xing, A unified frameworkfor 3D radiation therapy and IMRT planning: plan optimization in thebeamlet domain by constraining or regularizing the fluence map varia-tions, Physics in Medicine and Biology 55 (22) (2010) N521.
[16] T. Nolan, System changes to improve patient safety, British MedicalJournal 320 (7237) (2000) 771.
[17] N. Leveson, N. Dulac, K. Marais, J. Carroll, Moving beyond normal ac-cidents and high reliability organizations: a systems approach to safetyin complex systems, Organization Studies 30 (2-3) (2009) 227–249.
[18] W. Luo, J. Li, L. Price Jr, R.and Chen, J. Yang, J. Fan, Z. Chen,S. McNeeley, X. Xu, C.-M. Ma, Monte carlo based IMRT dose verifi-cation using mlc log files and R/V outputs, Medical physics 33 (2006)2557.
[19] A. Leal, F. Sanchez-Doblado, R. Arrans, J. Rosello, E. Pavon, J. La-gares, Routine IMRT verification by means of an automated monte carlosimulation system, International Journal of Radiation Oncology* Biol-ogy* Physics 56 (1) (2003) 58–68.
16

[20] B. Smith, I. Pan, Y. Shih, G. Smith, J. Harris, R. Punglia, L. Pierce,R. Jagsi, J. Hayman, S. Giordano, T. Buchholz, Adoption of intensity-modulation radiation therapy for breast cancer in the United States,Jounrnal of the National Cancer Institute 103 (2011) 798–809.
[21] L. Fenkell, I. Kaminsky, S. Breen, S. Huang, M. Van Prooijen,J. Ringash, Dosimetric comparison of IMRT vs. 3d conformal radiother-apy in the treatment of cancer of the cervical esophagus, Radiotherapyand Oncology 89 (3) (2008) 287–291.
[22] L. Muren, R. Smaaland, O. Dahl, Conformal radiotherapy of urinarybladder cancer, Radiotherapy and Oncology 73 (3) (2004) 387–398.
[23] U. Hermanto, E. K. Frija, M. J. Lii, E. L. Chang, A. Mahajan, S. Y.Woo, Intensity-modulated radiotherapy (IMRT) and conventional three-dimensional conformal radiotherapy for high-grade gliomas: does IMRTincrease the integral dose to normal brain?, Int. J. Radiation OncologyBiol. Phys. 67 (4) (2007) 1135–1144.
[24] D. Craft, P. Suss, T. Bortfeld, The tradeoff between treatment planquality and required number of monitor units in IMRT, Int. J. RadiationOncology Biol. Phys. 67 (5) (2007) 1596–1605.
[25] X. Sun, P. Xia, A new smoothing procedure to reduce delivery segmentsfor static MLC-based IMRT planning, Medical Physics 31 (5) (2004)1158–1165.
[26] S. Webb, D. Convery, P. Evans, Inverse planning with constraints togenerate smoothed intensity-modulated beams, Physics in Medicine andBiology 43 (1998) 2785–2794.
[27] M. Alber, F. Nusslin, Intensity modulated photon beams subject to aminimal surface smoothing constraint, Physics in Medicine and Biology45 (2000) N49–N52.
17


