Embed Size (px)
Citation preview

3D reconstruction of soccer sequences using non-calibrated video cameras
Sébastien Mavromatis1, Paulo Dias2, Jean Sequeira1, 1 LSIS Laboratory LXAO Group, University of Marseilles, France
2 University of Aveiro / IEETA - Portugal
Abstract. We present a global approach that enables the production of 3D soccer sequences from non-calibrated video cameras. Our system can produce a 3D animated model of the scene from a single non-calibrated moving camera (a TV sequence for example). The results presented here are very encouraging even with a single camera approach and will probably improve with the future introduction of multiple images that will help resolving occlusion issues and integrating into a single model information coming from various locations on the field. The key point of our approach is that it doesn’t need any camera calibration and it still works when the camera parameters vary along the process. Details on the registration and tracking processes are given as well as the description of the “Virtual Reality” system used for displaying the resulting animated model.
Keywords: SimulFoot project, colour image processing, tracking, virtual reality, 3D reconstruction.
1 Introduction
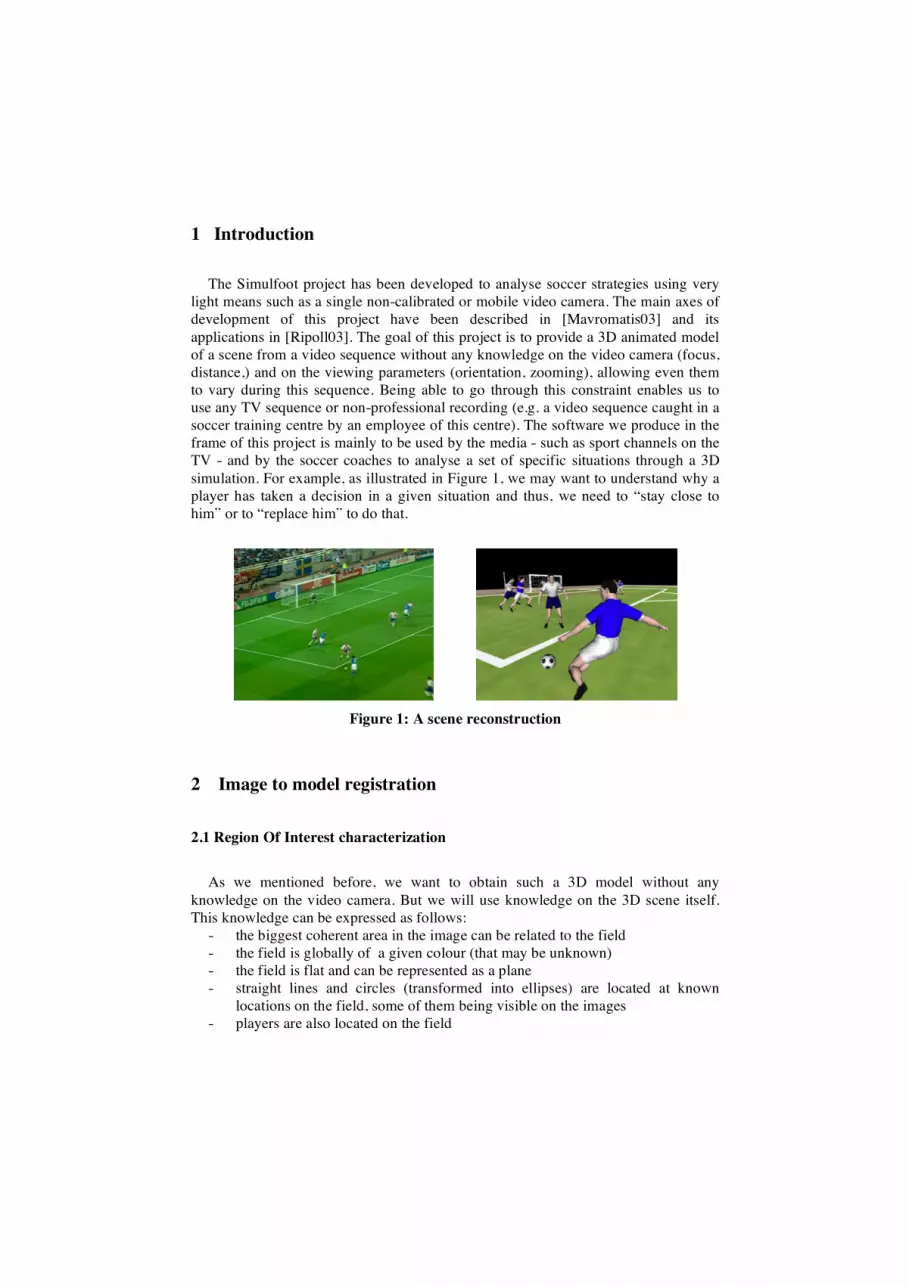
The Simulfoot project has been developed to analyse soccer strategies using very light means such as a single non-calibrated or mobile video camera. The main axes of development of this project have been described in [Mavromatis03] and its applications in [Ripoll03]. The goal of this project is to provide a 3D animated model of a scene from a video sequence without any knowledge on the video camera (focus, distance,) and on the viewing parameters (orientation, zooming), allowing even them to vary during this sequence. Being able to go through this constraint enables us to use any TV sequence or non-professional recording (e.g. a video sequence caught in a soccer training centre by an employee of this centre). The software we produce in the frame of this project is mainly to be used by the media - such as sport channels on the TV - and by the soccer coaches to analyse a set of specific situations through a 3D simulation. For example, as illustrated in Figure 1, we may want to understand why a player has taken a decision in a given situation and thus, we need to “stay close to him” or to “replace him” to do that.
Figure 1: A scene reconstruction
2 Image to model registration
2.1 Region Of Interest characterization
As we mentioned before, we want to obtain such a 3D model without any
knowledge on the video camera. But we will use knowledge on the 3D scene itself. This knowledge can be expressed as follows:
- the biggest coherent area in the image can be related to the field - the field is globally of a given colour (that may be unknown) - the field is flat and can be represented as a plane - straight lines and circles (transformed into ellipses) are located at known
locations on the field, some of them being visible on the images - players are also located on the field

The first task is to find precisely where the field is. This is done through a segmentation based on colorimetric and spatial criteria that has been described in previous publications ([LeTroter04]). But let us give the main steps of this process:
- we first analyse the distribution of the pixels in the HLS colour space and we provide a segmentation of this space (this is done by an original algorithm described in the referred paper that maintains a colour coherence criterion even when there are strong colour variations);
- keeping the pixels that belong to the selected area in the HLS colour space produce a binary image and then, by using a set of morphological operations, we obtain the field area in the image.
On the right image of Figure 2 we show in red the border of this area and the outer
part of the field is darkened.
Figure 2: Automatic field detection
2.2 Landmarks Detection
The next step consists in finding relevant elements within the detected “Region of Interest”. These relevant elements are the lines drawn on the field. They will help us in solving two problems that are:
- the characterization of the part of the field captured by the camera - the image to model registration There are straight lines and circles at given locations. The parallel straight lines
(drawn on the field) are transformed into a set of straight lines (in the image) that converge at a single point and are sorted in the same way. Circles and circle arcs (drawn on the field) are transformed into ellipses and ellipse arcs (in the image). Logical relations between these components are conserved through the transformation that produces the image, and thus, they help us in finding which field area (left part of the field, middle-left, middle – as shown on the next picture) is on the image. For example, on the left picture of Figure 3, we find an ellipse arc that is on the right art of the picture, whose extremities are on the left and connected to a main line: this gives us the global situation (view of the left part of the field, just in front of the goalkeeper area).

Figure 3: Automatic landmarks detection
These lines (straight lines and ellipses) are obtained by using robust algorithms specifically designed for this problem, derived from the Hough Transform. They are described in [LeTroter05].
2.3 Registration
Once we know which part of the field is captured by the video camera, we know precisely which are the landmarks that may be detected in this image and how they are spatially structured. In fact, we do not look for landmarks as points but we consider the intersection of the different lines that have been detected.
The transformation that sets the correspondence between the points of the image
and the points of the model is an homographic transformation that is represented by a “3 by 3” matrix in the homogeneous space (because the field is a 2D space as well as the image). Four points (landmarks) are required to characterize this transformation as Mundy demonstrated in [Mundy92]. We show in Figure 4 the result of this registration process on the three images used before as an illustration.
Figure 4: Camera calibration

To achieve our model we do not need a complete 3D information because most of its elements are 2D and the only ones that are true 3D are referenced to 2D positions (their feet location on the field). This property is valid in most situations (it may be invalidated when a player is jumping, or when studying the path of the ball in the air). Thus, we can determine the player position in the model, only by knowing its position in the image (because we know the homographic transformation that enables to go from one to the other).
The tracking algorithm that is to be used here is not so obvious due to the general
frame in which we study this problem: the video camera is a non-calibrated one and it can move, rotate, zoom, … In addition, if we consider a TV video sequence, camera changes may occur.
On the other hand, this first step (“Region of Interest” characterization, line
detection and “Image to Model” registration) carries out interesting information that is a rough determination of the player position. In fact, once we have detected the “Region of Interest”, we can consider the pixels of this region whose value does not belong to the selected area in the HLS colour space (e.g. the pixels that are not green in the previous example, see Figure 5). These pixels can be:
- points that belong to the characteristic lines - points that belong to players - points that belong to the ball - noise.
Figure 5: Pixels in the Region of Interest
Characteristic lines have been detected and can be filled. The ball and the noise do
not lay, locally, on many pixels. It is then possible, by using morphological operations, to keep only the main blobs location as an initialisation situation to start the player detection and tracking.
Now, let us go through a detailed description of the method we have developed to
perform this tracking process.

3 Tracking of players
Tracking of objects in images is a complex task: players move quickly, their silhouettes are submitted to large variations, and occlusions occur frequently. Template matching was already used for tracking in soccer games in [Taki96], its main limitation is the inability to cope with occlusions. To solve this problem, Kalmann filtering is often applied to predict players’ movements as in [NeadHam01]. In our work, we use a method similar to the one in [Figueroa06], based on a previous segmentation (in our case coming from the previous color analysis) we detect blobs that can represent a group of connected players. The images are analysed along the sequence to keep the blob information updated, and erosion is applied to blobs with multiple players to extract singe player position.
3.1 Blob detection using mask from colour analysis
Our tracking algorithm starts by applying a Canny Edge Detector [Canny86] to the images. The edges are then filtered with the masks coming from the colour image analysis presented in section 2. With these two steps we obtain a binary image in which the remaining pixels have a high probability to belong to players. To increase the robustness of the algorithm and compensate for colour analysis errors, our algorithm also prevents players that are not in the border of the images to disappear. This is done by comparing positions of blobs in the previous image with the colour analysis mask. If no mask exists in the surroundings of a blob previously detected, then the area around its previous position is also marked as interest. With this additional processing, our algorithm does not loose a player even if the colour image analysis misses a mask in a couple of images. After the filtering, a connected component algorithm is applied to the filtered binary image in order to detect all the single blobs in the image.
The whole procedure is presented in Figure 6 with one of our test sequence.
Figure 6: Blob detection procedure
New Image
Mask from colour analysis
Location of previous blobs
Edges
Canny
Filtering
Detected Blobs

3.2 Blob analysis along sequence
Once the main blobs are detected, we perform an analysis to follow the movements of the players along the sequence. We are interested in merging (two or more players merging in the same blob) or splitting of players (players in the same blobs that splits into several blobs in the new images). The analysis we apply is in many aspects similar to the one from [Figueroa06], but in a more complex situation since we use moving cameras making the whole tracking procedure much more.
The blob analysis consists in detecting blobs “touching” each other over two
consecutive images (by touching we mean at least one common pixel) and uses this information to follow the movement of players between blobs. The cases we consider in our analysis are summarized in Table 1 (between brackets is the number of players in the blob).
Blobs in previous image
Nº of blobs in contact with blob in
new image Behaviour of the algorithm
1 (n players) 1 blob One to one correspondances. New blob replaces old blob with the same players.
1 (1) 2 blobs or more The new blob with the minimum Euclidean distance to the centre of the old blob is selected, the others are not considered.
1 (2 players) 1 (3players)
2 blobs 3 blobs
The blob is split in two/three blobs. The association between blob and players is done using Euclidean distances to centre.
1 (3 players) 2 blobs The blob with larger area keeps two players, the other only one. Association between blobs and players is done using Euclidean distance
1 (above 4 players) Stop and ask for user interaction
Table 1: Blob analysis splitting scenarios considered in our algorith
Besides the blob splitting scenarios presented in Table 1, our algorithm also copes with the merging of players. The algorithm simply checks before adding any new blob to the list of current blobs in the image under analysis if the blob is already in the list. If so, instead of adding a new blob, the blob is maintained and the number of players of the blob is updated with the new number of players.
The algorithm is already very reliable in the case of few occlusions between
players. Situations of many players occluding (meaning many players in the same blob) are much more difficult to resolve, and our current option to avoid error is to stop the algorithm when the number of players in a blob splitting is above 4. To improve the algorithm we plan to allow for the use of images from multiple viewpoints in order to remove doubts when many players are occluding, in effect in this case another viewpoint can fall into a well known situation (few players in blob) and solve the tracking without need of user interaction.
n n
1 1
2 1
1
3 2
1

As it is the algorithm is already very reliable when they are few occlusions between players. Situations of many players occluding (meaning many players in the same blob) are much more difficult to resolve, and our actual option to avoid error is to stop the algorithm when the number of players in a blob splitting is above 4. To improve the algorithm we plan to allow for the use of images from multiple viewpoint in order to remove doubts in situation of many players occluding, in effect in this situation another viewpoint can fall into a well known situation (few players in blob) and solve the tracking without need of user interaction.
3.3 Extraction of player position and foot position
The blob analysis allows tracing the movement of players between blobs, but it does not give any information about player position. To evaluate the player position, and in particular foot’s position, which is the information necessary to find out its 3D position from the 3D calibration presented in section 3, we need further processing. We distinguish the two following cases:
1- Blobs corresponding to with one player: the player centre is computed as the
centre of gravity of the blob using the contour pixels. The foot position is then computed as the lower pixel of the players contour with the same X coordinate as the centre of gravity.
2- Blobs with more than one player: in this situation, iterative erosion is applied to
the whole blob until the number of resulting connected components is equal to the number of players (see Figure 7). The maximum number of iterations is limited to 10 to stop dilation when the number of desired contours is not achieved. The contours are then sorted according to the area (number of pixels), and the player position is associated to each one of the eroded regions as the centre of gravity, Euclidean distance between the region centre and players’ position is used to keep trace of players along images. If the number of erodes regions is inferior to the number of players, the technique is used for the eroded regions, and the remaining players are associated to the region having the larger area. This is based on the idea that these situations correspond to players that are occluding each other and thus will have approximately the same centre. In this situation, the foot position is computed from the players’ centre using a pre-defined threshold corresponding to the height in pixels of the players in the sequences.
Figure 7: Initial, eroded edges, and centre/foot position in video image

Our technique, once more, is reliable in the case of single blob – single player. In the case of occlusions, the results are more likely to have some errors due to variations in mask that will modify the results of the erosion, resulting in a jittering of a few pixels. We plan in the future to use the 3D location as feedback information to help a better player location in situations of occlusion as well as to filter the 3D trajectory to ensure continuity.
3.4 Results and user interaction
Our algorithm was applied to different sequences. The first one is a sequence acquired within the project only with two players and no crossing of the players. In this case, after the initialisation of the algorithm, no further interaction of the user was necessary and the tracking was performed automatically along the sequence (see right image of Figure 8).
The algorithm was also applied to a more complex sequence (left image of Figure
8) coming from a real match with around 15 players in average and several crossings and occlusions. In this case, after the initialisation of the algorithm, the tracking was correctly done along 149 images (corresponding to a continuous video stream of approximately 5 seconds with slight right/left movements of the camera) with 8 interaction of the user to correct bad entering in the sequences (the current algorithm only cope with single blob, single player in entry) and splitting of blobs with more than 4 players.
Figure 8: Tracking results in two sequences. On the left corner are the number
of blobs and number of players in the current image are displayed.
Besides the possibility to correct the tracking at each frame by clicking on the
image to add or remove players, the tracking information of each frame is saved in order to allow an historical navigation: the user can go back and forward in the previous frames, looking at the results and correcting bad detections to ensure a reliable detection of players position. This guarantees a good tracking even in more complex situations, allowing a fast and easy correction through manual interaction.

Figure 9: GUI Interface for user interaction, the arrows close to the current
image allow historical navigation.
Regarding the software, most of the image processing tasks were done using using the OpenCV library [OpenCV] and the interface was based on GLUI.
4 3D Visualization in a Virtual Reality system
Another goal of our project is to provide attractive views of the reconstructed 3D football sequences. To increase realism, we use a virtual reality set-up available at University of Aveiro to allow users to see the game as if they were a player. The used environment is based on relatively low-cost hardware: a 3D Head Mounted Display (HMD) from I-glasses equipped with an inertial tracker intertrax II from Intersense that (3 Degrees of Freedom). The 3D environment (football field, goals, etc…) was modelled using the Visualization Toolkit [Schroeder98]. This toolkit also gives us an easy way to update camera positions and map the tracker orientation to the camera. Currently the players are represented as simple prisms and their positions in the field are mapped according to the 3D position obtained from the tracking and the 3D calibration procedure.
The final demo is presented in Figure 10. The user (left) is placed in the same
position as a player of its choice. The movements of the user’s head are mapped to the camera as if he/she was moving his/her head in the virtual world giving. The user can select the player through the keyboard. It is also possible to have a view up of the field as presented in Figure 10 (c). In this latter image, we used the data coming from one of our test sequences that has been through the whole procedure: colour analysis, 2D 3D calibrations, tracking and finally visualization.
Figure 10: User in Virtual Reality set-up (a),
viewpoint of a player (b) and view up of the field(c).

5 Conclusion
The main advantage of the system we have presented is that it permits to create a 3D animated model of a soccer game from any uncalibrated video sequence. It is robust and reliable until the number of players who are gathered at a given location in the image is not larger than four. We also provide a simple but yet powerful interface to correct tracking errors and provide additional information when necessary, making it possible to have good results even in more complicated scenes. Our goal, now, is to improve the performance of the algorithms by solving more critic situations as when there are too many players. Solutions to this problem should be found by using cooperative processes with a multi-camera system. Another possible improvement is related to the simple models used in the 3D representation. We plan in the future to replace the prisms by more realistic animated 3d models with several poses, like running, walking and stop depending on their speed and providing a much more appealing simulation for the user.
Acknowledgments
The authors wish to thank the Luso-French action F35/06 that made possible the cooperation between the two laboratories involved in this project. Paulo Dias also wishes to thank Gustavo Corrente and Ana Cantanhede for their contribution in the development of the virtual reality visualization software.
References
[Canny86] J.F. Canny. “A computational Approach to Edge Detection”, In IEEE Transactions on Pattern Analysis and Machine Intelligence, Vol. PAMI-8, no.6. pp. 679-698,1986.
[Figueroa06] P.J. Figueroa, N.J. Leite, R.M.L. Barros. “Tracking soccer players aiming their kinematical motion analysis”, In Computer Vision and Image Understanding Volume 101, Issue 2 , February 2006, Pages 122-135.
[LeTroter04] A. Le Troter, S. Mavromatis, J. Sequeira. "Soccer field detection in video images using color and spatial coherence", In ICIAR 2004, Porto, Portugal.
[LeTroter05] A. Le Troter, R. Bulot, J-M. Boi, J. Sequeira. "Arc of ellipse detection for video image registration". In SiPS 2005, Athens, Greece, November 2005.
[Mavromatis03] S. Mavromatis, J. Baratgin, J. Sequeira, "Analyzing team sport strategies by means of graphical simulation", In ICISP 2003, Agadir, Morroco.
[Mundy92] J. Mundy,A. Zisserman. Geometric Invariance in Computer Vision. MIT Press, Cambridge, Massachusetts, 1992.
[Needham01] C.J. Needman, R.D. Boyle, Tracking multiple sport players through occlusion, congestion and scale, in: British Machine Vision Conference, 2001, pp. 93–102.
[OpenCV] Intel corporation, open Source Computer Vision Library. http://intel.com/research/mrl/research/opencv.
[Ripoll03] H. Ripoll, C. Aubert, S. Mavromatis. "Mechanisms involved in the change of point of view into a 3d-image simulation in sport". In FEPSAC, Copenhague, 2003.

[Schroeder98] Schroeder W. et al., The Visualization Toolkit - An Object Oriented Approach to 3D Graphics. 2nd ed., Prentice Hall, (1998).
[Taki96] T. Taki, J. Hasegawa, T. Fukumura, Development of motion analysis system for quantitative evaluation of team work in soccer game, in: Proc. Internat. Conf. on Image Processing, 1996, pp.815–818.