Embed Size (px)
Citation preview

3rd
Stage Seed-Cotton Cleaning System Total
Particulate Emission Factors and Rates for Cotton
Gins
Part of the National Characterization of Cotton Gin Particulate Matter
Emissions Project
Final Report: OSU12-32 Ver. 2.0
December 2012 (Revised June 2013)
Submitted to: San Joaquin Valley Air Pollution Study Agency
Cotton Incorporated
Cotton Foundation
National Cotton Ginners Association
Southern Cotton Ginners Association
Southeastern Cotton Ginners Association
California Cotton Growers and Ginners Association
Texas Cotton Ginners Association
Submitted by: Dr. Michael Buser
Department of Biosystems and Agricultural
Engineering
214 Agricultural Hall
Stillwater, OK 74078
Dr. Derek Whitelock
Southwestern Cotton Ginning Research
Laboratory
USDA Agricultural Research Service
300 E College Dr.
Mesilla Park, NM 88047
Mr. J. Clif Boykin
Cotton Ginning Research Unit
USDA Agricultural Research Service
111 Experiment Station Road
Stoneville, MS 38776
Dr. Greg Holt
Cotton Production and Processing Research
Unit
USDA Agricultural Research Service
1604 East FM 1294
Lubbock, TX 79403
Michael Buser, Ph.D. Biosystems and Agricultural Engineering Oklahoma State University 214 Agricultural Hall Stillwater, OK 74078 (405) 744-5288 – Phone (405) 744-6059 – Fax [email protected]

Acknowledgments:
Funding Sources: California Cotton Growers and Ginners Association
Cotton Foundation
Cotton Incorporated
Oklahoma State University
San Joaquin Valley Air Pollution Study Agency
Southeastern Cotton Ginners Association
Southern Cotton Ginners Association
Texas Cotton Ginners Association
Texas State Support Group
USDA Agricultural Research Service
Air Quality Advisory Group: California Air Resources Board
Missouri Department of Natural Resources
North Carolina Department of Natural Resources
San Joaquin Valley Air Pollution Control District
Texas A&M University Biological and Agricultural Engineering Department
Texas Commission on Environmental Quality
US Environmental Protection Agency – Air Quality Analysis Group
US Environmental Protection Agency – Air Quality Modeling Group
US Environmental Protection Agency – Office of Air Quality Planning and Standards
US Environmental Protection Agency – Process Modeling Research Branch, Human Exposure
and Atmospheric Sciences Division
US Environment Protection Agency Region 4
US Environment Protection Agency Region 9
USDA NRCS National Air Quality and Atmospheric Change Team
Cotton Gin Advisory Group: California Cotton Ginners and Growers Association
Cotton Incorporated
National Cotton Council
National Cotton Ginners Association
Southeastern Cotton Ginners Association
Southern Cotton Ginners Association
Texas Cotton Ginners Association
Texas A&M University Biological and Agricultural Engineering Department

ABSTRACT
This report is part of a project to characterize cotton gin emissions from the standpoint of
stack sampling. The impetus behind this project was the urgent need to collect additional cotton
gin emissions data to address current regulatory issues. A key component of this study was
focused on EPA total particulate emission factors. EPA AP-42 emission factors are generally
assigned a rating, from A (Excellent) to E (Poor), to assess the quality of the data being
referenced. Current EPA total particulate emission factor ratings for cotton gins are extremely
low. Cotton gin data received these low ratings because the data was collected almost
exclusively from a single geographical region. The objective of this study was to collect
additional total particulate emission factor data for 3rd
stage seed-cotton cleaning systems from
cotton gins located in regions across the cotton belt based on the EPA-approved stack sampling
methodology. The project plan included sampling seven cotton gins across the cotton belt. Key
factors for selecting specific cotton gins included: 1) facility location, 2) production capacity, 3)
processing systems and 4) abatement technologies. Two of the seven gins were equipped with 3rd
stage seed-cotton cleaning systems. In terms of capacity, the two gins were typical of the
industry, averaging 21.0 bales/h during testing. The average 3rd
stage seed-cotton cleaning
system total particulate emission factor based on two tests (6 total test runs) was 0.023 kg/227-kg
bale (0.052 lb/500-lb bale). The 3rd
stage seed-cotton cleaning system test average emission rates
ranged from 0.27 to 0.75 kg/h (0.59-1.66 lb/h). The system average total particulate emission
factor was less than that currently published in EPA AP-42.
INTRODUCTION
U.S. Environmental Protection Agency (EPA) emission factors published in EPA’s
Compilation of Air Pollution Emission Factors, AP-42 (EPA, 1996b) are assigned a rating that is
used to assess the quality of the data being referenced. The ratings can range from A (Excellent)
to E (Poor). Current EPA emission factor quality ratings for total particulate matter (PM) from
cotton gins are extremely low. Cotton gin data received these low ratings because they were
collected almost exclusively from a single geographical region (EPA, 1996a). Cotton ginners’
associations across the cotton belt, including the National, Texas, Southern, Southeastern, and
California associations, agreed that there was an urgent need to collect additional cotton gin
emissions data to address current regulatory issues. Working with the cotton ginning associations
Page 1 of 48

across the country and state and federal regulatory agencies, Oklahoma State University and
USDA-Agricultural Research Service (ARS) researchers developed a proposal and sampling
plan that was initiated in 2008 to address this need for additional data. This report is part of a
series that details cotton gin emissions measured by stack sampling. Each manuscript in the
series addresses a specific cotton ginning system. The systems covered in the series include:
unloading, 1st stage seed-cotton cleaning, 2
nd stage seed-cotton cleaning, 3
rd stage seed-cotton
cleaning, overflow, 1st stage lint cleaning, 2
nd stage lint cleaning, combined lint cleaning, cyclone
robber, 1st stage mote, 2
nd stage mote, combined mote, mote cyclone robber, mote cleaner, mote
trash, battery condenser and master trash. This report focuses on total particulate emissions from
3rd
stage seed-cotton cleaning systems.
The 1996 EPA AP-42 average emission factor for the No. 3 dryer and cleaner was 0.043
kg (0.095 lb) per 217-kg [480-lb] equivalent bale with a range of 0.041 to 0.045 kg (0.091-0.099
lb) per bale (EPA, 1996a, 1996b). This average and range was based on two tests conducted in
one geographical location. The EPA emission factor quality rating was D, which is the second
lowest possible rating (EPA, 1996a).
Seed cotton is a perishable commodity that has no real value until the fiber and seed are
separated (Wakelyn et al., 2005). Cotton must first be processed or ginned at the cotton gin to
separate the fiber and seed, producing 227-kg (500-lb) bales of marketable cotton fiber. Cotton
ginning is considered an agricultural process and an extension of the harvest by several federal
and state agencies (Wakelyn et al., 2005). Although the main function of the cotton gin is to
remove the lint fiber from the seed, many other processes also occur during ginning, such as
cleaning, drying, and packaging the lint. Pneumatic conveying systems are the primary method
of material handling in the cotton gin. As material reaches a processing point, the conveying air
is separated and emitted outside the gin through a pollution control device. The amount of dust
emitted by a system varies with the process and the condition of the material in the process.
Cotton ginning is a seasonal industry with the ginning season lasting from 75 to 120 days,
depending on the size and condition of the crop. Although the trend for U.S. cotton production
remained generally flat at about 17 million bales per year during the last 20 years, production
from one year to the next often varied greatly for various reasons, including climate and market
pressure (Fig. 1). The number of active gins in the U.S. has not remained constant, steadily
declining to fewer than 700 in 2011. Consequently, the average volume of cotton handled by
Page 2 of 48

each gin has risen and gin capacity has increased to an average of about 25 bales per hour across
the U.S. cotton belt (Valco et al., 2003, 2006, 2009, 2012).
Typical cotton gin layout includes: unloading system, dryers, seed-cotton cleaners, gin
stands, overflow collector, lint cleaners, battery condenser, bale packaging system, and trash
handling systems (Fig. 2); however, the number and type of machines and processes can vary.
Each of these systems serves a unique function with the ultimate goal of “ginning” the cotton to
produce a marketable product. Raw seed cotton harvested from the field is compacted into large
units called “modules” for delivery to the gin. The unloading system removes seed cotton either
mechanically or pneumatically from the module feed system and conveys the seed cotton to the
seed-cotton cleaning systems. Seed-cotton cleaning systems dry the seed cotton and remove
foreign matter prior to ginning. Ginning systems also remove foreign matter and separate the
cotton fiber from the seed. Lint cleaning systems further clean the cotton lint after ginning. The
battery condenser and packaging systems combine lint from the lint cleaning systems and
compress the lint into dense bales for easy transport. Gin systems produce some type of by-
product or trash, such as rocks, soil, sticks, hulls, leaf material, and short or tangled immature
fiber (motes), as a result of processing the seed cotton or lint. These streams of by-products must
be removed from the machinery and handled by trash collection systems. These trash systems
Figure 1. Annual U.S. cotton production, active U.S. gins, and average ginning volume (bales per gin)
(NASS, 1993-2012).
Page 3 of 48
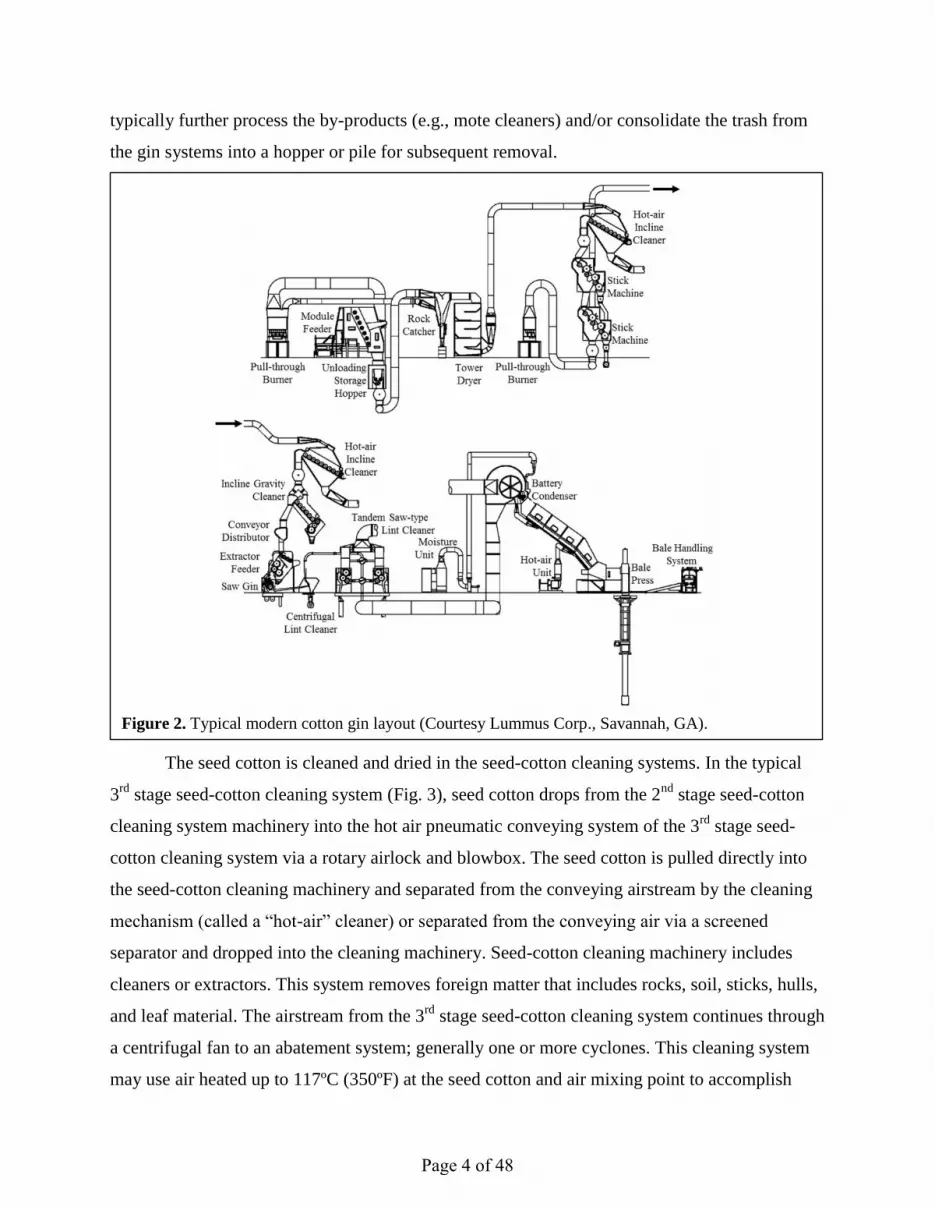
typically further process the by-products (e.g., mote cleaners) and/or consolidate the trash from
the gin systems into a hopper or pile for subsequent removal.
The seed cotton is cleaned and dried in the seed-cotton cleaning systems. In the typical
3rd
stage seed-cotton cleaning system (Fig. 3), seed cotton drops from the 2nd
stage seed-cotton
cleaning system machinery into the hot air pneumatic conveying system of the 3rd
stage seed-
cotton cleaning system via a rotary airlock and blowbox. The seed cotton is pulled directly into
the seed-cotton cleaning machinery and separated from the conveying airstream by the cleaning
mechanism (called a “hot-air” cleaner) or separated from the conveying air via a screened
separator and dropped into the cleaning machinery. Seed-cotton cleaning machinery includes
cleaners or extractors. This system removes foreign matter that includes rocks, soil, sticks, hulls,
and leaf material. The airstream from the 3rd
stage seed-cotton cleaning system continues through
a centrifugal fan to an abatement system; generally one or more cyclones. This cleaning system
may use air heated up to 117ºC (350ºF) at the seed cotton and air mixing point to accomplish
Figure 2. Typical modern cotton gin layout (Courtesy Lummus Corp., Savannah, GA).
Page 4 of 48

drying during transport (ASABE, 2007). Based on system configuration, the airstream
temperature at the abatement device could range from ambient to about 50% of the mixing-point
temperature. The material handled by the abatement system is typically the same as that removed
by the seed-cotton cleaning machinery (rocks, soil, sticks, hulls, and leaf material) and lint
extracted with the trash (Fig. 4).
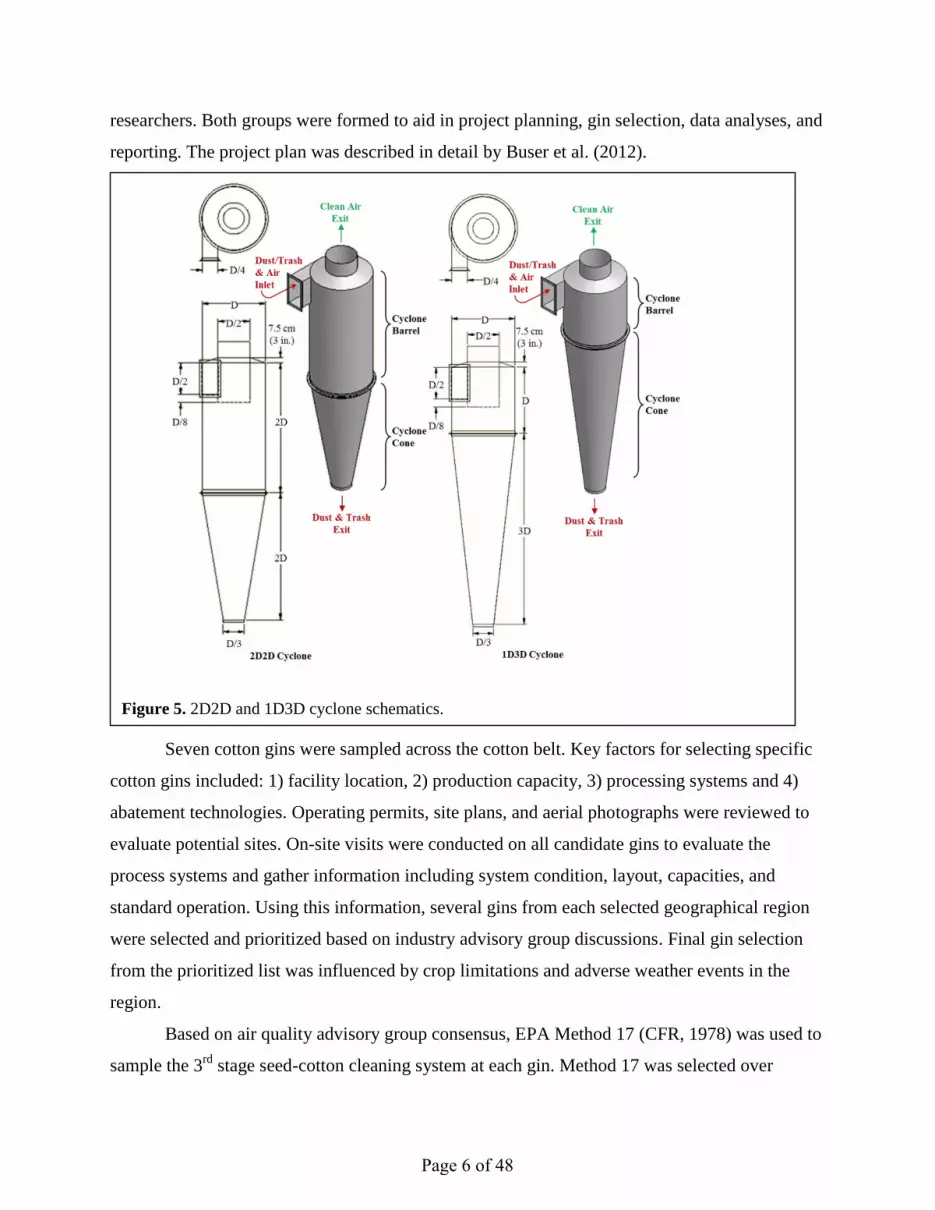
Cyclones are the most common PM abatement devices used at cotton gins. Standard
cyclone designs used at cotton ginning facilities are the 2D2D and 1D3D (Whitelock, et al.,
2009). The first D in the designation indicates the length of the cyclone barrel relative to the
cyclone barrel diameter and the second D indicates the length of the cyclone cone relative to the
cyclone barrel diameter. A standard 2D2D cyclone (Fig. 5) has an inlet height of D/2 and width
of D/4 and design inlet velocity of 15.2 ± 2 m/s (3000 ± 400 fpm). The standard 1D3D cyclone
(Fig. 5) has the same inlet dimensions as the 2D2D or may have the original 1D3D inlet with
height of D and width D/8. Also, it has a design inlet velocity of 16.3 ± 2 m/s (3200 ± 400 fpm).
The objective of this study was to collect additional total particulate emission factor data
for 3rd
stage seed-cotton cleaning systems with cyclones for emissions control at cotton gins
located in region across the cotton belt based on EPA-approved stack sampling methodologies.
METHODS
Two advisory groups were established for this project. The industry group consisted of
cotton ginning industry leaders and university and government researchers. The air quality group
included members from state and federal regulatory agencies, and university and government
Figure 3. Typical cotton gin 3
rd stage seed-cotton cleaning
system layout (Courtesy Lummus Corp., Savannah, GA).
Figure 4. Photograph of typical
trash captured by the 3rd
stage seed-
cotton cleaning system cyclones.
Page 5 of 48
researchers. Both groups were formed to aid in project planning, gin selection, data analyses, and
reporting. The project plan was described in detail by Buser et al. (2012).
Seven cotton gins were sampled across the cotton belt. Key factors for selecting specific
cotton gins included: 1) facility location, 2) production capacity, 3) processing systems and 4)
abatement technologies. Operating permits, site plans, and aerial photographs were reviewed to
evaluate potential sites. On-site visits were conducted on all candidate gins to evaluate the
process systems and gather information including system condition, layout, capacities, and
standard operation. Using this information, several gins from each selected geographical region
were selected and prioritized based on industry advisory group discussions. Final gin selection
from the prioritized list was influenced by crop limitations and adverse weather events in the
region.
Based on air quality advisory group consensus, EPA Method 17 (CFR, 1978) was used to
sample the 3rd
stage seed-cotton cleaning system at each gin. Method 17 was selected over
Figure 5. 2D2D and 1D3D cyclone schematics.
Page 6 of 48

Method 5 (CFR, 1987) because of the relatively low stack temperatures found at cotton gins.
One of the key benefits of using Method 17 over Method 5 is the option to eliminate the glass
probe and heating systems, and to sample at stack temperature with an in-stack filter. For the
total particulate sampling methodology, the particulate-laden stack gas was withdrawn
isokinetically (the velocity of the gas entering the sampler was equal to the velocity of the gas in
the stack) through a button-hook nozzle and then collected on an in-stack filter (Fig. 6). The
methods for retrieving the filter and conducting acetone washes of the sampling nozzle are
described in Method 17 (CFR, 1978). The mass of particulate on the filter and in the nozzle wash
was determined by gravimetric analyses. The total particulate mass was determined by summing
the mass of particulates on the filter and the front half wash. Stack gas temperature and moisture
content were also measured using EPA Method 17.
Only one stack from each 3rd
stage seed-cotton cleaning system was tested. For systems
with multiple stacks, it was assumed that emissions from each stack of the system were
equivalent and the total particulate emissions for the system were calculated by multiplying the
measured emission rates by the total number of cyclones used to control the process tested (EPA,
1996a). To obtain reliable results, the same technician from the same certified stack sampling
company (Reliable Emissions Measurements, Auberry, CA), trained and experienced in stack
sampling cotton gins, conducted all the tests at all the cotton gins.
All stack sampling equipment was purchased from Apex Instruments (Fuquay-Varina,
NC) and met specifications of Method 17. The sampling media were 47 mm Zefluor filters (Pall
Corporation, Port Washington, NY) and the sample recovery and analytical reagent was
American Chemical Society certified acetone (A18-4, Fisher Chemical, Pittsburgh, PA – assay ≥
99.5%). Filters and wash tubs and lids were pre-labeled and pre-weighed and stored in sealed
Figure 6. EPA Method 17 total particulate button-hook nozzle and in-stack filter holder photograph.
Page 7 of 48

containers at the USDA-ARS Air Quality Lab (AQL) in Lubbock, TX, and then transported to
each test site. Prior to testing, the certified stack testing technician calibrated all sampling
equipment according to EPA Method 17.
Each cyclone selected for testing was fitted with a cyclone stack extension that
incorporated two sampling ports (90° apart) and airflow straightening vanes to eliminate the
cyclonic flow of the air exiting the cyclone (Fig. 7). The extensions were designed to meet EPA
criteria (EPA, 1989) with an overall length of 3 m (10 ft) and sampling ports 1.2-m (48-in)
downstream from the straightening vanes and 0.9-m (36-in) upstream from the extension exit.
The tests were conducted by the certified stack sampling technician in an enclosed
sampling trailer at the base of the cyclone bank (Fig. 8). Sample retrieval, including filters and
nozzle acetone washes, was conducted according to Method 17. After retrieval, filters were
sealed in individual Petri dishes and acetone washes were dried on-site in a conduction oven at
49°C (120°F) and then sealed with pre-weighed lids and placed in individual plastic bags for
transport to the AQL in Lubbock, TX for gravimetric analyses. During testing, bale data (ID
number, weight, and date/time of bale pressing) were either manually recorded by the bale press
operator or captured electronically by the gin’s computer system for use in calculating emission
Figure 7. Schematic and photographs of stack extensions with sampling port and staightening
vanes (rail attached to extension above sampling port, at right, supports sampling probe during
testing traverse).
Page 8 of 48

factors in terms of kg/227-kg bale (lb/500-lb bale). Emission factors and rates were calculated in
accordance with Method 17 and ASAE Standard S582 (ASABE, 2005).
All laboratory analyses were conducted at the AQL. All filters were conditioned in an
environmental chamber (21 ± 2oC [70 ± 3.6
oF]; 35 ± 5% RH) for 48 h prior to gravimetric
analyses. Filters were weighed in the environmental chamber on a Mettler MX-5 microbalance
(Mettler-Toledo Inc., Columbus, OH – 1 µg readability and 0.9 µg repeatability) after being
passed through an anti-static device. The MX-5 microbalance was leveled on a marble table and
housed inside an acrylic box to minimize the effects of air currents and vibrations. To reduce
recording errors, weights were electronically transferred from the microbalance directly to a
spreadsheet. Technicians wore latex gloves and a particulate respirator mask to avoid
contamination. AQL procedures required that each sample be weighed three times each. If the
standard deviation of the weights for a given sample exceeded 10 μg, the sample was reweighed.
Gravimetric procedures for the acetone wash tubs were the same as those used for filters.
In addition to gravimetric analyses, each sample was visually inspected for unusual
characteristics, such as cotton lint content or extraneous material. Digital pictures were taken of
all filters and washes for documentation purposes prior to further analyses. After the laboratory
Figure 8. Clockwise from top right: cotton gin stack sampling with air quality lab trailer and
technicians on lifts; certified stack sampling technician in the trailer control room conducting
tests; sample recovery in trailer clean room; technician operating the probe at stack level.
Page 9 of 48

analyses were completed all stack sampling, cotton gin production, and laboratory data were
merged.
RESULTS
Two of the seven gins were equipped with 3rd
stage seed-cotton cleaning systems. The 3rd
stage seed-cotton cleaning systems sampled at gins A and C were typical for the industry. The 3rd
stage seed-cotton cleaning systems at gin A utilized two, separate and parallel, systems (Fig. 9).
In each of these parallel systems, the seed-cotton material was pneumatically conveyed from the
2nd
stage seed-cotton cleaning system with heated air through a dryer to a seed-cotton cleaner.
The material was separated from the airstream by the cleaner. The air from each of the parallel
3rd
stage seed-cotton cleaning systems then passed through separate fans and exhausted through
separate cyclones. Gin C also utilized two, parallel 3rd
stage seed-cotton cleaning systems with
single cleaners, except there were no dryers before the cleaners (Fig. 10).
Both 3rd
stage seed-cotton cleaning systems sampled utilized 1D3D cyclones to control
emissions (Fig. 5), but there were some cyclone design variations among the gins (Table 1 and
Fig. 11). Gin C split the system exhaust flow between two cyclones in a dual configuration (side-
by-side as opposed to one-behind-another). The system airstream for gin A was exhausted
through a single cyclone. Inlets on the gin A and C 3rd
stage seed-cotton cleaning cyclones were
inverted 1D3D and 2D2D inlets, respectively. Expansion chambers were present on 3rd
stage
seed-cotton cleaning cyclones at both gins. All of the cyclone variations outlined above, if
Figure 9. Schematic of split stream, single cleaner
3rd
stage seed-cotton cleaning system with dryer (gin
A).
Figure 10. Schematic of split stream, single cleaner
3rd
stage seed-cotton cleaning system without dryer
(gin C).
Page 10 of 48

properly designed and maintained, are recommended for controlling cotton gin emissions
(Whitelock et al., 2009).
Table 1. Abatement device configurationz for 3
rd stage seed-cotton cleaning systems tested.
Gin
Cyclone
Type
Inlet
Designy
Systems
per Gin
Cyclones
per Gin Configuration Cone Design
Trash
Exitx
A 1D3D inverted 1D3D 2 2 single expansion
chamber
hopper
C 1D3D 2D2D 2 4 dual expansion
chamber
hopper
z Figures 5 and 11
y Inverted 1D3D inlet has duct in line with the bottom of the inlet
x Systems to remove material from cyclone trash exits: hopper = large storage container directly under
cyclone trash exit
Table 2 shows the test parameters for each Method 17 test run for the 3rd
stage seed-
cotton cleaning systems sampled at the two gins. The system average ginning rate was 21.0
bales/h and the test average ginning rate at each gin ranged from 19.2 to 22.8 bales/h (based on
227-kg [500-lb] equivalent bales). The capacity of gins sampled was representative of the
industry average, approximately 25 bales/h. The 1D3D cyclones were all operated with inlet
velocities within design criteria, 16.3 ± 2 m/s (3200 ± 400 fpm), except run two for gin A was
outside the design range due to limitations in available system adjustments.
Figure 11. Cyclone design variations for the tested systems (left to right): dual configuration that
splits flow between identical 1D3D cyclones with 2D2D inlets; 1D3D cyclone with an inverted
1D3D inlet; and 1D3D cyclone with 2D2D inlet and expansion chamber on the cone.
Page 11 of 48

Table 2. Cotton gin production data and stack sampling performance metrics for the 3rd
stage
seed-cotton cleaning systems. Stack Gas
Test Ginning Rate
Cyclone Inlet
Velocity
Isokinetic
Sampling
Moisture
Content Temperature
Gin Run bales/hz
m/s fpm %
% °C °F
A 1 19.7 17.4 3427 101 0.7 13 55
2 17.9 19.1 3759 104 0.3 36 97
3 20.1 18.0 3535 103 1.2 30 86
Test Average 19.2 18.2 3574
C 1 22.9 17.0 3339 96 0.8 43 110
2 22.2 17.0 3341 98 1.8 45 114
3
23.2 17.9 3533 93 1.9 48 119
Test Average 22.8 17.3 3404
System Average 21.0 17.7 3489 z 227 kg (500 lb) equivalent bales
There are criteria specified in EPA Method 17 for test runs to be valid for total particulate
measurements (CFR, 1978). Isokinetic sampling must fall within EPA defined range of 100 ±
10%. All tests met the isokinetic criteria (Table 2). The stack gas temperatures ranged from 13 to
48oC (55-119
oF) and moisture content ranged from 0.3 to 1.9%
Total particulate emissions data (ginning and emission rates and corresponding emission
factors) for the 3rd
seed-cotton cleaning systems are shown in Table 3. The system average
emission factor was 0.023 kg/bale (0.052 lb/bale). The test average emission factors ranged from
0.014 to 0.033 kg (0.031-0.073 lb) per bale. The average 3rd
seed-cotton cleaning system total
particulate emission factor for this project was about 54% of the EPA AP-42 published value for
the No. 3 dryer and cleaner, which is an equivalent system to the 3rd
stage seed-cotton cleaning
system. The range of test average total particulate emission factors determined for this project
was lower than the AP-42 emission factor data range. The test average emission rates ranged
from 0.27 to 0.75 kg/h (0.59-1.66 lb/h).
Figure 12 shows an example of samples recovered from a typical 3rd
stage seed-cotton
cleaning system test run. Often, there were cotton lint fibers in the cotton gin cyclone exhausts.
Therefore, it was not unusual to find lint fiber on the Method 17 filter or in the front half wash
(Figure 13).
Page 12 of 48

Table 3. Total particulate emissions data for the 3rd
stage seed-cotton cleaning systems.
Emission Rate Emission Factor
Gin Test Run kg/h lb/h kg/balez
lb/balez
A 1 0.44 0.97 0.022 0.049
2 0.18 0.40 0.010 0.023
3 0.18 0.40 0.0089 0.020
Test Average (n=3) 0.27 0.59 0.014 0.031
C 1 0.71 1.57 0.031 0.069
2 0.78 1.72 0.035 0.078
3
0.76 1.67 0.033 0.072
Test Average (n=3) 0.75 1.66 0.033 0.073
System Average (n=2) 0.023 0.052 z 227 kg (500 lb) equivalent bales
Figure 12. Typical EPA Method 17 filter and sampler head acetone wash from the 3
rd stage seed-
cotton cleaning system. From left to right: front half wash and filter.
Figure 13. EPA Method 17 filter and sampler head acetone wash from the 3
rd stage seed-cotton
cleaning system with lint (indicated by arrows) on the filter. From left to right: front half wash
and filter.
Page 13 of 48

SUMMARY
Seven cotton gins across the U.S. cotton belt were sampled using EPA Method 17 to
collect additional data to improve the EPA AP-42 total particulate emission factor quality ratings
for cotton gins. Two of the seven gins were equipped with 3rd
stage seed-cotton cleaning
systems. The tested systems were similar in design and typical of the ginning industry. The
systems were equipped with 1D3D cyclones for emissions control with some variations in inlet
and cone design. In terms of capacity, the two gins were typical of the industry, averaging 21.0
bales/h during testing. The average 3rd
stage seed-cotton cleaning system total particulate
emission factor based on two tests (6 total test runs) was 0.023 kg/227-kg bale (0.052 lb/500-lb
bale) and was less than that currently published in EPA AP-42. The gin test average emission
rates ranged from 0.27 to 0.75 kg/h (0.59-1.66 lb/h).
Page 14 of 48

REFERENCES
American Society of Agricultural and Biological Engineers (ASABE). 2005. Cotton Gins—
Method of Utilizing Emission Factors in Determining Emission Parameters. ASAE S582,
March 2005. American Society of Agricultural and Biological Engineers, St. Joseph, MI.
American Society of Agricultural and Biological Engineers (ASABE). 2007. Temperature
Sensor Locations for Seed-Cotton Drying Systems. ASAE S530.1, August 2007.
American Society of Agricultural and Biological Engineers, St. Joseph, MI.
Buser, M.D., D.P. Whitelock, J.C. Boykin, and G.A. Holt. 2012. Characterization of cotton gin
particulate matter emissions—Project plan. J. Cotton Sci. 16:105–116.
Code of Federal Regulations (CFR). 1978. Method 17—Determination of particulate emissions
from stationary sources (in-stack filtration method). 40 CFR 60 Appendix A-6. Available
at http://www.epa.gov/ttn/emc/promgate/m-17.pdf (verified 19 Aug. 2013).
Code of Federal Regulations (CFR). 1987. Method 5—Determination of particulate matter
emissions from stationary sources. 40 CFR 60 Appendix A-3. Available at
http://www.epa.gov/ttn/emc/promgate/m-05.pdf (verified 19 Aug. 2013).
Environmental Protection Agency (EPA). 1989. Particulate sampling in cyclonic flow. U.S.
Environmental Protection Agency, Washington, DC. Available online at
http://www.epa.gov/ttn/emc/guidlnd/gd-008.pdf (verified 19 Aug. 2013).
Environmental Protection Agency (EPA). 1996a. Emission factor documentation for AP-42,
Section 9.7, Cotton Ginning (EPA Contract No. 68-D2-0159; MRI Project No. 4603-01,
Apr. 1996). Publ. AP-42. U.S. Environmental Protection Agency, Washington, DC.
Environmental Protection Agency (EPA). 1996b. Food and agricultural industries: Cotton gins.
In Compilation of air pollution emission factors, Volume 1: Stationary Point and Area
Sources. Publ. AP-42. U.S. Environmental Protection Agency, Washington, DC.
National Agricultural Statistics Service (NASS).1993-2012. Cotton Ginnings Annual Summary
[Online]. USDA National Agricultural Statistics Service, Washington, DC. Available at
http://usda.mannlib.cornell.edu/MannUsda/viewDocumentInfo.do?documentID=1042
(verified 19 Aug. 2013).
Page 15 of 48

Valco, T.D., H. Ashley, J.K. Green, D.S. Findley, T.L. Price, J.M. Fannin, and R.A. Isom. 2012.
The cost of ginning cotton—2010 survey results. p. 616–619 In Proc. Beltwide Cotton
Conf., Orlando, FL. 3-6 Jan. 2012. Natl. Cotton Counc. Am., Memphis, TN.
Valco, T.D., B. Collins, D.S. Findley, J.K. Green, L. Todd, R.A. Isom, and M.H. Wilcutt. 2003.
The cost of ginning cotton—2001 survey results. p. 662–670 In Proc. Beltwide Cotton
Conf., Nashville, TN. 6-10 Jan. 2003. Natl. Cotton Counc. Am., Memphis, TN.
Valco, T.D., J.K. Green, R.A. Isom, D.S. Findley, T.L. Price, and H. Ashley. 2009. The cost of
ginning cotton – 2007 survey results. p. 540–545 In Proc. Beltwide Cotton Conf., San
Antonio, TX. 5-8 Jan. 2009. Natl. Cotton Counc. Am., Memphis, TN.
Valco, T.D., J.K. Green, T.L. Price, R.A. Isom, and D.S. Findley. 2006. Cost of ginning cotton –
2004 survey results. p. 618–626 In Proc. Beltwide Cotton Conf., San Antonio, TX. 3-6
Jan. 2006. Natl. Cotton Counc. Am., Memphis, TN.
Wakelyn, P.J., D.W. Thompson, B.M. Norman, C.B. Nevius, and D.S. Findley. 2005. Why
cotton ginning is considered agriculture. Cotton Gin and Oil Mill Press 106(8): 5–9.
Whitelock, D.P., C.B. Armijo, M.D. Buser, and S.E. Hughs. 2009 Using cyclones effectively at
cotton gins. Appl. Eng. Ag. 25:563–576.
Page 16 of 48

Field and Laboratory Data
Page 17 of 48

Gin A Field and Laboratory Data
Page 18 of 48

A#400-2 No. 3 Drying 1D3D2008
Emission Factor (lbs/bale) Emission Rate (lbs/hr)Based on EPA Method 17 Based on EPA Method 17
Total PM Total PMRun 1 0.0493 Run 1 0.9714Run 2 0.0226 Run 2 0.4041Run 3 0.0197 Run 3 0.3954
Average 0.0305 Average 0.5903Condensables Condensables
Run 1 0.0017 Run 1 0.0338Run 2 0.0032 Run 2 0.0576Run 3 0.0001 Run 3 0.0022
Average 0.0017 Average 0.0312
Run 2: Cyclone Inlet Velocity High
Gin:Exhaust:
Date:
Page 19 of 48

Raw Test DataRun 1 Run 2 Run 3 Average
Barometer 26.00 26.00 26.00 Pbar 26.00Meter Calibration Fac. 1.01 1.01 1.01 Y 1.01Pitot Calibration Fac. 0.84 0.84 0.84 Cp 0.84Stack Static Pressure (in. H2O) -0.23 -0.23 -0.23 Pg -0.23Dry % Oxygen 20.90 20.90 20.90 %O2 20.90Dry % Carbon Monoxide 0.01 0.01 0.01 %CO2 0.01Area Standard Temperature (deg F) 68.0 68.0 68.0 tsd 68.0Temperature of Stack Gas (deg.F) 55.5 96.8 85.9 ts 79.4Temperature of Meter (deg.F) 70.3 67.0 62.6 tm 66.7∆ P Average (in H2O) 0.38 0.42 0.38 ∆ P 0.39Average √ ∆ P 0.61 0.64 0.61 √∆P 0.62∆ H Average (in H2O) 1.31 1.46 1.32 ∆ H 1.37Total Condensable water (g) 5.20 2.40 9.20 Vlc 5.60Dry gas Volume Measured (dcf) 41.16 42.75 39.99 Vm 41.30Stack Diameter (in.) 22.00 22.00 22.00 Ds 22.00Area of the Nozzle 0.00031 0.00031 0.00031 An 0.000309Sample duration (min) 60 60 60 Time 60
Intermediate CalculationsRun 1 Run 2 Run 3 Average
Absolute Stack Pressure (in.Hg) 25.98 25.98 25.98 Ps 25.98Standard Temperature (deg R) 528.0 528.0 528.0 Tstd 528.0Temperature of Stack Gas (deg.R) 515.5 556.8 545.9 Ts 539.4Temperature of Meter (deg.R) 530.3 527.0 522.6 Tm 526.7Water vapor standard (scf) 0.24 0.11 0.43 Vwstd 0.26Sample gas volume (dscf) 36.21 37.86 35.69 Vmstd 36.59Moisture Content Stack Gas 0.007 0.003 0.012 Bws 0.007Dry % Nitrogen 79.09 79.09 79.09 dcN2 79.09Molecular Weight Stack Gas (dry) 28.84 28.84 28.84 Md 28.84Molecular Weight Stack Gas (wet) 28.76 28.81 28.71 Ms 28.76Area of Stack (Ft^2) 2.64 2.64 2.64 As 2.64
ResultsRun 1 Run 2 Run 3 Average
Stack Gas Velocity (ft/sec) 36.4 39.9 37.5 Vs 37.9Stack Gas Flowrate (Acfm) 5,759 6,318 5,941 Qa 6,006Stack Gas Flowrate (Dscfm) 5,088 5,188 4,931 Qstd 5,069Cyclone Inlet Velocity (ft/min) 3427 3759 3535 Invs 3,574Isokinetic Variation (%) 101.33 103.93 103.09 I 102.78
Calculated Emission ResultsRun 1 Run 2 Run 3 Average
Particulate Weight (g) 0.026 0.011 0.011 Ws 0.016Particulate Emissions (grain/Dscf) 0.011 0.005 0.005 Cs 0.007Particulate Flow Rate (lb/hr) 0.49 0.20 0.20 CFs 0.30Standard 500 lb Hour (bale/hr) 19.71 17.91 20.05 Sbl/hr 19.22Particulate lb/bale 0.025 0.011 0.010 Cfbale 0.015Cyclones in sysytem 2 2 2 #Cy 2Total System Particulate lb/bale 0.049 0.023 0.020 Tsys 0.03
REM - 2003
12/13/08
Method 5 Data Average Sheet
A
#400-2 No. 3 Drying 1D3D
Page 20 of 48

Weather:
ө: min.Y: Cp:
Cyclone Dia: % Dia# in System: 2 K Fac:
PitotA: B: Hg 22
Hg 10
Notes:
g 1 gg 2 gg 3 gg 4 gg g
Averages: 55.46
5257.560
0.456
545453
47.550
52.5
32.535
37.540
42.545
717155
5252
0.320.30.36
0.48
46.097 0.632
1.31
1.40
745.5
0.711
0.6
Gross TotalTare
41.16
603808.1
AvgVacuum
in.Hg
Sample Run
Nozzle #:
Meter∆ H
0.32
VeloctiyMeter Temp
7070
0.94
3.49
Pre Leak Check:Post Leak Check:
00.016
0.470.46
∆ PMeter Volume∆ P
1.12
1.641.611.681.401.261.12
0.6
1.15
0.6780.6930.632
15:05
4.937Start Time
Points ө °F
% H2O:
Stack Dia:
Port Dia:3
Traverse Sample Stack
44
221
7
Unit:Job #:
p Stack:% O2:
Pbar: % CO2:Pitot #:
Ambient Temp:
Δ H @:LBK1 1.92160
68
1.01300
61Tstd:
12
5858
02.5
789
1517.520 58
57.510
12.5
10
3456
345
10
111212
1112
6789
59
5858
56555757
58
53
52
27.530
22.525
53
585654
0.4
0.721
Method 5 Data Sheet
Client:Location:
Run #:Cold Box #
Meter #:
1.081.12
0.7210.7140.686
1.191.811.811.781.64
0.548
1.471.290.910.73
1.051.26
1.12
70
7071
70707070
707070
0.420.370.26
0.34
0.27
0.47
0.60871717171
7170
26
70
0.02
7070
Acetone DI Water
0.5660.52
0.557
0.360.32
0.31
0.38
0.510.4580.566
0.5660.574
70
End Time17:19
End Volume
0.330.32
0.520.520.51
0.21
End Vol
#400-2 No. 3 Drying 1D3608-099Clear-0.23
End VolStart Vol
9.4
6.00 0.6170.33
20.90.01
A
1 CamDate: 12/13/08
Operator:
2
0.5660.583
0.648
0.686
√
OKOK
1 0.84M-3
7
0.238
5
5.2
602.3797.1
Total:
REM - 2003
Start Vol
Filter #:1
Total:
-15.9729.6717.1707.7
Page 21 of 48
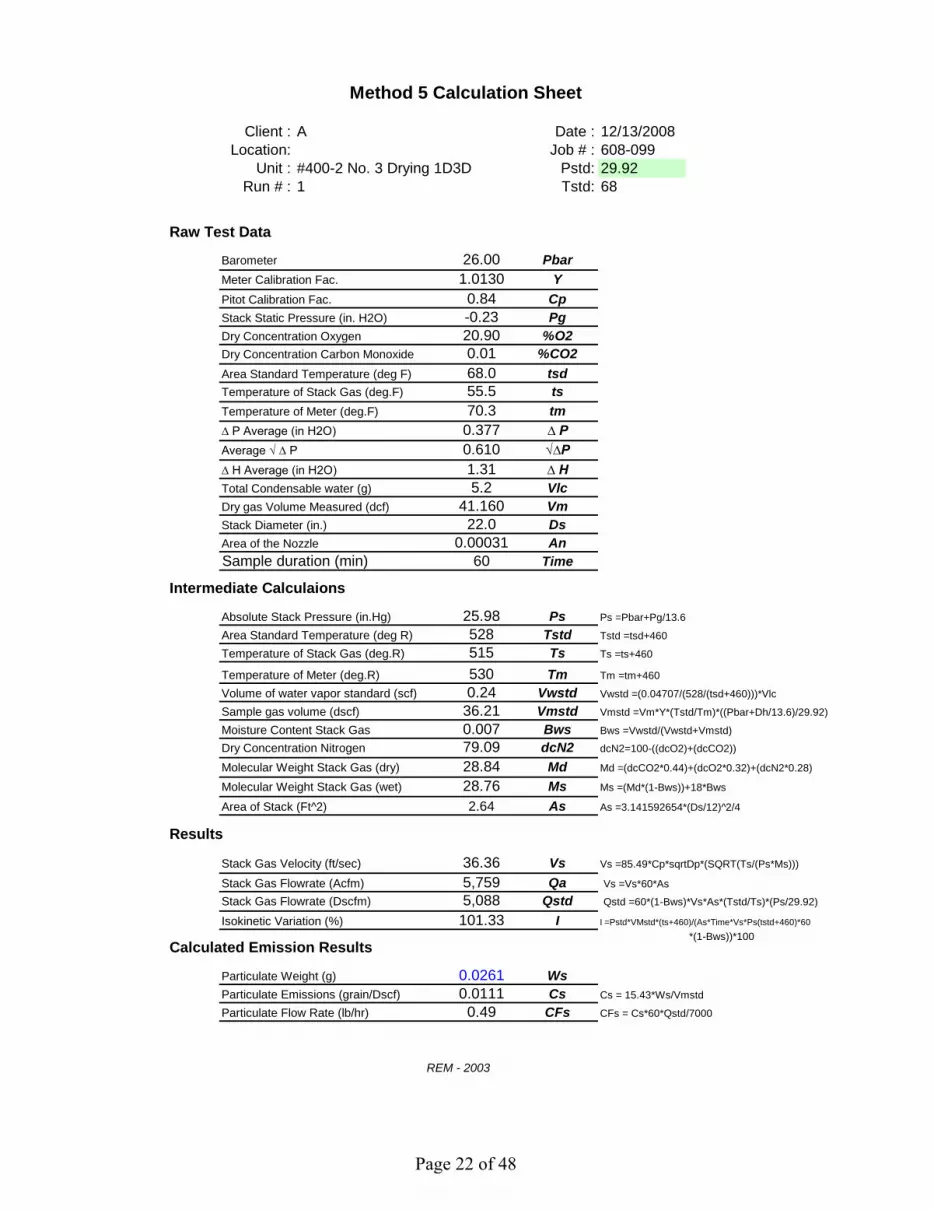
Client : A Date : 12/13/2008Location: Job # : 608-099
Unit : #400-2 No. 3 Drying 1D3D Pstd: 29.92Run # : 1 Tstd: 68
Barometer 26.00 PbarMeter Calibration Fac. 1.0130 YPitot Calibration Fac. 0.84 CpStack Static Pressure (in. H2O) -0.23 PgDry Concentration Oxygen 20.90 %O2Dry Concentration Carbon Monoxide 0.01 %CO2Area Standard Temperature (deg F) 68.0 tsdTemperature of Stack Gas (deg.F) 55.5 tsTemperature of Meter (deg.F) 70.3 tm∆ P Average (in H2O) 0.377 ∆ PAverage √ ∆ P 0.610 √∆P∆ H Average (in H2O) 1.31 ∆ HTotal Condensable water (g) 5.2 VlcDry gas Volume Measured (dcf) 41.160 VmStack Diameter (in.) 22.0 DsArea of the Nozzle 0.00031 AnSample duration (min) 60 Time
Absolute Stack Pressure (in.Hg) 25.98 Ps Ps =Pbar+Pg/13.6
Area Standard Temperature (deg R) 528 Tstd Tstd =tsd+460
Temperature of Stack Gas (deg.R) 515 Ts Ts =ts+460
Temperature of Meter (deg.R) 530 Tm Tm =tm+460
Volume of water vapor standard (scf) 0.24 Vwstd Vwstd =(0.04707/(528/(tsd+460)))*Vlc
Sample gas volume (dscf) 36.21 Vmstd Vmstd =Vm*Y*(Tstd/Tm)*((Pbar+Dh/13.6)/29.92)
Moisture Content Stack Gas 0.007 Bws Bws =Vwstd/(Vwstd+Vmstd)
Dry Concentration Nitrogen 79.09 dcN2 dcN2=100-((dcO2)+(dcCO2))
Molecular Weight Stack Gas (dry) 28.84 Md Md =(dcCO2*0.44)+(dcO2*0.32)+(dcN2*0.28)
Molecular Weight Stack Gas (wet) 28.76 Ms Ms =(Md*(1-Bws))+18*Bws
Area of Stack (Ft^2) 2.64 As As =3.141592654*(Ds/12)^2/4
Stack Gas Velocity (ft/sec) 36.36 Vs Vs =85.49*Cp*sqrtDp*(SQRT(Ts/(Ps*Ms)))
Stack Gas Flowrate (Acfm) 5,759 Qa Vs =Vs*60*As
Stack Gas Flowrate (Dscfm) 5,088 Qstd Qstd =60*(1-Bws)*Vs*As*(Tstd/Ts)*(Ps/29.92)
Isokinetic Variation (%) 101.33 I I =Pstd*VMstd*(ts+460)/(As*Time*Vs*Ps(tstd+460)*60
*(1-Bws))*100
Particulate Weight (g) 0.0261 WsParticulate Emissions (grain/Dscf) 0.0111 Cs Cs = 15.43*Ws/Vmstd
Particulate Flow Rate (lb/hr) 0.49 CFs CFs = Cs*60*Qstd/7000
REM - 2003
Calculated Emission Results
Results
Intermediate Calculaions
Raw Test Data
Method 5 Calculation Sheet
Page 22 of 48

Weather:
ө: min.Y: Cp:
Cyclone Dia: % Dia# in System: 1 K Fac:
PitotA: B: Hg 20
Hg 18
Notes:
g 1 gg 2 gg 3 gg 4 gg g
End Volume 0.574 1.151.120.566
18:51End Time 0.529 0.98
0.574
0.7
1.120.566
0.728 1.851.71
1.850.775 2.090.728
0.735
0.574 1.15
0.678 1.610.608 1.29
0.663 1.540.671 1.57
in.Hg ∆ P ∆ HVacuum Meter Volume
0.742
0.583 1.19
1.570.624 1.36
17:42 0.671
REM - 2003
2.4End Vol 824
609.5
Total: Total:832.7 8.7
Start Vol 610.1 0.6
Start Vol 773.4
0.3266
End Vol
47.435
96 0.326694 0.34
0.3366
0.5568Start Time
8
724.1
Gross764.9 -8.5725.7 1.6
Acetone DI Water Tare
90.185
1.920.735 1.88
√ Meter
0.592 1.220.648 1.47
1.88
0.608 1.291.15
67.04 0.42 8.00
66
Total
Averages: 96.75
12 57.560
0.583 1.19
1.4642.75 0.644
8 47.5 98
10 52.5 9755
500.2866
9 98
11
7 45 98 0.3366
5 40 99 0.49666 42.5 99 0.3766
3 35 99 0.54674 37.5 99 0.5367
1 30 97 0.53672 32.5 99 0.667
11 25 92 0.466712 27.5 93 0.3767
9 20 95 0.446710 22.5 95 0.4568
7 15 95 0.35688 17.5 96 0.4268
5 10 95 0.34686 12.5 96 0.3368
3 5 98 0.45684 7.5 96 0.3968
2 2.5 99 0.5468
Meter Temp
1 0 99AvgPoints ө °F
Traverse Sample Stack∆ P
Veloctiy
3
1 0.841.01300 Δ H @: 1.921 Pitot #:
Port Dia: 7
M-3 0.238Meter #: LBK1
44
OK1 Pre Leak Check: 0.007
3.49
Post Leak Check: 0.004
2
OK
26 60 % CO2: 0.01
-0.23
Stack Dia: 22 Sample Run
% H2O: 0.02 Nozzle #:
% O2: 20.9Pbar:
Ambient Temp: 58p Stack:Filter #:Cold Box # 3
Tstd: 68
Method 5 Data Sheet
Client: A Unit: #400-2 No. 3 Drying 1D3
ClearLocation: Date:
Run #: 2 Operator: Cam12/13/08 Job #: 608-099
Page 23 of 48

Client : A Date : 12/13/2008Location: Job # : 608-099
Unit : #400-2 No. 3 Drying 1D3D Pstd: 29.92Run # : 2 Tstd: 68
Barometer 26.00 PbarMeter Calibration Fac. 1.0130 YPitot Calibration Fac. 0.84 CpStack Static Pressure (in. H2O) -0.23 PgDry Concentration Oxygen 20.90 %O2Dry Concentration Carbon Monoxide 0.01 %CO2Area Standard Temperature (deg F) 68.0 tsdTemperature of Stack Gas (deg.F) 96.8 tsTemperature of Meter (deg.F) 67.0 tm∆ P Average (in H2O) 0.420 ∆ PAverage √ ∆ P 0.644 √∆P∆ H Average (in H2O) 1.46 ∆ HTotal Condensable water (g) 2.4 VlcDry gas Volume Measured (dcf) 42.750 VmStack Diameter (in.) 22.0 DsArea of the Nozzle 0.00031 AnSample duration (min) 60 Time
Absolute Stack Pressure (in.Hg) 25.98 Ps Ps =Pbar+Pg/13.6
Area Standard Temperature (deg R) 528 Tstd Tstd =tsd+460
Temperature of Stack Gas (deg.R) 557 Ts Ts =ts+460
Temperature of Meter (deg.R) 527 Tm Tm =tm+460
Volume of water vapor standard (scf) 0.11 Vwstd Vwstd =(0.04707/(528/(tsd+460)))*Vlc
Sample gas volume (dscf) 37.86 Vmstd Vmstd =Vm*Y*(Tstd/Tm)*((Pbar+Dh/13.6)/29.92)
Moisture Content Stack Gas 0.003 Bws Bws =Vwstd/(Vwstd+Vmstd)
Dry Concentration Nitrogen 79.09 dcN2 dcN2=100-((dcO2)+(dcCO2))
Molecular Weight Stack Gas (dry) 28.84 Md Md =(dcCO2*0.44)+(dcO2*0.32)+(dcN2*0.28)
Molecular Weight Stack Gas (wet) 28.81 Ms Ms =(Md*(1-Bws))+18*Bws
Area of Stack (Ft^2) 2.64 As As =3.141592654*(Ds/12)^2/4
Stack Gas Velocity (ft/sec) 39.89 Vs Vs =85.49*Cp*sqrtDp*(SQRT(Ts/(Ps*Ms)))
Stack Gas Flowrate (Acfm) 6,318 Qa Vs =Vs*60*As
Stack Gas Flowrate (Dscfm) 5,188 Qstd Qstd =60*(1-Bws)*Vs*As*(Tstd/Ts)*(Ps/29.92)
Isokinetic Variation (%) 103.93 I I =Pstd*VMstd*(ts+460)/(As*Time*Vs*Ps(tstd+460)*60
*(1-Bws))*100
Calculated Emission ResultsParticulate Weight (g) 0.0111 WsParticulate Emissions (grain/Dscf) 0.0045 Cs Cs = 15.43*Ws/Vmstd
Particulate Flow Rate (lb/hr) 0.20 CFs CFs = Cs*60*Qstd/7000
REM - 2003
Raw Test Data
Intermediate Calculaions
Results
Method 5 Calculation Sheet
Page 24 of 48

Weather:
ө: min.Y: Cp:
Cyclone Dia: % Dia# in System: 2 K Fac:
PitotA: B: Hg 22
Hg 10
Notes:
g 1 gg 2 gg 3 gg 4 gg g
1.01
0.38 8.00 39.985 0.611 1.32
0.29 131.38 0.5390.32 0.566 1.120.32 End Volume 0.5660.33 20:30 0.574 1.150.31 End Time 0.557
0.26 0.51 0.910.31 0.557 1.08
0.33 0.574 1.150.33 0.574 1.15
0.48 0.693 1.680.5 0.707 1.75
0.36 0.6 1.260.42 0.648 1.47
0.34 0.583 1.190.34 0.583 1.19
0.31 0.557 1.080.32 0.566 1.12
0.28 0.529 0.980.37 0.608
1.570.43 0.656 1.50
91.395 0.735 1.882.131.81
0.61 8 Start Time 0.7810.520.45 0.671
0.54 8
19:23 0.721
Total: Total:
REM - 2003
End Vol
9.2
∆ H
1.29
1.08
1.12
808.2
-2.2718.3
730.8
8.8
2.6603.1 0817
Start Vol 603.1End Vol 715.7
Gross Total728.6
DI Water
62.63
Start VolTareAcetone
Averages: 85.88
11 55 8412 57.5 79
6210 52.5 84 62
6062
8 47.5 85 629 50 85 62
6 42.5 85 627 45 85 62
4 37.5 86 625 40 86 62
2 32.5 85 623 35 86 62
12 27.5 85 631 30 83 62
10 22.5 87 6311 25 86 63
8 17.5 88 639 20 87 63
6 12.5 88 637 15 88 63
4 7.5 88 635 10 88 63
2 2.5 88 643 5 88 64
Points ө °F Avg1 0 87 64
Meter∆ P
Traverse Sample Stack Meter Temp Veloctiy Vacuum Meter Volume √in.Hg ∆ P
OKPort Dia: 7 Post Leak Check: 0.005 OK
3 1 Pre Leak Check: 0.001
M-3 0.238
Stack Dia: 22 Sample Run
% H2O: 0.02 2 Nozzle #:3.49
44
3 Filter #:Tstd: 68 Ambient Temp:
0.01Meter #: LBK1 1.01300 Δ H @: 1.921 Pitot #: 1 0.84
Pbar: 26 60 % CO2:
Client: A Unit: #400-2 No. 3 Drying 1D3608-099
Method 5 Data Sheet
58
Cam12/13/08 Job #:
-0.23
Date:Part Cloud
Location:Run #: 3 Operator:
p Stack:% O2: 20.9
Cold Box #
Page 25 of 48

Client : A Date : 12/13/2008Location: Job # : 608-099
Unit : #400-2 No. 3 Drying 1D3D Pstd: 29.92Run # : 3 Tstd: 68
Barometer 26.00 PbarMeter Calibration Fac. 1.0130 YPitot Calibration Fac. 0.84 CpStack Static Pressure (in. H2O) -0.23 PgDry Concentration Oxygen 20.90 %O2Dry Concentration Carbon Monoxide 0.01 %CO2Area Standard Temperature (deg F) 68.0 tsdTemperature of Stack Gas (deg.F) 85.9 tsTemperature of Meter (deg.F) 62.6 tm∆ P Average (in H2O) 0.378 ∆ PAverage √ ∆ P 0.611 √∆P∆ H Average (in H2O) 1.32 ∆ HTotal Condensable water (g) 9.2 VlcDry gas Volume Measured (dcf) 39.985 VmStack Diameter (in.) 22.0 DsArea of the Nozzle 0.00031 AnSample duration (min) 60 Time
Absolute Stack Pressure (in.Hg) 25.98 Ps Ps =Pbar+Pg/13.6
Area Standard Temperature (deg R) 528 Tstd Tstd =tsd+460
Temperature of Stack Gas (deg.R) 546 Ts Ts =ts+460
Temperature of Meter (deg.R) 523 Tm Tm =tm+460
Volume of water vapor standard (scf) 0.43 Vwstd Vwstd =(0.04707/(528/(tsd+460)))*Vlc
Sample gas volume (dscf) 35.69 Vmstd Vmstd =Vm*Y*(Tstd/Tm)*((Pbar+Dh/13.6)/29.92)
Moisture Content Stack Gas 0.012 Bws Bws =Vwstd/(Vwstd+Vmstd)
Dry Concentration Nitrogen 79.09 dcN2 dcN2=100-((dcO2)+(dcCO2))
Molecular Weight Stack Gas (dry) 28.84 Md Md =(dcCO2*0.44)+(dcO2*0.32)+(dcN2*0.28)
Molecular Weight Stack Gas (wet) 28.71 Ms Ms =(Md*(1-Bws))+18*Bws
Area of Stack (Ft^2) 2.64 As As =3.141592654*(Ds/12)^2/4
Stack Gas Velocity (ft/sec) 37.51 Vs Vs =85.49*Cp*sqrtDp*(SQRT(Ts/(Ps*Ms)))
Stack Gas Flowrate (Acfm) 5,941 Qa Vs =Vs*60*As
Stack Gas Flowrate (Dscfm) 4,931 Qstd Qstd =60*(1-Bws)*Vs*As*(Tstd/Ts)*(Ps/29.92)
Isokinetic Variation (%) 103.09 I I =Pstd*VMstd*(ts+460)/(As*Time*Vs*Ps(tstd+460)*60
*(1-Bws))*100
Particulate Weight (g) 0.0108 WsParticulate Emissions (grain/Dscf) 0.0047 Cs Cs = 15.43*Ws/Vmstd
Particulate Flow Rate (lb/hr) 0.20 CFs CFs = Cs*60*Qstd/7000
Raw Test Data
Intermediate Calculaions
Results
Calculated Emission Results
REM - 2003
Method 5 Calculation Sheet
Page 26 of 48

Plant: A Date: 12/13/2008Location: Job #: 608-099
Unit: #400-2 No. 3 Drying 1D3D Start Time: 15:05Run: 1 End Time: 17:19
Elapsed Time: 134 Test Time: 60Bale Time: 83.00 StdDev Std BPH: 6.91
Ave min/bale: 0:04:47 Ave Std BPH: 19.7
Bale No. Bale Wt. Time time/baleStd 500 lb
BPHChauvenet's
Criterion1545163 14:48:00 --- --- ---1545164 473 15:06:00 0:18:00 3.2 *1545165 433 15:08:00 0:02:00 26.01545166 447 15:10:00 0:02:00 26.81545167 457 15:12:00 0:02:00 27.41545168 472 15:15:00 0:03:00 18.91545169 453 15:17:00 0:02:00 27.21545170 461 15:20:00 0:03:00 18.41545171 458 15:23:00 0:03:00 18.31545172 486 15:25:00 0:02:00 29.21545173 494 15:27:00 0:02:00 29.61545174 508 15:30:00 0:03:00 20.31545175 485 15:32:00 0:02:00 29.11545176 488 15:34:00 0:02:00 29.31545177 493 15:36:00 0:02:00 29.61545178 504 15:39:00 0:03:00 20.21545179 493 15:41:00 0:02:00 29.61545180 505 15:43:00 0:02:00 30.31545181 493 15:45:00 0:02:00 29.61545182 514 15:48:00 0:03:00 20.61545183 500 15:50:00 0:02:00 30.01545184 498 15:52:00 0:02:00 29.91545185 495 15:54:00 0:02:00 29.71545186 510 15:57:00 0:03:00 20.41545187 481 15:59:00 0:02:00 28.91545188 525 16:01:00 0:02:00 31.51545189 16:08:00 0:07:00 *1545190 16:21:00 0:13:00 *1545191 16:23:00 0:02:00 *1545192 17:11:00 0:48:00 *1545193 511 17:13:00 0:02:00 30.71545194 507 17:15:00 0:02:00 30.41545195 491 17:21:00 0:06:00 9.8
REM - 2003
NOTE: Removed Bale Data = Lapse in Sampling Operation
Cotton Gin Bale Test Data
Page 27 of 48

Plant: A Date: 12/13/2008Location: Job #: 608-099
Unit: #400-2 No. 3 Drying 1D3D Start Time: 17:42Run: 2 End Time: 18:51
Elapsed Time: 69 Test Time: 60Bale Time: 72.00 StdDev Std BPH: 6.62
Ave min/bale: 0:04:47 Ave Std BPH: 17.9
Bale No. Bale Wt. Time time/baleStd 500 lb
BPHChauvenet's
Criterion1545204 17:41:00 --- --- ---1545205 495 17:44:00 0:03:00 19.81545206 499 17:48:00 0:04:00 15.01545207 518 17:51:00 0:03:00 20.71545208 500 17:53:00 0:02:00 30.01545209 522 17:55:00 0:02:00 31.31545210 533 18:13:00 0:18:00 3.61545211 487 18:16:00 0:03:00 19.51545212 484 18:18:00 0:02:00 29.01545213 493 18:21:00 0:03:00 19.71545214 490 18:24:00 0:03:00 19.61545215 483 18:27:00 0:03:00 19.31545216 488 18:29:00 0:02:00 29.31545217 488 18:31:00 0:02:00 29.31545218 485 18:34:00 0:03:00 19.41545219 484 18:37:00 0:03:00 19.41545220 474 18:39:00 0:02:00 28.41545221 470 18:41:00 0:02:00 28.21545222 451 18:43:00 0:02:00 27.11545223 447 18:45:00 0:02:00 26.81545224 486 18:48:00 0:03:00 19.41545225 489 18:50:00 0:02:00 29.31545226 479 18:53:00 0:03:00 19.2
REM - 2003
Cotton Gin Bale Test Data
Page 28 of 48

Plant: A Date: 12/13/2008Location: Job #: 608-099
Unit: #400-2 No. 3 Drying 1D3D Start Time: 19:23Run: 3 End Time: 20:30
Elapsed Time: 67 Test Time: 60Bale Time: 67.00 StdDev Std BPH: 7.02
Ave min/bale: 0:02:55 Ave Std BPH: 20.1
Bale No. Bale Wt. Time time/baleStd 500 lb
BPHChauvenet's
Criterion1545238 19:23:00 --- --- ---1545239 474 19:26:00 0:03:00 19.01545240 509 19:29:00 0:03:00 20.41545241 488 19:32:00 0:03:00 19.51545242 520 19:35:00 0:03:00 20.81545243 479 19:37:00 0:02:00 28.71545244 519 19:41:00 0:04:00 15.61545245 476 19:48:00 0:07:00 8.21545246 503 19:52:00 0:04:00 15.11545247 413 19:54:00 0:02:00 24.81545248 425 19:58:00 0:04:00 12.81545249 478 20:00:00 0:02:00 28.71545250 490 20:02:00 0:02:00 29.41545251 485 20:05:00 0:03:00 19.41545252 460 20:07:00 0:02:00 27.61545253 462 20:11:00 0:04:00 13.91545254 506 20:13:00 0:02:00 30.41545255 490 20:15:00 0:02:00 29.41545256 499 20:17:00 0:02:00 29.91545257 505 20:21:00 0:04:00 15.21545258 515 20:23:00 0:02:00 30.91545259 506 20:25:00 0:02:00 30.41545260 498 20:27:00 0:02:00 29.91545261 495 20:30:00 0:03:00 19.8
REM - 2003
Cotton Gin Bale Test Data
Page 29 of 48

Client : Date :Location: Job # : 608-099
Unit : #400-2 No. 3 Drying 1D3D
Solution Blanks DI Water AcetoneWeigh Dish #: TL-0019 Weigh Dish #: TS-0124
Gross: 646.241 mg Gross: 741.425 mgTare: 644.790 mg Tare: 741.126 mg
Total Residue 1.451 mg Total Residue 0.298 mgVolume: 250 g Volume: 100 g
Residue: 0.006 mg/g Residue: 0.003 mg/g
Run 1 Run 2 Run 3DI WaterBack 1/2 Vol/Rinse: 264.5 g Back 1/2 Vol/Rinse: 296 g Back 1/2 Vol/Rinse: 265.9 g
Total Water: 264.5 g Total Water: 296 g Total Water: 265.9 g
AcetoneFront 1/2 Rinse: 19 g Front 1/2 Rinse: 16.4 g Front 1/2 Rinse: 13.5 gBack 1/2 Rinse: 54.8 g Back 1/2 Rinse: 54.3 g Back 1/2 Rinse: 56.8 g
1 1 1
Front 1/2Weigh Dish #: TS-0129 Weigh Dish #: TS-0131 Weigh Dish #: TS-0133
Gross: 643.380 mg Gross: 688.166 mg Gross: 618.251 mgTare: 638.573 mg Tare: 684.523 mg Tare: 615.834 mg
Acetone wt: -0.057 mg Acetone wt: -0.049 mg Acetone wt: -0.040 mgFront 1/2 Weight: 4.750 mg Front 1/2 Weight: 3.593 mg Front 1/2 Weight: 2.377 mg
FilterFilter # 6L-0063 Filter # 6L-0064 Filter # 6L-0065Gross: 258.714 mg Gross: 247.843 mg Gross: 253.296 mg
Tare: 237.335 mg Tare: 240.287 mg Tare: 244.853 mgFilter Weight: 21.380 mg Filter Weight: 7.556 mg Filter Weight: 8.444 mg
Back 1/2Weigh Dish #: TL-0020 Weigh Dish #: TL-0021 Weigh Dish #: TL-0022
Gross: 679.568 mg Gross: 695.383 mg Gross: 667.356 mgTare: 676.928 mg Tare: 691.650 mg Tare: 665.582 mg
Total Residue: 2.641 mg Total Residue: 3.733 mg Total Residue: 1.774 mgDI Water wt: -1.535 mg DI Water wt: -1.718 mg DI Water wt: -1.543 mgAcetone wt: -0.163 mg Acetone wt: -0.162 mg Acetone wt: -0.169 mg
Back 1/2 Weight: 0.942 mg Back 1/2 Weight: 1.853 mg Back 1/2 Weight: 0.062 mg
Results Run 1 Run 2 Run 3Front 1/2 Wt: 0.0048 g Front 1/2 Wt: 0.0036 g Front 1/2 Wt: 0.0024 g
Filter Wt: 0.0214 g Filter Wt: 0.0076 g Filter Wt: 0.0084 gBack 1/2 Wt: 0.0009 g Back 1/2 Wt: 0.0019 g Back 1/2 Wt: 0.0001 g
Filterable PM Wt: 0.0261 g Filterable PM Wt: 0.0111 g Filterable PM Wt: 0.0108 gTotal PM Weight: 0.0271 g Total PM Weight: 0.0130 g Total PM Weight: 0.0109 g
Method 5.1 Weight, Data & Calculations
REM Method 5.1 - 2007
A
12/13/2008
Page 30 of 48

Acetone Rinse
Client : Date :Location: Job # : 608-099
Unit : #400-2 No. 3 Drying 1D3D
Total PM Date:Run 1 Run 2 Run 3
Filter ID#: 6L-0063 Filter ID#: 6L-0064 Filter ID#: 6L-0065
Front 1/2 Start Vol: 345.5 g Front 1/2 Start Vol: 310.5 g Front 1/2 Start Vol: 266.8 gEnd Vol: 326.5 g End Vol: 294.1 g End Vol: 253.3 g
Total: 19.0 g Total: 16.4 g Total: 13.5 gTub #: TS-0129 Tub #: TS-0131 Tub #: TS-0133
Back 1/2 Start Vol: 54.8 g Back 1/2 Start Vol: 54.3 g Back 1/2 Start Vol: 56.8 gProbe End Vol: 0.0 g Probe End Vol: 0.0 g Probe End Vol: 0.0 g
Total: 54.8 g Total: 54.3 g Total: 56.8 gTub #: TL-0020 Tub #: TL-0021 Tub #: TL-0022
Back 1/2 Start Vol: 54.8 g Back 1/2 Start Vol: 54.3 g Back 1/2 Start Vol: 56.8 gDI H2O End Vol: 319.3 g DI H2O End Vol: 350.3 g DI H2O End Vol: 322.7 g
Total: 264.5 g Total: 296.0 g Total: 265.9 gTub #: TL-0020 Tub #: TL-0021 Tub #: TL-0022
12/13-14/08
A 12/13/2008
Page 31 of 48
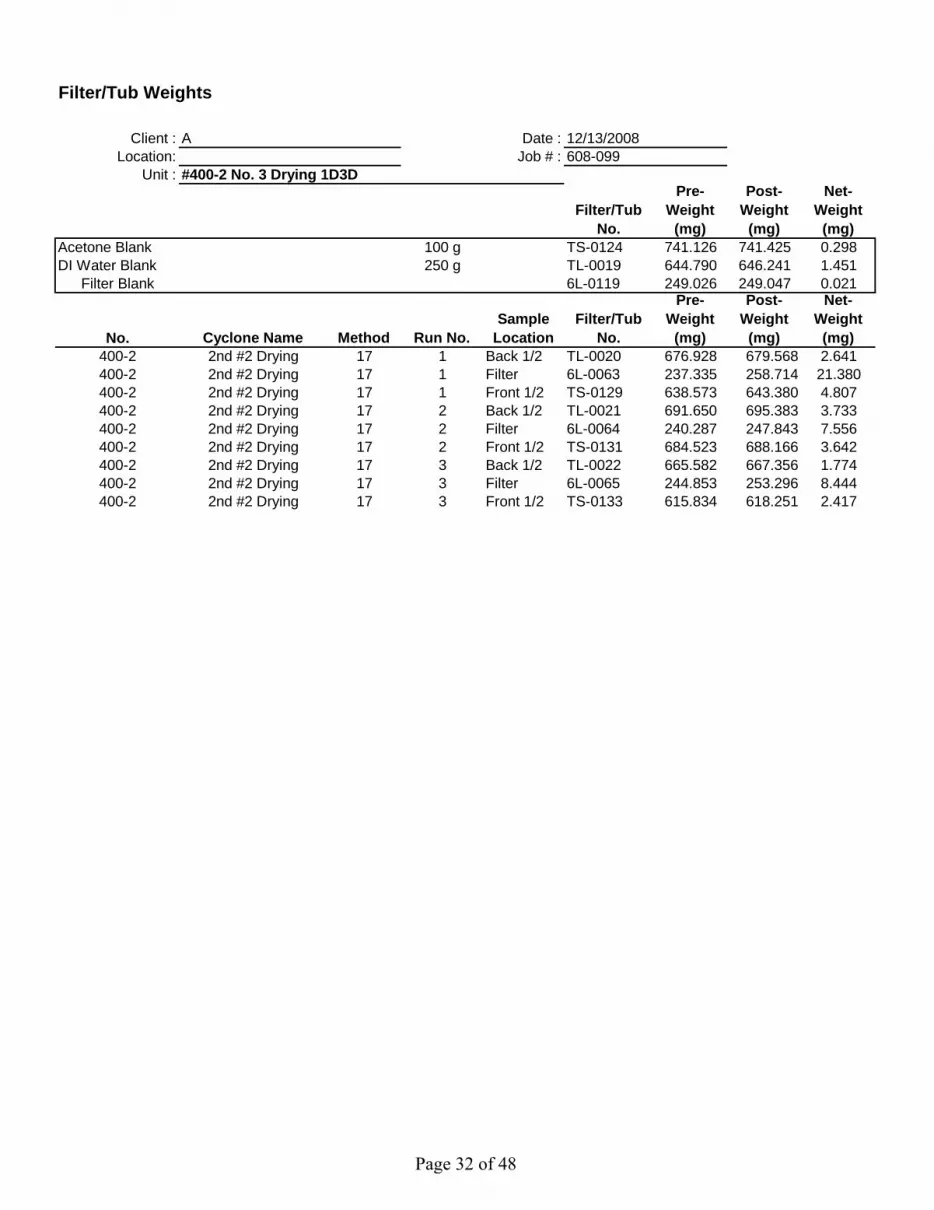
Filter/Tub Weights
Client : Date :Location: Job # : 608-099
Unit : #400-2 No. 3 Drying 1D3D
Filter/Tub No.
Pre-Weight
(mg)
Post-Weight
(mg)
Net-Weight
(mg)Acetone Blank 100 g TS-0124 741.126 741.425 0.298DI Water Blank 250 g TL-0019 644.790 646.241 1.451
Filter Blank 6L-0119 249.026 249.047 0.021
No. Cyclone Name Method Run No.Sample
LocationFilter/Tub
No.
Pre-Weight
(mg)
Post-Weight
(mg)
Net-Weight
(mg)400-2 2nd #2 Drying 17 1 Back 1/2 TL-0020 676.928 679.568 2.641400-2 2nd #2 Drying 17 1 Filter 6L-0063 237.335 258.714 21.380400-2 2nd #2 Drying 17 1 Front 1/2 TS-0129 638.573 643.380 4.807400-2 2nd #2 Drying 17 2 Back 1/2 TL-0021 691.650 695.383 3.733400-2 2nd #2 Drying 17 2 Filter 6L-0064 240.287 247.843 7.556400-2 2nd #2 Drying 17 2 Front 1/2 TS-0131 684.523 688.166 3.642400-2 2nd #2 Drying 17 3 Back 1/2 TL-0022 665.582 667.356 1.774400-2 2nd #2 Drying 17 3 Filter 6L-0065 244.853 253.296 8.444400-2 2nd #2 Drying 17 3 Front 1/2 TS-0133 615.834 618.251 2.417
A 12/13/2008
Page 32 of 48

Gin C Field and Laboratory Data
Page 33 of 48

C#7 3A Pull 1D3D2009
Emission Factor (lbs/bale) Emission Rate (lbs/hr)Based on EPA Method 17 Based on EPA Method 17
Total PM Total PMRun 1 0.0685 Run 1 1.5695Run 2 0.0777 Run 2 1.7243Run 3 0.0720 Run 3 1.6718
Average 0.0727 Average 1.6552Condensables Condensables
Run 1 0.0064 Run 1 0.1475Run 2 0.0000 Run 2 0.0000Run 3 0.0000 Run 3 0.0000
Average 0.0021 Average 0.0492
Gin:Exhaust:
Date:
Page 34 of 48

Raw Test DataRun 1 Run 2 Run 3 Average
Barometer 29.90 29.90 26.20 Pbar 28.67Meter Calibration Fac. 1.02 1.02 1.02 Y 1.02Pitot Calibration Fac. 0.84 0.84 0.84 Cp 0.84Stack Static Pressure (in. H2O) -0.17 -0.17 -0.17 Pg -0.17Dry % Oxygen 20.90 20.90 20.90 %O2 20.90Dry % Carbon Monoxide 0.05 0.05 0.05 %CO2 0.05Area Standard Temperature (deg F) 68.0 68.0 68.0 tsd 68.0Temperature of Stack Gas (deg.F) 110.3 113.7 119.3 ts 114.4Temperature of Meter (deg.F) 60.8 64.3 68.9 tm 64.7∆ P Average (in H2O) 0.37 0.37 0.35 ∆ P 0.36Average √ ∆ P 0.61 0.60 0.59 √∆P 0.60∆ H Average (in H2O) 0.33 0.32 0.31 ∆ H 0.32Total Condensable water (g) 3.30 7.20 6.70 Vlc 5.73Dry gas Volume Measured (dcf) 18.06 18.23 18.30 Vm 18.20Stack Diameter (in.) 19.00 19.00 19.00 Ds 19.00Area of the Nozzle 0.00017 0.00017 0.00017 An 0.000167Sample duration (min) 60 60 60 Time 60
Intermediate CalculationsRun 1 Run 2 Run 3 Average
Absolute Stack Pressure (in.Hg) 29.89 29.89 26.19 Ps 28.65Standard Temperature (deg R) 528.0 528.0 528.0 Tstd 528.0Temperature of Stack Gas (deg.R) 570.3 573.7 579.3 Ts 574.4Temperature of Meter (deg.R) 520.8 524.3 528.9 Tm 524.7Water vapor standard (scf) 0.16 0.34 0.32 Vwstd 0.27Sample gas volume (dscf) 18.75 18.79 16.39 Vmstd 17.98Moisture Content Stack Gas 0.008 0.018 0.019 Bws 0.015Dry % Nitrogen 79.05 79.05 79.05 dcN2 79.05Molecular Weight Stack Gas (dry) 28.84 28.84 28.84 Md 28.84Molecular Weight Stack Gas (wet) 28.75 28.65 28.64 Ms 28.68Area of Stack (Ft^2) 1.97 1.97 1.97 As 1.97
ResultsRun 1 Run 2 Run 3 Average
Stack Gas Velocity (ft/sec) 35.4 35.4 37.5 Vs 36.1Stack Gas Flowrate (Acfm) 4,185 4,188 4,428 Qa 4,267Stack Gas Flowrate (Dscfm) 3,839 3,782 3,466 Qstd 3,695Cyclone Inlet Velocity (ft/min) 3339 3341 3533 Invs 3,404Isokinetic Variation (%) 95.96 97.63 92.92 I 95.51
Calculated Emission ResultsRun 1 Run 2 Run 3 Average
Particulate Weight (g) 0.014 0.016 0.015 Ws 0.015Particulate Emissions (grain/Dscf) 0.012 0.013 0.014 Cs 0.013Particulate Flow Rate (lb/hr) 0.39 0.43 0.42 CFs 0.41Standard 500 lb Hour (bale/hr) 22.90 22.19 23.23 Sbl/hr 22.78Particulate lb/bale 0.017 0.019 0.018 Cfbale 0.018Cyclones in sysytem 4 4 4 #Cy 4Total System Particulate lb/bale 0.069 0.078 0.072 Tsys 0.07
REM - 2003
10/24/09
Method 5 Data Average Sheet
C
#7 3A Pull 1D3D
Page 35 of 48

Weather:
ө: min.Y: Cp:
Cyclone Dia: % Dia# in System: 4 K Fac:
PitotA: B: Hg 22
Hg 10
Notes:
g 1 gg 2 gg 3 gg 4 gg g
Acetone DI Water
60.75
626262
Start Vol
60
596060
Total
Start Vol
111111 60
606062
10
End Vol
0.320.6240.6
18.06
End Volume
0.370.37
3
0.37
0.35
Averages: 110.29
11057.560
62
6162
620.3262
0.3761
59
Gross
0.32
0.35
End Time8:28
0.310.34
0.33
-2.1
REM - 2003
731.9
62
End VolTotal:
0.6112
60
112111
0.340.38
0.32
AvgVacuum
in.Hg
Sample Run
Nozzle #:
Meter∆ H
6:495959
0.632
0.330.330.35
OKOK
0.608
p Stack:% O2:% CO2:Pitot #:
Ambient Temp:
Δ H @:
Tstd:
Meter Temp Meter Volume
0.8859
√
0.0070.005
Pre Leak Check:Port Dia:
319
1
∆ P
Filter #:
Traverse Sample Stack Veloctiy
7
38
12
Pbar:
Points ө °F
% H2O:
Stack Dia:
12
6789
109109
02.5
112
1517.5
45
1011
345678
3
910111212
30 109108109111111
22.525
55
32.535
37.540
42.545
47.550
52.5
112111
27.5
57.510
108
110
12.5
Meter #:
0.35
0.40.380.430.340.350.38
0.40.42
3
20
109
110110
110111111
Date: 10/24/09#7 3A Pull 1D3D
Run #:Cold Box #
Operator:
0.380.30
60
70.32
0.390.29
0.5830.616
20.90.05
0.175
Method 5 Data Sheet
Client:Location:
Unit:Job #:
0.280.280.33
0.5830.5920.6160.592
62
0.34
0.350.280.260.350.300.34
0.608
0.31
709-124pc-0.17
0.656
0.37 8.75
∆ P
0.606
0.35
0.566
0.390.39
MS5 0.84MS2
0.6480.6320.4
Post Leak Check:
1.02380
0.360.36
0.5660.5390.624
Tare
18.06
0.624
0Start Time
-1.13.6
729.8734.8607.2
2.9
15
0.566
3.3
C
1 CD26829.9 60
Total:
62
LBK1
885.6
731.9608.3882
1.89140.03
0.608
0.6320.616
Page 36 of 48
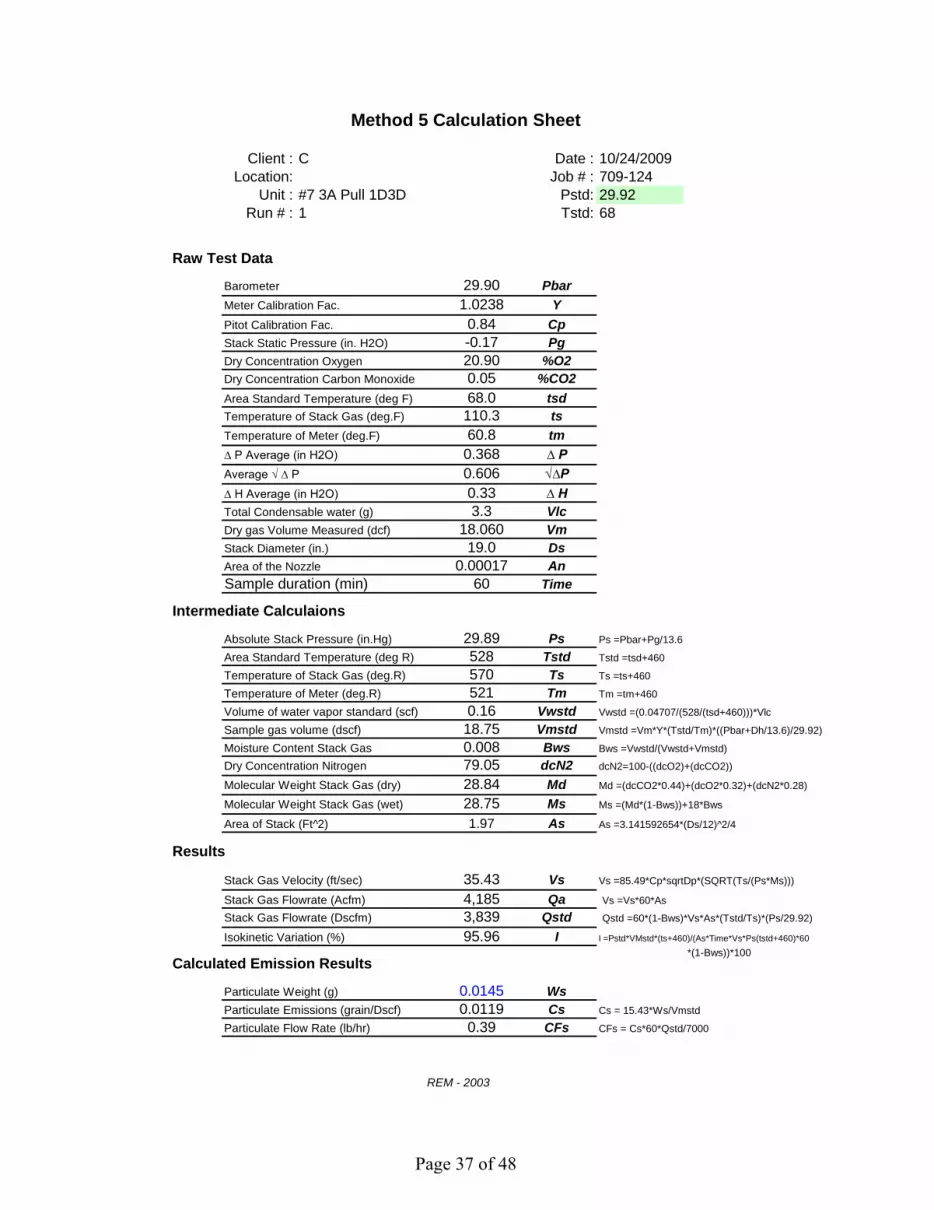
Client : C Date : 10/24/2009Location: Job # : 709-124
Unit : #7 3A Pull 1D3D Pstd: 29.92Run # : 1 Tstd: 68
Barometer 29.90 PbarMeter Calibration Fac. 1.0238 YPitot Calibration Fac. 0.84 CpStack Static Pressure (in. H2O) -0.17 PgDry Concentration Oxygen 20.90 %O2Dry Concentration Carbon Monoxide 0.05 %CO2Area Standard Temperature (deg F) 68.0 tsdTemperature of Stack Gas (deg.F) 110.3 tsTemperature of Meter (deg.F) 60.8 tm∆ P Average (in H2O) 0.368 ∆ PAverage √ ∆ P 0.606 √∆P∆ H Average (in H2O) 0.33 ∆ HTotal Condensable water (g) 3.3 VlcDry gas Volume Measured (dcf) 18.060 VmStack Diameter (in.) 19.0 DsArea of the Nozzle 0.00017 AnSample duration (min) 60 Time
Absolute Stack Pressure (in.Hg) 29.89 Ps Ps =Pbar+Pg/13.6
Area Standard Temperature (deg R) 528 Tstd Tstd =tsd+460
Temperature of Stack Gas (deg.R) 570 Ts Ts =ts+460
Temperature of Meter (deg.R) 521 Tm Tm =tm+460
Volume of water vapor standard (scf) 0.16 Vwstd Vwstd =(0.04707/(528/(tsd+460)))*Vlc
Sample gas volume (dscf) 18.75 Vmstd Vmstd =Vm*Y*(Tstd/Tm)*((Pbar+Dh/13.6)/29.92)
Moisture Content Stack Gas 0.008 Bws Bws =Vwstd/(Vwstd+Vmstd)
Dry Concentration Nitrogen 79.05 dcN2 dcN2=100-((dcO2)+(dcCO2))
Molecular Weight Stack Gas (dry) 28.84 Md Md =(dcCO2*0.44)+(dcO2*0.32)+(dcN2*0.28)
Molecular Weight Stack Gas (wet) 28.75 Ms Ms =(Md*(1-Bws))+18*Bws
Area of Stack (Ft^2) 1.97 As As =3.141592654*(Ds/12)^2/4
Stack Gas Velocity (ft/sec) 35.43 Vs Vs =85.49*Cp*sqrtDp*(SQRT(Ts/(Ps*Ms)))
Stack Gas Flowrate (Acfm) 4,185 Qa Vs =Vs*60*As
Stack Gas Flowrate (Dscfm) 3,839 Qstd Qstd =60*(1-Bws)*Vs*As*(Tstd/Ts)*(Ps/29.92)
Isokinetic Variation (%) 95.96 I I =Pstd*VMstd*(ts+460)/(As*Time*Vs*Ps(tstd+460)*60
*(1-Bws))*100
Particulate Weight (g) 0.0145 WsParticulate Emissions (grain/Dscf) 0.0119 Cs Cs = 15.43*Ws/Vmstd
Particulate Flow Rate (lb/hr) 0.39 CFs CFs = Cs*60*Qstd/7000
REM - 2003
Calculated Emission Results
Results
Intermediate Calculaions
Raw Test Data
Method 5 Calculation Sheet
Page 37 of 48

Weather:
ө: min.Y: Cp:
Cyclone Dia: % Dia# in System: 4 K Fac:
PitotA: B: Hg 20
Hg 12
Notes:
g 1 gg 2 gg 3 gg 4 gg g
Averages: 113.71
57.5 116 660.43
0.27
0.280.25
End Volume
Acetone DI Water
0.3264.33 0.37
0.39
0.616 0.34
0.548
AvgVeloctiy
63
4.00
Tare Gross
0.44
End Time
0.574
0.592
18.226 0.603
0.693
Vacuum √
0.663
0.64
7.2
Total
3.1605.8 -1.1
0.656 0.38
9:43 0.5660.529
0.583 0.300.29
0.31
18.226
0.548 0.27
0.574 0.290.557 0.27
0.648
0.632
0.36
in.Hg
Start Time 0.671
0.27
8:42 0.656
0.37
0.300.35
0.608
0.539 0.26
0.6 0.32
0.583
∆ P
Total:
REM - 2003
737.5
606.9
737.3 -0.2736.4733.3
End Vol 853.6Total:859 5.4
Start VolEnd VolStart Vol
0.557
Δ H @: 1.8914 Pitot #: LBK60 % CO2:
LBK 0.1750.84
0.05
∆ H
0.33
Meter Volume
0
0.380.64 0.36
0.40
1211 55 116 0.4866
60
117 0.326510 52.5 117 0.38669 508 47.5 117 0.28657 45 117 0.3656 42.5 117 0.3655 40 116 0.33654 37.5 115 0.34653 35 115 0.35652 32.5 113 0.31641 30 113 0.336612 27.5 114 0.416411 25 113 0.426410 22.5 112 0.43649 20 109 0.4648 17.5 110 0.34647 15 113 0.29636 12.5 113 0.31635 10 114 0.37634 7.5 113 0.4163
0.43633 5 110
% H2O: 0.03 3 Nozzle #:38Meter #:
OK
2 2.5 1091 0 110
Points ө °F
0.89
4∆ P0.360.45
Meter
63
Meter Temp
4 Filter #:pc
p Stack: -0.17CD
Traverse Sample Stack
OKPort Dia: 7 Post Leak Check: 0
LBK1 1.02380
3 1 Pre Leak Check: 0.002Stack Dia: 19 Sample Run
Method 5 Data Sheet
Client: C Unit: #7 3A Pull 1D3DJob #: 709-124
Pbar:Tstd: 68 Ambient Temp: 72 % O2: 20.9
29.9
Location: Date:Run #: 2 Operator:
10/24/09
Cold Box #
Page 38 of 48

Client : C Date : 10/24/2009Location: Job # : 709-124
Unit : #7 3A Pull 1D3D Pstd: 29.92Run # : 2 Tstd: 68
Barometer 29.90 PbarMeter Calibration Fac. 1.0238 YPitot Calibration Fac. 0.84 CpStack Static Pressure (in. H2O) -0.17 PgDry Concentration Oxygen 20.90 %O2Dry Concentration Carbon Monoxide 0.05 %CO2Area Standard Temperature (deg F) 68.0 tsdTemperature of Stack Gas (deg.F) 113.7 tsTemperature of Meter (deg.F) 64.3 tm∆ P Average (in H2O) 0.366 ∆ PAverage √ ∆ P 0.603 √∆P∆ H Average (in H2O) 0.32 ∆ HTotal Condensable water (g) 7.2 VlcDry gas Volume Measured (dcf) 18.226 VmStack Diameter (in.) 19.0 DsArea of the Nozzle 0.00017 AnSample duration (min) 60 Time
Absolute Stack Pressure (in.Hg) 29.89 Ps Ps =Pbar+Pg/13.6
Area Standard Temperature (deg R) 528 Tstd Tstd =tsd+460
Temperature of Stack Gas (deg.R) 574 Ts Ts =ts+460
Temperature of Meter (deg.R) 524 Tm Tm =tm+460
Volume of water vapor standard (scf) 0.34 Vwstd Vwstd =(0.04707/(528/(tsd+460)))*Vlc
Sample gas volume (dscf) 18.79 Vmstd Vmstd =Vm*Y*(Tstd/Tm)*((Pbar+Dh/13.6)/29.92)
Moisture Content Stack Gas 0.018 Bws Bws =Vwstd/(Vwstd+Vmstd)
Dry Concentration Nitrogen 79.05 dcN2 dcN2=100-((dcO2)+(dcCO2))
Molecular Weight Stack Gas (dry) 28.84 Md Md =(dcCO2*0.44)+(dcO2*0.32)+(dcN2*0.28)
Molecular Weight Stack Gas (wet) 28.65 Ms Ms =(Md*(1-Bws))+18*Bws
Area of Stack (Ft^2) 1.97 As As =3.141592654*(Ds/12)^2/4
Stack Gas Velocity (ft/sec) 35.45 Vs Vs =85.49*Cp*sqrtDp*(SQRT(Ts/(Ps*Ms)))
Stack Gas Flowrate (Acfm) 4,188 Qa Vs =Vs*60*As
Stack Gas Flowrate (Dscfm) 3,782 Qstd Qstd =60*(1-Bws)*Vs*As*(Tstd/Ts)*(Ps/29.92)
Isokinetic Variation (%) 97.63 I I =Pstd*VMstd*(ts+460)/(As*Time*Vs*Ps(tstd+460)*60
*(1-Bws))*100
Calculated Emission ResultsParticulate Weight (g) 0.0162 WsParticulate Emissions (grain/Dscf) 0.0133 Cs Cs = 15.43*Ws/Vmstd
Particulate Flow Rate (lb/hr) 0.43 CFs CFs = Cs*60*Qstd/7000
REM - 2003
Intermediate Calculaions
Results
Raw Test Data
Method 5 Calculation Sheet
Page 39 of 48

Weather:
ө: min.Y: Cp:
Cyclone Dia: % Dia# in System: 4 K Fac:
PitotA: B: Hg 22
Hg 18
Notes:
g 1 gg 2 gg 3 gg 4 gg g
0.34
0.35 8.50 18.301 0.594 0.31
0.38 18.301 0.616
0.360.42 0.648 0.370.41 End Volume 0.64
0.300.35 13 10:53 0.592 0.310.34 End Time 0.5830.28 0.529 0.250.3 0.548 0.27
0.35 0.592 0.310.32 0.566 0.280.33 0.574 0.290.35 0.592 0.310.35 0.592 0.310.43 0.656 0.380.39 0.624 0.350.35 0.592 0.310.34 0.583 0.300.34 0.583 0.300.29 0.539 0.260.32 0.566 0.28
0.350.39 4 Start Time 0.6240.39 9:52 0.624
in.Hg ∆ P ∆ H0.35 0 0.592 0.31
6.7891
Acetone DI Water
0.35 0.592 0.310.37 0.608 0.33
0.35
Total: Total:
REM - 2003
5.5Start Vol 607.1End Vol
746.8
885.5
-2.9750.2 3.4607.8 0.7
End Vol
Gross Total742.2745.1
Tare
60
Averages: 119.29 68.92
Start Vol
12 57.5 121 7111 55 121 7110 52.5 121 719 50 124 718 47.5 121 707 45 121 706 42.5 121 705 40 120 704 37.5 119 703 35 120 702 32.5 118 691 30 115 6912 27.5 119 6911 25 120 6910 22.5 120 689 20 119 688 17.5 119 687 15 120 68
2 2.5 116 671 0
6 12.5 120 685 10 118 67
115 66
4 7.5 118 673 5 117 67
3 1 Pre Leak Check: 0.016
Meter∆ P
Traverse Sample Stack Meter Temp Veloctiy Vacuum Meter Volume √
OKPort Dia: 7 Post Leak Check: 0.004 OK
Points ө °F Avg
0.175
Stack Dia: 19 Sample Run
% H2O:0.89
38
0.05Meter #: LBK1 1.02380 Δ H @: 1.8914 Pitot #: MS5 0.84
Pbar: 26.2 60 % CO2:68 Ambient Temp:
p Stack:CD
0.03 3 Nozzle #: MS2
Client: C Unit: #7 3A Pull 1D3D
Method 5 Data Sheet
10/24/09 Job #:
20.9-0.17
73 % O2:
Part CloudLocation:
Run #: 3 Operator:709-124 Date:
Cold Box # 3 Filter #:Tstd:
Page 40 of 48

Client : C Date : 10/24/2009Location: Job # : 709-124
Unit : #7 3A Pull 1D3D Pstd: 29.92Run # : 3 Tstd: 68
Barometer 26.20 PbarMeter Calibration Fac. 1.0238 YPitot Calibration Fac. 0.84 CpStack Static Pressure (in. H2O) -0.17 PgDry Concentration Oxygen 20.90 %O2Dry Concentration Carbon Monoxide 0.05 %CO2Area Standard Temperature (deg F) 68.0 tsdTemperature of Stack Gas (deg.F) 119.3 tsTemperature of Meter (deg.F) 68.9 tm∆ P Average (in H2O) 0.354 ∆ PAverage √ ∆ P 0.594 √∆P∆ H Average (in H2O) 0.31 ∆ HTotal Condensable water (g) 6.7 VlcDry gas Volume Measured (dcf) 18.301 VmStack Diameter (in.) 19.0 DsArea of the Nozzle 0.00017 AnSample duration (min) 60 Time
Absolute Stack Pressure (in.Hg) 26.19 Ps Ps =Pbar+Pg/13.6
Area Standard Temperature (deg R) 528 Tstd Tstd =tsd+460
Temperature of Stack Gas (deg.R) 579 Ts Ts =ts+460
Temperature of Meter (deg.R) 529 Tm Tm =tm+460
Volume of water vapor standard (scf) 0.32 Vwstd Vwstd =(0.04707/(528/(tsd+460)))*Vlc
Sample gas volume (dscf) 16.39 Vmstd Vmstd =Vm*Y*(Tstd/Tm)*((Pbar+Dh/13.6)/29.92)
Moisture Content Stack Gas 0.019 Bws Bws =Vwstd/(Vwstd+Vmstd)
Dry Concentration Nitrogen 79.05 dcN2 dcN2=100-((dcO2)+(dcCO2))
Molecular Weight Stack Gas (dry) 28.84 Md Md =(dcCO2*0.44)+(dcO2*0.32)+(dcN2*0.28)
Molecular Weight Stack Gas (wet) 28.64 Ms Ms =(Md*(1-Bws))+18*Bws
Area of Stack (Ft^2) 1.97 As As =3.141592654*(Ds/12)^2/4
Stack Gas Velocity (ft/sec) 37.48 Vs Vs =85.49*Cp*sqrtDp*(SQRT(Ts/(Ps*Ms)))
Stack Gas Flowrate (Acfm) 4,428 Qa Vs =Vs*60*As
Stack Gas Flowrate (Dscfm) 3,466 Qstd Qstd =60*(1-Bws)*Vs*As*(Tstd/Ts)*(Ps/29.92)
Isokinetic Variation (%) 92.92 I I =Pstd*VMstd*(ts+460)/(As*Time*Vs*Ps(tstd+460)*60*(1-Bws))*100
Particulate Weight (g) 0.0149 WsParticulate Emissions (grain/Dscf) 0.0141 Cs Cs = 15.43*Ws/Vmstd
Particulate Flow Rate (lb/hr) 0.42 CFs CFs = Cs*60*Qstd/7000
REM - 2003
Raw Test Data
Intermediate Calculaions
Results
Calculated Emission Results
Method 5 Calculation Sheet
Page 41 of 48

Plant: C Date: 10/24/2009Location: Job #: 709-124
Unit: #7 3A Pull 1D3D Start Time: 6:49Run: 1 End Time: 8:28
Elapsed Time: 99 Test Time: 60Bale Time: 101.90 StdDev Std BPH: 2.68
Ave min/bale: 0:02:33 Ave Std BPH: 22.9
Bale No. Bale Wt. Time time/baleStd 500 lb
BPHChauvenet's
Criterion5332266 6:49:00 --- --- ---5332267 477 6:51:20 0:02:20 24.55332268 469 6:53:34 0:02:14 25.25332269 478 6:56:11 0:02:37 21.95332270 472 6:58:21 0:02:10 26.15332271 482 7:01:15 0:02:54 19.95332272 463 7:03:38 0:02:23 23.35332273 496 7:05:36 0:01:58 30.3 *5332274 485 7:08:06 0:02:30 23.35332275 489 7:10:57 0:02:51 20.65332276 490 7:13:04 0:02:07 27.85332277 507 7:15:37 0:02:33 23.95332278 482 7:18:11 0:02:34 22.55332279 489 7:20:54 0:02:43 21.65332280 473 7:23:09 0:02:15 25.25332281 491 7:25:40 0:02:31 23.45332282 494 7:28:15 0:02:35 22.95332283 489 7:31:02 0:02:47 21.15332284 483 7:34:23 0:03:21 17.35332285 479 7:37:19 0:02:56 19.65332286 467 7:39:44 0:02:25 23.25332287 481 7:42:28 0:02:44 21.15332288 480 7:44:42 0:02:14 25.85332289 482 7:47:19 0:02:37 22.15332290 481 7:50:25 0:03:06 18.65332291 491 7:52:45 0:02:20 25.35332292 475 7:54:59 0:02:14 25.55332293 509 7:57:28 0:02:29 24.65332294 494 8:00:01 0:02:33 23.25332295 497 8:02:32 0:02:31 23.75332296 497 8:05:03 0:02:31 23.75332297 497 8:08:01 0:02:58 20.15332298 489 8:10:28 0:02:27 24.05332299 500 8:12:43 0:02:15 26.75332300 479 8:15:07 0:02:24 24.05332301 488 8:17:39 0:02:32 23.15332302 476 8:19:52 0:02:13 25.85332303 504 8:22:33 0:02:41 22.55332304 486 8:24:55 0:02:22 24.65332305 495 8:27:26 0:02:31 23.65332306 492 8:30:54 0:03:28 17.0
REM - 2003
Cotton Gin Bale Test Data
Page 42 of 48
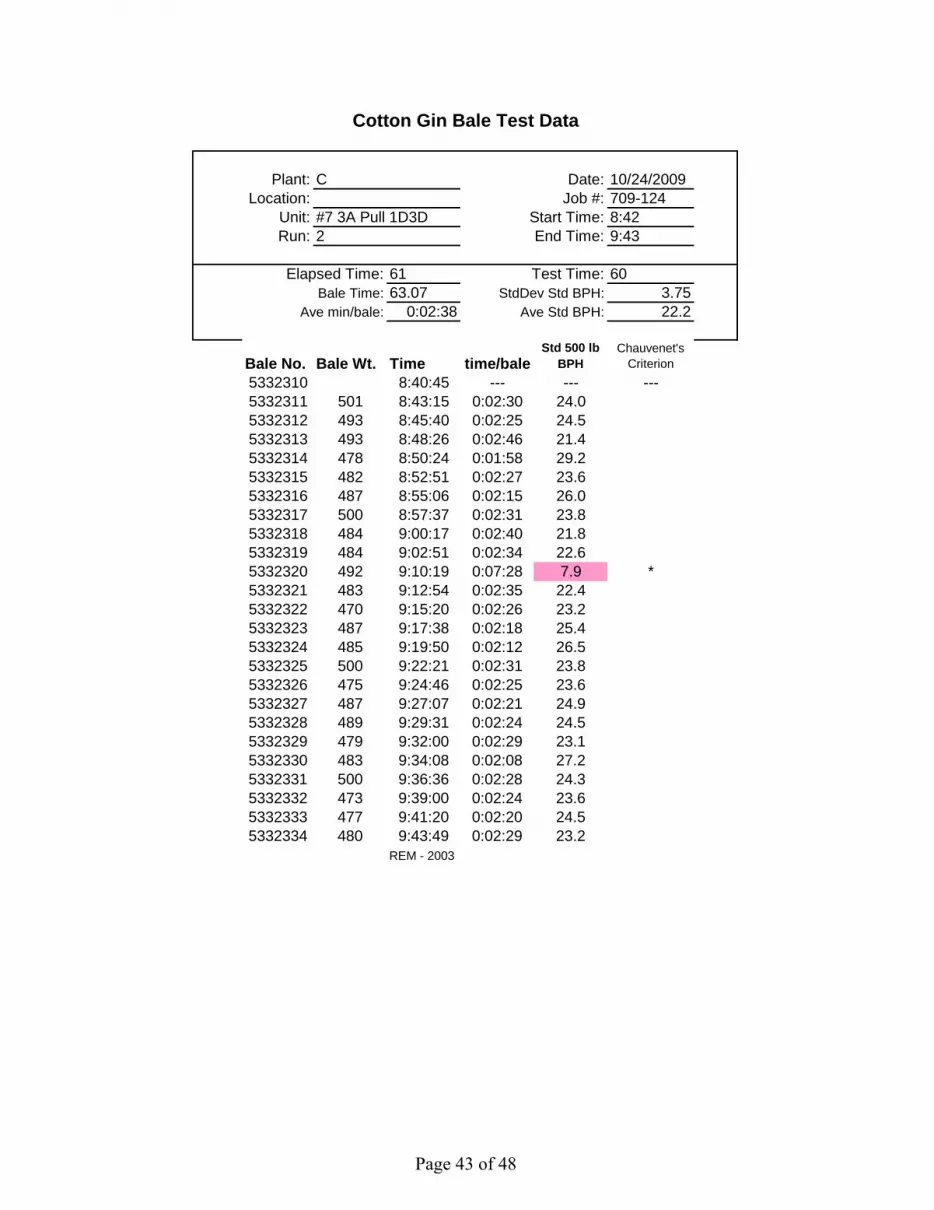
Plant: C Date: 10/24/2009Location: Job #: 709-124
Unit: #7 3A Pull 1D3D Start Time: 8:42Run: 2 End Time: 9:43
Elapsed Time: 61 Test Time: 60Bale Time: 63.07 StdDev Std BPH: 3.75
Ave min/bale: 0:02:38 Ave Std BPH: 22.2
Bale No. Bale Wt. Time time/baleStd 500 lb
BPHChauvenet's
Criterion5332310 8:40:45 --- --- ---5332311 501 8:43:15 0:02:30 24.05332312 493 8:45:40 0:02:25 24.55332313 493 8:48:26 0:02:46 21.45332314 478 8:50:24 0:01:58 29.25332315 482 8:52:51 0:02:27 23.65332316 487 8:55:06 0:02:15 26.05332317 500 8:57:37 0:02:31 23.85332318 484 9:00:17 0:02:40 21.85332319 484 9:02:51 0:02:34 22.65332320 492 9:10:19 0:07:28 7.9 *5332321 483 9:12:54 0:02:35 22.45332322 470 9:15:20 0:02:26 23.25332323 487 9:17:38 0:02:18 25.45332324 485 9:19:50 0:02:12 26.55332325 500 9:22:21 0:02:31 23.85332326 475 9:24:46 0:02:25 23.65332327 487 9:27:07 0:02:21 24.95332328 489 9:29:31 0:02:24 24.55332329 479 9:32:00 0:02:29 23.15332330 483 9:34:08 0:02:08 27.25332331 500 9:36:36 0:02:28 24.35332332 473 9:39:00 0:02:24 23.65332333 477 9:41:20 0:02:20 24.55332334 480 9:43:49 0:02:29 23.2
REM - 2003
Cotton Gin Bale Test Data
Page 43 of 48

Plant: C Date: 10/24/2009Location: Job #: 709-124
Unit: #7 3A Pull 1D3D Start Time: 9:52Run: 3 End Time: 10:53
Elapsed Time: 61 Test Time: 60Bale Time: 62.18 StdDev Std BPH: 2.35
Ave min/bale: 0:02:29 Ave Std BPH: 23.2
Bale No. Bale Wt. Time time/baleStd 500 lb
BPHChauvenet's
Criterion5332337 9:51:59 --- --- ---5332338 477 9:54:45 0:02:46 20.75332339 474 9:57:01 0:02:16 25.15332340 469 9:59:30 0:02:29 22.75332341 486 10:01:35 0:02:05 28.05332342 470 10:03:59 0:02:24 23.55332343 495 10:06:22 0:02:23 24.95332344 482 10:08:51 0:02:29 23.35332345 498 10:11:16 0:02:25 24.75332346 483 10:13:46 0:02:30 23.25332347 482 10:16:11 0:02:25 23.95332348 497 10:18:48 0:02:37 22.85332349 491 10:21:18 0:02:30 23.65332350 480 10:23:37 0:02:19 24.95332351 472 10:26:18 0:02:41 21.15332352 471 10:28:41 0:02:23 23.75332353 480 10:31:56 0:03:15 17.7 *5332354 471 10:34:26 0:02:30 22.65332355 492 10:36:57 0:02:31 23.55332356 492 10:39:38 0:02:41 22.05332357 486 10:42:18 0:02:40 21.95332358 467 10:44:50 0:02:32 22.15332359 489 10:46:46 0:01:56 30.4 *5332360 480 10:49:16 0:02:30 23.05332361 487 10:51:41 0:02:25 24.25332362 469 10:54:10 0:02:29 22.7
REM - 2003
Cotton Gin Bale Test Data
Page 44 of 48

Client : Date :Location: Job # : 709-124
Unit : #7 3A Pull 1D3D
Solution Blanks DI Water AcetoneWeigh Dish #: TL-0019 Weigh Dish #: TS-0124
Gross: 646.241 mg Gross: 741.425 mgTare: 644.790 mg Tare: 741.126 mg
Total Residue 1.451 mg Total Residue 0.298 mgVolume: 250 g Volume: 100 g
Residue: 0.006 mg/g Residue: 0.003 mg/g
Run 1 Run 2 Run 3DI WaterBack 1/2 Vol/Rinse: 263.2 g Back 1/2 Vol/Rinse: 297.6 g Back 1/2 Vol/Rinse: 292.8 g
Total Water: 263.2 g Total Water: 297.6 g Total Water: 292.8 g
AcetoneFront 1/2 Rinse: 11.35 g Front 1/2 Rinse: 10.35 g Front 1/2 Rinse: 12.94 gBack 1/2 Rinse: 50 g Back 1/2 Rinse: 50 g Back 1/2 Rinse: 50 g
1 1 1
Front 1/2Weigh Dish #: TS-0602 Weigh Dish #: TS-0601 Weigh Dish #: TS-0604
Gross: 711.749 mg Gross: 713.747 mg Gross: 667.506 mgTare: 709.655 mg Tare: 712.960 mg Tare: 665.491 mg
Acetone wt: -0.034 mg Acetone wt: -0.031 mg Acetone wt: -0.039 mgFront 1/2 Weight: 2.060 mg Front 1/2 Weight: 0.756 mg Front 1/2 Weight: 1.976 mg
FilterFilter # 8L-1415 Filter # 8L-1416 Filter # 8L-1417Gross: 308.043 mg Gross: 304.169 mg Gross: 306.829 mg
Tare: 295.612 mg Tare: 288.729 mg Tare: 293.859 mgFilter Weight: 12.431 mg Filter Weight: 15.441 mg Filter Weight: 12.970 mg
Back 1/2Weigh Dish #: TL-0080 Weigh Dish #: TL-0081 Weigh Dish #: TL-0082
Gross: 677.468 mg Gross: 687.465 mg Gross: 677.328 mgTare: 674.288 mg Tare: 685.702 mg Tare: 676.198 mg
Total Residue: 3.180 mg Total Residue: 1.763 mg Total Residue: 1.129 mgDI Water wt: -1.528 mg DI Water wt: -1.727 mg DI Water wt: -1.699 mgAcetone wt: -0.149 mg Acetone wt: -0.149 mg Acetone wt: -0.149 mg
Back 1/2 Weight: 1.503 mg Back 1/2 Weight: -0.113 mg Back 1/2 Weight: -0.719 mg
Results Run 1 Run 2 Run 3Front 1/2 Wt: 0.0021 g Front 1/2 Wt: 0.0008 g Front 1/2 Wt: 0.0020 g
Filter Wt: 0.0124 g Filter Wt: 0.0154 g Filter Wt: 0.0130 gBack 1/2 Wt: 0.0015 g Back 1/2 Wt: 0.0000 g Back 1/2 Wt: 0.0000 g
Filterable PM Wt: 0.0145 g Filterable PM Wt: 0.0162 g Filterable PM Wt: 0.0149 gTotal PM Weight: 0.0160 g Total PM Weight: 0.0162 g Total PM Weight: 0.0149 g
Method 5.1 Weight, Data & Calculations
REM Method 5.1 - 2007
C
10/24/2009
Page 45 of 48

Acetone Rinse
Client : Date :Location: Job # : 709-124
Unit : #7 3A Pull 1D3D
Total PMRun 1 Run 2 Run 3
Filter ID#: 8L-1415 Filter ID#: 8L-1416 Filter ID#: 8L-1417
Front 1/2 Start Vol: 340.0 g Front 1/2 Start Vol: 319.5 g Front 1/2 Start Vol: 283.9 gEnd Vol: 328.7 g End Vol: 309.1 g End Vol: 271.0 g
Total: 11.4 g Total: 10.4 g Total: 12.9 gTub #: TS-0602 Tub #: TS-0601 Tub #: TS-0604
Back 1/2 Start Vol: 50.0 g Back 1/2 Start Vol: 50.0 g Back 1/2 Start Vol: 50.0 gProbe End Vol: g Probe End Vol: g Probe End Vol: g
Total: 50.0 g Total: 50.0 g Total: 50.0 gTub #: TL-0080 Tub #: TL-0081 Tub #: TL-0082
Back 1/2 Start Vol: 263.2 g Back 1/2 Start Vol: 297.6 g Back 1/2 Start Vol: 292.8 gDI H2O End Vol: g DI H2O End Vol: g DI H2O End Vol: g
Total: 263.2 g Total: 297.6 g Total: 292.8 gTub #: TL-0080 Tub #: TL-0081 Tub #: TL-0082
C 10/24/2009
Page 46 of 48

Filter/Tub Weights
Client : Date :Location: Job # : 709-124
Unit : #7 3A Pull 1D3D
Filter/Tub No.
Pre-Weight
(mg)
Post-Weight
(mg)
Net-Weight
(mg)Acetone Blank 100 g TS-0124 741.126 741.425 0.298DI Water Blank 250 g TL-0019 644.790 646.241 1.451
Filter Blank 6L-0119 249.026 249.047 0.021
No. Cyclone Name Method Run No.Sample
LocationFilter/Tub
No.
Pre-Weight
(mg)
Post-Weight
(mg)
Net-Weight
(mg)7 #3A Pull 17 1 Back 1/2 TL-0080 674.288 677.468 3.1807 #3A Pull 17 1 Filter 8L-1415 295.612 308.043 12.4317 #3A Pull 17 1 Front 1/2 TS-0602 709.655 711.749 2.0947 #3A Pull 17 2 Back 1/2 TL-0081 685.702 687.465 1.7637 #3A Pull 17 2 Filter 8L-1416 288.729 304.169 15.4417 #3A Pull 17 2 Front 1/2 TS-0601 712.960 713.747 0.7877 #3A Pull 17 3 Back 1/2 TL-0082 676.198 677.328 1.1297 #3A Pull 17 3 Filter 8L-1417 293.859 306.829 12.9707 #3A Pull 17 3 Front 1/2 TS-0604 665.491 667.506 2.015
C 10/24/2009
Page 47 of 48

Acknowledgement: The authors appreciate the cooperating gin managers and personnel who
generously allowed and endured sampling at their gins. In addition, we thank California Cotton
Ginners’ and Growers’ Association, Cotton Incorporated, San Joaquin Valleywide Air Pollution
Study Agency, Southeastern Cotton Ginners’ Association, Southern Cotton Ginners’
Association, Texas Cotton Ginners’ Association, Texas State Support Committee, and The
Cotton Foundation for funding this project. This project was support in-part by the USDA
National Institute of Food and Agriculture Hatch Project OKL02882. The authors also thank the
Cotton Gin Advisory Group and Air Quality Advisory Group for their involvement and
participation in planning, execution, and data analysis for this project that is essential to
developing quality data that will be used by industry, regulatory agencies, and the scientific
community. The advisory groups included: the funding agencies listed above, California Air
Resources Board, Missouri Department of Natural Resources, National Cotton Council, National
Cotton Ginners’ Association, North Carolina Department of Environment and Natural
Resources, San Joaquin Valley Air Pollution Control District, Texas A&M University, Texas
Commission on Environmental Quality, USDA-NRCS National Air Quality and Atmospheric
Change, and U.S. Environmental Protection Agency (national, Region 4 and 9).
Disclaimer: Mention of trade names or commercial products in this publication is solely for the
purpose of providing specific information and does not imply recommendation or endorsement
by the Oklahoma State University or U.S. Department of Agriculture. Oklahoma State
University and USDA are equal opportunity providers and employers.
The statements and conclusions in this report are those of the USDA-ARS and Oklahoma State
University and not necessarily those of the California Air Resources Board, the San Joaquin
Valleywide Air Pollution Study Agency, or its Policy Committee, their employees or their
members. The mention of commercial products, their source, or their use in connection with
material reported herein is not to be construed as actual or implied endorsement of such products.
Page 48 of 48


