Embed Size (px)
Citation preview

2nd
Stage Seed-Cotton Cleaning System PM2.5
Emission Factors and Rates for Cotton Gins
Part of the National Characterization of Cotton Gin Particulate Matter
Emissions Project
Final Report: OSU12-03 Ver. 2.0
December 2012 (Revised June 2013)
Submitted to: San Joaquin Valley Air Pollution Study Agency
Cotton Incorporated
Cotton Foundation
National Cotton Ginners Association
Southern Cotton Ginners Association
Southeastern Cotton Ginners Association
California Cotton Growers and Ginners Association
Texas Cotton Ginners Association
Submitted by: Dr. Michael Buser
Department of Biosystems and Agricultural
Engineering
214 Agricultural Hall
Stillwater, OK 74078
Dr. Derek Whitelock
Southwestern Cotton Ginning Research
Laboratory
USDA Agricultural Research Service
300 E College Dr.
Mesilla Park, NM 88047
Mr. J. Clif Boykin
Cotton Ginning Research Unit
USDA Agricultural Research Service
111 Experiment Station Road
Stoneville, MS 38776
Dr. Greg Holt
Cotton Production and Processing Research
Unit
USDA Agricultural Research Service
1604 East FM 1294
Lubbock, TX 79403
Michael Buser, Ph.D. Biosystems and Agricultural Engineering Oklahoma State University 214 Agricultural Hall Stillwater, OK 74078 (405) 744-5288 – Phone (405) 744-6059 – Fax [email protected]

Acknowledgments:
Funding Sources: California Cotton Growers and Ginners Association
Cotton Foundation
Cotton Incorporated
Oklahoma State University
San Joaquin Valley Air Pollution Study Agency
Southeastern Cotton Ginners Association
Southern Cotton Ginners Association
Texas Cotton Ginners Association
Texas State Support Group
USDA Agricultural Research Service
Air Quality Advisory Group: California Air Resources Board
Missouri Department of Natural Resources
North Carolina Department of Natural Resources
San Joaquin Valley Air Pollution Control District
Texas A&M University Biological and Agricultural Engineering Department
Texas Commission on Environmental Quality
US Environmental Protection Agency – Air Quality Analysis Group
US Environmental Protection Agency – Air Quality Modeling Group
US Environmental Protection Agency – Office of Air Quality Planning and Standards
US Environmental Protection Agency – Process Modeling Research Branch, Human Exposure
and Atmospheric Sciences Division
US Environment Protection Agency Region 4
US Environment Protection Agency Region 9
USDA NRCS National Air Quality and Atmospheric Change Team
Cotton Gin Advisory Group: California Cotton Ginners and Growers Association
Cotton Incorporated
National Cotton Council
National Cotton Ginners Association
Southeastern Cotton Ginners Association
Southern Cotton Ginners Association
Texas Cotton Ginners Association
Texas A&M University Biological and Agricultural Engineering Department

ABSTRACT
This report is part of a project to characterize cotton gin emissions from the standpoint of
stack sampling. In 2006, EPA finalized and published a more stringent standard for particulate
matter with nominal diameter less than or equal to 2.5 µm (PM2.5). This created an urgent need to
collect additional cotton gin emissions data to address current regulatory issues, because current
EPA AP-42 cotton gin PM2.5 emission factors did not exist. The objective of this study was the
development of PM2.5 emission factors for cotton gin 2nd
stage seed-cotton cleaning systems
based on the EPA-approved stack sampling methodology, Method 201A. The project plan
included sampling seven cotton gins across the cotton belt. Key factors for selecting specific
cotton gins included: 1) facility location (geographically diverse), 2) industry representative
production capacity, 3) typical processing systems and 4) equipped with properly designed and
maintained 1D3D cyclones. Five of the seven gins were equipped with 2nd
stage seed-cotton
cleaning systems. In terms of capacity, the five gins were typical of the industry, averaging 33.8
bales/h during testing. Some test runs were excluded from the test averages because they failed
to meet EPA Method 201A Test criteria. Also, other test runs, included in the analyses, had
cotton lint fibers that collected in the ≤ 10 µm and/or ≤ 2.5 µm samples. This larger lint material
can impact the reported emissions data, but EPA Method 201A does not suggest methods to
account for these anomalies. Average measured 2nd
stage seed-cotton cleaning system PM2.5
emission factor based on the five tests (12 total test runs) was 0.0037 kg/227-kg bale (0.0080
lb/500-lb bale). The 2nd
stage seed-cotton cleaning system average emission factors for PM10 and
total particulate were 0.038 kg/bale (0.084 lb/bale) and 0.063 kg/bale (0.138 lb/bale),
respectively. The 2nd
stage seed-cotton cleaning system PM2.5 emission rate from test averages
ranged from 0.089 to 0.16 kg/h (0.20-0.36 lb/h). System average PM10 and total particulate
emission factors were lower than those currently published in EPA AP-42. The ratios of 2nd
stage
seed-cotton cleaning system PM2.5 to total particulate, PM2.5 to PM10, and PM10 to total
particulate were 5.8, 9.5, and 61.1%, respectively.
INTRODUCTION
In 2006, the U.S. Environmental Protection Agency (EPA) finalized a more stringent
standard for particulate matter with particle diameter less than or equal to a nominal 2.5-m
(PM2.5) aerodynamic equivalent diameter (CFR, 2006). The cotton industry’s primary concern
Page 1 of 105

with this standard was that there were no published cotton gin PM2.5 emissions data. Cotton
ginners’ associations across the cotton belt, including the National, Texas, Southern,
Southeastern, and California associations, agreed that there was an urgent need to collect PM2.5
cotton gin emissions data to address the implementation of the PM2.5 standards. Working with
cotton ginning associations across the country and state and federal regulatory agencies,
Oklahoma State University and USDA-Agricultural Research Service (ARS) researchers
developed a proposal and sampling plan that was initiated in 2008 to address this need for
additional data. This report is part of a series that detail cotton gin particulate emissions
measured by stack sampling. Each manuscript in the series addresses a specific cotton ginning
system. The systems covered in the series include: unloading, 1st stage seed-cotton cleaning, 2
nd
stage seed-cotton cleaning, 3rd stage seed-cotton cleaning, overflow, 1st stage lint cleaning, 2nd
stage lint cleaning, combined lint cleaning, cyclone robber, 1st stage mote, 2
nd stage mote,
combined mote, mote cyclone robber, mote cleaner, mote trash, battery condenser, and master
trash. This report focuses on PM2.5 emissions from 2nd
stage seed-cotton cleaning systems.
There are published PM10 (particulate matter with a particle diameter less than or equal to
a nominal 10-m aerodynamic equivalent diameter) and total particulate emission factors for
cotton gins in EPA’s Compilation of Air Pollution Emission Factors, AP-42 (EPA, 1996a,
1996b); however, there are no PM2.5, emission factors. The AP-42 average PM10 emission factor
for the No. 2 dryer and cleaner, which is an equivalent system to the 2nd
stage seed-cotton
cleaning system, was 0.043 kg (0.093 lb) per 217-kg (480-lb) equivalent bale with a range of
0.018 to 0.11 kg (0.040 to 0.23 lb) per bale. The AP-42 average total particulate emission factor
was 0.11 kg (0.24 lb) per bale with a range of 0.047 to 0.36 kg (0.10 to 0.79 lb) per bale. These
PM10 and total factors are based on five and seven tests, respectively, and were assigned EPA
emission factor quality ratings of D; the second lowest possible rating (EPA, 1996a).
Seed cotton is a perishable commodity that has no real value until the fiber and seed are
separated (Wakelyn et al., 2005). Cotton must be processed or ginned at the cotton gin to
separate the fiber and seed, producing 227-kg (500-lb) bales of marketable cotton fiber. Cotton
ginning is considered an agricultural process and an extension of the harvest by several federal
and state agencies (Wakelyn et al., 2005). Although the main function of the cotton gin is to
remove the lint fiber from the seed, many other processes also occur during ginning, such as
cleaning, drying, and packaging the lint. Pneumatic conveying systems are the primary method
Page 2 of 105

of material handling in the cotton gin. As material reaches a processing point, the conveying air
is separated and emitted outside the gin through a pollution control device. The amount of dust
emitted by a system varies with the process and the condition of the material in the process.
Cotton ginning is a seasonal industry with the ginning season lasting from 75 to 120 days,
depending on the size and condition of the crop. Although the trend for U.S. cotton production
remained generally flat at about 17 million bales per year during the last 20 years, production
from one year to the next often varied greatly for various reasons, including climate and market
pressure (Fig. 1). The number of active gins in the U.S. has not remained constant, steadily
declining to less than 700 in 2011. Consequently, the average volume of cotton handled by each
gin has risen and gin capacity has increased to an average of about 25 bales per hour across the
U.S. cotton belt (Valco et al., 2003, 2006, 2009, 2012).
Figure 1. Annual U.S. cotton production, active U.S. gins, and average ginning volume (bales per gin)
(NASS, 1993-2012).
Page 3 of 105
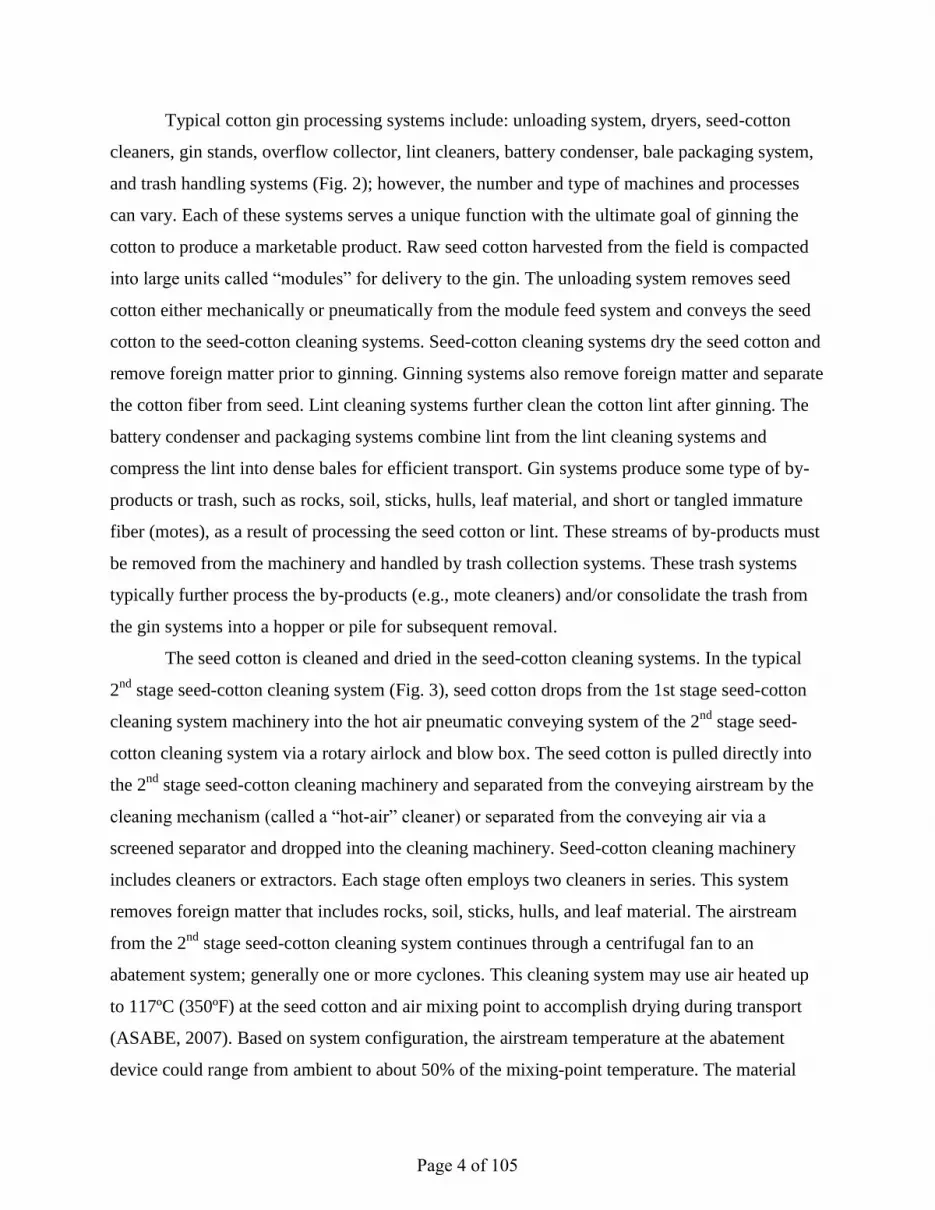
Typical cotton gin processing systems include: unloading system, dryers, seed-cotton
cleaners, gin stands, overflow collector, lint cleaners, battery condenser, bale packaging system,
and trash handling systems (Fig. 2); however, the number and type of machines and processes
can vary. Each of these systems serves a unique function with the ultimate goal of ginning the
cotton to produce a marketable product. Raw seed cotton harvested from the field is compacted
into large units called “modules” for delivery to the gin. The unloading system removes seed
cotton either mechanically or pneumatically from the module feed system and conveys the seed
cotton to the seed-cotton cleaning systems. Seed-cotton cleaning systems dry the seed cotton and
remove foreign matter prior to ginning. Ginning systems also remove foreign matter and separate
the cotton fiber from seed. Lint cleaning systems further clean the cotton lint after ginning. The
battery condenser and packaging systems combine lint from the lint cleaning systems and
compress the lint into dense bales for efficient transport. Gin systems produce some type of by-
products or trash, such as rocks, soil, sticks, hulls, leaf material, and short or tangled immature
fiber (motes), as a result of processing the seed cotton or lint. These streams of by-products must
be removed from the machinery and handled by trash collection systems. These trash systems
typically further process the by-products (e.g., mote cleaners) and/or consolidate the trash from
the gin systems into a hopper or pile for subsequent removal.
The seed cotton is cleaned and dried in the seed-cotton cleaning systems. In the typical
2nd
stage seed-cotton cleaning system (Fig. 3), seed cotton drops from the 1st stage seed-cotton
cleaning system machinery into the hot air pneumatic conveying system of the 2nd
stage seed-
cotton cleaning system via a rotary airlock and blow box. The seed cotton is pulled directly into
the 2nd
stage seed-cotton cleaning machinery and separated from the conveying airstream by the
cleaning mechanism (called a “hot-air” cleaner) or separated from the conveying air via a
screened separator and dropped into the cleaning machinery. Seed-cotton cleaning machinery
includes cleaners or extractors. Each stage often employs two cleaners in series. This system
removes foreign matter that includes rocks, soil, sticks, hulls, and leaf material. The airstream
from the 2nd
stage seed-cotton cleaning system continues through a centrifugal fan to an
abatement system; generally one or more cyclones. This cleaning system may use air heated up
to 117ºC (350ºF) at the seed cotton and air mixing point to accomplish drying during transport
(ASABE, 2007). Based on system configuration, the airstream temperature at the abatement
device could range from ambient to about 50% of the mixing-point temperature. The material
Page 4 of 105

handled by the abatement system is typically the same as that removed by the seed-cotton
cleaning machinery (rocks, soil, sticks, hulls, and leaf material) and lint extracted with the trash
(Fig. 4).
Figure 2. Typical modern cotton gin layout (Courtesy Lummus Corp., Savannah, GA).
Figure 3. Typical cotton gin 2
nd stage seed-cotton cleaning
system layout (Courtesy Lummus Corp., Savannah, GA).
Figure 4. Photograph of typical
trash captured by the 2nd
stage
seed-cotton cleaning system
cyclones.
Page 5 of 105
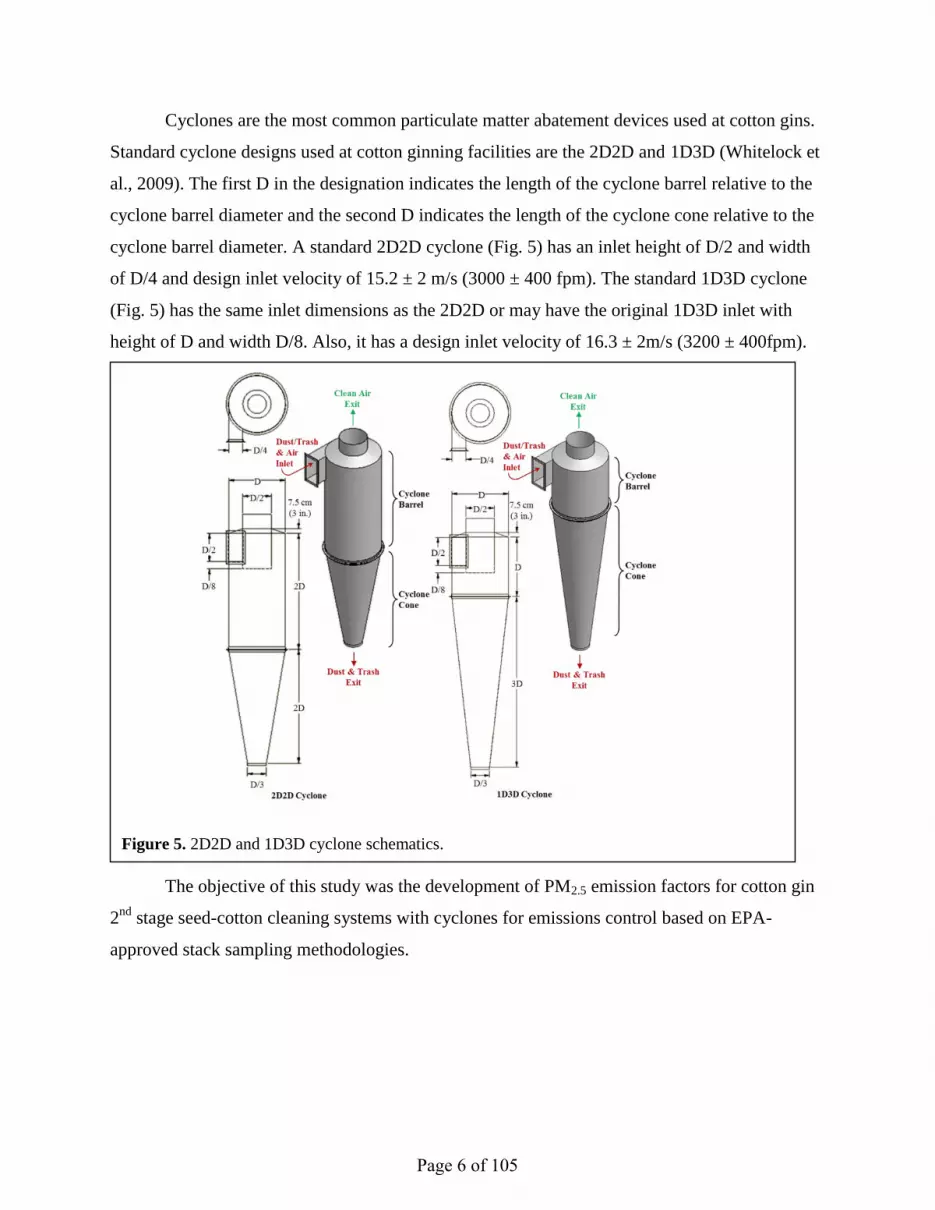
Cyclones are the most common particulate matter abatement devices used at cotton gins.
Standard cyclone designs used at cotton ginning facilities are the 2D2D and 1D3D (Whitelock et
al., 2009). The first D in the designation indicates the length of the cyclone barrel relative to the
cyclone barrel diameter and the second D indicates the length of the cyclone cone relative to the
cyclone barrel diameter. A standard 2D2D cyclone (Fig. 5) has an inlet height of D/2 and width
of D/4 and design inlet velocity of 15.2 ± 2 m/s (3000 ± 400 fpm). The standard 1D3D cyclone
(Fig. 5) has the same inlet dimensions as the 2D2D or may have the original 1D3D inlet with
height of D and width D/8. Also, it has a design inlet velocity of 16.3 ± 2m/s (3200 ± 400fpm).
The objective of this study was the development of PM2.5 emission factors for cotton gin
2nd
stage seed-cotton cleaning systems with cyclones for emissions control based on EPA-
approved stack sampling methodologies.
Figure 5. 2D2D and 1D3D cyclone schematics.
Page 6 of 105

METHODS
Two advisory groups were established for this project. The industry group consisted of
cotton ginning industry leaders and university and government researchers. The air quality group
included members from state and federal regulatory agencies, and university and government
researchers. Both groups were formed to aid in project planning, gin selection, data analyses, and
reporting. The project plan was described in detail by Buser et al. (2012).
Seven gins were sampled across the cotton belt. Key factors for selecting specific cotton
gins included: 1) facility location (geographically diverse), 2) industry representative production
capacity, 3) typical processing systems and 4) equipped with properly designed and maintained
1D3D cyclones. Operating permits, site plans, and aerial photographs were reviewed to evaluate
potential sites. On-site visits were conducted on all candidate gins to evaluate the process
systems and gather information including system condition, layout, capacities, and standard
operation. Using this information, several gins from each selected geographical region were
selected and prioritized based on industry advisory group discussions. Final gin selection from
the prioritized list was influenced by crop limitations and adverse weather events in the region.
Based on air quality advisory group consensus, EPA Other Test Method 27 (OTM27)
was used to sample the 2nd
stage seed-cotton cleaning system at each gin. When testing for this
project began in 2008, OTM27 was the EPA method for determination of PM10 and PM2.5 from
stationary sources. In December 2010, OTM27 was replaced with a revised and finalized Method
201A (CFR, 2010). The revised Method 201A was a successor to OTM27. The two methods
were similar to the point that EPA stated in an answer to a frequently asked question for Method
201A (EPA, 2010) that “If the source was using OTM 27 (and 28) for measuring either PM10 or
PM2.5 then using the revised reference methods Method 201A (and 202) should not be a concern
and should give equivalent results.” Accordingly, OTM27 is no longer an EPA method that can
be cited, and the revised Method 201A will be cited in this manuscript. Using Method 201A to
sample PM2.5, the particulate-laden stack gas was withdrawn isokinetically (the velocity of the
gas entering the sampler was equal to the velocity of the gas in the stack) through a PM10 sizing
cyclone and a PM2.5 sizing cyclone, and then collected on an in-stack filter (Fig. 6). The methods
for retrieving the filter and conducting acetone washes of the sizing cyclones are described in
detail in Method 201A (CFR, 2010). The mass of each size fraction was determined by
gravimetric analysis and included: > 10 µm (PM10 sizing cyclone catch acetone wash); 10 to 2.5
Page 7 of 105

µm (PM10 sizing cyclone exit acetone wash and PM2.5 sizing cyclone catch acetone wash); and ≤
2.5 µm (PM2.5 sizing cyclone exit acetone wash and filter). The PM2.5 mass was determined by
adding the mass of particulates captured on the filter and the ≤ 2.5 µm wash. The PM10 mass was
determined by adding the PM2.5 mass and the mass of the 10 to 2.5 µm wash. Total particulate
was determined by adding the PM10 mass and the mass of the > 10 m wash.
Figure 7 shows the performance curves for the PM10 and PM2.5 sizing cyclones. To
measure both PM10 and PM2.5 the Method 201A requires selecting a gas sampling rate in the
middle of the overlap zone of the performance curves for both sizing cyclones. For this study, the
method was specifically used to collect filterable PM2.5 emissions (solid particles emitted by a
source at the stack and captured in the ≤ 2.5 µm wash and on the filter [CFR, 2010]). The PM10
sizing cyclone was used to scrub larger particles from the airstream to minimize their impact on
the PM2.5 sizing cyclone Thus, the gas sampling rate was targeted to optimize the PM2.5 cyclone
performance.
Only one stack from each 2nd
stage seed-cotton cleaning system was tested. For systems
with multiple stacks, it was assumed that emissions from each stack of the system were
equivalent and the total emissions were calculated by multiplying the measured emission rates by
the total number of cyclones used to control the process tested (EPA, 1996a). To obtain reliable
results, the same technician from the same certified stack sampling company (Reliable Emissions
Measurements, Auberry, CA), trained and experienced in stack sampling cotton gins, conducted
the tests at all seven cotton gins.
Page 8 of 105

All stack sampling equipment, including the sizing cyclones, was purchased from Apex
Instruments (Fuquay-Varina, NC) and met specifications of Method 201A. The sampling media
were 47 mm Zefluor filters (Pall Corporation, Port Washington, NY) and the sample recovery
and analytical reagent was American Chemical Society certified acetone (A18-4, Fisher
Chemical, Pittsburgh, PA – assay ≥ 99.5%). Filters and wash tubs and lids were pre-labeled and
pre-weighed and stored in sealed containers at the USDA-ARS Air Quality Lab (AQL) in
Lubbock, TX, and then transported to each test site. Prior to testing, the certified stack testing
technician conducted calibrations and checks on all stack sampling equipment according to EPA
Method 201A.
Each cyclone tested was fitted with a cyclone stack extension that incorporated two
sampling ports (90° apart) and airflow straightening vanes to eliminate the cyclonic flow of the
air exiting the cyclone (Fig. 8). The extensions were designed to meet EPA criteria (EPA, 1989)
with an overall length of 3 m (10 ft) and sampling ports 1.2-m (48-in)downstream from the
straightening vanes and 0.9-m (36-in) upstream from the extension exit.
The tests were conducted by the certified stack sampling technician in an enclosed
sampling trailer at the base of the cyclone bank (Fig. 9). Sample retrieval, including filters and
sampler head acetone washes, was conducted according to Method 201A protocols. After
retrieval, filters were sealed in individual Petri dishes and acetone washes were dried on-site in a
Figure 7. Acceptable sampling rate for combined cyclone heads (CFR, 2010). Cyclone I = PM10
sizing cyclone and Cyclone IV = PM2.5 sizing cyclone (Gas temperatures for the 2nd
stage seed-
cotton cleaning systems tested ranged from 17 to 64oC [63-147
oF]).
Page 9 of 105

conduction oven at 49°C (120°F) and then sealed with pre-weighed lids and placed in individual
plastic bags for transport to the AQL in Lubbock, TX for gravimetric analyses. During testing,
bale data (ID number, weight, and date/time of bale pressing) were either manually recorded by
the bale press operator or captured electronically by the gin’s computer system for use in
calculating emission factors in terms of kg/bale (lb/bale). Emission factors and rates were
calculated in accordance with Method 201A and ASAE Standard S582 (ASABE, 2005).
All laboratory analyses were conducted at the AQL. All filters were conditioned in an
environmental chamber (21 ± 2oC [70 ± 3.6
oF]; 35 ± 5% RH) for 48 h prior to gravimetric
analyses. Filters were weighed in the environmental chamber on a Mettler MX-5 microbalance
(Mettler-Toledo Inc., Columbus, OH – 1 µg readability and 0.9 µg repeatability) after being
passed through an anti-static device. The MX-5 microbalance was leveled on a marble table and
housed inside an acrylic box to minimize the effects of air currents and vibrations. To reduce
recording errors, weights were digitally transferred from the microbalance directly to a
spreadsheet. Technicians wore latex gloves and a particulate respirator mask to avoid
Figure 8. Schematic and photographs of stack extensions with sampling
ports and staightening vanes (rail attached to extension above sampling port,
at right, supports sampling probe during testing traverse).
Page 10 of 105

contamination. AQL procedures required that each sample be weighed three times. If the
standard deviation of the weights for a given sample exceeded 10 μg, the sample was reweighed.
Gravimetric procedures for the acetone wash tubs were the same as those used for filters.
In addition to gravimetric analyses, each sample was visually inspected for unusual
characteristics, such as cotton lint content or extraneous material. Digital pictures were taken of
all filters and washes for documentation purposes prior to further analyses. After the laboratory
analyses were completed all stack sampling, cotton gin production, and laboratory data were
merged.
RESULTS
Five of the seven gins were equipped with 2nd
stage seed-cotton cleaning systems. The
2nd
stage seed-cotton cleaning systems sampled were typical for the industry, but varied among
the gins. The 2nd
stage seed-cotton cleaning systems at gin A utilized two, separate and parallel,
systems (Fig. 10). In each of these parallel systems, the seed-cotton material was pneumatically
Figure 9. Clockwise from top right: cotton gin stack sampling with air quality lab trailer and
technicians on lifts; certified stack sampling technician in the trailer control room conducting
tests;sample recovery in trailer clean room; technician operating the probe at stack level.
Page 11 of 105

conveyed from the 1st stage seed-cotton cleaning system with heated air through a dryer to a
seed-cotton cleaner in the 2nd
stage seed-cotton cleaning system. The material was separated
from the airstream by the cleaner. The air from each of the parallel 2nd
stage seed-cotton cleaning
systems then passed through separate fans and exhausted through separate cyclones. The 2nd
stage seed-cotton cleaning systems at gin D also utilized two, parallel streams like those at gin A,
except the seed-cotton material dropped from the first set of cleaners into a second set (Fig. 11).
The 2nd
stage seed-cotton cleaning system at gin E was also similar to the systems at gin A,
except gin E utilized only a single processing stream with dryer, seed-cotton cleaner, fan, and
cyclone, instead of two, parallel streams (Fig. 12). Gin F utilized two, parallel 2nd
stage seed-
cotton cleaning systems with two sets of cleaners, similar to gin D, except there were no dryers
before the first set of cleaners (Fig. 13). Gin G had the simplest 2nd
stage seed-cotton cleaning
system. At gin G, the seed-cotton material was pneumatically conveyed in a single stream from
the 1st stage seed-cotton cleaning system to a seed-cotton cleaner in the 2
nd stage seed-cotton
cleaning system. The material was separated from the airstream by the cleaner and the air then
passed through a fan and exhausted through one or more cyclones (Fig. 14).
All the 2nd
stage seed-cotton cleaning systems sampled utilized 1D3D cyclones to control
emissions (Fig. 5), but there were some cyclone design variations among the gins (Table 1 and
Fig. 15). All the gins, except gins A and E, split the system exhaust flow between two cyclones
in a dual configuration (side-by-side as opposed to one-behind-another). The system airstreams
for gins A and E were exhausted through a single cyclone. Inlets on all the 2nd
stage seed-cotton
Figure 10. Schematic of split stream, single
cleaner 2nd
stage seed-cotton cleaning system
with dryer (gin A).
Figure 11. Schematic of split stream, double cleaner
2nd
stage seed-cotton cleaning system with dryer (gin
D).
Page 12 of 105

cleaning cyclones were 2D2D type, except gin A that had inverted 1D3D inlets. Expansion
chambers were present on 2nd
stage seed-cotton cleaning cyclones at all gins, except gins E and F
that had standard cones. All of the cyclone variations outlined above, if properly designed and
maintained, are recommended for controlling cotton gin emissions (Whitelock et al., 2009). The
cyclones at gin F had angle-iron welded inside, down the length of the cone (Figure 16). This is
occasionally done by cyclone manufacturers for systems with high particulate loading, especially
sand, to encourage material to exit the cyclone more quickly and reduce cone wear; this is not a
recommended practice.
Table 1. Abatement device configurationz for 2
nd stage seed-cotton cleaning systems tested.
Gin
Cyclone
Type
Inlet
Designy
Systems
per Gin
Cyclones
per Gin Configuration
Cone
Design
Trash
Exits tox
A 1D3D inverted
1D3D 2 2 Single
expansion
chamber hopper
D 1D3D 2D2D 2 4 Dual expansion
chamber hopper
E 1D3D 2D2D 1 1 Single standard auger
F 1D3D 2D2D 2 4 Dual standard auger
G 1D3D 2D2D 1 2 Dual expansion
chamber auger
z Figures 5 and 15
y Inverted 1D3D inlet has duct in line with the bottom of the inlet
x Systems to remove material from cyclone trash exits: hopper = large storage container directly under
cyclone trash exit; auger = enclosed, screw-type conveyor
Figure 12. Schematic of single stream, single
cleaner 2nd
stage seed-cotton cleaning system
with dryer (gin E).
Figure 13. Schematic of split stream, double
cleaner 2nd
stage seed-cotton cleaning system
without dryer (gin F).
Page 13 of 105

Table 2 shows the test parameters for
each Method 201A test run for the 2nd
stage
seed-cotton cleaning systems sampled at the
five gins. The system average ginning rate was
33.8 bales/h and the test average ginning rates
at each gin ranged from 23.9 to 41.3 bales/h
(based on 227-kg [500-lb] equivalent bales).
The capacity of gins sampled was
representative of the industry average,
approximately 25 bales/h. The 1D3D cyclones
were all operated with inlet velocities within
design criteria, 16.3 ± 2 m/s (3200 ± 400 fpm),
except the test runs at gin D that were outside the design range due to limitations in available
system adjustments.
There are criteria specified in EPA Method 201A for test runs to be valid for PM2.5,
PM10, or total particulate measurements (CFR, 2010). Isokinetic sampling must fall within EPA
defined ranges (100 ± 20%) for valid PM2.5 and PM10 test runs. All tests met the isokinetic
criteria (Table 2), except run three for gin D and run one for gin F; these runs were removed
from the emissions test averages in Tables 3 and 4. To use the method to also obtain total
Figure 15. Cyclone design variations for the tested systems (left to right): dual configuration that splits
flow between identical 1D3D cyclones with 2D2D inlets; 1D3D cyclone with an inverted 1D3D inlet;
1D3D cyclone with 2D2D inlet and expansion chamber on the cone; 1D3D cyclone with 2D2D inlet
and standard cone.
Figure 14. Schematic of single stream, single
cleaner 2nd
stage seed-cotton cleaning system
without dryer (gin G).
Page 14 of 105

filterable particulate, sampling must be within 90 to 110% of
isokinetic flow. This criterion was not met in the third test
run for gin A, the second test run for E, or in all the test runs
for gins D and F; thus the data associated with these runs
were omitted from the total particulate test averages. The
PM2.5 aerodynamic cut size must fall within EPA defined
ranges (2.50 ± 0.25 m) for valid PM2.5 test runs. PM2.5 cut
size criteria were not met in the first test run for gin A, thus
the data associated with this run were omitted from the
PM2.5 test averages. The PM10 aerodynamic cut size must
fall within EPA defined ranges (10.0 ± 1.0 m) for valid
PM10 test runs. PM10 cut size criteria were not met in test
runs one and two for gins A and D, thus the data associated
with these runs were omitted from the PM10 test averages.
Sampling rates ranged from 10.3 to 13.4 standard l/min (0.36 to 0.47 standard ft3/min)
(Table 2). The stack gas temperatures ranged from 17 to 64oC (63-147
oF). The sampling method
documentation (CFR, 2010) warns that the acceptable gas sampling rate range is limited at the
stack gas temperatures encountered during this project’s testing, as indicated by the narrow
difference between the solid lines in Figure 7 for the temperatures listed above. These stack gas
characteristics justified targeting the PM2.5 cut size criteria and treating the PM10 cut size criteria
as secondary.
PM2.5 emissions data (ginning and emission rates and corresponding emission factors) for
the 2nd
stage seed-cotton cleaning systems are shown in Table 3. The system average PM2.5
emission factor was 0.0037 kg/bale (0.0080 lb/bale). The test average emission factors at each
gin ranged from 0.0027 to 0.0044 kg (0.0061-0.0098 lb) per bale and PM2.5 emission rates
ranged from 0.089 to 0.16 kg/h (0.20-0.36 lb/h). PM10 emissions data (ginning and emission
rates and corresponding emission factors) for the 2nd
stage seed-cotton cleaning systems are
shown in Table 4. The system average PM10 emission factor was 0.038 kg/bale (0.084 lb/bale).
The test average emission factors ranged from 0.017 to 0.053 kg (0.038-0.116 lb) per bale and
emission rates ranged from 0.40 to 1.96 kg/h (0.87-4.33 lb/h). Total particulate emissions data
(ginning and emission rates and corresponding emission factors) for the 2nd
stage seed-cotton
Figure 16. Angle-iron welded
to the inside surface of cyclone
cone at gin F.
Page 15 of 105

cleaning systems are shown in Table 5. The system average total particulate emission factor was
0.063 kg/bale (0.138 lb/bale). The test average emission factors ranged from 0.033 to 0.080 kg
(0.074-0.177 lb) per bale. Test average total particulate emission rates ranged from 0.81 to 2.72
kg/h (1.79-5.99 lb/h). The ratios of PM2.5 to total particulate, PM2.5 to PM10, and PM10 to total
particulate were 5.8, 9.5, and 61.1%, respectively (ratios calculated using tables 3, 4, and 5 may
vary slightly from those listed due to rounding).
The 2nd
stage seed-cotton cleaning system total particulate emission factor average for
this project was about 57.5% of the EPA AP-42 published value for the No. 2 dryer and cleaner
(EPA, 1996a, 1996b), which is an equivalent system to the 2nd
stage seed-cotton cleaning system.
The range of test average total particulate emission factors determined for this project and the
range of AP-42 emission factor data overlapped. The 2nd
stage seed-cotton cleaning system PM10
emission factor average for this project was 90.7% of the EPA AP-42 published value for the No.
2 dryer and cleaner. The test average PM10 emission factor range also overlapped with the AP-42
emission factor data range.
Figure 17 shows an example of samples recovered from a typical 2nd
stage seed-cotton
cleaning system test run. Often there were cotton lint fibers, which have cross-sectional
diameters much greater than 2.5 m, in the cotton gin cyclone exhausts. Therefore, it was not
unusual to find lint fiber in the > 10 µm wash from Method 201A. However, in the atypical
sample shown in Figure 18, lint fibers passed through the PM10 and PM2.5 cyclones and were
collected on the filter. This type of material carryover can bias the gravimetric measurements and
impact reported PM2.5 emission data. EPA Method 201A does not suggest methods to account
for these anomalies. Thus, no effort was made to adjust the data reported in this manuscript to
account for these issues.
Page 16 of 105

Table 2. Cotton gin production data and stack sampling performance metrics for the 2nd
stage
seed-cotton cleaning systems.
Test
Ginning
Rate,
Cyclone
Inlet
Velocity,
Isokinetic
Sampling,
Aerodynamic Cut
Size D50,
Sampling
Ratey
Stack
Temperature
Gin Run bales/hz
m/s fpm %
PM2.5, µm PM10, µm slpm scfm °C °F
A 1 24.2 17.2 3388 95 2.79v 11.8
v 10.3 0.362 19 67
2 24.3 17.2 3380 104 2.49 11.1v 11.2 0.395 18 64
3 23.2 17.0 3347 111w 2.32 10.6 11.8 0.418 17 63
Test
Average 23.9 17.1 3372
D 1 31.1 10.6 2091 111w 2.43 11.1
v 11.1 0.391 30 85
2 34.4 10.7 2113 114w 2.52 11.2
v 11.5 0.405 46 115
3
31.3 11.1 2185 122wx
2.26 10.5 12.7 0.448 49 120
Test
Average 32.3 10.8 2130
E 1 34.1 15.1 2979 110 2.33 10.7 12.2 0.431 44 112
2 39.0 14.9 2936 113w 2.31 10.7 12.4 0.437 46 115
3
39.6 14.4 2837 96 2.31 10.7 12.4 0.437 46 116
Test
Average 37.6 14.8 2918
F 1 47.4 14.3 2807 121wx
2.39 10.6 13.4 0.472 64 147
2 45.2 14.7 2889 112w 2.53 11.0 12.7 0.449 63 145
3 31.1 15.1 2969 114w 2.38 10.6 13.3 0.469 62 143
Test
Average 41.3 14.7 2888
G 1 33.9 15.5 3047 102 2.37 10.9 11.6 0.410 37 99
2 33.2 15.3 3003 103 2.37 10.9 11.6 0.409 37 99
3 34.6 15.4 3030 102 2.40 11.0 11.5 0.407 38 100
Test
Average 33.9 15.4 3026
System
Average 33.8 14.6 2867
z227 kg (500 lb) equivalent bales
y slpm = standard l/m, scfm = standard ft
3/m
x Did not meet PM2.5 or PM10 isokinetic sampling rate criteria (100 ± 20%)
w Did not meet total particulate isokinetic sampling rate criteria (100 ± 10%)
v Did not meet PM2.5 (2.50 ± 0.25 µm) or PM10 (10.0 ± 1.0 µm) aerodynamic cut size criteria
Page 17 of 105

Table 3. PM2.5 emissions data for the 2nd
stage seed-cotton cleaning systems.
Emission Rate, Emission Factor,
Gin Test Run kg/h lb/h kg/balez
lb/balez
A 1y 0.10 0.22 0.0041 0.0091
2 0.11 0.25 0.0047 0.0103
3 0.079 0.18 0.0034 0.0075
Test Average (n=2) 0.10 0.21 0.0041 0.0089
D 1 0.10 0.21 0.0031 0.0068
2 0.082 0.18 0.0024 0.0053
3y
0.094 0.21 0.0030 0.0066
Test Average (n=2) 0.089 0.20 0.0027 0.0061
E 1 0.20 0.45 0.0059 0.0131
2 0.14 0.31 0.0036 0.0080
3
0.15 0.33 0.0037 0.0082
Test Average (n=3) 0.16 0.36 0.0044 0.0098
F 1y 0.14 0.31 0.0030 0.0066
2 0.15 0.33 0.0033 0.0074
3 0.12 0.26 0.0038 0.0083
Test Average (n=2) 0.13 0.30 0.0036 0.0078
G 1 0.13 0.30 0.0039 0.0087
2 0.13 0.28 0.0038 0.0084
3 0.091 0.20 0.0026 0.0058
Test Average (n=3) 0.12 0.26 0.0035 0.0076
System Average (n=5)
0.0037 0.0080 z227 kg (500 lb) equivalent bales
y Test run omitted from test averages because the isokinetic sampling rate (100 ± 20%) and/or
aerodynamic cut size (2.50 ± 0.25 µm) were not met
Page 18 of 105

Table 4. PM10 emissions data for the 2nd
stage seed-cotton cleaning systems.
Emission Rate, Emission Factor,
Gin Test Run kg/h lb/h kg/balez
lb/balez
A 1y 0.48 1.07 0.020 0.044
2y 0.60 1.32 0.024 0.054
3 0.40 0.87 0.017 0.038
Test Average (n=1) 0.40 0.87 0.017 0.038
D 1y 0.19 0.41 0.006 0.013
2y 1.14 2.51 0.033 0.073
3y
1.03 2.26 0.033 0.072
Test Average (n=0)
E 1 2.03 4.49 0.060 0.131
2 1.89 4.17 0.049 0.107
3
1.96 4.32 0.050 0.109
Test Average (n=3) 1.96 4.33 0.053 0.116
F 1y 1.30 2.87 0.027 0.061
2 1.31 2.89 0.029 0.064
3 0.99 2.19 0.032 0.070
Test Average (n=2) 1.15 2.54 0.030 0.067
G 1 2.14 4.72 0.063 0.139
2 1.95 4.30 0.059 0.129
3 1.29 2.84 0.037 0.082
Test Average (n=3) 1.79 3.95 0.053 0.117
System Average (n=4)
0.038 0.084 z227 kg (500 lb) equivalent bales
y Test run omitted from test averages because the isokinetic sampling rate (100 ± 20%) and/or
aerodynamic cut size (10.0 ± 1.0 µm) were not met
Page 19 of 105

Table 5. Total particulate emissions data for the 2nd
stage seed-cotton cleaning systems.
Emission Rate, Emission Factor,
Gin Test Run kg/h lb/h kg/balez
lb/balez
A 1 0.73 1.61 0.030 0.066
2 0.90 1.98 0.037 0.081
3y 0.60 1.31 0.026 0.056
Test Average (n=2) 0.81 1.79 0.033 0.074
D 1y 0.25 0.55 0.008 0.018
2y 1.56 3.44 0.045 0.100
3y
1.45 3.20 0.046 0.102
Test Average (n=0)
E 1 2.78 6.13 0.081 0.180
2y 2.71 5.96 0.069 0.153
3
2.65 5.84 0.067 0.148
Test Average (n=2) 2.72 5.99 0.074 0.164
F 1y 1.89 4.16 0.040 0.088
2y 2.22 4.90 0.049 0.108
3y
1.64 3.61 0.053 0.116
Test Average (n=0)
G 1 2.90 6.40 0.086 0.189
2 3.01 6.63 0.090 0.199
3 2.23 4.91 0.064 0.142
Test Average (n=3) 2.71 5.98 0.080 0.177
System Average (n=3)
0.063 0.138 z227 kg (500 lb) equivalent bales
y Test run omitted from test averages because the isokinetic sampling rate (100 ± 10%) was not met
Figure 17. Typical EPA Method 201A filter and
sampler head acetone washes from the 2nd
stage
seed-cotton cleaning system. Clockwise from top
left:> 10 µm wash, 10 to 2.5 µm wash, ≤ 2.5 µm
wash, and filter.
Figure 18. EPA Method 201A filter and sampler
head acetone washes from the 2nd
stage seed-
cotton cleaning system with lint on the filter.
Clockwise from top left:> 10 µm wash, 10 to 2.5
µm wash, ≤ 2.5 µm wash, and filter.
Page 20 of 105

SUMMARY
Seven cotton gins across the U.S. cotton belt were stack sampled using EPA Method
201A to fill the data gap that exists for PM2.5 cotton gin emissions data. Five of the seven gins
were equipped with 2nd
stage seed-cotton cleaning systems. All the systems were equipped with
1D3D cyclones for emissions control with some slight variations in inlet and cone design. In
terms of capacity, the five gins were typical of the industry, averaging 33.8 bales/h during
testing. Some test runs were excluded from the test averages because they failed to meet EPA
Method 201A Test criteria. Also, other test runs, included in the analyses, had cotton lint fibers
that collected in the ≤ 10 µm and/or ≤ 2.5 µm samples. This larger lint material can impact the
reported emissions data, but EPA Method 201A does not suggest methods to account for these
anomalies. Average measured 2nd
stage seed-cotton cleaning system PM2.5 emission factor based
on the five gins tested (12 total test runs) was 0.0037 kg/227-kg bale (0.0080 lb/500-lb bale). The
2nd
stage seed-cotton cleaning system emission factors for PM10 and total particulate were 0.038
kg/bale (0.084 lb/bale) and 0.063 kg/bale (0.138 lb/bale), respectively. The gin test average
PM2.5, PM10 and total particulate emission rates ranged from 0.089 to 0.16 kg/h (0.20-0.36 lb/h),
0.40 to 1.96 kg/h (0.87-4.33 lb/h) and 0.81 to 2.72 kg/h (1.79-5.99 lb/h), respectively. System
average PM10 and total particulate emission factors were lower than those currently published in
EPA AP-42. The ratios of 2nd
stage seed-cotton cleaning system PM2.5 to total particulate, PM2.5
to PM10, and PM10 to total particulate were 5.8, 9.5, and 61.1%, respectively. These data are the
first published data to document PM2.5 emissions from 2nd
stage seed-cotton cleaning systems at
cotton gins.
Page 21 of 105

REFERENCES
American Society of Agricultural and Biological Engineers (ASABE). 2005. Cotton Gins—
Method of Utilizing Emission Factors in Determining Emission Parameters. ASAE S582,
March 2005. American Society of Agricultural and Biological Engineers, St. Joseph, MI.
American Society of Agricultural and Biological Engineers (ASABE). 2007. Temperature
Sensor Locations for Seed-Cotton Drying Systems. ASAE S530.1, August 2007.
American Society of Agricultural and Biological Engineers, St. Joseph, MI.
Buser, M.D., D.P. Whitelock, J.C. Boykin, and G.A. Holt. 2012. Characterization of cotton gin
particulate matter emissions—Project plan. J. Cotton Sci. 16:105–116.
Code of Federal Regulations (CFR). 2006. National ambient air quality standards for particulate
matter; final rule. 40 CFR, Part 50. U.S. Government Printing Office, Washington, D.C.
Code of Federal Regulations (CFR). 2010. Method 201A—Determination of PM10and
PM2.5emissions from stationary sources (Constant sampling rate procedure). 40 CFR 51,
Appendix M. Available at http://www.epa.gov/ttn/emc/promgate/m-201a.pdf (verified 19
Aug. 2013).
Environmental Protection Agency (EPA). 1989. Particulate sampling in cyclonic flow. U.S.
Environmental Protection Agency, Washington, DC. Available online at
http://www.epa.gov/ttn/emc/guidlnd/gd-008.pdf (verified 19 Aug. 2013).
Environmental Protection Agency (EPA). 1996a. Emission factor documentation for AP-42,
Section 9.7, Cotton Ginning (EPA Contract No. 68-D2-0159; MRI Project No. 4603-01,
Apr. 1996). Publ. AP-42. U.S. Environmental Protection Agency, Washington, DC.
Environmental Protection Agency (EPA). 1996b. Food and agricultural industries: Cotton gins.
In Compilation of air pollution emission factors, Volume 1: Stationary Point and Area
Sources. Publ. AP-42. U.S. Environmental Protection Agency, Washington, DC.
Environmental Protection Agency (EPA). 2010. Frequently asked questions (FAQS) for Method
201A [Online]. Available at http://www.epa.gov/ttn/emc/methods/method201a.html
(verified 19 Aug. 2013).
Page 22 of 105

National Agricultural Statistics Service (NASS).1993-2012. Cotton Ginnings Annual Summary
[Online]. USDA National Agricultural Statistics Service, Washington, DC. Available at
http://usda.mannlib.cornell.edu/MannUsda/viewDocumentInfo.do?documentID=1042
(verified 19 Aug. 2013).
Valco, T.D., H. Ashley, J.K. Green, D.S. Findley, T.L. Price, J.M. Fannin, and R.A. Isom. 2012.
The cost of ginning cotton—2010 survey results. p. 616–619 In Proc. Beltwide Cotton
Conf., Orlando, FL. 3-6 Jan. 2012. Natl. Cotton Counc. Am., Memphis, TN.
Valco, T.D., B. Collins, D.S. Findley, J.K. Green, L. Todd, R.A. Isom, and M.H. Wilcutt. 2003.
The cost of ginning cotton—2001 survey results. p. 662–670 In Proc. Beltwide Cotton
Conf., Nashville, TN. 6-10 Jan. 2003. Natl. Cotton Counc. Am., Memphis, TN.
Valco, T.D., J.K. Green, R.A. Isom, D.S. Findley, T.L. Price, and H. Ashley. 2009. The cost of
ginning cotton – 2007 survey results. p. 540–545 In Proc. Beltwide Cotton Conf., San
Antonio, TX. 5-8 Jan. 2009. Natl. Cotton Counc. Am., Memphis, TN.
Valco, T.D., J.K. Green, T.L. Price, R.A. Isom, and D.S. Findley. 2006. Cost of ginning cotton –
2004 survey results. p. 618–626 In Proc. Beltwide Cotton Conf., San Antonio, TX. 3-6
Jan. 2006. Natl. Cotton Counc. Am., Memphis, TN.
Wakelyn, P.J., D.W. Thompson, B.M. Norman, C.B. Nevius, and D.S. Findley. 2005. Why
cotton ginning is considered agriculture. Cotton Gin and Oil Mill Press 106(8):5–9.
Whitelock, D.P., C.B. Armijo, M.D. Buser, and S.E. Hughs. 2009 Using cyclones effectively at
cotton gins. Appl. Eng. Ag. 25:563–576.
Page 23 of 105

Field and Laboratory Data
Page 24 of 105

Gin A Field and Laboratory Data
Page 25 of 105

A#400 2 Drying 1D3D2008
Emission Factor (lbs/bale) Emission Rate (lbs/hr)Based on EPA Method OTM27 Based on EPA Method OTM27
Total PM Total PMRun 1 0.0664 Run 1 1.6078Run 2 0.0811 Run 2 1.9755
X Run 3 0.0564 Run 3 1.3104Average 0.0738 Average 1.7916
PM10 PM10
Y Run 1 0.0441 Run 1 1.0678Y Run 2 0.0540 Run 2 1.3148
Run 3 0.0375 Run 3 0.8718Average 0.0375 Average 0.8718
PM2.5 PM2.5
Z Run 1 0.0091 Run 1 0.2197Run 2 0.0103 Run 2 0.2520Run 3 0.0075 Run 3 0.1747
Average 0.0089 Average 0.2133PM10-2.5 PM10-2.5
Run 1 0.0350 Run 1 0.8481Run 2 0.0437 Run 2 1.0628Run 3 0.0300 Run 3 0.6971
Average 0.0300 Average 0.6971PM2.5/PM10
Run 1 20.6%Run 2 19.2%Run 3 20.0%
Average 23.8%PM2.5/TSP
Run 1 13.7%Run 2 12.8%Run 3 13.3%
Average 12.1%PM10/TSP
Run 1 66.4%Run 2 66.6%Run 3 66.5%
Average 50.9%
Y: Run omitted from all dependent averages - PM 10 ISO or D50 not metZ: Run omitted from all dependent averages - PM 2.5 ISO or D50 not met
Gin:Exhaust:
Date:
X: Run omitted from all dependent averages - Total PM ISO not met
Page 26 of 105

#400 2 Drying 1D3D Run #1 Run #2 Run #3
ø - Start of Run, time 14:04 16:19 18:25
ø - End of Run, time 15:30 17:26 19:31
Vlc - Volume of water collected, ml 0.0 0.0 0.0
Vm - Gas volume, meter cond., dcf 29.251 18.139 25.734
Y - Meter calibration factor 1.003 1.003 1.003
Pbar - Barometric pressure, in. Hg 26.05 26.05 26.05
Pg - Stack static pressure, in. H2O -0.17 -0.17 -0.17
ˆH - Avg. meter press. diff., in. H2O 0.477 0.503 0.501
Tm - Absolute meter temperature, °R 520.0 518.3 519.1
Vm(std) - Standard sample gas vol., dscf 25.9719 16.1585 22.8910
Bws - Water vapor part in gas stream 0.006 0.006 0.006
CO2 - Dry concentration, volume % 0.00 0.00 0.00
O2 - Dry concentration, volume % 0.0 0.0 0.0
Md - Mole wt. stack gas, dry, g/mole 28.844 28.844 28.844
Ms - Mole wt. stack gas, wet, g/gmole 28.779 28.779 28.779
Cp - Pitot tube coef., dimensionless 0.840 0.840 0.840
ˆp - Avg. of sq. roots of eachˆp 0.597 0.597 0.592
Ts - Absolute stack Temp. °R 526.5 524.3 523.0
A - Area of stack, square feet 2.64 2.64 2.64
Vs - Stack Gas Flow, ft/sec 35.95 35.86 35.52
Qstd - Volumetric flow rate, dscfm 4,939 4,948 4,912
An - Area of nozzle, square feet 1.767E-04 1.767E-04 1.767E-04
ø - Sampling time, minutes 82.68 46.94 62.78
DP50 - Cut size, microns 11.80 11.06 10.62
I - Isokinetic variation, percent 95.0 103.9 110.9
Sts - Stacks per system 2 2 2
OTM METHOD 27 FIELD DATA SUMMARYA
REM PM-10, 2.5 - 2008
Page 27 of 105

#400 2 Drying 1D3D Run #1 Run #2 Run #3 AVERAGE
Qstd - Volumetric flow rate, dscfm 4,939 4,948 4,912 4,933
Vm(std) - Standard sample gas vol., dscf 25.9719 16.1585 22.8910 21.6738
DP50 - Cut size, microns 10µ 11.80 11.06 10.62 11.16
DP50 - Cut size, microns 2.5µ 2.79 2.49 2.32 2.53
Bale/hr - Total 500 lb Bales per hr 24.2 24.3 23.2 23.9
>10 µ - Total PM g 0.0107 0.0082 0.0077 0.0089
>10 µ - Total PM gr/dscfm 0.0064 0.0078 0.0052 0.0065
>10 µ - Total PM lb/hr 0.270 0.330 0.219 0.2732
>10 µ - Total PM lb/bale 0.0112 0.0136 0.0094 0.0114
10 µ -2.5 µ - PM-10 - 2.5 g 0.0169 0.0131 0.0123 0.0141
10 µ -2.5 µ - PM-10 gr/dscf 0.0100 0.0125 0.0083 0.0103
10 µ -2.5 µ - PM-10 lb/hr 0.424 0.531 0.349 0.435
10 µ -2.5 µ - PM-10 lb/bale 0.0175 0.0218 0.0150 0.0181
< 2.5 µ - PM-2.5 g 0.0044 0.0031 0.0031 0.0035
< 2.5 µ - PM-2.5 gr/dscf 0.0026 0.0030 0.0021 0.00255
< 2.5 µ - PM-2.5 lb/hr 0.110 0.126 0.087 0.108
< 2.5 µ - PM-2.5 lb/bale 0.0045 0.0052 0.0038 0.0045
TPM - Total PM g 0.0320 0.0244 0.0231 0.0265
TPM - Total PM gr/dscf 0.0190 0.0233 0.0156 0.0193
TPM - Total PM lb/hr 0.804 0.988 0.655 0.82
TPM - Total PM lb/bale 0.0332 0.0406 0.0282 0.0340
OTM METHOD 27 FIELD DATA SUMMARYA
REM PM-10, 2.5 - 2008
Page 28 of 105

Run #1 Run #2 Run #3 AverageTotal Particulate Per Cyclone
Total gr/dscf 0.0190 0.0233 0.0156 0.0193Total lb/hr 0.80 0.99 0.66 0.82Total lb/bale 0.0332 0.0406 0.0282 0.0340
Total Particulate Per SystemTotal lb/hr 1.61 1.98 1.31 1.63Total lb/bale 0.066 0.081 0.056 0.068
< 10 µ Results per Cyclone- 10 µ gr/dscf 0.0126 0.0155 0.0104 0.0128- 10 µ (lb/hr) 0.53 0.66 0.44 0.54- 10 µ (lb/Bale) 0.0221 0.0270 0.0188 0.0226
< 10 µ Results per System- 10 µ (lb/hr) 1.07 1.31 0.87 1.08- 10 µ (lb/Bale) 0.044 0.054 0.038 0.045
< 2.5 µ Results per Cyclone- 2.5 µ gr/dscf 0.0026 0.0030 0.0021 0.0025- 2.5 µ (lb/hr) 0.11 0.13 0.09 0.11- 2.5 µ (lb/Bale) 0.0045 0.0052 0.0038 0.0045
< 2.5 µ Results per System- 2.5 µ (lb/hr) 0.22 0.25 0.17 0.22- 2.5 µ (lb/Bale) 0.009 0.010 0.008 0.009
Average Bales/hr 24.20 24.35 23.22 23.92
Cyclone Flow-RatesVs 35.95 35.86 35.52 35.78Acfm 5,694 5,680 5,625 5,666Dscfm 4,939 4,948 4,912 4,933
Cyclone Inlet VelocityVsfm 3388 3380 3347 3372
System Flow-RatesAcfm - - - 11,333Dscfm - - - 9,866
Number of Cyclones in System 2REM PM-10, 2.5 - 2001
A#400 2 Drying 1D3D
OTM METHOD 27 RESULTS
Page 29 of 105

Plant: A Unit: #400 2 Drying 1D3D Date: 12/9/2008 Lab#: 608-099Location: Cyclones in System: 2 Std Temp (Tstd): 68 °F
Cyclone Dia (in.): 44.00 Bales/hr: 24.20 Std Pressure: 29.92 in HgPbar: 26.05 in Hg Static Sp: -0.17 in water dcO2: 20.90 %
Run-Time, Ø: 60 min Pitot Factor: 0.84 Cp dcCO2: 0.05 %Meter Factor: 1.003 Y % H2O: 0.020 Bws* 2.0% dcN2: 79.05 %Meter Factor: 1.895 ¯H@ Meter Temp: 60.0 °F Stack Dia: 22.00 Sd in
Pre-test Leak Check: 0.000 cfm Pitot Leak Check: OK Post-test Leak Check: 0.000 cfm**EPA 201A - 10u & 2.5u: PRE - TEST CALCULATIONS
Delta P1 - Run: 0.300 pµs: 179.93 Ideal Nd: 0.187 Point 1 Ø: 6.32pMd: 28.84 pQs: 0.42123 Input Nd: 0.180 Vn ft/sec: 39.73pMs: 28.63 ¯H + 50 °F: 0.399 Closest Nd: 0.180 Delta H: 0.477
Ps in Hg: 26.04 ¯p min + 50°F: 0.179 V ft/sec min: 26.89 Ø: 60.0pVs, ft/sec: 36.65 ¯p max + 50°F: 0.636 V ft/sec max: 50.72 Dwell Time Const. 11.54
Stack Area pSa: 2.64 ¯H - 50 °F: 0.581 ¯p min: 0.195 Meter Volume: 24.0Acfm: 5805 ¯p min - 50°F: 0.216 ¯p max: 0.695 dscfm 0.401
pTs Stack: 74.8 ¯p max - 50 °F: 0.767 Vn/Vs x 100: 108.40 EPA 201A: TEST DATA & CALCULATIONS
Pre-Test Data Test Run Data Impinger Weights, gramsPoint Stack Temp ¯P Elapsed Ts Tm °F Tm °F ¯P Delta H Meter Volume Final InitialNo. °F "H2O Time °F Inlet Outlet "H2O "H2O Cubic Feet1 70 0.580 0.00 61.0 58 58 0.300 0.477 Initial Reading 12 72 0.390 6.32 67.0 58 58 0.380 0.477 0.000 23 72 0.240 13.43 66.0 59 59 0.260 0.477 Run Start Time 34 72 0.280 19.32 69.0 59 59 0.310 0.477 4 Total: 0.05 76 0.330 25.74 69.0 59 59 0.320 0.477 Test Avg Sqrt PM - Weights - Blank Corrected6 78 0.270 32.27 67.0 60 60 0.300 0.477 0.597 >10µ Wt: 0.0107 gms.1 77 0.550 38.59 64.0 60 60 0.580 0.477 Run End Time <10µ-2.5µ Wt: 0.0169 gms.2 77 0.490 47.37 65.0 61 61 0.440 0.477 <2.5µ Wt: 0.0044 gms.3 76 0.350 55.03 66.0 61 61 0.380 0.477 Final Reading >10µ: 0.0064 gr/dscf4 77 0.240 62.14 67.0 61 61 0.300 0.477 29.251 >10µ: 0.2700 lb/hr5 76 0.360 68.46 69.0 62 62 0.370 0.477 <10-2.5µ: 0.0100 gr/dscf6 75 0.370 75.48 68.0 62 62 0.390 0.477 Total Volume <10-2.5µ: 0.4241 lb/hr
74.8 0.371 82.68 66.5 60.0 0.361 0.477 29.251 <2.5µ: 0.0026 gr/dscf<2.5µ: 0.1098 lb/hr
EPA 201A: POST - TEST DATA & CALCULATIONSVlc: 0.0 grams Points Outside Dpmin or Dpmax: 0 Number of Points
MF - Moisture Fraction: 0.9940 fraction Reynolds No. for Run: 2488.11 dimentionlessDry Gas Meter Volume: 25.972 Vms, ft3 Nozzel Area: 1.77E-04 (AsNd) sqft
Corrected Water Volume: - Vws Nozzle Velocity: 34.15 (Nu) ft/secBws, Moisture Content: 0.0060 fraction Cyclone Inlet Velocity: 3388 (Vs) ft/min
Stack Gas Dry Molecular Weight: 28.844 Md PM-10 Sampler Flow Rate: 0.362 (scfm) PMQsStack Gas Wet Molecular Wt: 28.779 Mw Stack Flow Rate: 4,939.0 (Qs) Dscfm
Stack Gas Viscosity: 178.96 µs PM-10-Ds50: 11.80 micronsSample Flow Rate: 0.314 QsSt PM-2.5 Ds50 2.79 microns
Run - Cunn. Slip Corr. 1.06 dimensionless Iso Sampling Rate: 95.01 percentTotal - PM - Cs: 0.0190 gr/dscf PM < 10-2.5µ: 0.0175 lbs/baleTotal - PM - ER: 0.8039 lbs/hr PM < 2.5µ: 0.0045 lbs/bale
Stack Gas Velocity: 35.95 (Vs) ft/sec Total - PM: 0.0332 lbs/bale
REM PM-10, 2.5 - 2008
PRE - TEST DATA & CALCULATIONS
14:04
15:30
Page 30 of 105
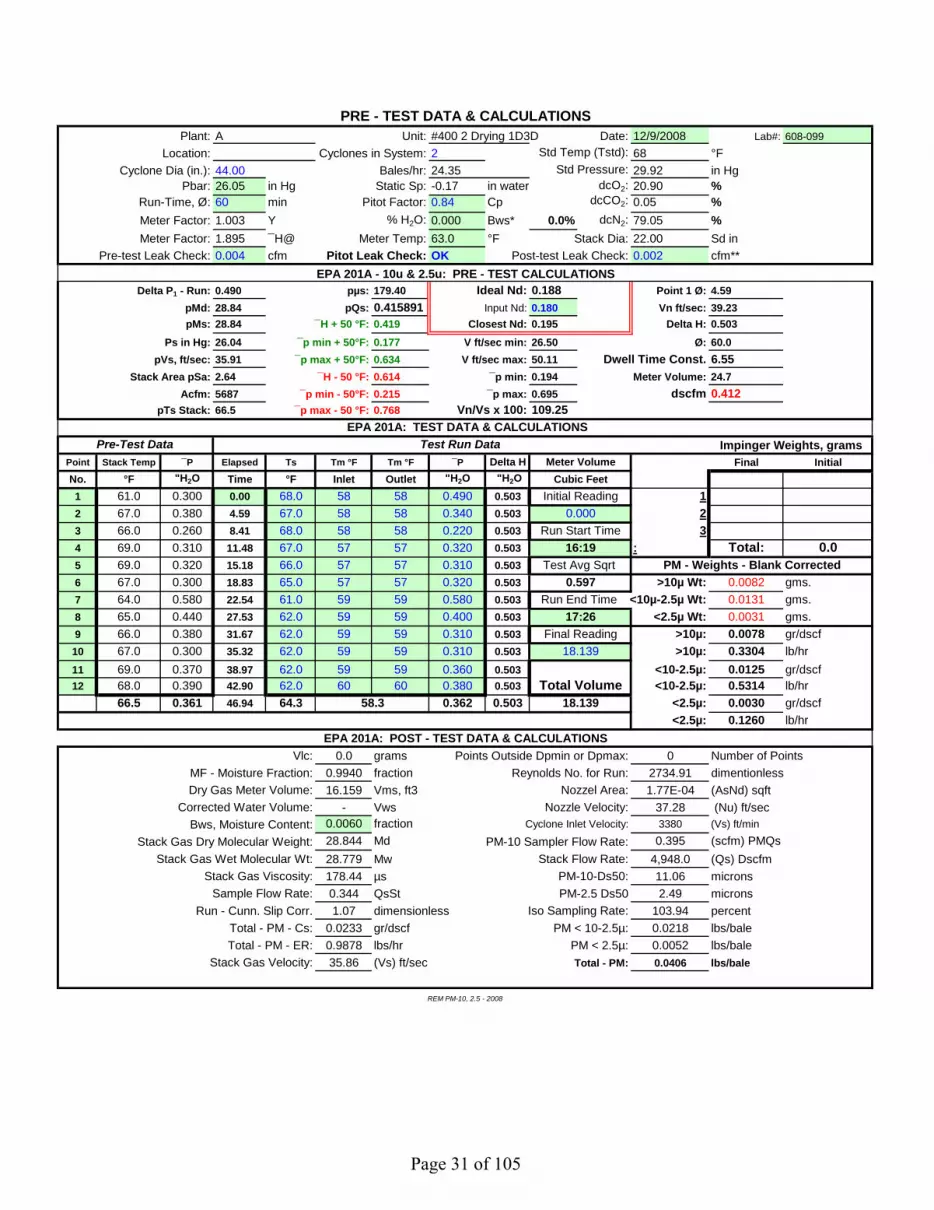
Plant: A Unit: #400 2 Drying 1D3D Date: 12/9/2008 Lab#: 608-099Location: Cyclones in System: 2 Std Temp (Tstd): 68 °F
Cyclone Dia (in.): 44.00 Bales/hr: 24.35 Std Pressure: 29.92 in HgPbar: 26.05 in Hg Static Sp: -0.17 in water dcO2: 20.90 %
Run-Time, Ø: 60 min Pitot Factor: 0.84 Cp dcCO2: 0.05 %Meter Factor: 1.003 Y % H2O: 0.000 Bws* 0.0% dcN2: 79.05 %Meter Factor: 1.895 ¯H@ Meter Temp: 63.0 °F Stack Dia: 22.00 Sd in
Pre-test Leak Check: 0.004 cfm Pitot Leak Check: OK Post-test Leak Check: 0.002 cfm**EPA 201A - 10u & 2.5u: PRE - TEST CALCULATIONS
Delta P1 - Run: 0.490 pµs: 179.40 Ideal Nd: 0.188 Point 1 Ø: 4.59pMd: 28.84 pQs: 0.415891 Input Nd: 0.180 Vn ft/sec: 39.23pMs: 28.84 ¯H + 50 °F: 0.419 Closest Nd: 0.195 Delta H: 0.503
Ps in Hg: 26.04 ¯p min + 50°F: 0.177 V ft/sec min: 26.50 Ø: 60.0pVs, ft/sec: 35.91 ¯p max + 50°F: 0.634 V ft/sec max: 50.11 Dwell Time Const. 6.55
Stack Area pSa: 2.64 ¯H - 50 °F: 0.614 ¯p min: 0.194 Meter Volume: 24.7Acfm: 5687 ¯p min - 50°F: 0.215 ¯p max: 0.695 dscfm 0.412
pTs Stack: 66.5 ¯p max - 50 °F: 0.768 Vn/Vs x 100: 109.25 EPA 201A: TEST DATA & CALCULATIONS
Pre-Test Data Test Run Data Impinger Weights, gramsPoint Stack Temp ¯P Elapsed Ts Tm °F Tm °F ¯P Delta H Meter Volume Final InitialNo. °F "H2O Time °F Inlet Outlet "H2O "H2O Cubic Feet1 61.0 0.300 0.00 68.0 58 58 0.490 0.503 Initial Reading 12 67.0 0.380 4.59 67.0 58 58 0.340 0.503 0.000 23 66.0 0.260 8.41 68.0 58 58 0.220 0.503 Run Start Time 34 69.0 0.310 11.48 67.0 57 57 0.320 0.503 : Total: 0.05 69.0 0.320 15.18 66.0 57 57 0.310 0.503 Test Avg Sqrt PM - Weights - Blank Corrected6 67.0 0.300 18.83 65.0 57 57 0.320 0.503 0.597 >10µ Wt: 0.0082 gms.7 64.0 0.580 22.54 61.0 59 59 0.580 0.503 Run End Time <10µ-2.5µ Wt: 0.0131 gms.8 65.0 0.440 27.53 62.0 59 59 0.400 0.503 <2.5µ Wt: 0.0031 gms.9 66.0 0.380 31.67 62.0 59 59 0.310 0.503 Final Reading >10µ: 0.0078 gr/dscf10 67.0 0.300 35.32 62.0 59 59 0.310 0.503 18.139 >10µ: 0.3304 lb/hr11 69.0 0.370 38.97 62.0 59 59 0.360 0.503 <10-2.5µ: 0.0125 gr/dscf12 68.0 0.390 42.90 62.0 60 60 0.380 0.503 Total Volume <10-2.5µ: 0.5314 lb/hr
66.5 0.361 46.94 64.3 58.3 0.362 0.503 18.139 <2.5µ: 0.0030 gr/dscf<2.5µ: 0.1260 lb/hr
EPA 201A: POST - TEST DATA & CALCULATIONSVlc: 0.0 grams Points Outside Dpmin or Dpmax: 0 Number of Points
MF - Moisture Fraction: 0.9940 fraction Reynolds No. for Run: 2734.91 dimentionlessDry Gas Meter Volume: 16.159 Vms, ft3 Nozzel Area: 1.77E-04 (AsNd) sqft
Corrected Water Volume: - Vws Nozzle Velocity: 37.28 (Nu) ft/secBws, Moisture Content: 0.0060 fraction Cyclone Inlet Velocity: 3380 (Vs) ft/min
Stack Gas Dry Molecular Weight: 28.844 Md PM-10 Sampler Flow Rate: 0.395 (scfm) PMQsStack Gas Wet Molecular Wt: 28.779 Mw Stack Flow Rate: 4,948.0 (Qs) Dscfm
Stack Gas Viscosity: 178.44 µs PM-10-Ds50: 11.06 micronsSample Flow Rate: 0.344 QsSt PM-2.5 Ds50 2.49 microns
Run - Cunn. Slip Corr. 1.07 dimensionless Iso Sampling Rate: 103.94 percentTotal - PM - Cs: 0.0233 gr/dscf PM < 10-2.5µ: 0.0218 lbs/baleTotal - PM - ER: 0.9878 lbs/hr PM < 2.5µ: 0.0052 lbs/bale
Stack Gas Velocity: 35.86 (Vs) ft/sec Total - PM: 0.0406 lbs/bale
REM PM-10, 2.5 - 2008
17:26
16:19
PRE - TEST DATA & CALCULATIONS
Page 31 of 105

Plant: A Unit: #400 2 Drying 1D3D Date: 12/9/2008 Lab#: 608-099Location: Cyclones in System: 2 Std Temp (Tstd): 68 °F
Cyclone Dia (in.): 44.00 Bales/hr: 23.22 Std Pressure: 29.92 in HgPbar: 26.05 in Hg Static Sp: -0.17 in water dcO2: 20.90 %
Run-Time, Ø: 60 min Pitot Factor: 0.84 Cp dcCO2: 0.05 %Meter Factor: 1.003 Y % H2O: 0.000 Bws* 0.0% dcN2: 79.05 %Meter Factor: 1.895 ¯H@ Meter Temp: 62.0 °F Stack Dia: 22.00 Sd in
Pre-test Leak Check: 0.003 cfm Pitot Leak Check: OK Post-test Leak Check: 0.004 cfm**EPA 201A - 10u & 2.5u: PRE - TEST CALCULATIONS
Delta P1 - Run: 0.440 pµs: 178.88 Ideal Nd: 0.188 Point 1 Ø: 5.86pMd: 28.84 pQs: 0.413973 Input Nd: 0.180 Vn ft/sec: 39.05pMs: 28.84 ¯H + 50 °F: 0.418 Closest Nd: 0.195 Delta H: 0.501
Ps in Hg: 26.04 ¯p min + 50°F: 0.176 V ft/sec min: 26.36 Ø: 60.0pVs, ft/sec: 35.82 ¯p max + 50°F: 0.631 V ft/sec max: 49.88 Dwell Time Const. 8.84
Stack Area pSa: 2.64 ¯H - 50 °F: 0.613 ¯p min: 0.193 Meter Volume: 24.7Acfm: 5674 ¯p min - 50°F: 0.213 ¯p max: 0.691 dscfm 0.411
pTs Stack: 64.3 ¯p max - 50 °F: 0.764 Vn/Vs x 100: 109.00 EPA 201A: TEST DATA & CALCULATIONS
Pre-Test Data Test Run Data Impinger Weights, gramsPoint Stack Temp ¯P Elapsed Ts Tm °F Tm °F ¯P Delta H Meter Volume Final InitialNo. °F "H2O Time °F Inlet Outlet "H2O "H2O Cubic Feet1 68.0 0.490 0.00 65.0 60 60 0.440 0.501 Initial Reading 12 67.0 0.340 5.86 66.0 60 60 0.330 0.501 0.000 23 68.0 0.220 10.94 65.0 59 59 0.230 0.501 Run Start Time 34 67.0 0.320 15.18 64.0 59 59 0.310 0.501 4 Total: 0.05 66.0 0.310 20.10 63.0 59 59 0.310 0.501 Test Avg Sqrt PM - Weights - Blank Corrected6 65.0 0.320 25.02 61.0 59 59 0.310 0.501 0.592 >10µ Wt: 0.0077 gms.7 61.0 0.580 29.94 61.0 59 59 0.520 0.501 Run End Time <10µ-2.5µ Wt: 0.0123 gms.8 62.0 0.400 36.31 62.0 59 59 0.420 0.501 <2.5µ Wt: 0.0031 gms.9 62.0 0.310 42.04 63.0 59 59 0.320 0.501 Final Reading >10µ: 0.0052 gr/dscf10 62.0 0.310 47.04 62.0 58 58 0.310 0.501 25.734 >10µ: 0.2193 lb/hr11 62.0 0.360 51.96 62.0 59 59 0.390 0.501 <10-2.5µ: 0.0083 gr/dscf12 62.0 0.380 57.48 62.0 59 59 0.360 0.501 Total Volume <10-2.5µ: 0.3485 lb/hr
64.3 0.362 62.78 63.0 59.1 0.354 0.501 25.734 <2.5µ: 0.0021 gr/dscf<2.5µ: 0.0873 lb/hr
EPA 201A: POST - TEST DATA & CALCULATIONSVlc: 0.0 grams Points Outside Dpmin or Dpmax: 0 Number of Points
MF - Moisture Fraction: 0.9940 fraction Reynolds No. for Run: 2901.70 dimentionlessDry Gas Meter Volume: 22.891 Vms, ft3 Nozzel Area: 1.77E-04 (AsNd) sqft
Corrected Water Volume: - Vws Nozzle Velocity: 39.38 (Nu) ft/secBws, Moisture Content: 0.0060 fraction Cyclone Inlet Velocity: 3347 (Vs) ft/min
Stack Gas Dry Molecular Weight: 28.844 Md PM-10 Sampler Flow Rate: 0.418 (scfm) PMQsStack Gas Wet Molecular Wt: 28.779 Mw Stack Flow Rate: 4,912.5 (Qs) Dscfm
Stack Gas Viscosity: 178.12 µs PM-10-Ds50: 10.62 micronsSample Flow Rate: 0.365 QsSt PM-2.5 Ds50 2.32 microns
Run - Cunn. Slip Corr. 1.07 dimensionless Iso Sampling Rate: 110.87 percentTotal - PM - Cs: 0.0156 gr/dscf PM < 10-2.5µ: 0.0150 lbs/baleTotal - PM - ER: 0.6552 lbs/hr PM < 2.5µ: 0.0038 lbs/bale
Stack Gas Velocity: 35.52 (Vs) ft/sec Total - PM: 0.0282 lbs/bale
PRE - TEST DATA & CALCULATIONS
18:25
19:31
REM PM-10, 2.5 - 2008
Page 32 of 105

Cotton Gin Test Data
Plant: A Date: 12/9/2008Location: Start Time: 14:04
Unit: #400 2 Drying 1D3D End Time: 15:30Run: 1
Elapsed Time: 86 Test Time: 82.68Bale Time: 87.00 StdDev Std BPH: 4.74
Ave min/bale: 0:02:21 Ave Std BPH: 24.2
Bale No. Bale Wt. Time time/baleStd 500 lb
BPHChauvenet's
Criterion1543300 14:04:00 --- --- ---1543301 493 14:06:00 0:02:00 29.61543302 458 14:09:00 0:03:00 18.31543303 470 14:11:00 0:02:00 28.21543304 475 14:13:00 0:02:00 28.51543305 493 14:16:00 0:03:00 19.71543306 460 14:18:00 0:02:00 27.61543307 452 14:20:00 0:02:00 27.11543308 465 14:23:00 0:03:00 18.61543309 470 14:25:00 0:02:00 28.21543310 467 14:27:00 0:02:00 28.01543311 463 14:30:00 0:03:00 18.51543312 461 14:32:00 0:02:00 27.71543313 491 14:35:00 0:03:00 19.61543314 468 14:37:00 0:02:00 28.11543315 472 14:39:00 0:02:00 28.31543316 465 14:41:00 0:02:00 27.91543317 473 14:43:00 0:02:00 28.41543318 462 14:46:00 0:03:00 18.51543319 487 14:48:00 0:02:00 29.21543320 481 14:51:00 0:03:00 19.21543321 465 14:53:00 0:02:00 27.91543322 468 14:55:00 0:02:00 28.11543323 480 14:57:00 0:02:00 28.81543324 477 14:59:00 0:02:00 28.61543325 490 15:01:00 0:02:00 29.41543326 467 15:04:00 0:03:00 18.71543327 492 15:06:00 0:02:00 29.51543328 504 15:10:00 0:04:00 15.11543329 466 15:13:00 0:03:00 18.61543330 478 15:15:00 0:02:00 28.71543331 464 15:17:00 0:02:00 27.81543332 462 15:19:00 0:02:00 27.71543333 467 15:21:00 0:02:00 28.01543334 481 15:24:00 0:03:00 19.21543335 507 15:26:00 0:02:00 30.41543336 479 15:29:00 0:03:00 19.21543337 475 15:31:00 0:02:00 28.5
REM - 2003
Page 33 of 105
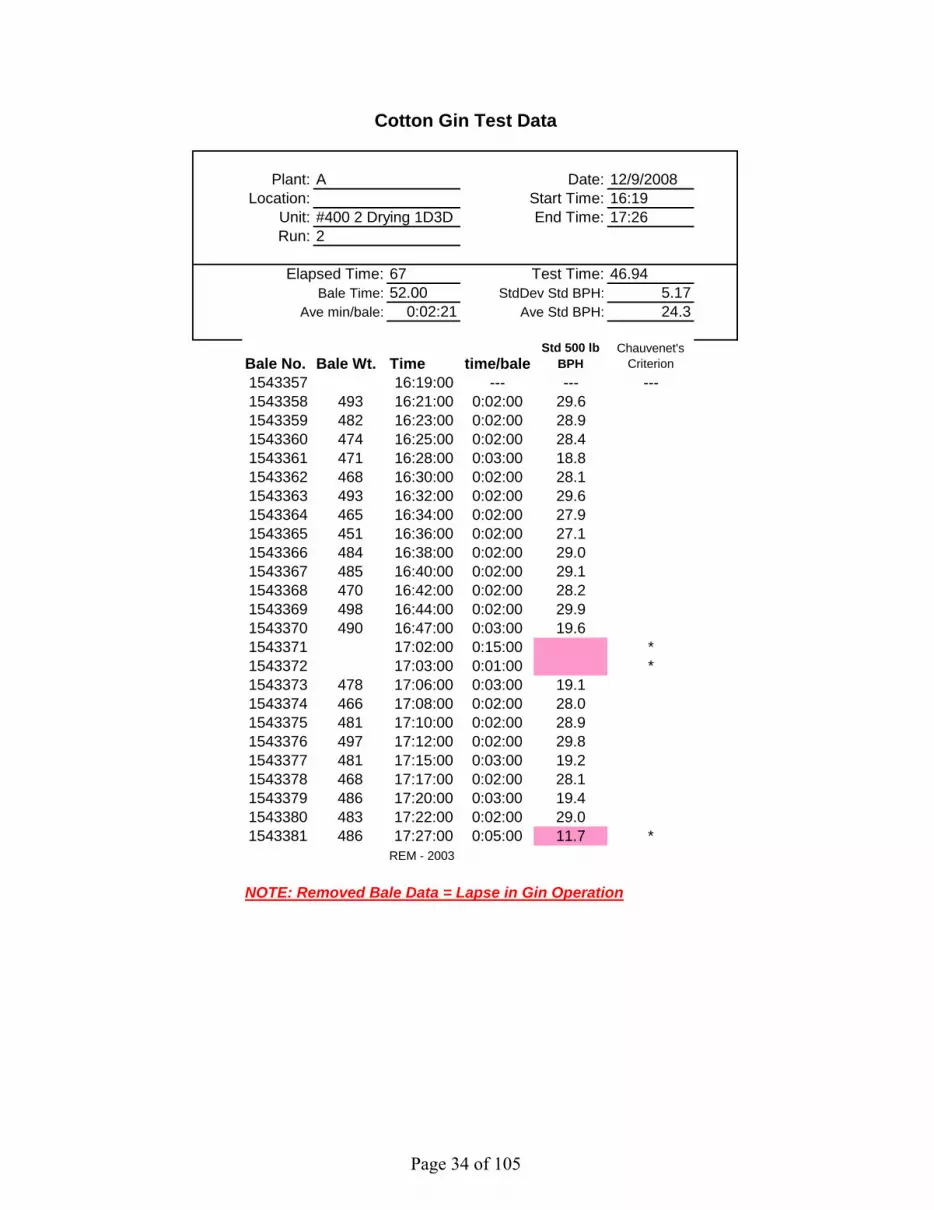
Cotton Gin Test Data
Plant: A Date: 12/9/2008Location: Start Time: 16:19
Unit: #400 2 Drying 1D3D End Time: 17:26Run: 2
Elapsed Time: 67 Test Time: 46.94Bale Time: 52.00 StdDev Std BPH: 5.17
Ave min/bale: 0:02:21 Ave Std BPH: 24.3
Bale No. Bale Wt. Time time/baleStd 500 lb
BPHChauvenet's
Criterion1543357 16:19:00 --- --- ---1543358 493 16:21:00 0:02:00 29.61543359 482 16:23:00 0:02:00 28.91543360 474 16:25:00 0:02:00 28.41543361 471 16:28:00 0:03:00 18.81543362 468 16:30:00 0:02:00 28.11543363 493 16:32:00 0:02:00 29.61543364 465 16:34:00 0:02:00 27.91543365 451 16:36:00 0:02:00 27.11543366 484 16:38:00 0:02:00 29.01543367 485 16:40:00 0:02:00 29.11543368 470 16:42:00 0:02:00 28.21543369 498 16:44:00 0:02:00 29.91543370 490 16:47:00 0:03:00 19.61543371 17:02:00 0:15:00 *1543372 17:03:00 0:01:00 *1543373 478 17:06:00 0:03:00 19.11543374 466 17:08:00 0:02:00 28.01543375 481 17:10:00 0:02:00 28.91543376 497 17:12:00 0:02:00 29.81543377 481 17:15:00 0:03:00 19.21543378 468 17:17:00 0:02:00 28.11543379 486 17:20:00 0:03:00 19.41543380 483 17:22:00 0:02:00 29.01543381 486 17:27:00 0:05:00 11.7 *
REM - 2003
NOTE: Removed Bale Data = Lapse in Gin Operation
Page 34 of 105

Cotton Gin Test Data
Plant: A Date: 12/9/2008Location: Start Time: 18:25
Unit: #400 2 Drying 1D3D End Time: 19:31Run: 3
Elapsed Time: 66 Test Time: 62.78Bale Time: 68.00 StdDev Std BPH: 5.60
Ave min/bale: 0:02:31 Ave Std BPH: 23.2
Bale No. Bale Wt. Time time/baleStd 500 lb
BPHChauvenet's
Criterion1543399 18:24:00 --- --- ---1543400 501 18:27:00 0:03:00 20.01543401 499 18:29:00 0:02:00 29.91543402 503 18:31:00 0:02:00 30.21543403 506 18:34:00 0:03:00 20.21543404 476 18:36:00 0:02:00 28.61543405 448 18:38:00 0:02:00 26.91543406 477 18:41:00 0:03:00 19.11543407 492 18:44:00 0:03:00 19.71543408 511 18:46:00 0:02:00 30.71543409 470 18:48:00 0:02:00 28.21543410 513 18:50:00 0:02:00 30.81543411 513 18:53:00 0:03:00 20.51543412 493 18:55:00 0:02:00 29.61543413 483 18:57:00 0:02:00 29.01543414 510 18:59:00 0:02:00 30.61543415 489 19:02:00 0:03:00 19.61543416 472 19:04:00 0:02:00 28.31543417 459 19:06:00 0:02:00 27.51543418 455 19:08:00 0:02:00 27.31543419 490 19:10:00 0:02:00 29.41543420 461 19:12:00 0:02:00 27.71543421 502 19:15:00 0:03:00 20.11543422 490 19:17:00 0:02:00 29.41543423 522 19:20:00 0:03:00 20.91543424 490 19:22:00 0:02:00 29.41543425 481 19:30:00 0:08:00 7.2 *1543426 450 19:32:00 0:02:00 27.0
REM - 2003
Page 35 of 105
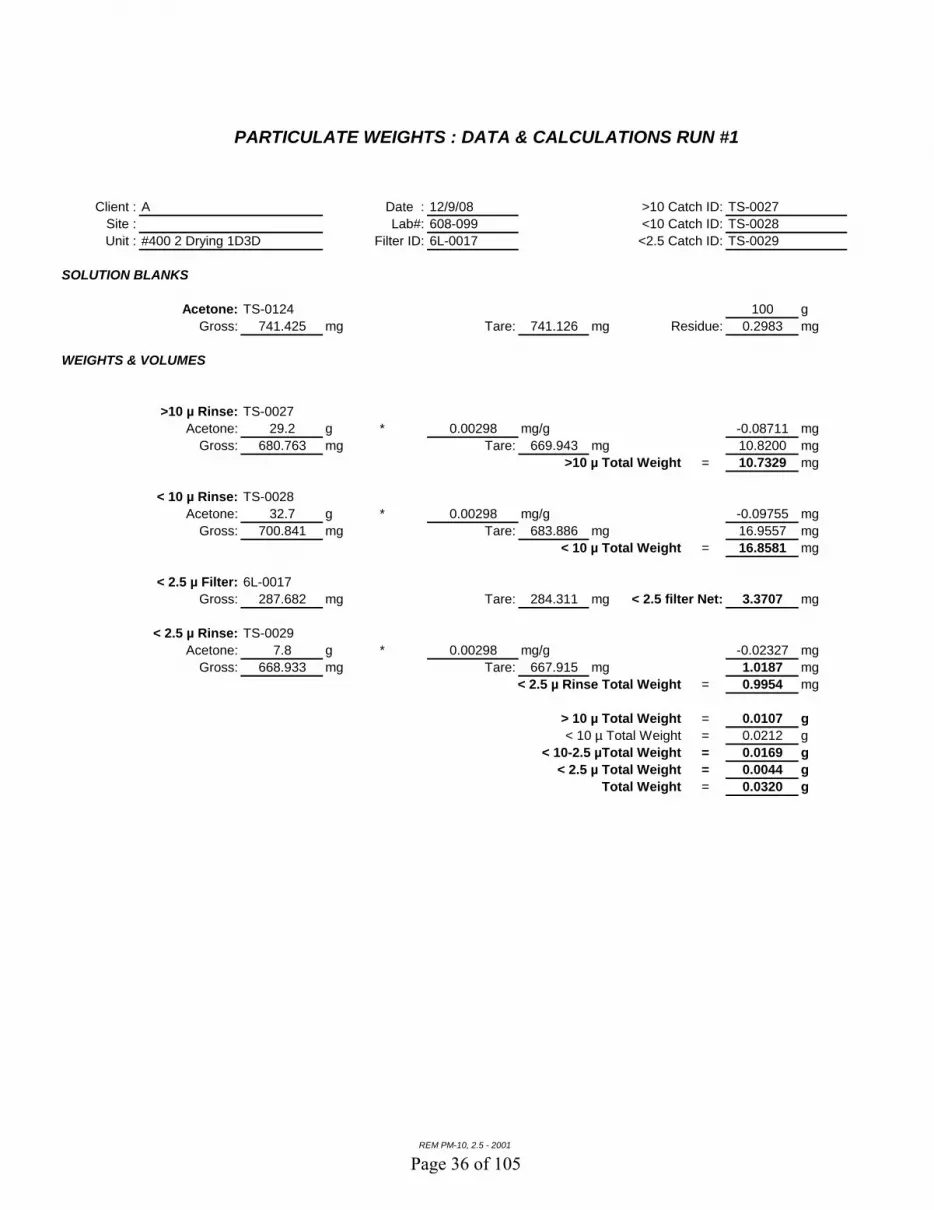
PARTICULATE WEIGHTS : DATA & CALCULATIONS RUN #1
Client : A Date : 12/9/08 >10 Catch ID:Site : Lab#: 608-099 <10 Catch ID:Unit : #400 2 Drying 1D3D Filter ID: 6L-0017 <2.5 Catch ID:
Acetone: TS-0124 100 gGross: 741.425 mg Tare: 741.126 mg Residue: 0.2983 mg
>10 µ Rinse: TS-0027Acetone: 29.2 g * 0.00298 mg/g -0.08711 mg
Gross: 680.763 mg Tare: 669.943 mg 10.8200 mg >10 µ Total Weight = 10.7329 mg
< 10 µ Rinse: TS-0028Acetone: 32.7 g * 0.00298 mg/g -0.09755 mg
Gross: 700.841 mg Tare: 683.886 mg 16.9557 mg< 10 µ Total Weight = 16.8581 mg
< 2.5 µ Filter: 6L-0017Gross: 287.682 mg Tare: 284.311 mg < 2.5 filter Net: 3.3707 mg
< 2.5 µ Rinse: TS-0029Acetone: 7.8 g * 0.00298 mg/g -0.02327 mg
Gross: 668.933 mg Tare: 667.915 mg 1.0187 mg< 2.5 µ Rinse Total Weight = 0.9954 mg
> 10 µ Total Weight = 0.0107 g< 10 µ Total Weight = 0.0212 g
< 10-2.5 µTotal Weight = 0.0169 g< 2.5 µ Total Weight = 0.0044 g
Total Weight = 0.0320 g
WEIGHTS & VOLUMES
REM PM-10, 2.5 - 2001
TS-0027TS-0028TS-0029
SOLUTION BLANKS
Page 36 of 105

PARTICULATE WEIGHTS : DATA & CALCULATIONS RUN #2
Client : A Date : 12/9/08 >10 Catch ID:Site : Lab#: 608-099 <10 Catch ID:Unit : #400 2 Drying 1D3D Filter ID: 6L-0018 <2.5 Catch ID:
Acetone: TS-0124 100 gGross: 741.425 mg Tare: 741.126 mg Residue: 0.2983 mg
>10 µ Rinse: TS-0030Acetone: 27.6 g * 0.00298 mg/g -0.08234 mg
Gross: 724.899 mg Tare: 716.660 mg 8.2387 mg >10 µ Total Weight = 8.1563 mg
< 10 µ Rinse: TS-0031Acetone: 23.7 g * 0.00298 mg/g -0.07070 mg
Gross: 698.279 mg Tare: 685.089 mg 13.1900 mg< 10 µ Total Weight = 13.1193 mg
< 2.5 µ Filter: 6L-0018Gross: 284.810 mg Tare: 282.886 mg < 2.5 filter Net: 1.9237 mg
< 2.5 µ Rinse: TS-0032Acetone: 9.3 g * 0.00298 mg/g -0.02774 mg
Gross: 670.103 mg Tare: 668.888 mg 1.2143 mg< 2.5 µ Rinse Total Weight = 1.1866 mg
> 10 µ Total Weight = 0.0082 g< 10 µ Total Weight = 0.0162 g
< 10-2.5 µTotal Weight = 0.0131 g< 2.5 µ Total Weight = 0.0031 g
Total Weight = 0.0244 g
WEIGHTS & VOLUMES
REM PM-10, 2.5 - 2001
TS-0030TS-0031TS-0032
SOLUTION BLANKS
Page 37 of 105

PARTICULATE WEIGHTS : DATA & CALCULATIONS RUN #3
Client : A Date : 12/9/08 >10 Catch ID:Site : Lab#: 608-099 <10 Catch ID:Unit : #400 2 Drying 1D3D Filter ID: 6L-0019 <2.5 Catch ID:
Acetone: TS-0124 100 gGross: 741.425 mg Tare: 741.126 mg Residue: 0.2983 mg
>10 µ Rinse: TS-0038Acetone: 24.7 g * 0.00298 mg/g -0.07369 mg
Gross: 685.079 mg Tare: 677.279 mg 7.7997 mg >10 µ Total Weight = 7.7260 mg
< 10 µ Rinse: TS-0039Acetone: 25.5 g * 0.00298 mg/g -0.07607 mg
Gross: 712.219 mg Tare: 699.865 mg 12.3540 mg< 10 µ Total Weight = 12.2779 mg
< 2.5 µ Filter: 6L-0019Gross: 302.350 mg Tare: 300.187 mg < 2.5 filter Net: 2.1630 mg
< 2.5 µ Rinse: TS-0040Acetone: 9.7 g * 0.00298 mg/g -0.02894 mg
Gross: 670.869 mg Tare: 669.926 mg 0.9430 mg< 2.5 µ Rinse Total Weight = 0.9141 mg
> 10 µ Total Weight = 0.0077 g< 10 µ Total Weight = 0.0154 g
< 10-2.5 µTotal Weight = 0.0123 g< 2.5 µ Total Weight = 0.0031 g
Total Weight = 0.0231 g
WEIGHTS & VOLUMES
REM PM-10, 2.5 - 2001
TS-0038TS-0039TS-0040
SOLUTION BLANKS
Page 38 of 105

Acetone Rinse
Client : Date :Location: Job # : 608-099
Unit : #400 2 Drying 1D3D
PM-2.5 Date:Run 1 Run 2 Run 3
Filter ID#: 6L-0017 Filter ID#: 6L-0018 Filter ID#: 6L-0019
>10 Start Vol: 247.9 g >10 Start Vol: 379.0 g >10 Start Vol: 201.7 gEnd Vol: 218.7 g End Vol: 351.4 g End Vol: 177.0 g
Total: 29.2 g Total: 27.6 g Total: 24.7 gTub #: TS-0027 Tub #: TS-0030 Tub #: TS-0038
<10 Start Vol: 218.7 g <10 Start Vol: 351.4 g <10 Start Vol: 177.0 gEnd Vol: 186.0 g End Vol: 327.7 g End Vol: 151.5 g
Total: 32.7 g Total: 23.7 g Total: 25.5 gTub #: TS-0028 Tub #: TS-0031 Tub #: TS-0039
<2.5 Start Vol: 186.0 g <2.5 Start Vol: 327.7 g <2.5 Start Vol: 151.5 gEnd Vol: 178.2 g End Vol: 318.4 g End Vol: 141.8 g
Total: 7.8 g Total: 9.3 g Total: 9.7 gTub #: TS-0029 Tub #: TS-0032 Tub #: TS-0040
A 12/9/2008
12/8-10/08
Page 39 of 105

Filter/Tub Weights
Client : Date :Location: Job # : 608-099
Unit : #400 2 Drying 1D3D
Filter/Tub No.
Pre-Weight
(mg)
Post-Weight
(mg)
Net-Weight
(mg)Acetone Blank 100 g TS-0124 741.126 741.425 0.298DI Water Blank 250 g TL-0019 644.790 646.241 1.451Filter Blank 6L-0119 249.026 249.047 0.021
No. Cyclone Name Method Run No.Sample
LocationFilter/Tub
No.
Pre-Weight
(mg)
Post-Weight
(mg)
Net-Weight
(mg)400 #3 Drying 27 1 < 10 TS-0028 683.886 700.841 16.956400 #3 Drying 27 1 < 2.5 TS-0029 667.915 668.933 1.019400 #3 Drying 27 1 > 10 TS-0027 669.943 680.763 10.820400 #3 Drying 27 1 Filter < 2.5 6L-0017 284.311 287.682 3.371400 #3 Drying 27 2 < 10 TS-0031 685.089 698.279 13.190400 #3 Drying 27 2 < 2.5 TS-0032 668.888 670.103 1.214400 #3 Drying 27 2 > 10 TS-0030 716.660 724.899 8.239400 #3 Drying 27 2 Filter < 2.5 6L-0018 282.886 284.810 1.924400 #3 Drying 27 3 < 10 TS-0039 699.865 712.219 12.354400 #3 Drying 27 3 < 2.5 TS-0040 669.926 670.869 0.943400 #3 Drying 27 3 > 10 TS-0038 677.279 685.079 7.800400 #3 Drying 27 3 Filter < 2.5 6L-0019 300.187 302.350 2.163
A 12/9/2008
Page 40 of 105
Gin D Field and Laboratory Data
Page 41 of 105

D#5 2A Pull 1D3D2009
Emission Factor (lbs/bale) Emission Rate (lbs/hr)Based on EPA Method OTM27 Based on EPA Method OTM27
Total PM Total PMX Run 1 0.0177 Run 1 0.5487X Run 2 0.0998 Run 2 3.4371X Run 3 0.1022 Run 3 3.2009
Average AveragePM10 PM10
Y Run 1 0.0132 Run 1 0.4100Y Run 2 0.0729 Run 2 2.5091Y Run 3 0.0722 Run 3 2.2603Average Average
PM2.5 PM2.5
Run 1 0.0068 Run 1 0.2126Run 2 0.0053 Run 2 0.1818
Z Run 3 0.0066 Run 3 0.2079Average 0.0061 Average 0.1972
PM10-2.5 PM10-2.5
Run 1 0.0064 Run 1 0.1974Run 2 0.0676 Run 2 2.3273Run 3 0.0655 Run 3 2.0524
Average AveragePM2.5/PM10
Run 1 51.9%Run 2 7.2%Run 3 9.2%
AveragePM2.5/TSP
Run 1 38.7%Run 2 5.3%Run 3 6.5%
AveragePM10/TSP
Run 1 74.7%Run 2 73.0%Run 3 70.6%
Average
Gin:Exhaust:
Date:
X: Run omitted from all dependent averages - Total PM ISO not metY: Run omitted from all dependent averages - PM 10 ISO or D50 not metZ: Run omitted from all dependent averages - PM 2.5 ISO or D50 not met
All Runs - Cyclone Inlet Velocity Low
Page 42 of 105

#5 2A Pull 1D3D Run #1 Run #2 Run #3
ø - Start of Run, time 7:52 8:44 9:24
ø - End of Run, time 8:22 9:17 10:10
Vlc - Volume of water collected, ml 0.0 0.0 0.0
Vm - Gas volume, meter cond., dcf 10.653 11.675 13.161
Y - Meter calibration factor 0.995 0.995 0.995
Pbar - Barometric pressure, in. Hg 30.05 30.05 30.05
Pg - Stack static pressure, in. H2O 0.02 0.02 0.02
ˆH - Avg. meter press. diff., in. H2O 0.493 0.497 0.510
Tm - Absolute meter temperature, °R 527.2 528.8 529.3
Vm(std) - Standard sample gas vol., dscf 10.6787 11.6682 13.1414
Bws - Water vapor part in gas stream 0.018 0.018 0.018
CO2 - Dry concentration, volume % 0.01 0.01 0.01
O2 - Dry concentration, volume % 20.9 20.9 20.9
Md - Mole wt. stack gas, dry, g/mole 28.838 28.838 28.838
Ms - Mole wt. stack gas, wet, g/gmole 28.643 28.643 28.643
Cp - Pitot tube coef., dimensionless 0.840 0.840 0.840
ˆp - Avg. of sq. roots of eachˆp 0.388 0.382 0.393
Ts - Absolute stack Temp. °R 545.4 574.8 579.7
A - Area of stack, square feet 2.41 2.41 2.41
Vs - Stack Gas Flow, ft/sec 22.19 22.42 23.18
Qstd - Volumetric flow rate, dscfm 3,058 2,931 3,006
An - Area of nozzle, square feet 2.640E-04 2.640E-04 2.640E-04
ø - Sampling time, minutes 28.58 31.77 32.66
DP50 - Cut size, microns 11.09 11.24 10.54
I - Isokinetic variation, percent 111.4 114.2 122.0
Sts - Stacks per system 4 4 4
OTM METHOD 27 FIELD DATA SUMMARYD
REM PM-10, 2.5 - 2008
Page 43 of 105

#5 2A Pull 1D3D Run #1 Run #2 Run #3 AVERAGE
Qstd - Volumetric flow rate, dscfm 3,058 2,931 3,006 2,998
Vm(std) - Standard sample gas vol., dscf 10.6787 11.6682 13.1414 11.8294
DP50 - Cut size, microns 10µ 11.09 11.24 10.54 10.96
DP50 - Cut size, microns 2.5µ 2.43 2.52 2.26 2.40
Bale/hr - Total 500 lb Bales per hr 31.1 34.4 31.3 32.3
>10 µ - Total PM g 0.0009 0.0070 0.0078 0.0052
>10 µ - Total PM gr/dscfm 0.0013 0.0092 0.0091 0.0066
>10 µ - Total PM lb/hr 0.035 0.232 0.235 0.1673
>10 µ - Total PM lb/bale 0.0011 0.0067 0.0075 0.0051
10 µ -2.5 µ - PM-10 - 2.5 g 0.0013 0.0175 0.0170 0.0119
10 µ -2.5 µ - PM-10 gr/dscf 0.0019 0.0232 0.0199 0.0150
10 µ -2.5 µ - PM-10 lb/hr 0.049 0.582 0.513 0.381
10 µ -2.5 µ - PM-10 lb/bale 0.0016 0.0169 0.0164 0.0116
< 2.5 µ - PM-2.5 g 0.0014 0.0014 0.0017 0.0015
< 2.5 µ - PM-2.5 gr/dscf 0.0020 0.0018 0.0020 0.00195
< 2.5 µ - PM-2.5 lb/hr 0.053 0.045 0.052 0.050
< 2.5 µ - PM-2.5 lb/bale 0.0017 0.0013 0.0017 0.0016
TPM - Total PM g 0.0036 0.0259 0.0264 0.0186
TPM - Total PM gr/dscf 0.0052 0.0342 0.0311 0.0235
TPM - Total PM lb/hr 0.137 0.859 0.800 0.60
TPM - Total PM lb/bale 0.0044 0.0250 0.0256 0.0183
OTM METHOD 27 FIELD DATA SUMMARYD
REM PM-10, 2.5 - 2008
Page 44 of 105

#5 2A Pull 1D3D
Run #1 Run #2 Run #3 AverageTotal Particulate Per Cyclone
Total gr/dscf 0.0052 0.0342 0.0311 0.0235Total lb/hr 0.14 0.86 0.80 0.60Total lb/bale 0.0044 0.0250 0.0256 0.0183
Total Particulate Per SystemTotal lb/hr 0.55 3.44 3.20 2.40Total lb/bale 0.018 0.100 0.102 0.073
< 10 µ Results per Cyclone- 10 µ gr/dscf 0.0039 0.0250 0.0219 0.0169- 10 µ (lb/hr) 0.10 0.63 0.57 0.43- 10 µ (lb/Bale) 0.0033 0.0182 0.0180 0.0132
< 10 µ Results per System- 10 µ (lb/hr) 0.41 2.51 2.26 1.73- 10 µ (lb/Bale) 0.013 0.073 0.072 0.053
< 2.5 µ Results per Cyclone- 2.5 µ gr/dscf 0.0020 0.0018 0.0020 0.0020- 2.5 µ (lb/hr) 0.05 0.05 0.05 0.05- 2.5 µ (lb/Bale) 0.0017 0.0013 0.0017 0.0016
< 2.5 µ Results per System- 2.5 µ (lb/hr) 0.21 0.18 0.21 0.20- 2.5 µ (lb/Bale) 0.007 0.005 0.007 0.006
Average Bales/hr 31.07 34.43 31.31 32.27
Cyclone Flow-RatesVs 22.19 22.42 23.18 22.60Acfm 3,202 3,235 3,346 3,261Dscfm 3,058 2,931 3,006 2,998
Cyclone Inlet VelocityVsfm 2091 2113 2185 2130
System Flow-RatesAcfm - - - 13,044Dscfm - - - 11,993
Number of Cyclones in System 4REM PM-10, 2.5 - 2001
D
OTM METHOD 27 RESULTS
Page 45 of 105
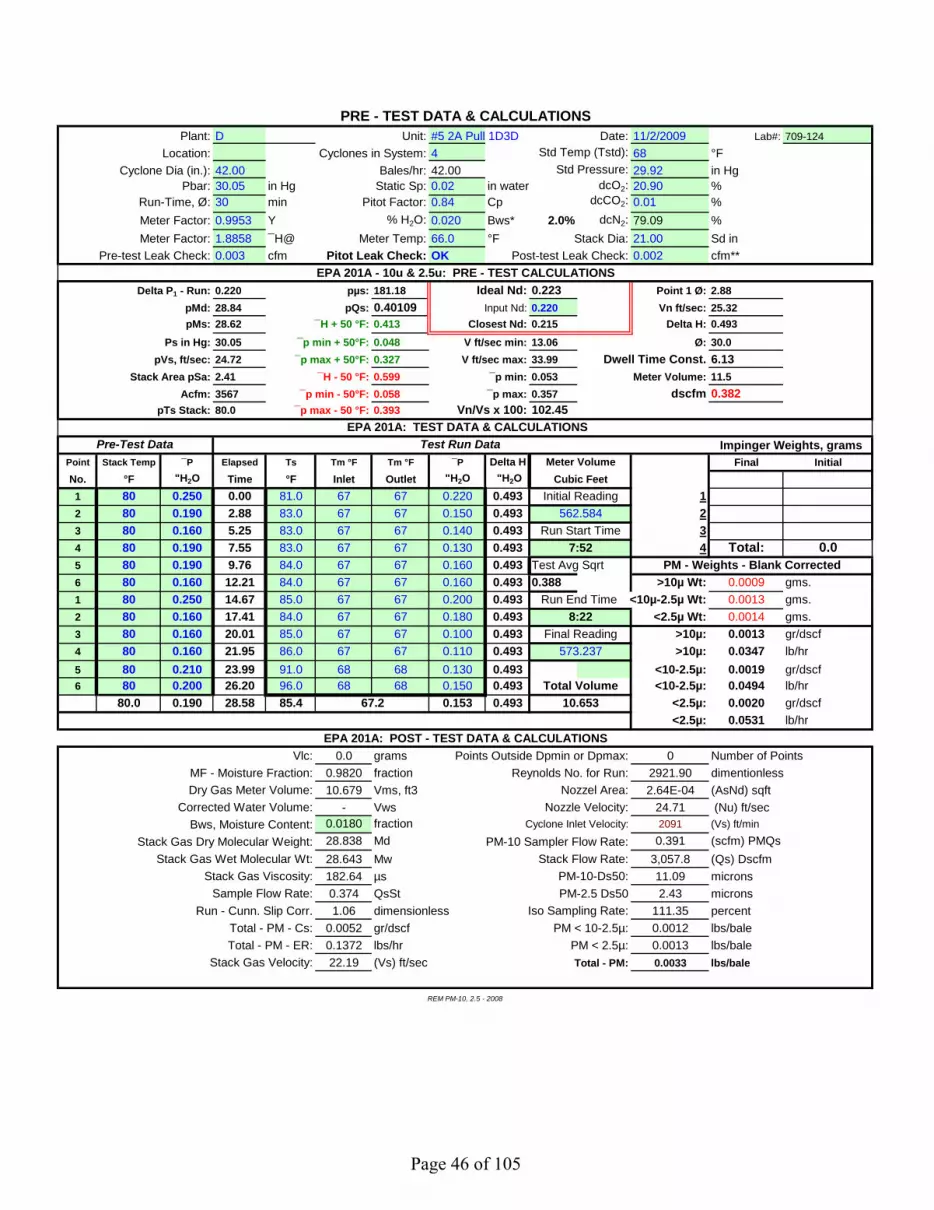
Plant: D Unit: #5 2A Pull 1D3D Date: 11/2/2009 Lab#: 709-124Location: Cyclones in System: 4 Std Temp (Tstd): 68 °F
Cyclone Dia (in.): 42.00 Bales/hr: 42.00 Std Pressure: 29.92 in HgPbar: 30.05 in Hg Static Sp: 0.02 in water dcO2: 20.90 %
Run-Time, Ø: 30 min Pitot Factor: 0.84 Cp dcCO2: 0.01 %Meter Factor: 0.9953 Y % H2O: 0.020 Bws* 2.0% dcN2: 79.09 %Meter Factor: 1.8858 ¯H@ Meter Temp: 66.0 °F Stack Dia: 21.00 Sd in
Pre-test Leak Check: 0.003 cfm Pitot Leak Check: OK Post-test Leak Check: 0.002 cfm**EPA 201A - 10u & 2.5u: PRE - TEST CALCULATIONS
Delta P1 - Run: 0.220 pµs: 181.18 Ideal Nd: 0.223 Point 1 Ø: 2.88pMd: 28.84 pQs: 0.40109 Input Nd: 0.220 Vn ft/sec: 25.32pMs: 28.62 ¯H + 50 °F: 0.413 Closest Nd: 0.215 Delta H: 0.493
Ps in Hg: 30.05 ¯p min + 50°F: 0.048 V ft/sec min: 13.06 Ø: 30.0pVs, ft/sec: 24.72 ¯p max + 50°F: 0.327 V ft/sec max: 33.99 Dwell Time Const. 6.13
Stack Area pSa: 2.41 ¯H - 50 °F: 0.599 ¯p min: 0.053 Meter Volume: 11.5Acfm: 3567 ¯p min - 50°F: 0.058 ¯p max: 0.357 dscfm 0.382
pTs Stack: 80.0 ¯p max - 50 °F: 0.393 Vn/Vs x 100: 102.45 EPA 201A: TEST DATA & CALCULATIONS
Pre-Test Data Test Run Data Impinger Weights, gramsPoint Stack Temp ¯P Elapsed Ts Tm °F Tm °F ¯P Delta H Meter Volume Final InitialNo. °F "H2O Time °F Inlet Outlet "H2O "H2O Cubic Feet1 80 0.250 0.00 81.0 67 67 0.220 0.493 Initial Reading 12 80 0.190 2.88 83.0 67 67 0.150 0.493 562.584 23 80 0.160 5.25 83.0 67 67 0.140 0.493 Run Start Time 34 80 0.190 7.55 83.0 67 67 0.130 0.493 4 Total: 0.05 80 0.190 9.76 84.0 67 67 0.160 0.493 Test Avg Sqrt PM - Weights - Blank Corrected6 80 0.160 12.21 84.0 67 67 0.160 0.493 0.388 >10µ Wt: 0.0009 gms.1 80 0.250 14.67 85.0 67 67 0.200 0.493 Run End Time <10µ-2.5µ Wt: 0.0013 gms.2 80 0.160 17.41 84.0 67 67 0.180 0.493 <2.5µ Wt: 0.0014 gms.3 80 0.160 20.01 85.0 67 67 0.100 0.493 Final Reading >10µ: 0.0013 gr/dscf4 80 0.160 21.95 86.0 67 67 0.110 0.493 573.237 >10µ: 0.0347 lb/hr5 80 0.210 23.99 91.0 68 68 0.130 0.493 <10-2.5µ: 0.0019 gr/dscf6 80 0.200 26.20 96.0 68 68 0.150 0.493 Total Volume <10-2.5µ: 0.0494 lb/hr
80.0 0.190 28.58 85.4 67.2 0.153 0.493 10.653 <2.5µ: 0.0020 gr/dscf<2.5µ: 0.0531 lb/hr
EPA 201A: POST - TEST DATA & CALCULATIONSVlc: 0.0 grams Points Outside Dpmin or Dpmax: 0 Number of Points
MF - Moisture Fraction: 0.9820 fraction Reynolds No. for Run: 2921.90 dimentionlessDry Gas Meter Volume: 10.679 Vms, ft3 Nozzel Area: 2.64E-04 (AsNd) sqft
Corrected Water Volume: - Vws Nozzle Velocity: 24.71 (Nu) ft/secBws, Moisture Content: 0.0180 fraction Cyclone Inlet Velocity: 2091 (Vs) ft/min
Stack Gas Dry Molecular Weight: 28.838 Md PM-10 Sampler Flow Rate: 0.391 (scfm) PMQsStack Gas Wet Molecular Wt: 28.643 Mw Stack Flow Rate: 3,057.8 (Qs) Dscfm
Stack Gas Viscosity: 182.64 µs PM-10-Ds50: 11.09 micronsSample Flow Rate: 0.374 QsSt PM-2.5 Ds50 2.43 microns
Run - Cunn. Slip Corr. 1.06 dimensionless Iso Sampling Rate: 111.35 percentTotal - PM - Cs: 0.0052 gr/dscf PM < 10-2.5µ: 0.0012 lbs/baleTotal - PM - ER: 0.1372 lbs/hr PM < 2.5µ: 0.0013 lbs/bale
Stack Gas Velocity: 22.19 (Vs) ft/sec Total - PM: 0.0033 lbs/bale
REM PM-10, 2.5 - 2008
PRE - TEST DATA & CALCULATIONS
7:52
8:22
Page 46 of 105

Plant: D Unit: #5 2A Pull 1D3D Date: 11/2/2009 Lab#: 709-124Location: Cyclones in System: 4 Std Temp (Tstd): 68 °F
Cyclone Dia (in.): 42.00 Bales/hr: 34.43 Std Pressure: 29.92 in HgPbar: 30.05 in Hg Static Sp: 0.02 in water dcO2: 20.90 %
Run-Time, Ø: 30 min Pitot Factor: 0.84 Cp dcCO2: 0.01 %Meter Factor: 0.9953 Y % H2O: 0.020 Bws* 2.0% dcN2: 79.09 %Meter Factor: 1.8858 ¯H@ Meter Temp: 68.0 °F Stack Dia: 21.00 Sd in
Pre-test Leak Check: 0.002 cfm Pitot Leak Check: OK Post-test Leak Check: 0.000 cfm**EPA 201A - 10u & 2.5u: PRE - TEST CALCULATIONS
Delta P1 - Run: 0.190 pµs: 182.49 Ideal Nd: 0.236 Point 1 Ø: 3.02pMd: 28.84 pQs: 0.405676 Input Nd: 0.220 Vn ft/sec: 25.61pMs: 28.62 ¯H + 50 °F: 0.417 Closest Nd: 0.232 Delta H: 0.497
Ps in Hg: 30.05 ¯p min + 50°F: 0.049 V ft/sec min: 13.25 Ø: 30.0pVs, ft/sec: 22.20 ¯p max + 50°F: 0.331 V ft/sec max: 34.36 Dwell Time Const. 6.93
Stack Area pSa: 2.41 ¯H - 50 °F: 0.602 ¯p min: 0.054 Meter Volume: 11.5Acfm: 3204 ¯p min - 50°F: 0.059 ¯p max: 0.361 dscfm 0.384
pTs Stack: 85.4 ¯p max - 50 °F: 0.398 Vn/Vs x 100: 115.39 EPA 201A: TEST DATA & CALCULATIONS
Pre-Test Data Test Run Data Impinger Weights, gramsPoint Stack Temp ¯P Elapsed Ts Tm °F Tm °F ¯P Delta H Meter Volume Final InitialNo. °F "H2O Time °F Inlet Outlet "H2O "H2O Cubic Feet1 81.0 0.220 0.00 113.0 69 69 0.190 0.497 Initial Reading 12 83.0 0.150 3.02 113.0 68 68 0.150 0.497 575.874 23 83.0 0.140 5.70 114.0 68 68 0.120 0.497 Run Start Time 34 83.0 0.130 8.11 114.0 68 68 0.130 0.497 : Total: 0.05 84.0 0.160 10.60 114.0 69 69 0.150 0.497 Test Avg Sqrt PM - Weights - Blank Corrected6 84.0 0.160 13.29 115.0 69 69 0.150 0.497 0.382 >10µ Wt: 0.0070 gms.7 85.0 0.200 15.97 115.0 69 69 0.170 0.497 Run End Time <10µ-2.5µ Wt: 0.0175 gms.8 84.0 0.180 18.83 112.0 69 69 0.150 0.497 <2.5µ Wt: 0.0014 gms.9 85.0 0.100 21.51 116.0 69 69 0.130 0.497 Final Reading >10µ: 0.0092 gr/dscf10 86.0 0.110 24.01 117.0 69 69 0.110 0.497 587.549 >10µ: 0.2320 lb/hr11 91.0 0.130 26.31 117.0 69 69 0.150 0.497 <10-2.5µ: 0.0232 gr/dscf12 96.0 0.150 28.99 117.0 69 69 0.160 0.497 Total Volume <10-2.5µ: 0.5818 lb/hr
85.4 0.153 31.77 114.8 68.8 0.147 0.497 11.675 <2.5µ: 0.0018 gr/dscf<2.5µ: 0.0454 lb/hr
EPA 201A: POST - TEST DATA & CALCULATIONSVlc: 0.0 grams Points Outside Dpmin or Dpmax: 0 Number of Points
MF - Moisture Fraction: 0.9820 fraction Reynolds No. for Run: 2764.15 dimentionlessDry Gas Meter Volume: 11.668 Vms, ft3 Nozzel Area: 2.64E-04 (AsNd) sqft
Corrected Water Volume: - Vws Nozzle Velocity: 25.60 (Nu) ft/secBws, Moisture Content: 0.0180 fraction Cyclone Inlet Velocity: 2113 (Vs) ft/min
Stack Gas Dry Molecular Weight: 28.838 Md PM-10 Sampler Flow Rate: 0.405 (scfm) PMQsStack Gas Wet Molecular Wt: 28.643 Mw Stack Flow Rate: 2,931.1 (Qs) Dscfm
Stack Gas Viscosity: 189.77 µs PM-10-Ds50: 11.24 micronsSample Flow Rate: 0.367 QsSt PM-2.5 Ds50 2.52 microns
Run - Cunn. Slip Corr. 1.06 dimensionless Iso Sampling Rate: 114.18 percentTotal - PM - Cs: 0.0342 gr/dscf PM < 10-2.5µ: 0.0169 lbs/baleTotal - PM - ER: 0.8593 lbs/hr PM < 2.5µ: 0.0013 lbs/bale
Stack Gas Velocity: 22.42 (Vs) ft/sec Total - PM: 0.0250 lbs/bale
REM PM-10, 2.5 - 2008
9:17
8:44
PRE - TEST DATA & CALCULATIONS
Page 47 of 105
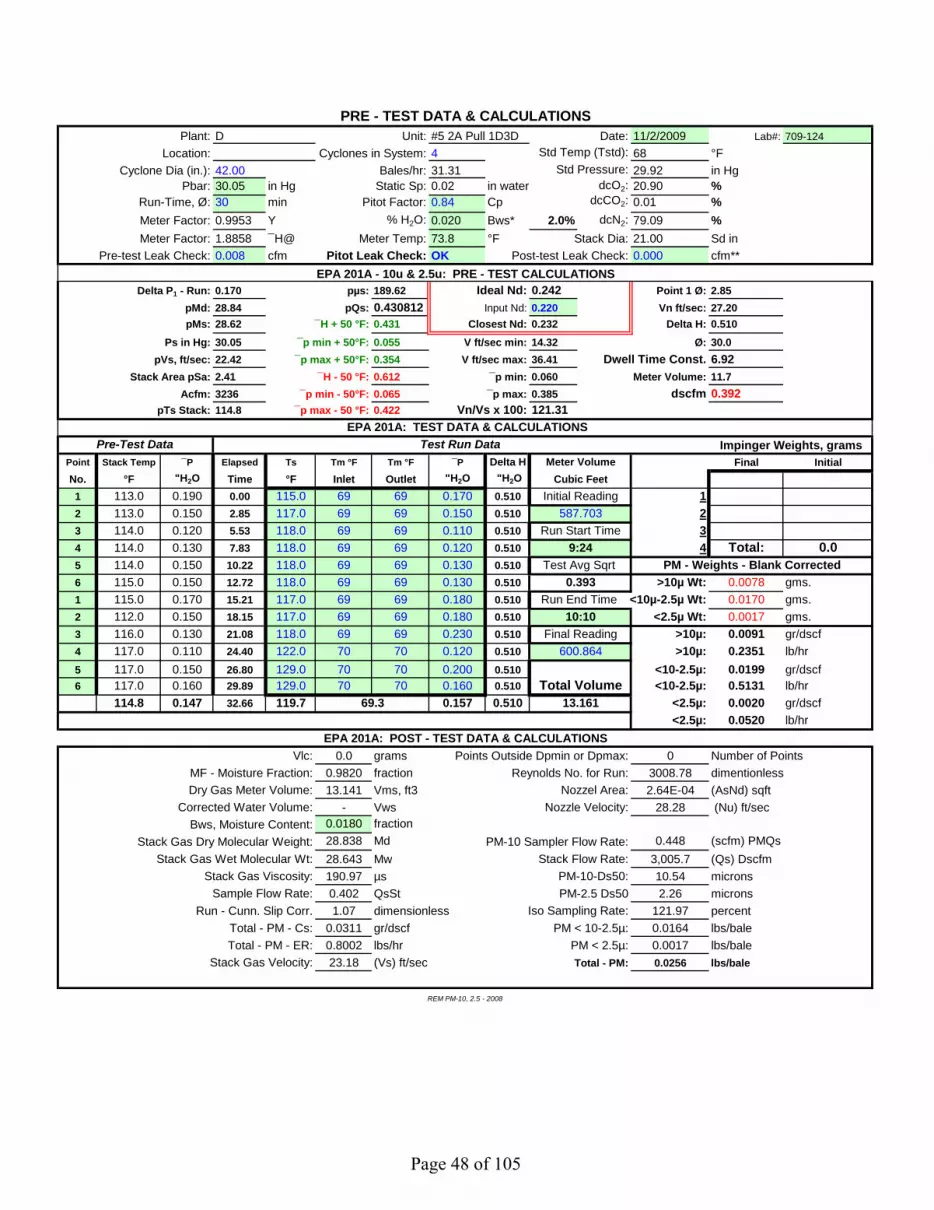
Plant: D Unit: #5 2A Pull 1D3D Date: 11/2/2009 Lab#: 709-124Location: Cyclones in System: 4 Std Temp (Tstd): 68 °F
Cyclone Dia (in.): 42.00 Bales/hr: 31.31 Std Pressure: 29.92 in HgPbar: 30.05 in Hg Static Sp: 0.02 in water dcO2: 20.90 %
Run-Time, Ø: 30 min Pitot Factor: 0.84 Cp dcCO2: 0.01 %Meter Factor: 0.9953 Y % H2O: 0.020 Bws* 2.0% dcN2: 79.09 %Meter Factor: 1.8858 ¯H@ Meter Temp: 73.8 °F Stack Dia: 21.00 Sd in
Pre-test Leak Check: 0.008 cfm Pitot Leak Check: OK Post-test Leak Check: 0.000 cfm**EPA 201A - 10u & 2.5u: PRE - TEST CALCULATIONS
Delta P1 - Run: 0.170 pµs: 189.62 Ideal Nd: 0.242 Point 1 Ø: 2.85pMd: 28.84 pQs: 0.430812 Input Nd: 0.220 Vn ft/sec: 27.20pMs: 28.62 ¯H + 50 °F: 0.431 Closest Nd: 0.232 Delta H: 0.510
Ps in Hg: 30.05 ¯p min + 50°F: 0.055 V ft/sec min: 14.32 Ø: 30.0pVs, ft/sec: 22.42 ¯p max + 50°F: 0.354 V ft/sec max: 36.41 Dwell Time Const. 6.92
Stack Area pSa: 2.41 ¯H - 50 °F: 0.612 ¯p min: 0.060 Meter Volume: 11.7Acfm: 3236 ¯p min - 50°F: 0.065 ¯p max: 0.385 dscfm 0.392
pTs Stack: 114.8 ¯p max - 50 °F: 0.422 Vn/Vs x 100: 121.31 EPA 201A: TEST DATA & CALCULATIONS
Pre-Test Data Test Run Data Impinger Weights, gramsPoint Stack Temp ¯P Elapsed Ts Tm °F Tm °F ¯P Delta H Meter Volume Final InitialNo. °F "H2O Time °F Inlet Outlet "H2O "H2O Cubic Feet1 113.0 0.190 0.00 115.0 69 69 0.170 0.510 Initial Reading 12 113.0 0.150 2.85 117.0 69 69 0.150 0.510 587.703 23 114.0 0.120 5.53 118.0 69 69 0.110 0.510 Run Start Time 34 114.0 0.130 7.83 118.0 69 69 0.120 0.510 4 Total: 0.05 114.0 0.150 10.22 118.0 69 69 0.130 0.510 Test Avg Sqrt PM - Weights - Blank Corrected6 115.0 0.150 12.72 118.0 69 69 0.130 0.510 0.393 >10µ Wt: 0.0078 gms.1 115.0 0.170 15.21 117.0 69 69 0.180 0.510 Run End Time <10µ-2.5µ Wt: 0.0170 gms.2 112.0 0.150 18.15 117.0 69 69 0.180 0.510 <2.5µ Wt: 0.0017 gms.3 116.0 0.130 21.08 118.0 69 69 0.230 0.510 Final Reading >10µ: 0.0091 gr/dscf4 117.0 0.110 24.40 122.0 70 70 0.120 0.510 600.864 >10µ: 0.2351 lb/hr5 117.0 0.150 26.80 129.0 70 70 0.200 0.510 <10-2.5µ: 0.0199 gr/dscf6 117.0 0.160 29.89 129.0 70 70 0.160 0.510 Total Volume <10-2.5µ: 0.5131 lb/hr
114.8 0.147 32.66 119.7 69.3 0.157 0.510 13.161 <2.5µ: 0.0020 gr/dscf<2.5µ: 0.0520 lb/hr
EPA 201A: POST - TEST DATA & CALCULATIONSVlc: 0.0 grams Points Outside Dpmin or Dpmax: 0 Number of Points
MF - Moisture Fraction: 0.9820 fraction Reynolds No. for Run: 3008.78 dimentionlessDry Gas Meter Volume: 13.141 Vms, ft3 Nozzel Area: 2.64E-04 (AsNd) sqft
Corrected Water Volume: - Vws Nozzle Velocity: 28.28 (Nu) ft/secBws, Moisture Content: 0.0180 fraction
Stack Gas Dry Molecular Weight: 28.838 Md PM-10 Sampler Flow Rate: 0.448 (scfm) PMQsStack Gas Wet Molecular Wt: 28.643 Mw Stack Flow Rate: 3,005.7 (Qs) Dscfm
Stack Gas Viscosity: 190.97 µs PM-10-Ds50: 10.54 micronsSample Flow Rate: 0.402 QsSt PM-2.5 Ds50 2.26 microns
Run - Cunn. Slip Corr. 1.07 dimensionless Iso Sampling Rate: 121.97 percentTotal - PM - Cs: 0.0311 gr/dscf PM < 10-2.5µ: 0.0164 lbs/baleTotal - PM - ER: 0.8002 lbs/hr PM < 2.5µ: 0.0017 lbs/bale
Stack Gas Velocity: 23.18 (Vs) ft/sec Total - PM: 0.0256 lbs/bale
PRE - TEST DATA & CALCULATIONS
9:24
10:10
REM PM-10, 2.5 - 2008
Page 48 of 105

Cotton Gin Test Data
Plant: D Date: 11/2/2009Location: Start Time: 7:52
Unit: #5 2A Pull 1D3D End Time: 8:22Run: 1
Elapsed Time: 30 Test Time: 28.58Bale Time: 31.43 StdDev Std BPH: 9.44
Ave min/bale: 0:01:58 Ave Std BPH: 31.1
Bale No. Bale Wt. Time time/baleStd 500 lb
BPHChauvenet's
Criterion5509070 7:50:40 --- --- ---5509071 498 7:55:05 0:04:25 13.55509072 504 7:56:47 0:01:42 35.65509073 502 7:58:39 0:01:52 32.35509074 498 8:00:32 0:01:53 31.75509075 514 8:03:04 0:02:32 24.35509076 480 8:04:03 0:00:59 58.6 *5509077 503 8:05:50 0:01:47 33.85509078 505 8:07:51 0:02:01 30.05509079 501 8:09:49 0:01:58 30.65509080 495 8:11:30 0:01:41 35.35509081 503 8:13:32 0:02:02 29.75509082 516 8:15:10 0:01:38 37.95509083 526 8:17:07 0:01:57 32.45509084 549 8:18:58 0:01:51 35.65509085 529 8:20:21 0:01:23 45.95509086 515 8:22:06 0:01:45 35.3
REM - 2003
Page 49 of 105

Cotton Gin Test Data
Plant: D Date: 11/2/2009Location: Start Time: 8:44
Unit: #5 2A Pull 1D3D End Time: 9:17Run: 2
Elapsed Time: 33 Test Time: 31.77Bale Time: 32.55 StdDev Std BPH: 4.14
Ave min/bale: 0:01:43 Ave Std BPH: 34.4
Bale No. Bale Wt. Time time/baleStd 500 lb
BPHChauvenet's
Criterion5509099 8:44:36 --- --- ---5509100 480 8:46:12 0:01:36 36.05509101 495 8:47:50 0:01:38 36.45509102 490 8:49:30 0:01:40 35.35509103 494 8:51:16 0:01:46 33.65509104 486 8:52:54 0:01:38 35.75509105 509 8:54:37 0:01:43 35.65509106 484 8:56:11 0:01:34 37.15509107 508 8:57:53 0:01:42 35.95509108 483 8:59:35 0:01:42 34.15509109 498 9:01:25 0:01:50 32.65509110 486 9:03:09 0:01:44 33.65509111 506 9:04:47 0:01:38 37.25509112 500 9:07:07 0:02:20 25.75509113 479 9:08:30 0:01:23 41.65509114 480 9:10:42 0:02:12 26.25509115 497 9:12:39 0:01:57 30.65509116 475 9:14:02 0:01:23 41.25509117 485 9:15:32 0:01:30 38.85509118 503 9:17:09 0:01:37 37.3
REM - 2003
Page 50 of 105

Cotton Gin Test Data
Plant: D Date: 11/2/2009Location: Start Time: 9:24
Unit: #5 2A Pull 1D3D End Time: 10:10Run: 3
Elapsed Time: 46 Test Time: 32.66Bale Time: 33.62 StdDev Std BPH: 5.86
Ave min/bale: 0:02:20 Ave Std BPH: 31.3
Bale No. Bale Wt. Time time/baleStd 500 lb
BPHChauvenet's
Criterion5509122 9:23:46 --- --- ---5509123 485 9:25:27 0:01:41 34.65509124 483 9:27:16 0:01:49 31.95509125 488 9:28:53 0:01:37 36.25509126 492 9:30:39 0:01:46 33.45509127 497 9:32:21 0:01:42 35.15509128 483 9:34:07 0:01:46 32.85509129 496 9:36:01 0:01:54 31.35509130 477 9:37:49 0:01:48 31.85509131 482 9:39:17 0:01:28 39.45509132 479 9:40:44 0:01:27 39.65509133 492 9:42:22 0:01:38 36.15509134 489 9:43:54 0:01:32 38.35509135 495 9:45:31 0:01:37 36.75509136 9:56:13 0:10:42 *5509137 9:58:34 0:02:21 *5509138 478 10:00:22 0:01:48 31.95509139 489 10:02:10 0:01:48 32.65509140 489 10:06:33 0:04:23 13.4 *5509141 488 10:08:43 0:02:10 27.05509142 490 10:10:26 0:01:43 34.3
REM - 2003
NOTE: Removed Bale Data = Lapse in Gin Operation
Page 51 of 105

PARTICULATE WEIGHTS : DATA & CALCULATIONS RUN #1
Client : D Date : 11/2/09 >10 Catch ID:Site : Lab#: 709-124 <10 Catch ID:Unit : #5 2A Pull 1D3D Filter ID: 8L-1512 <2.5 Catch ID:
Acetone: TS-0124 100 gGross: 741.425 mg Tare: 741.126 mg Residue: 0.2983 mg
>10 µ Rinse: TS-0832Acetone: 17.3 g * 0.00298 mg/g -0.05164 mg
Gross: 647.094 mg Tare: 646.126 mg 0.9673 mg >10 µ Total Weight = 0.9157 mg
< 10 µ Rinse: TS-0833Acetone: 20.1 g * 0.00298 mg/g -0.06002 mg
Gross: 687.340 mg Tare: 685.977 mg 1.3630 mg< 10 µ Total Weight = 1.3030 mg
< 2.5 µ Filter: 8L-1512Gross: 307.174 mg Tare: 306.670 mg < 2.5 filter Net: 0.5043 mg
< 2.5 µ Rinse: TS-0834Acetone: 6.9 g * 0.00298 mg/g -0.02047 mg
Gross: 735.779 mg Tare: 734.860 mg 0.9193 mg< 2.5 µ Rinse Total Weight = 0.8989 mg
> 10 µ Total Weight = 0.0009 g< 10 µ Total Weight = 0.0027 g
< 10-2.5 µTotal Weight = 0.0013 g< 2.5 µ Total Weight = 0.0014 g
Total Weight = 0.0036 g
WEIGHTS & VOLUMES
REM PM-10, 2.5 - 2001
TS-0832TS-0833TS-0834
SOLUTION BLANKS
Page 52 of 105

PARTICULATE WEIGHTS : DATA & CALCULATIONS RUN #2
Client : D Date : 11/2/09 >10 Catch ID:Site : Lab#: 709-124 <10 Catch ID:Unit : #5 2A Pull 1D3D Filter ID: 8L-1513 <2.5 Catch ID:
Acetone: TS-0124 100 gGross: 741.425 mg Tare: 741.126 mg Residue: 0.2983 mg
>10 µ Rinse: TS-0838Acetone: 31.2 g * 0.00298 mg/g -0.09296 mg
Gross: 641.236 mg Tare: 634.161 mg 7.0750 mg >10 µ Total Weight = 6.9820 mg
< 10 µ Rinse: TS-0839Acetone: 26.4 g * 0.00298 mg/g -0.07876 mg
Gross: 729.259 mg Tare: 711.670 mg 17.5887 mg< 10 µ Total Weight = 17.5099 mg
< 2.5 µ Filter: 8L-1513Gross: 321.505 mg Tare: 320.571 mg < 2.5 filter Net: 0.9337 mg
< 2.5 µ Rinse: TS-0840Acetone: 6.8 g * 0.00298 mg/g -0.02026 mg
Gross: 717.995 mg Tare: 717.541 mg 0.4543 mg< 2.5 µ Rinse Total Weight = 0.4341 mg
> 10 µ Total Weight = 0.0070 g< 10 µ Total Weight = 0.0189 g
< 10-2.5 µTotal Weight = 0.0175 g< 2.5 µ Total Weight = 0.0014 g
Total Weight = 0.0259 g
WEIGHTS & VOLUMES
REM PM-10, 2.5 - 2001
TS-0838TS-0839TS-0840
SOLUTION BLANKS
Page 53 of 105

PARTICULATE WEIGHTS : DATA & CALCULATIONS RUN #3
Client : D Date : 11/2/09 >10 Catch ID:Site : Lab#: 709-124 <10 Catch ID:Unit : #5 2A Pull 1D3D Filter ID: 8L-1514 <2.5 Catch ID:
Acetone: TS-0124 100 gGross: 741.425 mg Tare: 741.126 mg Residue: 0.2983 mg
>10 µ Rinse: TS-0843Acetone: 33.4 g * 0.00298 mg/g -0.09961 mg
Gross: 596.237 mg Tare: 588.365 mg 7.8720 mg >10 µ Total Weight = 7.7724 mg
< 10 µ Rinse: TS-0844Acetone: 28.2 g * 0.00298 mg/g -0.08404 mg
Gross: 710.857 mg Tare: 693.813 mg 17.0440 mg< 10 µ Total Weight = 16.9600 mg
< 2.5 µ Filter: 8L-1514Gross: 315.704 mg Tare: 314.528 mg < 2.5 filter Net: 1.1757 mg
< 2.5 µ Rinse: TS-0846Acetone: 6.4 g * 0.00298 mg/g -0.01906 mg
Gross: 645.468 mg Tare: 644.907 mg 0.5610 mg< 2.5 µ Rinse Total Weight = 0.5419 mg
> 10 µ Total Weight = 0.0078 g< 10 µ Total Weight = 0.0187 g
< 10-2.5 µTotal Weight = 0.0170 g< 2.5 µ Total Weight = 0.0017 g
Total Weight = 0.0264 g
WEIGHTS & VOLUMES
REM PM-10, 2.5 - 2001
TS-0843TS-0844TS-0846
SOLUTION BLANKS
Page 54 of 105

Acetone Rinse
Client : Date :Location: Job # : 709-124
Unit : #5 2A Pull 1D3D
PM-2.5Run 1 Run 2 Run 3
Filter ID#: 8L-1512 Filter ID#: 8L-1513 Filter ID#: 8L-1514
>10 Start Vol: 239.6 g >10 Start Vol: 399.6 g >10 Start Vol: 298.6 gEnd Vol: 222.3 g End Vol: 368.5 g End Vol: 265.2 g
Total: 17.3 g Total: 31.2 g Total: 33.4 gTub #: TS-0832 Tub #: TS-0838 Tub #: TS-0843
<10 Start Vol: 222.3 g <10 Start Vol: 368.5 g <10 Start Vol: 265.2 gEnd Vol: 202.2 g End Vol: 342.1 g End Vol: 237.0 g
Total: 20.1 g Total: 26.4 g Total: 28.2 gTub #: TS-0833 Tub #: TS-0839 Tub #: TS-0844
<2.5 Start Vol: 202.2 g <2.5 Start Vol: 342.1 g <2.5 Start Vol: 237.0 gEnd Vol: 195.3 g End Vol: 335.3 g End Vol: 230.6 g
Total: 6.9 g Total: 6.8 g Total: 6.4 gTub #: TS-0834 Tub #: TS-0840 Tub #: TS-0846
D 11/2/2009
Page 55 of 105

Filter/Tub Weights
Client : Date :Location: Job # : 709-124
Unit : #5 2A Pull 1D3D
Filter/Tub No.
Pre-Weight
(mg)
Post-Weight
(mg)
Net-Weight
(mg)Acetone Blank 100 g TS-0124 741.126 741.425 0.298DI Water Blank 250 g TL-0019 644.790 646.241 1.451Filter Blank 6L-0119 249.026 249.047 0.021
No. Cyclone Name Method Run No.Sample
LocationFilter/Tub
No.
Pre-Weight
(mg)
Post-Weight
(mg)
Net-Weight
(mg)5 #2A Pull 27 1 < 10 TS-0833 685.977 687.340 1.3635 #2A Pull 27 1 < 2.5 TS-0834 734.860 735.779 0.9195 #2A Pull 27 1 > 10 TS-0832 646.126 647.094 0.9675 #2A Pull 27 1 Filter < 2.5 8L-1512 306.670 307.174 0.5045 #2A Pull 27 2 < 10 TS-0839 711.670 729.259 17.5895 #2A Pull 27 2 < 2.5 TS-0840 717.541 717.995 0.4545 #2A Pull 27 2 > 10 TS-0838 634.161 641.236 7.0755 #2A Pull 27 2 Filter < 2.5 8L-1513 320.571 321.505 0.9345 #2A Pull 27 3 < 10 TS-0844 693.813 710.857 17.0445 #2A Pull 27 3 < 2.5 TS-0846 644.907 645.468 0.5615 #2A Pull 27 3 > 10 TS-0843 588.365 596.237 7.8725 #2A Pull 27 3 Filter < 2.5 8L-1514 314.528 315.704 1.176
D 11/2/2009
Page 56 of 105

Gin E Field and Laboratory Data
Page 57 of 105

E#9 2 Pull 1D3D2010
Emission Factor (lbs/bale) Emission Rate (lbs/hr)Based on EPA Method OTM27 Based on EPA Method OTM27
Total PM Total PMRun 1 0.1797 Run 1 6.1296
X Run 2 0.1530 Run 2 5.9631Run 3 0.1476 Run 3 5.8440
Average 0.1636 Average 5.9868PM10 PM10
Run 1 0.1315 Run 1 4.4850Run 2 0.1070 Run 2 4.1703Run 3 0.1092 Run 3 4.3215
Average 0.1159 Average 4.3256PM2.5 PM2.5
Run 1 0.0131 Run 1 0.4469Run 2 0.0080 Run 2 0.3110Run 3 0.0082 Run 3 0.3255
Average 0.0098 Average 0.3612PM10-2.5 PM10-2.5
Run 1 0.1184 Run 1 4.0381Run 2 0.0990 Run 2 3.8593Run 3 0.1009 Run 3 3.9959
Average 0.1061 Average 3.9644PM2.5/PM10
Run 1 10.0%Run 2 7.5%Run 3 7.5%
Average 8.4%PM2.5/TSP
Run 1 7.3%Run 2 5.2%Run 3 5.6%
Average 6.0%PM10/TSP
Run 1 73.2%Run 2 69.9%Run 3 73.9%
Average 70.8%
X: Run omitted from all dependent averages - Total PM ISO not met
Gin:Exhaust:
Date:
Page 58 of 105

#9 2 Pull 1D3D Run #1 Run #2 Run #3
ø - Start of Run, time 9:35 10:14 10:56
ø - End of Run, time 10:07 10:47 11:29
Vlc - Volume of water collected, ml 0.0 0.0 0.0
Vm - Gas volume, meter cond., dcf 11.921 12.071 11.641
Y - Meter calibration factor 1.000 1.000 1.000
Pbar - Barometric pressure, in. Hg 29.90 29.90 29.90
Pg - Stack static pressure, in. H2O -0.23 0.00 -0.23
ˆH - Avg. meter press. diff., in. H2O 0.490 0.489 0.492
Tm - Absolute meter temperature, °R 530.8 532.3 534.2
Vm(std) - Standard sample gas vol., dscf 11.8656 11.9791 11.5128
Bws - Water vapor part in gas stream 0.026 0.026 0.026
CO2 - Dry concentration, volume % 0.00 0.00 0.00
O2 - Dry concentration, volume % 0.0 0.0 0.0
Md - Mole wt. stack gas, dry, g/mole 28.838 28.838 28.838
Ms - Mole wt. stack gas, wet, g/gmole 28.556 28.556 28.556
Cp - Pitot tube coef., dimensionless 0.840 0.840 0.840
ˆp - Avg. of sq. roots of eachˆp 0.538 0.529 0.510
Ts - Absolute stack Temp. °R 572.1 574.8 575.7
A - Area of stack, square feet 9.17 9.17 9.17
Vs - Stack Gas Flow, ft/sec 31.61 31.15 30.11
Qstd - Volumetric flow rate, dscfm 15,612 15,324 14,777
An - Area of nozzle, square feet 2.074E-04 2.074E-04 2.521E-04
ø - Sampling time, minutes 30.68 30.66 29.56
DP50 - Cut size, microns 10.72 10.65 10.67
I - Isokinetic variation, percent 109.5 112.7 95.9
Sts - Stacks per system 1 1 1
OTM METHOD 27 FIELD DATA SUMMARYE
REM PM-10, 2.5 - 2008
Page 59 of 105

#9 2 Pull 1D3D Run #1 Run #2 Run #3 AVERAGE
Qstd - Volumetric flow rate, dscfm 15,612 15,324 14,777 15,238
Vm(std) - Standard sample gas vol., dscf 11.8656 11.9791 11.5128 11.7858
DP50 - Cut size, microns 10µ 10.72 10.65 10.67 10.68
DP50 - Cut size, microns 2.5µ 2.33 2.31 2.31 2.32
Bale/hr - Total 500 lb Bales per hr 34.1 39.0 39.6 37.6
>10 µ - Total PM g 0.0094 0.0106 0.0090 0.0097
>10 µ - Total PM gr/dscfm 0.0123 0.0136 0.0120 0.0127
>10 µ - Total PM lb/hr 1.645 1.793 1.523 1.6533
>10 µ - Total PM lb/bale 0.0482 0.0460 0.0385 0.0442
10 µ -2.5 µ - PM-10 - 2.5 g 0.0232 0.0228 0.0235 0.0232
10 µ -2.5 µ - PM-10 gr/dscf 0.0302 0.0294 0.0315 0.0304
10 µ -2.5 µ - PM-10 lb/hr 4.038 3.859 3.996 3.964
10 µ -2.5 µ - PM-10 lb/bale 0.1184 0.0990 0.1009 0.1061
< 2.5 µ - PM-2.5 g 0.0026 0.0018 0.0019 0.0021
< 2.5 µ - PM-2.5 gr/dscf 0.0033 0.0024 0.0026 0.00276
< 2.5 µ - PM-2.5 lb/hr 0.447 0.311 0.326 0.361
< 2.5 µ - PM-2.5 lb/bale 0.0131 0.0080 0.0082 0.0098
TPM - Total PM g 0.0352 0.0352 0.0344 0.0350
TPM - Total PM gr/dscf 0.0458 0.0454 0.0461 0.0458
TPM - Total PM lb/hr 6.130 5.963 5.844 5.98
TPM - Total PM lb/bale 0.1797 0.1530 0.1476 0.1601
REM PM-10, 2.5 - 2008
OTM METHOD 27 FIELD DATA SUMMARYE
Page 60 of 105

Run #1 Run #2 Run #3 AverageTotal Particulate Per Cyclone
Total gr/dscf 0.0458 0.0454 0.0461 0.0458Total lb/hr 6.13 5.96 5.84 5.98Total lb/bale 0.1797 0.1530 0.1476 0.1601
Total Particulate Per SystemTotal lb/hr 6.13 5.96 5.84 5.98Total lb/bale 0.180 0.153 0.148 0.160
< 10 µ Results per Cyclone- 10 µ gr/dscf 0.0335 0.0317 0.0341 0.0331- 10 µ (lb/hr) 4.48 4.17 4.32 4.33- 10 µ (lb/Bale) 0.1315 0.1070 0.1092 0.1159
< 10 µ Results per System- 10 µ (lb/hr) 4.48 4.17 4.32 4.33- 10 µ (lb/Bale) 0.131 0.107 0.109 0.116
< 2.5 µ Results per Cyclone- 2.5 µ gr/dscf 0.0033 0.0024 0.0026 0.0028- 2.5 µ (lb/hr) 0.45 0.31 0.33 0.36- 2.5 µ (lb/Bale) 0.0131 0.0080 0.0082 0.0098
< 2.5 µ Results per System- 2.5 µ (lb/hr) 0.45 0.31 0.33 0.36- 2.5 µ (lb/Bale) 0.013 0.008 0.008 0.010
Average Bales/hr 34.12 38.98 39.59 37.56
Cyclone Flow-RatesVs 31.61 31.15 30.11 30.96Acfm 17,388 17,138 16,561 17,029Dscfm 15,612 15,324 14,777 15,238
Cyclone Inlet VelocityVsfm 2979 2936 2837 2918
System Flow-RatesAcfm - - - 17,029Dscfm - - - 15,238
Number of Cyclones in System 1REM PM-10, 2.5 - 2001
E#9 2 Pull 1D3D
OTM METHOD 27 RESULTS
Page 61 of 105

Plant: E Unit: #9 2 Pull 1D3D Date: 9/20/2010 Lab#: 810-087Location: Cyclones in System: 1 Std Temp (Tstd): 68 °F
Cyclone Dia (in.): 82.00 Bales/hr: 34.12 Std Pressure: 29.92 in HgPbar: 29.90 in Hg Static Sp: -0.23 in water dcO2: 20.90 %
Run-Time, Ø: 30 min Pitot Factor: 0.84 Cp dcCO2: 0.01 %Meter Factor: 1 Y % H2O: 0.022 Bws* 2.2% dcN2: 79.09 %Meter Factor: 1.817 ¯H@ Meter Temp: 73.0 °F Stack Dia: 41.00 Sd in
Pre-test Leak Check: 0.020 cfm Pitot Leak Check: OK Post-test Leak Check: 0.000 cfm**EPA 201A - 10u & 2.5u: PRE - TEST CALCULATIONS
Delta P1 - Run: 0.270 pµs: 191.77 Ideal Nd: 0.192 Point 1 Ø: 2.47pMd: 28.84 pQs: 0.43983 Input Nd: 0.195 Vn ft/sec: 35.35pMs: 28.60 ¯H + 50 °F: 0.416 Closest Nd: 0.195 Delta H: 0.490
Ps in Hg: 29.88 ¯p min + 50°F: 0.131 V ft/sec min: 22.36 Ø: 30.0pVs, ft/sec: 36.54 ¯p max + 50°F: 0.550 V ft/sec max: 45.88 Dwell Time Const. 4.76
Stack Area pSa: 9.17 ¯H - 50 °F: 0.586 ¯p min: 0.142 Meter Volume: 11.8Acfm: 20099 ¯p min - 50°F: 0.155 ¯p max: 0.597 dscfm 0.392
pTs Stack: 124.2 ¯p max - 50 °F: 0.653 Vn/Vs x 100: 96.75 EPA 201A: TEST DATA & CALCULATIONS
Pre-Test Data Test Run Data Impinger Weights, gramsPoint Stack Temp ¯P Elapsed Ts Tm °F Tm °F ¯P Delta H Meter Volume Final InitialNo. °F "H2O Time °F Inlet Outlet "H2O "H2O Cubic Feet6 127 0.370 0.00 112.0 71 71 0.270 0.490 Initial Reading 15 125 0.410 2.47 112.0 70 70 0.220 0.490 0.000 24 126 0.310 4.70 112.0 71 71 0.170 0.490 Run Start Time 33 129 0.400 6.66 112.0 70 70 0.310 0.490 4 Total: 0.02 129 0.520 9.31 111.0 70 70 0.280 0.490 PM - Weights - Blank Corrected1 129 0.480 11.83 112.0 71 71 0.430 0.490 >10µ Wt: 0.0094 gms.6 127 0.350 14.94 110.0 71 71 0.240 0.490 Run End Time <10µ-2.5µ Wt: 0.0232 gms.5 123 0.220 17.27 115.0 71 71 0.220 0.490 <2.5µ Wt: 0.0026 gms.4 123 0.190 19.51 113.0 71 71 0.180 0.490 Final Reading >10µ: 0.0123 gr/dscf3 118 0.370 21.52 113.0 71 71 0.300 0.490 11.921 >10µ: 1.6446 lb/hr2 118 0.510 24.13 112.0 71 71 0.440 0.490 <10-2.5µ: 0.0302 gr/dscf1 116 0.510 27.28 111.0 71 71 0.510 0.490 Total Volume <10-2.5µ: 4.0381 lb/hr
124.2 0.387 30.68 112.1 70.8 0.298 0.490 11.921 <2.5µ: 0.0033 gr/dscf<2.5µ: 0.4469 lb/hr
EPA 201A: POST - TEST DATA & CALCULATIONSVlc: 0.0 grams Points Outside Dpmin or Dpmax: 0 Number of Points
MF - Moisture Fraction: 0.9740 fraction Reynolds No. for Run: 2944.92 dimentionlessDry Gas Meter Volume: 11.866 Vms, ft3 Nozzel Area: 2.07E-04 (AsNd) sqft
Corrected Water Volume: - Vws Nozzle Velocity: 34.62 (Nu) ft/secBws, Moisture Content: 0.0260 fraction Cyclone Inlet Velocity: 2979 (Vs) ft/min
Stack Gas Dry Molecular Weight: 28.838 Md PM-10 Sampler Flow Rate: 0.431 (scfm) PMQsStack Gas Wet Molecular Wt: 28.556 Mw Stack Flow Rate: 15,611.9 (Qs) Dscfm
Stack Gas Viscosity: 188.52 µs PM-10-Ds50: 10.72 micronsSample Flow Rate: 0.387 QsSt PM-2.5 Ds50 2.33 microns
Run - Cunn. Slip Corr. 1.07 dimensionless Iso Sampling Rate: 109.52 percentTotal - PM - Cs: 0.0458 gr/dscf PM < 10-2.5µ: 0.1184 lbs/baleTotal - PM - ER: 6.1296 lbs/hr PM < 2.5µ: 0.0131 lbs/bale
Stack Gas Velocity: 31.61 (Vs) ft/sec Total - PM: 0.1797 lbs/bale
REM PM-10, 2.5 - 2008
PRE - TEST DATA & CALCULATIONS
9:35
10:07
Page 62 of 105
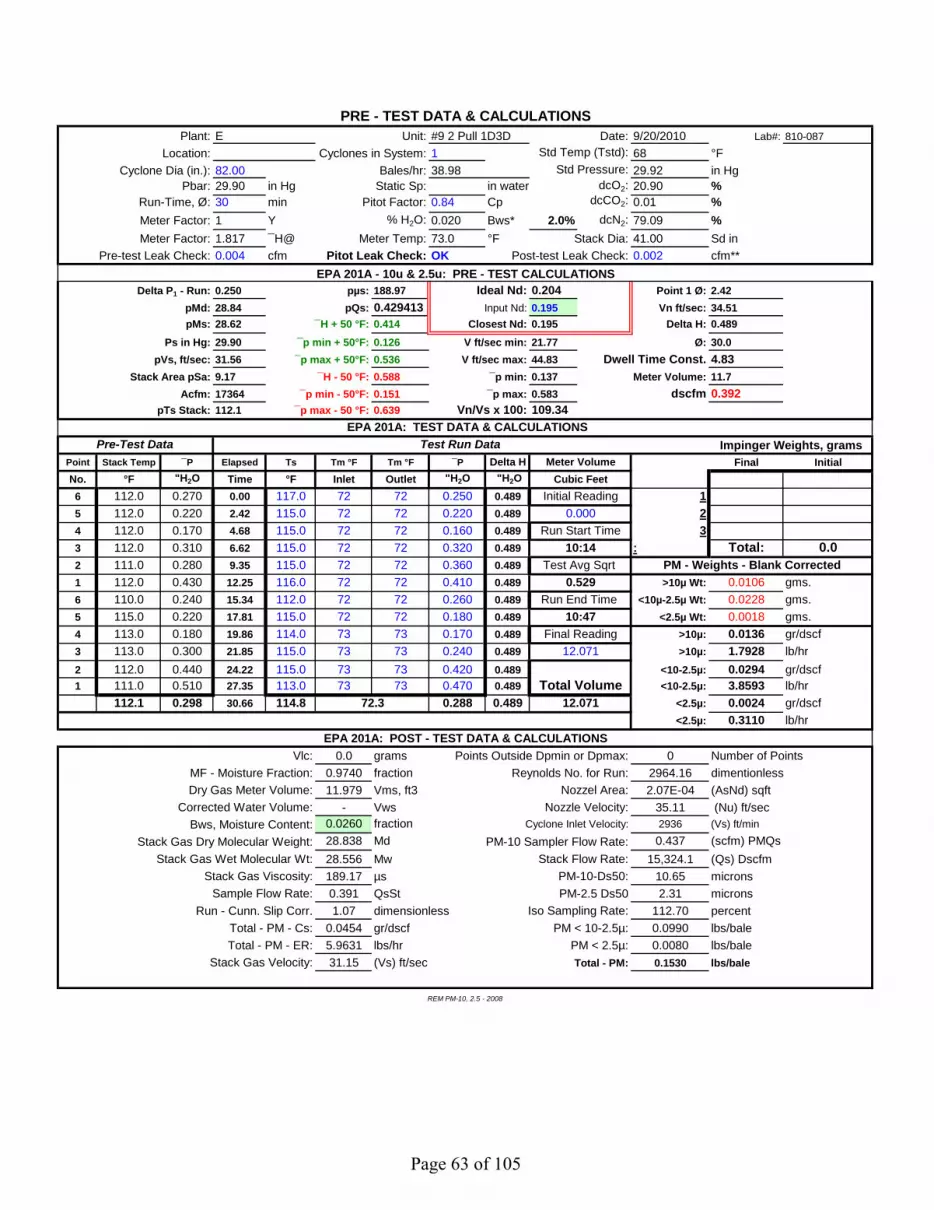
Plant: E Unit: #9 2 Pull 1D3D Date: 9/20/2010 Lab#: 810-087Location: Cyclones in System: 1 Std Temp (Tstd): 68 °F
Cyclone Dia (in.): 82.00 Bales/hr: 38.98 Std Pressure: 29.92 in HgPbar: 29.90 in Hg Static Sp: in water dcO2: 20.90 %
Run-Time, Ø: 30 min Pitot Factor: 0.84 Cp dcCO2: 0.01 %Meter Factor: 1 Y % H2O: 0.020 Bws* 2.0% dcN2: 79.09 %Meter Factor: 1.817 ¯H@ Meter Temp: 73.0 °F Stack Dia: 41.00 Sd in
Pre-test Leak Check: 0.004 cfm Pitot Leak Check: OK Post-test Leak Check: 0.002 cfm**EPA 201A - 10u & 2.5u: PRE - TEST CALCULATIONS
Delta P1 - Run: 0.250 pµs: 188.97 Ideal Nd: 0.204 Point 1 Ø: 2.42pMd: 28.84 pQs: 0.429413 Input Nd: 0.195 Vn ft/sec: 34.51pMs: 28.62 ¯H + 50 °F: 0.414 Closest Nd: 0.195 Delta H: 0.489
Ps in Hg: 29.90 ¯p min + 50°F: 0.126 V ft/sec min: 21.77 Ø: 30.0pVs, ft/sec: 31.56 ¯p max + 50°F: 0.536 V ft/sec max: 44.83 Dwell Time Const. 4.83
Stack Area pSa: 9.17 ¯H - 50 °F: 0.588 ¯p min: 0.137 Meter Volume: 11.7Acfm: 17364 ¯p min - 50°F: 0.151 ¯p max: 0.583 dscfm 0.392
pTs Stack: 112.1 ¯p max - 50 °F: 0.639 Vn/Vs x 100: 109.34 EPA 201A: TEST DATA & CALCULATIONS
Pre-Test Data Test Run Data Impinger Weights, gramsPoint Stack Temp ¯P Elapsed Ts Tm °F Tm °F ¯P Delta H Meter Volume Final InitialNo. °F "H2O Time °F Inlet Outlet "H2O "H2O Cubic Feet6 112.0 0.270 0.00 117.0 72 72 0.250 0.489 Initial Reading 15 112.0 0.220 2.42 115.0 72 72 0.220 0.489 0.000 24 112.0 0.170 4.68 115.0 72 72 0.160 0.489 Run Start Time 33 112.0 0.310 6.62 115.0 72 72 0.320 0.489 : Total: 0.02 111.0 0.280 9.35 115.0 72 72 0.360 0.489 Test Avg Sqrt PM - Weights - Blank Corrected1 112.0 0.430 12.25 116.0 72 72 0.410 0.489 0.529 >10µ Wt: 0.0106 gms.6 110.0 0.240 15.34 112.0 72 72 0.260 0.489 Run End Time <10µ-2.5µ Wt: 0.0228 gms.5 115.0 0.220 17.81 115.0 72 72 0.180 0.489 <2.5µ Wt: 0.0018 gms.4 113.0 0.180 19.86 114.0 73 73 0.170 0.489 Final Reading >10µ: 0.0136 gr/dscf3 113.0 0.300 21.85 115.0 73 73 0.240 0.489 12.071 >10µ: 1.7928 lb/hr2 112.0 0.440 24.22 115.0 73 73 0.420 0.489 <10-2.5µ: 0.0294 gr/dscf1 111.0 0.510 27.35 113.0 73 73 0.470 0.489 Total Volume <10-2.5µ: 3.8593 lb/hr
112.1 0.298 30.66 114.8 72.3 0.288 0.489 12.071 <2.5µ: 0.0024 gr/dscf<2.5µ: 0.3110 lb/hr
EPA 201A: POST - TEST DATA & CALCULATIONSVlc: 0.0 grams Points Outside Dpmin or Dpmax: 0 Number of Points
MF - Moisture Fraction: 0.9740 fraction Reynolds No. for Run: 2964.16 dimentionlessDry Gas Meter Volume: 11.979 Vms, ft3 Nozzel Area: 2.07E-04 (AsNd) sqft
Corrected Water Volume: - Vws Nozzle Velocity: 35.11 (Nu) ft/secBws, Moisture Content: 0.0260 fraction Cyclone Inlet Velocity: 2936 (Vs) ft/min
Stack Gas Dry Molecular Weight: 28.838 Md PM-10 Sampler Flow Rate: 0.437 (scfm) PMQsStack Gas Wet Molecular Wt: 28.556 Mw Stack Flow Rate: 15,324.1 (Qs) Dscfm
Stack Gas Viscosity: 189.17 µs PM-10-Ds50: 10.65 micronsSample Flow Rate: 0.391 QsSt PM-2.5 Ds50 2.31 microns
Run - Cunn. Slip Corr. 1.07 dimensionless Iso Sampling Rate: 112.70 percentTotal - PM - Cs: 0.0454 gr/dscf PM < 10-2.5µ: 0.0990 lbs/baleTotal - PM - ER: 5.9631 lbs/hr PM < 2.5µ: 0.0080 lbs/bale
Stack Gas Velocity: 31.15 (Vs) ft/sec Total - PM: 0.1530 lbs/bale
REM PM-10, 2.5 - 2008
10:47
10:14
PRE - TEST DATA & CALCULATIONS
Page 63 of 105
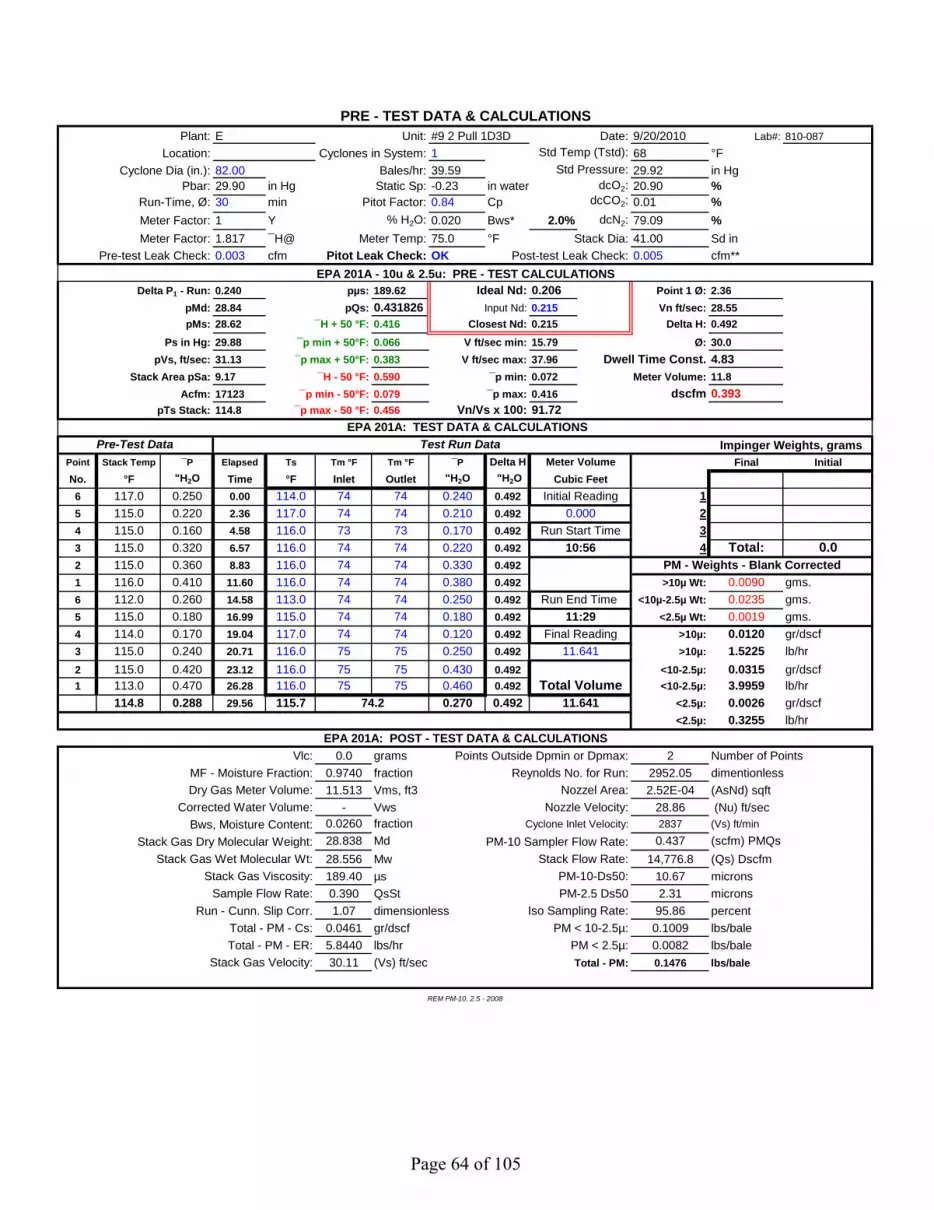
Plant: E Unit: #9 2 Pull 1D3D Date: 9/20/2010 Lab#: 810-087Location: Cyclones in System: 1 Std Temp (Tstd): 68 °F
Cyclone Dia (in.): 82.00 Bales/hr: 39.59 Std Pressure: 29.92 in HgPbar: 29.90 in Hg Static Sp: -0.23 in water dcO2: 20.90 %
Run-Time, Ø: 30 min Pitot Factor: 0.84 Cp dcCO2: 0.01 %Meter Factor: 1 Y % H2O: 0.020 Bws* 2.0% dcN2: 79.09 %Meter Factor: 1.817 ¯H@ Meter Temp: 75.0 °F Stack Dia: 41.00 Sd in
Pre-test Leak Check: 0.003 cfm Pitot Leak Check: OK Post-test Leak Check: 0.005 cfm**EPA 201A - 10u & 2.5u: PRE - TEST CALCULATIONS
Delta P1 - Run: 0.240 pµs: 189.62 Ideal Nd: 0.206 Point 1 Ø: 2.36pMd: 28.84 pQs: 0.431826 Input Nd: 0.215 Vn ft/sec: 28.55pMs: 28.62 ¯H + 50 °F: 0.416 Closest Nd: 0.215 Delta H: 0.492
Ps in Hg: 29.88 ¯p min + 50°F: 0.066 V ft/sec min: 15.79 Ø: 30.0pVs, ft/sec: 31.13 ¯p max + 50°F: 0.383 V ft/sec max: 37.96 Dwell Time Const. 4.83
Stack Area pSa: 9.17 ¯H - 50 °F: 0.590 ¯p min: 0.072 Meter Volume: 11.8Acfm: 17123 ¯p min - 50°F: 0.079 ¯p max: 0.416 dscfm 0.393
pTs Stack: 114.8 ¯p max - 50 °F: 0.456 Vn/Vs x 100: 91.72 EPA 201A: TEST DATA & CALCULATIONS
Pre-Test Data Test Run Data Impinger Weights, gramsPoint Stack Temp ¯P Elapsed Ts Tm °F Tm °F ¯P Delta H Meter Volume Final InitialNo. °F "H2O Time °F Inlet Outlet "H2O "H2O Cubic Feet6 117.0 0.250 0.00 114.0 74 74 0.240 0.492 Initial Reading 15 115.0 0.220 2.36 117.0 74 74 0.210 0.492 0.000 24 115.0 0.160 4.58 116.0 73 73 0.170 0.492 Run Start Time 33 115.0 0.320 6.57 116.0 74 74 0.220 0.492 4 Total: 0.02 115.0 0.360 8.83 116.0 74 74 0.330 0.492 PM - Weights - Blank Corrected1 116.0 0.410 11.60 116.0 74 74 0.380 0.492 >10µ Wt: 0.0090 gms.6 112.0 0.260 14.58 113.0 74 74 0.250 0.492 Run End Time <10µ-2.5µ Wt: 0.0235 gms.5 115.0 0.180 16.99 115.0 74 74 0.180 0.492 <2.5µ Wt: 0.0019 gms.4 114.0 0.170 19.04 117.0 74 74 0.120 0.492 Final Reading >10µ: 0.0120 gr/dscf3 115.0 0.240 20.71 116.0 75 75 0.250 0.492 11.641 >10µ: 1.5225 lb/hr2 115.0 0.420 23.12 116.0 75 75 0.430 0.492 <10-2.5µ: 0.0315 gr/dscf1 113.0 0.470 26.28 116.0 75 75 0.460 0.492 Total Volume <10-2.5µ: 3.9959 lb/hr
114.8 0.288 29.56 115.7 74.2 0.270 0.492 11.641 <2.5µ: 0.0026 gr/dscf<2.5µ: 0.3255 lb/hr
EPA 201A: POST - TEST DATA & CALCULATIONSVlc: 0.0 grams Points Outside Dpmin or Dpmax: 2 Number of Points
MF - Moisture Fraction: 0.9740 fraction Reynolds No. for Run: 2952.05 dimentionlessDry Gas Meter Volume: 11.513 Vms, ft3 Nozzel Area: 2.52E-04 (AsNd) sqft
Corrected Water Volume: - Vws Nozzle Velocity: 28.86 (Nu) ft/secBws, Moisture Content: 0.0260 fraction Cyclone Inlet Velocity: 2837 (Vs) ft/min
Stack Gas Dry Molecular Weight: 28.838 Md PM-10 Sampler Flow Rate: 0.437 (scfm) PMQsStack Gas Wet Molecular Wt: 28.556 Mw Stack Flow Rate: 14,776.8 (Qs) Dscfm
Stack Gas Viscosity: 189.40 µs PM-10-Ds50: 10.67 micronsSample Flow Rate: 0.390 QsSt PM-2.5 Ds50 2.31 microns
Run - Cunn. Slip Corr. 1.07 dimensionless Iso Sampling Rate: 95.86 percentTotal - PM - Cs: 0.0461 gr/dscf PM < 10-2.5µ: 0.1009 lbs/baleTotal - PM - ER: 5.8440 lbs/hr PM < 2.5µ: 0.0082 lbs/bale
Stack Gas Velocity: 30.11 (Vs) ft/sec Total - PM: 0.1476 lbs/bale
PRE - TEST DATA & CALCULATIONS
10:56
11:29
REM PM-10, 2.5 - 2008
Page 64 of 105

Cotton Gin Test Data
Plant: E Date: 9/20/2010Location: Start Time: 9:35
Unit: #9 2 Pull 1D3D End Time: 10:07Run: 1
Elapsed Time: 32 Test Time: 30.68Bale Time: 33.58 StdDev Std BPH: 5.19
Ave min/bale: 0:01:46 Ave Std BPH: 34.1
Bale No. Bale Wt. Time time/baleStd 500 lb
BPHChauvenet's
Criterion1797204 9:34:14 --- --- ---1797205 504 9:35:41 0:01:27 41.71797206 477 9:37:10 0:01:29 38.61797207 508 9:38:48 0:01:38 37.31797208 508 9:40:28 0:01:40 36.61797209 511 9:42:06 0:01:38 37.51797210 506 9:43:45 0:01:39 36.81797211 508 9:47:18 0:03:33 17.2 *1797212 510 9:49:23 0:02:05 29.41797213 503 9:51:05 0:01:42 35.51797214 479 9:52:43 0:01:38 35.21797215 518 9:54:29 0:01:46 35.21797216 483 9:56:06 0:01:37 35.91797217 519 9:58:04 0:01:58 31.71797218 480 9:59:31 0:01:27 39.71797219 521 10:01:16 0:01:45 35.71797220 507 10:02:52 0:01:36 38.01797221 516 10:04:32 0:01:40 37.21797222 473 10:06:00 0:01:28 38.71797223 517 10:07:49 0:01:49 34.2
REM - 2003
Page 65 of 105

Cotton Gin Test Data
Plant: E Date: 9/20/2010Location: Start Time: 10:14
Unit: #9 2 Pull 1D3D End Time: 10:47Run: 2
Elapsed Time: 33 Test Time: 30.66Bale Time: 34.77 StdDev Std BPH: 2.44
Ave min/bale: 0:01:35 Ave Std BPH: 39.0
Bale No. Bale Wt. Time time/baleStd 500 lb
BPHChauvenet's
Criterion1797226 10:13:36 --- --- ---1797227 489 10:15:05 0:01:29 39.61797228 500 10:16:37 0:01:32 39.11797229 498 10:18:08 0:01:31 39.41797230 515 10:20:00 0:01:52 33.1 *1797231 484 10:21:30 0:01:30 38.71797232 531 10:23:08 0:01:38 39.01797233 536 10:24:48 0:01:40 38.61797234 504 10:26:14 0:01:26 42.21797235 481 10:27:43 0:01:29 38.91797236 494 10:29:16 0:01:33 38.21797237 539 10:30:53 0:01:37 40.01797238 495 10:32:23 0:01:30 39.61797239 500 10:33:53 0:01:30 40.01797240 539 10:35:32 0:01:39 39.21797241 497 10:37:02 0:01:30 39.81797242 499 10:38:31 0:01:29 40.41797243 536 10:40:23 0:01:52 34.51797244 543 10:41:57 0:01:34 41.61797245 533 10:43:22 0:01:25 45.1 *1797246 521 10:44:58 0:01:36 39.11797247 525 10:46:35 0:01:37 39.01797248 534 10:48:22 0:01:47 35.9
REM - 2003
Page 66 of 105

Cotton Gin Test Data
Plant: E Date: 9/20/2010Location: Start Time: 10:56
Unit: #9 2 Pull 1D3D End Time: 11:29Run: 3
Elapsed Time: 33 Test Time: 29.56Bale Time: 33.97 StdDev Std BPH: 7.75
Ave min/bale: 0:01:33 Ave Std BPH: 39.6
Bale No. Bale Wt. Time time/baleStd 500 lb
BPHChauvenet's
Criterion1797253 10:55:56 --- --- ---1797254 500 10:57:53 0:01:57 30.81797255 516 10:59:11 0:01:18 47.61797256 512 11:00:53 0:01:42 36.11797257 527 11:02:32 0:01:39 38.31797258 510 11:04:49 0:02:17 26.81797259 497 11:05:40 0:00:51 70.2 *1797260 523 11:07:19 0:01:39 38.01797261 531 11:08:54 0:01:35 40.21797262 541 11:10:32 0:01:38 39.71797263 535 11:12:06 0:01:34 41.01797264 495 11:13:40 0:01:34 37.91797265 504 11:15:05 0:01:25 42.71797266 509 11:16:37 0:01:32 39.81797267 465 11:17:56 0:01:19 42.41797268 504 11:19:28 0:01:32 39.41797269 505 11:20:59 0:01:31 40.01797270 515 11:22:29 0:01:30 41.21797271 503 11:23:56 0:01:27 41.61797272 495 11:25:26 0:01:30 39.61797273 510 11:26:57 0:01:31 40.41797274 507 11:28:26 0:01:29 41.01797275 502 11:29:54 0:01:28 41.1
REM - 2003
Page 67 of 105

PARTICULATE WEIGHTS : DATA & CALCULATIONS RUN #1
Client : E Date : 9/20/10 >10 Catch ID:Site : Lab#: 810-087 <10 Catch ID:Unit : #9 2 Pull 1D3D Filter ID: 8L-3450 <2.5 Catch ID:
Acetone: TL-0156 75 gGross: 681.180 mg Tare: 681.037 mg Residue: 0.1427 mg
>10 µ Rinse: TS-1055Acetone: 25.5 g * 0.00190 mg/g -0.04841 mg
Gross: 726.487 mg Tare: 716.989 mg 9.4980 mg >10 µ Total Weight = 9.4496 mg
< 10 µ Rinse: TS-1056Acetone: 26.1 g * 0.00190 mg/g -0.04955 mg
Gross: 688.190 mg Tare: 664.939 mg 23.2513 mg< 10 µ Total Weight = 23.2018 mg
< 2.5 µ Filter: 8L-3450Gross: 287.610 mg Tare: 285.875 mg < 2.5 filter Net: 1.7353 mg
< 2.5 µ Rinse: TS-1057Acetone: 8.3 g * 0.00190 mg/g -0.01581 mg
Gross: 666.322 mg Tare: 665.474 mg 0.8483 mg< 2.5 µ Rinse Total Weight = 0.8325 mg
> 10 µ Total Weight = 0.0094 g< 10 µ Total Weight = 0.0258 g
< 10-2.5 µTotal Weight = 0.0232 g< 2.5 µ Total Weight = 0.0026 g
Total Weight = 0.0352 g
WEIGHTS & VOLUMES
REM PM-10, 2.5 - 2001
TS-1055TS-1056TS-1057
SOLUTION BLANKS
Page 68 of 105

PARTICULATE WEIGHTS : DATA & CALCULATIONS RUN #2
Client : E Date : 9/20/10 >10 Catch ID:Site : Lab#: 810-087 <10 Catch ID:Unit : #9 2 Pull 1D3D Filter ID: 8L-3451 <2.5 Catch ID:
Acetone: TL-0156 75 gGross: 681.180 mg Tare: 681.037 mg Residue: 0.1427 mg
>10 µ Rinse: TS-1060Acetone: 28.9 g * 0.00190 mg/g -0.05494 mg
Gross: 708.686 mg Tare: 698.036 mg 10.6497 mg >10 µ Total Weight = 10.5947 mg
< 10 µ Rinse: TS-1061Acetone: 27.1 g * 0.00190 mg/g -0.05155 mg
Gross: 784.843 mg Tare: 761.984 mg 22.8590 mg< 10 µ Total Weight = 22.8074 mg
< 2.5 µ Filter: 8L-3451Gross: 280.710 mg Tare: 279.303 mg < 2.5 filter Net: 1.4070 mg
< 2.5 µ Rinse: TS-1062Acetone: 6.4 g * 0.00190 mg/g -0.01212 mg
Gross: 722.908 mg Tare: 722.465 mg 0.4430 mg< 2.5 µ Rinse Total Weight = 0.4309 mg
> 10 µ Total Weight = 0.0106 g< 10 µ Total Weight = 0.0246 g
< 10-2.5 µTotal Weight = 0.0228 g< 2.5 µ Total Weight = 0.0018 g
Total Weight = 0.0352 g
WEIGHTS & VOLUMES
REM PM-10, 2.5 - 2001
TS-1060TS-1061TS-1062
SOLUTION BLANKS
Page 69 of 105

PARTICULATE WEIGHTS : DATA & CALCULATIONS RUN #3
Client : E Date : 9/20/10 >10 Catch ID:Site : Lab#: 810-087 <10 Catch ID:Unit : #9 2 Pull 1D3D Filter ID: 8L-3452 <2.5 Catch ID:
Acetone: TL-0156 75 gGross: 681.180 mg Tare: 681.037 mg Residue: 0.1427 mg
>10 µ Rinse: TS-1064Acetone: 28.3 g * 0.00190 mg/g -0.05389 mg
Gross: 665.465 mg Tare: 656.443 mg 9.0217 mg >10 µ Total Weight = 8.9678 mg
< 10 µ Rinse: TS-1065Acetone: 28.7 g * 0.00190 mg/g -0.05456 mg
Gross: 733.971 mg Tare: 710.380 mg 23.5907 mg< 10 µ Total Weight = 23.5361 mg
< 2.5 µ Filter: 8L-3452Gross: 296.501 mg Tare: 295.009 mg < 2.5 filter Net: 1.4920 mg
< 2.5 µ Rinse: TS-1066Acetone: 9.4 g * 0.00190 mg/g -0.01784 mg
Gross: 737.272 mg Tare: 736.829 mg 0.4433 mg< 2.5 µ Rinse Total Weight = 0.4255 mg
> 10 µ Total Weight = 0.0090 g< 10 µ Total Weight = 0.0255 g
< 10-2.5 µTotal Weight = 0.0235 g< 2.5 µ Total Weight = 0.0019 g
Total Weight = 0.0344 g
WEIGHTS & VOLUMES
REM PM-10, 2.5 - 2001
TS-1064TS-1065TS-1066
SOLUTION BLANKS
Page 70 of 105

Acetone Rinse
Client : Date :Location: Job # : 810-087
Unit : #9 2 Pull 1D3D
PM-2.5 Date:Run 1 Run 2 Run 3
Filter ID#: 8L-3450 Filter ID#: 8L-3451 Filter ID#: 8L-3452
>10 Start Vol: 220.4 g >10 Start Vol: 352.7 g >10 Start Vol: 287.1 gEnd Vol: 195.0 g End Vol: 323.8 g End Vol: 258.7 g
Total: 25.5 g Total: 28.9 g Total: 28.3 gTub #: TS-1055 Tub #: TS-1060 Tub #: TS-1064
<10 Start Vol: 195.0 g <10 Start Vol: 323.8 g <10 Start Vol: 258.7 gEnd Vol: 168.9 g End Vol: 296.7 g End Vol: 230.0 g
Total: 26.1 g Total: 27.1 g Total: 28.7 gTub #: TS-1056 Tub #: TS-1061 Tub #: TS-1065
<2.5 Start Vol: 168.9 g <2.5 Start Vol: 296.7 g <2.5 Start Vol: 230.0 gEnd Vol: 160.6 g End Vol: 290.3 g End Vol: 220.7 g
Total: 8.3 g Total: 6.4 g Total: 9.4 gTub #: TS-1057 Tub #: TS-1062 Tub #: TS-1066
E 9/20/2010
9/20/10
Page 71 of 105

Filter/Tub Weights
Client : Date :Location: Job # : 810-087
Unit : #9 2 Pull 1D3D
Filter/Tub No.
Pre-Weight
(mg)
Post-Weight
(mg)
Net-Weight
(mg)Acetone Acetone Blank (9/16/10) 75 g TL-0156 681.037 681.180 0.143DI DI Water Blank (9/20/10) 100 g TL-0163 707.924 708.138 0.214Filter Blank 6L-0119 249.026 249.047 0.021
No. Cyclone Name Method Run No.Sample
LocationFilter/Tub
No.
Pre-Weight
(mg)
Post-Weight
(mg)
Net-Weight
(mg)9 #2 Pull 27 1 Filter < 2.5 8L-3450 285.875 287.610 1.7359 #2 Pull 27 1 > 10 TS-1055 716.989 726.487 9.4989 #2 Pull 27 1 < 10 TS-1056 664.939 688.190 23.2519 #2 Pull 27 1 < 2.5 TS-1057 665.474 666.322 0.8489 #2 Pull 27 2 Filter < 2.5 8L-3451 279.303 280.710 1.4079 #2 Pull 27 2 < 2.5 TS-1062 722.465 722.908 0.4439 #2 Pull 27 2 < 10 TS-1061 761.984 784.843 22.8599 #2 Pull 27 2 > 10 TS-1060 698.036 708.686 10.6509 #2 Pull 27 3 Filter < 2.5 8L-3452 295.009 296.501 1.4929 #2 Pull 27 3 > 10 TS-1064 656.443 665.465 9.0229 #2 Pull 27 3 < 10 TS-1065 710.380 733.971 23.5919 #2 Pull 27 3 < 2.5 TS-1066 736.829 737.272 0.443
E 9/20/2010
Page 72 of 105

Gin F Field and Laboratory Data
Page 73 of 105

F#2 2B Pull 1D3D2010
Emission Factor (lbs/bale) Emission Rate (lbs/hr)Based on EPA Method OTM27 Based on EPA Method OTM27
Total PM Total PMX Run 1 0.0876 Run 1 4.1555X Run 2 0.1084 Run 2 4.8984X Run 3 0.1161 Run 3 3.6133Average Average
PM10 PM10
Y Run 1 0.0605 Run 1 2.8719Run 2 0.0639 Run 2 2.8883Run 3 0.0702 Run 3 2.1846
Average 0.0670 Average 2.5365PM2.5 PM2.5
Z Run 1 0.0066 Run 1 0.3125Run 2 0.0074 Run 2 0.3324Run 3 0.0083 Run 3 0.2594
Average 0.0078 Average 0.2959PM10-2.5 PM10-2.5
Run 1 0.0539 Run 1 2.5594Run 2 0.0565 Run 2 2.5560Run 3 0.0619 Run 3 1.9252
Average 0.0592 Average 2.2406PM2.5/PM10
Run 1 10.9%Run 2 11.5%Run 3 11.9%
Average 11.7%PM2.5/TSP
Run 1 7.5%Run 2 6.8%Run 3 7.2%
AveragePM10/TSP
Run 1 69.1%Run 2 59.0%Run 3 60.5%
Average
X: Run omitted from all dependent averages - Total PM ISO not metY: Run omitted from all dependent averages - PM 10 ISO or D50 not metZ: Run omitted from all dependent averages - PM 2.5 ISO or D50 not met
Gin:Exhaust:
Date:
Page 74 of 105

#2 2B Pull 1D3D Run #1 Run #2 Run #3
ø - Start of Run, time 13:05 13:43 15:09
ø - End of Run, time 13:30 14:49 15:45
Vlc - Volume of water collected, ml 0.0 0.0 0.0
Vm - Gas volume, meter cond., dcf 7.881 7.771 8.487
Y - Meter calibration factor 1.004 1.004 1.004
Pbar - Barometric pressure, in. Hg 27.96 27.96 27.96
Pg - Stack static pressure, in. H2O 0.12 0.12 0.12
ˆH - Avg. meter press. diff., in. H2O 0.467 0.469 0.475
Tm - Absolute meter temperature, °R 534.5 536.3 537.1
Vm(std) - Standard sample gas vol., dscf 7.3132 7.1866 7.8379
Bws - Water vapor part in gas stream 0.028 0.028 0.028
CO2 - Dry concentration, volume % 0.00 0.00 0.00
O2 - Dry concentration, volume % 0.0 0.0 0.0
Md - Mole wt. stack gas, dry, g/mole 28.838 28.838 28.838
Ms - Mole wt. stack gas, wet, g/gmole 28.534 28.534 28.534
Cp - Pitot tube coef., dimensionless 0.840 0.840 0.840
ˆp - Avg. of sq. roots of eachˆp 0.475 0.490 0.505
Ts - Absolute stack Temp. °R 607.3 605.4 602.9
A - Area of stack, square feet 4.59 4.59 4.59
Vs - Stack Gas Flow, ft/sec 29.78 30.65 31.51
Qstd - Volumetric flow rate, dscfm 6,474 6,685 6,900
An - Area of nozzle, square feet 2.182E-04 2.182E-04 2.182E-04
ø - Sampling time, minutes 19.60 20.22 21.01
DP50 - Cut size, microns 10.64 11.01 10.64
I - Isokinetic variation, percent 121.2 111.8 113.7
Sts - Stacks per system 4 4 4
OTM METHOD 27 FIELD DATA SUMMARYF
REM PM-10, 2.5 - 2008
Page 75 of 105

#2 2B Pull 1D3D Run #1 Run #2 Run #3 AVERAGE
Qstd - Volumetric flow rate, dscfm 6,474 6,685 6,900 6,686
Vm(std) - Standard sample gas vol., dscf 7.3132 7.1866 7.8379 7.4459
DP50 - Cut size, microns 10µ 10.64 11.01 10.64 10.77
DP50 - Cut size, microns 2.5µ 2.39 2.53 2.38 2.44
Bale/hr - Total 500 lb Bales per hr 47.4 45.2 31.1 41.3
>10 µ - Total PM g 0.0027 0.0041 0.0031 0.0033
>10 µ - Total PM gr/dscfm 0.0058 0.0088 0.0060 0.0069
>10 µ - Total PM lb/hr 0.321 0.503 0.357 0.3935
>10 µ - Total PM lb/bale 0.0068 0.0111 0.0115 0.0098
10 µ -2.5 µ - PM-10 - 2.5 g 0.0055 0.0052 0.0041 0.0049
10 µ -2.5 µ - PM-10 gr/dscf 0.0115 0.0112 0.0081 0.0103
10 µ -2.5 µ - PM-10 lb/hr 0.640 0.639 0.481 0.587
10 µ -2.5 µ - PM-10 lb/bale 0.0135 0.0141 0.0155 0.0144
< 2.5 µ - PM-2.5 g 0.0007 0.0007 0.0006 0.0006
< 2.5 µ - PM-2.5 gr/dscf 0.0014 0.0015 0.0011 0.00132
< 2.5 µ - PM-2.5 lb/hr 0.078 0.083 0.065 0.075
< 2.5 µ - PM-2.5 lb/bale 0.0016 0.0018 0.0021 0.0019
TPM - Total PM g 0.0089 0.0100 0.0078 0.0089
TPM - Total PM gr/dscf 0.0187 0.0214 0.0153 0.0185
TPM - Total PM lb/hr 1.039 1.225 0.903 1.06
TPM - Total PM lb/bale 0.0219 0.0271 0.0290 0.0260
OTM METHOD 27 FIELD DATA SUMMARYF
REM PM-10, 2.5 - 2008
Page 76 of 105

Run #1 Run #2 Run #3 AverageTotal Particulate Per Cyclone
Total gr/dscf 0.0187 0.0214 0.0153 0.0185Total lb/hr 1.04 1.22 0.90 1.06Total lb/bale 0.0219 0.0271 0.0290 0.0260
Total Particulate Per SystemTotal lb/hr 4.16 4.90 3.61 4.22Total lb/bale 0.088 0.108 0.116 0.104
< 10 µ Results per Cyclone- 10 µ gr/dscf 0.0129 0.0126 0.0092 0.0116- 10 µ (lb/hr) 0.72 0.72 0.55 0.66- 10 µ (lb/Bale) 0.0151 0.0160 0.0175 0.0162
< 10 µ Results per System- 10 µ (lb/hr) 2.87 2.89 2.18 2.65- 10 µ (lb/Bale) 0.061 0.064 0.070 0.065
< 2.5 µ Results per Cyclone- 2.5 µ gr/dscf 0.0014 0.0015 0.0011 0.0013- 2.5 µ (lb/hr) 0.08 0.08 0.06 0.08- 2.5 µ (lb/Bale) 0.0016 0.0018 0.0021 0.0019
< 2.5 µ Results per System- 2.5 µ (lb/hr) 0.31 0.33 0.26 0.30- 2.5 µ (lb/Bale) 0.007 0.007 0.008 0.007
Average Bales/hr 47.45 45.20 31.12 41.26
Cyclone Flow-RatesVs 29.78 30.65 31.51 30.65Acfm 8,196 8,436 8,671 8,434Dscfm 6,474 6,685 6,900 6,686
Cyclone Inlet VelocityVsfm 2807 2889 2969 2888
System Flow-RatesAcfm - - - 33,738Dscfm - - - 26,745
Number of Cyclones in System 4REM PM-10, 2.5 - 2001
F#2 2B Pull 1D3D
OTM METHOD 27 RESULTS
Page 77 of 105

Plant: F Unit: #2 2B Pull 1D3D Date: 10/19/2010 Lab#: 810-097
Location: Cyclones in System: 4 Std Temp (Tstd): 68 °FCyclone Dia (in.): 58.00 Bales/hr: 47.45 Std Pressure: 29.92 in Hg
Pbar: 27.96 in Hg Static Sp: 0.12 in water dcO2: 20.90 %Run-Time, Ø: 20 min Pitot Factor: 0.84 Cp dcCO2: 0.01 %Meter Factor: 1.004 Y % H2O: 0.020 Bws* 2.0% dcN2: 79.09 %Meter Factor: 1.724 ¯H@ Meter Temp: 72.0 °F Stack Dia: 29.00 Sd in
Pre-test Leak Check: 0.004 cfm Pitot Leak Check: OK Post-test Leak Check: 0.011 cfm**EPA 201A - 10u & 2.5u: PRE - TEST CALCULATIONS
Delta P1 - Run: 0.250 pµs: 196.97 Ideal Nd: 0.218 Point 1 Ø: 1.72pMd: 28.84 pQs: 0.47091 Input Nd: 0.200 Vn ft/sec: 35.98pMs: 28.62 ¯H + 50 °F: 0.398 Closest Nd: 0.215 Delta H: 0.467
Ps in Hg: 27.97 ¯p min + 50°F: 0.120 V ft/sec min: 22.50 Ø: 20.0pVs, ft/sec: 30.27 ¯p max + 50°F: 0.520 V ft/sec max: 46.82 Dwell Time Const. 3.44
Stack Area pSa: 4.59 ¯H - 50 °F: 0.555 ¯p min: 0.130 Meter Volume: 8.1Acfm: 8331 ¯p min - 50°F: 0.142 ¯p max: 0.563 dscfm 0.406
pTs Stack: 144.8 ¯p max - 50 °F: 0.613 Vn/Vs x 100: 118.85 EPA 201A: TEST DATA & CALCULATIONS
Pre-Test Data Test Run Data Impinger Weights, gramsPoint Stack Temp ¯P Elapsed Ts Tm °F Tm °F ¯P Delta H Meter Volume Final InitialNo. °F "H2O Time °F Inlet Outlet "H2O "H2O Cubic Feet6 140 0.250 0.00 145.0 75 75 0.250 0.467 Initial Reading 15 146 0.240 1.72 149.0 74 74 0.230 0.467 0.000 24 147 0.210 3.37 151.0 74 74 0.290 0.467 Run Start Time 33 147 0.220 5.22 150.0 74 74 0.190 0.467 4 Total: 0.02 146 0.240 6.72 149.0 74 74 0.220 0.467 PM - Weights - Blank Corrected1 143 0.200 8.33 148.0 74 74 0.240 0.467 >10µ Wt: 0.0027 gms.6 143 0.280 10.01 147.0 75 75 0.210 0.467 Run End Time <10µ-2.5µ Wt: 0.0055 gms.5 141 0.270 11.59 147.0 75 75 0.200 0.467 <2.5µ Wt: 0.0007 gms.4 146 0.230 13.12 147.0 74 74 0.210 0.467 Final Reading >10µ: 0.0058 gr/dscf3 146 0.250 14.70 146.0 75 75 0.240 0.467 7.881 >10µ: 0.3209 lb/hr2 145 0.240 16.38 146.0 75 75 0.230 0.467 <10-2.5µ: 0.0115 gr/dscf1 147 0.200 18.03 143.0 75 75 0.210 0.467 Total Volume <10-2.5µ: 0.6398 lb/hr
144.8 0.236 19.60 147.3 74.5 0.227 0.467 7.881 <2.5µ: 0.0014 gr/dscf<2.5µ: 0.0781 lb/hr
EPA 201A: POST - TEST DATA & CALCULATIONSVlc: 0.0 grams Points Outside Dpmin or Dpmax: 0 Number of Points
MF - Moisture Fraction: 0.9720 fraction Reynolds No. for Run: 2721.60 dimentionlessDry Gas Meter Volume: 7.313 Vms, ft3 Nozzel Area: 2.18E-04 (AsNd) sqft
Corrected Water Volume: - Vws Nozzle Velocity: 36.08 (Nu) ft/secBws, Moisture Content: 0.0280 fraction Cyclone Inlet Velocity: 2807 (Vs) ft/min
Stack Gas Dry Molecular Weight: 28.838 Md PM-10 Sampler Flow Rate: 0.472 (scfm) PMQsStack Gas Wet Molecular Wt: 28.534 Mw Stack Flow Rate: 6,474.1 (Qs) Dscfm
Stack Gas Viscosity: 197.01 µs PM-10-Ds50: 10.64 micronsSample Flow Rate: 0.373 QsSt PM-2.5 Ds50 2.39 microns
Run - Cunn. Slip Corr. 1.08 dimensionless Iso Sampling Rate: 121.15 percentTotal - PM - Cs: 0.0187 gr/dscf PM < 10-2.5µ: 0.0135 lbs/baleTotal - PM - ER: 1.0389 lbs/hr PM < 2.5µ: 0.0016 lbs/bale
Stack Gas Velocity: 29.78 (Vs) ft/sec Total - PM: 0.0219 lbs/bale
REM PM-10, 2.5 - 2008
PRE - TEST DATA & CALCULATIONS
13:05
13:30
Page 78 of 105

Plant: F Unit: #2 2B Pull 1D3D Date: 10/19/2010 Lab#: 810-097Location: Cyclones in System: 4 Std Temp (Tstd): 68 °F
Cyclone Dia (in.): 58.00 Bales/hr: 45.20 Std Pressure: 29.92 in HgPbar: 27.96 in Hg Static Sp: 0.12 in water dcO2: 20.90 %
Run-Time, Ø: 20 min Pitot Factor: 0.84 Cp dcCO2: 0.01 %Meter Factor: 1.004 Y % H2O: 0.020 Bws* 2.0% dcN2: 79.09 %Meter Factor: 1.724 ¯H@ Meter Temp: 74.0 °F Stack Dia: 29.00 Sd in
Pre-test Leak Check: 0.002 cfm Pitot Leak Check: OK Post-test Leak Check: 0.008 cfm**EPA 201A - 10u & 2.5u: PRE - TEST CALCULATIONS
Delta P1 - Run: 0.260 pµs: 197.60 Ideal Nd: 0.221 Point 1 Ø: 1.75pMd: 28.84 pQs: 0.473254 Input Nd: 0.200 Vn ft/sec: 36.16pMs: 28.62 ¯H + 50 °F: 0.400 Closest Nd: 0.215 Delta H: 0.469
Ps in Hg: 27.97 ¯p min + 50°F: 0.121 V ft/sec min: 22.63 Ø: 20.0pVs, ft/sec: 29.73 ¯p max + 50°F: 0.523 V ft/sec max: 47.04 Dwell Time Const. 3.44
Stack Area pSa: 4.59 ¯H - 50 °F: 0.557 ¯p min: 0.131 Meter Volume: 8.1Acfm: 8183 ¯p min - 50°F: 0.143 ¯p max: 0.566 dscfm 0.407
pTs Stack: 147.3 ¯p max - 50 °F: 0.617 Vn/Vs x 100: 121.60 EPA 201A: TEST DATA & CALCULATIONS
Pre-Test Data Test Run Data Impinger Weights, gramsPoint Stack Temp ¯P Elapsed Ts Tm °F Tm °F ¯P Delta H Meter Volume Final InitialNo. °F "H2O Time °F Inlet Outlet "H2O "H2O Cubic Feet6 145.0 0.250 0.00 143.0 76 76 0.260 0.469 Initial Reading 15 149.0 0.230 1.75 146.0 76 76 0.230 0.469 0.000 24 151.0 0.290 3.40 145.0 76 76 0.280 0.469 Run Start Time 33 150.0 0.190 5.22 145.0 76 76 0.220 0.469 Total: 0.02 149.0 0.220 6.83 146.0 76 76 0.250 0.469 14:28 TO END PM - Weights - Blank Corrected1 148.0 0.240 8.55 144.0 76 76 0.290 0.469 Strip Cotton >10µ Wt: 0.0041 gms.6 147.0 0.210 10.40 144.0 77 77 0.230 0.469 Run End Time <10µ-2.5µ Wt: 0.0052 gms.5 147.0 0.200 12.05 147.0 77 77 0.200 0.469 <2.5µ Wt: 0.0007 gms.4 147.0 0.210 13.59 147.0 76 76 0.220 0.469 Final Reading >10µ: 0.0088 gr/dscf3 146.0 0.240 15.20 147.0 76 76 0.240 0.469 7.771 >10µ: 0.5025 lb/hr2 146.0 0.230 16.89 146.0 77 77 0.250 0.469 <10-2.5µ: 0.0112 gr/dscf1 143.0 0.210 18.61 145.0 77 77 0.220 0.469 Total Volume <10-2.5µ: 0.6390 lb/hr
147.3 0.227 20.22 145.4 76.3 0.241 0.469 7.771 <2.5µ: 0.0015 gr/dscf<2.5µ: 0.0831 lb/hr
EPA 201A: POST - TEST DATA & CALCULATIONSVlc: 0.0 grams Points Outside Dpmin or Dpmax: 0 Number of Points
MF - Moisture Fraction: 0.9720 fraction Reynolds No. for Run: 2599.31 dimentionlessDry Gas Meter Volume: 7.187 Vms, ft3 Nozzel Area: 2.18E-04 (AsNd) sqft
Corrected Water Volume: - Vws Nozzle Velocity: 34.27 (Nu) ft/secBws, Moisture Content: 0.0280 fraction Cyclone Inlet Velocity: 2889 (Vs) ft/min
Stack Gas Dry Molecular Weight: 28.838 Md PM-10 Sampler Flow Rate: 0.449 (scfm) PMQsStack Gas Wet Molecular Wt: 28.534 Mw Stack Flow Rate: 6,685.0 (Qs) Dscfm
Stack Gas Viscosity: 196.54 µs PM-10-Ds50: 11.01 micronsSample Flow Rate: 0.355 QsSt PM-2.5 Ds50 2.53 microns
Run - Cunn. Slip Corr. 1.07 dimensionless Iso Sampling Rate: 111.79 percentTotal - PM - Cs: 0.0214 gr/dscf PM < 10-2.5µ: 0.0141 lbs/baleTotal - PM - ER: 1.2246 lbs/hr PM < 2.5µ: 0.0018 lbs/bale
Stack Gas Velocity: 30.65 (Vs) ft/sec Total - PM: 0.0271 lbs/bale
REM PM-10, 2.5 - 2008
14:49
13:43
PRE - TEST DATA & CALCULATIONS
Page 79 of 105

Plant: F Unit: #2 2B Pull 1D3D Date: 10/19/2010 Lab#: 810-097Location: Cyclones in System: 4 Std Temp (Tstd): 68 °F
Cyclone Dia (in.): 58.00 Bales/hr: 31.12 Std Pressure: 29.92 in HgPbar: 27.96 in Hg Static Sp: 0.12 in water dcO2: 20.90 %
Run-Time, Ø: 20 min Pitot Factor: 0.84 Cp dcCO2: 0.01 %Meter Factor: 1.004 Y % H2O: 0.020 Bws* 2.0% dcN2: 79.09 %Meter Factor: 1.724 ¯H@ Meter Temp: 81.3 °F Stack Dia: 29.00 Sd in
Pre-test Leak Check: 0.002 cfm Pitot Leak Check: OK Post-test Leak Check: 0.000 cfm**EPA 201A - 10u & 2.5u: PRE - TEST CALCULATIONS
Delta P1 - Run: 0.250 pµs: 197.13 Ideal Nd: 0.217 Point 1 Ø: 1.73pMd: 28.84 pQs: 0.471511 Input Nd: 0.200 Vn ft/sec: 36.02pMs: 28.62 ¯H + 50 °F: 0.405 Closest Nd: 0.215 Delta H: 0.475
Ps in Hg: 27.97 ¯p min + 50°F: 0.120 V ft/sec min: 22.53 Ø: 20.0pVs, ft/sec: 30.61 ¯p max + 50°F: 0.521 V ft/sec max: 46.88 Dwell Time Const. 3.47
Stack Area pSa: 4.59 ¯H - 50 °F: 0.564 ¯p min: 0.130 Meter Volume: 8.3Acfm: 8423 ¯p min - 50°F: 0.142 ¯p max: 0.564 dscfm 0.413
pTs Stack: 145.4 ¯p max - 50 °F: 0.614 Vn/Vs x 100: 117.70 EPA 201A: TEST DATA & CALCULATIONS
Pre-Test Data Test Run Data Impinger Weights, gramsPoint Stack Temp ¯P Elapsed Ts Tm °F Tm °F ¯P Delta H Meter Volume Final InitialNo. °F "H2O Time °F Inlet Outlet "H2O "H2O Cubic Feet6 143.0 0.260 0.00 132.0 77 77 0.250 0.475 Initial Reading 15 146.0 0.230 1.73 149.0 77 78 0.230 0.475 0.000 24 145.0 0.280 3.40 148.0 77 77 0.280 0.475 Run Start Time 33 145.0 0.220 5.23 149.0 78 77 0.220 0.475 4 Total: 0.02 146.0 0.250 6.86 148.0 77 77 0.260 0.475 PM - Weights - Blank Corrected1 144.0 0.290 8.63 147.0 77 77 0.280 0.475 >10µ Wt: 0.0031 gms.6 144.0 0.230 10.46 136.0 77 77 0.210 0.475 Run End Time <10µ-2.5µ Wt: 0.0041 gms.5 147.0 0.200 12.05 139.0 77 77 0.210 0.475 <2.5µ Wt: 0.0006 gms.4 147.0 0.220 13.64 140.0 77 77 0.250 0.475 Final Reading >10µ: 0.0060 gr/dscf3 147.0 0.240 15.38 142.0 77 77 0.280 0.475 8.487 >10µ: 0.3572 lb/hr2 146.0 0.250 17.21 146.0 77 77 0.320 0.475 <10-2.5µ: 0.0081 gr/dscf1 145.0 0.220 19.17 139.0 77 77 0.280 0.475 Total Volume <10-2.5µ: 0.4813 lb/hr
145.4 0.241 21.01 142.9 77.1 0.256 0.475 8.487 <2.5µ: 0.0011 gr/dscf<2.5µ: 0.0648 lb/hr
EPA 201A: POST - TEST DATA & CALCULATIONSVlc: 0.0 grams Points Outside Dpmin or Dpmax: 0 Number of Points
MF - Moisture Fraction: 0.9720 fraction Reynolds No. for Run: 2736.97 dimentionlessDry Gas Meter Volume: 7.838 Vms, ft3 Nozzel Area: 2.18E-04 (AsNd) sqft
Corrected Water Volume: - Vws Nozzle Velocity: 35.82 (Nu) ft/secBws, Moisture Content: 0.0280 fraction Cyclone Inlet Velocity: 2969 (Vs) ft/min
Stack Gas Dry Molecular Weight: 28.838 Md PM-10 Sampler Flow Rate: 0.469 (scfm) PMQsStack Gas Wet Molecular Wt: 28.534 Mw Stack Flow Rate: 6,899.8 (Qs) Dscfm
Stack Gas Viscosity: 195.92 µs PM-10-Ds50: 10.64 micronsSample Flow Rate: 0.373 QsSt PM-2.5 Ds50 2.38 microns
Run - Cunn. Slip Corr. 1.08 dimensionless Iso Sampling Rate: 113.69 percentTotal - PM - Cs: 0.0153 gr/dscf PM < 10-2.5µ: 0.0155 lbs/baleTotal - PM - ER: 0.9033 lbs/hr PM < 2.5µ: 0.0021 lbs/bale
Stack Gas Velocity: 31.51 (Vs) ft/sec Total - PM: 0.0290 lbs/bale
PRE - TEST DATA & CALCULATIONS
15:09
15:45
REM PM-10, 2.5 - 2008
Page 80 of 105
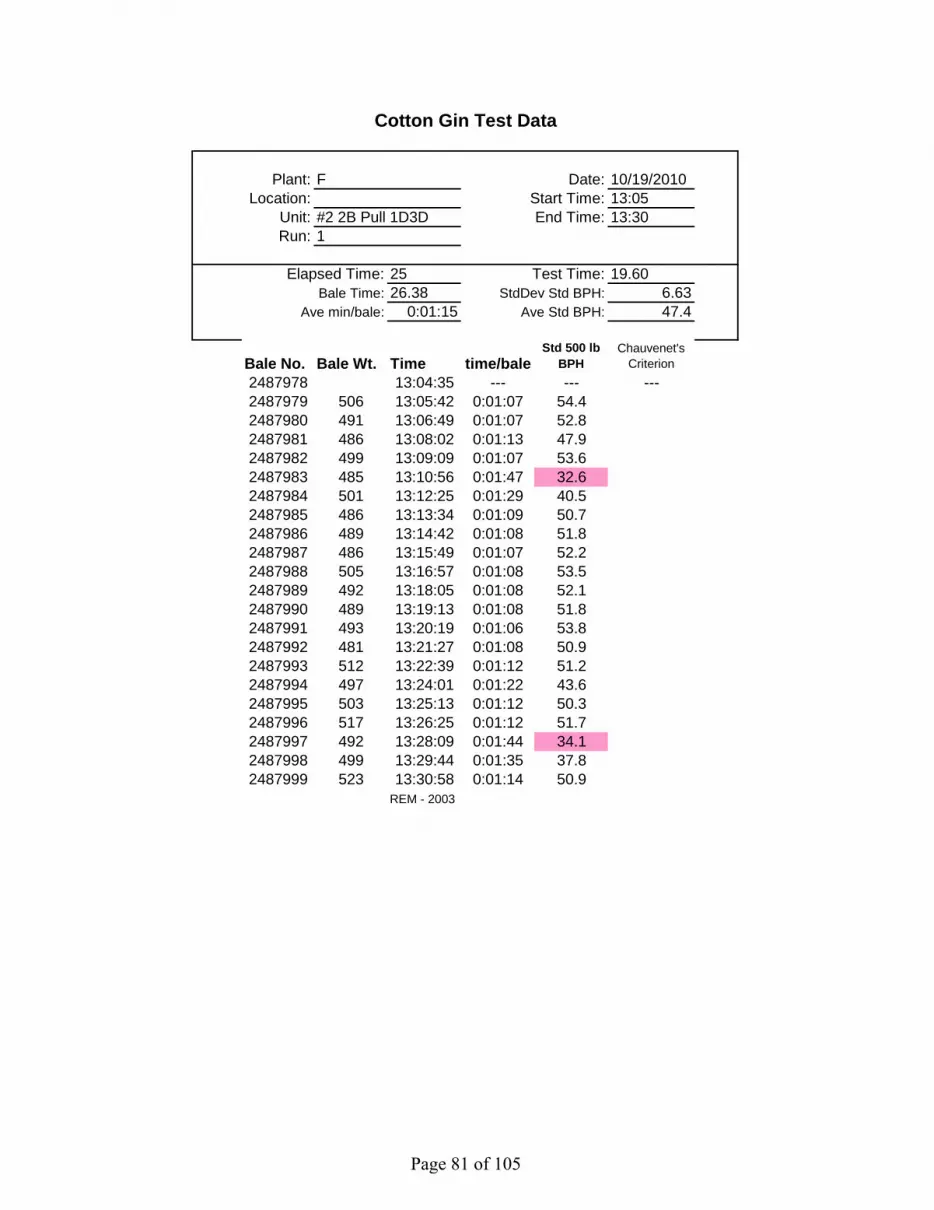
Cotton Gin Test Data
Plant: F Date: 10/19/2010Location: Start Time: 13:05
Unit: #2 2B Pull 1D3D End Time: 13:30Run: 1
Elapsed Time: 25 Test Time: 19.60Bale Time: 26.38 StdDev Std BPH: 6.63
Ave min/bale: 0:01:15 Ave Std BPH: 47.4
Bale No. Bale Wt. Time time/baleStd 500 lb
BPHChauvenet's
Criterion2487978 13:04:35 --- --- ---2487979 506 13:05:42 0:01:07 54.42487980 491 13:06:49 0:01:07 52.82487981 486 13:08:02 0:01:13 47.92487982 499 13:09:09 0:01:07 53.62487983 485 13:10:56 0:01:47 32.62487984 501 13:12:25 0:01:29 40.52487985 486 13:13:34 0:01:09 50.72487986 489 13:14:42 0:01:08 51.82487987 486 13:15:49 0:01:07 52.22487988 505 13:16:57 0:01:08 53.52487989 492 13:18:05 0:01:08 52.12487990 489 13:19:13 0:01:08 51.82487991 493 13:20:19 0:01:06 53.82487992 481 13:21:27 0:01:08 50.92487993 512 13:22:39 0:01:12 51.22487994 497 13:24:01 0:01:22 43.62487995 503 13:25:13 0:01:12 50.32487996 517 13:26:25 0:01:12 51.72487997 492 13:28:09 0:01:44 34.12487998 499 13:29:44 0:01:35 37.82487999 523 13:30:58 0:01:14 50.9
REM - 2003
Page 81 of 105

Cotton Gin Test Data
Plant: F Date: 10/19/2010Location: Start Time: 13:43
Unit: #2 2B Pull 1D3D End Time: 14:49Run: 2
Elapsed Time: 66 Test Time: 20.22Bale Time: 22.27 StdDev Std BPH: 8.63
Ave min/bale: 0:02:17 Ave Std BPH: 45.2
Bale No. Bale Wt. Time time/baleStd 500 lb
BPHChauvenet's
Criterion2488002 13:36:22 --- --- ---2488003 13:48:03 0:11:41 *2488004 13:51:14 0:03:11 *2488005 13:53:52 0:02:38 *2488006 13:56:25 0:02:33 *2488007 13:57:40 0:01:15 *2488008 14:13:14 0:15:34 *2488009 14:14:27 0:01:13 *2488010 14:15:37 0:01:10 *2488011 14:16:49 0:01:12 *2488012 14:19:05 0:02:16 *2488013 14:20:49 0:01:44 *2488014 14:22:51 0:02:02 *2488015 14:24:57 0:02:06 *2488016 14:26:09 0:01:12 *2488017 14:27:18 0:01:09 *2488018 485 14:28:32 0:01:14 47.22488019 508 14:29:36 0:01:04 57.12488020 505 14:30:46 0:01:10 51.92488021 491 14:31:51 0:01:05 54.42488022 496 14:32:53 0:01:02 57.62488023 486 14:34:02 0:01:09 50.72488024 493 14:35:25 0:01:23 42.82488025 501 14:36:41 0:01:16 47.52488026 491 14:37:54 0:01:13 48.42488027 491 14:39:21 0:01:27 40.62488028 498 14:41:13 0:01:52 32.02488029 482 14:43:11 0:01:58 29.42488030 477 14:44:39 0:01:28 39.02488031 493 14:45:50 0:01:11 50.02488032 491 14:47:02 0:01:12 49.12488033 496 14:48:33 0:01:31 39.22488034 503 14:49:34 0:01:01 59.4
REM - 2003
NOTE: Removed Bale Data = Lapse in Gin Operation
Page 82 of 105

Cotton Gin Test Data
Plant: F Date: 10/19/2010Location: Start Time: 15:09
Unit: #2 2B Pull 1D3D End Time: 15:45Run: 3
Elapsed Time: 36 Test Time: 21.01Bale Time: 26.58 StdDev Std BPH: 12.79
Ave min/bale: 0:02:29 Ave Std BPH: 31.1
Bale No. Bale Wt. Time time/baleStd 500 lb
BPHChauvenet's
Criterion2488048 15:08:02 --- --- ---2488049 513 15:09:13 0:01:11 52.02488050 488 15:10:20 0:01:07 52.42488051 491 15:11:42 0:01:22 43.12488052 496 15:13:03 0:01:21 44.12488053 481 15:14:20 0:01:17 45.02488054 481 15:15:37 0:01:17 45.02488055 514 15:17:10 0:01:33 39.82488056 490 15:18:27 0:01:17 45.82488057 524 15:19:45 0:01:18 48.42488058 485 15:21:45 0:02:00 29.12488059 508 15:23:48 0:02:03 29.72488060 15:28:50 0:05:02 *2488061 15:37:05 0:08:15 *2488062 472 15:38:57 0:01:52 30.32488063 500 15:40:02 0:01:05 55.42488064 452 15:47:54 0:07:52 6.9
REM - 2003
NOTE: Removed Bale Data = Lapse in Gin Operation
Page 83 of 105

PARTICULATE WEIGHTS : DATA & CALCULATIONS RUN #1
Client : F Date : 10/19/10 >10 Catch ID:Site : Lab#: 810-097 <10 Catch ID:Unit : #2 2B Pull 1D3D Filter ID: 8L-5725 <2.5 Catch ID:
Acetone: TL-0156 75 gGross: 681.180 mg Tare: 681.037 mg Residue: 0.1427 mg
>10 µ Rinse: TS-1192Acetone: 27.5 g * 0.00190 mg/g -0.05227 mg
Gross: 603.838 mg Tare: 601.046 mg 2.7927 mg >10 µ Total Weight = 2.7404 mg
< 10 µ Rinse: TS-1193Acetone: 24.3 g * 0.00190 mg/g -0.04620 mg
Gross: 699.299 mg Tare: 693.788 mg 5.5103 mg< 10 µ Total Weight = 5.4641 mg
< 2.5 µ Filter: 8L-5725Gross: 328.329 mg Tare: 327.916 mg < 2.5 filter Net: 0.4137 mg
< 2.5 µ Rinse: TS-1194Acetone: 6.6 g * 0.00190 mg/g -0.01248 mg
Gross: 730.528 mg Tare: 730.262 mg 0.2660 mg< 2.5 µ Rinse Total Weight = 0.2535 mg
> 10 µ Total Weight = 0.0027 g< 10 µ Total Weight = 0.0061 g
< 10-2.5 µTotal Weight = 0.0055 g< 2.5 µ Total Weight = 0.0007 g
Total Weight = 0.0089 g
WEIGHTS & VOLUMES
REM PM-10, 2.5 - 2001
TS-1192TS-1193TS-1194
SOLUTION BLANKS
Page 84 of 105

PARTICULATE WEIGHTS : DATA & CALCULATIONS RUN #2
Client : F Date : 10/19/10 >10 Catch ID:Site : Lab#: 810-097 <10 Catch ID:Unit : #2 2B Pull 1D3D Filter ID: 8L-5726 <2.5 Catch ID:
Acetone: TL-0156 75 gGross: 681.180 mg Tare: 681.037 mg Residue: 0.1427 mg
>10 µ Rinse: TS-1195Acetone: 29.3 g * 0.00190 mg/g -0.05572 mg
Gross: 659.032 mg Tare: 654.892 mg 4.1397 mg >10 µ Total Weight = 4.0840 mg
< 10 µ Rinse: TS-1196Acetone: 27.6 g * 0.00190 mg/g -0.05254 mg
Gross: 691.832 mg Tare: 686.587 mg 5.2457 mg< 10 µ Total Weight = 5.1931 mg
< 2.5 µ Filter: 8L-5726Gross: 347.559 mg Tare: 347.179 mg < 2.5 filter Net: 0.3803 mg
< 2.5 µ Rinse: TS-1197Acetone: 9.1 g * 0.00190 mg/g -0.01735 mg
Gross: 658.736 mg Tare: 658.423 mg 0.3123 mg< 2.5 µ Rinse Total Weight = 0.2950 mg
> 10 µ Total Weight = 0.0041 g< 10 µ Total Weight = 0.0059 g
< 10-2.5 µTotal Weight = 0.0052 g< 2.5 µ Total Weight = 0.0007 g
Total Weight = 0.0100 g
WEIGHTS & VOLUMES
REM PM-10, 2.5 - 2001
TS-1195TS-1196TS-1197
SOLUTION BLANKS
Page 85 of 105

PARTICULATE WEIGHTS : DATA & CALCULATIONS RUN #3
Client : F Date : 10/19/10 >10 Catch ID:Site : Lab#: 810-097 <10 Catch ID:Unit : #2 2B Pull 1D3D Filter ID: 8L-5727 <2.5 Catch ID:
Acetone: TL-0156 75 gGross: 681.180 mg Tare: 681.037 mg Residue: 0.1427 mg
>10 µ Rinse: TS-1198Acetone: 27.8 g * 0.00190 mg/g -0.05296 mg
Gross: 684.900 mg Tare: 681.779 mg 3.1203 mg >10 µ Total Weight = 3.0674 mg
< 10 µ Rinse: TS-1199Acetone: 30.9 g * 0.00190 mg/g -0.05876 mg
Gross: 650.487 mg Tare: 646.295 mg 4.1920 mg< 10 µ Total Weight = 4.1332 mg
< 2.5 µ Filter: 8L-5727Gross: 327.186 mg Tare: 326.832 mg < 2.5 filter Net: 0.3537 mg
< 2.5 µ Rinse: TS-1200Acetone: 9.3 g * 0.00190 mg/g -0.01779 mg
Gross: 688.482 mg Tare: 688.261 mg 0.2210 mg< 2.5 µ Rinse Total Weight = 0.2032 mg
> 10 µ Total Weight = 0.0031 g< 10 µ Total Weight = 0.0047 g
< 10-2.5 µTotal Weight = 0.0041 g< 2.5 µ Total Weight = 0.0006 g
Total Weight = 0.0078 g
WEIGHTS & VOLUMES
REM PM-10, 2.5 - 2001
TS-1198TS-1199TS-1200
SOLUTION BLANKS
Page 86 of 105

Acetone Rinse
Client : Date :Location: Job # : 810-097
Unit : #2 2B Pull 1D3D
PM-2.5Run 1 Run 2 Run 3
Filter ID#: 8L-5725 Filter ID#: 8L-5726 Filter ID#: 8L-5727
>10 Start Vol: 216.63 g >10 Start Vol: 377.27 g >10 Start Vol: 307.26 gEnd Vol: 189.15 g End Vol: 347.98 g End Vol: 279.42 g
Total: 27.48 g Total: 29.29 g Total: 27.84 gTub #: TS-1192 Tub #: TS-1195 Tub #: TS-1198
<10 Start Vol: 189.15 g <10 Start Vol: 347.98 g <10 Start Vol: 279.42 gEnd Vol: 164.86 g End Vol: 320.36 g End Vol: 248.53 g
Total: 24.29 g Total: 27.62 g Total: 30.89 gTub #: TS-1193 Tub #: TS-1196 Tub #: TS-1199
<2.5 Start Vol: 164.86 g <2.5 Start Vol: 320.36 g <2.5 Start Vol: 248.53 gEnd Vol: 158.30 g End Vol: 311.24 g End Vol: 239.18 g
Total: 6.56 g Total: 9.12 g Total: 9.35 gTub #: TS-1194 Tub #: TS-1197 Tub #: TS-1200
F 10/19/2010
Page 87 of 105

Filter/Tub Weights
Client : Date :Location: Job # : 810-097
Unit : #2 2B Pull 1D3D
Filter/Tub No.
Pre-Weight
(mg)
Post-Weight
(mg)
Net-Weight
(mg)Acetone Acetone Blank (9/16/10) 75 g TL-0156 681.037 681.180 0.143DI Blank 10/18/2010 150 g TL-0170 639.871 640.359 0.488Filter Blank 6L-0119 249.026 249.047 0.021
No. Cyclone Name Method Run No.Sample
LocationFilter/Tub
No.
Pre-Weight
(mg)
Post-Weight
(mg)
Net-Weight
(mg)2 2B Pull 27 1 Filter < 2.58L-5725 327.916 328.329 0.4142 2B Pull 27 1 < 10 TS-1193 693.788 699.299 5.5102 2B Pull 27 1 < 2.5 TS-1194 730.262 730.528 0.2662 2B Pull 27 1 > 10 TS-1192 601.046 603.838 2.7932 2B Pull 27 2 Filter < 2.58L-5726 347.179 347.559 0.3802 2B Pull 27 2 < 10 TS-1196 686.587 691.832 5.2462 2B Pull 27 2 < 2.5 TS-1197 658.423 658.736 0.3122 2B Pull 27 2 > 10 TS-1195 654.892 659.032 4.1402 2B Pull 27 3 Filter < 2.58L-5727 326.832 327.186 0.3542 2B Pull 27 3 < 10 TS-1199 646.295 650.487 4.1922 2B Pull 27 3 < 2.5 TS-1200 688.261 688.482 0.2212 2B Pull 27 3 > 10 TS-1198 681.779 684.900 3.120
F 10/19/2010
Page 88 of 105

Gin G Field and Laboratory Data
Page 89 of 105

G#5 No.2 Pull 1D3D2011
Emission Factor (lbs/bale) Emission Rate (lbs/hr)Based on EPA Method OTM27 Based on EPA Method OTM27
Total PM Total PMRun 1 0.1886 Run 1 6.4028Run 2 0.1994 Run 2 6.6278Run 3 0.1417 Run 3 4.9069
Average 0.1766 Average 5.9792PM10 PM10
Run 1 0.1392 Run 1 4.7241Run 2 0.1294 Run 2 4.3004Run 3 0.0820 Run 3 2.8388
Average 0.1168 Average 3.9545PM2.5 PM2.5
Run 1 0.0087 Run 1 0.2950Run 2 0.0084 Run 2 0.2805Run 3 0.0058 Run 3 0.1999
Average 0.0076 Average 0.2585PM10-2.5 PM10-2.5
Run 1 0.1305 Run 1 4.4291Run 2 0.1210 Run 2 4.0200Run 3 0.0762 Run 3 2.6389
Average 0.1092 Average 3.6960PM2.5/PM10
Run 1 6.2%Run 2 6.5%Run 3 7.0%
Average 6.5%PM2.5/TSP
Run 1 4.6%Run 2 4.2%Run 3 4.1%
Average 4.3%PM10/TSP
Run 1 73.8%Run 2 64.9%Run 3 57.9%
Average 66.2%
Gin:Exhaust:
Date:
Page 90 of 105

#5 No.2 Pull 1D3D Run #1 Run #2 Run #3
ø - Start of Run, time 8:20 8:46 9:15
ø - End of Run, time 8:40 9:09 9:34
Vlc - Volume of water collected, ml 0.0 0.0 0.0
Vm - Gas volume, meter cond., dcf 6.695 6.937 6.372
Y - Meter calibration factor 1.005 1.005 1.005
Pbar - Barometric pressure, in. Hg 30.35 30.35 30.35
Pg - Stack static pressure, in. H2O -0.14 -0.14 -0.14
ˆH - Avg. meter press. diff., in. H2O 0.513 0.510 0.510
Tm - Absolute meter temperature, °R 510.4 512.1 513.9
Vm(std) - Standard sample gas vol., dscf 7.0691 7.3001 6.6822
Bws - Water vapor part in gas stream 0.019 0.019 0.019
CO2 - Dry concentration, volume % 0.01 0.01 0.01
O2 - Dry concentration, volume % 20.9 20.9 20.9
Md - Mole wt. stack gas, dry, g/mole 28.838 28.838 28.838
Ms - Mole wt. stack gas, wet, g/gmole 28.632 28.632 28.632
Cp - Pitot tube coef., dimensionless 0.840 0.840 0.840
ˆp - Avg. of sq. roots of eachˆp 0.561 0.553 0.557
Ts - Absolute stack Temp. °R 559.3 558.8 560.3
A - Area of stack, square feet 3.98 3.98 3.98
Vs - Stack Gas Flow, ft/sec 32.33 31.86 32.15
Qstd - Volumetric flow rate, dscfm 7,244 7,144 7,189
An - Area of nozzle, square feet 2.074E-04 2.074E-04 2.074E-04
ø - Sampling time, minutes 18.37 18.97 17.52
DP50 - Cut size, microns 10.91 10.91 10.98
I - Isokinetic variation, percent 101.8 103.3 101.7
Sts - Stacks per system 2 2 2
OTM METHOD 27 FIELD DATA SUMMARYG
REM PM-10, 2.5 - 2008
Page 91 of 105
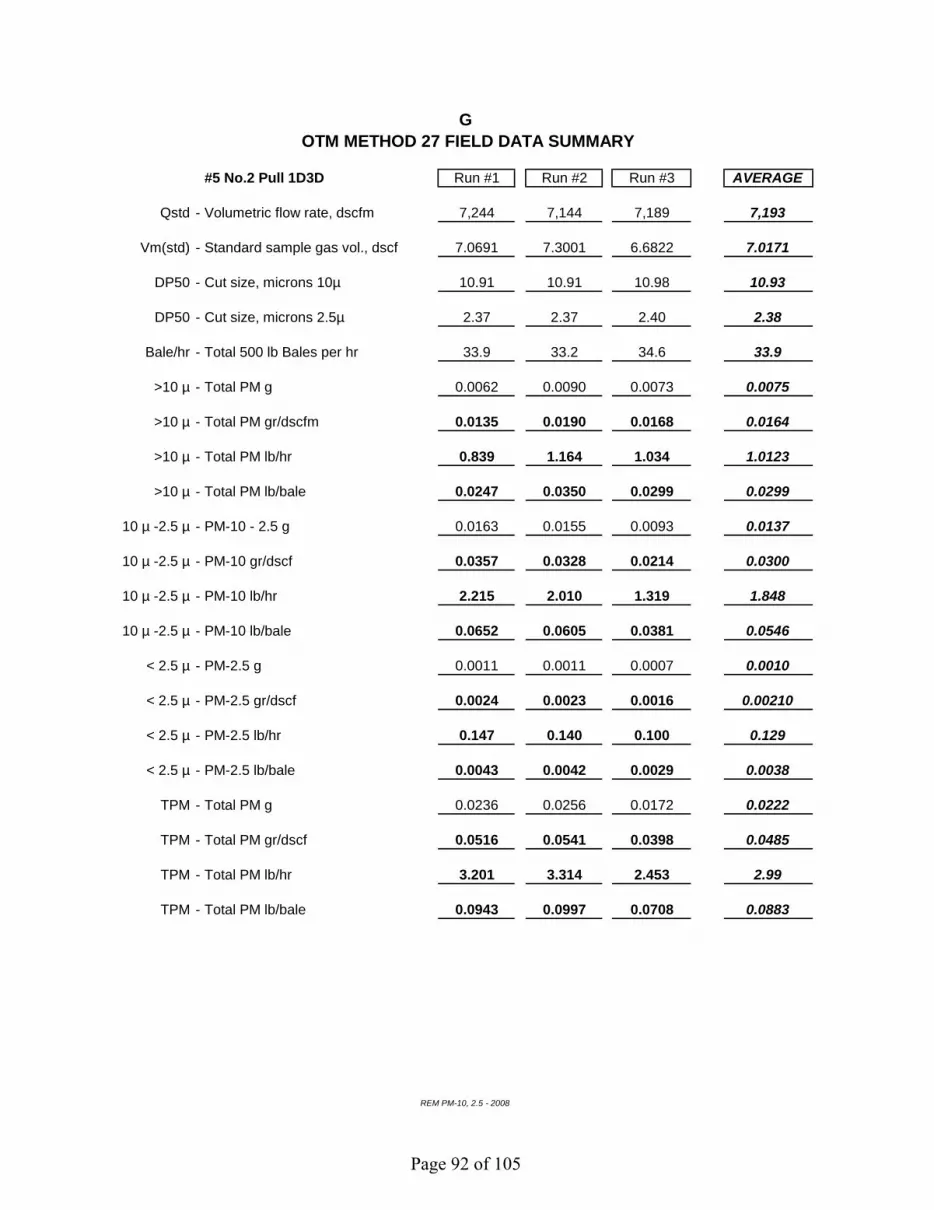
#5 No.2 Pull 1D3D Run #1 Run #2 Run #3 AVERAGE
Qstd - Volumetric flow rate, dscfm 7,244 7,144 7,189 7,193
Vm(std) - Standard sample gas vol., dscf 7.0691 7.3001 6.6822 7.0171
DP50 - Cut size, microns 10µ 10.91 10.91 10.98 10.93
DP50 - Cut size, microns 2.5µ 2.37 2.37 2.40 2.38
Bale/hr - Total 500 lb Bales per hr 33.9 33.2 34.6 33.9
>10 µ - Total PM g 0.0062 0.0090 0.0073 0.0075
>10 µ - Total PM gr/dscfm 0.0135 0.0190 0.0168 0.0164
>10 µ - Total PM lb/hr 0.839 1.164 1.034 1.0123
>10 µ - Total PM lb/bale 0.0247 0.0350 0.0299 0.0299
10 µ -2.5 µ - PM-10 - 2.5 g 0.0163 0.0155 0.0093 0.0137
10 µ -2.5 µ - PM-10 gr/dscf 0.0357 0.0328 0.0214 0.0300
10 µ -2.5 µ - PM-10 lb/hr 2.215 2.010 1.319 1.848
10 µ -2.5 µ - PM-10 lb/bale 0.0652 0.0605 0.0381 0.0546
< 2.5 µ - PM-2.5 g 0.0011 0.0011 0.0007 0.0010
< 2.5 µ - PM-2.5 gr/dscf 0.0024 0.0023 0.0016 0.00210
< 2.5 µ - PM-2.5 lb/hr 0.147 0.140 0.100 0.129
< 2.5 µ - PM-2.5 lb/bale 0.0043 0.0042 0.0029 0.0038
TPM - Total PM g 0.0236 0.0256 0.0172 0.0222
TPM - Total PM gr/dscf 0.0516 0.0541 0.0398 0.0485
TPM - Total PM lb/hr 3.201 3.314 2.453 2.99
TPM - Total PM lb/bale 0.0943 0.0997 0.0708 0.0883
OTM METHOD 27 FIELD DATA SUMMARYG
REM PM-10, 2.5 - 2008
Page 92 of 105

Run #1 Run #2 Run #3 AverageTotal Particulate Per Cyclone
Total gr/dscf 0.0516 0.0541 0.0398 0.0485Total lb/hr 3.20 3.31 2.45 2.99Total lb/bale 0.0943 0.0997 0.0708 0.0883
Total Particulate Per SystemTotal lb/hr 6.40 6.63 4.91 5.98Total lb/bale 0.189 0.199 0.142 0.177
< 10 µ Results per Cyclone- 10 µ gr/dscf 0.0380 0.0351 0.0230 0.0321- 10 µ (lb/hr) 2.36 2.15 1.42 1.98- 10 µ (lb/Bale) 0.0696 0.0647 0.0410 0.0584
< 10 µ Results per System- 10 µ (lb/hr) 4.72 4.30 2.84 3.95- 10 µ (lb/Bale) 0.139 0.129 0.082 0.117
< 2.5 µ Results per Cyclone- 2.5 µ gr/dscf 0.0024 0.0023 0.0016 0.0021- 2.5 µ (lb/hr) 0.15 0.14 0.10 0.13- 2.5 µ (lb/Bale) 0.0043 0.0042 0.0029 0.0038
< 2.5 µ Results per System- 2.5 µ (lb/hr) 0.29 0.28 0.20 0.26- 2.5 µ (lb/Bale) 0.009 0.008 0.006 0.008
Average Bales/hr 33.95 33.23 34.64 33.94
Cyclone Flow-RatesVs 32.33 31.86 32.15 32.11Acfm 7,713 7,600 7,669 7,661Dscfm 7,244 7,144 7,189 7,193
Cyclone Inlet VelocityVsfm 3047 3003 3030 3026
System Flow-RatesAcfm - - - 15,322Dscfm - - - 14,385
Number of Cyclones in System 2REM PM-10, 2.5 - 2001
G
OTM METHOD 27 RESULTS#5 No.2 Pull 1D3D
Page 93 of 105

Plant: G Unit: #5 No.2 Pull 1D3D Date: 10/8/2011 Lab#: 110-090Location: Cyclones in System: 2 Std Temp (Tstd): 68 °F
Cyclone Dia (in.): 54.00 Bales/hr: 33.95 Std Pressure: 29.92 in HgPbar: 30.35 in Hg Static Sp: -0.14 in water dcO2: 20.90 %
Run-Time, Ø: 18 min Pitot Factor: 0.84 Cp dcCO2: 0.01 %Meter Factor: 1.005 Y % H2O: 0.019 Bws* 1.9% dcN2: 79.09 %Meter Factor: 1.97 ¯H@ Meter Temp: 56.0 °F Stack Dia: 27.00 Sd in
Pre-test Leak Check: 0.004 cfm Pitot Leak Check: OK Post-test Leak Check: 0.002 cfm**EPA 201A - 10u & 2.5u: PRE - TEST CALCULATIONS
Delta P1 - Run: 0.320 pµs: 186.11 Ideal Nd: 0.195 Point 1 Ø: 1.54pMd: 28.84 pQs: 0.41656 Input Nd: 0.195 Vn ft/sec: 33.48pMs: 28.63 ¯H + 50 °F: 0.432 Closest Nd: 0.195 Delta H: 0.513
Ps in Hg: 30.34 ¯p min + 50°F: 0.122 V ft/sec min: 21.01 Ø: 18.0pVs, ft/sec: 33.63 ¯p max + 50°F: 0.523 V ft/sec max: 43.53 Dwell Time Const. 2.73
Stack Area pSa: 3.98 ¯H - 50 °F: 0.618 ¯p min: 0.133 Meter Volume: 6.8Acfm: 8022 ¯p min - 50°F: 0.146 ¯p max: 0.570 dscfm 0.376
pTs Stack: 100.0 ¯p max - 50 °F: 0.626 Vn/Vs x 100: 99.56 EPA 201A: TEST DATA & CALCULATIONS
Pre-Test Data Test Run Data Impinger Weights, gramsPoint Stack Temp ¯P Elapsed Ts Tm °F Tm °F ¯P Delta H Meter Volume Final InitialNo. °F "H2O Time °F Inlet Outlet "H2O "H2O Cubic Feet1 100 0.360 0.00 102.0 50 50 0.320 0.513 Initial Reading 12 100 0.340 1.54 100.0 50 50 0.340 0.513 794.125 23 100 0.250 3.13 99.0 50 50 0.270 0.513 Run Start Time 34 100 0.310 4.55 99.0 50 50 0.260 0.513 4 Total: 0.05 100 0.500 5.94 99.0 50 50 0.320 0.513 Test Avg Sqrt PM - Weights - Blank Corrected6 100 0.390 7.49 99.0 50 50 0.340 0.513 0.561 >10µ Wt: 0.0062 gms.1 100 0.350 9.08 97.0 50 50 0.270 0.513 Run End Time <10µ-2.5µ Wt: 0.0163 gms.2 100 0.360 10.49 100.0 51 51 0.250 0.513 <2.5µ Wt: 0.0011 gms.3 100 0.340 11.86 99.0 51 51 0.300 0.513 Final Reading >10µ: 0.0135 gr/dscf4 100 0.310 13.35 99.0 51 51 0.330 0.513 800.820 >10µ: 0.8393 lb/hr5 100 0.290 14.92 99.0 51 51 0.410 0.513 <10-2.5µ: 0.0357 gr/dscf6 100 0.310 16.67 99.0 51 51 0.390 0.513 Total Volume <10-2.5µ: 2.2146 lb/hr
100.0 0.343 18.37 99.3 50.4 0.317 0.513 6.695 <2.5µ: 0.0024 gr/dscf<2.5µ: 0.1475 lb/hr
EPA 201A: POST - TEST DATA & CALCULATIONSVlc: 0.0 grams Points Outside Dpmin or Dpmax: 0 Number of Points
MF - Moisture Fraction: 0.9810 fraction Reynolds No. for Run: 2957.65 dimentionlessDry Gas Meter Volume: 7.069 Vms, ft3 Nozzel Area: 2.07E-04 (AsNd) sqft
Corrected Water Volume: - Vws Nozzle Velocity: 32.93 (Nu) ft/secBws, Moisture Content: 0.0190 fraction Cyclone Inlet Velocity: 3047 (Vs) ft/min
Stack Gas Dry Molecular Weight: 28.838 Md PM-10 Sampler Flow Rate: 0.410 (scfm) PMQsStack Gas Wet Molecular Wt: 28.632 Mw Stack Flow Rate: 7,244.2 (Qs) Dscfm
Stack Gas Viscosity: 185.92 µs PM-10-Ds50: 10.91 micronsSample Flow Rate: 0.385 QsSt PM-2.5 Ds50 2.37 microns
Run - Cunn. Slip Corr. 1.07 dimensionless Iso Sampling Rate: 101.84 percentTotal - PM - Cs: 0.0516 gr/dscf PM < 10-2.5µ: 0.0652 lbs/baleTotal - PM - ER: 3.2014 lbs/hr PM < 2.5µ: 0.0043 lbs/bale
Stack Gas Velocity: 32.33 (Vs) ft/sec Total - PM: 0.0943 lbs/bale
REM PM-10, 2.5 - 2008
PRE - TEST DATA & CALCULATIONS
8:20
8:40
Page 94 of 105

Plant: G Unit: #5 No.2 Pull 1D3D Date: 10/8/2011 Lab#: 110-090Location: Cyclones in System: 2 Std Temp (Tstd): 68 °F
Cyclone Dia (in.): 54.00 Bales/hr: 33.23 Std Pressure: 29.92 in HgPbar: 30.35 in Hg Static Sp: -0.14 in water dcO2: 20.90 %
Run-Time, Ø: 18 min Pitot Factor: 0.84 Cp dcCO2: 0.01 %Meter Factor: 1.005 Y % H2O: 0.019 Bws* 1.9% dcN2: 79.09 %Meter Factor: 1.97 ¯H@ Meter Temp: 54.0 °F Stack Dia: 27.00 Sd in
Pre-test Leak Check: 0.008 cfm Pitot Leak Check: OK Post-test Leak Check: 0.000 cfm**EPA 201A - 10u & 2.5u: PRE - TEST CALCULATIONS
Delta P1 - Run: 0.280 pµs: 185.92 Ideal Nd: 0.198 Point 1 Ø: 1.51pMd: 28.84 pQs: 0.415896 Input Nd: 0.195 Vn ft/sec: 33.42pMs: 28.63 ¯H + 50 °F: 0.430 Closest Nd: 0.195 Delta H: 0.510
Ps in Hg: 30.34 ¯p min + 50°F: 0.122 V ft/sec min: 20.97 Ø: 18.0pVs, ft/sec: 32.33 ¯p max + 50°F: 0.522 V ft/sec max: 43.47 Dwell Time Const. 2.86
Stack Area pSa: 3.98 ¯H - 50 °F: 0.616 ¯p min: 0.133 Meter Volume: 6.7Acfm: 7713 ¯p min - 50°F: 0.146 ¯p max: 0.569 dscfm 0.374
pTs Stack: 99.3 ¯p max - 50 °F: 0.625 Vn/Vs x 100: 103.38 EPA 201A: TEST DATA & CALCULATIONS
Pre-Test Data Test Run Data Impinger Weights, gramsPoint Stack Temp ¯P Elapsed Ts Tm °F Tm °F ¯P Delta H Meter Volume Final InitialNo. °F "H2O Time °F Inlet Outlet "H2O "H2O Cubic Feet1 102.0 0.320 0.00 98.0 51 51 0.280 0.510 Initial Reading 12 100.0 0.340 1.51 99.0 51 52 0.300 0.510 801.073 23 99.0 0.270 3.08 99.0 52 52 0.280 0.510 Run Start Time 34 99.0 0.260 4.59 99.0 52 52 0.250 0.510 : Total: 0.05 99.0 0.320 6.02 99.0 52 52 0.350 0.510 Test Avg Sqrt PM - Weights - Blank Corrected6 99.0 0.340 7.71 98.0 52 52 0.330 0.510 0.553 >10µ Wt: 0.0090 gms.1 97.0 0.270 9.35 98.0 52 52 0.270 0.510 Run End Time <10µ-2.5µ Wt: 0.0155 gms.2 100.0 0.250 10.84 99.0 52 52 0.250 0.510 <2.5µ Wt: 0.0011 gms.3 99.0 0.300 12.26 99.0 52 52 0.250 0.510 Final Reading >10µ: 0.0190 gr/dscf4 99.0 0.330 13.69 99.0 53 53 0.320 0.510 808.010 >10µ: 1.1637 lb/hr5 99.0 0.410 15.31 99.0 53 53 0.420 0.510 <10-2.5µ: 0.0328 gr/dscf6 99.0 0.390 17.16 99.0 53 53 0.400 0.510 Total Volume <10-2.5µ: 2.0100 lb/hr
99.3 0.317 18.97 98.8 52.1 0.308 0.510 6.937 <2.5µ: 0.0023 gr/dscf<2.5µ: 0.1402 lb/hr
EPA 201A: POST - TEST DATA & CALCULATIONSVlc: 0.0 grams Points Outside Dpmin or Dpmax: 0 Number of Points
MF - Moisture Fraction: 0.9810 fraction Reynolds No. for Run: 2959.81 dimentionlessDry Gas Meter Volume: 7.300 Vms, ft3 Nozzel Area: 2.07E-04 (AsNd) sqft
Corrected Water Volume: - Vws Nozzle Velocity: 32.90 (Nu) ft/secBws, Moisture Content: 0.0190 fraction Cyclone Inlet Velocity: 3003 (Vs) ft/min
Stack Gas Dry Molecular Weight: 28.838 Md PM-10 Sampler Flow Rate: 0.409 (scfm) PMQsStack Gas Wet Molecular Wt: 28.632 Mw Stack Flow Rate: 7,144.4 (Qs) Dscfm
Stack Gas Viscosity: 185.80 µs PM-10-Ds50: 10.91 micronsSample Flow Rate: 0.385 QsSt PM-2.5 Ds50 2.37 microns
Run - Cunn. Slip Corr. 1.07 dimensionless Iso Sampling Rate: 103.27 percentTotal - PM - Cs: 0.0541 gr/dscf PM < 10-2.5µ: 0.0605 lbs/baleTotal - PM - ER: 3.3139 lbs/hr PM < 2.5µ: 0.0042 lbs/bale
Stack Gas Velocity: 31.86 (Vs) ft/sec Total - PM: 0.0997 lbs/bale
REM PM-10, 2.5 - 2008
9:09
8:46
PRE - TEST DATA & CALCULATIONS
Page 95 of 105

Plant: G Unit: #5 No.2 Pull 1D3D Date: 10/8/2011 Lab#: 110-090Location: Cyclones in System: 2 Std Temp (Tstd): 68 °F
Cyclone Dia (in.): 54.00 Bales/hr: 34.64 Std Pressure: 29.92 in HgPbar: 30.35 in Hg Static Sp: -0.14 in water dcO2: 20.90 %
Run-Time, Ø: 18 min Pitot Factor: 0.84 Cp dcCO2: 0.01 %Meter Factor: 1.005 Y % H2O: 0.019 Bws* 1.9% dcN2: 79.09 %Meter Factor: 1.97 ¯H@ Meter Temp: 54.0 °F Stack Dia: 27.00 Sd in
Pre-test Leak Check: 0.004 cfm Pitot Leak Check: ok Post-test Leak Check: 0.001 cfm**EPA 201A - 10u & 2.5u: PRE - TEST CALCULATIONS
Delta P1 - Run: 0.300 pµs: 185.80 Ideal Nd: 0.200 Point 1 Ø: 1.43pMd: 28.84 pQs: 0.41547 Input Nd: 0.195 Vn ft/sec: 33.39pMs: 28.63 ¯H + 50 °F: 0.430 Closest Nd: 0.195 Delta H: 0.510
Ps in Hg: 30.34 ¯p min + 50°F: 0.121 V ft/sec min: 20.95 Ø: 18.0pVs, ft/sec: 31.86 ¯p max + 50°F: 0.522 V ft/sec max: 43.42 Dwell Time Const. 2.62
Stack Area pSa: 3.98 ¯H - 50 °F: 0.616 ¯p min: 0.132 Meter Volume: 6.7Acfm: 7600 ¯p min - 50°F: 0.145 ¯p max: 0.569 dscfm 0.374
pTs Stack: 98.8 ¯p max - 50 °F: 0.624 Vn/Vs x 100: 104.81 EPA 201A: TEST DATA & CALCULATIONS
Pre-Test Data Test Run Data Impinger Weights, gramsPoint Stack Temp ¯P Elapsed Ts Tm °F Tm °F ¯P Delta H Meter Volume Final InitialNo. °F "H2O Time °F Inlet Outlet "H2O "H2O Cubic Feet1 98.0 0.280 0.00 98.0 53 53 0.300 0.510 Initial Reading 12 99.0 0.300 1.43 100.0 54 54 0.310 0.510 808.243 23 99.0 0.280 2.89 101.0 54 54 0.290 0.510 Run Start Time 34 99.0 0.250 4.30 101.0 54 54 0.240 0.510 4 Total: 0.05 99.0 0.350 5.59 101.0 54 54 0.290 0.510 Test Avg Sqrt PM - Weights - Blank Corrected6 98.0 0.330 7.00 100.0 54 54 0.360 0.510 0.557 >10µ Wt: 0.0073 gms.1 98.0 0.270 8.57 99.0 54 54 0.290 0.510 Run End Time <10µ-2.5µ Wt: 0.0093 gms.2 99.0 0.250 9.98 100.0 54 54 0.270 0.510 <2.5µ Wt: 0.0007 gms.3 99.0 0.250 11.34 101.0 54 54 0.260 0.510 Final Reading >10µ: 0.0168 gr/dscf4 99.0 0.320 12.68 101.0 54 54 0.290 0.510 814.615 >10µ: 1.0340 lb/hr5 99.0 0.420 14.09 101.0 54 54 0.460 0.510 <10-2.5µ: 0.0214 gr/dscf6 99.0 0.400 15.87 100.0 54 54 0.400 0.510 Total Volume <10-2.5µ: 1.3195 lb/hr
98.8 0.308 17.52 100.3 53.9 0.313 0.510 6.372 <2.5µ: 0.0016 gr/dscf<2.5µ: 0.1000 lb/hr
EPA 201A: POST - TEST DATA & CALCULATIONSVlc: 0.0 grams Points Outside Dpmin or Dpmax: 0 Number of Points
MF - Moisture Fraction: 0.9810 fraction Reynolds No. for Run: 2927.17 dimentionlessDry Gas Meter Volume: 6.682 Vms, ft3 Nozzel Area: 2.07E-04 (AsNd) sqft
Corrected Water Volume: - Vws Nozzle Velocity: 32.69 (Nu) ft/secBws, Moisture Content: 0.0190 fraction Cyclone Inlet Velocity: 3030 (Vs) ft/min
Stack Gas Dry Molecular Weight: 28.838 Md PM-10 Sampler Flow Rate: 0.407 (scfm) PMQsStack Gas Wet Molecular Wt: 28.632 Mw Stack Flow Rate: 7,189.4 (Qs) Dscfm
Stack Gas Viscosity: 186.16 µs PM-10-Ds50: 10.98 micronsSample Flow Rate: 0.381 QsSt PM-2.5 Ds50 2.40 microns
Run - Cunn. Slip Corr. 1.06 dimensionless Iso Sampling Rate: 101.69 percentTotal - PM - Cs: 0.0398 gr/dscf PM < 10-2.5µ: 0.0381 lbs/baleTotal - PM - ER: 2.4534 lbs/hr PM < 2.5µ: 0.0029 lbs/bale
Stack Gas Velocity: 32.15 (Vs) ft/sec Total - PM: 0.0708 lbs/bale
PRE - TEST DATA & CALCULATIONS
9:15
9:34
REM PM-10, 2.5 - 2008
Page 96 of 105

Cotton Gin Test Data
Plant: G Date: 10/8/2011Location: Start Time: 8:20
Unit: #5 No.2 Pull 1D3D End Time: 8:40Run: 1
Elapsed Time: 20 Test Time: 18.37Bale Time: 21.12 StdDev Std BPH: 2.40
Ave min/bale: 0:01:46 Ave Std BPH: 33.9
Bale No. Bale Wt. Time time/baleStd 500 lb
BPHChauvenet's
Criterion330132 8:19:01 --- --- ---330133 489 8:20:43 0:01:42 34.5330134 493 8:22:29 0:01:46 33.5330135 492 8:24:20 0:01:51 31.9330136 511 8:26:11 0:01:51 33.1330137 486 8:28:00 0:01:49 32.1330138 488 8:29:47 0:01:47 32.8330139 490 8:31:22 0:01:35 37.1330140 508 8:33:09 0:01:47 34.2330141 508 8:34:40 0:01:31 40.2 *330142 498 8:36:25 0:01:45 34.1330143 505 8:38:19 0:01:54 31.9330144 506 8:40:08 0:01:49 33.4
REM - 2003
Page 97 of 105

Cotton Gin Test Data
Plant: G Date: 10/8/2011Location: Start Time: 8:46
Unit: #5 No.2 Pull 1D3D End Time: 9:09Run: 2
Elapsed Time: 23 Test Time: 18.97Bale Time: 23.85 StdDev Std BPH: 10.73
Ave min/bale: 0:01:50 Ave Std BPH: 33.2
Bale No Bale Wt. Time time/baleStd 500 lb
BPHChauvenet's
Criterion330147 8:45:31 --- --- ---330148 509 8:47:31 0:02:00 30.5330149 483 8:49:14 0:01:43 33.8330150 509 8:52:27 0:03:13 19.0330151 507 8:53:21 0:00:54 67.6 *330152 502 8:55:12 0:01:51 32.6330153 510 8:57:08 0:01:56 31.7330154 529 8:58:59 0:01:51 34.3330155 501 9:00:30 0:01:31 39.6330156 505 9:02:14 0:01:44 35.0330157 519 9:03:59 0:01:45 35.6330158 507 9:05:48 0:01:49 33.5330159 517 9:07:33 0:01:45 35.5330160 507 9:09:22 0:01:49 33.5
REM - 2003
Page 98 of 105

Cotton Gin Test Data
Plant: G Date: 10/8/2011Location: Start Time: 9:15
Unit: #5 No.2 Pull 1D3D End Time: 9:34Run: 3
Elapsed Time: 19 Test Time: 17.52Bale Time: 20.82 StdDev Std BPH: 1.88
Ave min/bale: 0:01:44 Ave Std BPH: 34.6
Bale No Bale Wt. Time time/baleStd 500 lb
BPHChauvenet's
Criterion330163 9:14:53 --- --- ---330164 480 9:16:29 0:01:36 36.0330165 517 9:18:21 0:01:52 33.2330166 485 9:20:02 0:01:41 34.6330167 488 9:21:50 0:01:48 32.5330168 511 9:23:27 0:01:37 37.9330169 508 9:25:08 0:01:41 36.2330170 520 9:26:57 0:01:49 34.3330171 496 9:28:34 0:01:37 36.8330172 521 9:30:21 0:01:47 35.1330173 487 9:32:01 0:01:40 35.1330174 499 9:33:56 0:01:55 31.2330175 497 9:35:42 0:01:46 33.8
REM - 2003
Page 99 of 105

PARTICULATE WEIGHTS : DATA & CALCULATIONS RUN #1
Client : G Date : 10/8/11 >10 Catch ID:Site : Lab#: 110-090 <10 Catch ID:Unit : #5 No.2 Pull 1D3D Filter ID: 8L-6905 <2.5 Catch ID:
Acetone: TS-1529 60 gGross: 637.303 mg Tare: 637.224 mg Residue: 0.0793 mg
>10 µ Rinse: TS-1477Acetone: 19.8 g * 0.00132 mg/g -0.02614 mg
Gross: 669.961 mg Tare: 663.743 mg 6.2180 mg >10 µ Total Weight = 6.1919 mg
< 10 µ Rinse: TS-1478Acetone: 30.5 g * 0.00132 mg/g -0.04030 mg
Gross: 659.218 mg Tare: 642.841 mg 16.3773 mg< 10 µ Total Weight = 16.3370 mg
< 2.5 µ Filter: 8L-6905Gross: 355.132 mg Tare: 354.262 mg < 2.5 filter Net: 0.8700 mg
< 2.5 µ Rinse: TS-1479Acetone: 9.3 g * 0.00132 mg/g -0.01230 mg
Gross: 720.080 mg Tare: 719.849 mg 0.2303 mg< 2.5 µ Rinse Total Weight = 0.2180 mg
> 10 µ Total Weight = 0.0062 g< 10 µ Total Weight = 0.0174 g
< 10-2.5 µTotal Weight = 0.0163 g< 2.5 µ Total Weight = 0.0011 g
Total Weight = 0.0236 g
WEIGHTS & VOLUMES
REM PM-10, 2.5 - 2001
TS-1477TS-1478TS-1479
SOLUTION BLANKS
Page 100 of 105

PARTICULATE WEIGHTS : DATA & CALCULATIONS RUN #2
Client : G Date : 10/8/11 >10 Catch ID:Site : Lab#: 110-090 <10 Catch ID:Unit : #5 No.2 Pull 1D3D Filter ID: 8L-6906 <2.5 Catch ID:
Acetone: TS-1529 60 gGross: 637.303 mg Tare: 637.224 mg Residue: 0.0793 mg
>10 µ Rinse: TS-1480Acetone: 22.2 g * 0.00132 mg/g -0.02939 mg
Gross: 641.040 mg Tare: 632.022 mg 9.0183 mg >10 µ Total Weight = 8.9889 mg
< 10 µ Rinse: TS-1481Acetone: 34.2 g * 0.00132 mg/g -0.04518 mg
Gross: 731.585 mg Tare: 716.014 mg 15.5717 mg< 10 µ Total Weight = 15.5265 mg
< 2.5 µ Filter: 8L-6906Gross: 367.617 mg Tare: 366.753 mg < 2.5 filter Net: 0.8643 mg
< 2.5 µ Rinse: TS-1482Acetone: 13.9 g * 0.00132 mg/g -0.01842 mg
Gross: 680.585 mg Tare: 680.348 mg 0.2373 mg< 2.5 µ Rinse Total Weight = 0.2189 mg
> 10 µ Total Weight = 0.0090 g< 10 µ Total Weight = 0.0166 g
< 10-2.5 µTotal Weight = 0.0155 g< 2.5 µ Total Weight = 0.0011 g
Total Weight = 0.0256 g
WEIGHTS & VOLUMES
REM PM-10, 2.5 - 2001
TS-1480TS-1481TS-1482
SOLUTION BLANKS
Page 101 of 105

PARTICULATE WEIGHTS : DATA & CALCULATIONS RUN #3
Client : G Date : 10/8/11 >10 Catch ID:Site : Lab#: 110-090 <10 Catch ID:Unit : #5 No.2 Pull 1D3D Filter ID: 8L-6907 <2.5 Catch ID:
Acetone: TS-1529 60 gGross: 637.303 mg Tare: 637.224 mg Residue: 0.0793 mg
>10 µ Rinse: TS-1483Acetone: 20.7 g * 0.00132 mg/g -0.02732 mg
Gross: 659.787 mg Tare: 652.494 mg 7.2930 mg >10 µ Total Weight = 7.2657 mg
< 10 µ Rinse: TS-1484Acetone: 37.4 g * 0.00132 mg/g -0.04950 mg
Gross: 710.561 mg Tare: 701.240 mg 9.3207 mg< 10 µ Total Weight = 9.2712 mg
< 2.5 µ Filter: 8L-6907Gross: 341.419 mg Tare: 340.950 mg < 2.5 filter Net: 0.4693 mg
< 2.5 µ Rinse: TS-1485Acetone: 14.6 g * 0.00132 mg/g -0.01928 mg
Gross: 631.225 mg Tare: 630.973 mg 0.2523 mg< 2.5 µ Rinse Total Weight = 0.2331 mg
> 10 µ Total Weight = 0.0073 g< 10 µ Total Weight = 0.0100 g
< 10-2.5 µTotal Weight = 0.0093 g< 2.5 µ Total Weight = 0.0007 g
Total Weight = 0.0172 g
WEIGHTS & VOLUMES
REM PM-10, 2.5 - 2001
TS-1483TS-1484TS-1485
SOLUTION BLANKS
Page 102 of 105

Acetone Rinse
Client : Date :Location: Job # : 110-090
Unit : #5 No.2 Pull 1D3D
PM-2.5 Date:Run 1 Run 2 Run 3
Filter ID#: 8L-6905 Filter ID#: 8L-6906 Filter ID#: 8L-6907
>10 Start Vol: 417.55 g >10 Start Vol: 353.75 g >10 Start Vol: 278.26 gEnd Vol: 397.78 g End Vol: 331.52 g End Vol: 257.60 g
Total: 19.77 g Total: 22.23 g Total: 20.66 gTub #: TS-1477 Tub #: TS-1480 Tub #: TS-1483
<10 Start Vol: 397.78 g <10 Start Vol: 331.52 g <10 Start Vol: 257.60 gEnd Vol: 367.30 g End Vol: 297.35 g End Vol: 220.16 g
Total: 30.48 g Total: 34.17 g Total: 37.44 gTub #: TS-1478 Tub #: TS-1481 Tub #: TS-1484
<2.5 Start Vol: 367.30 g <2.5 Start Vol: 297.35 g <2.5 Start Vol: 220.16 gEnd Vol: 358.00 g End Vol: 283.42 g End Vol: 205.58 g
Total: 9.30 g Total: 13.93 g Total: 14.58 gTub #: TS-1479 Tub #: TS-1482 Tub #: TS-1485
G 10/8/2011
10/8/11
Page 103 of 105

Filter/Tub Weights
Client : Date :Location: Job # : 110-090
Unit : #5 No.2 Pull 1D3D
Filter/Tub No.
Pre-Weight
(mg)
Post-Weight
(mg)
Net-Weight
(mg)Acetone Blank 60 g TS-1529 637.224 637.303 0.079DI Blank 304.1 g TL-0022 671.908 672.059 0.151Filter Blank 8L-6914 296.945 296.944 -0.001
No. Cyclone Name Method Run No. Sample LocationFilter/Tub
No.
Pre-Weight
(mg)
Post-Weight
(mg)
Net-Weight
(mg)5 No.2 Pull 27 1 Filter < 2.5 8L-6905 354.262 355.132 0.8705 No.2 Pull 27 1 > 10 TS-1477 663.743 669.961 6.2185 No.2 Pull 27 1 < 10 TS-1478 642.841 659.218 16.3775 No.2 Pull 27 1 < 2.5 TS-1479 719.849 720.080 0.2305 No.2 Pull 27 2 Filter < 2.5 8L-6906 366.753 367.617 0.8645 No.2 Pull 27 2 > 10 TS-1480 632.022 641.040 9.0185 No.2 Pull 27 2 < 10 TS-1481 716.014 731.585 15.5725 No.2 Pull 27 2 < 2.5 TS-1482 680.348 680.585 0.2375 No.2 Pull 27 3 Filter < 2.5 8L-6907 340.950 341.419 0.4695 No.2 Pull 27 3 > 10 TS-1483 652.494 659.787 7.2935 No.2 Pull 27 3 < 10 TS-1484 701.240 710.561 9.3215 No.2 Pull 27 3 < 2.5 TS-1485 630.973 631.225 0.252
G 10/8/2011
Page 104 of 105

Acknowledgement: The authors appreciate the cooperating gin managers and personnel who
generously allowed and endured sampling at their gins. In addition, we thank California Cotton
Ginners’ and Growers’ Association, Cotton Incorporated, San Joaquin Valleywide Air Pollution
Study Agency, Southeastern Cotton Ginners’ Association, Southern Cotton Ginners’
Association, Texas Cotton Ginners’ Association, Texas State Support Committee, and The
Cotton Foundation for funding this project. This project was support in-part by the USDA
National Institute of Food and Agriculture Hatch Project OKL02882. The authors also thank the
Cotton Gin Advisory Group and Air Quality Advisory Group for their involvement and
participation in planning, execution, and data analysis for this project that is essential to
developing quality data that will be used by industry, regulatory agencies, and the scientific
community. The advisory groups included: the funding agencies listed above, California Air
Resources Board, Missouri Department of Natural Resources, National Cotton Council, National
Cotton Ginners’ Association, North Carolina Department of Environment and Natural
Resources, San Joaquin Valley Air Pollution Control District, Texas A&M University, Texas
Commission on Environmental Quality, USDA-NRCS National Air Quality and Atmospheric
Change, and U.S. Environmental Protection Agency (national, Region 4 and 9).
Disclaimer: Mention of trade names or commercial products in this publication is solely for the
purpose of providing specific information and does not imply recommendation or endorsement
by the Oklahoma State University or U.S. Department of Agriculture. Oklahoma State
University and USDA are equal opportunity providers and employers.
The statements and conclusions in this report are those of the USDA-ARS and Oklahoma State
University and not necessarily those of the California Air Resources Board, the San Joaquin
Valleywide Air Pollution Study Agency, or its Policy Committee, their employees or their
members. The mention of commercial products, their source, or their use in connection with
material reported herein is not to be construed as actual or implied endorsement of such products.
Page 105 of 105


