Embed Size (px)
Citation preview

Palaeogeography, Palaeoclimatology, Palaeoecology 451 (2016) 197–209
Contents lists available at ScienceDirect
Palaeogeography, Palaeoclimatology, Palaeoecology
j ourna l homepage: www.e lsev ie r .com/ locate /pa laeo
50,000 years of vegetation and climate change in the southern NamibDesert, Pella, South Africa
Sophak Lim a,⁎, Brian M. Chase a, Manuel Chevalier a, Paula J. Reimer b
a Centre National de la Recherche Scientifique, UMR 5554, Institut des Sciences de l'Evolution de Montpellier, Université de Montpellier, Bat. 22 CC061, Place Eugène Bataillon,34095 Montpellier cedex 5, Franceb School of Geography, Archaeology and Palaeoecology, Queen's University Belfast, Belfast BT7 1NN, Northern Ireland, UK
⁎ Corresponding author at: Institut des Sciences de l'E5554), Université Montpellier 2, Bat. 22 CC061, PlMontpellier cedex 5, France. Tel.: +33 04 67 14 39 25.
E-mail address: [email protected] (S. Lim).
http://dx.doi.org/10.1016/j.palaeo.2016.03.0010031-0182/© 2016 Elsevier B.V. All rights reserved.
a b s t r a c t
a r t i c l e i n f oArticle history:Received 21 October 2015Received in revised form 29 February 2016Accepted 1 March 2016Available online 9 March 2016
This paper presents the first continuous pollen record from the southern Namib Desert spanning the last50,000 years. Obtained from rock hyrax middens found near the town of Pella, South Africa, these data areused to reconstruct vegetation change and quantitative estimates of temperature and aridity. Results indicatethat the last glacial period was characterised by increased water availability at the site relative to the Holocene.Changes in temperature and potential evapotranspiration appear to have played a significant role in determiningthe hydrologic balance. The record can be considered in two sections: 1) the last glacial period, when low tem-peratures favoured the development ofmore mesic Nama-Karoo vegetation at the site, with periods of increasedhumidity concurrent with increased coastal upwelling, both responding to lower global/regional temperatures;and 2) the Holocene, during which time high temperatures and potential evapotranspiration resulted in in-creased aridity and an expansion of the Desert Biome. During this latter period, increases in upwelling intensitycreated drier conditions at the site.Considered in the context of discussions of forcing mechanisms of regional climate change and environmentaldynamics, the results from Pella stand in clear contrast withmany inferences of terrestrial environmental changederived from regional marine records. Observations of a strong precessional signal and interpretations of in-creased humidity during phases of high local summer insolation in the marine records are not consistent withthe data from Pella. Similarly, while high percentages of Restionaceae pollen has been observed in marine sedi-ments during the last glacial period, they do not exceed 1% of the assemblage from Pella, indicating that no sig-nificant expansion of the Fynbos Biomehas occurred during the last 50,000 years. These findings pose interestingquestions regarding the nature of environmental change in southwestern Africa, and the significance of the di-verse records that have been obtained from the region.
© 2016 Elsevier B.V. All rights reserved.
Keywords:South AfricaNamib DesertLate QuaternaryRock hyrax middensPollenClimate reconstruction
1. Introduction
Palaeoenvironmental evidence, and particularly palynological data,from the Namib Desert region are notably scarce (cf. Chase andMeadows, 2007; Lancaster, 2002), and as a result very little is knownabout long-term climate and vegetation dynamics surrounding the hy-perarid core of southwestern Africa. The arid environment has preclud-ed the preservation of organic material, and most palaeoenvironmentalrecords have been obtained from a diversity of geomorphic featuressuch as dune sediments (Bateman et al., 2003; Blümel et al., 1998;Bristow et al., 2007; Chase and Thomas, 2006, 2007; Eitel et al., 2002;Stokes et al., 1997; Stone and Thomas, 2008; Telfer, 2007; Thomas
volution de Montpellier (UMRace Eugène Bataillon, 34095
et al., 1997, 1998), fluvial deposits (Blumel et al., 2000; Bourke et al.,2003; Eitel et al., 2002; Eitel and Zöller, 1996; Heine, 2004; Heine andHeine, 2002; Heine and Völkel, 2009; Lancaster, 2002; Srivastava et al.,2006; Stone et al., 2010; Vogel, 1982) and fragmentary lacustrinerecords (Cooke and Heine, 1979; Deacon and Lancaster, 1988; Heine,1978, 1982; Lancaster, 1979, 1984, 1986; Lancaster and Teller, 1988;Teller and Lancaster, 1985, 1986; Teller et al., 1990; Ward, 1984).Many of these, while being potentially valuable indicators of landscapedynamics (Thomas, 2013), are of debatable palaeoclimatic significance(Chase, 2009; Chase and Brewer, 2009; Lancaster, 2002; Stone et al.,2010; Thomas and Burrough, 2012), and a coherent environmentalcontext for their development remains to be established. In terms ofpalaeoecological records, while some Holocene age pollen recordshave been recovered fromwestern Namibia, they are generally restrict-ed to the mid- to latest Holocene (Gil-Romera et al., 2006, 2007; Scott,1996; Scott et al., 1991), with only records from the Brandberg (Scottet al., 2004) providing snapshots of glacial-age vegetation in theNamib Desert.

198 S. Lim et al. / Palaeogeography, Palaeoclimatology, Palaeoecology 451 (2016) 197–209
This lack of terrestrial records has led to a reliance on records obtain-ed from marine cores (cf. Chase and Meadows, 2007). While thesesequences contain long, continuous records of terrestrial sediments(Gingele, 1996; Pichevin et al., 2005; Stuut et al., 2002; Weldeab et al.,2013), pollen (Shi and Dupont, 1997; Shi et al., 1998, 2000, 2001), char-coal (Daniau et al., 2013) and biomarkers (Collins et al., 2011, 2014;Rommerskirchen et al., 2003) the intense atmospheric and oceanic cir-culation systems dominating the Southeast Atlantic basin – particularlyalong the southwest African margin – and the potential for significantaeolian and fluvial sediment contributions, have raised questions re-garding the taphonomy, and thus significance, of the records obtained(cf. Chase and Meadows, 2007; Scott et al., 2004).
Despite the conflicts presented by these records and their interpre-tation, the regional dataset seems to generally indicate: 1) morehumid conditions in theNamib during the last glacial period, particular-ly duringmarine isotope stage (MIS) 4 (71–59 ka) and during lateMIS 3and early MIS 2, from ~35–24 ka, and 2) relatively drier conditionsduring the Holocene (synthesised in Chase and Meadows, 2007). Themechanisms driving the differences in glacial and interglacial climatesremain unclear. While Chase and Meadows (2007) suggested that theprevalence of southwest African sites indicating increased humidityduring the last glacial periodmay support prevailing conceptualmodelsrelating wetter glacial conditions to equatorward shifts in the westerlystorm track (e.g. van Zinderen Bakker, 1976), it has also been suggestedthatmore extensiveNorthernHemisphere ice sheetswould have result-ed in a southward displacement of theAfrican rainbelt (cf. the Intertrop-ical Convergence Zone (ITCZ)), bringingmore tropical rain to the regionduring the summer (Butzer, 1984; Butzer et al., 1978; Lancaster, 1979;Lewis et al., 2010). Quantifications of summer precipitation amountsin eastern South Africa (Chevalier and Chase, 2015; Truc et al., 2013)suggest that while some evidence exists to indicate increased tropicalprecipitation during the last glacial period (Schefuß et al., 2011;Thomas et al., 2009; Wang et al., 2013), this was restricted, at least inthe east, to a narrow belt south of LakeMalawi, and that any zone of en-hanced tropical rainfall was likely more restricted than some generalcirculation model (GCM) simulations suggest (cf. Lewis et al., 2010). Afurther consideration is the role of temperature on the regional hydro-logic budget. Regardless of changes in the position or intensity of the re-gions' dominant moisture-bearing systems, indications are thattemperatures in southern Africa were asmuch as 5 °C to 6 °C lower dur-ing the last glacial period (Chevalier and Chase, 2015; Kulongoski andHilton, 2004; Stute and Talma, 1997, 1998; Talma and Vogel, 1992;Truc et al., 2013). This would have significantly reduced potentialevapotranspiration (PET), and may have thus strongly influenced re-cords derived fromproxies sensitive to evaporation andwater availabil-ity rather than purely rainfall amount (Chevalier and Chase, in press).
Here we present: 1) the first continuous pollen records from thesouthern Namib Desert and South Africa's Desert Biome spanning thelast 50,000 years, and 2) quantified reconstructions of changes in aridityand mean annual temperature based on these data. The pollen recordswere obtained from two sections of a rock hyrax midden complexrecovered from mountains near the town of Pella, South Africa (a fulldescription of rock hyrax middens can be found in Chase et al., 2012).Through this analysis we seek to investigate: 1) the coherence betweenmarine and terrestrial pollen records, 2) the extent that the formermaybe used as reliable indicators of changes in terrestrial ecosystems, and3) the hypothesis that Mediterranean Fynbos Biome expanded far tothe north during the last glacial period as a result of an equatorwardshift of the westerly storm track (e.g. Chase and Meadows, 2007; Shiet al., 2000, 2001).
2. Study region and site description
The Pellamidden site (29°00′04″S, 19°08′06″E, 490mamsl.) is locat-ed 3 km NNW of the town of Pella, on the South African southern flankof the Orange River valley, 4 km from the river (Fig. 1). Lower than the
surrounding plains, which receive c. 200 mm yr−1 of rainfall, the cli-mate of the Orange River valley is arid to hyperarid, with the middensite receiving only c. 70 mm yr−1 of rainfall (Hijmans et al., 2005).Most (66%) of what little rainfall the region receives falls during thelate summer, placing the site on the border of the western margin ofsouthern Africa's summer rainfall zone (SRZ; sensu Chase andMeadows, 2007). Compounding the effects of low rainfall and strongseasonality, inter-annual variability of precipitation is high, and the re-gion may go for several years with no rainfall.
The vegetation at Pella (Fig. 1) is classified as Eastern Gariep RockyDesert, with the plains immediately to the south hosting Eastern GariepPlains Desert vegetation (Mucina and Rutherford, 2006a), representinganextension of thehyperarid–arid extension of theNamibDesert acrossthe more humid Succulent Karoo and Nama-Karoo biomes (Fig. 1). In-deed, vegetation on the rocky slopes around the site is extremely sparse.As the site is found in a structure created by a drainage line (Fig. 2D),some larger shrubs (e.g. Searsia (a.k.a. Rhus) sp. (Anacardiacae)) arefound in close proximity (Fig. 3). While no Aloe were observed at thesite, they are an important tree/shrub element of the ecoregion, as arespecies of Acacia, Boscia, Euclea, Maerua and Pappea. Smaller shrubs in-clude Commiphora sp., Ruschia, Mesembryanthenum, Tylecodon,Zygophyllum, Diospyros, Eriocephalus, Hermannia, Justicia, Monechmaand Petalidium, and Tribulus is one of the primary perennial herbs. Thesurrounding plains host somewhat denser vegetation (Figs. 2C; 3),dominated by species of Stipagrostis grass and Euphorbia andZygophyllum shrubs as well as localised stands of Aloe dichotoma(Mucina and Rutherford, 2006a). In this and drier regions of the DesertBiome (e.g. Fig. 2A), grasses are best adapted andmost prevalent as theycan withstand extended drought periods and respond quickly whenrain does fall. Woody shrubs may be found along drainage lines orother locations that store groundwater (Figs. 2D; 3), but these situationsbecome increasingly rare in drier environments.
Approximately 20–30 km to the south of the site, increased rainfallsupports Bushmanland Arid Grassland vegetation of the Nama-KarooBiome (Mucina and Rutherford, 2006a) (Fig. 2B). As a whole, theNama-Karoo is distinguished from the adjacent Succulent KarooBiome to thewest by seasonality of rainfall (summer as opposed towin-ter rainfall dominance), and its relatively low plant diversity, withAsteraceae and Poaceae being the dominant families (Mucina andRutherford, 2006a). A significant gradient in rainfall amount existsacross the Nama-Karoo from east (c. 500 mm yr−1) to west (c.70 mm yr−1). In the west, nearer to Pella, succulents of Aizoaceae,Crassulaceae and Euphorbiaceae become more common, reflecting thedrier climate and the transition with the Succulent Karoo and Desert bi-omes. The Bushmanland Arid Grassland is similar in many respects tothe Eastern Gariep Plains Desert described above, with a dominance ofStipagrostis grasses. Species of Aristida and Eragrostis grass also occur,and the tree species Acacia mellifera and Boscia foetida are found alongdrainage lines. Shrubs such as Lycium, Pentzia, Barleria, Berkhya,Blepharis, Eriocephalus, Hirpicium, Aizoon, Monechma, Solanum andZygophyllum are most common, and Tribulus is again a common herb(Mucina and Rutherford, 2006a). Generally, grass dominates in theNama-Karoo under two opposing climate regimes: 1) along its mostarid margins, where there are insufficient groundwater resources tosupport perennial shrubs, and 2) with increasing rainfall, whichbecomes more regular/abundant to the east, where the Nama-Karoogrades into the Grassland Biome.
3. Material and methods
3.1. The Pella rock hyrax middens
Rock hyrax middens are stratified accumulations of urine and/orfaecal pellets that are deposited as successive layers, often over thou-sands of years (see Chase et al., 2012). The midden at Pella formed inseveral distinct lobes (Fig. 3C). For this study, sections of two of the

Pella
16˚E 17˚E 18˚E 19˚E 20˚E
30
˚S
29˚S
28
˚S
27˚S
16˚E 17˚E 18˚E 19˚E 20˚E
30˚S
29
˚S
28˚S
27
˚S
Fynbos
Succulent Karoo
Nama-Karoo
Desert
Savanna
Azonal
Biomes
>66%
66-33%
<33%
>66%
66-33%
<33%Pella
0.28
0.02
Aridity Index
Fig. 1.Maps of aridity index (left) and the biomes of the southernNamibDesert region (right)with location of the Pella rockhyraxmidden site. The data for vegetation type is derived fromtwo separate sources for Namibia (‘ACACIA’, 2002) and South Africa (Mucina and Rutherford, 2006b). As the data differ in resolution andmethodology, the desert region in Namibia wasextended along the Orange River based on regional aridity index values (b0.04) (Trabucco and Zomer, 2009) to be comparable with the South African data. The boundaries of the winter,year-round and summer rainfall zones (defined as N66%, 66%–33% and b33% winter Apr.–Sept. rainfall; (defined as N66%, 66%–33% and b33% winter Apr.–Sept. rainfall; sensu Chase andMeadows, 2007) are indicated by the grey NW–SE trending lines.
199S. Lim et al. / Palaeogeography, Palaeoclimatology, Palaeoecology 451 (2016) 197–209
lobes of themidden complex were sampled for pollen analysis: PEL-1-1(22 cm thick) and PEL-1-4a (13.5 cm). The samples from each (PEL-1-1n= 38; PEL-1-4a n= 21)midden are contiguous, with each consistingof a block of material 2–5 mm thick and weighing between ~0.3 g and1.0 g. For a full description of hyrax middens, their development andthe sampling and analytical methodologies for the proxies they contain,see Chase et al. (2012).
Radiocarbon analysis was performed on 16 samples from the mid-den section (PEL-1-1, n = 10; PEL-1-4a, n = 6). The samples werepretreated with 2% HCl for 1 h at room temperature to remove carbon-ates and dried at 60 °C. They were then weighed into quartz tubes withan excess of CuO, sealed under vacuum and combusted to CO2. The CO2
was converted to graphite on an iron catalyst using the zinc reductionmethod (Slota et al., 1987). The 14C/12C ratio and 13C/12Cweremeasuredby accelerator mass spectrometry (AMS) at the 14CHRONO Centre,Queen's University Belfast.
All the radiocarbon ages were calibrated (Table S1) with the South-ern Hemisphere calibration data (SHCal13, Hogg et al., 2013; Reimeret al., 2013) and chronologies were estimated with the Bacon v2.2model (Blaauw and Christen, 2011). Bacon produces robust estimationsof the probability density function (pdf) of the uncertainties associatedwith our pollen samples. That information, referred to as pdfage, was ex-tracted and integrated in a framework to derive robust quantitative cli-mate reconstructions (more details below and in Chevalier and Chase,2015).
3.2. Pollen and microcharcoal analysis
Pollen samples were prepared with standard physical (600 μm siev-ing and decanting) and chemical (HCl, KOH,HF and acetolysis)methods(Moore et al., 1991). Lycopodium tablets were added to the weighedsample to estimate pollen concentrations (Stockmarr, 1971). A mini-mum pollen sum of 400 grains was counted at a magnification of×400 under a light microscope, and identified with the help of theliterature (Scott, 1982a; van Zinderen Bakker, 1953, 1956; vanZinderen Bakker and Coetzee, 1959), and photographic and slidesreference collections at the University of the Free State, Universityof Cape Town, and University of Montpellier. Microcharcoal particleswere identified as black, completely opaque, angular fragmentsthat occurred in the pollen slides (Clark, 1988). Only charcoalparticles N 75 μm2 (or longer than 10 μm) were counted under alight microscope at ×400 magnification (Mooney and Tinner, 2011;
Patterson et al., 1987). A minimum count of 200 items (given bythe sum of charcoal particles and exotic marker grains) was used.Charcoal particles which exceed the mesh-width size of 600 μm aremissing from the microscopic charcoal record and particles of ca.b10 μm were not counted in order to ensure correct identification(Mooney and Tinner, 2011). Therefore, our charcoal signal is relatedprimarily to the regional fire signal, with specifically local fires (largeparticles) and remote, extra-regional fires (b10 μm particles) beingexcluded.
The TILIA programme was used to construct the pollen diagrams,and pollen zones are determined by theCONISSmethod (Grimm, 2011).
3.3. Climate reconstruction from fossil pollen
To derive more specific palaeoclimatic information, we used theCREST software package (Climate REconstruction SofTware; Chevalieret al., 2014) to analyse the fossil pollen data from Pella. In this paper,we focus on the reconstruction of an aridity index (AI) andmean annualtemperature (MAT).
The method is based on the use of pdfs. Modern plant distributions,obtained from the South African National Botanical Institute(Rutherford et al., 2003, 2012; SANBI, 2003), are correlated with AI(Trabucco and Zomer, 2009) and MAT (Hijmans et al., 2005) data todefine climatic envelopes for plant species and fit species pdfs (pdfsp).These pdfsp are then combined according to the individual species thatcomprise each fossil pollen type identified in the sequence to create apollen pdf (pdfpol). Finally, the pdfpol for each sample are weighted andmultiplied to produce a curve that represents the likelihood of AI/MATbased on the coexistence of the different taxa (pdfAI/pdfMAT).
The CREST method has been shown to be sensitive to the numberof taxa used (Chevalier et al., 2014). Juggins et al. (2015) andChevalier and Chase (2015) have also shown – for different recon-struction methods – that selecting a subset of sensitive taxa waspreferable to ensure robust quantifications from pollen data. Usingthe CREST software package and its diagnostics tools (based on as-sessments of the shape of the pdfpols) (e.g. number of modes, kurto-sis) and the modern correlation between plant distributions andclimate gradients, we selected a subset of sensitive taxa for:1) AI (Aizoaceae, Aizoon type, Amaryllidaceae, Anacardiaceae,Apiaceae, Caryophyllaceae, Celastraceae, Crassula, Forsskaolea,Menispermaceae, Montinia, Pappea, Pentzia-type, Petalidium,Stoebe-type, Tribulus, Rhamnaceae and Zygophyllum) and 2) MAT

Fig. 2. Images of the grassy plains of the Desert Biome (A), the Bushmanland Arid Grassland vegetation of the Nama-Karoo Biome (B), the Eastern Gariep Plains Desert (C) and the EasternGariep Rocky Desert, with the Pella midden site indicated within the white circle (D).
200 S. Lim et al. / Palaeogeography, Palaeoclimatology, Palaeoecology 451 (2016) 197–209
(Amaryllidaceae, Apiaceae, Berkheya, Capparaceae, Caryophyllaceae,Crassula, Ericaceae, Forsskaolea, Hermannia, Justicia, Montinia,Moraceae and Stoebe-type). Species-rich taxa such as Asteraceae,Poaceae and Scrophulariaceae cannot be used due to the saturationeffect of the CREST method (further details available in Chevalieret al., 2014).
To enhance the signal over noise ratio of our reconstructions, weused the two-step Monte-Carlo framework presented in Chevalier andChase (2015). Each sample is associated with quantified uncertaintiesfrom: 1) the CREST reconstruction (pdfAI/pdfMAT), and 2) the pdf of theage uncertainties derived from the age-depth model (pdfage). To inter-polate the reconstructions and integrate these two sources of uncertain-ty, different scenarios are built by sampling pdfAI/pdfMAT and pdfage foreach sample. The accumulation and combination of 100,000 of thosescenarios produce a robust interpolated curve that integrates uncer-tainties from the age-depth model and the reconstruction process. Theinterpolated curves are then stacked together (centred using their over-lapping sections between 100 and 1300 cal BP (calibrated radiocarbonyears before AD 1950)) with a second round of Monte-Carlo samplingto produce a single reconstruction. This process generates high-frequency, low-amplitude white noise that has no climate or environ-mental significance, and which is filtered out with a 1000-yr movingaverage.
4. Results
4.1. Age-depth models and midden accumulation rates
The radiocarbon analyses of the Pellamiddens PEL-1-4a and PEL-1-1indicate that each lobe accumulated continuously, althoughwith signif-icant changes in accumulation rate (Fig. 4). An exception may be at~15.75 cm in PEL-1-1 where a sharp decrease or cessation of accumula-tion may have occurred. Accumulation rates range from extremes of
4.9 yr/mm in PEL-1-4a to 780 yr/mm in PEL-1-1, with average accumu-lation rates of 230 yr/mm(PEL-1-1) and 9 yr/mm (PEL-1-4a). This iden-tifies minimum and maximum resolutions of 10 and 2358 cal year persample, and average resolutions of 950 ± 515 (PEL-1-1) and 40 ± 10(PEL-1-4a) cal year per sample.
4.2. Vegetation dynamics inferred from pollen record
The Pella middens (PEL-1-1 and PEL-1-4a) are integrated into a sin-gle record (one sample from PEL-1-1 at ~630 cal BP with PEL-1-4a),with a total of fifty-one identified taxa being divided, and samplesbeing clustered into seven statistically significant pollen zones spanningthe last 50,000 years (Fig. 5). Poaceae and Asteraceae are themost com-mon and persistent pollen types occurring, with Asteraceae being mostprevalent during periods of the late Pleistocene (particularly from 50 to39 cal kBP and 32–15 cal kBP (thousand calibrated radiocarbon yearsbefore AD 1950)) and grasses – along with certain succulents andwoody elements – becoming more dominant during the Holocene.
4.2.1. Pleistocene vegetation composition and dynamicsThe lowermost pollen zone (PEL-I; ~50–~39 cal kBP) is characterised
by early peaks in Menispermaceae, Olea, Anacardiaceae (incl. Searsia/Rhus-type) and Cyperaceae pollen, followed by a general dominanceof Asteraceae until 42 cal kBP, when it is replaced by consecutivepeaks of Zygophyllum, Anacardiaceae and Cyperaceae pollen (Fig. 5).Trilete psilate spores are also consistently present, and even abundantduring PEL-I. Pollen zonePEL-II (~39–~32 cal kBP) is defined by relative-ly low percentages of Asteraceae pollen, and significant increasesin Anacardiaceae, Dicliptera-type and Scrophulariaceae pollen. Subse-quently, zone PEL-III (~32–~27 cal kBP) is characterised by the disap-pearance of Anacardiacae and Dicliptera-type pollen, the appearanceof Pappea and spikes in Zygophyllum pollen (comprising as much as91% of the pollen assemblage). PEL-IV (~27–~17 cal kBP) is dominated

Fig. 3. Images of the view from the Pella rock hyrax midden site, looking east (A), theoverhang sheltering the midden site (B) and the Pella rock hyrax midden, with PEL-1-1and PEL-1-4a lobes labelled (72 mm camera lens cover for scale) (C).
0 500 1500 2500 3500
−40
−30
−20
Iteration
Log
of O
bjec
tive
0 500 1000 15000.00
00.
002
Acc. rate (yr/cm)
acc.shape: 1.5 acc.mean: 200
0.0 0.2 0.4 0.6 0.8 1.0
01
23
4
Memory
mem.strength: 4mem.mean: 0.745 5cm sections
0 50 100 150 200
010
000
2000
030
000
4000
050
000
Depth (mm)
cal B
P
PEL−1−1
0 1000 3000 5000
−60
−55
−50
−45
−40
Iteration
Log
of O
bjec
tive
0 10 20 30 40 50 600.00
0.04
0.08
Acc. rate (yr/cm)
acc.shape: 1.5acc.mean: 10
0.0 0.2 0.4 0.6 0.8 1.0
01
23
4
Memory
mem.strength: 4mem.mean: 0.729 5cm sections
0 20 40 60 80 100 120 140
050
010
00
Depth (mm)
cal B
P
PEL−1−4a
Fig. 4. Age models for the Pella rock hyrax middens PEL-1-1 and PEL-1-4a.
201S. Lim et al. / Palaeogeography, Palaeoclimatology, Palaeoecology 451 (2016) 197–209
by Asteraceae pollen types. This increase in Asteraceae in PEL-III andPEL-IV is accompanied by the more regular abundance of succulentssuch as Aizoaceae, Aizoon-type and Euphorbia. In PEL-IV, Poaceae pollenbecomes notably less abundant. Menispermaceae pollen declines anddisappears across this period, and more generally, arboreal pollen islargely absent, particularly between ~24–17 cal kBP.
4.2.2. Deglacial and Holocene vegetation composition and dynamicsPollen zone PEL-V, from ~17–6.5 cal kBP, spans the last glacial–inter-
glacial transition (LGIT) and the early Holocene. Beginning at ~14 cal kBP,marked increases in arboreal pollen (particularly Pappea andAnacardiaceae, but also Celastraceae in lower percentages) are apparent,as is a sharp decline in Asteraceae pollen types (Fig. 5). Poaceae pollenpercentages also increase across this zone, reaching amaximumbetween~9.6–6.5 cal kBP. This increase in Poaceae is paralleled by a decline in theaforementioned arboreal taxa, with Anacardiacae being reduced to tracelevels after ~7 cal kBP. Pollen zones PEL-VI and PEL-VII (~6.5–
1.7 cal kBP and ~1.7 cal kBP to present, respectively) are most clearlydefined by significant increases in Heliophila and Forsskaolea pollen.Pappea pollen percentages increase for a short time in early PEL-VI(peaking at ~5.1 cal kBP), but decline again after ~4.5 cal kBP. Poaceaepollen percentages remain high from ~9.6 cal kBP throughout PEL-VIand PEL-VII. PEL-VII is similar to PEL-VI, although of significantly higherresolution (a result of the higher accumulation rates of the PEL-1-4amidden). Notable are increases in Forsskaolea pollen between ~1.5–0.8 cal kBP, followed by its decline, and increases in Zygophyllumpollen after ~0.8 cal kBP and an increase in Scrophulariaceae pollenfrom ~0.5 cal kBP until the end of the sequence.
4.3. Pollen-based climate reconstructions
Reconstructions of temperature from the Pella pollen data indicate apredictable pattern of cooler glacial and warmer interglacial conditions

0
5
10
15
20
25
30
35
40
45
50
Age (c
al kB
P)
Anaca
rdiac
eae
Cappa
race
ae
Celastr
acea
e
Diospy
ros
Men
isper
mac
eae
Mon
tinia
Olea Pappe
aAizo
acea
e
Aizoon
-type
Aloe-ty
pe
Crass
ulaEup
horb
iaZyg
ophy
llum
Astera
ceae
Berkh
eya
Hirpici
um-ty
pe
Pentzi
a-typ
e
Stoeb
e-typ
e
Amar
yllida
ceae
Apocy
nace
ae
Apiace
aeCar
yoph
yllac
eae
Cheno
/Am
aran
th
Cyper
acea
eDicl
ipter
a-typ
e
Ericac
eae
Faba
ceae
Fors
skao
leaHeli
ophil
aHer
man
nia
Justi
cia-ty
pe
Liliac
eae
Petali
dium
Poace
aeRes
tiona
ceae
Rubiac
eae
Scrop
hular
iacea
e
Thym
eleac
eae
Tribu
lusTa
mar
ixW
ahlen
berg
ia
Rham
nace
ae
Uniden
tified
Trile
te p
silat
e
Pollen
conc
entra
tion
Charc
oal c
once
ntra
tion
PolllenZone
PEL-I
PEL-II
PEL-III
PEL-IV
PEL-V
PEL-VI
PEL-VII
Arboreal taxa Succulent taxa Asteraceae family Others
CONISS
20 40 60 20 20 20 40 20 20 20 40 60 80 10 0 20 40 60 80 100 20 20 20 20 20 20 40 20 40 20 20 40 20 20 20 1 32
x106
grains/gram
1 5
x103
particles/gram
4 8 12 16 20
Total sumof squares
%
4 432
Fig. 5. Diagram of pollen percentage and microcharcoal concentration data (5× exaggeration) from the Pella rock hyrax middens PEL-1-1 and PEL-1-4a. Triangles represent 14C dates (PEL-1-1 in blue, PEL-1-4a in orange). (For interpretation of thereferences to colour in this figure legend, the reader is referred to the web version of this article.)
202S.Lim
etal./Palaeogeography,Palaeoclimatology,Palaeoecology
451(2016)
197–209
203S. Lim et al. / Palaeogeography, Palaeoclimatology, Palaeoecology 451 (2016) 197–209
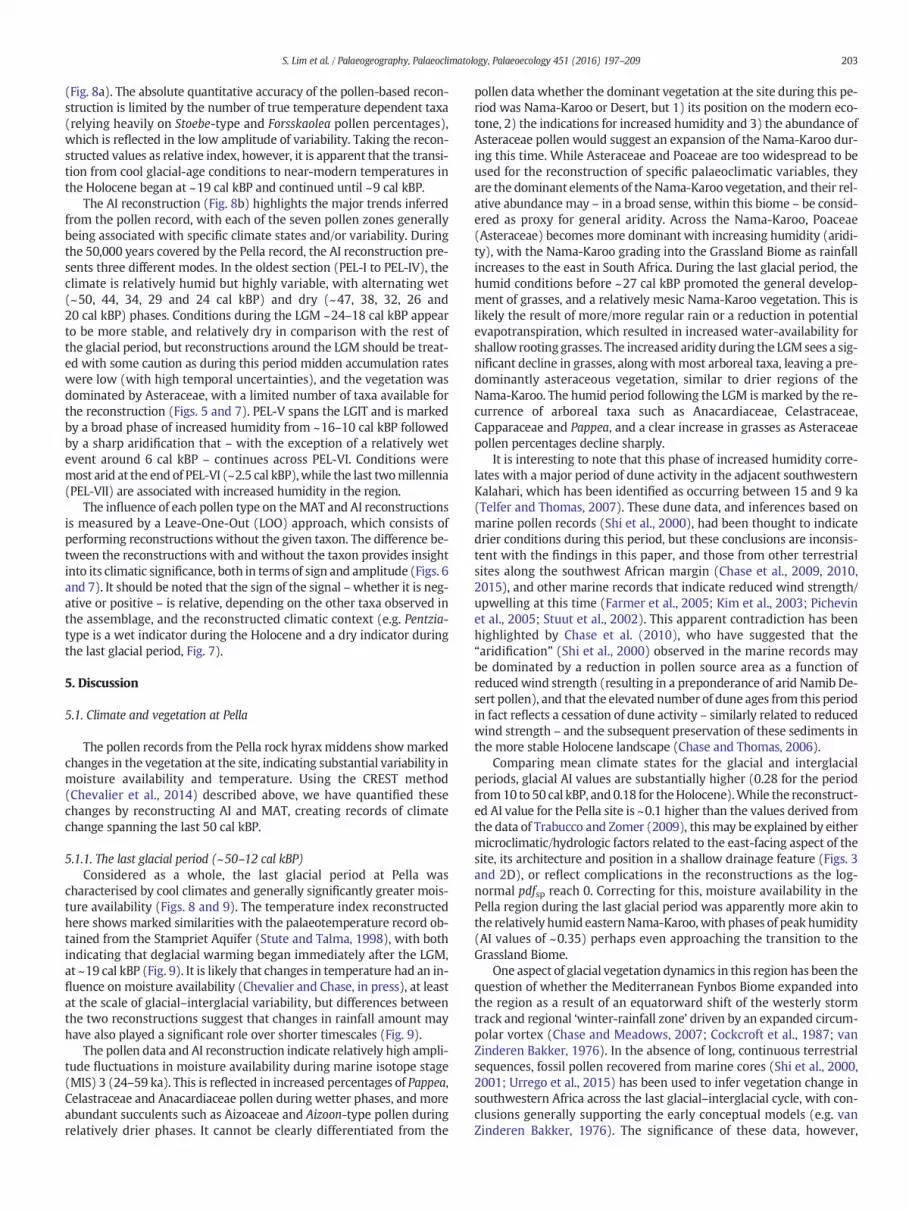
(Fig. 8a). The absolute quantitative accuracy of the pollen-based recon-struction is limited by the number of true temperature dependent taxa(relying heavily on Stoebe-type and Forsskaolea pollen percentages),which is reflected in the low amplitude of variability. Taking the recon-structed values as relative index, however, it is apparent that the transi-tion from cool glacial-age conditions to near-modern temperatures inthe Holocene began at ~19 cal kBP and continued until ~9 cal kBP.
The AI reconstruction (Fig. 8b) highlights the major trends inferredfrom the pollen record, with each of the seven pollen zones generallybeing associated with specific climate states and/or variability. Duringthe 50,000 years covered by the Pella record, the AI reconstruction pre-sents three different modes. In the oldest section (PEL-I to PEL-IV), theclimate is relatively humid but highly variable, with alternating wet(~50, 44, 34, 29 and 24 cal kBP) and dry (~47, 38, 32, 26 and20 cal kBP) phases. Conditions during the LGM ~24–18 cal kBP appearto be more stable, and relatively dry in comparison with the rest ofthe glacial period, but reconstructions around the LGM should be treat-ed with some caution as during this period midden accumulation rateswere low (with high temporal uncertainties), and the vegetation wasdominated by Asteraceae, with a limited number of taxa available forthe reconstruction (Figs. 5 and 7). PEL-V spans the LGIT and is markedby a broad phase of increased humidity from ~16–10 cal kBP followedby a sharp aridification that – with the exception of a relatively wetevent around 6 cal kBP – continues across PEL-VI. Conditions weremost arid at the end of PEL-VI (~2.5 cal kBP), while the last twomillennia(PEL-VII) are associated with increased humidity in the region.
The influence of each pollen type on theMAT and AI reconstructionsis measured by a Leave-One-Out (LOO) approach, which consists ofperforming reconstructions without the given taxon. The difference be-tween the reconstructions with and without the taxon provides insightinto its climatic significance, both in terms of sign and amplitude (Figs. 6and 7). It should be noted that the sign of the signal –whether it is neg-ative or positive – is relative, depending on the other taxa observed inthe assemblage, and the reconstructed climatic context (e.g. Pentzia-type is a wet indicator during the Holocene and a dry indicator duringthe last glacial period, Fig. 7).
5. Discussion
5.1. Climate and vegetation at Pella
The pollen records from the Pella rock hyraxmiddens showmarkedchanges in the vegetation at the site, indicating substantial variability inmoisture availability and temperature. Using the CREST method(Chevalier et al., 2014) described above, we have quantified thesechanges by reconstructing AI and MAT, creating records of climatechange spanning the last 50 cal kBP.
5.1.1. The last glacial period (~50–12 cal kBP)Considered as a whole, the last glacial period at Pella was
characterised by cool climates and generally significantly greater mois-ture availability (Figs. 8 and 9). The temperature index reconstructedhere shows marked similarities with the palaeotemperature record ob-tained from the Stampriet Aquifer (Stute and Talma, 1998), with bothindicating that deglacial warming began immediately after the LGM,at ~19 cal kBP (Fig. 9). It is likely that changes in temperature had an in-fluence on moisture availability (Chevalier and Chase, in press), at leastat the scale of glacial–interglacial variability, but differences betweenthe two reconstructions suggest that changes in rainfall amount mayhave also played a significant role over shorter timescales (Fig. 9).
The pollen data and AI reconstruction indicate relatively high ampli-tude fluctuations in moisture availability during marine isotope stage(MIS) 3 (24–59 ka). This is reflected in increased percentages of Pappea,Celastraceae and Anacardiaceae pollen during wetter phases, and moreabundant succulents such as Aizoaceae and Aizoon-type pollen duringrelatively drier phases. It cannot be clearly differentiated from the
pollen data whether the dominant vegetation at the site during this pe-riod was Nama-Karoo or Desert, but 1) its position on the modern eco-tone, 2) the indications for increased humidity and 3) the abundance ofAsteraceae pollen would suggest an expansion of the Nama-Karoo dur-ing this time. While Asteraceae and Poaceae are too widespread to beused for the reconstruction of specific palaeoclimatic variables, theyare the dominant elements of theNama-Karoo vegetation, and their rel-ative abundance may – in a broad sense, within this biome – be consid-ered as proxy for general aridity. Across the Nama-Karoo, Poaceae(Asteraceae) becomes more dominant with increasing humidity (aridi-ty), with the Nama-Karoo grading into the Grassland Biome as rainfallincreases to the east in South Africa. During the last glacial period, thehumid conditions before ~27 cal kBP promoted the general develop-ment of grasses, and a relatively mesic Nama-Karoo vegetation. This islikely the result of more/more regular rain or a reduction in potentialevapotranspiration, which resulted in increased water-availability forshallow rooting grasses. The increased aridity during the LGM sees a sig-nificant decline in grasses, alongwith most arboreal taxa, leaving a pre-dominantly asteraceous vegetation, similar to drier regions of theNama-Karoo. The humid period following the LGM is marked by the re-currence of arboreal taxa such as Anacardiaceae, Celastraceae,Capparaceae and Pappea, and a clear increase in grasses as Asteraceaepollen percentages decline sharply.
It is interesting to note that this phase of increased humidity corre-lates with a major period of dune activity in the adjacent southwesternKalahari, which has been identified as occurring between 15 and 9 ka(Telfer and Thomas, 2007). These dune data, and inferences based onmarine pollen records (Shi et al., 2000), had been thought to indicatedrier conditions during this period, but these conclusions are inconsis-tent with the findings in this paper, and those from other terrestrialsites along the southwest African margin (Chase et al., 2009, 2010,2015), and other marine records that indicate reduced wind strength/upwelling at this time (Farmer et al., 2005; Kim et al., 2003; Pichevinet al., 2005; Stuut et al., 2002). This apparent contradiction has beenhighlighted by Chase et al. (2010), who have suggested that the“aridification” (Shi et al., 2000) observed in the marine records maybe dominated by a reduction in pollen source area as a function ofreduced wind strength (resulting in a preponderance of arid Namib De-sert pollen), and that the elevated number of dune ages from this periodin fact reflects a cessation of dune activity – similarly related to reducedwind strength – and the subsequent preservation of these sediments inthe more stable Holocene landscape (Chase and Thomas, 2006).
Comparing mean climate states for the glacial and interglacialperiods, glacial AI values are substantially higher (0.28 for the periodfrom10 to 50 cal kBP, and0.18 for theHolocene).While the reconstruct-ed AI value for the Pella site is ~0.1 higher than the values derived fromthe data of Trabucco and Zomer (2009), this may be explained by eithermicroclimatic/hydrologic factors related to the east-facing aspect of thesite, its architecture and position in a shallow drainage feature (Figs. 3and 2D), or reflect complications in the reconstructions as the log-normal pdfsp reach 0. Correcting for this, moisture availability in thePella region during the last glacial period was apparently more akin tothe relatively humid easternNama-Karoo,with phases of peak humidity(AI values of ~0.35) perhaps even approaching the transition to theGrassland Biome.
One aspect of glacial vegetation dynamics in this region has been thequestion of whether the Mediterranean Fynbos Biome expanded intothe region as a result of an equatorward shift of the westerly stormtrack and regional ‘winter-rainfall zone’ driven by an expanded circum-polar vortex (Chase and Meadows, 2007; Cockcroft et al., 1987; vanZinderen Bakker, 1976). In the absence of long, continuous terrestrialsequences, fossil pollen recovered from marine cores (Shi et al., 2000,2001; Urrego et al., 2015) has been used to infer vegetation change insouthwestern Africa across the last glacial–interglacial cycle, with con-clusions generally supporting the early conceptual models (e.g. vanZinderen Bakker, 1976). The significance of these data, however,

Mon
tinia
0.3
Berkh
eya
0.3
Mor
acea
e
0.3
Forss
kaole
a
0.3 0.9
Justi
cia
0.3
Cappa
race
ae
0.3
Crass
ula
0.3
Herm
annia
0.3
Amar
yllida
ceae
0.3
Cal BP
0
100
200
300
400
500
600
700
800
900
1000
1100
1200
1300
Mor
acea
e
0.3
Caryo
phyll
acea
e
0.3
Mon
tinia
0.3 0.9 1.5
Forss
kaole
a
0.3
Justi
cia
0.3
Crass
ula
0.3
Apiace
ae
0.3 0.9
Cappa
race
ae
0.3
Ericac
eae
0.3
Stoeb
e typ
e
0.3
Berkh
eya
0.3
Amar
yllida
ceae
0.3
Cal BP
0
5000
10000
15000
20000
25000
30000
35000
40000
45000
50000
°C
°C
Fig. 6. Results of the leave-one-out cross-validation (LOOCV) analysis of the PEL-1-1 and PEL-1-4a pollen sequences for the temperature reconstructions. The importance of the pollentypes for the reconstruction is indicated by the length of the bars (5× exaggeration), as is their influence in terms of reconstructing colder (blue bars) or warmer conditions (red bars)for a given sample. (For interpretation of the references to colour in this figure legend, the reader is referred to the web version of this article.)
204 S. Lim et al. / Palaeogeography, Palaeoclimatology, Palaeoecology 451 (2016) 197–209
remains a subject of debate, with points of contention relating to: 1) thechoice of taxa that are considered as fynbos indicators, and 2) the ta-phonomy of the pollen sequences.
The Fynbos Biome experiences a predominantly winter rainfallregime and a cool growing season. As such, it is characterised by taxawith affinities for lower temperatures such as Ericaceae, Restionaceae,Proteaceae, Artemisia, Stoebe-type and Passerina. This has led some re-searchers to consider elevated percentages of these taxa in glacial-agesediments from Namibian marine cores as evidence for expansions ofthe Fynbos Biome (Shi et al., 2000, 2001; Urrego et al., 2015). It mustbe kept in mind, however, that these taxa are not restricted to the Fyn-bos Biome. Rather, particularly in the case of Artemisia and Stoebe-type(Stoebe and Elytropappus rhinocerotis) (Urrego et al., 2015), these plantsoccur across southern Africa where there is enough moisture to meettheir requirements, and temperatures during the wet season arebelow 21 °C (Rutherford et al., 2003, 2012; SANBI, 2003; Urrego et al.,2015). A temperature depression of 4–6 °C during the last glacial period,as estimated from regional palaeotemperature records (Chevalier andChase, 2015; Kulongoski and Hilton, 2004; Stute and Talma, 1998;Talma and Vogel, 1992; Truc et al., 2013),would have led to a significantincrease in the prominence and spatial distribution of these taxa, as isindicated in pollen records from across the subcontinent (Coetzee,1967; Scott, 1982b, 1989, 1999; Scott et al., 2012, 2004).
Of the taxa that are considered to be fynbos indicators, Restionaceaeis the closest to being exclusive to the biome. As such, it has beenconsidered to be a key element in determining possible palaeo-expansions of the Fynbos Biome by Shi et al. (2000, 2001). However,Restionaceae are wind pollinated, and data from surface samples indi-cate that it can represent a significant percentage of the total pollenrain far downwind of the plant's distribution (Rutherford et al., 2003,2012; SANBI, 2003). Unlike the pollen assemblages from themarine se-quences, wherein Restionaceae pollen is abundant, Scott et al. (2004)found no pollen of these taxa in similar age hyrax middens from theBrandberg of central Namibia. This discrepancy between terrestrialand marine records led Scott et al. to suggest that the intensification ofthe atmospheric and oceanic circulation systems associated with theBenguela Upwelling System during the last glacial period (cf. Farmeret al., 2005; Little et al., 1997; Pichevin et al., 2005; Stuut et al., 2002)would have increased the long-distant transport of pollen from the Fyn-bos Biome, and that the biome itself did not expand significantly. Whileit could be argued that as the Brandberg is ~1000 km north of the pres-ent limits of the Fynbos Biome, and a significant expansion of the biomemay still have occurred, the data from the Pella middens, as well as thatfrom the Richtersveld mountains to the west (Scott et al., 1995), sug-gests that thiswas not the case. Only ~150 kmnortheast of the northernfynbos remnants in the Kammiesberg mountains, Restionaceae pollen

Aridity Index (x100)
Aridity Index (x100)
Mon
tinia
3
Aizoac
eae
3
Zygop
hyllu
m
3
Rham
nace
ae
3
Aizoon
type
3
Pappe
a
3 9 15
Forss
kaole
a
3 9 15 21
Anaca
rdiac
eae
3 9
Amar
yllida
ceae
3
Pentzi
a typ
e
3
Celastr
acea
e
3
Petali
dium
3 9
Crass
ula
3
Cal BP
0
100
200
300
400
500
600
700
800
900
1000
1100
1200
1300
Petali
dium
3
Caryo
phyll
acea
e
3
Rham
nace
ae
3 9 15
Pappe
a
3 9
Mon
tinia
3
Forss
kaole
a
3 9 15
Celastr
acea
e
3
Anaca
rdiac
eae
3 9
Tribulu
s
3
Apiace
ae
3
Aizoon
type
3 9 15
Aizoac
eae
3 9 15 21
Crass
ula
3
Pentzi
a typ
e
3 9
Zygop
hyllu
m
3 9 15 21
Stoeb
e typ
e
3 9 15
Men
isper
mac
eae
3
Amar
yllida
ceae
3
Cal BP
0
5000
10000
15000
20000
25000
30000
35000
40000
45000
50000
Fig. 7. Results of the leave-one-out cross-validation (LOOCV) analysis of the PEL-1-1 and PEL-1-4a pollen sequences for the Aridity Index reconstructions. The importance of the pollentypes for the reconstruction is indicated by the length of the bars, as is their influence in terms of reconstructing wetter (blue bars) or drier conditions (brown bars) for a givensample. (For interpretation of the references to colour in this figure legend, the reader is referred to the web version of this article.)
205S. Lim et al. / Palaeogeography, Palaeoclimatology, Palaeoecology 451 (2016) 197–209
at Pella never exceeds 1% of the pollen assemblage (Fig. 5). This indi-cates that any expansion of the Fynbos Biome must have been very re-stricted, and that the elevated percentages of ‘fynbos’ pollen observedinmarine coresmore likely reflects: 1) generally cooler continental con-ditions, and 2) an increase in the long-distance transport of pollen withincreased atmospheric and oceanic circulation intensity during the lastglacial period.
5.1.2. The Holocene (12 cal kBP to present)Interestingly, while the vegetation of the last glacial period seems to
be broadly characterised by dynamics predicted for the Nama-KarooBiome, the relationship between climate and key pollen types such asAsteraceae and Poaceae changes fundamentally during the Holocene.The increase in Poaceae pollen and decrease in Asteraceae pollen duringthe period of increased humidity following the LGM (from ~16–10 cal kBP) may be interpreted as an increase in water-availabilityfollowing the above-described model. However, despite the abruptaridification after 10 cal kBP, and the significantly drier conditions ofthe Holocene (observed also at Eksteenfontein in the nearbyRichtersveld (Scott et al., 1995)), Poaceae pollen percentages remainat high level throughout the last 10,000 years. To explain this apparentinconsistency, the full environmental gradient across SouthAfrica needs
to be considered. As mentioned, with increased precipitation eastwardin South Africa the Nama-Karoo becomes increasingly grassy, eventual-ly transitioning into the relatively humidGrassland Biome. To the north-west of the Pella site precipitation declines sharply, and there areinsufficient groundwater resources to support the widespread develop-ment of shrubs such as the Asteraceae that define the arid easternNama-Karoo. As this component of the vegetation disappears, grassesonce more become dominant in the Desert Biome (Fig. 2A), exploitingthe rare rains that do fall.
Considered from this perspective, it appears that the arid conditionsthat began at the beginning of the Holocene resulted in a shift in theDesert — Nama-Karoo ecotone, with the Desert Biome expandingalong the Orange River Valley from its core along the coast. Duringthis period, increases in Asteraceae pollen may indicate slightly morehumid conditions, as indicated by the AI reconstructions, and at leastminor expansions of the Nama-Karoo.
5.2. Palaeoenvironmental history of the southern Namib
Considered in their regional context, results obtained from the Pellahyrax middens shed considerable light on the timing and mechanismsof climate change in the southern Namib Desert during the last

0.09
0.15
0.21
0.27
0.33
0.6 0.9 1.2
0.09
0.21
0.33
0.45
5 10 15 20 25 30 35 40 45
0.15
0.21
0.27
0.33
0.39
0.45
VII VI PEL−V PEL−IV III PEL−II PEL−I
0 5 10 15 20 25 30 35 40 45 50Age (cal kBP)
Arid
ity In
dex
Arid
ity In
dex
Arid
ity In
dex
b
16.5
17.5
18.5
0.6 0.9 1.2
14.5
15.5
16.5
17.5
18.5
5 10 15 20 25 30 35 40 45
14.5
15.5
16.5
17.5
18.5
VII VI PEL−V PEL−IV III PEL−II PEL−I
0 5 10 15 20 25 30 35 40 45 50Age (cal kBP)
Tem
pera
ture
Inde
xTe
mpe
ratu
re In
dex
Tem
pera
ture
Inde
x
a
0 0.3
50 0
0 0.3
50 0
Fig. 8. Reconstruction with 30% and 50% errors of mean annual temperature (TmeanAnn) (a) and aridity (AI) (b) at Pella derived from the PEL-1-1 and PEL-1-4a pollen data using theCREST software package (Chevalier et al., 2014). Black bars indicate the age range of each pollen sample analysed.
206 S. Lim et al. / Palaeogeography, Palaeoclimatology, Palaeoecology 451 (2016) 197–209
50,000 years. Despite the limited amplitude of the temperature recon-struction, as discussed above, the major temperature trends are consis-tent with the data from the nearby Stampriet Aquifer (Stute and Talma,1998). Indications of increased humidity between 32 and 26 cal kBP,25–20 cal kBP and 14–10 cal kBP from fragmentary wetland and lacus-trine sediments from further north and west in the Namib Desert andRichtersveld (Lancaster, 1984, 1986, 2002; Scott et al., 1995; Tellerand Lancaster, 1985, 1986) are generally consistent with phases of in-creased humidity at Pella, with the caveat that such correlations remainduly speculative, in light of the nature of the records and the low reso-lution of the Pella record during the LGM. A key question regardingthese findings is what drove this glacial-age increase in humidity.While such changes are often considered to be the result of increasedrainfall amount, studies fromeastern SouthAfrica have shown that tem-perature may be at least as important as rainfall amount in regulatingwater availability (Chevalier and Chase, in press; Scott and Thackeray,1987; Truc et al., 2013). First order changes across the last50,000 years certainly appear to fit this model, with cool, humid condi-tions during the last glacial period, andwarm, arid conditions during theHolocene.
Environmental variability in the broader region within the lastglacial period has been attributed to direct insolation forcing followingthe precessional cycle. Originating in findings from the Tswaing Crater(Partridge et al., 1997), studies of pollen (Urrego et al., 2015), charcoalconcentrations (Daniau et al., 2013) and leaf-wax δD and δ13C (Collinset al., 2014) from Namibian marine cores have also observed preces-sional cycles in their records, and inferred phases of increased humidity.In comparison, the data from Pella show no such correlation with theprecessional cycle, with, if anything, a tendency for phases of increasedhumidity to occur during phases of reduced insolation (Fig. 9). Thesefindings challenge the assertion that the marine records reflect
continental conditions and climate dynamics, indicating that they eitherreflect conditions in particular subregions, or that taphonomic ratherthan climatic controls are dominant determinants of the observedsignals, as described above.
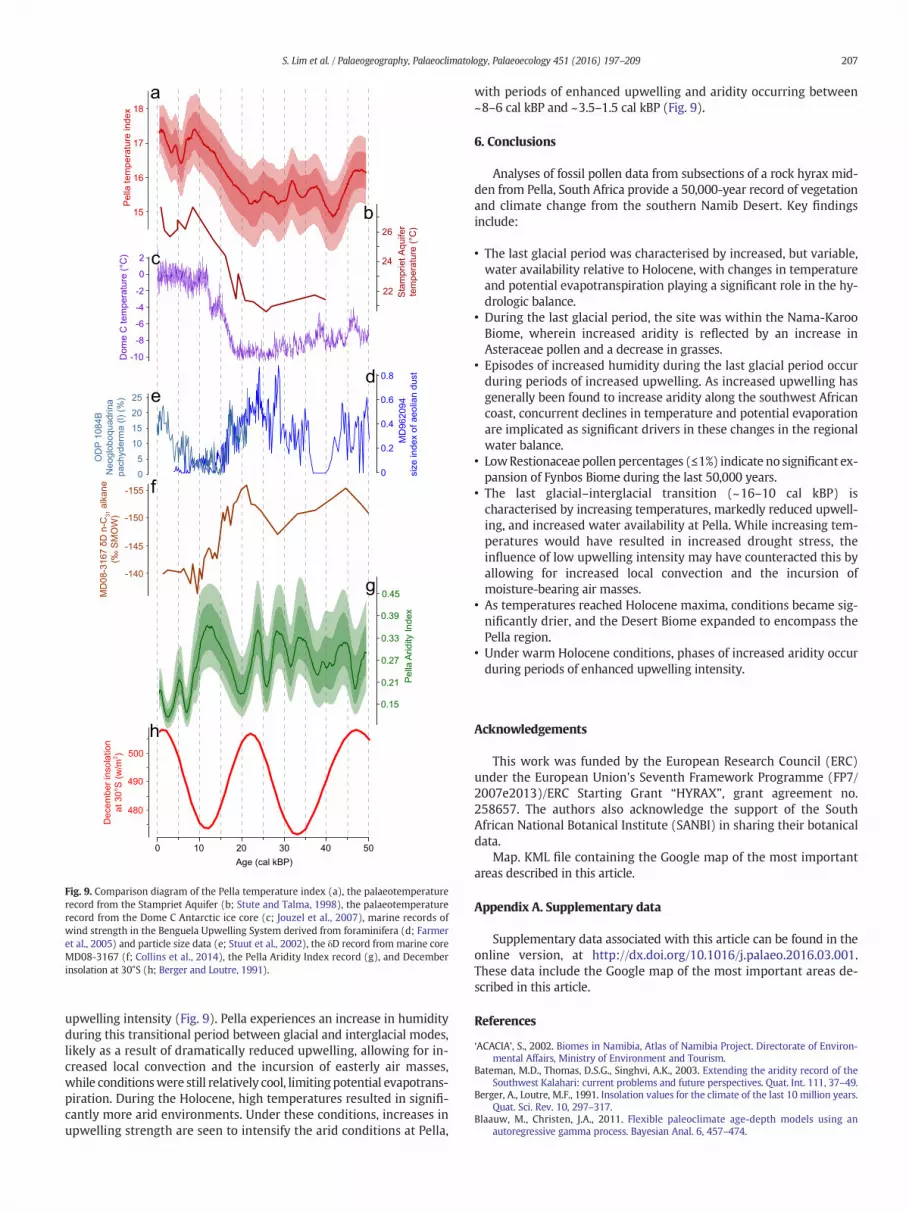
As direct insolation forcing does not adequately account for thesignificant AI variability observed at Pella during either the last glacialperiod or the Holocene, we compare our results with other indicatorsof changes in regional circulation systems. Of these, coastal upwelling,through the suppressed convection and the blocking of moisture-bearing systems from the east, has been shown to be an importantfactor in determining late Quaternary climate change in southwesternAfrica (Chase et al., 2009, 2010). Comparing the Pella data with grainsize analyses of Stuut et al. (2002) and the foraminifera data of Farmeret al. (2005), a complex, but coherent relationship can be observed.Throughout MIS 3 and the LGM (50–~18 cal kBP), phases of increasedhumidity at Pella occur when atmospheric circulation intensity – andthus upwelling – increases (Fig. 9). Of these episodes, those between35 and 50 cal kBP correlate strongly with temperature changes recordin the Antarctic ice core from Dome C (Jouzel et al., 2007), with coolerperiods being characterised by stronger winds (Farmer et al., 2005;Stuut et al., 2002). This relationship between cool conditions andincreased upwelling continues until the beginning of the Holocene, al-though the link appears to be more generalised between 20 and35 cal kBP. As increased upwelling is expected to have an aridifying in-fluence in southwestern Africa, we surmise that either its influence didnot extend this far inland and/or the related changes in temperature re-duced potential evapotranspiration during these periods, counteractingany reductions in precipitation. The period between 16 and 10 cal kBPdeviates from the pattern of humid periods occurring under cooler con-ditions. After 17 ka, the warming recorded at Dome C, the StamprietAquifer and Pella is paralleled by a sharp decrease in Benguela
0Age (cal kBP)
10 20 30 40 50
480
490
500
Dec
embe
r ins
olat
ion
at 3
0°S
(w/m
2 )
h0.15
0.39
0.45
0.33
Pella
Arid
ity In
dex
g
0.27
0.21
-140
-145
-150
MD
08-3
167
δD n
-C31
alk
ane
(‰ S
MO
W)
-155 f0
0.2
0.4
0.6
0.8
MD
9620
94si
ze in
dex
of a
eolia
n du
std
05
101520
OD
P 10
84B
Neo
glob
oqua
drin
apa
chyd
erm
a (l)
(%) 25 e
Dom
e C
tem
pera
ture
(°C
)
-10
2
0
-8
-6
-2
-4
c22
24
26
Stam
prie
t Aqu
ifer
tem
pera
ture
(°C
)
b
18
17
16
15
Pella
tem
pera
ture
inde
x
a
Fig. 9. Comparison diagram of the Pella temperature index (a), the palaeotemperaturerecord from the Stampriet Aquifer (b; Stute and Talma, 1998), the palaeotemperaturerecord from the Dome C Antarctic ice core (c; Jouzel et al., 2007), marine records ofwind strength in the Benguela Upwelling System derived from foraminifera (d; Farmeret al., 2005) and particle size data (e; Stuut et al., 2002), the δD record from marine coreMD08-3167 (f; Collins et al., 2014), the Pella Aridity Index record (g), and Decemberinsolation at 30°S (h; Berger and Loutre, 1991).
207S. Lim et al. / Palaeogeography, Palaeoclimatology, Palaeoecology 451 (2016) 197–209
upwelling intensity (Fig. 9). Pella experiences an increase in humidityduring this transitional period between glacial and interglacial modes,likely as a result of dramatically reduced upwelling, allowing for in-creased local convection and the incursion of easterly air masses,while conditionswere still relatively cool, limitingpotential evapotrans-piration. During the Holocene, high temperatures resulted in signifi-cantly more arid environments. Under these conditions, increases inupwelling strength are seen to intensify the arid conditions at Pella,
with periods of enhanced upwelling and aridity occurring between~8–6 cal kBP and ~3.5–1.5 cal kBP (Fig. 9).
6. Conclusions
Analyses of fossil pollen data from subsections of a rock hyrax mid-den from Pella, South Africa provide a 50,000-year record of vegetationand climate change from the southern Namib Desert. Key findingsinclude:
• The last glacial period was characterised by increased, but variable,water availability relative to Holocene, with changes in temperatureand potential evapotranspiration playing a significant role in the hy-drologic balance.
• During the last glacial period, the site was within the Nama-KarooBiome, wherein increased aridity is reflected by an increase inAsteraceae pollen and a decrease in grasses.
• Episodes of increased humidity during the last glacial period occurduring periods of increased upwelling. As increased upwelling hasgenerally been found to increase aridity along the southwest Africancoast, concurrent declines in temperature and potential evaporationare implicated as significant drivers in these changes in the regionalwater balance.
• LowRestionaceaepollen percentages (≤1%) indicate no significant ex-pansion of Fynbos Biome during the last 50,000 years.
• The last glacial–interglacial transition (~16–10 cal kBP) ischaracterised by increasing temperatures, markedly reduced upwell-ing, and increased water availability at Pella. While increasing tem-peratures would have resulted in increased drought stress, theinfluence of low upwelling intensity may have counteracted this byallowing for increased local convection and the incursion ofmoisture-bearing air masses.
• As temperatures reached Holocene maxima, conditions became sig-nificantly drier, and the Desert Biome expanded to encompass thePella region.
• Under warm Holocene conditions, phases of increased aridity occurduring periods of enhanced upwelling intensity.
Acknowledgements
This work was funded by the European Research Council (ERC)under the European Union's Seventh Framework Programme (FP7/2007e2013)/ERC Starting Grant “HYRAX”, grant agreement no.258657. The authors also acknowledge the support of the SouthAfrican National Botanical Institute (SANBI) in sharing their botanicaldata.
Map. KML file containing the Google map of the most importantareas described in this article.
Appendix A. Supplementary data
Supplementary data associated with this article can be found in theonline version, at http://dx.doi.org/10.1016/j.palaeo.2016.03.001.These data include the Google map of the most important areas de-scribed in this article.
References
‘ACACIA’, S., 2002. Biomes in Namibia, Atlas of Namibia Project. Directorate of Environ-mental Affairs, Ministry of Environment and Tourism.
Bateman, M.D., Thomas, D.S.G., Singhvi, A.K., 2003. Extending the aridity record of theSouthwest Kalahari: current problems and future perspectives. Quat. Int. 111, 37–49.
Berger, A., Loutre, M.F., 1991. Insolation values for the climate of the last 10 million years.Quat. Sci. Rev. 10, 297–317.
Blaauw, M., Christen, J.A., 2011. Flexible paleoclimate age-depth models using anautoregressive gamma process. Bayesian Anal. 6, 457–474.

208 S. Lim et al. / Palaeogeography, Palaeoclimatology, Palaeoecology 451 (2016) 197–209
Blümel, W.D., Eitel, B., Lang, A., 1998. Dunes in Southeastern Namibia: evidence for Holo-cene environmental changes in the southwestern Kalahari based on thermolumines-cence data. Palaeogeogr. Palaeoclimatol. Palaeoecol. 138, 139–149.
Blumel, W.D., Huser, K., Eitel, B., 2000. Climatic change and landscape development in theNamib Desert. Landschaftsveranderungen in der Namib. Geogr. Rundsch. 52, 17–23.
Bourke, M.C., Child, A., Stokes, S., 2003. Optical age estimates for hyper-arid fluvial de-posits at Homeb, Namibia. Quat. Sci. Rev. 22, 1099–1103.
Bristow, C.S., Duller, G.A.T., Lancaster, N., 2007. Age and dynamics of linear dunes in theNamib Desert. Geology 35, 555–558.
Butzer, K.W., 1984. Late Quaternary environments in South Africa. In: Vogel, J.C. (Ed.),Late Cainozoic Palaeoclimates of the Southern Hemisphere. Proc. SASQUA Sympo-sium, Swaziland, 1983. Balkema, pp. 235–264.
Butzer, K.W., Stuckenrath, R., Bruzewicz, A.J., Helgren, D.M., 1978. Late Cenozoicpaleoclimates of the Gaap Escarpment, Kalahari margin, South Africa. Quat. Res. 10,310–339.
Chase, B., 2009. Evaluating the use of dune sediments as a proxy for palaeo-aridity: aSouthern African case study. Earth Sci. Rev. 93, 31–45.
Chase, B.M., Brewer, S., 2009. Last glacial maximum dune activity in the Kalahari Desert ofsouthern Africa: observations and simulations. Quat. Sci. Rev. 28, 301–307.
Chase, B.M., Meadows, M.E., 2007. Late Quaternary dynamics of southern Africa's winterrainfall zone. Earth Sci. Rev. 84, 103–138.
Chase, B.M., Thomas, D.S.G., 2006. Late Quaternary dune accumulation along the westernmargin of South Africa: distinguishing forcing mechanisms through the analysis ofmigratory dune forms. Earth Planet. Sci. Lett. 251, 318–333.
Chase, B.M., Thomas, D.S.G., 2007. Multiphase late Quaternary aeolian sediment accumu-lation inWestern South Africa: timing and relationship to palaeoclimatic changes in-ferred from the marine record. Quat. Int. 166, 29–41.
Chase, B.M., Meadows, M.E., Scott, L., Thomas, D.S.G., Marais, E., Sealy, J., Reimer, P.J., 2009.A record of rapid Holocene climate change preserved in hyrax middens from south-western Africa. Geology 37, 703–706.
Chase, B.M., Meadows, M.E., Carr, A.S., Reimer, P.J., 2010. Evidence for progressive Holo-cene aridification in southern Africa recorded in Namibian hyrax middens: implica-tions for African monsoon dynamics and the “African humid period”. Quat. Res. 74,36–45.
Chase, B.M., Scott, L., Meadows, M.E., Gil-Romera, G., Boom, A., Carr, A.S., Reimer, P.J., Truc,L., Valsecchi, V., Quick, L.J., 2012. Rock hyrax middens: a palaeoenvironmental archivefor southern African drylands. Quat. Sci. Rev. 56, 107–125.
Chase, B.M., Boom, A., Carr, A.S., Carré, M., Chevalier, M., Meadows, M.E., Pedro, J.B., Stager,J.C., Reimer, P.J., 2015. Evolving southwest African response to abrupt deglacial NorthAtlantic climate change events. Quat. Sci. Rev. 121, 132–136.
Chevalier, M., Chase, B.M., 2015. Southeast African records reveal a coherent shift fromhigh- to low-latitude forcing mechanisms along the east African margin across lastglacial–interglacial transition. Quat. Sci. Rev. 125, 117–130.
Chevalier, M., Chase, B.M., 2016. Determining the drivers of long-term aridity variabilityin Southern Africa. J. Quat. Sci. http://dx.doi.org/10.1002/jqs.2850 (in press).
Chevalier, M., Cheddadi, R., Chase, B.M., 2014. CREST (Climate REconstruction SofTware):a probability density function (pdf)-based quantitative climate reconstruction meth-od. Clim. Past 10, 2081–2098.
Clark, J.S., 1988. Stratigraphic charcoal analysis on petrographic thin section: applicationto fire history in Northwestern Minnesota. Quat. Res. 30, 81–91.
Cockcroft, M.J., Wilkinson, M.J., Tyson, P.D., 1987. The application of a present-day climaticmodel to the late Quaternary in southern Africa. Clim. Chang. 10, 161–181.
Coetzee, J.A., 1967. Pollen analytical studies in east and southern Africa. Palaeoecol. Afr. 3,1–146.
Collins, J.A., Schefuß, E., Heslop, D., Mulitza, S., Prange, M., Zabel, M., Tjallingii, R., Dokken,T.M., Huang, E., Mackensen, A., Schulz, M., Tian, J., Zarriess, M., Wefer, G., 2011. Inter-hemispheric symmetry of the tropical African rainbelt over the past 23,000 years.Nat. Geosci. 4, 42–45.
Collins, J.A., Schefuß, E., Govin, A., Mulitza, S., Tiedemann, R., 2014. Insolation and glacial–interglacial control on southwestern African hydroclimate over the past140000 years. Earth Planet. Sci. Lett. 398, 1–10.
Cooke, H.J., Heine, K., 1979. Radiocarbon chronology of late Quaternary lakes in theKalahari, southern Africa: a discussion. Catena 6, 107.
Daniau, A.-L., Sánchez Goñi, M.F., Martinez, P., Urrego, D.H., Bout-Roumazeilles, V.,Desprat, S., Marlon, J.R., 2013. Orbital-scale climate forcing of grassland burning insouthern Africa. Proc. Natl. Acad. Sci. 110, 5069–5073.
Deacon, J., Lancaster, N., 1988. Late Quaternary Palaeoenvironments of Southern Africa.Clarendon Press, Oxford.
Eitel, B., Zöller, L., 1996. Soils and sediments in the basin of Dieprivier-Uitskot (KhorixasDistrict, Namibia): age, geomorphic and sedimentological investigation,palaeoclimatic interpretation. Palaeoecol. Afr. 24, 159–172.
Eitel, B., Blümel, W.D., Hüser, K., 2002. Environmental transitions between 22 ka and 8 kainmonsoonally influenced Namibia: a preliminary chronology. Z. Geomorphol. Suppl.126, 31–57.
Farmer, E.C., deMenocal, P.B., Marchitto, T.M., 2005. Holocene and deglacial oceantemperature variability in the Benguela upwelling region: implications for low-latitude atmospheric circulation. Paleoceanography 20. http://dx.doi.org/10.1029/2004PA001049.
Gil-Romera, G., Scott, L., Marais, E., Brook, G.A., 2006. Middle- to late-Holocene moisturechanges in the desert of Northwest Namibia derived from fossil hyrax dung pollen.The Holocene 16, 1073–1084.
Gil-Romera, G., Scott, L., Marais, E., Brook, G.A., 2007. Late Holocene environmentalchange in the northwestern Namib desert margin: new fossil pollen evidence fromhyrax middens. Palaeogeogr. Palaeoclimatol. Palaeoecol. 249, 1–17.
Gingele, F.X., 1996. Holocene climatic optimum in Southwest Africa: evidence from themarine clay mineral record. Palaeogeogr. Palaeoclimatol. Palaeoecol. 122, 77–87.
Grimm, E.C., 2011. Tilia version 1.7.16.Heine, K., 1978. Radiocarbon chronology of the late Quaternary lakes in the Kalahari. Ca-
tena 5, 145–149.Heine, K., 1982. The main stages of the late Quaternary evolution of the Kalahari region,
southern Africa. Palaeoecol. Afr. 15, 53–76.Heine, K., 2004. Little Ice Age climatic fluctuations in the Namib Desert, Namibia, and ad-
jacent areas: evidence of exceptionally large floods from slack water deposits and de-sert soil sequences. Paleoecol. Quat. Drylands 137–165.
Heine, K., Heine, J.T., 2002. A paleohydrologic reinterpretation of theHomeb Silts, Kuiseb River,Central Namib Desert (Namibia) and paleoclimatic implications. Catena 48, 107–130.
Heine, K., Völkel, J., 2009. Desert flash flood series— slackwater deposits and floodouts inNamibia: their significance for palaeoclimatic reconstructions. Zbl. Geol. Paläontol.Teil I 2007, 287–308.
Hijmans, R., Cameron, S.E., Parra, J.L., Jones, P.G., Jarvis, A., 2005. Very high resolution in-terpolated climate surfaces for global land areas. Int. J. Climatol. 25, 1965–1978.
Hogg, A.G., Hua, Q., Blackwell, P.G., Niu,M., Buck, C.E., Guilderson, T.P., Heaton, T.J., Palmer,J.G., Reimer, P.J., Reimer, R.W., Turney, C.S.M., Zimmerman, S.R.H., 2013. SHCal13Southern Hemisphere Calibration, 0–50,000 Years Cal BP.
Jouzel, J., Masson-Delmotte, V., Cattani, O., Dreyfus, G., Falourd, S., Hoffmann, G., Minster,B., Nouet, J., Barnola, J.M., Chappellaz, J., Fischer, H., Gallet, J.C., Johnsen, S.,Leuenberger, M., Loulergue, L., Luethi, D., Oerter, H., Parrenin, F., Raisbeck, G.,Raynaud, D., Schilt, A., Schwander, J., Selmo, E., Souchez, R., Spahni, R., Stauffer, B.,Steffensen, J.P., Stenni, B., Stocker, T.F., Tison, J.L., Werner, M., Wolff, E.W., 2007. Orbit-al and millennial Antarctic climate variability over the past 800,000 years. Science317, 793–797.
Juggins, S., Simpson, G.L., Telford, R.J., 2015. Taxon selection using statistical learning tech-niques to improve transfer function prediction. The Holocene 25, 130–136.
Kim, J.-H., Schneider, R.R., Mulitza, S., Müller, P.J., 2003. Reconstruction of SE trade-windintensity based on sea-surface temperature gradients in the Southeast Atlantic overthe last 25 kyr. Geophys. Res. Lett. 30, 2144.
Kulongoski, J.T., Hilton, D.R., 2004. Climate variability in the Botswana Kalahari from thelate Pleistocene to the present day. Geophys. Res. Lett. 31.
Lancaster, N., 1979. Evidence for a widespread Late Pleistocene humid period in theKalahari. Nature 279, 145–146.
Lancaster, N., 1984. Paleoenvironments in the Tsondab Valley, Central Namib Desert.Palaeoecol. Afr. 16, 411–419.
Lancaster, N., 1986. Pans in the southwestern Kalahari: a preliminary report. Palaeoecol.Afr. 17, 59–67.
Lancaster, N., 2002. How dry was dry?: late Pleistocene palaeoclimates in the Namib De-sert. Quat. Sci. Rev. 21, 769–782.
Lancaster, N., Teller, J.T., 1988. Interdune deposits of the Namib Sand Sea. Sediment. Geol.55, 91–107.
Lewis, S.C., LeGrande, A.N., Kelley, M., Schmidt, G.A., 2010. Water vapour source impactson oxygen isotope variability in tropical precipitation during Heinrich events. Clim.Past 6, 325–343.
Little, M.G., Schneider, R.R., Kroon, D., Price, B., Bickert, T., Wefer, G., 1997. Rapidpalaeoceanographic changes in the Benguela upwelling system for the last160,000 years as indicated by abundances of planktonic foraminifera. Palaeogeogr.Palaeoclimatol. Palaeoecol. 130, 135–161.
Mooney, S.D., Tinner, W., 2011. The analysis of charcoal in peat and organic sediments.Mires and Peat 7, 1–18.
Moore, P.D., Webb, J.A., Collinson, M.E., 1991. Pollen Analysis. Blackwell Scientific Publica-tions, London.
Mucina, L., Rutherford, M.C., 2006a. The Vegetation of South Africa, Lesotho andSwaziland. South African National Biodiversity Institute, Pretoria.
Mucina, L., Rutherford, M.C., 2006b. The Vegetation of South Africa, Lesotho andSwaziland, Strelitzia. South African National Biodiversity Institute, Pretoria.
Partridge, T.C., deMenocal, P.B., Lorentz, S.A., Paiker, M.J., Vogel, J.C., 1997. Orbital forcingof climate over South Africa: a 200,000-year rainfall record from the Pretoria saltpan.Quat. Sci. Rev. 16, 1125–1133.
Patterson, W.A., Edwards, K.J., Maguire, D.J., 1987. Microscopic charcoal as a fossil indica-tor of fire. Quat. Sci. Rev. 6, 3–23.
Pichevin, L., Cremer, M., Giraudeau, J., Bertrand, P., 2005. A 190 kyr record of lithogenicgrain-size on the Namibian slope: forging a tight link between past wind-strengthand coastal upwelling dynamics. Mar. Geol. 218, 81–96.
Reimer, P.J., Bard, E., Bayliss, A., Beck, J.W., Blackwell, P.G., Bronk Ramsey, C., Grootes, P.M.,Guilderson, T.P., Haflidason, H., Hajdas, I., Hatté, C., Heaton, T.J., Hoffmann, D.L., Hogg,A.G., Hughen, K.A., Kaiser, K.F., Kromer, B., Manning, S.W., Niu, M., Reimer, R.W.,Richards, D.A., Scott, E.M., Southon, J.R., Staff, R.A., Turney, C.S.M., van der Plicht, J.,2013. IntCal13 andMarine13 Radiocarbon Age Calibration Curves 0–50,000 Years CalBP.
Rommerskirchen, F., Eglinton, G., Dupont, L., Güntner, U., Wenzel, C., Rullkötter, J., 2003. Anorth to south transect of Holocene southeast Atlantic continental margin sediments:Relationship between aerosol transport and compound-specific δ13C land plant bio-marker and pollen records. Geochem. Geophys. Geosyst. 4, 1101.
Rutherford, M.C., Powrie, L.W., Midgley, G.F., 2003. ACKDAT: a digital spatial database ofdistributions of south African plant species and species assemblages. S. Afr. J. Bot.69, 99–104.
Rutherford, M.C., Mucina, L., Powrie, L.W., 2012. The South African National VegetationDatabase: history, development, applications, problems and future. S. Afr. J. Sci. 108.
SANBI, 2003. PRECIS (National Herbarium Pretoria (PRE) Computerized Information Sys-tem) Database.
Schefuß, E., Kuhlmann, H., Mollenhauer, G., Prange, M., Patzold, J., 2011. Forcing of wetphases in southeast Africa over the past 17,000 years. Nature 480, 509–512.
Scott, L., 1982a. Late Quaternary fossil pollen grains from the Transvaal, South Africa. Rev.Palaeobot. Palynol. 36, 241–278.

209S. Lim et al. / Palaeogeography, Palaeoclimatology, Palaeoecology 451 (2016) 197–209
Scott, L., 1982b. Pollen analyses of late Cainozoic deposits in the Transvaal, South Africa,and their bearing on palaeoclimates (Sterkfontein). Palaeoecol. Afr. 15, 101–107.
Scott, L., 1989. Climatic conditions in Southern Africa since the Last Glacial Maximum,inferred from pollen analysis. Palaeogeogr. Palaeoclimatol. Palaeoecol. 70, 345–353.
Scott, L., 1996. Palynology of hyrax middens: 2000 years of palaeoenvironmental historyin Namibia. Quat. Int. 33, 73–79.
Scott, L., 1999. Vegetation history and climate in the Savanna biome South Africa since190,000 ka: a comparison of pollen data from the Tswaing Crater (the PretoriaSaltpan) and Wonderkrater. Quat. Int. 57-8, 215–223.
Scott, L., Thackeray, J.F., 1987. Multivariate analysis of Late Pleistocene and Holocenepollen spectra from Wonderkrater, Transvaal, South Africa. S. Afr. J. Sci. 83, 93–98.
Scott, L., Cooremans, B., de Wet, J.S., Vogel, J.C., 1991. Holocene environmental changes inNamibia inferred from pollen analysis of swamp and lake deposits. The Holocene 1,8–13.
Scott, L., Steenkamp, M., Beaumont, P.B., 1995. Palaeoenvironmental conditions in SouthAfrica at the Pleistocene–Holocene transition. Quat. Sci. Rev. 14, 937–947.
Scott, L., Marais, E., Brook, G.A., 2004. Fossil hyrax dung and evidence of Late Pleistoceneand Holocene vegetation types in the Namib Desert. J. Quat. Sci. 19, 829–832.
Scott, L., Neumann, F.H., Brook, G.A., Bousman, C.B., Norström, E., Metwally, A.A., 2012.Terrestrial fossil-pollen evidence of climate change during the last 26 thousandyears in southern Africa. Quat. Sci. Rev. 32, 100–118.
Shi, N., Dupont, L.M., 1997. Vegetation and climatic history of southwest Africa: amarine palynological record of the last 300,000 years. Veg. Hist. Archaeobot. 6,117–131.
Shi, N., Dupont, L.M., Beug, H.-J., Schneider, R., 1998. Vegetation and climate changesduring the last 21 000 years in SW Africa based on a marine pollen record. Veg.Hist. Archaeobot. 7, 127–140.
Shi, N., Dupont, L.M., Beug, H.-J., Schneider, R., 2000. Correlation between vegetation in south-western Africa and oceanic upwelling in the past 21,000 years. Quat. Res. 54, 72–80.
Shi, N., Schneider, R., Beug, H.-J., Dupont, L.M., 2001. Southeast trade wind variationsduring the last 135 kyr: evidence from pollen spectra in eastern south Atlantic sedi-ments. Earth Planet. Sci. Lett. 187, 311–321.
Slota, P.J., Jull, A.J.T., Linick, T.W., Toolin, L.J., 1987. Preparation of small samples for 14C ac-celerator targets by catalytic reduction of CO. Radiocarbon 29, 303–306.
Srivastava, P., Brook, G.A., Marais, E., Morthekai, P., Singhvi, A.K., 2006. Depositional envi-ronment and OSL chronology of the Homeb silt deposits, Kuiseb River, Namibia. Quat.Res. 65, 478–491.
Stockmarr, J., 1971. Tablets with spores used in absolute pollen analysis. Pollen Spores 13,614–621.
Stokes, S., Thomas, D.S.G., Shaw, P.A., 1997. New chronological evidence for the natureand timing of linear dune development in the Southwest Kalahari Desert. Geomor-phology 20, 81–93.
Stone, A.E.C., Thomas, D.S.G., 2008. Linear dune accumulation chronologies from thesouthwest Kalahari, Namibia: challenges of reconstructing late Quaternarypalaeoenvironments from aeolian landforms. Quat. Sci. Rev. 27, 1667–1681.
Stone, A.E.C., Thomas, D.S.G., Viles, H.A., 2010. Late Quaternary palaeohydrological chang-es in the Northern Namib Sand Sea: new chronologies using OSL dating of interdigi-tated aeolian and water-lain interdune deposits. Palaeogeogr. Palaeoclimatol.Palaeoecol. 288, 35–53.
Stute, M., Talma, A.S., 1997. Isotope techniques in the study of past and current environ-mental changes in the hydrosphere and the atmosphere. IAEA Vienna Symposium1997, Isotopic Techniques in the Study of Environmental Change. International Atom-ic Energy Agency, Vienna, pp. 307–318.
Stute, M., Talma, A.S., 1998. Glacial temperatures and moisture transport regimes recon-structed from noble gas and δ18O, Stampriet aquifer, Namibia, isotope techniques inthe study of past and current environmental changes in the hydrosphere and the at-mosphere. IAEA Vienna Symposium 1997, Vienna, pp. 307–328.
Stuut, J.-B.W., Prins, M.A., Schneider, R.R., Weltje, G.J., Jansen, J.H.F., Postma, G., 2002. A300 kyr record of aridity and wind strength in southwestern Africa: inferencesfrom grain-size distributions of sediments on Walvis Ridge, SE Atlantic. Mar. Geol.180, 221–233.
Talma, A.S., Vogel, J.C., 1992. Late Quaternary paleotemperatures derived from aspeleothem from Cango Caves, Cape Province, South Africa. Quat. Res. 37, 203–213.
Telfer, M., 2007. Late Quaternary Aeolian Activity and Palaeoenvironments of the South-western Kalahari: Advances from an Intensive Chronometric Investigation atWitpan,South Africa, School of Geography. University of Oxford, Oxford.
Telfer, M.W., Thomas, D.S.G., 2007. Late Quaternary linear dune accumulation andchronostratigraphy of the southwestern Kalahari: implications for aeolianpalaeoclimatic reconstructions and predictions of future dynamics. Quat. Sci. Rev.26, 2617–2630.
Teller, J.T., Lancaster, N., 1985. History of sediments at Khommabes, Central Namib Desert.Modoqua 14, 267–278.
Teller, J.T., Lancaster, N., 1986. Lacustrine sediments at Narabeb in the Central NamibDesert, Namibia. Palaeogeogr. Palaeoclimatol. Palaeoecol. 56, 177–195.
Teller, J.T., Rutter, N., Lancaster, N., 1990. Sedimentology and paleohydrology of lateQuaternary lake deposits in the Northern Namib Sand Sea, Namibia. Quat. Sci. Rev.9, 343–364.
Thomas, D.S.G., 2013. Reconstructing paleoenvironments and palaeoclimates in drylands:what can landform analysis contribute? Earth Surf. Process. Landf. 38, 3–16.
Thomas, D.S.G., Burrough, S.L., 2012. Interpreting geoproxies of late Quaternary climatechange in African drylands: implications for understanding environmental changeand early human behaviour. Quat. Int. 253, 5–17.
Thomas, D.S.G., Stokes, S., Shaw, P.A., 1997. Holocene aeolian activity in the SouthwesternKalahari Desert, Southern Africa: significance and relationships to late-Pleistocenedune-building events. The Holocene 7, 273–281.
Thomas, D.S.G., Stokes, S., O'Connor, P.W., 1998. Late Quaternary aridity in the Southwest-ern Kalahari Desert: new contributions from OSL dating of aeolian deposits, NorthernCape Province, South Africa. In: Alsharhan, A.S., Glennie, K.W., Whittle, G.L., Kendall,C.G.S.C. (Eds.), Quaternary Deserts and Climatic Change. Balkema, Rotterdam.
Thomas, D.S.G., Bailey, R., Shaw, P.A., Durcan, J.A., Singarayer, J.S., 2009. Late Quaternaryhighstands at Lake Chilwa, Malawi: frequency, timing and possible forcing mecha-nisms in the last 44 ka. Quat. Sci. Rev. 28, 526–539.
Trabucco, A., Zomer, R.J., 2009. Global Aridity Index (Global-Aridity) and Global PotentialEvapo-Transpiration (Global-PET) Geospatial Database. In: Information, C.C.f.S. (Ed.),CGIAR-CSI GeoPortal (http://www.csi.cgiar.org).
Truc, L., Chevalier, M., Favier, C., Cheddadi, R., Meadows, M.E., Scott, L., Carr, A.S., Smith,G.F., Chase, B.M., 2013. Quantification of climate change for the last 20,000 yearsfromWonderkrater, South Africa: implications for the long-term dynamics of the In-tertropical Convergence Zone. Palaeogeogr. Palaeoclimatol. Palaeoecol. 386, 575–587.
Urrego, D.H., Sánchez Goñi, M.F., Daniau, A.L., Lechevrel, S., Hanquiez, V., 2015. Increasedaridity in southwestern Africa during the warmest periods of the last interglacial.Clim. Past 11, 1417–1431.
van Zinderen Bakker, E.M., 1953. South African Pollen Grains and Spores. Part I. Balkema,Amsterdam/Cape Town.
van Zinderen Bakker, E.M., 1956. South African Pollen Grains and Spores. Part II. Balkema,Amsterdam/Cape Town.
van Zinderen Bakker, E.M., 1976. The evolution of late Quaternary paleoclimates of South-ern Africa. Palaeoecol. Afr. 9, 160–202.
van Zinderen Bakker, E.M., Coetzee, J.A., 1959. South African Pollen Grains and Spores.Part III. Balkema, Amsterdam/Cape Town.
Vogel, J.C., 1982. The age of the Kuiseb river silt terrace at Homeb (Namibia). Palaeoecol.Afr. 15, 201–209.
Wang, Y.V., Larsen, T., Leduc, G., Andersen, N., Blanz, T., Schneider, R.R., 2013. What doesleaf wax δD from a mixed C3/C4 vegetation region tell us? Geochim. Cosmochim.Acta 111, 128–139.
Ward, J.D., 1984. A reappraisal of the Cenozoic stratigraphy in the Kuiseb Valley of theCentral Namib Desert. In: Vogel, J.C. (Ed.), Late Cainozoic Palaeoclimates of the South-ern Hemisphere. A.A. Balkema, Rotterdam, pp. 455–463.
Weldeab, S., Stuut, J.B.W., Schneider, R.R., Siebel, W., 2013. Holocene climate variability inthe winter rainfall zone of South Africa. Clim. Past 9, 2347–2364.


