Embed Size (px)
Citation preview

101
7 Routine prescribing data
MARION BENNIE AND IAIN BISHOP
This chapter describes the data which is routinely collected within primary and secondary NHS care settings. The different sources of this data, its strengths, limitations and uses are critically reviewed. The chapter concludes with a look to the future.
BackgroundNearly all patients treated within the National Health Service (NHS) receive medicines as part of their therapy. Medicines have under-pinned the development of modern healthcare and it is estimated that 15–20% of the total NHS budget is spent on medicines. It is therefore critical that we have systems to understand how we are using medicines in the NHS and ultimately what health gain is achieved. This chapter will examine primary care and hospital prescribing; outline the current tools available, their uses, benefi ts and limitations and end with a view to the future.
Primary care prescribing informationPrescribing information can come in a number of different forms, depending on the source of the information, the processing authority, and the format in which it is presented. This chapter aims to describe the array of prescribing information available and its potential uses. However, before progressing any further it is important to make

USING MEDICINES INFORMATION
102
the distinction between prescribing information and prescribing statistics.
Prescribing statisticsPrescribing statistics are published on behalf of each of the home countries’ parliaments and are collated fi gures covering the country as a total. They provide information broken down by cost and volume for each British National Formulary (BNF) chapter. Sites providing prescribing statistics are listed below.
http://www.publications.doh.gov.uk/prescriptionstatistics/ ■
http://www.isdscotland.org/isd/info3.jsp?pContentID=1041&p_ ■
applic=CCC&p_service=Content.show&http://www.wales.nhs.uk/sites3/page.cfm?orgid=428&pid= ■
13533http://www.centralservicesagency.com/display/statistics ■
Prescribing informationPrescribing information could be described as prescribing statistics provided at a more detailed level, suffi cient to analyse the prescribing patterns of individual prescribers, or groups of prescribers. It can also be provided in small enough aliquots, e.g. monthly, to provide analyses of change over time as well as comparisons in single time periods. It is the availability and uses of this type of prescribing information that form the focus of this chapter. It is important to note at this point that health services have responsibilities under both the Freedom of Information Act and the Data Protection Act that informs data access for different users.
Data sourcesThe data which enables the production of primary care prescribing information is generated as a by-product of the processing of prescrip-tions, for the purpose of reimbursing the costs of drugs which have been dispensed by community pharmacists, dispensing doctors and appliance suppliers. These prescriptions will have been written by any of the currently acceptable prescriber types, e.g. general practitioner (GP), nurse prescriber, community pharmacist prescriber (see also Chapter 10); or by authorised secondary care prescribers on specifi c prescription forms, which can be dispensed in the community, e.g. HBP prescriptions in Scotland.
The monthly processing and pricing of prescriptions is carried out by the relevant processing body as listed below.

ROUTINE PRESCRIBING DATA
103
England: Prescription Pricing Division (PPD) ( ■ http://www.ppa.org.uk/ppa/ppa_main.htm)Wales: Prescribing Services Unit, Health Solutions Wales ( ■ http://www.wales.nhs.uk/sites3/page.cfm?orgid=166&pid=3997)Scotland: Practitioner Services Division, NHS National Services ■
Scotland (http://www.psd.scot.nhs.uk/)North Ireland: ( ■ http://www.centralservicesagency.com/display/pharmaceuticalservices)
Following processing, data is passed to other departments within each country’s processing body to map to the prescriber codes necessary to create prescriber based information from the prescription based data.
This data is then made available at different levels to different user groups, e.g. prescribing advisers to monitor the clinical and cost effectiveness of prescribing for a geographical area; practitioners providing services to support clinical audit; and fi nance and health authorities to enable planning and performance management.
England (PACT/ePACT) PACT (prescribing analysis and cost) data is collated and made available in a series of reports from the PPA. The reports inform general practices and prescribers which drugs and appliances have been prescribed, and their expenditure for a given period. Reports consist of aggregated information.
ePACT.net is an application that allows authorised users to view and analyse PACT data from the PPA. More information on the use of ePACT is available from http://www.ppa.org.uk/news/help/epact.net/pcg/usgLoggingon.htm
Scotland (SPA/PRISMS) SPA (Scottish Prescribing Analysis) is made available to all general practices and prescribers. SPA is available at two levels:
SPA Level 1, sent automatically to GPs, is a breakdown of total costs ■
and number of items dispensed for major therapeutic categories compared against averages for the practice, NHS board, and ScotlandSPA Level 2, originally produced on request for GPs, practice or ■
NHS board shows all items dispensed in a three-month period.
USING MEDICINES INFORMATION
104
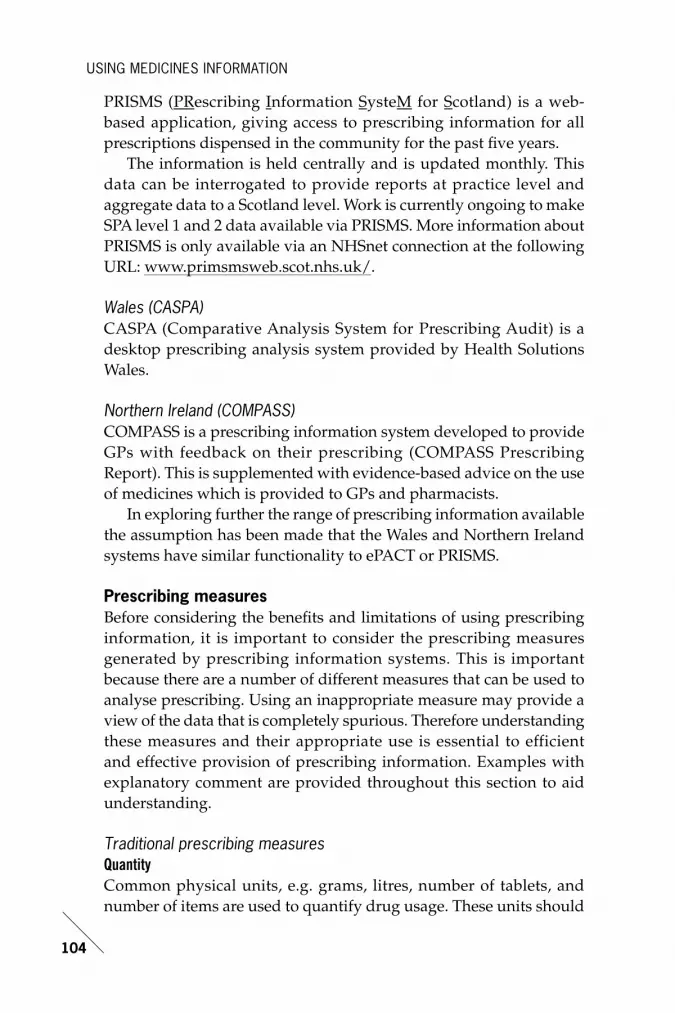
PRISMS (PRescribing Information SysteM for Scotland) is a web-based application, giving access to prescribing information for all prescriptions dispensed in the community for the past fi ve years.
The information is held centrally and is updated monthly. This data can be interrogated to provide reports at practice level and aggre gate data to a Scotland level. Work is currently ongoing to make SPA level 1 and 2 data available via PRISMS. More information about PRISMS is only available via an NHSnet connection at the following URL: www.primsmsweb.scot.nhs.uk/.
Wales (CASPA) CASPA (Comparative Analysis System for Prescribing Audit) is a desktop prescribing analysis system provided by Health Solutions Wales.
Northern Ireland (COMPASS) COMPASS is a prescribing information system developed to provide GPs with feedback on their prescribing (COMPASS Prescribing Report). This is supplemented with evidence-based advice on the use of medicines which is provided to GPs and pharmacists.
In exploring further the range of prescribing information available the assumption has been made that the Wales and Northern Ireland systems have similar functionality to ePACT or PRISMS.
Prescribing measuresBefore considering the benefi ts and limitations of using prescribing information, it is important to consider the prescribing measures generated by prescribing information systems. This is important because there are a number of different measures that can be used to analyse prescribing. Using an inappropriate measure may provide a view of the data that is completely spurious. Therefore understanding these measures and their appropriate use is essential to efficient and effective provision of prescribing information. Examples with explanatory comment are provided throughout this section to aid understanding.
Traditional prescribing measuresQuantityCommon physical units, e.g. grams, litres, number of tablets, and number of items are used to quantify drug usage. These units should
ROUTINE PRESCRIBING DATA
105
be applied only when the use of one drug, or of specifi c products, is being evaluated. Problems arise when it is used in the context of utilisation of whole drug groups. If usage is given in terms of grams of active ingredients, drugs with low potency will have a larger fraction of the total than drugs with high potency. Counting numbers of tablets also has disadvantages because strengths of tablets vary. The result is that low strength preparations contribute relatively more than high strength preparations. In addition, short-acting products will contribute more than long-acting preparations.
There are some instances where number of items does not give a good indication of total use unless total amount of drug per item is also considered. Counting items is of more value in measuring the frequency of prescribing and this is relevant to treatments given largely, or entirely, as courses, e.g. antibiotics and immunisations. Other factors can confound these measures, such as the size of the practice population, i.e. a large practice is likely to prescribe more in absolute terms than a small one. It is therefore sometimes better for comparative purposes to refer to items per 1000 patients. This method and other similar measures are described in more detail later.
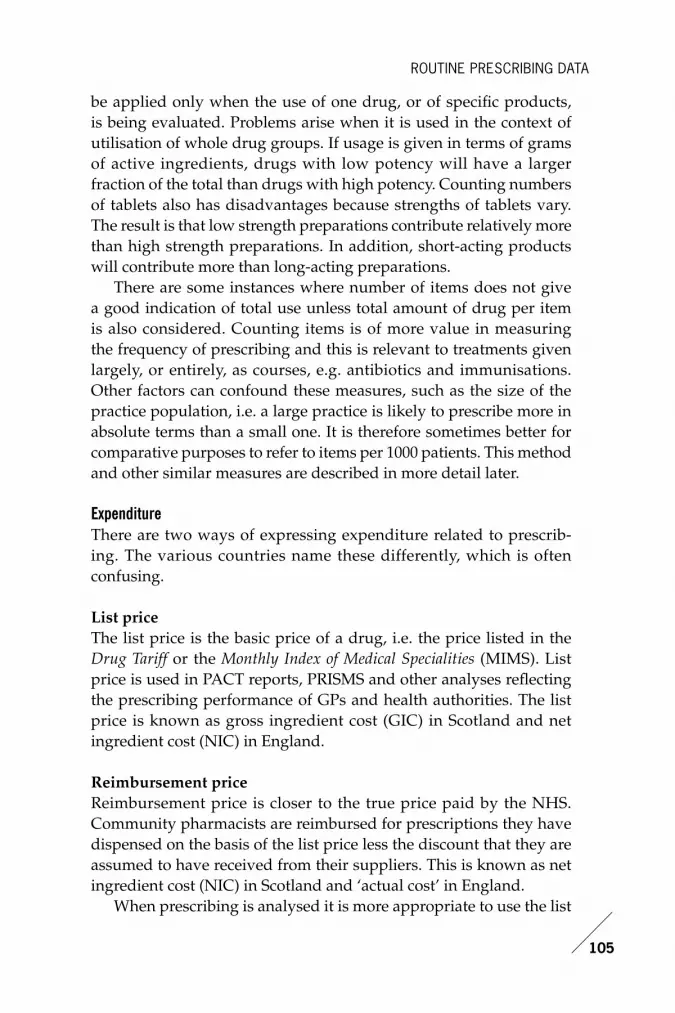
ExpenditureThere are two ways of expressing expenditure related to prescrib-ing. The various countries name these differently, which is often confusing.
List priceThe list price is the basic price of a drug, i.e. the price listed in the Drug Tariff or the Monthly Index of Medical Specialities (MIMS). List price is used in PACT reports, PRISMS and other analyses refl ecting the prescribing performance of GPs and health authorities. The list price is known as gross ingredient cost (GIC) in Scotland and net ingredient cost (NIC) in England.
Reimbursement priceReimbursement price is closer to the true price paid by the NHS. Community pharmacists are reimbursed for prescriptions they have dispensed on the basis of the list price less the discount that they are assumed to have received from their suppliers. This is known as net ingredient cost (NIC) in Scotland and ‘actual cost’ in England.
When prescribing is analysed it is more appropriate to use the list

USING MEDICINES INFORMATION
106
price as it allows accurate comparisons between practices. However, from a fi nancial perspective, the NHS needs to know the reim burse-ment price. In many cases prescribing advisers will project in terms of list price and accountants will convert these fi gures to reimburse-ment price.
For the purposes of clarity all examples will use the Scottish terms GIC (list price) and NIC (reimbursement price). Some examples to illustrate this are shown below. All examples use the prescribing of a group of drugs known as statins for the same group of practices for the same time period.
Figure 7.1 shows cost and volume for statin prescribing over a three month period for a random selection of GP practices. The variance in both volume and cost between practices is signifi cant. This may be due in part to practice population effects. Additionally, the pattern of expenditure does not fully match the volume pattern. This may be the effect of the repeat prescription cycle length and/or specifi c drug choices in each practice and/or levels of generic prescribing. With this number of potential variables affecting the information, further refi ning of the data is needed to provide more meaningful comparisons.
Figure 7.2 provides an insight into whether the quantity prescribed has an effect on the understanding of the data. The quantity pattern
0
200
600
400
1000
800
1200
1400
£4000
£0
£8000
£12 000
£16 000
£20 000
£24 000
£28 000
£32 000
£36 000
£40 000Items
Item
s GIC
GIC
GP Practice
1 2 3 4 5 6 7 8 9 10 11 12 13 14 15 16 17 18 19 20 21
FIGURE 7.1 Statin prescribing for a three-month period for a group of GP practices
ROUTINE PRESCRIBING DATA
107
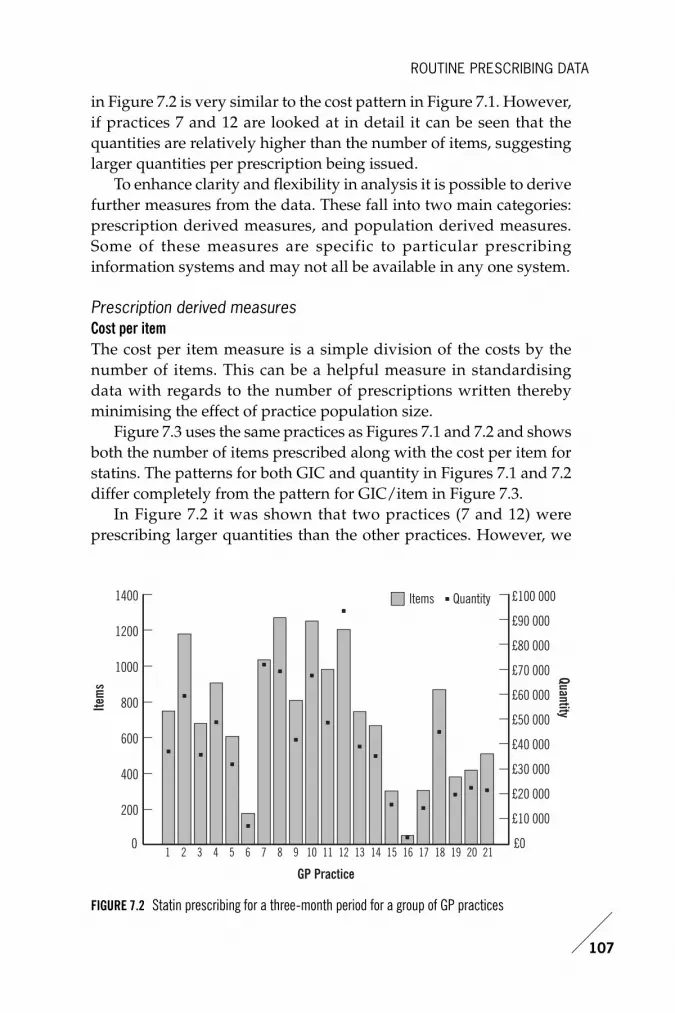
in Figure 7.2 is very similar to the cost pattern in Figure 7.1. However, if practices 7 and 12 are looked at in detail it can be seen that the quantities are relatively higher than the number of items, suggesting larger quantities per prescription being issued.
To enhance clarity and fl exibility in analysis it is possible to derive further measures from the data. These fall into two main categories: prescription derived measures, and population derived measures. Some of these measures are specific to particular prescribing information systems and may not all be available in any one system.
Prescription derived measuresCost per itemThe cost per item measure is a simple division of the costs by the number of items. This can be a helpful measure in standardising data with regards to the number of prescriptions written thereby minimising the effect of practice population size.
Figure 7.3 uses the same practices as Figures 7.1 and 7.2 and shows both the number of items prescribed along with the cost per item for statins. The patterns for both GIC and quantity in Figures 7.1 and 7.2 differ completely from the pattern for GIC/item in Figure 7.3.
In Figure 7.2 it was shown that two practices (7 and 12) were prescribing larger quantities than the other practices. However, we
0
200
600
400
1000
800
1200
1400
£10 000
£0
£20 000
£30 000
£40 000
£50 000
£60 000
£70 000
£80 000
£90 000
£100 000Items
Item
sQuantity
Quantity
GP Practice
1 2 3 4 5 6 7 8 9 10 11 12 13 14 15 16 17 18 19 20 21
FIGURE 7.2 Statin prescribing for a three-month period for a group of GP practices

USING MEDICINES INFORMATION
108
can see that there are four practices whose GIC/item is higher than the rest. These are practices 4, 7, 12, and 20. This suggests that whilst the quantities prescribed by practices 7 and 12 may be infl uencing their high GIC/item, this cannot explain the high GIC/item for practice 4 and 20. In this case the high GIC/item may be a function of three possible factors:
higher strengths being prescribed ■
differences in product choice ■
high brand, low generic prescribing. ■
To achieve further clarity, the questions asked and the data retrieved need to be refi ned.
Average quantity per itemThis measure is derived by dividing the total quantity prescribed by the total number of items prescribed, and can be used to confi rm the assumptions in Figure 7.2.
Defi ned daily dosesDefined daily doses (DDDs) are a World Health Organization (WHO) statistical measure of drug consumption. DDDs are used to standardise the comparative usage of various drugs. They are a
0
200
600
400
1000
800
1200
1400
£16
£18
£20
£22
£24
£26
£28
£30Items
Item
sGIC/Item
GIC/Item
GP Practice
1 2 3 4 5 6 7 8 9 10 11 12 13 14 15 16 17 18 19 20 21
FIGURE 7.3 Statin prescribing for a three-month period for a group of GP practices

ROUTINE PRESCRIBING DATA
109
function of strength and quantity, and the basic defi nition of the unit given by the WHO is: ‘The DDD is the assumed average maintenance dose per day for a drug used for its main indication in adults.’
It should be emphasised that the DDD is a unit of measurement and does not necessarily reflect the recommended or prescribed daily dose. Doses for individual patients and patient groups will often differ from the DDD and will necessarily have to be based on individual characteristics (e.g. age and weight) and pharmacokinetic considerations. The DDD is nearly always a compromise based on a review of the available information including the dosages used in various countries when this information is available. The DDD is sometimes a dose that is rarely if ever prescribed, because it is an average of two or more commonly used dosage regimes.
Drug consumption data presented as DDDs only gives a rough estimate of consumption and not an exact picture of actual use. DDDs provide a fi xed unit of measurement independent of price and formulation enabling the researcher to assess trends in drug consumption and to perform comparisons between population groups.
DDDs are not established for topical preparations, sera, vaccines, antineoplastic agents, allergen extracts, general and local anaesthetics, nor are they available for combination products.
The formula for calculating DDDs is as follows:
For example, paracetamol has a WHO DDD of 3g. If a patient is issued with a prescription for 84 × paracetamol 500mg tablets, the prescription could be said to contain 14 DDDs of paracetamol – calculated as 1 item containing 42g (84 × 0.5g), divided by 3g.
For more information on DDDs, visit the website http://www.whocc.no/atcddd/ and see also Chapter 6.
DDDs per itemThis can be considered to be similar to average quantity per item. It standardises the data effect of total volumes (both items and quantity) and population sizes. It can be used to confi rm larger quantities and/or higher strengths per prescription. The effect of using this measure is shown in Figure 7.4.
Drug Usage (DDDs) =Items issued × Amount of Drug per item
WHO DDD Measure

USING MEDICINES INFORMATION
110
In Figure 7.4 practices 4 and 20 show high GIC/DDD, but practices 7 and 12 do not. This does suggest, but does not completely confi rm, that practices 4 and 20 tend to prescribe statins that have a higher cost per DDD, i.e. newer preparations or proprietary brands rather
£0.00
£0.05
£0.15
£0.10
£0.20
£0.25
£0.30
£16
£18
£20
£22
£24
£26
£28
£30GIC/DDD
GIC/
DDD GIC/Item
GIC/Item
GP Practice
1 2 3 4 5 6 7 8 9 10 11 12 13 14 15 16 17 18 19 20 21
£0.00
£0.05
£0.15
£0.10
£0.20
£0.25
£0.30
75
80
85
90
95
100
105GIC/DDD
GIC/
DDD
GP Practice
% Generic Prescribed
% Generic Prescribed
1 2 3 4 5 6 7 8 9 10 11 12 13 14 15 16 17 18 19 20 21
FIGURE 7.5 Statin prescribing for a three-month period for a group of GP practices
FIGURE 7.4 Statin prescribing for a three-month period for a group of GP practices

ROUTINE PRESCRIBING DATA
111
than generic versions of established medicines. Querying generic prescribing rates might further clarify this point.
Generic prescribing ratesGeneric prescribing rates for the same group of drugs are shown in Figure 7.5. However, this fails to illustrate any real differences in generic prescribing rates between practices 4, 7, 12 and 20. The only practices with relatively low generic prescribing rates are practices 11 and 21. This does support the hypothesis that practice 4 and 20 may prescribe generically in general, but preferred to use a statin for which there is no generic product available, such as a more recently marketed drug entity, only available as a branded product.
Average daily quantityDDDs have been based on international prescribing habits. Work done by the Prescribing Support Unit (PSU) (http://www.ic.nhs.uk/our-services/prescribing-support) demonstrated that prescribing by GPs in England could differ from the international standard. To allow comparison of prescribing within England there was a need to have a system that more accurately refl ected English GPs’ prescribing. The result was the development of average daily quantities (ADQs) by an expert group convened by the PSU.
ADQs are not recommended doses but are analytical units produced in order to compare more accurately the prescribing activity of primary care practitioners in England. More information on ADQs is also mentioned in Chapter 6. http://www.ppa.org.uk/news/help/toolkit/pre_meas.htm#prescribed%20daily%20dosen
Population derived measuresThe volume and cost of prescribing are infl uenced by the demography and morbidity of the population served, e.g. on average, elderly patients have a greater need for medicines than younger adult patients. These should, therefore, wherever possible and appropriate, be taken into account when comparing data either between GP practices or at higher organisational levels.
Unweighted patientsThe population, i.e. number of patients for a given practice, area, health authority or NHS board is their unweighted patient population. It is unweighted in that the population fi gure is unadulterated by

USING MEDICINES INFORMATION
112
addi tional demographic and morbidity factors which could affect the uptake and use of medicines, e.g. age, gender, deprivation, chronic illnesses, and thus confound comparisons between groups.
Cost per patientThis measure is similar to cost per item, but uses the practice popu la-tion as the denominator of the measure. This measure adjusts for the effects of population size and prescription volume.
Figure 7.6 details the differences between overall expenditure (GIC) and cost per patient (GIC/Patient). It is apparent that high overall GIC does not necessary relate to high GIC/Patient.
Items per 1000 patientsThis is calculated by dividing the total items by the practice population, then multiplying by 1000. This is shown in Figure 7.7.
By using both the GIC/Patient (Figure 7.6) and Items/1000 Patients (Figure 7.7) we can separate out practices which could truly be considered ‘High cost/High volume’ for further analysis. In this example, practices 3 and 20 would require further investigation.
Weighted patientsAdding a weighting to a patient population attempts to recalculate an
£0
£5000
£10 000
£20 000
£15 000
£30 000
£25 000
£35 000
£40 000
£0
£1
£2
£3
£4
£5
£6GICGI
C
GP Practice
GIC/PatientGIC/Patient
1 2 3 4 5 6 7 8 9 10 11 12 13 14 15 16 17 18 19 20 21
FIGURE 7.6 Statin prescribing for a three-month period for a group of GP practices

ROUTINE PRESCRIBING DATA
113
assumed higher or lower medicines usage as a result of demographic and morbidity factors within the population. It does this by means of infl ating or defl ating the population fi gure, e.g. if a particular practice has a population of 3000, but if the patients are particularly elderly or live in a deprived area, the weighted population of the practice could be 4000. There have been many different approaches to developing weighting formulae, some of which are described below, none of which are considered a gold standard throughout the UK.
The Arbuthnott FormulaIn Scotland, the Arbuthnott Formula is used as a weighting measure for populations. The formula takes account of the population in the NHS board area, the age of the population, gender, level of deprivation and the proportion of population living in remote and rural areas. More information on the Arbuthnott Formula is available here: http://www.scotland.gov.uk/Publications/2005/10/19160721/07218
Figure 7.8 shows the differences between practices using unweighted and weighted populations.
ASTRO-PUASTRO-PUs (age sex temporary resident originated prescribing units)
£0
£5000
£10 000
£20 000
£15 000
£30 000
£25 000
£35 000
£40 000
£0
£1
£2
£3
£4
£5
£6GICGI
C
GP Practice
GIC/Patient
GIC/Patient
1 2 3 4 5 6 7 8 9 10 11 12 13 14 15 16 17 18 19 20 21
FIGURE 7.7 Statin prescribing for a three-month period for a group of GP practices

USING MEDICINES INFORMATION
114
were derived by the Prescribing Research Unit (PRU) in 1993. Detailed information on their construction and use is available at http://www.ic.nhs.uk/our-services/prescribing-support-unit/measures/astro-pus. See also Chapter 6.
STAR-PUSTAR-PUs (specifi c therapeutic age-sex related prescribing units) were derived in 1995. Detailed information on their use is available at http://www.ic.nhs.uk/our-services/prescribing-support/measures/star-pus. See also Chapter 6.
Application of ASTRO-PUs and STAR-PUs would be similar in principle to the illustration using Arbuthnott (Figure 7.8) but would differ in exact details of the effect.
Benefi ts of prescribing information The benefi ts of correctly analysed and used prescribing information are many. However, prescribing information must be seen as a means of adding richness to the data available. It can act as a catalyst for discussion by using it to formulate more reasoned and intelligent questions. It is only when prescribing activity is combined with an
0
100
50
150
200
0
50
100
150
200Items/1000 Pts
Item
s/10
00 P
ts
GP Practice
Items/1000 W
td PtsItems/1000 Wtd Pts
1 2 3 4 5 6 7 8 9 10 11 12 13 14 15 16 17 18 19 20 21
FIGURE 7.8 Statin prescribing for a three-month period for a group of GP practices

ROUTINE PRESCRIBING DATA
115
understanding of the underlying clinical evidence and used as part of discussions and debates with prescribers regarding their clinical use of medicines that a fuller level of knowledge can begin to emerge.
The following include examples of areas in which prescribing information can be beneficial. They are exemplars and are not intended to be exhaustive.
PlanningPrescribing information can be used to identify both clinical and fi nancial risks to organisations and policymakers to support clinical service development and budget allocation.
Budget allocationBudget allocation can be approached using regression analysis of the prescribing cost trends, integrated with other elements that can affect the potential expenditure over a projected period, e.g.
drugs losing patent protection (exclusivity of the manufacturer for ■
the market for a defi ned period) and lower cost generic equivalents becoming availableentry of new drugs into the marketplace ■
new clinical evidence that could increase or decrease the use of a ■
medicine or group of medicines.
Financial risk managementChanging prescribing which deviates from predictions can create fi nancial risk for an organisation. Close monitoring of medicines usage, even with the natural delay in prescribing information (usually about three months), can support contingency planning.
Clinical and cost effectiveness use of medicines Monitoring of new drug uptake is of particular importance to under stand how these medicines are being used in general practice compared to the clinical trial setting. This is of specifi c importance for drugs reviewed by National Institute for Health and Clinical Excellence (NICE) and the Scottish Medicines Consortium (SMC). In addition, the ability to review changes in prescribing behaviour following the publication of landmark trials is useful.
Exception reportingAs can be seen from the examples given there is the potential to

USING MEDICINES INFORMATION
116
retrieve vast quantities of data and eventually suffer from ‘paralysis by analysis’, i.e. having so much data that you become overwhelmed and unable to fi nd a logical way forward. To prevent this situation from occurring, there are occasions where exception reporting should be used. In these situations identifi cation of changes outside the norm are worthy of further investigation. This is not to say that higher or lower than average use is good or bad, but that it is different, and until a clinical context is placed on the prescribing activity then the activity needs to be questioned.
Changing service modelsMonitoring the impact of new services or contracts, e.g. in the new General Medical Services (GMS) contract, a number of specific drugs and groups of drugs are linked explicitly or implicitly to the Quality and Outcomes Framework (QOF). The changes in use of these medicines can be monitored over time by practice to gauge the effects of the new contract on clinical activity and expenditure, and can often identify contrasting activity by neighbouring practices, e.g. one practice opting for the most potent statin available in order to reach the highest possible threshold and earn the higher number of QOF points in that section regardless of the effect on prescribing expenditure, whilst another practice selecting the most cost effective generic product fi rst line and only moving onto another, more potent (and more expensive) statin when patients fail to reach the appropriate cholesterol target.
Changing prescribers’ prescribing activityOne of the most effective ways of infl uencing change is showing prescribers comparisons of themselves against their peers. This is often best carried out in the form of a graph showing the particular practice in the context of a group of practices. Following agreement with practices regarding courses of action, positive feedback using prescribing information throughout the process of change can help to maintain the momentum of something that can take considerable time and effort to change.
Prescribing indicatorsProviding comparisons is extremely useful, especially if a prescrib ing indicator for a particular clinical activity can be developed. The benefi t here is that the measurement can be standardised. For example, one

ROUTINE PRESCRIBING DATA
117
current public health message is that individuals should not exceed 6g per day of salt intake. However, if patients are prescribed effervescent formulations of paracetamol or co-codamol and take eight tablets per day, they will receive 8.8g of salt per day in addition to any dietary intake. Therefore a prescribing indicator showing effervescent formulations of these products as a percentage of all similar thera-peutic, but non-effervescent, formulations can inform measures to reduce the inappropriate use of these formulations. The indicator can be calculated using measures of ‘quantity’ (probably more accurate) or ‘items’ (probably less accurate), but the important point is that it has to be measured and calculated consistently. Prescribing indica-tors can be used incorrectly; therefore, it is important to remember that their use may indicate something unusual or different from the norm, but this may not necessarily be good or bad. A clinical context must always be sought.
Formulary compliance Providing comparisons of a number of practices’ compliance with either locally or nationally produced formularies is another useful tool. It should be noted, however, that unless the formulary is totally inclusive of all available products, then compliance will always be lower than 100%. In many instances a reasonable level of compliance with a locally based formulary is likely to be in the range of 70–90%.
Limitations of prescribing informationWhilst there are many benefits of using appropriately analysed prescribing information, there are also limitations in its use. These must always be taken into account when reviewing prescribing information. Some of the key issues are discussed below.
Data accuracyThe most fundamental limiting factor is the accuracy of the base data used to generate prescribing information. Without an understanding of the base data accuracy, confi dence in the information provided via prescribing information systems can be eroded.
Prescription handling within practices The fi rst level of data inaccuracy lies within practices themselves. The process in place within the practice for dealing with repeat

USING MEDICINES INFORMATION
118
prescriptions (approximately 80% of the total prescription volume) will determine accuracy, or lack of it, at prescriber level. Most clinical systems have the facility within them to either print the cipher (code) of the GP who will sign the prescription, or the cipher of the GP with whom the patient is registered. If the latter option is chosen, the prescribing is attributed to the GP the patient is registered with. This may not be the GP the patient regularly sees, or who initiated the therapy. Therefore care must be taken when attempting to analyse data at individual prescriber level as inaccuracy in the data may be high.
Processing Once prescriptions have been dispensed they are returned by the community pharmacy to be processed for payment. This processing inevitably has a level of error that can add to data inaccuracy. Most processing systems operate at accuracy rates of about 99%, which appears high, but when converted to actual prescriptions, it means that over the whole of the UK some 600,000–700,000 prescriptions are potentially incorrectly processed each month.
Patient characteristicsSince prescribing information is generated from prescriptions dispensed, there is currently no link to the GP clinical system or the community pharmacy patient medication record, and therefore no current linkage to patient identifi able data.
DemographicsThere is no information available within prescribing information systems currently which indicates the socioeconomic class of the patient, or the rurality of their abode. However, work in Scotland is progressing to promote the use and capture of the Community Health Index (CHI) from primary care prescriptions which will enable age, gender and post code to be established for individual patients enabling prescribing to be assigned to the patient’s residence rather than the general practice providing services.
Morbidity There is currently no indication on prescriptions as to the clinical reason for the prescription being written. There is also no indication of whether this is initiation of new therapy or continuation therapy.

ROUTINE PRESCRIBING DATA
119
Such information would support pharmacoepidemiology and pharmacovigilance (see Chapters 6 and 9).
Hospital prescribing informationIn comparison to primary care there is currently a paucity of hospital prescribing information available at a national level. This is a consequence of a number of factors including:
numerous different hospital medicine stock control systems cur- ■
rently in place in NHS hospitals across the UKno standardisation of medicine dictionaries within and across ■
these systems until recently, few drivers to encourage benchmarking across com- ■
parable hospitals in respect to medicines utilisation greater focus on primary care prescribing in part due to higher ■
expenditure in comparison to hospital prescribing, i.e. approxi-mately 90% primary care and 10% secondary care.
It should, however, be recognised that locally hospitals have had a long history of using information on medicines utilisation at a clinical level to support evidence-based medicine. This grew from the original hospital based formulary management system into full clinical pharmacy services to support patient care. Formulary management provides a process that enables clinicians to agree upon a selected number of medicines for routine use within the clinical settings to:
support evidence-based practice ■
enable familiarity with a range of medicines to minimise medication ■
errors with a particular focus on supporting new prescribers facilitate communication across different specialities ■
support the management of the medicines distribution system ■
feedback on the usage of medicines within defi ned clinical areas. ■
These developments in hospital prescribing information have sup-ported the development of the current primary care systems available nationally. It is now time to refl ect on the experience with national primary care prescribing information to inform the building of secondary care systems to meet the information needs of clinicians, planners, policymakers and the public in the future.

USING MEDICINES INFORMATION
120
Data sources Work continues across the UK to assist in providing an interim solution to the data defi cit in hospital prescribing information. The long term vision is for hospital prescribing information to be a by-product of the introduction of electronic prescribing and administration systems which will require the use of a standardised medicines dictionary. This is part of the wider single patient record initiative within the NHS.
The following is an outline of work ongoing in England and developmental work in Scotland to provide interim data on hospital prescribing.
England England currently has no central collation of medicines used and issued in NHS hospitals. However, the NHS Health and Social Care Information Centre, a special health authority, has published in 2005 its fi rst bulletin on hospital prescribing, generated from the Hospital Pharmacy Audit Index (HPAI). This data source is produced by IMS Health, a commercial company. IMS Health collects and collates all information on medicines issued from hospital pharmacy depart-ments covering 97% of NHS hospitals in England. This fi rst bulletin provides overall costs of medicines by health authority combining primary and secondary care data and also seeks to look at specifi c therapeutic areas and specific drugs, approved through NICE. (http://www.ic.nhs.uk/statistics-and-data-collections/primary-care/prescribing/hospital-prescribing-2004--england)
Information on hospital outpatient prescribing (FP10) is routinely collated through ePACT and designated hospital ePACT data (www.ppa.org.uk). Hospital outpatient prescribing varies across the UK dependent upon the model of health service delivery, e.g. outpatient prescriptions dispensed through community pharmacies in Scotland is minimal in comparison with England.
Scotland Scotland like England has no central collation of hospital medicines usage. However, work has commenced through NHS National Services Scotland, a special health board, to explore the building of a national hospital database to enable submission of data from all hospital pharmacy departments in Scotland. This programme of work is linked to and will help to inform the national programme

ROUTINE PRESCRIBING DATA
121
for the introduction of hospital electronic prescribing and medicines administration (HEPMA), a by-product of which will be medicines utilisation data. This database will initially provide high level expenditure data by BNF category at hospital, health board, regional and national levels. With time this will extend to provide detailed medicines utilisation data on specifi c clinical areas and specifi c drugs including key drugs recommended for use by the Scottish Medicines Consortium (SMC). The SMC provides single technology assessments near to or at the point of launch for all new medicines and major new indications for the NHS in Scotland.
Prescribing measures As outlined previously there are a number of prescribing measures that can be used to present prescribing information. The traditional measures of volume and expenditure remain the mainstay of current data, the most predominant of these being total expenditure, generally assimilated to BNF categories.
Application of DDDs to hospital prescribing data is a growing area of development to assist in standardisation of data by taking into account the volume and strength of the medicine. For example: the ability to summate the total amount of antibiotic prescribed across primary and secondary care for a geographical area can support the understanding of the exposure of the population and potential relationship to the generation of antimicrobial resistance.
Population-derived measures in the context of hospital prescribing are restricted at present by the established data capture systems which focus on hospital activity rather than the population demographics and characteristics. The most frequently used generic measures are:
occupied bed days ■
admissions, e.g. Scottish Morbidity Records (SMR) – admissions ■
and referral rates by clinical speciality, admissions by diagnostic category and operative procedures; English hospital episodes statistics consultant episodes. ■
The major limitation of these measures with respect to prescribing data is the inherent variability in our hospital populations due to the development of different service delivery models and clinical specialities which impact signifi cantly on the interpretation of such prescribing information. For example, a large tertiary referral centre is

USING MEDICINES INFORMATION
122
likely to have a different population, prescribing and service delivery profi le than a local district general hospital. In such situations the need for careful benchmarking is critical and the risk of misinterpretation is potentially higher than for a general practice population. Access to hospital activity data is through the prescribing statistics websites identifi ed at the start of this chapter.
Future developments in prescribing informationThe future use of prescribing information is dependent on ensuring that prescribing data, both primary and secondary care, is routinely captured as a by-product of clinical care and not a separate activity either to enable payment to contractors/clinicians for services undertaken or by hospitals to demonstrate performance. Linkage directly to patient care and integration within the single patient record system will support appropriate record linkage of prescribing to clinical condition and clinical outcome, a much better information stream on which to support continuous quality improvement.
A number of areas require research and development if we are to maximise the rich data streams to evolve from the single patient record.
How do we best present information to support clinicians to con- ■
tinuously improve prescribing given the extended ability to link prescribing to patient characteristics and clinical conditions?How do we better support routine pharmacovigilance and gen- ■
era tion of early warning signals for potentially unknown adverse effects to medicines?How do we utilise the routine capture of population data to estab- ■
lish the clinical effectiveness of medicines outwith strict clinical trial settings?How do we convert these richer datasets into knowledge to sup- ■
port effi cient and effective policymaking, service planning and performance management?
ConclusionPrimary care prescribing information can be extremely useful in the forecasting of medicines usage and identification of clinical and fi nancial risks. It can be an extremely good catalyst for change when correctly contextualised, but there remain some potentially

ROUTINE PRESCRIBING DATA
123
con founding limitations to the data and how it relates to patients in the clinical setting. It is therefore vitally important that when using prescribing information, the data is contextualised as accurately as possible including the limitations of the data if it is to be optimally used.
However, hospital prescribing data is still underutilised, at a national level, due to practical and logistical reasons refl ecting the historical development of the systems at individual sites rather than as a centrally co-ordinated and supported programme.
In summary, there have been considerable developments in pre-scrib ing information in the last 10–15 years but the next 10–15 years should see further major advancements in this fi eld if information management and technology can be effectively harnessed in the fi eld of healthcare delivery. Medicines will remain a driving force in the advancement and delivery of healthcare. It is therefore critical that we have the systems and the intelligence to use the data generated through the application of such technology within the NHS to under-stand the health gain achieved through such investment of public monies.