Embed Size (px)
Citation preview
An Automated Routine for Menu Structure Optimization
Mikhail V. Goubko Institute of Control Sciences RAS
65, Profsoyuznaya str., Moscow, Russian Fed. [email protected]
Alexander I. Danilenko Institute of Control Sciences RAS
65, Profsoyuznaya str., Moscow, Russian Fed. [email protected]
ABSTRACT We propose an automated routine for hierarchical menu structure optimization. A computer advice-giving system founded on the mathematical model of menu navigation directs the designer-driven process of sequential enhancement, while menu designer caters for the semantic quality of menu labels and groupings used. The mathematical model employs the frequencies of functions’ usage and the estimates of navigation time delays to calculate the average search time for the current and optimal menu structure, to show the “bottleneck” panels of the current menu, and to suggest the direction of their improvement. The model covers the variety of menu types and allows choosing the best type to meet requirements of specific application or user category. The approach is illustrated by the optimization of a mobile phone command menu.
Author Keywords Menu-driven system, usability, depth vs. breadth, optimal hierarchy, menu design automation, menu of mobile device.
ACM Classification Keywords H.1.2. User/Machine Systems: Human Factors. H.5.2. User Interfaces: Interaction Styles. I.3.6. Methodology and Techniques: Interaction Techniques.
General Terms Design, Performance, Theory
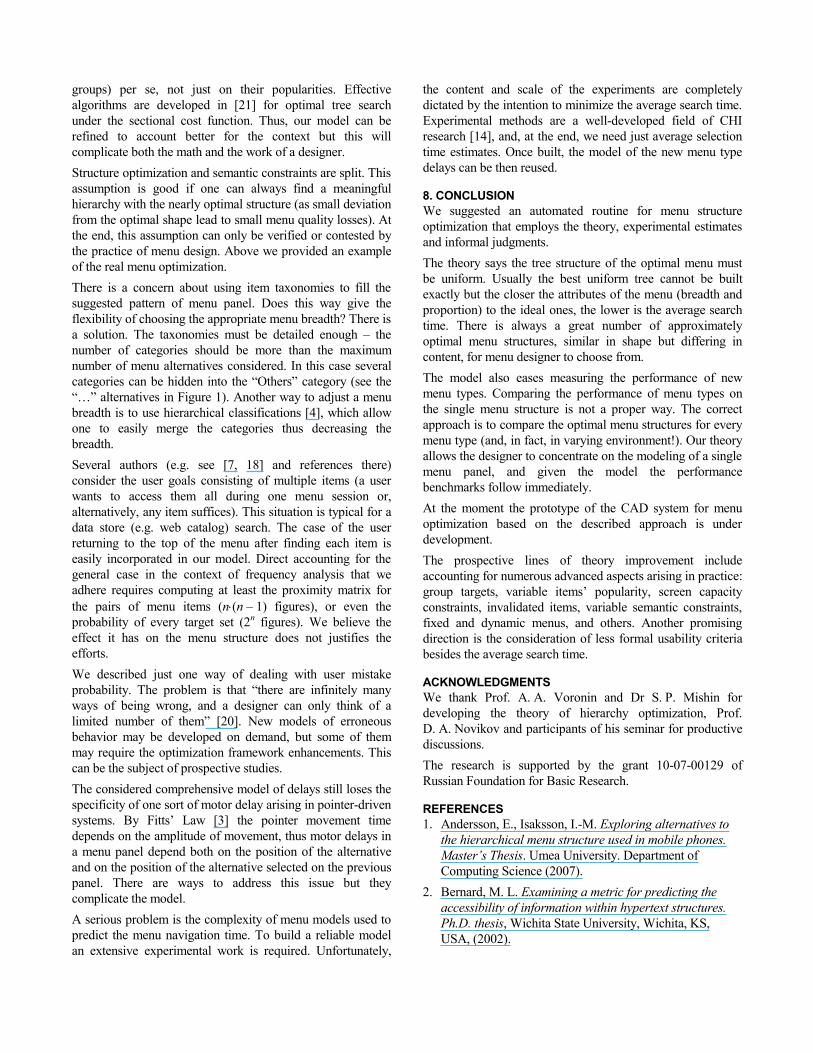
1. INTRODUCTION Hierarchical index was one of the earliest methods to arrange a large number of items for fast access. Contemporary examples of such hierarchies include complex command menus in GUI, Web catalogues like “Google™ directory” (see Figure 1), voice menus of phone-based services, menus of ubicomp devices [20], and many others. Users spend much time selecting from menus, thus the usability of applications is often determined by the usability of its menu system. This factor is particularly important for mobile devices, with their limited interface capabilities. The design of a hierarchical menu consists of building a hierarchy
of taxonomies for the set of items and choosing a menu type or layout for every taxonomy (menu panel). The result must fit the best specific application, user, and hardware conditions. The usability of a menu is typically measured by the items’ average search time. There are usually a number of semantically feasible ways to arrange a given set of items into a hierarchy of categories, so the problem is to find a permissible hierarchy with the lowest average search time. We solve this discrete optimization problem along with some of its extensions, and suggest the human-guided routine for menu structure optimization.
Figure 1: Google™ Directory –
an example of a hierarchical menu (fragment)
This paper has the following structure. First we describe the suggested process as it is seen by a menu designer and formulate the contribution. Then we review the literature to outline the alternative approaches. In section 4 we introduce the theory, illustrate it in section 5, and embed the theory into the design process in section 6. In section 7 we discuss the details of the approach, compare it with the others, and address some issues and possible criticism. Section 8 concludes.
2. THE ROUTINE We take the average time spent by a user in a menu as a main indicator of menu quality and usability. The suggested approach to the design of optimal (i.e. time-minimizing) menu bases on the four components:
Permission to make digital or hard copies of all or part of this work for personal or classroom use is granted without fee provided that copies are not made or distributed for profit or commercial advantage and that copies bear this notice and the full citation on the first page. To copy otherwise, or republish, to post on servers or to redistribute to lists, requires prior specific permission and/or a fee. EICS’10, June 19–23, 2010, Berlin, Germany. Copyright 2010 ACM 978-1-4503-0083-4/10/06...$10.00.
1. Experimental or expert estimates of menu navigation delays and the menu items’ popularities.
2. A theoretical model of menu structure optimization. The model allows calculating the shape and delays of the optimal hierarchy accepting all possible item groupings (in the absence of semantic constraints).
3. A suite of predefined partitions of menu items that help to fill the normative menu panel pattern suggested by the theory by meaningful groups of items.
4. A designer that governs the process of menu creation, evaluates the semantic quality, chooses and corrects the suggested automatic groupings to handle the informal factors missed by the model.
For a designer the process of hierarchical menu development and optimization consists of the following steps. 1. Fix the set of menu items to be searched by users. For
every menu item estimate its popularity – the probability of being searched.
2. Prepare several meaningful taxonomies of the set of menu items (multi-criteria and hierarchical classifications are welcome). Later they will be used for automatic item groupings into labeled menu categories.
3. Determine the expected operating conditions of a menu and its focus group.
4. Pick over the set of menu panel types to consider (e.g. top-down list of labels, matrix of icons, etc.) or develop new ones.
5. Evaluate, given the audience and conditions, the average selection delays of each menu alternative for every menu type and breadth (the number of alternatives on the panel). The library of predefined analytic and simulation models should save sufficient time and efforts. If the audience is diverse or menu usage conditions are unclear, average delays can be used.
6. The theory says that mixing several menu types in one menu is not necessary. Thus for every menu type the CAD system estimates the average time of the optimal hierarchy built using this menu type and suggests the menu type with the lowest average delays.
7. Fix the advised menu type (or choose another on the basis of private considerations) and start the optimization of the menu structure.
8. The process of sequential structure improvement may start from any point. It can be a manually built hierarchy, or automatically generated structure based on the predefined taxonomies from step 2. Different taxonomies are used to partition the items on different menu panels into meaningful categories with clear and comprehensible labels.
9. For the current hierarchy its average search time is estimated (by simulation) and compared to the average search time of the optimal hierarchy (calculated from
the optimization). For every panel of the current hierarchy several key performance indicators (KPI) are displayed: time losses in seconds compared to the structure of optimal panel, relative panel quality, panel quality compared to the quality of other panels (bottleneck indicator), the number of alternatives in the optimal panel and the optimal alternatives popularity ratio compared to the current panel alternatives’ distribution of popularities.
10. Improve the current panel: a. Adjust the grouping of menu items by splitting or
merging the categories, changing their order or making other local improvements. Changes immediately affect the values of KPIs.
b. Change (if needed) the principle of items’ partition. Predefined taxonomies help to regroup large sets of items. Manual ad-hoc classification is possible for small sets.
c. Choose another menu type for the current panel. 11. Find and process the new bottleneck panel. 12. Stop the improvement process when the time losses in
comparison with the theoretically optimal structure become plausible, or when no improvements are seen.
Several points of this program require extensive experimental and theoretical support. The experiment is required in step 1 to estimate the menu items popularity. Thorough analysis is also needed to build a reliable model of menu navigation delays (see step 5) for new menu types. The model should allow tuning to the different contexts (user categories, data channel or display quality, etc.). The theory of hierarchy optimization is used to estimate the optimal menu time delays in step 6, and also to calculate the optimal parameters (the number of menu alternatives and the distribution of their popularities) of menu panels, to find the most inefficient panel of current hierarchy, and to suggest the possible directions of improvement in step 9. Some of these process requirements force us to improve the existing and to develop the new theoretical results. These improvements constitute the main contribution of our work to the theory of CHI. The contribution of this paper to the engineering of interactive computing systems is the operable and implementable process of menu design and optimization.
3. BRIEF LITERATURE REVIEW An extensive study of menu optimization methods (the rather aged but a comprehensive survey is found in [11]) started in the past two decades of the 20th century in response to advances in computer interfaces. Hierarchical menus were the part of standard GUI and then migrated to the Web transforming into the structure of hyperlinks. A number of aspects should be taken into account when designing a rational hierarchical menu – menu panels’ appearance, information processing capabilities, user
experience, application needs, user search strategies, principles of items sorting, learning processes. An important issue is that of menu structure studied mostly in the context of the so called “depth vs. breadth” problem. The question is how many alternatives a rationally organized menu should offer to a user at once (this number is called the breadth of a menu), and, thus, how many levels (also called the depth) the menu will have. The more precise question is how should the breadth of a menu panel depend on its level – is it rational to give the user a richer choice first and then to narrow the number of alternatives or vice versa. There are different approaches to this problem. Early empirical recommendations “keep it simple” [15] were not satisfactory. In a classic model by Lee and MacGregor [9] a very restrictive framework is considered of symmetric menu with constant breadth over a set of equally popular items. They supposed each alternative has equal mean time of being selected and studied two search strategies resulting in a linear relationship between the search time and the menu breadth. The formula was obtained for the optimal menu breadth (giving 6-8 alternatives for a wide range of parameters). This range was far from empirical observations, so Landauer and Nachbar [8] suggested another model with similar restrictions but with a logarithmic relationship between the search time and the menu breadth. Their formula allow for a wider range of menu breadths (see [3] for the recent revision of this model). The frequency-based model of Paap and Roske-Hofstrand [13] extended the one of Lee and MacGregor [9], but still excluded asymmetric hierarchies from consideration. Thimbleby [19] suggested another frequency-based model of user interface optimization based on Huffman coding. The idea of “making frequent things easy” captures the benefits of asymmetric menus, but menu panels in the model are hidden within the state-machine diagram. The model accounts only for button presses, not time delays. This makes it hard to compare with the others. A certain model of menu navigation forms a basis for every theoretical study, and a substantial body of literature concerns the modeling issues in different circumstances. Among recent publications [3, 4, 7] should be mentioned. Shneiderman [17] stressed the importance of experimental justification of theoretical conclusions, and many authors ([3, 7, 11, 12, 16], among others) concentrated on empirical studies of various menu types or menu structuring principles to substantiate certain design guidelines. An advanced topic for empirical research was the study of menus with varying breadth. At the moment they give no clear understanding whether increasing or decreasing breadth (with a menu level) is optimal. Norman and Chin [12] conclude the breadth should increase at deeper levels of a menu, while Bernard [2] found no significant differences between increasing and decreasing breadth menus.
Both theoretical and experimental approaches suffer from the lack of applicability. Theoretical results operate in a rather abstract framework while guidelines from experimental research concern particular cases. Most approaches do not account for the semantic quality of menu category labels. One of the known exceptions is the paper of Fisher et al. [4] where the assumptions of Lee and MacGregor are partially relaxed and the algorithm is suggested for menu optimization that takes into account semantic aspects. The idea is introduced there of using the taxonomies of menu items to automatically build meaningful groupings. Consider a design process from Section 2. Neither of the existing approaches addresses perfectly all its requirements. Yet these requirements seem to be quite natural for any operator-driven design process: CAD system must show where we are, where the goal is, where (and in what direction) the efforts should be exerted. In the next section we extend the known approaches to build the general model of menu navigation. We equip it with the methods for structure optimization that rely on the general theory of hierarchy optimization [5, 10, 21].
4. THE THEORY Consider a fixed set of items N – the collection of items to be categorized and arranged in a hierarchy. Suppose a user always seeks a single item. Let µ(w) be the item’s w ∈ N popularity – the probability of being searched. The set N can be partitioned into the categories forming different menu panels. Every category (i.e. menu panel) is characterized by the set s ⊆ N of items that belong to it. Subsequent partition of categories induces a directed tree with the top category N being its root and the individual items w (w ∈ N) being the leaves. Let us define a target category as any category that contains the target item. For every category s ⊆ N define its popularity
∑ ∈=
sws w)(µµ . Consider a user navigating to some
category s ⊆ N with k subcategories. If µi is the popularity of category si, i = 1, …, k (note that µ1 + … + µk = µs), the conditional probability of the i-th category being the target one is yi := µi/µs (hereinafter the vector (y1, …, yk) is referred to as the proportion since y1 + … + yk = 1 by definition). Let the menu type stand for a summary of visual and usability menu properties and let Ω be the set of all potential menu types that designer can choose from. The elements of the set Ω for mobile phone menu can, for example, be something like “Up-down list with text labels”, “4x3 array of animated icons”, or “high-contrast huge static icons with voice hints”. Menu navigation delays form the basis of the model. Besides the menu type the delays depend on the operation conditions of a menu and its focus group. The vector of relevant usage conditions (e.g. the communication channel speed, screen size and resolution, application type, etc.) and user characteristics (e.g. age, experience, vision quality, reading
speed, etc.) may depend on the menu type but there is no loss of generality to consider a common multidimensional vector ξ ∈ Ξ. To describe the model of menu type θ ∈ Ω is to define the average time ti(k, θ, ξ) of finding and selecting the i-th alternative from the list of k alternatives in the menu of type θ given the conditions vector ξ (it is supposed that alternatives are indexed somehow from 1 to k). This time may include both cognitive and motor delays. In section 5 we provide several illustrative menu models. To account for the context in menu design one must predict the usage conditions and the focus group of the menu. In general these predictions take the form of probability distribution over Ξ. The model we build is linear in the delays ti(k, θ, ξ), thus the context information can be averaged. Hereinafter we skip the term ξ assuming the delays ti(k, θ) correspond to the conditions in hand. If a user enters a menu panel (category) s ⊆ N with k elements s1, …, sk (subcategories or individual items), the average time he or she spends there is evaluated as a weighted sum of select time for each element:
( )∑=
=k
iiik yktyyt
11 ,),,...,( θθ .
Before finding the best menu structure one needs to choose the menu type that minimizes the average search time for every individual menu panel:
( ) ( )∑=
Ω∈=
k
iiik yktyyt
11 ,min,..., θ
θ.
The problem in hand belongs to a broad class of problems of optimal hierarchy search. These problems arise in different areas but despite dissimilar interpretations they have a common mathematical setting and allow for a general approach to their solution. The average search time T is the total time user (at the average) spends on every category s in hierarchy H. If µs is the probability of category s to be the target one, and
1sµ , …,
)(sksµ are the popularities of its k(s) subcategories, the
expression for T can be written as
( )∑∈
⋅=Hs
sssss sktT µµµµµ /,...,/
)(1.
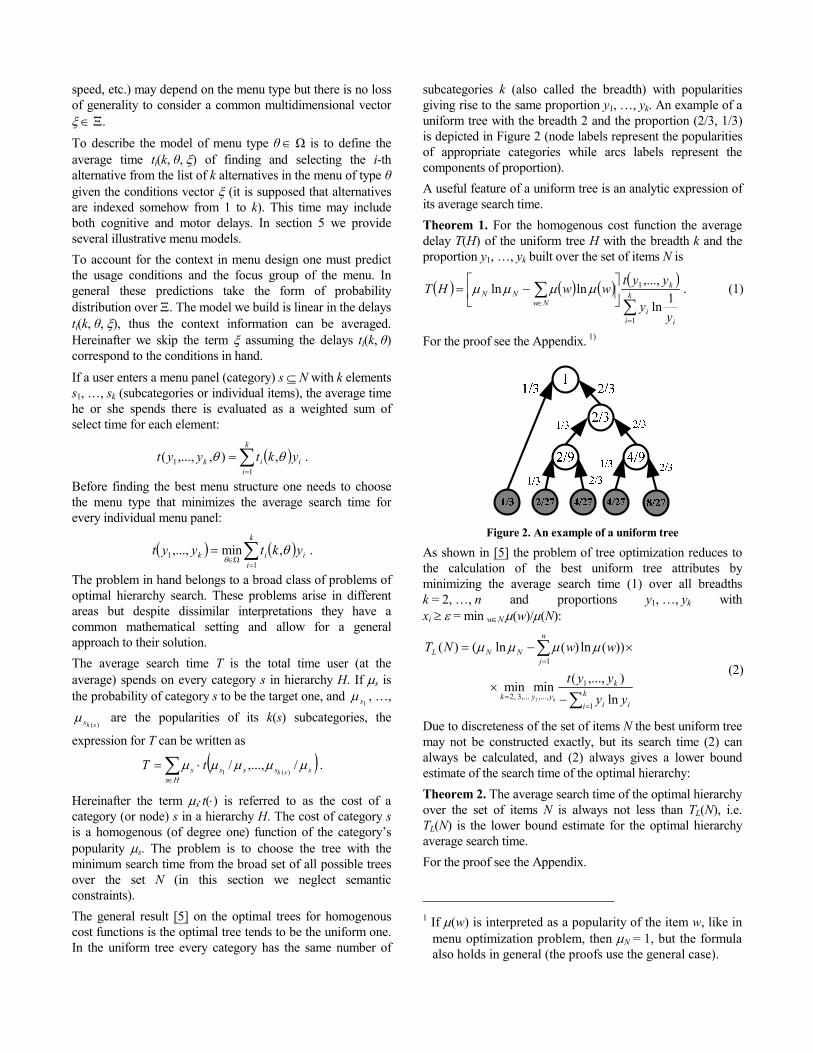
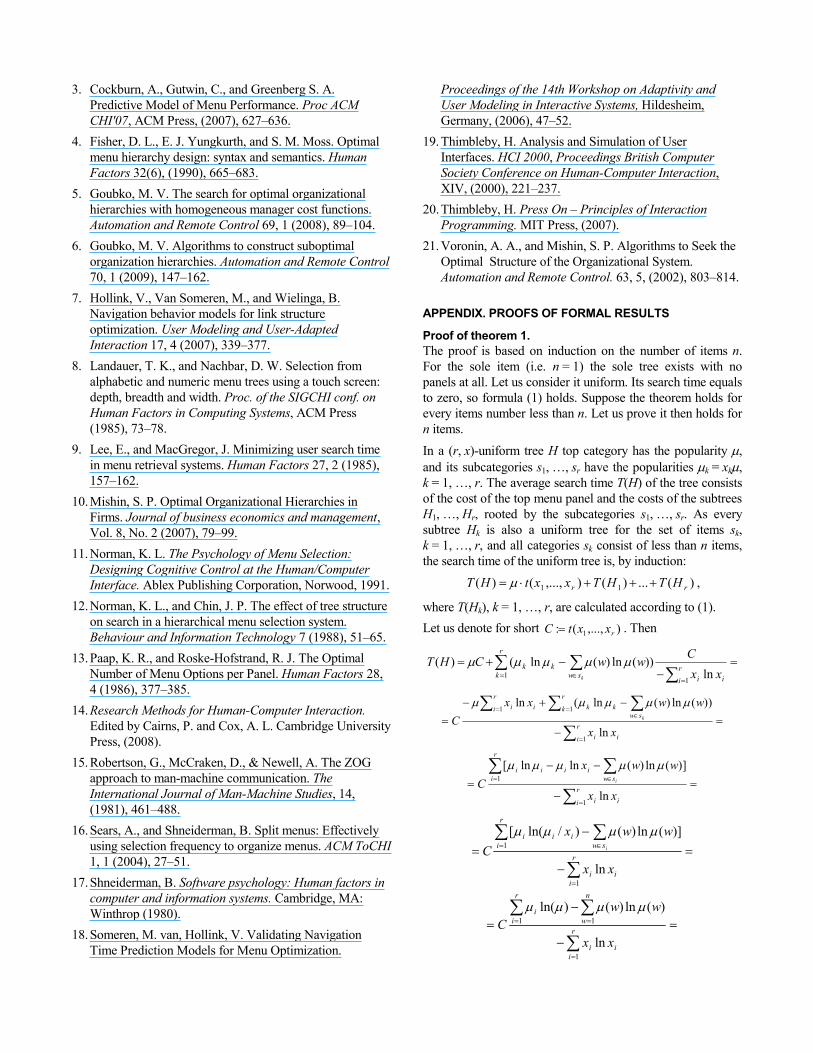
Hereinafter the term µs⋅t(⋅) is referred to as the cost of a category (or node) s in a hierarchy H. The cost of category s is a homogenous (of degree one) function of the category’s popularity µs. The problem is to choose the tree with the minimum search time from the broad set of all possible trees over the set N (in this section we neglect semantic constraints). The general result [5] on the optimal trees for homogenous cost functions is the optimal tree tends to be the uniform one. In the uniform tree every category has the same number of
subcategories k (also called the breadth) with popularities giving rise to the same proportion y1, …, yk. An example of a uniform tree with the breadth 2 and the proportion (2/3, 1/3) is depicted in Figure 2 (node labels represent the popularities of appropriate categories while arcs labels represent the components of proportion). A useful feature of a uniform tree is an analytic expression of its average search time. Theorem 1. For the homogenous cost function the average delay T(H) of the uniform tree H with the breadth k and the proportion y1, …, yk built over the set of items N is
( ) ( ) ( ) ( )
∑∑
=
∈
−= k
i ii
k
NwNN
yy
yytwwHT
1
1
1ln
,...,lnln µµµµ . (1)
For the proof see the Appendix. 1)
Figure 2. An example of a uniform tree
As shown in [5] the problem of tree optimization reduces to the calculation of the best uniform tree attributes by minimizing the average search time (1) over all breadths k = 2, …, n and proportions y1, …, yk with xi ≥ ε = min w∈N µ(w)/µ(N):
∑
∑
==
=
−×
×−=
ki ii
k
yyk
n
jNNL
yyyyt
wwNT
k1
1
,...,,...3,2
1
ln),...,(minmin
))(ln)(ln()(
1
µµµµ
(2)
Due to discreteness of the set of items N the best uniform tree may not be constructed exactly, but its search time (2) can always be calculated, and (2) always gives a lower bound estimate of the search time of the optimal hierarchy: Theorem 2. The average search time of the optimal hierarchy over the set of items N is always not less than TL(N), i.e. TL(N) is the lower bound estimate for the optimal hierarchy average search time. For the proof see the Appendix.
1 If µ(w) is interpreted as a popularity of the item w, like in
menu optimization problem, then µN = 1, but the formula also holds in general (the proofs use the general case).
Effective computational procedures are suggested in [6] to build roughly uniform and almost optimal trees. One of them, the generalization of the well-known Shannon-Fano coding algorithm, is best suited for optimal menu construction. Let us outline its idea. Consider the menu items are aligned in some order. The algorithm starts building the tree from the top, grouping the conjoint items to best fit the normative breadth and proportion. Then the procedure is repeated for every child group formed until the terminal nodes. Let TSO(N) denote the average search time of the tree built. It is shown in [6] that given some technical assumptions the ratio TSO(N)/TL(N) tends to unity when the number of items in the set N grows. In other words, the tree is roughly optimal for large item sets. Note that a roughly optimal tree can be constructed for every of n! items’ orderings. So the algorithm allows building a great number of roughly optimal trees.
5. RESULTS Find the shape of optimal menu for different types of user navigation strategies. The cost function µs⋅t(⋅) is homogenous by definition. Thus, an optimal hierarchical menu must be uniform, i.e. every category in an optimal menu must have, if possible, the same number of subcategories with the same proportion (relative popularities of subcategories). Note, that this means that it is inefficient to combine several menu types in one menu structure. For every menu panel the menu type is chosen to minimize the average time user spends in a panel. One can calculate the best menu type for every breadth and proportion. But in the optimal hierarchy all panels have the same breadth and proportion and, thus, the same optimal menu type. Consider a couple of examples of the best uniform tree attributes calculation for two classic user search strategies [11] – the exhaustive search and self-terminating search.
5.1. Exhaustive Search without Repetition Consider the simplest type of Web-based menu where a user navigating to some category observes a page with a plain list of subcategories. “Read all” navigation strategy [7, 11] is adopted – a user sequentially reads the titles of all categories and then drills down to the target category (or item). The possibility of user choice mistakes is neglected. As a user always reads all items, the average time spent in a category s is ( ) clickreadloadrespk tktkttyyt +++=,...,1 , (3)
where tresp is a server’s mean response time in seconds (more precisely, the mean time it takes to download a page with an empty list of categories), tload is the mean time of a single category label download, tread is the mean time needed to read and recognize one category label, and tclick is the mean time spent in moving the pointer to the target category and clicking the link (as all these parameters enter linearly in the criterion we can always use averages).
The optimal breadth r and the proportion (x1, …, xr) minimizes (1). Given (3) it is easy to conclude that for “read all” strategy symmetric hierarchy is the best choice. Optimal breadth r is found from the equation
rt
trttr
read
clickloadresp +++= 1ln . (4)
Take the typical parameters values for Web-based menus: tresp = 2 sec, tload = 0.02 sec, tread = 1 sec, tclick = 1 sec (these convenient values are taken just for illustration; in [9] tread = 1 sec corresponds to “slow readers”). The optimal breadth is then r = 5. This means that an optimal menu structure forms symmetric tree with 3 choices in each category. The formula (4) extends the one obtained by Lee and MacGregor [9] under the assumption that all items have the same popularities. The model proposed allows for the different popularity of every single item.
5.2. Self-terminating Serial Search Another classic user behavior is the so called “read until” strategy – a user sequentially reads categories in a list until the target category/item and immediately drills down [9]. As a user reads the labels sequentially, yi is also the conditional probability of user reading exactly i labels until target. Thus, given s is one of the target categories, the average time spent on it is
( ) clickki ireadloadrespk tyitkttyyt +⋅++= ∑ =11,..., . (5)
The optimal breadth r and the proportion (x1, …, xr) minimizes (1). Substituting (5) into (1) yields
∑
∑=
=⋅+
= k
i ii
k
i i
yykryy
yikAxxr
k1
1
...,,1)/1ln(
)(minminarg))...,,(,(1
, (6)
where readclickloadresp ttkttkA /)()( ++= .
From the first-order conditions find ( ) ikAi kay += )( ,
i = 1, …, k, where a(k) is the solution of the equation 11
)( =∑ =+k
iikAa (or, alternatively, 1/1)()( −=− + aaa kkAkA ).
Substitution of the optimal proportion into (6) yields the optimal menu breadth
( )( )kar
k 1ln1minarg= .
For the parameter values from the previous subsection the optimal breadth r = 13 is then easily found by numerical minimization (compare it with r = 5 in the previous subsection!). Corresponding proportion is x1 ≈ 0.27, x2 ≈ 0.20, x3 ≈ 0.15, …, x13 ≈ 0.007, i.e. the chance to find the target item in the first category of the optimal list must be more than 1:4, in the second – about 1:5, and so on up to the last category – 1:150. Compare this result to the analogous one in [9]. For the similar navigation strategy Lee and MacGregor find an
estimate for the optimal breadth. Their formula gives r = 7 for the above parameter values. In [9] only symmetric and uniform trees are studied. Just a few studies in the ensuing years addressed hierarchies with varying breadths and they gave no clear answer on whether varying breadths make sense or not (Norman and Chin [12] found that menus with the largest breadth in the top layer and the terminal layer are more efficient than menus with the largest breadth in the middle layers while Bernard [2] found no significant differences in efficiency between various breadth profiles). The above analysis extends the previous results to the class of arbitrary menu structures and arbitrary items popularities. Note that allowing for asymmetric menus saves about 10% of user time on average.
5.3. Navigation Mistakes Probability In this subsection an example is given of how simple search models can be improved to include advanced considerations like user mistakes, thus tuning the general model to the variety of practical situations. Ambiguous or inconsistent category names may lead to user mistakes during navigation through menus. Two types of mistakes and corresponding recovery techniques are considered: the user navigates to the wrong subcategory and then moves back to the parent category or user mistakenly navigates up from the target subcategory [11]. User mistakes increase the search time at the cost of wrong choice and recovery. For “read until” navigation strategy the time to choose the i-th item in the parent category by mistake is
clickreadloadrespimistake titkttt +++= .
Once navigated to the subcategory the user has to view it through and make a choice to move back:
clickreadloadresprecover tktkttt +++= .
Let us introduce the probability, p, of a user making a mistake while browsing a category. This probability is split among category items proportionally to their popularity (a mistake is more likely to occur for popular categories). Thus, for the particular user in the particular category, the probability to choose the i-th item by mistake is p∙yi. The total probability to get into category s by mistake is μs∙p. So, the average time loss in a category s due to the user’s mistakes is
∑=
+k
i
imistakeisrecovers typt
1
µµ .
The optimal popularities of subcategories are calculated: ( ) ikB
i kay += )( , i = 1, …, k, where
( ) kp
pkAp
pkB+
+
+
+=1
)(1
1)( ,
a(k) is the solution of the equation 11
)( =∑ =+k
iikBa .
As before the optimal breadth
( )( )kar
k 1ln1minarg= .
For the typical parameter values specified above and the mistake probability p = 0.2 the optimal breadth r = 8 and corresponding proportion is x1 ≈ 0.25, x2 ≈ 0.19, x3 ≈ 0.15, …, x13 ≈ 0.05. Note the possibility of user mistakes reduces the number of items within a category. The reason is that these “narrower” menus give the user an ability to recover faster after a mistake. Analogous closed-form solutions can also be found for alphabetically sorted items (the search time is logarithm of menu breadth [8]), categorized menus (see Figure 1) [13], and many other practical situations.
6. ALIGNING AN OPTIMAL MENU STRUCTURE WITH SEMANTIC CONSTRAINTS The set of admissible hierarchies in a hierarchical menu optimization problem is restricted by semantic constraints. In many cases these constraints are reduced to the enumeration of semantically meaningful categories (items’ groups) that solely can be used while constructing a menu. Call the menu meaningful if it consists of meaningful categories only. Although the problem is to find a meaningful menu minimizing the average search time, the solution of unrestricted optimization problem also helps to design a meaningful menu structure in an automated mode.
6.1. General Considerations First, the designer can compare the predicted average search time of the current hierarchy with the lower bound (1). If the difference is small, e.g. less than 5%, the current menu can be treated as satisfactory. Second, the structure of an optimal tree can be used as a template, the ideal that must be pursued while building a meaningful tree. The lower bound for the unrestricted problem remains the lower bound for the problem with semantic constraints. For the constrained setting branch and bound algorithms can be suggested that exploit the idea of TD-tree construction algorithm but also account for semantic constraints. They employ the set of predefined items’ taxonomies to group the items into meaningful categories with popularities close to optimal ones. Even then there is a number or informal aspects that may lead the designer to reject the suggested groupings. All these considerations are included in the suggested routine.
6.2. An Example: Mobile Phone Menu Optimization Show how the suggested routine works in the case study of mobile phone menu optimization.
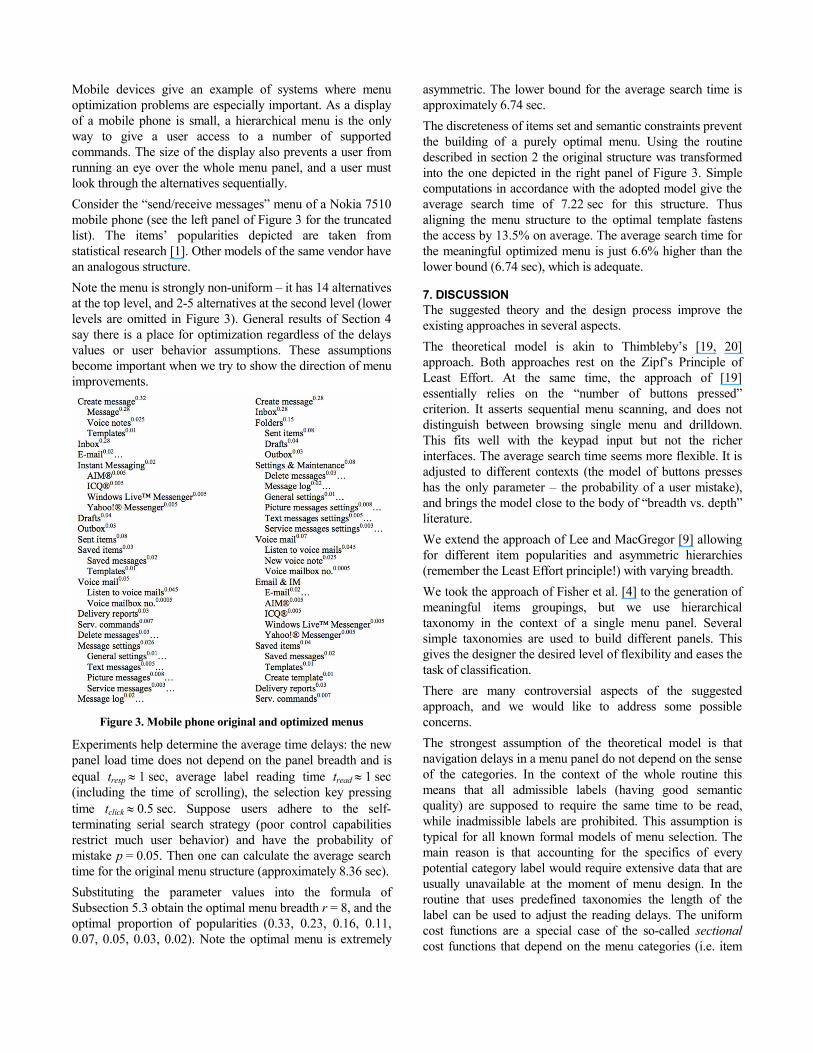
Mobile devices give an example of systems where menu optimization problems are especially important. As a display of a mobile phone is small, a hierarchical menu is the only way to give a user access to a number of supported commands. The size of the display also prevents a user from running an eye over the whole menu panel, and a user must look through the alternatives sequentially. Consider the “send/receive messages” menu of a Nokia 7510 mobile phone (see the left panel of Figure 3 for the truncated list). The items’ popularities depicted are taken from statistical research [1]. Other models of the same vendor have an analogous structure. Note the menu is strongly non-uniform – it has 14 alternatives at the top level, and 2-5 alternatives at the second level (lower levels are omitted in Figure 3). General results of Section 4 say there is a place for optimization regardless of the delays values or user behavior assumptions. These assumptions become important when we try to show the direction of menu improvements.
Figure 3. Mobile phone original and optimized menus
Experiments help determine the average time delays: the new panel load time does not depend on the panel breadth and is equal tresp ≈ 1 sec, average label reading time tread ≈ 1 sec (including the time of scrolling), the selection key pressing time tclick ≈ 0.5 sec. Suppose users adhere to the self-terminating serial search strategy (poor control capabilities restrict much user behavior) and have the probability of mistake p = 0.05. Then one can calculate the average search time for the original menu structure (approximately 8.36 sec). Substituting the parameter values into the formula of Subsection 5.3 obtain the optimal menu breadth r = 8, and the optimal proportion of popularities (0.33, 0.23, 0.16, 0.11, 0.07, 0.05, 0.03, 0.02). Note the optimal menu is extremely
asymmetric. The lower bound for the average search time is approximately 6.74 sec. The discreteness of items set and semantic constraints prevent the building of a purely optimal menu. Using the routine described in section 2 the original structure was transformed into the one depicted in the right panel of Figure 3. Simple computations in accordance with the adopted model give the average search time of 7.22 sec for this structure. Thus aligning the menu structure to the optimal template fastens the access by 13.5% on average. The average search time for the meaningful optimized menu is just 6.6% higher than the lower bound (6.74 sec), which is adequate.
7. DISCUSSION The suggested theory and the design process improve the existing approaches in several aspects. The theoretical model is akin to Thimbleby’s [19, 20] approach. Both approaches rest on the Zipf’s Principle of Least Effort. At the same time, the approach of [19] essentially relies on the “number of buttons pressed” criterion. It asserts sequential menu scanning, and does not distinguish between browsing single menu and drilldown. This fits well with the keypad input but not the richer interfaces. The average search time seems more flexible. It is adjusted to different contexts (the model of buttons presses has the only parameter – the probability of a user mistake), and brings the model close to the body of “breadth vs. depth” literature. We extend the approach of Lee and MacGregor [9] allowing for different item popularities and asymmetric hierarchies (remember the Least Effort principle!) with varying breadth. We took the approach of Fisher et al. [4] to the generation of meaningful items groupings, but we use hierarchical taxonomy in the context of a single menu panel. Several simple taxonomies are used to build different panels. This gives the designer the desired level of flexibility and eases the task of classification. There are many controversial aspects of the suggested approach, and we would like to address some possible concerns. The strongest assumption of the theoretical model is that navigation delays in a menu panel do not depend on the sense of the categories. In the context of the whole routine this means that all admissible labels (having good semantic quality) are supposed to require the same time to be read, while inadmissible labels are prohibited. This assumption is typical for all known formal models of menu selection. The main reason is that accounting for the specifics of every potential category label would require extensive data that are usually unavailable at the moment of menu design. In the routine that uses predefined taxonomies the length of the label can be used to adjust the reading delays. The uniform cost functions are a special case of the so-called sectional cost functions that depend on the menu categories (i.e. item
groups) per se, not just on their popularities. Effective algorithms are developed in [21] for optimal tree search under the sectional cost function. Thus, our model can be refined to account better for the context but this will complicate both the math and the work of a designer. Structure optimization and semantic constraints are split. This assumption is good if one can always find a meaningful hierarchy with the nearly optimal structure (as small deviation from the optimal shape lead to small menu quality losses). At the end, this assumption can only be verified or contested by the practice of menu design. Above we provided an example of the real menu optimization. There is a concern about using item taxonomies to fill the suggested pattern of menu panel. Does this way give the flexibility of choosing the appropriate menu breadth? There is a solution. The taxonomies must be detailed enough – the number of categories should be more than the maximum number of menu alternatives considered. In this case several categories can be hidden into the “Others” category (see the “…” alternatives in Figure 1). Another way to adjust a menu breadth is to use hierarchical classifications [4], which allow one to easily merge the categories thus decreasing the breadth. Several authors (e.g. see [7, 18] and references there) consider the user goals consisting of multiple items (a user wants to access them all during one menu session or, alternatively, any item suffices). This situation is typical for a data store (e.g. web catalog) search. The case of the user returning to the top of the menu after finding each item is easily incorporated in our model. Direct accounting for the general case in the context of frequency analysis that we adhere requires computing at least the proximity matrix for the pairs of menu items (n⋅(n – 1) figures), or even the probability of every target set (2n figures). We believe the effect it has on the menu structure does not justifies the efforts. We described just one way of dealing with user mistake probability. The problem is that “there are infinitely many ways of being wrong, and a designer can only think of a limited number of them” [20]. New models of erroneous behavior may be developed on demand, but some of them may require the optimization framework enhancements. This can be the subject of prospective studies. The considered comprehensive model of delays still loses the specificity of one sort of motor delay arising in pointer-driven systems. By Fitts’ Law [3] the pointer movement time depends on the amplitude of movement, thus motor delays in a menu panel depend both on the position of the alternative and on the position of the alternative selected on the previous panel. There are ways to address this issue but they complicate the model. A serious problem is the complexity of menu models used to predict the menu navigation time. To build a reliable model an extensive experimental work is required. Unfortunately,
the content and scale of the experiments are completely dictated by the intention to minimize the average search time. Experimental methods are a well-developed field of CHI research [14], and, at the end, we need just average selection time estimates. Once built, the model of the new menu type delays can be then reused.
8. CONCLUSION We suggested an automated routine for menu structure optimization that employs the theory, experimental estimates and informal judgments. The theory says the tree structure of the optimal menu must be uniform. Usually the best uniform tree cannot be built exactly but the closer the attributes of the menu (breadth and proportion) to the ideal ones, the lower is the average search time. There is always a great number of approximately optimal menu structures, similar in shape but differing in content, for menu designer to choose from. The model also eases measuring the performance of new menu types. Comparing the performance of menu types on the single menu structure is not a proper way. The correct approach is to compare the optimal menu structures for every menu type (and, in fact, in varying environment!). Our theory allows the designer to concentrate on the modeling of a single menu panel, and given the model the performance benchmarks follow immediately. At the moment the prototype of the CAD system for menu optimization based on the described approach is under development. The prospective lines of theory improvement include accounting for numerous advanced aspects arising in practice: group targets, variable items’ popularity, screen capacity constraints, invalidated items, variable semantic constraints, fixed and dynamic menus, and others. Another promising direction is the consideration of less formal usability criteria besides the average search time.
ACKNOWLEDGMENTS We thank Prof. A. A. Voronin and Dr S. P. Mishin for developing the theory of hierarchy optimization, Prof. D. A. Novikov and participants of his seminar for productive discussions. The research is supported by the grant 10-07-00129 of Russian Foundation for Basic Research.
REFERENCES 1. Andersson, E., Isaksson, I.-M. Exploring alternatives to
the hierarchical menu structure used in mobile phones. Master’s Thesis. Umea University. Department of Computing Science (2007).
2. Bernard, M. L. Examining a metric for predicting the accessibility of information within hypertext structures. Ph.D. thesis, Wichita State University, Wichita, KS, USA, (2002).
3. Cockburn, A., Gutwin, C., and Greenberg S. A. Predictive Model of Menu Performance. Proc ACM CHI'07, ACM Press, (2007), 627–636.
4. Fisher, D. L., E. J. Yungkurth, and S. M. Moss. Optimal menu hierarchy design: syntax and semantics. Human Factors 32(6), (1990), 665–683.
5. Goubko, M. V. The search for optimal organizational hierarchies with homogeneous manager cost functions. Automation and Remote Control 69, 1 (2008), 89–104.
6. Goubko, M. V. Algorithms to construct suboptimal organization hierarchies. Automation and Remote Control 70, 1 (2009), 147–162.
7. Hollink, V., Van Someren, M., and Wielinga, B. Navigation behavior models for link structure optimization. User Modeling and User-Adapted Interaction 17, 4 (2007), 339–377.
8. Landauer, T. K., and Nachbar, D. W. Selection from alphabetic and numeric menu trees using a touch screen: depth, breadth and width. Proc. of the SIGCHI conf. on Human Factors in Computing Systems, ACM Press (1985), 73–78.
9. Lee, E., and MacGregor, J. Minimizing user search time in menu retrieval systems. Human Factors 27, 2 (1985), 157–162.
10. Mishin, S. P. Optimal Organizational Hierarchies in Firms. Journal of business economics and management, Vol. 8, No. 2 (2007), 79–99.
11. Norman, K. L. The Psychology of Menu Selection: Designing Cognitive Control at the Human/Computer Interface. Ablex Publishing Corporation, Norwood, 1991.
12. Norman, K. L., and Chin, J. P. The effect of tree structure on search in a hierarchical menu selection system. Behaviour and Information Technology 7 (1988), 51–65.
13. Paap, K. R., and Roske-Hofstrand, R. J. The Optimal Number of Menu Options per Panel. Human Factors 28, 4 (1986), 377–385.
14. Research Methods for Human-Computer Interaction. Edited by Cairns, P. and Cox, A. L. Cambridge University Press, (2008).
15. Robertson, G., McCraken, D., & Newell, A. The ZOG approach to man-machine communication. The International Journal of Man-Machine Studies, 14, (1981), 461–488.
16. Sears, A., and Shneiderman, B. Split menus: Effectively using selection frequency to organize menus. ACM ToCHI 1, 1 (2004), 27–51.
17. Shneiderman, B. Software psychology: Human factors in computer and information systems. Cambridge, MA: Winthrop (1980).
18. Someren, M. van, Hollink, V. Validating Navigation Time Prediction Models for Menu Optimization.
Proceedings of the 14th Workshop on Adaptivity and User Modeling in Interactive Systems, Hildesheim, Germany, (2006), 47–52.
19. Thimbleby, H. Analysis and Simulation of User Interfaces. HCI 2000, Proceedings British Computer Society Conference on Human-Computer Interaction, XIV, (2000), 221–237.
20. Thimbleby, H. Press On – Principles of Interaction Programming. MIT Press, (2007).
21. Voronin, A. A., and Mishin, S. P. Algorithms to Seek the Optimal Structure of the Organizational System. Automation and Remote Control. 63, 5, (2002), 803–814.
APPENDIX. PROOFS OF FORMAL RESULTS
Proof of theorem 1. The proof is based on induction on the number of items n. For the sole item (i.e. n = 1) the sole tree exists with no panels at all. Let us consider it uniform. Its search time equals to zero, so formula (1) holds. Suppose the theorem holds for every items number less than n. Let us prove it then holds for n items. In a (r, x)-uniform tree H top category has the popularity µ, and its subcategories s1, …, sr have the popularities µk = xkµ, k = 1, …, r. The average search time T(H) of the tree consists of the cost of the top menu panel and the costs of the subtrees H1, …, Hr, rooted by the subcategories s1, …, sr. As every subtree Hk is also a uniform tree for the set of items sk, k = 1, …, r, and all categories sk consist of less than n items, the search time of the uniform tree is, by induction:
)(...)(),...,()( 11 rr HTHTxxtHT +++⋅= µ ,
where T(Hk), k = 1, …, r, are calculated according to (1). Let us denote for short ),...,(: 1 rxxtC = . Then
=−
−+= ∑∑
∑=
=∈
r
kri iisw
kkxx
CwwCHTk1
1 ln))(ln)(ln()( µµµµµ
=−
−+−
=∑
∑ ∑∑
=
=∈
=
r
i ii
r
ksw
kkr
i ii
xx
wwxxC k
1
11
ln
))(ln)(ln(ln µµµµµ
=−
−−=
∑
∑ ∑
=
= ∈
r
i ii
r
i swiiii
xx
wwxC i
1
1
ln
])(ln)(lnln[ µµµµµ
=−
−=
∑
∑ ∑
=
= ∈
r
iii
r
i swiii
xx
wwxC i
1
1
ln
)](ln)()/ln([ µµµµ
=−
−=
∑
∑∑
=
==r
iii
n
w
r
ii
xx
wwC
1
11
ln
)(ln)()ln( µµµµ
1 1
1
ln( ) ( ) ln ( )
ln
r n
ii w
r
i ii
w wC
x x
µ µ µ µ= =
=
−= =
−
∑ ∑
∑1
1
1
( ,..., )( ln ( ) ln ( )) .ln
nr
rw
i ii
c x xw wx x
µ µ µ µ=
=
= −−
∑∑
QED.
Proof of theorem 2. The idea is analogous to theorem 1. Use induction on the number of items n. For the sole item with the measure µ1 TL(µ1) = 0, and is equal to the search time of the only possible “empty tree”. Suppose the theorem holds for every number of items less than n. Prove that it then holds for n items. Consider some tree H where the top category s with the popularity µ is divided into k subcategories s1, …, sk with the popularities µ1, …, µk. The search time of the tree consists of the cost of the top menu panel and the costs of the trees H1, …, Hk rooted by the categories s1, …, sk (if the tree consists of the sole item, its search time equals to zero):
)(...)()/,...,/()( 11 kk HTHTtHT +++⋅= µµµµµ .
As the categories s1, …, sk consist of less than n items, the average search time in the corresponding subtrees by induction is not less than TL(si). Thus,
)(...)()/,...,/()( 11 kLLk sTsTtHT +++⋅≥ µµµµµ .
In the right side of the inequality we see the fixed menu breadth k and the fixed partition s1, …, sk of the set N. Consequently, the right side will not grow if we take the minimum for all k from 2 to n and for all possible partitions s1, …, sk of the set N. So,
)()/)(,...,/)((minmin)(1
1:,...,...2
1
1∑
==
=+⋅≥
=
k
iiLk
Nsssnk
sTsstHTk
i i
k
µµµµµ
.
Let us adopt the notation for convenience
∑ =∈= −
= ki ii
k
Dynk yyyyt
nFk
1
1
)(...2 ln),...,(
minmin:),(ε
ε .
Here Dk(ε) is the part of k-dimentional simplex, where every component of the vector is not less than ε. The notation allows writing (1) in a compact form:
),())(ln)(ln()( 1 εµµµµ nFwwNT nwL ∑ =
−=
Let us denote also r(n, ε) as the breadth, and x(n, ε) = (x1(n, ε), …, xr(n, ε)(n, ε)) as the proportion, where minimum in (2) is achieved. Let us sharpen the inequality
.),(])(ln)(ln[
)/)(,...,/)((minmin)(
1
1:,...,...2
1
1
∑ ∑= ∈
==
−+
+⋅≥
=
k
iii
swii
k
Nsssnk
nFww
sstHT
i
k
i i
k
εµµµµ
µµµµµ
Replace ni by n, and εi by ε, thus widening the minimization domain:
).)(ln)(ln)(,(
),...,(minmin)(
1
1)(...2
∑∑∈=
∈=
−⋅
+⋅≥
Nw
k
iii
kDynk
wwyynF
yytHTk
µµµµε
µε
Add and subtract TL(N) in the right side of the inequality:
=+−
−−
+⋅+≥
∑
∑∑
∈
∈=
∈=
))(ln)(ln
)(ln)(ln)(,(
),...,(minmin)()(
1
1)(...2
Nw
Nw
k
iii
kDynkL
ww
wwyynF
yytNTHTk
µµµµ
µµµµε
µε
=−+
++=
∑=
∈=
)lnln)(,(
),...,(minmin)(
1
1)(...2
µµµµε
µε
k
iii
kDynkL
yynF
yytNTk
.ln),(),...,(minmin)(1
1)(...2∑
=∈=++=
k
iiikDynkL yynFyytNT
k
εµε
Take the positive factor ∑=
−k
iii yy
1ln out the brackets:
).,(ln
),...,()ln(minmin
)()(
1
1
1)(...2εµ
εnF
yy
yytyy
NTHT
k
iii
kk
iiiDynk
L
k
−−
−+
+≥
∑∑
=
=∈=
The first multiplier of the minimized expression is non-negative. The second multiplier is also non-negative as it achieves the minimum (that is equal to zero) at k = r(n, ε), y = x(n, ε). Consequently, the minimum in the right side is equal to zero, and T(H) ≥ TL(N). QED.