Embed Size (px)
Citation preview

A 7-amino-acid insert in the heavy chain nucleotidebinding loop alters the kinetics of smooth musclemyosin in the laser trap
ANNE-MARIE LAUZON 1 , MATTHEW J. TYSKA 1 , ARTHUR S. ROVNER 1 ,YELENA FREYZON 2 , DAVID M. WARSHAW 1 * and KATHLEEN M. TRYBUS 2
1 Department of Molecular Physiology and Biophysics, University of Vermont, Given Medical Building, D-217, Burlington, VT 054052 Rosenstiel Research Science Center, Brandeis University, Waltham, MA 02254, USA
Received 31 March 1998; revised 13 July 1998; accepted 20 July 1998
Summary
Two smooth muscle myosin heavy chain isoforms differ by a 7-amino-acid insert in a ¯exible surface loop located near thenucleotide binding site. The non-inserted isoform is predominantly found in tonic muscle, while the inserted isoform ismainly found in phasic muscle. The inserted isoform has twice the actin-activated ATPase activity and actin ®lamentvelocity in the in vitro motility assay as the non-inserted isoform. We used the laser trap to characterize the molecularmechanics and kinetics of the inserted isoform ((+)insert) and of a mutant lacking the insert (())insert), analogous to theisoform found in tonic muscle. The constructs were expressed as heavy meromyosin using the baculovirus/insect cellsystem. Unitary displacement (d) was similar for both constructs (� 10 nm) but the attachment time (ton for the ())insertwas twice as long as for the (+)insert regardless of the [MgATP]. Both the relative average isometric force�Favg�ÿinsert�=Favg��insert�� � 1:1� 0:2 (mean � SE) using the in vitro motility mixture assay, and the unitary force (F � 1 pN)using the laser trap, showed no difference between the two constructs. However, as under unloaded conditions, ton underloaded conditions was longer for the ())insert compared with the (+)insert construct at limiting [MgATP]. These datasuggest that the insert in this surface loop does not affect the mechanics but rather the kinetics of the cross-bridge cycle.Through comparisons of ton from d measurements at various [MgATP], we conclude that the insert affects two speci®csteps in the cross-bridge cycle, that is, MgADP release and MgATP binding. Ó Kluwer Academic Publishers.
Introduction
Smooth muscle myosin heavy chain isoforms aregenerated by alternative splicing from a single gene(Eddinger & Murphy, 1988; Nagai et al., 1989; Somlyo,1993; White et al., 1993). Two of these isoforms differstructurally by the presence or absence of a 7-amino-acid insert in the ¯exible surface loop located betweenthe 25 and 50 kDa tryptic domains of the myosin head(Fig. 1) (Kelley et al., 1993; White et al., 1993). Theexpression of these two isoforms is tissue-speci®c(Babij, 1993; White et al., 1993). The non-inserted iso-form is found primarily in tonic muscle, while theinserted one is found predominantly in phasic mus-cle. The expression of these two myosin isoformscould in part account for the dramatic difference inshortening velocity between phasic and tonic smooth
muscles. Indeed, the actin-activated ATPase rate ofmyosin isolated from phasic muscle and its velocity ofactin movement (mmax) in an in vitro motility assay areknown to be greater than those of myosin from tonicmuscle (Kelley et al., 1993). However, two essentiallight chain (ELC) isoforms that are co-expressed withthe inserted and the non-inserted heavy chain iso-forms (i.e. the acidic ELC (LC17a) with the insertedisoform, and the basic ELC (LC17b) with thenon-inserted isoform) have confounded the issue.Therefore, Rovner and colleagues (1997) co-expressedknown heavy chain variants and ELC in the baculo-virus system and showed that the presence of theinsert is necessary and suf®cient to double the actin-activated ATPase activity and mmax. To de®ne furtherthe functional consequences resulting from the pres-ence or absence of the insert, independent of anyother amino-acid differences that may exist betweenthe heavy chains of phasic and tonic tissues, we haveexpressed two heavy meromyosin (HMM) constructs:
*To whom correspondence should be addressed.E-mail: [email protected]
0142±4319/98 Ó Kluwer Academic Publishers
Journal of Muscle Research and Cell Motility 19, 825±837 (1998)

a chicken gizzard isoform that normally contains theinsert ((+)insert) and a mutated form lacking the in-sert (())insert). These constructs demonstrated a two-fold difference in their mmax. The molecular basis forthis difference was then investigated.
At the molecular level, mmax is related to the dis-placement generated by myosin during its powerstroke (d), and to the period of the cross-bridge cycleduring which the myosin head remains attached tothe actin ®lament following the power stroke (ton), asfollows:
mmax � d=ton �1�Doubling of mmax can therefore be obtained by doub-ling d, by halving ton, or by a combination of the twoprocesses. If d re¯ects the mechanical capacity of themyosin molecule, whereas ton is dependent on the
kinetics of the cross-bridge cycle, one can determinethe effect of the insert on myosin's mechanics and/orkinetics through measurements of these molecularindices.
In the present study, we used the laser trap tomeasure d and ton directly from single (+)insert and())insert HMM molecules. To complete the charac-terization of the functional properties of these twoconstructs, we measured their relative average force(Favg) in a mixture motility assay (Warshaw et al.,1990; Harris et al., 1994) and their unitary force (F)with the laser trap. Our results demonstrate that thepresence of the insert alters the kinetics rather thanthe mechanics of the myosin molecule. Because our invitro expressed constructs differ only by the 7-amino-acid insert within the 25±50 kDa loop, this conclusionis unequivocal.
Fig. 1. Structural model of the (+) and ())insert smooth muscle myosin heavy chain constructs. The 7-amino-acid insert isshown in green and the rest of the surface loop is shown in white. The ())insert loop is shown in magenta, like the rest of themyosin heavy chain. The essential and regulatory light chains are shown in violet and pink respectively. The model wasgenerated using the coordinates of Rayment and coworkers (1993) using Insight 2, v. 95.0 (MSI).
826 LAUZON et al.

Materials and methods
HMM CONSTRUCT PREPARATION
Homogeneous HMM populations of the (+)insert isoformand the ())insert mutant were prepared by baculovirusexpression as previously reported (Rovner et al., 1997). The(+)insert isoform cDNA was obtained from chicken gizzardheavy chain. The ())insert mutant was obtained by remov-ing the 7-amino-acid insert (QGPSFSY) in the surface loop(Rovner et al., 1997).
ACTIN
Actin was puri®ed from chicken pectoralis acetone powderas previously described (Pardee & Spudich, 1982) andstored as ®laments at 4°C. Skeletal muscle a-actin has pre-viously been demonstrated to be functionally similar to thesmooth muscle a-actin isoform in the in vitro motility assay(Harris & Warshaw, 1993). Therefore, in this study, anyobserved difference between the two myosins cannot beattributed to the use of skeletal muscle actin. Actin was¯uorescently labelled by incubation with tetramethylrhod-amine isothiocyanate (TRITC)-labelled phalloidin (Sigma)(Warshaw et al., 1990).
BUFFERS
Solution concentrations were as follows: myosin buffer:300 mM KCl, 25 mM imidazole, 1 mM EGTA, 4 mM MgCl2,10 mM dithiothreitol (pH 7.4); actin buffer: 25 mM KCl,25 mM imidazole, 1 mM EGTA, 4 mM MgCl2, 10 mM di-thiothreitol (pH 7.4) with an oxygen scavenger system toretard photobleaching consisting of 0.1 mg ml)1 glucoseoxidase, 0.018 mg ml)1 catalase and 2.3 mg ml)1 glucose.
LASER TRAP
The laser trap (Finer et al., 1994) and its implementation inour laboratory have been reported before (Dupuis et al.,1997; Guilford et al., 1997). Brie¯y, the beam of a variable-power diode pumped Nd: YAG solid-state laser (SpectraPhysics, Model T-10V-106C, TEM00, max. power 2.5 W,1064 nm) was split into two orthogonally polarized beams.Each beam was expanded by an independent telescope to®ll the back-aperture of a microscope objective. The beamswere recombined by a cubic beam splitter before enteringthe microscope objective, which focused them into two in-dependent traps capable of trapping polystyrene micro-spheres to which an actin ®lament was subsequentlyattached (see below).
Unitary displacement events generated by the actomyosininteraction were detected by changes in position of thebright-®eld image of one of the trapped microspheres (Fineret al., 1994). This image was projected on to a quadrantphotodiode detector (QD). The QD provided displacementsignals in both the x and y directions, where x was parallelto the actin ®lament's longitudinal axis and y perpendicular.The position of the trapped bead, detected by the QD, couldalso be controlled by an acousto-optic modulator (AOM).When making force measurements, the signal from the QDwas fed through a feedback system that controlled theAOM, which by rapid de¯ection of the laser beam, kept the
microsphere stationary (Finer et al., 1994). Force was ob-tained by calibration of the correction signal sent to theAOM from the feedback circuitry. The microsphere positionwas well controlled only up to 140 Hz.
The analogue displacement signals were low-pass ®lteredwith a cut-off frequency of 2 kHz. Both x and y displace-ments and the force signal were recorded on videotape witha multichannel FM recording adapter. The recorded datawere then digitized at 4 kHz for later analysis.
The microscope was equipped for bright-®eld and epi-¯uorescence, so that the investigator could simultaneouslyobserve the microspheres with a CCD camera and the¯uorescently-labelled actin ®laments with a SIT camera.The experimental ¯ow cell was oil-coupled to both theobjective and the condenser. The temperature of the ¯owcell was maintained at 25°C by regulating the temperatureof the objective and condenser through a resistive heatingdevice.
LASER TRAP EXPERIMENTAL PROTOCOL
A detailed description of the protocol has been publishedpreviously (Guilford et al., 1997). In brief, ¯ow cells ofapproximately 18 ll were constructed in the following way.A small coverslip (22 ´ 22 mm) was sprayed with 2 lm sil-ica microspheres and then coated with nitrocellulose (Fineret al., 1994; Guilford et al., 1997). The glass microspheres wereused to create pedestals to position the HMM off the surfaceof the coverslip. A second coverslip (24 ´ 30 mm) was gluedto the ®rst with�100 lm mylar shims (McMaster Carr) usingcurable UV glue (Norland Optical Adhesive).
1 lm polystyrene microspheres were coated withN-ethylmaleimide (NEM)-modi®ed myosin which does nothydrolyse MgATP and therefore was used to bind actintightly to the microspheres. In this way, the microspherescould serve as handles for manipulating an actin ®lament insolution. NEM-myosin was prepared as previously de-scribed (Warshaw et al., 1990). Microspheres (� 2� 108)were suspended by sonication in � 45 ll of a solution con-taining NEM-myosin (3.2 mg ml)1 in myosin buffer and50% glycerol) and then incubated for 30 min. Myosin buffer(200 ll) was then added to the suspension, followed bysonication, and then spun down at 103 rpm for 2 min. Thepellet was rinsed 2±3 times with actin buffer to removeunbound NEM-myosin, and the microspheres were ®nallyresuspended in actin buffer.
Before each experiment, HMM (200 lg ml)1 in actinbuffer) was mixed with an equimolar quantity of ®la-mentous actin and 1 mM MgATP in actin buffer. Thissolution was spun using an ultracentrifuge (Beckman, TLX-120) for 20 min at 9.5 ´ 103 rpm to pellet the actin and anyattached ATP-insensitive HMM. The supernatant wasdiluted with actin buffer to a ®nal HMM concentration of4 lg ml)1. On the motility surface, HMM molecules werebound to nitrocellulose by the S2 region of the rod through amonoclonal antibody (S2.2; Trybus & Henry, 1989). Thismode of attachment is needed for normal motility ofsmooth muscle HMM (Horowitz & Trybus, 1992). TRITC-phalloidin-labelled actin (1 mM) was diluted approximately600-fold in actin buffer just before use.
Solutions were applied to the ¯ow cells in 18 ll aliquots inthe following order: (1) 100 lg ml)1 S2.2 antibody in myosin
An insert in the motor domain alters the kinetics of myosin 827

buffer, incubation of 2 min; (2) 0.5 mg ml)1 bovine serumalbumin (BSA) (Sigma) in myosin buffer, incubation of2 min; (3) HMM in actin buffer (4 lg ml)1), incubation of2 min; (4) one wash with actin buffer; (5) a mixture ofequal volumes of NEM-myosin coated microspheres andTRITC-labelled actin, both in actin buffer containing either1 lM, 10 lM or 1 mM MgATP. Most of the laser trap studiesare performed at limiting [MgATP] � 10 lM to prolong thelifetime of the unitary events.
The ¯ow cell was then transferred to the stage of themicroscope, one NEM-myosin coated microsphere wascaptured in each trap, and an actin ®lament was strungbetween them. The distance between the microspheres wasset such that the actin ®lament was pre-tensioned by� 2±4 pN (Dupuis et al., 1997). The actin ®lament was thenmoved to the vicinity of an HMM-coated pedestal and abaseline record was obtained at the same height as for eventrecordings. The actin ®lament was then centred over thepedestal and a recording was obtained for � 1 min. Eventswere considered to be in the forward direction when theimaged microsphere was pulled in the direction thatapplied more tension to the ®lament. If the majority of theevents were in the reverse direction, the actin ®lamentpolarity was changed by ¯ipping the microsphere±actin±microsphere assembly. Only data without signi®cant dis-placement in the y direction were considered.
The QD sensitivity was obtained at the time of theexperiment by removing the tension from the actin ®la-ment, and measuring the QD voltage while moving themicrosphere with the AOM in a series of 9 nm steps. Inaddition, trap stiffness was determined from the Brownianmotion of the microsphere by the equipartition method(Svoboda et al., 1993; Dupuis et al. 1997; Guilford et al.,1997). The trap stiffness used for the displacement mea-surements was 0.03 pN nm)1, whereas it was increased to0.08 pN nm)1 to reduce the system compliance and in-crease the system bandwidth in feedback mode. Withfeedback, the trap stiffness was effectively two orders ofmagnitude greater.
LASER TRAP ANALYSIS
Unitary displacement
The displacement measurements made with the laser trapare of similar amplitude as the Brownian motion of themicrospheres in solution. Appropriate analysis techniquesthat are statistical and unbiased are therefore required forsuch a low signal-to-noise ratio. We chose to use the mean±variance (MV) analysis, as developed by Patlak (1993) forthe analysis of single ion-channel current data (see Guilfordet al., 1997, for details). Brie¯y, the MV analysis consists oftransforming the data from a time series into a mean±variance histogram. A window of a given width is movedacross the data, one point at a time, and the mean andvariance are calculated for that window at each point. TheMV estimates are then assembled into a three-dimensionalhistogram of binned mean versus log-binned variance. Thethird dimension of this MV histogram is the total number ofsampled points (cumulative time) spent at a particular meanand variance. This is a model-independent transformationof the data.
Baseline and displacement event populations are de-scribed in these histograms as three-dimensional peaks, thatis, regions of high probability density or `volume' (seeFig. 2). By ®tting these peaks, one can obtain a quantitativeand statistical description of the event population with re-gards to its mean unitary displacement (Guilford et al.,1997).
MV analysis offers superb resolving power, given theknown reduction in the displacement signal variance thatoccurs upon HMM attachment to the actin ®lament (Fineret al., 1994; Molloy et al., 1995; Guilford et al., 1997). Thisreduction is the result of HMM adding its stiffness to themicrosphere±actin ®lament±microsphere system, thus re-ducing the Brownian noise. Therefore, displacement popu-lations are separated from the baseline population in bothmean (i.e. d) and variance (see Fig. 2).
Unitary force
MV analysis was applied to the force data in a similarmanner as for the displacement data, with the only excep-tion that we took advantage of the residual x displacementsignal as a result of the limited bandwidth of the feedbacksystem (see Fig. 5). When HMM attached to actin, thevariance of the x displacement signal was reduced to agreater extent than any reduction of variance in the forcesignal itself. Therefore, when performing MV analysis offorce data, the mean was calculated from the force timeseries and the variance was calculated from the x displace-ment time series.
Event duration �ton�MV analysis can also be used to estimate event duration(ton). It is assumed that individual ton are distributed sto-chastically and according to an exponentially decreasingprobability function. It is important to note that MV analysisemphasizes the events of greater duration than the windowwidth (N). The total time spent in a given event population(or volume, Vmv) depends on the difference between ton andN. Therefore, the longer the event duration compared withN, the more entries in Vmv: Vmv is estimated from thebaseline-subtracted histogram by counting only those pointswithin the event population. The relationship betweenVmv; ton, N, and the number of events (j) has previouslybeen determined (Patlak, 1993; Guilford et al., 1997):
Vmv � tonj eÿ�Nÿ1�=ton �2�To estimate ton, the data are resampled at 1000 Hz, Vmv atdifferent window widths is obtained, and Equation (2) is®tted to the data (see Fig. 3). Window widths of the range20±1000 ms were used for the displacement data and20±1500 ms for the force data. By mathematical simula-tions, we showed that ton as small as 4 ms can be resolvedwith this technique at a sampling frequency of 1000 Hz.
IN VITRO MOTILITY MIXTURE ASSAY
The in vitro motility mixture assay has been described before(Warshaw et al., 1990; Harris et al., 1994). Brie¯y, when actinis moving over a mixture of two myosin populations, in thiscase a mixture of (+)insert and ())insert HMM, mechanical
828 LAUZON et al.

interactions occur between the two isoforms which thendetermine the actin ®lament velocity (Warshaw et al.,1990; Harris et al., 1994; Cuda et al., 1997). A cross-bridgeinteraction model has been developed that allows one torelate the myosin mixture concentration v. actin ®lamentvelocity data to the force-generating capacity of the twomyosins (Warshaw et al., 1990; Harris et al., 1994).
Proteins and ¯ow cells were prepared as for the laser trapexperiments, with the exception that coverslips were notsprayed with silica microspheres. HMM mixtures of(+)insert and ())insert were prepared by combining appro-priate quantities of each construct to obtain a total concen-tration of 200 lg ml)1. The following solutions were appliedto the ¯ow cells in 18 ll aliquots: (1) 100 lg ml)1 S2.2 anti-body in myosin buffer, incubation of 2 min; (2) 0.5 mg ml)1
BSA in myosin buffer, incubation of 2 min; (3) HMM in actinbuffer (200 lg ml)1), incubation of 2 min; (4) one wash withactin buffer; (5) two washes with labelled actin (10 lM) inactin buffer, 30 s incubations; (6) one wash with actin buffer;(7) three washes with actin buffer containing 0.5% methyl-cellulose (to prevent actin from diffusing away from theHMM-coated surface) and 1 mM ATP to initiate actin ®la-ment movement. This motion was analysed for velocity by apreviously reported technique (Work & Warshaw, 1992).
To estimate the relative maximum average cross-bridgeforce (Favg) generated by each construct, the myosin inter-action model was ®tted to the HMM mixture concentrationv. actin ®lament velocity data (for details see Harris et al.,1994). An approximately linear relationship should beobserved if Favg�ÿinsert�=Favg��insert� � 1, a concave-up rela-tionship should be observed if Favg�ÿinsert�=Favg��insert� > 1,and a concave-down relationship should be observed ifFavg�ÿinsert�=Favg��insert� < 1 (see Fig. 1A in Harris et al., 1994).
Results
Actin ®lament velocity and unitary displacements
mmax, obtained in the motility assay at 1 mM MgATP,is 1.8-fold faster for the (+)insert than for the ())insertconstruct (Table 1), similar to that reported previously(Kelley et al., 1993; Rovner et al., 1997). To understandthe molecular basis for this difference, unitarydisplacement events for the two constructs wereobtained using the laser trap.
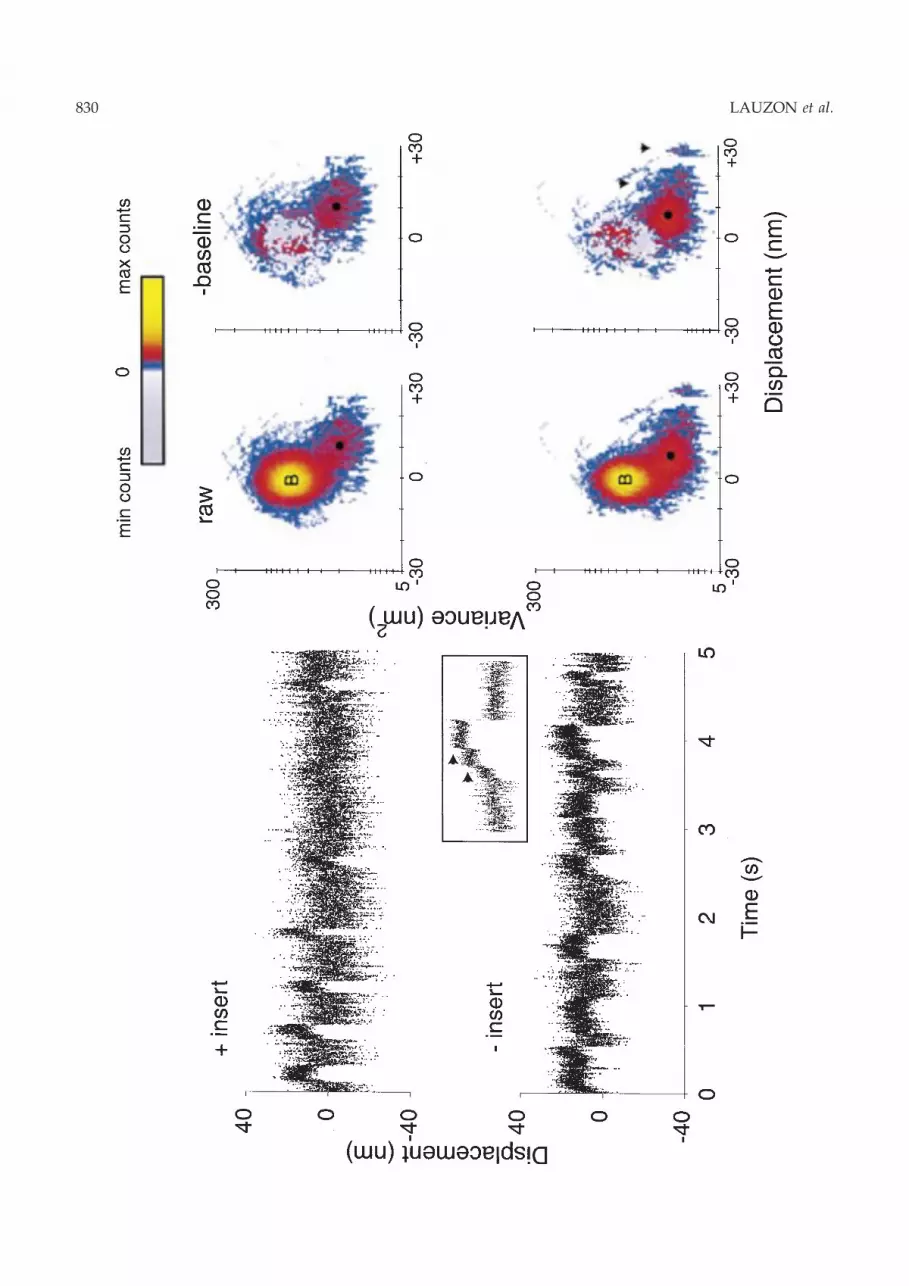
Sample unitary displacement data for each con-struct at 10 lM MgATP are shown in Fig. 2. Only 5 sof � 1 minute displacement records are presented inFig. 2, as well as the corresponding MV histogramsfor the full data records. Depending on the recordduration and event density, a single MV histogrammay contain information from 30±200 events. For thisstudy, numerous myosin molecules from different¯ow cells at each MgATP concentration were studied(see n in Table 1).
The time series show periods of Brownian noise (i.e.baseline) interspersed with HMM-generated dis-placement events. During events, the variance of thenoise is decreased due to the HMM attachment, asdescribed above. We take advantage of this variancereduction in the MV analysis to separate the eventsfrom baseline. By visual inspection, the event ampli-tudes appear to be similar for both constructs. How-ever, the event durations, ton, appear longer for the())insert construct.
To quantify rigorously the mean unitary displace-ment (d) and ton, we transformed time series datasuch as Fig. 2 into MV histograms. The `raw' histo-grams are characterized by a signi®cant baselinepopulation centred on a mean displacement of 0 nm.Leaving this baseline population are arches in thehistogram that settle into a population with a highermean displacement and lower variance (i.e. the myo-sin displacement event population). An arch occurswhen a window passes over a transition between twosteady displacement levels (e.g. between baseline andthe plateau of an event). By characterizing and ®ttingthe baseline population from data where myosin-generated events are not present, we can then sub-tract this ®tted baseline population from the rawhistogram. This subtraction results in a histogram (seeFig. 2, )baseline) where most of the remaining entriesexist within a single event population, while othersexist in transition arches and randomly distributedleftover entries in the baseline population. Previousmodelling efforts have demonstrated that this sub-traction procedure does not remove histogram entries
Table 1. Velocity and displacement results summary.
Velocity Displacement
1 mM [MgATP] 1 mM [MgATP] 10 lM [MgATP] 1 lM [MgATP]
mmax (n)(lm s)1)
d (n)a
(nm)ton (n)b
(ms)d (n)a
(nm)ton (n)b
(ms)d (n)a
(nm)ton (n)b
(ms)
(+) insert 0.88 � 0.07 (5) 11.2 � 1.0 (3) 28 � 6 (3) 9.6 � 1.0 (11) 158 � 19 (11) 9.0 � 0.9 (6) 505 � 84 (6)()) insert *0.49 � 0.03 (5) 10.0 � 1.1 (3) 47 � 12 (3) 9.3 � 0.9 (8) 301 � 32 (8) ND ND
Data are presented as means � S E. The velocities of the two constructs were compared by Student's t-test.* Signi®cant at the <0.05 level. d and ton were compared for [MgATP] and construct by ANOVA.a There is no effect of either [MgATP] or construct on d.b There is an effect of both [MgATP] (p < 0.001) and construct (p < 0.012) on ton.ND, not determined. d and ton for the (+)insert at 10 lM and 1 lM were obtained from Warshaw and colleagues (1998).
An insert in the motor domain alters the kinetics of myosin 829
830 LAUZON et al.

that might be associated with an event population(Guilford et al., 1997).
Occasionally, more than one event population isobserved (Fig. 2; arrowheads, )baseline MV histo-gram). These higher-order event populations areusually centred at a displacement level that is amultiple of the mean displacement for the dominantevent population (Fig. 2, black dot). Multiple eventpopulations can result when more than one HMMmolecule interacts with the actin ®lament. Suchinteractions produce staircase displacement events(for example, see Fig. 2 inset). In fact, staircase eventsare identi®ed by transition arches between eventpopulations (Fig. 2, lower histograms). Not all data-sets contained multiple event populations, but if so,we then estimated d by ®tting all event populationssimultaneously (see Guilford et al., 1997) and report-ing only the d associated with the dominant eventpopulation (black dots, Fig. 2, Table 1).
To characterize further the predominant eventpopulation, an estimate of the event population widthalong the displacement axis was obtained for eachconstruct to determine if the event population mightbe differentially distributed between constructs. Anestimate of this distribution was obtained from thestandard deviation that describes the Gaussian ®t tothe event population along the displacement axis (seeGuilford et al., 1997, for details). These standard de-viations were not statistically different for the (+) and())insert, with average mean � SE (n) of 3.3 � 0.4(11) nm and 3.7 � 0.8 (8) nm, respectively. It is worthnoting that this distribution width cannot be attrib-uted solely to Brownian noise, given that these dis-tributions are less than half that of the baseline noise(i.e. (baseline population variance)1/2).
To estimate ton, the total time spent in the primaryevent population, Vmv, was estimated for severalwindow widths (N) and Equation (2) (see Methods)was ®tted to the data for Vmv as a function of N(Fig. 3). The sample data in Fig. 3 were obtained fromthe experiments presented in Fig. 2. Notice that thevolume for an event population diminishes morerapidly for the (+)insert construct with increasingwindow width, suggesting a shorter ton for the(+)insert (Table 1).
Similar experiments were performed at 1 mM
MgATP for both the (+) and ())insert and at 1 lM
MgATP for only the (+)insert construct (Table 1). Toassess the effect of both constructs and [MgATP] onboth d and ton, a two-way analysis of variance(ANOVA) was performed (SigmaStat; Jandel Scien-ti®c). Based on this analysis, there is no effect ofeither construct (p > 0.6) or [MgATP] (p > 0.4) on d.In all cases d is � 10 nm. In contrast, estimates of ton
are highly dependent on the construct (p < 0.02) and[MgATP] (p < 0.001). Therefore, the (+)insert exhibitsshorter ton, half of that of the ())insert construct. Inaddition, lowering the [MgATP] results in longer ton
for both constructs.
Average and unitary force
The results from the in vitro motility mixture assayfrom ®ve independent experiments are shown inFig. 4. mmax in a given experiment is normalized tothat of the (+)insert construct. These data were ®ttedby the myosin interaction model (see Methods), with
Fig. 3. Normalized Vmv as a function of window width forthe sample data shown in Fig. 2. Circles, (+)insert; square,())insert. The ®t parameters from Equation (2) are ton and j(i.e. number of events), which are respectively 136 � 20 msand 49 � 8 for the (+)insert and 408 � 30 ms and 30 � 3 forthe ())insert construct.
Fig. 2. Unitary displacement time series for the (+)insert and the ())insert constructs and corresponding MV histograms. Forclarity, only 5 s out of �1 min of each data-set are shown. The inset for the ())insert shows an �1 s data segment of staircasedisplacement from the same data-set, containing multiple event levels at 5, 18 (lower arrow) and 25 nm (upper arrow). TheMV histograms are shown in their raw format on the left, and with their baseline removed on the right. B denotes the baselinepopulation, and the dominant ®tted event population is shown by a black dot. The colour bar indicates log-counts withmaximum and minimum counts of 1839 and )295 for the (+)insert and 1299 and )168 for the ())insert construct. Note thatafter baseline subtraction, negative counts are shown in grey, revealing that the baseline subtraction results in both randomlydistributed negative and positive residual counts remaining in the region of the baseline. Multiple level events are shown byarrows both in the inset and in the MV histogram. The example (+)insert data-set was obtained from Warshaw and coworkers(1998).
An insert in the motor domain alters the kinetics of myosin 831

the best ®t indicated by the solid line. The apparentlinear relationship predicts that there is no differencein average force generation between the two con-structs, with a model estimate of Favg�ÿinsert�=Favg��insert� of 1.1 � 0.2 (mean � SE). To indicate themodel sensitivity, the dashed line above and belowthe best ®tted line simulate a factor of 2 difference inFavg �Favg�ÿinsert�=Favg��insert� � 0:5 and 2, respective-ly). Except for one data point, all data are either aboveor below these two hypothetical ®ts, thus lendingvisual support to the model's best ®t.
Representative unitary force time series and cor-responding histograms for each construct at 10 lM
MgATP are shown in Fig. 5. Only 5 s of � 1 min offorce records are presented, as well as their corre-sponding MV histograms for the full data record.The character of the time series is similar to that ofthe unitary displacement measurements, where theamplitude of the events does not appear to differbetween constructs, whereas the event durations
appear longer for the ())insert construct. Theresidual displacement trace is also shown for the())insert construct, demonstrating that the varianceof the noise decreased during each event. The base-line-subtracted MV histograms once again were usedto extract estimates for both F and ton. As with someof the displacement MV histograms (Fig. 2), theseparticular force MV histograms display multipleevent populations (Fig. 5 arrowheads), which can beattributed to data records containing staircase forceevents (Fig. 5 arrowheads in time series). Once again,in these cases all event populations were ®t simul-taneously and then only the dominant event popu-lation was used in the F and ton estimates. Table 2summarizes the results for both constructs. There isno difference in F (� 1 pN) between the two con-structs, but ton for the ())insert is 2.5 times longerthan that of the (+)insert construct.
Caution must be exercised when interpreting uni-tary forces measured in this assay. The � 1 pN forcesare surely an underestimate caused by the presence ofan additional compliance that is external to myosin.For example, Mehta and colleagues (1997) estimated acompliance within the microsphere±actin linkage ofapproximately 0.03 pN nm)1, which is signi®cantlylower than the assumed stiffness associated with themyosin molecule (Guilford et al., 1997). Such compli-ance would prevent the measurements from beingtruly isometric. However, by taking a comparativeapproach, regardless of any complicating factors thatmight compromise the absolute measurement of F,any relative differences observed between constructsshould re¯ect true physiological differences.
Discussion
In this study of smooth muscle HMM, we havedemonstrated that the 7-amino-acid insert, located inthe ¯exible surface loop spanning the nucleotidebinding cleft, does not affect myosin's molecular forceand motion-generating capacity. On the contrary, therates of transition between steps in the cross-bridgecycle (i.e. kinetics) are affected by the insert.
Velocity and displacement
Unloaded shortening velocities in phasic and tonicsmooth muscle tissue differ by as much as seven-fold
Fig. 4. In vitro motility mixture assay results. Actin ®lamentvelocity (mmax) is normalized to the maximum velocity of the(+)insert construct. Data points are the mean and standarderror for data from ®ve experiments. The myosin interactionmodel was ®tted to the data (solid curve) and a value ofFavg()insert)/Favg(+insert) of 1.1 � 0.2 was obtained. Forcomparison, predicted model ®ts for Favg()insert)/Favg(+insert) � 0.5 (upper dashed curve) and 2.0 (lowerdashed curve) are plotted.
Fig. 5. Unitary force time series for the (+)insert and the ())insert constructs and corresponding MV histograms. For clarity,only 5 s out of �30 s of each data-set are shown. The MV histograms are shown in their raw format on the left and with theirbaseline removed on the right. B denotes the baseline population, and the ®tted dominant event population is shown by ablack dot. Multiple level events are shown by arrows in both the time series data and the histograms. The colour bar indicateslog-counts with maximum and minimum counts of 3991 and )265 for the (+)insert, and 1341 and )328 for the ())insertconstruct. Note that after baseline subtraction, negative counts are shown in grey, revealing that the baseline subtractionresults in both randomly distributed negative and positive residual counts remaining in the region of the baseline.
832 LAUZON et al.

An insert in the motor domain alters the kinetics of myosin 833

(Murphy, 1976; Hellstrand & Paul, 1982; Malmqvist &Arner, 1991). This could be related in part to themyosin isoform expressed in these tissues, wherephasic muscle predominantly contains the (+)insertisoform and tonic muscle the ())insert isoform (Whiteet al., 1993). Indeed, this is most likely the case, giventhat at the molecular level, we and others (Kelley et al.,1993; Rovner et al., 1997) have shown that the (+)inserthas an � 2-fold greater mmax than the ())insert form.The factor of two difference in actin ®lament velocitiescompared with a seven-fold difference in the tissuemay simply re¯ect differences in the complexmechanical interactions that exist between thecontractile apparatus, the cytoskeleton, and theextracellular connective tissue matrix.
To understand further the dependence of mmax onthe presence or absence of the insert, one can relatemmax to its molecular determinants, d and ton (seeEqn 1) using the laser trap. We have shown that bothmyosin constructs generate the same d. However, ton
for the (+)insert is approximately half that of the())insert construct, regardless of the MgATP concen-tration. Because the relative difference in mmax be-tween the two constructs can be explained by asimilar relative change in ton, we conclude that theinsert alters only the kinetics of the cross-bridge cycle.It should be noted that the absolute value of mmax
obtained in the in vitro motility assay at 1 mM MgATPwas greater by a factor of � 2 than that predicted bydividing d by ton at the same MgATP concentration(see Table 1). Given that actin ®lament motility occursunder unloaded conditions, whereas displacementmeasurements in the laser trap are made under lightlyloaded conditions, it is possible that slight differencesin loading conditions could account for the absolutedifferences in measured and calculated mmax.
Knowing that the insert alters ton, we then at-tempted to identify which step or steps in the cross-bridge cycle are affected by the insert to account fordifferences in ton. Figure 6 illustrates how the princi-pal steps of the cross-bridge cycle may relate to ton.Assuming that the myosin powerstroke occurs duringthe transition between the weak (M.ADP.Pi) to strongbinding state (A.M.ADP) (Goldman, 1987; Cooke,1997), ton equals the elapsed time for both the releaseof MgADP (tÿADP) and the time waiting for the nextMgATP molecule to bind(t�ATP). If ton is partitionedproperly, then decreasing the solution [MgATP]should prolong the waiting period for binding of anew MgATP molecule (i.e. t�ATP) and thus prolongton. This was readily apparent from displacementmeasurements of the (+)insert construct at 1 mM,10 lM and 1 lM MgATP, where ton estimated by MVanalysis increased with decreasing [MgATP] (seeFig. 7). Further support for this interpretation wasobtained by predicting ton using biochemical rateconstants. Based on the range of MgADP dissociationrate constants (15 s)1, Marston & Taylor, 1980; 22 s)1,Cremo & Geeves, 1998; 79 s)1, Sweeney et al., 1998)and the second order rate constant for MgATP bind-ing of 2 ´ 106
M)1 s)1 (Marston & Taylor, 1980) for
gizzard myosin, predicted ton (Fig. 7, lower numbersin parentheses) were in reasonable agreement withmeasured values from the laser trap studies (Fig. 7,upper numbers). Furthermore, at 1 mM MgATP, t�ATP
Table 2. Force results summary.
Force
F (pN) (n) ton (ms) (n)
(+) insert 0.9 � 0.1 (7) 274 � 62 (6)()) insert 1.2 � 0.1 (8) *679 � 132 (6)
Data are presented as means � S E. Student's t-tests were per-formed.* Signi®cant at the <0.05 level.
Fig. 6. Illustration of the principal theoretical cross-bridge cycle steps corresponding to a displacement event observed in thelaser trap (see Discussion for details).
834 LAUZON et al.

is estimated from the biochemistry to be 0.5 ms. Be-cause this is such a small fraction of ton, it would bereasonable to assume that at 1 mM MgATP, ton isdetermined primarily by tÿADP. We therefore per-formed the laser trap displacement experiments atsaturating levels of MgATP (1 mM), to investigate theeffect of the insert on tÿADP. Assuming that at 1 mM
MgATP, ton approximates tÿADP, then the shorter ton
for the (+)insert (� 2-fold shorter) suggests that therate of MgADP release for this construct is twice thatof the ())insert construct. This is supported by thethree-fold difference in the MgADP dissociation rateconstant reported by Sweeney and coworkers (1998)for the (+)insert (gizzard) and ())insert (aorta)
isoforms. If we now extrapolate these results to the ton
data obtained for both constructs at 10 lM MgATP,then subtracting ton at 1 mM MgATP from that at10 lM MgATP predicts that t�ATP for the (+)insertis half that for the ())insert construct. Therefore,the addition of the insert also increases the MgATPattachment rate by a factor of � 2. These results aresupported by studies of laser ¯ash photolysis of cagedATP (Fuglsang et al., 1993; Khromov et al., 1996), inwhich it was shown that the af®nity of MgADP formyosin cross-bridges was lower in phasic than intonic muscle by a factor of � 5, and that the apparentsecond-order rate constant of MgATP-induced cross-bridge detachment from rigor in the absence of Ca2+
was � 3 times higher in phasic than in tonic perme-abilized smooth muscle.
Average and unitary force
While differences in shortening velocity betweenphasic and tonic muscles are well documented in theliterature (Murphy, 1976; Hellstrand & Paul, 1982),there is no indication of a difference in maximumisometric force production. Nevertheless, it is impor-tant to characterize the force-generating capacities ofthe two myosin motors because tissue level mea-surements could potentially mask intrinsic differen-ces. As a ®rst approach, we estimated molecular Favg
with the motility mixture assay. This assay has provenin the past to be a simple quantitative tool to measurethis value, as con®rmed by comparisons with micro-needle experiments (Harris et al., 1994; VanBuren et al.,1994, 1995). Our results demonstrate that Favg is thesame for the (+)insert and the ())insert constructs.
While the Favg results were somewhat expected fromthe tissue level measurements, it was important tomeasure F to demonstrate further that the insert doesnot affect the mechanics but rather the kinetics of thecross-bridge cycle. Indeed, our results show that F is thesame for both constructs, whereas ton under loadedconditions is doubled in the absence of the insert.
Can these force data reveal further information onthe cross-bridge attachment and detachment ratesunder loaded conditions? By de®nition:
Favg � F � duty cycle �3�where the duty cycle is the percentage of the totalcycle time that myosin remains attached to actin inthe force-generating state (VanBuren et al., 1994).Because we have determined that both constructsgenerate similar Favg and F, then both constructsshould have similar duty cycles. Based on the two-step cross-bridge model proposed by Huxley (1957),duty cycle is proportional to (f/(f+g), where f and gare the rates of cross-bridge attachment anddetachment, respectively. Assuming these rate con-stants apply to the unitary measurements, then the
Fig. 7. Unitary displacement time series for the (+)insertconstruct at decreasing MgATP concentrations. The ton
shown are estimated from the data by MV analysis (top) orpredicted using biochemical rate constants (in parentheses).See Discussion for details.
An insert in the motor domain alters the kinetics of myosin 835

cross-bridge detachment rate, g, will effectively de-termine ton. Therefore, shorter ton for the (+)insertsuggest that g is increased for this construct. Is therate of cross-bridge attachment, f, also affected by theinsert? Given that the duty cycle for smooth musclemyosin must be as high as 60% (based on the as-sumed skeletal myosin duty cycle of 20% (Finer et al.,1994) and the three-fold average force enhancementfor smooth muscle myosin (Guilford et al., 1997)), thiswould imply that f must be of the same magnitude asg (see Eqn 3), and that any increase in g for the(+)insert must be matched by a similar increase in f.A similar conclusion was reached by Horiuti andcolleagues (1989) using ¯ash photolysis of cagedMgATP to study the rate of force development inskinned tonic and phasic muscles.
Conclusion
Spudich (1994) proposed a simple model for howthe two myosin heavy chain surface loops (loop 1at the junction of the 25±50 kDa domains and loop 2 atthe junction of the 50±20 kDa domains) might affectmyosin's kinetics. Based on measurements of mmax andactin-activated ATPase activity from Dictyosteliummyosin chimeras, in which the actin binding loop(loop 2) from various muscle myosins replaced theendogenous Dictyostelium loop (Uyeda et al., 1994),Spudich (1994) suggested that loop 1, near the nucleo-tide binding pocket, tunes the rate constant forMgADP release and thereby sets mmax, whereas loop 2tunes the actin-activated ATPase rate. While somerecent results (Bobkov et al., 1996; Murphy & Spudich,1998) support this model, it may not be universallyapplicable (Kelley et al., 1993; Rovner et al., 1995, 1997;Perreault-Micale et al., 1996). In our study, alterationsin the smooth muscle myosin nucleotide binding loopaffect mmax, MgADP release rate, and the MgATPattachment rate. Although these results support theSpudich model, at the same time the known effect ofthese nucleotide binding loop isoforms on ATPaseactivity are in contrast to the model predictions.
Given that the insert exists in a ¯exible surface looplocated at the opening of the nucleotide binding pocket(Rayment et al., 1993), it is not surprising that d and Fwere unaffected by the insert. However, differencesin the tertiary structure of the loop, with and withoutthe insert, may play a role in regulating nucleotideentry to and exit from the catalytic site. For example, theadditional seven amino acids increase the length andperhaps the ¯exibility of the loop, which may relievesome of the strain within the catalytic domain, in effectallowing the nucleotide binding pocket to breathe morereadily and thus allow the nucleotide to enter and exitmore freely from the pocket. This might explain ourpredicted increase in both the rate of MgATP binding
and MgADP release for the (+)insert isoform. A similarconclusion was obtained by Sweeney and coworkers(1998) who studied smooth muscle HMM chimerasin which the nucleotide binding loops from variousmyosin II isoforms were inserted in place of theendogenous loop. Determination of how the catalyticsite actually senses the presence or absence of sevenamino acids in a surface loop will require more detailedmolecular structure/functional analysis.
Acknowledgements
The authors acknowledge the invaluable contributionof the following people: Donald E. Dupuis andWilliam H. Guilford for numerous enriching discus-sions, Eric Hayes and Janet Vose for protein prepa-ration, technical assistance and computer graphicsexpertise, Donald Gaffney for superb computer sup-port and programming, and Guy Kennedy for theconstant mechanical support, design changes andimplementation to the trap. This work was supportedby funds from the National Institutes of Health(HL54568 to KMT and DMW) and the American LungAssociation (postdoctoral fellowship to A-ML).
References
BABIJ , P. (1993) Tissue-speci®c and developmentally regu-lated alternative splicing of a visceral isoform of smoothmuscle myosin heavy chain. Nucleic Acid Res. 21, 1467±71.
BOBKOV, A. A., BOBKOVA, E. & REISLER, E. (1996) The roleof surface loops (residues 204±216 and 627±646) in themotor function of the myosin head. Proc. Natl Acad. Sci.USA 93, 2285±9.
COOKE, R. (1997) Actomysin interaction in striated muscle.Physiol. Rev. 77, 671±97.
CREMO, C. R. & GEEVES, M. A. (1998) Interaction of actinand ADP with the head domain of smooth musclemyosin: implications for strain-dependent ADP releasein smooth muscle. Biochem. 37, 1969±78.
CUDA, G., PATE, E., COOKE, R. & SELLERS, J . R. (1997) Invitro actin ®lament sliding velocities produced bymixtures of different types of myosin. Biophys. J. 72,1767±79.
DUPUIS, D. E., GUILFORD, W. H., WU, J . & WARSHAW,D. M. (1997) Actin ®lament mechanics in the laser trap.J. Muscle Res. Cell Motil. 18, 17±30.
EDDINGER, T. J . & MURPHY, R. A. (1988) Two smoothmuscle myosin heavy chains differ in their light mero-myosin fragment. Biochem. 27, 3807±11.
FINER, J . T ., S IMMONS, R. M. & SPUDICH, J . A. (1994)Single myosin molecule mechanics: piconewton forcesand nanometer steps. Nature 386, 113±9.
FUGLSANG, A., KHROMOV, A., TOÈ ROÈ K, K., SOMLYO, A. V.& SOMLYO, A. P. (1993) Flash photolysis studies ofrelaxation and cross-bridge detachment: higher sensi-tivity of tonic than phasic smooth muscle to MgADP.J. Muscle Res. Cell Motil. 14, 666±73.
GOLDMAN, Y. E. (1987) Kinetics of the actomyosin ATPasein muscle ®bers. Ann. Rev. Physiol. 49, 637±54.
836 LAUZON et al.

GUILFORD W. H., DUPUIS, D. E., KENNEDY, G., WU, J .,PATLAK, J . B. & WARSHAW, D. M. (1997) Smoothmuscle and skeletal muscle myosins produce similarunitary forces and displacements in the laser trap.Biophys. J. 72, 1006±21.
HARRIS, D. E. & WARSHAW, D. M. (1993) Smooth andskeletal muscle actin are mechanically indistinguish-able in the in vitro motility assay. Circ. Res. 72, 219±24.
HARRIS, D. E., WORK, S. S., WRIGHT, R. K., ALPERT, N. R.& WARSHAW, D. M. (1994) Smooth, cardiac and skel-etal muscle myosin force and motion generation as-sessed by cross-bridge mechanical interactions in vitro.J. muscle Res. Cell Motil 15, 11±19.
HELLSTRAND, P. & PAUL R. J . (1982) Vascular smoothmuscle: relation between energy metabolism andmechanics. In Vascular Smooth Muscle: Metabolic, Ionicand Contractile Mechanism (edited by BARNES, C.D.)pp. 1±35. New York: Academic Press.
HORIUTI , K., SOMLYO, A. V., GOLDMAN, Y. E. & SOMLYO,A. P. (1989) Kinetics of contraction initiated by ¯ashphotolysis of caged adenosine triphosphate in tonic andphasic smooth muscles. J. Gen. Physiol. 94, 769±81.
HOROWITZ, A. & TRYBUS, K. M. (1992) Inhibition of smoothmuscle myosin's activity and assembly by an anti-rodmonoclonal antibody. J. Biol. Chem 267, 26091±6.
HUXLEY, A. F. (1957) Muscle structure and theories ofcontraction. Prog. Biophys. 7, 255±317.
KELLEY, C. A., TAKAHASHI, M., YU, J . H. & ADELSTEIN,R. S. (1993) An insert of seven amino acids confersfunctional differences between smooth muscle myosinsfrom the intestines and vasculature. J. Biol. Chem. 268,12848±54.
KHROMOV, A. S., SOMLYO, A. V. & SOMLYO, A. P. (1996)Nucleotide binding by actomyosin as a determinant ofrelaxation kinetics of rabbit phasic and tonic smoothmuscle. J. Physiol. 492, 669±73.
MALMQVIST, U. & ARNER, A. (1991) Correlation betweenisoform composition of the 17 kDa myosin light chainand maximal shortening velocity in smooth muscle.P¯uÈgers Arch. 418, 523±30.
MARSTON, S. B., & TAYLOR, E. W. (1980) Comparison ofthe myosin and actomyosin ATPase mechanisms ofthe four types of vertebrate muscles. J. Mol. Biol. 139,573±600.
MEHTA, A. D., FINER, J . T. & SPUDICH, J . A. (1997) Detectionof single-molecule interactions using correlated thermaldiffusion. Proc. Natl Acad. Sci. USA 94, 7927±31.
MOLLOY, J . E ., BURNS, J . E ., KENDRICK-JONES, J .,TREGEAR, R. T. & WHITE, D. C. S . (1995) Movementand force produced by a single myosin head. Nature378, 209±12.
MURPHY, C. T. & SPUDICH, J . A. (1998) Dictyosteliummyosin 25±50K loop substitutions speci®cally affectADP release rates. Biochem. 37, 6738±44.
MURPHY, R. A. (1976) Contractile system function inmammalian smooth muscle. Blood Vessels 13, 1±23.
NAGAI, R., KURO-O, M., BABIJ , P. & PERIASAMY, M. (1989)Identi®cation of two types of smooth muscle myosinheavy chain isoforms by cDNA cloning and immuno-blot analysis. J. Biol. Chem. 264, 9734±7.
PARDEE, J . D. & SPUDICH, J . A. (1982) Puri®cation ofmuscle actin. Methods Enzymol. 85, 164±81.
PATLAK, J . B. (1993) Measuring kinetics of complex singleion channel data using mean-variance histograms.Biophys. J. 65, 29±42.
PERREAULT-MICALE, C. L., KALABOKIS, V. N., NYITRAY,L. & SZENT-GYORGYI, A. G. (1996) Sequence variationsin the surface loop near the nucleotide binding sitemodulate the ATP turnover rates of mulluscan myo-sins. J. Muscle Res. Cell Motil. 17, 543±53.
RAYMENT, I ., RYPNIEWSKI, W. R., SCHMIDT-BASE, K.,SMITH, R., TOMCHICK, D. R., BENNING, M. M.,WINKELMANN, D. A., WESENBERG, G. & HOLDEN,H. M. (1993) Three-dimensional structure of myosinsubfragment-1; a molecular motor. Science 261, 50±65.
ROVNER, A. S., FREYZON, Y. & TRYBUS, K. M. (1995) Chi-meric substitutions of the actin-binding loop activatedephosphorylated but not phosphorylated smoothmuscle heavy meromyosin. J. Biol. Chem. 270, 30260±3.
ROVNER, A. S., FREYZON, Y. & TRYBUS, K. M. (1997) Aninsert in the motor domain determines the functionalproperties of expressed smooth muscle myosin iso-forms. J. Muscle Res. Cell Motil. 18, 103±10.
SOMLYO, A. P. (1993) Myosin isoforms in smooth muscle:how may they affect function and structure? J. MuscleRes. Cell Motil. 14, 557±63.
SPUDICH, J . A. (1994) How molecular motors work? Nature372, 515±8.
SVOBODA, K., SCHMIDT, C. F., SCHNAPP, B. J . & BLOCK,S. M. (1993) Direct observation of kinesin stepping byoptical trapping interferometry. Nature 365, 721±7.
SWEENEY, H. L., ROSENFELD, S. S ., BROWN, F., FAUST, L.,SMITH, J ., XING, J ., STEIN, L. A. & SELLERS, J . R. (1998).Kinetic tuning of myosin via a ¯exible loop adjacent tothe nucleotide binding pocket. J. Biol. Chem. 273, 6262±70.
TRYBUS, K. M. & HENRY, L. (1989) Monoclonal antibodiesdetect and stabilize conformational states of smoothmuscle myosin. J. Cell Biol. 109, 2879±86.
UYEDA, T. Q. P., RUPPEL, K. M. & SPUDICH, J . A. (1994) En-zymatic activities correlate with chimaeric substitutionsat the actin-binding face of myosin. Nature 368, 567±9.
VANBUREN, P., HARRIS, D. E., ALPERT, N. R. &
WARSHAW, D. M. (1995) Cardiac V1 and V3 myosinsdiffer in their hydrolytic and mechanical activities invitro. Circ. Res. 77, 439±44.
VANBUREN, P., WORK, S. S. & WARSHAW D. M. (1994)Enhanced force generation by smooth muscle myosin invitro. Proc. Natl Acad. Sci. USA 91, 202±5.
WARSHAW, D. M., DESROSIERS, J . M., WORK, S. S. &
TRYBUS, K. M. (1990) Smooth muscle myosin cross-bridge interactions modulate actin ®lament slidingvelocity in vitro J. Cell Biol. 111, 453±63.
WARSHAW, D. M., HAYES, E., GAFFNEY, D., LAUZON,A.-M., WU., J ., KENNEDY, G., TRYBUS, K. M., LOWEY,S. & BERGER, C. (1998) Myosin conformational statesdetermined by single ¯uorophore polarization. Proc.Natl Acad. Sci. USA 95, 8034±9.
WHITE, S ., MARTIN, A. F. & PERIASAMY, M. (1993) Iden-ti®cation of a novel smooth muscle myosin heavy chaincDNA: isoform diversity in the S1 head region. Am. J.Physiol. 264, C1252±8.
WORK, S. S. & WARSHAW, D. M. (1992) Computer-assistedtracking of actin ®lament motility. Analyt. Biochem. 202,275±85.
An insert in the motor domain alters the kinetics of myosin 837
![Insert document title Location | Date ATSB Transport Safety Report [Insert Mode] Occurrence Investigation XX-YYYY-#### Final Investigation An Overview of Human Factors in Aviation](https://img.pdfslide.net/doc/110x75/636044f92dd6e4659f01d908/insert-document-title-location-date-atsb-transport-safety-report-insert-mode.jpg)


