Embed Size (px)
Citation preview
A CASE STUDY
ON BUYERS’ BEHAVIOUR ON COLD DRINKS IN NEPAL BASED ON BARAHTHAWA AREA
A THESIS Submitted By:
Gyan Bahadur Bhulon
Makwanpur Multiple Campus
Hetauda, Makwanpur
TU Reg. No. 7-3-242-484-2005
Submitted To:
Office of the Dean
Faculty of Management
Tribhuvan University
In partial fulfillment of the requirements for the degree of
Masters of Business Studies (M.B.S)
Hetauda, Makwanpur
April 2010 (2066)
RECOMMENDATION
This is certify that the thesis
Submitted by
Gyan Bahadur Bhulon
Entitled:
“A CASE STUDY ON BUYERS’ BEHAVIOUR ON COLD DRINKS
IN EPAL BASED ON BARAHTHAWA AREA”
has been prepared as approved by this department in the prescribed format of the Faculty
of Management. This is forwarded for examination. We recommend this thesis for
acceptance.
……………………… ………………………
Yam Siwal Bachhu Ram Adhikari
Thesis Supervisor Thesis Supervisor
(Makwanpur Multiple Campus) (Makwanpur Multiple Campus)
……………………… ………………………
Vijay Kumar Sharma Uddhab Prasad Sapkota
Head of research department Co-coordinator, MBS Program
(Makwanpur Multiple Campus ) (Makwanpur Multiple Campus)
VIVA-VOCE SHEET
We have conducted the viva-voce sheet examination of the thesis
Submitted by
Gyan Bahadur Bhulon
Entitled:
“A CASE STUDY ON BUYERS’ BEHAVIOUR ON COLD DRINKS
IN EPAL BASED ON BARAHTHAWA AREA”
And found the thesis to be the original work of the student and written in according to the
prescribed format. We recommend the thesis to be accepted as partial fulfillment of the
requirements for the Degree of Master’s in Business Studies (MBS)
Viva – Voce Committee:
Head Of Research Department: ………………………………….
Member (Thesis Supervisor): ………………………………….
Member (Thesis Supervisor): ………………………………….
Member (External Expert): ………………………………….
Date: ……………………
DECLARATION
I hereby declare that the work reported in thesis entitled “A CASE STUDY ON
BUYERS’ BEHAVIOUR ON COLD DRINKS IN EPAL BASED ON
BARAHTHWA AREA”submitted to office of the Dean, Faculty of Management,
Tribhuvan University, is my original work done in the form of partial fulfillment of the
requirement for the Degree of Master Of Business Studies (MBS) under the supervision
and guidance of Mr. Bin Bahadur Raut and Mr. Jayram Devkota, Makwanpur Multiple
Campus, Hetauda, Nepal.
…..……………………
Gyan Bahadur Bhulon
Researcher
T.U. Regd. No. 7-3-242-484-2005
Date: Makwanpur Multiple Campus
ACKNOWLEDGEMENT
Interdependence is a higher value than independence.
In this report, it brings together the combined studying and writing about
Marketing, Attitude, Usage pattern and Image of cold drinks in Barahathwa
area. I am grateful to numerous of people who have contributed their time,
thoughts, skills and encouragement to complete this thesis report. I want to
extend my sincere thanks to those who have added the richness to this report
by completing open ended questionnaire or participated in direct interviews
concerning subject matter in which they has particular experience and
expertise. I am indebted to all of these accomplished people who provided
such thoughtful comments and assistance to complete this thesis.
My special thanks goes to our Professor Mr. Yam B. Silwal, Makwanpur
Multiple Campus for special help and aspiring me to write this report and
guiding me in entire process of its completion which would help to seek
information about cold drinks marketing sectors in Nepal.
This work is a synergistic product of many minds, and itself feel a deep
sense of gratitude:
- To central library staff, who have helped me in library work.
- To my assistant, for the assistance provided to me in grouping the
data editing them and especially at the time of evaluation.
- To Mr. Rupesh Jung Thapa, Shyam Prasad Upadhyay, Krishnaraj
Karki, Kapil Adhakari, Sushma Lama and all other friends who
performed the logistical and management work.
- To all the concerns personnel who are indebted to all of these
thoughtful comments.
…..……………………
Gyan Bahadur Bhulon
Researcher
T.U. Regd. No. 7-3-242-484-2005
Makwanpur Multiple Campus
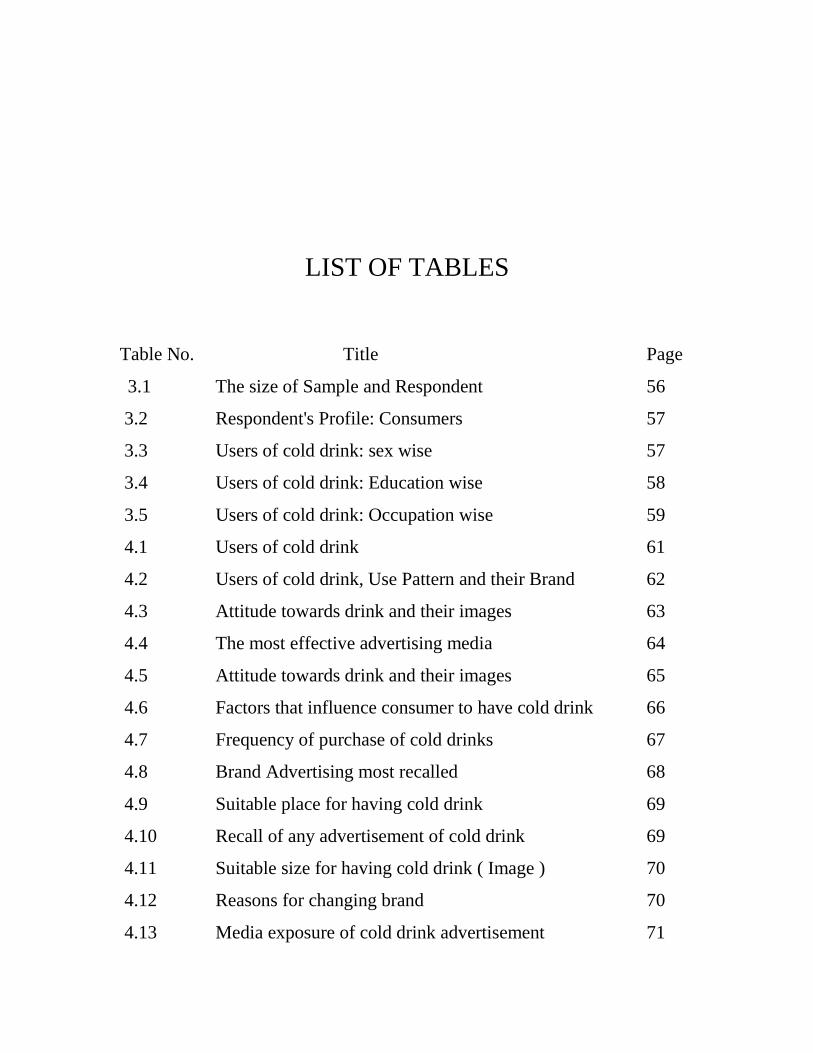
LIST OF TABLES
Table No. Title Page
3.1 The size of Sample and Respondent 56
3.2 Respondent's Profile: Consumers 57
3.3 Users of cold drink: sex wise 57
3.4 Users of cold drink: Education wise 58
3.5 Users of cold drink: Occupation wise 59
4.1 Users of cold drink 61
4.2 Users of cold drink, Use Pattern and their Brand 62
4.3 Attitude towards drink and their images 63
4.4 The most effective advertising media 64
4.5 Attitude towards drink and their images 65
4.6 Factors that influence consumer to have cold drink 66
4.7 Frequency of purchase of cold drinks 67
4.8 Brand Advertising most recalled 68
4.9 Suitable place for having cold drink 69
4.10 Recall of any advertisement of cold drink 69
4.11 Suitable size for having cold drink ( Image ) 70
4.12 Reasons for changing brand 70
4.13 Media exposure of cold drink advertisement 71
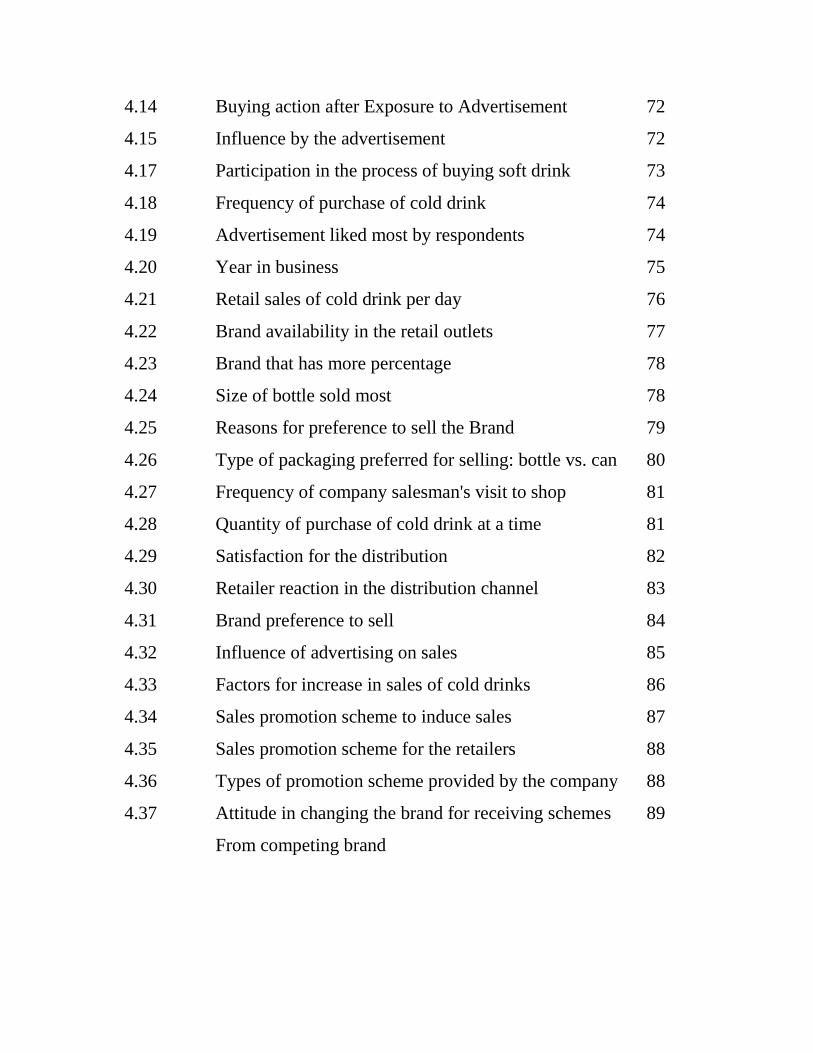
4.14 Buying action after Exposure to Advertisement 72
4.15 Influence by the advertisement 72
4.17 Participation in the process of buying soft drink 73
4.18 Frequency of purchase of cold drink 74
4.19 Advertisement liked most by respondents 74
4.20 Year in business 75
4.21 Retail sales of cold drink per day 76
4.22 Brand availability in the retail outlets 77
4.23 Brand that has more percentage 78
4.24 Size of bottle sold most 78
4.25 Reasons for preference to sell the Brand 79
4.26 Type of packaging preferred for selling: bottle vs. can 80
4.27 Frequency of company salesman's visit to shop 81
4.28 Quantity of purchase of cold drink at a time 81
4.29 Satisfaction for the distribution 82
4.30 Retailer reaction in the distribution channel 83
4.31 Brand preference to sell 84
4.32 Influence of advertising on sales 85
4.33 Factors for increase in sales of cold drinks 86
4.34 Sales promotion scheme to induce sales 87
4.35 Sales promotion scheme for the retailers 88
4.36 Types of promotion scheme provided by the company 88
4.37 Attitude in changing the brand for receiving schemes 89
From competing brand
CHAPTER-1
INTRODUCTION
1.1 Background
Nepal, located on the southern slopes of the mighty Himalaya, is also called a "Buffer
State". It is a bounded on the north by the Tibet, an autonomous region of the People’s
Republic of China and on its east, south & west by the Indian states of Indian Territory. It
is an elongated rectangle with a total area of 147,181square Kilometers lying between
80"4' & 88"12' east longitude 26"22' and 30"27' north latitude. Although tiny in the world
map, Nepal is the largest of all these Himalayas and Kingdoms.
Nepal is a country of about 24 million people out of which about half-and-half million
are male & female having a growth rate of 1.08%. About 81.1% of the total Population
derives their livelihood from agriculture & 18.6% from non-agricultural sector.
The essence of marketing is that it enables on organization to find out what the
customers’ needs and it also help to decide a product to make. Today's marketing
environment is characterized by globalization, technological change an intense
competition. Successful marketers are those who deliver what customers are willing to
purchase as well as ability to purchase. For this reason marketers today conduct many
research and development to study consumer's decisions. Once it is understood marketers
become able to predict and shape their marketing strategies accordingly. Without doubt,
marketers who understand markets and consumer behavior have great competitive
advantage in the market place. So, it is obvious that a producing organization or
manufacture must determine the attitudes, needs & wants of their customer first and then
bring products in the market accordingly. According to Prof. Philip Kotler "marketing is
a social and managerial process by which individuals and groups obtain what they need
and want through creating, offering and exchanging products of value with others."
Another scholar Prof. William J. Stanton defines marketing as "a total system of business
activities design to plan, Price, Promote and distribute want satisfying products to target
markets to achieve organizational objectives." Similarly, the American Marketing
Association defines marketing as "the Process of Planning and exacting this conception,
Pricing, Promotion and distributions of ideas, goods and services to create exchange that
satisfy individuals and organizational objectives. The main focus is being on consumer
need satisfaction as well as marketer's profit.
Perhaps the most distinctive skill of professional marketers is their ability to create,
maintain, protect, and enhance brands. Marketers say," Branding is the art and
combination of marketing." A brand is a name, term, sign, symbol, or design, or a
combination of them, intended to identify the goods or service of one seller or group of
seller and to differentiate them from those of competitions.
A brand is an offering from a known source. A brand name carries many associations in
the minds of people. These associations make up the brand image. All companies strive
to build brand strength-that is, a strong, favorable brand image. Smart companies, When
they first become acquainted with the product category an brands, what their brands
beliefs are, how involve they are with the product, how they make their brand choices,
and how satisfied they are after purchase.
Hence, above definitions of marketing suggests that it consists of some activities
consisting of study of consumer needs, Products, Price, Place, Promotion to facilitate
exchange and brands that satisfies individual as well as organizational objectives within
the social and marketing environment prevailing today. The consumer or customer gets
the product he/she wants and the manufacturer or marketer gets the profit with
satisfaction. This highlights the importance of product is the whole process of marketing.
Product is always an important element of the marketing mix. It is more than goods and
services as people think it to be. A product consists of goods services, ideas, experience
events, Places, personality and organizations. Prof. Philip Kotler defines a product as
"anything that can be offered to a market to satisfy a want or need."
Research area selected for our study is Barahathwa, the mid eastern Nepal situated on the
bank of Bagmati River. It is one of the famous commercial town of Nepal. Being the
most populated area, it may prove to be the most suitable area for the purpose of our
research. Since, most of the modern Hotels restaurants and bakeries are found in
Barahathwa. The consumption of cold drinks is immense here. As such the survey held in
the process of our research reveal the true characteristics of the cold drinks available in
the markets. At the same time the results derived by the research are appreciable to the
whole country. This study includes almost all the brands of cold drinks (i.e. coke, fanta,
lemon fanta, sprite, pepsi, mirinda, frooti etc). Among the industries that produce cold
drinks, bottlers Nepal is in direct competition with Pepsi-cola products. Coca-cola almost
captures 80% of the market share. Beside these two brands, there are some other brands
of cold drinks like frooti, Rio, and real juice selling cold drink in Barahathwa. These
entire products, also to some extend compete with some Chinese cold drinks available in
the market. But these Chinese cold drinks are not in significant amount for our research
purpose. Therefore our study focuses in the product of coke & pepsi.
1.2 Focus of the study
The present study tries to focus on the marketing of cold drinks in Barahathwa. Generally
cold drink stands for alcohol-less drink. Cold drinks are sold in bottles, plastic containers
or cans. Most people in Nepal, use cold drinks in the hot seasons only. That's why
demand of cold drink in Nepal goes comparatively high in the hot summer season.
Marketing in this true sense helps to increase effective demand for a product through the
reduction of distribution cost and also helps to explore markets for new products. The
role of marketing with regard to dissemination of information is very important for
consumer as well as producers to day and produces goods. It helps ringing markets
competitive thus increasing efficiency of resource use. Likewise, its role with regard to
satisfying consumers and making inputs available at reasonable price as services has its
own importance. Therefore, the impact of marketing is deep and far reaching. A national
development program that concentrates only on production will be less effective than a
program that recognizes the contribution of marketing.
This study will examine the present marketing strategies of cold drinks in Barahathwa
and try to find out the marketing variables affecting the cold drinks. The research also
focuses on the role played by attitude, image & usage pattern of cold drinks.
1.3 Statement of Problem
The stiff competition in the marketing of cold drinks has forced the marketers to adopt a
variety of marketing tools and techniques in the market place. The manufactures in a
variety of Medias use different types of advertisement. As a result of competition
between new established companies industries are developing rapidly. This development
in the industries sector has provided varieties of different type of product, different
brands of even a single product, to the Nepalese consumers. Every product is made for
the fulfillment some needs and wants product are used or consumed by the customer’s
different way and in different occasions. Customers want different attributes from the
same product. Therefore, usage pattern, brand positioning and band image are also
important to be taken into account. Nepalese consumers are provided with different
brands and they are quite free to choose the one they think the best. We can see different
brand of cold drinks in market just as Pepsi, Coke, Mirinda, Fanta, Sprite, 7'up, Slice,
Lemon Fanta etc. The competition is very tough in the cold drink market. Demands of
cold drinks are increasing day by day and many new companies are emerging to fulfill
the demand. However the new brands they are not in the stage to compete with Coca-
Cola and Pepsi products.
Cold drinks are one of the heavily advertised products. Large amount of money is spent
on the promotion of cold drinks. Yet very few companies are found to measure the effects
of their advertisements. It is essential for companies to know about their consumers, their
choice and preferences. For regular sales and distribution of cold drinks we must know
about 'which is the best advertising media'. Which advertising media can be more
effective? Therefore the problems encompassed by this study are as follows:
What is the consumers' perception and consumption behavior of cold drinks in
Barahathwa?
What are the different brands and what if the level of awareness of those brands in
consumer’s minds?
What are the usage patterns of cold drinks?
What image cold drinks carry in consumer's mind?
What type of distribution network exists in the study area for marketing of cold
drinks?
What are the marketing strategies begin adopted by the marketers of cold drinks
in the study area?
What types of impacts have the advertisements made on the sales of cold drinks in
the study area?
What are the effects of sales promotion schemes on sales of cold drinks in the
study area?
1.4 Objective of the Study
The main objective of this study is to examine the marketing of cold drinks in
Barahathwa. However the specific objectives of the study are as follows:
To examine the consumers' perception and behaviors in the purchase of cold
drink in Barahathwa.
To find out the levels of awareness of different brand, their images and attitudes
towards different brand.
To evaluate the impact of advertisement and sales promotion schemes on sales of
cold drinks in the study area.
1.5 Importance of the study
Success of an industry depends on the function of success marketing of its product. In an
era of cutthroat competition, successful marketing of the products demands through
understanding of consumer's taste; choice preference and loyalty attitude, image of
certain products and consumption behavior. Manufactures may use the findings from this
study and marketer’s cold drinks to understand better about their consumers and design
better marketing strategy for the study area.
1.6 Limitations of the study
This study has been strictly limited to Barahathwa and the findings from this study may
not apply for the National character. The Study has been predominantly based on primary
information collection through a questionnaire survey of limitations number of
individuals and retailers. Therefore, the findings this study is affective to some extent by
the small size of the sample.
1.7 Organization of the Study
The whole study has been divided into five chapters starting from Introduction, Review
of literature, Research methodology, Data presentation & analysis and Summary,
conclusion & Recommendation. A brief outline of this chapter has been outlined as
under:
Introduction: The first chapter of the study serves as an introduction to the
study. It includes the background of the study, focus of the study, statement of
the problem, objective of the study, importance of the study and limitation of
the study.
Review of Literature: This chapter deals with review of the different
literature in regards to the theoretical analysis and review of books, article and
thesis related to the study field. Therefore it includes conceptual framework
and other related studies.
Research Methodology: This chapter deals with research methodology used
to carry out the research. It includes research design, population and samples,
sources and techniques of data collection and data analysis tools.
Data Presentation and Analysis: It is the main body of research. It includes
data analysis. The collected data are analyzed and interpreted by the research
design set in methodology chapter and concludes with the main findings of the
study.
Summary, Conclusion and Recommendation: The last chapter concludes
summary, conclusion and makes some recommendation obtained from the
whole study.
CHAPTER-II
REVIEW OF LITERATURE
2.1 Conceptual Review
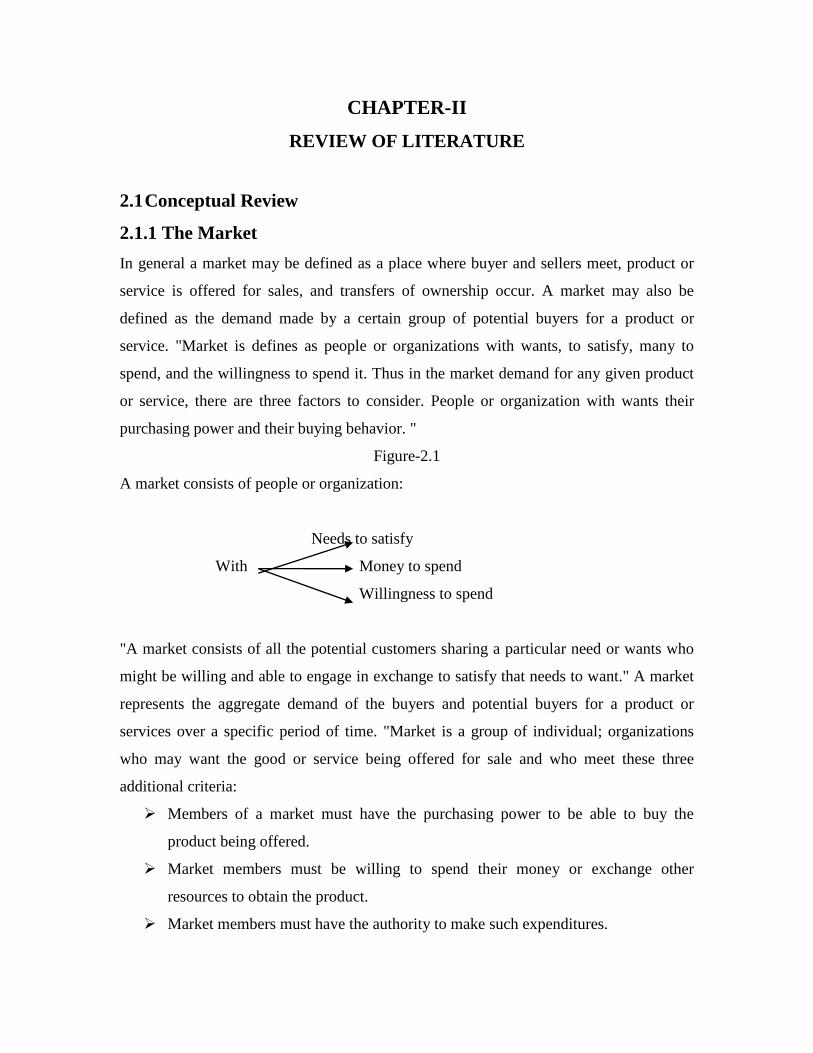
2.1.1 The Market
In general a market may be defined as a place where buyer and sellers meet, product or
service is offered for sales, and transfers of ownership occur. A market may also be
defined as the demand made by a certain group of potential buyers for a product or
service. "Market is defines as people or organizations with wants, to satisfy, many to
spend, and the willingness to spend it. Thus in the market demand for any given product
or service, there are three factors to consider. People or organization with wants their
purchasing power and their buying behavior. "
Figure-2.1
A market consists of people or organization:
Needs to satisfy
With Money to spend
Willingness to spend
"A market consists of all the potential customers sharing a particular need or wants who
might be willing and able to engage in exchange to satisfy that needs to want." A market
represents the aggregate demand of the buyers and potential buyers for a product or
services over a specific period of time. "Market is a group of individual; organizations
who may want the good or service being offered for sale and who meet these three
additional criteria:
Members of a market must have the purchasing power to be able to buy the
product being offered.
Market members must be willing to spend their money or exchange other
resources to obtain the product.
Market members must have the authority to make such expenditures.
2.1.2Marketing
"Marketing consists of all business activities involved in the flow of goods and services
from the point of initial production unit they are in the hands of the ultimate consumer.
Thus, agricultural marketing is a process by which the producer and buyer of agricultural
goods are brought together."
"The making process establishes forward linkages for agricultural activities, that is, it
provides economic rewards for the production process. It includes not only storage and
transportation activities of the middleman but also encompasses all activities linking the
consumer and the producer."
"Marketing is the process of planning and executing the conception, pricing, promotion,
and distribution of goods, services, and ideas to create exchanges with target group that
satisfy customer and organizational objectives."
A marketing programmer plays a crucial role in the physical distribution of any product.
Therefore each and every firm should have marketing system for channel the product to
the market to satisfy customer needs and wants. Sometimes they have to face the
marketing problems of capturing the market and creating goodwill.
A more modem definition in tune with greatly expanded productive capacity might
emphasize the adaptation production facilities to the market. Specifically marketing
might be defined as the response of businessmen to consumer demand through
adjustments in production capabilities. Adjusting production, accounting, finance and
marketing in the light of the changing needs of consumers who are affluent enough to
have varied buying choices.
"Marketing is concerned with designing an efficient and fair system which will direct an
economy's flow of goods and service from producers to consumers and accomplish the
objective of the society."
"Marketing is a social and managerial process by which individuals and groups obtain
what they needs and want through creating, offering and exchanging products of value
with others." Marketing can be defined in a simple manner as the activities done by the
company to deliver the product from the place of production to the place of consumption.
It means that marketing is the process of the transfer of ownership of the product in
exchange of something of value.
Different authorities define marketing in different ways." Marketing is the exchange
taking place between consuming groups on the one hand and supplying groups on the
other." Marketing is concerned with regular the lever, timing, and character of demand
for one more products of an organization." "Marketing is human activity directed at
satisfying needs and wants through exchange processes." "Marketing is the anticipation,
stimulation, facilitation, regulation and satisfaction of consumer and public’s demand for
products, services, organization, people, place and ideas through the exchange process."
According to Stanton "Marketing is defines as total system of business activities designed
to plan, price, promote and distribute want satisfying goods and service to present and
potential customers."
In the light of above definitions, it can be concluded that marketing is a process of
delivering goods and services produced to satisfy the needs of consumers to the
consumers in an effective way so that the objectives of the produces are fulfilled.
Marketing thus satisfies the objectives of the producers by making it possible to sell their
products on the market in one hand and on the other hand helps consumer to get ht
maximum of satisfaction by providing goods and services for their consumption.
In the modern marketing era every marketers should understand the consumer needs.
Successful marketing understand consumer taste, quality and choice. If there is no
satisfaction of consumer that product doesn’t give good result. For consumer satisfaction,
the product that is available easily ad everywhere than customer attract in that product
easily.
2.1.3 Marketing System
A system is a set of units with relationships among them. Marketing is a system of
business activities designed to plan, price, promote and distribute want satisfying product
to target market to achieve organizational objectives.
"The concept of marketing system is given by the system approach to marketing based
upon the work of Bertlanfy." The term 'marketing system' consists of two separate words
"marketing" and "system". Marketing is a human activity directed at satisfying needs and
wants through exchange processes. On the other, the term "system" means regularly
interacting group of activities forming a unified whole. In other words, system means
systematic or regular flow of anything directed at fulfilling basic goals.
"Marketing system deals with the smooth functioning of the marketing activities for the
fulfillment of the consumer needs and wants. If a marketer fails to do so, then we must
know that there is something wrong with the marketing organization. And, in this
situation no marketer can work successfully. So, the marketing manager must be able to
analyze the marketing system in systematic manner."
2.1.4 Marketing Environment
"Environment is an outside organization but potentially relevant to the firm's market and
marketing activities. It consists of the factors that affect the firm's ability to develop and
maintain both the successful transactions and the relationships with its target customers."
The marketing environment consists of external forces that directly or indirectly
influence an organization's acquisition of inputs and generation of outputs. Examples of
inputs include skilled personnel, financial resources, raw materials and information. The
output
Should be information, packages, goods, Services, or ideas. "The marketing environment
as consisting of six categories of forces: political, legal, regulatory, societal, economic
and competitive, and technological." In this sense, marketing environment lays upon
limits or constraints on the firm's marketing activities, such as, marketing information
system, marketing planning system, implementation system, control system, production
activities, pricing promotion, placing etc. The effect of marketing environment cannot be
measured in term of expectations, assumptions and predictions but in terms of goal
achievements. That’s why; investing a huge amount of time, money, energy etc has
become a new life style of almost all marketing enterprises. The key to marketing success
lies more than ever, on knowing: what a firm is; what it is in the competitive
environment; and who its competitors are."
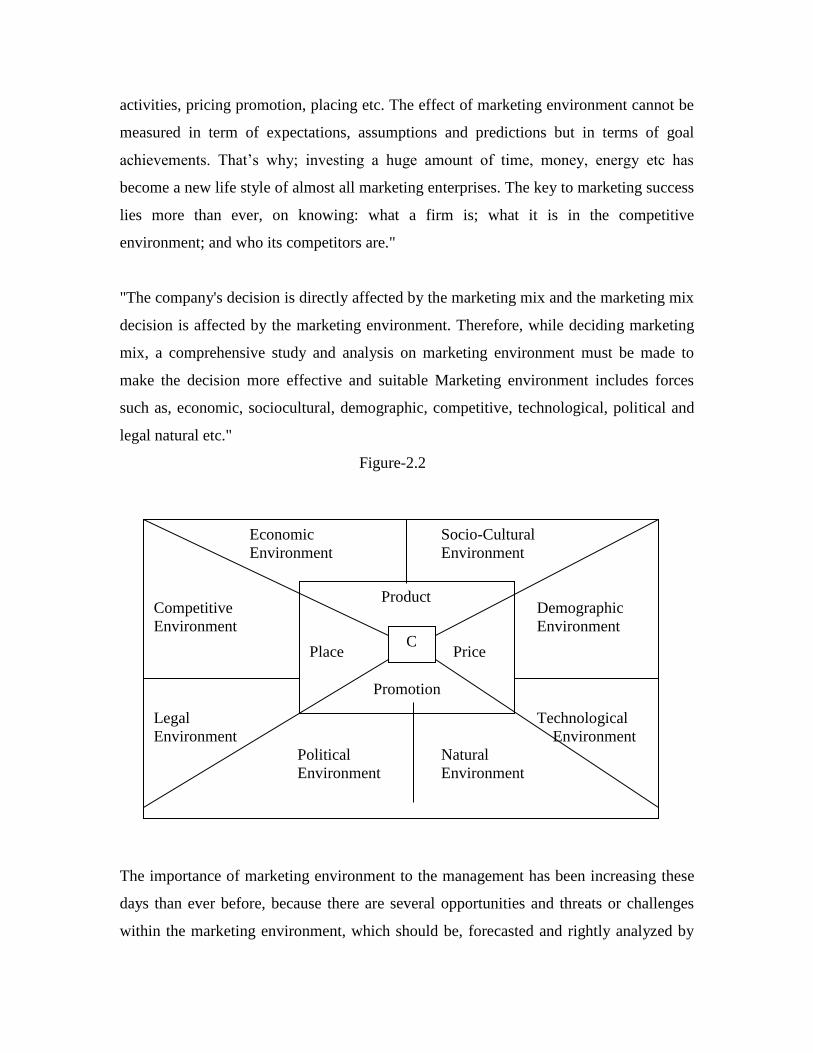
"The company's decision is directly affected by the marketing mix and the marketing mix
decision is affected by the marketing environment. Therefore, while deciding marketing
mix, a comprehensive study and analysis on marketing environment must be made to
make the decision more effective and suitable Marketing environment includes forces
such as, economic, sociocultural, demographic, competitive, technological, political and
legal natural etc."
Figure-2.2
The importance of marketing environment to the management has been increasing these
days than ever before, because there are several opportunities and threats or challenges
within the marketing environment, which should be, forecasted and rightly analyzed by
Economic Socio-Cultural
Environment Environment
Competitive Demographic
Environment Environment
Legal Technological
Environment Environment
Political Natural
Environment Environment
Product
Place Price
Promotion
C
the marketing manager to enjoy the opportunities. A successful marketer is one who can
appropriately analyze these forces. A successful marketer can acquire several
opportunities through these forces and successfully run his business.
2.1.5 Role of Marketing in Industrialization
Industrialization is the impact of overall development of country. Today industrialization
is considered as synonymous to development. The countries, which are industrialized, are
developed too and vice versa. Many countries which we say the most developed countries
like UK, USA, Japan, China etc. have been fully industrialized and the countries which
are under developed or developing are also stepping gradually ahead toward that
direction. All Nepal, a developing country, too is not exception to this phenomenon of the
world.
Marketing plays a very significant role in accelerating the pace of industrialization, which
in turn, aims at making the economy developed and strong. In this connection, it is
significant to note that marketing is the most important multiplier of economic integration
and the fullest utilization of assets and productive capacity an economy already
possesses. It mobilizes latent economic development of entrepreneurs and in managers."
Marketing plays important role in the process of industrialization. The proceeds of
industrial activity are passed on to the society through the process of marketing. Hence,
the success or failure of fussiness largely hinges upon the art and science of marketing,
which is composed of explorative knowledge, tact, and talent of veteran practitioners. In
the global market, the multinational companies like Sony, Hitachi, Toshiba, Philips,
Proctor and Gamble, Johnson and Nicholson, and many others have been permeating
throughout the world with the help of modern marketing practices and methods. So are
Tata the Birla, the Bajaj India, and STC, That food (Ra Ra noodles), Bottlers Nepal and
Panchakanya Iron in Nepal. Marketing in this sense has made the producers as well as the
customers more conscious toward comparative service, values, safety, satisfaction and
convenience.
2.1.6 The Marketing Mix
The Marketing mix is one of the most fundamental concepts associated with the
marketing process. It is well understood by most modern marketers and is systematically
applied in many industries especially those that deal with physical products. Yet it is easy
to assume that, because most managers have heard about it and/or use it, there is no need
to mention it again a book on marketing.
The sad truth is that quite often the precise role and scope of the concept and its
underlying principles are not fully appreciated by those who tackle about it or use it.
Many mangers as no more than a theoretical model that helps in understanding the breath
of activities encompassed by the marketing task regard it. In many situations it is
considered as no more than an aid to highlighting the fact that 'marketing' is a much
broader concept than just selling and buying.
A brief review of the main principles surrounding the marketing mix can help to clarify
its true role in the development amid execution of an effective marketing effort.
The marketing mix is the set of marketing variables which the organization blends to
achieve the marketing goal in a defined target market. The marketing mix consist of
everything the organization can do influence the demand for its product in the target
market.
As stated earlier the marketing mix represents as assemblage of tasks and subtasks, which
ultimately will help to satisfy the customer's requirements in such a way as to enable the
firm to attain its objectives in an optimum fashion. The subtle part of the concept is that
different company in the same business may opt to develop different 'mixes'. In fact it is
this different that may provide one company with competitive advantages over its
competitors.
The concept of the Marketing Mix essentially premises that the decision making
executive must analyze certain market forces and certain elements of marketing if the
executive is ultimately to determine a sound "mix" of marketing elements which
promises to be effective and profitable." The "four Ps model" of the marketing mix has
probably gained acceptance because of its elegance rather than its validity in all
situations. Regrettably, what has been gained in simplicity has been sacrificed in
universal appropriateness. It is easy to find examples of marketing programmers, which
don not outset that this model is not of universal validity.
The theory underlying the four Ps is that, if one manages to achieve the right product at
the right price with the appropriate promotion, and in the right place, the marketing
program will be effective and successful. However, one must bear in mind that each of
the four Ps can be broken down in to a number of sub-components. Marketing Mix is the
set of marketing tools that the firm uses to pursue its marketing objectives in the target
market.
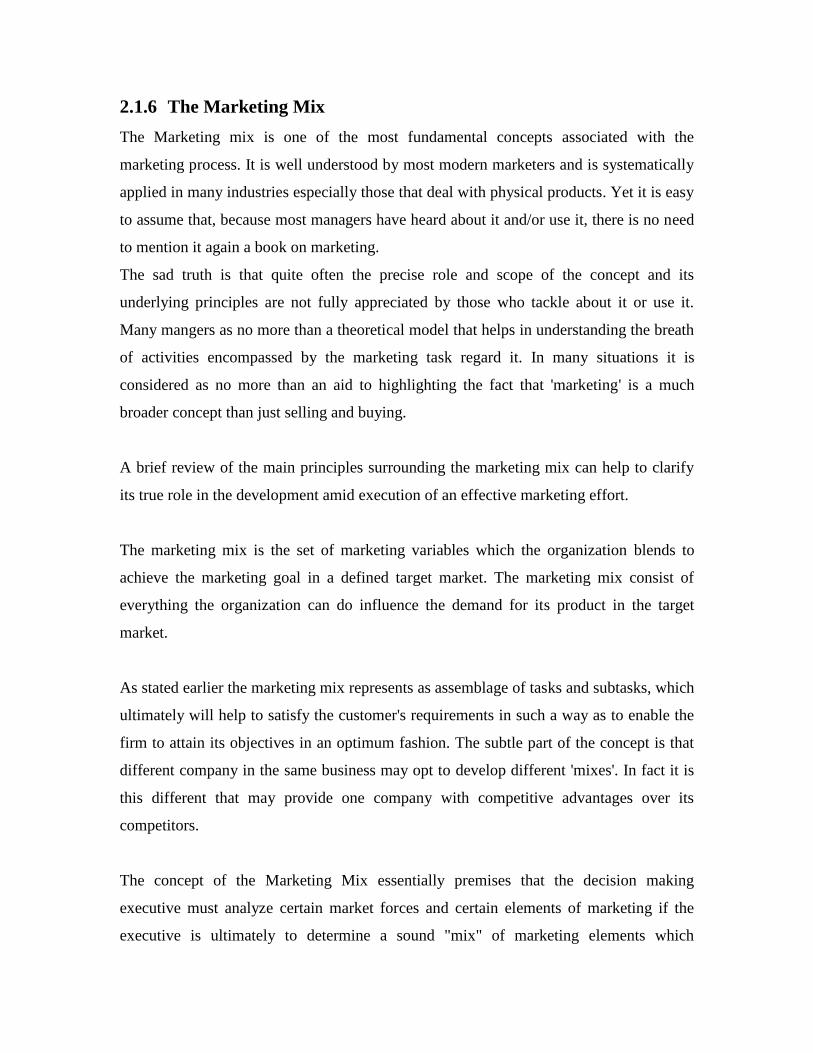
Figure-2.3
Product variety List price Sales promotion Channels
Quality Discounts Advertising Coverage
Design Allowances Sales force Assortments
Features Payment period Public relation Locations
Brand name Credit terms Direct marketing Inventory
Packaging Transport
Sizes
Services
Warranties
Returns
Marketing Mix
Product Price Promotion Place
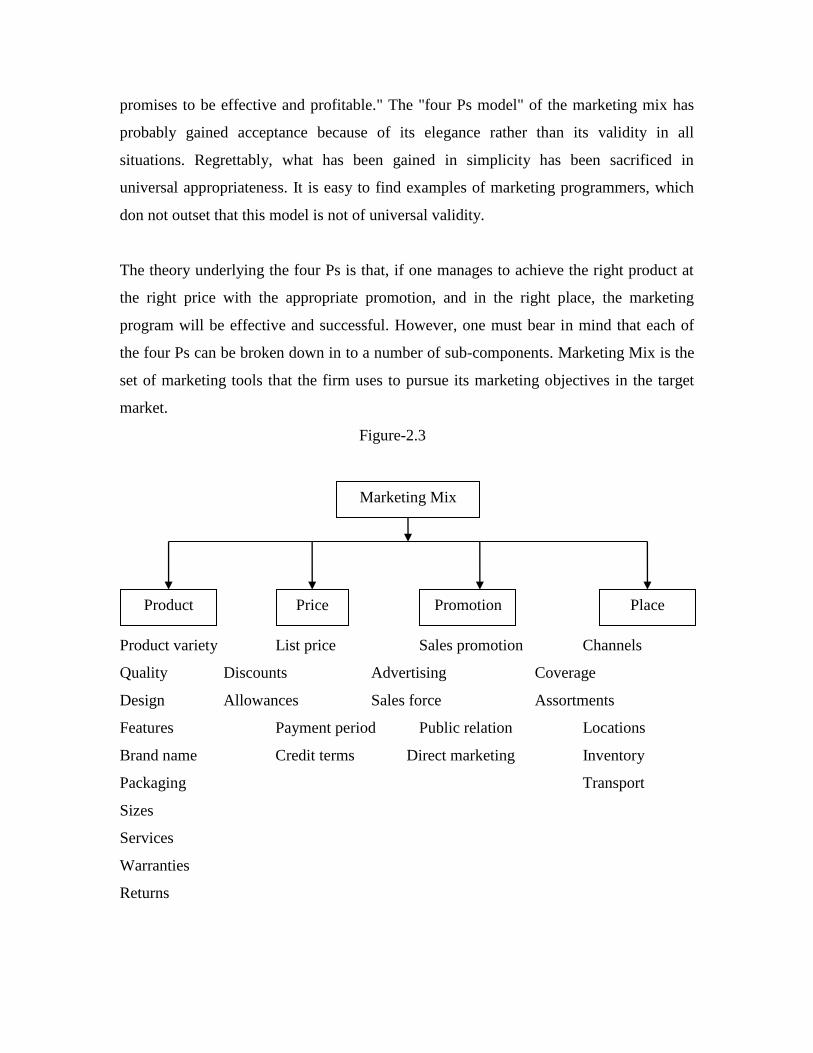
"Marketing Mix is one of the key concepts in modern marketing. It refers the set of
variables that the business uses to satisfy consumer needs." "Marketing mix may be
considered as consisting of four Ps-product, price, promotion, place."
Figure-2.4
Variable of Marketing Mix
2.1.6.1 Product
Product is one of the most important parts of the marketing mix. Without product we
cannot sell or buy the things. The product area is concerned with developing the right
product for the target market. This product may involve a physical and or some
combination of services. The crux of the matter in the product area is to develop
something, which will satisfy the customers’ needs.
Most of the text will be concerned with tangible products, but the principles in most cases
also apply to services. It is important to keep this in mind, since the service side of our
economy is growing. It is also important to see the product concept as including service,
because it is too easy to become overly occupied with producing and selling tangible
products. Too many production oriented people fall into these trap and neglect important
opportunities for satisfying needs in other ways.
Product Price
Place Promotion
Consumer
Needs
A product is anything that can be offered to a market to satisfy a want or need. Products
that are marketed include physical good, services, persons, place, organization and ideas.
The product offered by an organization is what the business(or no business) entity is all
about. While we tend to think of products as objects we can see and touch the term
product may be used in referring to intangible services and ideas as well. So product is a
market's offering as perceived by the market." "Product mix includes decisions on
product line and mix, product, quality, variety, design features, branding, packaging,
labeling, etc. It also includes important activities such as product planning and
development.
2.1.6.2 Place
A product is not much good to a customer if it is not available when and where he/ she
wants it. We must consider where, when and by whom the goods and services are to be
offered for sale.
Goods and services do not flow from producers to consumers automatically. They move
through channels of distribution where a great deal of marketing work is done. Channel
members may or may not handle the goods. Some may own them and transfer title, while
others do neither. Some may provide return and repair services, while also storing and
transporting them. And others may be primarily concerned with transmitting money and
information. In other words, a number of things flow through a channel, besides goods, in
both ways.
Place or distribution mix includes design of the distribution channels, distribution
networks, dealer, promotion and motivation systems, and physical distribution of the
product. Any sequence of marketing institutions, from producer to final user or
consumer, including any number of middlemen is called a channel of distribution.
Marketing managers must work in and through such channels and so our study of place
will be very important to marketing strategy planning.
Even through marketing intermediaries are primarily a non controllable environmental
factor, a marketing executive has considerable latitude when working with them.
Management's responsibility is:
To Select and manage the trade channels through which the products will reach the
right market at the right time and
To develop a distribution system for physical handling products and then transporting
them through the appropriate channels.
2.1.6.3 Promotion
Promotion, one of the four major variables with the marketing manager works, is
communicating information between seller and buyer with a view to changing attitudes
and behavior. The marketing manager's job is to tell target customers that the right
product is available at the right place at the right price.
Promotion is the ingredient used to inform and persuade the market regarding a
company's product. Advertising personal selling, and sales promotion are the major
promotional activities.
The major promotional methods include personal selling, mass and sales promotion.
Personal selling involves direct face to face relationships between sellers and potential
customers. Mass selling is designed to communicate with large number of customers at
the same time. Advertising is the main form of mass selling, but it also involves publicity.
Sales promotion refers to specific activities that complement personal and mass selling
such as point of purchase displays booklets, leaflets, and direct mailings.
Companies face the task of distributing the total promotion budget over the five
promotional tools advertising, sales promotion, public relations and publicity, sales force,
and direct marketing. Within the same industry, companies can differ considerably in
how they allocate their promotional budget. It is possible to achieve a given sales level
with varying promotional mixes.
It is the variable that communicates to the consumer about other variable of marketing
mix for their need satisfaction. It consists of advertising, publicity, personal selling and
sales promotion.
2.1.6.4 Price
Price is also one of the major parts of the marketing mix. While the marketing manager is
developing the right product and promotion, he also must decide on the right price. In
setting the price, he must consider the nature of competition in his target market as well
as the existing practices on markups, discounts and terms of sale. He also must consider
legal restrictions affecting prices.
Price mix includes such as analysis of competitors prices, formulation of pricing
objectives, setting the price, determining terms and conditions of sales, discounts and
commission etc." In pricing, management must determine the right base price for its
products. It must decide on strategies concerning discounts, freight payments, and many
other price related variables.
In economic theory, we learn that price, value, and utility are related concepts. Utility is
the attribute of an item that makes it capable of satisfying human wants. Value is the
quantitative measure of the worth of a product to attract other products in exchange. Price
is value expressed in terms o dollars and cents, or any other monetary medium of
exchange. In Pricing we must consider more than the physical product alone. A seller
usually is pricing a combination of the physical product and several services and wants
satisfying benefits. Price is the value place on goods and services. Price is tile amount of
money and/or product that are needed to acquire some combination of another product
and its accompanying services.
It is the variable that creates sales revenue. Consumers pay price to buy products for their
need satisfaction. It may be fixed on the basis of cost, demand or competition. It may
involve discounts, allowances, credit facilities etc. Price has become the second most
important variable of marketing mix because o inflationary pressures in recent years.
2.1.7 Marketing Strategy
Marketing strategy is both unique and common. That might sound like a contradiction of
terms but it is not. The term "Strategy" is widely used to describe a seemingly endless
number of marketing activities. Today, everything in marketing seems to be "Strategic."
There is strategic pricing strategic market entry, strategic advertising, and may be even
strategic strategy. The glut, of competition has focused more attention on performing the
traditional marketing actions strategically with an eye towards beating the traditional
marketing actions strategically with an eye towards beating the competition. In that sense,
marketing strategy is commonplace. In recent years it seems to have been appended to
nearly every marketing action.
Marketing strategy is also unique. There is not one unified definition upon which
marketers agree. Marketing strategy is a commonly used term, but no one is really sure
what it means. "A strategic sector is one in which you can obtain a competitive advantage
and exploit strategic sectors are the key to strategy because each sector's frame of
reference is competition. The largest competitor in an industry call be unprofitable if the
individual strategic sectors are dominated by smaller competitors." Boyd and Larreche
(1978) had found in the history of marketing strategy that tremendous confusion over just
what strategy is. The term "Strategy" as used in marketing, has been applied to at least
three types of issues, each at a different level of aggregation."
At the macro level, there are marketing strategies, which focus, on manipulations of the
marketing mix variables product, price, place, and promotion. According to that
definition setting a strategy for a product consists of selection a price for a produce,
designing an advertising campaign, then deciding on a plan of distribution. Finally there
are product market entry strategies, which include strategies that look at specific
marketing decisions strategies that call for a firm to built markets share harvest profit and
share of defined share from competitors. Another widely used definition of strategy in
marketing emphasized the broader perspective of strategy in management. That definition
views strategic market planning as a four steps.
Defining the business
Setting a mission
Selecting functional plans for marketing, production, and other areas and
Budgeting for those plans, (A bell and Hamond 1979) in that sense, marketing
strategy is more akin to corporate strategy."
Strategic marketing is a major component of the strategic planning. Its main objective is
to establish the product/market scope of a business. Strategic and marketing is the method
that concentrates on the market to serve, the competition to be tackled and the timing of
market entry/exit and related moves. Formally, strategic marketing deals with the
following question;
Where to complete?
How to complete?
When to complete?
Strategic marketing helps to define the market in entering and competing. That may be
either an entire market or one or more segments of the entire market. Strategic marketing
provides inputs or techniques for soling customer need. That technique may be either an
introduction of a new product or existing product with improvements. Similarly, strategic
marketing tries to identify an appropriate time for entering to the market defined. The
appropriate time to enter the market may be the first in the market or wait until primary
demand is established."
2.1.7.1 Product strategy
In a very narrow sense, a product is a set of tangible physical attributes assembled in an
identifiable form. Each product carries a commonly understood descriptive name, such as
apples, steel or baseball bats. "A product is a set of tangible and intangible attributes,
including packaging, color, price, manufacturer's prestige, retailer's prestige, and
manufacturer's and retailer's service." "Product is anything that can be offered to a market
for attention, acquisition, use or consumption, and that might satisfy a want or need.
Products include more than just tangible goods. Broadly defined, product includes
physical objects, service, persons, places, organizations, ideas or mixes of these entities."
A product is anything that is potentially valued by a target market for the benefits of
satisfaction it provides (Craven, Hills and Woodruff). The general principle is that a firm
must have a right product that can satisfy the needs and wants of the consumers. But a
product cannot satisfy their needs and wants over the time period, because of several
reasons:
First, like living creatures a product also has a life during which a firm has to reformulate
or modify or differentiate or standardize it to maintain its position in the market.
Second consumer demand goes on changing over the time period. As such, the same
consumer may demand different products over the time period.
Finally the requirement of all consumers is not alike, different consumers may demand
for different product attributes (such as quality, product service, branding, good packing,
attractive color and design prestige, problem, solution etc) at the same time.
It clearly indicate that the product decision is not only an important decision in the
marketing but also a most challenging task for the marketers, to succeed in the
competitive markets the marketer must be able to study each and every aspects of the
product including product life cycle, new product development, product mix and product
line, product positioning, branding packaging etc.
Product is what marketers offer to consumers. They include goods, service, ideas, and
any other things that can be exchanged by a supplier and a buyer or consumer. The term
product concept refers to the marketing strategist's selection and blending of a product's
primary characteristics and auxiliary dimensions into a basic idea or concept emphasizing
a particular set of consumer benefits.
Product strategy is the core of strategic planning for the enterprise and it plays pivotal
role in shaping marketing strategy. Management's strategic decisions about the product to
be offered are among the most important of those affecting the future of a company. No
other strategic decision has such widespread impact, cutting across every functional area
and affecting all level of an organization. This key strategic role should not come as
surprise since meeting people's needs and wants with goods and services is what business
is all about. A product strategy consists of:
Deciding how to position a business unit's product offering (specific product, line
or mix) to serve its target market.
Setting strategic objectives for the product offering.
Selecting a branding strategy.
Developing and implementing a management strategy for new and existing
products.
2.1.7.2 pricing Strategy
Price is one of the four major elements that the marketing manager must consider while
preparing the marketing program. Price is regarded as a backbone on which the success
of the marketing program ;argely depends. No rational product policy, no product, and no
marketing strategy cnabe formulated without consideration of price, nor price is set in
isolation of the total strategy. Since price decisions affect not only the firm's sales and
profit but also determines its future prospects, they must be taken into account seriously.
In general, price is value or amount of money sacrificed to obtain a particular product or
service. Price may also be defined as the exchange of something of value between parties
involved in a transaction. In economic sense, Price is value expressed in terms of rupees
or dollars; or any other monetary medium of exchange.
Pricing on the other means the determination of proper value to a particular product or
service. In broader sense, price settings involve the determination of some object that can
be used to establish the value of the exchange to all parties involved in the transaction.
Determining the valued to base price is a strategic decision. Pricing as a strategic variable
in marketing it should be based on systematic decisions to assign a value to
communication the seller's estimated worth of the offering.
Price strategy has many characteristics in common with a bomb. The consequences of
pricing decision can be explosive and far-reaching and it may be difficult to alter a
strategy once it has been implemented, particularly if the change calls for significant
price increases. Price has many possible uses as a strategic instrument in corporate and
marketing strategy.
We define a price strategy as: "Deciding how to position price within the range of
feasible; establishing whether price shall be used as an active or passive element in the
marketing program, setting the specific objectives to be accomplished by price; and
establishing policies and structure for guiding pricing decisions."
2.1.7.3 Distribution Strategy
Distribution is one of the majors marketing functions. Without it's effective and efficient
management the whole marketing system may be failed. So that, clever marketing
manager should have given due attention towards it's better functioning. Simply
speaking, distribution is the delivery of the products to the right time, place and
consumer. It is not a single element, but it is a mixed of various to consolidate functions.
Such as channel of distribution, transportation warehousing and inventory control etc.
Most producer work with marketing intermediaries to bring their product to market, they
try to forget a distribution channel. A producer should decide how many middlemen he
should seek at each level of distribution. He will determine the numbers of retailers,
wholesalers, agents and so on.
Distribution may be defined as an operation or a series of operation which physically
bring the goods manufactured or produced by any particular manufactures in to the hands
of the final consumer or users." "Distribution channels are major factors in the effective
development of the market share, internationally to maintain quality and ensure services,
direct distribution is also undertaken by many manufactures. Also, the use of multiple
channels will expand and include Tele-marketing, direct response marketing, mail-order
and computer assisted buying.
Distribution is concerned with the activities involved in transferring goods from
producers to final buyers and users. It includes not only physical activities, such as
transporting and storing goods, but also the legal promotional, and financial activities
performed in the course of transferring ownership. Since a succession of enterprises is
generally involved in the distribution process leading to the final sale to the consumer or
user, to understand distribution one must analyze both the different kind of marketing
institutions and the marketing channels in which they operate.
The means of distribution have a very significant effect upon the prices of goods and a
single means is not enough due to the geographical diversity, where there is single system
this has led to the rise in the price of commodities on the one hand and the non
availability of them in time, on the other hand. These problems have pointed to the
necessity of a new management in the means of distribution which specially considers the
factors like the nature of the commodity, the behavior of the customers, effectiveness of
time, education and social values.
The distribution channel moves goods from producers to consumers. It's overcomes time,
place and possession gaps that separates goods and services from those who would use
them. The different distribution channels are useful for receiving information, finding and
communicating with perspective buyers, attempting to agree on price and the other terms
that the transfer of ownership possession can happen.
In today is mass production economy; most producers do not sell their goods directly to
the final users. Distribution channels are among the most complete and challenging
function of decision making facing a firm in modern business organization. The channel
and physical distribution programmer are developed to deliver right products at the right
place at the right time at the lower cost.
Effective control of distribution costs can give an organization an advantage, if the
organization cannot control distribution costs profit will be impaired in the short run and
survival may be threatened in the long run.
Most producers do not sell their product directly to the final consumers. That is why; they
use a variety of intermediaries. Channels are the medium for taking the goods and
services to ultimate buyers. These organization and agencies are grouped together in
various combinations linking particular producing units through the channels of
distribution.
In today's economy most of the producer of goods and services do not sell their goods
directly to the final users. Between them and the final users stands a ghost of marketing
intermediaries performing in a variety of functions and bearing a variety of names. Some
middlemen such as wholesalers and retailer buy, take title to, and re-sell the merchandise.
They are called merchant middlemen other such as brokers, manufacturers and may
negotiate on behalf of the producer but do not take title to the goods. They are agent
middlemen.
After the product has been produced, producers must distribute or supply these products
to the target markets. In most of the cases, producers use several middlemen or channels
of distribution to supply goods and service to the consumption point.
A channel of distribution shall be considered to comprise a set of institutions, which
perform all of the activities utilized to move a product and its title from production to
consumption (Bucklin). Channels of distribution is an organized network of agencies and
institutions which in combination, perform all the activities required to link producers
with users and users with producers to accomplish the marketing task(Craven, Hills &
woodruff).
These intermediaries or channels of distribution tend to be used for several reasons:
The number of sellers and buyers and the distance o product movement are relatively
large;
The frequency of purchase is high;
Markets are decentralized.
There are three levels of marketing channels:
Direct channels
Indirect channel
Mixed channel
Under direct channel, producer himself distributes goods and services to the end users.
No intermediaries are used in this case. Under indirect channel, several intermediaries
such as wholesalers, retailers dealers, agents etc are used to supply good and services
from production point to the consumption point. Under mixed channel, producer uses
both direct as well as indirect channels at the same time for the purpose.
Here, intermediaries or middlemen can be divided into two categories:
Merchant Middlemen; and
Agents
Merchant middlemen purchase outsight and actually take title to the goods. Merchant
middlemen include wholesalers, retailer's etc. Agent acts in an agency capacity on behalf
of clients and does not take title to the goods, which they deal. They usually charge
certain commission in terms of percentage or lump sum.
2.1.7.4Physical Distribution
Physical distribution is concerned to the management of physical flow of goods from the
points of suppliers to the points of purchasers. Cravens, Hills and woodruff define
physical distribution management as the process of strategically managing the movement
and storage of materials, parts, and finished inventory from suppliers, between enterprise
facilities and to customers. Stanton defines physical distribution as the activities
concerned with the movement of the right amount of the right products to the right place
of the right time.
`The main objective of physical distribution is getting the right product safely to the right
places at the right time at the least possible cost. More specifically, the objectives of
physical distribution are:
To provide customer service
To distribute goods more safely
To minimize the total cost
To supply goods to the right target market function of physical distribution.
A physical distribution system consists of a sell of interrelate functions with
specific boundaries. The interrelated functions include the following element:
Transportation
Warehousing
Inventory Management and control
Order processing
Material Handling
Transportation is the element of the physical distribution system that links geographically
separated markets and facilities. There are five models of transportation.
Rail transport
Highway transport
Water transport
Pipe-line transport
Air transport
Warehousing decision determines the number, size and location of storage facilities
needed to service customer demand. Developing effective warehousing strategy includes
the decisions regarding the following elements:
Location of warehouse
Determine the type of warehouse i.e., private or public warehouse.
Evaluate developments in warehousing.
Inventory decisions are concerned with balancing the costs of carrying inventory,
ordering products from suppliers and controlling other inventory costs to achieve a
desired level of consumer satisfaction. Inventory accumulation is expensive, yet
availability is essential to having satisfaction customers.
Order processing constitutes the communication linkage that stimulates a physical
distribution system into action. In other words, order processing regard to all those
activities involved in collecting, checking and transmitting sales-order information. It is
the handling of all paper work associated with the sale of goods and services offered by
an organization.
Material handling, also called the physical handling of goods and activity that is
important in inventory, warehousing, and transportation. The characteristics of a product
determine to a large extent how it will be handled.
2.1.7.5Promotional Strategy
Promotional strategy is also one of the most important marketing strategies. There is
various type of promotion. These include advertising personal selling, sales promotion
and various miscellaneous efforts. When management has a message to pass to target
consumers promotion is the proper vehicle.
Like other marketing tools, both business and non business organizations use promotion.
The state of Louisiana has been promoting family planning since 1965. Promotion can be
used to improve the image of police work as a career.
A company needs to make marketing decisions only in the areas of segmentation, product
offering, pricing, and distribution but also in the area of promotion. Promotion is "any
marketing effort whose function is to inform or persuade actual or potential consumers
about the merits of a given product or service for the purpose of inducting a consumer
either to continue or to start purchasing the firm's product or service at some given price.
Promotion is persuasive communication. It is a highly visible element in the marketing
mix. It tells the target customers about product, price and place. It is also known as
marketing communication. "Promotion is applied communication used by marketers to
exchange persuasive messages and information between buyers and sellers."
Promotion represents the various communications to inform and persuade people that a
firm directs towards its market targets, channel organizations, and the public at large.
These communications consists of advertising, personal selling, and sales promotion
activities. Increasingly, marketing management is finding it profitable to combine
advertising, personal selling, packaging, point of purchase, direct mail, product sampling,
publicity, and public relations decisions into an integrated promotion strategy for
communicating with buyers and other involved in marketing purchasing decision. Since
each type of promotion has certain strengths and short comings, the strategy adopted
should capitalize upon the advantages of every component in shaping a cost effective
communications mix.
There are various promotion methods.
A. Advertising:
Unlike personal selling and some sales promotion and public relation techniques,
advertising is an impersonal means of communication. Advertising is an impersonal
promotion to groups that is paid for by an identified sponsor. It focuses upon group of
persons, rather than upon individuals. Advertising can be described as any paid of non
personal communication by a sponsor. Advertising any persuasive message carried by a
mass medium and paid for by a sponsor who sings the message.
B. Personal Selling:
Personal selling can be a very intense means of promotion. Personal selling consists of
person to person communication between sales persons and their prospects. Unlike
advertising, it involves personal interaction between the source and the destination.
Personal selling refers to oral presentation to one or more customers in a face to face
situation for stimulating demand for products and services or enhancing company image.
Personal selling is a person to person dialogue between buyer and seller where the
purpose of the interaction, whether face to face or over the phone is to persuade to buyer
to accept a point of view or to convince the buyer to take a specific course of action.
C. Sales Promotion:
According to the American Marketing Association, sales promotion is ,Those marketing
activities, other than personal selling advertising, and publicity that stimulate consumer
purchasing and dealer effectiveness, such as displays, shows and expositions,
demonstrations, and various no recurrent selling efforts not in the ordinary routine." Sales
promotion activities are impersonal and usually nonrecurring, and are directed to ultimate
consumers, industrial consumers, and middlemen. These activities tend to supplement the
advertising and personal selling efforts. Examples of sales promotion are free product
samples, trading stamps, store displays, premiums, coupons, and trade shows. "Sales
promotion can be defined as those promotional activities other that personal selling,
advertising, and publicity that are intended to stimulate buyer purchases or leader
effectiveness in a specific time period.
D. Publicity:
Publicity is a means of promoting to the mass market. Publicity is similar to advertising,
except that it is free, is found in the editorial portion of news media, and pertains to
newsworthy events. The most common types of publicity are news releases (also called
press releases), photographs, and feature stories. Publicity is similar to advertising except
that it involves an unpaid and unsigned message even though it may use the same mass
media as advertising does.
Public Relations:
Marketers engage in public relations in order to develop a favorable image of their
organizations and products in the eyes of the public, they direct this activity to parties
other than target consumers. These 'others' include the public at large labor union, the
press, and environmentalist groups. Public relations activities include sponsoring floats in
parades, lobbying and using promotion messages to persuade members of the public to
take a desired position.
Push or Pull Strategies:
In Push strategy, the promotion program is directed at middlemen. The product is
'pushed' through the channel. The channel members are persuaded to order, carry and
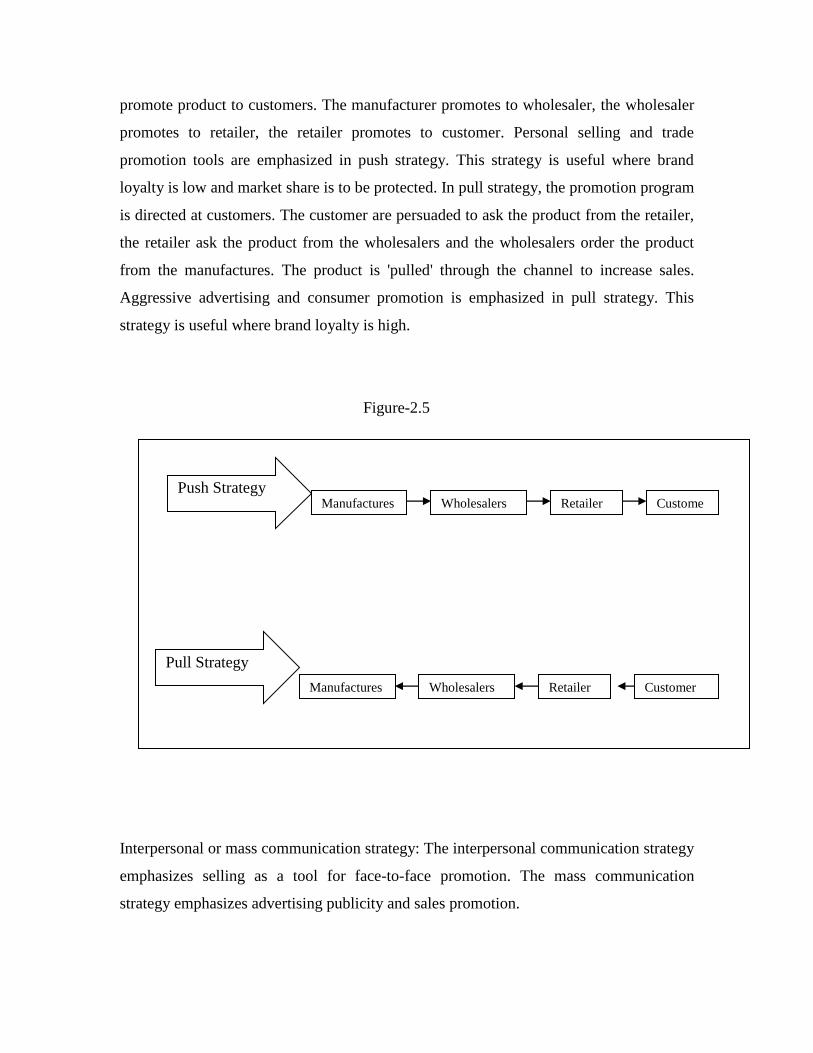
promote product to customers. The manufacturer promotes to wholesaler, the wholesaler
promotes to retailer, the retailer promotes to customer. Personal selling and trade
promotion tools are emphasized in push strategy. This strategy is useful where brand
loyalty is low and market share is to be protected. In pull strategy, the promotion program
is directed at customers. The customer are persuaded to ask the product from the retailer,
the retailer ask the product from the wholesalers and the wholesalers order the product
from the manufactures. The product is 'pulled' through the channel to increase sales.
Aggressive advertising and consumer promotion is emphasized in pull strategy. This
strategy is useful where brand loyalty is high.
Figure-2.5
Interpersonal or mass communication strategy: The interpersonal communication strategy
emphasizes selling as a tool for face-to-face promotion. The mass communication
strategy emphasizes advertising publicity and sales promotion.
Push Strategy
Pull Strategy
Manufactures Custome
r666rrtrrr
r
Wholesalers Retailer
Manufactures
Wholesalers
Retailer Customer
2.1.8Definitions of Attitude
2.1.8.1Definition
Social psychologists, unfortunately, do not agree on the precise definition of an attitude.
In fact, there are more than 100 different definitions of the concept. However, four
definitions are more commonly accepted than others. One conception is that an attitude is
how positive or negative, favorable or unfavorable, or pro or cons a feels toward an
object an object. The definitions views to attitude as a feeling or an evaluation reaction
to the objects.
A second definitions represents that thoughts of Allport, who views attitudes as “learned
predispositions to respond to an object or class of object in a consistently favorable or
unfavorable way”. This definition is slightly mare respond towards an object.
A third definitions of attitude popularized by cognitively oriented social psychologists is:
" an enduring organization of motivational, emotional perceptual, and cognitive process
with respect to some aspect of the individual's world. This views attitudes as being made
up to three components. (1) the cognitive, or knowledge, component,(2) the affective, or
emotional, component, and (3) the cognitive, or behavioral-tendency, component.
More recently, theorists have given more attention to a new definition of attitude, which
has generated much research and has been useful in predicting behavior. This definition
explicitly treats attitudes as being multidimensional in nature, as opposed to the one-
dimensional emphasis taken by earlier definitions. Here, a person's overall attitude
toward an object is seen to be a function of(1) the strength of each of a number of beliefs
the person holds about various aspects of the object and(2) the evaluation he gives to
each behalf as it relates to the object. A belief is the probability a person attaches to a
given piece of knowledge being true.
This last definition has considerable appeal, because it has been shown that consumers
perceive a product (object) as having many attributes, and they form beliefs about each of
these attributes. For example, a consumer may believe strongly that Listerine mouthwash
kills germ, helps prevent colds, gives people clean, refreshing breath, and prevents sore
throats. If this consumer evaluates all five of these attributes as favorable qualities, then
according to the definition he would have a strongly favorable overall attitude toward the
brand. On the other hand, a second consumer might believe Justas strongly as the first
consumer that Listerine possesses all five of these traits; however, she may not evaluate
all attributes as favorably as the first consumer does. Therefore, her overall attitude
toward the brand would be less favorable. This idea will be discussed in more later in the
chapter.
It has been important to provide all four attitude definitions because the majority of
attitude studies have been based on them. In fact, results of this research serve as the
basis of this chapter.
2.1.8.2 Characteristics of Attitudes
Attitudes have several important characteristics or properties: namely, they (1) have an
object; (2) have direction, intensity, and degree; (3) have structure; and (4) are learned.
1) Attitudes Have an Object
By definition, attitudes must have an object. This is, they must have a focal point whether
it be an obstruct concept, such as "ethical behavior" or a tangible item, such as a
motorcycle. The object can be a physical thing, such as a product, or it can be an action,
such as buying a lawnmower. In addition, the object can be either one item, such as a
person , or a collection of items such as a social groups; it also can be either specific
(Deutschmacher bologna) or general (imported meats).
2) Attitudes Have Direction, Degree and Intensity
An attitude expresses how a person feels toward an object. It expresses (1) direction- the
person is either favorable or unfavorable toward, or for or against the object; (2) degree
how much the person either likes or dislikes the object; and (3) intensity the level of
sureness or confidence of expression about the object, or how strongly a person fells
about his or her conviction. Although degree and intensity might seem the same and are
actually related, they are not synonymous. For example, a person may feel that a Snapper
riding mower is very poorly made. This indicates that his attitude is negative and the
degree of negative feeling is quite extensive. However, the individual may have very
little conviction or feeling of sureness (intensity in attitude) that he is right. Thus, his
attitude could be more easily changed in a favorable direction than a person who feels a
strong conviction that Snapper mowers are poorly made.
3) Attitudes Have Structure
As explained below, attitudes display organization, which means that they have internal
consistency and possess inter attitudinal centrality. They also tend to be stable, to have
varying degrees of salience, and to be generalizes.
The structure of human attitudes may be viewed as a complex Tinker Toy set created in a
type of circular pattern. At the center of this structure are the individual's important
values and self concept. Attitudes close to the hub of this system are said to have a high
degree of centrality. Other attitudes located farther out in the structure possess less
centrality.
Attitudes do not stand in isolation. They are associated (tied in) with each other to form a
complex whole. This implies that a certain degree of consistency must exist between
them. That is , because they are related, there must be some amount of "fit" between
them, or conflict will result. Also, because the more central attitudes are related to a
larger number of other attitudes, they must exhibit a greater degree of consistency than
more peripheral attitudes do.
Because attitudes cluster into a structure, they tend to show stability over time. The
length of time may not be infinite, but it is far from being temporary. Also, because
attitudes are learned, they tend to become stronger, or at least more resistant to change,
the linger they are held. Thus, newly formed attitudes are easier to change and less stable
than are older ones of equal strength.
4) Attitudes are learned
Among all of the attitudes in a person's attitudinal structure, some are more important or
salient to her than others. For example, a U.S. consumer might feel that "buying
American" is more important than saving money. Therefore, she might purchase an
American car that coasts more than a comparable foreign car. Also, the "buy American"
attitude can be closely tied to attitudes of creating American jobs, keeping money at
home, and the like, which thereby support the " buy American" attitude and increase it
salience.
2.1.8.3 Functions of Attitudes
Attitudes serve four major functions for the individual: (1) the adjustment function, (2)
the ego defensive function, (3) the value expressive function, and (4) the knowledge
function. Ultimately, these function serve people's need to protect and enhance the image
they hold of themselves. In more general terms, these functions are the motivational
bases, which shape and reinforce positive attitudes toward goal objects perceived as need
satisfying and/or negative attitudes toward other objects perceives as punishing or
threatening. These situations are diagramed. The functions themselves can help us to
understand why people hold the attitudes they do toward psychological objects.
1. Adjustment Function
The adjustment function directs people toward pleasurable or rewarding objects and away
from unpleasant, undesirable ones. It serves the utilitarian concept of maximizing reward
and minimizing punishment. Thus, the attitudes of consumers depend to a large degree on
their perceptions of what is needed satisfying and what is punishing. Because consumers
perceive products, services, and stores as providing need-satisfying or unsatisfying
experiences, we should expect their attitudes toward these objects to vary in relation to
the experiences that have occurred.
2. Ego-Defensive Function
Attitudes formed to protect the ego or self image from threats help fulfill the ego
defensive function. Actually, many outward expressions of such attitudes reflect the
opposite of what the person perceives himself to be. For example, a consume who has
made a poor purchase decision or a poor investment may staunchly defend the decision as
being correct at the time or as being the result or poor advice from another person. Such
ego defensive attitudes help us to protect our self image, and often we are unaware of
them.
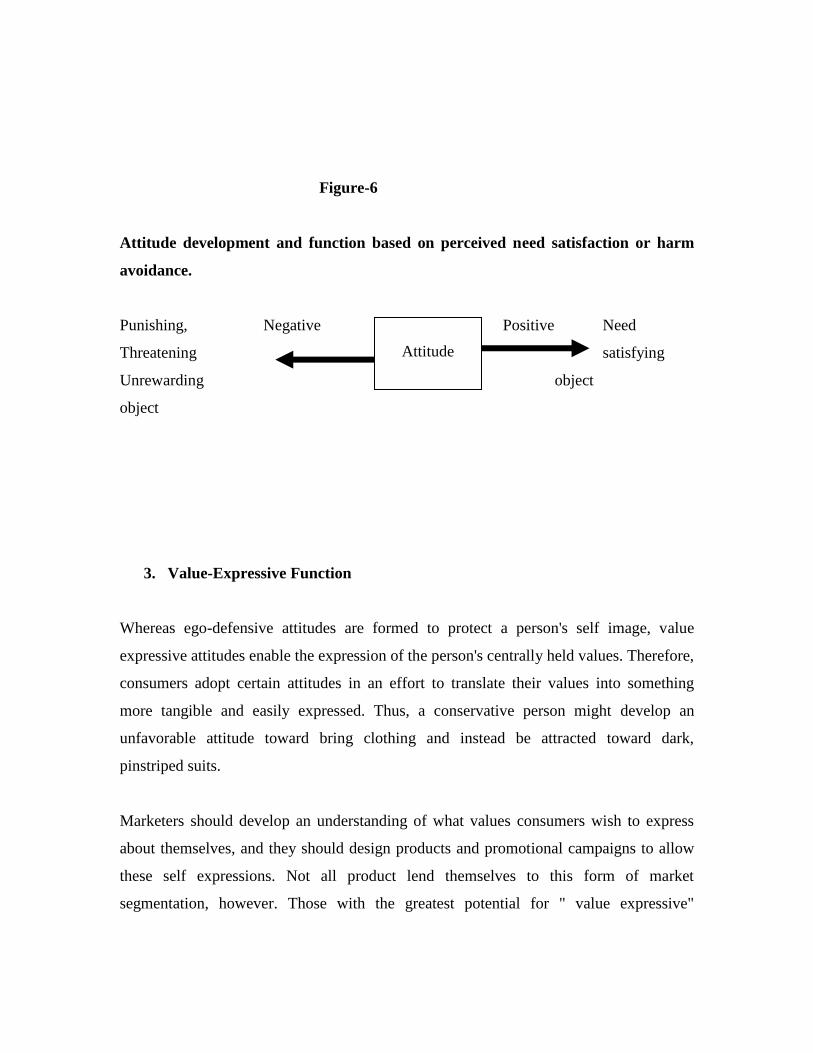
Figure-6
Attitude development and function based on perceived need satisfaction or harm
avoidance.
Punishing, Negative Positive Need
Threatening satisfying
Unrewarding object
object
3. Value-Expressive Function
Whereas ego-defensive attitudes are formed to protect a person's self image, value
expressive attitudes enable the expression of the person's centrally held values. Therefore,
consumers adopt certain attitudes in an effort to translate their values into something
more tangible and easily expressed. Thus, a conservative person might develop an
unfavorable attitude toward bring clothing and instead be attracted toward dark,
pinstriped suits.
Marketers should develop an understanding of what values consumers wish to express
about themselves, and they should design products and promotional campaigns to allow
these self expressions. Not all product lend themselves to this form of market
segmentation, however. Those with the greatest potential for " value expressive"
Attitude
segmentation are ones with high socials visibility. Cross-pens, Saks Fifth Avenue clothes,
Ferrari automobiles, and Bang & Olufsen stereo systems are examples.
4. Knowledge Function
Human have a need for a structured and orderly world, and therefore they seek
consistency, stability, definition and understanding. Out of this need develops attitudes
toward acquiring knowledge. In addition, the need to know tends to be specific.
Therefore, an individual, who does not play golf, nor with to learn the sport, is unlikely to
seek knowledge or an understanding of the game. This will influence the amount of
information search devoted to this topic. Thus, out of our need to know come attitudes
about what we believe we need or do not need to understand.
In addition, attitudes enable consumers to simplify the complexity of the real world. That
is, as was pointed out in the chapter on information processing, the real world is too
complex for us to cope with so we develop mechanisms to simplify situations. We saw
that this involves sensory thresholds and selective attention, and it also involves attitudes.
Attitudes allow us to categorize or group objects as a way of knowing about them. Thus,
when a new object is experienced we attempt to categorize it into a group, which we
know something about. In this way the object can share the reactions we have for other
objects in the same category. This is efficient because we do not have to spend much
effort reacting to each new object as a completely unique situation. Consequently, we
often find consumers reacting in similar ways toads for "going out of business" sales,
"limited time" offers, "American made" goods, etc. Of course, there is some risk of error
in not looking at the unique aspects or new information about objects, but for better or
worse, out attitudes have influenced how we feel and react to new examples of these
situations.
2.1.9 Image
Since our research is concerned with the image of the cold drinks, it is very relevant to
make some assessment as to the "identifying the target audience"
(as it is called in the language of marketing). For this purpose we are going to present
some analysis of images as a review of literature in the concerned field o study, as
follows.
2.1.9.1 Image Analysis
Image is the set of beliefs, ideas, impressions and person holds as to an object i.e., a
product in the marketing sense. People's attitudes and action towards and object are
highly conditioned by that object's image.
2.1.9.2 Product & Services Images
The image that a product or service has in the mine of the consumer that is it's positioning
is probably more important to its ultimate success that are its actual characteristics.
Marketers try to position their brands so that they are perceived by the consumer as
fitting into a distinctive niche in the market place a niche occupied by no other product.
They try to differentiate their products by stressing attributes that they claim will fulfill
the consumer's needs better than competing brands. They strive to create a product image
consistent with the relevant self-image of the targeted consumer segment.
2.1.9.3 Positioning Strategies
Positioning strategy is the essence of the marketing mix; it complements the company's
segmentation strategy and selection of target markets. Positioning conveys the concept,
or meaning of the product or service in terms of how it fulfills a consumer needs.
Different consumer meanings (i.e. product images) are sometimes assigned to the same
product or service. Thus, a product (or service) can be positioned differently to different
market segments, or can be repositioned to the same audience, without actually being
physically changed.
2.1.9.4 Repositioning Strategies
Regardless of how well positioned a product appears to be the marketer may be forced to
reposition it in response to market events, such as a competition cutting into the brand's
market share. For example, rather than trying to meet the lower process of high quality
private label competition, some premium brand marketers have repositioned their brands
to justify their higher prices, playing up brand attributes that previously been ignored.
When Revlon decided to change the image of Revlon cosmetics to attract a younger,
more diverse audience, its repositioning strategy involved changing its copy appeals,
changing its advertising media (to youth oriented TV shows), and changing its
distribution channels (from higher price department stores to lower priced retail outlets
such as drug and supermarkets). Similar repositioning strategy was adopted by sprite and
fanta to target young generation Johnson & Johnson also adopted same tactics.
Another reason to reposition a product or service is changing consumer preferences. For
example, as consumers became aware of the dangers of intense sustaining, alert cosmetic
companies began to add sunscreens to lipsticks, moisturizers, and foundation creams, and
to promote this new benefits as a major attribute, thus repositioning specific product line.
They also created a new and highly profitable product category: self tanners that required
no sun exposure whatever. When health oriented consumers began to avoid hi-fat foods,
many fast food chains acted swiftly to reposition their images by offering salad bars and
other health oriented foods. Kentucky Fried Chicken changed its well known corporate
name to KFC in order to omit the bread word "Fried" from its advertising. Weight
watchers its diet-thin imagery while responding to a perceived shift in consumer values.
2.1.9.5Perceived Quality
Consumers often judge the quality of a product or service on the basis of a variety of
informational clues that they associate with the product. Some of these clues are intrinsic
to the product or services and others are extrinsic. Either singly or in composite, such
clues provide the basis for perception of product and service quality.
Clues that are intrinsic concern physical characteristics of the product itself, such as size,
color, flavor, or aroma. In some cases, consumers use physical characteristics to judge
product quality. For example, consumers often judge the flavor of ice cream or cake by
color cues. Even the perceived quality of laundry detergents is affected by color cues. For
example, many detergents are traditionally colored blue, in the hopes that housewives
will associate the color with the "bluing" their grandmothers used to add to whiten and
brighten their laundry. Similarly, coke and Pepsi both are offered in same color
signifying the completion they have with each other.
Consumers like to believe that they base their evaluations or product quality on intrinsic
cues, because that enables them to justify their product decisions, (either positive or
negative) as being "rational" or "objective" product choices. More often that not,
however, they physical characteristics they use to judge quality have no intrinsic
relationship to the products quality. For example, though many consumers claim they buy
a brand because of its superior taste, they are often unable to identify that brand in blind
taste tests.
2.1.10 Usages Pattern
Products do not sell themselves and marketing program that insures the same of products
as intended should include a program that will guarantee the sell of products. This
objective should include the study of usage pattern of the product i.e. that is in hand. How
consumers behave as to the consumption pattern of the product (i.e. cold drinks in our
case) must be studied. In fact the image of the product can be derived from the study of
the usage pattern of the product itself. For this purpose the study of consumer behavior
was done by the researcher himself through observation and interviews in many cases
and conclusions were drawn from the answers received through questionnaires
distributed to retailers and consumers also. On the other hand in a change to made in
taste, price or quality as a whole of the product is felt, again the study on usage pattern of
the product is needed. In our case i.e. our research work on cold drinks, the practical
aspect of the problem is very clear and lack of any previous research in the field hindered
this detail review of literature. And the findings as to the usage pattern will come to be
implied within the image and consumer behaviors regarding the marketing of cold drinks
in Barahathwa.
In fact, the images of this product as well as the attitude of a consumer towards a certain
product are often related to the pattern of use as seen in the market. Since, the usage
pattern if consumers is directly related to the understanding of consumer behavior. It is
obvious that a marketer or a manufacturer must have an idea or insight into why
individuals act in certain consumption related ways and with learning what internal and
external influence impact them to act as they do. As such it can be stated that
consumption pattern or usage pattern of a particular product depends upon this image and
the attitude themselves as already has come into existence in the mind of the consumer.
As such this specific study as to usage pattern itself does not give much sense unless it is
related to image and attitudes. As such, study of consumers usage pattern is deeply rooted
in the theories of consumer behavior began to study the buying behavior of consumers,
they soon realized that many consumers rebelled at using the identical products everyone
else used. Instead they preferred differentiated products that they felt reflected their own
special needs, personalities and lifestyles. Such situations give birth to different image
and attitudes towards different products and as a result set particular types of usage
pattern of products in the market. To meet the needs of specific groups of consumers
most marketers adopt a policy of "market segmentation", which calls for this division of
their total potential markets into smaller homogeneous segments for which they could
design specific products and or promotional campaigns. At the same time they also use
promotional techniques to vary the image of their products so that they would be
perceived as better fulfilling the specific needs o certain target segments. This process is
called nowadays as "Positioning". Other reasons for the developing interest in consumer
behavior regarding usage pattern of consumers include the rate of new product
development, growth of the movement, public policy concerns and environment concerns
etc.
Thus the marketing objective should be to enable the consumer, to link a specific image
with specific brand name. And such image will definitely lead to some specific pattern of
use of the products and the pattern seen and found in the existing marketing conditions
also lead back to the image and attitude also. This means usage pattern can also give feed
back to the marketers as to the strategic decision makings regarding the images and
attitudes of consumers towards certain products.
2.1.11Review of Related Studies
2.1.11.1Lamichhane, Hari "Marketing of cold Drinks in Nepal"(2006)"
The study was undertaken in 2006 with the following objectives:
To examine the potential consumers in purchasing cold drinks.
To identify the purchases behavior of consumers who purchase cold drinks.
To estimate demand of cold drinks in Nepal
To identify the best choice of consumers on cold drinks in the basis of selecting
brands advertising habitual testing, asking question and personal inspection.
To find the relationship between the brand preference and advertising.
To find out the popular media of advertising for the cold drinks, which can easily
attract the potential consumers on each company, branded cold drink.
To estimate sales of cold drink in Nepal
The study has concluded that advertising is considered as the primary source of
information. The advertisement of coke, Pepsi and other branded cold drinks are found in
Nepal. Coca-cola brand is more popular than other brand. Consumer gives more
preference to the brand but less preference to quality and test. Television is the mostly
favorite media for advertisement. The major reasons of brand switching are the taste of
the product.
The study has recommended that advertising should be more believable and effective, so
manufactures are suggested to advertise their product through television and other media.
Most of consumers are found brand loyal. If they don’t get the desired brand, they use the
alternative brand. So the marketers are suggested to give proper attention on their
distribution system. It is suggested that the manufacturers of cold drinks should try to
fulfill consumers demand on cold drinks of their choice.
2.1.11.2Pathak, Krishna Prasad, in 2007 conducted the study on "Coffee Marketing
System in Nepal" with the following objectives:
To analyze the present phenomena, problems for the farmers engaged in coffee
farming.
To assess the existing coffee marking system.
To analyze the challenges, problems and profitability of faming, processing and
marketing of coffee and professional standards.
To recommend measures for improvement.
From this study, the following conclusions have been deduced. Nepalese farmers are
motivated to plant coffee for better yields and they need technical support and training for
professional farming skills. There is no support to farmers. Input, supply and sales
security were very weak. Recently emerging community activities show better symptom's
in this respect. Pricing to support farmers was effective due to increased competition.
Market promotion is weak and packing is the first place to start promotional campaign.
Now push sales is only measure and no promotions are done. Distribution system
components are assembly transportation, processing and order processing. Through
Nepalese domestic production covers only 22.9 % of domestic market, Nepalese coffee is
worth exporting and Nepalese consumers prefer instant coffee mainly imported from
India. It shows that Nepal can develop coffee, as an important cash crop to generate
exports, which should help in economic growth, employment generation and mitigating
the ever increasing unfavorable balance of trade, for this professional and institutional
approach, is warranted for.
The study has recommended that select better seeds appropriate for Nepalese landscape
and climate should be conducted. Interest Rate 17% is not appropriate for farming and is
very high. Enterprising farmers should be trained so as to make them the bridge between
the ordinary farmers and technical experts. Wet pulping should be introduced and farmers
should be facilitated to pulp, hull and grade the beans and green beans should be
introduced in trade. There should be developed as the catalysts to incorporate rural people
in modern business ethics. Professional should be encouraged in coffee marketing.
2.1.11.3Bhatta, Shree Chandra, in 2007 conducted a study on "Sales Promotion
and its Effect on Sales"
A case study of Beer Market of Nepal with the objectives of analyzing the sales
promotion and its effects on sales is the main focus of the study. Though the concept of
sales promotion is relatively new in Nepal, there are lots of thinking to be researched and
find out on the practice of sales promotion. The study had the following specific
objectives:
To find out whether the sales promotion does impact on sales of beer.
To find out what mode of sales promotion is more acceptable by the Nepalese
consumers.
To find out what mode is more wisely use by the manufacturers as a sales
promotion tools.
To evaluate effectiveness of sales promotion activities in the sales of near in
Nepal
To find out which media is suitable to advertise about the sales promotion.
To predict the sales of coming year if every factors would be the same.
On the basis of analysis of the consumers view point and sales data separately. The
following are drawn. The people with high income group highly educated and from
business people tend to drink beers more. The people prefer san Miguel brand than other
nears. In the case of sales promotion the cash prizes out of all the tools insist people. In
advertising, electronic medial is very popular among the people. In advertising, electronic
medial the sales increase in a high speed. Fro, the regression it is clearly seen that if the
expenses on the sales promotion increases, the sales of the product will be increases. It is
concluded that sales promotion works as a starter to the beer drinkers. Most people, who
are not so educated, are not loyal to wards any particular brand. Due to this, the sales
promotions easily quench the attention of those beer drinkers and as a result the sales of
the beer will increase.
The people who drink beers accept electronic media most. So far sales promotion
purpose, the electronic media is very suitable. The sales promotion is very powerful tools
which can easily boots the sales. The study has recommended that low income group as
well as low education group should be launched the beer. In advertising, the electronic
media is very popular. So the heavy media coverage should be acquired. People like cash
prizes so company should cut sown the prize like motorcycles, fridge, tv, etc. findings
proved that that the sales promotion have positive impacts on the sales of the beer. But
the companies launcdhed the sales promotion programmers for only 3 months. It is
strongly advised that sales promotion programmers should be launched at least for 6
months. At last, sales promotion is very important if the use would be in a proper way.
2.1.11.4 Thapaliya, Anup kumar, in 2005 conducted "A study in Market
Situation of Instant Noodle Yum Yum" ( A case study in Nepal")
A case study mainly focused in marketing situation of Yum Yum in Market having the
following main objectives.
To test the market of 'yum yum' in Nepal
To obtain and analyze the information on the sales of different kinds on instant
noodles in Nepal
To obtain the consumers opining on price, quality and test of different brands.
To compare the position of 'yum yum' instant noodles with other brands.
To assess the average percentage of consumer's loyalty over several brands.
To compare the price, quality and taste of 'yum yum' with other brands.
To suggest the company of 'yum yum' for overall marketing activities for better
distribution.
To assess the status, usage pattern, attitude and Image of Yum Yum.
On the basis of the field survey and subsequent analysis, the study has found followings.
All wholesalers are under the distributorship of Chitwan supplier, the single distributor of
yum Yum in Barahathwa. Wholesalers prefer the brands of noodles on the basis of sales
volume. On the basis if sales volume Wai Wai stands at the top and Yum Yum stand in
second. Few wholesalers have expressed the view that some retailers complain over the
price of Rara, wai wai and kits and on the taste of yum yum. After introduction of yum
yum in the market, 90% of wholesalers expressed that it is satisfactory and rest of the
wholesalers expressed that the quality is not satisfactory regarding the distribution of
different brands by their quality. Wai wai is the best quality noodle and yum yum was in
second position. Out of 100 percent 65% use noodles as Tiffin and rest 35% respondents
use it as both Tiffin and dinner.
This study concluded that the use of instant noodles has become a general consumption
phenomenon in Nepal. There are various brands of instant noodles available in the market
and market of noodles has turned to be competitive in recent years. The company does
not have effective and reliable channel to collect information from wholesalers,
distributors and consumers.
The study has recommended that an improvement in the test and quality and fixing
reasonable price can be helpful measure to increase the volume of sales in the market.
The company should increase the incentive to the wholesalers/distributors so as to
motivate and encourage them to focus their transactions on Yum Yum. The company
should diversify its market by penetrating into potential rural areas. It should establish
efficient distribution networks and provide reasonable amount of commission at each
level.
Although Mr. Hari Lamichhane had conducted a similar study in 2005 in the same study
area, this study has been more focused on studying the consumers perspective on their
consumption behavior of cold drink. This study has also integrated the retailer level
survey in order to examine the distribution system of cold drink in the study area and find
out what the channel members particularly the retailers give priority in selling cold drink.
CHAPTER-III
RESEARCH METHODOLOGY
3.1Introduction
The objective of this study is to examine the marketing, usage pattern,
attitude and image of cold drinks in Barahathwa. In this study, the necessary relevant data
have been collected from the sample consumers and retailers. To achieve this objective,
the study follows a research methodology, which has been describe as follows:
3.2Research Design
This study is based on a survey research design. A limited scale survey has been
conducted among the consumers and retailer of cold drink in Barahathwa. The
questioners have been administered in order to generate data and other information
relation to the research questions adopted for this study.
3.3Population and Sample
As the total population of cold drink users of presently available brands is hard to find in
number, the study takes the population as the total consumers of cold drinks in
Barahathwa town. The study has included 150 consumers and 60 retailers of cold drink
based in Barahathwa. Though the sample size is very small in comparison to the total
population, sufficient efforts have been made
to make the sample representative by including consumers from the different professions,
age group, educational backgrounds and sex.
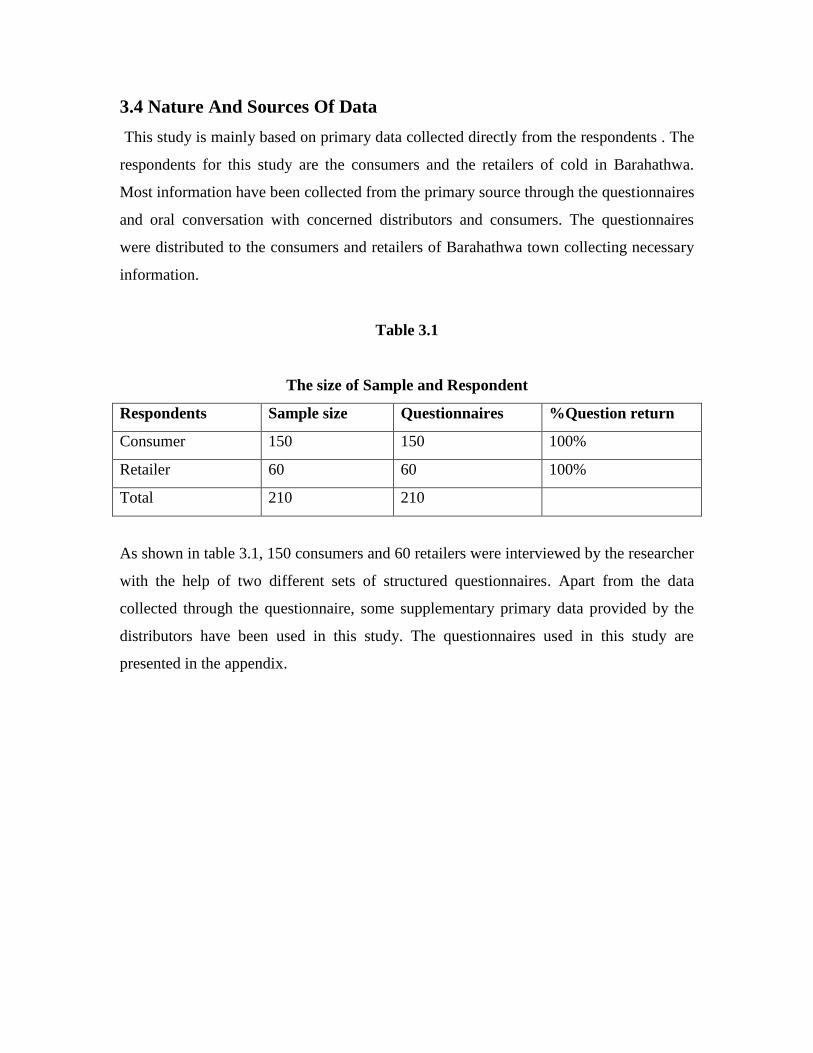
3.4 Nature And Sources Of Data
This study is mainly based on primary data collected directly from the respondents . The
respondents for this study are the consumers and the retailers of cold in Barahathwa.
Most information have been collected from the primary source through the questionnaires
and oral conversation with concerned distributors and consumers. The questionnaires
were distributed to the consumers and retailers of Barahathwa town collecting necessary
information.
Table 3.1
The size of Sample and Respondent
Respondents Sample size Questionnaires %Question return
Consumer 150 150 100%
Retailer 60 60 100%
Total 210 210
As shown in table 3.1, 150 consumers and 60 retailers were interviewed by the researcher
with the help of two different sets of structured questionnaires. Apart from the data
collected through the questionnaire, some supplementary primary data provided by the
distributors have been used in this study. The questionnaires used in this study are
presented in the appendix.
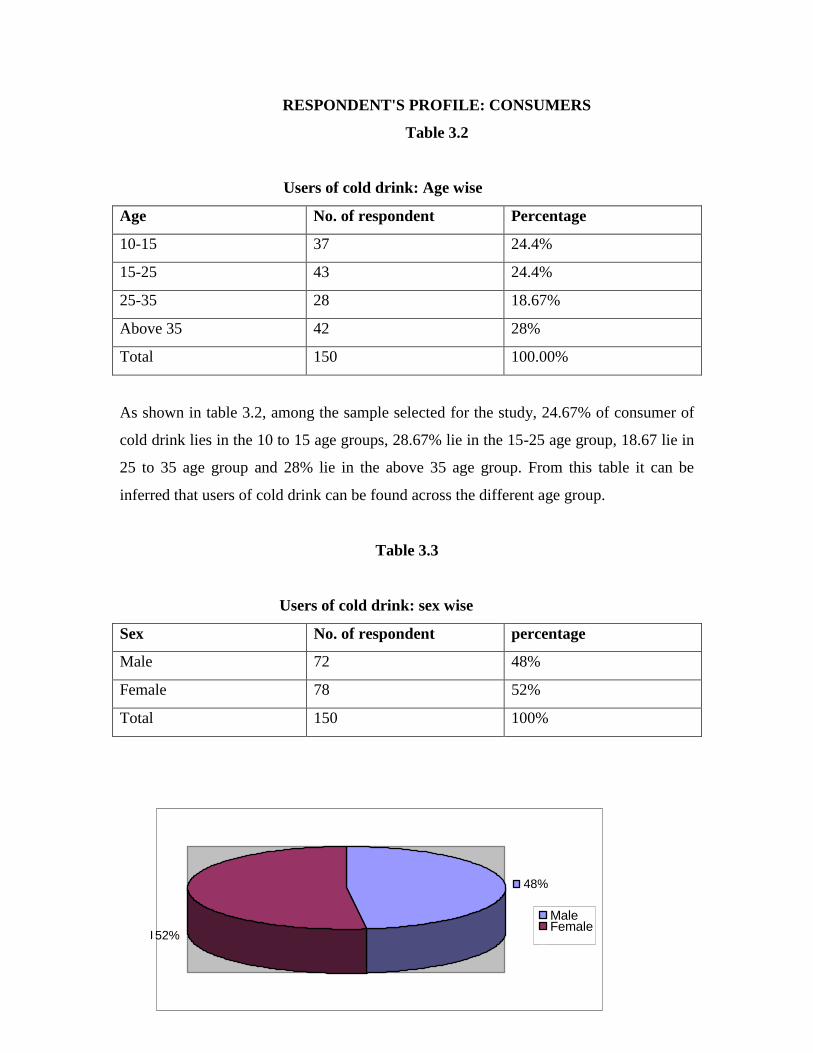
RESPONDENT'S PROFILE: CONSUMERS
Table 3.2
Users of cold drink: Age wise
Age No. of respondent Percentage
10-15 37 24.4%
15-25 43 24.4%
25-35 28 18.67%
Above 35 42 28%
Total 150 100.00%
As shown in table 3.2, among the sample selected for the study, 24.67% of consumer of
cold drink lies in the 10 to 15 age groups, 28.67% lie in the 15-25 age group, 18.67 lie in
25 to 35 age group and 28% lie in the above 35 age group. From this table it can be
inferred that users of cold drink can be found across the different age group.
Table 3.3
Users of cold drink: sex wise
Sex No. of respondent percentage
Male 72 48%
Female 78 52%
Total 150 100%
48%
52%
MaleFemale
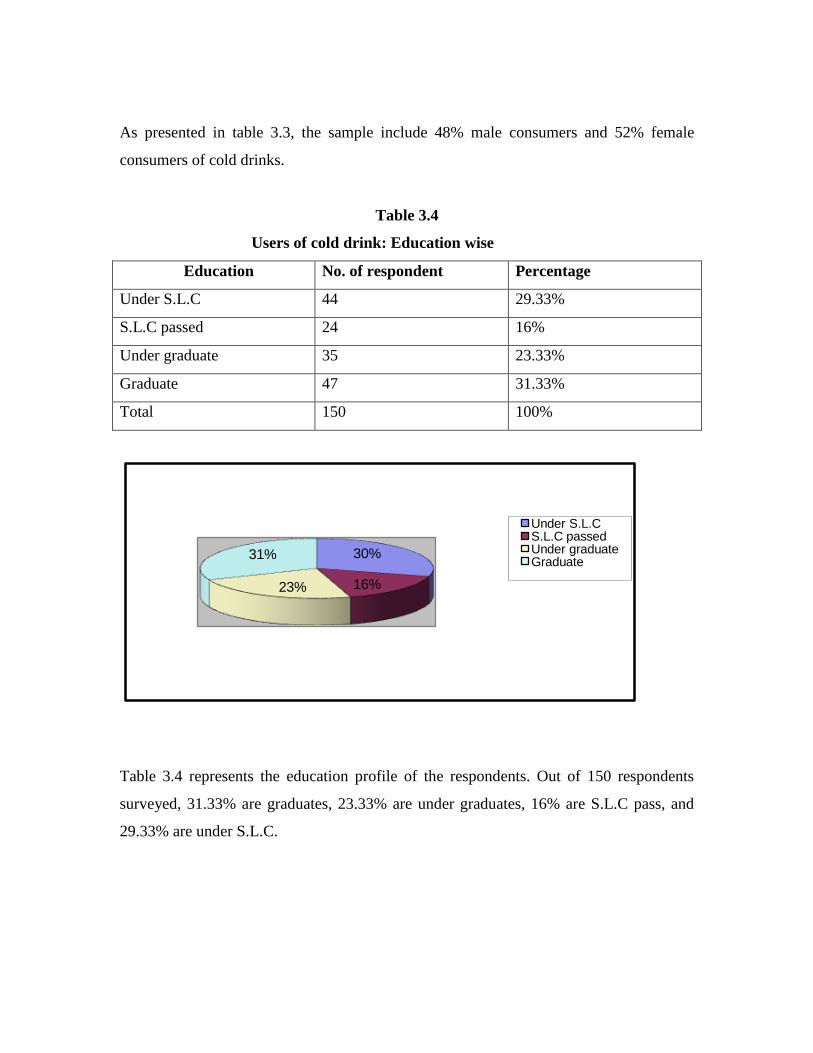
As presented in table 3.3, the sample include 48% male consumers and 52% female
consumers of cold drinks.
Table 3.4
Users of cold drink: Education wise
Education No. of respondent Percentage
Under S.L.C 44 29.33%
S.L.C passed 24 16%
Under graduate 35 23.33%
Graduate 47 31.33%
Total 150 100%
30%
16%23%
31%
Under S.L.CS.L.C passedUnder graduateGraduate
Table 3.4 represents the education profile of the respondents. Out of 150 respondents
surveyed, 31.33% are graduates, 23.33% are under graduates, 16% are S.L.C pass, and
29.33% are under S.L.C.
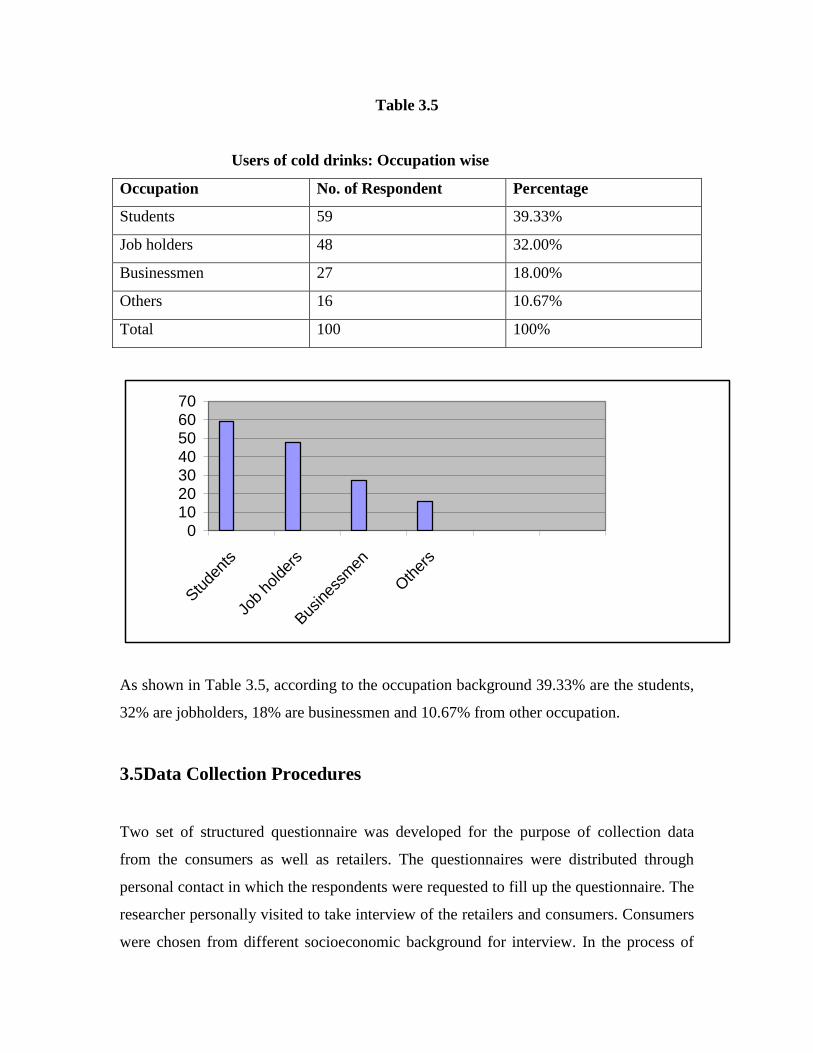
Table 3.5
Users of cold drinks: Occupation wise
Occupation No. of Respondent Percentage
Students 59 39.33%
Job holders 48 32.00%
Businessmen 27 18.00%
Others 16 10.67%
Total 100 100%
010203040506070
Stu
dent
s
Job
holder
s
Bus
ines
smen
Oth
ers
As shown in Table 3.5, according to the occupation background 39.33% are the students,
32% are jobholders, 18% are businessmen and 10.67% from other occupation.
3.5Data Collection Procedures
Two set of structured questionnaire was developed for the purpose of collection data
from the consumers as well as retailers. The questionnaires were distributed through
personal contact in which the respondents were requested to fill up the questionnaire. The
researcher personally visited to take interview of the retailers and consumers. Consumers
were chosen from different socioeconomic background for interview. In the process of
collecting data the researcher was also in touch with the responsible officers of
companies selling Coca-Cola, Pepsi, Frooti, and Rio products.
3.6Data Processing and Analysis
The raw data collected through the questionnaire have been manually processed and
presented in the form of tables. Once the data are arranged sequentially, simple statistical
tools were used for analysis. The processed data have also been presented graph, bar
diagram and pie chart. All the questionnaires were distributed and collected by the
researcher himself. So there was no delay in collection of the questionnaires distributed to
the consumers. Every questionnaire was thoroughly checked after the collection.
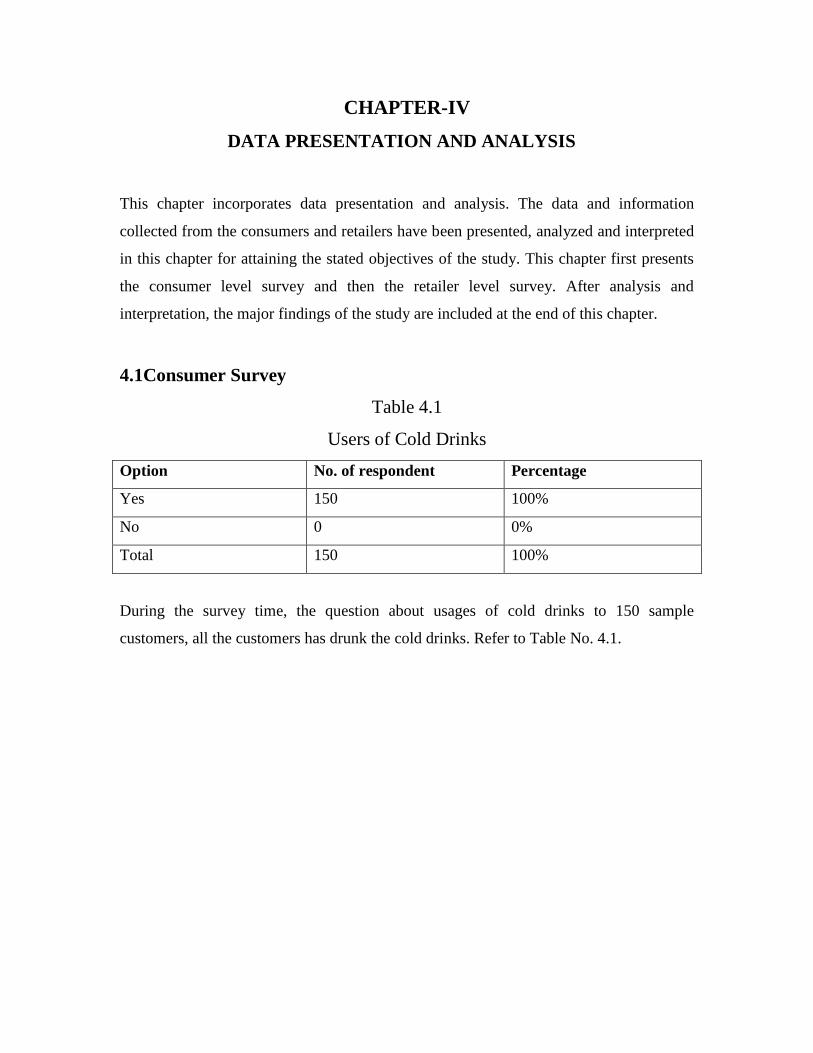
CHAPTER-IV
DATA PRESENTATION AND ANALYSIS
This chapter incorporates data presentation and analysis. The data and information
collected from the consumers and retailers have been presented, analyzed and interpreted
in this chapter for attaining the stated objectives of the study. This chapter first presents
the consumer level survey and then the retailer level survey. After analysis and
interpretation, the major findings of the study are included at the end of this chapter.
4.1Consumer Survey
Table 4.1
Users of Cold Drinks
Option No. of respondent Percentage
Yes 150 100%
No 0 0%
Total 150 100%
During the survey time, the question about usages of cold drinks to 150 sample
customers, all the customers has drunk the cold drinks. Refer to Table No. 4.1.
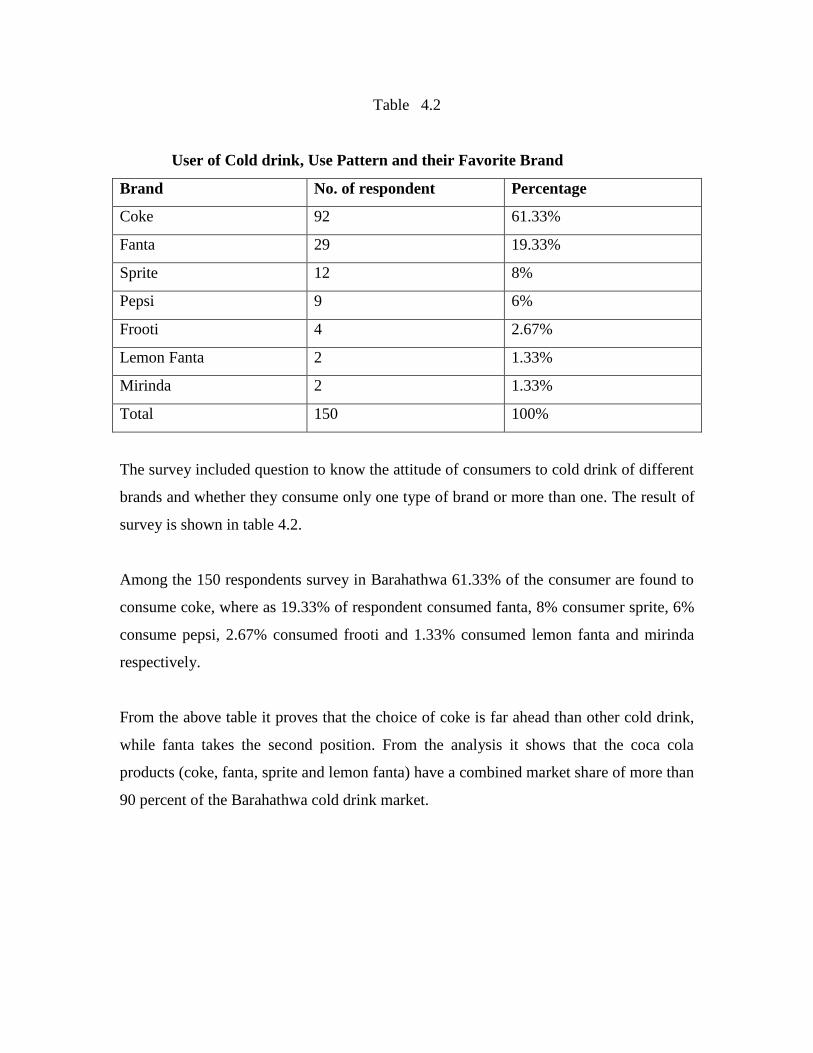
Table 4.2
User of Cold drink, Use Pattern and their Favorite Brand
Brand No. of respondent Percentage
Coke 92 61.33%
Fanta 29 19.33%
Sprite 12 8%
Pepsi 9 6%
Frooti 4 2.67%
Lemon Fanta 2 1.33%
Mirinda 2 1.33%
Total 150 100%
The survey included question to know the attitude of consumers to cold drink of different
brands and whether they consume only one type of brand or more than one. The result of
survey is shown in table 4.2.
Among the 150 respondents survey in Barahathwa 61.33% of the consumer are found to
consume coke, where as 19.33% of respondent consumed fanta, 8% consumer sprite, 6%
consume pepsi, 2.67% consumed frooti and 1.33% consumed lemon fanta and mirinda
respectively.
From the above table it proves that the choice of coke is far ahead than other cold drink,
while fanta takes the second position. From the analysis it shows that the coca cola
products (coke, fanta, sprite and lemon fanta) have a combined market share of more than
90 percent of the Barahathwa cold drink market.
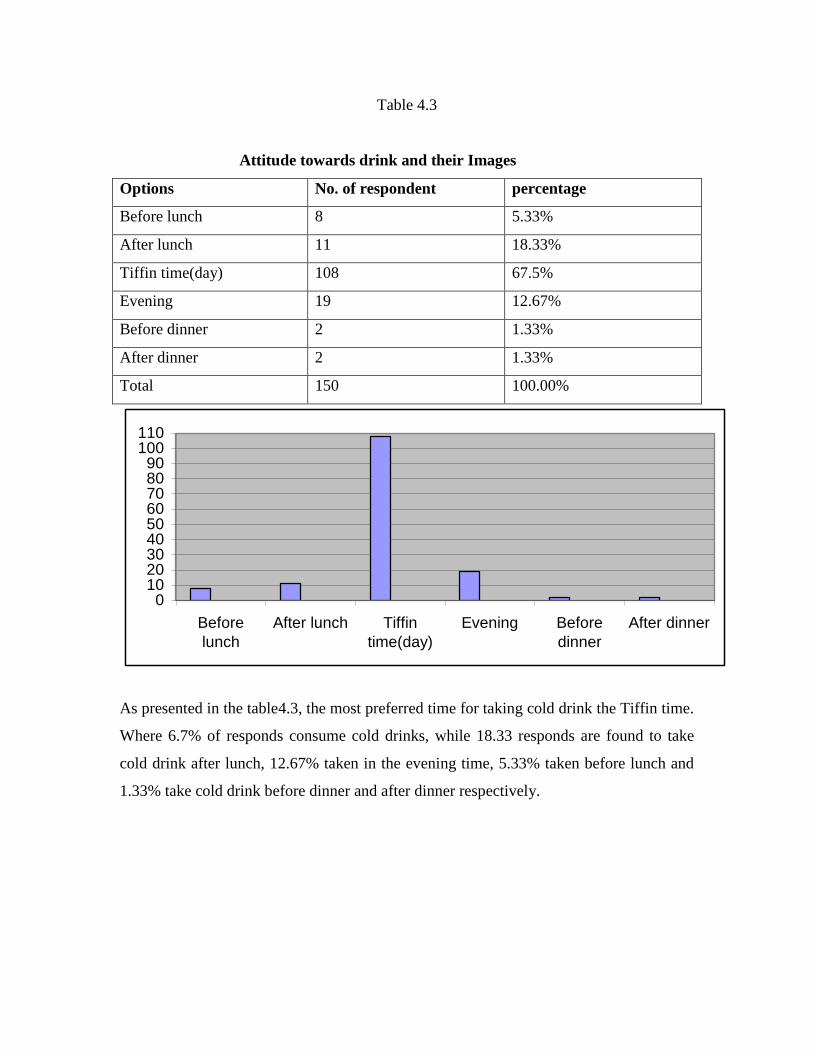
Table 4.3
Attitude towards drink and their Images
Options No. of respondent percentage
Before lunch 8 5.33%
After lunch 11 18.33%
Tiffin time(day) 108 67.5%
Evening 19 12.67%
Before dinner 2 1.33%
After dinner 2 1.33%
Total 150 100.00%
0102030405060708090
100110
Before
lunch
After lunch Tiffin
time(day)
Evening Before
dinner
After dinner
As presented in the table4.3, the most preferred time for taking cold drink the Tiffin time.
Where 6.7% of responds consume cold drinks, while 18.33 responds are found to take
cold drink after lunch, 12.67% taken in the evening time, 5.33% taken before lunch and
1.33% take cold drink before dinner and after dinner respectively.
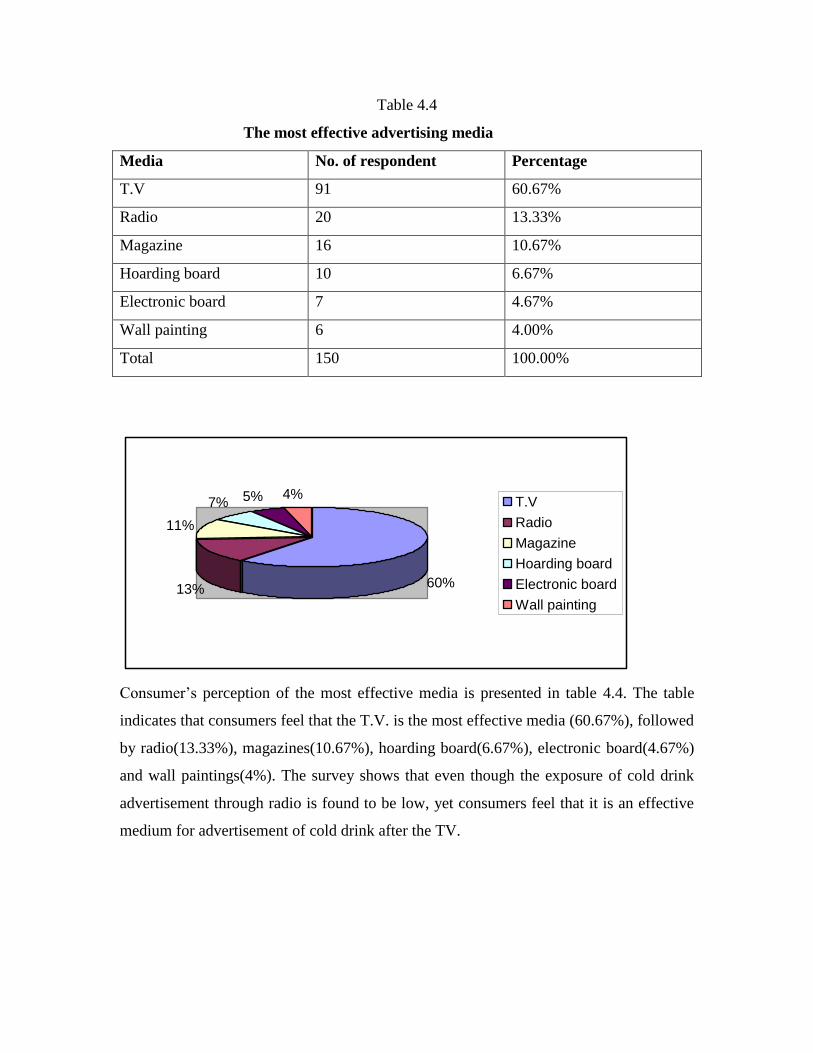
Table 4.4
The most effective advertising media
Media No. of respondent Percentage
T.V 91 60.67%
Radio 20 13.33%
Magazine 16 10.67%
Hoarding board 10 6.67%
Electronic board 7 4.67%
Wall painting 6 4.00%
Total 150 100.00%
60%13%
11%
7% 5% 4%T.V
Radio
Magazine
Hoarding board
Electronic board
Wall painting
Consumer’s perception of the most effective media is presented in table 4.4. The table
indicates that consumers feel that the T.V. is the most effective media (60.67%), followed
by radio(13.33%), magazines(10.67%), hoarding board(6.67%), electronic board(4.67%)
and wall paintings(4%). The survey shows that even though the exposure of cold drink
advertisement through radio is found to be low, yet consumers feel that it is an effective
medium for advertisement of cold drink after the TV.
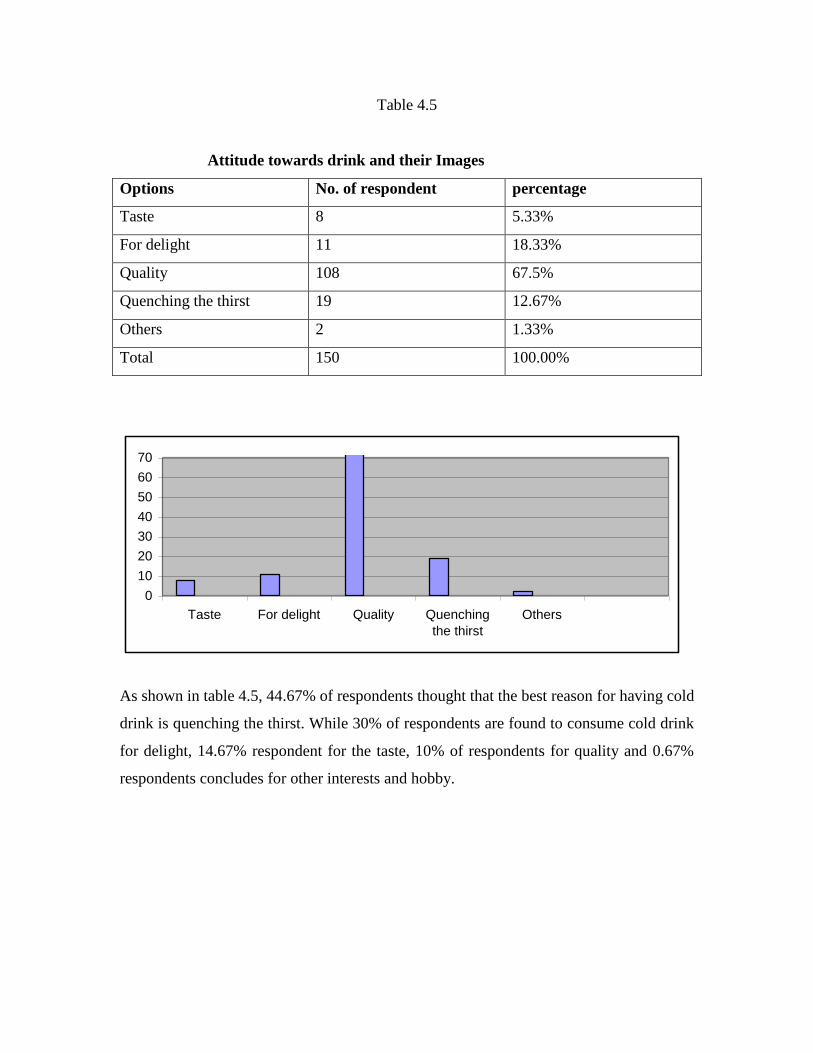
Table 4.5
Attitude towards drink and their Images
Options No. of respondent percentage
Taste 8 5.33%
For delight 11 18.33%
Quality 108 67.5%
Quenching the thirst 19 12.67%
Others 2 1.33%
Total 150 100.00%
As shown in table 4.5, 44.67% of respondents thought that the best reason for having cold
drink is quenching the thirst. While 30% of respondents are found to consume cold drink
for delight, 14.67% respondent for the taste, 10% of respondents for quality and 0.67%
respondents concludes for other interests and hobby.
0
10
20
30
40
50
60
70
Taste For delight Quality Quenching
the thirst
Others
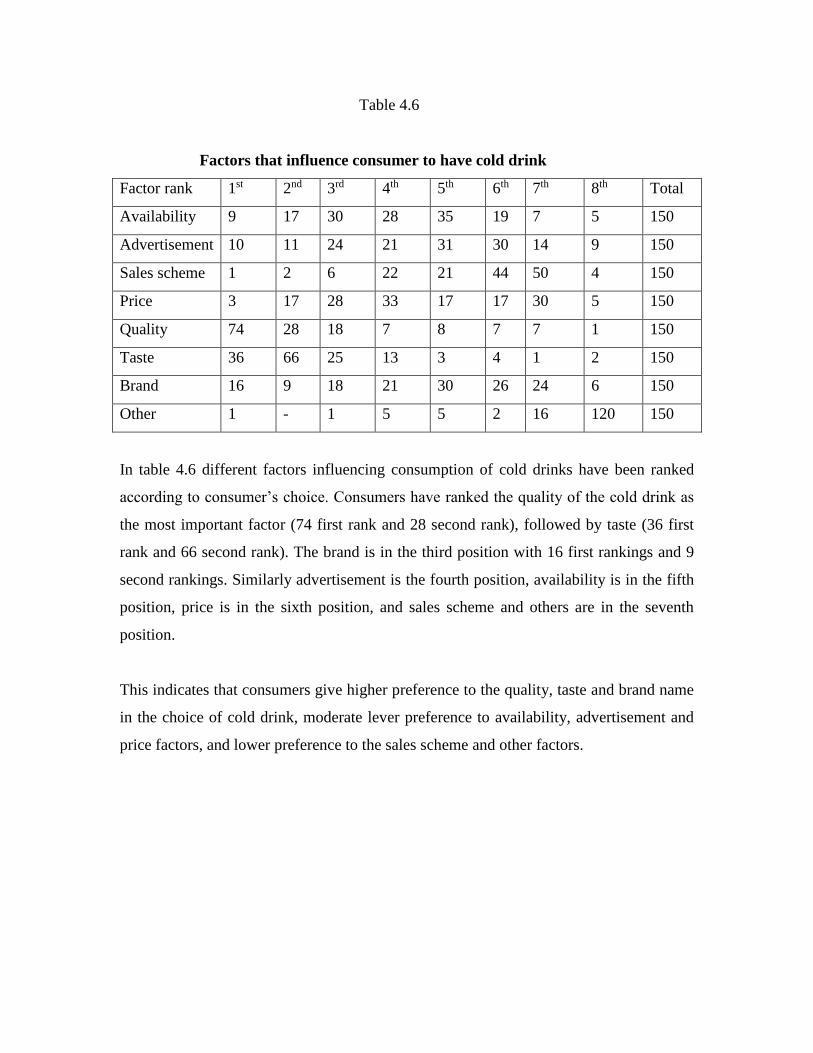
Table 4.6
Factors that influence consumer to have cold drink
Factor rank 1st 2nd 3rd 4th 5th 6th 7th 8th Total
Availability 9 17 30 28 35 19 7 5 150
Advertisement 10 11 24 21 31 30 14 9 150
Sales scheme 1 2 6 22 21 44 50 4 150
Price 3 17 28 33 17 17 30 5 150
Quality 74 28 18 7 8 7 7 1 150
Taste 36 66 25 13 3 4 1 2 150
Brand 16 9 18 21 30 26 24 6 150
Other 1 - 1 5 5 2 16 120 150
In table 4.6 different factors influencing consumption of cold drinks have been ranked
according to consumer’s choice. Consumers have ranked the quality of the cold drink as
the most important factor (74 first rank and 28 second rank), followed by taste (36 first
rank and 66 second rank). The brand is in the third position with 16 first rankings and 9
second rankings. Similarly advertisement is the fourth position, availability is in the fifth
position, price is in the sixth position, and sales scheme and others are in the seventh
position.
This indicates that consumers give higher preference to the quality, taste and brand name
in the choice of cold drink, moderate lever preference to availability, advertisement and
price factors, and lower preference to the sales scheme and other factors.
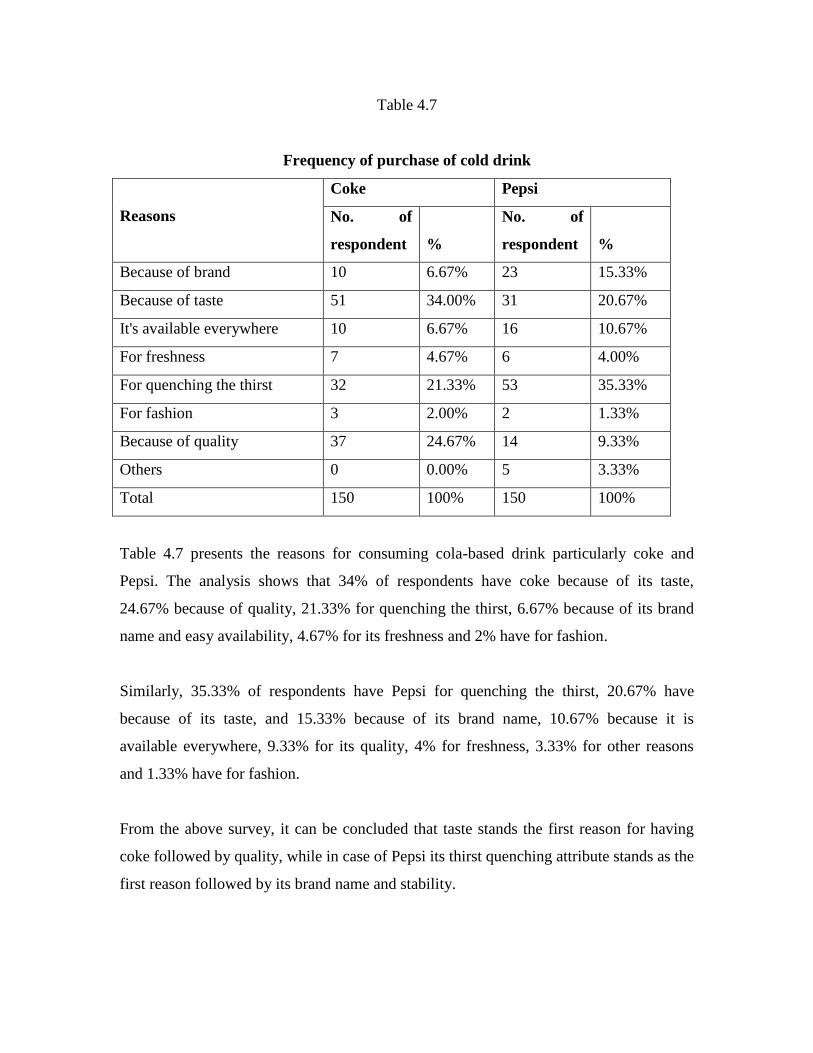
Table 4.7
Frequency of purchase of cold drink
Reasons
Coke Pepsi
No. of
respondent
%
No. of
respondent
%
Because of brand 10 6.67% 23 15.33%
Because of taste 51 34.00% 31 20.67%
It's available everywhere 10 6.67% 16 10.67%
For freshness 7 4.67% 6 4.00%
For quenching the thirst 32 21.33% 53 35.33%
For fashion 3 2.00% 2 1.33%
Because of quality 37 24.67% 14 9.33%
Others 0 0.00% 5 3.33%
Total 150 100% 150 100%
Table 4.7 presents the reasons for consuming cola-based drink particularly coke and
Pepsi. The analysis shows that 34% of respondents have coke because of its taste,
24.67% because of quality, 21.33% for quenching the thirst, 6.67% because of its brand
name and easy availability, 4.67% for its freshness and 2% have for fashion.
Similarly, 35.33% of respondents have Pepsi for quenching the thirst, 20.67% have
because of its taste, and 15.33% because of its brand name, 10.67% because it is
available everywhere, 9.33% for its quality, 4% for freshness, 3.33% for other reasons
and 1.33% have for fashion.
From the above survey, it can be concluded that taste stands the first reason for having
coke followed by quality, while in case of Pepsi its thirst quenching attribute stands as the
first reason followed by its brand name and stability.
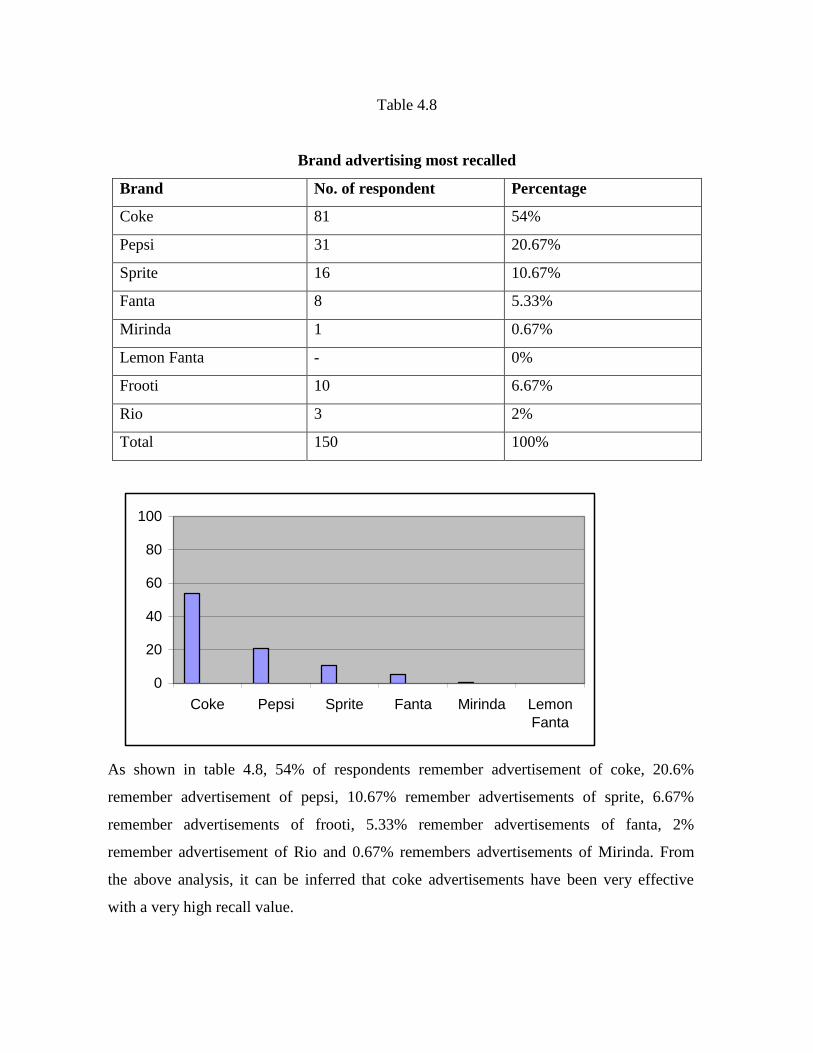
Table 4.8
Brand advertising most recalled
Brand No. of respondent Percentage
Coke 81 54%
Pepsi 31 20.67%
Sprite 16 10.67%
Fanta 8 5.33%
Mirinda 1 0.67%
Lemon Fanta - 0%
Frooti 10 6.67%
Rio 3 2%
Total 150 100%
0
20
40
60
80
100
Coke Pepsi Sprite Fanta Mirinda Lemon
Fanta
As shown in table 4.8, 54% of respondents remember advertisement of coke, 20.6%
remember advertisement of pepsi, 10.67% remember advertisements of sprite, 6.67%
remember advertisements of frooti, 5.33% remember advertisements of fanta, 2%
remember advertisement of Rio and 0.67% remembers advertisements of Mirinda. From
the above analysis, it can be inferred that coke advertisements have been very effective
with a very high recall value.
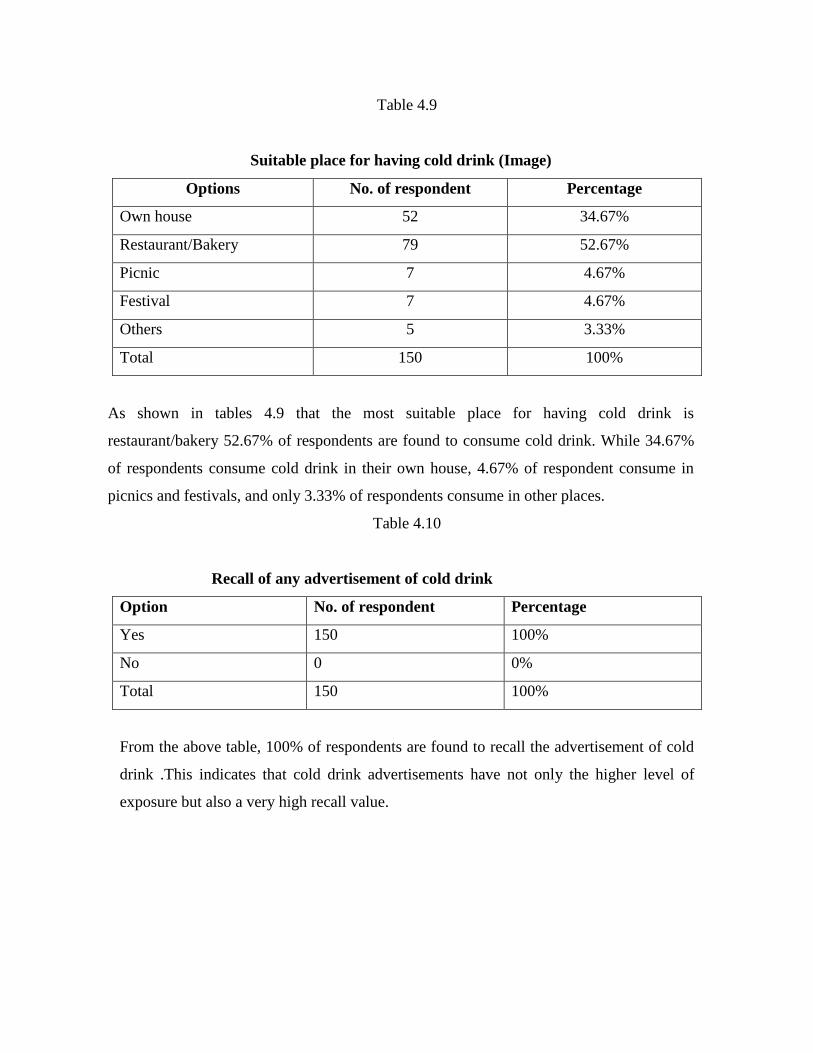
Table 4.9
Suitable place for having cold drink (Image)
Options No. of respondent Percentage
Own house 52 34.67%
Restaurant/Bakery 79 52.67%
Picnic 7 4.67%
Festival 7 4.67%
Others 5 3.33%
Total 150 100%
As shown in tables 4.9 that the most suitable place for having cold drink is
restaurant/bakery 52.67% of respondents are found to consume cold drink. While 34.67%
of respondents consume cold drink in their own house, 4.67% of respondent consume in
picnics and festivals, and only 3.33% of respondents consume in other places.
Table 4.10
Recall of any advertisement of cold drink
Option No. of respondent Percentage
Yes 150 100%
No 0 0%
Total 150 100%
From the above table, 100% of respondents are found to recall the advertisement of cold
drink .This indicates that cold drink advertisements have not only the higher level of
exposure but also a very high recall value.
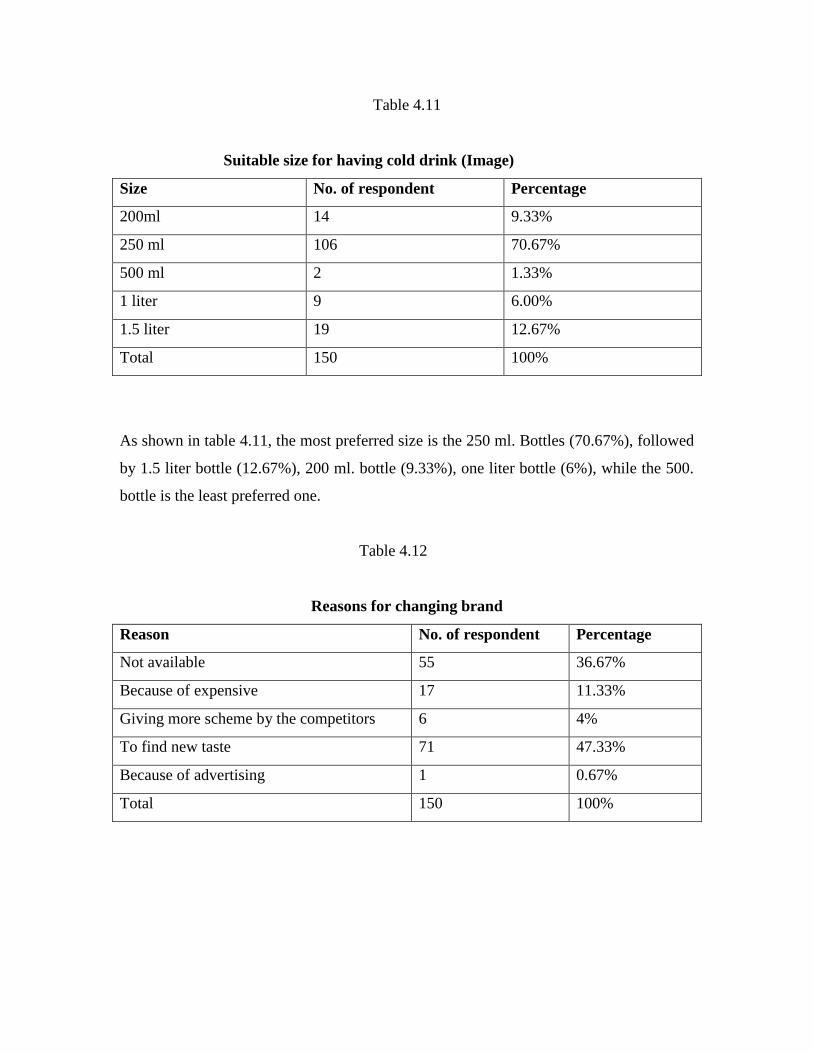
Table 4.11
Suitable size for having cold drink (Image)
Size No. of respondent Percentage
200ml 14 9.33%
250 ml 106 70.67%
500 ml 2 1.33%
1 liter 9 6.00%
1.5 liter 19 12.67%
Total 150 100%
As shown in table 4.11, the most preferred size is the 250 ml. Bottles (70.67%), followed
by 1.5 liter bottle (12.67%), 200 ml. bottle (9.33%), one liter bottle (6%), while the 500.
bottle is the least preferred one.
Table 4.12
Reasons for changing brand
Reason No. of respondent Percentage
Not available 55 36.67%
Because of expensive 17 11.33%
Giving more scheme by the competitors 6 4%
To find new taste 71 47.33%
Because of advertising 1 0.67%
Total 150 100%
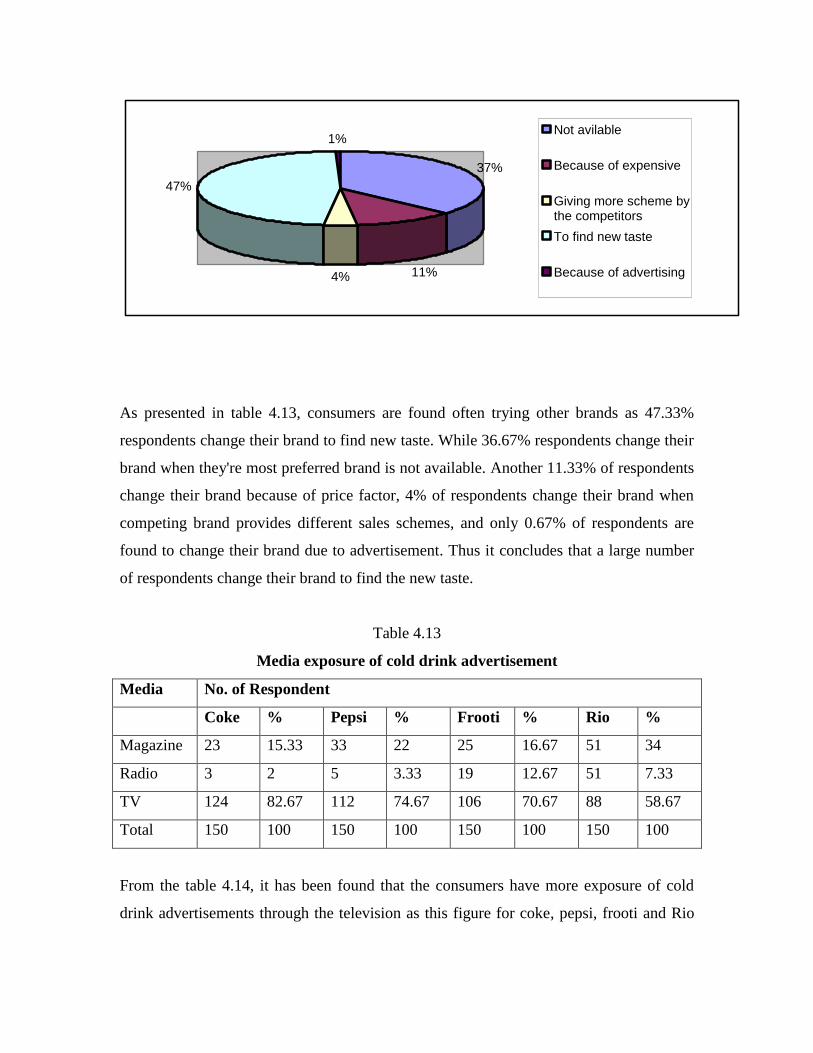
37%
11%4%
47%
1%Not avilable
Because of expensive
Giving more scheme bythe competitors
To find new taste
Because of advertising
As presented in table 4.13, consumers are found often trying other brands as 47.33%
respondents change their brand to find new taste. While 36.67% respondents change their
brand when they're most preferred brand is not available. Another 11.33% of respondents
change their brand because of price factor, 4% of respondents change their brand when
competing brand provides different sales schemes, and only 0.67% of respondents are
found to change their brand due to advertisement. Thus it concludes that a large number
of respondents change their brand to find the new taste.
Table 4.13
Media exposure of cold drink advertisement
Media No. of Respondent
Coke % Pepsi % Frooti % Rio %
Magazine 23 15.33 33 22 25 16.67 51 34
Radio 3 2 5 3.33 19 12.67 51 7.33
TV 124 82.67 112 74.67 106 70.67 88 58.67
Total 150 100 150 100 150 100 150 100
From the table 4.14, it has been found that the consumers have more exposure of cold
drink advertisements through the television as this figure for coke, pepsi, frooti and Rio
are 82.67%, 74.67%, 70.67% and 58.6% respectively. Magazine provides the second
most important exposure, while exposure through radio is found to be very low.
Table 4.14
Buying action after Exposure to Advertisement
Option No. of respondent Percentage
Recently 2 1.33%
After seeing one or two times 12 8%
After additional Information 22 14.%67
Not consulted 24 16%
When it need 90 60%
Total 150 100%
Table 4.15 shows that the advertisements have very little action effects as 60% of
respondents are found to buy cold drink when they need, while 16% respondent found
that they buy cold drink without consulting any advertisements. Only 1.33% of the
respondent is found to buy cold drink immediately after exposure to and advertisement
and additional 8% after a few exposures.
Table 4.15
Influence by the Advertisement
Option No. of respondent Percentage
Yes 135 90%
No 15 10%
Total 150 100%
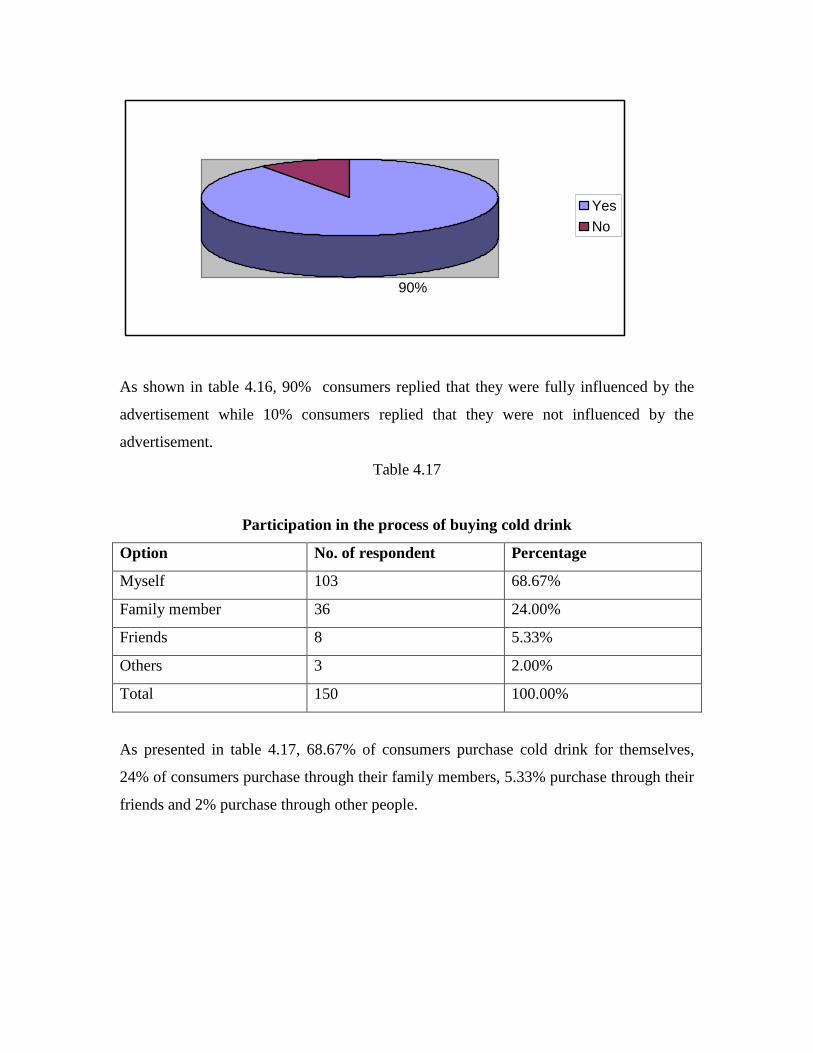
90%
Yes
No
As shown in table 4.16, 90% consumers replied that they were fully influenced by the
advertisement while 10% consumers replied that they were not influenced by the
advertisement.
Table 4.17
Participation in the process of buying cold drink
Option No. of respondent Percentage
Myself 103 68.67%
Family member 36 24.00%
Friends 8 5.33%
Others 3 2.00%
Total 150 100.00%
As presented in table 4.17, 68.67% of consumers purchase cold drink for themselves,
24% of consumers purchase through their family members, 5.33% purchase through their
friends and 2% purchase through other people.
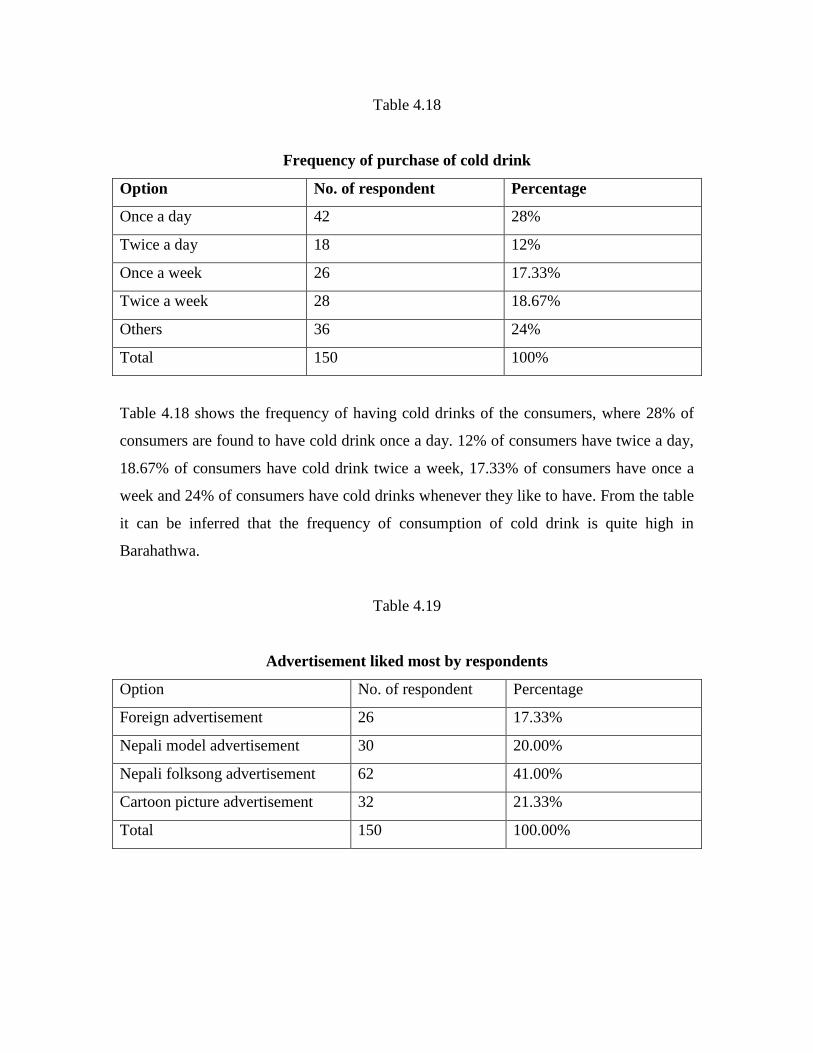
Table 4.18
Frequency of purchase of cold drink
Option No. of respondent Percentage
Once a day 42 28%
Twice a day 18 12%
Once a week 26 17.33%
Twice a week 28 18.67%
Others 36 24%
Total 150 100%
Table 4.18 shows the frequency of having cold drinks of the consumers, where 28% of
consumers are found to have cold drink once a day. 12% of consumers have twice a day,
18.67% of consumers have cold drink twice a week, 17.33% of consumers have once a
week and 24% of consumers have cold drinks whenever they like to have. From the table
it can be inferred that the frequency of consumption of cold drink is quite high in
Barahathwa.
Table 4.19
Advertisement liked most by respondents
Option No. of respondent Percentage
Foreign advertisement 26 17.33%
Nepali model advertisement 30 20.00%
Nepali folksong advertisement 62 41.00%
Cartoon picture advertisement 32 21.33%
Total 150 100.00%
010203040506070
Fo
reig
n
ad
ve
rtis
em
en
t
Ne
pa
li m
od
el
ad
ve
rtis
em
en
t
Ne
pa
li
folk
so
ng
ad
ve
rtis
em
en
t
Ca
rto
on
pic
ture
ad
ve
rtis
em
en
t
Table 4.19 shows that 41.33% of the respondents like advertisements based on the
Nepalese folksong, while 21.33% of respondents like cartoon picture advertisement, 20%
like advertisements with Nepali model, and 17.33% like foreign advertisements. From the
analysis it may be inferred that the cold drinks users primary like folk-song based
advertisement while there are sufficient numbers of respondents who like other forms of
advertisements.
4.2 RETAILER SURVEY
Table 4.20
Year in Business
Year No. of Retailer Percentage
0-5 36 60.00%
5-10 17 28.33%
10-15 6 10.00%
15 above 1 1.67%
Total 60 100.00%
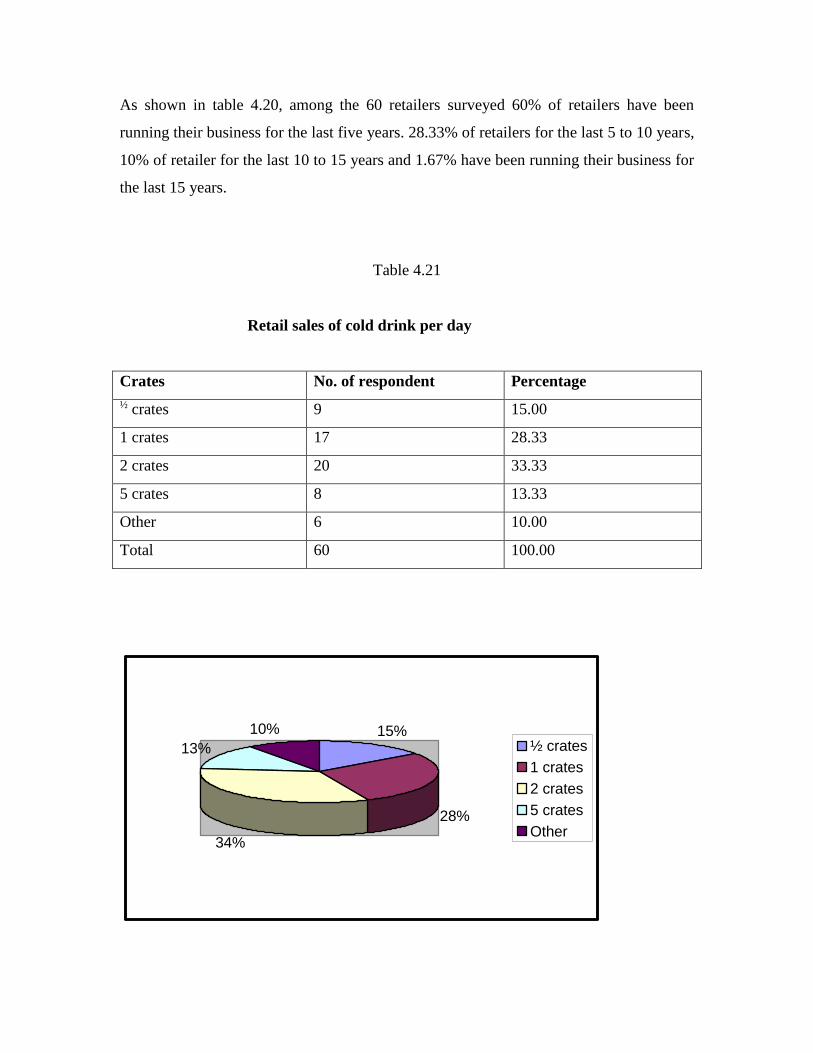
As shown in table 4.20, among the 60 retailers surveyed 60% of retailers have been
running their business for the last five years. 28.33% of retailers for the last 5 to 10 years,
10% of retailer for the last 10 to 15 years and 1.67% have been running their business for
the last 15 years.
Table 4.21
Retail sales of cold drink per day
Crates No. of respondent Percentage
½ crates 9 15.00
1 crates 17 28.33
2 crates 20 33.33
5 crates 8 13.33
Other 6 10.00
Total 60 100.00
15%
28%
34%
13%
10%½ crates
1 crates
2 crates
5 crates
Other
Out of 60 retailers 33.33% sells 2 crates of cold drink in a day, 28.33% sells 1 crates per
day, 15% sells ½ crates per day, 13.33% sells 5 crates per day and 10% of the retailers
sell less than half crates in a day. From the above table it may be inferred that the retail
sales per store in generally between one to two crates of cold drink in a day.
Table 4.22
Brand availability in the retail outlets
Brand No. of respondent Percentage
Coke 58 15.89
Pepsi 28 7.67
Sprite 56 15.34
Fanta 58 15.89
Mirinda 21 5.75
Lemon fanta 45 12.33
Frooti 55 15.07
Rio 36 9.86
7' up 8 2.19
Table 4.22 presents the brand availability in the retail outlets in the Barahathwa town.
The survey showed that availability of Coca-Cola products (Coke, Fanta, Sprite and
Lemon Fanta) is generally higher that the Pepsi products (Pepsi, Mirinda, and 7up).
Frooti is also found to be very strong in terms of availability in the retail stores of the
study area, while Rio is slowly catching up in the market.
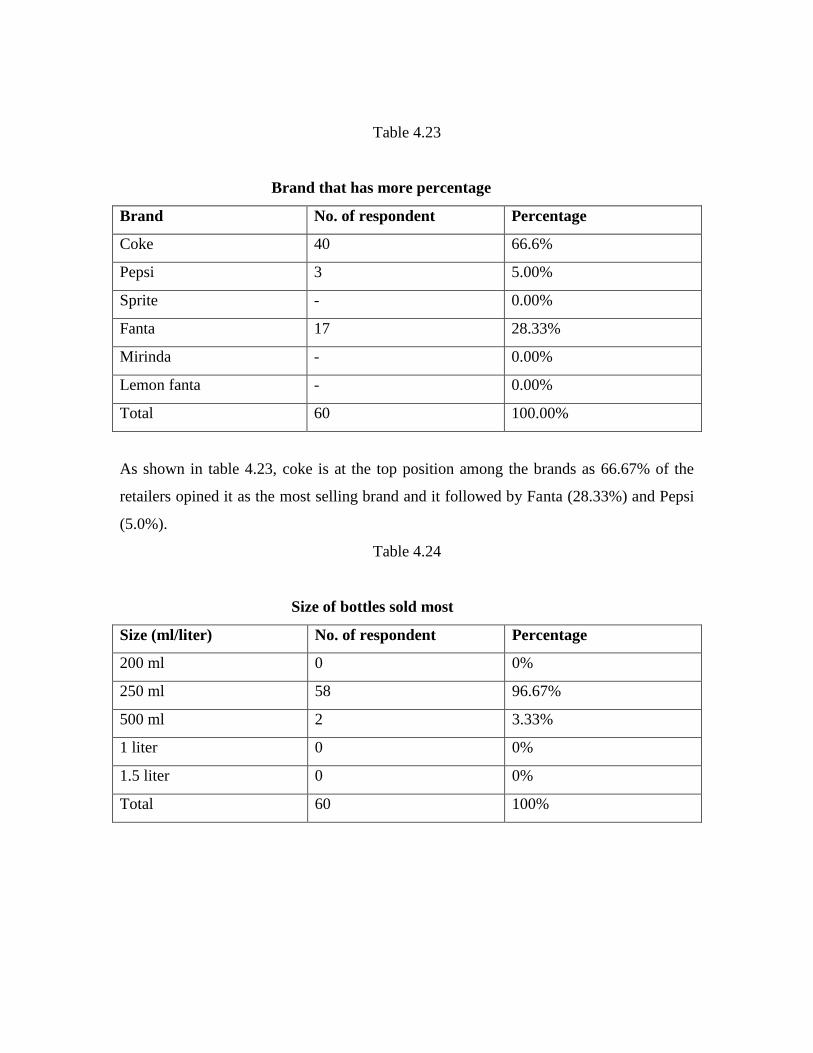
Table 4.23
Brand that has more percentage
Brand No. of respondent Percentage
Coke 40 66.6%
Pepsi 3 5.00%
Sprite - 0.00%
Fanta 17 28.33%
Mirinda - 0.00%
Lemon fanta - 0.00%
Total 60 100.00%
As shown in table 4.23, coke is at the top position among the brands as 66.67% of the
retailers opined it as the most selling brand and it followed by Fanta (28.33%) and Pepsi
(5.0%).
Table 4.24
Size of bottles sold most
Size (ml/liter) No. of respondent Percentage
200 ml 0 0%
250 ml 58 96.67%
500 ml 2 3.33%
1 liter 0 0%
1.5 liter 0 0%
Total 60 100%
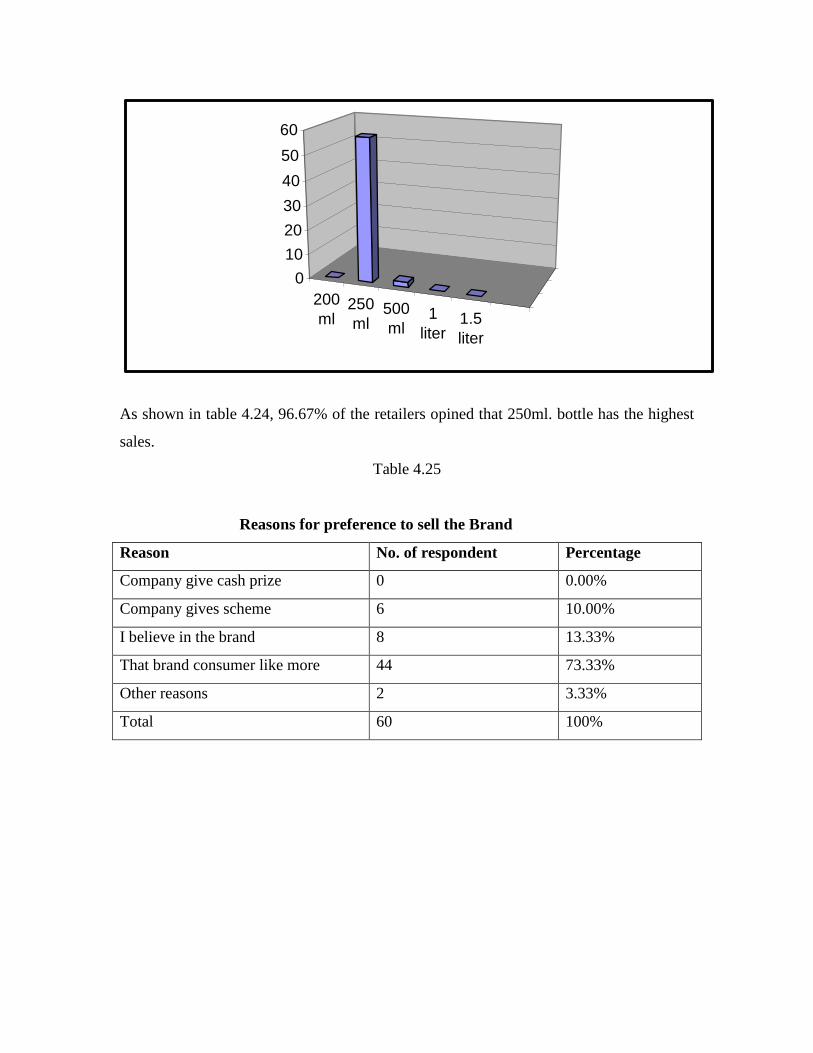
200
ml250
ml500
ml1
liter1.5
liter
0
10
20
30
40
50
60
As shown in table 4.24, 96.67% of the retailers opined that 250ml. bottle has the highest
sales.
Table 4.25
Reasons for preference to sell the Brand
Reason No. of respondent Percentage
Company give cash prize 0 0.00%
Company gives scheme 6 10.00%
I believe in the brand 8 13.33%
That brand consumer like more 44 73.33%
Other reasons 2 3.33%
Total 60 100%
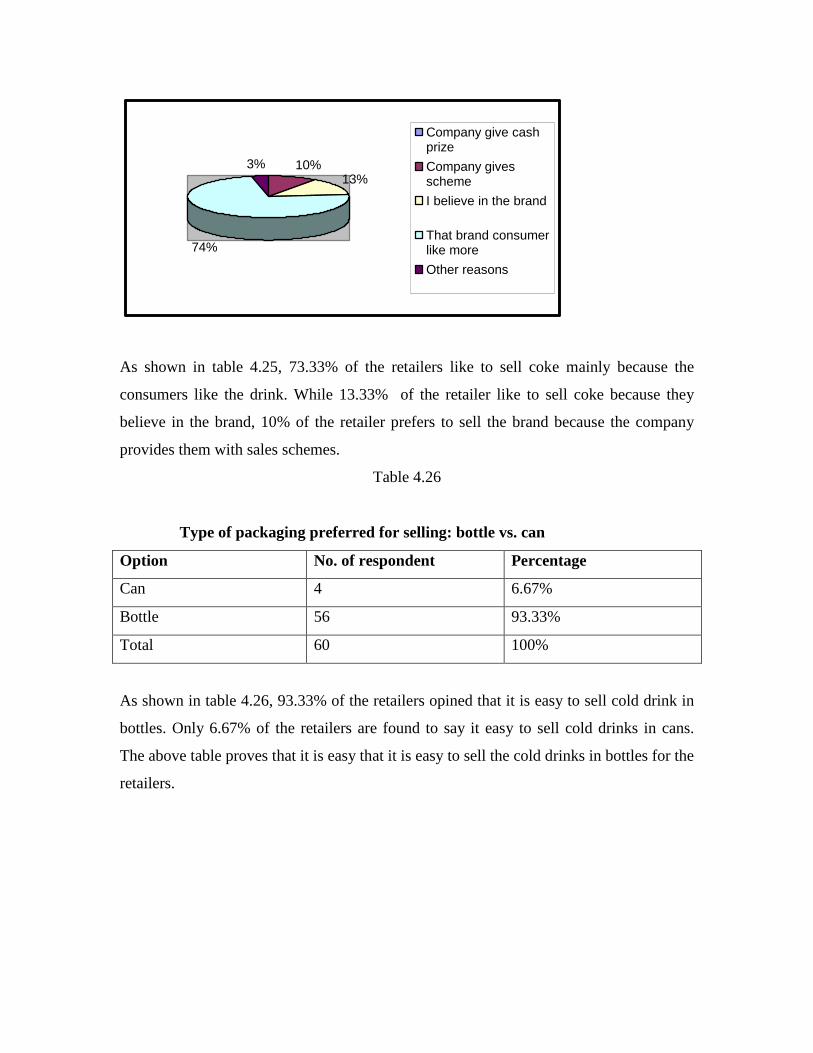
10%13%
74%
3%
Company give cashprize
Company givesscheme
I believe in the brand
That brand consumerlike more
Other reasons
As shown in table 4.25, 73.33% of the retailers like to sell coke mainly because the
consumers like the drink. While 13.33% of the retailer like to sell coke because they
believe in the brand, 10% of the retailer prefers to sell the brand because the company
provides them with sales schemes.
Table 4.26
Type of packaging preferred for selling: bottle vs. can
Option No. of respondent Percentage
Can 4 6.67%
Bottle 56 93.33%
Total 60 100%
As shown in table 4.26, 93.33% of the retailers opined that it is easy to sell cold drink in
bottles. Only 6.67% of the retailers are found to say it easy to sell cold drinks in cans.
The above table proves that it is easy that it is easy to sell the cold drinks in bottles for the
retailers.
Table 4.27
Frequency of company salesman's visit to shop
Option Coke % Pepsi % Frooti % Rio %
Daily 28 46.67% 8 13.4% 6 10% 4 6.67%
Once a week 15 25% 13 21.67% 34 56.67% 21 35%
Twice a week 14 23.33% 12 20% 7 11.67% 9 15%
Other 3 5% 27 45% 12 21.67% 23 43.33%
Total 60 100% 60 100% 60 100% 60 100%
The table 4.27 reveals that, the Coca-Cola and Pepsi salesman visit about half of the retail
outlets on a daily basis. The shop visit by the company salesmen for Frooti and Rio is
found to be mostly once a week. This indicates that the Coca-Cola and Pepsi have more
aggressive marketing strategy in Barahathwa than the Frooti and Rio.
Table 4.28
Quantity of purchase of cold drink at a time
Option No. of respondent Percentage
1crates 3 5%
2 crates 13 21.67%
More than 3 crates 18 30%
More than 5 crates 24 40%
More than 10 crates 2 3.33%
Total 60 100%
This survey reveals (table 4.28) that out of 60 retailers. 3.33% of the retailer's purchase
more than 10 crates at any one time. While 40% are found to purchase more than 5 crates
at a time, 30% of the retailers purchase more than 3 crates at a time, 21.67% of them
purchase 2 crates, and only 5% purchase of cold drink in Barahathwa is mostly between 5
to 10 crates at a time.
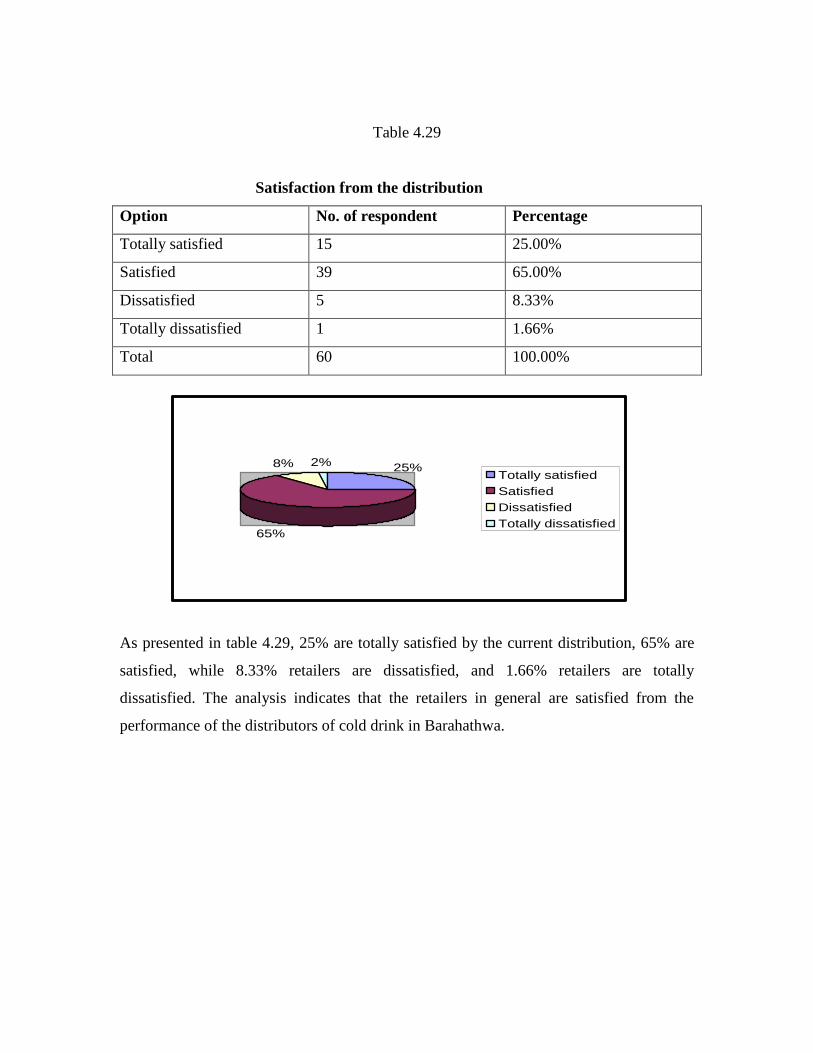
Table 4.29
Satisfaction from the distribution
Option No. of respondent Percentage
Totally satisfied 15 25.00%
Satisfied 39 65.00%
Dissatisfied 5 8.33%
Totally dissatisfied 1 1.66%
Total 60 100.00%
As presented in table 4.29, 25% are totally satisfied by the current distribution, 65% are
satisfied, while 8.33% retailers are dissatisfied, and 1.66% retailers are totally
dissatisfied. The analysis indicates that the retailers in general are satisfied from the
performance of the distributors of cold drink in Barahathwa.
25%
65%
8% 2%Totally satisfied
Satisfied
Dissatisfied
Totally dissatisfied
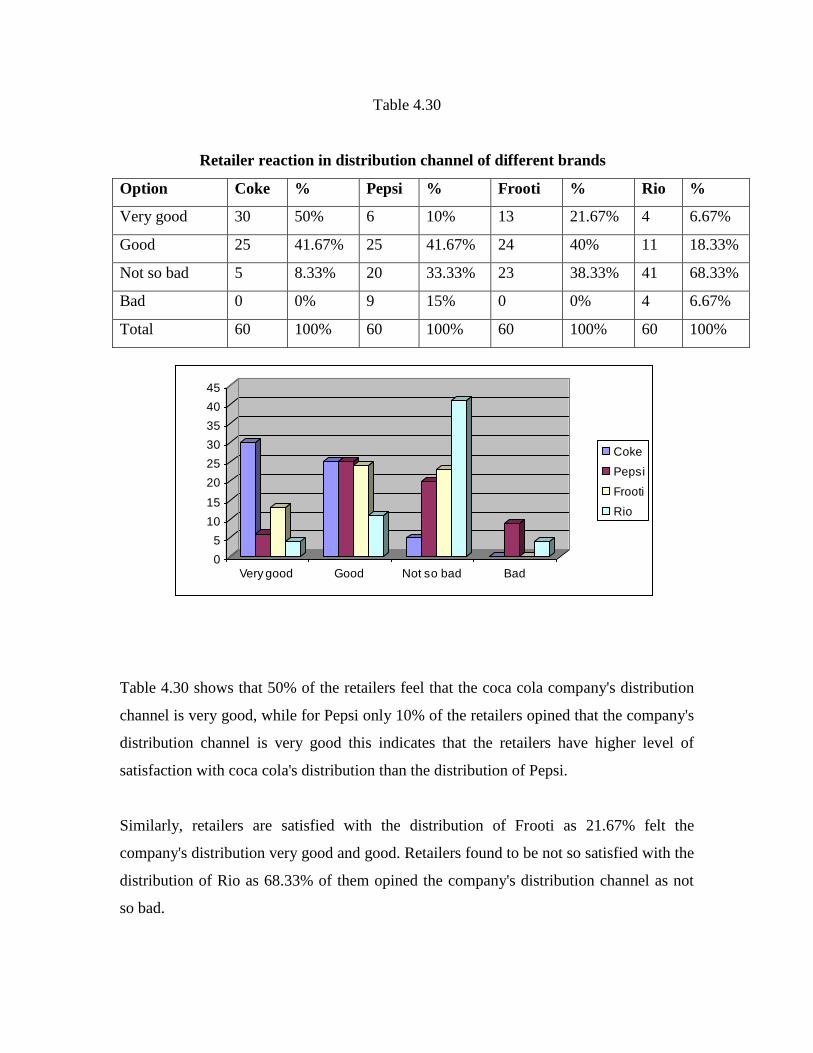
Table 4.30
Retailer reaction in distribution channel of different brands
Option Coke % Pepsi % Frooti % Rio %
Very good 30 50% 6 10% 13 21.67% 4 6.67%
Good 25 41.67% 25 41.67% 24 40% 11 18.33%
Not so bad 5 8.33% 20 33.33% 23 38.33% 41 68.33%
Bad 0 0% 9 15% 0 0% 4 6.67%
Total 60 100% 60 100% 60 100% 60 100%
Table 4.30 shows that 50% of the retailers feel that the coca cola company's distribution
channel is very good, while for Pepsi only 10% of the retailers opined that the company's
distribution channel is very good this indicates that the retailers have higher level of
satisfaction with coca cola's distribution than the distribution of Pepsi.
Similarly, retailers are satisfied with the distribution of Frooti as 21.67% felt the
company's distribution very good and good. Retailers found to be not so satisfied with the
distribution of Rio as 68.33% of them opined the company's distribution channel as not
so bad.
0
5
10
15
20
25
30
35
40
45
Very good Good Not so bad Bad
Coke
Pepsi
Frooti
Rio
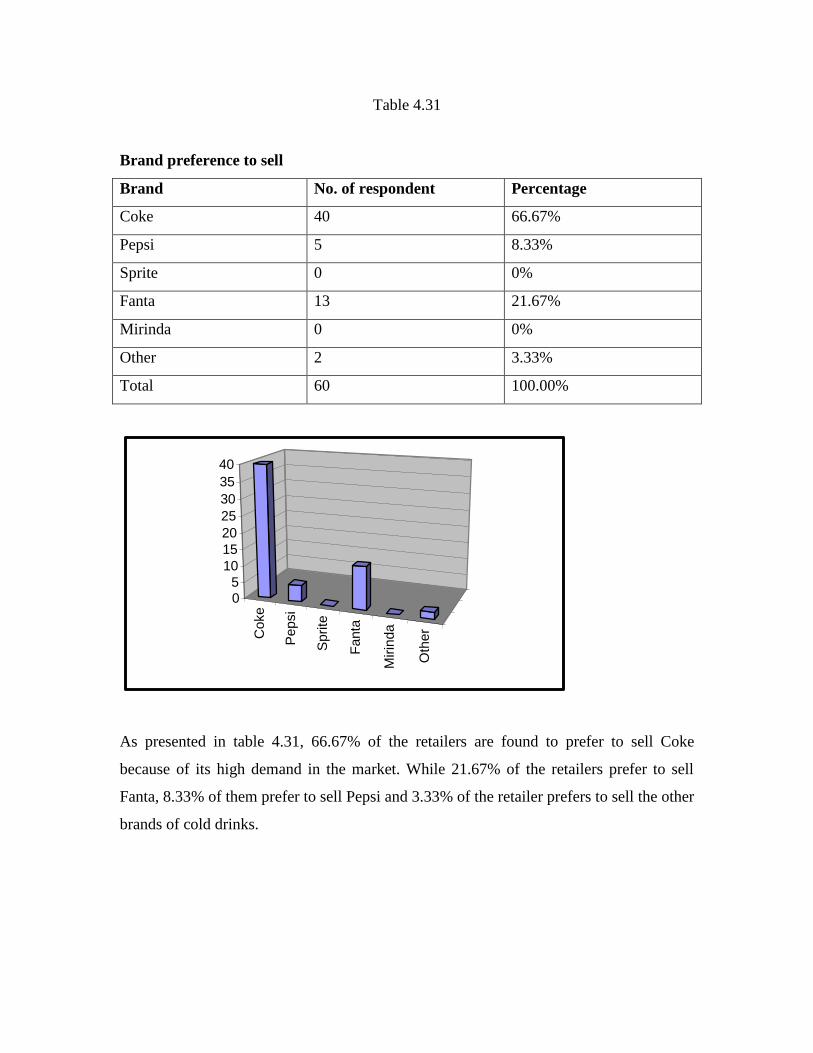
Table 4.31
Brand preference to sell
Brand No. of respondent Percentage
Coke 40 66.67%
Pepsi 5 8.33%
Sprite 0 0%
Fanta 13 21.67%
Mirinda 0 0%
Other 2 3.33%
Total 60 100.00%
Coke
Pepsi
Sprite
Fa
nta
Mirin
da
Oth
er
0
5
10
15
20
25
30
35
40
As presented in table 4.31, 66.67% of the retailers are found to prefer to sell Coke
because of its high demand in the market. While 21.67% of the retailers prefer to sell
Fanta, 8.33% of them prefer to sell Pepsi and 3.33% of the retailer prefers to sell the other
brands of cold drinks.
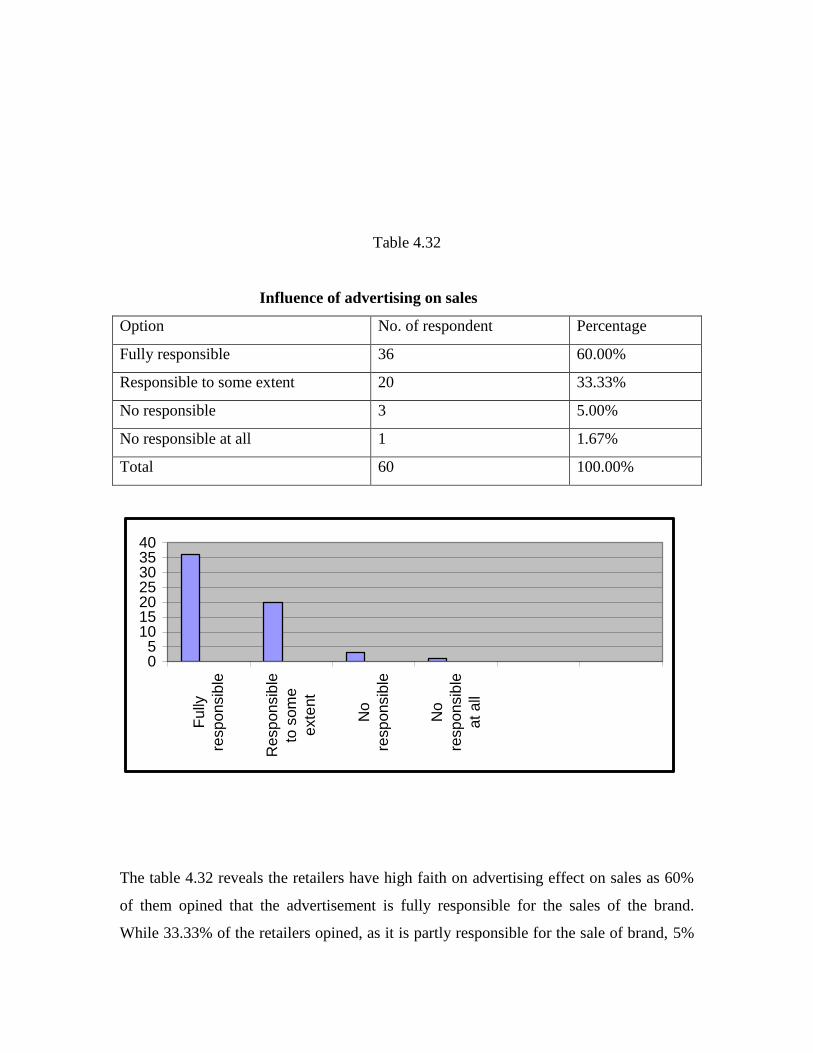
Table 4.32
Influence of advertising on sales
Option No. of respondent Percentage
Fully responsible 36 60.00%
Responsible to some extent 20 33.33%
No responsible 3 5.00%
No responsible at all 1 1.67%
Total 60 100.00%
05
10152025303540
Fully
responsib
le
Responsib
le
to s
om
e
exte
nt
No
responsib
le
No
responsib
le
at
all
The table 4.32 reveals the retailers have high faith on advertising effect on sales as 60%
of them opined that the advertisement is fully responsible for the sales of the brand.
While 33.33% of the retailers opined, as it is partly responsible for the sale of brand, 5%
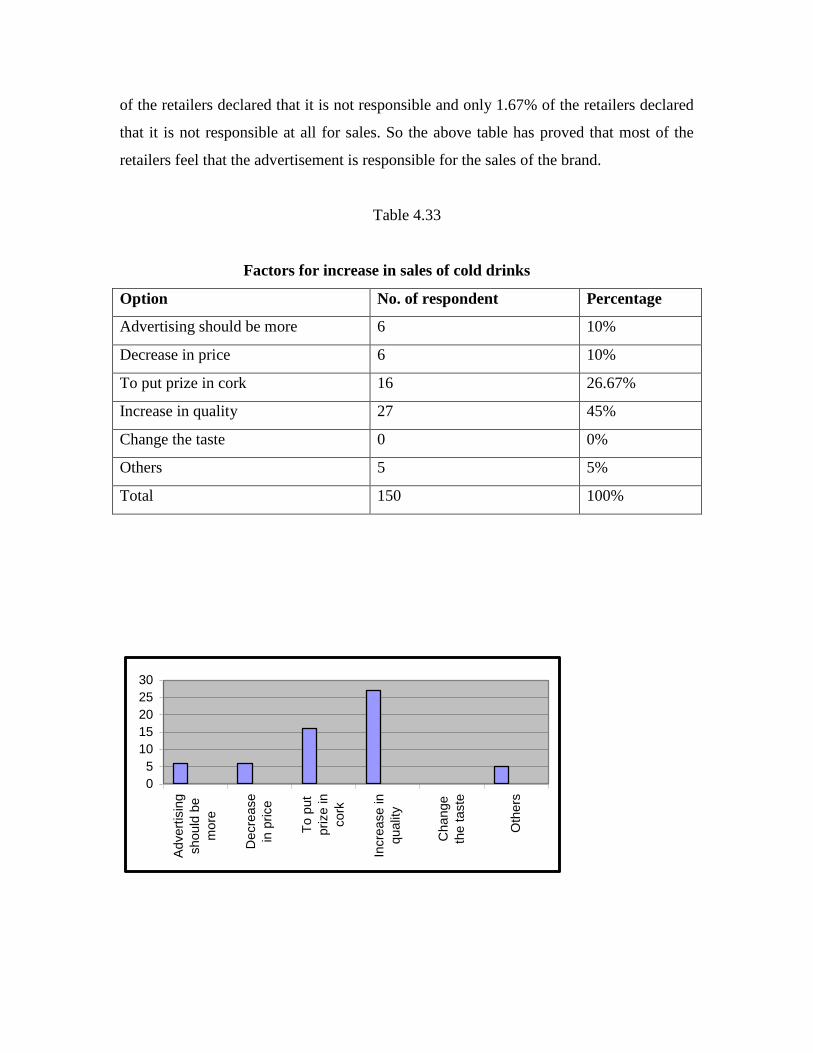
of the retailers declared that it is not responsible and only 1.67% of the retailers declared
that it is not responsible at all for sales. So the above table has proved that most of the
retailers feel that the advertisement is responsible for the sales of the brand.
Table 4.33
Factors for increase in sales of cold drinks
Option No. of respondent Percentage
Advertising should be more 6 10%
Decrease in price 6 10%
To put prize in cork 16 26.67%
Increase in quality 27 45%
Change the taste 0 0%
Others 5 5%
Total 150 100%
0
5
10
15
20
25
30
Ad
ve
rtis
ing
sh
ou
ld b
e
mo
re
De
cre
ase
in p
rice
To
pu
t
prize
in
co
rk
Incre
ase
in
qu
alit
y
Ch
an
ge
the
ta
ste
Oth
ers
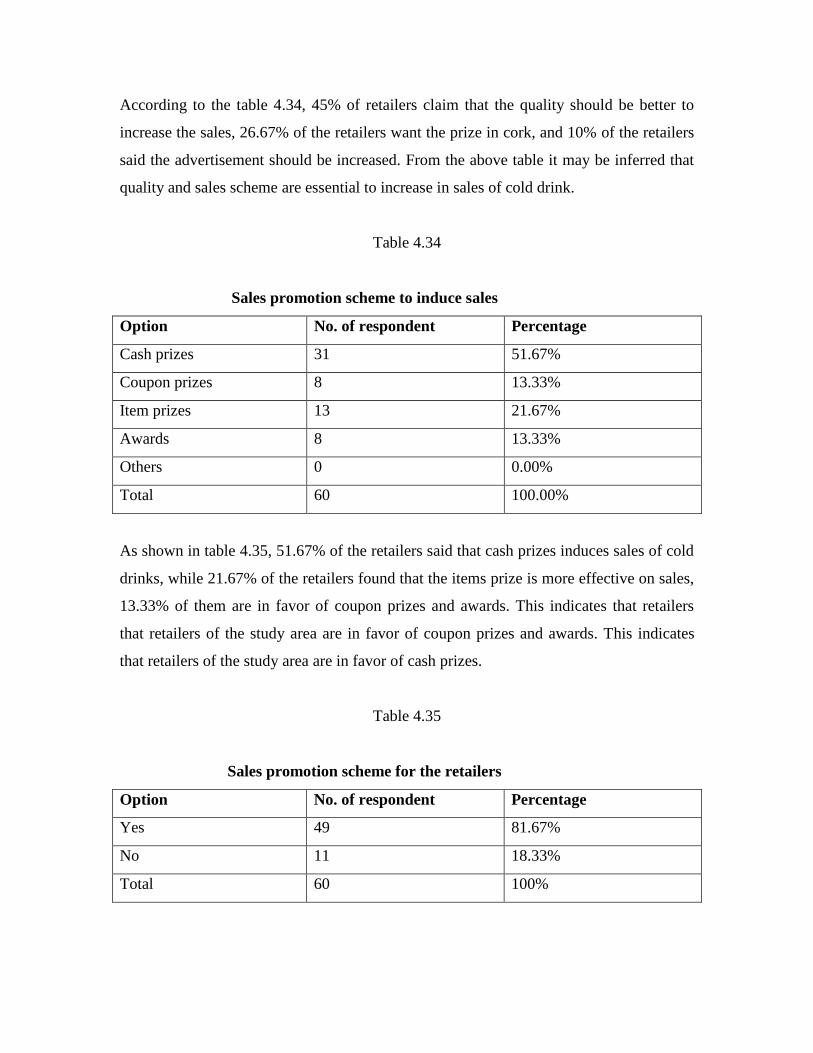
According to the table 4.34, 45% of retailers claim that the quality should be better to
increase the sales, 26.67% of the retailers want the prize in cork, and 10% of the retailers
said the advertisement should be increased. From the above table it may be inferred that
quality and sales scheme are essential to increase in sales of cold drink.
Table 4.34
Sales promotion scheme to induce sales
Option No. of respondent Percentage
Cash prizes 31 51.67%
Coupon prizes 8 13.33%
Item prizes 13 21.67%
Awards 8 13.33%
Others 0 0.00%
Total 60 100.00%
As shown in table 4.35, 51.67% of the retailers said that cash prizes induces sales of cold
drinks, while 21.67% of the retailers found that the items prize is more effective on sales,
13.33% of them are in favor of coupon prizes and awards. This indicates that retailers
that retailers of the study area are in favor of coupon prizes and awards. This indicates
that retailers of the study area are in favor of cash prizes.
Table 4.35
Sales promotion scheme for the retailers
Option No. of respondent Percentage
Yes 49 81.67%
No 11 18.33%
Total 60 100%
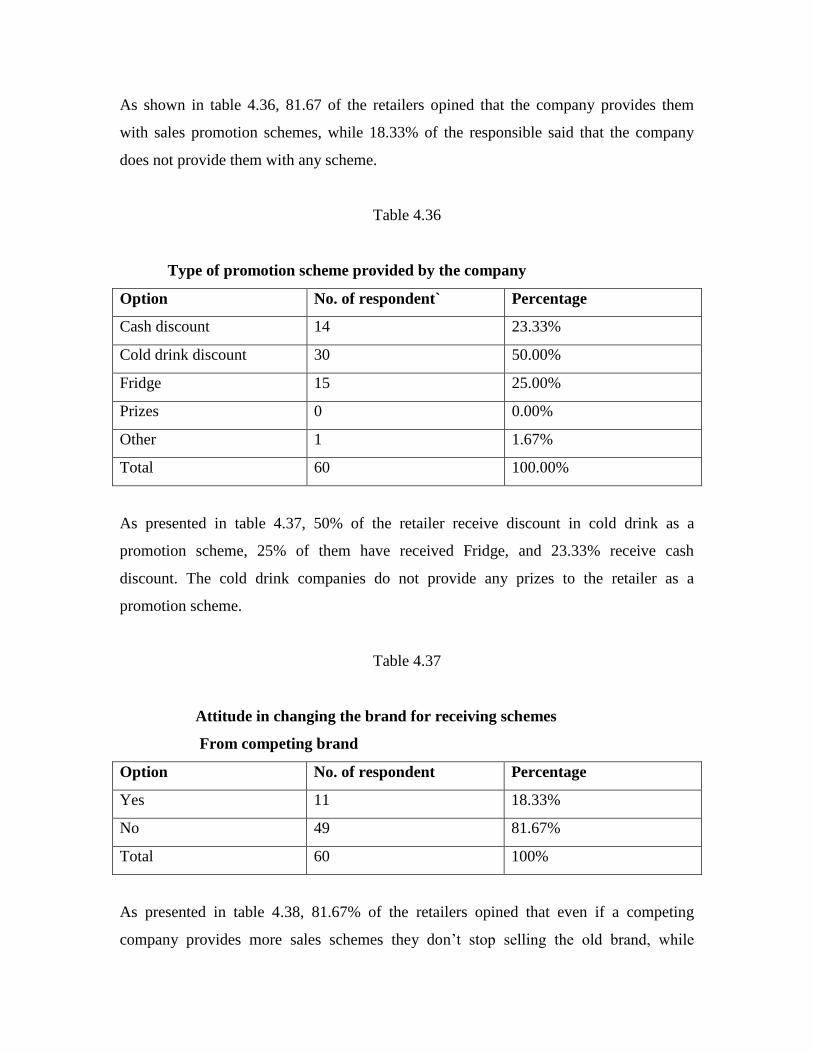
As shown in table 4.36, 81.67 of the retailers opined that the company provides them
with sales promotion schemes, while 18.33% of the responsible said that the company
does not provide them with any scheme.
Table 4.36
Type of promotion scheme provided by the company
Option No. of respondent` Percentage
Cash discount 14 23.33%
Cold drink discount 30 50.00%
Fridge 15 25.00%
Prizes 0 0.00%
Other 1 1.67%
Total 60 100.00%
As presented in table 4.37, 50% of the retailer receive discount in cold drink as a
promotion scheme, 25% of them have received Fridge, and 23.33% receive cash
discount. The cold drink companies do not provide any prizes to the retailer as a
promotion scheme.
Table 4.37
Attitude in changing the brand for receiving schemes
From competing brand
Option No. of respondent Percentage
Yes 11 18.33%
No 49 81.67%
Total 60 100%
As presented in table 4.38, 81.67% of the retailers opined that even if a competing
company provides more sales schemes they don’t stop selling the old brand, while
18.33% of them are found to be willing to stop selling the old brand if they receive better
sales schemes. This indicates that more than four fifths of the retailers are brand loyal.
4.3Major Findings of the Study
As a result of above analysis of data some major findings may be summed up as listed
below:
'Coke' the number one choice. As the analysis of table no 4.1 suggest, the choice
for coke is far than to any other brand \s of cold drinks available right now in the
market. Peoples attitude towards coke is far more positive than to other brands
and together with this the coca cola company has rightly combined coke with its
other product i.e., fanta, sprite and lemon fanta, so that it has about 90% of the
cold drink market.
Our second major finding is regarding the image of cold drinks on basis of time,
place, and reasons to drink. It is found that people consider cold drinks as daytime
drinks as suggested by the consumer survey shown by table no. 4.2. this table
shows that more than 67% prefer to have cold drinks as daytime. Table no. 4.3
exposes another image of cold drinks in people's mind. Seemingly more than 55%
of the respondent pinpoints the reason to have cold drinks for quenching, the
thirst. Another image as to cold drinks in people's mind is that it is more suitable
to have in a restaurant or bakery shop which table no. 4.5. suggests this clearly.
More than 52% prefer cold drinks in restaurant and surrounding.
Third finding includes consumers first preference goes to quality, taste and brand
name and only the moderate level of preference to availability, advertisement and
price.
Next major finding can be derived from table no. 4.23. this table defines the
consumption pattern of cold drinks. The table suggests that more than 66% of the
total sale of cold drinks be occupied by coke. This means consumers prefer the
coke than to other cold drinks. Hence, consumption pattern of cold drinks is
dominated by coke.
It has been found that the consumers have more exposure of cold drink
advertisements through the television as this figure for coke, pepsi, frooti and rio
are 82.67%, 74.67%, 70.67% and 58.6% respectively. Magazines provide the
second most important exposure, while exposure through radio is found to be very
low. On terms of consumers perception of the most effective media, the TV is the
most effective media (60.67%), followed by radio (13.33%), magazines (10.67%),
hoarding board (6.67%), electronic board (4.67%) and wall paintings (4%). The
survey shows that even though the exposure of cold drink advertisements through
radio is found to be low, yet consumers feel that it is an effective medium for
advertisement of cold drink after the TV.
All respondents are found to recall the advertisement of cold drink. This indicates
that cols drink advertisements have not only higher level of exposure but also a
very high recall value. The study found that 54% of respondents remember
advertisement of coke, 20.67% remember advertisement of pepsi, 10.67%
remember advertisements of sprite, 6.67% remember advertisements of frooti,
5.33% remember advertisements of fanta, 2% remember advertisement of rio and
0.67% remember advertisements of mirinda. From the above analysis it can be
inferred that coke advertisements have been very effective with a very high recall
value.
The study also found that 86% of respondents remember TV advertising, while
6.67% of respondents remember advertising in magazine, 2% of respondents
remember advertisement in electronic boars, wall painting and fridge and 1.33%
respondents remember advertising in radio. From the above survey it proves that
TV is more attractive media and radio is the weakest media of advertisement for
advertisement for cold drink.
The advertisements have very little action effects as 60% of respondents are found
to buy cold drink when they need, while 16% respondents found that they buy
cold drink without consulting any advertisements. Only 1.33% of the respondent
is found to buy cold drink immediately after exposure to an advertisement and
additional 8% after a few exposures. However, 90% consumers replied that they
were fully influenced by the advertisement while 10% consumers replied that they
were not influenced by the advertisement. From this, it should be inferred that
although consumers buy cold drink, when the need arises, advertisements have
played a very strong role in the choice of cold drink brand.
Consumers are found to often try other brands as 47.33% respondents change
their brand to find new taste. While 36.67% respondents change their brand when
they are most preferred brand is not available. Another 11.33% of respondents
change their brand when competing brand provides different sales schemes, and
only 9.67 of respondents are found to change their brand due to advertisement.
Thus it concludes that a large number of respondents change their brand to find
the new taste.
In the study area, 68.67% of consumer purchase cold drink for themselves, 24%
of Consumers purchase through their family members, 5.33% purchase through
their friends and 2% purchase through other people. Similarly, 28% of consumers
are found to have cold drink once a day, 12% consumers have twice a day,
18.67% of consumers have cold drink twice a week, 17.33% of consumer have
once a week, and 24% of consumers have cold drinks whenever they like to have.
From this, it can be inferred that the frequency of consumption of cold drink is
quite high in Barahathwa.
In terms of the reasons for consuming cola brand drink, particularly coke and
pepsi, 34% of respondents used to have coke because of its taste 24.67% because
of quality, 21.33% for quenching the thirst, 6.67% because of its brand name and
easy availability, 4.67% for its freshness and have for fashion. Similarly, 35.33%
of respondents have pepsi for quenching the thirst, 20.67% have because of its
taste, and 15.33% because of its brand name, 10.67% because it is available
everywhere, 9.33 for its quality, 4% for freshness, 3.33% for other reasons and
1.33% have for fashion. From this study, it can be concluded that taste stands the
first attribute for having coke followed by quality, while in case of pepsi its thirst
quenching attribute stands as the first reason followed by its brand name and
availability.
In terms of the respondents reasons for having the fruit based cold drink
particularly, frooti and rio, 56% of respondents consume frooti because of its
taste. 13.33% of respondents consume for quenching the thirst, 6.67% of
respondent consume because of quality, 6% respondent for brand, availability and
for freshness, 4.67% respondents consume for other reasons and 1.33% consume
for fashion. Similarly, 28.67% respondents consume rio because of its taste, 20%
consume for quenching the thirst, and 12.67% respondent consume because of
brand. 12% consumes for freshness and other reasons, 8% respondents consume
because it is available everywhere, 5.33% consume because of its quality and
1.33% consume for fashion. From this study, it may be conclude that taste and the
thirst quenching properties of both frooti and rio are the first and the second most
important reasons for consumption of these fruit based drinks.
The study shows that 41.33% of the respondents like advertisements based on the
Nepalese folksong, while 21.33% of respondents like cartoon picture
advertisement, 20% like advertisements with Nepali model and 17.33% like
foreign advertisements. From the analysis it may be inferred that the cold drink
users primarily like folk song base advertisements while there are sufficient
number of respondents who like other forms of advertisements.
Among the 60 retailers surveyed 60% of retailers have been running their
business for the last five years, 28.33% of retailers for the last 5 to 10 years, 10%
of retailer for the last 10 to 15 years and 1.67% have been running their business
for the last 15 years.
The study showed that availability of coca cola products (coke, fanta, sprite and
lemon fanta) is generally higher than the pepsi products (pepsi, Mirinda and 7up).
Frooti is also found to be very strong in terms of availability in the retail stores of
the study area, while Rio is slowly catching up in the market.
Out of 60 retailers 33.33% sells 2 crates of cold drink in a day, 28.33% sells 1
crates per day, 15% sells 2 crates per day, 13.33% sells 5 crates per day and 10%
of the retailers sell less than half crates in a day. From this , it may be inferred that
the retail sales per store in generally between one to two crates of cold drink in a
day.
The coke is at the top position among the brands as 66.67 the retailers opined it as
the most selling brand and it followed by fanta (28.33%) and pepsi 5%. In the
study, 96.67% of the retailers opined that 250ml. bottles has the highest sales, and
93.33% of the retailers opined that it is easy to sell cold drinks in cans. This infers
that it is easy to sell the cold drinks in bottles for the retailer.
The coca cola and pepsi salesmen visit about half of the retail outlets on a daily
basis. The shop visit by the company salesmen for frooti and rio is found to be
mostly once a week. This indicates that the coca cola and pepsi have more
aggressive marketing strategy in Barahathwa than the frooti and rio.
This study reveals that out of 60 retailers, 3.33% of the retailers purchase more
than 10 crates at any one time. While 40% are found to purchase more than 5
crates at a time, 30% of the retailers purchase more than 3 crates at a time,
21.67% of them purchase 2 crates and only 5% purchase 1 crates at a time. This
indicates that the retail purchase of cold drink in Barahathwa is mostly between 5
to 10 crates at a time.
The study found that 25% of the retailers are totally satisfied with the current
distribution, 65% of the retailers are satisfied, while 8.33% retailers are
dissatisfied, and 1.66% retailers are totally dissatisfied. The analysis indicates that
the retailers in general are satisfied, from the performance of the distributor of
cold drink in Barahathwa. About 50% of the retailers feel that the coca cola
company's distribution channel is very good while for Pepsi only 10% of the
retailers opined that the company distribution channel is very good. This indicates
that the company's distribution channel is very good. This indicates that the
retailers have higher level of satisfaction with coca cola's distribution than then
the distribution of Pepsi. Similarly, retailers are satisfied with the distribution of
fruity as 61.67% felt the company's distribution as very good and good. Retailers
are not so satisfied with the distribution of rio and 68.33% of them opined the
company's distribution channel as not so bad.
In the study, 66.67% of the retailers are found to prefer to sell coke because of its
high demand in the market. While 21.67% of the retailers prefer to sell fanta,
8.33% of them prefer to sell Pepsi and 3.33% of the retailer prefers to sell the
other brands of cold drinks. Similarly, 73.33% of the retailers like to sell coke
mainly because the consumers like the drink while, 13.33% of the retailers like to
sell coke because they believe in the brand, and 10% of the retailers prefer to sell
the brand because the company provides them with sales schemes.
The study reveals that the retailers have high faith on advertising for its effect on
sales as 60% of them opined that the advertisement is fully responsible for the
sales of the brand. While 33.33% of the retailers opined as it is partly responsible
for the sale of brand, 5% of the retailers declared that it is not responsible and
only 1.67% of the retailers declared that it is not responsible at all for sales. So the
study indicates that most of the retailers feel that the advertisement is responsible
for the sales of the brand.
The study shows that retailers have high faith in the coke advertisement as
66.07% of them feel that the advertisement of coke has influences its sales, while
this figure for Pepsi is only 16.07%. Retailers feeling the influence on fanta
advertisement on its sales is 12.5% and for sprite it is 5.36%. However, 45% of
retailer's claim that the quality should be better to increase the sales, 26.67% of
the retailers want the prize in cork, and 10% of the retailers said the advertisement
should be increased. From this, it may be inferred that the quality and sales
schemes are essential to increase in sales of cold drink. In this study, 51.67% of
the retailers said that cash prizes induces sales of cold drinks, while 21.67% of the
retailers found that he item prize is more effective on sales, 13.33% of them are in
favor of coupon prizes and awards. This indicates that retailers of the study area
are in favor of cash prizes.
In the study, 81.67% of the retailers opined that the company provides them with
sales promotion schemes, while 18.33% of the respondents said that the company
does not provide them with any scheme. It was found that 50% of the retailers
receive discount in cold drink as a promotion scheme, 25% of them have received
freezer and 2333% receive cash discount. The cold drink companies do not
provide any prizes to the retailers as a promotion scheme.
In the study, 81.67% of the retailers opined that even if a competing company
provides more sales schemes they don’t stop selling the old brand, while 18.33%
of them are found to be willing to stop selling the old brand if they receive better
sales schemes. This indicates that more than four fifths of the retailers are brand
loyal.
CHAPTER-V
SUMMARY, CONCLUSION AND RECOMMENDATIONS
5.1Summary
In the modern time industries are developing rapidly in Nepal. Every year new fields of
industrial importance are being uncovered. Similarly the number of units at different
types of industries is also increasing in the country. All these have introduced a tough
competitions in the Nepalese market. Today, a product not only needs quality
enhancement but also better promotion and presentation in the market. The product
should be presented with right price, at suitable place, with good brand promotion, label
and package. The product should be able to win the heart of consumers to be successful
in the market.
Marketing plays a very significant role in accelerating the pace of industrialization, which
in turn, aims, of making the economy developed and strong. Indeed, marketing is the
most significant multiplier of economic development. The development of marketing
makes possible economic integration and the perfect utilization of whatever assets and
productive capacity that an economy energy and finally contributes o the greatest need:
that for the rapid development at entrepreneurs and managers.
The rapid urbanizations in Nepal has include a cultural of drinking cold drink by the
people. Moreover, population density has been creating hot climate, which in turn has
increased the demand for cold drink. The variety of cold drink brands sold in the
Nepalese market has also increased in recent years. The modern bottled cold drink was
first introduced in Nepal in 1976 when Coca-Cola was established, followed by Pepsi in
1986. Since then, Several industries have been established in Nepal to meet the ever-
increasing demand. Thus, the cold drink market has become very competitive in Nepal
and it is essential for every company to set up effective marketing mechanisms to exploit
the market potential.
This study has been conducted with the object of examining the marketing of cold drinks
in Barahathwa. This study has been concluded to examine the consumers' perception and
behavior in the purchase of cold drink in the study area and evaluate the distribution
Network and Marketing strategies of cold drink companies. It aims to evaluate the impact
of advertisement and sales promotion schemes on scale of cold drinks and identify
consumers profit and their preference of cold drink in the study area. It also aims to
measure the effect of sales promotion schemes on the sales of cold drinks and identify
consumers profit and their preference of cold drinks in the study area. It also aims to
measure the effect of sales promotion schemes on the sales of cold drinks and identify
consumers profit and their preference of cold drink. The study has been concluded
through a survey of consumers and retailers. All together, 150 consumers and 60 retailers'
opinions' have been collected by administering questionnaires.
5.2Conclusions
As analyzed in the above data presenting and analysis chapter, We come to conclude as
to the marketing Image Attitude as usage pattern of cold drink described by follows:
The Coca-Cola products (Coke, Fanta, Sprite and Lemon Fanta) have a
combination market share of more than 90 percent of the Barahathwa cold drink
markets.
Consumers are generally found to consume cold drink during the tiffin time. The
best reason for having cold drinks is "quenching the thirst", followed by "for
delight"; "for the test", "for the quality" and "for other interested and hobby".
Consumers are found to give higher preference to the quality, taste and brand
name in the choice of cold drinks, moderated level preference to availability,
advertisement and prices factors, moderate preference to the sales scheme and
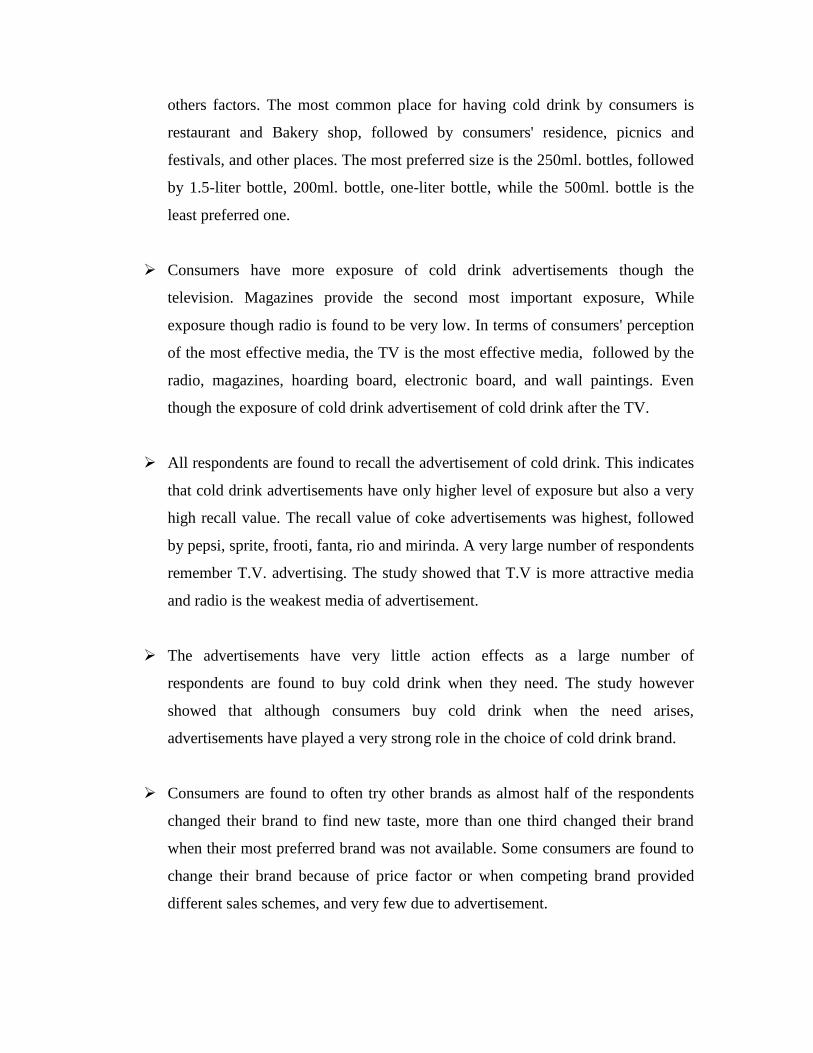
others factors. The most common place for having cold drink by consumers is
restaurant and Bakery shop, followed by consumers' residence, picnics and
festivals, and other places. The most preferred size is the 250ml. bottles, followed
by 1.5-liter bottle, 200ml. bottle, one-liter bottle, while the 500ml. bottle is the
least preferred one.
Consumers have more exposure of cold drink advertisements though the
television. Magazines provide the second most important exposure, While
exposure though radio is found to be very low. In terms of consumers' perception
of the most effective media, the TV is the most effective media, followed by the
radio, magazines, hoarding board, electronic board, and wall paintings. Even
though the exposure of cold drink advertisement of cold drink after the TV.
All respondents are found to recall the advertisement of cold drink. This indicates
that cold drink advertisements have only higher level of exposure but also a very
high recall value. The recall value of coke advertisements was highest, followed
by pepsi, sprite, frooti, fanta, rio and mirinda. A very large number of respondents
remember T.V. advertising. The study showed that T.V is more attractive media
and radio is the weakest media of advertisement.
The advertisements have very little action effects as a large number of
respondents are found to buy cold drink when they need. The study however
showed that although consumers buy cold drink when the need arises,
advertisements have played a very strong role in the choice of cold drink brand.
Consumers are found to often try other brands as almost half of the respondents
changed their brand to find new taste, more than one third changed their brand
when their most preferred brand was not available. Some consumers are found to
change their brand because of price factor or when competing brand provided
different sales schemes, and very few due to advertisement.
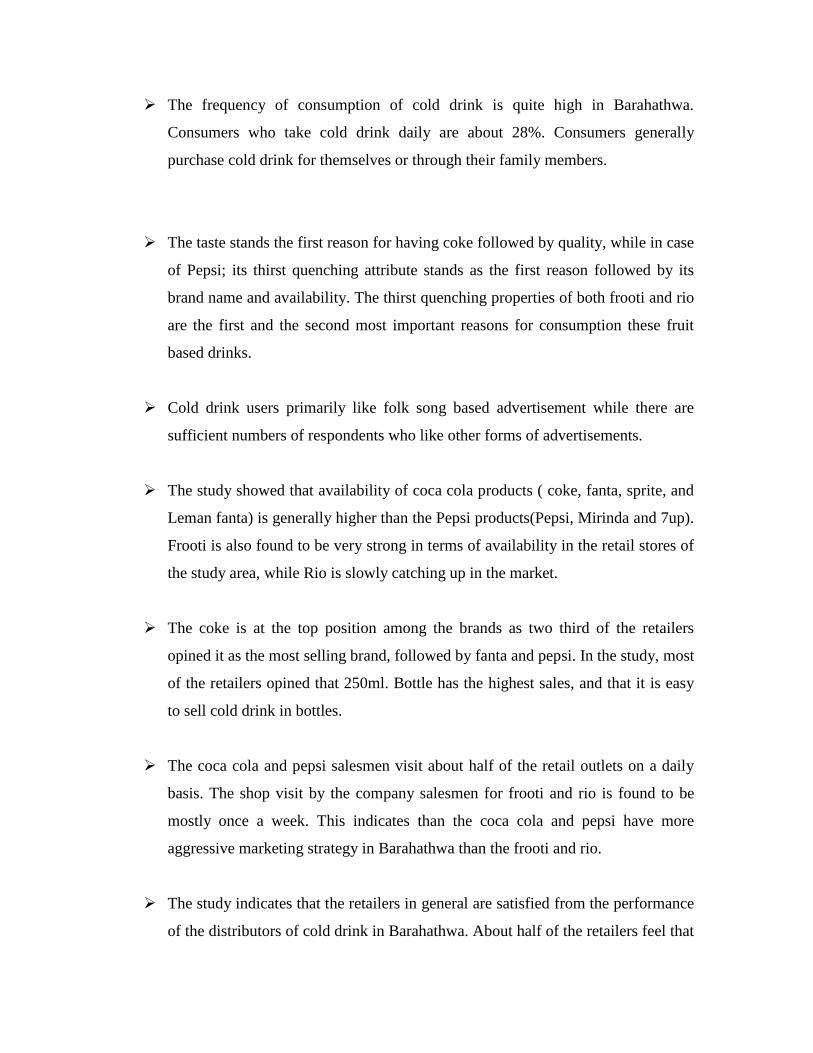
The frequency of consumption of cold drink is quite high in Barahathwa.
Consumers who take cold drink daily are about 28%. Consumers generally
purchase cold drink for themselves or through their family members.
The taste stands the first reason for having coke followed by quality, while in case
of Pepsi; its thirst quenching attribute stands as the first reason followed by its
brand name and availability. The thirst quenching properties of both frooti and rio
are the first and the second most important reasons for consumption these fruit
based drinks.
Cold drink users primarily like folk song based advertisement while there are
sufficient numbers of respondents who like other forms of advertisements.
The study showed that availability of coca cola products ( coke, fanta, sprite, and
Leman fanta) is generally higher than the Pepsi products(Pepsi, Mirinda and 7up).
Frooti is also found to be very strong in terms of availability in the retail stores of
the study area, while Rio is slowly catching up in the market.
The coke is at the top position among the brands as two third of the retailers
opined it as the most selling brand, followed by fanta and pepsi. In the study, most
of the retailers opined that 250ml. Bottle has the highest sales, and that it is easy
to sell cold drink in bottles.
The coca cola and pepsi salesmen visit about half of the retail outlets on a daily
basis. The shop visit by the company salesmen for frooti and rio is found to be
mostly once a week. This indicates than the coca cola and pepsi have more
aggressive marketing strategy in Barahathwa than the frooti and rio.
The study indicates that the retailers in general are satisfied from the performance
of the distributors of cold drink in Barahathwa. About half of the retailers feel that
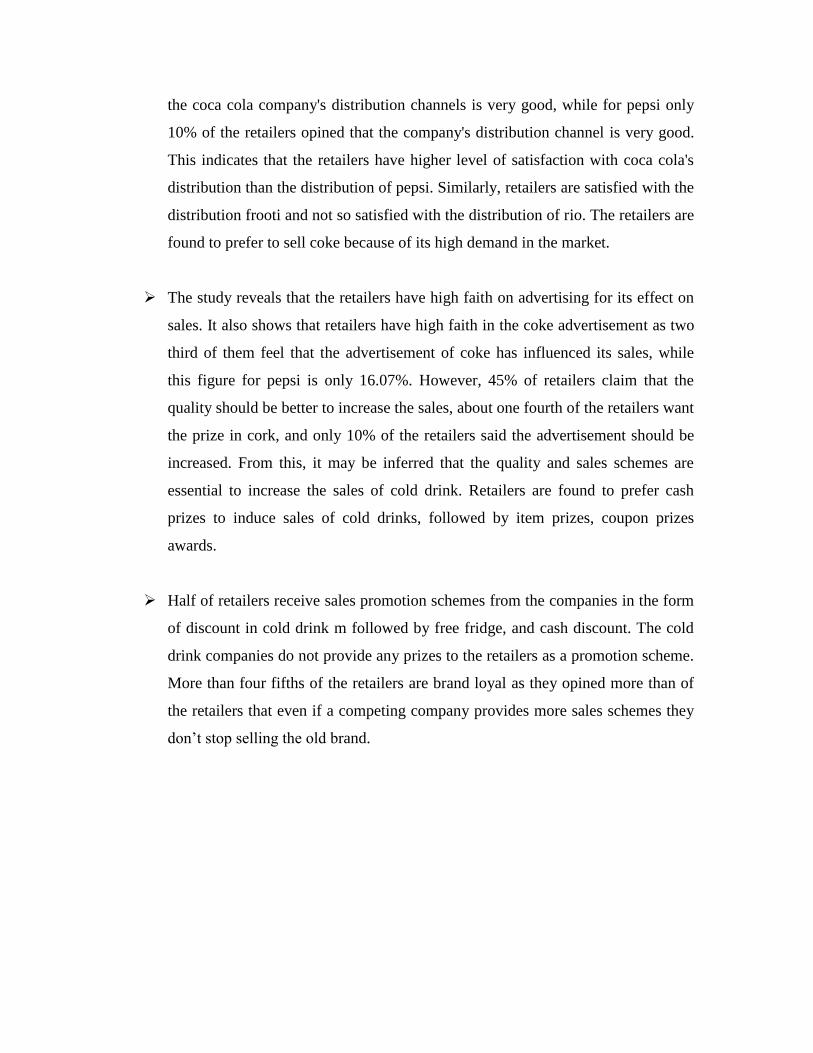
the coca cola company's distribution channels is very good, while for pepsi only
10% of the retailers opined that the company's distribution channel is very good.
This indicates that the retailers have higher level of satisfaction with coca cola's
distribution than the distribution of pepsi. Similarly, retailers are satisfied with the
distribution frooti and not so satisfied with the distribution of rio. The retailers are
found to prefer to sell coke because of its high demand in the market.
The study reveals that the retailers have high faith on advertising for its effect on
sales. It also shows that retailers have high faith in the coke advertisement as two
third of them feel that the advertisement of coke has influenced its sales, while
this figure for pepsi is only 16.07%. However, 45% of retailers claim that the
quality should be better to increase the sales, about one fourth of the retailers want
the prize in cork, and only 10% of the retailers said the advertisement should be
increased. From this, it may be inferred that the quality and sales schemes are
essential to increase the sales of cold drink. Retailers are found to prefer cash
prizes to induce sales of cold drinks, followed by item prizes, coupon prizes
awards.
Half of retailers receive sales promotion schemes from the companies in the form
of discount in cold drink m followed by free fridge, and cash discount. The cold
drink companies do not provide any prizes to the retailers as a promotion scheme.
More than four fifths of the retailers are brand loyal as they opined more than of
the retailers that even if a competing company provides more sales schemes they
don’t stop selling the old brand.
5.3 Recommendations
Based on the conclusions derived from this study ,the following Recommendation have
been suggested to the companies selling cold drinks in Barahathwa.
Since coca cola products (Coke, fanta, sprite and lemon fanta) have a combined
market share of more than 90 percent of the cold drink market and also has a very
aggressive marketing strategy, it is necessary for other cold drink companies to
review and revise their respective marketing strategies in Barahathwa.
Since consumers are found to give high weight age to "quenching the thirst" and
"for delight", the advertisements of the cold drinks should be built around these
two major attributes. As we are experiencing through different Indian Television,
marketers their seem to give the meaning of coca cola as "DHANDA". They try to
give impression by doing so that coke is equivalent quenching through and it is
the only cold drink in the market. As consumers are found to give higher
preference to the quality taste and brand name in the choice of cold drink the
advertisements should also be focused on these important aspect.
As consumers have more exposure of cold drink advertisements through the
television and magazines, these media should be extensively utilized.
The recall value of Fanta, Rio and Mirinda advertisements was very low and these
advertisements need corrections. The study showed that although consumers' buy
cold drink when the need arises, advertisements have played a very strong role in
the choice of cold drink brand.
Since brand switching is very common among the consumers mainly to find new
taste, or unavailability of the most preferred brand, companies should focus on a
better availability of their brands . Pepsi products (Pepsi, Mirinda, and 7up) need
to improve on its availability factor.
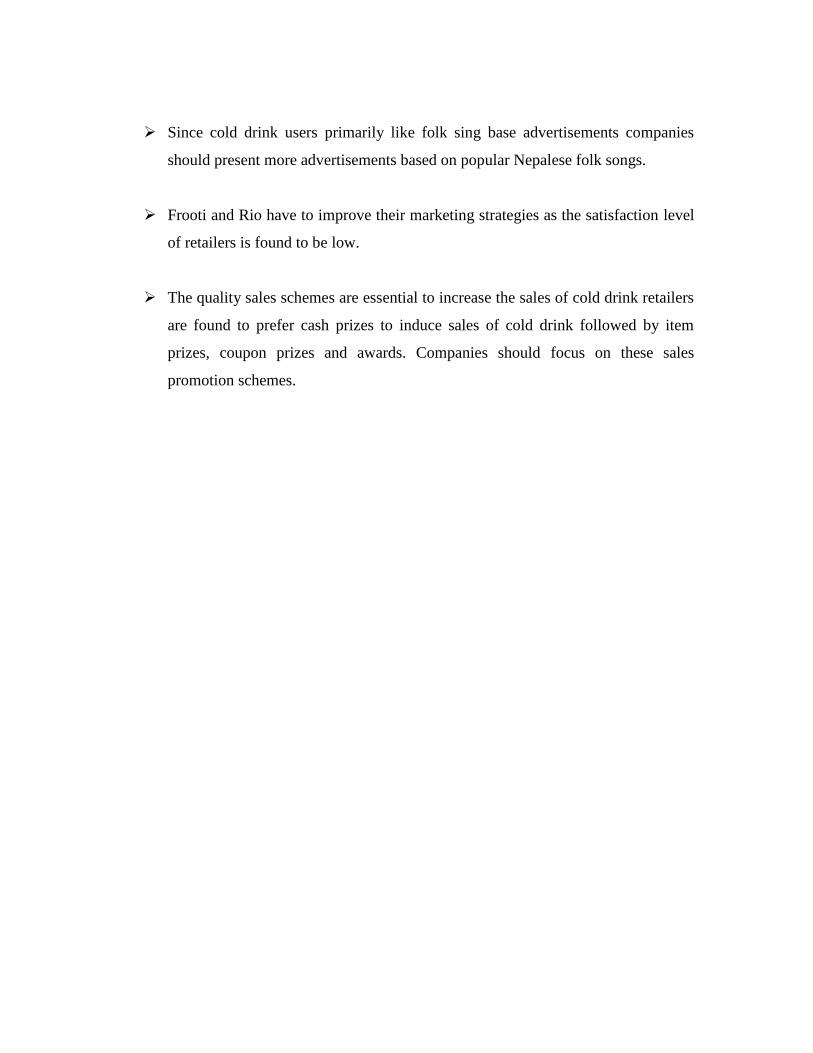
Since cold drink users primarily like folk sing base advertisements companies
should present more advertisements based on popular Nepalese folk songs.
Frooti and Rio have to improve their marketing strategies as the satisfaction level
of retailers is found to be low.
The quality sales schemes are essential to increase the sales of cold drink retailers
are found to prefer cash prizes to induce sales of cold drink followed by item
prizes, coupon prizes and awards. Companies should focus on these sales
promotion schemes.
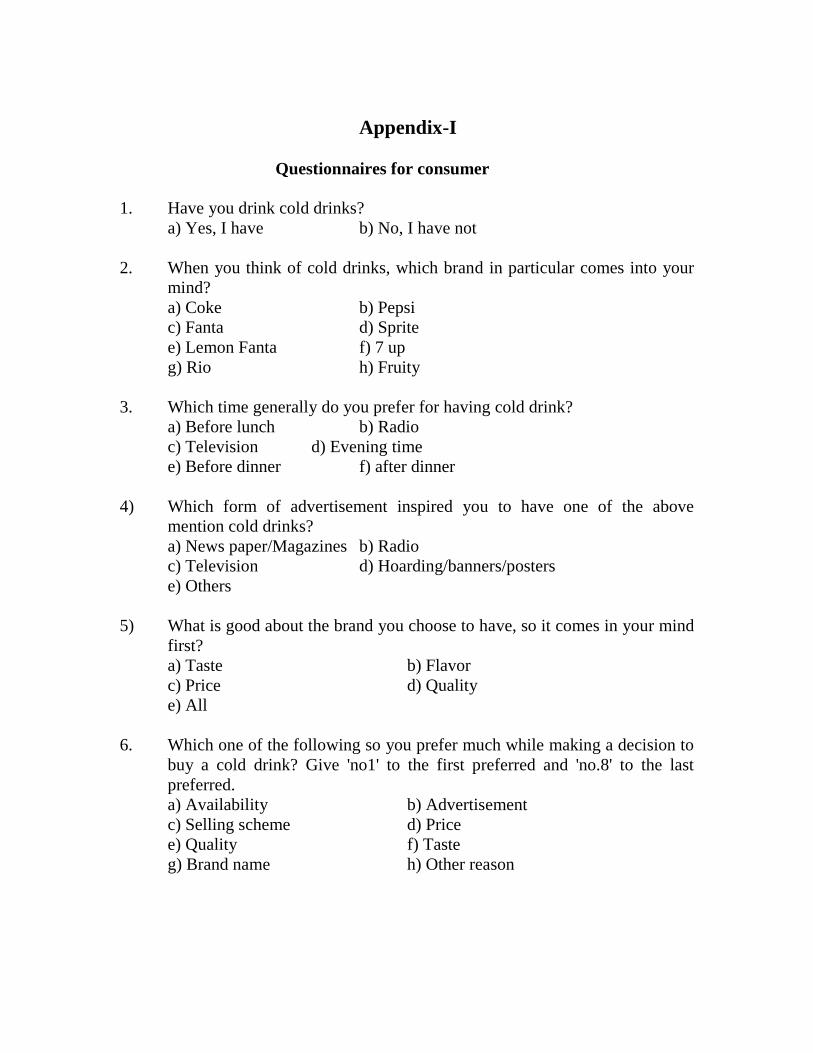
Appendix-I
Questionnaires for consumer
1. Have you drink cold drinks?
a) Yes, I have b) No, I have not
2. When you think of cold drinks, which brand in particular comes into your
mind?
a) Coke b) Pepsi
c) Fanta d) Sprite
e) Lemon Fanta f) 7 up
g) Rio h) Fruity
3. Which time generally do you prefer for having cold drink?
a) Before lunch b) Radio
c) Television d) Evening time
e) Before dinner f) after dinner
4) Which form of advertisement inspired you to have one of the above
mention cold drinks?
a) News paper/Magazines b) Radio
c) Television d) Hoarding/banners/posters
e) Others
5) What is good about the brand you choose to have, so it comes in your mind
first?
a) Taste b) Flavor
c) Price d) Quality
e) All
6. Which one of the following so you prefer much while making a decision to
buy a cold drink? Give 'no1' to the first preferred and 'no.8' to the last
preferred.
a) Availability b) Advertisement
c) Selling scheme d) Price
e) Quality f) Taste
g) Brand name h) Other reason
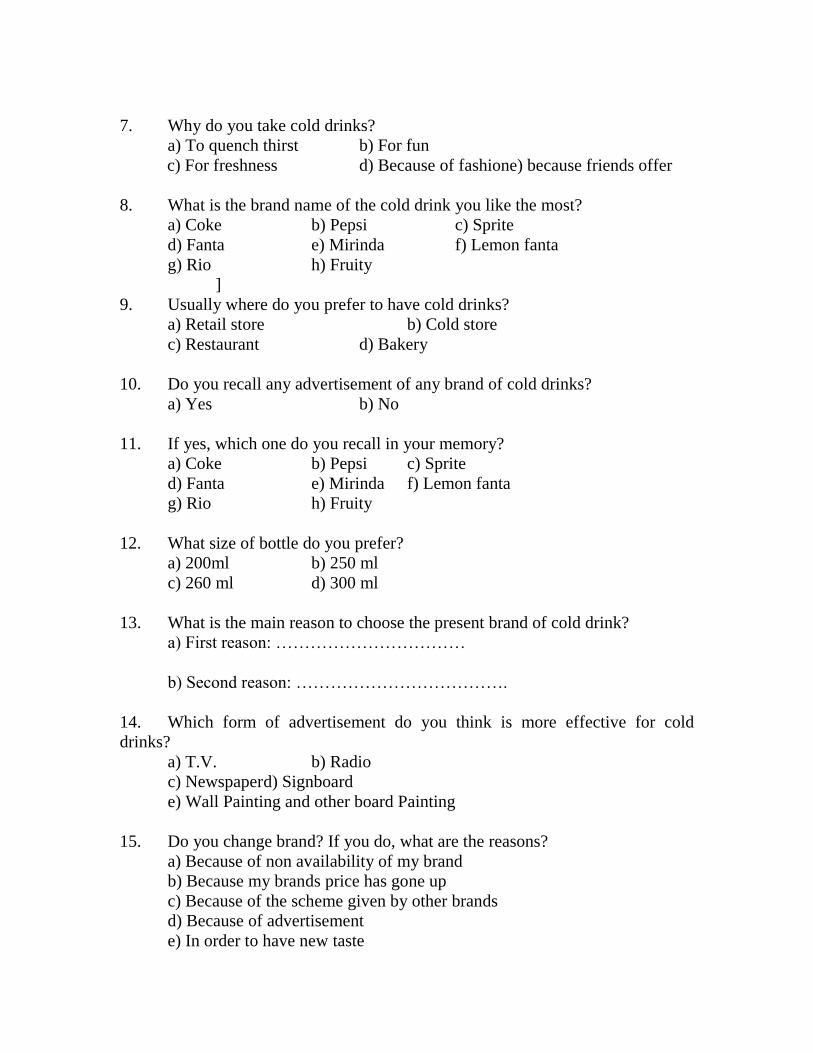
7. Why do you take cold drinks?
a) To quench thirst b) For fun
c) For freshness d) Because of fashione) because friends offer
8. What is the brand name of the cold drink you like the most?
a) Coke b) Pepsi c) Sprite
d) Fanta e) Mirinda f) Lemon fanta
g) Rio h) Fruity
]
9. Usually where do you prefer to have cold drinks?
a) Retail store b) Cold store
c) Restaurant d) Bakery
10. Do you recall any advertisement of any brand of cold drinks?
a) Yes b) No
11. If yes, which one do you recall in your memory?
a) Coke b) Pepsi c) Sprite
d) Fanta e) Mirinda f) Lemon fanta
g) Rio h) Fruity
12. What size of bottle do you prefer?
a) 200ml b) 250 ml
c) 260 ml d) 300 ml
13. What is the main reason to choose the present brand of cold drink?
a) First reason: ……………………………
b) Second reason: ……………………………….
14. Which form of advertisement do you think is more effective for cold
drinks?
a) T.V. b) Radio
c) Newspaper d) Signboard
e) Wall Painting and other board Painting
15. Do you change brand? If you do, what are the reasons?
a) Because of non availability of my brand
b) Because my brands price has gone up
c) Because of the scheme given by other brands
d) Because of advertisement
e) In order to have new taste
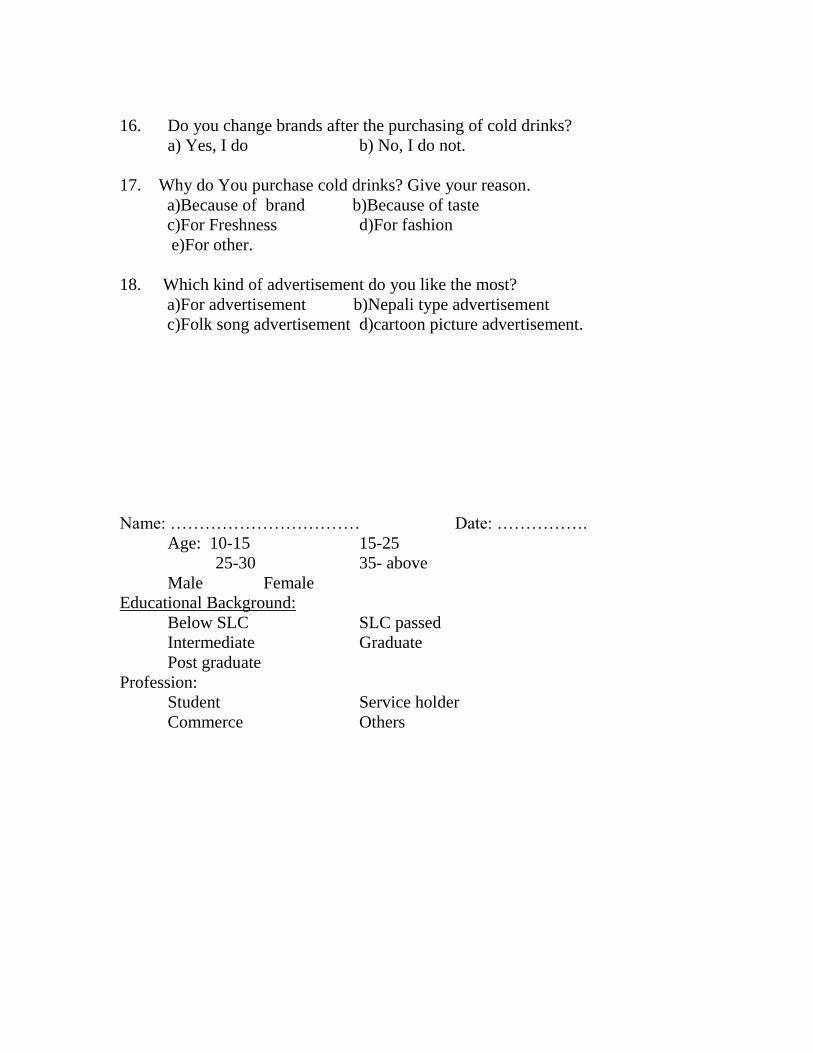
16. Do you change brands after the purchasing of cold drinks?
a) Yes, I do b) No, I do not.
17. Why do You purchase cold drinks? Give your reason.
a)Because of brand b)Because of taste
c)For Freshness d)For fashion
e)For other.
18. Which kind of advertisement do you like the most?
a)For advertisement b)Nepali type advertisement
c)Folk song advertisement d)cartoon picture advertisement.
Name: …………………………… Date: …………….
Age: 10-15 15-25
25-30 35- above
Male Female
Educational Background:
Below SLC SLC passed
Intermediate Graduate
Post graduate
Profession:
Student Service holder
Commerce Others
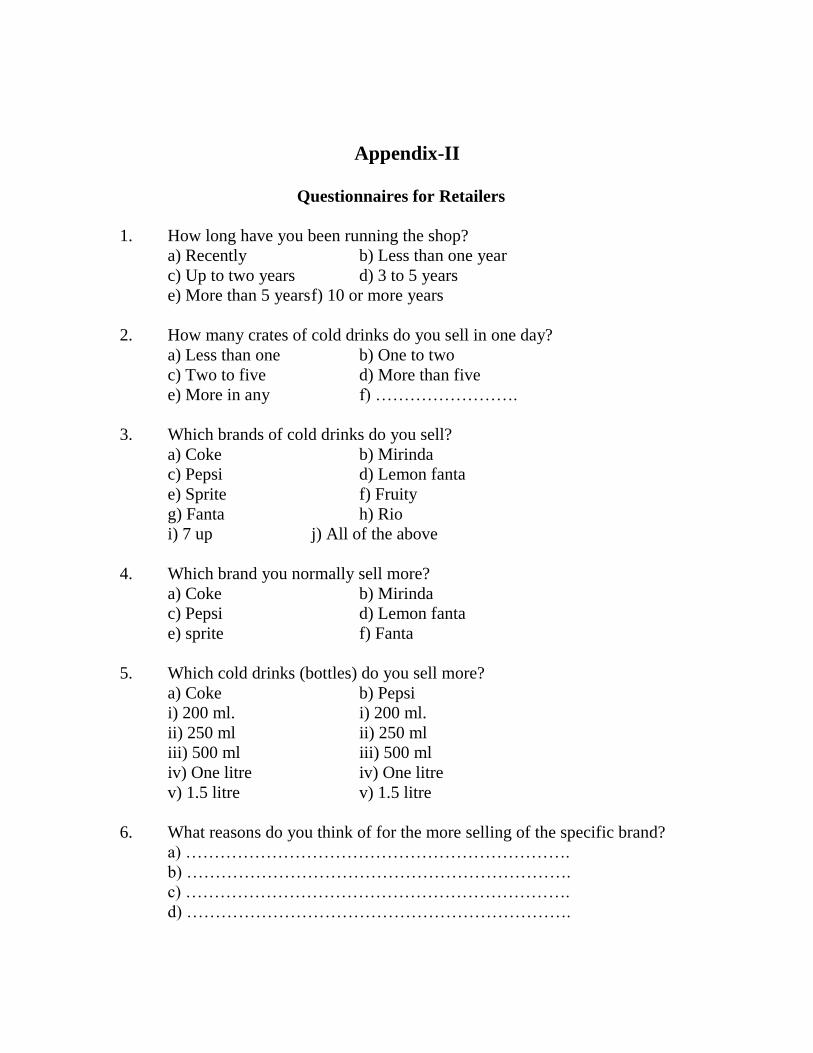
Appendix-II Questionnaires for Retailers
1. How long have you been running the shop?
a) Recently b) Less than one year
c) Up to two years d) 3 to 5 years
e) More than 5 years f) 10 or more years
2. How many crates of cold drinks do you sell in one day?
a) Less than one b) One to two
c) Two to five d) More than five
e) More in any f) …………………….
3. Which brands of cold drinks do you sell?
a) Coke b) Mirinda
c) Pepsi d) Lemon fanta
e) Sprite f) Fruity
g) Fanta h) Rio
i) 7 up j) All of the above
4. Which brand you normally sell more?
a) Coke b) Mirinda
c) Pepsi d) Lemon fanta
e) sprite f) Fanta
5. Which cold drinks (bottles) do you sell more?
a) Coke b) Pepsi
i) 200 ml. i) 200 ml.
ii) 250 ml ii) 250 ml
iii) 500 ml iii) 500 ml
iv) One litre iv) One litre
v) 1.5 litre v) 1.5 litre
6. What reasons do you think of for the more selling of the specific brand?
a) ………………………………………………………….
b) ………………………………………………………….
c) ………………………………………………………….
d) ………………………………………………………….
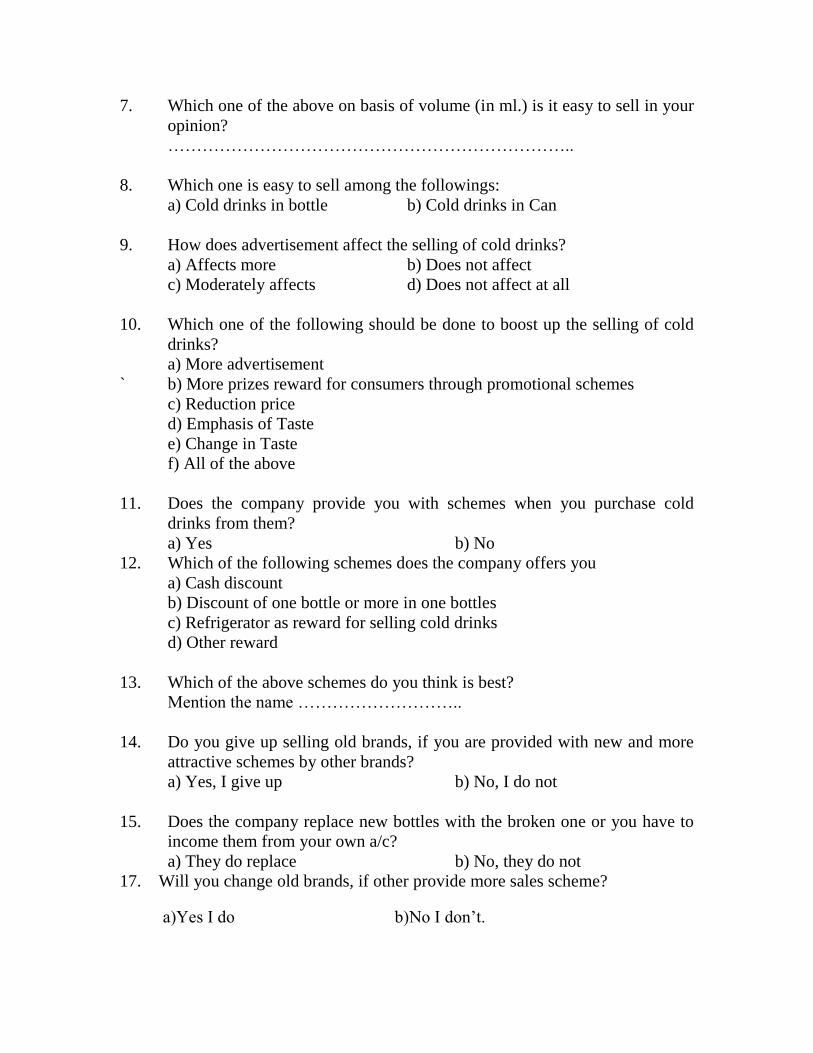
7. Which one of the above on basis of volume (in ml.) is it easy to sell in your
opinion?
……………………………………………………………..
8. Which one is easy to sell among the followings:
a) Cold drinks in bottle b) Cold drinks in Can
9. How does advertisement affect the selling of cold drinks?
a) Affects more b) Does not affect
c) Moderately affects d) Does not affect at all
10. Which one of the following should be done to boost up the selling of cold
drinks?
a) More advertisement
` b) More prizes reward for consumers through promotional schemes
c) Reduction price
d) Emphasis of Taste
e) Change in Taste
f) All of the above
11. Does the company provide you with schemes when you purchase cold
drinks from them?
a) Yes b) No
12. Which of the following schemes does the company offers you
a) Cash discount
b) Discount of one bottle or more in one bottles
c) Refrigerator as reward for selling cold drinks
d) Other reward
13. Which of the above schemes do you think is best?
Mention the name ………………………..
14. Do you give up selling old brands, if you are provided with new and more
attractive schemes by other brands?
a) Yes, I give up b) No, I do not
15. Does the company replace new bottles with the broken one or you have to
income them from your own a/c?
a) They do replace b) No, they do not
17. Will you change old brands, if other provide more sales scheme?
a)Yes I do b)No I don’t.
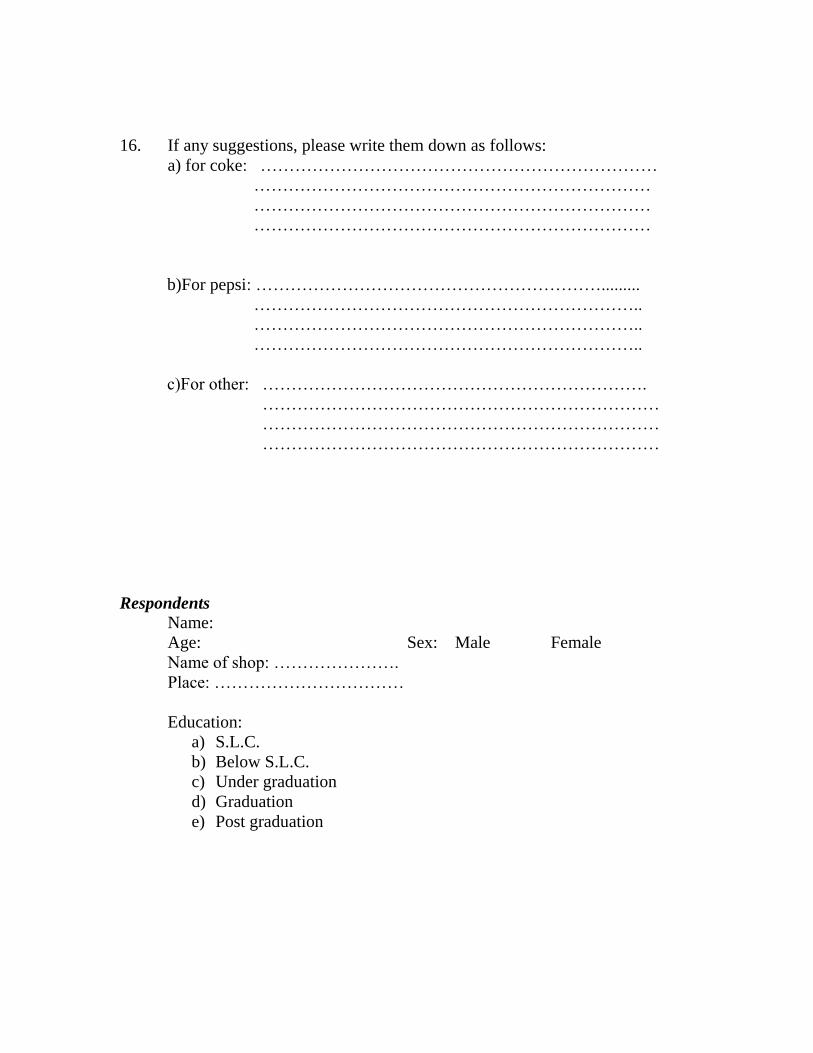
16. If any suggestions, please write them down as follows:
a) for coke: ……………………………………………………………
……………………………………………………………
……………………………………………………………
……………………………………………………………
b)For pepsi: …………………………………………………….........
…………………………………………………………..
…………………………………………………………..
…………………………………………………………..
c)For other: ………………………………………………………….
……………………………………………………………
……………………………………………………………
……………………………………………………………
Respondents
Name:
Age: Sex: Male Female
Name of shop: ………………….
Place: ……………………………
Education:
a) S.L.C.
b) Below S.L.C.
c) Under graduation
d) Graduation
e) Post graduation
BIBLIOGRAPHY
BOOKS
Alderson, Wroe and Green, Paul E. "Planning and problem solving in
marketing" 1964. Homewood II, Rechard D. Irwin Inc.
Buell Victor p; "Marketing management" 1984, Mc Graw Hill Book
company, USA.
Duglass Johnson "Advertising Today" 1978, Chicago III, Science Research
Associates.
Hansen, Richard W; Cocanougher, A. Benton and Harvey, Michael G. "An
application of marketing concept in the public sector", Chicago American
Marketing association.
Klirala, Kundan Dutta; " Marketing Management" 2057, M.K. Publishers
and Distributors, Katlunandu, Nepal.
Terry, George R., "Principles of management", 1977 Bombay.
Taraporevala Publishing.
Peterson, Robin "Marketing: A contemporary Introduction" 1977, Weley
Hamilton Publication.
Kotler, Philip; Armstrong; Gray "principle of Marketing" 1999, 8 edition
prentice hall of India pvt. Ltd., New Delhi-i 10001
Kotler, Philip, "Marketing Management: Planning Analysis and control"
1980, 4 edition, Englewood cliffs, NJ: Prentice Hall.
Agrawal, Dr. Govinda Ram, Marketing Management in Nepal. M.K.
publisher and distributor, kathmandu, 2001.
Coterora, Philip R., graham, jong 1, International marketing. Tata McGraw
Hill New Delhi, 10th ed, 2001.
Joshi P.R. research methodlody, 2nd edition, Buddha Academic Enterprises
Pvt. Ltd. Kathmandu.
Koirala Dr.K.D., Marketing decision, M.K. publisher and distributors,
kathmandu.
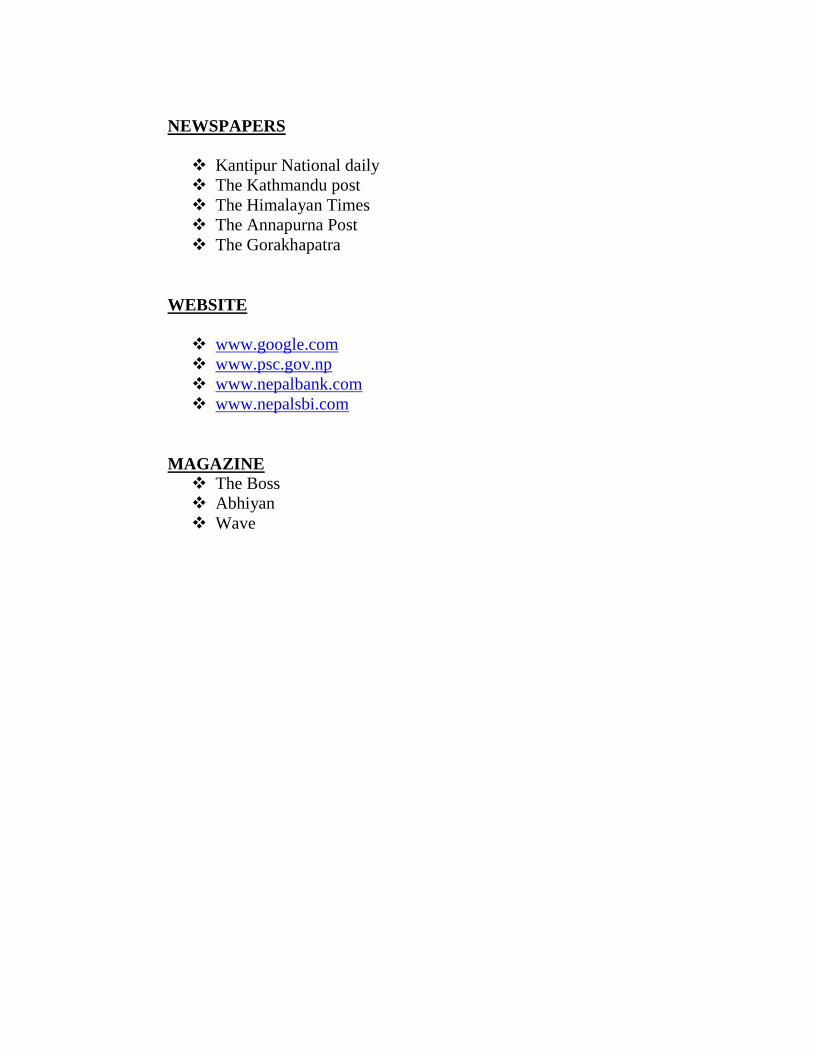
NEWSPAPERS
Kantipur National daily
The Kathmandu post
The Himalayan Times
The Annapurna Post
The Gorakhapatra
WEBSITE
www.google.com
www.psc.gov.np
www.nepalbank.com
www.nepalsbi.com
MAGAZINE
The Boss
Abhiyan
Wave
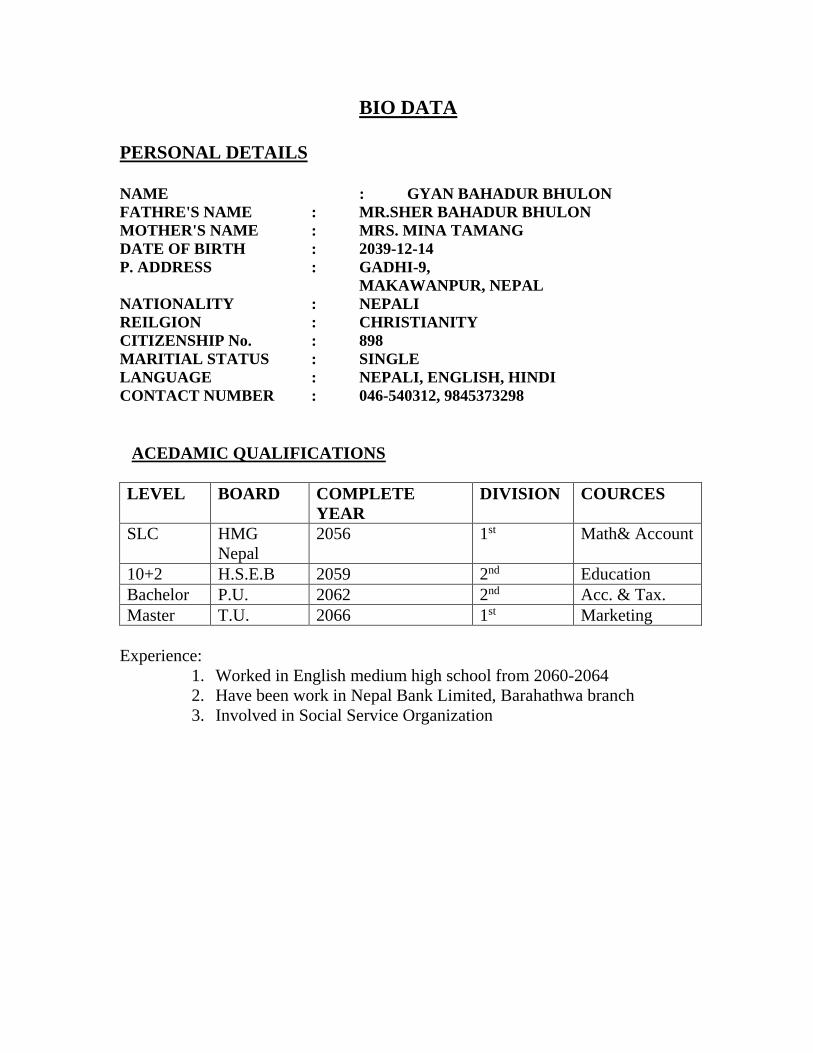
BIO DATA
PERSONAL DETAILS
NAME : GYAN BAHADUR BHULON
FATHRE'S NAME : MR.SHER BAHADUR BHULON
MOTHER'S NAME : MRS. MINA TAMANG
DATE OF BIRTH : 2039-12-14
P. ADDRESS : GADHI-9,
MAKAWANPUR, NEPAL
NATIONALITY : NEPALI
REILGION : CHRISTIANITY
CITIZENSHIP No. : 898
MARITIAL STATUS : SINGLE
LANGUAGE : NEPALI, ENGLISH, HINDI
CONTACT NUMBER : 046-540312, 9845373298
ACEDAMIC QUALIFICATIONS
LEVEL BOARD COMPLETE
YEAR
DIVISION COURCES
SLC HMG
Nepal
2056 1st Math& Account
10+2 H.S.E.B 2059 2nd Education
Bachelor P.U. 2062 2nd Acc. & Tax.
Master T.U. 2066 1st Marketing
Experience:
1. Worked in English medium high school from 2060-2064
2. Have been work in Nepal Bank Limited, Barahathwa branch
3. Involved in Social Service Organization


