Embed Size (px)
Citation preview

RESEARCHREPORT
A comparative study of men and women gamblers in Victoria
November 2014
Nerilee Hinga, Alex Russella, Barry Tolchardb & Lia Nowerc
a Centre for Gambling Education & Research, Southern Cross Universityb School of Health, University of New Englandc Center for Gambling Studies, Rutgers University

2 VICTORIAN RESPONSIBLE GAMBLING FOUNDATION
© Copyright Victorian Responsible Gambling Foundation, November 2014
This publication is licensed under a Creative Commons Attribution 3.0 Australia licence. The licence does not apply to any images, photographs, branding or logos.
This report has been peer reviewed by two independent researchers. For further information on the foundation’s review process of research reports, please see responsiblegambling.vic.gov.au.
This study was funded by the Victorian Responsible Gambling Foundation through the Grants for Gambling Research Program.
For information on the Victorian Responsible Gambling Foundation Research Program
visit responsiblegambling.vic.gov.au.
Disclaimer:The opinions, findings and proposals contained in this report represent the views of the author and do not necessarily represent the attitudes or opinions of the Victorian Responsible Gambling Foundation or the State of Victoria. No warranty is given as to the accuracy of the information. The Victorian Responsible Gambling Foundation specifically excludes any liability for any error or inaccuracy in, or omissions from, this document and any loss or damage that you or any other person may suffer.
AcknowledgementsThis study was funded by the Victorian Responsible Gambling Foundation through a Grant for Gambling Research 2011 (Round 4), Tender Reference Number 078/10-11.
To cite this report:Hing, N. et al. (2014). A comparative study of men and women gamblers in Victoria. Victoria, Australia: Victorian Responsible Gambling Foundation.
Conflict of interest declarationThe authors declares no conflict of interest in relation to this report or project.
Disclosure of previous interestsNerilee Hing has been a named investigator on research funded by the Victorian Responsible Gambling Foundation, Gambling Research Australia, Queensland Department of Justice and Attorney General, Victorian Department of Justice, NSW Office of Liquor, Gaming and Racing, Menzies Foundation, Australian Research Council, Echo Entertainment, and Sportsbet over the four years prior to the publication of this report. In this same period, she has held an Honorary position of Responsible Gambling Advisor for Singapore Pools. She has also received internal research funding from Southern Cross University.
Alex Russell has been a named investigator on research funded by the Victorian Responsible Gambling Foundation, Echo Entertainment and Gambling Research Australia over the four years prior to the publication of this report. He has also received internal funding from the School of Psychology and Faculty of Science at the University of Sydney for expenses relating to the study of his PhD.
Barry Tolchard has been a named investigator on research funded by the Victorian Responsible Gambling Foundation and the Queensland Department of Justice and Attorney General over the four years prior to the publication of this report.
Lia Nower has been a named investigator on research funded by the Victorian Responsible Gambling Foundation, the Department of Gaming Enforcement (NJ), Ontario Problem Gambling Research Centre, Department of Treasury (Queensland) and the Australian Research Council.
Victorian Responsible Gambling FoundationLevel 6, 14-20 Blackwood StreetNorth Melbourne, Victoria, 3051PO Box 2156Royal Melbourne HospitalVictoria, 3050Tel +61 3 9452 2600Fax +61 3 9452 2660ABN: 72 253 301 291
A Victoria free from gambling-related harm

A comparative study of men and women gamblers in Victoria Hing, Russell, Tolchard & Nower
Victorian Responsible Gambling Foundation Page 3
Table of Contents
ACKNOWLEDGEMENTS .......................................................................................................... 2
TABLE OF CONTENTS ............................................................................................................. 3
LIST OF TABLES ...................................................................................................................... 7
EXECUTIVE SUMMARY ......................................................................................................... 10
CHAPTER ONE: BACKGROUND TO THE STUDY ............................................................... 14
1.1 Introduction ..................................................................................................................................................... 14
1.2 Research objectives ....................................................................................................................................... 15
1.3 Report structure .............................................................................................................................................. 15
1.4 Terminology .................................................................................................................................................... 15
CHAPTER TWO: LITERATURE REVIEW .............................................................................. 17
2.1 Introduction ..................................................................................................................................................... 17
2.2 Theoretical underpinning of gender differences in gambling .................................................................... 17
2.3 Gambling participation, preferences and behaviours ................................................................................. 18 2.3.1 Gambling participation ................................................................................................................................ 18 2.3.2 Gambling preferences ................................................................................................................................ 19 2.3.3 Gambling behaviours ................................................................................................................................. 20
2.4 Theoretical underpinnings and aetiology of gambling harm and risk ...................................................... 21 2.4.1 Genetic risk ................................................................................................................................................ 21 2.4.2 Environmental risk (social, family, community) .......................................................................................... 22 2.4.3 Psychological/behavioural risk ................................................................................................................... 22
2.5 Problem gambling prevalence and gender .................................................................................................. 24
2.6 Help seeking behaviour by gender ............................................................................................................... 25
2.7 Mental health profiles of male and female problem gamblers ................................................................... 26
2.8 Chapter summary ........................................................................................................................................... 27
CHAPTER THREE: APPROACH ............................................................................................ 30
3.1 Introduction ..................................................................................................................................................... 30
3.2 Survey administration and sampling for A Study of Gambling in Victoria ............................................... 30

A comparative study of men and women gamblers in Victoria Hing, Russell, Tolchard & Nower
Victorian Responsible Gambling Foundation Page 4
3.3 Variables measured in A Study of Gambling in Victoria ............................................................................. 30 3.3.1 Gambling preferences, activities and styles of play ................................................................................... 30 3.3.2 Gambling motivations and attitudes ........................................................................................................... 31 3.3.3 Gambling problems .................................................................................................................................... 32 3.3.4 Physical and mental health and related behaviours ................................................................................... 33 3.3.5 Family and early gambling influences and experiences ............................................................................. 33 3.3.6 Gambling help-seeking behaviour .............................................................................................................. 34 3.3.7 Socio-demographics ................................................................................................................................... 34
3.4 Analytical methods used the current study ................................................................................................. 34
CHAPTER FOUR: SIMILARITIES AND DIFFERENCES BETWEEN MALE AND FEMALE GAMBLERS IN VICTORIA ...................................................................................................... 38
4.1 Introduction ..................................................................................................................................................... 38
4.2 Differences between male and female gamblers in gambling participation ............................................. 38 4.2.1 Demographic differences in male and female gamblers ............................................................................ 39 4.4.2 Differences in age group of male and female gamblers and gambling participation .................................. 41
4.3 Differences between male and female gamblers in gambling frequency ................................................. 44
4.4 Differences between male and female gamblers in problem gambling .................................................... 46
4.5 Differences between male and female gamblers in gambling expenditure .............................................. 46
4.6 Differences between male and female gamblers in main gambling channel ............................................ 47
4.7 Differences between male and female gamblers in whom they gambled with ......................................... 48
4.8 Differences between male and female gamblers in number of gambling venues .................................... 49
4.9 Differences between male and female gamblers in specific questions for each gambling form ........... 49 4.9.1 EGMs ......................................................................................................................................................... 49 4.9.2 Horse/harness/greyhound racing ............................................................................................................... 50 4.9.3 Sports or events betting ............................................................................................................................. 50 4.9.4 Lotto/Powerball/Pools ................................................................................................................................. 51 4.9.5 Other gambling forms ................................................................................................................................. 51
4.10 Differences between male and female gamblers in money management for gambling on main activity ................................................................................................................................................................... 51
4.11 Differences between male and female gamblers in main reasons for gambling on highest spend activity ................................................................................................................................................................... 52
4.12 Differences between male and female gamblers in attitudes to gambling in Victoria ........................... 53
4.13 Differences between male and female gamblers in physical and mental health .................................... 53 4.13.1 Smoking ................................................................................................................................................... 53 4.13.2 Alcohol use (CAGE) ................................................................................................................................. 54 4.13.3 Drug use ................................................................................................................................................... 54 4.13.4 Physical and mental health ...................................................................................................................... 54

A comparative study of men and women gamblers in Victoria Hing, Russell, Tolchard & Nower
Victorian Responsible Gambling Foundation Page 5
4.14 Differences between male and female gamblers in family and early gambling influences and experiences ........................................................................................................................................................... 55
4.15 Differences between male and female gamblers in gambling help-seeking behaviour ........................ 56
CHAPTER FIVE: SIMILARITIES AND DIFFERENCES BETWEEN MALE AND FEMALE NON-‐PROBLEM AND AT-‐RISK GAMBLERS .......................................................................... 57
5.1 Introduction ..................................................................................................................................................... 57
5.2 Demographic factors associated with at-risk and non-problem gambling ............................................... 57 5.2.1 Age ............................................................................................................................................................. 57 5.2.2 Language spoken at home ......................................................................................................................... 58 5.2.3 Education ................................................................................................................................................... 58 5.2.4 Living arrangements ................................................................................................................................... 59 5.2.5 Employment ............................................................................................................................................... 60 5.2.6 Income ........................................................................................................................................................ 60
5.3 Gambling forms associated with at-risk and non-problem gambling ....................................................... 62 5.3.1 Gambling participation ................................................................................................................................ 62 5.3.2 Gambling frequency ................................................................................................................................... 63
5.4 Gambling behaviours associated with at-risk and non-problem gambling .............................................. 67 5.4.1 EGM behaviour .......................................................................................................................................... 67 5.4.2 Horse/harness/greyhound race betting behaviour ..................................................................................... 68 5.4.3 Expenditure on highest spending gambling activity ................................................................................... 69 5.4.4 Money management ................................................................................................................................... 70
5.5 Main reasons for gambling ............................................................................................................................ 71
5.6 Attitudes towards gambling in Victoria ........................................................................................................ 72
5.7 Substance use ................................................................................................................................................ 74
5.8 Mental and physical health ............................................................................................................................ 75 5.8.1 Mental health .............................................................................................................................................. 75 5.8.2 Physical health ........................................................................................................................................... 76
5.9 Multivariate analyses of risk and protective factors ................................................................................... 78 5.9.1 Females ...................................................................................................................................................... 79 5.9.2 Males .......................................................................................................................................................... 81 5.9.3 Comparison of models for females and males ........................................................................................... 81
CHAPTER SIX: DISCUSSION AND CONCLUSIONS ............................................................ 83
6.1 Introduction ..................................................................................................................................................... 83
6.2 Gender differences in gambling preferences, activities and styles of play .............................................. 83
6.3 Gender differences in gambling motivations ............................................................................................... 86
6.4 Gender differences in health ......................................................................................................................... 86

A comparative study of men and women gamblers in Victoria Hing, Russell, Tolchard & Nower
Victorian Responsible Gambling Foundation Page 6
6.5 Gender differences in family and early gambling influences and experiences ........................................ 87
6.6 Gender differences in gambling help-seeking ............................................................................................. 87
6.7 Gender differences in problem gambling ..................................................................................................... 88 6.7.1 Factors distinguishing male and female moderate risk/problem gamblers ................................................ 88 6.7.2 Factors distinguishing moderate risk/problem gamblers from non-problem/low risk gamblers by gender . 90
6.8 Limitations of the study ................................................................................................................................. 91
6.9 Conclusions and implications ....................................................................................................................... 92
REFERENCES ......................................................................................................................... 93
APPENDIX A: EXCERPT EXPLAINING STUDY METHODOLOGY AND SAMPLING DESIGN FROM A STUDY OF GAMBLING IN VICTORIA (HARE, 2009). ........................... 106
APPENDIX B: EXCERPT EXPLAINING METHODOLOGY USED FOR DATA WEIGHTING FROM AT STUDY OF GAMBLING IN VICTORIA (HARE, 2009) ......................................... 119
APPENDIX C: SURVEY INSTRUMENT FROM A STUDY OF GAMBLING IN VICTORIA (HARE, 2009) ......................................................................................................................... 129

A comparative study of men and women gamblers in Victoria Hing, Russell, Tolchard & Nower
Victorian Responsible Gambling Foundation Page 7
List of Tables
Table 4.1 Participation in gambling activities by gender ................................................................................. 39
Table 4.2 Demographic information by gender (gamblers only) ...................................................................... 40
Table 4.3a Gambling participation by gender by age ...................................................................................... 41
Table 4.3b Gambling participation by gender by age ...................................................................................... 43
Table 4.4 Spearman correlations for the relationship between age and participation in each form of gambling for each gender .............................................................................................................................................. 44
Table 4.5 Frequency of play for each gambling form by gender ...................................................................... 45
Table 4.6 Problem gambling by gender ........................................................................................................... 46
Table 4.7 Spend per annum on single highest-‐spend gambling activities by gender ........................................ 47
Table 4.8 Gambling channel by gambling form and by gender ........................................................................ 48
Table 4.9 Who the respondent prefers to gamble with by gender .................................................................. 48
Table 4.10 Number of venues gambled in over the last 12 months by form by gender .................................... 49
Table 4.11 EGM gambling behaviour by gender .............................................................................................. 50
Table 4.12 Horse/harness/greyhound betting behaviour by gender ............................................................... 50
Table 4.13 Lotto/Powerball/Pools gambling behaviour by gender .................................................................. 51
Table 4.14 Money management techniques by gender ................................................................................... 52
Table 4.15 Main reasons for gambling on highest spend activity by gender .................................................... 52
Table 4.16 Attitudes to gambling in Victoria by gender ................................................................................... 53
Table 4.17 Who moderate risk and problem gamblers started gambling with by gender ................................ 55
Table 4.18 Form on which moderate risk and problem gamblers first gambled by gender .............................. 55
Table 5.1 Percentage of non-‐problem and at risk gamblers in each age group by gender ................................ 58
Table 5.2 Percentage of non-‐problem and at risk gamblers who speak a language other than English at home by gender ....................................................................................................................................................... 58
Table 5.3 Percentage of non-‐problem and at risk gamblers by education by gender ....................................... 59

A comparative study of men and women gamblers in Victoria Hing, Russell, Tolchard & Nower
Victorian Responsible Gambling Foundation Page 8
Table 5.4 Percentage of non-‐problem and at risk gamblers in each household type by gender ....................... 59
Table 5.5 Percentage of non-‐problem and at risk gamblers by employment status by gender ........................ 60
Table 5.6 Percentage of non-‐problem and at risk gamblers by household income by gender .......................... 61
Table 5.7 Percentage of non-‐problem and at risk gamblers by personal income by gender ............................. 61
Table 5.8 Percentage of non-‐problem and at risk gamblers who engage in each form of gambling by gender . 62
Table 5.9 Percentage of non-‐problem and at risk gamblers who engage in each form of gambling by gender by frequency of betting ....................................................................................................................................... 65
Table 5.9 Percentage of non-‐problem and at risk gamblers who engage in each form of gambling by gender by frequency of betting (cont’d) .......................................................................................................................... 66
Table 5.10 Percentage of non-‐problem and at risk gamblers by number of venues at which they have played EGMs in the last 12 months by gender ........................................................................................................... 67
Table 5.11 Percentage of non-‐problem and at risk gamblers by how often they bet more than one credit per line on EGMs by gender .................................................................................................................................. 68
Table 5.12 Percentage of non-‐problem and at risk gamblers by denomination of EGM usually played by gender ........................................................................................................................................................... 68
Table 5.13 Percentage of non-‐problem and at risk gamblers by type of bet usually placed on horse/harness/greyhound races by gender .................................................................................................... 69
Table 5.14 Descriptive statistics for expenditure on single highest-‐spend gambling activity over past 12 months by problem gambler status by gender ............................................................................................... 69
Table 5.15 Percentage of non-‐problem and at risk gamblers type of cards taken to gambling venues by gender ...................................................................................................................................................................... 70
Table 5.16 Percentage of non-‐problem and at risk gamblers by amount of money brought to gambling over past 12 months by gender .............................................................................................................................. 70
Table 5.17 Percentage of non-‐problem and at risk gamblers by number of times during a single gambling session they would access extra money (e.g. through ATM, credit card) by gender ........................................ 71
Table 5.18 Percentage of non-‐problem and at risk gamblers by main reasons for gambling by gender ........... 72
Table 5.19 Percentage of non-‐problem and at risk gamblers by attitudes to gambling in Victoria by gender .. 72
Table 5.20 Percentage of non-‐problem and at risk gamblers by past (last 12 months) and current smoking status by gender ............................................................................................................................................. 74
Table 5.21 Percentage of non-‐problem and at risk gamblers by level of alcohol abuse by gender ................... 75

A comparative study of men and women gamblers in Victoria Hing, Russell, Tolchard & Nower
Victorian Responsible Gambling Foundation Page 9
Table 5.22 Descriptive statistics for alcohol abuse by problem gambler status by gender ............................... 75
Table 5.23 Percentage of non-‐problem and at risk gamblers by mental health status (Kessler 10) by gender .. 76
Table 5.24 Percentage of non-‐problem and at risk gamblers by past experiences of trauma or hardship by gender ........................................................................................................................................................... 76
Table 5.25 Percentage of non-‐problem and at risk gamblers by current status of physical health issues by gender ........................................................................................................................................................... 77
Table 5.26 Results for the predictors in the multivariate analysis for females ................................................. 80
Table 5.27 Results for the predictors in the multivariate analysis for males .................................................... 82

A comparative study of men and women gamblers in Victoria Hing, Russell, Tolchard & Nower
Victorian Responsible Gambling Foundation Page 10
Executive Summary
Research objectives This study was funded by the Victorian Responsible Gambling Foundation to extend the analyses conducted for A Study of Gambling in Victoria (Hare, 2009) to provide detailed analyses of similarities and differences between male and female gamblers in Victoria Australia. The research objectives were to:
1. Analyse the similarities and differences between male and female gamblers in Victoria in terms of gambling preferences, activities and styles of play; gambling motivations and attitudes; physical and mental health; family and early gambling influences; and help-seeking behaviour; and
2. Analyse the similarities and differences between male and female gamblers in Victoria in terms of risk factors associated with problem/moderate risk gambling and protective factors associated with low risk/non-problem gambling.
Approach A Study of Gambling in Victoria (Hare, 2009) is the largest study of gambling in Victoria ever undertaken. It was conducted between August and October 2008 and collected data from 15,000 participants using Computer Aided Telephone Interviewing (CATI). The sample was stratified to reflect the adult population of each of the eight government regions across Victoria, with high EGM expenditure areas over-sampled to ensure the sample captured likely problem gamblers. The survey data were then weighted to ensure that the sample was as closely aligned to the Victorian adult population as possible. This included weighting adjustments to reflect the method of sampling, number of adults and telephone lines per household and other general Victorian population characteristics. These weights were also used in all analyses conducted for the present study.
To address Research Objective One, differences in percentages for males and females were assessed using chi-square tests of independence and pairwise comparisons, while differences in continuous variables were tested using parametric (t-tests) and non-parametric (Mann-Whitney U-test) analyses. Interactions were tested using logistic regressions and ANOVAs as appropriate. To address Research Objective Two, moderate risk/problem gamblers were compared to low risk/non-problem gamblers, with separate comparisons for males and females.
Main results for Objective One Male gambling participation was highest for lottery-type games, raffles/sweeps/competitions,
EGMs, race wagering, table games, sports betting and informal private betting, respectively. Compared to female gamblers, higher proportions of men gambled on most of these gambling forms as well as on keno, although they were less likely than women to gamble on raffle/sweeps/competitions and bingo.

A comparative study of men and women gamblers in Victoria Hing, Russell, Tolchard & Nower
Victorian Responsible Gambling Foundation Page 11
Males tended to gamble more frequently than females on most gambling forms, including informal private betting, EGMs, table games, race and sports wagering, lottery-type games, scratch tickets, and raffles/sweeps/other competitions.
Younger men were significantly more likely than older men to take part in informal private betting, EGMs, table games, race wagering, sports betting, scratch tickets and phone/SMS competitions. Older male gamblers were more likely than younger male gamblers to engage in lottery type games and raffles/sweeps/other competitions.
Amongst female gamblers, lottery-type games and raffles/sweeps/competitions, followed by EGMs and race wagering, attracted highest participation. Women were significantly less likely than men to gamble on other skill-based gambling activities but were more likely to participate in scratch tickets, bingo, phone/SMS competitions and raffles/sweeps/competitions.
Younger women were more likely than older women to participate in informal private betting, table games, race wagering, sports betting, scratch tickets and phone/SMS competitions. Older women were more likely than younger women to take part in lottery-type games and raffles/sweeps/other competitions, and also in bingo.
Participation in skill-based activities amongst younger women was less than for younger male gamblers, but proportionately more younger women participated in scratch tickets and phone/SMS competitions compared to younger men.
Notably, older female gamblers were more likely to take part in EGM gambling, while the opposite was true for males.
Men spent significantly more money than women in the past 12 months on their highest-spend gambling activity.
Males were significantly more likely than females to play higher denomination EGMs and to bet more than one credit per line. For race wagering, women were more likely to bet each way and men were more likely to bet on trifectas and other more exotic types of bets.
More than half the female gamblers reported not taking any bank cards to gambling, while males were significantly more likely to take a credit card or both credit and ATM/EFTPOS cards. Men also had greater tendency to take larger amounts of cash to gambling venues and to withdraw money for gambling purposes compared to women.
Men were significantly more likely than women to gamble for social reasons or for general entertainment, while women were more likely to gamble for charity or other reasons, including because gambling takes your mind off things and relieves stress and boredom.
Higher proportions of male gamblers reported substance use than female gamblers, including smoking, alcohol consumption and using marijuana/hashish.
Female gamblers were more likely to report depression, anxiety and obesity and to exhibit a significantly higher level of psychological distress, compared to male gamblers.
Male moderate risk and problem gamblers started gambling at a significantly younger age than their female counterparts and were more likely to start gambling alone. EGMs and other forms were the most common first gambling form for female moderate risk and problem gamblers, compared to race wagering, table games or informal private betting for their male counterparts.

A comparative study of men and women gamblers in Victoria Hing, Russell, Tolchard & Nower
Victorian Responsible Gambling Foundation Page 12
A significantly higher proportion of female problem gamblers (40.5%) reported seeking help for their gambling compared to 18.1% of male problem gamblers.
Main results for Objective Two Male gamblers were significantly more likely to have had some level of problem gambling both at
some point in their life and during the last 12 months, compared to female gamblers. Lifetime prevalence of problem/pathological gambling was 3.2% for men, which was double the rate for women (1.6%). Past year prevalence of problem gambling amongst gamblers was 1.3% for men which was also double the rate for women (0.6%).
Younger men were more likely to be moderate risk/problem gamblers compared to younger women, while older women were more likely to be low risk/non-problem gamblers compared to older men.
Amongst males, those in in part-time employment were significantly more likely to be in the higher risk PGSI categories, while the opposite was found for men in full-time employment. Amongst women, those who were unemployed were more likely to be moderate risk/problem gamblers.
EGM participation and frequency were significantly more problematic for females than for males, while table games and race wagering were more problematic for men. Sports betting may also be more problematic for men.
Statistically significant predictors of at-risk gambling status amongst male Victorian gamblers were: being 18-24 years old (compared to being 65 or older), speaking a language other than English at home, having Year 10 or lower education (compared to those with university level education or those who have completed Year 12), living in a group household (compared to being a couple with children), being unemployed or not at work (compared to full-time employment), betting on EGMs, table games, horse/harness/greyhound racing, sports or events outcomes, or Lotto/Powerball/Pools (compared to not betting on those forms), not betting on raffles, sweeps and other competitions (compared to betting on them), and gambling for reasons other than social reasons, to win money or for general entertainment .
Statistically significant predictors of at-risk gambling status amongst female Victorian gamblers were: being 18-24 years old (compared to being 65 or older), speaking a language other than English at home, living in a group household (compared to being a couple with children), being unemployed or not in the workforce (compared to both full-time and part-time employment), betting on informal private betting, EGMs, scratch tickets or bingo (compared to not betting on those forms), not betting on raffles, sweeps and other competitions (compared to betting on them), an gambling for reasons other than social reasons, to win money or for general entertainment.
While there were few differences between risk factors for men and for women, analysis of which predictors were significantly different for women and for men indicated that being aged 45-54 years and betting on informal private betting, EGMs and scratch tickets were comparatively stronger predictors for women, while having a university education, being unemployed, and betting on table games, races and lottery-type games were comparatively stronger predictors for men.
Protective factors associated with low risk/non-problem gambling were also nearly identical for men and women, which is not surprising given they are essentially the reverse of identified risk

A comparative study of men and women gamblers in Victoria Hing, Russell, Tolchard & Nower
Victorian Responsible Gambling Foundation Page 13
factors. Amongst both males and females, being aged 65 years or older, speaking English at home, being in full-time or part-time employment, betting on raffles, sweeps and other competitions, and gambling for social reasons, to win money or for general entertainment were statistically significant predictors of low risk/non-problem gambling. A further protective factor for males was having a Year 12 or university education.
Limitations of the study The main limitations of the dataset that hindered certain analyses were: 1) relatively small numbers of problem gamblers, necessitating the combining of moderate risk and problem gambler groups to analyse risk factors for problem gambling; 2) that several potential risk factors were only asked of moderate risk and problem gamblers which limited comparisons that could be conducted amongst PGSI groups (perceived gambling problems, gambling in households, families and relationships, how people started gambling, gambling help and awareness of gambling help, overcoming problem gambling, role of significant others, readiness to change, and suicide, substance use and crime); 3) a non-validated version of the PGSI was used to measure problem gambling severity and it is not known how this affected PGSI results and assignment of respondents to PGSI groups; 4) most other measures used in the survey have also not been validated, so it is difficult to assess whether related findings reflect true differences or measurement artefacts; and 5) sample sizes were quite different across the analyses (which were thus associated with different levels of statistical power). Where numbers are small, some results may be unlikely to generalise or replicate..
Conclusions and Implications This study has largely confirmed findings from previous gender analyses of gambling and problem gambling, but in a large representative sample. Major differences in gambling preferences were found amongst men and women. These differences manifest as higher male gambling involvement in most forms, particularly skill-based gambling, and greater risk-taking behaviours, along with higher rates of problem gambling. Women show a preference for chance-based gambling forms, which may be driven by the capacity of EGM gambling in particular to provide an escape from stress, loneliness, boredom and their higher rates of anxiety and depression. While problem gambling prevalence is lower amongst women, their gambling problems are largely related to EGM gambling.
Analysing risk factors for problem gambling allows high-risk groups to be identified and appropriately targeted for early intervention and prevention. The results of this study indicate that the primary targets for public health interventions in Victoria comprise young adults, especially males; older women who play EGMs; non-English speaking populations; frequent gamblers on EGMs, table games, race and sport wagering; and gamblers motivated by escape-based reasons.

A comparative study of men and women gamblers in Victoria Hing, Russell, Tolchard & Nower
Victorian Responsible Gambling Foundation Page 14
Chapter One: Background to the Study
1.1 Introduction The Australian and international research literature is reasonably conclusive on a number of aspects of gambling by men and women. Studies in Western countries have generally found that women gamble as frequently as men, although there are distinctive product preferences; women generally prefer electronic gaming machines (EGMs), bingo and lotteries, while some gambling activities such as table games, wagering and sports betting clearly attract more men (Delfabbro, King, & Griffiths, 2013; Hing, Gainsbury et al., 2014; Hing & Breen, 2001a, 2001b; Oldlaug, Marsh, Kim & Grant, 2011; Productivity Commission, 2010; Volberg, 2003). Research also supports some gender differences in gambling motivations, with women often gambling for escape or avoidance-based reasons and men more attracted to risk, competition and a chance to win (Grant & Kim, 2002; Lloyd et al., 2010; Sacco, Torres, Cunningham-Williams, Woods, & Unick, 2011; Walker, Hinch, & Weighill, 2005). Although the prevalence of gambling problems in men is higher, women are quickly catching up and tend to experience problems almost exclusively with EGMs (Holdsworth, Hing & Breen, 2012; Productivity Commission, 2010).
However, the Australian and international research literature is inconclusive on risk and protective factors in gambling (Delfabbro, 2012; Johansson, Grant, Kim, Odlaug & Götestam, 2009). While numerous studies have identified particular correlates with problem gambling, these analyses have been criticised for failing to use multivariate techniques that account for statistical overlap between factors (Delfabbro, 2009; Productivity Commission, 2010). Similarly, while the gambling literature has identified some similarities and differences in risk and protective factors influencing men’s and women’s gambling, little sophisticated modelling has been conducted to provide an accurate picture of salient variables, including in Victoria.
A Study of Gambling in Victoria (Hare, 2009) is the largest study of gambling in the Australian state of Victoria ever undertaken. It was conducted between August and October 2008 and collected data from 15,000 participants using Computer Aided Telephone Interviewing (CATI). The size and representativeness of the sample make it an ideal dataset on which to base a gender comparison of gambling behaviour and risk and protective factors. While the research report for that study provided numerous insights into the prevalence, distribution and determinants of problem gambling in Victoria, gender comparisons were limited to the variables measuring gambling preferences, activities and some aspects of styles of play. No gender comparisons were conducted in relation to gambling motivations and attitudes; physical and mental health; family and early gambling influences; and help-seeking behaviour. Additionally, no multivariate analyses of risk and protective factors for men and for women were undertaken. Thus, this current research study was funded by the Victorian Responsible Gambling Foundation to extend the analyses conducted for A Study of Gambling in Victoria (Hare, 2009) to provide detailed analyses of similarities and differences between male and female gamblers in Victoria.

A comparative study of men and women gamblers in Victoria Hing, Russell, Tolchard & Nower
Victorian Responsible Gambling Foundation Page 15
1.2 Research objectives The research objectives for this study were based on Questions of Interest defined by the Victorian Department of Justice (DoJ) in its call for grant proposals. The DoJ Questions of Interest of relevance to this study were:
What is the relationship between gambling products, demographic characteristics (e.g. age, gender) and attitudes to gambling and the risk of problem gambling?
What gambling products do men/women prefer, and why do they prefer those products?
What are the similarities and differences in gambling activity, styles of play, motivations and mental health profile of male and female gamblers and problem gamblers?
Based on these Questions of Interest and the variables contained in the available dataset, the objectives of the current study were to:
1. Analyse the similarities and differences between male and female gamblers in Victoria in terms of gambling preferences, activities and styles of play; gambling motivations and attitudes; physical and mental health; family and early gambling influences; and help-seeking behaviour.
2. Analyse the similarities and differences between male and female gamblers in Victoria in terms of risk factors associated with problem/moderate risk gambling and protective factors associated with low risk/non-problem gambling.
1.3 Report structure This report is structured into six chapters. Chapter Two reviews literature that contextualises the current study. While a literature review usually justifies the research plan and its objectives based on gaps in important knowledge, the main driver of the research plan and objectives for this study was the DoJ Questions of Interest which are of policy relevance to DoJ. These policy interests do not necessarily align with gaps in the literature. Thus, while Chapter Two attempts to justify the focus of the study based on deficiencies in the knowledge base, it does not suggest that all variables examined in this study are of equal importance to theory development to explain gender patterns, similarities and differences in gambling. Chapter Three explains the research methods and relevant measures utilised for the original study and analytical methods used in the current study. Because these methods are explained in detail in the original report for A Study of Gambling in Victoria (Hare, 2009), readers are sometimes referred to excerpts from that report contained in the Appendices instead of repeating some finer details in the current report. Chapter Four presents results of the first research objective, while Chapter Five presents results for the second research objective. Chapter Six summarises the study’s findings and discusses them in relation to the research objectives and the extant literature.
1.4 Terminology Various terms are used in the literature to describe problematic gambling behaviour, including problem gambling, disordered gambling and pathological gambling. Where previous research is cited, this report uses terms consistent with usage by the original researchers. Where describing the current

A comparative study of men and women gamblers in Victoria Hing, Russell, Tolchard & Nower
Victorian Responsible Gambling Foundation Page 16
study and its results, the terms adhere to the measures used (e.g., problem gambler to refer to those scoring 8+ on the PGSI; pathological gambler for those scoring 5+ on the NODS-CLiP2). In more general discussion, the report mainly uses the term problem gambling to adhere to its common usage in Australia to describe gambling characterised by difficulties in limiting money and/or time spent on gambling which leads to adverse consequences for the gambler, others, or for the community (Neal, Delfabbro & O’Neil, 2005).

A comparative study of men and women gamblers in Victoria Hing, Russell, Tolchard & Nower
Victorian Responsible Gambling Foundation Page 17
Chapter Two: Literature Review
2.1 Introduction This chapter provides a review of theory and literature on gender differences in gambling. Relatively few studies have focused specifically on gender differences in recreational gambling, although distinct gendered gambling preferences have been identified from prevalence and other population studies. While other factors may in part play a role in recreational gambling behaviour, there is evidence to suggest gender alone may account for certain variability. More research has focused on problem gambling amongst men and women, highlighting differences in demographic profiles of male and female problem gamblers and in the aetiology of problem gambling, as well as variations in mental health profiles and help-seeking behaviours. However, gambling research, it has been argued, has traditionally been gender blind, and our understanding of women gamblers in particular has been assessed as (Li, 2007; Svensson, Romild, Nordenmark & Månsdotter, 2011). While gambling has traditionally been viewed as a largely male pursuit, the rapid rise in the availability of EGMs over the last few decades has seen this view challenged, with the majority of studies reporting similar gambling participation rates for men and women (Delfabbro, 2012). Thus, a contemporary understanding of both men’s and women’s gambling is important for gambling policy, public health, problem gambling treatment, and research.
2.2 Theoretical underpinning of gender differences in gambling
From a review of Australasian gambling research, Delfabbro (2012) postulates a number of theories that may help explain possible gender differences in gambling. One, gender role theory suggests women are less attracted to gambling due to a perception of having a traditional nurturing role. They may therefore consider gambling to be a waste of family resources. This view was supported in a qualitative study conducted in Israel (Gavriel-Fried & Ajzenstadt, 2012). However, the evidence generally no longer appears to support this theory as women appear to be gambling in similar proportions to men. Delfabbro (2012) therefore proposes a second argument in which gender differences exist due to specific venue factors. This theory suggests that certain venues are avoided by women due to their perceived unattractiveness and in order to prevent unwanted attention. Again, while this may have been true many years ago, modern venues and in particular online gambling tries to appeal to a wide variety of people including women (Corney & Davis, 2010). In a recent study of Internet gambling, anonymity was considered a factor in female gambling with some women considering traditional venues to be overly masculine (McCormack & Griffiths, 2012). In another study of college aged gamblers, men were more familiar with the gambling venue and so it was argued were prepared to take more risks than women in the same venue (Wong, Zane, Saw & Chan, 2013). However, in an Australian study both men and women considered EGM venues equally accessible (Moore, Thomas, Kyrios, Bates & Meredyth, 2011). Activity preference is proposed as the best possible explanation of gender differences in gambling, possibly arising from early gender role socialisation. Here, Delfabbro (2012) argues that, at a very early age, men and women establish different preferences for games. This view suggests preferences established in childhood continue into adulthood and explain why male gamblers tend to prefer skill based games and female gamblers non-skill based games. This is supported in a study of fantasy sports players where gender role

A comparative study of men and women gamblers in Victoria Hing, Russell, Tolchard & Nower
Victorian Responsible Gambling Foundation Page 18
socialisation influenced female players to not play (Lee, Kwak, Lim, Pedersen,& Miloch, 2011). A recent argument suggests there has been a feminisation of gambling which has resulted in more men gambling on less skilled-based games such as slot machines (Svensson et al., 2011). However, of course, no single explanation can be applied to gender differences as many women play cards and men slot machines.
Further to these theories, motivation is also considered a driving force behind differences in male and female gambling (Corney & Davis, 2010). Researchers have suggested that men see gambling as a means to prove themselves as skilful players or as an attempt to become wealthy from their wins. In contrast, women may be more motivated by intra-psychic motivators such as relieving or escaping from negative emotional states (Corney & Davis, 2010; Holdsworth, Nuske & Breen, 2012). In one study of elderly women, the principal motivators to go to a casino were generally for non-gambling reasons such as the entertainment (Tarras, Singh & Moufakkir, 2012). However, amongst the elderly women who gambled, escape was a primary motivator. A recent study of Internet gamblers noted female gamblers identified boredom as a primary motivator (McCormack, Shorter & Griffiths, 2014). A study of regular horse and slot machine gamblers found that male horse gamblers differed in their motivations to gamble which were for excitement and reward; in contrast, female slot machine players were generally responding to escape from emotional distress, again providing support for different motivators between male and female gamblers (Balodis, Thomas & Moore, 2014). Among casino gamblers, differences in motivations were found to include higher risk taking with learning/cognitive self-classification being more important for male gamblers than female gamblers. Again, escape was seen as the primary motivator for female gamblers (Walker et al., 2005). This emotional distress may also be a consequence of women’s gambling rather than a reason to start gambling (Holdsworth, Hing & Breen, 2012).
2.3 Gambling participation, preferences and behaviours 2.3.1 Gambling participation
Numerous population level surveys of gambling participation have been conducted. A few of these surveys have either tracked gambling behaviour using the same respondents in longitudinal designs or have formed part of regular household studies completed every few years, but not necessarily matching individuals across surveys. More commonly national, state and specific jurisdictional prevalence survey are conducted to provide snap shots of gambling participation. All provide at least basic breakdowns of gambling by gender.
One household survey of the Queensland populous has tracked gambling trends every few years since 2001. All surveys have used the Problem Gambling Severity Index (PGSI) as a measure of problem gambling. While there has been no attempt to match individuals, the surveys provide very clear patterns of gambling and changes over time. In 2001 over 13,000 people were surveyed. Male and female non-gamblers differed from the general population, where male non-gamblers were over-represented compared to the general population and female non-gamblers were under-represented. The gender mix for both male and female non-problem and low-risk gamblers matched that of the general population. Significant changes in gender mix emerge once a reasonable level of harm is related to gambling. Males were significantly over-represented amongst PGSI moderate-risk gamblers (75%) compared to their proportion in the Queensland population (49.8%). Quite the opposite was true of females, who made up 25% of the moderate-risk gamblers compared to 50.2% of the Queensland population. This figure remained similar for problem gamblers (Queensland Government,

A comparative study of men and women gamblers in Victoria Hing, Russell, Tolchard & Nower
Victorian Responsible Gambling Foundation Page 19
2001). Similar findings were present in the 2003 survey of 30,000 people (Queensland Government, 2004). However, of note is that the proportion of female at-risk gamblers (moderate risk and problem) was higher than in the previous survey, a trend which continued into all surveys thereafter (Queensland Government, 2008, 2010, 2012). Generally, female gamblers began to show a rise in participation over the period of these surveys, although men still have higher participation rates than women. Similar levels of participation were noted in a large longitudinal survey of gamblers in Sweden (Romild, Volberg & Abbott, 2014). A study of gamblers in Macao provided further evidence that there is greater participation in gambling by males compared to females (Fong & Ozorio, 2005).
In a longitudinal investigation over four time points of adolescent gambling in South Australia, men’s participation rates in gambling were about 8% to 10% higher than women’s (Delfabbro et al., 2013). This study found women were more likely to participate in scratch tickets, although this difference was not significant, and that keno was more popular among males. At Time 1 (ages 16-19), males were more than twice as likely as females to participate in card play but, by the final wave of the study, they were seven times more likely. Males had higher participation levels in sports betting at all-time points, although participation increased steadily over time for females also. For casino games, both males and females had similar participation rates at Time 1, but, by Time 3 (ages 19-22) and 4 (ages 20-23), male rates were nine times the rates for females. Similarly, a study of recreational gamblers conducted in the United States of America (US) found that males (66.8%) had greater participation than females (59.3%). This study noted that, compared to non-gamblers, female past-year recreational gamblers tended to be Caucasian, have higher levels of education, and be employed full-time. On the other hand, compared to non-gamblers, male past-year gamblers were better educated, not in a relationship, employed and also earning a liveable wage (Potenza, Maciejewski & Mazure, 2006).
Similar findings have been reported in a number of population studies including in South Africa (Dellis, Spurrett, Hofmeyr, Sharp & Ross, 2012), Europe (Romild et al., 2014; Sassen et al., 2011; Svensson & Romild, 2014), South Korea (Williams, Lee & Back, 2013), Australia and New Zealand (Tu, Gray & Walton, 2014; Worthington, Brown, Crawford, & Pickernell, 2007). However, one study noted no differences by gender in terms of overall involvement (Afifi, LaPlante, Taillieu, Dowd & Shaffer, 2014). While the evidence is mixed, additional analyses are necessary to further understand gender differences in gambling participation.
2.3.2 Gambling preferences In general, men prefer strategic forms of gambling (blackjack, cards, sports betting, race wagering), whereas women prefer non-strategic forms such as slot machines, video poker, and bingo (Hing & Breen, 2001b; Grant & Kim, 2002; Oldlaug et al., 2011; Potenza et al., 2001). In an analysis of data from a prevalence survey in the Northern Territory, Australia, male gamblers were found to be two times more likely than female gamblers to play high skill games (Stevens & Young, 2010). In a small cross sectional study of 303 participants, male gamblers were significantly more likely to gamble on skill-based games, but no differences were found between genders on unskilled games (Thomas et al., 2010). A cross sectional study in the United Kingdom (UK) showed women had a higher preference for bingo over male gamblers (Casey, 2006). Non-strategic gamblers were significantly more likely to be older and female (Odlaug et al., 2011; Stevens & Young, 2010). In a household survey conducted in Queensland, female gamblers preferred lottery and bingo more than male gamblers, although men were more likely than females to prefer all other forms of gambling (Queensland Government, 2012), a finding similar to that of a recent New South Wales prevalence survey (Sproston, Hing & Palankay, 2012). A study of 975 Internet gamblers (175 female) confirmed females were much more likely to prefer non-strategic online games such as bingo and slot machines

A comparative study of men and women gamblers in Victoria Hing, Russell, Tolchard & Nower
Victorian Responsible Gambling Foundation Page 20
(McCormack et al., 2014). In Germany, analysis of the Epidemiological Survey of Substance Abuse (ESA) of 8,006 adults found the only significantly higher preference among female gamblers was with scratch tickets. All other forms of gambling were significantly more likely to be played by men (Sassen et al., 2011). However, two studies in Spain found that men had a preference for slots (Echeburua, Gonzalez-Ortega, deCorral & Polo-Lopez, 2011; Granero et al., 2009), suggesting that jurisdictional differences may play a role in gambling preferences. However, both studies examined treatment-seeking gamblers and only contained small samples. A review of gambling in Europe noted the majority of treatment-seeking gamblers were slot machine players (75% of Spanish treatment-seeking gamblers) (Griffiths, 2009). Larger population samples from Spain may reveal different results between male and female gamblers. In a study of 5,313 adolescent gamblers, at non-problem levels of gambling, males showed a higher preference than females for all gambling forms. However, with the exception of sports betting, which continues to be preferred by male gamblers over female gamblers, these differences largely disappear once adolescents begin to develop gambling problems. While there were similar preferences, male adolescent gamblers continued to participate at higher levels than their female counterparts (Ellenbogen, Derevensky & Gupta, 2007).
In order to test whether there are specific preferential differences between male and female gamblers, it will be necessary to determine whether jurisdictional differences play a role. It should be noted that gender dependent relationships for gambling participation and preference do not necessarily lead to gender differences in gambling problems (Hodgins et al., 2012).
2.3.3 Gambling behaviours In a study of 400 treatment-seeking gamblers, Oldlaug et al. (2011) reported that frequency of gambling, money spent gambling, gambling severity and comorbid disorders did not vary significantly between male and female gamblers. An analysis of prevalence surveys in New Zealand and Sweden found that male gamblers spent twice as much as female gamblers (Abbott, Volberg & Rönnberg, 2004). In the US, a study of recreational gamblers, drawn from a national household survey, found males gambled more often, spending larger amounts of money at each session of play (Potenza et al., 2006). However, these data are drawn from a survey carried out some years ago and changes in gambling since then may produce different findings.
In Australia, clubs are popular venues for gambling by both men and women. A cross sectional study of 127 adult club gamblers in Queensland found participants spent an average of $71 per session, although problem gamblers spent an average of $185 per occasion and played an average of seven times per month (Nower & Blaszczynski, 2010). In that study, females spent more money per session than males ($92.14 vs. $62.05) but played slightly less per month (3.46 vs. 4.45 times). However, these findings were statistically non-significant, suggesting that profiles of gamblers in these clubs could be relatively unaffected by gender differences (Nower & Blaszczynski, 2010). The 2012 Queensland Household Gambling Survey found that male gamblers played more frequently than female gamblers, but did not measure gambling expenditure (Queensland Government, 2012). Using a net win/loss approach, the UK national prevalence survey found differences in expenditure by gender, with men losing more on the lottery (£1.81 vs. £1.33) and women winning more on bingo (£2.75 win vs. £3.32 loss) (Wardle at al., 2007). Overall, male gamblers spent more on all forms of gambling compared to female gamblers. Male gamblers were also more likely to report spending more than usual in the week prior to being surveyed than female gamblers (Wardle at al., 2007). However, a study of 303 gamblers examining self-regulation in gambling found that male gamblers were more likely to apply limit setting and distractive strategies in order to control their gambling than were female gamblers (Moore, Thomas, Kyrios & Bates, 2012). Comparing bet sizes, one study of a simulated gambling task found female gamblers placed more bets than male gamblers (Rockloff & Hing, 2012).
A comparative study of men and women gamblers in Victoria Hing, Russell, Tolchard & Nower
Victorian Responsible Gambling Foundation Page 21
On the other hand, when examining casino gambling, women have been found to gamble for lower stakes than male gamblers (Zimmerman, 2011).
The growing availability of the Internet has provided another medium for gambling, dominated primarily by male gamblers (McCormack et al., 2014). In a large-scale international survey of Internet gamblers, 78% were male, with a higher yearly and weekly involvement than females in almost every kind of gambling, particularly sports betting, betting on horse or dog races, and betting on games of skill like poker (Wood & Williams, 2011). An Australian study found that Internet gamblers were more likely to be male, employed full time, and have higher incomes than non-Internet gamblers (Gainsbury, Wood, Russell, Hing & Blaszczynski, 2012). The main advantages of Internet gambling reported in this and another Australian study were convenience, accessibility, greater physical comfort, privacy and anonymity (Hing, Gainsbury et al., 2014).
While evidence exists to suggest male and female gamblers differ in terms of gambling preference, activities and style of play, it has been argued these differences are more complex and often relate to personal demographic, economic and health factors (LaPlante, Nelson, LaBrie & Shaffer, 2006; Shaffer & Martin, 2011). The current study tests the validity of these claims and determines whether gender does in fact play a significant role in gambling preferences, activities and styles of play amongst Victorian gamblers when socio-demographic and selected health factors are taken into consideration. The gambling-related variables used to inform this analysis include: gambling participation, frequency and access channels used in the past 12 months, details of preferred gambling activity in the past 12 months, venues and other gambling details in the past 12 months, and money management for gambling on highest spend activity in past 12 months.
2.4 Theoretical underpinnings and aetiology of gambling harm and risk
A number of harm/risk factors have been associated with problem gambling. Many of these factors have similar relationships regardless of gender. However, some risk factors have clear gender differences. These differences can be broken down into genetic, environmental and psychological/behavioural factors (Williams, West & Simpson, 2007, 2012). The aetiology of problem gambling, likewise, results from the interplay of a complex array of factors that are rooted in childhood or adolescence and evolve over the life course.
2.4.1 Genetic risk A number of studies have implicated clear genetic components to problem gambling. Whether gender differences are due to these differences has not been shown to be conclusive. However, evidence suggests that, in women only, the dopamine receptor system is less efficient in problem versus non-problem gamblers (Ibáñez, Blanco, de Castro, Fernandez-Piqueras & Sáiz-Ruiz, 2003). Dopamine is the neurotransmitter associated with the reward system in the brain, and therefore any alteration of this chemical could clearly influence decision-making in gamblers (Joutsa et al., 2012). A recent twin study of male and female gamblers determined that genetic factors contributed 85% of the variance in male problem gamblers but none of the variance in female problem gamblers (Beaver et al., 2010). This study found that specific environmental factors were much more likely to contribute to female problem gambling. Similar findings emerged from an Australian study (Slutske, Ellingson, Richmond-Rakerd, Zhu & Martin, 2013). Therefore, there is some evidence that genetic transmission is related to

A comparative study of men and women gamblers in Victoria Hing, Russell, Tolchard & Nower
Victorian Responsible Gambling Foundation Page 22
male but not to female gamblers, though another twin study found no qualitative or quantitative evidence of gender differences (Slutske, Zhu, Meier, & Martin, 2010) . These findings, although clearly not dispositive, may suggest that differences in the aetiology of problem gambling by gender are more related to psycho-social factors than to biology.
2.4.2 Environmental risk (social, family, community) Having a family member who is a problem gambler has been shown to be a clear risk for future problem gambling (Dowling, Jackson, Thomas & Freydenberg, 2010; Winters, Stinchfield & Kim, 2002; Wardle et al., 2007). Five family-related domains are implicated in adolescent and future adult gambling. They are family socio-demographic factors, general family climate, family members’ attitudes and behaviours, parenting practices, and family relationship characteristics (McComb & Sabiston, 2010). A family history of gambling combined with excessive negative emotions in males was found to predict time spent and problems with gambling amongst US college students (King, Abrams & Wilkinson, 2010). In children, while factors such as low anxiety and high impulsivity predicted gambling in boys, having a family member gamble increased the risk for both boys and girls equally (Vitaro & Wanner, 2011). This appears to translate into adolescence, where male gamblers compared to male non-gamblers had greater conflict in their family. Female gamblers compared to female non-gamblers did not have a clear link with family influences other than where they were considered rule breakers (Casey et al., 2011). Also, it has been suggested family disharmony may play a role in problem gambling among adolescent females, whereas males are more likely to be influenced by their peer group (Donati, Chiesi & Primi, 2013). In Spain, family support was linked to problem gambling in women (González-Ortega, Echeburúa, Corral, Polo-López & Alberich, 2012). Trans-generational relationships have also been established between grandparents and grandchildren. One study found this relationship favoured male grandchildren and was stronger than if a parent was a gambler (Lang & Randall, 2013).
Social environmental risks may include peer groups, work environment and community influences. Younger males are particularly influenced by peer groups, (Donati et al., 2013; Hodgins et al., 2012). likely due to modelling and social reinforcement effects (Lussier, Derevensky, Gupta & Vitaro, 2013). Working in a gambling environment is also linked to problem gambling among employees, especially males (Hing & Gainsbury, 2011; Wong & Lam, 2013).
2.4.3 Psychological/behavioural risk Several theories have been posited explaining the psychological processes involved in developing gambling problems and vulnerabilities. The two dominant theories centre on a general model of addictions (Jacobs, 1986) or learning through conditioning (Brown, 1987). While many have argued that conditioning theories are the main framework for the development of gambling problems, especially with forms of gambling such as slot machines, the fact that not all gamblers develop gambling problems would suggest there is a more complex process involved (Williams, West et al., 2007, 2012). The general theory of addictions described by Jacobs (1986) argues that there are vulnerabilities all people possess that could influence future problem gambling. They include physiological (under/over arousal) and psychological (low self-esteem, mood disturbances) vulnerabilities and these are overlayed with environmental experiences (childhood abuse and trauma) (Gupta & Derevensky, 1998; Hodgins et al., 2010). A number of studies have supported this view but few have done so by testing all elements of Jacobs’s model together, instead examining individual parts. A recent Australian study found that higher levels of psychological distress predicted vulnerability in recreational gamblers to develop a problem and to a lesser extent physiological

A comparative study of men and women gamblers in Victoria Hing, Russell, Tolchard & Nower
Victorian Responsible Gambling Foundation Page 23
dissociative states were also linked (McCormick, Delfabbro & Denson, 2012). However, this paper suggests the evidence to support the physiological aspect of Jacob’s model was weaker and associated more with substance use than gambling.
Conditioning theories of gambling stress the relationships between positively reinforced outcomes such as winning with negatively reinforced behaviours, often escape (Redish, Jensen, Johnson & Kurth-Nelson, 2007). The basic premise of gambling conditioning is that a positive reinforcer, in this case money, leads to excitement and arousal (urge). With more play, the gambler then begins to experience the same feelings to other stimuli associated with gambling (e.g., mood states). This secondary response is then triggered by occasional wins (Sodano & Wulfert, 2010).
Impulsivity and sensation seeking in the form of risk taking are two additional aetiological factors that appear early in life and predispose youth, particularly males, to gambling problems. Several studies have validated the relationship of impulsivity to gambling in young children and adolescents. A population study of 1,125 six to eight-year-olds showed that teacher-rated impulsivity predicted early gambling for both genders (Vitaro & Wanner, 2011). Chambers and Potenza (2003) proposed that a common trait of impulsivity, rooted in neurodevelopment, underlies problem gambling and common comorbid psychiatric disorders in adolescents, who exhibit reward sensitivity and deficits in decision-making. A longitudinal study of 1,004 males from low socio-economic status (SES) areas provides some support for that hypothesis, where it was found that impulsivity at age 14 predicted gambling problems at age 17. In addition, the study found gambling problems at age 17 predicted an increase in depressive symptoms from age 17 to 23, and depressive symptoms at age 17 predicted an increase in gambling problems from age 17 to 23 (Dussault, Brendgen, Vitaro, Wanner & Tremblay, 2011).
In a study of 1,339 young adults, impulsivity and a specific form of sensation seeking, intensity seeking, were the only two significant predictors of problem gambling in females and two important predictors for males (Nower, Derevensky & Gupta, 2004); notably, girls in that study who were high in impulsivity reported higher rates than all boys, irrespective of their gambling status. Higher rates of impulsivity, combined with risk taking and social anxiety, have also been found to correlate with problem gambling, particularly in males (Wong et al., 2013). Cross, Copping and Campbell (2011) have theorised that women tend to have greater sensitivity than men to the punishing consequences of risky activities, which deters them from the same level of engagement; in contrast, men display significantly higher tendencies toward and preferences for sensation-seeking activities.
The intergenerational nature of gambling disorder and the impact of familial influences on the development of gambling problems in youth highlight the impact of modelling on behaviour. Although studies have yet to investigate parent-child stress coping styles in relation to gambling, findings suggest that youth gamblers, particularly males, who are adversely affected by parental problems with gambling and substance use are more likely to adopt avoidant stress coping strategies (Nower et al., 2004). In contrast, active, problem-focused coping strategies may serve as a protective factor in young females (Nower et al., 2004). Other studies have found that males report using more emotion-focused coping strategies than females, whose gambling problems were associated with reduced support-seeking (Bergevin, Gupta, Derevensky & Kaufman, 2006; Matheson, Wohl & Anisman, 2009). Coping and support seeking, therefore, are promising targets for treatment intervention for both genders.
To address some shortcomings of the Jacob’s model and conditioning theories, Blaszczynski & Nower (2002) have theorised that predisposing, aetiological factors variously combine in identifiable clusters that, together with irrational cognitions and behavioural conditioning, lead to problem gambling behaviours. Exploring these factors in a large, nationally representative US dataset, Nower and colleagues (2013) found that men were overrepresented in two subgroups — one characterised by the absence of significant clinical pathology and the other characterised by significant psychopathology, including mood, substance use, and personality disorders with a high level of impulsivity. In contrast,
A comparative study of men and women gamblers in Victoria Hing, Russell, Tolchard & Nower
Victorian Responsible Gambling Foundation Page 24
women were overrepresented in the second subgroup, identified by mood disorders and problems with substance use (Nower, Martins, Lim & Blanco, 2013). In youth, depression was found to predict gambling disorder, particularly among females (Nower, Gupta, Blaszczynski & Derevensky, 2004).
Studies have identified the familial transmission and intergenerational effects of disordered gambling behaviour. Slutske and colleagues (2010) reported that gambling involvement has genetic associations among men but not women, although overall, studies have found that parents who gamble and/or use substances have a significant, negative impact on both genders to varying degrees. Early exposure to gambling, primarily with a family member, is positively associated with disordered gambling, particularly in males (Ibanez et al., 2003; Nower et al., 2004). In a study of Italian adolescent boys, Donati et al. (2013) found that focusing on probabilities and economic profitability, combined with peer influences, were most predictive of problem gambling among boys, whereas the modelling effects of parental gambling behaviour were characteristic of girls who gambled problematically (Donati et al., 2013). In another study of 581 college students, parental substance use problems, combined with negative emotions and impulsivity, predicted gambling-related cognitive distortions, time spent gambling, and gambling problems, particularly in males (King et al., 2010). A Canadian study also found that adolescent and young adult males who believed their fathers gambled too much were 3.3 times more likely than other males to develop a serious gambling problem, while girls who believed their fathers abused substances were at 2.5 times greater risk for disordered gambling (Nower et al., 2004). Vitaro and Wanner (2011) reported that parental gambling participation alone, without problems, predicted early gambling for both boys and girls.
2.5 Problem gambling prevalence and gender Despite global increases in gambling opportunities, the proportion of problem gambling by gender has remained relatively stable, with men reporting two to three times the rate of gambling disorder when compared to women (Petry, Stinson & Grant, 2005; Williams, Volberg & Stevens, 2012). For example, in A Study of Gambling in Victoria, a representative population sample on which this current analysis is based, rates of problem gambling among women (0.47%) were much lower than among men (0.95%) (Hare, 2009). In the most recent Queensland gambling household survey of 15,000 people, the prevalence of male problem gambling (0.7%) was higher than for females (0.3%). There are criticisms of current methods of determining prevalence rates and so if moderate risk was accounted for then the percentages would be male (3.2%) and female (1.6%) (Queensland Government, 2012). In a US survey of 43,093 adults, about 0.6% of men and 0.2% of women had lifetime histories of problem gambling, with lifetime prevalence rates of subclinical problem gambling at 6.8% for men and 3.3% for women (Blanco, Petry, Stinson & Grant, 2006). A recent UK gambling prevalence survey identified males to be problem gamblers more than females by an odds ratio of 4.9 to 1 (Wardle et al., 2007). A Canadian study of 2,208 young adults, identified that high risk gamblers were significantly more likely to be male than female (Bergen, Newby-Clark & Brown, 2012). However, the number of female problem gamblers in this study was very low and so these findings would require further testing. Overall, male gender, young age, low SES, low educational level, divorced or single marital status and, in some studies, minority status are associated factors indicating increased risk for problem gambling (Castrén et al., 2013a, 2013b). These findings are supported in a Brazilian study, a lower socio-economic setting, where being male was clearly related to problem gambling (Carneiro et al., 2014).
Gender differences in gambling are evident at an early age. Results from five studies with 2,750 youth, aged 12 to 18 years, found that males gambled more frequently than females, although, as problem severity increased for both genders, so did the frequency of gambling and the likelihood that participants would gamble on both strategic (e.g., cards, sports) and non-strategic (e.g., lottery,

A comparative study of men and women gamblers in Victoria Hing, Russell, Tolchard & Nower
Victorian Responsible Gambling Foundation Page 25
EGMs) forms of gambling (Ellenbogen et al., 2007). In Queensland, Australia male 18-34 year olds had significantly higher rates of problem gambling than any other male or female adult age group. While this also translated to 18-34 year old males being over-represented in the moderate risk group, these differences were not as marked (Queensland Government, 2012). This result was also found in the New South Wales prevalence survey where no female problem gamblers were found in the 18-34 age group compared to 4.0% of males in this age group. It appears surprising no females were found, which may be an artefact of sampling in this survey (Sproston et al., 2012).
Several studies have concluded that higher levels of gambling problem severity are associated with an earlier age of onset, around the age of nine or ten years (Dell, Ruzicka & Palisi, 1981; Gupta & Derevensky, 1998, 2000). Men who develop gambling problems typically begin gambling at a younger age; in contrast, women begin gambling later in life and develop problems more rapidly than men (Ibáñez, Blanco, Moreryra & Saiz-Ruiz, 2003; Gonzalez-Ortega et al., 2013; Nower & Blaszczynski, 2006; Tang, Wu & Tang, 2007), possibly because of a preference for non-strategic machine gaming (Nower & Blaszczynski, 2006) which provides emotional escape (Ibanez et al., 2003) but is correlated with higher levels of problem gambling severity (Dowling, Smith & Thomas, 2005). In women, higher rates of problem gambling have been related to being older, and, in men, to having low self-esteem and abusing alcohol (Gonzalez-Ortega et al., 2013). A study of 1,520 subjects from Victoria, Australia found that women problem gamblers, as compared to men, were more likely to be older and prefer machine gambling; however, they were also more likely to be married, living with family and dependent children, and to report less than half the debt owed by males (Crisp et al., 2004). However, among a small sample of 143 callers to a gambling hotline, women reported higher levels of problem gambling severity than men and more financial consequences (Ledgerwood, Wiedemann, Moore & Arfken, 2012). In comparison, in a treatment sample of 204 subjects, male gamblers experienced higher gambling severity with no difference in financial problems suggesting that localised prevalence is multifactorial and likely context dependent, and that women in crisis may be more amenable to calling for help than men (Tolchard & Battersby, 2013).
2.6 Help seeking behaviour by gender Rates of treatment-seeking amongst problem gamblers are generally low for both men and women (Blanco et al., 2006; Delfabbro, 2012; Potenza et al., 2001). In a cross sectional analysis of 562 gamblers calling a helpline, women gamblers were more likely to report having received non-gambling-related mental health treatment prior to seeking help for gambling (Potenza et al., 2001). In addition, studies have found that women problem gamblers report a greater readiness for change than men (Ledgerwood et al., 2012; Petry, 2005)) and that help-seeking is motivated by a desire to gain control, prevent suicide, comply with the request or suggestion of a counsellor (Nower & Blaszczynski, 2006; Battersby, Tolchard, Scurrah & Thomas, 2006) or to maintain control over their child rearing despite gambling (Gavriel-Fried & Ajzenstadt, 2012).
One study of 131 gamblers found that both men and women were equally likely to seek treatment, but both Gamblers Anonymous and outpatient therapy were equally ineffective in reducing gambling symptoms (Grant & Kim, 2002). In 400 young gamblers, greater use of problem-solving and support seeking have been found to correlate with more positive attitudes to treatment for both men and women (Matheson et al., 2009). However, at 6-months post treatment, another study found that men had improved significantly more on gambling severity and rates of abstinence than women, who found specific components of the gambling intervention targeting identification of high-risk situations, gambling beliefs, and attitudes to be unhelpful (Toneatto & Wang, 2009). This study reported on only 60 subjects of whom 15 were female gamblers and so the findings would need further clarifying in a larger study. Amongst 212 gamblers receiving cognitive therapy, male gamblers were more likely to be

A comparative study of men and women gamblers in Victoria Hing, Russell, Tolchard & Nower
Victorian Responsible Gambling Foundation Page 26
abstinent within treatment (Petry, 2012). However, an Australian study of exposure therapy found the reverse to be the case (Tolchard & Battersby, 2013). Irrespective of gender, those who dropped out of treatment were characterised by a high impulsivity on intake in one study (Leblond, Ladouceur & Blaszczynski, 2003) and by sensation-seeking traits in another (Smith et al., 2010).
2.7 Mental health profiles of male and female problem gamblers
Research has found that women with gambling problems report more mental and physical health problems than other women. Moreover, female problem gamblers report higher rates of depression and anxiety, physical abuse, and dissatisfaction with their spouses than male problem gamblers, who have more difficulties with impulse control (Ibanez et al., 2003; Petry et al., 2005; Martins, Tavares, da Silva Lobo, Galetti & Gentil, 2004). However, these findings were contradicted in small study of treatment seeking gamblers which found no difference in co-morbid presentations between male and female problem gamblers (Grant, Odlaug & Mooney, 2012).
In a Canadian nationally representative sample, in contrast to non-problem gamblers, women experiencing gambling problems in the past year reported lower overall general health, higher levels of suicidal ideation and attempts, decreased psychological well-being, increased distress, depression, mania, panic attacks, social phobia, agoraphobia, alcohol dependence, any mental disorder, comorbidity of mental disorders, chronic bronchitis, fibromyalgia and migraine headaches (Afifi, Cox, Martens, Sareen & Enns. 2010). A variety of studies have found depressed mood (Blanco et al., 2006), suicidal thoughts and somatic complaints (Tang et al., 2007), anxiety and eating disorders (Dannon et al., 2006) to be more common in female gamblers. These characteristics of female problem gamblers often begin in childhood and adolescence (Nower et al., 2004). For example, a US survey of 18,518 men and 24,575 women found that women at-risk gamblers overall presented with higher levels of mental disorder than male at-risk gamblers. This relationship was strongest in at risk gambling women experiencing mood disorders. This study found young female gamblers were four times more likely to experience dysphoria and depression than their male counterparts (Desai, Maciejewski, Pantalon & Potenza, 2005).
Women gamblers are much more likely than controls to be victims of intimate partner violence (IPV) (Echeburua, Gonzalez-Ortega, Decorral & Polo-Lopez, 2013), physical abuse (Ibanez et al., 2003), to report a family history of alcoholism (Ledgerwood et al., 2012) and childhood maltreatment (Petry & Steinberg, 2005), and to suffer from poor self-esteem (Echeburua et al., 2011). Matching 103 problem with 103 non-problem gamblers, Echeburua and colleagues (2013) found that nearly 69% of female gamblers versus about 10% of female non-gamblers reported they were victims of IPV. However, one study noted that female gamblers (65%) reported higher levels of perpetration of IPV than male gamblers (54%) (Korman et al., 2008). This study had few female gamblers and so the finding may have been skewed. An analysis of IPV data from the Canadian Community Health Survey, found no difference between male and female gamblers as perpetrators of IPV (Afifi, Brownridge, MacMillan & Sareen, 2010).
Few studies have reported gender differences in smoking, alcohol use and crime. Of those that have, compared to women, men who gamble problematically are significantly more likely to smoke excessively, be classified as heavy drinkers (Martins et al., 2004), have lifetime diagnoses of alcohol and drug use disorders (Blanco et al., 2006; Dannon et al., 2006; Desai, Maciejewski, Pantalon & Potenza, 2006; Desai & Potenza, 2008), and to have been incarcerated (Potenza et al., 2006). In an analysis of data from the US National Epidemiologic Survey on Alcohol and Related Conditions,

A comparative study of men and women gamblers in Victoria Hing, Russell, Tolchard & Nower
Victorian Responsible Gambling Foundation Page 27
nicotine use was associated with women developing or being at risk of problem gambling. In this same study, men were found to be at risk of problem gambling if they had alcohol use disorder (Pilver, Libby, Hoff & Potenza, 2013). In a survey of 5,000 Finnish working age adults, both smoking and alcohol use were linked to a risk of problem gambling in males (Castrén et al., 2013).
Male problem gamblers generally report more sexual risk taking behaviour and alcohol abuse (Martins et al., 2004), although increased severity of past-year gambling problems has been associated with increased odds of most past year Axis I and lifetime Axis II disorders, regardless of gender. In a study of college athletes, female problem gamblers were more likely to have multiple sexual partners and unprotected sex. However, only a small number of female problem gamblers were found in this study and when comparing at-risk gamblers there were no differences in gender. This finding may also reflect gambling as a more attractive outlet for problem gambling male athletes (Huang, Jacobs & Derevensky, 2010).
As Williams, West et al. (2007, 2012) point out in their comprehensive review of the gambling risk literature, once a gambler has developed such risks then myriad conjoint issues emerge, including mental health problems, substance abuse, interpersonal problems, poor health practices, school/work problems, and antisocial behaviour, all of which impact on any recovery the person may try to achieve. A Study of Gambling in Victoria (Hare, 2009), measured many constructs that can help to clarify whether some of these social, health and wellbeing issues interact with a person’s gambling. To assess the issues that emerged from the literature on gender differences in problem gambling, the following variables were analysed; gambling prevalence using the PGSI and the NODS-CLiP2; environmental risks using gambling problems amongst family and friends, how people started gambling, gambling help-seeking, overcoming problem gambling, gambling readiness to change; and health and wellbeing risks using smoking, alcohol consumption, physical health, psychological health (Kessler 10, Suicide ideation) and drug use.
2.8 Chapter summary The notion that gambling is a male pursuit is being eroded due to the rise in new forms of gambling over the last few decades, both terrestrial and online, and because women’s roles in many contemporary societies are markedly different from previously. It has been argued that this previous view of gambling has therefore restricted meaningful analyses of gender differences in gambling and in particular characteristics of female gamblers. Growing evidence suggests that activity preference combined with social acceptance of gambling play an important role in distinguishing between male and female gamblers. Underneath this preferential and social acceptance model are gender specific motivations that see male gamblers continuing to be motivated by proving themselves as skilful players whereas female gamblers are escaping from, or relieving, negative emotional states. However, this is not so clear cut and more research is needed to tease out the motivational nuances.
The clear difference between perceived skilful gambling, preferred by men, and unskilled repetitive gambling, associated with women, requires more contemporary analyses especially in light of some emerging jurisdictional differences highlighted in this review. For example, this review has shown that, in some jurisdictions, men are becoming familiar with and participating more in unskilled gambling activities such as slot machines. Further research is required to understand changes in structural differences offered by various gambling forms, both terrestrial and online, and whether these are changing male and female gambling behaviour. There may be a second wave of gambling feminisation occurring that attracts more women to traditional male dominated games such as card play and sports betting due to their online availability.

A comparative study of men and women gamblers in Victoria Hing, Russell, Tolchard & Nower
Victorian Responsible Gambling Foundation Page 28
The way in which male and female gamblers gamble has also been reviewed, with inconclusive evidence to suggest clear differences. However, this may in part be due to a lack of separation in the analyses of large population studies. Further exploration of these factors is required. The venue and the type of betting done appear to vary between gender. However, again this is reported across jurisdictions differently. In one country, men may place bigger bets while in another female gamblers do so. Understanding this in the Australian context will provide a better understanding of jurisdictional similarities and differences.
This literature review has identified similarities and difference by gender in gamblers at all levels of risk. While it is clear that male gamblers have higher levels of participation in most forms of gambling, these differences are lessening, especially once gamblers reach moderate or problem levels of gambling. The pathway taken to reach this point has also been found to have specific gender differences. These include bio-genetic vulnerabilities, age of first gambling, family and other social factors, as well as individual emotional/psychological factors.
Several studies have identified a familial transmission of problem gambling; that is, parents/grandparents who gamble and/or use substances have a significant, negative impact and may predict early gambling for both boys and girls. Adolescent and young adult men who develop gambling problems report a history of impulsivity, risk taking and sensation seeking – factors that are also associated with poor treatment outcome – and depressive problems that are related to trait impulsivity early in life. By comparison, women may be more sensitive to the punishing consequences of risky activities and female problem gamblers are likely to have a history of mood disorders and child maltreatment. They are more likely to seek treatment but are not necessarily more likely to view the treatment as helpful.
Despite the rise of gambling among women and changes in male gambling, why then is participation still unrelated to future problems? There remains a need for greater understanding of the risk and protective factors that separate male and female gamblers. Understanding risk and protective factors in moderate risk/problem gamblers will assist in identifying any similar vulnerabilities in low risk, non-problem and non-gamblers. Being able to isolate specific gender factors will progress prevention greatly. Similarly, understanding gender differences and how they emerge in younger people just starting their gambling careers will provide opportunities for better education for individuals, their families and the wider community. It is clear from the literature that certain factors prevent someone from seeking help once they have developed a problem. First, knowing what these factors are and second, identifying specific differences between male and female gamblers will give greater insight into early identification in venues, primary care and so on. Knowing the underlying motivators of male and female gamblers will also assist treatment providers in offering clearly targeted approaches.
Mental health and chronic physical concerns are affecting large numbers of the population regardless of whether someone gambles; there are tangible issues specific to gamblers and more so specifically to male and female gamblers. While studies have found no qualitative or quantitative biological basis for aetiological gender differences, a number of psycho-social factors have been identified in men versus women. For problem gamblers in general, an absence of task-oriented stress coping styles and problem solving skills distinguish problem gamblers, although, for men, avoidant and emotion-focused coping styles appear to be additional risk factors. While studies have been identified from this review that hint at some of these issues, more research is needed. There is a common assumption that substance use, alcohol and smoking are strongly related to gambling. The evidence for this is unclear and at times contradictory. Only by analysing large scale representative samples can evidence be developed on any claims made. Similarly, other problematic excessive behaviours that may be related to gambling problems require further analysis.

A comparative study of men and women gamblers in Victoria Hing, Russell, Tolchard & Nower
Victorian Responsible Gambling Foundation Page 29
This report will investigate common factors associated with male and female gamblers and, by doing so, establish significant differences that can help to explain some of the issues raised in this review. Analysing general gambling related similarities and differences, and examining these in relation to at-risk and problem gambling, will be pursued. While it is evident there are differences, the complex interplay between gender and the myriad of experiences a person faces needs teasing out. While an analysis of this sort is unable to establish cause and effect, relating personal, family and community factors to individual gambling behaviour will go some way to doing so.
In summary, there are significant differences between men and women regarding gambling preferences and behaviours, the aetiology and course of problem gambling, and prevalence rates. Beginning in adolescence, males gamble more frequently than females, with adult men gambling at rates two to three times that of women. Men begin gambling earlier and often report comorbid problems with alcohol and/or drugs and excessive smoking. Men are more likely to engage in strategic forms of gambling (blackjack, cards, sports betting), whereas women prefer non-strategic forms such as EGMs and bingo. Compared to their male counterparts, women with gambling problems typically begin gambling later in life, develop problems more rapidly, and report more physical and mental health problems, particularly mood disorders. While research has identified certain distinctive features of men’s and women’s gambling and problem gambling, these features may also differ according to jurisdictional variations in gambling products, gambling accessibility, social norms, public health interventions and treatment services. The current study provides the first analysis of gender differences in gambling in Victoria, Australia based on a large, dataset that was weighted to be representative of the Victorian adult population.

A comparative study of men and women gamblers in Victoria Hing, Russell, Tolchard & Nower
Victorian Responsible Gambling Foundation Page 30
Chapter Three: Approach
3.1 Introduction This chapter explains key aspects of the research methods and relevant measures used in A Study of Gambling in Victoria (Hare, 2009) on which the current project was based. Analytical methods used in the current study are also explained. Readers are referred to this report’s appendices for excerpts from the original study that provide more details, including the survey instrument.
3.2 Survey administration and sampling for A Study of Gambling in Victoria
A Study of Gambling in Victoria (Hare, 2009) is the largest study of gambling in Victoria ever undertaken. It was conducted between August and October 2008 and collected data from 15,000 participants using Computer Aided Telephone Interviewing (CATI). The sample was stratified to reflect the adult population of each of the eight Government regions across Victoria. Local government areas were classified into high, medium or low EGM expenditure bands, with the high EGM expenditure areas over-sampled to ensure the sample captured likely problem gamblers. Seventy per cent of the sample was from high EGM expenditure areas, 20% was from medium EGM expenditure areas and 10% was from low EGM expenditure areas. Randomly generated telephone numbers were then pooled into EGM expenditure bands and numbers randomly selected (Hare, 2009). The survey data were then weighted to ensure that the sample was as closely aligned to the Victorian adult population as possible. This included weighting adjustments to reflect the method of sampling, the number of adults and telephone lines per household and other general Victorian population characteristics (e.g. age, gender, location). Please see Appendix A for a full explanation of the weighting used and the methods as explained in A Study of Gambling in Victoria (Hare, 2009). These weights were also used in all analyses conducted for the present study.
3.3 Variables measured in A Study of Gambling in Victoria
Use of an existing dataset meant the analyses in the current study were restricted to using the variables measured in A Study of Gambling in Victoria (Hare, 2009). The variables analysed in the current study are summarised below, grouped into overarching constructs that align with those in identified for Research Objectives 1 and 2. The survey instrument is contained in Appendix B.
3.3.1 Gambling preferences, activities and styles of play Gambling participation, frequency and access channels used in the past 12 months. Participation was assessed with a yes/no response, frequency was asked as number of times per week or per month or

A comparative study of men and women gamblers in Victoria Hing, Russell, Tolchard & Nower
Victorian Responsible Gambling Foundation Page 31
per year, while response options for access channel varied for the different forms of gambling. The following types of gambling were included in analyses:
Informal private betting for money. Playing the pokies or EGMs. Betting on table games such as blackjack, roulette and poker. Betting on horse or harness racing or greyhounds – excluding sweeps. Betting on sports and event results – such as football or TV show results. Keno. Lotto, Powerball or the Pools. Scratch tickets. Bingo. Competitions where one pays money to enter by telephone or leave an SMS. Buying tickets in raffles, sweeps and other competitions.
Details of highest spend gambling activity in the past 12 months, defined as the activity on which the respondent had gambling most money. Variables measured comprised expenditure ($ per day, week, fortnight, month or year, converted into annual expenditure), most frequently used access channel, specific venue/site/betting service used, top three features the respondent likes at this venue (17 response options plus “other”), and whether the respondents usually gambled alone/with one person/with a group of people.
Venues and other gambling details in the past 12 months. Variables measured comprised how many venues (including Internet gambling sites) the respondent had gambled at, and details about betting patterns. For EGMs, respondents were asked frequency of betting more than one credit per line, denomination mostly played and how much linked jackpots had influenced choice of venue. For betting on horse/harness racing/greyhounds, respondents were asked their three main types of bets placed, whether respondents had used batch betting, and whether the respondent had mainly bet alone or in a syndicate. For betting on sports and events results, respondents were asked which sports they had bet on and the three main types of bets placed. For Lotto/Powerball/Pools, respondents were asked whether they had mainly gambled alone or in a syndicate, whether they mainly picked their own numbers or used Quickpicks, how many numbers they usually picked per game, and how many games or squares they usually played each week. For scratch tickets, respondents were asked what denomination they normally bought, while for bingo they were asked how many books they purchased each time and how many books they played at once. For phone/SMS competitions, respondents were asked which media the competitions they played were usually promoted through.
Money management for gambling on highest spend activity in past 12 months. Variables measured were how much cash the respondent usually brought to venue, whether they typically brought debit and credit cards to the venue, and the number of times they used their ATM card/EFTPOS/credit card per session.
3.3.2 Gambling motivations and attitudes Main three reasons for gambling on the highest spend activity. Response options were social reasons, to win money, general entertainment, takes your mind off things, relieves stress, boredom, and other (free response).
Attitudes to gambling in Victoria. Respondents were presented with five statements, with responses indicated on a 5-point Likert scale from 1= strongly disagree to 5 = strongly agree. The five statements

A comparative study of men and women gamblers in Victoria Hing, Russell, Tolchard & Nower
Victorian Responsible Gambling Foundation Page 32
were: 1) The Victorian Government is taking positive action to encourage responsible gambling in Victoria, 2) Gambling is a serious social problem in Victoria, 3) Gambling provides a lot of fun for the community, 4) Gambling is too widely accessible in my local council/shire, and 5) Governments need to do more to address problem gambling in my local council/shire.
3.3.3 Gambling problems Problem Gambling Severity Index (PGSI; Ferris & Wynne, 2001). The PGSI contains nine questions which were administered to all gamblers in the study. In contrast to the validated version of the PGSI (Ferris & Wynne, 2001), responses were scored as never = 0, rarely = 1, sometimes = 1, most of the time = 2, and always = 3. Scores can range from 0 to 27 and indicate the risk level of gambling problems for each participant. Cut-off scores were 0 = non-problem gambler, 1-2 = low risk gambler, 3-7 = moderate risk gambler, and 8-27 = problem gambler. The PGSI is widely used in Australia and is recommended as a measure of problem gambling severity (Problem Gambling Research & Treatment Centre, 2011). However, because of the use of different response options and the assignment of the same value to two response options, the PGSI as used in this survey has not been validated and cannot be compared to research using the validated version of the PGSI.
The PGSI defines problem gamblers as those who have experienced adverse consequences from their gambling and may have lost control of their behaviour; moderate risk gamblers as those who may be heavily involved in gambling and respond positively to 3 or 4 correlates of problem gambling, and who may or may not have experienced adverse consequences as a result of their gambling; low risk gamblers as those who may be heavily involved in gambling and respond positively to 1 or 2 correlates of problem gambling, and who are unlikely to have experienced adverse consequences as a result of their gambling; and non-problem gamblers as those who respond never to all of the indicators of problem gamblers and who have not experienced any adverse consequences of gambling (Ferris & Wynne, 2001).
NODS-CLiP2. The NODS-CLiP2 Scale estimates lifetime prevalence of both problem and pathological gambling. It contains 16 items. The first five items were administered to all gamblers. If none of the first five items of the NODS CLiP2 are endorsed, then the respondent is assumed to be negative on the entire battery. If one or more of the first five items are endorsed, then the additional questions are intended to obtain responses needed to establish all of the ten DSM-IV criteria. Thus, if Item 1 is endorsed, then Item 6 is asked to establish Withdrawal; if Item 6 is then endorsed, then Items 7 and 8 are asked to determine Loss of Control; if Item 2 is NOT endorsed, then Item 9 is asked to determine Preoccupation; if Item 3 is endorsed, then Item 10 is asked to establish Lying; and if Item 5 is not endorsed, then Item 11 (Escape) is asked to determine Escape (Hare, 2009). Scoring is based only on items 2 or 9 (Preoccupation), 4 (Chasing), 5 or 11 (Escape), 6 (Withdrawal), 8 (Loss of Control 3+ times), 10 (Lying 3+ times), 12 (Tolerance), 13 (Illegal Acts), 14 or 15 (Risked Relationships), and 16 (Bailout). Total score on the NODS can range from 0-10, with cut-off scores being 0 = non-problem gambler, 1-2 = at risk gambler, 3-4 = problem gambler, and 5+ = pathological gambler.
The NODS questions are based on the DSM-IV criteria for pathological gambling. The NODS defines pathological gamblers as meeting 5 or more DSM-IV criteria, problem gamblers as those in the upper subclinical range meeting 3-4 criteria, at-risk gamblers as meeting 1-2 criteria, and low-risk gamblers as meeting no criteria. Thus, terminology and definitions of categories are different for the NODS and the PGSI.
A comparative study of men and women gamblers in Victoria Hing, Russell, Tolchard & Nower
Victorian Responsible Gambling Foundation Page 33
3.3.4 Physical and mental health and related behaviours Smoking. Questions asked gathered information on whether the respondent had smoked at all in the past 12 months, whether they currently smoked, number of cigarettes smoked per day, and increase/no effect/decrease in gambling since the venue smoking ban.
Alcohol consumption. Questions gathered information on whether the respondent had consumed an alcoholic drink in the past 12 months, and number of standard alcoholic drinks consumed per week. The 4-item CAGE alcohol screen (Ewing, 1984) measured the risk of clinically significant alcohol abuse.
Health. Respondents were asked to rate their overall health (5-point scale from 1 = excellent to 5 = poor), whether they had experienced major problems, hardship or trauma in their life or upbringing or not, whether they currently had eight specific health conditions (heart conditions, high blood pressure or high cholesterol, diabetes, cancer, lung conditions including asthma, depression, anxiety disorders, obesity, any other physical or mental health conditions ), and whether or not they had a disability affecting day-to-day life in the past 12 months.
Kessler 10. This is a 10-item scale that yields a global measure of psychological distress based on questions about anxiety and depressive symptoms that a person has experienced in the most recent 4 week period. Responses are measured on a 5-point scale from 1 = none of the time to 5 = all of the time. Scores are then summed for a total ranging from 10-50. Cut-off scores were 10-19 = likely to be well, 20-24 = likely to have a mild disorder, 25-29 = likely to have a moderate mental disorder, and 30-50 = likely to have a severe mental disorder.
The following questions were asked only of respondents scoring as moderate risk or problem gamblers on the PGSI:
Suicide ideation. Respondents were asked if, in the past 12 months, they had considered taking their own life (yes/no).
Drug use. Respondents were asked whether, during the past 12 months, they had used any of 13 types of drugs for non-medical reasons, with response options being no use, occasional use and regular use. The drugs were marijuana/hashish, prescription pain killers, amphetamines like speed, ecstasy/designer drugs, cocaine/crack, tranquilisers, hallucinogens, inhalants, heroin, GHB, barbiturates, growth/muscle promoting steroids and methadone.
3.3.5 Family and early gambling influences and experiences The following questions were asked only of respondents scoring as moderate risk or problem gamblers on the PGSI:
Gambling problems amongst family and friends. Questions gathered information about whether anyone in the respondent’s family and anyone else close to them was currently at-risk of or had a gambling problem.
How people started gambling. Questions included age at first gambling, who they first started gambling with, their first gambling activity, and triggers to start gambling (open-ended, coded into social reasons, to win money, general entertainment, takes your mind off things, relieves stress, boredom, and other).

A comparative study of men and women gamblers in Victoria Hing, Russell, Tolchard & Nower
Victorian Responsible Gambling Foundation Page 34
3.3.6 Gambling help-seeking behaviour The following questions were asked only of respondents scoring as moderate risk or problem gamblers on the PGSI:
Gambling help-seeking. Questions ascertained whether the respondent had sought help for a gambling problem in the past 12 months, who from, type of help, who mainly referred them to help, if they had wanted help in the past 12 months, and why they did not seek help (if applicable).
Overcoming problem gambling. Questions ascertained respondents’ views on the usefulness of six factors in helping to reduce the amount of gambling they do, measured on a 5-point scale from 1 = not at all useful to 5 = very useful. The six factors were having a wider social network, counselling to help overcome a difficult time in your past, having more money available, information on the odds of winning in gambling, having more outside leisure activities and interests, and finding a relationship partner. Respondents were also asked how much five types of people (employer, friends, relationship partner, relatives, doctor or other health care professionals) had encouraged them to reduce their gambling, with responses measured on a 3-point scale (not at all, a little, a lot).
Gambling Readiness to Change Scale ((Rollnick, Heather, Gold & Hall, 1992). This nine item scale includes 3 items each to measure pre-contemplation, contemplation and action in terms of their preparedness to reduce their gambling behaviour. An overall composite of readiness to change consists of weighting the precontemplation items (-2), contemplation items (1), and action items (2), and taking the mean of all weighted items. Alternatively, separate scores for precontemplation, contemplation, and action can be derived by taking the mean of the items corresponding to each subscale. A third alternative is to categorise individuals as precontemplators, contemplators, or in the action stage according to their highest subscale score (Hare, 2009).
3.3.7 Socio-demographics Questions established respondents’ age, gender, language other than English spoken at home, Aboriginal or Torres Strait Islander background, number of people 18+ in the household, local government area, suburb, postcode, education, household composition, number of dependent children under 25 years, employment status, type of work, whether they had migrated to Australia in the past five years, type of Internet connection at home, household income and personal income.
3.4 Analytical methods used the current study Data were analysed using SPSS v20. Analyses were conducted using a p-value (alpha) of 0.05 or lower. All data were weighted using the same weighting variables as in A Study of Gambling in Victoria (Hare, 2009). All gamblers were included in the analyses for Research Objective One. Some respondents reported only gambling on forms that are not usually associated with problem gambling (informal private betting, keno, lottery/Powerball/pools, scratch tickets, Bingo, phone or SMS competitions or raffles, sweeps and other competitions) and doing so infrequently. Those who reported that they only bet on one of these forms less often than once per month and who did not report gambling on any other form of gambling were classified as casual gamblers and were excluded from analyses for Research Objective Two.

A comparative study of men and women gamblers in Victoria Hing, Russell, Tolchard & Nower
Victorian Responsible Gambling Foundation Page 35
To address Research Objective One, differences in percentages for males and females were assessed using chi-square test of independence. Where more than two groups were compared, the omnibus chi-square test of independence is reported in the tables along with results of planned pairwise comparisons of percentages. These pairwise comparisons were tested using Bonferroni-adjusted Z-tests, in order to be conservative due to the large sample size. For continuous dependent variables, parametric tests (t-tests) and non-parametric (Mann-Whitney U-tests) were conducted. Tests for interactions were conducted via logistic regression for percentages and via ANOVA for continuous variables.
There are numerous statistical approaches that could be used to address Research Objective Two. In general, the analyses determined which factors differentiate low risk/non-problem gamblers from problem/moderate risk gambling separately for women and for men (i.e. simple effects). The comparisons for females and for males were then compared using interaction terms.
Problem gambling was measured using the PGSI. There are two options in terms of analyses: treating PGSI as a continuous scale (i.e., using a score out of 27) or using the categories that are typically applied to the PGSI (Ferris & Wynne, 2001). The scale is heavily skewed. The vast majority of respondents (88.9%) had a PGSI score of 0 and 96.3% had a score of two or less. Alternative distributions were explored and the results were similar to those reported here. We chose to use existing groupings for the PGSI as this approach is most often used in gambling research, including in A Study of Gambling in Victoria (Hare, 2009) and the results are easily accessible for most readers.
The analyses therefore aimed to identify problem/moderate risk gamblers and low risk/non-problem gamblers. As only 0.7% of the sample were classified as a problem gambler (PGSI of 8 or higher), moderate risk gamblers (PGSI 3-7 based on the original classifications) were also included in this group. Thus, the analyses compared “non-problem gamblers” (here defined to mean PGSI 0-2, i.e., non-problem and low risk gamblers) and “at risk gamblers” (PGSI 3+, i.e., moderate risk and problem gamblers) based on this definition.
As the aim of this analysis was to identify variables that are related to problem/moderate risk gambling, we also excluded some respondents who were unlikely to be at risk of developing problem gambling. Any respondent who reported taking part in the following forms less than once a month (and not taking part in any other forms) were excluded: private informal betting, keno, lotto, instant scratch tickets, bingo, phone or SMS competitions and raffles. Of the 11,235 gamblers, 2,304 met these criteria and were thus excluded, leaving 8,931 gamblers. Of these, 407 (4.6%) were classified as being “at risk” (PGSI 3+). When the weighting variable was applied, the total number of included respondents was 8,919, with 464 (5.2%) classified as “at risk”. Of these at risk gamblers, 285 were male and 179 were female.
The following predictors were analysed to determine whether they are related to problem/moderate risk gambling separately for both males and females: gambling forms participated in, frequency of gambling on each form, demographics, gambling expenditure, who the respondent usually gambles with, number of venues that they attend for particular forms, some specific behaviours for each form (e.g. number of lines and credits bet on EGMs), money management, attitudes to gambling in Victoria, main reasons for gambling, smoking/alcohol/drug use, mental health (Kessler 10) and physical health. This test was conducted using a binary logistic regression after tolerance/overlap of predictors was tested using a linear regression. Further details on this analysis are reported with the results.
The analyses do not infer that the predictors are causal. To demonstrate this point, the relationship between mental health and problem gambling can be considered. If there is a significant association between the variables for males or females, it may be the case that those with mental health issues

A comparative study of men and women gamblers in Victoria Hing, Russell, Tolchard & Nower
Victorian Responsible Gambling Foundation Page 36
are more susceptible to becoming problem gamblers. It may also be the case that problem gambling has led to mental health issues.
For each variable, the comparison between non-problem (PGSI 0-2) and at-risk (PGSI 3+) gamblers is presented separately for females and males in Chapter Five. The corresponding statistical result is presented in the tables in blue text. Further analyses were conducted comparing female non-problem with female at-risk gamblers and comparing male non-problem with male at-risk gamblers. Both sets of analyses are presented in each table in Chapter 5. Under that is the interaction result, also in blue text, which tests whether the differences between non-problem and at-risk female gamblers are significantly different to the differences between non-problem and at-risk male gamblers. In other words, the interaction asks whether the differences between non-problem and at-risk gamblers in terms of each variable (e.g., age, participation in each form of gambling, etc.) are significantly different for females and for males. The interactions for the percentage data were tested using hierarchical logistic regressions, where the first block included the main effects of gender and the other predictor in question (e.g., age, participation in each form of gambling, etc.) individually, followed by a second block, where the product interaction term for the two predictors was calculated. The result presented for the interaction is the increment test from these logistic regressions. Where the variable of interest was nominal or ordinal (e.g. age), the lowest-coded level was treated as the reference group for the interaction. The dependent variable for these logistic models was non-problem and at-risk gambling.
Table 5.2 from Chapter 5 is reproduced below to explain how to interpret its inclusions. The letters at the top of the table refer to gender (F or M) and problem gambling status (NP or AR for non-problem and at-risk respectively). The analysis was essentially treated as a 2x2 (gender x problem gambling status) design and the results are simple effects. The left-most chi-square analysis compared the 11.9% of female non-problem gamblers to 17.9% of female at-risk gamblers who speak a language other than English at home. This difference was found to be statistically significant. The chi-square analysis on the right, under AR, compared female at-risk gamblers (17.9%) to male at-risk gamblers (27.5%) and once again, this difference is significant. The interaction compares differences of differences. For example, the difference between female and male non-problem gamblers (11.9% compared to 16.6% for a 4.7% difference) was compared to the corresponding gender difference for at-risk gamblers (17.9% compared to 27.5% for a difference of 9.6%). The difference between these differences (4.9%) was not statistically significant in this case. That is, the difference between non-problem male and female gamblers was not significantly larger than the difference between at-risk male and female gamblers.
Example table
F M NP AR NP AR NP AR F M F M
N 4,228 179 4,228 284 4,228 4,228 179 284 Speaks a language other than English at home
11.9 17.9* 16.6 27.5* 11.9 16.6^ 17.9 27.5^
Difference χ2 (1, N = 4,407) = 5.65, p = 0.017, Φ
= 0.04
χ2 (1, N = 4,512) = 22.19, p < 0.001,
Φ = 0.07
χ2 (1, N = 8,456) = 36.80, p < 0.001,
Φ = 0.07
χ2 (1, N = 463) = 5.57, p = 0.018, Φ
= 0.11 Interaction χ2 (1, N = 8,919) = 0.51, ns Note: * indicates differences between non-problem and at-risk gamblers for each gender. ^ indicates differences between each gender separately for non-problem and at-risk gamblers.

A comparative study of men and women gamblers in Victoria Hing, Russell, Tolchard & Nower
Victorian Responsible Gambling Foundation Page 37
Where the chi-square tests of independence involved more than one degree of freedom, post-hoc tests were conducted using z-tests to further understand the results. In some cases, the post-hoc tests detected a significant difference when the omnibus, multi-degree-of-freedom tests did not. Both statistics are reported. When an analysis involved at least one small cell (expected count below 5), Fisher’s exact test was employed instead.
As the sample was quite large, many relatively small effects were found to be statistically significant. All statistically significant results are reported along with effect sizes. These effect sizes should be taken into account when determining the importance of the results. For chi-square tests, phi is reported and effect sizes below approximately 0.1 may be treated as trivial. For independent samples t-tests, Cohen’s d has been reported and effect sizes below 0.2 may be treated as trivial. Effect sizes are not reported for correlations as the correlation value serves as an effect size. Finally, for ANOVA, eta-squared as been reported and effect sizes below 0.01 may be treated as trivial.
As there was possible overlap between some of the results (e.g. the results for age and the results for household type or employment status), separate multivariate analyses were conducted to determine which results were still significant when controlling for all others. The rationale and structure of these models are reported in Chapter Five.

A comparative study of men and women gamblers in Victoria Hing, Russell, Tolchard & Nower
Victorian Responsible Gambling Foundation Page 38
Chapter Four: Similarities and Differences Between Male and Female Gamblers in Victoria
4.1 Introduction This chapter addresses Research Objective One, which was to: analyse the similarities and differences between male and female gamblers in Victoria in terms of gambling preferences, activities and styles of play; gambling motivations and attitudes; physical and mental health; family and early gambling influences; and help-seeking behaviour. Gamblers were defined as those who had taken part in any of the surveyed gambling activities in the last 12 months (see section 3.3.1).
Of the 15,000 respondents in the sample, 11,235 indicated that they were gamblers. The weighted proportion of males amongst these gamblers was 49.0% (n = 5,508).
4.2 Differences between male and female gamblers in gambling participation
Significantly higher proportions of male gamblers participated in most forms of gambling during the last 12 months compared to female gamblers. The exceptions were scratch tickets, bingo, phone/SMS competitions and raffles/sweeps/competitions, which had significantly higher levels of female participation. Table 4.1 summarises these results. Some of the significant differences between the groups may be an artefact of overpowered analyses, such as the significant differences for EGMs, keno and Lotto/Powerball/Pools.
When asked about their preferred forms of informal betting, there were no significant differences between the genders. The most common form of informal betting for both genders was cards (78.2% of females, 83.9% of males).

A comparative study of men and women gamblers in Victoria Hing, Russell, Tolchard & Nower
Victorian Responsible Gambling Foundation Page 39
Table 4.1 Participation in gambling activities by gender
Females Males Gambling form N % N % Inferential statistics Informal private betting 113 2.0 419 7.6* χ2 (1, N = 11,236) = 197.62,
p < 0.001, Φ = 0.13 EGMs 1,582 27.6 1,718 31.2* χ2 (1, N = 11,235) = 17.23,
p < 0.001, Φ = 0.04 Table games 147 2.6 559 10.1* χ2 (1, N = 11,236) = 274.16,
p < 0.001, Φ = 0.16 Horse/harness /greyhound racing
944 16.5 1,579 28.7* χ2 (1, N = 11,236) = 239.50, p < 0.001, Φ = 0.15
Betting on sports or event results
117 2.0 491 8.9* χ2 (1, N = 11,235) = 258.98, p < 0.001, Φ = 0.15
Keno 159 2.8 200 3.6* χ2 (1, N = 11,235) = 6.63, p = 0.010, Φ = 0.02
Lotto/Powerball/Pools 3,659 63.9 3,645 66.2* χ2 (1, N = 11,235) = 6.45, p = 0.011, Φ = 0.02
Scratch tickets 1,353 23.6* 1,002 18.2 χ2 (1, N = 11,235) = 50.03, p < 0.001, Φ = 0.07
Bingo 270 4.7* 56 1.0 χ2 (1, N = 11,236) = 136.23, p < 0.001, Φ = 0.11
Phone or SMS competitions 758 13.2* 372 6.8 χ2 (1, N = 11,236) = 130.32, p < 0.001, Φ = 0.11
Raffles, sweeps and other competitions
3,609 63.0* 2,985 54.2 χ2 (1, N = 11,235) = 90.16, p < 0.001, Φ = 0.09
Note. Numbers represent those who responded yes to participation in a gambling activity and percentages are within gender; * indicates the significantly higher proportion per activity.
4.2.1 Demographic differences in male and female gamblers Significant differences were observed between male and female gamblers in all demographic variables (Table 4.2), although many of these differences were relatively small and were thus significant due to the large sample size. The greatest differences between genders were found in income and employment. Males tend to earn significantly more money than females and a significantly higher proportion of males were employed full-time compared to females.

A comparative study of men and women gamblers in Victoria Hing, Russell, Tolchard & Nower
Victorian Responsible Gambling Foundation Page 40
Table 4.2 Demographic information by gender (gamblers only)
Females Males Demographic N % N % Age group 18-24 587 10.2 668 12.1* 25-29 428 7.5 443 8.0 30-34 545 9.5 517 9.4 35-39 556 9.7 550 10.0 40-44 581 10.1 549 10.0 45-49 563 9.8 518 9.4 50-54 542 9.5 552 10.0 55-59 478 8.3 427 7.8 60-64 393 6.9 408 7.4 65-69 367 6.4 331 6.0 70-74 306 5.3* 232 4.2 75-79 198 3.5 191 3.5 80-84 133 2.3* 88 1.6 85 years or older 51 0.9 34 0.6
χ2 (13, N = 11,236) = 32.71, p = 0.002, Φ = 0.05 Speaks a language other than English at home 808 14.1 1,020 18.5*
χ2 (1, N = 11,235) = 40.08, p < 0.001, Φ = 0.06 Education University 1,565 27.6 1,554 28.5 TAFE or trade qualification 1,047 18.5 1,156 21.2* Year 12 1,210 21.4 1,261 23.1* Year 10 or lower 1,845 32.6* 1,480 27.2
χ2 (3, N = 11,118) = 42.37, p < 0.001, Φ = 0.06 Household type Couple with child or children 2822 49.5 2782 50.7 One parent family 495 8.7* 254 4.6 Other family 266 4.7 237 4.3 Couple without children 1398 24.5 1506 27.5* Group household (not related) 180 3.2 263 4.8* Lone person 538 9.4* 437 8.0 Other Household 3 0.1 6 0.1
χ2 (6, N = 11,187) = 106.36, p < 0.001, Φ = 0.10 Employment Full-time employment 1,658 29.0 3,483 63.3* Part-time employment 1,729 30.2* 655 11.9 Unemployed 173 3.0 178 3.2 Not in workforce or away from work 2,157 37.7* 1,184 21.5
χ2 (3, N = 11,217) = 1411.47, p < 0.001, Φ = 0.36 Household income $0-$33,799 743 20.6* 594 14.8 $33,800-$62,399 855 23.8 886 22.0 $62,400-$103,999 1,092 30.3 1,225 30.4 $104,000 or higher 909 25.3 1,318 32.8*
χ2 (3, N = 7,622) = 76.56, p < 0.001, Φ = 0.10 Personal income $0-$31,199 2,422 60.1* 1,377 32.0 $31,200-$51,999 915 22.7 1,039 24.1 $52,000-$83,199 531 13.2 1,124 26.1* $83,200 or higher 164 4.1 766 17.8*
χ2 (3, N = 8,338) = 889.43, p < 0.001, Φ = 0.33 * indicates the significantly higher proportion.
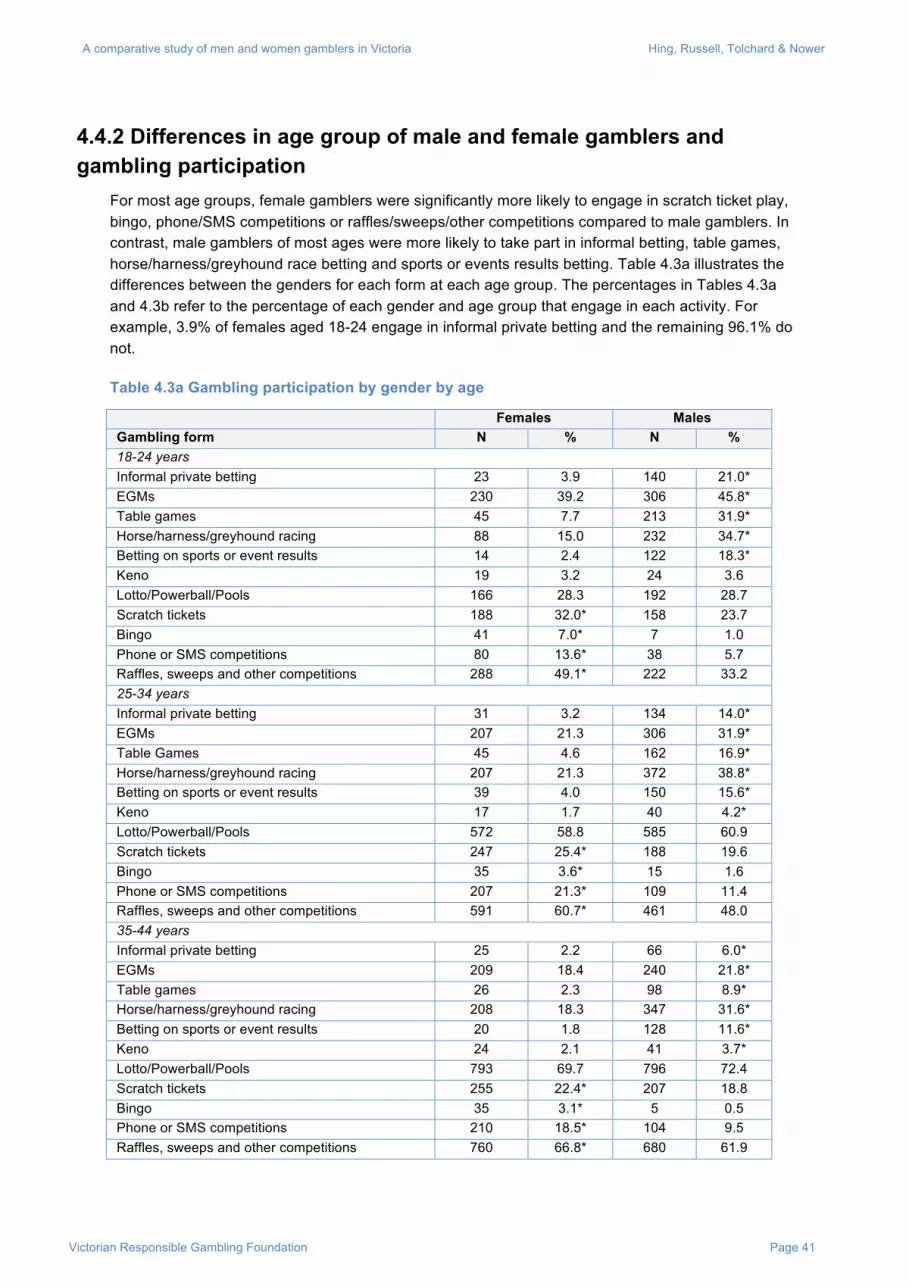
A comparative study of men and women gamblers in Victoria Hing, Russell, Tolchard & Nower
Victorian Responsible Gambling Foundation Page 41
4.4.2 Differences in age group of male and female gamblers and gambling participation
For most age groups, female gamblers were significantly more likely to engage in scratch ticket play, bingo, phone/SMS competitions or raffles/sweeps/other competitions compared to male gamblers. In contrast, male gamblers of most ages were more likely to take part in informal betting, table games, horse/harness/greyhound race betting and sports or events results betting. Table 4.3a illustrates the differences between the genders for each form at each age group. The percentages in Tables 4.3a and 4.3b refer to the percentage of each gender and age group that engage in each activity. For example, 3.9% of females aged 18-24 engage in informal private betting and the remaining 96.1% do not.
Table 4.3a Gambling participation by gender by age
Females Males Gambling form N % N % 18-24 years Informal private betting 23 3.9 140 21.0* EGMs 230 39.2 306 45.8* Table games 45 7.7 213 31.9* Horse/harness/greyhound racing 88 15.0 232 34.7* Betting on sports or event results 14 2.4 122 18.3* Keno 19 3.2 24 3.6 Lotto/Powerball/Pools 166 28.3 192 28.7 Scratch tickets 188 32.0* 158 23.7 Bingo 41 7.0* 7 1.0 Phone or SMS competitions 80 13.6* 38 5.7 Raffles, sweeps and other competitions 288 49.1* 222 33.2 25-34 years Informal private betting 31 3.2 134 14.0* EGMs 207 21.3 306 31.9* Table Games 45 4.6 162 16.9* Horse/harness/greyhound racing 207 21.3 372 38.8* Betting on sports or event results 39 4.0 150 15.6* Keno 17 1.7 40 4.2* Lotto/Powerball/Pools 572 58.8 585 60.9 Scratch tickets 247 25.4* 188 19.6 Bingo 35 3.6* 15 1.6 Phone or SMS competitions 207 21.3* 109 11.4 Raffles, sweeps and other competitions 591 60.7* 461 48.0 35-44 years Informal private betting 25 2.2 66 6.0* EGMs 209 18.4 240 21.8* Table games 26 2.3 98 8.9* Horse/harness/greyhound racing 208 18.3 347 31.6* Betting on sports or event results 20 1.8 128 11.6* Keno 24 2.1 41 3.7* Lotto/Powerball/Pools 793 69.7 796 72.4 Scratch tickets 255 22.4* 207 18.8 Bingo 35 3.1* 5 0.5 Phone or SMS competitions 210 18.5* 104 9.5 Raffles, sweeps and other competitions 760 66.8* 680 61.9
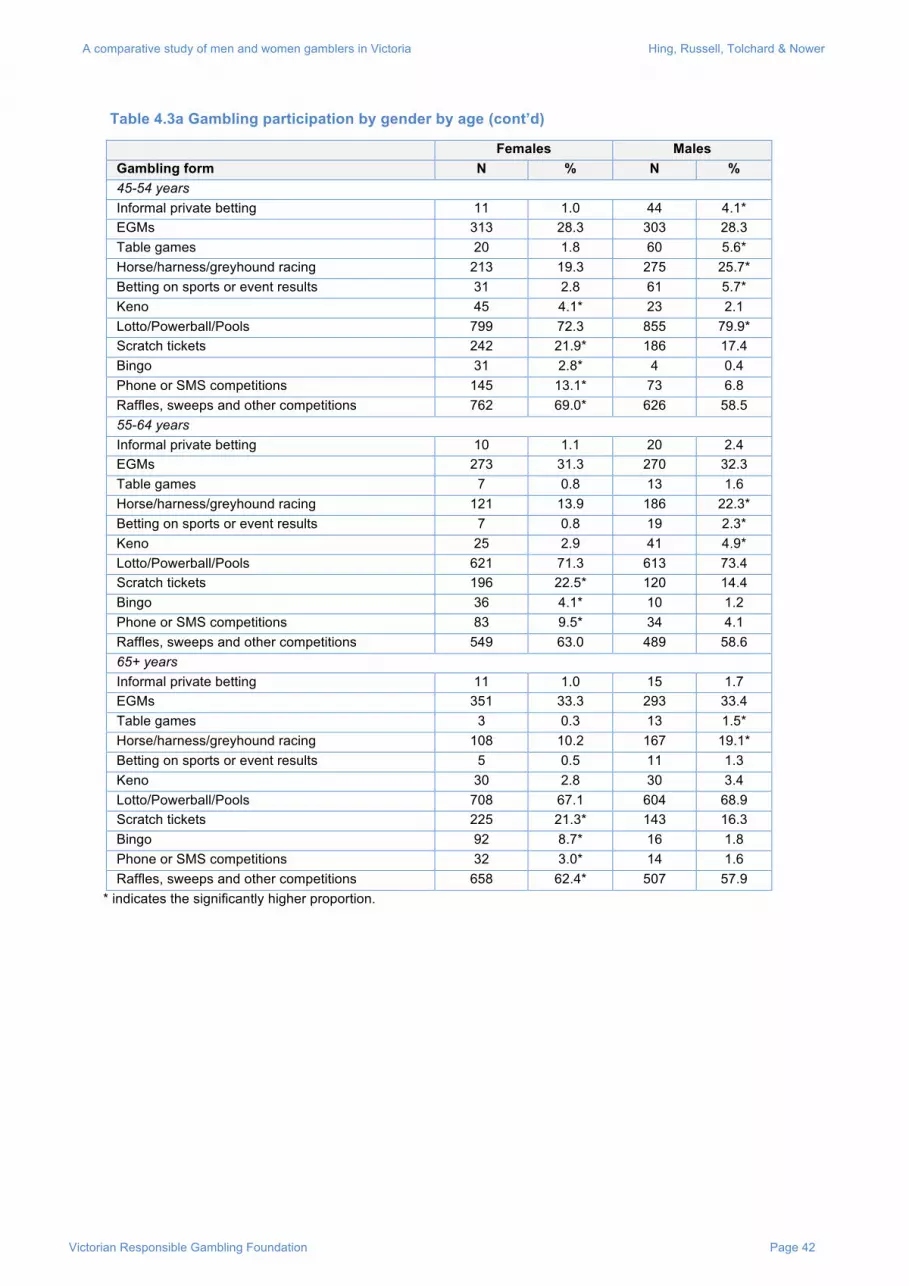
A comparative study of men and women gamblers in Victoria Hing, Russell, Tolchard & Nower
Victorian Responsible Gambling Foundation Page 42
Table 4.3a Gambling participation by gender by age (cont’d)
Females Males Gambling form N % N % 45-54 years Informal private betting 11 1.0 44 4.1* EGMs 313 28.3 303 28.3 Table games 20 1.8 60 5.6* Horse/harness/greyhound racing 213 19.3 275 25.7* Betting on sports or event results 31 2.8 61 5.7* Keno 45 4.1* 23 2.1 Lotto/Powerball/Pools 799 72.3 855 79.9* Scratch tickets 242 21.9* 186 17.4 Bingo 31 2.8* 4 0.4 Phone or SMS competitions 145 13.1* 73 6.8 Raffles, sweeps and other competitions 762 69.0* 626 58.5 55-64 years Informal private betting 10 1.1 20 2.4 EGMs 273 31.3 270 32.3 Table games 7 0.8 13 1.6 Horse/harness/greyhound racing 121 13.9 186 22.3* Betting on sports or event results 7 0.8 19 2.3* Keno 25 2.9 41 4.9* Lotto/Powerball/Pools 621 71.3 613 73.4 Scratch tickets 196 22.5* 120 14.4 Bingo 36 4.1* 10 1.2 Phone or SMS competitions 83 9.5* 34 4.1 Raffles, sweeps and other competitions 549 63.0 489 58.6 65+ years Informal private betting 11 1.0 15 1.7 EGMs 351 33.3 293 33.4 Table games 3 0.3 13 1.5* Horse/harness/greyhound racing 108 10.2 167 19.1* Betting on sports or event results 5 0.5 11 1.3 Keno 30 2.8 30 3.4 Lotto/Powerball/Pools 708 67.1 604 68.9 Scratch tickets 225 21.3* 143 16.3 Bingo 92 8.7* 16 1.8 Phone or SMS competitions 32 3.0* 14 1.6 Raffles, sweeps and other competitions 658 62.4* 507 57.9
* indicates the significantly higher proportion.

A comparative study of men and women gamblers in Victoria Hing, Russell, Tolchard & Nower
Victorian Responsible Gambling Foundation Page 43
Table 4.3b Gambling participation by gender by age
18-24 years
25-34 years
35-44 years
45-54 years
55-64 years
65+ years
Females Informal private betting 3.9 3.2 2.2 1.0 1.1 1.0 EGMs 39.2 21.3 18.4 28.3 31.3 33.3 Table games 7.7 4.6 2.3 1.8 0.8 0.3 Horse/harness/greyhound racing 15.0 21.3 18.3 19.3 13.9 10.2 Betting on sports or event results 2.4 4.0 1.8 2.8 0.8 0.5 Keno 3.2 1.7 2.1 4.1 2.9 2.8 Lotto/Powerball/Pools 28.3 58.8 69.7 72.3 71.3 67.1 Scratch tickets 32.0 25.4 22.4 21.9 22.5 21.3 Bingo 7.0 3.6 3.1 2.8 4.1 8.7 Phone or SMS competitions 13.6 21.3 18.5 13.1 9.5 3.0 Raffles, sweeps and other competitions
49.1 60.7 66.8 69.0 63.0 62.4
Males Informal private betting 21.0 14.0 6.0 4.1 2.4 1.7 EGMs 45.8 31.9 21.8 28.3 32.3 33.4 Table games 31.9 16.9 8.9 5.6 1.6 1.5 Horse/harness/greyhound racing 34.7 38.8 31.6 25.7 22.3 19.1 Betting on sports or event results 18.3 15.6 11.6 5.7 2.3 1.3 Keno 3.6 4.2 3.7 2.1 4.9 3.4 Lotto/Powerball/Pools 28.7 60.9 72.4 79.9 73.4 68.9 Scratch tickets 23.7 19.6 18.8 17.4 14.4 16.3 Bingo 1.0 1.6 0.5 0.4 1.2 1.8 Phone or SMS competitions 5.7 11.4 9.5 6.8 4.1 1.6 Raffles, sweeps and other competitions
33.2 48.0 61.9 58.5 58.6 57.9
Table 4.3b shows the same information as Table 4.3a (percentages only) in a different layout, to ease interpretation of the following analyses. Non-parametric (Spearman) correlations were conducted to compare levels of gambling participation for each form of gambling by age for each gender separately. The results are presented in Table 4.4, where a positive correlation indicates that a higher proportion of older people engage in each activity and a negative correlation indicates that a higher proportion of younger people engage in each activity. Note that this analysis requires the relationship to be monotonic over age and does not account for curves.
For both genders, younger gamblers were significantly more likely to take part in informal private betting, table games, horse/harness/greyhound race betting, betting on sports or event results, scratch tickets and phone/SMS competitions. For both genders, older gamblers were more likely to take part in Lotto/Powerball/Pools and raffles/sweeps/other competitions. Older females were more likely to take part in EGM gambling, while the opposite was true for males. Older females were significantly more likely to play bingo; however, there was no significant linear relationship between age and bingo participation for males. There was no significant relationship between age and keno participation for either gender.
The strength of these relationships was also compared statistically, as outlined in the Z column in Table 4.4. The relationship between age and participation was stronger for males for informal private betting, table games, horse/harness/greyhound racing, betting on sports or event results and betting on raffles/sweeps/other competitions compared to that for females; for females the relationship was significantly stronger for phone/SMS competitions.

A comparative study of men and women gamblers in Victoria Hing, Russell, Tolchard & Nower
Victorian Responsible Gambling Foundation Page 44
Table 4.4 Spearman correlations for the relationship between age and participation in each form of gambling for each gender
Female (n = 5,675) Male (n = 5,718) Spearman’s
rho (ρ) p Spearman’s
rho (ρ) p Z
Informal private betting -0.073 <0.001 -0.220 <0.001 8.03 EGMs 0.047 <0.001 -0.036 0.006 n.s. Table games -0.128 <0.001 -0.285 <0.001 8.77 Horse/harness/greyhound racing
-0.065 <0.001 -0.147 <0.001 4.43
Betting on sports or event results
-0.058 <0.001 -0.212 <0.001 8.39
Keno 0.017 n.s. -0.001 n.s. n.s. Lotto/Powerball/Pools 0.184 <0.001 0.211 <0.001 n.s. Scratch tickets -0.055 <0.001 -0.067 <0.001 n.s. Bingo 0.043 0.001 0.008 n.s. n.s. Phone or SMS competitions -0.154 <0.001 -0.095 <0.001 3.20 Raffles, sweeps and other competitions
0.050 <0.001 0.122 <0.001 3.87
Note: The Z column indicates a statistical test of the difference between the correlation coefficients for each gender. Where the z-score is presented, the result is statistically significant (p < 0.05). n.s. means the result is not significant.
4.3 Differences between male and female gamblers in gambling frequency
Respondents were asked how many times they took part in each of eleven different gambling activities during the past 12 months. This information was recoded into those who took part at least annually but less than monthly, at least monthly but less than weekly, and at least weekly. The results are presented in Table 4.5. For all games with significantly different frequencies between genders, males tended to gamble more frequently than females. This was the case for informal betting, EGMs, table games, horse/harness/greyhounds, betting on sports or events results, Lotto/Powerball/Pools, scratch tickets, and raffles/sweeps/other competitions.

A comparative study of men and women gamblers in Victoria Hing, Russell, Tolchard & Nower
Victorian Responsible Gambling Foundation Page 45
Table 4.5 Frequency of play for each gambling form by gender
Females Males Gambling form N % N % Informal private betting At least annually but less often than monthly 86 76.1 294 70.2 At least monthly but less often than weekly 12 10.6 86 20.5* At least weekly 15 13.3 39 9.3
χ2 (2, N = 532) = 6.56, p = 0.038, Φ = 0.11 EGMs At least annually but less often than monthly 1,181 74.7* 1,212 70.5 At least monthly but less often than weekly 296 18.7 363 21.1 At least weekly 105 6.6 144 8.4
χ2 (2, N = 3,301) = 7.65, p = 0.022, Φ = 0.05 Table games At least annually but less often than monthly 140 95.2* 499 89.3 At least monthly but less often than weekly 6 4.1 36 6.4 At least weekly 1 0.7 24 4.3*
n.s. chi-square test, but significant post-hoc tests indicated above Horse/harness/greyhound racing At least annually but less often than monthly 832 88.1* 1,072 67.9 At least monthly but less often than weekly 73 7.7 235 14.9* At least weekly 39 4.1 271 17.2*
χ2 (2, N = 2,522) = 138.46, p < 0.001, Φ = 0.23 Betting on sports or events results At least annually but less often than monthly 79 66.9 283 57.5 At least monthly but less often than weekly 20 16.9 128 26.0* At least weekly 19 16.1 81 16.5
n.s. chi-square test, but significant post-hoc tests indicated above Keno At least annually but less often than monthly 116 73.0 148 74.0 At least monthly but less often than weekly 10 6.3 23 11.5 At least weekly 33 20.8 29 14.5
n.s. Lotto/Powerball/Pools At least annually but less often than monthly 1,683 46.0* 1,361 37.3 At least monthly but less often than weekly 632 17.3 839 23.0* At least weekly 1,344 36.7 1,445 39.6*
χ2 (2, N = 7,304) = 66.82, p < 0.001, Φ = 0.10 Scratch tickets At least annually but less often than monthly 1,046 77.4* 712 71.1 At least monthly but less often than weekly 226 16.7 210 21.0* At least weekly 80 5.9 80 8.0*
χ2 (2, N = 2,354) = 12.28, p = 0.002, Φ = 0.07 Bingo At least annually but less often than monthly 131 48.5 27 48.2 At least monthly but less often than weekly 49 18.1 7 12.5 At least weekly 90 33.3 22 39.3
n.s. Phone or SMS competitions At least annually but less often than monthly 641 84.7 299 80.6 At least monthly but less often than weekly 105 13.9 65 17.5 At least weekly 11 1.5 7 1.9
n.s. Raffles, sweeps and other competitions At least annually but less often than monthly 3,165 87.7* 2,456 82.3 At least monthly but less often than weekly 384 10.6 421 14.1* At least weekly 60 1.7 106 3.6*
χ2 (2, N = 6,592) = 44.83, p < 0.001, Φ = 0.08 * indicates the significantly higher proportion. n.s means the result is not significant.

A comparative study of men and women gamblers in Victoria Hing, Russell, Tolchard & Nower
Victorian Responsible Gambling Foundation Page 46
4.4 Differences between male and female gamblers in problem gambling
Two different measures of problem gambling were used. The NODS CLiP is a measure of life-time problem gambling and respondents are split into four categories depending on their score on the scale. The PGSI is a measure of recent (last 12 months) problem gambling and once again respondents are split into four categories depending on their score on the scale. The reliability for the 16 NODS CLiP items in this survey was low, with a Cronbach’s alpha of 0.63. In contrast, the reliability for the nine PGSI scale items was good, with a Cronbach’s alpha of 0.87. Thus, the results from both scales will be reported here, although the PGSI will be used for subsequent gambling comparisons due to its immediate relevance rather than the possible measure of past gambling problems.
In both measures, a significantly higher proportion of females were classified as non-problem gamblers. For every one of the other levels of problem gambling, the proportion of males was significantly higher than that of females. That is, male gamblers were significantly more likely to have had some level of problem gambling both at some point in their life and at some point in the last 12 months (Table 4.6).
Table 4.6 Problem gambling by gender
Females Males Problem gambling N % N % NODS CLiP (lifetime) Non-problem gambler 5,454 95.2* 4,975 90.3 At-risk gambler 179 3.1 358 6.5* Problem gambler 42 0.7 95 1.7* Pathological gambler 52 0.9 80 1.5*
χ2 (3, N = 11,235) = 103.88, p < 0.001, Φ = 0.10 PGSI (last 12 months) Non-problem gambler 5,198 90.8* 4,690 85.1 Low risk gambler 349 6.1 527 9.6* Moderate risk gambler 143 2.5 220 4.0* Problem gambler 37 0.6 71 1.3*
χ2 (3, N = 11,235) = 85.07, p < 0.001, Φ = 0.09 * indicates the significantly higher proportion.
4.5 Differences between male and female gamblers in gambling expenditure
Respondents were asked about how much money they spent in the past 12 months on the single form on which they spent the most. The results are presented in Table 4.7. As can be seen from the standard deviations and from the highest spends for each gender, some respondents reported very high amounts.
Parametric tests were not appropriate for expenditure due to skew in the data. Thus a non-parametric test was run to compare the genders and the difference was significant, indicating that males spent more than females on gambling in the previous 12 months, U(4,556) = 2,049,432.5), Z = 12.99 p < 0.001.

A comparative study of men and women gamblers in Victoria Hing, Russell, Tolchard & Nower
Victorian Responsible Gambling Foundation Page 47
Table 4.7 Spend per annum on single highest-spend gambling activities by gender
N Mean SD Median Female 2,231 664.04 6,877.99 100.00 Male 2,327 2,958.59 45,462.76 208.00
4.6 Differences between male and female gamblers in main gambling channel
For each form of gambling in the past 12 months, the respondents were asked where they did their gambling (referred to here as an access channel). The respondents could identify more than one access channel, although most only identified one. Thus the analyses below compare the primary access channel for each form of gambling by gender.
There were no significant differences between the genders in terms of where they took part in keno, table games, horse/harness/greyhound racing, bingo, Lotto/Powerball/Pools or phone/SMS competitions. Significant differences were observed for poker machines, sports or events results, scratch ticket play and raffles/sweeps/other competitions. These are outlined in Table 4.8. Males were significantly more likely than females to play EGMs at Crown Casino, while females were significantly more likely than males to play them in another state or at other venues apart from those listed in Table 4.8. For sports or events results, males were significantly more likely to place their bets in Victorian pubs or at an off-track Victorian TAB compared to females, while females were significantly more likely to place them in other venues, although this result should be interpreted with caution due to the small number of females who bet on sports. Males were significantly more likely than females to buy scratch tickets at Victorian newsagents, while females were significantly more likely to buy them at a Tatts venue or kiosk. For raffles, females were significantly more likely to buy tickets over the phone, at a school, through a charity/community organisation or hospital, or other venues compared to males, while males were more likely to buy them in relation to sports clubs, pubs or through door-to-door sales.

A comparative study of men and women gamblers in Victoria Hing, Russell, Tolchard & Nower
Victorian Responsible Gambling Foundation Page 48
Table 4.8 Gambling channel by gambling form and by gender
Females Males Gambling form N % N % EGMs Victorian clubs 721 45.5 781 45.4 Victorian pubs 415 26.2 470 27.3 Crown Casino 264 16.7 335 19.5* Other Australian State 36 2.3* 22 1.3 Other 147 9.3* 111 6.5
χ2 (4, N = 3,302) = 17.06, p = 0.002, Φ = 0.07 Sports or events results Victorian pubs 10 8.6 79 16.1* Over the Internet 25 21.6 101 20.5 Off-track at a Victorian TAB 29 25.0 243 49.4* Other 52 44.8* 69 14.0
χ2 (3, N = 608) = 60.83, p < 0.001, Φ = 0.32 Scratch tickets Tatts venue/kiosk 443 32.7* 277 27.7 Newsagent in Victoria 854 63.1 684 68.3* Other 56 4.1 40 4.0
χ2 (2, N = 2,354) = 7.26, p = 0.027, Φ = 0.06 Raffles, sweeps and other competitions Clubs (e.g. football, sports) 487 13.5 741 24.8* Pubs 19 0.5 61 2.0* Over the phone 461 12.8* 234 7.8 Through door-to-door sales 75 2.1 116 3.9* At a school 716 19.8* 372 12.5 At a workplace/office 347 9.6 410 13.7* Through the mail 295 8.2 226 7.6 Charity/community organisation/hospital 93 2.6* 43 1.4 Other 1,116 30.9* 783 26.2
χ2 (8, N = 6,595) = 301.29, p < 0.001, Φ = 0.21 * indicates the significantly higher proportion.
4.7 Differences between male and female gamblers in whom they gambled with
When asked who they mostly played with when they gambled on their highest-spend activity, more than half of each gender reported gambling alone. There were no gender differences in terms of gambling alone or with one other person. However, males were significantly more likely than females to report gambling in groups (Table 4.9).
Table 4.9 Who the respondent prefers to gamble with by gender
Females Males N % N % Alone 1,257 54.8 1,268 53.0 With one other person 541 23.6 514 21.5 With several people in a group 497 21.7 611 25.5*
χ2 (2, N = 4,688) = 10.42, p = 0.005, Φ = 0.05 * indicates the significantly higher proportion.

A comparative study of men and women gamblers in Victoria Hing, Russell, Tolchard & Nower
Victorian Responsible Gambling Foundation Page 49
4.8 Differences between male and female gamblers in number of gambling venues
Respondents were asked to estimate the total number of venues they had patronised during the past 12 months to play EGMs, table games, horse/harness/greyhound racing, sports and events betting, keno and bingo. Answers were recoded into the following categories: “one venue”, “two venues”, “three venues” and “four or more venues”. These recoded variables were compared by gender. Significant gender differences were found for horse/harness/greyhound racing, sports and events betting and keno (see Table 4.10). In all three forms of gambling, females were significantly more likely to gamble at one venue compared to males, while males were significantly more likely to gamble at more than one venue. However, the small number of females taking part in sports or events betting and keno limits this analysis and the reader should use caution when interpreting the analysis.
Table 4.10 Number of venues gambled in over the last 12 months by form by gender
Females Males Gambling form N % N % Horse/harness/greyhound racing One venue 301 75.3* 370 48.3 Two venues 60 15.0 152 19.8* Three venues 17 4.3 95 12.4* Four or more venues 22 5.5 149 19.5*
χ2 (3, N = 1,166) = 89.61, p < 0.001, Φ = 0.28 Sports or events results One venue 39 88.6* 177 60.8 Two venues 1 2.3 47 16.2* Three venues 0 0.0 31 10.7* Four or more venues 4 9.1 36 12.4
χ2 (3, N = 335) = 14.76, p = 0.002, Φ = 0.21 Keno One venue 72 80.0* 58 59.2 Two venues 8 8.9 19 19.4* Three venues 6 6.7 12 12.2 Four or more venues 4 4.4 9 9.2
χ2 (3, N = 188) = 9.59, p = 0.022, Φ = 0.23 * indicates the significantly higher proportion.
4.9 Differences between male and female gamblers in specific questions for each gambling form
The respondents were asked specific questions about how they gambled on certain forms of gambling during the past 12 months to inform the research objective and DoJ Questions of Interest pertaining to styles of play.
4.9.1 EGMs For EGMs, gender differences were non significant regarding the influence of linked jackpots on choice of EGM. However, males were significantly more likely than females to play higher denominations of machines and to bet more than one credit per line on the pokies. These results are presented in Table 4.11.

A comparative study of men and women gamblers in Victoria Hing, Russell, Tolchard & Nower
Victorian Responsible Gambling Foundation Page 50
Table 4.11 EGM gambling behaviour by gender
Females Males EGM gambling behaviour N % N % EGM denomination One cent 404 52.1* 345 40.2 Two cent 185 23.8 200 23.8 Five cent 121 15.6 161 18.7 Ten, twenty or fifty cent 23 3.0 45 5.2* $1 or $2 15 1.9 62 7.2* Combination of the above 28 3.6 46 5.4
χ2 (5, N = 1,635) = 47.00, p < 0.001, Φ = 0.17 How often respondent bet more than 1 credit per line Never 217 28.8* 176 20.2 Rarely 141 18.7 141 16.2 Sometimes 157 20.8 158 18.1 Often 85 11.3 126 14.4 Always 154 20.4 272 31.2
χ2 (4, N = 1,627) = 36.42, p < 0.001, Φ = 0.15 * indicates the significantly higher proportion.
4.9.2 Horse/harness/greyhound racing For horse/harness/greyhound racing, there were no significant gender differences in terms of betting in a syndicate, with about 90% of both genders betting alone on this form (Table 4.12). However, significant differences were observed in the types of bet placed, with females more likely to bet each way, while males were more likely to bet on trifectas, possibly indicating a more cautious approach in horse/harness/greyhound race betting for females.
Table 4.12 Horse/harness/greyhound betting behaviour by gender
Females Males Type of bet placed N % N % Win/place bet 231 56.3 444 56.9 Each way 104 25.4* 151 19.3 Trifecta 33 8.0 106 13.6* Other 42 10.2 80 10.2
χ2 (3, N = 1,191) = 11.61, p = 0.009, Φ = 0.10 Note: based on first answer only. * indicates the significantly higher proportion.
4.9.3 Sports or events betting As there were very few females who gambled on this form who responded to these questions, gender differences were unclear. There is some evidence to suggest that males were more likely to bet on more exotic forms; for example, 38 males (12.9%) reporting that they bet with multibets, compared to 0 females. However, due to a particularly low count in many cells for this analysis, the results are questionable.

A comparative study of men and women gamblers in Victoria Hing, Russell, Tolchard & Nower
Victorian Responsible Gambling Foundation Page 51
4.9.4 Lotto/Powerball/Pools Respondents were asked whether they played in a syndicate and whether they picked their own numbers when playing Lotto/Powerball/Pools during the past 12 months. Approximately 82% of both genders denied playing in a syndicate and approximately 65% of both genders reported relying on Quickpick to choose their numbers. There were no significant gender differences for either of these questions.
Respondents were also asked how many numbers they typically picked per game and how many squares they selected per week when playing Lotto, Powerball Or Pools. The results, presented in Table 4.13, indicate that males tended to pick significantly more numbers per week (t(2196.15) = 4.04, p < 0.001, d = 0.17), but significantly fewer squares per year (t(3030.82) = 2.45, p = 0.014, d = 0.09) than females.
Table 4.13 Lotto/Powerball/Pools gambling behaviour by gender
N Mean SD Median Lowest Highest Numbers of numbers picked per game
Female 1,076 6.68 2.39 6.00 1.00 30.00 Male 1,224 7.17 3.39 6.00 1.00 30.00
Number of squares picked per week
Female 1,509 38.39 40.47 12.00 1.00 125.00 Male 1,594 34.98 36.72 17.34 1.00 180.00
4.9.5 Other gambling forms There were few significant differences between male and female gamblers on the other forms of gambling. No clear differences emerged in terms of the denomination of scratch tickets that respondents tended to buy, nor in terms of how many bingo books respondents bought each time they went to bingo. Females tended to play more bingo books simultaneously compared to males, χ2 (3, N = 164) = 9.83, p = 0.020, Φ = 0.25, although this result is based on the answers of only 22 males, so should be treated with caution. There were no significant differences in terms of how respondents mainly entered phone/SMS competitions.
4.10 Differences between male and female gamblers in money management for gambling on main activity
Respondents were asked three questions about their money management behaviour, as outlined in Table 4.14. In general, females appear to have acted more prudently in their money management when gambling during the past 12 months than males, with more than half of the females denying taking bank cards to gambling, while males were significantly more likely to take a credit card or both a credit card and ATM/EFTPOS card. Furthermore, males were significantly more likely to take relatively large amounts of cash with them to cover expenses and were significantly more likely to withdraw money for gambling purposes compared to females.

A comparative study of men and women gamblers in Victoria Hing, Russell, Tolchard & Nower
Victorian Responsible Gambling Foundation Page 52
Table 4.14 Money management techniques by gender
Females Males Money management technique N % N % Type of cards taken to gambling, even if not used EFTPOS/ATM card 380 17.1 443 19.1 Credit card 61 2.7 92 4.0* Both 651 29.3 800 34.6* No cards 1,128 50.8* 980 42.3
χ2 (3, N = 4,535) = 34.82, p < 0.001, Φ = 0.09 Amount of money brought to gambling (to cover food, gambling and other expenses) None 225 9.8* 191 8.0 Up to $20 712 30.9* 568 23.7 $20-$50 481 20.9 488 20.3 $51-$100 737 32.0 712 29.7 $101-$200 111 4.8 239 10.0* More than $200 39 1.7 201 8.4*
χ2 (5, N = 4,704) = 173.81, p < 0.001, Φ = 0.19 Number of times respondent would withdraw money for gambling during a single session Not at all 911 82.3* 1,054 77.8 Once 152 13.7 223 16.5 Twice 20 1.8 57 4.2* Three times 13 1.2 10 0.7 Four or more times 11 1.0 11 0.8
χ2 (4, N = 2,462) = 17.21, p = 0.002, Φ = 0.08 * indicates the significantly higher proportion.
4.11 Differences between male and female gamblers in main reasons for gambling on highest spend activity
Respondents were asked about their main reasons for gambling on their highest spend activity and were allowed to give up to three answers. The first-reported reasons are presented in Table 4.15. Males were significantly more likely to gamble for social reasons or for general entertainment, while females were more likely to gamble to raise money for charity or for other reasons. A further 1,602 respondents gave secondary reasons and 609 gave tertiary reasons, with social reasons, to win money and for general entertainment being the most popular choices.
Table 4.15 Main reasons for gambling on highest spend activity by gender
Females Males Main reason for gambling on highest spend activity
N % N %
Social reasons 435 18.9 536 22.3* To win money 916 39.7 995 41.5 General entertainment 339 14.7 445 18.5* Raise money for charity 258 11.2* 129 5.4 Other 359 15.6* 294 12.3
χ2 (4, N = 4,706) = 75.80, p < 0.001, Φ = 0.13 * indicates the significantly higher proportion.

A comparative study of men and women gamblers in Victoria Hing, Russell, Tolchard & Nower
Victorian Responsible Gambling Foundation Page 53
4.12 Differences between male and female gamblers in attitudes to gambling in Victoria
The respondents were asked to respond to five statements about their attitudes to gambling in Victoria. These statements were: 1) “The Victorian Government is taking positive action to encourage responsible gambling in Victoria”, 2) “Gambling is a serious social problem in Victoria”, 3) “Gambling provides a lot of fun for the community”, 4) “Gambling is too widely accessible in my local council/shire” and 5) “Governments need to do more to address problem gambling in my local council/shire”. Responses were collected using a 5-point Likert scale ranging from 1 (Strongly disagree) to 5 (Strongly agree). The genders were compared on their answers using non-parametric analyses (Table 4.16).
Thus, females were significantly more likely to agree that gambling is a serious social problem in Victoria compared to males (U = 2,449,583, Z = 6.16, p < 0.001), to agree that gambling is too widely accessible in their local council/shire (U = 2,409,063, Z = 4.14, p < 0.001) and to disagree that gambling provides a lot of fun for the community (U = 2,445,439.5, Z = 6.11, p < 0.001).
Table 4.16 Attitudes to gambling in Victoria by gender
N Mean SD Median The Victorian Government is taking positive action to encourage responsible gambling in Victoria
Female 2,224 3.11 1.18 3.00 Male 2,330 3.12 1.23 3.00
Gambling in a serious social problem in Victoria Female 2,256 4.30 0.93 5.00 Male 2,361 4.13 0.98 4.00
Gambling provides a lot of fun for the community Female 2,257 2.54 1.13 2.00 Male 2,370 2.76 1.16 3.00
Gambling is too widely accessible in my local council/shire
Female 2,190 3.64 1.18 4.00 Male 2,313 3.49 1.20 4.00
Governments need to do more to address problem gambling in my local council/shire
Female 2,160 3.69 1.09 4.00 Male 2,319 3.62 1.12 4.00
Note: Responses were collected on a Likert scale where 1 = Strongly disagree, 3 = Neutral and 5 = Strongly agree. Thus, means below 3 indicate general disagreement with the statement, while means above 3 indicate general agreement. Lowest and highest scores are not presented as they were 1 and 5 respectively for all statements.
4.13 Differences between male and female gamblers in physical and mental health 4.13.1 Smoking
A significantly higher proportion of males reported smoking in the past 12 months (29.7% vs 25.6% of females, χ2 (1, N = 4,706) = 10.10, p = 0.001, Φ = 0.05) and current smoking (22.8% vs 19.8% of females, χ2 (1, N = 4,706) = 6.46, p = 0.011, Φ = 0.04). Of those who did smoke, males tended to smoke more cigarettes per day compared to females (t(996) = 3.48, p = 0.001, d = 0.22).
The vast majority of respondents reported that the 2007 ban on smoking in venues had had no effect on their gambling. For females, this figure was 95.3%, which was significantly higher than the 94.0% of males who said the same. A significantly higher proportion of males (3.8%) reported that the ban had decreased their gambling compared to 2.4% of females; there was no significant difference between the genders in terms of gambling being increased because of the ban. The omnibus test for this question was significant, χ2 (2, N = 4,620) = 7.24, p = 0.027, Φ = 0.04..

A comparative study of men and women gamblers in Victoria Hing, Russell, Tolchard & Nower
Victorian Responsible Gambling Foundation Page 54
4.13.2 Alcohol use (CAGE) The CAGE scale was administered to the respondents and the reliability for this scale was relatively low (Cronbach’s alpha = 0.65). The mean CAGE score for males was 0.59 (SD = 0.99), which was significantly higher than the mean CAGE score of 0.33 (SD = 0.74) for females, t(3840.35) = 9.64, p < 0.001, d = 0.31. The same pattern was observed when CAGE score was tested with a non-parametric analysis (U = 1,675,467.5, Z = 9.72, p < 0.001).
4.13.3 Drug use Respondents were asked about their recreational use of various drugs in the past 12 months. There were no significant differences by gender regarding use of prescription pain killers, ecstasy/designer drugs, cocaine/crack, amphetamines, tranquilisers, inhalants, heroin, hallucinogens, GHB, barbiturates, growth/muscle promoting steroids or methadone.
A significantly higher proportion of men (21.3%) reported using marijuana/hashish at least occasionally compared to 12.8% of women, χ2 (1, N = 466) = 5.27, p = 0.022, Φ = 0.11. There was no relationship between marijuana/hashish use, gender and Kessler 10 categories.
4.13.4 Physical and mental health Respondents were asked whether they had suffered any trauma or hardship in their past. They were also asked about their current health conditions in terms of heart conditions/high blood pressure/high cholesterol, diabetes, cancer, lung conditions including asthma, depression, anxiety disorders, obesity, or other physical or mental health conditions.
No significant differences were found between the genders for: heart conditions/high blood pressure/high cholesterol, diabetes, cancer, lung conditions including asthma or other physical or mental health conditions. A significantly higher proportion of males (84.2%) reported trauma compared to 74.0% of females, χ2 (1, N = 4,704) = 74.42, p < 0.001, Φ = 0.13. For depression, anxiety and obesity, the proportions were higher for females (12.4%, 11.0% and 11.1% respectively) compared to males (9.0%, 7.7% and 7.6% respectively), with the smallest differences reported for depression χ2 (1, N = 4,706) = 13.51, p < 0.001, Φ = 0.05. A more general measure of mental health was established using the Kessler 10 scale. The reliability for this scale was good (Cronbach’s alpha =0.87). The scale was analysed both as a continuous scale and as a categorical scale.
When measured as a continuous scale, females exhibited a significantly higher level of psychological distress (M = 13.93, SD = 5.38) compared to males (M = 13.30, SD = 4.96), t(4638.61) = 4.16, p < 0.001, d = 0.12 and the same pattern was observed when analysed using a non-parametric analysis (U = 2,557,373, Z = 5.51, p < 0.001).
When the Kessler 10 was treated as a categorical variable, similar differences emerged. Overall, 87.9% of females were classified as likely to be well, which was significantly lower than the 91.0% of males that were classified as likely to be well. A significantly higher proportion of females (2.7%) were likely to have a severe mental disorder, compared to 1.8% of males, with no differences between the genders for being likely to have a mild or moderate mental disorder. The overall omnibus test was significant, χ2 (1, N = 3,358) = 11.98, p = 0.007, Φ = 0.05. The respondents were also asked about whether they had considered taking their own lives in the past 12 months. Only moderate risk and problem gamblers answered the question, with around 6% of moderate risk gamblers and 27% of

A comparative study of men and women gamblers in Victoria Hing, Russell, Tolchard & Nower
Victorian Responsible Gambling Foundation Page 55
problem gamblers of both genders saying that they had contemplated suicide. There were no significant gender differences overall. Kessler 10 scores were also taken into account for this analysis, but due to the low number of respondents saying that they had contemplated suicide, the analysis was not significant, most likely due to a lack of power.
4.14 Differences between male and female gamblers in family and early gambling influences and experiences
Male moderate risk and problem gamblers (M = 20.77, SD = 8.97) started gambling at a significantly younger age than female moderate risk and problem gamblers (M = 29.40, SD = 14.25), t(265.71) = 7.24, p < 0.001, d = 0.89.
There were some significant gender differences in terms of with whom they first gambled. Females were significantly more likely to be introduced to gambling by a male or female family member, while males were more likely to be introduced by a friend who they did not live with. These differences are outlined in Table 4.17.
Table 4.17 Who moderate risk and problem gamblers started gambling with by gender
Females Males Response N % N % By yourself 23 12.9 52 17.9 With a friend who didn’t live with you 73 41.0 149 51.4* With a friend who was also a housemate 16 9.0 26 9.0 With a male relative 29 16.3* 24 8.3 With a female relative 29 16.3* 23 7.9 Other 8 4.5 16 5.5
χ2 (5, N = 468) = 17.65, p = 0.003, Φ = 0.19 * indicates the significantly higher proportion.
Moderate risk and problem gamblers were asked to identify their first form of gambling at initiation from a list of 14 options. These were reclassified into the categories shown in Table 4.18 based on preliminary analyses. Significant gender differences were observed, with EGMs and other forms being the most common for females, whereas males were significantly more likely to have started on horse/harness/greyhound racing, table games or informal private betting (see Table 4.18). Note that the results for informal private betting and table games are based on a small number of female respondents and should be interpreted with caution.
Table 4.18 Form on which moderate risk and problem gamblers first gambled by gender
Females Males Response N % N % Informal private betting 4 2.2 29 10.0* EGMs 93 51.7* 64 22.0 Table games 7 3.9 51 17.5* Horse/harness/greyhound racing 27 15.0 101 34.7* Other forms (combined) 49 27.2* 46 15.8
χ2 (4, N = 471) = 78.77, p < 0.001, Φ = 0.41 * indicates the significantly higher proportion.

A comparative study of men and women gamblers in Victoria Hing, Russell, Tolchard & Nower
Victorian Responsible Gambling Foundation Page 56
When moderate risk and problem gamblers were asked about the trigger for gambling initiation, there were no significant differences between the genders. The most popular reasons were for general entertainment (around 40% of both genders), social reasons (around 32% of both genders) and to win money (around 15% of both genders).
4.15 Differences between male and female gamblers in gambling help-seeking behaviour
Of the moderate risk and problem gamblers, 8.9% reported having sought help in the past 12 months. There were no significant gender differences regarding the proportion who had sought help, although among problem gamblers, a significantly higher proportion of females (40.5%) reported seeking help compared to 18.1% of males, χ2 (1, N = 109) = 6.47, p = 0.011, Φ = 0.24.
Due to a low response rate to questions regarding help seeking (n=40), we have not reported any tests of significance and instead seek to summarise the results. As the percentages reported below are based on small Ns, they should be interpreted with caution.
Respondents were asked to state who they saw for help. Of males who had sought help, 36.8% saw a counselling professional compared to 9.5% of females. Of males who had sought help, 31.6% approached a male friend, while no females did so. In contrast, 28.6% of females reported seeing a female relative, while no males did so. For both males and females, gamblers endorsed themselves a their primary referral source (71.4% of females, 78.9% of males).
Of the moderate risk and problem gamblers who had not sought help (N = 428), 12 respondents stated that they wanted help in the last 12 months but did not seek it. Five of these were female and seven male. When asked why they had not sought help, six of these twelve said that they thought that they could solve the problem themselves.
Respondents were asked about the usefulness of certain types of activities or thoughts in terms of reducing gambling. No significant gender differences were observed for “having a wider social network”, “having more money available”, “information on the odds of winning in gambling”, “having more outside leisure activities and interests” or “finding a relationship partner”. Significant differences were only observed for “counselling to help overcome a difficult time in the past”. All items were measured on a 1-5 Likert scale, with 1 = not at all useful and 5 = very useful. Thus, higher scores indicate more perceived usefulness. The mean for females on this item was 2.76 (SD = 1.76), which was significantly higher than the mean for males (M = 2.22, SD = 1.51), t(327.03) = 3.34, p < 0.001, d = 0.37.
Respondents were also asked about whether others had encouraged them to reduce their gambling in the last 12 months. No significant gender differences were observed for: employer, relationship partner, relatives or their doctor or health professional. Males were significantly more likely to report a lot of encouragement from their friends (12.6%) compared to females (5.1%), χ2 (2, N = 464) = 7.18, p = 0.028, Φ = 0.12.
The Readiness to Change scale was also administered to respondents. This scale is arranged into three subscales: precontemplation, contemplation and action. However, there were no significant differences between the genders for any of these subscales so we have not reported all of the analyses for this scale.

A comparative study of men and women gamblers in Victoria Hing, Russell, Tolchard & Nower
Victorian Responsible Gambling Foundation Page 57
Chapter Five: Similarities and Differences Between Male and Female Non-Problem and At-Risk Gamblers
5.1 Introduction This chapter addresses Research Objective Two, which was to: analyse the similarities and differences between male and female non-casual gamblers (see Section 3.4) in Victoria in terms of risk factors associated with problem/moderate risk gambling and protective factors associated with low risk/non-problem gambling. Analytical methods were explained in Chapter Three.
Of the 15,000 respondents in the sample, 8,919 indicated that they were non-casual gamblers. The weighted proportion of males amongst these gamblers was 50.6% (n = 4,512).
Most tests in this chapter compare non-problem and at-risk gamblers separately for males and for females, as well as comparing female non-problem gamblers to male non-problem gamblers and then female at-risk gamblers to male at-risk gamblers. An interaction term was then calculated to determine whether the difference between non-problem and at-risk female gamblers is significantly different to the difference between non-problem and at-risk male gamblers. An example of how to read these tables was presented in Section 3.4.
5.2 Demographic factors associated with at-risk and non-problem gambling
5.2.1 Age For both genders, significantly higher proportions of at risk gamblers were found in younger age brackets compared to non-problem gamblers. Amongst males, those aged between 18-34 years were more likely to be at-risk, as were females aged between 18-24 years. Conversely, both males and females aged 65 years or over were significantly more likely to be non-problem gamblers compared to their counterparts in the younger age groups. Furthermore, a significant interaction indicates that the pattern of results differed significantly across the genders (Table 5.1). In particular, younger males were more likely to be at-risk compared to younger females, while older females were more likely to be non-problem gamblers compared to older males.

A comparative study of men and women gamblers in Victoria Hing, Russell, Tolchard & Nower
Victorian Responsible Gambling Foundation Page 58
Table 5.1 Percentage of non-problem and at risk gamblers in each age group by gender
F M NP AR Age NP AR NP AR F M F M N 4,228 179 4,226 284 4,228 4,226 179 284 18-24 8.7 16.8* 11.7 23.2* 8.7 11.7^ 16.8 23.2 25-34 16.2 12.8 16.7 23.9* 16.2 16.7 12.8 23.9^ 35-44 19.7 16.2 19.7 17.6 19.7 19.7 16.2 17.6 45-54 20.0 22.9 20.3* 14.1 20.0 20.3 22.9^ 14.1 55-64 15.8 17.9 15.3 13.0 15.8 15.3 17.9 13.0 65+ 19.6* 13.4 16.4* 8.1 19.6^ 16.4 13.4 8.1 Difference χ2 (5, N = 4,407)
= 19.12, p = 0.002, Φ = 0.07
χ2 (5, N = 4,510) = 54.77, p <
0.001, Φ = 0.11
χ2 (5, N = 8,454) = 31.15, p <
0.001, Φ = 0.06
χ2 (5, N = 463) = 18.89, p = 0.002,
Φ = 0.20 Interaction χ2 (5, N = 8,919) = 13.31, p = 0.021
Note: * indicates differences between non-problem and at-risk gamblers for each gender. ^ indicates differences between each gender separately for non-problem and at-risk gamblers.
5.2.2 Language spoken at home For both genders, at-risk gamblers were significantly more likely to speak a language other than English at home compared to non-problem gamblers (Table 5.2), although this difference did not differ by gender. For both levels of problem gambling, male non-casual gamblers were significantly more likely to speak a language other than English at home compared to females.
Table 5.2 Percentage of non-problem and at risk gamblers who speak a language other than English at home by gender
F M NP AR NP AR NP AR F M F M N 4,228 179 4,228 284 4,228 4,228 179 284 Speaks a language other than English at home
11.9 17.9* 16.6 27.5* 11.9 16.6^ 17.9 27.5^
Difference χ2 (1, N = 4,407) = 5.65, p = 0.017, Φ =
0.04
χ2 (1, N = 4,512) = 22.19, p < 0.001, Φ =
0.07
χ2 (1, N = 8,456) = 36.80, p < 0.001, Φ =
0.07
χ2 (1, N = 463) = 5.57, p = 0.018, Φ =
0.11 Interaction χ2 (1, N = 8,919) = 0.51, ns
Note: * indicates differences between non-problem and at-risk gamblers for each gender. ^ indicates differences between each gender separately for non-problem and at-risk gamblers.
5.2.3 Education In terms of education, for both genders, at-risk gamblers were significantly more likely to not have completed school beyond Year 10 compared to non-problem gamblers, while non-problem gamblers were significantly more likely to have attended university, particularly male non-problem gamblers. There is some evidence to suggest that female at-risk gamblers were more likely to have lower education compared to male at-risk gamblers. There was no significant interaction, indicating that this difference in terms of education did not differ between the genders (Table 5.3).

A comparative study of men and women gamblers in Victoria Hing, Russell, Tolchard & Nower
Victorian Responsible Gambling Foundation Page 59
Table 5.3 Percentage of non-problem and at risk gamblers by education by gender
F M NP AR Education NP AR NP AR F M F M N 4,182 174 4,185 283 4,182 4,185 174 283 University 25.3* 15.5 27.2* 17.7 25.3 27.2^ 15.5 17.7 TAFE or trade qualification
18.7 14.4 21.3 19.4 18.7 21.3^ 14.4 19.4
Year 12 20.9 21.3 23.5 26.5 20.9 23.5^ 21.3 26.5 Year 10 or lower
35.2 48.9* 28.2 36.4* 35.2^ 28.2 48.9^ 36.4
Difference χ2 (3, N = 4,356) = 16.84, p =
0.001, Φ = 0.06
χ2 (3, N = 4,468) = 16.80, p =
0.001, Φ = 0.06
χ2 (3, N = 8,367) = 47.36, p <
0.001, Φ = 0.08
χ2 (3, N = 457) = 7.15, n.s.
Interaction χ2 (5, N = 8,919) = 13.31, p = 0.021 Note: * indicates differences between non-problem and at-risk gamblers for each gender. ^ indicates differences between each gender separately for non-problem and at-risk gamblers.
5.2.4 Living arrangements For both genders, at-risk gamblers were significantly more likely to live in group households compared to non-problem gamblers. For females, a significantly higher proportion of at-risk gamblers lived in one-parent family households, whereas a significantly higher proportion of non-problem gamblers lived as couples with children. For males, a significantly higher proportion of non-problem gamblers lived as a couple without children. While there were differences in which results were significant for males and for females, the overall omnibus interaction test was not statistically significant (Table 5.4).
Table 5.4 Percentage of non-problem and at risk gamblers in each household type by gender
F M NP AR NP AR NP AR F M F M N 4,215 177 4,208 284 4,215 4,208 177 284 Couple with child(ren)
48.8* 40.7 51.0 47.9 48.8 51.0 40.7 47.9^
One parent family
8.7 14.1* 4.7 7.0 8.7^ 4.7 14.1^ 7.0
Other family 4.7 6.8 4.3 6.7 4.7 4.3 6.8 6.7 Couple without children
25.8 20.3 28.2* 16.9 25.8 28.2^ 20.3 16.9
Group household (not related)
2.4 9.6* 4.1 10.6* 2.4 4.1^ 9.6 10.6
Lone person 9.5 8.5 7.7 10.6 9.5^ 7.7 8.5 10.6 Other household
0.0 0.0 0.1 0.4 0.0 0.1 0.0 0.4
Difference χ2 (6, N = 4,392) = 44.22, p <
0.001, Φ = 0.10
χ2 (6, N = 4,492) = 48.41, p <
0.001, Φ = 0.10
χ2 (6, N = 8,423) = 84.93, p <
0.001, Φ = 0.10
χ2 (6, N = 461) = 8.78, n.s.
Interaction χ2 (6, N = 8,893) = 5.90, ns Note: * indicates differences between non-problem and at-risk gamblers for each gender. ^ indicates differences between each gender separately for non-problem and at-risk gamblers.

A comparative study of men and women gamblers in Victoria Hing, Russell, Tolchard & Nower
Victorian Responsible Gambling Foundation Page 60
5.2.5 Employment For both genders, employment categories were associated with problem gambling status. For males, those in full-time employment were significantly less likely to be at-risk gamblers, while the opposite was true for those in part-time employment. A significantly higher proportion of unemployed females were at-risk compared to non-problem gamblers, but those in employment or not in the workforce or away from work did not differ in terms of the proportion of non-problem and at-risk gamblers. Furthermore, the overall pattern of results differed significantly between the genders, indicating that the relationship between employment status and at-risk gambling differed by gender (Table 5.5). In particular, female non-problem and at-risk gamblers were significantly more likely to not be in the workforce compared to their male counterparts, while male non-problem and at-risk gamblers were significantly more likely to be in full-time employment.
Table 5.5 Percentage of non-problem and at risk gamblers by employment status by gender
F M NP AR NP AR NP AR F M F M N 4,225 179 4,221 285 4,225 4,221 179 285 Full-time employment
29.1 23.5 64.4* 55.4 29.1 64.4^ 23.5 55.4^
Part-time employment
29.9 26.8 11.0 19.3* 29.9^ 11.0 26.8 19.3
Unemployed 2.8 7.8* 3.1 4.2 2.8 3.1 7.8 4.2 Not in workforce or away from work
38.2 41.9 21.5 21.1 38.2^ 21.5 41.9^ 21.1
Difference χ2 (3, N = 4,404) = 17.54, p =
0.001, Φ = 0.06
χ2 (3, N = 4,506) = 20.22, p <
0.001, Φ = 0.07
χ2 (3, N = 8,446) = 1129.92, p < 0.001, Φ = 0.37
χ2 (3, N = 464) = 47.86, p < 0.001,
Φ = 0.32 Interaction χ2 (3, N = 8,919) = 12.67, p = 0.005
Note: * indicates differences between non-problem and at-risk gamblers for each gender. ^ indicates differences between each gender separately for non-problem and at-risk gamblers.
5.2.6 Income For both genders, those in the highest household income bracket ($104,000 or higher) were significantly less likely to be at-risk gamblers. For males, those in the second lowest household income bracket ($33,800-$62,399) were significantly more likely to be at-risk gamblers. Female gamblers of both levels of problem gambling were significantly more likely to live in a lower-income household. However, overall, the pattern of results did not differ between genders (Table 5.6).

A comparative study of men and women gamblers in Victoria Hing, Russell, Tolchard & Nower
Victorian Responsible Gambling Foundation Page 61
Table 5.6 Percentage of non-problem and at risk gamblers by household income by gender
F M NP AR NP AR NP AR F M F M N 2,696 102 3,100 202 2,696 3,100 102 202 $0 - $33,799
21.2 26.5 14.9 14.4 21.2^ 14.9 26.5^ 14.4
$33,800 - $62,399
24.1 29.4 21.4 33.2* 24.1^ 21.4 29.4 33.2
$62,400 - $103,999
31.4 29.4 29.8 33.2 31.4 29.8 29.4 33.2
$104,000 or higher
23.3* 14.7 33.9* 19.3 23.3 33.9^ 14.7 19.3
Difference χ2 (3, N = 2,798) = 5.67, n.s.
χ2 (3, N = 3,302) = 24.90, p <
0.001, Φ = 0.09
χ2 (3, N = 5,796) = 93.39, p <
0.001, Φ = 0.13
χ2 (3, N = 304) = 6.81, n.s.
Interaction χ2 (3, N = 6,208) = 2.66, ns Note: * indicates differences between non-problem and at-risk gamblers for each gender. ^ indicates differences between each gender separately for non-problem and at-risk gamblers.
Table 5.7 indicates that the results for personal income are similar to those for household income, with those in lower brackets ($0-$31,199) significantly more likely to be at-risk, while those in higher brackets ($52,000-$83,199 for females and $83,200 or higher for males) were significantly less likely to be at-risk of gambling problems. Furthermore, female non-casual gamblers of both levels of problem gambling tended to have lower personal incomes than males. Once again, the difference between genders in terms of the relationship between income and at-risk gamblers did not differ significantly by gender.
Table 5.7 Percentage of non-problem and at risk gamblers by personal income by gender
F M NP AR NP AR NP AR F M F M N 2,977 133 3,305 229 2,977 3,305 133 229 $0 - $31,199
59.5 71.4* 30.6 41.0* 59.5^ 30.6 71.4^ 41.0
$31,200 - $51,999
22.9 21.1 24.5 27.5 22.9 24.5 21.1 27.5
$52,000 - $83,199
13.2* 5.3 25.9 24.9 13.2 25.9^ 5.3 24.9^
$83,200 or higher
4.3 2.3 19.0* 6.6 4.3 19.0^ 2.3 6.6
Difference χ2 (3, N = 3,110) = 10.74, p =
0.013, Φ = 0.06
χ2 (3, N = 3,534) = 26.66, p <
0.001, Φ = 0.09
χ2 (3, N = 6,282) = 705.42, p <
0.001, Φ = 0.34
χ2 (3, N = 362) = 37.72, p < 0.001,
Φ = 0.32 Interaction χ2 (3, N = 6,535) = 3.95, ns
Note: * indicates differences between non-problem and at-risk gamblers for each gender. ^ indicates differences between each gender separately for non-problem and at-risk gamblers.

A comparative study of men and women gamblers in Victoria Hing, Russell, Tolchard & Nower
Victorian Responsible Gambling Foundation Page 62
5.3 Gambling forms associated with at-risk and non-problem gambling 5.3.1 Gambling participation
Table 5.8 outlines the forms of gambling that are associated with problem gambling for each gender. For both males and females, a significantly higher proportion of at-risk gamblers (compared to non-problem gamblers) took part in the following activities in the preceding 12 months: EGMs, table games, keno and bingo. The following forms were related to at-risk gambling for men only: informal private betting, horse/harness/greyhound race betting and betting on sports or event results. Instant scratch tickets were related to at-risk gambling for females only. Finally, taking part in raffles, sweeps and other competitions was associated with non-problem gamblers for both genders.
Males of both levels of problem gambling were significantly more likely to take part in: informal private betting, table games, horse/harness/greyhound racing and betting on sports or event results. Females of both levels were significantly more likely to take part in buying scratch tickets and playing bingo. Female non-problem gamblers were significantly more likely than male non-problem gamblers to take part in buying lotto/lottery/Powerball tickets, to take part in phone or SMS competitions or to take part in raffles, sweeps or other competitions.
Furthermore, the interaction tests indicate that EGM participation was significantly more problematic for females than for males, while the opposite was found for table games and horse/harness/greyhound racing. While it would appear that the same is true for sports betting and bingo, there were not enough female at-risk sports betters or male at-risk bingo gamblers for the results to be statistically significant.
Table 5.8 Percentage of non-problem and at risk gamblers who engage in each form of gambling by gender
F M NP AR NP AR NP AR F M F M N 4,228 179 4,227 285 4,228 4,227 179 285 Informal private betting
2.2 4.5 7.8 21.8* 2.2 7.8^ 4.5 21.8^
Difference χ2 (1, N = 4,407) = 3.83, ns
χ2 (1, N = 4,512) = 66.22, p <
0.001, Φ = 0.12
χ2 (1, N = 8,455) = 136.63, p <
0.001, Φ = 0.13
χ2 (1, N = 464) = 25.64, p < 0.001,
Φ = 0.24 Interaction χ2 (1, N = 8,919) = 1.31, ns EGMs 33.8 86.6* 35.3 78.6* 33.8 35.3 86.6^ 78.6 Difference χ2 (1, N = 4,406)
= 208.29, p < 0.001, Φ = 0.22
χ2 (1, N = 4,512) = 211.84, p <
0.001, Φ = 0.22
χ2 (1, N = 8,454) = 2.35, ns
χ2 (1, N = 464) = 4.70, p = 0.030,
Φ = 0.10 Interaction χ2 (1, N = 8,919) = 5.92, p = 0.015 Table games 3.2 6.7* 10.8 36.1* 3.2 10.8^ 6.7 36.1^ Difference χ2 (1, N = 4,407)
= 6.57, p = 0.010, Φ = 0.04
χ2 (1, N = 4,512) = 158.11, p <
0.001, Φ = 0.19
χ2 (1, N = 8,455) = 187.54, p <
0.001, Φ = 0.15
χ2 (1, N = 464) = 51.11, p < 0.001,
Φ = 0.33 Interaction χ2 (1, N = 8,919) = 5.50, p = 0.019 Horse/ harness/ greyhound racing
21.4 22.9 34.0 49.5* 21.4 34.0^ 22.9 49.5^
Difference χ2 (1, N = 4,407) = 0.24, ns
χ2 (1, N = 4,513) = 28.06, p <
0.001, Φ = 0.08
χ2 (1, N = 8,456) = 169.07, p <
0.001, Φ = 0.14
χ2 (1, N = 464) = 32.56, p < 0.001,
Φ = 0.27 Interaction χ2 (1, N = 8,919) = 6.75, p = 0.009

A comparative study of men and women gamblers in Victoria Hing, Russell, Tolchard & Nower
Victorian Responsible Gambling Foundation Page 63
Table 5.8 Percentage of non-problem and at risk gamblers who engage in each form of gambling by gender (cont’d)
F M NP AR NP AR NP AR F M F M N 4,228 179 4,227 285 4,228 4,227 179 285 Betting on sports or event results
2.6 3.9 9.9 25.4* 2.6 9.9^ 3.9 25.4^
Difference χ2 (1, N = 4,406) = 1.14, ns
χ2 (1, N = 4,511) = 65.40, p <
0.001, Φ = 0.12
χ2 (1, N = 8,454) = 192.54, p <
0.001, Φ = 0.15
χ2 (1, N = 463) = 35.67, p < 0.001,
Φ = 0.28 Interaction χ2 (1, N = 8,919) = 3.11, ns Keno 3.3 8.4* 4.0 8.8* 3.3 4.0 8.4 8.8 Difference χ2 (1, N = 4,407)
= 12.80, p < 0.001, Φ = 0.05
χ2 (1, N = 4,512) = 14.57, p <
0.001, Φ = 0.06
χ2 (1, N = 8,455) = 2.82, ns
χ2 (1, N = 464) = 0.02, ns
Interaction χ2 (1, N = 8,919) = 0.15, ns Lotto/ Powerball/ Pools
75.3 70.9 73.1 75.8 75.3^ 73.1 70.9 75.8
Difference χ2 (1, N = 4,406) = 1.78, ns
χ2 (1, N = 4,512) = 0.99, ns
χ2 (1, N = 8,454) = 5.58, p =
0.018, Φ = 0.03
χ2 (1, N = 464) = 1.34, ns
Interaction χ2 (1, N = 8,919) = 2.59, ns Scratch tickets 28.2 40.2* 20.8 24.9 28.2^ 20.8 40.2^ 24.9 Difference χ2 (1, N = 4,406)
= 12.03, p = 0.001, Φ = 0.05
χ2 (1, N = 4,513) = 2.73, ns
χ2 (1, N = 8,455) = 63.51, p <
0.001, Φ = 0.09
χ2 (1, N = 464) = 12.09, p = 0.001,
Φ = 0.16 Interaction χ2 (1, N = 8,919) = 2.05, ns Bingo 5.3 21.2* 1.1 3.2* 5.3^ 1.1 21.2^ 3.2 Difference χ2 (1, N = 4,407)
= 77.95, p < 0.001, Φ = 0.13
χ2 (1, N = 4,511) = 9.19, p =
0.002, Φ = 0.05
χ2 (1, N = 8,455) = 119.39, p <
0.001, Φ = 0.12
χ2 (1, N = 463) = 39.26, p < 0.001,
Φ = 0.29 Interaction χ2 (1, N = 8,919) = 1.28, ns Phone or SMS competitions
15.4 12.2 7.5 9.5 15.4^ 7.5 12.2 9.5
Difference χ2 (1, N = 4,407) = 1.35, ns
χ2 (1, N = 4,512) = 1.40, ns
χ2 (1, N = 8,454) = 128.36, p <
0.001, Φ = 0.12
χ2 (1, N = 465) = 0.88, ns
Interaction χ2 (1, N = 8,919) = 2.91, ns Raffles, sweeps and other competitions
65.6* 50.3 55.7* 46.3 65.6^ 55.7 50.3 46.3
Difference χ2 (1, N = 4,407) = 17.62, p <
0.001, Φ = 0.06
χ2 (1, N = 4,512) = 9.53, p =
0.002, Φ = 0.05
χ2 (1, N = 8,455) = 85.92, p <
0.001, Φ = 0.10
χ2 (1, N = 464) = 0.69, ns
Interaction χ2 (1, N = 8,919) = 1.63, ns Note: * indicates differences between non-problem and at-risk gamblers for each gender. ^ indicates differences between each gender separately for non-problem and at-risk gamblers.
5.3.2 Gambling frequency Those who participated in each gambling form were asked how often they had done so in the previous 12 months. These results were collapsed into those who participated at least weekly (referred to as “weekly” in the table below) and those who did so less often. This was tested for all of the forms of gambling, but no significant differences for either gender (and no significant interaction) were observed for informal private betting or bingo.

A comparative study of men and women gamblers in Victoria Hing, Russell, Tolchard & Nower
Victorian Responsible Gambling Foundation Page 64
For both sexes, those who engaged in the following forms at least weekly were significantly more likely to be at-risk gamblers than non-problem gamblers: EGMs, table games, horse/harness/greyhound race betting and instant scratch tickets. The same was true for males (but not females) on keno and sports betting, and for females (but not males) on bingo. However, these latter two results were once again based on a relatively small numbers of female sports bettors and male bingo players, so should be interpreted with caution.
For both sexes, those who engaged in the following forms less than monthly were significantly more likely to be non-problem gamblers than at-risk gamblers: EGMs, table games and horse/harness/greyhound racing. The same was true for males (but not females) on keno, sports betting and raffles, sweeps and other competitions, and for females (but not males) on scratch tickets and phone or SMS competitions.
Significant interactions were observed for sports, scratch tickets, bingo and phone or SMS competitions, although the sports betting and bingo results should be interpreted with caution due to low numbers. The results for scratch tickets and phone or SMS competitions indicate that these results are more strongly related to at-risk gambling for females than for males.

A comparative study of men and women gamblers in Victoria Hing, Russell, Tolchard & Nower
Victorian Responsible Gambling Foundation Page 65
Table 5.9 Percentage of non-problem and at risk gamblers who engage in each form of gambling by gender by frequency of betting
F M NP AR NP AR NP AR F M F M N 94 8 328 62 94 328 8 62 Informal private betting
Weekly 14.9 12.5 10.1 9.7 14.9 10.1 12.5 9.7
Less often
85.1 87.5 89.9 90.3 85.1 89.9 87.5 90.3
Difference χ2 (1, N = 102) = 0.03, n.s.
χ2 (1, N = 390) = 0.01, n.s.
χ2 (1, N = 422) = 1.72, n.s.
Fisher exact test n.s.
Interaction χ2 (1, N = 342) = <0.01, n.s. N 1,427 155 1,494 223 1,427 1,494 155 223 EGMs Weekly 5.0 22.6* 6.0 23.8* 5.0 6.0 22.6 23.8 Less
often 95.0* 77.4 94.0* 76.2 95.0 94.0 77.4 76.2
Difference χ2 (1, N = 1,582) = 69.32, p <
0.001, Φ = 0.21
χ2 (1, N = 1,717) = 80.01, p <
0.001, Φ = 0.22
χ2 (1, N = 2,921) = 1.54, n.s.
χ2 (1, N = 378) = 0.07, n.s.
Interaction χ2 (1, N = 3,251) = 0.20, n.s. N 135 13 456 103 135 456 13 103 Table games
Weekly 0.0 7.7* 2.0 14.6* 0.0 2.0 7.7 14.6
Less often
100.0* 92.3 98.0* 85.4 100.0 98.0 92.3 85.4
Difference χ2 (1, N = 148) = 10.46, p =
0.001, Φ = 0.27
χ2 (1, N = 559) = 32.41, p <
0.001, Φ = 0.24
χ2 (1, N = 591) = 2.71, n.s.
χ2 (1, N = 116) = 0.46, n.s.
Interaction χ2 (1, N = 486) = 0.91, n.s. N 903 41 1,438 142 903 1,438 41 142 Horse/ harness/ greyhound racing
Weekly 3.2 24.4* 14.7 43.0* 3.2 14.7^ 24.4 43.0^
Less often
96.8* 75.6 85.3* 57.0 96.8^ 85.3 75.6^ 57.0
Difference χ2 (1, N = 944) = 44.42, p <
0.001, Φ = 0.22
χ2 (1, N = 1,580) = 72.55, p <
0.001, Φ = 0.21
χ2 (1, N = 2,341) = 79.20, p <
0.001, Φ = 0.18
χ2 (1, N = 183) = 4.62, p = 0.032,
Φ = 0.16 Interaction χ2 (1, N = 2,250) = 2.85, n.s. N 110 7 419 72 110 419 7 72 Betting on sports or event results
Weekly 17.3 0.0 12.9 37.5* 17.3 12.9 0.0 37.5
Less often
82.7 100.0 87.1* 62.5 82.7 87.1 100.0 62.5
Difference Fisher exact test n.s.
χ2 (1, N = 491) = 27.02, p <
0.001, Φ = 0.24
χ2 (1, N = 529) = 1.41, n.s.
Fisher exact test n.s.
Interaction χ2 (1, N = 436) = 7.52, p = 0.006 N 141 15 152 13 141 152 15 13 Keno Weekly 19.1 40.0 10.6 45.8* 19.1^ 10.6 40.0 45.8 Less
often 80.9 60.0 89.4* 54.2 80.9 89.4^ 60.0 54.2
Difference χ2 (1, N = 156) = 3.53, n.s.
χ2 (1, N = 194) = 20.55, p <
0.001, Φ = 0.33
χ2 (1, N = 311) = 4.56, p = 0.033,
Φ = 0.12
χ2 (1, N = 39) = 0.13, n.s.
Interaction χ2 (1, N = 348) = 1.37, n.s.

A comparative study of men and women gamblers in Victoria Hing, Russell, Tolchard & Nower
Victorian Responsible Gambling Foundation Page 66
Table 5.9 Percentage of non-problem and at risk gamblers who engage in each form of gambling by gender by frequency of betting (cont’d)
F M NP AR NP AR NP AR F M F M N 3,185 127 3,091 216 3,185 3,091 127 216 Lotto/ Powerball/ Pools
Weekly 40.6 39.4 43.9 40.7 40.6 43.9^ 39.4 40.7
Less often
59.4 60.6 56.1 59.3 59.4^ 56.1 60.6 59.3
Difference χ2 (1, N = 3,312) = 0.08, n.s.
χ2 (1, N = 3,307) = 0.82, n.s.
χ2 (1, N = 6,276) = 6.89, p =
0.009, Φ = 0.03
χ2 (1, N = 343) = 0.06, n.s.
Interaction χ2 (1, N = 6,894) = 0.10, n.s. N 1,194 72 879 71 1,194 879 72 71 Scratch tickets
Weekly 5.7 16.7* 8.5 7.0 5.7 8.5 16.7 7.0
Less often
94.3* 83.3 91.5 93.0 94.3 91.5 83.3 93.0
Difference χ2 (1, N = 1,266) = 13.81, p <
0.001, Φ = 0.10
χ2 (1, N = 950) = 0.19, n.s.
χ2 (1, N = 2,073) = 6.35, p =
0.012, Φ = 0.06
χ2 (1, N = 143) = 3.16, n.s.
Interaction χ2 (1, N = 2,203) = 6.25, p = 0.012 N 224 38 47 10 224 47 38 10 Bingo Weekly 33.9 36.8 44.7 10.0 33.9 44.7 36.8 10.0 Less
often 66.1 63.2 55.3 90.0 66.1 55.3 63.2 90.0
Difference χ2 (1, N = 262) = 0.12, n.s.
Fisher exact test n.s.
χ2 (1, N = 271) = 1.95, n.s.
Fisher exact test n.s.
Interaction χ2 (1, N = 360) = 5.82, p = 0.016 N 651 22 312 27 651 312 22 27 Phone or SMS competitions
Weekly 1.2 18.2* 2.2 0.0 1.2 2.2 18.2^ 0.0
Less often
98.8* 81.8 97.8 100.0 98.8 97.8 81.8 100.0^
Difference χ2 (1, N = 1,266) = 13.81, p <
0.001, Φ = 0.10
Fisher exact test n.s.
χ2 (1, N = 970) = 1.31, n.s.
Fisher exact test, p = 0.035
Interaction χ2 (1, N = 1,071) = 7.81, p = 0.005 N 2,772 91 2,353 131 2,772 2,353 91 131 Raffles, sweeps and other competitions
Weekly 2.1 3.3 4.0 7.6* 2.1 4.0^ 3.3 7.6
Less often
97.9 96.7 96.0* 92.4 97.9^ 96.0 96.7 92.4
Difference χ2 (1, N = 2,863) = 0.61, n.s.
χ2 (1, N = 2,484) = 3.96, p =
0.046, Φ = 0.04
χ2 (1, N = 5,125) = 16.62, p <
0.001, Φ = 0.06
χ2 (1, N = 222) = 1.83, n.s.
Interaction χ2 (1, N = 5,568) = 0.33, n.s. Note: * indicates differences between non-problem and at-risk gamblers for each gender. ^ indicates differences between each gender separately for non-problem and at-risk gamblers. No significant differences were observed for either gender between non-problem and at-risk gamblers in terms of frequency of engagement for the following forms: informal private betting, Lotto/Powerball/Pools, phone or SMS competitions and raffles, sweeps and other competitions. The result for betting on sports or events results for females and bingo for men were based on a small n. Those percentages should be read with caution.

A comparative study of men and women gamblers in Victoria Hing, Russell, Tolchard & Nower
Victorian Responsible Gambling Foundation Page 67
5.4 Gambling behaviours associated with at-risk and non-problem gambling
Numerous gambling behaviour questions were analysed. Significant results are presented in the following tables.
Variables that were not related to at-risk gambling for either males or females were: who they gambled with, and the number of venues that they usually attended for table games, sports, horse/harness/greyhound race betting, keno or bingo. Furthermore, Lotto/Powerball/Pools gamblers were also asked about how many numbers or squares they usually picked; these were also not related to at-risk gambling for either gender.
5.4.1 EGM behaviour Table 5.10 indicates the number of venues at which EGM players typically played. For both genders, those who played at three or more venues were significantly more likely to be at-risk gamblers, while those who played at only one venue were significantly more likely to be non-problem gamblers. This pattern did not differ significantly across genders. Furthermore, the pattern did not differ within problem gambling levels.
Table 5.10 Percentage of non-problem and at risk gamblers by number of venues at which they have played EGMs in the last 12 months by gender
F M NP AR NP AR NP AR F M F M N 636 153 660 221 636 660 153 221 One venue 39.9* 17.6 39.1* 24.9 39.9 39.1 17.6 24.9 Two venues
25.3 20.3 27.0 21.7 25.3 27.0 20.3 21.7
Three venues
17.5 29.4* 13.6 19.5* 17.5 13.6 29.4 19.5
Four or more venues
17.3 32.7* 20.3 33.9* 17.3 20.3 32.7 33.9
Difference χ2 (3, N = 789) = 41.81, p < 0.001,
Φ = 0.23
χ2 (3, N = 881) = 27.87, p < 0.001,
Φ = 0.18
χ2 (3, N = 1,296) = 5.00, n.s.
χ2 (3, N = 374) = 6.10, n.s.
Interaction χ2 (3, N = 1,671) = 3.07, ns Note: * indicates differences between non-problem and at-risk gamblers for each gender. ^ indicates differences between each gender separately for non-problem and at-risk gamblers.
Frequency of play and the number of venues at which they played EGMs were not the only significant factors for at-risk gamblers for both genders. Playing more than one credit per line often or always was associated with at-risk gamblers and this effect is more pronounced for males, as indicated by the significant interaction in Table 5.11. There is also some evidence to suggest that playing higher denomination machines is related to at-risk gambling for both genders, and males of both levels of problem gambling tend to play on higher denomination machines than females, although there does not appear to be a significant interaction between genders (Table 5.12). Conversely, non-problem gamblers were significantly more likely to never (both genders) or rarely (male only) bet more than one

A comparative study of men and women gamblers in Victoria Hing, Russell, Tolchard & Nower
Victorian Responsible Gambling Foundation Page 68
credit per line on an EGM and to usually play one cent EGMs, while males of both problem levels were significantly more likely to always play more than one credit per line. Furthermore, this gender effect was more pronounced for at-risk gamblers.
Table 5.11 Percentage of non-problem and at risk gamblers by how often they bet more than one credit per line on EGMs by gender
F M NP AR NP AR NP AR F M F M N 603 151 649 225 603 649 151 225 Never 31.0* 19.9 24.7* 7.6 31.0^ 24.7 19.9^ 7.6 Rarely 18.9 17.9 17.7* 11.6 18.9 17.7 17.9 11.6 Sometimes 20.2 23.2 18.5 16.9 20.2 18.5 23.2 16.9 Often 10.1 15.9* 12.9 18.7* 10.1 12.9 15.9 18.7 Always 19.7 23.2 26.2 45.3* 19.7 26.2^ 23.2 45.3^ Difference χ2 (4, N = 754) =
10.06, p = 0.039, Φ = 0.12
χ2 (4, N = 874) = 51.75, p < 0.001,
Φ = 0.24
χ2 (4, N = 1,252) = 13.10, p =
0.011, Φ = 0.10
χ2 (4, N = 376) = 27.93, p < 0.001,
Φ = 0.27 Interaction χ2 (4, N = 1,626) = 9.99, p = 0.041
Note: * indicates differences between non-problem and at-risk gamblers for each gender. ^ indicates differences between each gender separately for non-problem and at-risk gamblers.
Table 5.12 Percentage of non-problem and at risk gamblers by denomination of EGM usually played by gender
F M NP AR NP AR NP AR F M F M N 623 153 642 217 623 642 153 217 One cent 55.5* 37.9 43.8* 29.5 55.5^ 43.8 37.9 29.5 Two cent 22.5 29.4 22.4 25.8 22.5 22.4 29.4 25.8 Five cent 13.3 24.8* 18.1 20.7 13.3 18.1^ 24.8 20.7 Ten, twenty or fifty cent
3.5 0.7 4.8 6.0 3.5 4.8 0.7 6.0^
$1 or $2 1.6 3.3 5.5 12.9* 1.6 5.5^ 3.3 12.9^ Combination of the above
3.5 3.9 5.5 5.1 3.5 5.5 3.9 5.1
Difference χ2 (5, N = 776) = 25.50, p < 0.001,
Φ = 0.18
χ2 (5, N = 858) = 22.39, p < 0.001,
Φ = 0.16
χ2 (5, N = 1,265) = 30.37, p <
0.001, Φ = 0.16
χ2 (5, N = 370) = 19.38, p = 0.002,
Φ = 0.23 Interaction χ2 (5, N = 1,634) = 8.00, ns
Note: * indicates differences between non-problem and at-risk gamblers for each gender. ^ indicates differences between each gender separately for non-problem and at-risk gamblers.
5.4.2 Horse/harness/greyhound race betting behaviour For those who bet on horses/harness/greyhound races, betting on more exotic types of bets (e.g. trifectas and other types) was associated with at-risk gambling, particularly for males. Male at-risk gamblers were significantly less likely to bet on win/place or each way outcomes, while male non-problem gamblers were significantly more likely to place win/place or each way bets. While some results were significant for males but not for females, the overall pattern of results did not differ significantly between the genders (Table 5.13). Furthermore, the pattern between genders did not appear to differ within levels of problem gambling.

A comparative study of men and women gamblers in Victoria Hing, Russell, Tolchard & Nower
Victorian Responsible Gambling Foundation Page 69
Table 5.13 Percentage of non-problem and at risk gamblers by type of bet usually placed on horse/harness/greyhound races by gender
F M NP AR NP AR NP AR F M F M N 368 41 640 141 368 640 41 141 Win/place 57.6 46.3 60.0* 42.6 57.6 60.0 46.3 42.6 Each way 25.8 19.5 20.8* 12.8 25.8 20.8 19.5 12.8 Trifecta 7.9 7.3 11.3 24.1* 7.9 11.3 7.3 24.1 Other 8.7 26.8* 8.0 20.6* 8.7 8.0 26.8 20.6 Difference χ2 (3, N = 409) =
12.96, p = 0.005, Φ = 0.18
χ2 (3, N = 781) = 42.02, p < 0.001,
Φ = 0.23
χ2 (3, N = 1,008) = 5.64, n.s.
χ2 (3, N = 182) = 6.09, n.s.
Interaction χ2 (3, N = 1,191) = 2.53, ns Note: * indicates differences between non-problem and at-risk gamblers for each gender. ^ indicates differences between each gender separately for non-problem and at-risk gamblers. A win/place bet is a single bet placed for the outcome either of a horse (or greyhound) winning a race, or placing in (usually) the top two or three positions. An each way wager refers to two separate bets, one of them for a win and one for a place. A trifecta bet refers to picking the top three places in order. “Other” includes more exotic bets, such as quinella, daily double, multi-bet, mystery bet and other bet types not listed in the table.
5.4.3 Expenditure on highest spending gambling activity The respondents were asked to estimate how much money they had spent over the last 12 months on the single gambling activity on which they typically spend the most money. Expenditure was positively skewed, with some very large responses. Despite this skew, which can sometimes hide significant results by inflating error variance, parametric tests indicated that, for both genders, at-risk gamblers spent significantly more money than their non-problem counterparts. However, the interaction was not statistically significant, indicating that for this particular sample, the result did not differ significantly across genders. Despite the fact that the parametric tests for females and males were statistically significant, concerns remained about the excessive variance in the data (maximum values for each group were between 14 and 42 standard deviations from the mean), so these tests were also conducted using non-parametric statistics and the same results were found, indicating that the result is not due to extreme outliers (Table 5.14).
Table 5.14 Descriptive statistics for expenditure on single highest-spend gambling activity over past 12 months by problem gambler status by gender
F M NP AR NP AR NP AR F M F M N 1,631 158 1,707 266 1,631 1,707 158 266 Mean 374.33 4,805.28 2,508.01 8,852.59 374.33 2,508.01 4,805.28 8,852.59 SD 1,465.13 25,004.90 51,477.15 31,510.88 1,465.13 51,477.15 25,004.90 31,510.88 Median 120.00 1,040.00 260.00 1,539.81 120.00 260.00 1,040.00 1,539.81 Non-parametric test
U = 46,149.5, Z = 12.51, p < 0.001
U = 108,102.5, Z = 14.54, p < 0.001
U = 1,094,419.5, Z = 11.56, p < 0.001
U = 16,889, Z = 2.82, p = 0.005
Parametric test
t(157.19) = 2.23, p = 0.027, d = 0.36
t(518.29) = 2.76, p = 0.006, d = 0.24
t(1708.40 = 1.71, n.s.
t(388.45) = 1.46, n.s.
Interaction F(1,3792) < 0.01, n.s.

A comparative study of men and women gamblers in Victoria Hing, Russell, Tolchard & Nower
Victorian Responsible Gambling Foundation Page 70
5.4.4 Money management Respondents were asked about their money management techniques. For both genders, at-risk gamblers were significantly more likely to bring EFTPOS/ATM cards with them when gambling to allow withdrawal of money, and significantly less likely to not bring any cards at all with them (Table 5.15). Non-problem gamblers of both genders were significantly more likely to bring neither EFTPOS or ATM cards with them, although male non-problem gamblers were more likely than female non-problem gamblers to bring a credit card or both their EFTPOS and credit card with them. There was no significant interaction.
Table 5.15 Percentage of non-problem and at risk gamblers type of cards taken to gambling venues by gender
F M NP AR NP AR NP AR F M F M N 1,638 180 1,705 283 1,638 1,705 180 283 Brings EFTPOS/ ATM card
17.2 35.6* 17.1 39.6* 17.2 17.1 35.6 39.6
Brings credit card
2.2 3.9 4.2 3.2 2.2 4.2^ 3.9 3.2
Brings both 31.3 32.2 37.0 36.0 31.3 37.0^ 32.2 36.0 Brings neither 49.4* 28.3 41.7* 21.2 49.4^ 41.7 28.3 21.2 Difference χ2 (3, N =
1,818) = 46.14, p < 0.001, Φ =
0.16
χ2 (3, N = 1,988) = 87.20, p < 0.001, Φ =
0.21
χ2 (3, N = 3,343) = 29.39, p < 0.001, Φ =
0.09
χ2 (3, N = 463) = 3.43, n.s.
Interaction χ2 (3, N = 3,807) = 3.37, ns Note: * indicates differences between non-problem and at-risk gamblers for each gender. ^ indicates differences between each gender separately for non-problem and at-risk gamblers.
Furthermore, at-risk gamblers of both genders were significantly more likely to bring larger amounts of money with them to gambling venues, particularly amounts of $100 or more compared to non-problem gamblers and males of both levels of problem gambling were significantly more likely to bring higher amounts of money with them. Conversely, non-problem gamblers of both genders were significantly more likely to bring up to $20 (Table 5.16).
Table 5.16 Percentage of non-problem and at risk gamblers by amount of money brought to gambling over past 12 months by gender
F M NP AR NP AR NP AR F M F M N 1,675 177 1,750 285 1,675 1,750 177 285 No money 7.7* 3.4 6.5 4.6 7.7 6.5 3.4 4.6 Up to $20 32.7* 9.6 24.8* 9.8 32.7^ 24.8 9.6 9.8 $20 - $50 23.0 22.6 21.7 17.2 23.0 21.7 22.6 17.2 $50 - $100 30.6 44.6* 29.4 28.8 30.6 29.4 44.6^ 28.8 $100 - $200 4.7 12.4* 9.2 23.5* 4.7 9.2^ 12.4 23.5^ More than $200 1.4 7.3* 8.5 16.1* 1.4 8.5^ 7.3 16.1^ Difference χ2 (5, N = 1,852)
= 87.87, p < 0.001, Φ = 0.22
χ2 (5, N = 2,035) = 87.96, p <
0.001, Φ = 0.21
χ2 (5, N = 3,425) = 130.77, p <
0.001, Φ = 0.20
χ2 (5, N = 462) = 23.48, p < 0.001,
Φ = 0.23 Interaction χ2 (5, N = 3,887) = 9.95, ns
Note: * indicates differences between non-problem and at-risk gamblers for each gender. ^ indicates differences between each gender separately for non-problem and at-risk gamblers.

A comparative study of men and women gamblers in Victoria Hing, Russell, Tolchard & Nower
Victorian Responsible Gambling Foundation Page 71
Finally in terms of money management, at-risk gamblers of both genders were significantly more likely than others to withdraw extra money at least once while at a gambling venue, although the result did not differ significantly by gender. In contrast, non-problem gamblers were significantly more likely not to access extra money at all during a single gambling session (Table 5.17), although there were no significant differences between genders within levels of problem gambling.
Table 5.17 Percentage of non-problem and at risk gamblers by number of times during a single gambling session they would access extra money (e.g. through ATM, credit card) by gender
F M NP AR NP AR NP AR F M F M N 834 126 1,000 215 834 1,000 126 215 Not at all 85.6* 42.1 84.8* 36.7 85.6 84.8 42.1 36.7 Once or less than once on average
12.9 32.5* 13.6 36.7* 12.9 13.6 32.5 36.7
Twice or more
1.4 25.4* 1.6 26.5* 1.4 1.6 25.4 26.5
Difference χ2 (2, N = 960) = 190.13, p <
0.001, Φ = 0.45
χ2 (2, N = 1,215) = 289.90, p <
0.001, Φ = 0.49
χ2 (2, N = 1,834) = 0.26, n.s.
χ2 (2, N = 341) = 1.02, n.s.
Interaction χ2 (2, N = 2,174) = 0.45, ns Note: * indicates differences between non-problem and at-risk gamblers for each gender. ^ indicates differences between each gender separately for non-problem and at-risk gamblers.
5.5 Main reasons for gambling Respondents were asked to report the main reason that they gambled on their highest spending activity. At-risk gamblers were significantly less likely to report that they gambled to win money or to raise money for charity but were significantly more likely to select one of the options that was recoded into an “other” option for the purposes of the statistical analysis due to small cell sizes. These other responses include reasons like: escaping boredom, relieving stress, taking the respondent’s mind off things and various other self-reported reasons. Furthermore, male at-risk gamblers were significantly more likely to report that they gambled on their highest spending form for general entertainment, while the same result was not statistically significant for females. Non-problem gamblers of both genders were significantly more likely to report gambling on their highest spending form to win money and to raise money for charity. Male non-problem gamblers were significantly more likely to gamble for general entertainment, while females non-problem gamblers were significantly more likely to gamble to raise money for charity compared to males. However, there was no significant interaction effect (Table 5.18).

A comparative study of men and women gamblers in Victoria Hing, Russell, Tolchard & Nower
Victorian Responsible Gambling Foundation Page 72
Table 5.18 Percentage of non-problem and at risk gamblers by main reasons for gambling by gender
F M NP AR NP AR NP AR F M F M N 1,675 179 1,749 285 1,675 1,749 179 285 Social reasons 20.2 18.4 22.7 23.2 20.2 22.7 18.4 23.2 To win money 44.4* 27.9 44.5* 31.6 44.4 44.5 27.9 31.6 General entertainment
16.1 21.2 19.2 26.7* 16.1 19.2^ 21.2 26.7
Raise money for charity
6.4* 0.6 2.7* 0.7 6.4^ 2.7 0.6 0.7
Other 12.9 31.8* 10.9 17.9* 12.9 10.9 31.8^ 17.9 Difference χ2 (4, N = 1,854)
= 61.87, p < 0.001, Φ = 0.18
χ2 (4, N = 2,034) = 30.53, p <
0.001, Φ = 0.12
χ2 (4, N = 3,424) = 35.74, p <
0.001, Φ = 0.10
χ2 (4, N = 464) = 12.18, p =
0.016, Φ = 0.16 Interaction χ2 (4, N = 3,888) = 4.61, ns
Note: * indicates differences between non-problem and at-risk gamblers for each gender. ^ indicates differences between each gender separately for non-problem and at-risk gamblers.
5.6 Attitudes towards gambling in Victoria At-risk gamblers of both genders were significantly more likely than non-problem gamblers to strongly disagree that the Victorian Government is taking positive action to encourage responsible gambling in Victoria, as well as being significantly more likely to strongly agree that gambling is too widely accessible in their local council/shire and that governments need to do more to address problem gambling in their local council/shire. This latter effect was significantly stronger for females than it was for males, with at-risk females also significantly more likely than female non-problem gamblers to strongly agree that gambling is a serious social issue in Victoria. Non-problem gamblers of both genders were generally more ambivalent about these issues compared to the at-risk gamblers
Conversely, at-risk gamblers of both genders were significantly more likely to state that gambling provides a lot of fun for the community (Table 5.19).
Table 5.19 Percentage of non-problem and at risk gamblers by attitudes to gambling in Victoria by gender
F M NP AR NP AR NP AR F M F M N 1,638 178 1,731 282 1,638 1,731 178 282 The Victorian Government is taking positive action to encourage responsible gambling in Victoria Strongly disagree
11.0 27.0* 12.2 25.4* 11.0 12.2 27.0 25.4
Disagree 14.3 17.2 13.9 15.7 14.3 13.9 17.2 15.7 Neither agree nor disagree
35.5* 19.0 30.7* 21.4 35.5^ 30.7 19.0 21.4
Agree 25.6 21.8 29.2* 21.1 25.6 29.2^ 21.8 21.1 Strongly agree 13.6 14.9 14.0 16.4 13.6 14.0 14.9 16.4 Difference χ2 (4, N = 1,792)
= 46.70, p < 0.001, Φ = 0.16
χ2 (4, N = 1,988) = 43.67, p <
0.001, Φ = 0.15
χ2 (4, N = 3,326) = 11.09, p <
0.001, Φ = 0.06
χ2 (4, N = 454) = 0.76, n.s.
Interaction χ2 (4, N = 3,841) = 2.57, ns

A comparative study of men and women gamblers in Victoria Hing, Russell, Tolchard & Nower
Victorian Responsible Gambling Foundation Page 73
Table 5.19 Percentage of non-problem and at risk gamblers by attitudes to gambling in Victoria by gender (cont’d)
F M NP AR NP AR NP AR F M F M N 1,638 178 1,731 282 1,638 1,731 178 282 Gambling is a serious social problem in Victoria Strongly disagree
2.4 1.7 2.4 1.4 2.4 2.4 1.7 1.4
Disagree 2.1 2.2 5.7 6.0 2.1 5.7^ 2.2 6.0 Neither agree nor disagree
13.0 10.1 15.0 13.7 13.0 15.0 10.1 13.7
Agree 31.1* 23.0 34.1 31.0 31.1 34.1 23.0 31.0 Strongly agree 51.4 62.9* 42.8 47.9 51.4^ 42.8 62.9^ 47.9 Difference χ2 (4, N = 1,814)
= 8.95, ns χ2 (4, N = 2,007)
= 3.48, ns χ2 (4, N = 3,359)
= 46.60, p < 0.001, Φ = 0.12
χ2 (4, N = 462) = 11.67, p = 0.020,
Φ = 0.16 Interaction χ2 (4, N = 3,842) = 1.85, ns Gambling provides a lot of fun for the community Strongly disagree
19.5 22.5 15.6 13.8 19.5^ 15.6 22.5^ 13.8
Disagree 28.5 24.2 25.9 22.0 28.5 25.9 24.2 22.0 Neither agree nor disagree
29.7 25.8 29.3 24.5 29.7 29.3 25.8 24.5
Agree 18.2 17.4 24.5 22.3 18.2 24.5^ 17.4 22.3 Strongly agree 4.0 10.1* 4.7 17.4* 4.0 4.7 10.1 17.4^ Difference χ2 (4, N = 1,816)
= 15.51, p = 0.004, Φ = 0.09
χ2 (4, N = 2,013) = 64.95, p <
0.001, Φ = 0.18
χ2 (4, N = 3,369) = 25.97, p <
0.001, Φ = 0.09
χ2 (4, N = 460) = 10.30, p < 0.001,
Φ = 0.15 Interaction χ2 (4, N = 3,830) = 2.70, ns Gambling is too widely accessible in my local council/shire Strongly disagree
4.1 5.2 5.4 7.9 4.1 5.4 5.2 7.9
Disagree 16.5 11.6 19.7 17.1 16.5 19.7^ 11.6 17.1 Neither agree nor disagree
20.9* 13.3 24.6* 15.7 20.9 24.6^ 13.3 15.7
Agree 30.5* 19.7 27.3 23.6 30.5^ 27.3 19.7 23.6 Strongly agree 28.0 50.3* 23.0 35.7* 28.0^ 23.0 50.3^ 35.7 Difference χ2 (4, N = 1,771)
= 39.05, p < 0.001, Φ = 0.15
χ2 (4, N = 1,969) = 28.31, p <
0.001, Φ = 0.12
χ2 (4, N = 3,287) = 23.32, p <
0.001, Φ = 0.08
χ2 (4, N = 453) = 9.99, p = 0.041,
Φ = 0.15 Interaction χ2 (4, N = 3,739) = 2.93, ns Governments need to do more to address problem gambling in my local council/shire Strongly disagree
2.6 4.6 3.4 3.2 2.6 3.4 4.6 3.2
Disagree 13.9* 5.1 15.8 15.2 13.9 15.8 5.1 15.2^ Neither agree nor disagree
27.5* 12.6 26.3* 14.4 27.5 26.3 12.6 14.4
Agree 30.4 25.1 29.8 35.4 30.4 29.8 25.1 35.4^ Strongly agree 25.7 52.6* 24.6 31.8* 25.7 24.6 52.6^ 31.8 Difference χ2 (4, N = 1,738)
= 66.71, p < 0.001, Φ = 0.20
χ2 (4, N = 1,973) = 20.77, p <
0.001, Φ = 0.10
χ2 (4, N = 3,259) = 4.87, n.s.
χ2 (4, N = 452) = 25.55, p < 0.001,
Φ = 0.24 Interaction χ2 (4, N = 3,710) = 21.54, p < 0.001 Note: * indicates differences between non-problem and at-risk gamblers for each gender. ^ indicates differences between each gender separately for non-problem and at-risk gamblers.

A comparative study of men and women gamblers in Victoria Hing, Russell, Tolchard & Nower
Victorian Responsible Gambling Foundation Page 74
5.7 Substance use At-risk gamblers of both genders were significantly more likely to have smoked in the last 12 months and to be current smokers (Table 5.20). Male non-problem gamblers were also significantly more likely to have previously smoked compared to female non-problem gamblers, with no gender difference for at-risk gamblers. There was no significant difference in terms of current smoking, nor were there significant interactions for either of the smoking variables.
Table 5.20 Percentage of non-problem and at risk gamblers by past (last 12 months) and current smoking status by gender
F M NP AR NP AR NP AR F M F M N 1,675 179 1,749 285 1,675 1,749 179 285 Smoked in the last 12 months
24.4 49.2* 28.1 51.9* 24.4 28.1^ 49.2 51.9
Difference χ2 (1, N = 1,854) = 50.46, p <
0.001, Φ = 0.17
χ2 (1, N = 2,034) = 64.37, p <
0.001, Φ = 0.18
χ2 (1, N = 3,424) = 6.08, p = 0.014,
Φ = 0.04
χ2 (1, N = 464) = 0.34, n.s.
Interaction χ2 (1, N = 3,888) = 0.20, ns Currently smokes
18.7 42.5* 21.0 45.3* 18.7 21.0 42.5 45.3
Difference χ2 (1, N = 1,854) = 54.74, p <
0.001, Φ = 0.17
χ2 (1, N = 2,034) = 77.88, p <
0.001, Φ = 0.20
χ2 (1, N = 3,424) = 2.82, n.s.
χ2 (1, N = 464) = 0.35, n.s.
Interaction χ2 (1, N = 3,888) = 0.03, ns Note: * indicates differences between non-problem and at-risk gamblers for each gender. ^ indicates differences between each gender separately for non-problem and at-risk gamblers.
Non-problem gamblers were not asked about using illicit drugs. About 12.8% of female at-risk gamblers and 21.4% of male at-risk gamblers reported using one or more forms of illicit drugs. This difference was statistically significant, χ2 (1, N = 464) = 5.43,p = 0.020, Φ = 0.11.
The CAGE measure was used to determine alcohol abuse. This was analysed both as a categorical (Table 5.21) and continuous (Table 5.22) variable. In both analyses, at-risk gamblers of both genders were significantly more likely to show signs of clinical alcohol abuse or to have moderate or high levels of clinical alcohol abuse compared to non-problem gamblers, although in both cases, the difference between the pattern of results by gender was not statistically significant. In contrast, non-problem gamblers were significantly more likely to show no signs of clinical alcohol abuse. Furthermore, males of both levels of problem gambling were significantly more likely than their female counterparts to display some level of clinical alcohol abuse and to have higher CAGE scores.

A comparative study of men and women gamblers in Victoria Hing, Russell, Tolchard & Nower
Victorian Responsible Gambling Foundation Page 75
Table 5.21 Percentage of non-problem and at risk gamblers by level of alcohol abuse by gender
F M NP AR NP AR NP AR F M F M N 1,363 124 1,566 253 1,363 1,566 124 253 No signs of clinical alcohol abuse
80.9* 64.5 68.3* 48.6 80.9^ 68.3 64.5^ 48.6
At-risk for clinical alcohol abuse
10.0 11.3 15.7 18.2 10.0 15.7^ 11.3 18.2
Signs of clinical alcohol abuse
6.5 15.3* 9.6 17.0* 6.5 9.6^ 15.3 17.0
Moderate levels of clinical alcohol abuse
2.5 6.5* 5.6 12.6* 2.5 5.6^ 6.5 12.6
High levels of clinical alcohol abuse
0.2 2.4* 0.8 3.6* 0.2 0.8^ 2.4 3.6
Difference χ2 (4, N = 1,487) = 36.35, p <
0.001, Φ = 0.16
χ2 (4, N = 1,819) = 55.17, p <
0.001, Φ = 0.17
χ2 (4, N = 2,929) = 64.00, p <
0.001, Φ = 0.15
χ2 (4, N = 377) = 9.88, p = 0.042,
Φ = 0.16 Interaction χ2 (4, N = 3,299) = 1.86, ns Note: * indicates differences between non-problem and at-risk gamblers for each gender. ^ indicates differences between each gender separately for non-problem and at-risk gamblers.
Table 5.22 Descriptive statistics for alcohol abuse by problem gambler status by gender
F M NP AR NP AR NP AR F M F M N 1,363 124 1,566 253 1,363 1,566 124 253 Mean 0.31 0.72 0.55 1.04 0.31 0.55 0.72 1.04 SD 0.72 1.10 0.93 1.22 0.72 0.93 1.10 1.22 Median 0.00 0.00 0.00 1.00 0.00 0.00 0.00 1.00 Non-parametric test
U = 63,306, Z = 4.29, p < 0.001
U = 164,615.5, Z = 6.45, p < 0.001
U = 938,788.5, Z = 8.24, p < 0.001
U = 12,306, Z = 2.70, p = 0.007
Parametric test
t(132.95) = 3.99, p < 0.001, d =
0.69
t(300.97) = 6.12, p < 0.001, d =
0.71
t(2883.33) = 7.75, p < 0.001, d =
0.29
t(268.33) = 2.61, p = 0.010, d =
0.32 Interaction F(1,3329) = 0.452, ns
5.8 Mental and physical health 5.8.1 Mental health
The respondents completed the Kessler 10 scale and were subsequently categorised into one of four levels of mental health. For both genders, at-risk gamblers were significantly more likely to have mild, moderate, or severe mental disorders compared to non-problem gamblers and this result did not differ significantly between genders. Conversely, non-problem gamblers of both genders were significantly more likely than at-risk gamblers to be in the ‘likely to be well’ category on the K10. Males of either level of problem gambling were significantly more likely than their female counterparts to be well (Table 5.23).

A comparative study of men and women gamblers in Victoria Hing, Russell, Tolchard & Nower
Victorian Responsible Gambling Foundation Page 76
Table 5.23 Percentage of non-problem and at risk gamblers by mental health status (Kessler 10) by gender
F M NP AR NP AR NP AR F M F M N 1,675 179 1,749 284 1,675 1,675 179 179 Likely to be well 90.2* 60.0 93.5* 71.8 90.2 93.5^ 60.0 71.8^ Likely to have a mild disorder
5.6 13.9* 3.9 13.4* 5.6^ 3.9 13.9 13.4
Likely to have a moderate mental disorder
2.3 11.1* 1.3 8.8* 2.3^ 1.3 11.1 8.8
Likely to have a severe mental disorder
1.9 15.0* 1.4 6.0* 1.9 1.4 15.0^ 6.0
Difference χ2 (3, N = 1,856) = 161.40, p < 0.001, Φ =
0.30
χ2 (3, N = 2,033) = 140.84, p < 0.001, Φ =
0.26
χ2 (3, N = 3,425) = 13.39, p = 0.004, Φ =
0.06
χ2 (3, N = 464) = 12.36, p =
0.006, Φ = 0.16
Interaction χ2 (3, N = 3,888) = 3.64, ns Note: * indicates differences between non-problem and at-risk gamblers for each gender. ^ indicates differences between each gender separately for non-problem and at-risk gamblers.
Furthermore, at-risk gamblers of both genders were significantly more likely to have experienced trauma or hardship (Table 5.24), with females of both levels of problem gambling significantly more likely to have experienced trauma or hardship compared to males. However there was no significant interaction.
Table 5.24 Percentage of non-problem and at risk gamblers by past experiences of trauma or hardship by gender
F M NP AR NP AR NP AR F M F M N 1,675 179 1,749 284 1,675 1,749 179 284 Trauma or hardship
25.0 47.5* 14.2 28.9* 25.0^ 14.2 47.5^ 28.9
Difference χ2 (1, N = 1,854) = 41.53, p <
0.001, Φ = 0.15
χ2 (1, N = 2,033) = 38.40, p <
0.001, Φ = 0.14
χ2 (3, N = 3,424) = 62.67, p <
0.001, Φ = 0.14
χ2 (3, N = 463) = 16.50, p < 0.001,
Φ = 0.19 Interaction χ2 (1, N = 3,887) = 0.21, ns
Note: * indicates differences between non-problem and at-risk gamblers for each gender. ^ indicates differences between each gender separately for non-problem and at-risk gamblers.
5.8.2 Physical health Respondents were asked about the current status of any physical health issues. For both genders, at-risk gamblers were significantly more likely to report lung conditions including asthma, depression, anxiety disorders and obesity. Male at-risk gamblers were significantly more likely to report other health conditions, while female at-risk gamblers were significantly more likely to report diabetes compared to non-problem gamblers (Table 5.25). Female non-problem gamblers were significantly more likely than male non-problem gamblers to have experienced depression, anxiety, or obesity, with no significant gender differences between at-risk gamblers. There were no significant interactions for any of the health conditions.
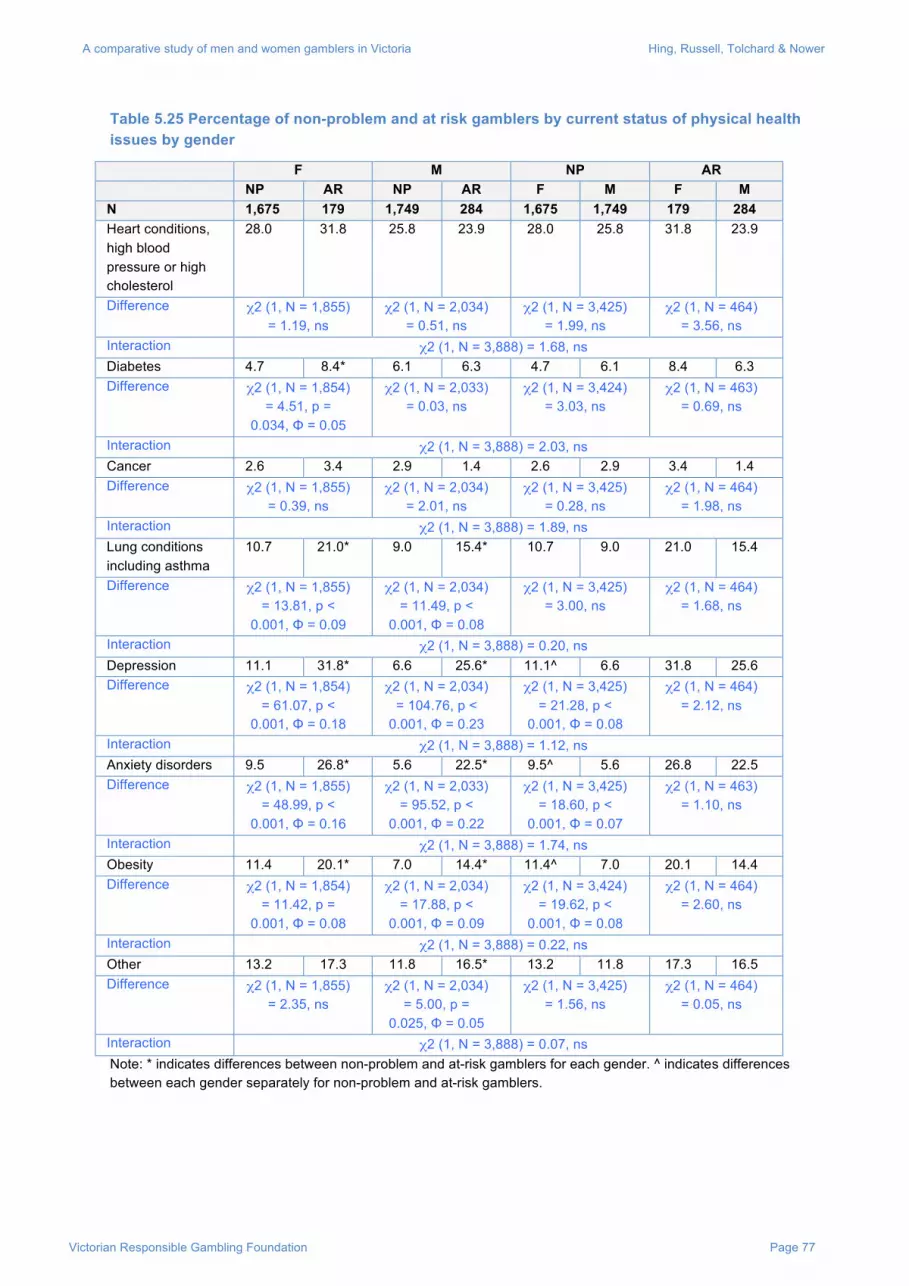
A comparative study of men and women gamblers in Victoria Hing, Russell, Tolchard & Nower
Victorian Responsible Gambling Foundation Page 77
Table 5.25 Percentage of non-problem and at risk gamblers by current status of physical health issues by gender
F M NP AR NP AR NP AR F M F M N 1,675 179 1,749 284 1,675 1,749 179 284 Heart conditions, high blood pressure or high cholesterol
28.0 31.8 25.8 23.9 28.0 25.8 31.8 23.9
Difference χ2 (1, N = 1,855) = 1.19, ns
χ2 (1, N = 2,034) = 0.51, ns
χ2 (1, N = 3,425) = 1.99, ns
χ2 (1, N = 464) = 3.56, ns
Interaction χ2 (1, N = 3,888) = 1.68, ns Diabetes 4.7 8.4* 6.1 6.3 4.7 6.1 8.4 6.3 Difference χ2 (1, N = 1,854)
= 4.51, p = 0.034, Φ = 0.05
χ2 (1, N = 2,033) = 0.03, ns
χ2 (1, N = 3,424) = 3.03, ns
χ2 (1, N = 463) = 0.69, ns
Interaction χ2 (1, N = 3,888) = 2.03, ns Cancer 2.6 3.4 2.9 1.4 2.6 2.9 3.4 1.4 Difference χ2 (1, N = 1,855)
= 0.39, ns χ2 (1, N = 2,034)
= 2.01, ns χ2 (1, N = 3,425)
= 0.28, ns χ2 (1, N = 464)
= 1.98, ns Interaction χ2 (1, N = 3,888) = 1.89, ns Lung conditions including asthma
10.7 21.0* 9.0 15.4* 10.7 9.0 21.0 15.4
Difference χ2 (1, N = 1,855) = 13.81, p <
0.001, Φ = 0.09
χ2 (1, N = 2,034) = 11.49, p <
0.001, Φ = 0.08
χ2 (1, N = 3,425) = 3.00, ns
χ2 (1, N = 464) = 1.68, ns
Interaction χ2 (1, N = 3,888) = 0.20, ns Depression 11.1 31.8* 6.6 25.6* 11.1^ 6.6 31.8 25.6 Difference χ2 (1, N = 1,854)
= 61.07, p < 0.001, Φ = 0.18
χ2 (1, N = 2,034) = 104.76, p <
0.001, Φ = 0.23
χ2 (1, N = 3,425) = 21.28, p <
0.001, Φ = 0.08
χ2 (1, N = 464) = 2.12, ns
Interaction χ2 (1, N = 3,888) = 1.12, ns Anxiety disorders 9.5 26.8* 5.6 22.5* 9.5^ 5.6 26.8 22.5 Difference χ2 (1, N = 1,855)
= 48.99, p < 0.001, Φ = 0.16
χ2 (1, N = 2,033) = 95.52, p <
0.001, Φ = 0.22
χ2 (1, N = 3,425) = 18.60, p <
0.001, Φ = 0.07
χ2 (1, N = 463) = 1.10, ns
Interaction χ2 (1, N = 3,888) = 1.74, ns Obesity 11.4 20.1* 7.0 14.4* 11.4^ 7.0 20.1 14.4 Difference χ2 (1, N = 1,854)
= 11.42, p = 0.001, Φ = 0.08
χ2 (1, N = 2,034) = 17.88, p <
0.001, Φ = 0.09
χ2 (1, N = 3,424) = 19.62, p <
0.001, Φ = 0.08
χ2 (1, N = 464) = 2.60, ns
Interaction χ2 (1, N = 3,888) = 0.22, ns Other 13.2 17.3 11.8 16.5* 13.2 11.8 17.3 16.5 Difference χ2 (1, N = 1,855)
= 2.35, ns χ2 (1, N = 2,034)
= 5.00, p = 0.025, Φ = 0.05
χ2 (1, N = 3,425) = 1.56, ns
χ2 (1, N = 464) = 0.05, ns
Interaction χ2 (1, N = 3,888) = 0.07, ns Note: * indicates differences between non-problem and at-risk gamblers for each gender. ^ indicates differences between each gender separately for non-problem and at-risk gamblers.

A comparative study of men and women gamblers in Victoria Hing, Russell, Tolchard & Nower
Victorian Responsible Gambling Foundation Page 78
5.9 Multivariate analyses of risk and protective factors The analyses reported earlier in this chapter compared non-problem and at-risk gamblers on each of the factors individually. These analyses identified important factors that were then included in a multivariate analysis below. The results for each predictor add to our understanding of the previous results by controlling for other factors in the model and thus testing what each predictor brings to the model uniquely.
The predictors of interest were:
Age (dummy-coded with 18-24 as the reference group)
Whether the respondent speaks a language other than English at home
Education (dummy-coded with university as the reference group)
Household type (recoded as couple with child(ren), couple without children, group household and other, then dummy-coded with couple with child(ren) as the reference group)
Employment (dummy-coded with “not in workforce or away from work” and “unemployed” as the reference group)
Engagement in each of the main forms of gambling surveyed
Main reasons for gambling of highest spend activity (dummy-coded with “other” as the reference group and with “to raise money for charity” also collapsed into the reference group)
Other variables were considered but were removed due to numerous reasons including: a high correlation with the chosen variables, because the bivariate analyses involving those variables were either non-significant or had very low effect sizes and were therefore unlikely to be significant predictors in a multivariate model, or because relatively few respondents were asked or answered the question.
The model was run separately for males and for females, predicting at-risk gambling status (i.e. PGSI 0-2 vs PGSI 3+, coded as 0 and 1 respectively). Confidence intervals for each predictor were calculated and are reported in the following tables. These were used to compare models.
The statistics reported are B, Odds ratio (with asterisks indicating significant predictors) and the lower and upper bounds for the 95% confidence interval for each predictor. Thus, a positive B indicates that the predictor is associated with at-risk gamblers (compared to the reference group) for that gender, whereas a negative B indicates that the predictor is associated with non-problem gamblers.
Those who were excluded from the analyses due to missing data were compared to those who were included. There were some minor demographic and behavioural differences between the groups, but the effect sizes were small and most differences were in the order of 3%, indicating that the differences were likely to be due to the large sample size. Thus, the missing data were not considered to be particularly problematic for these models.

A comparative study of men and women gamblers in Victoria Hing, Russell, Tolchard & Nower
Victorian Responsible Gambling Foundation Page 79
5.9.1 Females A total of 1,820 respondents completed all of the questions included in the analysis. Of these, 1,648 were non-problem gamblers and 172 were at-risk gamblers. The overall model predicting at-risk gamblers was statistically significant (χ2 (28, N = 1,820) = 252.04, p < 0.001) and the model correctly predicted 99.3% of non-problem gamblers, but only 11.5% of at-risk gamblers.
The following predictors significantly predicted at-risk status amongst female Victorian gamblers: being 18-24 years old (compared to being 65 or older), speaking a language other than English at home, living in a group household (compared to being a couple with children), being unemployed or not in the workforce (compared to both full-time and part-time employment), betting on informal private betting, EGMs, scratch tickets or bingo (compared to not betting on those forms), and not betting on raffles, sweeps and other competitions (compared to betting on them). Finally, gambling for reasons other than social reasons, to win money or for general entertainment was also a significant predictor of female at-risk gamblers (Table 5.26).
The following predictors significantly predicted non-problem gambling status amongst female Victorian gamblers: being aged 65 years or older (compared to 18-24 years old), speaking English at home, being in full-time or part-time employment (compared to no employment), betting on raffles, sweeps and other competitions (compared to not betting on them), and gambling for social reasons, to win money or for general entertainment (compared to gambling for other reasons).

A comparative study of men and women gamblers in Victoria Hing, Russell, Tolchard & Nower
Victorian Responsible Gambling Foundation Page 80
Table 5.26 Results for the predictors in the multivariate analysis for females
B Odds Ratio CI Lower CI Upper
Predictor Level Bound Bound
Age (ref: 18-24)
25-34 0.20 1.22 0.60 2.49
35-44 0.26 1.30 0.63 2.66
45-54 0.54 1.71 0.87 3.35
55-64 0.03 1.03 0.49 2.17
65 or older -1.01 0.36* 0.16 0.82
Language other than English at home (ref: no)
0.64 1.90* 1.15 3.12
Education (ref: Year 10 or lower)
University -0.36 0.70 0.40 1.21
TAFE or trade qualification -0.40 0.67 0.40 1.14
Year 12 -0.35 0.70 0.43 1.14
Household type (ref: couple with children)
Couple without children -0.11 0.89 0.54 1.49
Group household 1.45 4.25* 1.89 9.54
Other 0.21 1.23 0.79 1.92
Employment status (ref: unemployed or not at work)
Full-time employment -0.55 0.58* 0.36 0.94
Part-time employment -0.48 0.62* 0.39 0.99
Forms of gambling (ref: do not participate)
Informal private betting 0.87 2.39* 1.02 5.57
EGMs 2.14 8.49* 5.30 13.58
Table games -0.28 0.76 0.36 1.60
Horse/harness/greyhound 0.09 1.09 0.71 1.67
Sports or events 0.35 1.42 0.56 3.64
Keno 0.04 1.04 0.52 2.06
Lotto/Powerball/Pools 0.06 1.06 0.69 1.63
Scratch tickets 0.44 1.55* 1.07 2.25
Bingo 1.11 3.03* 1.81 5.08
Phone/SMS competitions -0.07 0.94 0.55 1.60
Raffles, sweeps, etc -0.51 0.60* 0.42 0.87
Main reason for gambling (ref: other)
Social reasons -0.94 0.39* 0.23 0.66
To win money -0.87 0.42* 0.26 0.67
General entertainment -0.63 0.54* 0.32 0.89 Note: Asterisks (*) indicate significant predictors in the regression model.
A comparative study of men and women gamblers in Victoria Hing, Russell, Tolchard & Nower
Victorian Responsible Gambling Foundation Page 81
5.9.2 Males A total of 2,005 males were included in the model as they had valid data for all of the predictors in the model. Of these, 1,722 were non-problem gamblers, while 283 were at-risk gamblers. The overall model predicting at-risk gamblers was statistically significant (χ2 (28, N = 2,005) = 369.39, p < 0.001) and the model correctly predicted 98.3% of non-problem gamblers, along with 26.4% of at-risk gamblers, indicating that there is still a large amount of overlap between at-risk and non-problem gamblers, although this model appears to be better than the one for females.
Controlling for all other variables in the model, the following predictors were statistically significant predictors of at-risk gambling status amongst male Victorian gamblers: being 18-24 years old (compared to being 65 or older), speaking a language other than English at home, having Year 10 or lower education (compared to those with university level education or those who have completed Year 12), living in a group household (compared to being a couple with children), being unemployed or not at work (compared to full-time employment), betting on EGMs, table games, horse/harness/greyhound racing, sports or events outcomes, or Lotto/Powerball/Pools (compared to not betting on those forms) and not betting on raffles, sweeps and other competitions (compared to betting on them). Finally, gambling for reasons other than social reasons, to win money or for general entertainment was also a significant predictor of male at-risk gamblers (Table 5.27).
The following predictors were statistically significant predictors of non-problem gambling status amongst male Victorian gamblers: Being aged 65 years or older (compared to 18-24 years old), having a Year 12 or university education (compared to Year 10 or lower), being in full-time employment (compared to no employment), betting on raffles, sweeps and other competitions (compared to not betting on them), and gambling for social reasons, to win money or for general entertainment (compared to gambling for other reasons).
5.9.3 Comparison of models for females and males An inspection of Tables 5.26 and 5.27 allows identification of which predictors are significantly different for females and for males by comparing the Exp B from one model to the confidence interval for the other. If the Exp B for females does not lie in the confidence interval for males (and vice versa), then the strength of that predictor within the models is different between the genders.
The following predictors are stronger predictors of being an at-risk gambler for females: being 45-54 (compared to 18-24), and betting on informal private betting, EGMs and scratch tickets. The predictors that are stronger for males are: having a university education (compared to having an education of Year 10 or lower), being unemployed (compared to working full-time), and betting on table games, horse/harness/greyhound races and Lotto/Powerball/Pools.

A comparative study of men and women gamblers in Victoria Hing, Russell, Tolchard & Nower
Victorian Responsible Gambling Foundation Page 82
Table 5.27 Results for the predictors in the multivariate analysis for males
B Odds Ratio CI Lower CI Upper
Predictor Level Bound Bound
Age (ref: 18-24)
25-34 -0.09 0.92 0.56 1.51
35-44 -0.19 0.82 0.48 1.42
45-54 -0.37 0.69 0.39 1.23
55-64 -0.17 0.84 0.46 1.54
65 or older -1.34 0.26* 0.13 0.55
Language other than English at home (ref: no)
0.84 2.32* 1.61 3.35
Education (ref: Year 10 or lower)
University -0.87 0.42* 0.27 0.66
TAFE or trade qualification -0.34 0.71 0.48 1.06
Year 12 -0.46 0.63* 0.42 0.94
Household type (ref: couple with children
Couple without children -0.19 0.83 0.55 1.25
Group household (not related) 1.14 3.13* 1.75 5.59
Other 0.14 1.15 0.79 1.68
Employment status (ref: unemployed or not at work)
Full-time employment -1.09 0.34* 0.21 0.53
Part-time employment -0.51 0.60 0.35 1.02
Forms of gambling (ref: do not participate)
Informal private betting 0.29 1.34 0.87 2.06
EGMs 1.66 5.25* 3.77 7.31
Table games 0.87 2.38* 1.63 3.46
Horse/harness/greyhound 0.45 1.56* 1.13 2.16
Sports or events 0.69 1.99* 1.34 2.98
Keno -0.16 0.85 0.47 1.55
Lotto/Powerball/Pools 0.99 2.68* 1.83 3.92
Scratch tickets -0.26 0.78 0.54 1.11
Bingo 0.54 1.71 0.51 5.76
Phone/SMS competitions -0.07 0.94 0.57 1.54
Raffles, sweeps, etc -0.33 0.72* 0.53 0.98
Main reason for gambling (ref: other)
Social reasons -0.62 0.54* 0.34 0.86
To win money -0.74 0.48* 0.31 0.74
General entertainment -0.72 0.49* 0.30 0.78 Note: Asterisks (*) indicate significant predictors in the regression model.
A comparative study of men and women gamblers in Victoria Hing, Russell, Tolchard & Nower
Victorian Responsible Gambling Foundation Page 83
Chapter Six: Discussion and Conclusions
6.1 Introduction Results from Chapter Four which examined differences in male and female gamblers in Victoria revealed some variations in terms of gambling preferences, activities and styles of play; gambling motivations and attitudes; physical and mental health; family and early gambling influences; and help-seeking behaviour for gambling problems. Similarly, the results from Chapter Five also revealed commonalities and differences between risk factors for moderate risk/problem gambling and factors associated with low-risk/non-problem gambling. These results are summarised and discussed in this chapter in relation to the literature. The chapter concludes by identifying limitations and implications of the study.
6.2 Gender differences in gambling preferences, activities and styles of play
Past year participation rates for the various gambling forms differed significantly between men and women in Victoria. While gambling participation amongst both genders was highest for lottery-type games, followed by raffles, sweeps and other competitions, participation rates in other gambling forms differed significantly between genders (although some effect sizes were small).
After lottery-type games and raffles/sweeps/competitions, male gambling participation was highest for EGMs, followed by race wagering, table games, sports betting and informal private betting, respectively. When compared to female gamblers, higher proportions of men gambled on most of these gambling forms as well as on keno, although they were less likely than women to gamble on raffle/sweeps/competitions and bingo. This proportionately greater gambling participation was observed for males in most age groups for informal private betting, table games, race wagering, and sports betting, compared to female gamblers in corresponding age groups.
Further, males tended to gamble more frequently than females on most gambling forms, including informal private betting, EGMs, table games, race and sports wagering, lottery-type games, scratch tickets, and raffles/sweeps/other competitions. These results are generally consistent with previous research finding that men tend to prefer strategic, competitive and skill-based gambling forms (Grant & Kim, 2002; Hing & Breen, 2001a, 2001b; Odlaug et al., 2011; Potenza et al., 2001; Scannell, Quirk, Smith, Maddern & Dickerson, 2000; Thomas & Moore, 2001), gamble on a greater variety of gambling forms (Hraba & Lee, 1996; Potenza et al., 2006), and are more frequent and high spending gamblers than women (Delfabbro, 2012; Hing & Breen, 2001a, 2001b).
When gambling participation was compared amongst different age groups, younger men were significantly more likely than older men to take part in several gambling forms. These included informal private betting, EGMs, table games, race wagering, sports betting, scratch tickets and phone/SMS competitions. In contrast, older male gamblers were more likely than younger male gamblers to engage in lottery type games and raffles/sweeps/other competitions. Previous Australian research has also identified the particular appeal of EGMs, scratch tickets, race wagering, table games and sports betting to younger adults, and the popularity of lottery-type games amongst older adults (Delfabbro,

A comparative study of men and women gamblers in Victoria Hing, Russell, Tolchard & Nower
Victorian Responsible Gambling Foundation Page 84
2012). Recent studies on Internet gambling have found that both male gender (Gainsbury et al., 2012; Griffiths, Wardle, Orford, Sproston & Erens, 2009; Hing, Gainsbury et al., 2014; Queensland Government, 2012; Sproston et al., 2012; Woolley, 2003; Wood & Williams, 2011) and younger age (Delfabbro, Lahn & Grabosky, 2005; Dowling et al., 2010; Jackson, Dowling, Thomas, Bond & Patton, 2008; Ly, 2010) characterise Internet gamblers, so the continued growth of online gambling may also be contributing to the popularity of many gambling forms amongst young adult males. A nationally representative survey also found that males and younger Internet gamblers were more likely to have higher PGSI scores (Hing, Gainsbury et al., 2014), reflecting their comparatively high engagement in Internet gambling. In particular, increasing popularity of sports betting amongst young men has been observed and this demographic group is the key target market in Australia for sports betting advertising and promotions (Hing, Gainsbury et al., 2014; Hing, Lamont & Vitartas, 2014; McMullan, 2011; Thomas, Lewis, McLeod & Haycock, 2012). Nevertheless, only 8% of adult Australians gamble using the Internet (Hing, Gainsbury et al., 2014).
Amongst female gamblers in Victoria, lottery-type games and raffles/sweeps/competitions, followed by EGMs and race wagering attracted highest participation, mirroring the top four preferences of male gamblers. However, women were significantly less likely than men to gamble on other skill-based gambling activities but were more likely to participate in scratch tickets, bingo, phone/SMS competitions and raffles/sweeps/competitions. The higher levels of female participation in these gambling activities were consistent amongst most age groups of women, when compared to male gamblers in corresponding age groups. These findings replicate those from prior studies which have found that women tend to prefer chance-based, non-strategic forms of gambling (Delfabbro, 2012; Delfabbro et al., 2013; Grant & Kim, 2002; Hing & Breen, 2001a, 2001b; Odlaug et al., 2011; Potenza et al., 2001).
Like their male counterparts, younger women were more likely than older women to participate in informal private betting, table games, race wagering, sports betting, scratch tickets and phone/SMS competitions, although their participation in skill-based activities was less than for younger male gamblers. However, proportionately more younger women participated in scratch tickets and phone/SMS competitions compared to younger men. Similarly to males, older women were more likely than younger women to take part in lottery-type games and raffles/sweeps/other competitions, and also in bingo. Delfabbro (2012) has noted the popularity of instant scratch tickets amongst young adult women in Australia, while others have observed the popularity of bingo amongst older Australian women (Breen, 2009; Sproston et al., 2012).
Notably, older female gamblers in Victoria were more likely to take part in EGM gambling, while the opposite was true for males. Women’s penchant for EGMs has been noted in numerous studies (Delfabbro, 2012; Hing & Breen 2001a; Hing & Breen 2001b; Quirke 1996; Scannell et al. 2000; Thomas & Moore 2001) following the widespread expansion of EGMs in Australia since the 1990s (Productivity Commission 2010). This expansion fuelled a feminisation of gambling in many countries (Volberg 2003) with more women gambling than ever before. However, participation rates in the current study indicate that women’s participation in the vast majority of gambling activities is less than men’s (although most effect sizes were small), including on EGMs, similar to previous research findings (Delfabbro et al., 2013).
Other differences were apparent in the gambling behaviour of men and women in Victoria. Men spent significantly more money than women in the past 12 months on their highest-spend gambling activity, consistent with previous research findings (Delfabbro, 2012). The gender difference in spend is reflected in differences in problem gambling rates between genders, with male gamblers being significantly more likely to have experienced some level of problem gambling both at some point in their life and during the last 12 months.

A comparative study of men and women gamblers in Victoria Hing, Russell, Tolchard & Nower
Victorian Responsible Gambling Foundation Page 85
Male and female gamblers in Victoria also differed in who they usually gambled with. While there were no gender differences in terms of gambling alone or with one other person, men were more likely to gamble in groups. A similar finding was reported by Hing and Breen (2001b) who found that female EGM players were more likely to gamble alone or with other family members rather than with their spouse, friends or work colleagues, compared to male EGM players. However, the current finding is not specific to EGMs and may instead reflect gendered gambling preferences, with extended skill-based activities such as table games, sports betting and wagering perhaps being more conducive to socialising in groups, compared to gambling on scratch tickets, phone/SMS competitions and raffles/sweeps/competitions which women were more likely than men to prefer. Interestingly, research has found that the presence of other gamblers appears to facilitate gambling, resulting in higher betting intensity because larger groups of gamblers may give the impression of more frequent wins, although this research was conducted only in relation to simulated EGMs (Rockloff & Dyer, 2007).
In terms of other gambling behaviours captured by the survey, no significant differences between men and women were observed for self-reported influence of linked jackpots on choice of EGM. However, males were significantly more likely to play higher denomination EGMs and to bet more than one credit per line. This result mirrors previous findings that women tend to play lower denomination EGMs compared to men and are less likely to bet more than one credit at a time, suggesting that women play EGMs in ways that maximise playing time (Hing & Breen, 2001b). This suggestion is consistent with women’s greater use of EGMs for escape from worries, stresses, loneliness and boredom and for time-out (Boughton & Brewster, 2002; Grant & Kim, 2002; Ladd & Petry, 2002; Lloyd et al., 2010; Sacco et al., 2011; Walker et al. 2005).
For race wagering, significant differences were observed in types of bet placed, with women more likely to bet each way and men more likely to bet on trifectas. Results suggest that males had greater tendency to place more exotic types of bets; for example, 38 men (12.9%) but no women reported placing multibets. These findings generally reflect the greater risk-taking propensity of men compared to women, as discussed In Chapter Two (Cross et al., 2011) and of male gamblers compared to female gamblers (Grant & Kim, 2002; Walker et al., 2005). However, the small number of women participating in race wagering in the current study means firm conclusions are difficult to draw about any differences in betting preferences by gender. Additionally, when playing Lotto, Powerball or Pools, males tended to pick significantly more numbers per week, but significantly fewer squares than females. However, women tended to play more bingo books simultaneously compared to men.
Also reflecting lower risk-taking propensity, women demonstrated more prudent money management when gambling, with more than half the female gamblers reporting not taking any bank cards to gambling, while males were significantly more likely to take a credit card or both credit and ATM/EFTPOS cards. Additionally, males had greater tendency to take larger amounts of cash to gambling venues and to withdraw money for gambling purposes compared to females. These findings align with the higher overall gambling expenditure reported by men compared to women in this study and therefore are consistent with previous identification of access to cash and credit cards as risk factors for overspending during gambling (Martin & Moskos, 2007; McDonnell-Phillips, 2005). In Victoria, Thomas et al. (2013) found that removal of ATMs from EGM venues was followed by reduced EGM expenditure amongst higher risk gamblers, and reduced impulsive overspending amongst both higher and lower risk EGM players.
In summary, comparisons of gambling behaviour between men and women gamblers in Victoria confirm the findings of most prior research in a large representative population sample.

A comparative study of men and women gamblers in Victoria Hing, Russell, Tolchard & Nower
Victorian Responsible Gambling Foundation Page 86
6.3 Gender differences in gambling motivations Many studies have found that men have a greater tendency than women to gamble for excitement, to feel a rush, for the action, and to learn new gambling skills, while women gamble more to escape from boredom, loneliness and day-to-day problems, to cope with stressful or unsatisfying lives, and for mood regulation (Boughton & Brewster, 2002; Grant & Kim, 2002; Ladd & Petry, 2002; Lloyd et al., 2010; Sacco et al., 2011; Walker et al. 2005). In the current study, fixed response options to this question were rather limited (social reasons, to win money, general entertainment, takes your mind off things, relieves stress, boredom), although a free response “other” category was provided. The question also asked only about gambling on the highest spend activity. Both men and women most commonly reported their main reason for gambling was to win money, followed by social reasons and for general entertainment. Men were significantly more likely than women to gamble for social reasons or for general entertainment, but it may be that more commonly found male motivations for gambling, such as excitement, challenge, action or competition, were subsumed within their other responses. Women were more likely than men to gamble for charity or other reasons, including because gambling takes your mind off things and relieves stress and boredom, which were collapsed with other free response options to enable robust numbers for statistical comparisons. Thus, comparisons with the literature are difficult here, although the main reasons women reported gambling on their highest spend activity do not contradict their commonly reported escape-based motivations as discussed earlier. Future studies of gambling motivations should ensure that validated measures are used to enable more robust comparisons with the literature to allow better contributions to be made to theory testing and development.
6.4 Gender differences in health In the current study, higher proportions of male gamblers reported substance use than female gamblers. Proportionately more men than women reported smoking in the past 12 months, that they currently smoked and smoked more cigarettes per day than the female smokers. Logically then, a significantly higher proportion of males also reported that the smoking ban in Victorian gambling venues had decreased their gambling. Mean CAGE score for alcohol abuse amongst men was significantly higher than for women, and a significantly higher proportion of men reported using marijuana/hashish at least occasionally compared to women. Studies have shown that adolescent gambling is positively related to alcohol (Barnes et al.,, 1999, 2002) and other substance use (Vitaro, Brendgen, Ladouceur, & Tremblay, 2001; Winters & Anderson, 2000; Winters et al., 1993). However, studies of adult gambling have tended to focus on the well established higher substance use rates amongst problem gamblers, compared to non-problem gamblers (Blanco et al., 2006; Dannon et al., 2006; Desai et al., 2006; Desai & Potenza, 2008; Martins et al., 2004).
Nevertheless, a few studies have focused on health correlates of recreational gambling, generally finding poorer results on measures of health, depression, alcohol and drug use compared to non-gamblers (Desai, Maciejewski, Dausey, Caldarone & Potenza, 2004; Desai & Potenza, 2008; Potenza et al., 2006), although recreational gambling has been associated with better physical health and mental functioning in older adults (Desai, Desai & Potenza, 2007). A nationally representative US study (Potenza et al., 2006) comparing recreational gamblers to non-gamblers found that female recreational gamblers were more likely to report alcohol and drug use, compared to female non-gamblers. Male recreational gamblers were also more likely to report alcohol use and abuse, and any substance abuse, compared to male non-gamblers. However, despite heavier gambling in male than female recreational gamblers, similar mental health functioning was observed for both sexes. These results contrast with those for the current study that depression, anxiety and obesity were

A comparative study of men and women gamblers in Victoria Hing, Russell, Tolchard & Nower
Victorian Responsible Gambling Foundation Page 87
proportionately higher amongst females than males, and that female gamblers exhibited a significantly higher level of psychological distress, compared to male gamblers. Female gamblers were significantly more likely to have a severe mental disorder, compared to male gamblers, although there were no gender differences for having mild or moderate mental disorder. However, the current study compared all male gamblers to all female gamblers, not just those who gambled at recreational levels, which may explain these inconsistencies with previous research.
6.5 Gender differences in family and early gambling influences and experiences
In the current study, family and early gambling influences and experiences were asked only of moderate risk and problem gamblers. Male moderate risk and problem gamblers started gambling at a significantly younger age than their female counterparts and were more likely to start gambling alone and to have been introduced to gambling by a friend. In contrast, female moderate risk and problem gamblers were more likely to be introduced to gambling by a family member. Significant gender differences were also observed for first gambling form, with EGMs and other forms being the most common for female moderate risk and problem gamblers, compared to race wagering, table games or informal private betting for their male counterparts. These last results suggest that gender differences in gambling preferences are formed early in a person’s gambling career.
Early exposure to gambling in a social context, often in childhood through gambling within the family, has been linked to later gambling problems (Dowling et al., 2010; Lesieur et al., 1999; Perese, Bellringer & Abbott, 2005; Saugeres, Thomas, Moore & Bates, 2012; Winters et al., 2002), especially where a parent has had a gambling problem (Dowling et al., 2010; Felsher, Deverensky & Gupta, 2010; Hardoon & Deverensky, 2002; Lesieur et al., 1999; McComb & Sabiston, 2010; Winters et al., 2002). Indeed, Winters et al. (2002) reported that people raised with a problem gambling parent were seven times more likely to become problem gamblers themselves than people not raised with a problem gambling parent. Felsher et al. (2010) also note that high levels of parental gambling can impact on emotional problems within the family, which can heighten children’s vulnerability to problem gambling in later life (Felsher et al., 2010). However, the contribution of early gambling experiences to problem gambling, including comparisons amongst males and females, could not be assessed in the current study as these questions were not asked of non-problem and low risk gamblers. Thus, future studies examining gender differences in early gambling influences and experiences should question all PGSI groups to clarify any differences between men and women by PGSI status. This approach would allow more robust comparisons with the literature and better enable further contributions to theory testing and development.
6.6 Gender differences in gambling help-seeking The predominance of men amongst problem gamblers in the general population is not mirrored in the treatment-seeking population, with most Australian studies finding almost equal numbers of men and women attending treatment services (Productivity Commission, 2010). This is thought to reflect a widespread gender difference in help-seeking behaviour, with men less likely than women to seek help for medical, psychological and substance abuse problems (Addis & Mahalik, 2003; Parslow & Jorm, 2000) and for gambling problems (Abbott et al., 2012; Ledgerwood et al., 2012, 2013; Pulford et al., 2009; Weinstock et al., 2011, 2013). However, a large national study of gambling help-seeking in

A comparative study of men and women gamblers in Victoria Hing, Russell, Tolchard & Nower
Victorian Responsible Gambling Foundation Page 88
Australia (Hing, Nuske & Gainsbury, 2012) found no gender differences in awareness, use, motivations or barriers for accessing professional gambling help services, although male helpline callers were significantly more likely than female helpline callers to be younger, employed full-time, and to gamble on sports betting, race wagering and online gambling. In contrast, Australian studies have found that women seek help for gambling problems almost exclusively related to EGMs (Delfabbro, 2012).
This greater propensity of female problem gamblers to seek help was also found in the current study, with a significantly higher proportion (40.5%) reporting seeking help compared to 18.1% of male problem gamblers. These findings therefore lend confirmation to previous research based on a large population survey. Types of help sought also varied between genders, with 36.8% of males who had sought help seeing a counselling professional compared to 9.5% of female help-seekers. Non-professional support demonstrated a same-gender preference, with 31.6% of males who had sought this support approaching a male friend compared to no females, while 28.6% of females reported seeing a female relative while no males did so. Significant differences were also observed for the usefulness of “counselling to help overcome a difficult time in the past” with females rating this item higher than males. Men were significantly more likely to report a lot of encouragement from friends to reduce their gambling compared to women.
6.7 Gender differences in problem gambling The current study found that male gamblers were significantly more likely to have had some level of problem gambling both at some point in their life and during the last 12 months, compared to female gamblers. Lifetime prevalence of problem/pathological gambling was 3.2% for men, which was double the rate for women (1.6%). Past year prevalence of problem gambling amongst gamblers was 1.3% for men which was also double the rate for women (0.6%). Despite use of a non-validated version of the PGSI, these results align with prior research which has found that gambling pathology amongst men occurs at double or triple the rate than for women (Blanco, et al., 2006; Petry et al., 2005). Reasons proposed for this gender difference have been discussed in Chapter Two.
Statistical comparisons were conducted between male and female past year moderate risk/problem gamblers, with the main differences summarised below. Overall, there were more similarities than differences between the male and female at-risk gamblers, with factors that distinguished problem gamblers from other PGSI groups presented in the original report, A Study of Gambling in Victoria (Hare, 2009).
6.7.1 Factors distinguishing male and female moderate risk/problem gamblers
In terms of demographic characteristics, male and female moderate risk/problem gamblers differed from each other only in terms of age and employment. Younger men were more likely to be moderate risk/problem gamblers compared to younger women, while older women were more likely to be low risk/non-problem gamblers compared to older men. The relationship between employment status and problem gambling severity also differed by gender. Amongst males, those in in part-time employment were significantly more likely to be in the higher risk categories, while the opposite was found for men in full-time employment. Amongst women, those who were unemployed were more likely to be moderate risk/problem gamblers. These results are consistent with previous research findings of male

A comparative study of men and women gamblers in Victoria Hing, Russell, Tolchard & Nower
Victorian Responsible Gambling Foundation Page 89
gender, younger age and low economic status increasing the risk of problem gambling (Castrén et al., 2013; Delfabbro, 2012; Productivity Commission, 2010).
In relation to gambling forms, EGM participation was problematic for significantly more females than males on a proportional basis. Further, playing EGMs more frequently was also more strongly related to female than male gambling problems. In contrast, table games and race wagering were problematic for proportionately more men. While it appears that sports betting is also problematic for proportionately more men and bingo is also problematic for proportionately more women, low numbers of female sports bettors and male bingo gamblers who were also moderate risk/problem gamblers limited statistical significance. EGM participation is a widely recognised correlate of problem gambling (Dowling et al., 2005; Williams, Volberg et al., 2012), particularly amongst women (Crisp et al., 2004; Holdsworth et al., 2012; Welte et al., 2007), with increased rates of female problem gambling attributed to widespread expansion of EGMs in Australia since the 1990s (Brown & Coventry 1997; Delfabbro, 2012; Productivity Commission 2010). The prevalence of problem gambling also rises steeply with the frequency of gambling on table games, wagering and especially EGMs (Productivity Commission 2010), with continuous forms of gambling more conducive to problem gambling because of their rapid play and high frequency of reinforcement (Williams, West et al., 2012). Sports betting is a relatively new growth area, with high rates of problem gambling found amongst regular sports bettors (Hing, Vitartas et al., 2014) and amongst online sports bettors (Hing, Gainsbury et al., 2014). Thus, the current findings on gambling forms most associated with problem gambling align with those highlighted in previous Australian and international research, and provide confirmation based on a large representative population survey.
Other gambling behaviours associated with moderate risk/problem gamblers also differed by gender. Often or always playing more than one credit per line on EGMs was associated with higher problem gambling severity, with this effect more pronounced amongst men. Amongst race wagerers, gambling on more exotic bet types (e.g. trifectas and other types) was associated with higher risk gambling, particularly for males, although as noted previously, gender comparisons were limited by small number of at-risk females reporting these types of bets. These findings generally reflect the higher risk-taking propensity of male compared to female gamblers (Grant & Kim, 2002; Walker et al., 2005) and of male problem gamblers compared to female problem gamblers (Wong et al., 2013), as discussed in Chapter Two. The EGM finding is also consistent with suggestions to reduce maximum EGM bet size because this would significantly reduce EGM-related harms and because problem gamblers are much more likely than lower risk gamblers to bet large amounts (Livingstone, Woolley, Zazryn, Bakacs & Shami, 2008; Productivity Commission, 2010; Williams, West et al., 2012). Indeed, Blaszczynski , Sharpe & Walker (2001) found that reducing maximum EGM bet from $10 to $1 resulted in significantly decreased time and money spent on EGMs. Also consistent with the current findings, a study measuring responses to different message elements found that problem gamblers were more tempted by promotions for exotic bets, specifically micro-bets, compared to non-problem and lower risk gamblers, although the study focused on sports and not race wagering (Hing, Vitartas et al., 2014). Nevertheless, a male preference for exotic bets aligns with the greater risk-taking profile of problem gamblers generally (Wong et al., 2013).
Differences between male and female moderate risk/problem gamblers were also observed in illicit drug use, with males having greater tendency to use illicit drugs, compared to females. This result confirms in a large representative sample of the population previous findings of higher drug use disorders amongst male problem gamblers compared to female problem gamblers (Blanco et al, 2006; Dannon et al., 2006; Desai et al., 2006; Desai & Potenza, 2008).

A comparative study of men and women gamblers in Victoria Hing, Russell, Tolchard & Nower
Victorian Responsible Gambling Foundation Page 90
6.7.2 Factors distinguishing moderate risk/problem gamblers from non-problem/low risk gamblers by gender
A Study of Gambling in Victoria (Hare, 2009) reported significant differences between problem gamblers and the other PGSI groups. Key findings were that problem gamblers were more likely to participate in gambling on EGMs, tables games, races, sports, keno, lottery-type games, scratch tickets and bingo. They were also significantly more likely to play EGMs in pubs, to play table games online, and to sports bet at the casino, compared to the other PGSI groups. Problem gamblers were also significantly more likely than non-problem gamblers to gamble on their highest spending gambling activity for social reasons, but this significant difference from non-problem gamblers was also found for low risk and moderate risk gamblers. When compared to the general Victorian population, problem gamblers were more likely to be male, have a personal income of $31,200-$51,999, have a household income of $62,400-$103,999, and be blue collar or sales workers. However, this study did not conduct multivariate analyses for these correlates, nor separate results for men and women. The current study therefore extended the literature by analysing risk factors for men and women separately using regression analysis which compared moderate risk/problem gamblers to low risk/non-problem gamblers for the range of variables for which adequate data were available. Unfortunately, several potentially relevant survey questions were asked only of moderate risk/problem gamblers and so could not be included in these analyses and therefore limited their contribution to theory.
Statistically significant predictors of at-risk gambling status amongst male Victorian gamblers were: being 18-24 years old, speaking a language other than English at home, having Year 10 or lower education, living in a group household, being unemployed or not in the workforce, betting on EGMs, table games, races, sports, or lottery-type games, and gambling for reasons other than social reasons, to win money or for general entertainment. Statistically significant predictors of at-risk gambling status amongst female Victorian gamblers were: being 18-24 years old, speaking a language other than English at home, living in a group household, being unemployed or not in the workforce, betting on informal private betting, EGMs, scratch tickets or bingo, and gambling for reasons other than social reasons, to win money or for general entertainment. Thus, there were few differences between risk factors for men and for women, although analysis of which predictors were significantly different for females and for males indicated that being aged 45-54 years and betting on informal private betting, EGMs and scratch tickets were comparatively stronger predictors for women, while having a university education, being unemployed, and betting on table games, races and lottery-type games were comparatively stronger predictors for men.
Protective factors identified in the current study as associated with low risk/non-problem gambling were also nearly identical for men and women, which is not surprising given they are essentially the reverse of the identified risk factors. Amongst both males and females, being aged 65 years or older, speaking English at home, being in full-time or part-time employment, betting on raffles, sweeps and other competitions, and gambling for social reasons, to win money or for general entertainment were statistically significant predictors of low risk/non-problem gambling. A further protective factor for males was having a Year 12 or university education.
The risk factors for gambling problems as found in this study largely confirm results from previous studies, but in a large representative sample. Research into demographic risk factors for problem gambling have found that male gender, young age, low socioeconomic status, low educational level, divorced or single marital status and, in some studies, ethnic minority status are factors associated with increased risk of problem gambling (Castrén et al., 2013; Johansson et al., 2009). Australian and New Zealand studies have found that recent migrant status, often measured through speaking a language other than English at home, is a further demographic factor that heightens the risk of gambling problems (Hing, Gainsbury et al., 2014; Perese et al., 2005; Productivity Commission, 1999).
A comparative study of men and women gamblers in Victoria Hing, Russell, Tolchard & Nower
Victorian Responsible Gambling Foundation Page 91
Other studies have also found links between problem gambling and living in a group household (Tremayne, Helen Masterman-Smith & McMillen, 2001; Young, Stevens & Morris, 2008), although this variable is likely correlated with young age.
Certain types of gambling have also been widely implicated as problem gambling risk factors, particularly EGMs (Dowling et al., 2005; Delfabbro, 2012; Perese et al., 2005; Productivity Commission, 2010; Saugeres et al., 2012; Williams. Volberg, et al., 2012), which were found to be the only gambling form posing a risk factor for both men and women in the current study. Further, this risk was heightened for female compared to male moderate risk/problem gamblers, also in accordance with previous research (Crisp et al., 2004; Holdsworth et al., 2012; Perese et al., 2005; Welte et al., 2007). For males, playing table games heightened the risk of gambling problems, as also found in previous research (Delfabbro, 2012; Perese et al., 2005; Productivity Commission, 2010; Saugeres et al., 2012; Williams, West et al., 2012). Other risky types of gambling for men found in this study, including race and sports wagering, may be increasing in prominence due to their online availability, with a large Australian study revealing that risk factors for greater problem gambling severity among Internet gamblers include being male, younger and a non-English speaker at home, as well as greater gambling participation and betting on sports, races and poker (Hing, Gainsbury et al., 2014).
Certain motivations for gambling were also implicated in the current study as risk factors for both male and female moderate risk/problem gamblers. These related to gambling for reasons other than social reasons, to win money or for general entertainment, with these other reasons including escaping boredom, relieving stress, and taking the respondent’s mind off things. Gambling to escape and for mood regulation has been endorsed in previous research as increasing risks for gambling problems (Blaszczynski & Nower, 2002; Nower & Blaszczynski, 2010; Saugeres et al., 2012), with women more likely to gamble to escape everyday problems, boredom, and loneliness (Grant & Kim, 2002; Sacco et al., 2011) and for mood regulation (Lloyd et al., 2010), compared to men. Several studies of women’s gambling have noted their use of EGMs as a form of avoidant or emotion-based coping (Perese et al., 2005; Schull, 2002; Thomas, 1998; Thomas & Moore, 2003), used to combat loneliness and isolation (Brown & Coventry, 1997; Thomas & Moore, 2001; Trevorrow & Moore, 1998), and anxiety, depression and stress (Bicego, 2002; Pierce et al., 1997; Surgey, 2000).
Thus, the risk factors identified in the current study for problem gambling amongst men and women corroborate and strengthen previous research findings through validation in a large representative population survey.
6.8 Limitations of the study While completing this study provided the opportunity to conduct further analysis of a major dataset that was weighted to be representative of the Victorian adult population, use of an existing dataset meant that associated limitations could not be avoided. The main limitations of the dataset that hindered certain analyses were as follows, with appropriate cautions around results pertaining to these variables noted earlier in the relevant results sections.
The relatively small numbers of problem gamblers necessitated the combining of moderate risk and problem gambler groups to analyse risk factors for problem gambling. Thus, any gender differences in risk factors that may exist between moderate risk and problem gamblers were obscured by the need to combine these groups.
Several potential risk factors were only asked of moderate risk and problem gamblers which limited comparisons that could be conducted amongst PGSI groups (perceived gambling problems,

A comparative study of men and women gamblers in Victoria Hing, Russell, Tolchard & Nower
Victorian Responsible Gambling Foundation Page 92
gambling in households, families and relationships, how people started gambling, gambling help and awareness of gambling help, overcoming problem gambling, role of significant others, readiness to change, and suicide, substance use and crime). Some or all of these variables may differ by PGSI group and may also be risk factors for problem gambling, but the current study was unable to ascertain this.
A non-validated version of the PGSI was used to measure problem gambling severity and it is not known how this affected PGSI results and assignment of respondents to PGSI groups.
Most other measures used in the survey have also not been validated, so it is difficult to assess whether related findings reflect true differences or measurement artefacts.
Sample sizes were quite different across the analyses (which were thus associated with different levels of statistical power). Where numbers are small, some results may be unlikely to generalise or replicate.
6.9 Conclusions and implications This study has largely confirmed previous gender analyses of gambling and problem gambling in the general population. Major differences in gambling preferences were found amongst men and women, with previous research suggesting that social capital theory, cultural geography, gender role theory and socialisation may all help to explain these differences (Delfabbro, 2012; Holdsworth et al., 2012). These differences manifest as higher male gambling involvement in most forms, particularly skill-based gambling, and greater risk-taking behaviours, along with higher rates of problem gambling. Women show a preference for chance-based gambling forms, which may be driven by the capacity of EGM gambling in particular to provide an escape from stress, loneliness, boredom and their higher rates of anxiety and depression. While problem gambling prevalence is lower amongst women, their gambling problems are largely related to EGM gambling.
Risk factors for problem gambling are variables associated with the condition and do not presume a causal relationship. However, their identification allows high-risk groups to be identified and appropriately targeted for early intervention and prevention (Perese et al., 2005; Thomas & Jackson, 2008). The results of this study indicate that the primary targets for public health interventions in Victoria comprise young adults, especially males; older women who play EGMs; non-English speaking populations; frequent gamblers on EGMs, table games, race and sport wagering; and gamblers motivated by escape-based reasons.
In summary, this report’s comparison of gambling behaviour between men and women gamblers in Victoria confirms the findings of most prior research into gender differences in gambling behaviour. The main contribution of the current findings to the literature therefore lies in their confirmation of these previous findings based on a large representative population sample.

A comparative study of men and women gamblers in Victoria Hing, Russell, Tolchard & Nower
Victorian Responsible Gambling Foundation Page 93
References
Abbott, M., Bellringer, M., Hodgins, D., Palmer Du Preez, K., Landon, J., Sullivan, S., & Feigin, V. (2012). Effectiveness of problem gambling brief telephone interventions: A randomised controlled trial. Auckland: Ministry of Health.
Abbott, M.W., Volberg, R.A., & Rönnberg, S. (2004). Comparing the New Zealand and Swedish national surveys of gambling and problem gambling. Journal of Gambling Studies, 20(3), 237-258.
Addis, M.E., & Mahalik, J.R. (2003). Men, masculinity and the contexts of help seeking, American Psychologist, 58(1),.5-14.
Afifi, T.O., Brownridge, D.A., MacMillan, H., & Sareen, J. (2010). The relationship of gambling to intimate partner violence and child maltreatment in a nationally representative sample. Journal of Psychiatric Research, 44(5), 331-337.
Afifi, T.O., Cox, B.J., Martens, P.J., Sareen, J., & Enns, M.W. (2010). Demographic and social variables associated with problem gambling among men and women in Canada. Psychiatry Research, 178, 395-400.
Afifi, T.O., LaPlante, D.A., Taillieu, T.L., Dowd, D., & Shaffer, H.J. (2014). Gambling involvement: Considering frequency of play and the moderating effects of gender and age. International Journal of Mental Health and Addiction, 12(3), 283-294.
Balodis, S., Thomas, A., & Moore, S. (2014). Sensitivity to reward and punishment: Horse race and EGM gamblers compared. Personality and Individual Differences, 56, 29-33.
Barnes, G.M., Welte, J.W., Hoffman, J.H., & Dintcheff, B A. (1999). Gambling and alcohol use among youth: Influences of demographic, socialization, and individual factors. Addictive Behaviors, 24, 749–767.
Barnes, G.M., Welte, J.W., Hoffman, J.H., & Dintcheff, B.A. (2002). Effects of alcohol misuse on gambling patterns in youth. Journal of Studies on Alcohol, 63, 767–775.
Battersby, M., Tolchard, B., Scurrah, M., & Thomas, L. (2006). Suicide ideation and behaviour in people with pathological gambling attending a treatment service. International Journal of Mental Health and Addiction, 4(3), 233-246.
Beaver, K. M., Hoffman, T., Shields, R. T., Vaughn, M. G., DeLisi, M., & Wright, J. P. (2010). Gender differences in genetic and environmental influences on gambling: Results from a sample of twins from the National Longitudinal Study of Adolescent Health. Addiction, 105(3), 536-542.
Bergen, A.E., Newby-Clark, I.R., & Brown, A. (2012). Low trait self-control in problem gamblers: Evidence from self-report and behavioral measures. Journal of Gambling Studies, 28(4), 637-648.
Bergevin, T., Gupta, R., Derevensky, J. & Kaufman, F. (2006). Adolescent gambling: Understanding the role of stress and coping. Journal of Gambling Studies, 22, 195-208.

A comparative study of men and women gamblers in Victoria Hing, Russell, Tolchard & Nower
Victorian Responsible Gambling Foundation Page 94
Bicego, B. (2002). When a woman’s best friend is doing her harm. Paper presented at Expanding Our Horizons Conference, 18-22 February, University of Sydney, Australia.
Blanco, C., Petry, N., Stinson, F.S., & Grant, B.F. (2006). Sex differences in subclinical and DSM-IV pathological gambling: results from the National Epidemiologic survey on alcohol and related conditions. Psychological Medicine, 36, 943-953.
Blaszczynski, A., & Nower, L. (2002). A pathways model of problem and pathological gambling. Addiction, 97, 487-499.
Blaszczynski, A., Sharpe, L., & Walker, M. (2001). Final report: The assessment of the impact of the reconfiguration on electronic gaming machines as harm minimisation strategies for problem gambling.Sydney: University of Sydney.
Boughton, R., & Brewster, J.M. (2002). Voices of women who gamble in Ontario: A survey of women’s gambling, barriers to treatment and treatment service needs. Toronto: Ontario Ministry of Health and Long-Term Care.
Breen H. (2009). Senior citizen bingo players in Australian registered and licensed clubs: A case study at Tweed Heads, New South Wales. Journal of Travel and Tourism Marketing, 26(4), 383-394.
Brown, R. (1987). Classical and operant paradigms in the management of gambling addictions. Behavioural Psychotherapy, 15(02), 111-122.
Brown, S., & Coventry, L. (1997). Queen of hearts: The needs of women with gambling problems. Melbourne: Financial and Consumer Rights Council.
Carneiro, E., Tavares, H., Sanches, M., Pinsky, I., Caetano, R., Zaleski, M., & Laranjeira, R. (2014). Gambling onset and progression in a sample of at-risk gamblers from the general population. Psychiatry Research, 216(3), 404-411.
Casey, D M., Williams, R., Mossière, A., Schopflocher, D., el-Guebaly, N., Hodgins, D., . . . Wood, R. (2011). The role of family, religiosity, and behavior in adolescent gambling. Journal of Adolescence, 34(5), 841-851.
Casey, E. (2006). Domesticating gambling: Gender, caring and the UK National Lottery. Leisure Studies, 25(1), 3-16.
Cassidy, R. (2014). ‘A place for men to come and do their thing’: Constructing masculinities in betting shops in London. The British Journal of Sociology, 65(1), 170-191.
Castrén, S., Basnet, S., Pankakoski, M., Ronkainen, J.-E., Helakorpi, S., Uutela, A., . . . Lahti, T. (2013). An analysis of problem gambling among the Finnish working-age population: a population survey. BMC Public Health, 13(1), 519.
Castrén, S., Basnet, S., Salonen, A. H., Pankakoski, M., Ronkainen, J. E., Alho, H., & Lahti, T. (2013). Factors associated with disordered gambling in Finland. Substance Abuse Treatment, Prevention, and Policy, 8, 24.
Chambers, R.A., & Potenza, M.N. (2003). Neurodevelopment, impulsivity, and adolescent gambling. Journal of Gambling Studies, 19, 53-84.
Corney, R., & Davis, J. (2010). The attractions and risks of internet gambling for women: A qualitative study. Journal of Gambling Issues, 121-139.
A comparative study of men and women gamblers in Victoria Hing, Russell, Tolchard & Nower
Victorian Responsible Gambling Foundation Page 95
Crisp, B.R., Thomas, S.A., Jackson, A.C., Smith, S., Borrell, J., Ho, W.Y., Holt, T.A., & Thomason, N. (2004). Not the same: A comparison of female and male clients seeking treatment from problem gambling counseling services. Journal of Gambling Studies, 20, 283-299.
Cross, C., Copping, L., & Campbell, A. (2011). Sex differences in impulsivity: A meta-analysis. Psychological Bulletin, 137, 97-130.
Dannon, P.N., Lowengrub, K., Shalgi, B., Sasson, M. Tuson, L., Saphir, Y., & Kotler, M. (2006). Dual psychiatric diagnosis and substance abuse in pathological gamblers: A preliminary gender comparison study. Journal of Addictive Diseases, 25, 49-54.
Delfabbro, P H. (2012). Australasian gambling review (5th ed.). Adelaide: Independent Gambling Authority.
Delfabbro, P.H. (2009). Australasian gambling review (4th ed.). Adelaide: Independent Gambling Authority.
Delfabbro, P.H., King, D., & Griffiths, M.D. (2013). From adolescent to adult gambling: An analysis of longitudinal gambling patterns in South Australia. Journal of Gambling Studies, 1-17.
Delfabbro, P.H., Lahn, J., & Grabosky, P. (2005). Adolescent gambling in the ACT. Canberra: Australian National University.
Dell, L.J., Ruzicka, M.F., & Palisi, A.T. (1981). Personality and other factors associated with gambling addiction. International Journal of Addiction, 16, 149–156.
Dellis, A., Spurrett, D., Hofmeyr, A., Sharp, C., & Ross, D. (2012). Gambling participation and problem gambling severity among rural and peri-urban poor South African adults in KwaZulu-Natal. Journal of Gambling Studies, 1-17.
Desai, R.A., & Potenza, M.N. (2008). Gender differences in the associations between past-year gambling problems and psychiatric disorders. Social Psychiatry and Psychiatric Epidemiology, 43(3):173-83
Desai, R.A., Desai, M., & Potenza, M.N. (2007). Gambling, health and age: Data from the National Epidemiologic Survey on Alcohol and Related Conditions. Psychology of Addictive Behaviors, 21(4), 431.
Desai, R.A., Maciejewski, P.K., Dausey, D., Caldarone, B.J., & Potenza, M.N. (2004). Health correlates of recreational gambling in older adults. American Journal of Psychiatry, 161, 1672–1679.
Desai, R.A., Maciejewski, P.K., Pantalon, M.V., & Potenza, M.N. (2005). Gender differences in adolescent gambling. Annals of Clinical Psychiatry, 17(4), 249-258.
Desai, R.A., Maciejewski, P.K., Pantalon, M.V., & Potenza, M.N. (2006). Gender differences among recreational gamblers: Association with the frequency of alcohol use. Psychology of Addictive Behaviors, 20, 145-153.
Donati, M.A, Chiesi, F., & Primi, C. (2013). A model to explain at-risk/problem gambling among male and female adolescents: Gender similarities and differences. Journal of Adolescence, 36, 129-137.

A comparative study of men and women gamblers in Victoria Hing, Russell, Tolchard & Nower
Victorian Responsible Gambling Foundation Page 96
Dowling, N., Jackson, A.C., Thomas, S.A., & Freydenberg, E. (2010). Children at risk of developing problem gambling. Melbourne: Gambling Research Australia.
Dowling, N., Smith, D., & Thomas, T. (2005). Electronic gaming machines: Are they the ‘crack‐cocaine’ of gambling? Addiction, 100, 33-45.
Dussault, F., Brendgen, M., Vitaro, F., Wanner, B., & Tremblay, R E. (2011). Longitudinal links between impulsivity, gambling problems and depressive symptoms: a transactional model from adolescence to early adulthood. Journal of Child Psychology and Psychiatry, 52, 130-138.
Echeburua, E., Gonzalez-Ortega, I., deCorral, P., & Polo-Lopez, R. (2011). Clinical gender differences among adult pathological gamblers seeking treatment. Journal of Gambling Studies, 27, 215-227.
Echeburua, E., Gonzalez-Ortega, I., deCorral, P., & Polo-Lopez, R. (2013). Pathological gamblers and non-psychiatric control group taking gender differences into account. Spanish Journal of Psychology, 16(2), 1-9.
Ellenbogen, S. Derevensky, J. & Gupta, R. (2007). Gender differences among adolescents with gambling-related problems. Journal of Gambling Studies, 23, 133-143.
Ewing, J.A. (1984). Detecting alcoholism. JAMA: The Journal of the American Medical Association, 252(14), 1905-1907.
Felsher, J., Derevensky, J., & Gupta, R. (2010). Young adults with gambling problems: The impact of childhood maltreatment. International Journal of Mental Health & Addiction, 8, 545-556.
Ferris J., & Wynne H. (2001). The Canadian Problem Gambling Index: Final report. Ottawa: Canadian Centre on Substance Abuse.
Fong, D.K.-C., & Ozorio, B. (2005). Gambling participation and prevalence estimates of pathological gambling in a far-east gambling city: Macao. UNLV Gaming Research & Review Journal, 9(2), 15-28.
Gainsbury, S., Wood, R., Russell, A., Hing, N., & Blaszczynski, A. (2012). A digital revolution: Comparison of demographic profiles, attitudes and gambling behavior of Internet and non-Internet gamblers. Computers in Human Behavior, 28, 1388-1398.
Gavriel-Fried, B. & Ajzenstadt, M. (2012). Pathological women gamblers: Gender-related aspects of control. Sex Roles, 66, 128-142.
Gonzalez-Ortega, I., Echeburua, E., Corral, P., Polo-Lopez, R., & Alberich, S. (2013). Predictors of pathological gambling severity taking gender differences into account. European Addiction Research, 19, 146-154.
Granero, R., Penelo, E., Martínez-Giménez, R., Álvarez-Moya, E., Gómez-Peña, M., Aymamí, M. N., ... & Jiménez-Murcia, S. (2009). Sex differences among treatment-seeking adult pathologic gamblers. Comprehensive Psychiatry, 50, 173-180.
Grant, J.E. & Kim, S.W. (2002). Gender differences in pathological gamblers seeking medication treatment. Comprehensive Psychiatry, 43, 56-62.

A comparative study of men and women gamblers in Victoria Hing, Russell, Tolchard & Nower
Victorian Responsible Gambling Foundation Page 97
Grant, J.E., Odlaug, B L., & Mooney, M.E. (2012). Telescoping phenomenon in pathological gambling: Association with gender and comorbidities. The Journal of Nervous and Mental Disease, 200(11), 996.
Griffiths, M. (2009). Problem gambling in Europe: An overview. Nottingham: Nottingham Trent University.
Griffiths, M., Wardle, H., Orford, J., Sproston, K., & Erens, B. (2009). Sociodemographic correlates of Internet gambling: Findings from the 2007 British Gambling Prevalence Survey. Cyberpsychology and Behaviour, 12, 199-202.
Gupta, R. & Derevensky, J.L. (1998). Adolescent gambling behavior: A prevalence study and examination of the correlates associated with problem gambling. Journal of Gambling Studies, 14, 319–345.
Gupta, R. & Derevensky, J.L. (2000). Adolescents with gambling problems: From research to treatment. Journal of Gambling Studies, 16, 315–342.
Gupta, R., & Derevensky, J. L. (1998). An empirical examinination of Jacobs' General Theory of Addictions: Do adolescent gamblers fit the theory? Journal of Gambling Studies, 14(1), 17-49.
Hardoon, K K. & Derevensky, J.L. (2002). Child and adolescent gambling behavior: Current knowledge. Clinical Child Psychology and Psychiatry, 7, 263-281.
Hare, S. (2009). A study of gambling in Victoria: Problem gambling from a public health perspective. Melbourne: Department of Justice.
Hing, N., & Breen, H. (2001a). An empirical study of sex differences in gaming machine play amongst club members. International Gambling Studies, 1, 67-86.
Hing, N., & Breen, H. (2001b). Profiling lady luck: An empirical study of gambling & problem gambling amongst female club members. Journal of Gambling Studies, 17(1), 47-69.
Hing, N., & Gainsbury, S. (2011). Risky business: Gambling problems amongst gaming venue employees in Queensland, Australia. Journal of Gambling Issues, 4-23.
Hing, N., Gainsbury, S., Blaszczynski, A., Wood, R., Lubman, D., & Russell, A. (2014). Interactive gambling. Melbourne: Gambling Research Australia. http://www.gamblingresearch.org.au/home/interactive+gambling+pdf
Hing, N., Nuske, E., & Gainsbury, S. (2012). Gamblers at risk and their help-seeking behaviour. Melbourne: Gambling Research Australia.
Hing, N., Vitartas, P., & Lamont, M. (2014). Promotion of gambling and live betting odds during televised sport: Influences on gambling participation and problem gambling. Brisbane: Queensland Department of Justice and Attorney-General.
Hodgins, D., Schopflocher, D., el-Guebaly, N., Casey, D., Smith, G., Williams, R., & Wood, R. (2010). The association between childhood maltreatment and gambling problems in a community sample of adult men and women. Psychology of Addictive Behaviors, 24(3), 548.
Hodgins, D., Schopflocher, D., Martin, C., El-Guebaly, N., Casey, D., Currie, S., . . . Williams, R. (2012). Disordered gambling among higher-frequency gamblers: who is at risk? Psychological Medicine, 1(1), 1-12.

A comparative study of men and women gamblers in Victoria Hing, Russell, Tolchard & Nower
Victorian Responsible Gambling Foundation Page 98
Holdsworth, L., Hing, N., & Breen, H. (2012). Exploring women's problem gambling: A review of the literature. International Gambling Studies, 12(2), 199-213.
Holdsworth, L., Nuske, E., & Breen, H. (2012). Only the lonely: An analysis of women's experiences of poker machine gambling. Gambling Research, 23(2), 17.
Hraba, J., & Lee, G. (1996). Gender, gambling and problem gambling. Journal of Gambling Studies, 12, 83-101.
Huang, J.-H., Jacobs, D F., & Derevensky, J.L. (2010). Sexual risk-taking behaviors, gambling, and heavy drinking among US college athletes. Archives of Sexual Behavior, 39(3), 706-713.
Ibáñez, A., Blanco, C., de Castro, I. P., Fernandez-Piqueras, J., & Sáiz-Ruiz, J. (2003). Genetics of pathological gambling. Journal of Gambling Studies, 19(1), 11-22.
Ibáñez, A., Blanco, C., Moreryra, P., & Sáiz-Ruiz, J. (2003). Gender differences in pathological gambling. Journal of Clinical Psychiatry, 64, 295-301.
Jackson, A., Dowling, N., Thomas, S., Bond, L., & Patton, G. (2008). Adolescent gambling behaviour and attitudes: A prevalence study and correlates in an Australian population. International Journal of Mental Health and Addiction, 6, 325-352.
Jacobs, D.F. (1986). A general theory of addictions: A new theoretical model. Journal of Gambling Behavior, 2(1), 15-31.
Johansson, A., Grant, J.E., Kim, S.W., Odlaug, B.L., & Götestam, K.G. (2009). Risk factors for problematic gambling: A critical literature review. Journal of Gambling Studies, 25(1), 67-92.
Joutsa, J., Johansson, J., Niemelä, S., Ollikainen, A., Hirvonen, M.M., Piepponen, P., . . . Rinne, J.O. (2012). Mesolimbic dopamine release is linked to symptom severity in pathological gambling. Neuroimage, 60(4), 1992-1999.
King, S. M., Abrams, K., & Wilkinson, T. (2010). Personality, gender, and family history in the prediction of college gambling. Journal of Gambling Studies, 26(3), 347-359.
Korman, L. M., Collins, J., Dutton, D., Dhayananthan, B., Littman-Sharp, N., & Skinner, W. (2008). Problem gambling and intimate partner violence. Journal of Gambling Studies, 24(1), 13-23.
Ladd, G.T., & Petry, N.M. (2002). Disordered gambling among university-based medical and dental patients: A focus on Internet gambling. Psychology of Addictive Behaviors, 16(1), 76.
Lang, A.M., & Randall, B.A. (2013). Intergenerational transmission of gambling: Links between young adult and perceived grandparent gambling attitudes and behavior. Journal of Gambling Studies, 29(3), 551-573.
LaPlante, D. A., Nelson, S.E., LaBrie, R.A., & Shaffer, H.J. (2006). Men and women playing games: Gender and the gambling preferences of Iowa gambling treatment program participants. Journal of Gambling Studies, 22(1), 65-80.
Leblond, J., Ladouceur, R., & Blaszczynski, A. (2003). Which pathological gamblers will complete treatment? British Journal of Clinical Psychology, 42, 205-209.

A comparative study of men and women gamblers in Victoria Hing, Russell, Tolchard & Nower
Victorian Responsible Gambling Foundation Page 99
Ledgerwood, D., Arfken, C., Wiedemann, A., Bates, K., Holmes, D., & Jones, L. (2013). Who goes to treatment? Predictors of treatment initiation among gambling help‐line callers. The American Journal on Addictions, 22(1), 33-38.
Ledgerwood, D.M. Wiedemann, A.A., Moore, J., & Arfken, C.L. (2012). Clinical characteristics and treatment readiness of male and female problem gamblers calling a state gambling helpline. Addiction Research & Theory, 20, 162-171.
Lee, W.-Y., Kwak, D.H., Lim, C., Pedersen, P.M., & Miloch, K.S. (2011). Effects of personality and gender on fantasy sports game participation: The moderating role of perceived knowledge. Journal of Gambling Studies, 27(3), 427-441.
Lesieur, H.R., Cross, J., Frank, M., Welch, M., White, C.M., Rubenstein, G., Moseley, K., & Mark, M. (1999). Gambling and pathological gambling among university students. Addictive Behaviours, 16, 517–527.
Li, J. (2007). Women's ways of gambling and gender‐specific research. Sociological Inquiry, 77(4), 626-636.
Livingstone, C., Woolley, R., Zazryn, T., Bakacs, L., & Shami, R. (2008). The relevance and role of gaming machine games and game features on the play of problem gamblers. Adelaide: Independent Gambling Authority.
Lloyd, J., Doll, H., Hawton, K., Dutton, W.H., Geddes, J.R., Goodwin, G.M., & Rogers, R.D. (2010). How psychological symptoms relate to different motivations for gambling: An online study of Internet gamblers. Biological Psychiatry, 68, 733-740.
Lussier, I.D., Derevensky, J., Gupta, R., & Vitaro, F. (2013). Risk, compensatory, protective, and vulnerability factors related to youth gambling problems. Psychology of Addictive Behaviors. DOI: 10.1037/a0034259
Ly, C. (2010). An exploratory investigation of online gambling amongst university students in Tasmania. Hobart: Department of Health and Human Services.
Martin, B., & Moskos, M. (2007). Evaluative research project. Final report. Adelaide: Independent Gambling Authority.
Martins, S.S., Tavares, H., da Silva Lobo, D.S., Galetti, A.M., & Gentil, V. (2004). Pathological gambling, gender, and risk-taking behaviors. Addictive Behaviors, 29, 1231-1235.
Matheson, K., Wohl, M.J.A., & Anisman, H. (2009). The interplay of appraisals, specific coping styles, and depressive symptoms among young male and female gamblers. Social Psychology, 40, 212-221.
McComb, J.L., & Sabiston, C.M. (2010). Family influences on adolescent gambling behavior: A review of the literature. Journal of Gambling Studies, 26(4), 503-520.
McCormack, A., & Griffiths, M.D. (2012). Motivating and inhibiting factors in online gambling behaviour: A grounded theory study. International Journal of Mental Health and Addiction, 10(1), 39-53.
McCormack, A., Shorter, G.W., & Griffiths, M.D. (2014). An empirical study of gender differences in online gambling. Journal of Gambling Studies, 30(1), 71-88.
A comparative study of men and women gamblers in Victoria Hing, Russell, Tolchard & Nower
Victorian Responsible Gambling Foundation Page 100
McCormick, J., Delfabbro, P., & Denson, L. A. (2012). Psychological vulnerability and problem gambling: an application of Durand Jacobs’ general theory of addictions to electronic gaming machine playing in Australia. Journal of Gambling Studies, 28(4), 665-690.
McDonnell-Phillips Pty Ltd (2005). Analysis of gambler precommitment behaviour. Melbourne: Gambling Research Australia.
McMullan, J.L. (2011). Submission to the Joint Select Committee on Gambling Reform Inquiry into Interactive Gambling. Retrieved 3 September 2013 from: http://www.aph.gov.au/senate/committee/gamblingreform_ctte/interactive_online_gambling_advertising/submissions.htm
Moore, S. M., Thomas, A. C., Kyrios, M., & Bates, G. (2012). The self-regulation of gambling. Journal of Gambling Studies, 28(3), 405-420.
Moore, S. M., Thomas, A. C., Kyrios, M., Bates, G., & Meredyth, D. (2011). Gambling accessibility: A scale to measure gambler preferences. Journal of Gambling Studies, 27(1), 129-143.
Neal, P., Delfabbro, P.H., & O’Neil, M. (2005). Problem gambling and harm: Towards a national definition. Melbourne: Gambling Research Australia.
Nower, L., & Blaszczynski, A. (2006). Characteristics and gender differences among self-excluded casino problem gamblers: Missouri data. Journal of Gambling Studies, 22, 81-99.
Nower, L., & Blaszczynski, A. (2010). Gambling motivations, money-limiting strategies, and precommitment preferences of problem versus non-problem gamblers. Journal of Gambling Studies, 26, 361-372.
Nower, L., Derevensky, J.L., & Gupta, R. (2004). The relationship of impulsivity, sensation seeking, coping, and substance use in youth gamblers. Psychology of Addictive Behaviors, 18(1), 49.
Nower, L., Gupta, R., Blaszczynski, A., & Derevensky, J.L. (2004). Suicidality and depression among youth gamblers: A preliminary examination of three studies. International Gambling Studies, 4, 69-80.
Nower, L., Martins, S.S., Lin, K.H., & Blanco, C. (2013). Subtypes of disordered gamblers: Results from the National Epidemiologic Survey on Alcohol and Related Conditions. Addiction, 108, 789-798.
Odlaug, B.L., Marsh, P.J., Kim, S.W., & Grant, J.E. (2011). Strategic vs nonstrategic gambling: Characteristics of pathological gamblers based on gambling preference. Annals of Clinical Psychiatry, 23, 105-112.
Parslow, R.A., & Jorm, A.F. (2000). Who uses mental health services in Australia? An analysis of data from the National Survey of Mental Health and Wellbeing. Australian & New Zealand Journal of Psychiatry, 34(6), 997-1008.
Perese, L., Bellringer, M., & Abbott, M. (2005). Literature review to inform social marketing objectives and approaches, and behaviour change indicators, to prevent and minimise gambling harm. Auckland: Gambling Research Centre, Auckland University of Technology.
Petry, N. (2012). Discounting of probabilistic rewards is associated with gambling abstinence in treatment-seeking pathological gamblers. Journal of Abnormal Psychology, 121(1), 151.

A comparative study of men and women gamblers in Victoria Hing, Russell, Tolchard & Nower
Victorian Responsible Gambling Foundation Page 101
Petry, N.M. (2005). Stages of change in treatment-seeking pathological gamblers. Journal of Consulting and Clinical Psychology, 73(2), 312.
Petry, N.M., & Steinberg, K.L. (2005). Childhood maltreatment in male and female treatment-seeking pathological gamblers. Psychology of Addictive Behaviors, 19, 226.
Petry, N.M., Stinson, F.S., & Grant, B.F. (2005). Comorbidity of DSM-IV pathological gambling and other psychiatric disorders: Results from the national epidemiologic survey on alcohol and related conditions. Journal of Clinical Psychiatry, 66, 564-574.
Pierce, M., Wentzel J., & Loughnan, T. (1997). Male gamblers/female gamblers: Mapping the differences. In G. Coman, B. Evans and R. Wootton (eds), Responsible Gambling: A Future Winner: Proceedings of the Eighth National Conference of the National Association for Gambling Studies (pp. 293-309). Melbourne: National Association for Gambling Studies.
Pilver, C E., Libby, D.J., Hoff, R.A., & Potenza, M.N. (2013). Gender differences in the relationship between gambling problems and the incidence of substance-use disorders in a nationally representative population sample. Drug and Alcohol Dependence, 133(1), 204-211.
Potenza, M.N., Maciejewski, P K., & Mazure, C.M. (2006). A gender-based examination of past-year recreational gamblers. Journal of Gambling Studies, 22(1), 41-64.
Potenza, M.N., Steinberg, M.A., McLaughlin, S.D., Wu, R., Rounsaville, B.J., & O’Malley, S.S. (2001). Gender-related differences in the characteristics of problem gamblers using a gambling helpline. American Journal of Psychiatry, 158, 1500-1505.
Problem Gambling Research & Treatment Centre (2011). Guidelines for screening, assessment and treatment in problem gambling. Clayton: Monash University.
Productivity Commission (1999). Australia’s gambling industries, report no. 10. Canberra: AusInfo.
Productivity Commission (2010). Gambling, report no. 50. Canberra: Commonwealth of Australia.
Pulford, J., Bellringer, M., Abbott, M., Clarke, D., Hodgins, D., & Williams, J. (2009). Reasons for seeking help for a gambling problem: The experiences of gamblers who have sought specialist assistance and the perceptions of those who have not. Journal of Gambling Studies, 25(1), 19-32.
Queensland Government (2001). Queensland household gambling survey 2000-01. Brisbane: Queensland Government.
Queensland Government (2004). Queensland Household Gambling Survey 2003-04. Brisbane: Queensland Government
Queensland Government (2008). Queensland Household Gambling Survey 2006-07. Brisbane: Queensland Government
Queensland Government (2010). Queensland Household Gambling Survey 2008-09. Brisbane: Queensland Government
Queensland Government (2012). Queensland household gambling survey 2011-12. Brisbane: Queensland Government.

A comparative study of men and women gamblers in Victoria Hing, Russell, Tolchard & Nower
Victorian Responsible Gambling Foundation Page 102
Quirke, M. (1996). Women gambling on poker machines: A way of coping?. In B. Tolchard (ed.), Towards 2000: The future of gambling: Proceedings of Seventh National Conference of the National Association for Gambling Studies (pp. 235-47). Adelaide: National Association for Gambling Studies.
Redish, A.D., Jensen, S., Johnson, A., & Kurth-Nelson, Z. (2007). Reconciling reinforcement learning models with behavioral extinction and renewal: implications for addiction, relapse, and problem gambling. Psychological Review, 114(3), 784.
Rockloff, M.J., & Dyer, V. (2007). An experiment on the social facilitation of gambling behavior. Journal of Gambling Studies, 23(1), 1-12.
Rockloff, M.J., & Hing, N. (2012). The impact of jackpots on EGM gambling behavior: A review. Journal of Gambling Studies, 29(4), 1-16.
Rollnick, S., Heather, N., Gold, R., & Hall, W. (1992). Development of a short ‘readiness to change’ questionnaire for use in brief, opportunistic interventions among excessive drinkers. British Journal of Addiction, 87(5), 743-754.
Romild, U., Volberg, R., & Abbott, M. (2014). The Swedish Longitudinal Gambling Study (Swelogs): Design and methods of the epidemiological (EP‐) track. International Journal of Methods in Psychiatric Research.
Sacco, P., Torres, L.R., Cunningham-Williams, R.M., Woods, C., & Unick, G. (2011). Differential item functioning of pathological gambling criteria: An examination of gender, race/ethnicity and age. Journal of Gambling Studies, 27, 317-330.
Sassen, M., Kraus, L., Bühringer, G., Pabst, A., Piontek, D., & Taqi, Z. (2011). Gambling among adults in Germany: Prevalence, disorder and risk factors. SUCHT-Zeitschrift für Wissenschaft und Praxis/Journal of Addiction Research and Practice, 57(4), 249-257.
Saugeres, L., Thomas, A., Moore, S., & Bates, G. (2012). Gamblers tell their stories: Life patterns of gambling. Melbourne: Department of Justice.
Scannell, E., Quirk, M., Smith, K., Maddern, R., & Dickerson, M. (2000). Females coping styles and control over poker machine gambling. Journal of Gambling Studies, 16, 417–432.
Schull, S. (2002). Escape mechanism: Women, caretaking, and compulsive machine gambling. Berkley: University of California.
Shaffer, H.J., & Martin, R. (2011). Disordered gambling: Etiology, trajectory, and clinical considerations. Annual Review of Clinical Psychology, 7, 483-510.
Slutske, W., Zhu, G., Meier, M., & Martin, N. (2010). Genetic and environmental influences on disordered gambling in men and women. Archives of General Psychiatry 67, 624-630.
Slutske, W.S., Ellingson, J.M., Richmond-Rakerd, L.S., Zhu, G., & Martin, N.G. (2013). Shared genetic vulnerability for disordered gambling and alcohol use disorder in men and women: eEvidence from a national community-based Australian Twin Study. Twin Research and Human Genetics, 16(02), 525-534.

A comparative study of men and women gamblers in Victoria Hing, Russell, Tolchard & Nower
Victorian Responsible Gambling Foundation Page 103
Smith, D., Harvey, P., Battersby, M., Pols, R., Oakes, J., & Baigent, M. (2010). Treatment outcomes and predictors of drop out for problem gamblers in South Australia: A cohort study. Australian and New Zealand Journal of Psychiatry, 44, 911-920.
Sodano, R., & Wulfert, E. (2010). Cue reactivity in active pathological, abstinent pathological, and regular gamblers. Journal of Gambling Studies, 26(1), 53-65.
Sproston, K., Hing, N., & Palankay, C. (2012). Prevalence of gambling and problem gambling in New South Wales. Sydney: Ogilvy Illumination.
Stevens, M., & Young, M. (2010). Who plays what? Participation profiles in chance versus skill-based gambling. Journal of Gambling Studies, 26(1), 89-103.
Surgey, D. (2000). Playing for time: Exploring the impacts of gambling on women. Melbourne: Victorian Department of Human Services.
Svensson, J., & Romild, U. (2014). Problem gambling features and gendered gambling domains amongst regular gamblers in a Swedish population-based study. Sex Roles, 70(5-6), 240-254.
Svensson, J., Romild, U., Nordenmark, M., & Månsdotter, A. (2011). Gendered gambling domains and changes in Sweden. International Gambling Studies, 11(2), 193-211.
Tang, C.S., Wu, A.M., & Tang, J.Y. (2007). Gender differences in characteristics of Chinese treatment-seeking problem gamblers. Journal of Gambling Studies, 23, 145-156.
Tarras, J., Singh, A., & Moufakkir, O. (2012). The profile and motivations of elderly women gamblers. UNLV Gaming Research & Review Journal, 5(1), 3.
Thomas, A., & Moore, S. (2003). The interactive effects of avoidance coping and dysphoric mood on problem gambling for female and male gamblers. Journal of Gambling Issues, 8, not paginated.
Thomas, A., Bates, G., Moore, S., Kyrios, M., Meredyth, D., & Jessop, G. (2011). Gambling and the multidimensionality of accessibility: More than just proximity to venues. International Journal of Mental Health and Addiction, 9(1), 88-101.
Thomas, A., Moore, S., Kyrios, M., Bates, G., Meredyth, D., & Jessop, G. (2010). Problem gambling vulnerability: The interaction between access, individual cognitions and group beliefs/preferences: Office of Gaming and Racing, Victorian Government Department of Justice.
Thomas, A., Pfeifer, J., Moore, S., Meyer, D., Yap, L, & Armstrong, A. (2013). Evaluation of the removal of ATMs from gaming venues in Victoria, Australia. Melbourne: Department of Justice.
Thomas, S. (1998). Excessive poker machine gambling and anxiety disorders. Gambling Research, 10, 7-13.
Thomas, S., & Jackson. A.C. (2008). Risk and protective factors, depression and comorbidities in problem gambling. Melbourne: Beyondblue.
Thomas, S., & Moore, S. (2001). Do women gamble for the same reasons as men? In A. Blaszczynski et al. (Eds.), Culture and the gambling phenomenon: Proceedings of the 11th Annual

A comparative study of men and women gamblers in Victoria Hing, Russell, Tolchard & Nower
Victorian Responsible Gambling Foundation Page 104
Conference of the National Association for Gambling Studies (pp. 366-377). Sydney: National Association for Gambling Studies.
Thomas, S.L., Lewis, S., McLeod, C., & Haycock, J. (2012). “They are working every angle”. A qualitative study of Australian adults' attitudes towards, and interactions with, gambling industry marketing strategies. International Gambling Studies, 12(1), 111-127.
Toce-Gerstein, M., Gerstein, D.R., & Volberg, R.A. (2009). The NODS–CLiP: A rapid screen for adult pathological and problem gambling. Journal of Gambling Studies, 25(4), 541-555.
Tolchard, B., & Battersby, M. (2013). Cognitive behaviour therapy for problem gamblers: A clinical outcomes evaluation. Behaviour Change, 30(01), 12-23.
Toneatto, T., & Wang, J.J. (2009). Community treatment for problem gambling: Sex differences in outcome and process. Community Mental Health Journal, 45, 468-475.
Tremayne, K., Masterman-Smith, H., & McMillen, J. (2001). Survey of the nature and extent of gambling and problem gambling in the ACT. Sydney: Australian Institute for Gambling Research.
Trevorrow, K., & Moore, S. (1998).The association between loneliness, social isolation and women’s electronic gaming machine gambling. Journal of Gambling Studies, 14, 263–284.
Tu, D., Gray, R.J., & Walton, D.K. (2014). Household experience of gambling-related harm by socio-economic deprivation in New Zealand: increases in inequality between 2008 and 2012. International Gambling Studies, 14(2), 330-344.
Vitaro, F., & Wanner, B. (2011). Predicting early gambling in children. Psychology of Addictive Behaviors, 25, 118.
Vitaro, F., Brendgen, M., Ladouceur, R., & Tremblay, R.E. (2001). Gambling, delinquency, and drug use during adolescence: Mutual influences and common risk factors. Journal of Gambling Studies, 17, 171– 190.
Volberg, R. (2003). Has there been a ‘feminization’ of gambling and problem gambling in the United States? Journal of Gambling Issues, 8, May, not paginated.
Walker, G.J., Hinch, T.D., & Weighill, A. (2005). Inter-and intra-gender similarities and differences in motivations for casino gambling. Leisure Sciences, 27(2), 111-130.
Wardle, H., Sproston, K., Orford, J., Erens, J., Griffiths, M., Constantine, R., & Pigott, S. (2007). British Gambling Prevalence Survey 2007. London: The National Centre for Social Research.
Weinstock, J., Burton, S., Rash, C. J., Moran, S., Biller, W., Krudelbach, N., . . . Morasco, B. J. (2011). Predictors of engaging in problem gambling treatment: Data from the West Virginia Problem Gamblers Help Network. Psychology of Addictive Behaviors, 25(2), 372.
Weinstock, J., Scott, T.L., Burton, S., Rash, C.J., Moran, S., Biller, W., & Kruedelbach, N. (2013). Current suicidal ideation in gamblers calling a helpline. Addiction Research & Theory, (0), 1-9.
Welte, J.W., Barnes, G.M, Wieczorek, W.F., Tidwell, M-C.O. Tidwell, Hoffman, J.H. (2007). Type of gambling and availability as risk factors for problem gambling: A tobit regression analysis by age and gender. International Gambling Studies, 7 (2), 183-198.

A comparative study of men and women gamblers in Victoria Hing, Russell, Tolchard & Nower
Victorian Responsible Gambling Foundation Page 105
Williams, R. J., Lee, C.-K., & Back, K. J. (2013). The prevalence and nature of gambling and problem gambling in South Korea. Social Psychiatry and Psychiatric Epidemiology, 48(5), 821-834.
Williams, R.J., Volberg, R.A., & Stevens, R. (2012). The population prevalence of problem gambling: Methodological influences, standardized, rates, jurisdictional differences, and worldwide trends. Guelph: Ontario Problem Gambling Research Centre and the Ontario Ministry of Health and Long Term Care.
Williams, R.J., West, B L., & Simpson, R.I. (2007). Prevention of problem gambling: A comprehensive review of the evidence. Guelph: Ontario Problem Gambling Research Centre.
Williams, R.J., West, B.L., & Simpson, R.I. (2012). Prevention of problem gambling: A comprehensive review of the evidence and identified best practices. Guelph: Ontario Problem Gambling Research Centre.
Winters, K.C., & Anderson, N. (2000). Gambling involvement and drug use among adolescents. Journal of Gambling Studies, 16, 175–198.
Winters, K.C., Stinchfield, R.D., & Fulkerson, J. (1993). Patterns and characteristics of adolescent gambling. Journal of Gambling Studies, 9, 371–386.
Winters, K.C., Stinchfield, R.D., & Kim, LG. (2002). Monitoring adolescent gambling in Minnesota. Journal of Gambling Studies, 11, 165–183.
Wong, G., Zane, N., Saw, A., & Chan, A.K.K. (2013). Examining gender differences for gambling engagement and gambling problems among emerging adults. Journal of Gambling Studies, 29, 171-189.
Wong, I.L.K., & Lam, P.S. (2013). Work stress and problem gambling among Chinese casino employees in Macau. Asian Journal of Gambling Issues and Public Health, 3(1), 1-16.
Wood, R.T., & Williams, R.J. (2011). A comparative profile of the Internet gambler: Demographic characteristics, game-play patterns, and problem gambling status. New Media & Society, 13, 1123-1141.
Woolley, R. (2003). Mapping Internet gambling: Emerging modes of online participation in wagering and sports betting. International Gambling Studies, 3, 3-21.
Worthington, A., Brown, K., Crawford, M., & Pickernell, D. (2007). Gambling participation in Australia: Findings from the National Household Expenditure Survey. Review of Economics of the Household, 5(2), 209-221.
Young, M., Stevens, M., & Morris, M. (2008). Problem gambling within the non-Indigenous population of the Northern Territory of Australia: A multivariate analysis of risk factors. International Gambling Studies, 8, 77-93.
Zimmerman, J. (2011). Casino gambling as an income-based leisure activity: Evidence from the gambling impact and behavior study. Journal of Business & Economics Research (JBER), 1(12).

Appendix A: Excerpt explaining study methodology and sampling design from A Study of Gambling in Victoria (Hare, 2009).
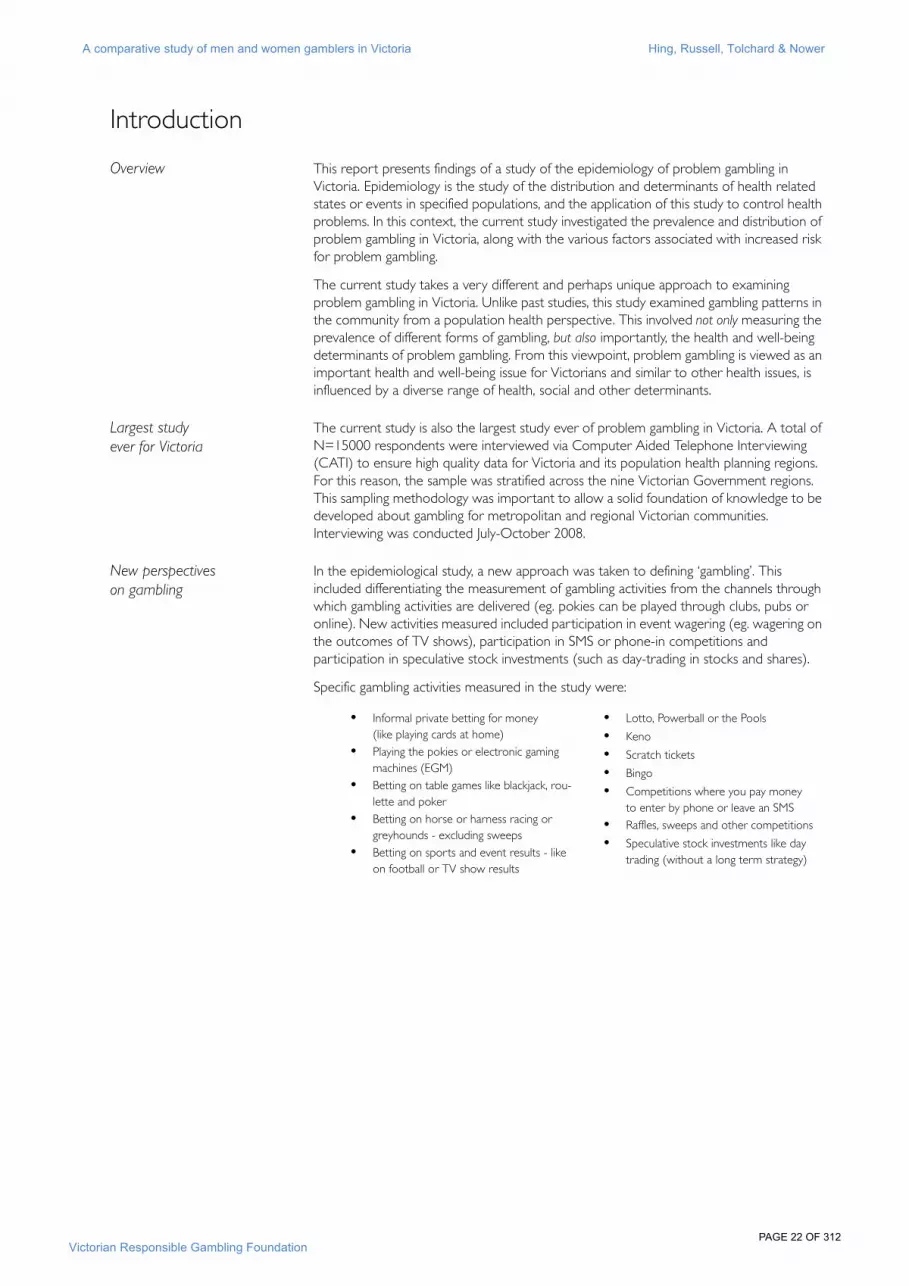
A comparative study of men and women gamblers in Victoria Hing, Russell, Tolchard & Nower
Victorian Responsible Gambling Foundation !"#$%**%'(%)&*
Introduction
Overview This report presents findings of a study of the epidemiology of problem gambling in Victoria. Epidemiology is the study of the distribution and determinants of health related states or events in specified populations, and the application of this study to control health problems. In this context, the current study investigated the prevalence and distribution of problem gambling in Victoria, along with the various factors associated with increased risk for problem gambling.
The current study takes a very different and perhaps unique approach to examining problem gambling in Victoria. Unlike past studies, this study examined gambling patterns in the community from a population health perspective. This involved not only measuring the prevalence of different forms of gambling, but also importantly, the health and well-being determinants of problem gambling. From this viewpoint, problem gambling is viewed as an important health and well-being issue for Victorians and similar to other health issues, is influenced by a diverse range of health, social and other determinants.
Largest study ever for Victoria
The current study is also the largest study ever of problem gambling in Victoria. A total of N=15000 respondents were interviewed via Computer Aided Telephone Interviewing (CATI) to ensure high quality data for Victoria and its population health planning regions. For this reason, the sample was stratified across the nine Victorian Government regions. This sampling methodology was important to allow a solid foundation of knowledge to be developed about gambling for metropolitan and regional Victorian communities. Interviewing was conducted July-October 2008.
New perspectiveson gambling
In the epidemiological study, a new approach was taken to defining ‘gambling’. This included differentiating the measurement of gambling activities from the channels through which gambling activities are delivered (eg. pokies can be played through clubs, pubs or online). New activities measured included participation in event wagering (eg. wagering on the outcomes of TV shows), participation in SMS or phone-in competitions and participation in speculative stock investments (such as day-trading in stocks and shares).
Specific gambling activities measured in the study were:
! Informal private betting for money (like playing cards at home)
! Playing the pokies or electronic gaming machines (EGM)
! Betting on table games like blackjack, rou-lette and poker
! Betting on horse or harness racing or greyhounds - excluding sweeps
! Betting on sports and event results - like on football or TV show results
! Lotto, Powerball or the Pools
! Keno
! Scratch tickets
! Bingo
! Competitions where you pay money to enter by phone or leave an SMS
! Raffles, sweeps and other competitions
! Speculative stock investments like day trading (without a long term strategy)

A comparative study of men and women gamblers in Victoria Hing, Russell, Tolchard & Nower
Victorian Responsible Gambling Foundation
!"#$%*)%'(%)&*
Interesting designfeatures of the study
The epidemiological study of problem gambling included many design features that had not been previously trialled in past prevalence studies. Notable design features of the study included:
!! concentration of study sampling within high Electronic Gaming Machine (EGM) expenditure Local Government Areas (LGA) across Victorian Government regions
!! use of random digit dialling to ensure improved coverage of households in Victoria (given that a current version of electronic Whitepages is no longer available on disk)
!! screening of all past year gamblers for risk for problem gambling
!! screening of all people who had ever gambled for risk for lifetime problem gambling
!! use of a range of validated health measurement scales including use of the Kessler-10 (measurement of generalised psychological distress), the CAGE alcohol screen (measurement of clinically significant alcohol abuse), the Gambling Readiness to Change Scale (for measurement of readiness to reduce gambling) and measurement of a diverse range of health conditions and health behaviours (eg. general health, health conditions and disabilities, smoking, alcohol and drug use, suicide ideation, illegal activities etc.)

A comparative study of men and women gamblers in Victoria Hing, Russell, Tolchard & Nower
Victorian Responsible Gambling Foundation !"#$%*+%'(%)&*
Epidemiological study methodology and sampling design
Measurementof problemgambling
Problem gambling has been traditionally measured using a range of validated measurement scales. The accepted Australian national measurement scale for measuring risk for problem gambling is the nine-item Canadian Problem Gambling Severity Index (PGSI) (Ferris and Wynne, 2001). For this reason, the PGSI was also used in the current study.
In the Victorian Epidemiological Study of Problem Gambling, all 15000 respondents playing at least one gambling activity in the past year were screened using the nine-item PGSI. This included even players who played forms of gambling such as only lotto or scratch tickets. This was undertaken to explore potential risk for problem gambling across the whole of the Victorian population. This was also seen as important, given the changing nature of gambling and channels for accessing gambling.
The PGSI measures an individual’s risk for problem gambling by segmenting gamblers into four key risk categories based on a total risk score out of 27. Specifically, these are:
!! Non-problem gamblers (a score of 0 on the CPGSI)
!! Low risk gamblers (a score of 1-2 on the CPGSI)
!! Moderate gamblers (a score of 3-7 on the CPGSI)
!! Problem gamblers (a score of 8 or higher on the CPGSI)
For consistency with other states in Australia, the Queensland Household Gambling Survey PGSI scale anchors were used in lieu of the original PGSI scale anchors.
Using ratings of Never (score of 0), Rarely/Sometimes (score of 1), Often (score of 2) and Always (score of 3), defining items of the CPGSI ask an individual to think about the past year and rate ‘How often you have’:
Measures To ensure a detailed assessment of problem gambling in a public health context, a range of important health and well-being measures were examined in the study. This included, where possible, validated measurement instruments used in population health settings. Apart from the Canadian Problem Gambling Severity Index, discrete validated measurement instruments used in the survey included:
!! The NODS-CLiP2 - was used to measure the lifetime prevalence of problem gambling/ pathological gambling. The 5 item scale is currently not published. It was developed by Rachel Volberg and Yoku Shaw Taylor
!! The CAGE alcohol screen - was used to measure risk of clinically significant alcohol abuse (Ewing, 1984)
!! Self-reported health - a measure of general health was assessed by asking respondents to indicate whether their health was excellent, very good, good, fair or poor. This has been shown to be generally a good predictor of ill-health, future health care needs and other behavioural and psychosocial risk factors (eg. Idler & Benyami, 1997)
!! Kessler-10 - a measure of psychological distress was used, which has also been used in Australian Bureau of Statistics Health Surveys (Kessler et. al, 1992)
! Bet more than you could really afford to lose?
! Needed to gamble with larger amounts of money to get the same feeling of excitement?
! Gone back another day to try to win back the money you lost?
! Borrowed money or sold anything to get money to gamble?
! Felt that you might have a problem with gambling?
! Felt guilty about the way you gamble, or what happens when you gamble?
! Has your gambling caused any financial prob-lems for you or your household?
! Had people criticize your betting or told you that you had a gambling problem, regardless of whether or not you thought it was true?
! Has your gambling caused you any health prob-lems, including stress or anxiety?

A comparative study of men and women gamblers in Victoria Hing, Russell, Tolchard & Nower
Victorian Responsible Gambling Foundation
!"#$%*,%'(%)&*
!! Social capital items - as used as in Victorian Population Health surveys, these items explored issues such as social support and whether people liked living in their community
!! The Gambling Readiness-to-Change Scale - the scale segmented gamblers into precontemplation, contemplation and action in terms of their preparedness to reduce their gambling behaviour, as devised by Rollnick et al. (1992)
In addition, a range of other comorbidities were also measured in the study including alcohol consumption, smoking, the influence of life events on problem gambling, health conditions, offending behaviours, suicide ideation, drug use and disabilities affecting a person’s day-to-day life. A copy of the survey instrument is presented in the Appendix.
Ethical review To ensure an ethically-sound approach to the research, a rigorous ethical review process was applied to the design and conduct of the study. This helped ensure that any vulnerable respondents were assisted with information and support where identified during the course of the research. This included design of the Computer Aided Telephone Interviewing program to automatically ensure that ‘at-risk’ respondents were offered help in line with their needs and a ‘warm referral’ process was offered where respondents were able to be called by counsellors. This was supported by the Gambler’s Help line. National Health and Medical Research Council Guidelines were used to guide the ethical review process, in conjunction with advice from Department of Human Services.
Sampling Random digit dialling (RDD) was used in the survey process for household selection. Random digit dial sample was generated to align to the Local Government Areas within Victoria. Random digit dialling is also necessary nowadays, given the limited availability of current electronic Whitepages residential listings on disk and the additional issue that a reasonable proportion of households have private numbers.
The approach to sampling included:
!! Stratification of sampling in line with the key Victorian Government Regions - this implied that, if a certain percent of the population came from a certain Victorian Government region, this was set to the same percent of the total sample of N=15000
!! Within each region of Victoria, three Electronic Gaming Machine Expenditure bands were formed - This included low, medium and high expenditure bands. Local Government Areas were then allocated to each band based on the per capita EGM expenditure for 2006-2007 (based on data supplied by the Victorian Commission for Gambling Regulation). In some cases, this implied that certain LGAs may have had only medium or high spend bands and hence no low expenditure bands - Spend bands cut-offs were defined by listing the per capita EGM expenditure amounts from low to high and allocating one-third to each band
!! Within each spend band, RDD numbers relating to different LGAs were pooled and numbers randomly selected with approximately 70% of the total sample coming from the high spend band, 20% of the sample from the medium spend band and 10% of the sample from the low spend band - This implied that sampling favoured high EGM and medium EGM spend band areas. This was designed to improve identification of problem gambling
!! From this point, sampling was completely random with no age or gender quotas, however, weighting allowed for gender and age adjustments. The ‘most recent birthday’ method was also used to select a respondent randomly within each household
!! Participation of respondents by age and gender was closely monitored during the research. This also permitted strategies to assist in building a representative profile of respondents. For instance, in cases where low participation from young males was apparent, strategies were developed regularly to improvement engagement with young people during the early interview stage to improve response rates. Strategies to improve response rates were then continually trialled and refined in the context of the research

A comparative study of men and women gamblers in Victoria Hing, Russell, Tolchard & Nower
Victorian Responsible Gambling Foundation
!"#$%*-%'(%)&*
A ‘batch and exhaust’ style methodology was used to load sample progressively into the CATI system. This implied loading batches of phone numbers into the CATI system until each batch was exhausted. This was important to ensure that numbers were exhausted as far as possible prior to loading additional ‘virgin’ sample. As quotas were nearing at the Victorian Government region level, progressively smaller sample batches of RDD numbers were loaded prior to exhausting the sample (as low as 1% of the total sample). While not a perfect methodology, this methodology achieved a good balance between ensuring that all sample was exhausted as far as possible in the project, whilst still allowing interviewing to progress at a reasonable rate.

A comparative study of men and women gamblers in Victoria Hing, Russell, Tolchard & Nower
Victorian Responsible Gambling Foundation
!"#$%*.%'(%)&*
RDD number geographic concordance
As random digit dial numbers cannot be perfectly allocated to Local Government Areas (initial allocations are only a rough estimate of the likely location of the number), the following steps were used to achieve concordance between telephone numbers generated and the allocation of a respondent to a given LGA (and accordingly, to a correct EGM spend band):
!! a large batch of RDD numbers for Victoria was generated using an RDD number generator with an aim to cover all post codes within Victoria
!! approximate concordance between RDD phone numbers and post codes was determined using a phone pre-fix postcode concordance database - as phone prefixes can span across postcodes and LGAs, this first step was only an estimation of the location of the respondent in a postcode/LGA/Victorian Government region
!! postcode to LGA concordance information was then sourced from the Australian Bureau of Statistics and RDD numbers were allocated to a ‘predicted’ LGA
!! some postcodes which existed, yet were not in the ABS Concordance database were manually viewed from a postcode map and were allocated the nearest concording postcode (and in turn, LGA)
!! once the estimated LGA concordance was established, a batch of numbers was allocated in proportions in line with the sampling frame (see below)
!! during the survey, respondents were asked to confirm their true LGA during interview - this implied that some numbers (respondents) were then reallocated to a new LGA
!! in the case that respondents did not know their LGA, a respondent’s suburb was also requested - this allowed the correct LGA to be identified through a manual process
The location of respondents within Victoria was also screened prior to interview commencement. This allowed respondents in border areas in NSW and SA to be excluded from the sample.
Sample sizes within and across EGM expenditure bands are shown in Table 4. As shown, the sample size allocation to each EGM spend band was only approximately 70/20/10, given that expected LGAs (based on phone prefix numbers) did not perfectly concord with actual LGAs (which were confirmed during interviews or ascertained from respondents providing their suburb). In addition, some areas such as Gippsland were allocated zero sample in the low band as the area had per capita EGM expenditure levels, which could not be justifiably allocated to a low band.
Subsampling As there was a desire to maximise the available sample for the study, following administration of the questions relating to gambling participation and the Canadian Problem Gambling Severity Index (where the entire population was screened), only non-problem gamblers were subsampled for completion of the main study. In total, 1 in 3 non-problem gamblers were selected for the main interview. This was primarily for reasons of cost-effectiveness. The design of the study was also structured such that non-gamblers completed very few questions.
Table 4. Sample size within and across EGM Expenditure bands for the epidemiological study (N=15000, July-October 2008)
Type of LGAsBarwon South-West
Eastern Metro
Gippsland Grampians HumeLoddon-Mallee
North-West Metro
Southern Metro
TotalN
Low EGM spend band
102 (10%) 329 (11%) 0 (0%) 68 (11%) 78 (10%) 104 (12%) 490 (11%) 298 (8%) 1469(100%)
Medium EGM spend band
194 (19%) 566 (19%) 216 (30%) 136 (22%) 151 (20%) 166 (19%) 1095 (24%) 745 (21%) 3269(100%)
High EGM spend band
740 (71%) 2022 (69%) 500 (70%) 409 (67%) 527 (70%) 607 (69%) 2911 (65%) 2546 (71%) 10262(100%)
Totals 1036 2917 716 613 756 877 4496 3589 15000

A comparative study of men and women gamblers in Victoria Hing, Russell, Tolchard & Nower
Victorian Responsible Gambling Foundation
!"#$%*/%'(%)&*
The total sample achieved from the epidemiological study is presented in Table 5.
Data weighting Data in the epidemiological study were weighted to ensure that the sample was as close to the Victorian population as possible. The purpose of weighting, in broad terms, is to correct for distortions in sampling. This typically includes making adjustments for the different probabilities of sampling within and across spend bands and Victorian Government regions (eg. due to the 70%, 20%, 10% EGM band sampling approach across 8 Victorian Government regions) and to adjust for population characteristics (eg. age, gender, region). A full description of the weighting methodology is presented in Methodology used for data weighting on page 274. This includes information on how the selection weights, intra-region sampling weights and the population benchmark weights were calculated. The weighting methodology was agreed to by Project Board members prior to implementation.
Data imputation For data used in weighting, a data imputation methodology was followed. This involved inserting a value for a small number of cases where data was missing. This was needed to ensure that the full data set could be weighted. This included a random value imputation methodology for missing values for age and phone lines in household and a partial logic method for the total adults in the household variable. The approach is detailed in the section - Data imputation methodology for epidemiological data on page 281.
Outliers Apart from correcting clearly obvious ‘mistakes’ during the data editing stage at the conclusion of the study, outliers were not excluded from the analysis (including multivariate outliers). However, ranges of values were formed in cases where outliers had the ability to disproportionately affect means. In ten cases, validating calls with respondents directly were also made to correct data values recorded.
Refusal conversions To further improve the representativeness of sampling, households or respondents who initially refused to complete the survey were coded into either a soft or a hard refusal. Soft refusals implied that there may be some likelihood that a respondent may be interested to take part in the survey at a later time. Typically, this was due to a respondent just being very busy at the time of the call and hence not able to reschedule a call back (eg. leaving the house at the time of the call, looking after a young baby or cooking dinner). Hard refusals, in contrast, were when the respondent was not at all interested to participate, usually evidenced through the reasons given for non-participation (eg. disliking surveys period) or intonation (eg. respondents being upset that they were randomly selected).
In total, 1204 refusal conversions were conducted as part of the project. This involved successfully converting an initial soft refusal to a complete survey. To avoid the encouragement of refusals by interviewers, a separate group of interviewers conducted the refusal conversion interview process.
Table 5. Sample breakdown of epidemiological study (N=15000, July-October 2008)
CPGSI risk segments
Starting sample
Sample taking part in main study
Non-Problem Gamblers 9986 1 in 3
Low Risk Gamblers 837 1 in 1
Moderate Risk Gamblers 317 1 in 1
Problem Gamblers 95 1 in 1
Non-Gamblers 3765 Completed only a small number of questions and then survey demographics
Total 15000 15000

A comparative study of men and women gamblers in Victoria Hing, Russell, Tolchard & Nower
Victorian Responsible Gambling Foundation
!"#$%*0%'(%)&*
This involved setting up a completely separate project which could be sensitively managed and monitored. Interviewers were also given training to understand the need for an appropriate balance in converting respondents to interview (eg. not to be pushy). A range of scripts were also trialled and evaluated for this purpose through the refusal conversion period. Safeguards were also put in place including careful monitoring by supervisors for sensitivities.
The prevalence rate of problem gambling achieved from the refusal conversion sample was marginally lower than the overall prevalence rate of problem gambling in non-refusal participants. Risk for problem gambling for the refusal conversion and non-refusal conversion samples is shown in Figure 4.
Multilingual interviewing As part of the study, 369 multilingual interviews were undertaken in a range of non-English languages. The coverage of languages achieved through the multilingual interviewing is presented in Figure 5.
The approach to multilingual interviews included:
!! having interviewers listen carefully for cases of non-English speaking households
!! pooling of numbers that may be targeting a non-English speaking household
!! where possible, using basic English to identify the type of language that was in the household(interviewers were also trained in methodologies for doing this)
!! identifying the availability of native language interviewers for the target language
!! randomly selecting a pool of non-English speaking households for interview(in line with available multilingual interviewing budgets)
!! conduct of multilingual interviews in the target languages
Figure 4. Refusal conversion sample - Highlighting prevalence of problem gambling(Refusal conversion sample N=1204)a
a. Based on the nine item Canadian Problem Gambling Severity Index risk category (Base: All Victorian adults)
Non Refusal Refusal Conversion0
10
20
30
40
50
60
70
80
90
100
% V
icto
rian
adul
ts 64.38
5.852.41 0.75
26.61
63.51
3.9 1.76 0.22
30.62
Non-Problem Gamblers
Low Risk Gamblers
Moderate Risk Gamblers
Problem Gamblers
Non-Gamblers
NN==11220044 RReeffuussaall ccoonnvveerrssiioonnss xx pprreevvaalleennccee ooff pprroobblleemm ggaammbblliinngg
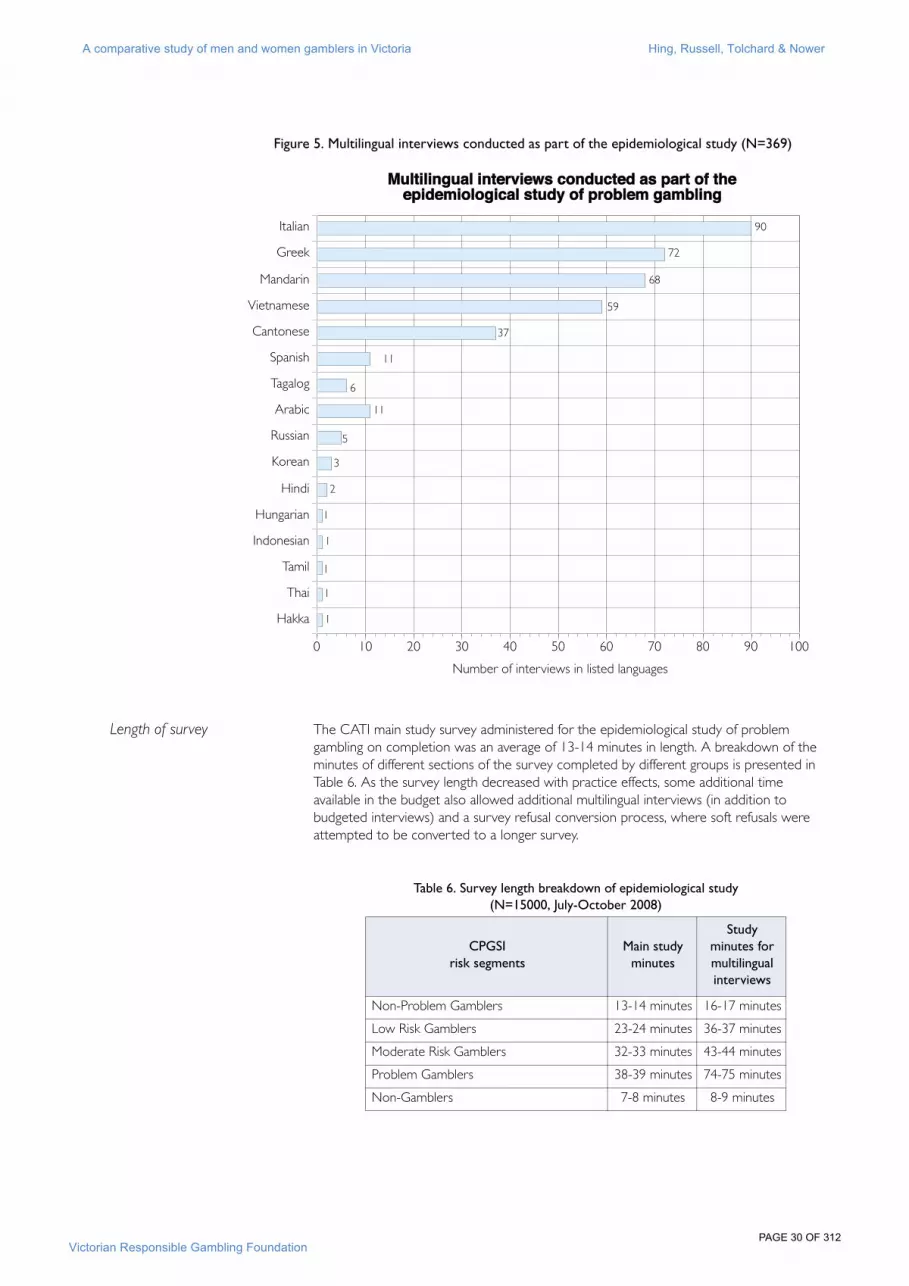
A comparative study of men and women gamblers in Victoria Hing, Russell, Tolchard & Nower
Victorian Responsible Gambling Foundation
!"#$%)1%'(%)&*
Length of survey The CATI main study survey administered for the epidemiological study of problem gambling on completion was an average of 13-14 minutes in length. A breakdown of the minutes of different sections of the survey completed by different groups is presented in Table 6. As the survey length decreased with practice effects, some additional time available in the budget also allowed additional multilingual interviews (in addition to budgeted interviews) and a survey refusal conversion process, where soft refusals were attempted to be converted to a longer survey.
Figure 5. Multilingual interviews conducted as part of the epidemiological study (N=369)
Hakka
Thai
Tamil
Indonesian
Hungarian
Hindi
Korean
Russian
Arabic
Tagalog
Spanish
Cantonese
Vietnamese
Mandarin
Greek
Italian
0 10 20 30 40 50 60 70 80 90 100
Number of interviews in listed languages
1
1
1
1
1
2
3
5
11
6
11
37
59
68
72
90
MMuullttiilliinngguuaall iinntteerrvviieewwss ccoonndduucctteedd aass ppaarrtt ooff tthheeeeppiiddeemmiioollooggiiccaall ssttuuddyy ooff pprroobblleemm ggaammbblliinngg
Table 6. Survey length breakdown of epidemiological study (N=15000, July-October 2008)
CPGSI risk segments
Main studyminutes
Studyminutes formultilingual interviews
Non-Problem Gamblers 13-14 minutes 16-17 minutes
Low Risk Gamblers 23-24 minutes 36-37 minutes
Moderate Risk Gamblers 32-33 minutes 43-44 minutes
Problem Gamblers 38-39 minutes 74-75 minutes
Non-Gamblers 7-8 minutes 8-9 minutes

A comparative study of men and women gamblers in Victoria Hing, Russell, Tolchard & Nower
Victorian Responsible Gambling Foundation
!"#$%)&%'(%)&*
Interviewer training Prior to commencement of interviewing, all interviewers were trained in a number of areas and written briefing information was supplied. Training went for a period of four hours. This included developing knowledge and skills of the interviewers in:
!! understanding problem gambling and sensitivities and vulnerabilities of respondents including how to best manage sensitivities during the project and any critical incidents or emergency events (eg. something unexpected happening to a respondent)
!! how to engage potential interviewees to promote as high consent rates as possible
!! understanding the range of gambling activities available in Victoria, along with the different channels for accessing gambling (and associated more technical gambling activity specific information - eg. different types of bets wagered etc.)
!! understanding the objectives of the project including the need for measurement precision in particular areas of the survey such as administration of the PGSI and other validated instruments - this also included stressing the need to read the survey script carefully and word-for-word (with an emphasis on particular care in the PGSI and NODS-CLiP2)
!! the need to reassure participants that their survey would only be presented in a de-identified format to ensure strict confidentiality of findings
!! the need for interviewers to assist in cases where respondents wanted to access their survey results, as is a requirement of current privacy legislation.
The performance rate of every interviewer was also monitored on a daily basis, particularly in terms of their ability to achieve consent to interviews. In cases where interviewers were having difficulties achieving consent, coaching and training were offered. If some interviewers were finding it consistently difficult to achieve informed consent, they were allocated to different projects.
Piloting Piloting of the study was conducted as part of the project. Prior to implementation of the methodology for the study, the sampling frame design, gambling activities and many other survey questions were also ‘piloted’ in a further separate study for Department of Justice of approximately N=1700. This implied that very few changes needed to be made in the study, given that the first study had given an opportunity to ‘iron-out’ most identified issues. The CATI script was also thoroughly and extensively checked prior to commencement of field work.
Response andconsent rates
Calculation of response and consent rates is both an art and a science. Response rates for a survey are typically derived by working out the total potential of qualifying sample items and calculating a percent of surveys completed. Consent rate, in contrast, is best defined as the percent of respondents who agreed to a survey once contacted.
As there is wide debate about ways of calculating response rate and not an agreed approach (there is always debate about which numbers qualify as being ‘in-scope’), a couple of variants for response rate are presented. One response rate calculation is less conservative, while the other is more conservative. Hence, both options are only showing potential response rate methodologies, as it is clear that methodologies can be interpreted differently.
Based on this analysis, the survey response rate was calculated to range from 43.50% (very conservative) to 52.65% (least conservative). The calculated consent rate based on only respondents refusing and participating was 59.37%. Findings also showed that the drop out rate once a survey had commenced was very low with 95.30% of people continuing to completion once commenced.
RDD studies frequently achieve lower response rates compared to studies based on the Whitepages (ie. residential listings), given that it is more difficult to confirm whether RDD numbers are actually qualifying numbers. For instance, RDD often generates a significantly higher proportion of ‘dead numbers’ that may ring, yet are never answered. Whitepages is only available on disk for 2004 and for this reason was not used in the research (as the database was too out-of-date for the study).

A comparative study of men and women gamblers in Victoria Hing, Russell, Tolchard & Nower
Victorian Responsible Gambling Foundation
!"#$%)*%'(%)&*
It is apparent from other prevalence studies that most tend to use less conservative methods of calculating response rate, so specific methodologies should be considered if any comparisons are drawn (particularly how ‘in-scope’ sample is defined). For this purpose, the least conservative response rate should be considered a rough benchmark, with comparative limitations acknowledged.
Table 7. Survey response rates and consent rates for the epidemiological study of problem gambling (July-October 2008)
Description of call
statisticsa N
% of total RDD
numbers dialled
Qualifying numbers considered ‘in-scope’b and henceused in the calculation below are indicated
Less conservative method for response
rate calculation
More conservative method for response
rate calculation
Survey consent rate
Mid survey refusals 740 0.84 740 740 740
Other miscellaneous refusals
21 0.02 21 21 21
No english-Language identified
489 0.56 489 489 -
No english-Language not identified
1682 1.91 1682 1682 -
Away for 8wk field period (eg. living overseas)
308 0.35 - 308 -
Illness-away for 8wk field period
110 0.12 110 110 -
Unable to take part - other reason (other than refusals)
466 0.53 - 466 -
Refused Household - HARD Male (no questions)
2424 2.75 2424 2424 2424
Refused Household - SOFT Male (no questions)
285 0.32 285 285 285
Refused Household - HARD Female (no questions)
3054 3.47 3054 3054 3054
Refused Household - SOFT Female (no questions)
573 0.65 573 573 573
Refused Respondent - SOFT Male (no questions)
290 0.33 290 290 290
Refused Respondent - SOFT Female (no questions)
385 0.44 385 385 385
Refused Respondent - HARD Male (no questions)
1088 1.24 1088 1088 1088
Refused Respondent - HARD Female (no questions)
1405 1.60 1405 1405 1405
Engaged 141 0.16 - 141 -
No Answer 1675 1.90 - 1675 -
Answering machine-sounds like a residence
675 0.77 675 675 -

A comparative study of men and women gamblers in Victoria Hing, Russell, Tolchard & Nower
Victorian Responsible Gambling Foundation !"#$%))%'(%)&*
Answering machine-can't tell if home or business
25 0.03 25 25 -
Complete 15000 17.04 15000 15000 15000
Arrange Call-back 2800 3.18 - 2800 -
Soft appointments 362 0.42 362
Hard Appointments 239 0.27 - 239 -
Non-qualifier-Away duration
1 0.00 - - -
Cognitively impaired 113 0.13 113 113 -
No-one 18yrs OR over 18yrs in household
291 0.33 - - -
Non-qualifier-Lives outside VIC
61 0.07 - - -
Non-qualifier-Under 18 14 0.02 - - -
Hearing impaired 130 0.15 130 130 -
Answering Machine 1 0.00 1 -
Multiple land lines 99 0.11 - - -
Out of scope number - business
4733 5.38 - - -
Fax Machine 2918 3.32 - - -
Disconnected - Telstra message
34927 39.68 - - -
Disconnected 53 0.06 - - -
Call cycle dead after more than 10 attempts
10444 11.86 - - -
Total sample items (RDD numbers)
88022 100.00 28489 34481 25265
Percentages for response rates and consent rate 52.65% 43.50% 59.37%
a. Note that hard refusals are obvious refusals where the respondent states a firm position to not want to participate in the study (eg. becomes angry or verbally states a definitive ‘no’). Soft refusals, in contrast, may be where the respondent is ‘a bit busy at the moment’ (or similar) and there is some indication that they may participate if circumstances had been different at the time (eg. Comments such as - It’s sounds interesting, but I’m just a bit busy too busy at the moment).
b. In-scope refers to the numbers that can be counted as qualifying for the epidemiological study.
Table 7. Survey response rates and consent rates for the epidemiological study of problem gambling (July-October 2008)
Description of call
statisticsa N
% of total RDD
numbers dialled
Qualifying numbers considered ‘in-scope’b and henceused in the calculation below are indicated
Less conservative method for response
rate calculation
More conservative method for response
rate calculation
Survey consent rate

A comparative study of men and women gamblers in Victoria Hing, Russell, Tolchard & Nower
Victorian Responsible Gambling Foundation
Appendix B: Excerpt explaining methodology used for data weighting from At Study of Gambling in Victoria (Hare, 2009)
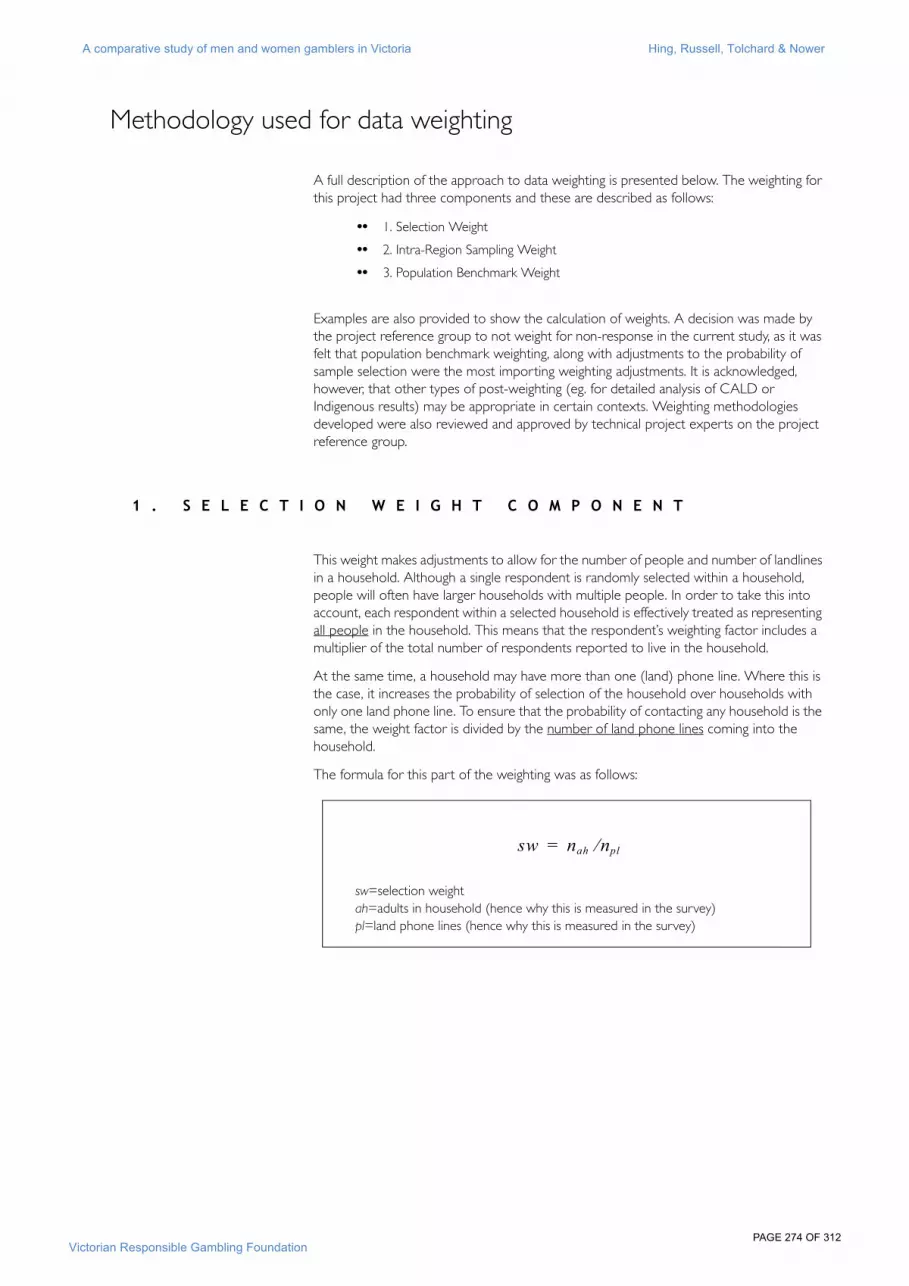
A comparative study of men and women gamblers in Victoria Hing, Russell, Tolchard & Nower
Victorian Responsible Gambling Foundation
!"#$%&.,%)*%+(&
Methodology used for data weighting
A full description of the approach to data weighting is presented below. The weighting for this project had three components and these are described as follows:
!! 1. Selection Weight
!! 2. Intra-Region Sampling Weight
!! 3. Population Benchmark Weight
Examples are also provided to show the calculation of weights. A decision was made by the project reference group to not weight for non-response in the current study, as it was felt that population benchmark weighting, along with adjustments to the probability of sample selection were the most importing weighting adjustments. It is acknowledged, however, that other types of post-weighting (eg. for detailed analysis of CALD or Indigenous results) may be appropriate in certain contexts. Weighting methodologies developed were also reviewed and approved by technical project experts on the project reference group.
! " # $ % & % ' ( ) * + # , % ) - . ( # ' * / 0 * + % + (
This weight makes adjustments to allow for the number of people and number of landlines in a household. Although a single respondent is randomly selected within a household, people will often have larger households with multiple people. In order to take this into account, each respondent within a selected household is effectively treated as representing all people in the household. This means that the respondent’s weighting factor includes a multiplier of the total number of respondents reported to live in the household.
At the same time, a household may have more than one (land) phone line. Where this is the case, it increases the probability of selection of the household over households with only one land phone line. To ensure that the probability of contacting any household is the same, the weight factor is divided by the number of land phone lines coming into the household.
The formula for this part of the weighting was as follows:
!" #$% #&'!!
sw=selection weightah=adults in household (hence why this is measured in the survey)pl=land phone lines (hence why this is measured in the survey)

A comparative study of men and women gamblers in Victoria Hing, Russell, Tolchard & Nower
Victorian Responsible Gambling Foundation
!"#$%&.'%)*%+(&
1 " # ) + ( 2 3 4 2 % - ) * + # $ 3 / 0 & ) + - #
, % ) - . ( # ' * / 0 * + % + (
The next weight is important as it makes adjustments to allow for the disproportional sampling methodology used for generating the initial sample. In generating the phone numbers for each region x level stratum, we have disproportionately sampled within each Region based on the EGM expenditure bands.
For instance, within each Victorian Government region:
!! 70% of the sample was taken from LGAs with high EGM spend bands
!! 20% of the sample was taken from LGAs with medium EGM spend bands
!! 10% of the sample was taken from LGAs with low EGM spend bands
For this reason, the distribution needed to be ‘realigned’ to match the true population within each Region. Two potential methods for achieving this were evaluated prior to weighting implementation.
They were
!! OPTION 2A - The first option was to adjust the responding sample items after allocation to Region x Level strata based on survey responses (eg. we asked people their LGA in the survey and also suburb in the case where an LGA wasn’t known). This would ensure that the final sample would be reflective of the split at the strata level and would not be affected by respondents being allocated into different strata in which they were originally selected (which occurred for a proportion of respondents) - eg. Respondent John was originally in LGA X, but really should be in the nearby LGA Y, as he’s verbally confirmed this in the survey - So he has been switched from one LGA to another, despite ORIGINALLY being sampled in LGA X
!! OPTION 2B - The second option was to make the adjustment based on the stratum in which a record was selected in (ie. bearing in mind that some LGA allocations to strata were incorrect). This would allow for differing probabilities of selection for numbers which end up in the same strata, but were sampled in different strata with differing probabilities of selection - eg. Respondent Mary really lives in LGA XX, but she really should be located in LGA YY. But for the purpose of correcting for sampling, we would just leave her in LGA XX, as we assume this difference is small and negligible.
Both methods have their advantages, but in consultation with the project board, the first option (OPTION 2A) was selected. This was seen as advantageous given that it ensured that the sample distribution was perfectly aligned to the correct LGA. In cases where respondents could not be allocated to an LGA based on their responses to the survey, they were located within the original sample location LGA (based on phone pre-fix concordance data).

A comparative study of men and women gamblers in Victoria Hing, Russell, Tolchard & Nower
Victorian Responsible Gambling Foundation
!"#$%&.-%)*%+(&
On this basis, the formula for OPTION 2A was as follows:
5 " # 0 * 0 6 & 3 ( ) * + # 7 % + ' . / 3 2 8 # , % ) - . (
In addition to the selection weight and intra-region weight components, a population benchmark component was applied to ensure that the adjusted sample distribution matches the population distribution for the combined cross-cells of sex by age by Victorian Government region (eg. males aged 18-24 years in Barwon S/W).
The reference population for the population benchmark weighting was VICTORIAN ADULTS aged 18yrs or over. In lieu of using Census 2006 data, Estimated Resident Population projections were kindly supplied by DHS to assist in development of more up-to-date population benchmarks.
The approach to population benchmark weights include consideration of three variables:
!! Age - with 6 categories (18-24yrs, 25-34yrs, 35-44yrs, 45-54yrs, 55-64yrs, 65 years or over)
!! Gender - male and female
!! Victorian Government Regions - Barwon South West, Eastern Metro, Gippsland, Grampians, Hume, Loddon-Mallee, North-West Metro, Southern Metro
The population benchmark component was calculated by dividing the population of each cross-cell by the sum of the selection weight components x the intra-region weight components for all respondents in the sample within that cross-cell.
(
('
(
('
#
#
)
)*" ""
Nrl=Population 18yrs or over in Region x Level Strata Nr=Population 18yrs or over in Region nrl=Number of completed interviews 18yrs or over in Region x Level Strata nr=Number of completed interviews 18yrs or over in Region
This involves asking respondents to verbally confirm where they live and hence theirLGA and ensures that they where possible are allocated to the correct LGA stratum.

A comparative study of men and women gamblers in Victoria Hing, Russell, Tolchard & Nower
Victorian Responsible Gambling Foundation
!"#$%&..%)*%+(&
For each cross-cell (i), the formula for this component was:
' 3 & ' 6 & 3 ( ) + - # ( . % # 0 % 2 $ * + # , % ) - . ( #
9 * 2 # 3 0 0 & ) ' 3 ( ) * + # ( * # ( . % # : 3 ( 3 # $ % (
Finally, respondents were assigned a person weight factor (pwt) by multiplying the selection weight (sw) by the intra-region sampling weight (iw) by the population benchmark weight (pbmark).
The formula for this was as follows:
# $
"*
+
*+*+
**
*"!"
)&,-$(.
#$
j = the jth person in the cross-cell
Ni = the population of the ith cross-cell
= means the sum for each person (j) in cross-cell (i) of the product of:
iwij = intra-region sampling weight for each respondent (1 thru j) in the ith cross-cell
#*
+
swij = the selection weights for each respondent (1 thru j) in the ith cross-cell and
i = the ith cross-cell
!"#$%&'&("$%&2&$"%&2&!)*+,-$
Where:
j = the jth person in the cross-celli = the ith cross-cell

A comparative study of men and women gamblers in Victoria Hing, Russell, Tolchard & Nower
Victorian Responsible Gambling Foundation
!"#$%&./%)*%+(&
% ; 3 / 0 & % # * 9 # , % ) - . ( # ' 3 & ' 6 & 3 ( ) * + $
The following illustrate examples of how weights are calculated.
Table 126. Examples of weight calculations
Case
Number Adults (nah)
Number of phone lines (npl)
SW (nah / npl)
Region levelIW (see
below)
SW x IW
gender agepbmark
(see below)
pwt (SW x IW x
Pbmark)
1 2 1 2 Barwon S/W L 1.5001 3.0001 Male 18-24 12.5 37.50171
2 2 1 2 Barwon S/W L 1.5001 3.0001 Male 18-24 12.5 37.50171
3 3 1 3 Barwon S/W L 1.5001 4.5002 Male 18-24 12.5 56.25257
4 2 1 2 Barwon S/W H 0.9811 1.9623 Male 18-24 12.5 24.52823
5 1 2 0.5 Barwon S/W H 0.9811 0.4906 Male 65+ 2.909 1.427053
6 2 1 2 Barwon S/W M 0.8064 1.6128 Male 65+ 2.909 4.691571
7 1 1 1 Barwon S/W M 0.8064 0.8064 Female 25-34 1.404 1.13217
8 1 2 0.5 Barwon S/W H 0.9811 0.4906 Female 25-34 1.404 0.688753
9 3 1 3 Barwon S/W M 0.8064 2.4192 Female 25-34 1.404 3.396511
10 4 2 2 Barwon S/W H 0.9811 1.9623 Female 25-34 1.404 2.755011

A comparative study of men and women gamblers in Victoria Hing, Russell, Tolchard & Nower
Victorian Responsible Gambling Foundation
!"#$%&.0%)*%+(&
eg. For all cases in the Barwon S/W – L strata,
iw =(42,741 / 276,160) / (13 / 126)
=15% / 10%
=1.5001
eg. For all cases in the Barwon S/W – male – 18-24 cell...
pbmark =250/20
=12.500
Table 127. Calculation of Intra-Region weight iw – OPTION2A (at an aggregated level)
Region LevelABS Population
figuresPopulation
DistributionCompleted Interviews
Interview Distribution
IW (pop dist divided by
int dist)
Barwon S/W L 42,741 15% 13 10% 1.5001
Barwon S/W M 44,185 16% 25 20% 0.8064
Barwon S/W H 189,234 69% 88 70% 0.9811
Barwon S/W TOTAL 276,160 100% 126 100%
Eastern Metro L 233,718 30% 35 10% 3.0175
Eastern Metro M 210,308 27% 70 20% 1.3576
Eastern Metro H 330,508 43% 245 70% 0.6096
Eastern Metro TOTAL 774,534 100% 350 100%
Table 128. Calculation of pbmark weight (at an aggregated level)
Weighted table = weighted by (sw x iw)
Total wt’d interviews
Population ('000s) - ABS
pbmark weight factor (pop/wtd ints)
Barwon S/W - Male - 18-24 20 250 12.500
Barwon S/W - Female - 18-24 15 190 12.667
Barwon S/W - Male - 25-34 35 540 15.429
Barwon S/W - Female - 25-34 47 66 1.404
Barwon S/W - Male - 65+ 11 32 2.909
Barwon S/W - Female - 65+ 18 34 1.889
TOTAL 700 3298

A comparative study of men and women gamblers in Victoria Hing, Russell, Tolchard & Nower
Victorian Responsible Gambling Foundation
!"#$%&/1%)*%+(&
For Case 1:
Strata = Barwon S/W – L
Cell = Barwon S/W – Male – 18-24
Therefore:
sw= 2 / 1 = 2
iw=1.5001 from Table 2 based on Strata membership
pbmark= 12.500 from Table 3 based on Cell membership
pwt=sw x iw x pbmark
=2 x 1.5 x 12.5
=37.5017
Table 129. Calculation of person weight (pwt) for Case 1
CaseNumber Adults (nah)
Number phone
lines (npl)
SW (nah / npl)
Region level IW SW x IW
gender age Pbmark Pwt
1 2 1 2 Barwon S/W L 1.5001 3.0001 Male 18-24 12.5 37.50171

A comparative study of men and women gamblers in Victoria Hing, Russell, Tolchard & Nower
Victorian Responsible Gambling Foundation
!"#$%&/(%)*%+(&
Data imputation methodology for epidemiological data
Context An approach to data imputation was necessary to ensure that all values were not missing for variables used in the weighting of data associated with the study. Variables used in weighting calculations with some missing data at the end of the study included:
!! (1) Number of adults in the household
!! (2) Number of phone lines in household
!! (3) Age of respondents
The general approach to data imputation was to insert a random value in cases where data was missing. However, a partial logical deduction method was used in the case of missing data relating to the total number of adults in the household. Approaches are described below.
) / 0 6 ( 3 ( ) * + # / % ( . * : * & * - ) % $
Adults in householdvariable
In relation to the adults in household variable:
!! there were 22 cases with missing data (0.15% of sample)
!! the mean number of adults was 2.085
!! the modal (most common) value is 2.0
Given the availability of a further variable on ‘household composition’, where other data could be used to estimate adults in the household, this additional variable was used to inform the data imputation method. Otherwise, in cases, where this was unclear, a random value was substituted.
The household composition variable (Demo 2) consisted of the following values:
1. Couple with child or children2. One parent family3. Other family4. Couple without children5. Group household (not related)6. Lone person7. Other Household (record) ____98. DK99. Refused
Accordingly, the approach was implemented as follows:
!! if Demo 2=1, imputed value=2
!! if Demo 2=2, imputed value=1
!! if Demo 2=3, imputed value=INSERT RANDOM OBSERVATION
!! if Demo 2=4, imputed value=2
!! if Demo 2=5, imputed value= INSERT RANDOM OBSERVATION BUT MUST BE > 1 (as group household)
!! if Demo 2=6, imputed value = 1
!! if Demo 2=7, imputed value is based on 'other' comment if feasible
!! Otherwise - if unknown - impute as RANDOM OBSERVATION

A comparative study of men and women gamblers in Victoria Hing, Russell, Tolchard & Nower
Victorian Responsible Gambling Foundation !"#$%&/&%)*%+(&
Phone linevariable
Number of phone lines shows that:
!! 75 cases are missing phone lines
!! Modal value is 1
!! The mean number of lines is 1.2
!! 85% of households have 1 line, 13% have 2, 2% have >2
Imputation methodology - Values were imputed with a random observation
Respondent agevariable
For the missing age respondents, data shows that:
!! 25 cases are missing age (6 males and 9 females)
!! Where a respondent has refused to give their exact age, an age has been sought in broader age bands. These 25 cases refused to provide both their age in years and their age in a band
Imputation methodology - Values were imputed with a random observation
LGA It should be noted that in cases where there was a missing local government area variable (and the LGA could not be inferred from the suburb), the original sample location based on the telephone number pre-fix postcode concordance was used to determine LGA. This approach is also described in the section on data weighting.

A comparative study of men and women gamblers in Victoria Hing, Russell, Tolchard & Nower
Victorian Responsible Gambling Foundation
Appendix C: Survey instrument from A Study of Gambling in Victoria (Hare, 2009)

A comparative study of men and women gamblers in Victoria Hing, Russell, Tolchard & Nower
Victorian Responsible Gambling Foundation
!"#$%&/+%)*%+(&
Survey instrument used in epidemiological study
Good morning/afternoon/evening. This is XX from XX calling on behalf of the State Government of Victoria. The Victorian Government is conducting a study on an important health and well-being issue to Victorian communities. To ensure we speak to a random cross-section of Victorians, I’d like to speak to the person in your household who has had the most recent birthday and is 18 years or older.
(If away for study duration, ask for next birthday person. OTHERWISE, if just out, schedule callback for first birthday person).
(Repeat) Would you kindly take part in this Victorian Government study? It will take between 5 and 25 minutes, depending on your responses and is strictly confidential.
REFUSAL SCRIPTS
Refusal - Please feel assured - this is genuine social research. We are looking to study a very important health and well-being issue in the community.
If people ask what about - The study is to better understand community patterns of responsible gambling.
If says “I’m not a gambler” or “I’m not a problem gambler” - As a general community member, you are a very important part of this study.
If says “Sounds negative about gambling” - We are just as keen to talk to people who dislike gambling or have had negative experiences. Your views will help inform future Government policy and help to improve the health and well-being of Victorians. Because this is an extremely important social study, could you please help me out?
Then if still refusal - Would there be a more convenient time to call? (pause) Or another number for better privacy? (record callback)
(CODE - SOFT REFUSALS V HARD REFUSALS - REFER CALL STATISTICS FRAMEWORK - SOFT REFUSALS WERE THEN USED FOR REFUSAL CONVERSIONS)
IF AGREE > START MAIN SURVEY (ALL WHO AGREE TO TAKE PART) Thanks. For Victorian Govt statistical purposes (Link to “may” on next line so 1 sentence)
Pre-survey Screen - May I first confirm whether you are currently located in Victoria or another state?1. Victoria (start survey at question below)2. Other state (eg. border areas) - TERMINATE - “Sorry this study is only for people in Victoria. Thanks anyway for your time”.
May I confirm...?
1. Your age: _______ (98-DK, 99-Refused) (If under 18 > “So sorry, but you don’t qualify for the study” + Exit)(999 if won’t give age - then prompt age bands and code the band)
2. Do you speak a language other than English at home? Yes/No (98-DK, 99-Refused) (If yes - 2a. which main language? _________)
3. Are you of Aboriginal, Torres Strait islander or Australian South Sea Islander background? Yes/No (98-DK, 99-Refused)
4. What is the total number of land telephone lines in your household (not faxes/mobiles or internet phones which don’t have a land line number): __________ (98-DK, 99-Refused)
5. The total number of people 18yrs or over who usually live in this household: __________ (98-DK, 99-Refused)
6. Your Local Government Authority: ___________ (98-DK, 99-Refused)

A comparative study of men and women gamblers in Victoria Hing, Russell, Tolchard & Nower
Victorian Responsible Gambling Foundation
!"#$%&/,%)*%+(&
6b. Gender - 1. Male, 2 Female
7. As we plan to classify study results by census collection districts, may I confirm your: (98-DK, 99-Ref)
Suburb: ____ Postcode: ______
8. On which of the following activities have you spent any money in the past 12 months...
Prompted activities
(A) Have you spent any money on this in
thepast 12mths?
(B) If USED - Ask access channel
If USED - (C) How often on average did you take part in [insert activity]
in the past 12mths?
If USED - (D) Base
3)4$%5%67%89:8;9%<=><%4=??<%:@%4=A=@9?%B9CD9E%8;9=<9%8@:F8?%GH?I%5%JK:D;L%?IH<%A9%M:C<HL9@9L%=%M;DA%:@%=%8DANO
P@9M:@L%:@%@9M:L9%=MM:@LHCQ;>%5%H9R%S9M:L9%HC?:%K;DAE%!DA%:@%H7%DCTC:GC%5%@9M:@L%=<%GI=?%G=<%<=HL%5%9QR%4=??<U
1. Informal private betting for money - like playing cards at home
1. Yes2. No
What did you bet for money privately on? (prompt - MULTIPLE RESPONSE)
1. Mahjong 2. Card games (eg. poker, blackjack)3. Sport results4. Computer games online5. Computer games at home (offline)6. Board games7. Events97. Other activities (record up to 3)
98. DK99. Refused
_________ times
1. Per week2. Per month3. Per year
2. Now excluding private betting...
Playing the pokies or electronic gaming machines
1. Yes2. No
Did you play the pokies at:(prompt - MULTIPLE RESPONSE)1. Victorian Clubs2. Victorian Pubs 3. Crown casino4. On a mobile phone5. Over the internet
95. In other Australian states96. On a trip overseas97. Elsewhere (record)
98. DK99. Refused
_________ times
1. Per week2. Per month3. Per year
3. Betting on table games like blackjack, roulette and poker
1. Yes2. No
Did you play table games at:(prompt - MULTIPLE RESPONSE)1. Crown casino2. On a mobile phone3. Over the internet
95. In other Australian states96. On a trip overseas97. Elsewhere (record)
98. DK99. Refused
_________ times
1. Per week2. Per month3. Per year

A comparative study of men and women gamblers in Victoria Hing, Russell, Tolchard & Nower
Victorian Responsible Gambling Foundation
!"#$%&/'%)*%+(&
4. Betting on horse or harness racing or greyhounds - excluding sweeps
1. Yes2. No
Did you place your bets at:(prompt - MULTIPLE RESPONSE)1. Victorian Clubs 2. Victorian Pubs 3. Crown Casino4. Over the phone5. Over the internet6. Off-track with a bookmaker in Victoria7. Off-track at a Victorian TAB8. At a Victorian race track9. On a mobile phone
95. In other Australian states96. On a trip overseas97. Elsewhere (record)
98. DK99. Refused
_________ times
1. Per week2. Per month3. Per year
5. Betting on sports and event results - like on football or other events like TV showresults
1. Yes2. No
Did you place your bets at: (prompt - MULTIPLE RESPONSE)1. Victorian Clubs 2. Victorian Pubs3. Crown Casino 4. Over the phone5. Over the internet6. Off-track with a bookmaker in Victoria7. Off-track at a Victorian TAB8. At a Victorian race track9. On a mobile phone
95. In other Australian states96. On a trip overseas97. Elsewhere (record)
98. DK99. Refused
_________ times
1. Per week2. Per month3. Per year
6. Keno
1. Yes2. No
Where did you play keno? (prompt):(prompt - MULTIPLE RESPONSE)1. Victorian Clubs 2. Victorian Pubs3. Crown Casino 4. Over the phone5. Over the internet
95. In other Australian states96. On a trip overseas97. Elsewhere (record)
98. DK99. Refused
_________ times
1. Per week2. Per month3. Per year
Prompted activities
(A) Have you spent any money on this in
thepast 12mths?
(B) If USED - Ask access channel
If USED - (C) How often on average did you take part in [insert activity]
in the past 12mths?
If USED - (D) Base
3)4$%5%67%89:8;9%<=><%4=??<%:@%4=A=@9?%B9CD9E%8;9=<9%8@:F8?%GH?I%5%JK:D;L%?IH<%A9%M:C<HL9@9L%=%M;DA%:@%=%8DANO
P@9M:@L%:@%@9M:L9%=MM:@LHCQ;>%5%H9R%S9M:L9%HC?:%K;DAE%!DA%:@%H7%DCTC:GC%5%@9M:@L%=<%GI=?%G=<%<=HL%5%9QR%4=??<U

A comparative study of men and women gamblers in Victoria Hing, Russell, Tolchard & Nower
Victorian Responsible Gambling Foundation
!"#$%&/-%)*%+(&
7. Lotto,Powerball, or the Pools
1. Yes2. No
Where did you buy your lotto tickets? (prompt - MULTIPLE RESPONSE)1. Tatts Venue/kiosk2. Newsagent in Victoria3. Over the phone4. Over the internet
95. In other Australian states96. On a trip overseas97. Elsewhere (record)
98. DK99. Refused
How often did you take part in Lotto,Powerball, or the Pools
_________ times
1. Per week2. Per month3. Per year
8. Scratchtickets
1. Yes2. No
Where did you buy your scratch tickets? (prompt - MULTIPLE RESPONSE)1. Tatts Venue/kiosk2. Newsagent in Victoria3. Over the phone4. Over the internet
95. In other Australian states96. On a trip overseas97. Elsewhere (record)
98. DK99. Refused
_________ times
1. Per week2. Per month3. Per year
9. Bingo
1. Yes2. No
Where did you play bingo? (prompt - MULTIPLE RESPONSE)1. At a Victorian club2. At a Victorian pub3. With a church in Victoria4. At a Victorian bingo hall5. At a general Victorian community hall6. Over the internet
95. In other Australian states96. On a trip overseas97. Elsewhere (record)______98. DK99. Refused
_________ times
1. Per week2. Per month3. Per year
10. Competitions where you pay money to enter by phone or leave an SMS to be in a prize draw
1. Yes2. No
Did you take part in both...?(prompt - MULTIPLE RESPONSE)1. Phone-in competitions2. Competitions where you entered via SMS3. Both
_________ times
1. Per week2. Per month3. Per year
NOTE: Voting who will win a TV show by sending an SMS is a competition (10). Placing a bet on who would win a TV show for fixed odds would be a bet (5)
Prompted activities
(A) Have you spent any money on this in
thepast 12mths?
(B) If USED - Ask access channel
If USED - (C) How often on average did you take part in [insert activity]
in the past 12mths?
If USED - (D) Base
3)4$%5%67%89:8;9%<=><%4=??<%:@%4=A=@9?%B9CD9E%8;9=<9%8@:F8?%GH?I%5%JK:D;L%?IH<%A9%M:C<HL9@9L%=%M;DA%:@%=%8DANO
P@9M:@L%:@%@9M:L9%=MM:@LHCQ;>%5%H9R%S9M:L9%HC?:%K;DAE%!DA%:@%H7%DCTC:GC%5%@9M:@L%=<%GI=?%G=<%<=HL%5%9QR%4=??<U

A comparative study of men and women gamblers in Victoria Hing, Russell, Tolchard & Nower
Victorian Responsible Gambling Foundation
!"#$%&/.%)*%+(&
11. Buying tickets in raffles, sweeps + other competitions
1. Yes2. No
Were the tickets sold at? (prompt - MULTIPLE RESPONSE)
1. Clubs (eg. sports/football club)2. Pubs3. Over the internet4. Over the phone5. Thru door-to-door sales6. At a shopping centre7. At a school8. At a workplace/office9. Through the mail10. At a function 11. At Church12. From a friend13. On the street14. Elsewhere (specify) ______
_________ times
1. Per week2. Per month3. Per year
12. Have you gambled for money on anything else in the past 12mths? (Note - exclude private betting)
(12i) PRE-CODES1. Two-up2. Other (record)___________3. Nothing
(ALSO leave field for interviewer call notes - so can recode if problems)
Where did you do this? (record)
____________________ times
1. Per week2. Per month3. Per year
(12ii) Have you made any short-term speculative investments like day trading in stocks and shares in the past 12mths?1. Yes2. No
(12iii) If Answers Yes in (12ii) Were the speculative investments mostly (prompt):1. Online2. Thru a broker3. Both 4. Other (record) _________98. DK99. Refused
Prompted activities
(A) Have you spent any money on this in
thepast 12mths?
(B) If USED - Ask access channel
If USED - (C) How often on average did you take part in [insert activity]
in the past 12mths?
If USED - (D) Base
3)4$%5%67%89:8;9%<=><%4=??<%:@%4=A=@9?%B9CD9E%8;9=<9%8@:F8?%GH?I%5%JK:D;L%?IH<%A9%M:C<HL9@9L%=%M;DA%:@%=%8DANO
P@9M:@L%:@%@9M:L9%=MM:@LHCQ;>%5%H9R%S9M:L9%HC?:%K;DAE%!DA%:@%H7%DCTC:GC%5%@9M:@L%=<%GI=?%G=<%<=HL%5%9QR%4=??<U

A comparative study of men and women gamblers in Victoria Hing, Russell, Tolchard & Nower
Victorian Responsible Gambling Foundation
!"#$%&//%)*%+(&
13. No gambling in the past 12mths
No gambling assumed if answers “no” to any of the previous bank of activities.
Hence, if yes, to any of previous activities, then person is considered a gambler for the purpose of the study.
Hence, people doing speculative stock investments are also considered gamblers.
1. Yes2. No IF NO GAMBLING AT ALL ON ANY ACTIVITIES IN PAST 12mths,
ASK FOLLOWING:
13a. Have you ever gambled for money? 1. Yes 2. No (If no gambling ever - “Thanks for that” - >> GO TO FINAL demographics starting at DEMO_1 at end of survey)
13b. (If Q13a=Yes) Which gambling activities did you most prefer to play? (unprompted, multiple responses)1. Informal private betting for money - like playing cards at home2. Playing the pokies or electronic gaming machines3. Betting on table games like blackjack, roulette and poker4. Betting on horse or harness racing or greyhounds - excluding sweeps5. Betting on sports and event results - like on football or other events like TV show results6. Keno7. Lotto, Powerball and Pools8. Scratch tickets9. Bingo10. Competitions where you enter by phone or leave an SMS to be in a prize draw11. Buying tickets in raffles, sweeps and other competitions12-14. Other (Allow up to 3 responses)15. Short term speculative investments like day trading in stocks and shares14. None
13c. Why have you not gambled in the past 12mths may I ask? (unprompted, multiple responses)1. No reason in particular2. Waste of money3. Waste of time4. Boring/no interest5. Cannot afford it/No money6. Cannot smoke7. Past difficulties/issues with gambling8. Spouse/partner/other person won’t allow it9. Friends don’t gamble10. Seen gambling harm people/gambling is harmful11. Other (record)
THEN - “Thanks for that” - >> GO TO NODS-CLiP
IF PERSON DOESN’T KNOW - TERMINATE AND COUNT AS REFUSAL. THIS DOESN’T GO TOWARDS THE N=15000 CODE AS REFUSAL TO ANSWER GAMBLING ACTIVITIES (eg. Add note in call stats). CLASSIFY AS HARD REFUSAL.
“The Victorian Govt is looking to better understand views on gambling in communities, so could you please help us out?”IF PERSON REFUSES - TERMINATE AND COUNT AS REFUSAL. THIS DOESN’T GO TOWARDS THE N=15000 CODE AS REFUSAL TO ANSWER GAM-BLING ACTIVITIES (eg. Add note in call stats)
Prompted activities
(A) Have you spent any money on this in
thepast 12mths?
(B) If USED - Ask access channel
If USED - (C) How often on average did you take part in [insert activity]
in the past 12mths?
If USED - (D) Base
3)4$%5%67%89:8;9%<=><%4=??<%:@%4=A=@9?%B9CD9E%8;9=<9%8@:F8?%GH?I%5%JK:D;L%?IH<%A9%M:C<HL9@9L%=%M;DA%:@%=%8DANO
P@9M:@L%:@%@9M:L9%=MM:@LHCQ;>%5%H9R%S9M:L9%HC?:%K;DAE%!DA%:@%H7%DCTC:GC%5%@9M:@L%=<%GI=?%G=<%<=HL%5%9QR%4=??<U

A comparative study of men and women gamblers in Victoria Hing, Russell, Tolchard & Nower
Victorian Responsible Gambling Foundation
!"#$%&/0%)*%+(&
Canadian Problem Gambling Severity Index (9 item measure with Queensland scale anchors)
[DUE TO INTERVIEWER HABIT OF USING 1-4, RATHER THAN 0-3 ETC. (A HUMAN FACTOR ISSUE), THIS SHOULD BE PROGRAMMED AS 1-4 FOR INTERVIEWERS, THEN IT WILL BE RECODED IN CATI SCRIPT “LIVE” AS INDICATED BELOW (ie. back to 0-3) - SCORES BELOW MUST BE USED TO FORM THE REAL CPGSI SCORES AND SEGMENTS - THIS IS TO AVOID HUMAN ERROR ON THE PART OF INTERVIEWERS]
OK thanks for that... The next questions refer to all your gambling in the past 12mths.
CPGI_1 - Thinking about the past 12 months, how often have you bet more than you could really afford to lose? Would you say (PROMPT): 0. Never1. Rarely1. Sometimes2. Often3. Always
CPGI_2 - Thinking about the past 12 months, how often have you needed to gamble with larger amounts of money to get the same feeling of excitement? (PROMPT): WOULD YOU SAY0. Never1. Rarely1. Sometimes2. Often3. Always
CPGI_3 - Thinking about the past 12 months, WHEN YOU GAMBLED, how often have you gone back another day to try to win back the money you lost? (PROMPT): WOULD YOU SAY0. Never1. Rarely1. Sometimes2. Often3. Always
CPGI_4 - Thinking about the past 12 months, how often have you borrowed money or sold anything to get money to gamble? (PROMPT) WOULD YOU SAY0. Never1. Rarely1. Sometimes2. Often3. Always
CPGI_5 - Thinking about the past 12 months, how often have you felt that you might have a problem with gambling? (PROMPT) WOULD YOU SAY0. Never1. Rarely1. Sometimes2. Often3. Always
CPGI_6 - Thinking about the past 12 months, how often have people criticized your betting or told you that you had a gambling problem, regardless of whether or not you thought it was true? (PROMPT) WOULD YOU SAY0. Never1. Rarely1. Sometimes2. Often3. Always
CPGI_7 - Thinking about the past 12 months, how often have you felt guilty about the way you gamble, or what happens when you gamble? (PROMPT) WOULD YOU SAY0. Never1. Rarely1. Sometimes2. Often3. Always

A comparative study of men and women gamblers in Victoria Hing, Russell, Tolchard & Nower
Victorian Responsible Gambling Foundation
!"#$%&01%)*%+(&
CPGI_8 - Thinking about the past 12 months, how often has your gambling caused you any health problems, including stress or anxiety? (PROMPT) WOULD YOU SAY0. Never1. Rarely1. Sometimes2. Often3. Always
CPGI_9 - Thinking about the past 12 months, how often has your gambling caused any financial problems for you or your household? (PROMPT) WOULD YOU SAY0. Never1. Rarely1. Sometimes2. Often3. Always
Thank you for that.
PREDICTED LIFETIME PROBLEM GAMBLING RISK STATUS - ALL GAMBLERS
(If Q8_13A =2 - ie. never gambled then skip the NODS CLiP question) - NODS CLiP TO BE ASKED OF ALL GAMBLERS (even if already classified as PG by the CPGI)
Thanks for that. Now thinking about gambling across the whole of your life, may I ask...
9 CPGSI items summed in CATI script using codes displayed:
! 0. Never! 1. Rarely! 1. Sometimes! 2. Often! 3. Always
4 groups to be formed based on sum of 9 CPGSI items:
! Non-problem gamblers - total score=0
! Low risk gamblers - total score=1-2
! Moderate risk gamblers - total score=3-7
! Problem gamblers - total score=8-27
N1. Have you ever tried to stop, cut down, or control your gambling? (N1_lifetimePG) YES -1 NO
N2. Have there ever been periods lasting 2 weeks or longer when you spent a lot of time thinking about your gambling experiences, or planning out future gambling ventures or bets?(N2_lifetimePG)
YES NO - 2
N3. Have you ever lied to family members, friends, or others about how much you gamble
or how much money you lost on gambling? (N3_lifetimePG)YES - 3 NO
N4. Has there ever been a period when, if you lost money gambling one day, you would
often return another day to get even? (N4_lifetimePG)YES NO
N5. Have you ever gambled as a way to escape from personal problems? (N5_lifetimePG) YES NO - 5
IF NO TO ALL ABOVE, END OF QUESTIONS. IF YES TO ANY ABOVE, CONTINUE.

A comparative study of men and women gamblers in Victoria Hing, Russell, Tolchard & Nower
Victorian Responsible Gambling Foundation
!"#$%&0(%)*%+(&
SCORING OF NODS CLiP AS FOLLOWS:
If none of the first five items of the NODS CLiP are endorsed, then the respondent is assumed to be negative on entire battery.
If one or more of the first five items are endorsed, then the additional questions are intended to obtain theresponses needed to establish all of the ten DSM-IV criteria.
Thus:
!! If Item 1 is endorsed, then Item 6 should be asked to establish Withdrawal.
!! If Item 6 is then endorsed, then Items 7 and 8 are needed to determine Loss of Control.
!! If Item 2 is NOT endorsed, then Item 9 should be asked to determine Preoccupation.
!! If Item 3 is endorsed, then Item 10 is needed to establish Lying.
!! If Item 5 is NOT endorsed, then Item 11 (Escape) should be asked to determine Escape.
N6. IF YES to 1: On one or more of the times when you tried to stop, cut down, or
control your gambling, were you restless or irritable? (N6_lifetimePG)YES NO
N7. Have you ever tried but not succeeded in stopping, cutting down, or
controlling your gambling? (N7_lifetimePG)YES - 7 NO
N8. IF YES TO 7: Has this happened three or more times? (N8_lifetimePG) YES NO
N9. IF NO to 2: Have there ever been periods lasting 2 weeks or longer when you spent
a lot of time thinking about ways of getting money to gamble with? (N9_lifetimePG)YES NO
N10. IF YES to 3: Have you lied about gambling three or more times? (N10_lifetimePG) YES NO
N11. If NO TO 5 Have you ever gambled to relieve uncomfortable feelings such as guilt,
anxiety, helplessness, or depression? (N11_lifetimePG)YES NO
N12. Have there ever been periods when you needed to gamble with increasing amounts of money or with larger bets than before in order to get the same feeling of excitement?
(N12_lifetimePG)YES NO
N13. Have you ever written a bad check or taken money that didn’t belong to you from
family members or anyone else in order to pay for your gambling? (N13_lifetimePG)YES NO
N14. Has your gambling ever caused serious or repeated problems in your relationships
with any of your family members or friends? (N14_lifetimePG)YES NO-14
N15. IF NO TO 14 Has your gambling ever caused you any problems in school, have trouble with your job, or miss out on an important job or career opportunity?
(N15_lifetimePG)YES NO
16. Have you ever needed to ask family members or anyone else to loan you money or otherwise bail you out of a desperate money situation that was largely caused by your
gambling? (N16_lifetimePG)YES NO

A comparative study of men and women gamblers in Victoria Hing, Russell, Tolchard & Nower
Victorian Responsible Gambling Foundation
!"#$%&0&%)*%+(&
If non-gambler in past 12mths > Go to Final demo’s starting at Demo_1
Note following scoring of the NODs-CLiP2
Regarding calculation of the NODS score: the important thing to remember in calculating the NODS score is that some of the NODS items are “gate” items and others are “criterion” items. It is ESSENTIAL that the count include ONLY the criterion items and NOT the gate items. The criterion items in the version of the NODS-CLiP2 are:
*N2 OR N9 (Preoccupation)N4 (Chasing)*N5 OR N11 (Escape)N6 (Withdrawal)N8 (Loss of Control 3+ times)N10 (Lying 3+ times)N12 (Tolerance)N13 (Illegal Acts)*N14 OR N15 (Risked Relationships)N16 (Bailout)
The minimum score on the NODS will be 0 and the maximum score will be 10 (NODS_SCORE)
Regarding the question about classifying respondents based on their NODS scores - the NODS classifies respondents into the following groups: (NODS_TYPE)
0 = Non-problem Gambler 1 – 2 = At Risk Gambler3 – 4 = Problem Gambler5+ = Pathological gambler
SUBSAMPLING PROTOCOL FOR 1 in 3 SUBSAMPLING FOR NON-PROBLEM GAMBLERS
Once CPGSI groups are formed (not the NODS groups), next step is to randomly subsample a proportion of each of the four groups as fol-lows:
! Non-problem gambler - Sample 1 in 3 (MAIN STUDY)
! Low risk gambler - Sample ALL(1 IN 1 in MAIN STUDY)
! Moderate risk gambler - SAMPLE ALL(1 IN 1 in MAIN STUDY)
! Problem gambler - SAMPLE ALL(1 IN 1 in MAIN STUDY)
Non-gamblers continue to do their short survey.
If SUBSAMPLED - Go to Q9. (ie. gambling activity where person spent most money in the past 12mths) and do a long survey
If NOT subsampled - Go to Demographics at back starting at DEMO_1 and continue on (ie. asking about future participation and contact details etc.) and do a short survey.

A comparative study of men and women gamblers in Victoria Hing, Russell, Tolchard & Nower
Victorian Responsible Gambling Foundation
!"#$%&0+%)*%+(&
MAIN STUDY (IE. AFTER AGREEMENT TO TAKE PART)
Preferred activity/channel and venue location
9. On which single gambling activity did you spend the most money in the past 12mths? (prompt ONLY gambling activities as mentioned in Q8-Column A and select single activity)
10. How much money on average did you typically spend on this activity during the past 12mths? $_____ (RECORD HOURS and BASE - Day, week, fortnight, month, year) (convert to annual as previously advised)(Q10_1=HOURS, Q10_2=BASE, Spend_pa=annualised)
11. In the past 12mths, did you mostly spend money on/at [insert channels]? (prompt ONLY gambling channels as mentioned in Q8-Column B in line with activity selected above and select a single response only)
12. What is the name of the specific venue, internet site or betting service you spent the most money playing this? _________ (single response) (only venue players if following games appear in Q9.- 2. pokies, 3. table games, 4. horse/harness racing/greyhounds, 5. Sports/events, 6. Keno, 9. Bingo)
Q12B. INTERVIEWER TO CODE AS (1) VENUE OR (2) NON-VENUE (IF VENUE - Go to Q13. and onwards) (IF NON-VENUE - GO TO Q15.)
13. Roughly, how many kilometres are you away from this venue? _____ (only venue players - ie. played 2. pokies, 3. table games, 4. horse/harness racing/greyhounds, 5. Sports/events, 6. Keno, 9. Bingo) [Not relevant if most money spent on web site or on phone betting service]
14. Apart from being able to play your preferred game, what are the top 3 features you most like about this venue? (DISPLAY VENUE NAME IN Q12.) [Not relevant if most money spent on web site or on phone betting service]
1. Food pricing2. Drink pricing3. Food quality4. Range of food5. Easy to get to 6. Close to home7. Poker machine brands8. New poker machines 9. Pleasant interior10. Recently renovated11. Cheaper prices for members12. Clean toilets/bathrooms13. Good music/entertainment14. Nice staff/managers15. Prizes/draws16. Incentives/freebies offered17. Linked jackpots18. Other (record)____
15. When you played [Highest spend activity - As per Q9.] over the past 12mths, did you mostly play... (prompt - single) 1. Alone2. With one other person3. With several people in a group98. Don’t know99. Refused

A comparative study of men and women gamblers in Victoria Hing, Russell, Tolchard & Nower
Victorian Responsible Gambling Foundation
!"#$%&0,%)*%+(&
16. [If answers Q15.] What are top three main reasons you like to play this activity? (prompt)1. Social reasons2. To win money3. General entertainment4. Takes your mind off things5. Relieves stress6. Boredom7. Other (record)______98. Don’t know 99. Refused
[Only CPGSI categories of - Non-Problem Gamblers and Low Risk Gamblers]
Binge gambling
17. On how many days in the past 12mths did you spend a significantly larger than usual amount on gambling, in a shorter than usual period of time? (such as a big spending day on gambling) _______ days in past 12mths(SKIP TO Q21. if Q17.=0)
18. (if Q17.>0) Which single gambling activity did you mostly play? (insert only activities played as per Q8.-Column A and select a single response)_________
19. (if Q17.>0) Did you experience any financial difficulties as a result of this? (prompt)1. None2. Some3. Significant98. DK99. Refused
20. (if Q17.>0) Which of the following triggered this larger than usual spending on gambling? (prompt - allow multiple responses)1. Boredom - Y/N2. Depression - Y/N3. Used gambling to escape problems - Y/N4. Playing together with friends - Y/N5. Alcohol - Y/N6. Drugs - Y/N7. Chasing your losses - Y/N8. Stressful life event - Y/N9. Won money - so gave an incentive to gamble more - Y/N10. Other triggers (record)98. DK99. Refused
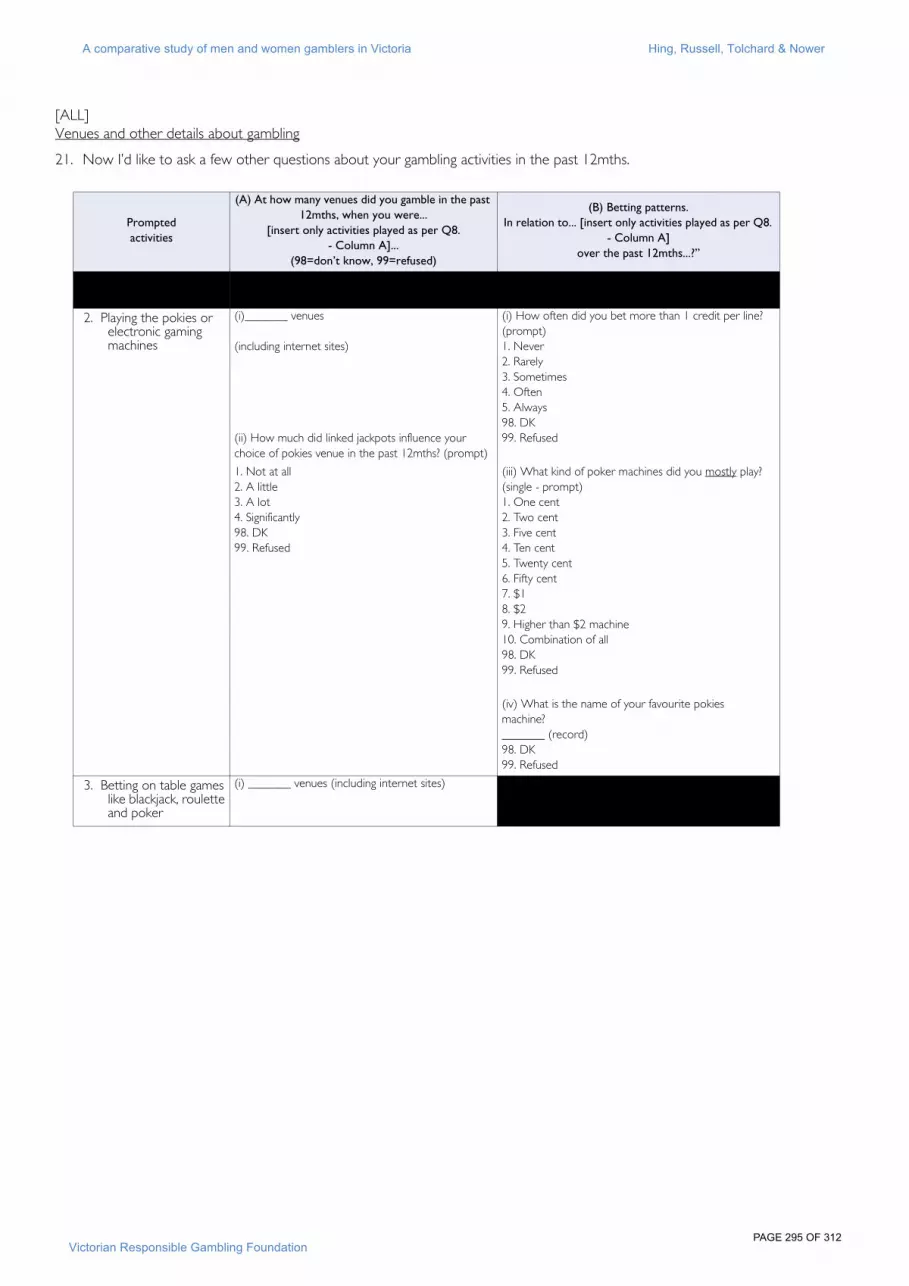
A comparative study of men and women gamblers in Victoria Hing, Russell, Tolchard & Nower
Victorian Responsible Gambling Foundation
!"#$%&0'%)*%+(&
[ALL]Venues and other details about gambling
21. Now I’d like to ask a few other questions about your gambling activities in the past 12mths.
Prompted activities
(A) At how many venues did you gamble in the past 12mths, when you were...
[insert only activities played as per Q8.- Column A]...
(98=don’t know, 99=refused)
(B) Betting patterns.In relation to... [insert only activities played as per Q8.
- Column A]over the past 12mths...?”
1. Informal private betting for money
2. Playing the pokies or electronic gaming machines
(i)_______ venues
(including internet sites)
(ii) How much did linked jackpots influence your choice of pokies venue in the past 12mths? (prompt)
1. Not at all2. A little3. A lot4. Significantly 98. DK99. Refused
(i) How often did you bet more than 1 credit per line? (prompt)1. Never2. Rarely3. Sometimes4. Often5. Always98. DK99. Refused
(iii) What kind of poker machines did you mostly play? (single - prompt)1. One cent2. Two cent3. Five cent4. Ten cent5. Twenty cent6. Fifty cent7. $18. $29. Higher than $2 machine10. Combination of all98. DK99. Refused
(iv) What is the name of your favourite pokies machine?_______ (record)98. DK99. Refused
3. Betting on table games like blackjack, roulette and poker
(i) _______ venues (including internet sites)

A comparative study of men and women gamblers in Victoria Hing, Russell, Tolchard & Nower
Victorian Responsible Gambling Foundation
!"#$%&0-%)*%+(&
4. Betting on horse or harness racing or greyhounds - excluding sweeps
(ii) _______ venues (including internet sites)
(ii) How much did jackpots influence your choice of races for wagering in the past 12mths? (prompt)
1. Not at all2. A little3. A lot4. Significantly
(i) What are the main ways you typically placed your wagering bets? (eg. Win/place bet, Trifectas, Daily dou-bles, quaddies) (Top 3 bets only)
Don’t accept bookmaker, TAB, cash, internet etc. - ASK TYPE OF BET
More common1. Win/place bet2. Each way3. Trifecta4. Quinella5. Daily double6. Running double 7. Multi-bet8. Mystery bet (all types of mystery bets)9. Calcutta
Less common10. Exacta11. Duet12. First 413. Parlayformula14. Other (specify):__________
98. DK99. Refused
(ii) Have you used batch betting in the past 12mths?
1. Yes2. No
(iii) Do you mainly bet in a syndicate (with pooled money) or alone?1. Syndicate2. Alone
Prompted activities
(A) At how many venues did you gamble in the past 12mths, when you were...
[insert only activities played as per Q8.- Column A]...
(98=don’t know, 99=refused)
(B) Betting patterns.In relation to... [insert only activities played as per Q8.
- Column A]over the past 12mths...?”

A comparative study of men and women gamblers in Victoria Hing, Russell, Tolchard & Nower
Victorian Responsible Gambling Foundation
!"#$%&0.%)*%+(&
5. Betting on sports and event results - like on football or other events like TV shows
(i)_______ venues
(including internet sites)
(i) Did you bet on? (prompt)
1. AFL (FootyTab)2. Tennis3. Cricket4. Soccer5. Basketball6. Boxing7. Rugby8. TV show results9. Any other sports or events (record)
(ii) What are the main ways you typically placed your sport or event bets?(eg. Win, Tip 8s, Quads) (Top 3 only)
Don’t accept bookmaker, TAB, cash, internet etc. - ASK TYPE OF BET
More common1. Win2. Tip (eg. 7 or 8)3. Quad/quarter quad4. Points/points differential/Total points5. Multibet/multi6. Head to head7. Each way8. Double/half full double/extra double9. Line betting10. First scorer11. Other (specify): _______
6. Keno (i)_______ venues
(including internet sites)
7. Lotto, Powerball, or the Pools
(i) Did you mainly play lotto/powerball/pools in a syndi-cate (with pooled money) or alone?1. Syndicate2. Alone98. DK99. Refused
(ii) Did you mainly use Quickpicks or pick your own numbers?1. Quickpick2. Picks own numbers98. DK99. Refused
(iii) How many numbers did you typically pick per game? (eg. Examples of standard number - Ozsuper 7 - stand-ard 7, Powerball - 5+powerball, Tattslotto 6)
______ 98. DK99. Refused
(iv) How many games or squares did you typically play each week? _______ games (Typical standard games = 12/15/24/36/50)98. DK99. Refused
Prompted activities
(A) At how many venues did you gamble in the past 12mths, when you were...
[insert only activities played as per Q8.- Column A]...
(98=don’t know, 99=refused)
(B) Betting patterns.In relation to... [insert only activities played as per Q8.
- Column A]over the past 12mths...?”

A comparative study of men and women gamblers in Victoria Hing, Russell, Tolchard & Nower
Victorian Responsible Gambling Foundation
!"#$%&0/%)*%+(&
8. Scratch tickets (i) What denomination scratchies did you mostly buy? $_____
9. Bingo _______ venues (including internet sites) (i) How many books did you typically buy each time you went to Bingo? _____ books
(ii) How many books did you play at once? _____ books
10. Competitions where you enter by phone or leave an SMS to be in a prize draw
(i) Were the competitions that you entered by phone or SMS mainly promoted through? (top 3) 1. TV2. Radio3. Magazines4. Newspaper5. Internet sites6. Other (record)98. DK 99. Refused
Prompted activities
(A) At how many venues did you gamble in the past 12mths, when you were...
[insert only activities played as per Q8.- Column A]...
(98=don’t know, 99=refused)
(B) Betting patterns.In relation to... [insert only activities played as per Q8.
- Column A]over the past 12mths...?”

A comparative study of men and women gamblers in Victoria Hing, Russell, Tolchard & Nower
Victorian Responsible Gambling Foundation
!"#$%&00%)*%+(&
Money management for gambling (ALL)
22. When people go out, they often bring money to cover food, gambling and other expenses. Roughly how much cash on average did you take with you in the past 12mths when you played [insert gambling activity that person spends most money on - as per Q9.], even if you didn’t spend it?
$_____ on average (per outing)98. DK99. Refused
23. Do you typically bring any ATM, EFTPOS or CREDIT cards when you go to gamble, even if you don’t use them? (probe to clarify - multiple)1. Brings EFTPOS/ATM card 2. Brings a credit card3. Brings both4. Brings no cards98. Don’t know99. Refused
(If Doesn’t bring any cards >>> go to Q25.)
24. How many times during a single gambling session would you use your ATM Card/EFTPOS/CREDIT CARD to access extra money for your gambling? ______ times per gambling session98. Don’t know99. Refused
Life events experienced in the past 12mths (ALL)
25. Now I’d like you to think about things that happened in your life during the past 12mths. Which of the following life events did you experience in the past 12mths?
26. Did any particular life event trigger an increase in your gambling in the past 12mths, even if only temporarily? (If more than one, record the single biggest trigger) (record as per code frame or Record - Other______)
Smoking (ALL)
27. Have you smoked at all in the past 12mths?1. Yes2. No
28. Do you currently smoke?1. Yes2. No
29. (If Yes) How many cigarettes do you currently smoke a day on average? ____________
Life eventsExperienced in past 12mths
Life eventsExperienced in past 12mths
1. Death of someone close to you 1. Yes 2. No 7. Retirement 1. Yes 2. No
2. Divorce 1. Yes 2. No 8. Pregnancy or new family additions 1. Yes 2. No
3. Legal difficulties 1. Yes 2. No 9. Major change to your financial situation 1. Yes 2. No
4. Major injury or illness to either yourself or someone close to you
1. Yes 2. No 10. Taking on a mortgage, loan or making a big purchase
1. Yes 2. No
5. Marriage or finding a relationship partner 1. Yes 2. No 11. Increase in the number of arguments with someone you are close to
1. Yes 2. No
6. Troubles with your work, boss, or superiors
1. Yes 2. No 12. Major change in living or workconditions (eg. renovations, new job)
1. Yes 2. No

A comparative study of men and women gamblers in Victoria Hing, Russell, Tolchard & Nower
Victorian Responsible Gambling Foundation
!"#$%+11%)*%+(&
30. Has the smoking ban since July 1 2007 in Victorian gambling venues (prompt)?1. Decreased your gambling 2. Had no effect on your gambling3. Increased your gambling 98. DK99. Refused
Alcohol (ALL)
31. Have you consumed an alcoholic drink in the past 12mths?1. Yes2. No
32. (Long term risk) Based on the past 12mths, how many standard alcoholic drinks did you typically consume each week? __________ drinks per week
33. CAGE four-item alcohol screen (2 or more = clinically significant alcohol abuse) (only if Q31.=Yes - drinks alcohol)
The next questions are being asked to help work out if there is any link between alcohol and gambling patterns in the community. May I ask....
1. Have you ever felt you should cut down on your drinking? (1. Yes, 2. No)2. Have people annoyed you by criticizing your drinking? (1. Yes, 2. No)3. Have you ever felt bad or guilty about your drinking? (1. Yes, 2. No)4. Have you ever had a drink first thing in the morning to steady your nerves or to get rid of a hangover (ie. An eye opener)? (1. Yes, 2. No)
Health conditions (ALL)
34. Over the past 12mths, would you say that in general your health has been... (prompt)1. Excellent2. Very good3. Good4. Fair5. Poor
35. Thinking of your personal background, would you say that you are someone who has had:1. No really major problems, hardships or traumas in their life or upbringing 2. A lot of trauma, hardship and problems in their life or upbringing
36. Which of the following health conditions do you currently have?1. Heart conditions, high blood pressure or high cholesterol (Y/N)2. Diabetes (Y/N)3. Cancer (Y/N)4. Lung conditions including asthma (Y/N)5. Depression (Y/N)6. Anxiety disorders (Y/N)7. Obesity (Y/N)8. Any other physical or mental health conditions (record) (Y/N)
37. Do you have a disability that affected your day-to-day life over the past 12mths? 1. Yes (If so, record _______)2. No

A comparative study of men and women gamblers in Victoria Hing, Russell, Tolchard & Nower
Victorian Responsible Gambling Foundation
!"#$%+1(%)*%+(&
Kessler-10 for non-specific psychological distress (ALL)
38. The next questions are about how you have been feeling during the past 4wks. During the past 4wks, about how often did you feel...? (prompt items and scale - Would you say...? Start with > All of the time...)
Kessler-10 itemsa
(non-specific psychological distress)
a. ABS (4817.0.55.001 - Information Paper: Use of the Kessler Psychological Distress Scale in ABS Health Surveys, Australia, 2001) - Each item is scored from 1 for 'none of the time' to 5 for 'all of the time'. Scores for the ten items are then summed, yielding a minimum possible score of 10 and a maximum possible score of 50, with low scores indicating low levels of psychological distress and high scores indicating high levels of psychological distress.
Vic Pop Health 2001 Cut-offs based on K-10 - Score 10 - 19 - Likely to be well, 20 - 24 - Likely to have a mild disorder, 25 - 29 - Likely to have a moderate mental disorder, 30 - 50 Likely to have a severe mental disorder.
Non
e of
time
A li
ttle
of t
he t
ime
Som
e of
th
e tim
e
Mos
t of
the
time
All
ofth
e tim
e
Don
’t kn
ow
Ref
used
Kessler-10 items
1. Tired out for no good reason 1 2 3 4 5 98 99
2. Nervous 1 2 3 4 5 98 99
3. So nervous that nothing could calm you down 1 2 3 4 5 98 99
4. Hopeless 1 2 3 4 5 98 99
5. Restless or fidgety 1 2 3 4 5 98 99
6. So restless that you could not sit still 1 2 3 4 5 98 99
7. Depressed 1 2 3 4 5 98 99
8. That everything was an effort 1 2 3 4 5 98 99
9. So sad that nothing could cheer you up 1 2 3 4 5 98 99
10. Worthless 1 2 3 4 5 98 99

A comparative study of men and women gamblers in Victoria Hing, Russell, Tolchard & Nower
Victorian Responsible Gambling Foundation
!"#$%+1&%)*%+(&
Social capital items featuring in the Victorian Population Health Survey (as used by Victorian Communities) (ALL)
39. The next questions look at how you feel about the community you live in.
40. Do you like living in your community? (prompt)1. Definitely2. Sometimes3. No - Not at all4. No feeling about it98. Don’t know99. Refused
41. How would you rate the overall quality of services, facilities and “things to do” in your community?1. Very poor2. Poor3. OK4. Good5. Very good98. DK99. Refused
Gambling difficulties (Moderate Risk and Problem Gamblers)
Now I’d like to explore the way gambling has influenced your life. May I ask...
42. Have you ever had any difficulties related to your gambling?1. Yes2. No
43. Have you had any difficulties related to your gambling in the past 12mths? 1. Yes2. No
44. (If Q43.=1) If 1=not at all and 10=very serious, how would you rate the seriousness of these difficulties in the past 12mths? ___
Items in the Indicators of Community Strength Survey Ye
s,de
finite
ly
Som
etim
es
No,
Not
at
all
Don
’t kn
ow
Ref
used
Ability to get help
1. Can you get help from friends, family or neighbours when you need it? 1 2 3 98 99
Items in the Indicators of Community Strength Survey Ye
s
No
Don
’t kn
ow
Ref
used
Participation (new items in the 2006 survey)
1. Are you a member of an organised group such as a sports or church group or another community group including those over the internet?
1 3 98 99

A comparative study of men and women gamblers in Victoria Hing, Russell, Tolchard & Nower
Victorian Responsible Gambling Foundation
!"#$%+1+%)*%+(&
45. Do you consider that you personally have a gambling problem or may be “at risk” for problem gambling? (probe)1. Yes - gambling problem2. Yes - “at risk”3. Maybe - gambling problem4. Maybe - “at risk”5. No - no gambling problem or “at risk”98. DK99. Refused
46. (If Q45.=1 to 4) How long ago did you first think this? _________ (record in years)(Add code for just now - 96. Just Now when doing phone interview) (98. DK, 99. Refused)
Gambling in households, families and relationships (Moderate Risk and Problem Gamblers)
47. Would you consider anyone in your family to be currently at risk of either having or developing a gambling problem? (multiple) Would that be your... (prompt example)?1. Spouse/partner2. Brother3. Sister4. Father5. Mother6. Grandmother (incl. great)7. Grandfather (incl. great)8. Uncle9. Aunt10. No-one else11. Other (record)_________98. Don’t know99. Refused
48. Apart from your family, would you consider any other people you are close to to be at risk of either having or developing a gambling problem? Would that be your... (prompt example) (multiple) (ask whether person lives with respondent and code below)1. Male house mate (non-related)2. Female house mate (non-related)3. Male friend (live together)4. Female friend (live together)5. Male friend (doesn’t live together)6. Female friend (doesn’t live together)7. Male work colleague9. Female work colleague10. No-one else11. Other (record) ________98. Don’t know99. Refused
How People Started Gambling (Moderate Risk and Problem Gamblers)
Now the next questions are about how you started gambling. May I ask...
49. At what age did you first start gambling or betting for money? (apart from Melbourne Cup sweeps) _______
50. When you first went to gamble for money, did you mainly start... (prompt - single response)1. By yourself2. With a friend - who didn’t live with you3. With a friend - who was also a housemate4. With a male relative5. With a female relative6. Other (record)______98. Don’t know99. Refused

A comparative study of men and women gamblers in Victoria Hing, Russell, Tolchard & Nower
Victorian Responsible Gambling Foundation
!"#$%+1,%)*%+(&
51. What game did you first start playing? (insert code frame from Q8a - all activities - not just ones played in past 12mths) (Single response)
52. What triggered you to start gambling? (record - unprompted) 1. Social reasons2. To win money3. General entertainment4. Takes your mind off things5. Relieves stress6. Boredom7. Other (record)______98. Don’t know 99. Refused
Gambling help and awareness of gambling help (Moderate Risk and Problem Gamblers)
53. Have you sought any help for a gambling problem - whether informally from a friend or more formally from a help professional - in the past 12mths?1. Yes (If no go to Q54.)2. No (If no go to Q57.)98. Don’t know (Go to Q57.)99. Refused (Go to Q57.)
54. Who provided the help? (multiple)1. Doctor/medical professional2. Counselling professional3. Psychologist4. Psychiatrist5. Employer/supervisor/boss6. Church/minister/priest7. Addiction treatment program/centre 8. Community help organisation (eg. Lifeline)9. Telephoned the gambling help line10. Gambling Help service11. Gamblers Anonymous/GA12. Financial counsellor13. Spouse/partner14. Male friend15. Female friend16. Male relative17. Female relative 18. Other (record)98. Don’t know 99. Refused
55. What type of help did you get. Was it... (prompt)1. Friendship support 2. Relationship counselling3. Personal counselling 4. Help sorting out finances5. Help with food/money/clothing/accommodation or other items6. Other (record)_____

A comparative study of men and women gamblers in Victoria Hing, Russell, Tolchard & Nower
Victorian Responsible Gambling Foundation
!"#$%+1'%)*%+(&
56. Who mainly referred you to the help? (single response)1. Doctor/medical professional2. Counselling professional3. Psychologist4. Psychiatrist5. Employer/supervisor/boss6. Church/minister/priest7. Addiction treatment program/centre 8. Community help organisation (eg. Lifeline)9. Telephoned the gambling help line10. Gamblers Anonymous/GA11. Financial counsellor15. Spouse/partner16. Male friend17. Female friend18. Male relative19. Female relative 20. Yourself 21. Other (record)98. Don’t know 99. Refused
57. (If Q53.=No) Have you wanted help for a gambling problem in the past 12mths?1. Yes2. No (If no go to Q59.)98. Don’t know99. Refused
58. (If Q57.=Yes) Why did you not seek help? Was it because... (prompt - multiple)1. You didn’t know where to get help2. You thought you could solve it yourself3. You didn’t think it was serious enough4. You were embarrassed/shy5. It was inconvenient6. You thought it would cost a lot7. Other reason (record) ________98. Don’t know99. Refused
Overcoming problem gambling (Moderate Risk, Problem Gamblers)
59. Using a scale from 1 to 5, where 1=not at all useful and 5=very useful, how useful would the following be in helping you reduce the amount of gambling you do:1. Having a wider social network _____ (98. DK, 99. Refused)2. Counselling to help overcome a difficult time in your past _____ (98. DK, 99. Refused)3. Having more money available _____ (98. DK, 99. Refused)4. Information on the odds of winning in gambling _____ (98. DK, 99. Refused)5. Having more outside leisure activities and interests ______ (98. DK, 99. Refused)6. Finding a relationship partner ______ (98. DK, 99. Refused)
Role of significant others (Moderate Risk, Problem Gamblers)
60. How much have the following people encouraged you to reduce your gambling in the past 12mths?1. Employer - (1) Not at all (2) A little (3) a lot (98-DK, 99-Refusal, 97-not applicable)2. Friends - (1) Not at all (2) A little (3) a lot (98-DK, 99-Refusal)3. Your relationship partner - (1) Not at all (2) A little (3) a lot (98-DK, 99-Refusal, 97-not applicable)4. Relatives - (1) Not at all (2) A little (3) a lot (98-DK, 99-Refusal, 97-not applicable)5. Doctor or other health professionals (1) Not at all (2) A little (3) a lot (98-DK, 99-Refusal)

A comparative study of men and women gamblers in Victoria Hing, Russell, Tolchard & Nower
Victorian Responsible Gambling Foundation
!"#$%+1-%)*%+(&
Readiness To Change (RTC) questionnaire - based on Prochaska and DiClemente model (Rollnick et al., 1992)(Moderate Risk and Problem Gamblers)
61. The following questions are designed to identify how you personally feel about your gambling right now. Using a scale where 1=strongly disagree and 5=strongly agree (3 is neutral), how much do you agree or disagree with the following...
Suicide, substance use and crime (Moderate Risk and Problem Gamblers)
These next questions may be seen as sensitive, so please don't feel that you have to answer them. But if you would, it will assist to better understand the health and well-being of gamblers. Would it be OK to read these?
62. In the past 12mths, have you considered taking your own life?1. Yes2. No98. DK99. Refused
63. Now the following is strictly confidential. This information will also be deleted to protect individual privacy following data analysis.
How many of the following drugs have you occasionally or regularly used for non-medical reasons in the past 12 months? (98 DK, 99 Refused - ADD TO ALL)
1. Marijuana/Hashish (1. No use 2. Occasional Use 3. Regular use) 2. Prescription pain killers (1. No use 2. Occasional Use 3. Regular use) 3. Amphetamines like speed (1. No use 2. Occasional Use 3. Regular use) 4. Ecstasy/designer drugs (1. No use 2. Occasional Use 3. Regular use) 5. Cocaine/crack (1. No use 2. Occasional Use 3. Regular use) 6. Tranquillisers (1. No use 2. Occasional Use 3. Regular use) 7. Hallucinogen (1. No use 2. Occasional Use 3. Regular use) 8. Inhalants (1. No use 2. Occasional Use 3. Regular use) 9. Heroin (1. No use 2. Occasional Use 3. Regular use) 10. GHB (1. No use 2. Occasional Use 3. Regular use) 11. Barbituates (1. No use 2. Occasional Use 3. Regular use)12. Growth/muscle promoting steroids (1. No use 2. Occasional Use 3. Regular use) 13. Methadone (1. No use 2. Occasional Use 3. Regular use)
Gambling Readiness to change (GRTC) scale items
(Based on Rollnick et. al, 1992)a
a. An overall composite of readiness to change consists of weighting the precontemplation items (-2), contemplation items (1), and action items (2), and taking the mean of all weighted items. Alternatively, separate scores for precontemplation, contemplation, and action can be derived by taking the mean of the items corresponding to each subscale. A third alternative is to categorize individuals as precontemplators, contemplators, or in the action stage according to their highest subscale score. Slightly adapted to cater to CATI.P=Precontemplation, C=Contemplation and A=Action
Stro
ngly
dis
agre
e
Dis
agre
e
Neu
tral
Agr
ee
Stro
ngly
agr
ee
Don
’t k
now
Ref
use
1. I enjoy my gambling, but sometimes I gamble too much (C) 1 2 3 4 5 98 99
2. Sometimes I think I should cut down on my gambling (C) 1 2 3 4 5 98 99
3. It’s a waste of time thinking about my gambling (P) 1 2 3 4 5 98 99
4. I have just recently changed my gambling habits (A) 1 2 3 4 5 98 99
5. Anyone can talk about wanting to do something about gambling, but I am actually doing something about it (A)
1 2 3 4 5 98 99
6. My gambling is a problem sometimes (C) 1 2 3 4 5 98 99
7. There is no need for me to think about changing my gambling (P) 1 2 3 4 5 98 99
8. I am actually changing my gambling habits right now (A 1 2 3 4 5 98 99
9. Gambling less would be pointless for me (P) 1 2 3 4 5 98 99

A comparative study of men and women gamblers in Victoria Hing, Russell, Tolchard & Nower
Victorian Responsible Gambling Foundation
!"#$%+1.%)*%+(&
64. Please do not tell us what it is. But may I ask, in the past 12mths, has your gambling led you to do anything that is technically against the law? (we don’t need to know what it is)1. Yes2. No98. Refused99. DK
Key attitudes about gambling in Victoria [ALL]
65. Using a scale where 1=strongly disagree, 5=strongly agree and 3 is neutral, how much do you agree or disagree with the following statements?
Demographics (Checked for compliance with ABS 2006 Census Dictionary Code Frames and use of Census 06 Variable Names)
The final questions are for official Victorian Government statistics and are strictly confidential.... %
Attitudes
Stro
ngly
dis
agre
e
Dis
agre
e
Neu
tral
Agr
ee
Stro
ngly
agr
ee
Don
’t k
now
Ref
use
Support for Government policy
1. The Victorian Government is taking positive action to encourage responsible gambling in Victoria
1 2 3 4 5 98 99
2. Gambling is a serious social problem in Victoria 1 2 3 4 5 98 99
3. Gambling provides a lot of fun for the community 1 2 3 4 5 98 99
Local community concern about gambling
4. Gambling is too widely accessible in my local council/shire 1 2 3 4 5 98 99
5 Governments need to do more to address problem gambling in my local council/shire
1 2 3 4 5 98 99
DEMO_1. (ASCED combined with HSCP) What is your highest level of completed
education?(don’t prompt)
DEMO_2. (Non-ABS) Does your household consist of...a (prompt)
DEMO_3. (Child) How many dependent children
live with you at home under the age of 25?
1. Post-graduate degree2. Bachelors degree3. Advanced diploma/diploma/certificate/ trade qualification4. Completed year 125. Completed year 106. Completed year 8 or less7. No schooling98. DK99. Refused
1. Couple with child or children2. One parent family3. Other family4. Couple without children5. Group household (not related) 6. Lone person 7. Other Household (record) ____98. DK99. Refused

A comparative study of men and women gamblers in Victoria Hing, Russell, Tolchard & Nower
Victorian Responsible Gambling Foundation
!"#$%+1/%)*%+(&
The Victorian Study of the Epidemiologyof problem gambling
DEMO_4. (LFS06P) Do you currently work or are you looking for work?
Full or part-time? (record)
DEMO_5. (OCC06P) What type of work do you do?
(Only If 1-5 in DEMO_4)
DEMO_6. (Non-ABS) Have you migrated to Australia in the past 5 yrs?
1. Employed, work full-time2. Employed, work part-time3. Employed - away from work4. Unemployed, looking for FT work5. Unemployed, looking for PT work6. Not in labour force/not looking for work98. DK99. Refused
(including volunteering as not in the labour force)
(Non-FT to be included in part-time)
(OCC06Pi) Record__________
(OCC06Pii) Code:1. Manager2. Professional3. Technicians and trades workers4. Community and personal service worker5. Clerical and administrative worker6. Sales worker7. Machinery operators and drivers8. Labourers9. Found difficult to code
(Do not code small business or business owner in 9. Code the type of work role. 2006 census dictionary definitions to be supplied)
1. Yes.... (From which country? ________)2. No
Demo_6c. Street detailsWe would like to classify survey responses by census collection districts – which are parts of individual sub-urbs. For this I need to know your street number and street name. Please note that your address will not be connected with your survey responses – it will be con-verted to a census collection district only.Street number: _____Street name: _____
DEMO_7. (NEDD) What speed of internet connection
do you have at home?
DEMO_8. (HINASD) What is the approximate total income of all people
combined in your household? (weekly or annual household
income - before tax - including any govt payments)
DEMO_9. (INCP) What is your approximate total personal income?
(weekly or annual personalincome - before tax -
including any govt payments)
1. No Internet connection2. Broadband 3. Dial-up 4. Other connection5. Don’t know
(Note ADSL, cable, satellite + wireless = broadband)
1. Negative income 2. Nil income 3. $1–$149 ($1–$7,799) 4. $150–$249 ($7,800–$12,999) 5. $250–$349 ($13,000–$18,199) 6. $350–$499 ($18,200–$25,999) 7. $500–$649 ($26,000–$33,799) 8. $650–$799 ($33,800–$41,599) 9. $800–$999 ($41,600–$51,999) 10. $1,000–$1,199 ($52,000–$62,399) 11. $1,200–$1,399 ($62,400–$72,799) 12. $1,400–$1,699 ($72,800–$88,399)13. $1,700–$1,999 ($88,400–$103,999)14. $2,000–$2,499 ($104,000–$129,999) 15. $2,500–$2,999 ($130,000–$155,999) 16. $3,000–$3,499 ($156,000–$181,999) 17. $3,500–$3,999 ($182,000–$207,999)18. $4,000 or more ($208,000 or more)98. DK99. Refused
1. Negative income2. Nil income3. $1–$149 ($1–$7,799) 4. $150–$249 ($7,800–$12,999)5. $250–$399 ($13,000–$20,799)6. $400–$599 ($20,800–$31,199)7. $600–$799 ($31,200–$41,599)8. $800–$999 ($41,600–$51,999) 9. $1,000–$1,299 ($52,000–$67,599) 10. $1,300–$1,599 ($67,600–$83,199)11. $1,600–$1,999 ($83,200–$103,999)12. $2,000 or more ($104,000 or more)98. DK99. Refused
a. A new 2006 Census variable. Replaces former Household type variable. Main to allow coding of cases when unrelated household members are present.

A comparative study of men and women gamblers in Victoria Hing, Russell, Tolchard & Nower
Victorian Responsible Gambling Foundation
!"#$%+10%)*%+(&
The Victorian Study of the Epidemiologyof problem gambling
Future studies (ALL)
66. The Victorian Government is doing a study to look at community views about gambling over time. Would you be happy for your name and contact details to be supplied to the Victorian Government with your responses? If you agree to this, the information that you supply would be used by other social researchers to conduct future studies to see how gambling patterns change over time.
This can also give you an opportunity to be selected for focus groups for incentives or free shopping vouchers.
1. Agree to participate 2. Soft refusal (could be converted)3. Hard refusal (no way) This only means that we may call to see if you're interested, so you can also decline to take part in the future.
67. Can I confirm your first name once again? _______________
68. Can I confirm your phone number is _______________
69. Are there other numbers or a mobile for future contact? (record all - including mobiles or other numbers)
70. Do you have an email address if we need to send you information? ______________________ (read back)
71. I’d like to thank you for taking part in this Victorian Government survey and advise you that my supervisor may call to verify your participation.
(ONLY People with suicide ideation - Q62.=yes OR Depression - Q38.=Total sum of all items in battery is 25 or over OR Moderate Risk or Problem Gamblers)
I was wondering whether would you may be interested in some free confidential support from the Gambler's Help Line. Would you like their number or would you like someone from there to contact you?
1. Asked for number (1800 156 789) 2. Asked for counsellor to call (organise call back - Counselling in line with counsellor availability) (Confirm number for call and contact name _______________)
If respondent EXTREMELY upset during the call, offer to break the call and offer to have someone from the help line call that person. Refer all critical incident protocols (Have backup number of Lifeline 13 11 14 for critical events - for use afterhours)
CALLS WILL BE TRACKED AS FOLLOWS DURING THE PILOT AND SURVEY - UPDATED:
Call tracking items In scopeConfirmed
out of scopeUnclear whether
in or out
Refusals (please provide refusals by Victorian Government region x gender)
Refused Household - HARD (no questions) - MALE
Refused Household - HARD (no questions) - FEMALE
Refused Household - SOFT (no questions) - MALE
Refused Household - SOFT (no questions) - FEMALE
Refused Respondent - HARD (no questions) - MALE
Refused Respondent - HARD (no questions) - FEMALE
Refused Respondent - SOFT (no questions) - MALE
Refused Respondent - SOFT (no questions) - FEMALE
Partial completions - REFUSAL SURVEY (ie. must be completed by separate interviewers)
Exited before completing all the:- gambling activity questions and;- CPGSI 9 items(Counts as a refusal - not counted towards N=15000 - keep data)

A comparative study of men and women gamblers in Victoria Hing, Russell, Tolchard & Nower
Victorian Responsible Gambling Foundation
!"#$%+(1%)*%+(&
The Victorian Study of the Epidemiologyof problem gambling
Partial completions - FULL SURVEY
Attempted main full survey (after agreeing), but exited before completing in full all the:- gambling activity questions and;- CPGSI 9 items(Counts as a refusal - not counted towards N=15000 - keep data)
Completions - REFUSAL SURVEY
Problem Gamblers (N and % of full survey)
Moderate Risk Gamblers (N and % of full survey)
Low Risk Gamblers (N and % of full survey)
Non-problem gamblers (N and % of full survey)
Non-gamblers (N and % of full survey)
Completions - FULL SURVEY
Problem Gamblers (N and % of full survey)
Moderate Risk Gamblers (N and % of full survey)
Low Risk Gamblers (N and % of full survey)
Non-problem gamblers (N and % of full survey)
Non-gamblers (N and % of full survey)
Language issues
Insufficient english - Language identified (record)(protocol - organise a multilingual interview)
Insufficient english - Language not yet identified (add notes to give indication - eg. sounds like Asian language)(protocol - organise a multilingual interviewer to ring)
Completions (SEPARATE REPORTING FOR REFUSAL SURVEY, FULL SURVEY AND OVERALL)
Males v Females - 18-24yrs (N and % total)
Males v Females - 25-34yrs (N and % total)
Males v Females - 35-44yrs (N and % total)
Males v Females - 45-54yrs (N and % total)
Males v Females - 55-64yrs (N and % total)
Males v Females - 65yrs and over (N and % total)
Numbers
Answering machine - sounds like a residence(Hello - this is John and Sally’s house)
Answering machine - no way to tell if home or business
Answering machines where it’s clearly a business are to be put in the “Out of scope number - business” list
Disconnected numbers
Fax machine
Engaged
Multiple landlines
No answer
Out of scope number - business
Out of scope number - household (eg. no pp 18yrs or over)
Unable to take part - away for 8wk field period (eg. overseas)
Unable take part - illness - away for 8wk field period (eg. overseas)
Call tracking items In scopeConfirmed
out of scopeUnclear whether
in or out

A comparative study of men and women gamblers in Victoria Hing, Russell, Tolchard & Nower
Victorian Responsible Gambling Foundation
!"#$%+((%)*%+(&
The Victorian Study of the Epidemiologyof problem gambling
Unable to take part - Hearing impaired(protocol - see if organise a TTY interview)
Unable to take part - cognitively impaired(protocol - see if can talk to carer. Find when available - Similar protocol as when we did intellectual disability interviews)
Unable to take part - other (and record why)
For unable to take part as above - Please record date when person is back.
Call tracking items In scopeConfirmed
out of scopeUnclear whether
in or out


