Embed Size (px)
Citation preview

Journal of Economics, Finance and Accounting – JEFA (2016), Vol.3(1) Guloglu, Ekinci
__________________________________________________________________________________ 244
A COMPARISON OF BID-ASK SPREAD PROXIES: EVIDENCE FROM BORSA ISTANBUL FUTURES
DOI: 10.17261/Pressacademia.2016321992
Zeynep Cobandag Guloglu1, Cumhur Ekinci2 1Istanbul Technical University. [email protected] 2Istanbul Technical University. [email protected]
ABSTRACT We analyze the performance of five different methods appearing in the market microstructure literature in predicting effective and quoted bid-ask spreads (Roll, LOT Mixed, Effective Tick, High-Low and Closing Percent Quoted Spread proxies). With data from index futures, currency futures and gold futures traded in Borsa Istanbul and taking percent effective and percent quoted spreads obtained from intraday trade and quote data as benchmarks, we calculate and compare the correlations and root mean square errors of the spread measures. Results show that none of the proxies is successful enough in estimating effective or quoted spread although under normal market conditions, Effective Tick appears to perform best. Keywords: bid-ask spread, Borsa Istanbul, futures market JEL Classification: G10, G14, G23
1. INTRODUCTION Market liquidity or transactional liquidity is simply defined as the ability of trading large sizes quickly at a low cost. Today, for an investor generally it is not possible to invest without taking market liquidity into consideration since it is one of the critical features showing market quality.
Market liquidity concept is broad and includes depth, ex-post volume, cost of a round trip and resiliency dimensions among others. Cost dimension of market liquidity is measured by the difference between the bid and ask prices called “bid-ask spread”. The price cost of a round trip originating from an immediate purchase and sale of a security, bid-ask spread, has thus been of great concern in market microstructure research and closely followed by investors and market authorities. Therefore, understanding bid-ask spread dynamics is beneficial for all market participants.
Withstanding the importance of spread, there are several studies that explain spread dynamics over time or its time-series determinants. However, existing studies of bid-ask spread analysis have all been performed over short time periods such as a year or a few months. The reason for this is computational difficulties and more importantly the lack of long-term intraday data. In order to compute either quoted or effective bid-ask spread for long periods, large sets of high-frequency (mostly tick-by-tick) data that consist of quotes and trades are needed. In most cases, intraday data do not go back more than a few years. However, one might be interested in analyzing market liquidity for several years and on various international markets. Thus, this kind of analysis requires extensive amounts of high-frequency data which usually are unavailable (especially in emerging markets) or hard to work with. Instead, if average bid-ask spread can be estimated with readily available low-frequency data such as daily price or volume, this can allow for the investigation about liquidity for much longer time periods.
Journal of Economics, Finance and Accounting – (JEFA), ISSN: 2148-6697
Year: 2016 Volume: 3 Issue: 1

Journal of Economics, Finance and Accounting – JEFA (2016), Vol.3(1) Guloglu, Ekinci
__________________________________________________________________________________ 245
In effect, measurement of bid-ask spread using alternative low frequency data is an interesting question. Hence, in this paper we focus on how bid-ask spread could be approximated in the absence of real data. Microstructure literature proposes models that attempt to estimate bid-ask spread using low-frequency or other data. In this study, we evaluate the performance of the models proposed in literature on an emerging market.
Roll (1984) is first to estimate bid-ask spreads form observed price movements. Roll approach is attractive since it gives an estimate using just price data. However, it is criticized since its performance is poor when longer term data are used. Thus, starting from popular Roll (1984) measure, various new models have been proposed. Lesmond, Ogden and Trzcinka (1999) develop “Zeros” measure to estimate transaction costs using only the time series of daily security returns which outperforms Roll measure. Their method is based on the idea that lower liquidity is a result of zero volume thus zero return days (Goyenko, Holden, & Trzcinka, 2009). Their bid-ask spread measure is defined as the proportion of zero return days to total trading days in a month. Thus, their percent cost proxy shows monthly liquidity rather than daily liquidity. By the same token, they launched a new measure called LOT Mixed based on the relationship between trading costs and observed stock returns. They state that observed stock returns can change due to buying and selling costs and their liquidity proxy is simply the difference of buying and selling costs. Furthermore, they indicate that true return of a stock is unobserved and these unobserved returns can be estimated by a market model. Using these relations, they estimate cost parameters by maximizing the likelihood function of daily stock returns. Hasbrouck (2004 and 2009) estimates effective costs of trading with a Gibbs procedure. The study uses Roll model and assumes that public information in the model is distributed normally. In fact, we can argue that both LOT Mixed and Hasbrouck measures are useful low-frequency spread proxies but require iterative and computer-intensive calculations. Holden (2009) develops an extended Roll model. This model is a more implicit version of Roll since it takes the idiosyncratic adjusted price change by generating a market model. Developed by Holden (2009) and Goyenko, Holden and Trzcinka (2009), Effective Tick estimator assumes that the relation between spreads and effective tick sizes help researchers infer spreads from price clustering. This spread proxy is simply the probability weighted average of each effective spread size divided by average price. Recently, Corwin and Schultz (2012) generate a new spread proxy using daily high and daily low prices. More recently, Chung and Zhang (2014) suggest a percent-cost proxy called ‘Closing Percent Quoted Spread’ using closing ask and closing bid prices and show that it performs better for U.S. data. Fong, Holden and Trczinka (2014), generate a new monthly spread proxy called FHT which is a simplified version of LOT Mixed.
A wide variety of researchers have used these low frequency estimators in their analysis. However, the question is whether low-frequency spread proxies really measure what researchers want to measure. This questioning is essential since inaccurate estimates of spreads can create misleading information about actual market liquidity and functioning of financial markets. Therefore, throughout our paper we test the hypothesis that low-frequency measures can usefully estimate bid-ask spread and try to determine the measures that fit best.
So far, several studies in the literature have tested the performance of these low-frequency spread estimators on stock markets. For instance, Lesmond (2005) tests the LOT Mixed proxy to provide liquidity estimates for thirty one emerging markets for a period from 1991 to 2000. The study finds that estimates are more than 80% correlated with the proportional bid-ask spread recorded for twenty three of thirty one markets. Goyenko, Holden, and Trzcinka (2009) compare TAQ-based effective spread with various low-frequency liquidity measures using a sample of 400 randomly selected stocks over the period from 1993 through 2005. They show that the simplest dominant measure is the Effective Tick among Holden, Gibbs, LOT Mixed, Zeros and Roll proxies. Corwin and Schultz (2012) compare Roll, Effective Tick, LOT Mixed and High-Low estimators with NYSE data from 1993 through 2006. Their results show that High-Low spread estimator dominates Roll and LOT estimators and does better than Effective Tick estimator for most stocks. Chung and Zhang (2014) test Closing Percent Quoted spread for US data and find that it performs better than Roll, Effective Tick, Gibbs and Zeros. The most comprehensive study is done by Fong, Holden and Trzcinka (2014). They calculate a variety of liquidity proxies including newest Closing Percent Quoted and High-Low proxy for forty three exchanges around the world and test the performance of these proxies by comparing with daily liquidity benchmarks calculated
Journal of Economics, Finance and Accounting – JEFA (2016), Vol.3(1) Guloglu, Ekinci
__________________________________________________________________________________ 246
from intraday data. They find that Closing Percent Quoted Spread and High-Low estimator show the best performance.
In our paper, we compare the performance of commonly used Roll (Roll, 1984), LOT Mixed (Lesmond, Ogden and Trzcinka, 1999), Effective Tick (Goyenko, Holden, and Trzcinka, 2009; and Holden, 2009), High-Low (Corwin and Schultz, 2012) and Closing Percent Quoted Spread (Chung and Zhang, 2014) proxies in an emerging market. Furthermore, we conduct our analysis on futures contracts. As stated above, while few studies test all these liquidity proxies’ performance for stocks, not much is known about liquidity proxies’ performance for futures contracts. An exception is Schestag et al (2016) who thoroughly compare liquidity proxies in US corporate bond market. They indicate that most low-frequency proxies based on daily data measure transaction costs well. Our study bears resemblance to this paper but we provide evidence on futures market from Turkey and our results partially differ.
In fact, we have a good reason for studying futures contracts rather than stocks. Tick sizes in Borsa Istanbul stock market are so high that the bid-ask spread is almost always one tick for most stocks and changes very rarely. So, we believe making such an analysis makes more sense in futures market rather than stock market in the case of Borsa Istanbul. Moreover, with this comprehensive assessment, we will have evidence from a different market perspective.
We test the performance of these daily low-frequency spread measures by comparing correlations and root mean square errors with our benchmark spread data that are collected intradaily for selected futures contracts. At daily frequency we expect the estimator to closely approximate spread benchmarks. However, results show that none of these low-frequency spread proxies comes out with a desirable approximation level. Yet, Effective Tick proxy appears to perform better than others in the presence of normal market conditions and captures the time series variation both for effective and quoted spreads. We conclude that better low-frequency effective spread proxies are needed.
The remainder of the paper is organized as follows. Section II explains the high-frequency spread benchmarks and low-frequency spread proxies. Section III describes the data and methodology. Section IV presents our empirical results, and Section V concludes.
2. SPREAD MEASURES This section presents high-frequency spread benchmarks and low-frequency spread proxies used in our research.
2.1. HIGH-FREQUENCY SPREAD BENCHMARKS Spread can be defined in several ways. Quoted spread is simply the difference between bid and ask prices at any time in the market. In its turn, effective spread is the difference between trading price and mid-point of the bid-ask spread (also called mid-price). Taking into account large transactions walking through the book, hidden orders or internalization of orders by market makers, effective spread usually is considered to be a more realistic indicator of market liquidity than quoted spread. Two of the most common measures of market liquidity are relative (percent) effective spread and relative quoted spread. These are defined below.
Let be the bid price, be the ask price, be the midpoint of the prevailing bid and ask quotes and be trade price at time . The percent effective and quoted spreads are defined as:
= 2 ∗ |( − )|/ (1)
= ( − )/ (2)
2.2. LOW-FREQUENCY SPREAD PROXIES Low-frequency spread proxies include Roll (Roll, 1984), LOT Mixed (Lesmond, Ogden and Trzcinka, 1999), Effective Tick (Goyenko, Holden, and Trzcinka, 2009; and Holden, 2009), High-Low (Corwin and Schultz, 2012) and Closing Percent Quoted Spread (Chung and Zhang, 2014). These are defined and discussed below.

Journal of Economics, Finance and Accounting – JEFA (2016), Vol.3(1) Guloglu, Ekinci
__________________________________________________________________________________ 247
2.2.1. ROLL Roll (1984) developed an estimator of the effective spread based on observed price changes. His effective spread estimation methodology depends on the idea that the true value of the stock price follows a random walk and in an efficient market the bid-ask spread fluctuates randomly around the true price. Thus, effective bid-ask spread can be inferred from the first-order serial covariance of price changes. Under these conditions, subsequent price changes yield negative expected autocorrelation. So, effective spread estimator is defined as follows:
Roll = 2 −Cov(∆P , ∆P ) (3)
When serial covariance is positive, the formula in equation (3) is undefined. So, this measure was modified by Goyenko et al. (2009) as follows.
Roll = 2 −Cov(∆P , ∆P ) /P0
(∆ ,∆ ) (∆ ,∆ ) (4)
Roll approach is attractive since it gives an estimate by using price data only. However, this model is criticized by researchers because its performance is poor when longer term data are used since the covariance of price changes is frequently positive for long term.
2.2.2. LOT MIXED Lesmond, Ogden and Trzcinka (1999) developed a new measure called LOT Mixed that depends on the relation between trading costs and observed stock returns. The authors argue that observed stock returns change due to buying and selling costs. The unobserved return of a stock j on day t (R∗ ) can be estimated by the following market model where R is the market return.
R∗ = β R + ε (5)
Let α < 0 denote the cost of selling and α > 0 the cost of buying. The observed return on day t is given by:
R =R∗ − α when R∗ < α0 when α < R∗ < αR∗ − α when R∗ > α
(6)
The LOT Mixed liquidity proxy is simply α − α .
Using these relations, they estimate cost parameters by maximizing the likelihood function of daily stock returns with respect to α , α , stock’s market sensitivity β and return volatility σ .
2.2.3. EFFECTIVE TICK Holden (2009) as well as Goyenko, Holden and Trzcinka (2009) jointly developed an effective spread proxy based on the observable price clustering. To calculate the effective spread, first, for each possible spread s , the probability of price clustering (F ) is calculated as follows.
F =∑
for j = 1,2, … , J (7)
where N is the number of the trades on prices corresponding to the j spread. Then, the unconstrained probability of the effective spread is defined as:
U =2F , j = 1
2F − F , j = 2,3, . . , J − 1F − F , j = J
(8)
Further, they add the following constraints to generate proper probabilities.

Journal of Economics, Finance and Accounting – JEFA (2016), Vol.3(1) Guloglu, Ekinci
__________________________________________________________________________________ 248
γ =Min Max U , 0 , 1 , j = 1
Min Max U , 0 , 1 − ∑ γ , j = 2,3, . . , J (9)
Finally, effective tick measure is simply the probability weighted average of each effective spread size divided by average price P as shown below.
Effective Tick =∑
(10)
2.2.4. HIGH-LOW SPREAD ESTIMATOR Corwin and Schultz (2012) proposed a new measure simply by using daily high and low prices. They state that daily high (low) prices are almost always buyer-initiated (seller-initiated) trades. Therefore, the ratio of the high to low prices reflects both the fundamental volatility of stock and its bid-ask spread. They add that variance component grows proportionally with time period while spread component does not. Thus, high-low ratios estimated over a two-day period should have a variance that is twice the variance over a one-day period. This fact helps them to create an innovative high-low spread. Their effective spread estimator is given as follows:
S = ( ) (11)
where
α =
√−
√ (12)
The beta (β) and gamma (γ) values in equation (12) are obtained from daily high and low prices and defined as:
β = ∑ [ln ] (13)
γ = [ln ,
,] (14)
where H , and L , are highest and lowest prices over a two-day period, respectively.
This low-frequency spread measure allows the study of liquidity over relatively long periods of time since only daily high and low prices are needed and these are easily available even in long-term historical data. The estimator is easy to calculate and the authors claim that it performs better than other spread proxies, i.e. it results in higher correlations with spread benchmarks. In their study, they state that this measure performs better in U.S. data than any other proxy. Further, the estimator is not limited to daily data but can be applied to intraday data when the quote data are unavailable or trades cannot be reliably matched with the quotes.
2.2.5. CLOSING PERCENT QUOTED SPREAD
Chung and Zhang (2014) suggest a percent-cost proxy called Closing Percent Quoted Spread using closing ask and bid prices. Their effective spread proxy is simply calculated as follows:
Closing Percent Quoted Spread = ( )( )/
(15)
The main criticism about this proxy is that it only considers the closing moment of the day leaving out all the intraday spread patterns.
3. DATA AND METHODOLOGY Using a sample of futures data from Borsa Istanbul Futures and Options Market (VIOP) through March 25 to August 25, 2014 (98 trading days), we first calculated our benchmarks. We work on three contracts: BIST 30 Index future contract (Index Future), USDTRY future contract (Currency Future) and USD/OUNCE Gold future

Journal of Economics, Finance and Accounting – JEFA (2016), Vol.3(1) Guloglu, Ekinci
__________________________________________________________________________________ 249
contract (Gold Future). These are the most heavily traded futures contracts and represent approximately %98 of trading at that time. In VIOP, contracts with three different expiration months are traded; we only take the nearest-to-maturity contracts since these are the most liquid.
VIOP is a fully automated market. It operates continuously from 9:15 am to 17:45 pm. A lunch break exists for equity derivatives from 12:30 to 13:55. As an example, there are on average 20,000 timestamp records daily for the index future. However, other contracts are not that liquid; only 3000 records for currency future exist on the same screen page and only 200 records for gold future.
We calculated effective and quoted bid-ask spreads from the tick-by-tick quote and transaction data as trades occur for 98 trading days from Thomson Reuters Eikon trade and quote screen page. We record data as trades occur and end up with 2,210,695 data points for index future contract, 196,161 data points for currency future contract and 18,131 data points for gold future contract. Our high-frequency dataset differs from periodic datasets since it relies on price observation drawn at variable time intervals.
In our analysis, we first constructed our high-frequency bid-ask spread benchmarks by calculating percent effective and quoted spreads1 from intraday data. At each moment of transaction in each contract, we determined quoted spread using Equation (2) and then calculated the time-weighted average for a day. The quoted spread is the implicit cost of trading when a trade occurs at the quoted price. In order to measure the spread beyond the quoted bid-ask prices, we also calculated the effective spread at each moment of transaction in each contract as shown in Equation (1) and then calculated the average effective spread for the day.
In addition to our high-frequency benchmarks, we calculated each low-frequency spread estimator mentioned in 2.2 (Roll, LOT Mixed, Effective Tick, High-Low and Closing Percent Quoted Spread).
Following the literature (Corwin & Schultz, 2012; Fong, Holden, & Trzcinka, 2014; Goyenko et al., 2009), we identified certain criteria in order to assess the measurement performance of the low frequency spread estimators. These are time series correlation (tested as well for significance2) and root mean square errors (RMSE).
4. FINDINGS AND DISCUSSIONS Table 1 provides the summary statistics for the estimators considered in this paper. For comparison purposes, Effective Spread and Quoted Spread (the benchmarks) are presented first. Simple average effective spreads are 0.0361%, 0.0352% and 0.1441% and time-weighted quoted spreads are 0.0281%, 0.0274%, 0.1019% for index, currency and gold futures, respectively. A comparison of the left and right sides of the table reveals that a majority of proxies underestimate effective and quoted spreads (for example, mean values of Roll, Effective Tick and High-Low respectively are 0.0137%, 0.0264% and 0.0168% in index futures while effective and quoted spreads are 0.0361% and 0.0281%, respectively). However, LOT Mixed and Closing Percent Quoted Spread overestimate index future spreads (0.0535% and 0.1772% vs. 0.0361%) and currency future spreads (0.0398% and 0.4849% vs. 0.0352%). For gold future, Lot Mixed largely underestimates spreads (0.0116% vs. 0.1441%) while Closing Percent Quoted Spread overestimates them (0.8305% vs. 0.1441%). In this preliminary analysis, out of all the proxies, the values of Effective Tick generally are the closest to the benchmarks.
1Note that percent quoted spread is based on displayed quotes, so it represents the hypothetical cost of trading. By contrast, percent
effective spread depends on the real trade price occurring in the market, so it represents the actual, round-trip-equivalent cost of trading to the investor. (See Holden 2014 and Holden et al. 2014) 2For an estimated correlation r, Groebner et al. (2008) propose in Chapter 14 testing the significance with t = where n is the sample
size.
Journal of Economics, Finance and Accounting – JEFA (2016), Vol.3(1) Guloglu, Ekinci
__________________________________________________________________________________ 250
In order to see the spread patterns over time, we plot in Figure 1 and Figure 2 daily effective and quoted spreads (the benchmarks) for the entire period. Both charts indicate that the level and the volatility of gold futures spreads are considerably higher than index and currency futures.
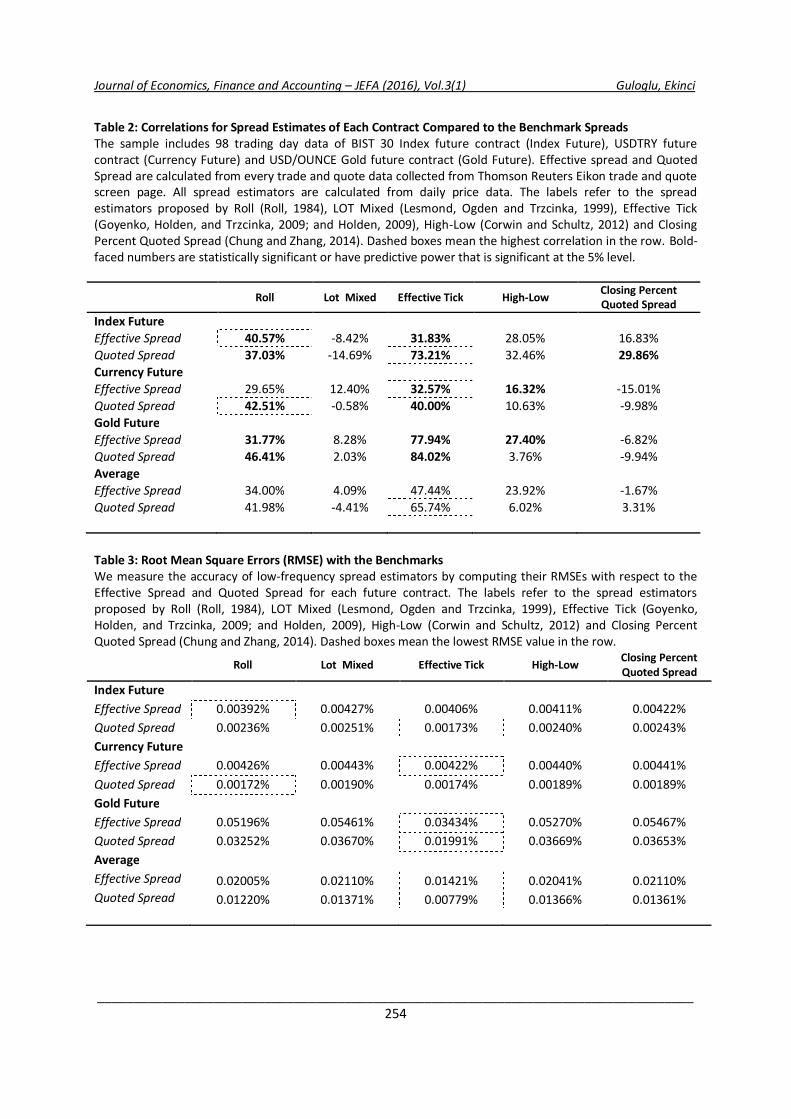
Table 2 presents results about the correlation between the benchmarks and the spread estimates. A clear result is that Effective Tick has the highest correlation coefficients in all the futures except one (the correlation coefficient between effective spread (respectively quoted spread) and Roll’s measure is 41% (43%)). Moreover, coefficients are fully significant in Effective Tick, partially significant in Roll and High-Low and almost insignificant in Closing Percent Quoted Spread and LOT Mixed proxies. The average coefficient of correlation between Effective Tick proxy and effective (quoted) spread benchmark is 47% (66%). This implies that Effective Tick is more successful in predicting quoted spread rather than effective spread. Another interesting result is the relatively low coefficients in currency futures. For instance, as far as quoted spread is concerned, the coefficients of Effective Tick are as high as 73% and 84% in index and gold futures, but only 40 % in currency futures.
The root mean square errors (RMSE) between the benchmarks and proxies that help determine whether the relevant proxy captures the level of the benchmark are given in Table 3. In general, Effective Tick has the lowest RMSE in all the futures indicating its relatively good performance. However, one should notice that there is a large gap between the RMSE of effective and quoted spreads. RMSE are very high in effective spreads compared to quoted spreads. Especially in currency futures, the performance of Effective Tick is not really different from the performance of other proxies.
Results show that none of the proxies is successful enough in estimating effective or quoted spread. This is in contrast to the evidence found by Schestag et al (2016). Nevertheless, under normal market conditions, Effective Tick appears to perform best. This evidence is in line with Goyenko, Holden, and Trzcinka (2009) comparative study while contradictory with Corwin and Schultz (2012) and Fong, Holden and Trzcinka (2014) comparative studies for stocks.
5. CONCLUSION Understanding market liquidity is critical for understanding market efficiency, functioning and stability. However, studying long-term dynamics of liquidity via bid-ask spreads requires extensive intraday datasets which are usually hard to obtain, especially for emerging markets and long periods. These large datasets bring about a computational burden as well. Thus, some easy-to-calculate proxies that capture the behavior of bid-ask spreads can facilitate this attempt.
In effect, measurement of bid-ask spread using alternative low-frequency data has recently become an interesting question in the literature. Our paper provides research on how one can precisely measure spreads if intraday data are not available. In this attempt, we calculate five daily low-frequency effective spread proxies that exist and most popularly used in the literature (Roll, LOT Mixed, Effective Tick, High-Low and Closing Percent Quoted Spread) and compare their performance. A good proxy should capture well the level and time-series variation of the actual intraday spread with some low-frequency data and computational ease. Each of these proxies has some advantages and disadvantages. For example, LOT Mixed proxy requires a computer-intensive process. For Roll measure, we need tick-by-tick price data which may be hard to obtain. Similarly, Effective Tick proxy requires estimations about intraday prices and intraday spreads. In their turn, High-Low and Closing Percent Quoted Spread proxies require simpler datasets and are easy to calculate. However they usually perform poorly.
Our investigation about the performance of these proxies on index, currency and gold futures trading on Borsa Istanbul Futures and Options Market (VIOP) yields interesting results. For example, Effective Tick proxy appears to perform better than others. More specifically, its correlation with time-weighted quoted spread is satisfactorily high as far as index and gold futures are concerned (73% and 84%, respectively) whereas as far as currency futures are concerned, the correlation falls to 40%. Moreover, the correlation coefficients in the relation between Effective Tick proxy and effective spread are 32%, 33% and 78% for index, currency and gold futures, respectively. Although all these correlations of Effective Tick are statistically significant, they are not

Journal of Economics, Finance and Accounting – JEFA (2016), Vol.3(1) Guloglu, Ekinci
__________________________________________________________________________________ 251
high enough to rely on as an indicator of liquidity. Generally speaking, the overall performance of other proxies is even weaker. The analysis of the root mean square errors (RMSE) points out to similar results.
Although controversial and highly criticized, Roll measure performs relatively well. Its correlations with the benchmarks are higher than LOT Mixed or Closing Percent Quoted Spread proxies and to a lesser extent High-Low proxy.
Results also show that the level and the volatility of gold futures spreads are higher than index and currency future spreads. This is not surprising since index and currency futures are much more liquid than gold futures.
In this study, our aim is to contribute to the literature by identifying the estimator that performs best in predicting actual spreads for futures market. We compare five proxies to the spreads calculated directly with high-frequency data. Our findings show that bid–ask spread estimates are thoroughly biased. Imprecise market liquidity estimates can create misinformation about actual spread dynamics. Thus, we conclude that one should be cautious in using these proxies proposed in the literature. Moreover, a detailed check is necessary about method suitability to market type, market specific regulations (e.g. tick size) and instrument-specific features before starting any study.
The most important direction for further research may be about finding more robust proxies of bid-ask spreads that work with low-frequency data and keeping computational ease. Besides, spread estimation for other markets may bring about different results.
ACKNOWLEDGEMENTS We thank Istanbul Technical University (ITU) Finance Lab for providing the data.
REFERENCES Bollerslev, T., & Melvin, M. 1994, “Bid—ask spreads and volatility in the foreign exchange market: An empirical analysis”, Journal of International Economics, 36(3), 355-372.
Chung, K. H., & Zhang, H. 2014, “A simple approximation of intraday spreads using daily data”, Journal of Financial Markets, 17(1), 94–120. Corwin, S. A., & Schultz, P. 2012, “A Simple Way to Estimate Bid-Ask Spreads from Daily High and Low Prices”, Journal of Finance, 67(2), 719–760.
Fong, K. Y. L., Holden, C. W., & Trzcinka, C. A. 2014, “What Are The Best Liquidity Proxies For Global Research?”, Indiana University Working Paper.
Goyenko, R. Y., Holden, C. W., & Trzcinka, C. A. 2009, “Do liquidity measures measure liquidity?”, Journal of Financial Economics, 92(2), 153–181.
Groebner, D. F., Shannon, P. W., Fry, P. C., & Smith, K. D. 2008, “Business Statistics: A Decision-Making Approach”, 7th Edition, Prentice-Hall.
Hasbrouck, J. 2004, “Liquidity in the futures pits: Inferring market dynamics from incomplete data”, Journal of Financial and Quantitative Analysis, 39, 305–326.
Hasbrouck, J. 2009, “Trading costs and returns for U.S. equities: Estimating effective costs from daily data”, Journal of Finance, 65, 1445-1477.
Holden, C. W. 2009, “New low-frequency spread measures”, Journal of Financial Markets, 12(4), 778–813.
Holden, C. W. 2014, “The Empirical Analysis of Liquidity”, Foundations and Trends in Finance, 8(4), 263–365.
Holden, C. W., & Jacobsen, S. 2014, “Liquidity measurement problems in fast, competitive markets: Expensive and cheap solutions”, Journal of Finance, 69(4), 1747–1785.
Lesmond, D., Ogden, J., & Trzcinka, C. A. 1999, “A New Estimate of Transaction Costs”, Review of Financial Studies, 12(5), 1113–41.
Lesmond, D. 2005, “Liquidity of emerging markets”, Journal of Financial Economics, 77(2), 411–452.
Madhavan, A. 2000, “Market microstructure: A survey”, Journal of Financial Markets, 3(3), 205–258.
Roll, R. 1984, “A Simple Implicit Measure of the Effective Bid-Ask Spread in an Efficient Model”, Journal of Finance, 39(4), 1127–1139.
Schestag, R., Schuster, P., & Uhrig-Homburg M. 2016, Measuring Liquidity in Bond Markets, Review of Financial Studies, 29-5, 1170-1219.

Journal of Economics, Finance and Accounting – JEFA (2016), Vol.3(1) Guloglu, Ekinci
__________________________________________________________________________________ 252
Figure 1: Effective Spread Pattern
The chart gives the daily percent average effective spread in index and currency futures (left axis) and gold futures (right axis).
Figure 2: Quoted Spread Pattern The chart gives the daily percent time-weighted quoted spread in index and currency futures (left axis) and gold futures (right axis).
0,00%
0,10%
0,20%
0,30%
0,40%
0,50%
0,60%
0,000%
0,010%
0,020%
0,030%
0,040%
0,050%
0,060%
0,070%
25.03.2014 25.04.2014 25.05.2014 25.06.2014 25.07.2014
Effective Spread
Index Future Currency Future Gold Future
0,00%
0,05%
0,10%
0,15%
0,20%
0,25%
0,000%
0,005%
0,010%
0,015%
0,020%
0,025%
0,030%
0,035%
0,040%
0,045%
25.03.2014 25.04.2014 25.05.2014 25.06.2014 25.07.2014
Quoted Spread
Index Future Currency Future Gold Future

Journal of Economics, Finance and Accounting – JEFA (2016), Vol.3(1) Guloglu, Ekinci
__________________________________________________________________________________ 253
Table 1: Summary Statistics of the Benchmark Spreads and Spread Proxies This table provides the summary statistics for the estimators considered in this paper. The sample includes 98 trading days data of BIST 30 Index future contract (Index Future), USDTRY future contract (Currency Future) and USD/OUNCE Gold future contract (Gold Future). In addition to Effective Spread and Quoted Spread, the labels refer to the estimators proposed by Roll (Roll, 1984), LOT Mixed (Lesmond, Ogden and Trzcinka, 1999), Effective Tick (Goyenko, Holden, and Trzcinka, 2009; and Holden, 2009), High-Low (Corwin and Schultz, 2012) and Closing Percent Quoted Spread (Chung and Zhang, 2014). Effective Spread is the percentage effective spread and Quoted Spread is time-weighted percentage quoted spread. Both are estimated from intraday trade and quote data. The Roll estimates are calculated by setting positive monthly autocovariance estimates to zero. The Effective Tick is based on the observable price clustering and is a function of the tick increment used in trade prices. LOT Mixed is estimated by maximizing the likelihood function of daily stock returns. High-Low estimator is calculated exactly as in Corwin and Schultz (2012) and Closing Percent Quoted Spread is calculated using daily closing ask and bid prices. Effective
Spread Quoted Spread
Roll LOT Mixed Effective Tick High-Low Closing Percent Quoted Spread
Index Future Mean 0.0361% 0.0281% 0.0137% 0.0535% 0.0264% 0.0168% 0.1772% Median 0.0353% 0.0276% 0.0132% 0.0506% 0.0259% 0.0158% 0.1506% Standard Deviation 0.0043% 0.0025% 0.0022% 0.0742% 0.0015% 0.0072% 0.1264% Range 0.0355% 0.0162% 0.0140% 0.7567% 0.0079% 0.0453% 0.9266% N 98 98 98 98 98 98 98 Currency Future Mean 0.0352% 0.0274% 0.0114% 0.0398% 0.0234% 0.2779% 0.4849% Median 0.0351% 0.0270% 0.0112% 0.0296% 0.0234% 0.2717% 0.4572% Standard Deviation 0.0044% 0.0019% 0.0044% 0.0378% 0.0003% 0.1158% 0.2454% Range 0.0218% 0.0094% 0.0284% 0.2401% 0.0018% 0.6703% 1.4349% N 98 98 98 98 98 98 98 Gold Future Mean 0.1441% 0.1019% 0.0389% 0.0116% 0.0710% 0.7377% 0.8305% Median 0.1327% 0.0976% 0.0407% 0.0096% 0.0651% 0.6878% 0.7827% Standard Deviation 0.0545% 0.0365% 0.0288% 0.0192% 0.0326% 0.3619% 0.4251% Range 0.3540% 0.1902% 0.1282% 0.1949% 0.1787% 2.4813% 2.2513% N 98 98 98 98 98 98 98
Journal of Economics, Finance and Accounting – JEFA (2016), Vol.3(1) Guloglu, Ekinci
__________________________________________________________________________________ 254
Table 2: Correlations for Spread Estimates of Each Contract Compared to the Benchmark Spreads The sample includes 98 trading day data of BIST 30 Index future contract (Index Future), USDTRY future contract (Currency Future) and USD/OUNCE Gold future contract (Gold Future). Effective spread and Quoted Spread are calculated from every trade and quote data collected from Thomson Reuters Eikon trade and quote screen page. All spread estimators are calculated from daily price data. The labels refer to the spread estimators proposed by Roll (Roll, 1984), LOT Mixed (Lesmond, Ogden and Trzcinka, 1999), Effective Tick (Goyenko, Holden, and Trzcinka, 2009; and Holden, 2009), High-Low (Corwin and Schultz, 2012) and Closing Percent Quoted Spread (Chung and Zhang, 2014). Dashed boxes mean the highest correlation in the row. Bold-faced numbers are statistically significant or have predictive power that is significant at the 5% level.
Roll Lot Mixed Effective Tick High-Low Closing Percent Quoted Spread
Index Future Effective Spread 40.57% -8.42% 31.83% 28.05% 16.83% Quoted Spread 37.03% -14.69% 73.21% 32.46% 29.86% Currency Future Effective Spread 29.65% 12.40% 32.57% 16.32% -15.01% Quoted Spread 42.51% -0.58% 40.00% 10.63% -9.98% Gold Future Effective Spread 31.77% 8.28% 77.94% 27.40% -6.82% Quoted Spread 46.41% 2.03% 84.02% 3.76% -9.94% Average Effective Spread 34.00% 4.09% 47.44% 23.92% -1.67% Quoted Spread 41.98% -4.41% 65.74% 6.02% 3.31% Table 3: Root Mean Square Errors (RMSE) with the Benchmarks We measure the accuracy of low-frequency spread estimators by computing their RMSEs with respect to the Effective Spread and Quoted Spread for each future contract. The labels refer to the spread estimators proposed by Roll (Roll, 1984), LOT Mixed (Lesmond, Ogden and Trzcinka, 1999), Effective Tick (Goyenko, Holden, and Trzcinka, 2009; and Holden, 2009), High-Low (Corwin and Schultz, 2012) and Closing Percent Quoted Spread (Chung and Zhang, 2014). Dashed boxes mean the lowest RMSE value in the row. Roll Lot Mixed Effective Tick High-Low Closing Percent
Quoted Spread Index Future Effective Spread 0.00392% 0.00427% 0.00406% 0.00411% 0.00422% Quoted Spread 0.00236% 0.00251% 0.00173% 0.00240% 0.00243% Currency Future Effective Spread 0.00426% 0.00443% 0.00422% 0.00440% 0.00441% Quoted Spread 0.00172% 0.00190% 0.00174% 0.00189% 0.00189% Gold Future Effective Spread 0.05196% 0.05461% 0.03434% 0.05270% 0.05467% Quoted Spread 0.03252% 0.03670% 0.01991% 0.03669% 0.03653% Average Effective Spread 0.02005% 0.02110% 0.01421% 0.02041% 0.02110% Quoted Spread 0.01220% 0.01371% 0.00779% 0.01366% 0.01361%


