Embed Size (px)
Citation preview

ORI GIN AL
A comparison of nanoindentation cell wall hardnessand Brinell wood hardness in jack pine(Pinus banksiana Lamb.)
Manon Vincent • Queju Tong • Nasko Terziev •
Geoffrey Daniel • Cecilia Bustos •
William Gacitua Escobar • Isabelle Duchesne
Received: 1 November 2012
� Her Majesty the Queen in Right of Canada as represented by the Service Canadiens des Forets 2013
Abstract Nanoindentation is a powerful tool for hardness testing on a very small
scale. Since the technique was first introduced for studying wood cell wall
mechanics, it has been integrated as an important tool for measuring the modulus of
elasticity and hardness of wood cell walls. In this study, hardness measured with
nanoindentation (nanohardness) was compared with hardness measured by the
standard Brinell test method (Brinell hardness) on jack pine (Pinus banksiana
Lamb.) wood. Nanoindentation was performed on both the S2 layer of the sec-
ondary cell wall and the middle lamella (ML) of early- and latewood fibers. Four
annual growth rings were studied. The influence of growth ring and initial spacing
on both measurements was analyzed. The relationship between Brinell hardness,
nanoindentation measurements, and average ring density was also studied. Results
suggest that Brinell- and nanohardness are controlled by different mechanisms and
factors. The location of nanohardness measurements (i.e., S2 layer or ML) also
M. Vincent (&)
Departement des sciences du bois et de la foret, Universite Laval,
Pavillon Gene-H.-Kruger, Quebec, QC G1K 7P4, Canada
e-mail: [email protected]
Q. Tong
Pulp, Paper and BioProducts, FPInnovations, Quebec, Canada
N. Terziev � G. Daniel
Department of Forest Products, Swedish University of Agricultural Sciences (SLU),
Uppsala, Sweden
C. Bustos � W. G. Escobar
Departamento de Ingenierıa en Maderas, Biomaterials and Nanotechnology Center (CBN),
Universidad del Bıo-Bıo, Concepcion, Chile
I. Duchesne
Natural Resources Canada, Canadian Forest Service, Canadian Wood Fibre Centre, Quebec,
QC G1V 4C7, Canada
123
Wood Sci Technol
DOI 10.1007/s00226-013-0580-5
influenced hardness differently. It was concluded that nanomeasurements are not an
exact representation of wood mechanical properties conducted at the macro level
because of the hierarchical structure of wood. The effect of other factors such as
moisture or wood extractive content may also need consideration.
Introduction
The wide range of wood products from construction materials to pulp and paper
products through wood–plastic composites requires an exhaustive understanding of
the wood properties at different scales (Jozsa and Middleton 1997). Recently, the
increased use of mathematical models in the applied and fundamental sciences
associated with high computational capability has led to an increasing need for
multi-scale modeling approach (Weinan and Engquist 2003). These new tools
should provide a better understanding of wood behavior resulting from the high
heterogeneity of wood components. In this respect, the development of new
technologies such as nanometer and micrometer technologies has brought new life
into studies of wood fiber properties (Yan 2001). Nanoindentation, an indentation
test at a very small scale, was first introduced for examination of wood cell wall
mechanics by Wimmer and Lucas (1997). Since then, several authors have used
this method not only to analyze the mechanical properties of wood cell walls
(Wimmer and Lucas 1997; Gindl and Gupta 2002; Tze et al. 2007), but also to
characterize the adhesive bond effect on cell wall properties in a defined area
(Konnerth and Gindl 2006) or to examine the effects of forest management
practices on wood micro-scale properties (Duchesne et al. 2011). The effects of
silviculture and site characteristics on wood properties, interpreted through their
effect on tree growth, are for example well documented (e.g., Jozsa and Middleton
1997; Debell et al. 2004; Kang et al. 2004; Makinen et al. 2005; Schneider et al.
2008; Auty 2011). As outlined above, wood property variations with growth rate
can be studied from different points of view as well as different scales, for
example differences in the type of wood produced—juvenile/mature wood
proportions (Zobel and Sprague 1998), heartwood/sapwood proportions (Yang
and Hazenberg 1992; Morling and Valinger 1999) or early-/latewood ratios, and
cell wall characteristics (microfibril angle, cellulose, and lignin content) (Lind-
strom et al. 1998; Koga and Zhang 2002; Jungnikl et al. 2008). It is hypothesized
that any change observed at the smallest scale should reflect to some extent a
change of wood properties at a larger level. In this study, the authors focused on
the estimation of cell wall hardness measured by nanoindentation and compared it
with hardness measured by macroindentation (specifically Brinell hardness) for
different growth rates of jack pine.
Previous nanoindentation studies have been conducted according to the
isotropic theory developed by Oliver and Pharr (1992) to determine the reduced
modulus of elasticity (MOEr) and hardness. This theory makes possible
determination of the MOEr of wood samples from initial elastic unloading.
However, this MOEr is lower than the expected longitudinal modulus (obtained
from single fiber tensile tests or model calculations), and concerns have been
Wood Sci Technol
123

raised about the theory (Gindl and Schoberl 2004; Jager et al. 2011). Jager et al.
(2011) therefore developed a model according to anisotropic indentation theory to
determine MOEr. This model appears promising since it includes additional
variables such as microfibril angle and elastic properties of cell walls. The
relationship between nano- and macro-indentation was also studied to understand
the mechanism of wood property modification at the microscopic level using
chemical treatments (Frihart et al. 2008; Moon et al. 2009; Konnerth et al. 2010).
Other studies explored correlations or the variations of the changes observed
between the measured hardness of the cell wall layer and the hardness of bulk
wood (Holmberg 2000; Gindl et al. 2004; Tze et al. 2007). To the authors’
knowledge, however, few studies have directly addressed the relationship between
the cell wall hardness measured using a nanoindenter and wood hardness measured
according to the standard method (Brinell hardness), specifically related to the
growth rate variations (Moon et al. 2006, 2009).
The aim of the study is to determine whether the changes that occurred with
growth rate variation that are noticeable with Brinell hardness partly result from
changes that occurred at smaller scale, or whether the correlation between
nanohardness (measured in cell wall constituent) and macro-hardness would vary
depending on growth rate, due to different changes occurring at different scale.
Materials and methods
Tree selection and sample preparation
This study was based on a 32-year-old Nelder spacing plot (Nelder 1962)
established in 1977 near Woodstock, New Brunswick, Canada. Half of the plot was
composed of jack pine (Pinus banksiana Lamb.), and the other half of the plot was
composed of white spruce (Picea glauca (Moench) Voss). Trees were planted at the
intersection of the radial lines and circular arches at an increasing spacing from
0.87 m 9 0.91 m (the innermost circular arc) to 3.5 m 9 3.66 m (the outermost
circular arc) (stand density from 12,600 to 780 trees/ha, respectively). A detailed
description of this Nelder plot and tree sampling can be found in Tong et al. (2013).
In this study, three initial spacings (IS) were selected, representing a common
practice spacing (2.2 m 9 2.3 m), narrow spacing (1.38 m 9 1.45 m), and
extremely wide spacing (3.5 m 9 3.65 m). In this study, ‘‘spacing’’ or ‘‘initial
spacing’’ refers to distance between trees, which determines stand density, i.e., the
number of tree per unit area. Two jack pine (JP) trees from each spacing were
sampled for nanoindentation experiments (Fig. 1) in 2009. For each tree, diameter
at breast height (dbh), tree height (H), and width and length of the living crown were
recorded (Table 1).
A 5-cm-thick disk was cut at stump height of each tree. From each disk, a
25-mm-wide (tangentially) slice was extracted from pith to bark in the northern
direction (Fig. 2). Each slice was sawn into three strips transversely. The top strip
was used for nanoindentation, the middle strip for macroindentation to measure
Brinell hardness, and the bottom strip for X-ray densitometry to obtain growth ring
Wood Sci Technol
123

density. The strips were then dried in a conditioning chamber for 7 days under slight
vacuum at 25 �C for 24 h and then with a gradual increase in temperature to 60 �C
to avoid drying defects.
White spruceJack pine
White spruceJack pine
Fig. 1 Nelder plot design andlocation of sample trees (Nelder1962). Trees are planted at theintersections of radial lines andcircular arches. Filled dotsrepresent the locations of sampletrees
Table 1 Summary statistics of sample jack pine trees by spacing
# row Spacing
(m 9 m)
Number
of trees
Mean dbh
(cm)
Mean
H (m)
Mean diameter
of live crown (m)
Mean length
of live crown (m)
6a 2.2 9 2.3 2 12.6 (0.8) 16.8 (0.6) 0.9 (0.2) 6.4 (1.6)
11 1.38 9 1.45 2 18 (1.4) 17.2 (1.3) 3.1 (0.4) 5.9 (1.1)
16 3.5 9 3.65 2 25.5 (3) 16.8 (1.7) 6.1 (1.6) 9.6 (0.1)
Mean values are followed by standard deviation in parenthesesa Innermost row
5 cm
2.54 cm
Radial Longitudinal
Tangential
X-ray densityBrinell Nanohardness
Fig. 2 A 5-cm-thick and 2.54-cm wide slice was sawn from the middle of each disk
Wood Sci Technol
123

Nanoindentation
Four growth rings formed in 1984, 1989, 1994, and 2001 of each strip were selected
to examine the hardness of the cell walls in early- and latewood. A 4 9 4 9 4 mm3
cube was cut from each growth ring in such a way that it contained the latewood of
the years of interest and the earlywood formed in the following years. For example,
the cube for 1984 contained latewood of 1984 and earlywood of 1985. This allows
for both earlywood and latewood contained in the same cube and avoids applying
nanoindentation on wood cells within earlywood to latewood transition zone. This
ensured that all rings were tested in the same manner, since some growth rings were
wider than the final smooth surface allowed in the nanoindenter. The wood cubes
were embedded in Spurr’s (Spurr 1969) epoxy resin according to the manufacturers’
protocol for hard resin. Following resin impregnation, samples were placed under
vacuum (1 h), the vacuum released (1 h), and the vacuum treated again. Finally, the
resin was heat polymerized at 70 �C for at least 12 h in an oven. The embedding
epoxy resin, once cured, provided mechanical support for microtome sectioning and
prevents wood cell walls from buckling during indentation. The resin-embedded
cubes were shaped into a truncated pyramid such that the bottom and top of the
pyramid were parallel to each other and perpendicular to the longitudinal axis. A
particular attention was paid to specimen preparation since it has been demonstrated
that fiber/fibril alignment is important and can significantly influence results and
scattering (Gindl et al. 2004; Konnerth et al. 2009; He and Swain 2011; Jager et al.
2011). The top surface of each truncated pyramid was leveled using a glass knife
and then cut with a rotary microtome (Leica RM2265) equipped with a diamond
knife to generate a smooth surface of 2 9 2 mm2 (Fig. 3). After conditioning for
24 h at 21 �C and 60 % relative humidity (11 % equilibrium moisture content) in
the room housing the nanoindenter, nanoindentation was performed using a
Hysitron TI 900 Tribo Indenter equipped with a cube corner tip to measure
nanohardness.
The standard Oliver–Pharr method was used to assess nanohardness using load
and area of contact for each individual nanoindentation. Two types of indenters
were tried for nanoindentation, i.e., cube Corner and Berkovich tip. The cube corner
tip is a three-side pyramid with mutually perpendicular faces arranged in geometry
like the corner of a cube. The centerline to face angle for this indenter is 34.38. In
Fig. 3 Truncated pyramid with2 by 2 mm of smooth transversesurface
Wood Sci Technol
123
preliminary tests, the cube corner and Berkovich tips gave the same information and
no significant differences in terms of hardness.
Before nanoindention, calibration was performed on quartz following procedures
recommended by the manufactures to ensure the accuracy of the measurements.
Axial nanoindentations were performed across the transverse surface of the
secondary cell wall (S2) and middle lamellae (ML) of both early- and latewood
fibers. A loading function was applied to load a peak force of 100 lN.
Nanohardness (GPa) was calculated as the ratio of the maximum load to the
projected contact area. To control the proper positioning of the indenter tip and
avoid edge effects (Jakes et al. 2008a, 2009), a dedicated incident light microscope
(509) mounted in the nanoindenter Hysitron TI900 was used to scan sample surface
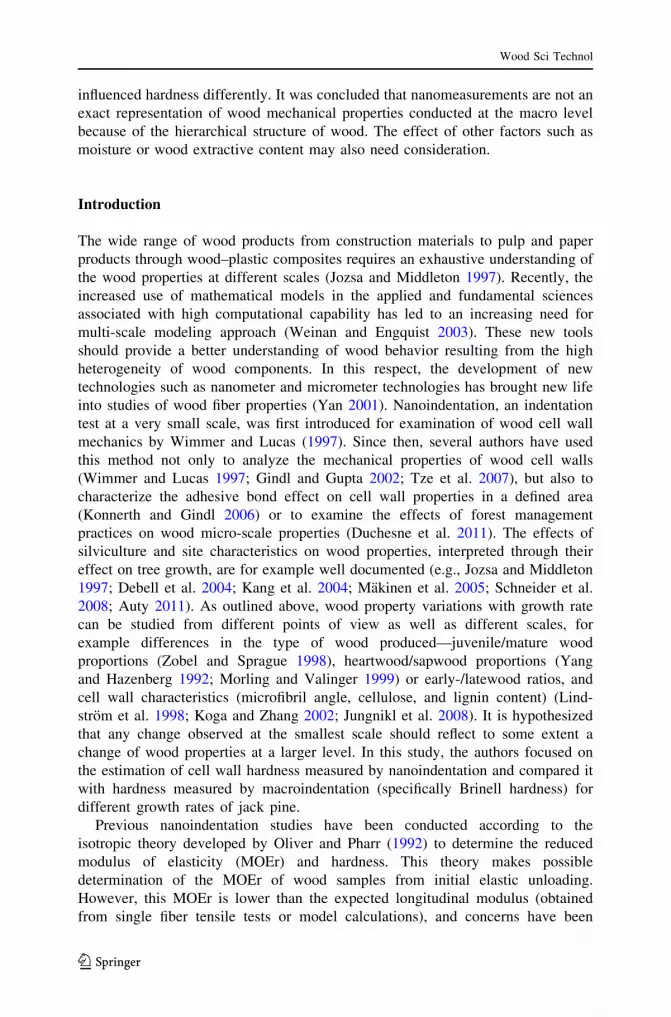
and locate proper spots for the indentation. This was followed by a probe scanning,
which revealed topographic surface of fibre cross section, and several points of
interest, 3–4 lm apart, were located and marked on the topographic images for
indentation (Fig. 4). After nanoindentation, a rescanning was performed to verify
the indentation positions. Nanohardness data measured at compromised positions,
i.e., positions too close to the edge of interested area (S2 layer and ML) as proposed
by Jakes et al. (2008a, 2009), or having significantly deviated from the marking
points, were discarded for analysis.
Brinell hardness and X-ray densitometry
Brinell hardness tests were conducted according to a modified Brinell hardness
method (Brinell ball of 11.3 mm in diameter on the end face—transverse section)
with adjustments according to ASTM D1037 and Green et al. (2006). Each wood
sample was cut into 13-mm-thick (longitudinally) and 25-mm-wide (tangentially)
slices with length (radius) depending on tree diameter. Tests were performed at
12 % moisture content by a universal testing machine (Shimadzu AG–X 50 KN).
The measurement accuracy was ±0.01 mm for position, ±0.1 % for speed, and
Fig. 4 a Topographic images showing the positions of indentations on the S2 layer of two adjacentearlywood tracheids of jack pine. Small open circles followed by numbers are designated indentationpositions, showing the relationships with actual positions of indentation (triangular shape); b 3D view ofa nanoindentation on S2 layer of three adjacent latewood tracheids of jack pine
Wood Sci Technol
123

±0.5 % for loading. The Brinell hardness test was conducted on the same rings
(1984, 1989, 1994, and 2001) as for nanoindentation. The geometric center of each
ring was first identified to correspond to the impact point of the Brinell ball. Loading
rate was 4 mm/min, and hardness was measured as the ball penetration, i.e.,
displacement under a load of 1,500 N. A large displacement implies a low Brinell
hardness, and vice versa.
For X-ray analyses, a small strip was cut from the corresponding strip to yield a
1.57-mm-thick (longitudinally) sample using a special saw table adapted for precise
cutting. Sawn strips were scanned by an X-ray densitometer (QTRS-01X, Quintek
Measurement Systems, Knoxville, Tennessee) in air-dry conditions. Ring density
was used as one of the independent variables to explain Brinell hardness variations.
Statistical analyses
Brinell hardness variations were analyzed with three-factor ANOVA using
restricted maximum likelihood estimation (REML). A mixed model with tree
(TREE) as random factor and calendar year (YEAR, four levels) and initial spacing
(IS, three levels) as fixed factors was built. Displacement (DISPL, mm), which is
inversely proportional to Brinell hardness (GPa), was the independent variable.
Similar analyses were done to test the effect of year, IS, and wood type (W;
earlywood or latewood) on nanohardness in the middle lamella and S2 layer.
Treatment means were compared using Bonferroni’s test. In addition, Brinell
hardness (GPa) calculated as the ratio of the maximum load to projected area was
compared with nanohardness.
A regression analysis was performed to describe the Brinell hardness as simply as
possible in order to explain the relationship between Brinell- and nanohardness.
Five independent variables were used to find a fitting model for the studied variable
DISPL (hardness at macro-scale) in relation to hardness on earlywood middle
lamella (HEWML), hardness on latewood middle lamella (HLWML), hardness on
earlywood S2 layer (HEWS2), hardness on latewood S2 layer (HLWS2), and
average ring density (average RD). The Durbin–Watson test was performed to
detect the presence of first-order correlation in the residuals. Null hypothesis (H0: no
first-order correlation between explicative variables) was not rejected according to
the Durbin–Watson table (d = 1.87, dL = 0.90, and dU = 1.92) (Durbin and
Watson 1951). The stepwise method was used to select the variables to be included
in the final model. Finally, the form of the variables in the final model was
determined with the partial residuals.
Results
Variation of Brinell hardness with initial spacing and year
Figure 5 shows displacement variations with IS. Brinell hardness increased with
cambial age, whereas it decreased with increasing IS. DISPL decreased from 1.7
Wood Sci Technol
123

(±0.2) mm to 1.3 (±0.3) mm from 1984 to 2001 and varied from 1.39 (±0.08) mm
to 1.74 (±0.17) mm with decreasing in initial spacing.
The variability of Brinell hardness between years tends to be greater for high
stand density (narrow IS) than for low stand density (wide IS) (Fig. 5).
Table 2 outlines ANOVA results for Brinell hardness. The effect of YEAR was
the only factor that significantly affected DISPL (Table 2, p = 0.0063). The
interaction IS 9 YEAR was nonsignificant on DISPL (p = 0.0828).
The Bonferroni test showed a significantly higher DISPL in 1984 and 1989 than
in 2001. This implies that wood has a higher hardness on ring formed in 2001 than
that formed in 1984 and 1989.
Comparison with hardness measured by nanoindentation
Figure 6 shows nanohardness variations with YEAR on A) earlywood middle
lamella (HEWML), B) latewood middle lamella (HLWML), C) earlywood S2 layer
(HEWS2), and D) latewood S2 layer (HLWS2). In the middle lamella,
Fig. 5 Displacement (DISPL)variations with initial spacing(IS) for the 4 years (YEARS).1984, 1989, 1994, and 2001refer to calendar years. Treeswere 32-year old when sampledin 2009
Table 2 ANOVA results for Brinell hardness (fixed effects) measured as DISPL (mm)
Source df F Pr [ F LSmeana
IS 2 6.40 0.0828
YEAR 3 8.10 0.0063 84 and 89 [ 01
IS 9 YEAR 6 0.82 0.5831
IS initial spacing (m 9 m), YEAR for calendar years, LSmean least square meana 84, 89, 94, and 01 refer to calendar years 1984, 1989, 1994, and 2001. The plantation occurred in 1977,
and trees were harvested in 2009. Where effects are significant, means were compared using Bonferroni’s
test. Significant levels were adjusted according to the number of comparisons
Wood Sci Technol
123

nanohardness on earlywood (HEWML) varied from 0.273 to 0.395 GPa and on
latewood (HLWML) from 0.264 to 0.412 GPa. In the S2 layer, nanohardness on
earlywood (HEWS2) varied from 0.234 to 0.301 GPa and on latewood (HLWS2)
from 0.235 to 0.334 GPa. The effect of IS on nanohardness variation is not clear
according to Fig. 6, specifically because nanohardness measured on trees from
intermediate IS (2.2 9 2.3) does not evolve similarly to the others (Fig. 6a–c).
Table 3 outlines the ANOVA results for nanohardness obtained for both ML and
S2 layer. No significant effect of IS on nanohardness for the middle lamella (ML)
(p = 0.53) or for the S2 layer (p = 0.14) was observed. YEAR showed a significant
effect on nanohardness for ML (p = 0.03). Nanohardness on ML was higher in
rings formed in 1984 and 1989 than in 2001. Although not significantly different
between cambial ages, a decreasing trend with calendar year can be observed in
Fig. 6 Nanohardness variations with calendar year (YEAR) for three initial spacings (IS) on a earlywoodmiddle lamella (HEWML), b latewood middle lamella (HLWML), c earlywood S2 layer (HEWS2), andd latewood S2 layer. 1984, 1989, 1994, and 2001 refer to calendar years. Plantation was in 1977, and treesharvested in 2009
Wood Sci Technol
123

nanohardness measured in S2 layer (Fig. 6c, d). A decreasing trend of nanohardness
was observed from pith to bark for both the ML and S2 layers. While wood type had
no significant effect, it may affect the S2 layer nanohardness differently in different
initial spacings and cambial ages, as shown by the nearly significant interaction
effect (p = 0.06, Table 3).
YEAR has an inverse effect on Brinell hardness and nanohardness in the middle
lamella, while YEAR did not significantly affect nanohardness in the S2 layer.
Moreover, IS did not affect nano- or Brinell hardness.
When DISPL data (mm) are transformed into hardness in GPa by dividing the
load (1,500 N) by the projected area, the resulting hardness appears 10 times lower
than average hardness of S2 and ML obtained through nanoindentation (average
values of 0.029 ± 0.005 vs. 0.297 ± 0.034 GPa, respectively).
Correlation between Brinell hardness, nanohardness, and ring density
According to the stepwise selection, only nanohardness measured on latewood
(HLWML and HLWS2) and average RD were included in the final model. Indeed,
multicolinearity was found between nanohardness measured on early- and latewood,
but not between average RD and nanohardness. The model is presented below (Adj
R2 = 0.77, p = 0.002):
DISPL ¼ �0:17� 11:9HLWMLþ 24:66HLWML2 þ 34:53HLWS2
� 72:43HLWS22 � 0:0022AVRD
The main part of variation in DISPL was explained by average RD (AVRD, partial
R2 = 0.48), while HLWS2 and HLWML explained an additional 19 and 14 % of
the variations in DISPL, respectively.
Figure 7 represents the effect of each independent variable on DISPL
(Y) according to the final model. For each graph, one independent variable was
isolated, while the two others were set as constants equal to their mean values.
Table 3 ANOVA results for nanohardness (fixed effects)
Effect df Middle lamella S2 layer
F value p value LSmeana F value p value LSmeana
IS 2 0.81 0.53 2.37 0.14
YEAR 3 4.60 0.03 84 and 89 [ 01 2.44 0.11
IS 9 YEAR 6 1.40 0.32 0.61 0.72
Wood (W) 1 0.03 0.87 0.02 0.90
IS 9 W 2 0.45 0.65 3.57 0.06
YEAR 9 W 3 0.48 0.71 3.20 0.06
IS 9 YEAR 9 W 6 0.92 0.52 2.93 0.06
IS initial spacing (m 9 m), YEAR is for calendar years, Wood is for earlywood and latewooda 84, 89, 94, and 01 refer to calendar years 1984, 1989, 1994, and 2001. The plantation occurred in 1977,
and trees were harvested in 2009. Where effects are significant, means were compared using Bonferroni’s
test. Significant levels were adjusted according to the number of comparisons
Wood Sci Technol
123

According to the model, DISP decrease with HLWS2, whereas it is positively
affected with HLWML. Regarding average RD, it evolves in opposition to DISPL,
which is not surprising since Brinell hardness increases with ring density.
Discussion
Comparison between Brinell hardness and nanohardness
It is well accepted that mechanical properties such as hardness are closely
correlated with ring density, which is in turn correlated with fiber dimensions such
as cell wall thickness to lumen ratio (Bendtsen 1978; Jozsa and Middleton 1997)
that are partly dependent on growth conditions (Kang et al. 2004; Savva et al.
2010). In softwood species, changes in growth conditions usually lead to a
variation in earlywood–latewood proportions (e.g., Koga and Zhang 2002;
Alteyrac et al. 2005). The fact that wood density explained a major part of
variance in the regression equation and further confirms the important roles that
wood density plays in Brinell hardness.
The fact that Brinell hardness seems mainly influenced by wood density contrasts
with the decrease in nanohardness with YEAR. This variation may be due to a
variation of the S2 layer and the ML properties independent of early-/latewood cell
wall characteristics (Table 3) (i.e., variations in cellulose microfibrillar arrangement
and crystallinity, and the chemical composition of the S2 layer). Similar results
were found by Huang et al. (2012) who studied nanohardness on compression and
opposite wood cell walls of Masson pine (Pinus massoniana Lamb.). The authors
found that in mature conifer wood, nanohardness was not affected by cell wall
thickness.
A variation that occurs with year is likely due to the transition from juvenile to
mature wood and the difference between heartwood and sapwood. Keith and
(B) y~HLWML (C) y~HLWS2(A) y~DISPL
HLWML (GPa)
0,20 0,25 0,30 0,35 0,40 0,45
HLWS2 (GPa)0,20 0,22 0,24 0,26 0,28 0,30 0,32 0,34 0,36
AverageRD (kg/m³)
350 400 450 500 550 600 650 700 750
y
0,8
1,0
1,2
1,4
1,6
1,8
2,0
2,2
2,4
yDISPL
Fig. 7 Effect of individually studied variables displacement (DISPL, mm). a Ring density (average RD,kg/m3). b Hardness of latewood middle lamella (HLWML, GPa) and c hardness of S2 layer (HLWS2,GPa). Variable transformations were chosen according to partial residuals. The solid line in the figure isthe regression line of the variable of interest while keeping other variables constant (average). The scatterplots represent the measured values of DISPL
Wood Sci Technol
123

Chauret (1988) found a decrease in the extractive content from both juvenile to
mature wood and heartwood to sapwood in European larch (Larix deciduas Mill.).
This variation has also been observed for other wood species (Campbell et al. 1990;
Jozsa and Middleton 1997). It could imply that the different properties are measured
in nano- and Brinell hardness since the main difference between latewood and
earlywood detected by Brinell hardness variation is related to cell dimensions
(lumen, cell wall). Yet, the density of dry wood cell walls is reported to be relatively
constant at 1,500 kg/m3 (Shmulsky and Jones 2011), regardless of wood type
(earlywood/latewood) cell wall characteristics are modified during tree growth
along the year. The main parameter, which is known to evolve with year in S2 layer,
is the microfibril angle (MFA) of the S2 layer (Bergander et al. 2002). While the
relationship between MFA and MOEr measured with nanoindentation is well known
(Gindl et al. 2004; Gindl and Schoberl 2004; Konnerth et al. 2009, 2010), that
relationship between MFA and nanohardness is less clear and apparently not as
strong (Tze et al. 2007; Konnerth et al. 2009; Meng 2010; Huang et al. 2012). In
conifers, however, it was shown that the MFA0s was large in the juvenile wood and
small in the mature wood (Donaldson 2008). If MFA was the only parameter
affecting nanohardness, one should therefore see an increase in S2 nanohardness
with age (Tze et al. 2007; Donaldson 2008; Auty et al. 2013). A positive increase in
MFA with ring width was found in Scots and radiata pines (Lasserre et al. 2009;
Auty et al. 2013) that lead to a decrease in nanohardness of S2 layer with increasing
spacing. Different studies have shown nanohardness values from juvenile to mature
wood.
The values of nanohardness observed in this study are similar or lower than those
reported for other pine species. Some studies also reported a similar trend of
nanohardness variation with cambial age. For instance, in opposite latewood of
Masson pine, Huang et al. (2012) found that at breast height, nanohardness varied
from 0.5317 GPa for ring number 2 to 0.5216 GPa for ring number 24 (average
value for 6 rings 0.4868 GPa). In loblolly pine in samples from year ring 2 to 50,
taken at 0.3 m above ground, nanohardness varied from 0.53 to 0.42 GPa (average
value 0.4556) with a mean in juvenile wood of 0.50 (ring 2 and 9) in latewood cell
walls (Tze et al. 2007). Both studies showed a decreasing trend of nanohardness
values with increasing cambial age, which is consistent with this study. Average
nanohardness of 0.38 and 0.358 GPa was also reported for ponderosa pine
(Ponderosa pine) (Frihart et al. 2008; Jakes et al. 2008b) and radiate pine (Moon
et al. 2009), respectively. These values are similar to those presented in this study.
Another variation that occurs during wood formation is the formation of heart-
and sapwood which differs in density, chemical composition, and mechanical
properties (Sellin 1994). The main difference between these two types of wood is
the extractive content that increases in heartwood. Despite difficulties in accurately
determining the micro-distribution of extractives in situ, the presence of extractives
impregnated in the cell wall structure has been demonstrated. Extractives can form
coatings on the cell wall and on pits and can penetrate the cell wall itself (Taylor
et al. 2002). Some authors report a variation in heart-/sapwood proportion with
growth rate, but the results are somehow contradictory. An increase in sapwood
width was observed with growth rate and tree diameter in Norway spruce (Picea
Wood Sci Technol
123

abies (L.) Karst) and Scots pine (Sellin 1994; Morling and Valinger 1999), while
Gominho and Pereira (2000) observed a positive correlation between heartwood
content and growth rate in young eucalyptus (Eucalyptus globulus Labill).
However, only heart-/sapwood volumes were affected by growth rate and not the
number of rings of each type of wood. If nanohardness differed between heart- and
sapwood cell walls, it could also explain why no differences between nanohardness
values were observed with growth rate variation since the samples of this study
showed no evidence of heartwood at 32 years.
The model here suggests that nanohardness in the S2 layer affects Brinell
hardness inversely to nanohardness in the ML. This may be explained in terms of
the chemical composition of the ML and S2 because ML has a higher lignin content
compared with S2 layer, while S2 has low lignin concentration and high cellulose
concentration (Wimmer and Lucas 1997). Regarding the S2 layer, a positive
relationship was found between nano- and Brinell hardness, while the opposite
relationship was observed for ML.
Significance of nanohardness measurements
Nanohardness was about ten times higher than Brinell hardness. This result is
consistent with the literature on soft- and hardwoods (Moon et al. 2009; Konnerth
et al. 2010, respectively). It can be explained through differences in woody material
volume fraction within the indentation interaction volume. For nanoindentation, this
is the cell wall material (without lumen) that is indented, while for the Brinell
hardness, the interaction volume is composed of several wood cells, including
lumens that provoke lower material density. Moreover, while buckling is avoided
during nanoindentation because the sample is embedded in epoxy resin, for Brinell
hardness (Tze et al. 2007), it is one of the first failure modes that occurs in
compression.
As two different methods, nano- and Brinell hardness measurements, are not
supposed to be equivalent, as mentioned in the Materials and methods, some
characteristics of nanohardness such as the form of the indent are important and the
cube corner can influence nanohardness results. While Brinell hardness is performed
with a Janka Ball, it was demonstrated that the form of the indent influences
nanohardness values (Fischer-Cripps 2000; Gindl and Schoberl 2004; Konnerth
et al. 2009). In this study, Brinell hardness was overestimated compared with
nanohardness. Indeed, hardness was assessed from the Brinell test by assuming the
total displacement defines the contact area. In contrast, in nanoindentation, the
resulting plastic depth is used with a predetermined area function to define contact
area. These differences, however, do not induce variations in nano- or Brinell
hardness evolution with cambial age or growth rate, but induce a bias in presented
values. Apparently, nanohardness values have to be interpreted with caution. It was
recently demonstrated in loblolly pine (Pinus taeda L.) (Meng 2010) that
nanohardness on non-resin-embedded samples was significantly lower (i.e., 32 %)
than that of samples embedded with epoxy resin.
Based on the literature, the nanohardness variation in S2 layer did not evolve as it
should be if it was influenced by microfibril angle (Donaldson 2008; Auty et al.
Wood Sci Technol
123

2013). Moreover, despite not being identical, the nanohardness in the S2 layer and
in the ML evolves similarly with cambial age and was not affected by inter-tree
spacing. This result agrees with the suggestion of authors that observed no
relationship between nanohardness and MFA (Gindl et al. 2002, 2004; Konnerth
et al. 2009), but rather function of matrix properties governed by hemicelluloses and
lignin.
Conclusion
The effect of growth rate controlled by silvicultural practices on the type of wood
produced is particularly important with regard to allocation of timber according to
end-use properties. Since nanohardness does not seem to be affected by such
changes, its use as a unique predictor of macro-hardness may be questioned. Indeed,
the relationship that exists by nature between nano- and macro-hardness may vary
with growth conditions. Although it is known that Brinell hardness was indirectly
influenced by the early-/latewood ratio because of the wall anatomy of the cell
types, the nanohardness of early- and latewood cell walls do not seem to be
different. However, according to the results of this study, variations in nanohardness
properties are induced by the changes that occur in the composition of the S2 layer
and middle lamella with age, and nanohardness measurements show other
characteristics that may influence the bulk properties that should be considered. It
could be a useful tool to integrate in mechanistic models to enhance prediction
precision.
Acknowledgments This study was supported by ForValueNet and NSERC (the Natural Sciences and
Engineering Research Council of Canada) Strategic Network. We would like to thank Michel Beaudoin,
Universite Laval, and Michele Bernier-Cardou, Canadian Forest Service, for their constructive and
critical comments that helped to improve the manuscript; Luciane Paes Torquato at Universite Laval,
and Katherine Concha and Paulina Valenzula at the Universidad del Bıo-Bıo for their nanoindentation
work. We also thank Alain Cloutier and Alexis Achim at Universite Laval for providing the opportunity
for this study. Finally, special thanks are due to Denis Belley at Universite Laval and Edwin Swift and his
team at the Canadian Wood Fibre Centre in New Brunswick for the fieldwork.
References
Alteyrac J, Zhang SY, Cloutier A, Ruel JC (2005) Influence of stand density on ring width and wood
density at different sampling heights in black spruce (Picea mariana (Mill.) BSP). Wood Fiber Sci
37(1):83–94
Auty D (2011) Modelling the effects of forest management on the wood properties and branch
characteristics of UK-grown Scots pine. PhD thesis, University of Aberdeen
Auty D, Gardiner BA, Achim A, Moore JR, Cameron AD (2013) Models for predicting microfibril angle
variation in Scots pine. Ann For Sci 70(2):209–218. doi:10.1007/s13595-012-0248-6
Bendtsen BA (1978) Properties of wood from improved and intensively managed trees. For Prod J
28(10):61–72
Bergander A, Brandstrom J, Daniel G, Salmen L (2002) Fibril angle variability in earlywood of Norway
spruce using soft rot cavities and polarization confocal microscopy. J Wood Sci 48(4):255–263
Campbell A, Kim W-J, Koch P (1990) Chemical variation in lodgepole pine with sapwood/heartwood,
stem height, and variety. Wood Fiber Sci 22(1):22–30
Wood Sci Technol
123

Debell DS, Singleton R, Gartner BL, Marshall DD (2004) Wood density of young-growth western
hemlock: relation to ring age, radial growth, stand density, and site quality. Can J For Res
34(12):2433–2442
Donaldson L (2008) Microfibril angle: measurement, variation and relationships: a review. IAWA J
29(4):345–386
Duchesne I, Tong T, Torquatos LP, Escobar WG, Bustos C, Achim A, Concha K, Cloutier A (2011)
Impact of spacing on modulus of elasticity and hardness of jack pine cell walls. Paper presented at
the 2011 Annual Meeting of the International Academy of Wood Science, Stockholm, Sweden
Durbin J, Watson GS (1951) Testing for serial correlation in least squares regression II. Biometrika 38(1/
2):159–177
Fischer-Cripps AC (2000) A review of analysis methods for sub-micron indentation testing. Vacuum
58(4):569–585
Frihart CR, Yelle DJ, Ralph J, Moon RJ, Stone DS, Jakes JE (2008) Enhanced understanding of the
relationship between chemical modification and mechanical properties of wood ‘‘Innovation and
Challenges in Biobased Composites: How Far to the New Frontier?’’ In: Csiro, Scion (eds) 9th
Pacific rim biobased composites symposium. Rotorua, New Zealand, pp 141–147
Gindl W, Gupta HS (2002) Cell-wall hardness and Young’s modulus of melamine-modified spruce wood
by nano-indentation. Compos A Appl Sci Manuf 33(8):1141–1145
Gindl W, Schoberl T (2004) The significance of the elastic modulus of wood cell walls obtained from
nanoindentation measurements. Compos A Appl Sci Manuf 35(11):1345–1349
Gindl W, Gupta HS, Grunwald C (2002) Lignification of spruce tracheid secondary cell walls related to
longitudinal hardness and modulus of elasticity using nano-indentation. Can J Bot 80(10):
1029–1033
Gindl W, Gupta HS, Schoberl T, Lichtenegger HC, Fratzl P (2004) Mechanical properties of spruce wood
cell walls by nanoindentation. Appl Phys A Mater Sci Process 79(8):2069–2073
Gominho J, Pereira H (2000) Variability of heartwood content in plantation-grown Eucalyptus globulus
Labill. Wood Fiber Sci 32(2):189–195
Green DW, Begel M, Nelson W (2006) Janka hardness using nonstandard specimens. Research Note
FPL-RN-0303. US Department of Agriculture, Forest Service, Forest Products Laboratory. Madison,
WI, Madison, WI
He LH, Swain MV (2011) 3.306—Microindentation. In: Ducheyne P (ed) Comprehensive biomaterials.
Elsevier, Oxford, pp 75–90. ISBN 978-0-08-055294-1
Holmberg H (2000) Influence of grain angle on Brinell hardness of Scots pine (Pinus sylvestris L.). Holz
Roh- Werkst 58(1–2):91–95
Huang YH, Fei BH, Yu Y, Wang SQ, Shi ZQ, Zhao RJ (2012) Modulus of elasticity and hardness of
compression and opposite wood cell walls of masson pine. Bioresources 7(3):3028–3037
Jager A, Bader T, Hofstetter K, Eberhardsteiner J (2011) The relation between indentation modulus,
microfibril angle, and elastic properties of wood cell walls. Compos A Appl Sci Manuf 42:677–685
Jakes JE, Frihart CR, Beecher JF, Moon RJ, Stone DS (2008a) Experimental method to account for
structural compliance in nanoindentation measurements. J Mater Res 23(4):1113–1127
Jakes JE, Stone DS, Frihart CR (2008b) Nanoindentation methods for wood: adhesive bond lines. Paper
presented at the proceedings 31st annual Meeting of the Adhesion Society, Inc., Austin, TX, 2008
February 17–20
Jakes JE, Frihart CR, Beecher JF, Moon RJ, Resto PJ, Melgarejo ZH, Suarez OM, Baumgart H, Elmustafa
AA, Stone DS (2009) Nanoindentation near the edge. J Mater Res 24(3):1016–1031
Jozsa LA, Middleton GR (1997) Les caracteristiques determinant la qualite du bois: nature et
consequences pratiques. Publication speciale SP-34F, Forintek Canada Corp. edn. Forintek Canada
Corp., Sainte-Foy
Jungnikl K, Koch G, Burgert I (2008) A comprehensive analysis of the relation of cellulose microfibril
orientation and lignin content in the S2 layer of different tissue types of spruce wood (Picea abies
(L.) Karst). Holzforschung 62(4):475–480
Kang KY, Zhang SY, Mansfield SD (2004) The effects of initial spacing on wood density, fibre and pulp
properties in jack pine (Pinus banksiana Lamb.). Holzforschung 58(5):455–463
Keith CT, Chauret G (1988) Basic wood properties of European larch from fast-growth plantations in
eastern Canada. Can J For Res 18(10):1325–1331
Koga S, Zhang SY (2002) Relationships between wood density and annual growth rate components in
balsam fir (Abies balsamea). Wood Fiber Sci 34(1):146–157
Wood Sci Technol
123

Konnerth J, Gindl W (2006) Mechanical characterisation of wood-adhesive interphase cell walls by
nanoindentation. Holzforschung 60(4):429–433
Konnerth J, Gierlinger N, Keckes J, Gindl W (2009) Actual versus apparent within cell wall variability of
nanoindentation results from wood cell walls related to cellulose microfibril angle. J Mater Sci
44(16):4399–4406
Konnerth J, Eiser M, Jager A, Bader TK, Hofstetter K, Follrich J, Ters T, Hansmann C, Wimmer R (2010)
Macro- and micro-mechanical properties of red oak wood (Quercus rubra L.) treated with
hemicellulases. Holzforschung 64(4):447–453
Lasserre JP, Mason EG, Watt MS, Moore JR (2009) Influence of initial planting spacing and genotype on
microfibril angle, wood density, fibre properties and modulus of elasticity in Pinus radiata D. Don
corewood. For Ecol Manag 258(9):1924–1931
Lindstrom H, Evans JW, Verrill SP (1998) Influence of cambial age and growth conditions on microfibril
angle in young Norway spruce (Picea abies [L.] Karst.). Holzforschung 52(6):573–581
Makinen H, Hynynen J, Isomaki A (2005) Intensive management of Scots pine stands in southern
Finland: First empirical results and simulated further development. For Ecol Manag 215:37–50
Meng Y (2010) Methods for characterizing mechanical properties of wood cell walls via nanoindentation.
University of Tennessee, Knoxville
Moon RJ, Frihart CR, Wegner T (2006) Nanotechnology applications in the forest products industry.
Forest Prod J 55(5):4–10
Moon RJ, Jakes JE, Beecher JF, Frihart CR, Stone DS (2009) Relating nanoindentation to
macroindentation of wood. In: Hse C-Y, Jiang Z, Kuo M-L (eds) Advanced biomass science and
technology for bio-based products, Beijing, China, 2009. Chinese Academy of Forestry & USDA
Forest Service, Southern Research Station, pp 145–159
Morling T, Valinger E (1999) Effects of fertilization and thinning on heartwood area, sapwood area and
growth in Scots pine. Scand J For Res 14(5):462–469
Nelder JA (1962) New kinds of systematic designs for spacing experiments. Biometrics 18(3):283–307
Oliver WC, Pharr GM (1992) An improved technique for determining hardness and elastic modulus using
load and displacement sensing indentation experiments. J Mater Res 7(6):1564–1583
Savva Y, Koubaa A, Tremblay F, Bergeron Y (2010) Effects of radial growth, tree age, climate, and seed
origin on wood density of diverse jack pine populations. Trees Struct Funct 24(1):53–65
Schneider R, Zhang SY, Swift DE, Begin J, Lussier JM (2008) Predicting selected wood properties of
jack pine following commercial thinning. Can J For Res 38(7):2030–2043
Sellin A (1994) Sapwood-heartwood proportion related to tree diameter, age, and growth rate in Picea
abies. Can J For Res 24(5):1022–1028
Shmulsky R, Jones PD (2011) Density and specific gravity. In: Wiley-Blackwell (ed) Forest products and
wood science: an introduction, 6th edn. Wiley, New York, pp 175–195
Spurr AR (1969) A low-viscosity epoxy resin embedding medium for electron microscopy. J Ultrastruct
Res 26:31–43
Taylor A, Gartner B, Morrell J (2002) Heartwood formation and natural durability: a review. Wood Fiber
Sci 34(4):587–611
Tong QJ, Duchesne I, Belley D, Beaudoin M, Swift E (2013) Characterization of knots in plantation white
spruce. Wood Fiber Sci 45(1):1–14
Tze WTY, Wang S, Rials TG, Pharr GM, Kelley SS (2007) Nanoindentation of wood cell walls:
continuous stiffness and hardness measurements. Compos A Appl Sci Manuf 38(3):945–953
Weinan E, Engquist B (2003) Multiscale modeling and computation. Notice AMS 50(9):1062–1070
Wimmer R, Lucas NB (1997) Comparing mechanical properties of secondary wall and cell corner middle
lamella in spruce wood. IAWA J 18(1):77–88
Yan M (2001) Prospect nanometer and micrometer science and technology for applying to the wood
industry. Sci Silvae Sin 37(6):9–12
Yang KC, Hazenberg G (1992) Impact of Spacings on Sapwood and Heartwood Thickness in Picea
mariana (Mill) BSP and Picea glauca (Moench) VOSS. Wood Fiber Sci 24(3):330–336
Zobel BJ, Sprague JR (1998) Juvenile wood in forest trees. Springer series in wood science. Springer,
Berlin
Wood Sci Technol
123


